Yuba County, CA Map & Demographics
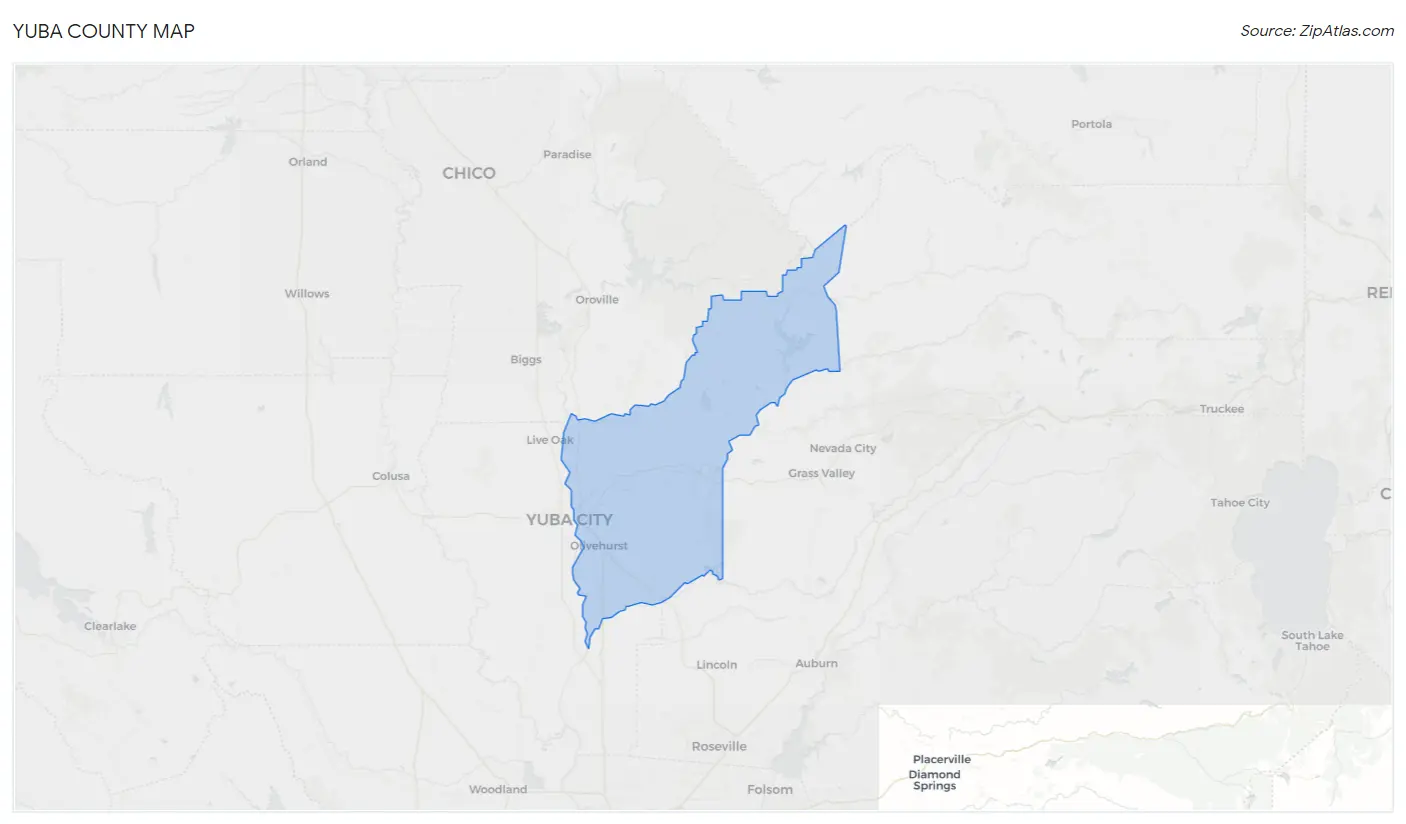
Yuba County Map
Yuba County Overview
$30,036
PER CAPITA INCOME
$76,321
AVG FAMILY INCOME
$66,693
AVG HOUSEHOLD INCOME
30.9%
WAGE / INCOME GAP [ % ]
69.1¢/ $1
WAGE / INCOME GAP [ $ ]
$12,002
FAMILY INCOME DEFICIT
0.44
INEQUALITY / GINI INDEX
81,705
TOTAL POPULATION
41,643
MALE POPULATION
40,062
FEMALE POPULATION
103.95
MALES / 100 FEMALES
96.20
FEMALES / 100 MALES
33.5
MEDIAN AGE
3.4
AVG FAMILY SIZE
2.9
AVG HOUSEHOLD SIZE
36,582
LABOR FORCE [ PEOPLE ]
59.3%
PERCENT IN LABOR FORCE
7.4%
UNEMPLOYMENT RATE
Yuba County Area Codes
Income in Yuba County
Income Overview in Yuba County
Per Capita Income in Yuba County is $30,036, while median incomes of families and households are $76,321 and $66,693 respectively.
| Characteristic | Number | Measure |
| Per Capita Income | 81,705 | $30,036 |
| Median Family Income | 19,337 | $76,321 |
| Mean Family Income | 19,337 | $93,913 |
| Median Household Income | 27,567 | $66,693 |
| Mean Household Income | 27,567 | $85,286 |
| Income Deficit | 19,337 | $12,002 |
| Wage / Income Gap (%) | 81,705 | 30.93% |
| Wage / Income Gap ($) | 81,705 | 69.07¢ per $1 |
| Gini / Inequality Index | 81,705 | 0.44 |
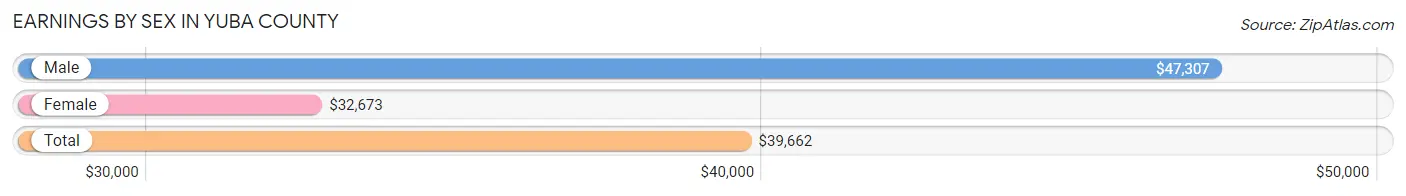
Earnings by Sex in Yuba County
Average Earnings in Yuba County are $39,662, $47,307 for men and $32,673 for women, a difference of 30.9%.
| Sex | Number | Average Earnings |
| Male | 20,486 (54.2%) | $47,307 |
| Female | 17,334 (45.8%) | $32,673 |
| Total | 37,820 (100.0%) | $39,662 |
Earnings by Sex by Income Bracket in Yuba County
The most common earnings brackets in Yuba County are $100,000+ for men (3,179 | 15.5%) and $100,000+ for women (1,298 | 7.5%).
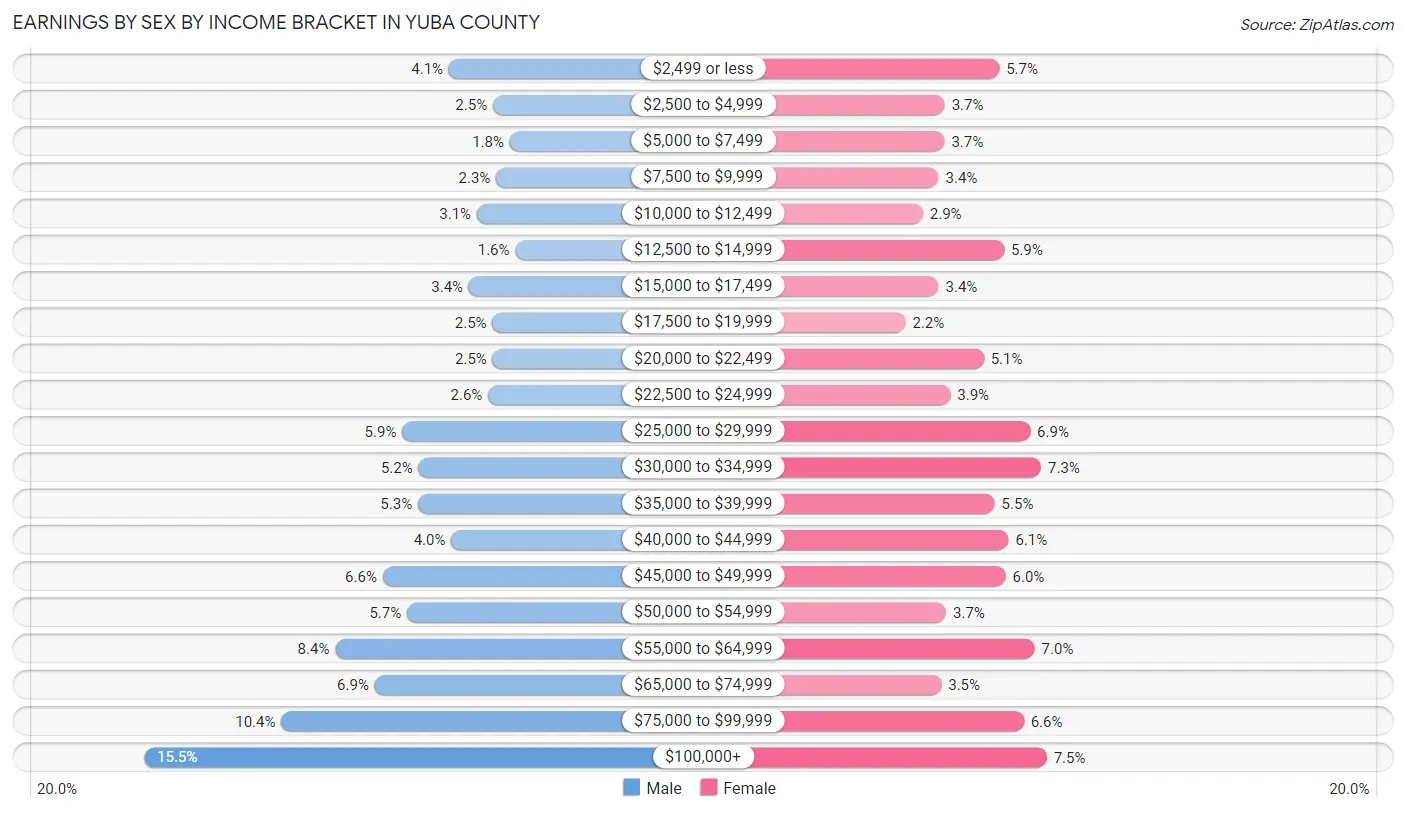
| Income | Male | Female |
| $2,499 or less | 839 (4.1%) | 990 (5.7%) |
| $2,500 to $4,999 | 501 (2.5%) | 637 (3.7%) |
| $5,000 to $7,499 | 373 (1.8%) | 635 (3.7%) |
| $7,500 to $9,999 | 478 (2.3%) | 596 (3.4%) |
| $10,000 to $12,499 | 624 (3.0%) | 494 (2.9%) |
| $12,500 to $14,999 | 330 (1.6%) | 1,021 (5.9%) |
| $15,000 to $17,499 | 687 (3.4%) | 596 (3.4%) |
| $17,500 to $19,999 | 506 (2.5%) | 382 (2.2%) |
| $20,000 to $22,499 | 503 (2.5%) | 890 (5.1%) |
| $22,500 to $24,999 | 538 (2.6%) | 672 (3.9%) |
| $25,000 to $29,999 | 1,198 (5.9%) | 1,190 (6.9%) |
| $30,000 to $34,999 | 1,073 (5.2%) | 1,262 (7.3%) |
| $35,000 to $39,999 | 1,077 (5.3%) | 961 (5.5%) |
| $40,000 to $44,999 | 821 (4.0%) | 1,050 (6.1%) |
| $45,000 to $49,999 | 1,348 (6.6%) | 1,032 (5.9%) |
| $50,000 to $54,999 | 1,161 (5.7%) | 645 (3.7%) |
| $55,000 to $64,999 | 1,713 (8.4%) | 1,221 (7.0%) |
| $65,000 to $74,999 | 1,410 (6.9%) | 613 (3.5%) |
| $75,000 to $99,999 | 2,127 (10.4%) | 1,149 (6.6%) |
| $100,000+ | 3,179 (15.5%) | 1,298 (7.5%) |
| Total | 20,486 (100.0%) | 17,334 (100.0%) |
Earnings by Sex by Educational Attainment in Yuba County
Average earnings in Yuba County are $53,364 for men and $37,637 for women, a difference of 29.5%. Men with an educational attainment of graduate degree enjoy the highest average annual earnings of $96,571, while those with less than high school education earn the least with $37,350. Women with an educational attainment of graduate degree earn the most with the average annual earnings of $77,396, while those with less than high school education have the smallest earnings of $21,311.
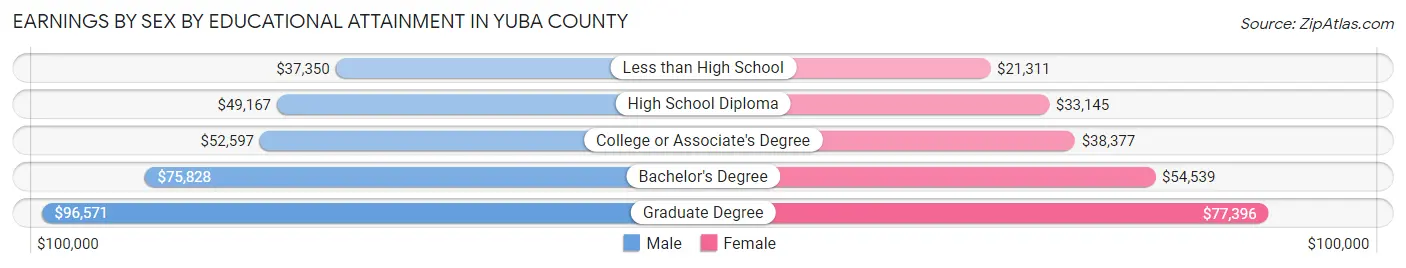
| Educational Attainment | Male Income | Female Income |
| Less than High School | $37,350 | $21,311 |
| High School Diploma | $49,167 | $33,145 |
| College or Associate's Degree | $52,597 | $38,377 |
| Bachelor's Degree | $75,828 | $54,539 |
| Graduate Degree | $96,571 | $77,396 |
| Total | $53,364 | $37,637 |
Family Income in Yuba County
Family Income Brackets in Yuba County
According to the Yuba County family income data, there are 3,635 families falling into the $100,000 to $149,999 income range, which is the most common income bracket and makes up 18.8% of all families. Conversely, the $10,000 to $14,999 income bracket is the least frequent group with only 445 families (2.3%) belonging to this category.
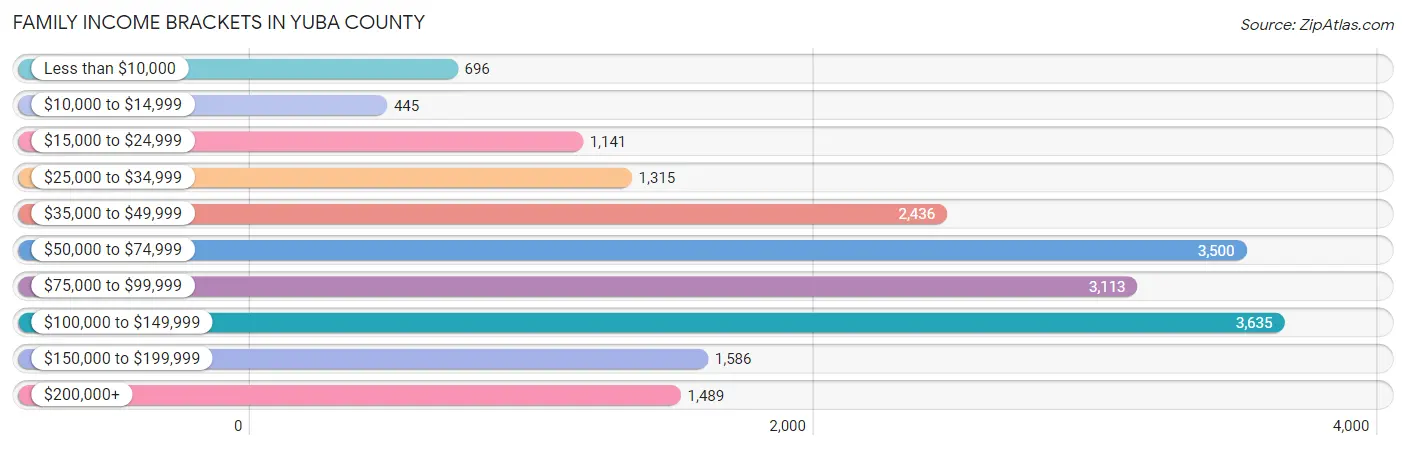
| Income Bracket | # Families | % Families |
| Less than $10,000 | 696 | 3.6% |
| $10,000 to $14,999 | 445 | 2.3% |
| $15,000 to $24,999 | 1,141 | 5.9% |
| $25,000 to $34,999 | 1,315 | 6.8% |
| $35,000 to $49,999 | 2,436 | 12.6% |
| $50,000 to $74,999 | 3,500 | 18.1% |
| $75,000 to $99,999 | 3,113 | 16.1% |
| $100,000 to $149,999 | 3,635 | 18.8% |
| $150,000 to $199,999 | 1,586 | 8.2% |
| $200,000+ | 1,489 | 7.7% |
Family Income by Famaliy Size in Yuba County
7+ person families (667 | 3.5%) account for the highest median family income in Yuba County with $140,271 per family, while 2-person families (7,403 | 38.3%) have the highest median income of $29,342 per family member.
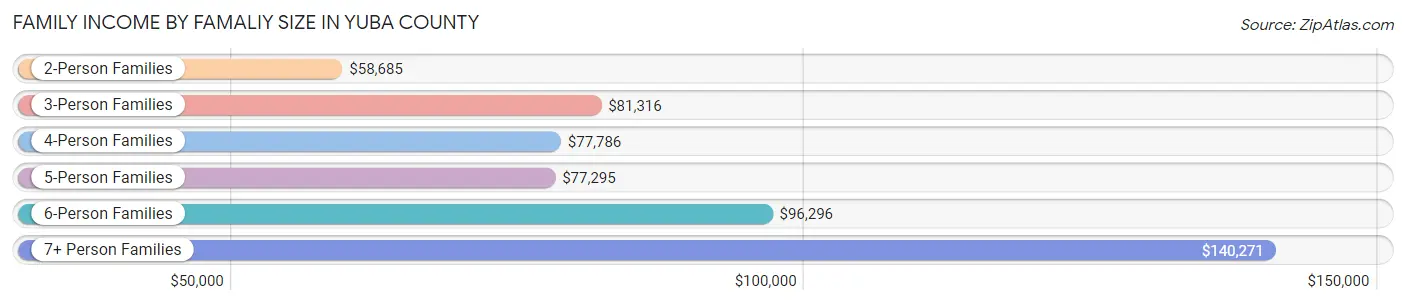
| Income Bracket | # Families | Median Income |
| 2-Person Families | 7,403 (38.3%) | $58,685 |
| 3-Person Families | 4,363 (22.6%) | $81,316 |
| 4-Person Families | 3,777 (19.5%) | $77,786 |
| 5-Person Families | 2,083 (10.8%) | $77,295 |
| 6-Person Families | 1,044 (5.4%) | $96,296 |
| 7+ Person Families | 667 (3.5%) | $140,271 |
| Total | 19,337 (100.0%) | $76,321 |
Family Income by Number of Earners in Yuba County
The median family income in Yuba County is $76,321, with families comprising 3+ earners (1,729) having the highest median family income of $141,112, while families with no earners (2,970) have the lowest median family income of $38,597, accounting for 8.9% and 15.4% of families, respectively.
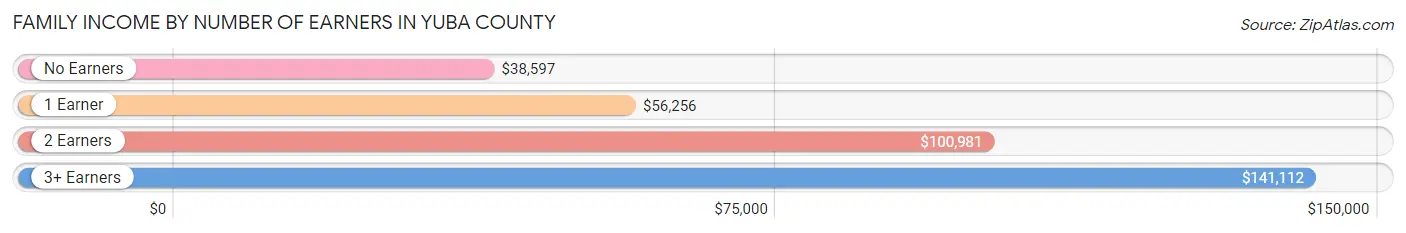
| Number of Earners | # Families | Median Income |
| No Earners | 2,970 (15.4%) | $38,597 |
| 1 Earner | 7,322 (37.9%) | $56,256 |
| 2 Earners | 7,316 (37.8%) | $100,981 |
| 3+ Earners | 1,729 (8.9%) | $141,112 |
| Total | 19,337 (100.0%) | $76,321 |
Household Income in Yuba County
Household Income Brackets in Yuba County
With 5,183 households falling in the category, the $50,000 to $74,999 income range is the most frequent in Yuba County, accounting for 18.8% of all households. In contrast, only 1,241 households (4.5%) fall into the $10,000 to $14,999 income bracket, making it the least populous group.
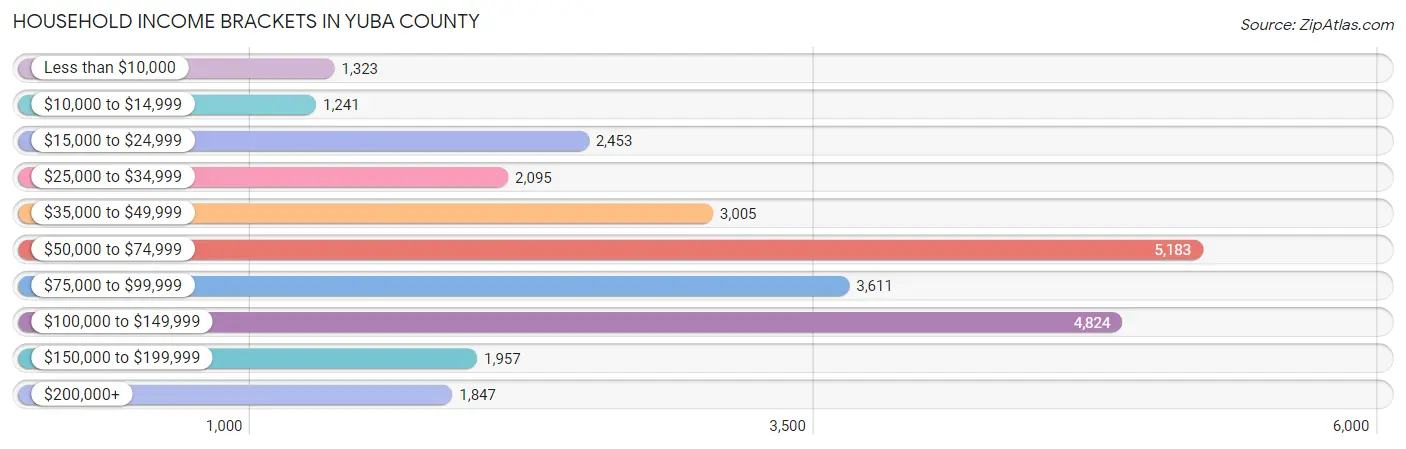
| Income Bracket | # Households | % Households |
| Less than $10,000 | 1,323 | 4.8% |
| $10,000 to $14,999 | 1,241 | 4.5% |
| $15,000 to $24,999 | 2,453 | 8.9% |
| $25,000 to $34,999 | 2,095 | 7.6% |
| $35,000 to $49,999 | 3,005 | 10.9% |
| $50,000 to $74,999 | 5,183 | 18.8% |
| $75,000 to $99,999 | 3,611 | 13.1% |
| $100,000 to $149,999 | 4,824 | 17.5% |
| $150,000 to $199,999 | 1,957 | 7.1% |
| $200,000+ | 1,847 | 6.7% |
Household Income by Householder Age in Yuba County
The median household income in Yuba County is $66,693, with the highest median household income of $78,883 found in the 25 to 44 years age bracket for the primary householder. A total of 10,549 households (38.3%) fall into this category. Meanwhile, the 65+ years age bracket for the primary householder has the lowest median household income of $46,259, with 6,526 households (23.7%) in this group.
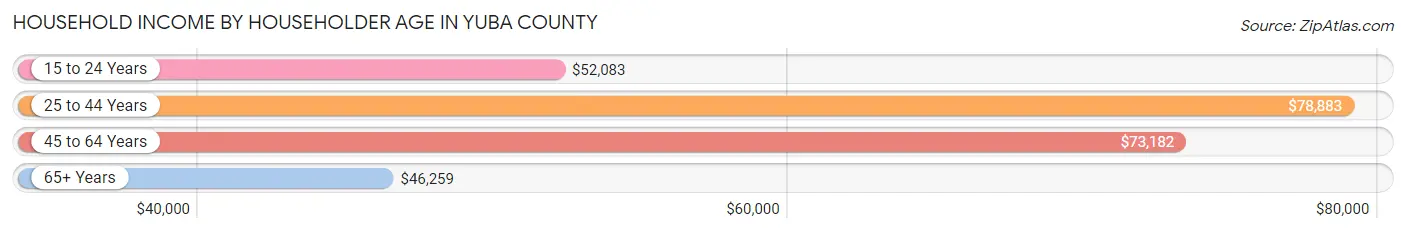
| Income Bracket | # Households | Median Income |
| 15 to 24 Years | 1,300 (4.7%) | $52,083 |
| 25 to 44 Years | 10,549 (38.3%) | $78,883 |
| 45 to 64 Years | 9,192 (33.3%) | $73,182 |
| 65+ Years | 6,526 (23.7%) | $46,259 |
| Total | 27,567 (100.0%) | $66,693 |
Poverty in Yuba County
Income Below Poverty by Sex and Age in Yuba County
With 14.5% poverty level for males and 16.3% for females among the residents of Yuba County, 15 year old males and 16 and 17 year old females are the most vulnerable to poverty, with 228 males (35.7%) and 401 females (36.9%) in their respective age groups living below the poverty level.
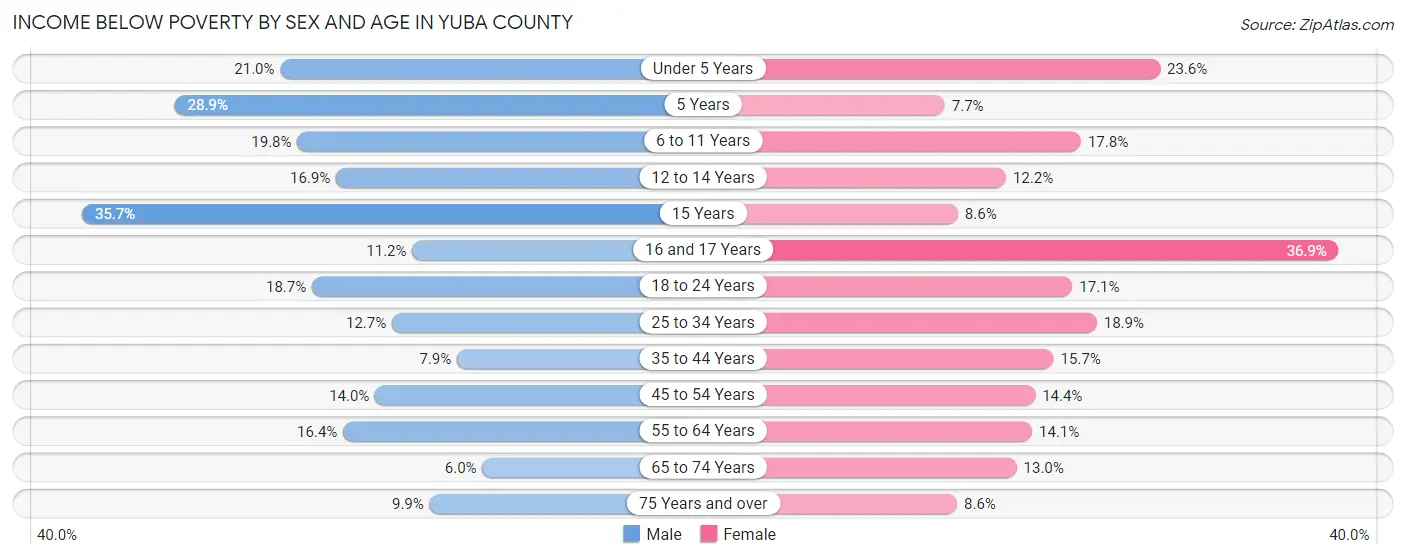
| Age Bracket | Male | Female |
| Under 5 Years | 642 (21.0%) | 695 (23.6%) |
| 5 Years | 172 (28.9%) | 60 (7.6%) |
| 6 to 11 Years | 781 (19.8%) | 589 (17.8%) |
| 12 to 14 Years | 303 (16.9%) | 254 (12.2%) |
| 15 Years | 228 (35.7%) | 43 (8.6%) |
| 16 and 17 Years | 117 (11.2%) | 401 (36.9%) |
| 18 to 24 Years | 731 (18.7%) | 589 (17.1%) |
| 25 to 34 Years | 796 (12.7%) | 1,153 (18.9%) |
| 35 to 44 Years | 452 (7.9%) | 841 (15.7%) |
| 45 to 54 Years | 580 (14.0%) | 588 (14.4%) |
| 55 to 64 Years | 735 (16.4%) | 637 (14.1%) |
| 65 to 74 Years | 193 (6.0%) | 441 (13.0%) |
| 75 Years and over | 174 (9.9%) | 180 (8.6%) |
| Total | 5,904 (14.5%) | 6,471 (16.3%) |
Income Above Poverty by Sex and Age in Yuba County
According to the poverty statistics in Yuba County, males aged 65 to 74 years and females aged 5 years are the age groups that are most secure financially, with 94.0% of males and 92.3% of females in these age groups living above the poverty line.
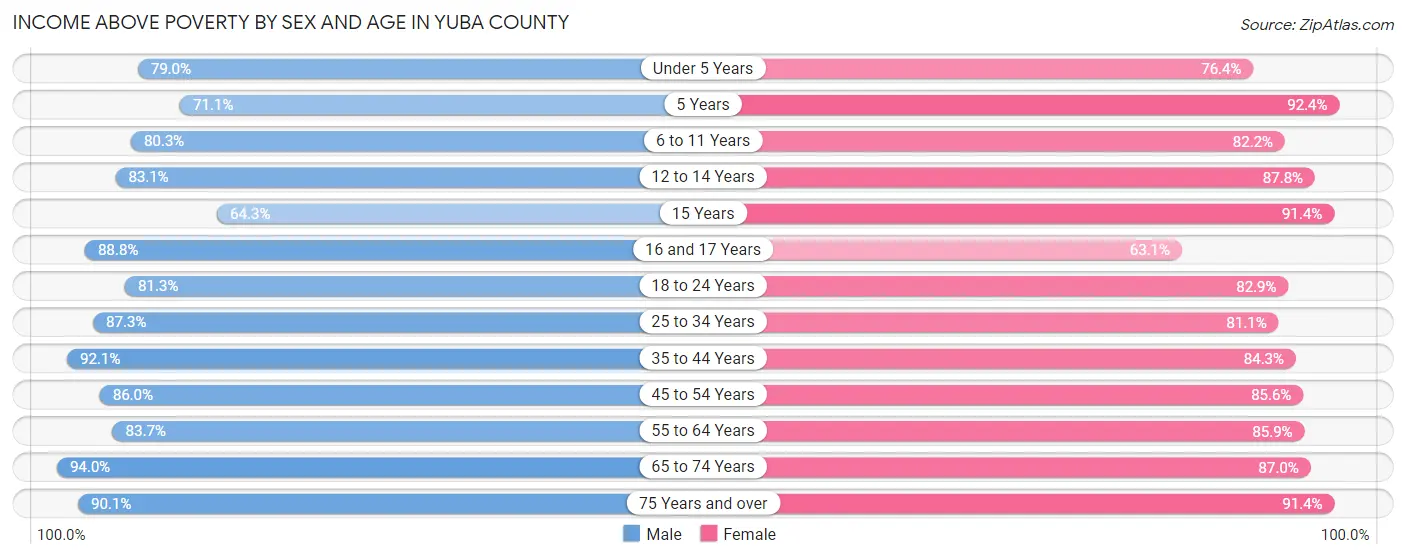
| Age Bracket | Male | Female |
| Under 5 Years | 2,414 (79.0%) | 2,246 (76.4%) |
| 5 Years | 424 (71.1%) | 724 (92.3%) |
| 6 to 11 Years | 3,173 (80.2%) | 2,728 (82.2%) |
| 12 to 14 Years | 1,493 (83.1%) | 1,830 (87.8%) |
| 15 Years | 410 (64.3%) | 456 (91.4%) |
| 16 and 17 Years | 927 (88.8%) | 686 (63.1%) |
| 18 to 24 Years | 3,186 (81.3%) | 2,851 (82.9%) |
| 25 to 34 Years | 5,464 (87.3%) | 4,938 (81.1%) |
| 35 to 44 Years | 5,279 (92.1%) | 4,507 (84.3%) |
| 45 to 54 Years | 3,572 (86.0%) | 3,507 (85.6%) |
| 55 to 64 Years | 3,761 (83.7%) | 3,871 (85.9%) |
| 65 to 74 Years | 3,019 (94.0%) | 2,956 (87.0%) |
| 75 Years and over | 1,578 (90.1%) | 1,924 (91.4%) |
| Total | 34,700 (85.5%) | 33,224 (83.7%) |
Income Below Poverty Among Married-Couple Families in Yuba County
The poverty statistics for married-couple families in Yuba County show that 5.3% or 710 of the total 13,375 families live below the poverty line. Families with 3 or 4 children have the highest poverty rate of 14.9%, comprising of 249 families. On the other hand, families with no children have the lowest poverty rate of 1.7%, which includes 103 families.
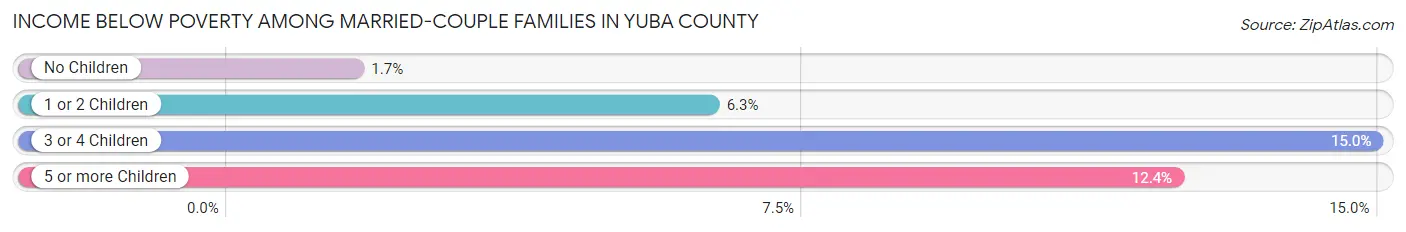
| Children | Above Poverty | Below Poverty |
| No Children | 6,152 (98.4%) | 103 (1.7%) |
| 1 or 2 Children | 4,884 (93.7%) | 328 (6.3%) |
| 3 or 4 Children | 1,416 (85.1%) | 249 (14.9%) |
| 5 or more Children | 213 (87.6%) | 30 (12.3%) |
| Total | 12,665 (94.7%) | 710 (5.3%) |
Income Below Poverty Among Single-Parent Households in Yuba County
According to the poverty data in Yuba County, 10.4% or 209 single-father households and 32.1% or 1,269 single-mother households are living below the poverty line. Among single-father households, those with 1 or 2 children have the highest poverty rate, with 157 households (14.0%) experiencing poverty. Likewise, among single-mother households, those with 5 or more children have the highest poverty rate, with 37 households (78.7%) falling below the poverty line.
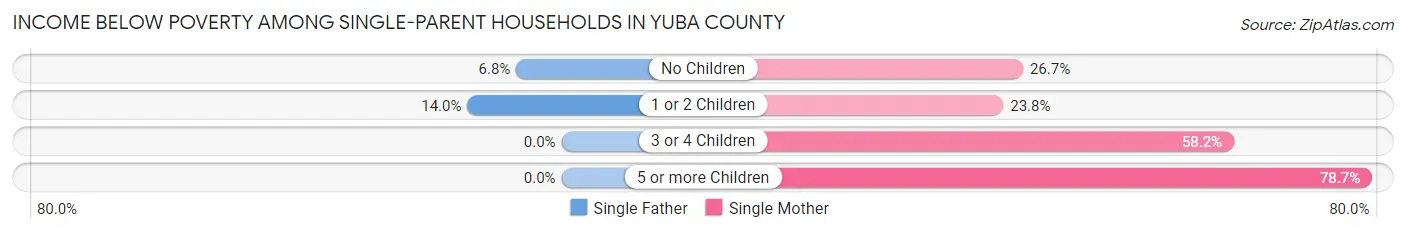
| Children | Single Father | Single Mother |
| No Children | 52 (6.8%) | 327 (26.7%) |
| 1 or 2 Children | 157 (14.0%) | 452 (23.8%) |
| 3 or 4 Children | 0 (0.0%) | 453 (58.2%) |
| 5 or more Children | 0 (0.0%) | 37 (78.7%) |
| Total | 209 (10.4%) | 1,269 (32.1%) |
Income Below Poverty Among Married-Couple vs Single-Parent Households in Yuba County
The poverty data for Yuba County shows that 710 of the married-couple family households (5.3%) and 1,478 of the single-parent households (24.8%) are living below the poverty level. Within the married-couple family households, those with 3 or 4 children have the highest poverty rate, with 249 households (14.9%) falling below the poverty line. Among the single-parent households, those with 5 or more children have the highest poverty rate, with 37 household (78.7%) living below poverty.
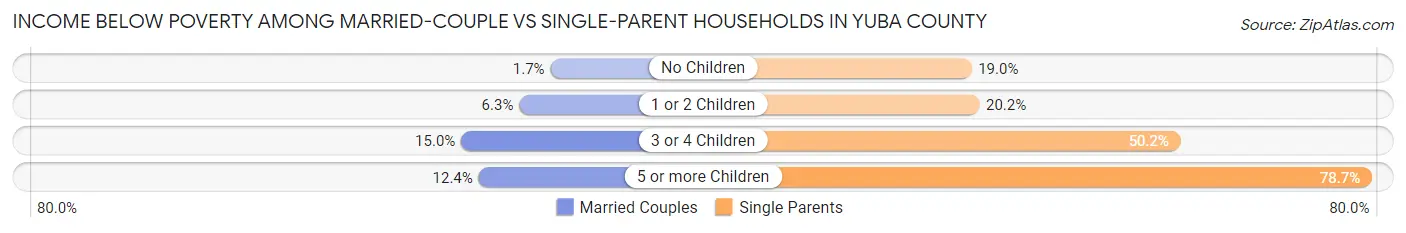
| Children | Married-Couple Families | Single-Parent Households |
| No Children | 103 (1.7%) | 379 (19.0%) |
| 1 or 2 Children | 328 (6.3%) | 609 (20.2%) |
| 3 or 4 Children | 249 (14.9%) | 453 (50.2%) |
| 5 or more Children | 30 (12.3%) | 37 (78.7%) |
| Total | 710 (5.3%) | 1,478 (24.8%) |
Race in Yuba County
The most populous races in Yuba County are White / Caucasian (52,705 | 64.5%), Hispanic or Latino (24,353 | 29.8%), and Two or more Races (12,102 | 14.8%).
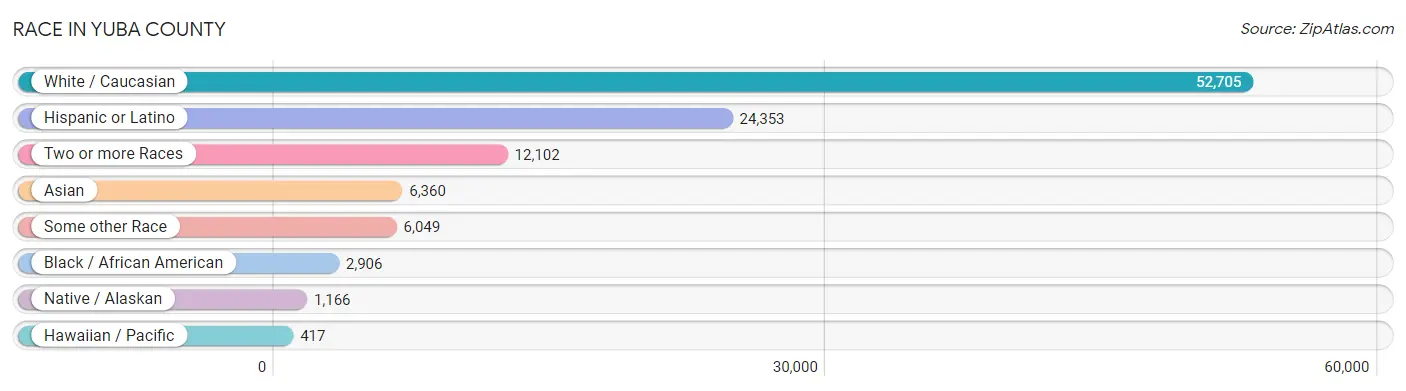
| Race | # Population | % Population |
| Asian | 6,360 | 7.8% |
| Black / African American | 2,906 | 3.6% |
| Hawaiian / Pacific | 417 | 0.5% |
| Hispanic or Latino | 24,353 | 29.8% |
| Native / Alaskan | 1,166 | 1.4% |
| White / Caucasian | 52,705 | 64.5% |
| Two or more Races | 12,102 | 14.8% |
| Some other Race | 6,049 | 7.4% |
| Total | 81,705 | 100.0% |
Ancestry in Yuba County
The most populous ancestries reported in Yuba County are Mexican (21,265 | 26.0%), German (8,441 | 10.3%), Irish (6,499 | 8.0%), English (6,226 | 7.6%), and Bangladeshi (3,978 | 4.9%), together accounting for 56.8% of all Yuba County residents.
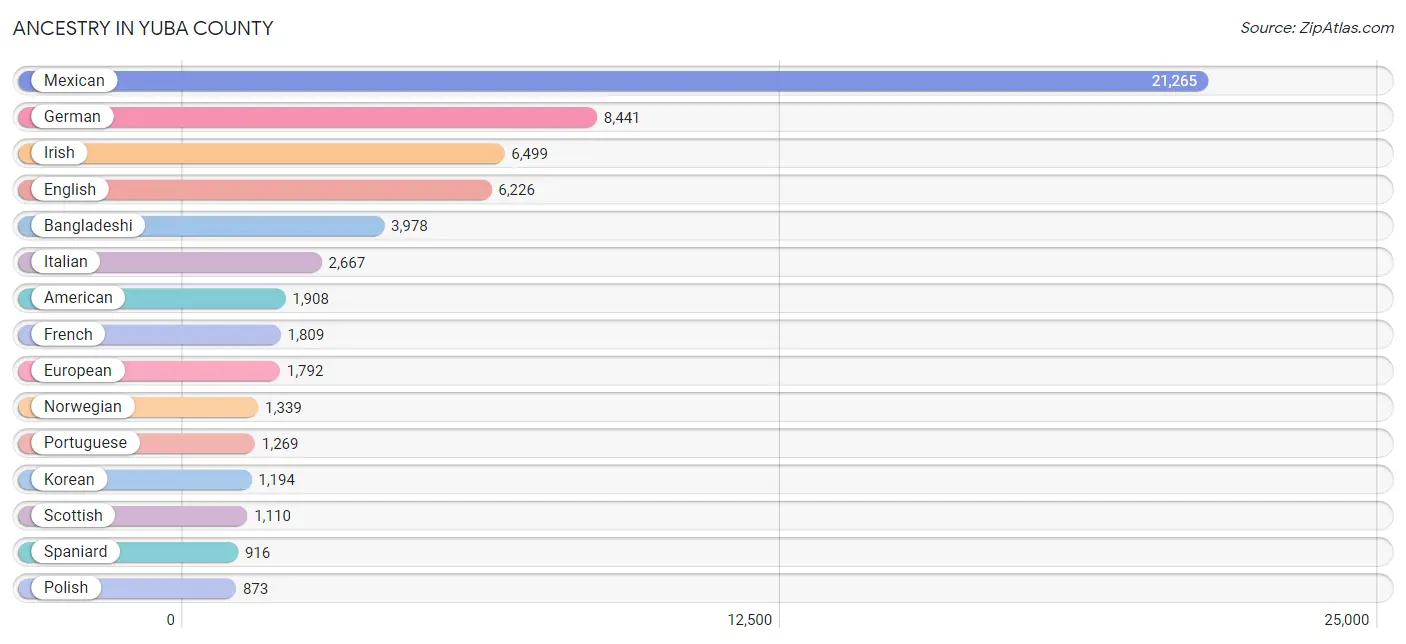
| Ancestry | # Population | % Population |
| Afghan | 123 | 0.2% |
| African | 359 | 0.4% |
| American | 1,908 | 2.3% |
| Apache | 320 | 0.4% |
| Arab | 46 | 0.1% |
| Arapaho | 10 | 0.0% |
| Armenian | 60 | 0.1% |
| Assyrian / Chaldean / Syriac | 3 | 0.0% |
| Australian | 6 | 0.0% |
| Austrian | 272 | 0.3% |
| Bangladeshi | 3,978 | 4.9% |
| Basque | 58 | 0.1% |
| Belgian | 57 | 0.1% |
| Bhutanese | 475 | 0.6% |
| Blackfeet | 178 | 0.2% |
| Brazilian | 13 | 0.0% |
| British | 675 | 0.8% |
| British West Indian | 47 | 0.1% |
| Burmese | 115 | 0.1% |
| Cajun | 33 | 0.0% |
| Canadian | 134 | 0.2% |
| Central American | 342 | 0.4% |
| Central American Indian | 23 | 0.0% |
| Cherokee | 724 | 0.9% |
| Cheyenne | 182 | 0.2% |
| Chickasaw | 148 | 0.2% |
| Chilean | 109 | 0.1% |
| Chippewa | 56 | 0.1% |
| Choctaw | 187 | 0.2% |
| Colombian | 15 | 0.0% |
| Comanche | 21 | 0.0% |
| Creek | 45 | 0.1% |
| Croatian | 97 | 0.1% |
| Cuban | 62 | 0.1% |
| Czech | 120 | 0.2% |
| Danish | 371 | 0.4% |
| Dominican | 72 | 0.1% |
| Dutch | 662 | 0.8% |
| Dutch West Indian | 27 | 0.0% |
| Eastern European | 169 | 0.2% |
| English | 6,226 | 7.6% |
| Estonian | 32 | 0.0% |
| Ethiopian | 77 | 0.1% |
| European | 1,792 | 2.2% |
| Filipino | 13 | 0.0% |
| Finnish | 40 | 0.1% |
| French | 1,809 | 2.2% |
| French American Indian | 24 | 0.0% |
| French Canadian | 189 | 0.2% |
| German | 8,441 | 10.3% |
| Greek | 466 | 0.6% |
| Guamanian / Chamorro | 375 | 0.5% |
| Guatemalan | 81 | 0.1% |
| Haitian | 55 | 0.1% |
| Honduran | 42 | 0.1% |
| Hungarian | 41 | 0.1% |
| Indian (Asian) | 677 | 0.8% |
| Inupiat | 31 | 0.0% |
| Iranian | 116 | 0.1% |
| Irish | 6,499 | 8.0% |
| Israeli | 31 | 0.0% |
| Italian | 2,667 | 3.3% |
| Jamaican | 133 | 0.2% |
| Japanese | 159 | 0.2% |
| Kenyan | 28 | 0.0% |
| Kiowa | 5 | 0.0% |
| Korean | 1,194 | 1.5% |
| Latvian | 28 | 0.0% |
| Lebanese | 11 | 0.0% |
| Lithuanian | 32 | 0.0% |
| Malaysian | 215 | 0.3% |
| Maltese | 52 | 0.1% |
| Mexican | 21,265 | 26.0% |
| Mexican American Indian | 348 | 0.4% |
| Moroccan | 25 | 0.0% |
| Native Hawaiian | 119 | 0.2% |
| Navajo | 19 | 0.0% |
| Nicaraguan | 99 | 0.1% |
| Northern European | 142 | 0.2% |
| Norwegian | 1,339 | 1.6% |
| Paiute | 142 | 0.2% |
| Pakistani | 75 | 0.1% |
| Panamanian | 13 | 0.0% |
| Peruvian | 18 | 0.0% |
| Polish | 873 | 1.1% |
| Portuguese | 1,269 | 1.5% |
| Pueblo | 32 | 0.0% |
| Puerto Rican | 622 | 0.8% |
| Romanian | 186 | 0.2% |
| Russian | 734 | 0.9% |
| Salvadoran | 107 | 0.1% |
| Samoan | 42 | 0.1% |
| Scandinavian | 334 | 0.4% |
| Scotch-Irish | 469 | 0.6% |
| Scottish | 1,110 | 1.4% |
| Senegalese | 11 | 0.0% |
| Serbian | 58 | 0.1% |
| Shoshone | 10 | 0.0% |
| Sioux | 15 | 0.0% |
| Slavic | 28 | 0.0% |
| Slovak | 55 | 0.1% |
| South American | 224 | 0.3% |
| Spaniard | 916 | 1.1% |
| Spanish | 416 | 0.5% |
| Spanish American Indian | 5 | 0.0% |
| Sri Lankan | 406 | 0.5% |
| Subsaharan African | 475 | 0.6% |
| Swedish | 480 | 0.6% |
| Swiss | 82 | 0.1% |
| Thai | 741 | 0.9% |
| Tlingit-Haida | 5 | 0.0% |
| Tongan | 94 | 0.1% |
| Trinidadian and Tobagonian | 53 | 0.1% |
| Ukrainian | 70 | 0.1% |
| Venezuelan | 33 | 0.0% |
| Welsh | 591 | 0.7% |
| Yaqui | 106 | 0.1% |
| Yugoslavian | 58 | 0.1% | View All 118 Rows |
Immigrants in Yuba County
The most numerous immigrant groups reported in Yuba County came from Latin America (6,216 | 7.6%), Central America (6,013 | 7.4%), Mexico (5,903 | 7.2%), Asia (2,745 | 3.4%), and South Eastern Asia (1,805 | 2.2%), together accounting for 27.8% of all Yuba County residents.
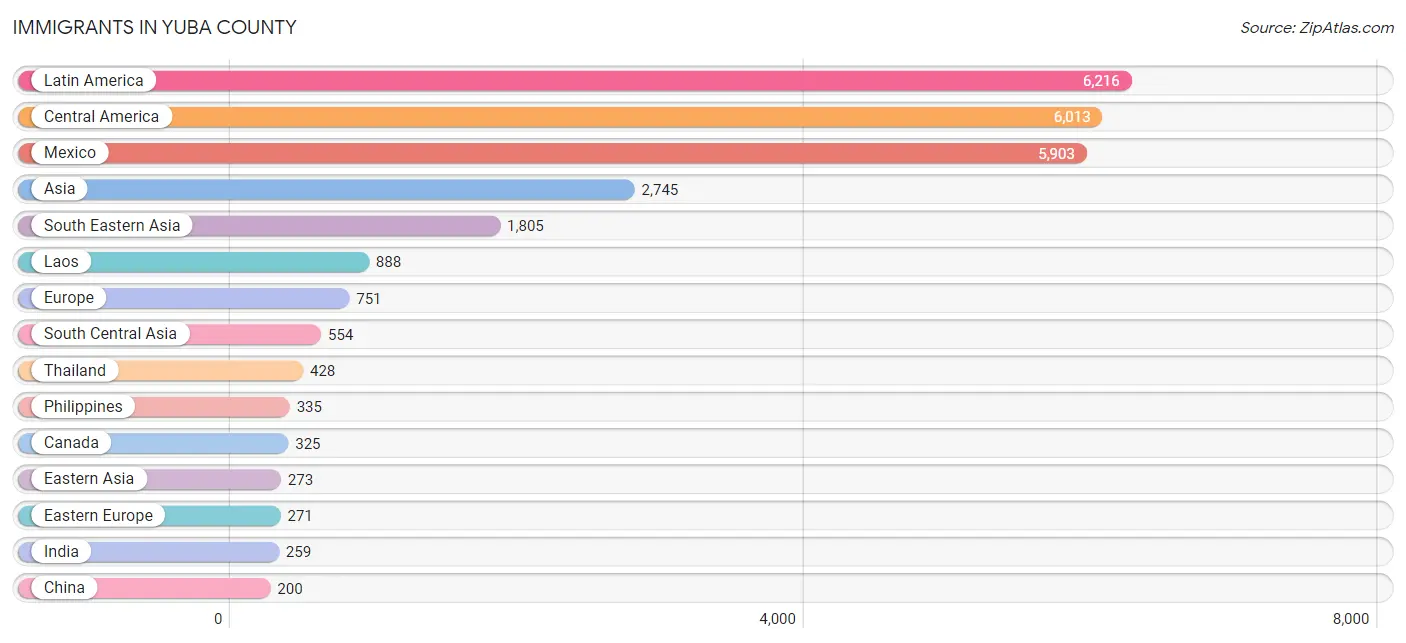
| Immigration Origin | # Population | % Population |
| Afghanistan | 155 | 0.2% |
| Africa | 125 | 0.2% |
| Argentina | 14 | 0.0% |
| Armenia | 7 | 0.0% |
| Asia | 2,745 | 3.4% |
| Belgium | 11 | 0.0% |
| Cambodia | 41 | 0.1% |
| Canada | 325 | 0.4% |
| Caribbean | 79 | 0.1% |
| Central America | 6,013 | 7.4% |
| Chile | 37 | 0.1% |
| China | 200 | 0.2% |
| Cuba | 1 | 0.0% |
| Dominican Republic | 5 | 0.0% |
| Eastern Africa | 125 | 0.2% |
| Eastern Asia | 273 | 0.3% |
| Eastern Europe | 271 | 0.3% |
| El Salvador | 55 | 0.1% |
| England | 64 | 0.1% |
| Eritrea | 77 | 0.1% |
| Europe | 751 | 0.9% |
| Fiji | 57 | 0.1% |
| France | 27 | 0.0% |
| Germany | 107 | 0.1% |
| Guatemala | 32 | 0.0% |
| Haiti | 8 | 0.0% |
| Hong Kong | 14 | 0.0% |
| India | 259 | 0.3% |
| Iran | 8 | 0.0% |
| Israel | 31 | 0.0% |
| Italy | 94 | 0.1% |
| Jamaica | 9 | 0.0% |
| Japan | 42 | 0.1% |
| Kenya | 28 | 0.0% |
| Korea | 31 | 0.0% |
| Laos | 888 | 1.1% |
| Latin America | 6,216 | 7.6% |
| Mexico | 5,903 | 7.2% |
| Moldova | 68 | 0.1% |
| Netherlands | 28 | 0.0% |
| Nicaragua | 23 | 0.0% |
| Northern Europe | 123 | 0.2% |
| Oceania | 65 | 0.1% |
| Pakistan | 14 | 0.0% |
| Peru | 56 | 0.1% |
| Philippines | 335 | 0.4% |
| Romania | 64 | 0.1% |
| Russia | 120 | 0.2% |
| South America | 124 | 0.2% |
| South Central Asia | 554 | 0.7% |
| South Eastern Asia | 1,805 | 2.2% |
| Southern Europe | 142 | 0.2% |
| Spain | 48 | 0.1% |
| Switzerland | 13 | 0.0% |
| Taiwan | 38 | 0.1% |
| Thailand | 428 | 0.5% |
| Trinidad and Tobago | 53 | 0.1% |
| Ukraine | 19 | 0.0% |
| Uzbekistan | 97 | 0.1% |
| Venezuela | 17 | 0.0% |
| Vietnam | 113 | 0.1% |
| Western Asia | 38 | 0.1% |
| Western Europe | 186 | 0.2% |
| Zimbabwe | 20 | 0.0% | View All 64 Rows |
Sex and Age in Yuba County
Sex and Age in Yuba County
The most populous age groups in Yuba County are 35 to 39 Years (3,412 | 8.2%) for men and 5 to 9 Years (3,393 | 8.5%) for women.
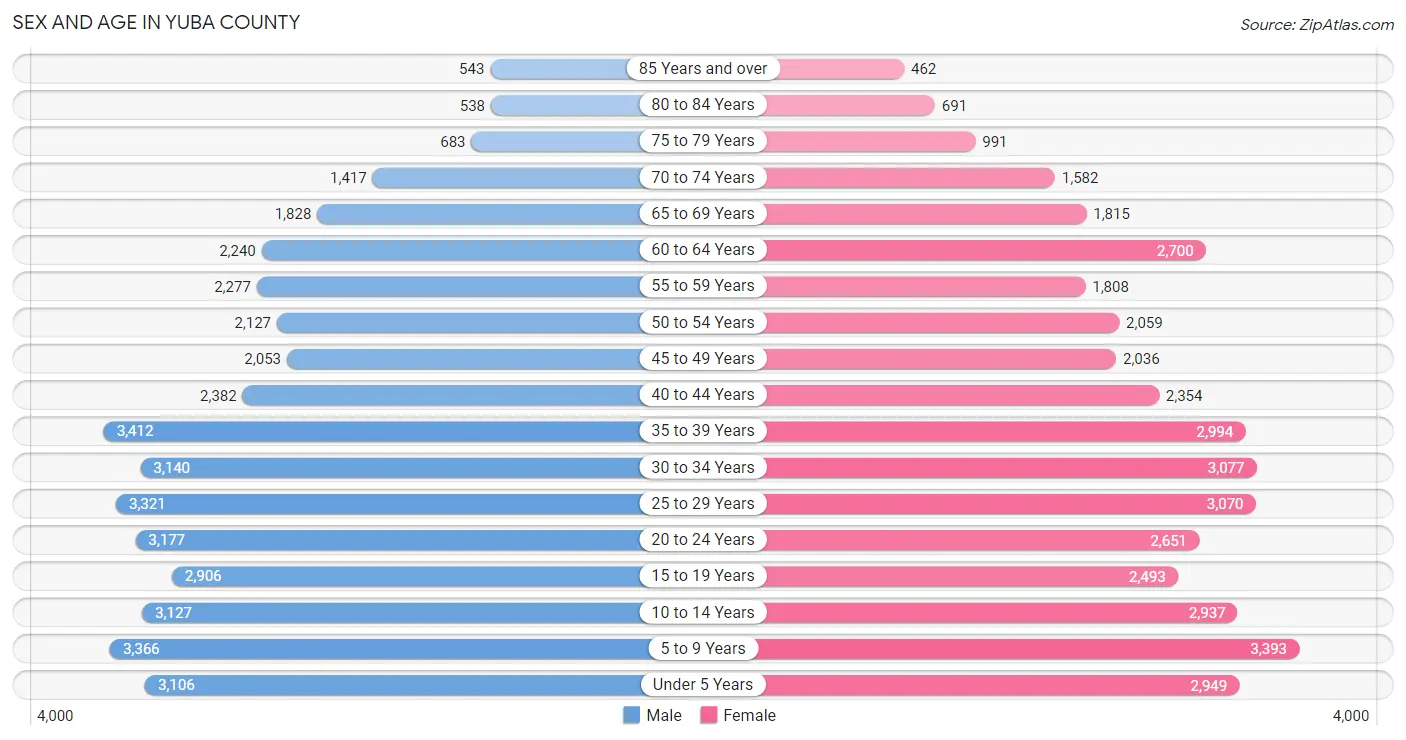
| Age Bracket | Male | Female |
| Under 5 Years | 3,106 (7.5%) | 2,949 (7.4%) |
| 5 to 9 Years | 3,366 (8.1%) | 3,393 (8.5%) |
| 10 to 14 Years | 3,127 (7.5%) | 2,937 (7.3%) |
| 15 to 19 Years | 2,906 (7.0%) | 2,493 (6.2%) |
| 20 to 24 Years | 3,177 (7.6%) | 2,651 (6.6%) |
| 25 to 29 Years | 3,321 (8.0%) | 3,070 (7.7%) |
| 30 to 34 Years | 3,140 (7.5%) | 3,077 (7.7%) |
| 35 to 39 Years | 3,412 (8.2%) | 2,994 (7.5%) |
| 40 to 44 Years | 2,382 (5.7%) | 2,354 (5.9%) |
| 45 to 49 Years | 2,053 (4.9%) | 2,036 (5.1%) |
| 50 to 54 Years | 2,127 (5.1%) | 2,059 (5.1%) |
| 55 to 59 Years | 2,277 (5.5%) | 1,808 (4.5%) |
| 60 to 64 Years | 2,240 (5.4%) | 2,700 (6.7%) |
| 65 to 69 Years | 1,828 (4.4%) | 1,815 (4.5%) |
| 70 to 74 Years | 1,417 (3.4%) | 1,582 (4.0%) |
| 75 to 79 Years | 683 (1.6%) | 991 (2.5%) |
| 80 to 84 Years | 538 (1.3%) | 691 (1.7%) |
| 85 Years and over | 543 (1.3%) | 462 (1.1%) |
| Total | 41,643 (100.0%) | 40,062 (100.0%) |
Families and Households in Yuba County
Median Family Size in Yuba County
The median family size in Yuba County is 3.44 persons per family, with married-couple families (13,375 | 69.2%) accounting for the largest median family size of 3.58 persons per family. On the other hand, single male/father families (2,012 | 10.4%) represent the smallest median family size with 2.83 persons per family.
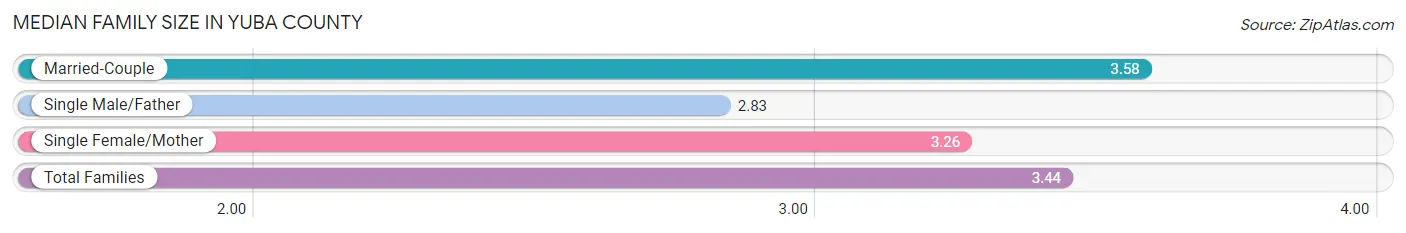
| Family Type | # Families | Family Size |
| Married-Couple | 13,375 (69.2%) | 3.58 |
| Single Male/Father | 2,012 (10.4%) | 2.83 |
| Single Female/Mother | 3,950 (20.4%) | 3.26 |
| Total Families | 19,337 (100.0%) | 3.44 |
Median Household Size in Yuba County
The median household size in Yuba County is 2.91 persons per household, with single female/mother households (3,950 | 14.3%) accounting for the largest median household size of 3.69 persons per household. non-family households (8,230 | 29.8%) represent the smallest median household size with 1.30 persons per household.
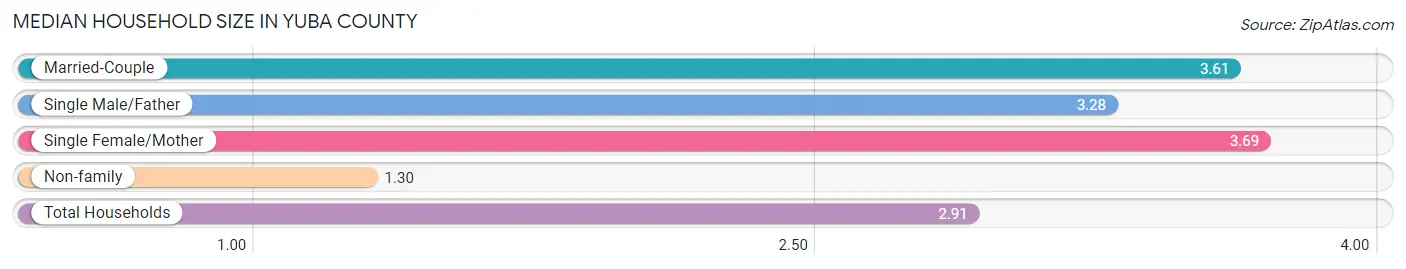
| Household Type | # Households | Household Size |
| Married-Couple | 13,375 (48.5%) | 3.61 |
| Single Male/Father | 2,012 (7.3%) | 3.28 |
| Single Female/Mother | 3,950 (14.3%) | 3.69 |
| Non-family | 8,230 (29.8%) | 1.30 |
| Total Households | 27,567 (100.0%) | 2.91 |
Household Size by Marriage Status in Yuba County
Out of a total of 27,567 households in Yuba County, 19,337 (70.2%) are family households, while 8,230 (29.8%) are nonfamily households. The most numerous type of family households are 2-person households, comprising 6,274, and the most common type of nonfamily households are 1-person households, comprising 6,284.
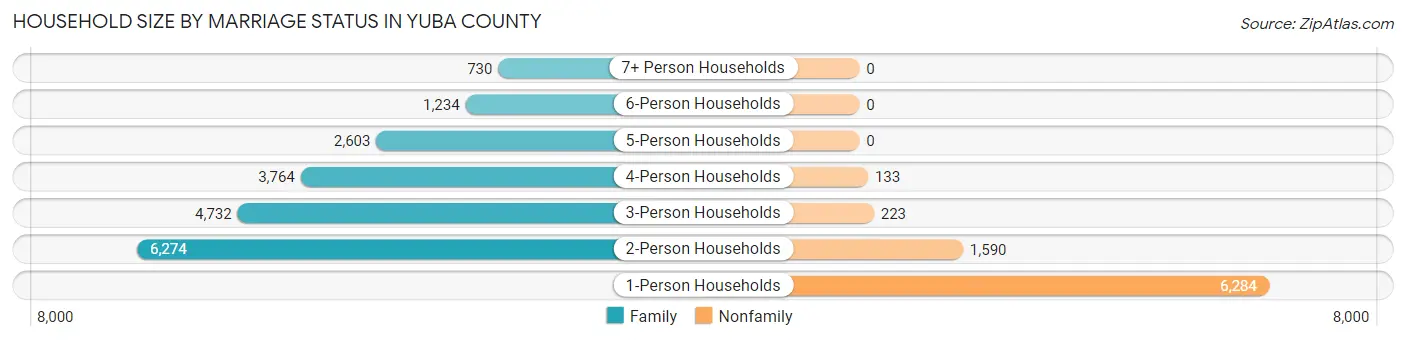
| Household Size | Family Households | Nonfamily Households |
| 1-Person Households | - | 6,284 (22.8%) |
| 2-Person Households | 6,274 (22.8%) | 1,590 (5.8%) |
| 3-Person Households | 4,732 (17.2%) | 223 (0.8%) |
| 4-Person Households | 3,764 (13.7%) | 133 (0.5%) |
| 5-Person Households | 2,603 (9.4%) | 0 (0.0%) |
| 6-Person Households | 1,234 (4.5%) | 0 (0.0%) |
| 7+ Person Households | 730 (2.6%) | 0 (0.0%) |
| Total | 19,337 (70.2%) | 8,230 (29.8%) |
Female Fertility in Yuba County
Fertility by Age in Yuba County
Average fertility rate in Yuba County is 84.0 births per 1,000 women. Women in the age bracket of 20 to 34 years have the highest fertility rate with 143.0 births per 1,000 women. Women in the age bracket of 20 to 34 years acount for 79.0% of all women with births.
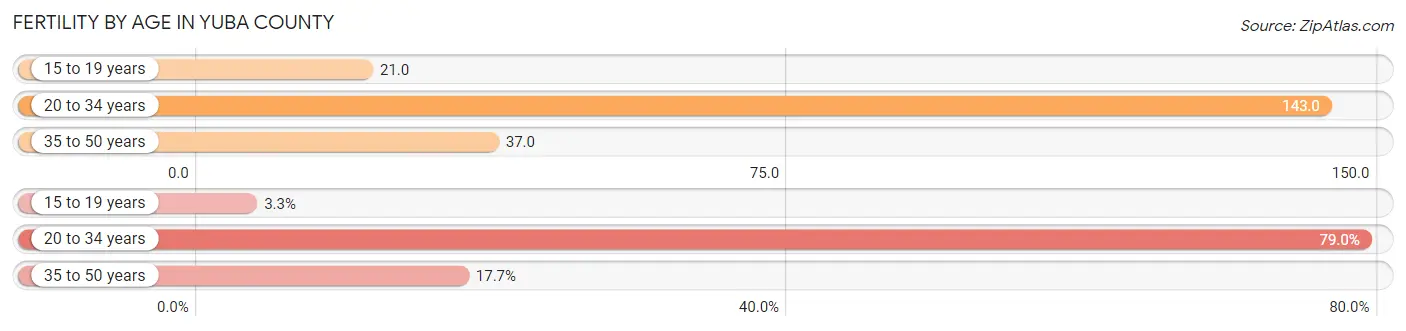
| Age Bracket | Women with Births | Births / 1,000 Women |
| 15 to 19 years | 53 (3.3%) | 21.0 |
| 20 to 34 years | 1,254 (79.0%) | 143.0 |
| 35 to 50 years | 281 (17.7%) | 37.0 |
| Total | 1,588 (100.0%) | 84.0 |
Fertility by Age by Marriage Status in Yuba County
53.3% of women with births (1,588) in Yuba County are married. The highest percentage of unmarried women with births falls into 15 to 19 years age bracket with 100.0% of them unmarried at the time of birth, while the lowest percentage of unmarried women with births belong to 35 to 50 years age bracket with 17.4% of them unmarried.
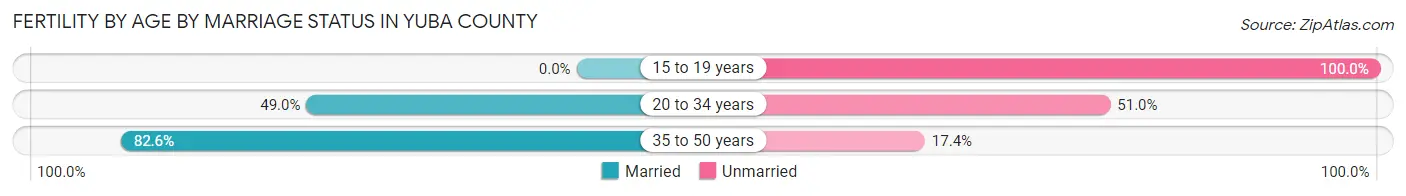
| Age Bracket | Married | Unmarried |
| 15 to 19 years | 0 (0.0%) | 53 (100.0%) |
| 20 to 34 years | 614 (49.0%) | 640 (51.0%) |
| 35 to 50 years | 232 (82.6%) | 49 (17.4%) |
| Total | 846 (53.3%) | 742 (46.7%) |
Fertility by Education in Yuba County
Average fertility rate in Yuba County is 84.0 births per 1,000 women. Women with the education attainment of college or associate's degree have the highest fertility rate of 102.0 births per 1,000 women, while women with the education attainment of graduate degree have the lowest fertility at 59.0 births per 1,000 women. Women with the education attainment of college or associate's degree represent 54.0% of all women with births.
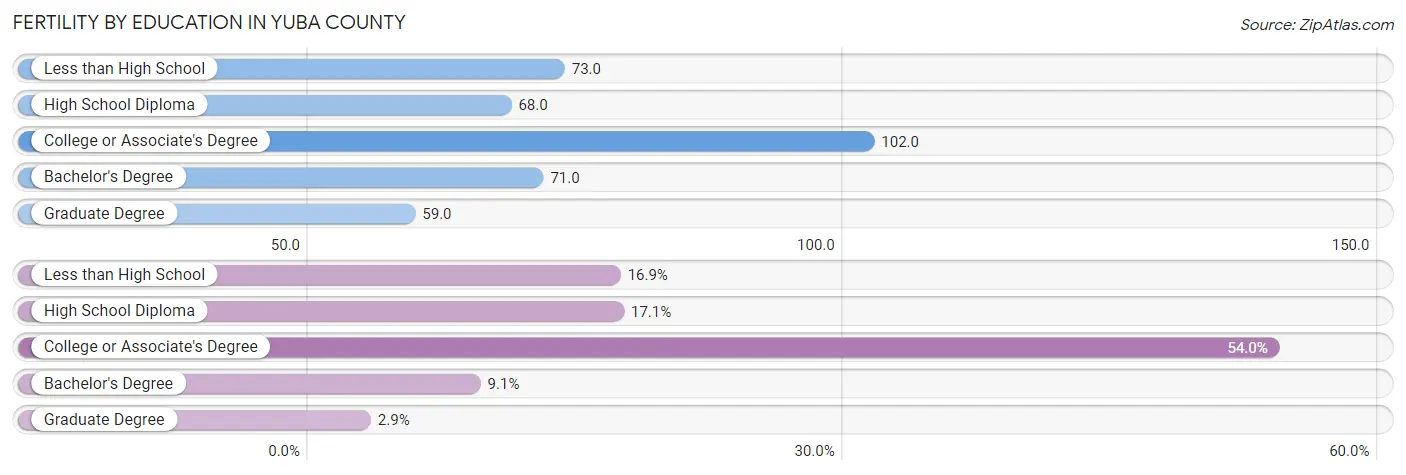
| Educational Attainment | Women with Births | Births / 1,000 Women |
| Less than High School | 269 (16.9%) | 73.0 |
| High School Diploma | 272 (17.1%) | 68.0 |
| College or Associate's Degree | 857 (54.0%) | 102.0 |
| Bachelor's Degree | 144 (9.1%) | 71.0 |
| Graduate Degree | 46 (2.9%) | 59.0 |
| Total | 1,588 (100.0%) | 84.0 |
Fertility by Education by Marriage Status in Yuba County
46.7% of women with births in Yuba County are unmarried. Women with the educational attainment of graduate degree are most likely to be married with 100.0% of them married at childbirth, while women with the educational attainment of bachelor's degree are least likely to be married with 52.8% of them unmarried at childbirth.
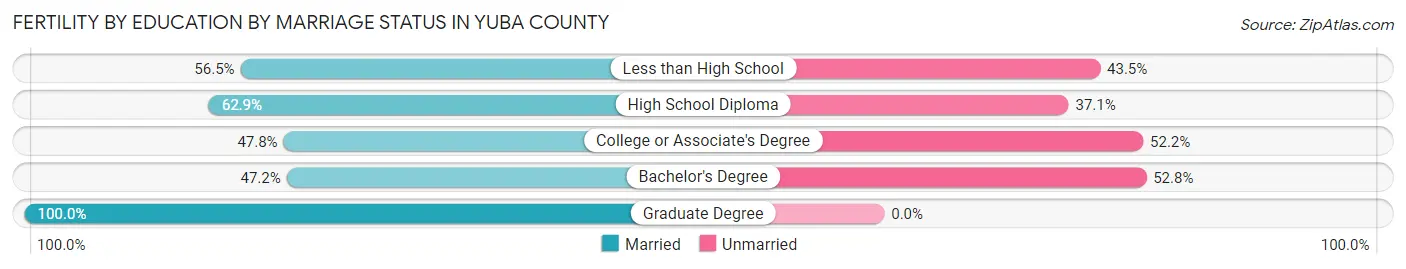
| Educational Attainment | Married | Unmarried |
| Less than High School | 152 (56.5%) | 117 (43.5%) |
| High School Diploma | 171 (62.9%) | 101 (37.1%) |
| College or Associate's Degree | 410 (47.8%) | 447 (52.2%) |
| Bachelor's Degree | 68 (47.2%) | 76 (52.8%) |
| Graduate Degree | 46 (100.0%) | 0 (0.0%) |
| Total | 846 (53.3%) | 742 (46.7%) |
Employment Characteristics in Yuba County
Employment by Class of Employer in Yuba County
Among the 33,422 employed individuals in Yuba County, private company employees (20,074 | 60.1%), federal government employees (3,545 | 10.6%), and local government employees (2,778 | 8.3%) make up the most common classes of employment.
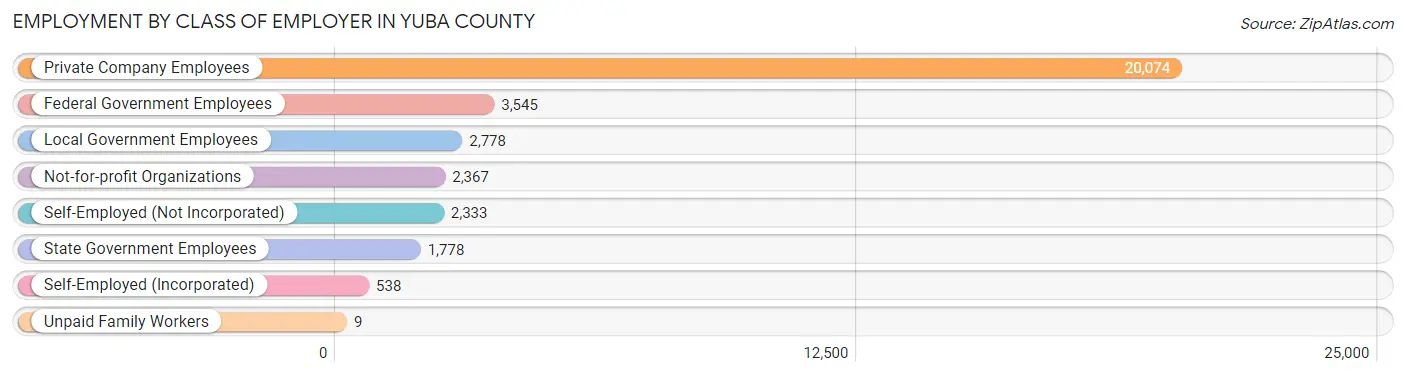
| Employer Class | # Employees | % Employees |
| Private Company Employees | 20,074 | 60.1% |
| Self-Employed (Incorporated) | 538 | 1.6% |
| Self-Employed (Not Incorporated) | 2,333 | 7.0% |
| Not-for-profit Organizations | 2,367 | 7.1% |
| Local Government Employees | 2,778 | 8.3% |
| State Government Employees | 1,778 | 5.3% |
| Federal Government Employees | 3,545 | 10.6% |
| Unpaid Family Workers | 9 | 0.0% |
| Total | 33,422 | 100.0% |
Employment Status by Age in Yuba County
According to the labor force statistics for Yuba County, out of the total population over 16 years of age (61,690), 59.3% or 36,582 individuals are in the labor force, with 7.4% or 2,707 of them unemployed. The age group with the highest labor force participation rate is 35 to 44 years, with 81.6% or 9,092 individuals in the labor force. Within the labor force, the 16 to 19 years age range has the highest percentage of unemployed individuals, with 22.7% or 333 of them being unemployed.
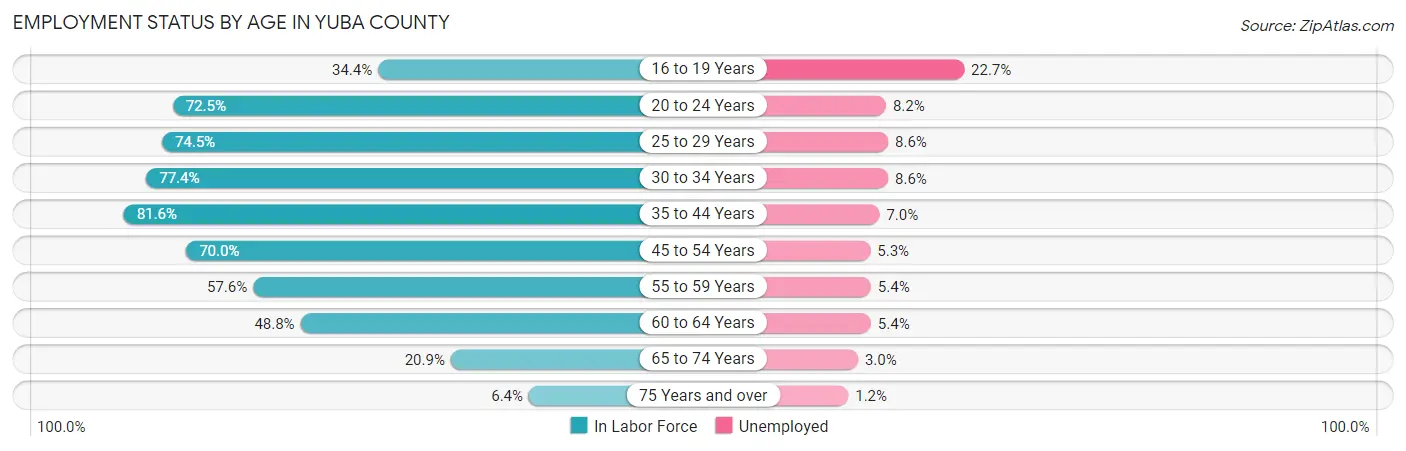
| Age Bracket | In Labor Force | Unemployed |
| 16 to 19 Years | 1,466 (34.4%) | 333 (22.7%) |
| 20 to 24 Years | 4,225 (72.5%) | 346 (8.2%) |
| 25 to 29 Years | 4,761 (74.5%) | 409 (8.6%) |
| 30 to 34 Years | 4,812 (77.4%) | 414 (8.6%) |
| 35 to 44 Years | 9,092 (81.6%) | 636 (7.0%) |
| 45 to 54 Years | 5,792 (70.0%) | 307 (5.3%) |
| 55 to 59 Years | 2,353 (57.6%) | 127 (5.4%) |
| 60 to 64 Years | 2,411 (48.8%) | 130 (5.4%) |
| 65 to 74 Years | 1,388 (20.9%) | 42 (3.0%) |
| 75 Years and over | 250 (6.4%) | 3 (1.2%) |
| Total | 36,582 (59.3%) | 2,707 (7.4%) |
Employment Status by Educational Attainment in Yuba County
According to labor force statistics for Yuba County, 71.2% of individuals (29,228) out of the total population between 25 and 64 years of age (41,050) are in the labor force, with 6.9% or 2,017 of them being unemployed. The group with the highest labor force participation rate are those with the educational attainment of bachelor's degree or higher, with 86.5% or 6,058 individuals in the labor force. Within the labor force, individuals with less than high school education have the highest percentage of unemployment, with 8.8% or 308 of them being unemployed.
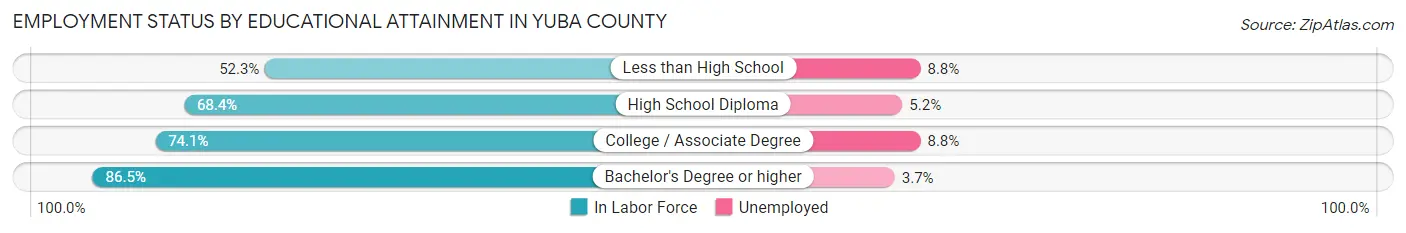
| Educational Attainment | In Labor Force | Unemployed |
| Less than High School | 3,501 (52.3%) | 589 (8.8%) |
| High School Diploma | 7,176 (68.4%) | 546 (5.2%) |
| College / Associate Degree | 12,494 (74.1%) | 1,484 (8.8%) |
| Bachelor's Degree or higher | 6,058 (86.5%) | 259 (3.7%) |
| Total | 29,228 (71.2%) | 2,832 (6.9%) |
Employment Occupations by Sex in Yuba County
Management, Business, Science and Arts Occupations
The most common Management, Business, Science and Arts occupations in Yuba County are Community & Social Service (2,780 | 8.8%), Management (2,744 | 8.7%), Health Diagnosing & Treating (1,729 | 5.5%), Education Instruction & Library (1,462 | 4.6%), and Computers, Engineering & Science (1,380 | 4.4%).
Management, Business, Science and Arts Occupations by Sex
Within the Management, Business, Science and Arts occupations in Yuba County, the most male-oriented occupations are Legal Services & Support (70.1%), Architecture & Engineering (68.7%), and Arts, Media & Entertainment (55.2%), while the most female-oriented occupations are Education Instruction & Library (82.0%), Health Technologists (80.3%), and Education, Arts & Media (74.1%).
| Occupation | Male | Female |
| Management | 1,350 (49.2%) | 1,394 (50.8%) |
| Business & Financial | 398 (32.9%) | 812 (67.1%) |
| Computers, Engineering & Science | 732 (53.0%) | 648 (47.0%) |
| Computers & Mathematics | 348 (49.1%) | 360 (50.8%) |
| Architecture & Engineering | 323 (68.7%) | 147 (31.3%) |
| Life, Physical & Social Science | 61 (30.2%) | 141 (69.8%) |
| Community & Social Service | 867 (31.2%) | 1,913 (68.8%) |
| Education, Arts & Media | 123 (25.9%) | 352 (74.1%) |
| Legal Services & Support | 75 (70.1%) | 32 (29.9%) |
| Education Instruction & Library | 263 (18.0%) | 1,199 (82.0%) |
| Arts, Media & Entertainment | 406 (55.2%) | 330 (44.8%) |
| Health Diagnosing & Treating | 656 (37.9%) | 1,073 (62.1%) |
| Health Technologists | 161 (19.7%) | 658 (80.3%) |
| Total (Category) | 4,003 (40.7%) | 5,840 (59.3%) |
| Total (Overall) | 16,497 (52.1%) | 15,160 (47.9%) |
Services Occupations
The most common Services occupations in Yuba County are Food Preparation & Serving (1,849 | 5.8%), Healthcare Support (1,543 | 4.9%), Cleaning & Maintenance (1,299 | 4.1%), Security & Protection (898 | 2.8%), and Personal Care & Service (696 | 2.2%).
Services Occupations by Sex
Within the Services occupations in Yuba County, the most male-oriented occupations are Law Enforcement (91.9%), Security & Protection (82.4%), and Firefighting & Prevention (74.1%), while the most female-oriented occupations are Healthcare Support (92.5%), Personal Care & Service (75.9%), and Food Preparation & Serving (58.9%).
| Occupation | Male | Female |
| Healthcare Support | 116 (7.5%) | 1,427 (92.5%) |
| Security & Protection | 740 (82.4%) | 158 (17.6%) |
| Firefighting & Prevention | 354 (74.1%) | 124 (25.9%) |
| Law Enforcement | 386 (91.9%) | 34 (8.1%) |
| Food Preparation & Serving | 760 (41.1%) | 1,089 (58.9%) |
| Cleaning & Maintenance | 753 (58.0%) | 546 (42.0%) |
| Personal Care & Service | 168 (24.1%) | 528 (75.9%) |
| Total (Category) | 2,537 (40.4%) | 3,748 (59.6%) |
| Total (Overall) | 16,497 (52.1%) | 15,160 (47.9%) |
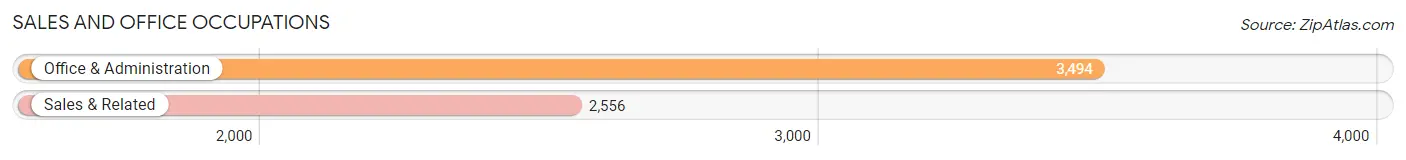
Sales and Office Occupations
The most common Sales and Office occupations in Yuba County are Office & Administration (3,494 | 11.0%), and Sales & Related (2,556 | 8.1%).
Sales and Office Occupations by Sex
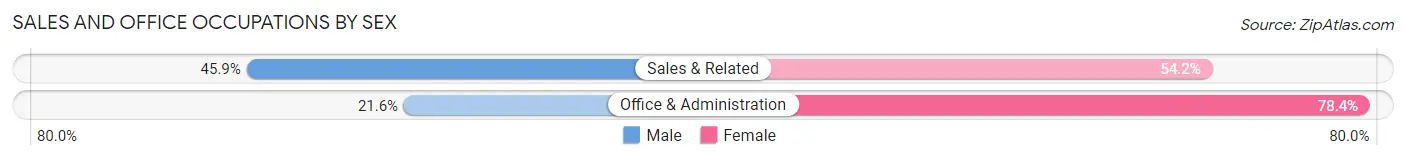
| Occupation | Male | Female |
| Sales & Related | 1,172 (45.9%) | 1,384 (54.1%) |
| Office & Administration | 756 (21.6%) | 2,738 (78.4%) |
| Total (Category) | 1,928 (31.9%) | 4,122 (68.1%) |
| Total (Overall) | 16,497 (52.1%) | 15,160 (47.9%) |
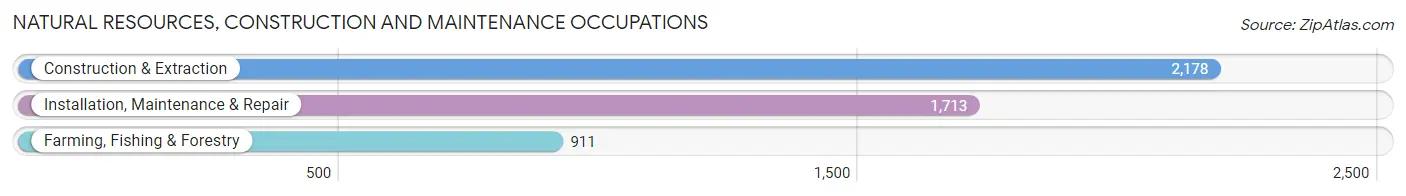
Natural Resources, Construction and Maintenance Occupations
The most common Natural Resources, Construction and Maintenance occupations in Yuba County are Construction & Extraction (2,178 | 6.9%), Installation, Maintenance & Repair (1,713 | 5.4%), and Farming, Fishing & Forestry (911 | 2.9%).
Natural Resources, Construction and Maintenance Occupations by Sex
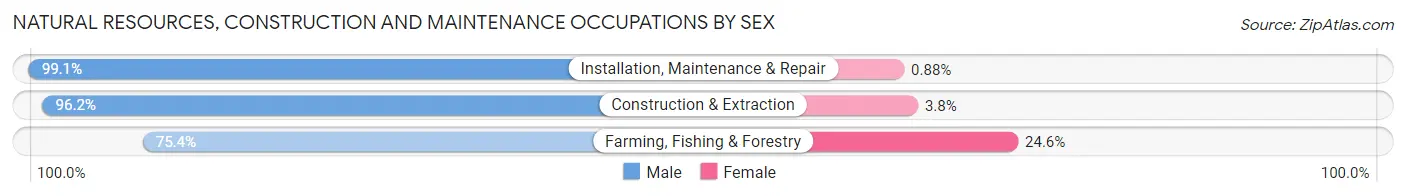
| Occupation | Male | Female |
| Farming, Fishing & Forestry | 687 (75.4%) | 224 (24.6%) |
| Construction & Extraction | 2,096 (96.2%) | 82 (3.8%) |
| Installation, Maintenance & Repair | 1,698 (99.1%) | 15 (0.9%) |
| Total (Category) | 4,481 (93.3%) | 321 (6.7%) |
| Total (Overall) | 16,497 (52.1%) | 15,160 (47.9%) |
Production, Transportation and Moving Occupations
The most common Production, Transportation and Moving occupations in Yuba County are Production (1,804 | 5.7%), Material Moving (1,523 | 4.8%), and Transportation (1,350 | 4.3%).
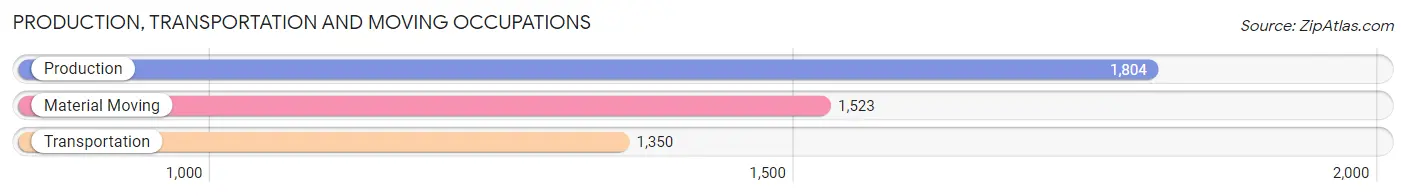
Production, Transportation and Moving Occupations by Sex
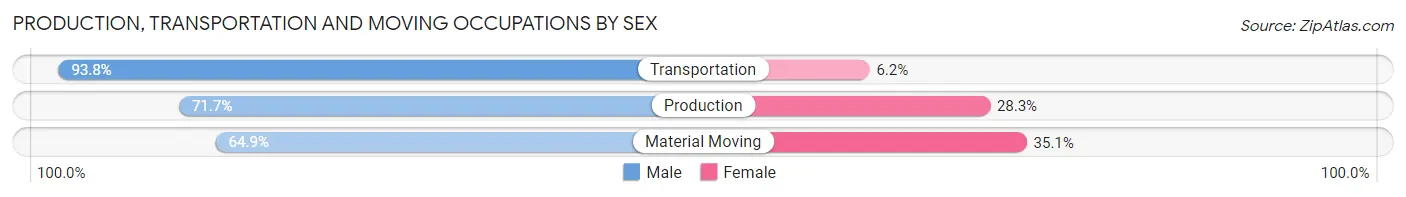
| Occupation | Male | Female |
| Production | 1,293 (71.7%) | 511 (28.3%) |
| Transportation | 1,266 (93.8%) | 84 (6.2%) |
| Material Moving | 989 (64.9%) | 534 (35.1%) |
| Total (Category) | 3,548 (75.9%) | 1,129 (24.1%) |
| Total (Overall) | 16,497 (52.1%) | 15,160 (47.9%) |
Employment Industries by Sex in Yuba County
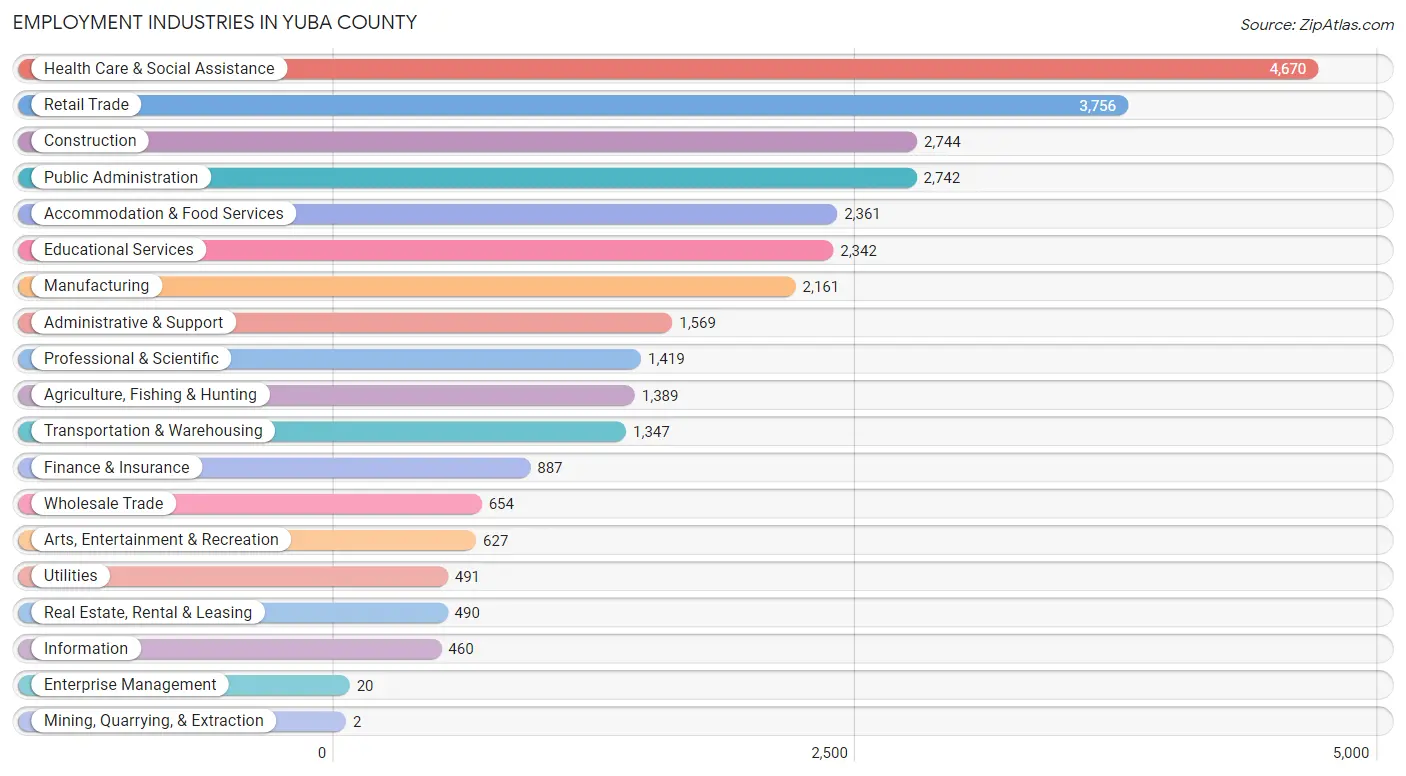
Employment Industries in Yuba County
The major employment industries in Yuba County include Health Care & Social Assistance (4,670 | 14.7%), Retail Trade (3,756 | 11.9%), Construction (2,744 | 8.7%), Public Administration (2,742 | 8.7%), and Accommodation & Food Services (2,361 | 7.5%).
Employment Industries by Sex in Yuba County
The Yuba County industries that see more men than women are Mining, Quarrying, & Extraction (100.0%), Construction (92.0%), and Wholesale Trade (85.2%), whereas the industries that tend to have a higher number of women are Enterprise Management (100.0%), Health Care & Social Assistance (81.3%), and Educational Services (73.5%).
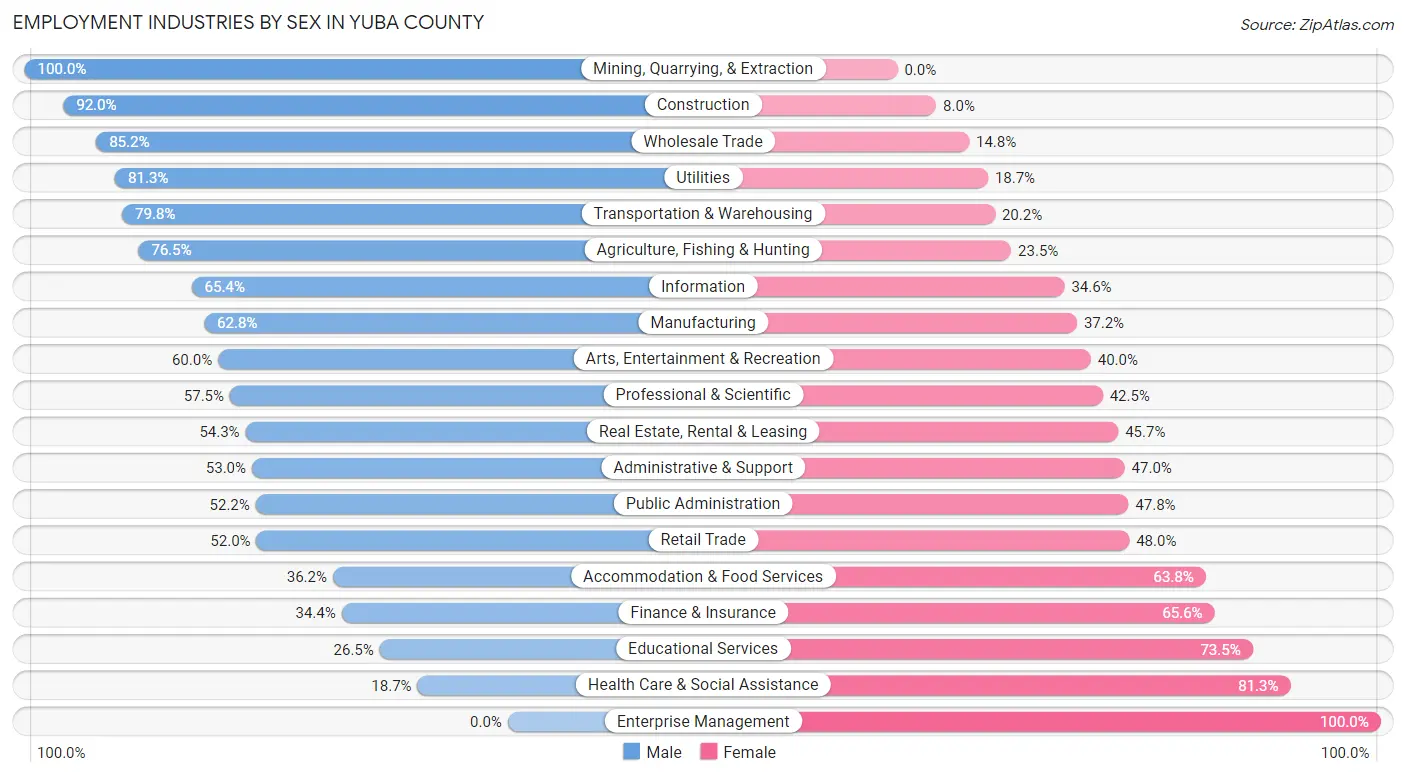
| Industry | Male | Female |
| Agriculture, Fishing & Hunting | 1,062 (76.5%) | 327 (23.5%) |
| Mining, Quarrying, & Extraction | 2 (100.0%) | 0 (0.0%) |
| Construction | 2,524 (92.0%) | 220 (8.0%) |
| Manufacturing | 1,358 (62.8%) | 803 (37.2%) |
| Wholesale Trade | 557 (85.2%) | 97 (14.8%) |
| Retail Trade | 1,954 (52.0%) | 1,802 (48.0%) |
| Transportation & Warehousing | 1,075 (79.8%) | 272 (20.2%) |
| Utilities | 399 (81.3%) | 92 (18.7%) |
| Information | 301 (65.4%) | 159 (34.6%) |
| Finance & Insurance | 305 (34.4%) | 582 (65.6%) |
| Real Estate, Rental & Leasing | 266 (54.3%) | 224 (45.7%) |
| Professional & Scientific | 816 (57.5%) | 603 (42.5%) |
| Enterprise Management | 0 (0.0%) | 20 (100.0%) |
| Administrative & Support | 831 (53.0%) | 738 (47.0%) |
| Educational Services | 621 (26.5%) | 1,721 (73.5%) |
| Health Care & Social Assistance | 873 (18.7%) | 3,797 (81.3%) |
| Arts, Entertainment & Recreation | 376 (60.0%) | 251 (40.0%) |
| Accommodation & Food Services | 855 (36.2%) | 1,506 (63.8%) |
| Public Administration | 1,431 (52.2%) | 1,311 (47.8%) |
| Total | 16,497 (52.1%) | 15,160 (47.9%) |
Education in Yuba County
School Enrollment in Yuba County
The most common levels of schooling among the 22,461 students in Yuba County are college / undergraduate (4,990 | 22.2%), elementary school (4,956 | 22.1%), and middle school (4,663 | 20.8%).
| School Level | # Students | % Students |
| Nursery / Preschool | 1,340 | 6.0% |
| Kindergarten | 1,432 | 6.4% |
| Elementary School | 4,956 | 22.1% |
| Middle School | 4,663 | 20.8% |
| High School | 4,388 | 19.5% |
| College / Undergraduate | 4,990 | 22.2% |
| Graduate / Professional | 692 | 3.1% |
| Total | 22,461 | 100.0% |
School Enrollment by Age by Funding Source in Yuba County
Out of a total of 22,461 students who are enrolled in schools in Yuba County, 2,291 (10.2%) attend a private institution, while the remaining 20,170 (89.8%) are enrolled in public schools. The age group of 3 to 4 year olds has the highest likelihood of being enrolled in private schools, with 266 (28.2% in the age bracket) enrolled. Conversely, the age group of 18 to 19 year olds has the lowest likelihood of being enrolled in a private school, with 1,319 (97.1% in the age bracket) attending a public institution.
| Age Bracket | Public School | Private School |
| 3 to 4 Year Olds | 677 (71.8%) | 266 (28.2%) |
| 5 to 9 Year Old | 5,954 (95.2%) | 300 (4.8%) |
| 10 to 14 Year Olds | 5,330 (89.3%) | 639 (10.7%) |
| 15 to 17 Year Olds | 3,008 (93.7%) | 203 (6.3%) |
| 18 to 19 Year Olds | 1,319 (97.1%) | 39 (2.9%) |
| 20 to 24 Year Olds | 1,842 (90.1%) | 202 (9.9%) |
| 25 to 34 Year Olds | 1,316 (79.1%) | 348 (20.9%) |
| 35 Years and over | 731 (71.8%) | 287 (28.2%) |
| Total | 20,170 (89.8%) | 2,291 (10.2%) |
Educational Attainment by Field of Study in Yuba County
Business (1,689 | 17.6%), arts & humanities (960 | 10.0%), engineering (914 | 9.6%), science & technology (860 | 9.0%), and social sciences (809 | 8.5%) are the most common fields of study among 9,575 individuals in Yuba County who have obtained a bachelor's degree or higher.
| Field of Study | # Graduates | % Graduates |
| Computers & Mathematics | 253 | 2.6% |
| Bio, Nature & Agricultural | 655 | 6.8% |
| Physical & Health Sciences | 300 | 3.1% |
| Psychology | 510 | 5.3% |
| Social Sciences | 809 | 8.5% |
| Engineering | 914 | 9.6% |
| Multidisciplinary Studies | 75 | 0.8% |
| Science & Technology | 860 | 9.0% |
| Business | 1,689 | 17.6% |
| Education | 681 | 7.1% |
| Literature & Languages | 609 | 6.4% |
| Liberal Arts & History | 457 | 4.8% |
| Visual & Performing Arts | 441 | 4.6% |
| Communications | 362 | 3.8% |
| Arts & Humanities | 960 | 10.0% |
| Total | 9,575 | 100.0% |
Transportation & Commute in Yuba County
Vehicle Availability by Sex in Yuba County
The most prevalent vehicle ownership categories in Yuba County are males with 2 vehicles (5,939, accounting for 33.7%) and females with 2 vehicles (4,434, making up 39.4%).
| Vehicles Available | Male | Female |
| No Vehicle | 320 (1.8%) | 442 (2.9%) |
| 1 Vehicle | 2,193 (12.4%) | 3,171 (21.0%) |
| 2 Vehicles | 5,939 (33.7%) | 4,434 (29.4%) |
| 3 Vehicles | 5,094 (28.9%) | 3,677 (24.4%) |
| 4 Vehicles | 2,899 (16.4%) | 2,351 (15.6%) |
| 5 or more Vehicles | 1,199 (6.8%) | 994 (6.6%) |
| Total | 17,644 (100.0%) | 15,069 (100.0%) |
Commute Time in Yuba County
The most frequently occuring commute durations in Yuba County are 15 to 19 minutes (4,755 commuters, 15.2%), 45 to 59 minutes (4,081 commuters, 13.1%), and 20 to 24 minutes (3,365 commuters, 10.8%).
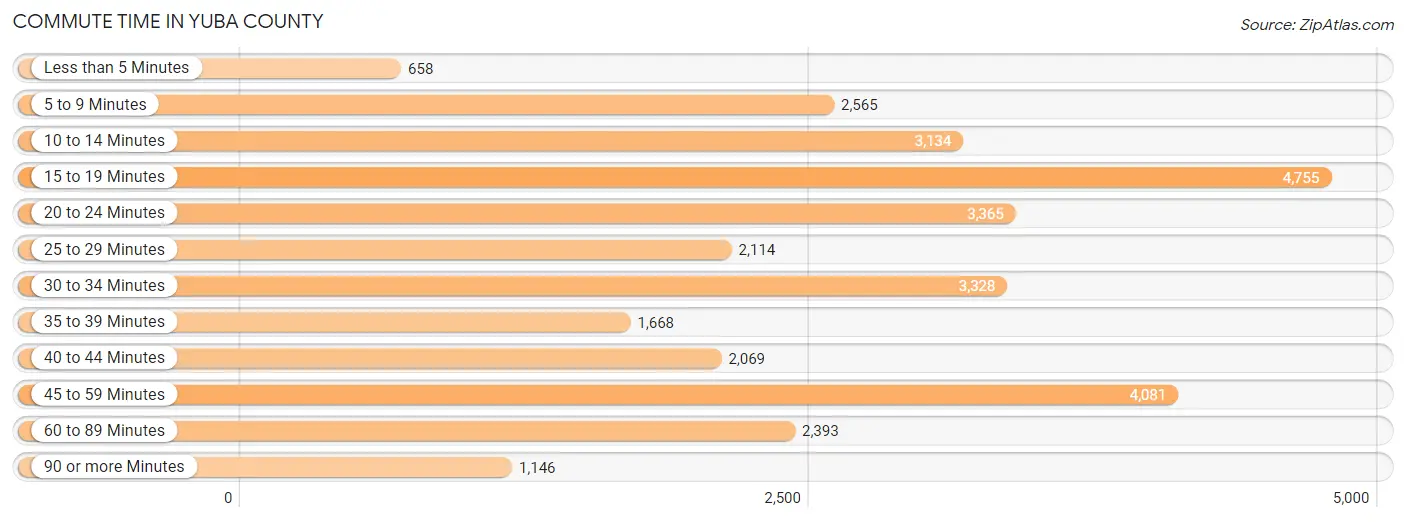
| Commute Time | # Commuters | % Commuters |
| Less than 5 Minutes | 658 | 2.1% |
| 5 to 9 Minutes | 2,565 | 8.2% |
| 10 to 14 Minutes | 3,134 | 10.0% |
| 15 to 19 Minutes | 4,755 | 15.2% |
| 20 to 24 Minutes | 3,365 | 10.8% |
| 25 to 29 Minutes | 2,114 | 6.8% |
| 30 to 34 Minutes | 3,328 | 10.6% |
| 35 to 39 Minutes | 1,668 | 5.3% |
| 40 to 44 Minutes | 2,069 | 6.6% |
| 45 to 59 Minutes | 4,081 | 13.1% |
| 60 to 89 Minutes | 2,393 | 7.6% |
| 90 or more Minutes | 1,146 | 3.7% |
Commute Time by Sex in Yuba County
The most common commute times in Yuba County are 15 to 19 minutes (2,670 commuters, 15.5%) for males and 15 to 19 minutes (2,085 commuters, 14.9%) for females.
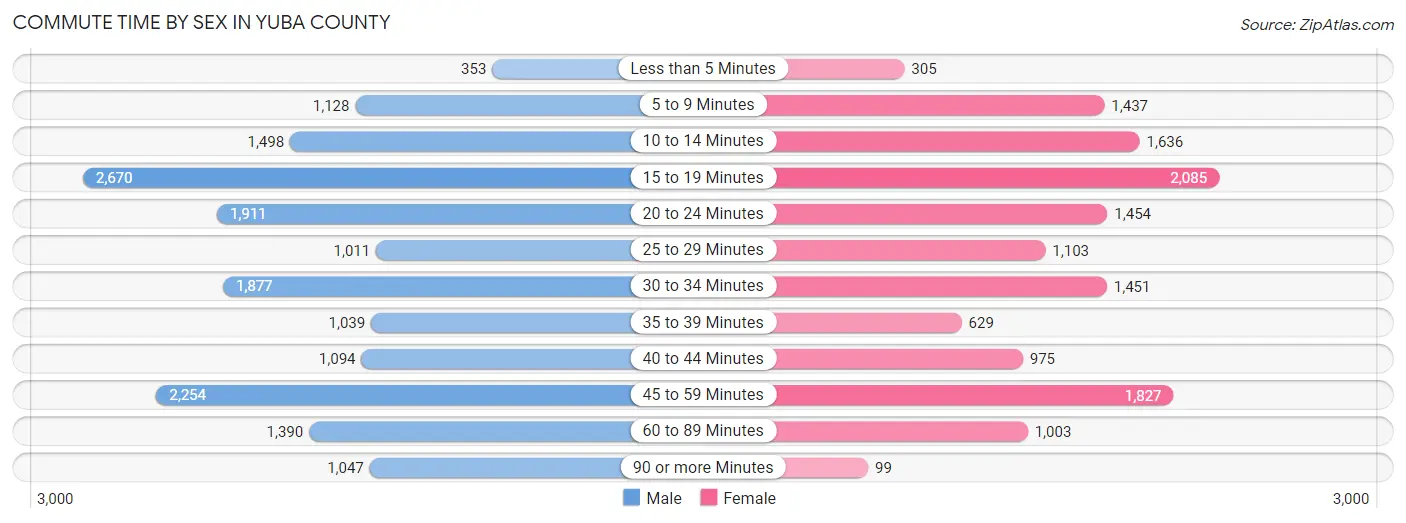
| Commute Time | Male | Female |
| Less than 5 Minutes | 353 (2.0%) | 305 (2.2%) |
| 5 to 9 Minutes | 1,128 (6.5%) | 1,437 (10.3%) |
| 10 to 14 Minutes | 1,498 (8.7%) | 1,636 (11.7%) |
| 15 to 19 Minutes | 2,670 (15.5%) | 2,085 (14.9%) |
| 20 to 24 Minutes | 1,911 (11.1%) | 1,454 (10.4%) |
| 25 to 29 Minutes | 1,011 (5.9%) | 1,103 (7.9%) |
| 30 to 34 Minutes | 1,877 (10.9%) | 1,451 (10.4%) |
| 35 to 39 Minutes | 1,039 (6.0%) | 629 (4.5%) |
| 40 to 44 Minutes | 1,094 (6.3%) | 975 (7.0%) |
| 45 to 59 Minutes | 2,254 (13.1%) | 1,827 (13.1%) |
| 60 to 89 Minutes | 1,390 (8.1%) | 1,003 (7.2%) |
| 90 or more Minutes | 1,047 (6.1%) | 99 (0.7%) |
Time of Departure to Work by Sex in Yuba County
The most frequent times of departure to work in Yuba County are 5:00 AM to 5:29 AM (2,178, 12.6%) for males and 7:30 AM to 7:59 AM (2,189, 15.6%) for females.
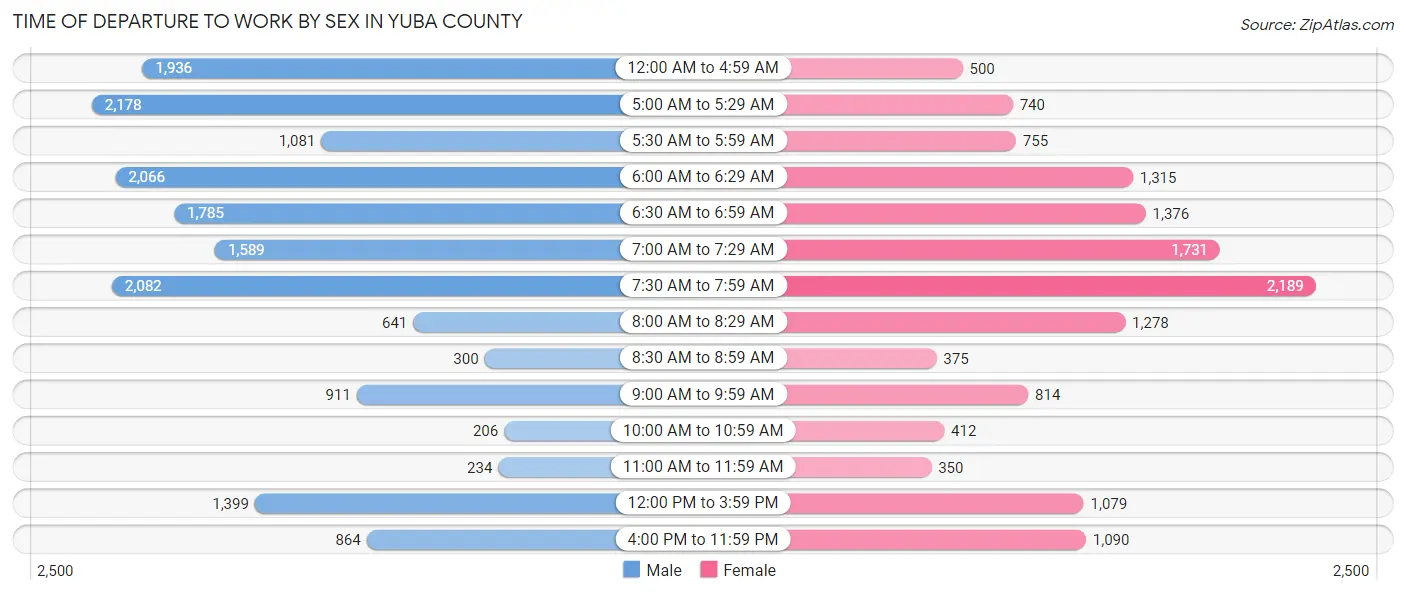
| Time of Departure | Male | Female |
| 12:00 AM to 4:59 AM | 1,936 (11.2%) | 500 (3.6%) |
| 5:00 AM to 5:29 AM | 2,178 (12.6%) | 740 (5.3%) |
| 5:30 AM to 5:59 AM | 1,081 (6.3%) | 755 (5.4%) |
| 6:00 AM to 6:29 AM | 2,066 (12.0%) | 1,315 (9.4%) |
| 6:30 AM to 6:59 AM | 1,785 (10.3%) | 1,376 (9.8%) |
| 7:00 AM to 7:29 AM | 1,589 (9.2%) | 1,731 (12.4%) |
| 7:30 AM to 7:59 AM | 2,082 (12.0%) | 2,189 (15.6%) |
| 8:00 AM to 8:29 AM | 641 (3.7%) | 1,278 (9.1%) |
| 8:30 AM to 8:59 AM | 300 (1.7%) | 375 (2.7%) |
| 9:00 AM to 9:59 AM | 911 (5.3%) | 814 (5.8%) |
| 10:00 AM to 10:59 AM | 206 (1.2%) | 412 (2.9%) |
| 11:00 AM to 11:59 AM | 234 (1.3%) | 350 (2.5%) |
| 12:00 PM to 3:59 PM | 1,399 (8.1%) | 1,079 (7.7%) |
| 4:00 PM to 11:59 PM | 864 (5.0%) | 1,090 (7.8%) |
| Total | 17,272 (100.0%) | 14,004 (100.0%) |
Housing Occupancy in Yuba County
Occupancy by Ownership in Yuba County
Of the total 27,567 dwellings in Yuba County, owner-occupied units account for 16,928 (61.4%), while renter-occupied units make up 10,639 (38.6%).
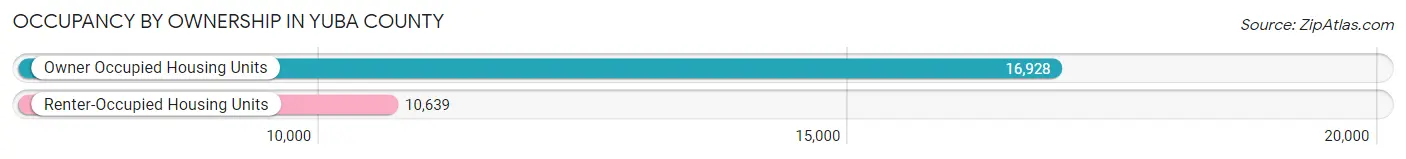
| Occupancy | # Housing Units | % Housing Units |
| Owner Occupied Housing Units | 16,928 | 61.4% |
| Renter-Occupied Housing Units | 10,639 | 38.6% |
| Total Occupied Housing Units | 27,567 | 100.0% |
Occupancy by Household Size in Yuba County
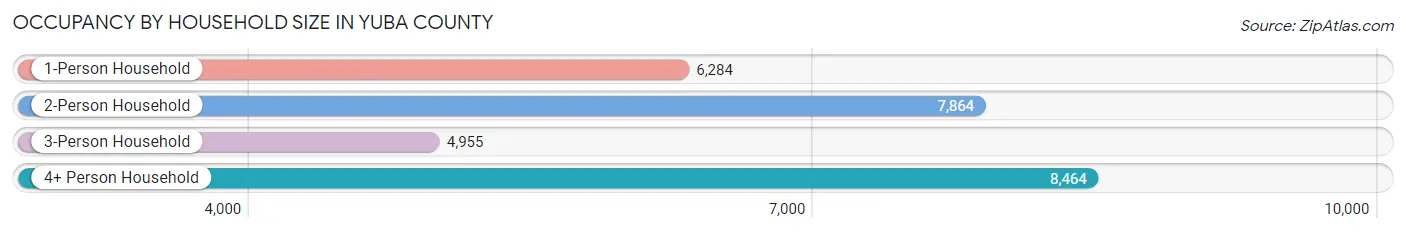
| Household Size | # Housing Units | % Housing Units |
| 1-Person Household | 6,284 | 22.8% |
| 2-Person Household | 7,864 | 28.5% |
| 3-Person Household | 4,955 | 18.0% |
| 4+ Person Household | 8,464 | 30.7% |
| Total Housing Units | 27,567 | 100.0% |
Occupancy by Ownership by Household Size in Yuba County
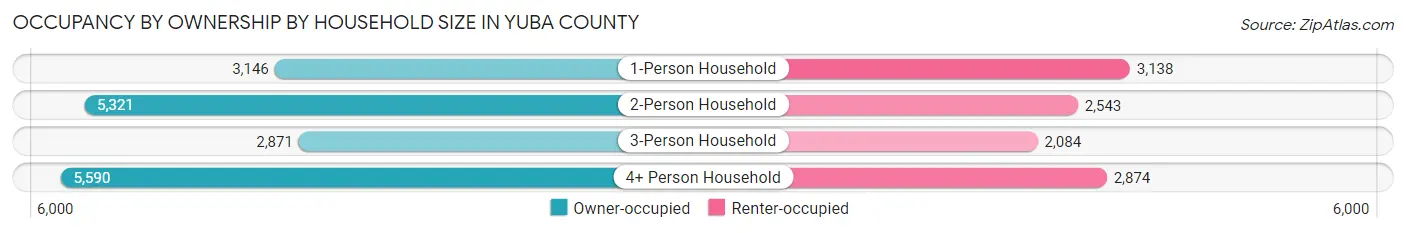
| Household Size | Owner-occupied | Renter-occupied |
| 1-Person Household | 3,146 (50.1%) | 3,138 (49.9%) |
| 2-Person Household | 5,321 (67.7%) | 2,543 (32.3%) |
| 3-Person Household | 2,871 (57.9%) | 2,084 (42.1%) |
| 4+ Person Household | 5,590 (66.0%) | 2,874 (34.0%) |
| Total Housing Units | 16,928 (61.4%) | 10,639 (38.6%) |
Occupancy by Educational Attainment in Yuba County
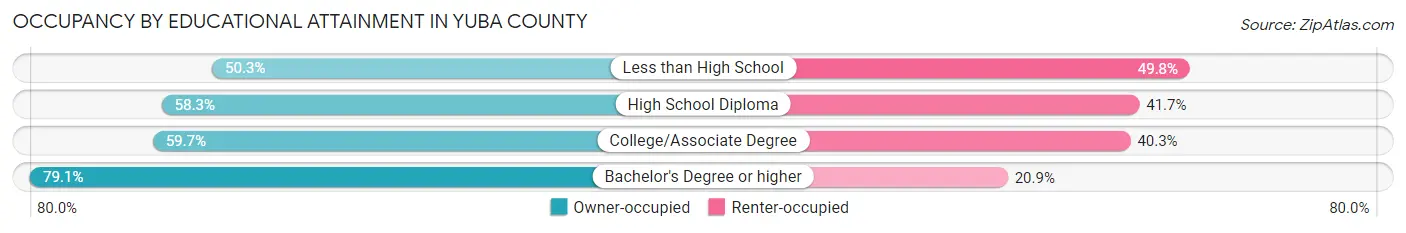
| Household Size | Owner-occupied | Renter-occupied |
| Less than High School | 2,094 (50.2%) | 2,073 (49.7%) |
| High School Diploma | 3,439 (58.3%) | 2,464 (41.7%) |
| College/Associate Degree | 7,513 (59.7%) | 5,078 (40.3%) |
| Bachelor's Degree or higher | 3,882 (79.1%) | 1,024 (20.9%) |
Occupancy by Age of Householder in Yuba County
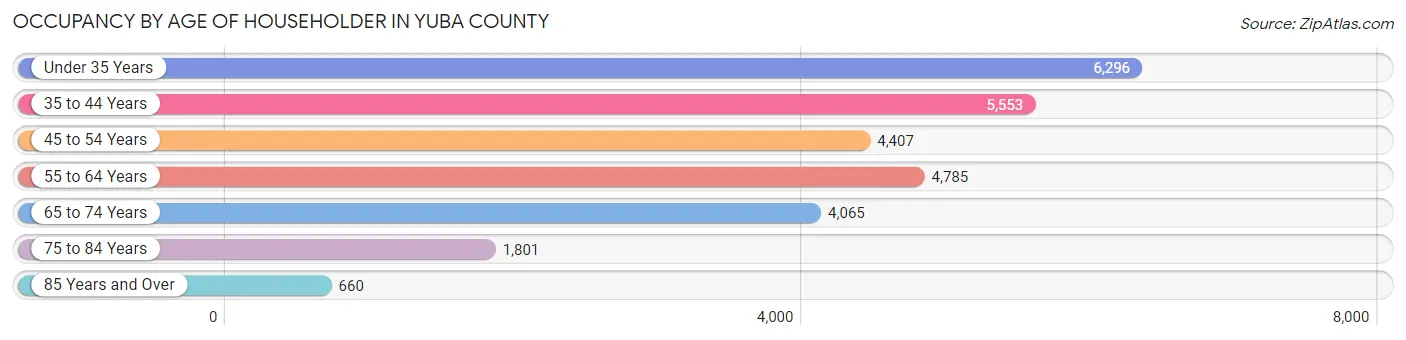
| Age Bracket | # Households | % Households |
| Under 35 Years | 6,296 | 22.8% |
| 35 to 44 Years | 5,553 | 20.1% |
| 45 to 54 Years | 4,407 | 16.0% |
| 55 to 64 Years | 4,785 | 17.4% |
| 65 to 74 Years | 4,065 | 14.7% |
| 75 to 84 Years | 1,801 | 6.5% |
| 85 Years and Over | 660 | 2.4% |
| Total | 27,567 | 100.0% |
Housing Finances in Yuba County
Median Income by Occupancy in Yuba County
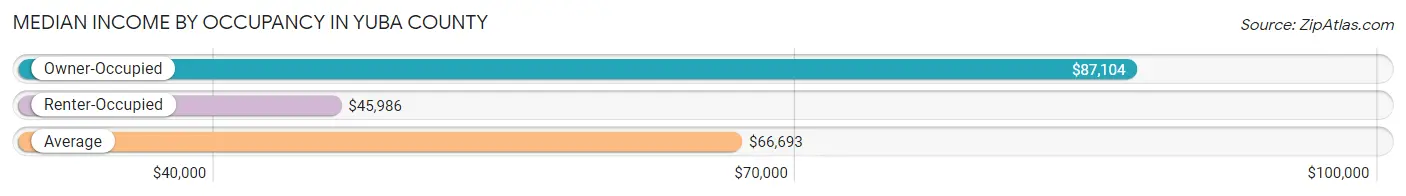
| Occupancy Type | # Households | Median Income |
| Owner-Occupied | 16,928 (61.4%) | $87,104 |
| Renter-Occupied | 10,639 (38.6%) | $45,986 |
| Average | 27,567 (100.0%) | $66,693 |
Occupancy by Householder Income Bracket in Yuba County
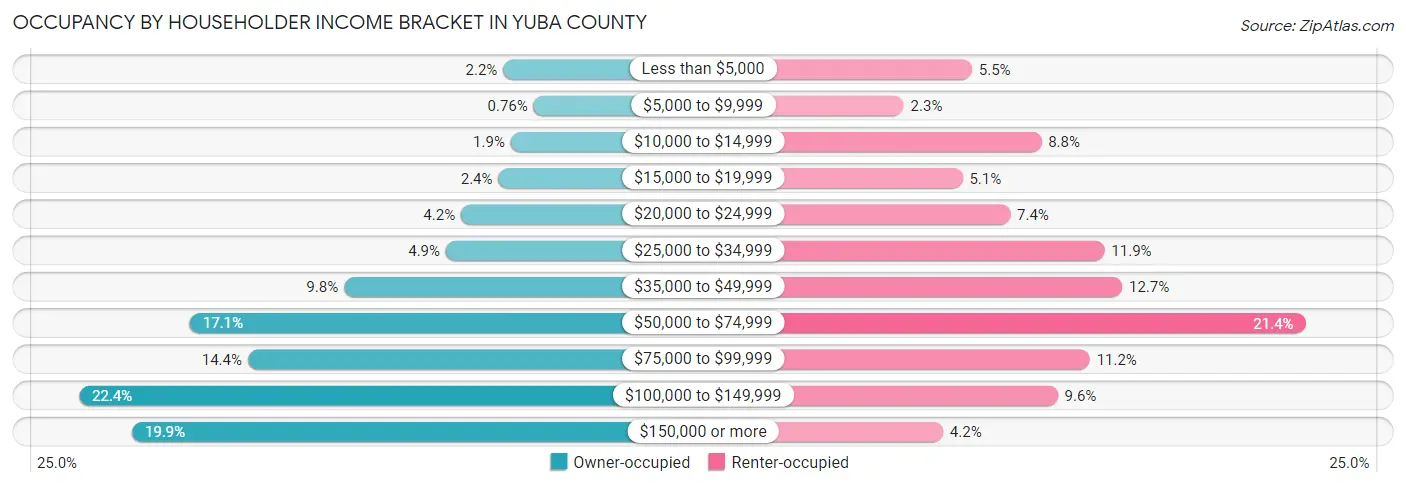
| Income Bracket | Owner-occupied | Renter-occupied |
| Less than $5,000 | 374 (2.2%) | 589 (5.5%) |
| $5,000 to $9,999 | 128 (0.8%) | 244 (2.3%) |
| $10,000 to $14,999 | 313 (1.8%) | 940 (8.8%) |
| $15,000 to $19,999 | 413 (2.4%) | 541 (5.1%) |
| $20,000 to $24,999 | 714 (4.2%) | 783 (7.4%) |
| $25,000 to $34,999 | 836 (4.9%) | 1,261 (11.8%) |
| $35,000 to $49,999 | 1,657 (9.8%) | 1,350 (12.7%) |
| $50,000 to $74,999 | 2,900 (17.1%) | 2,279 (21.4%) |
| $75,000 to $99,999 | 2,432 (14.4%) | 1,186 (11.2%) |
| $100,000 to $149,999 | 3,794 (22.4%) | 1,023 (9.6%) |
| $150,000 or more | 3,367 (19.9%) | 443 (4.2%) |
| Total | 16,928 (100.0%) | 10,639 (100.0%) |
Monthly Housing Cost Tiers in Yuba County
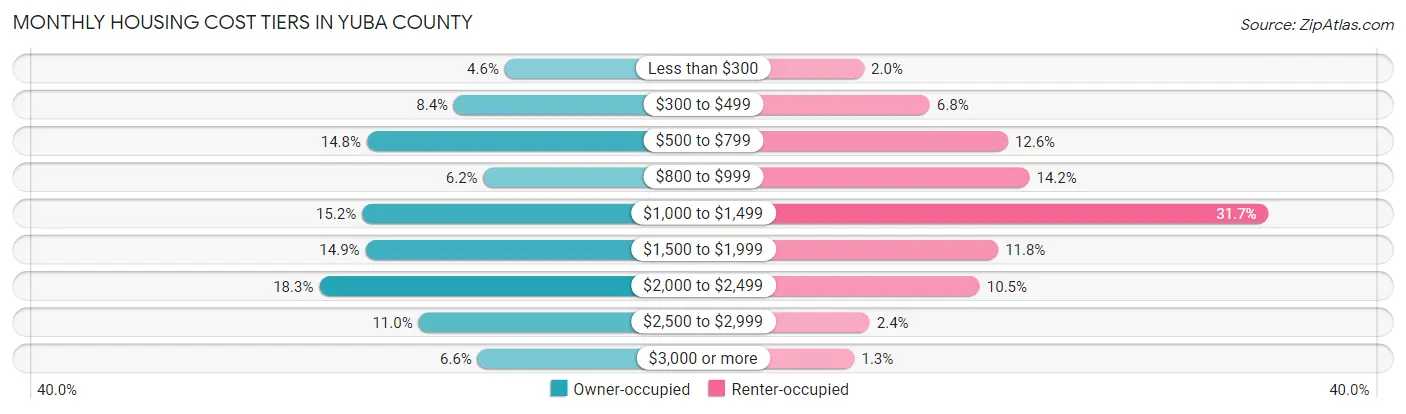
| Monthly Cost | Owner-occupied | Renter-occupied |
| Less than $300 | 786 (4.6%) | 210 (2.0%) |
| $300 to $499 | 1,418 (8.4%) | 725 (6.8%) |
| $500 to $799 | 2,505 (14.8%) | 1,336 (12.6%) |
| $800 to $999 | 1,051 (6.2%) | 1,505 (14.1%) |
| $1,000 to $1,499 | 2,565 (15.1%) | 3,377 (31.7%) |
| $1,500 to $1,999 | 2,522 (14.9%) | 1,260 (11.8%) |
| $2,000 to $2,499 | 3,097 (18.3%) | 1,116 (10.5%) |
| $2,500 to $2,999 | 1,861 (11.0%) | 254 (2.4%) |
| $3,000 or more | 1,123 (6.6%) | 134 (1.3%) |
| Total | 16,928 (100.0%) | 10,639 (100.0%) |
Physical Housing Characteristics in Yuba County
Housing Structures in Yuba County
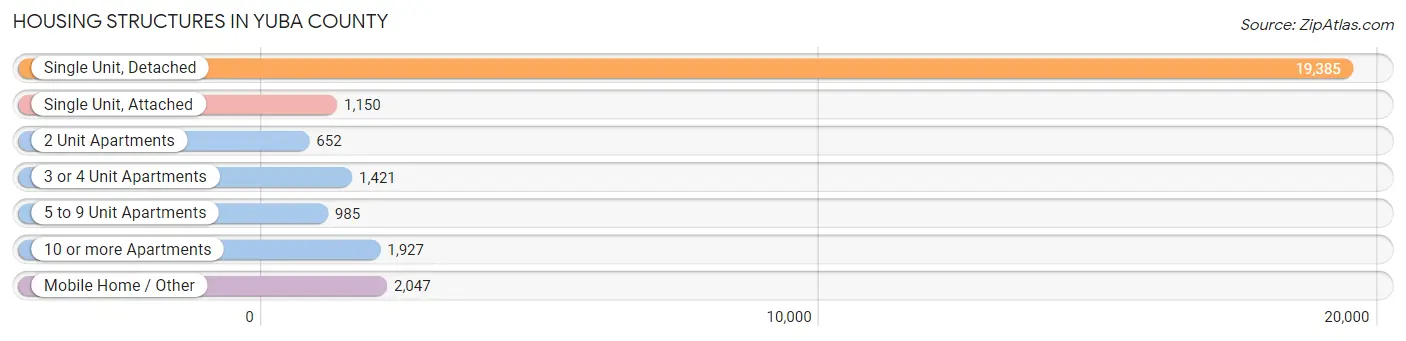
| Structure Type | # Housing Units | % Housing Units |
| Single Unit, Detached | 19,385 | 70.3% |
| Single Unit, Attached | 1,150 | 4.2% |
| 2 Unit Apartments | 652 | 2.4% |
| 3 or 4 Unit Apartments | 1,421 | 5.1% |
| 5 to 9 Unit Apartments | 985 | 3.6% |
| 10 or more Apartments | 1,927 | 7.0% |
| Mobile Home / Other | 2,047 | 7.4% |
| Total | 27,567 | 100.0% |
Housing Structures by Occupancy in Yuba County
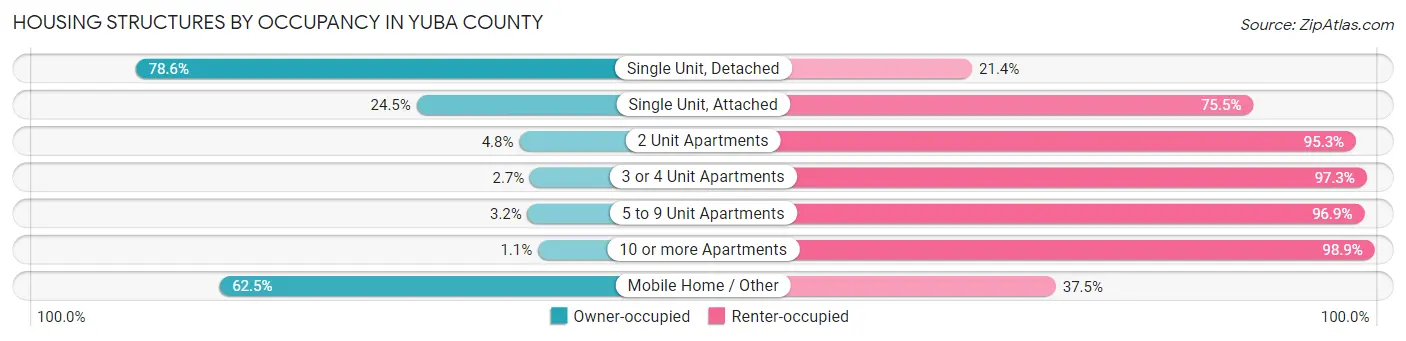
| Structure Type | Owner-occupied | Renter-occupied |
| Single Unit, Detached | 15,244 (78.6%) | 4,141 (21.4%) |
| Single Unit, Attached | 282 (24.5%) | 868 (75.5%) |
| 2 Unit Apartments | 31 (4.8%) | 621 (95.3%) |
| 3 or 4 Unit Apartments | 38 (2.7%) | 1,383 (97.3%) |
| 5 to 9 Unit Apartments | 31 (3.2%) | 954 (96.9%) |
| 10 or more Apartments | 22 (1.1%) | 1,905 (98.9%) |
| Mobile Home / Other | 1,280 (62.5%) | 767 (37.5%) |
| Total | 16,928 (61.4%) | 10,639 (38.6%) |
Housing Structures by Number of Rooms in Yuba County
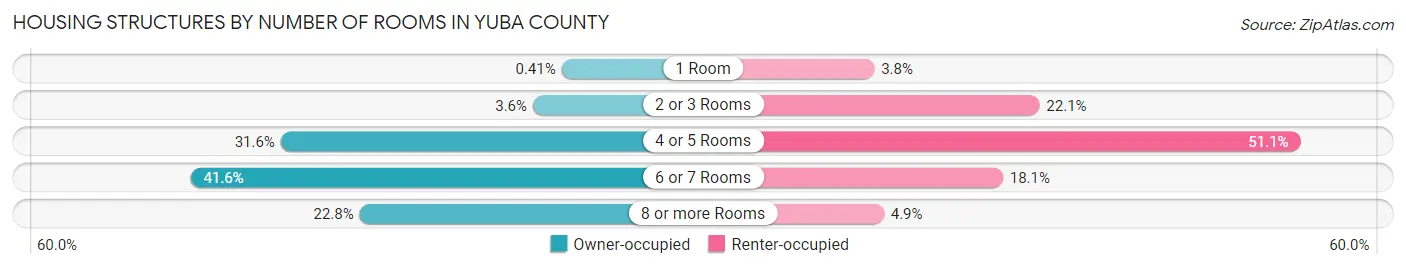
| Number of Rooms | Owner-occupied | Renter-occupied |
| 1 Room | 69 (0.4%) | 405 (3.8%) |
| 2 or 3 Rooms | 608 (3.6%) | 2,355 (22.1%) |
| 4 or 5 Rooms | 5,346 (31.6%) | 5,437 (51.1%) |
| 6 or 7 Rooms | 7,040 (41.6%) | 1,924 (18.1%) |
| 8 or more Rooms | 3,865 (22.8%) | 518 (4.9%) |
| Total | 16,928 (100.0%) | 10,639 (100.0%) |
Housing Structure by Heating Type in Yuba County
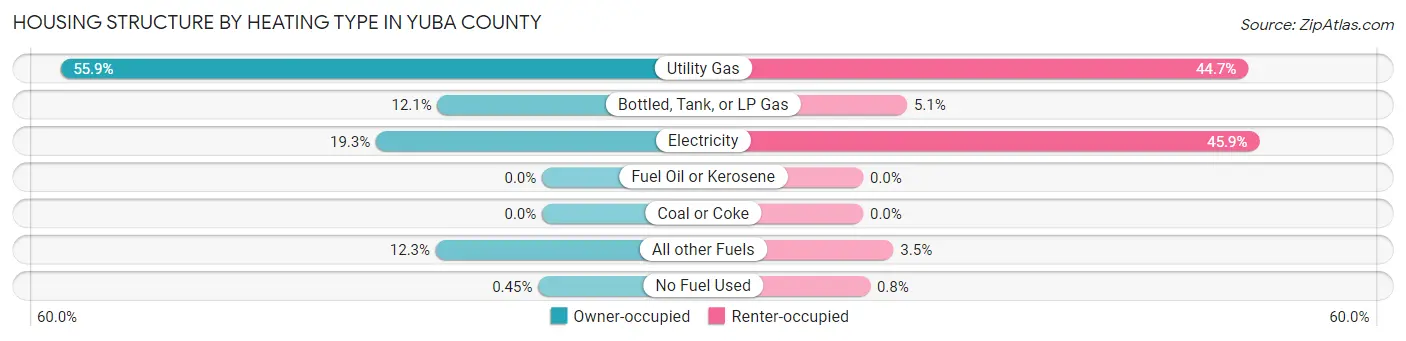
| Heating Type | Owner-occupied | Renter-occupied |
| Utility Gas | 9,457 (55.9%) | 4,750 (44.7%) |
| Bottled, Tank, or LP Gas | 2,052 (12.1%) | 542 (5.1%) |
| Electricity | 3,258 (19.3%) | 4,888 (45.9%) |
| Fuel Oil or Kerosene | 0 (0.0%) | 0 (0.0%) |
| Coal or Coke | 0 (0.0%) | 0 (0.0%) |
| All other Fuels | 2,085 (12.3%) | 374 (3.5%) |
| No Fuel Used | 76 (0.4%) | 85 (0.8%) |
| Total | 16,928 (100.0%) | 10,639 (100.0%) |
Household Vehicle Usage in Yuba County
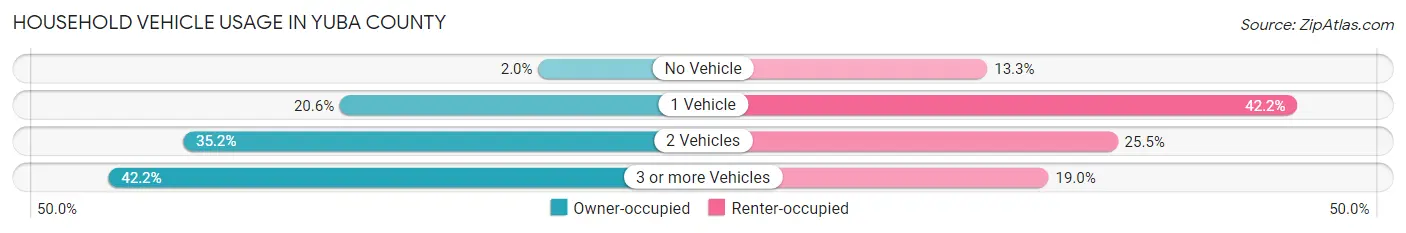
| Vehicles per Household | Owner-occupied | Renter-occupied |
| No Vehicle | 346 (2.0%) | 1,414 (13.3%) |
| 1 Vehicle | 3,481 (20.6%) | 4,493 (42.2%) |
| 2 Vehicles | 5,960 (35.2%) | 2,709 (25.5%) |
| 3 or more Vehicles | 7,141 (42.2%) | 2,023 (19.0%) |
| Total | 16,928 (100.0%) | 10,639 (100.0%) |
Real Estate & Mortgages in Yuba County
Real Estate and Mortgage Overview in Yuba County
| Characteristic | Without Mortgage | With Mortgage |
| Housing Units | 5,358 | 11,570 |
| Median Property Value | $277,100 | $374,800 |
| Median Household Income | $61,818 | $2,723 |
| Monthly Housing Costs | $570 | $1,111 |
| Real Estate Taxes | $1,896 | $192 |
Property Value by Mortgage Status in Yuba County
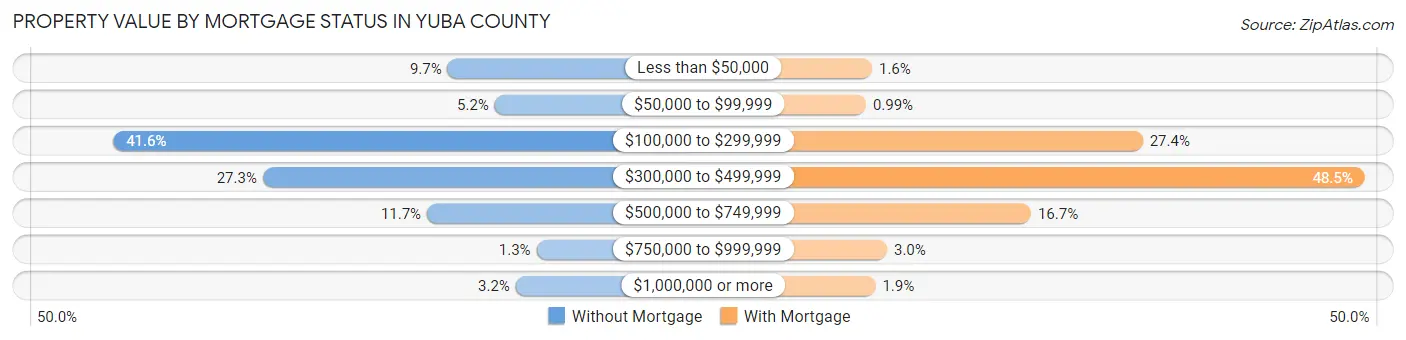
| Property Value | Without Mortgage | With Mortgage |
| Less than $50,000 | 521 (9.7%) | 182 (1.6%) |
| $50,000 to $99,999 | 280 (5.2%) | 114 (1.0%) |
| $100,000 to $299,999 | 2,227 (41.6%) | 3,164 (27.4%) |
| $300,000 to $499,999 | 1,464 (27.3%) | 5,610 (48.5%) |
| $500,000 to $749,999 | 626 (11.7%) | 1,933 (16.7%) |
| $750,000 to $999,999 | 67 (1.3%) | 347 (3.0%) |
| $1,000,000 or more | 173 (3.2%) | 220 (1.9%) |
| Total | 5,358 (100.0%) | 11,570 (100.0%) |
Household Income by Mortgage Status in Yuba County
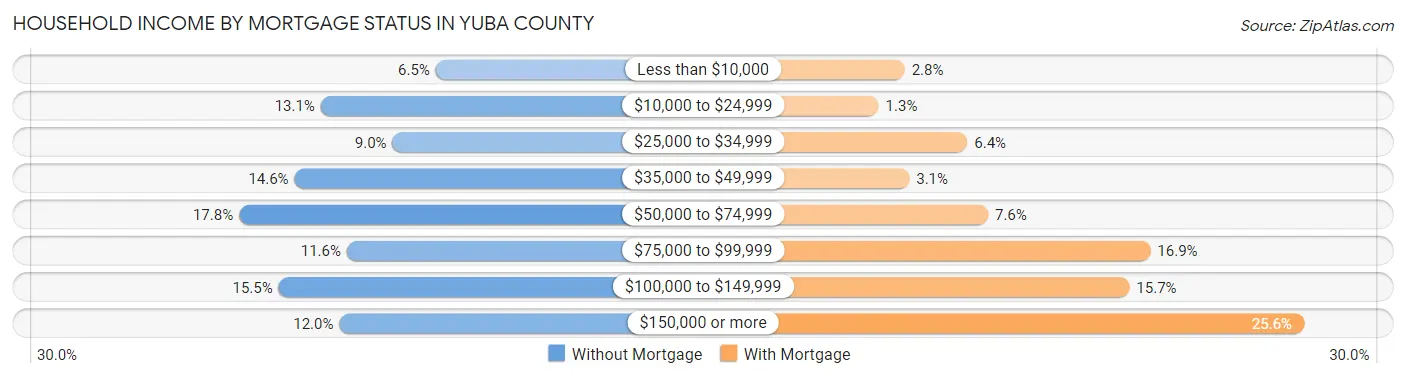
| Household Income | Without Mortgage | With Mortgage |
| Less than $10,000 | 349 (6.5%) | 325 (2.8%) |
| $10,000 to $24,999 | 701 (13.1%) | 153 (1.3%) |
| $25,000 to $34,999 | 481 (9.0%) | 739 (6.4%) |
| $35,000 to $49,999 | 781 (14.6%) | 355 (3.1%) |
| $50,000 to $74,999 | 951 (17.7%) | 876 (7.6%) |
| $75,000 to $99,999 | 621 (11.6%) | 1,949 (16.9%) |
| $100,000 to $149,999 | 830 (15.5%) | 1,811 (15.7%) |
| $150,000 or more | 644 (12.0%) | 2,964 (25.6%) |
| Total | 5,358 (100.0%) | 11,570 (100.0%) |
Property Value to Household Income Ratio in Yuba County
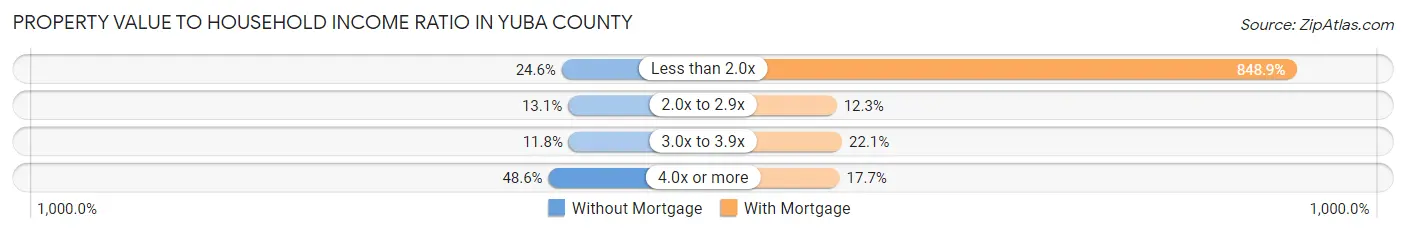
| Value-to-Income Ratio | Without Mortgage | With Mortgage |
| Less than 2.0x | 1,316 (24.6%) | 98,212 (848.9%) |
| 2.0x to 2.9x | 704 (13.1%) | 1,424 (12.3%) |
| 3.0x to 3.9x | 630 (11.8%) | 2,558 (22.1%) |
| 4.0x or more | 2,604 (48.6%) | 2,049 (17.7%) |
| Total | 5,358 (100.0%) | 11,570 (100.0%) |
Real Estate Taxes by Mortgage Status in Yuba County
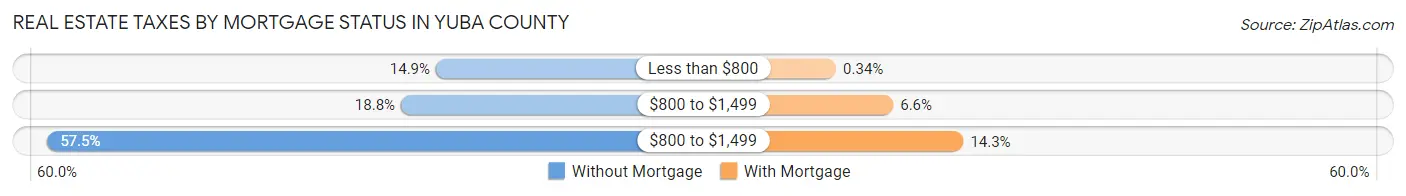
| Property Taxes | Without Mortgage | With Mortgage |
| Less than $800 | 800 (14.9%) | 39 (0.3%) |
| $800 to $1,499 | 1,005 (18.8%) | 764 (6.6%) |
| $800 to $1,499 | 3,082 (57.5%) | 1,653 (14.3%) |
| Total | 5,358 (100.0%) | 11,570 (100.0%) |
Health & Disability in Yuba County
Health Insurance Coverage by Age in Yuba County
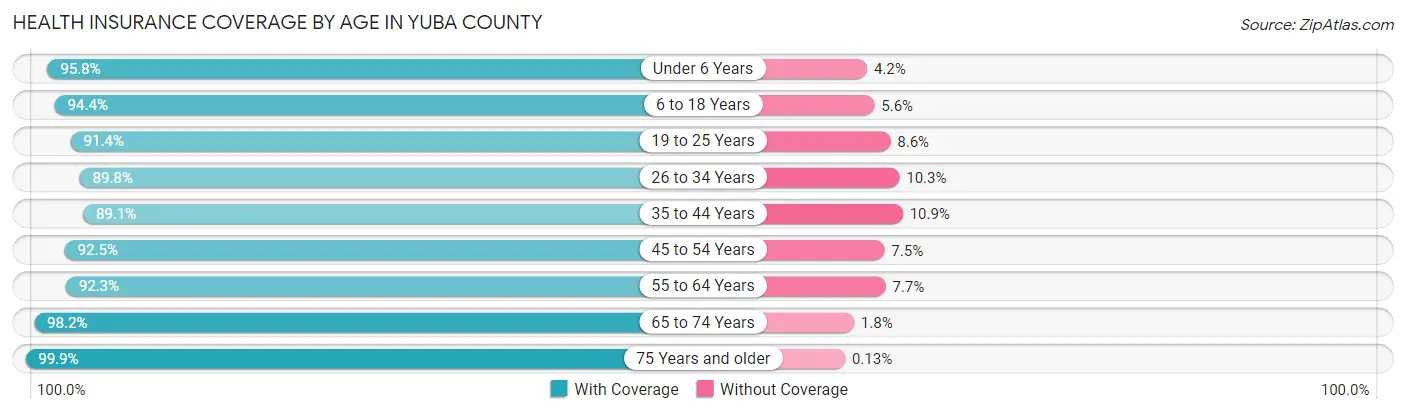
| Age Bracket | With Coverage | Without Coverage |
| Under 6 Years | 7,120 (95.8%) | 315 (4.2%) |
| 6 to 18 Years | 14,944 (94.4%) | 888 (5.6%) |
| 19 to 25 Years | 6,002 (91.4%) | 564 (8.6%) |
| 26 to 34 Years | 9,513 (89.7%) | 1,087 (10.2%) |
| 35 to 44 Years | 9,718 (89.1%) | 1,188 (10.9%) |
| 45 to 54 Years | 7,498 (92.5%) | 606 (7.5%) |
| 55 to 64 Years | 8,312 (92.3%) | 692 (7.7%) |
| 65 to 74 Years | 6,491 (98.2%) | 118 (1.8%) |
| 75 Years and older | 3,851 (99.9%) | 5 (0.1%) |
| Total | 73,449 (93.1%) | 5,463 (6.9%) |
Health Insurance Coverage by Citizenship Status in Yuba County
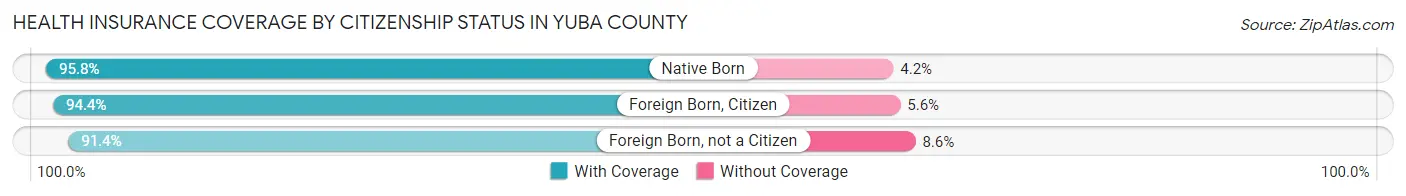
| Citizenship Status | With Coverage | Without Coverage |
| Native Born | 7,120 (95.8%) | 315 (4.2%) |
| Foreign Born, Citizen | 14,944 (94.4%) | 888 (5.6%) |
| Foreign Born, not a Citizen | 6,002 (91.4%) | 564 (8.6%) |
Health Insurance Coverage by Household Income in Yuba County
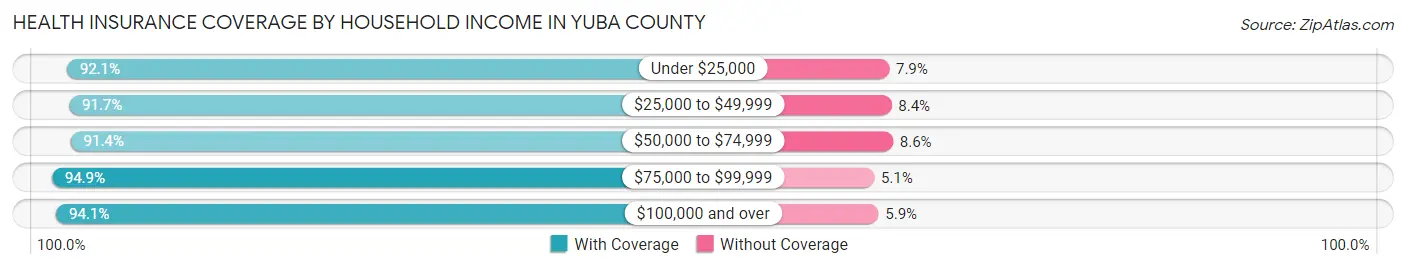
| Household Income | With Coverage | Without Coverage |
| Under $25,000 | 9,128 (92.1%) | 784 (7.9%) |
| $25,000 to $49,999 | 11,466 (91.6%) | 1,044 (8.4%) |
| $50,000 to $74,999 | 13,134 (91.4%) | 1,241 (8.6%) |
| $75,000 to $99,999 | 10,580 (94.9%) | 569 (5.1%) |
| $100,000 and over | 28,744 (94.1%) | 1,806 (5.9%) |
Public vs Private Health Insurance Coverage by Age in Yuba County
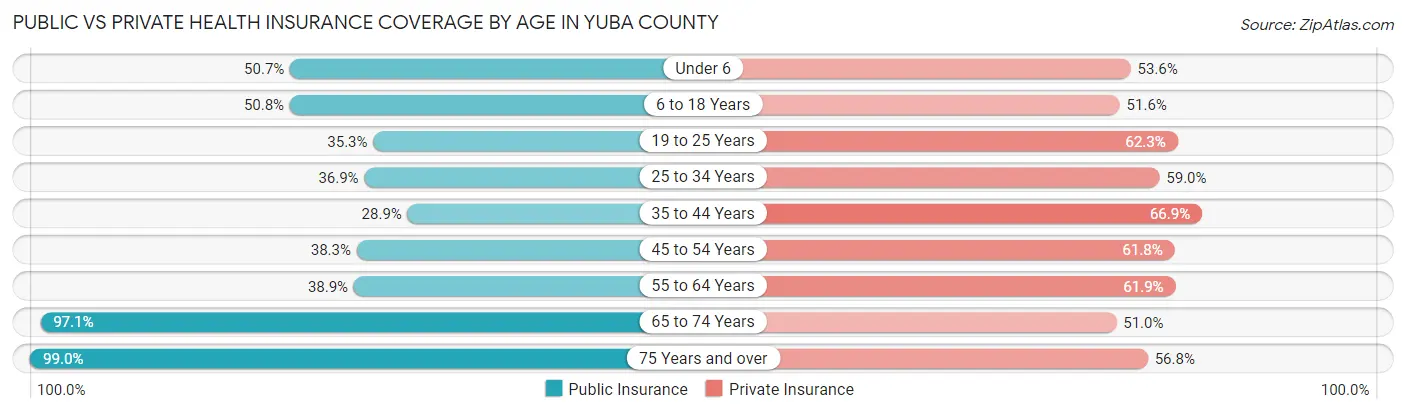
| Age Bracket | Public Insurance | Private Insurance |
| Under 6 | 3,770 (50.7%) | 3,985 (53.6%) |
| 6 to 18 Years | 8,034 (50.7%) | 8,164 (51.6%) |
| 19 to 25 Years | 2,315 (35.3%) | 4,091 (62.3%) |
| 25 to 34 Years | 3,913 (36.9%) | 6,249 (59.0%) |
| 35 to 44 Years | 3,152 (28.9%) | 7,291 (66.8%) |
| 45 to 54 Years | 3,107 (38.3%) | 5,006 (61.8%) |
| 55 to 64 Years | 3,500 (38.9%) | 5,575 (61.9%) |
| 65 to 74 Years | 6,417 (97.1%) | 3,367 (50.9%) |
| 75 Years and over | 3,816 (99.0%) | 2,190 (56.8%) |
| Total | 38,024 (48.2%) | 45,918 (58.2%) |
Disability Status by Sex by Age in Yuba County
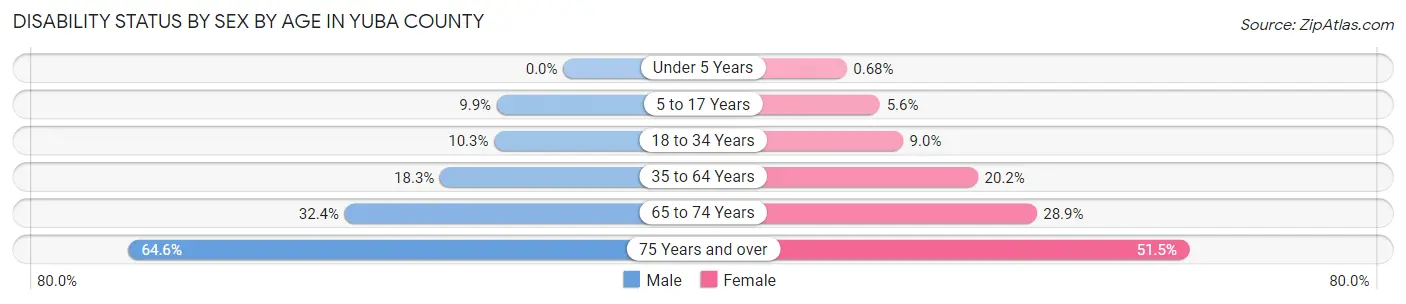
| Age Bracket | Male | Female |
| Under 5 Years | 0 (0.0%) | 20 (0.7%) |
| 5 to 17 Years | 806 (9.9%) | 446 (5.6%) |
| 18 to 34 Years | 921 (10.3%) | 842 (9.0%) |
| 35 to 64 Years | 2,580 (18.3%) | 2,805 (20.2%) |
| 65 to 74 Years | 1,042 (32.4%) | 981 (28.9%) |
| 75 Years and over | 1,131 (64.5%) | 1,084 (51.5%) |
Disability Class by Sex by Age in Yuba County
Disability Class: Hearing Difficulty
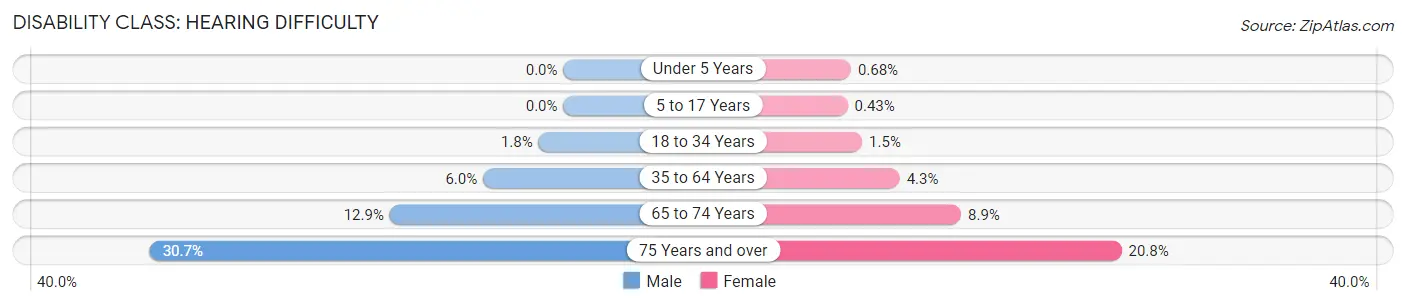
| Age Bracket | Male | Female |
| Under 5 Years | 0 (0.0%) | 20 (0.7%) |
| 5 to 17 Years | 0 (0.0%) | 34 (0.4%) |
| 18 to 34 Years | 165 (1.8%) | 141 (1.5%) |
| 35 to 64 Years | 840 (6.0%) | 598 (4.3%) |
| 65 to 74 Years | 414 (12.9%) | 301 (8.9%) |
| 75 Years and over | 538 (30.7%) | 437 (20.8%) |
Disability Class: Vision Difficulty
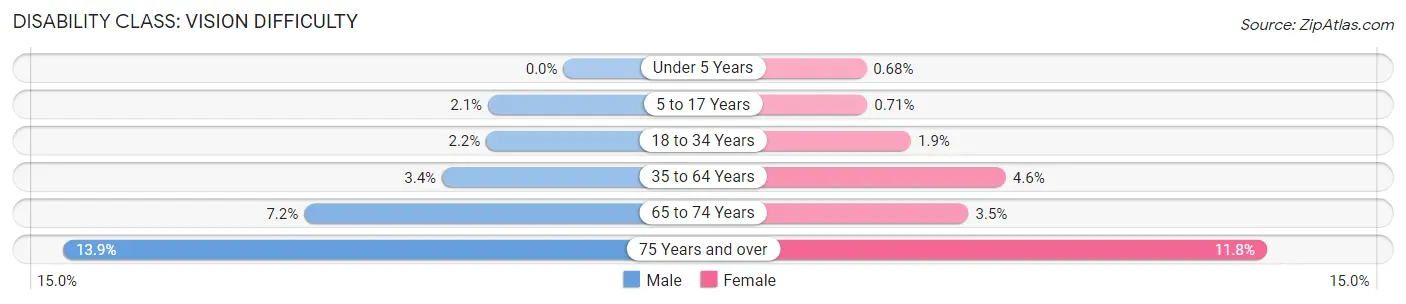
| Age Bracket | Male | Female |
| Under 5 Years | 0 (0.0%) | 20 (0.7%) |
| 5 to 17 Years | 172 (2.1%) | 56 (0.7%) |
| 18 to 34 Years | 193 (2.1%) | 180 (1.9%) |
| 35 to 64 Years | 477 (3.4%) | 635 (4.6%) |
| 65 to 74 Years | 232 (7.2%) | 120 (3.5%) |
| 75 Years and over | 244 (13.9%) | 249 (11.8%) |
Disability Class: Cognitive Difficulty
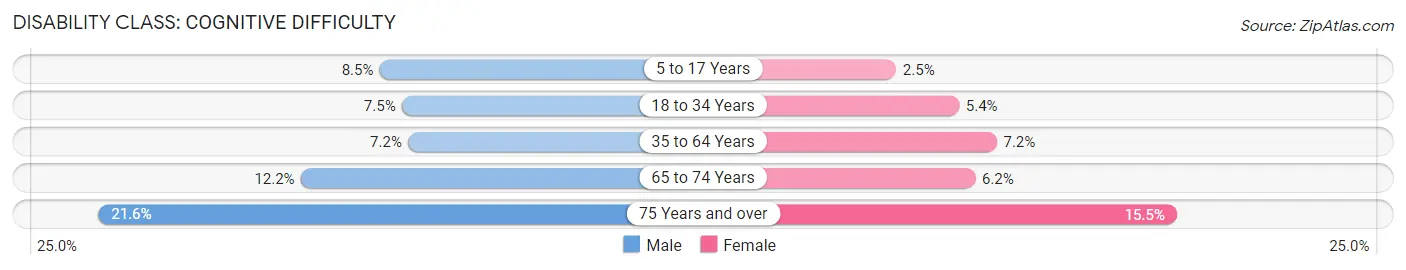
| Age Bracket | Male | Female |
| 5 to 17 Years | 698 (8.5%) | 199 (2.5%) |
| 18 to 34 Years | 674 (7.5%) | 506 (5.4%) |
| 35 to 64 Years | 1,018 (7.2%) | 999 (7.2%) |
| 65 to 74 Years | 392 (12.2%) | 210 (6.2%) |
| 75 Years and over | 378 (21.6%) | 327 (15.5%) |
Disability Class: Ambulatory Difficulty
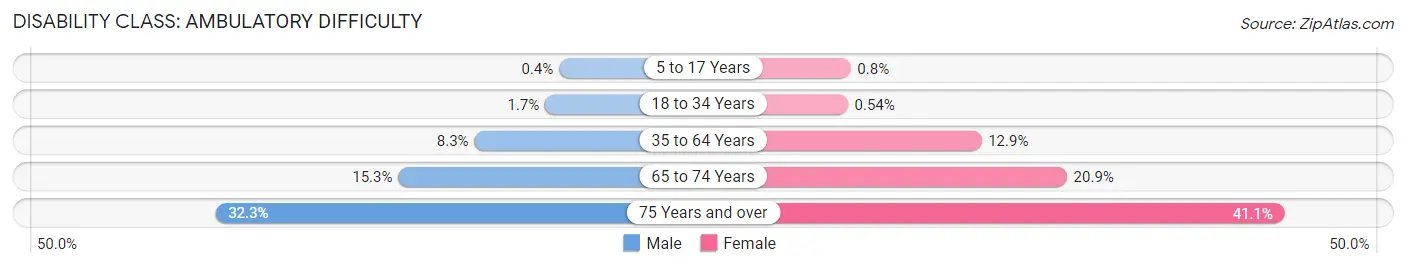
| Age Bracket | Male | Female |
| 5 to 17 Years | 33 (0.4%) | 63 (0.8%) |
| 18 to 34 Years | 153 (1.7%) | 50 (0.5%) |
| 35 to 64 Years | 1,164 (8.3%) | 1,800 (12.9%) |
| 65 to 74 Years | 492 (15.3%) | 709 (20.9%) |
| 75 Years and over | 566 (32.3%) | 865 (41.1%) |
Disability Class: Self-Care Difficulty
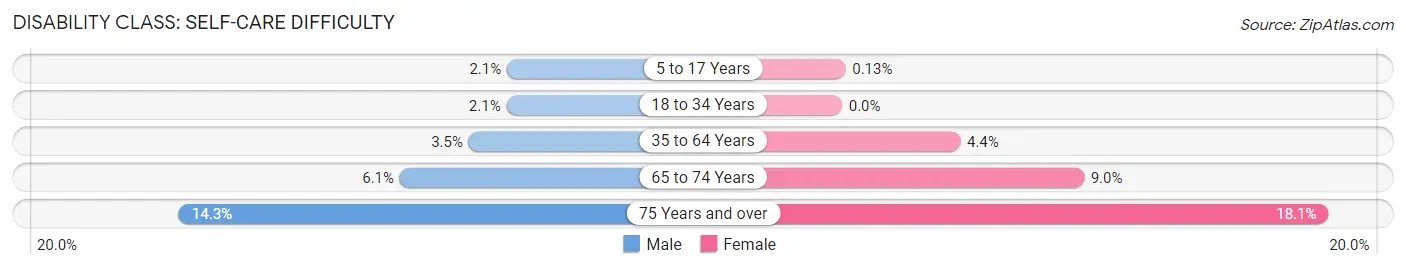
| Age Bracket | Male | Female |
| 5 to 17 Years | 171 (2.1%) | 10 (0.1%) |
| 18 to 34 Years | 189 (2.1%) | 0 (0.0%) |
| 35 to 64 Years | 495 (3.5%) | 611 (4.4%) |
| 65 to 74 Years | 195 (6.1%) | 305 (9.0%) |
| 75 Years and over | 250 (14.3%) | 380 (18.1%) |
Technology Access in Yuba County
Computing Device Access in Yuba County
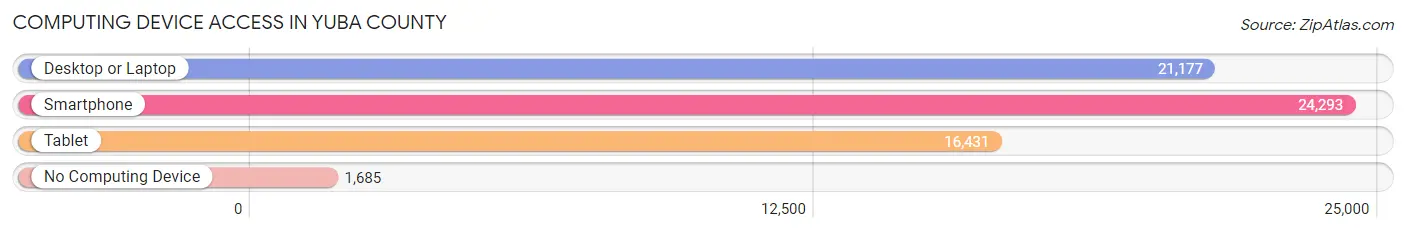
| Device Type | # Households | % Households |
| Desktop or Laptop | 21,177 | 76.8% |
| Smartphone | 24,293 | 88.1% |
| Tablet | 16,431 | 59.6% |
| No Computing Device | 1,685 | 6.1% |
| Total | 27,567 | 100.0% |
Internet Access in Yuba County
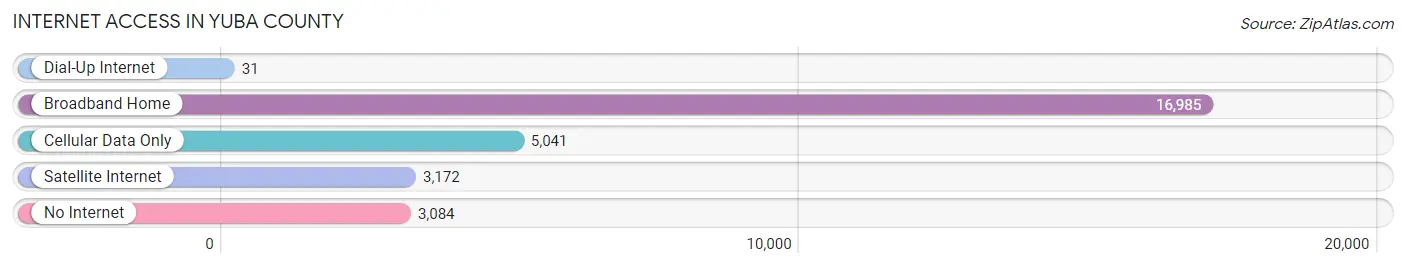
| Internet Type | # Households | % Households |
| Dial-Up Internet | 31 | 0.1% |
| Broadband Home | 16,985 | 61.6% |
| Cellular Data Only | 5,041 | 18.3% |
| Satellite Internet | 3,172 | 11.5% |
| No Internet | 3,084 | 11.2% |
| Total | 27,567 | 100.0% |
Yuba County Summary
Yuba County is located in the Central Valley of California, and is part of the Sacramento-San Joaquin Delta region. It is bordered by Sutter County to the north, Placer County to the east, Nevada County to the south, and Butte County to the west. The county seat is Marysville, and the largest city is Yuba City. The county has a total area of 644 square miles, and a population of 72,155 as of the 2010 census.
History
Yuba County was one of the original counties of California, created in 1850 at the time of statehood. It was named after the Yuba River, which was named for the Native American tribe that lived in the area. The county was originally part of Sutter County, but was split off in 1851.
The county was an important center of gold mining during the California Gold Rush, and many of the towns in the county were founded during this period. Marysville, the county seat, was founded in 1851 and quickly became a major trading center for the region.
Geography
Yuba County is located in the Central Valley of California, and is part of the Sacramento-San Joaquin Delta region. It is bordered by Sutter County to the north, Placer County to the east, Nevada County to the south, and Butte County to the west. The county has a total area of 644 square miles, and is mostly flat, with rolling hills in the northern and eastern parts of the county.
The Feather River is the main waterway in the county, and is used for irrigation and recreation. The Yuba River, Bear River, and American River also flow through the county. The county is home to several reservoirs, including Bullards Bar Reservoir, Englebright Lake, and Collins Lake.
Economy
Yuba County’s economy is largely based on agriculture, with rice, walnuts, and almonds being the main crops. The county is also home to several manufacturing companies, including a Nestle plant in Marysville and a General Mills plant in Wheatland.
The county is also home to several military bases, including Beale Air Force Base and the Yuba County Airport. The county is also home to several casinos, including the Feather Falls Casino and the Yuba County Casino.
Demographics
As of the 2010 census, Yuba County had a population of 72,155. The racial makeup of the county was 68.2% White, 5.3% African American, 1.2% Native American, 4.2% Asian, 0.3% Pacific Islander, 15.2% from other races, and 5.7% from two or more races. Hispanic or Latino of any race were 28.2% of the population.
The median income for a household in the county was $41,837, and the median income for a family was $48,945. The per capita income for the county was $20,845. About 14.2% of families and 17.7% of the population were below the poverty line, including 25.2% of those under age 18 and 8.2% of those age 65 or over.
Common Questions
What is Per Capita Income in Yuba County?
Per Capita income in Yuba County is $30,036.
What is the Median Family Income in Yuba County?
Median Family Income in Yuba County is $76,321.
What is the Median Household income in Yuba County?
Median Household Income in Yuba County is $66,693.
What is Income or Wage Gap in Yuba County?
Income or Wage Gap in Yuba County is 30.9%.
Women in Yuba County earn 69.1 cents for every dollar earned by a man.
What is Family Income Deficit in Yuba County?
Family Income Deficit in Yuba County is $12,002.
Families that are below poverty line in Yuba County earn $12,002 less on average than the poverty threshold level.
What is Inequality or Gini Index in Yuba County?
Inequality or Gini Index in Yuba County is 0.44.
What is the Total Population of Yuba County?
Total Population of Yuba County is 81,705.
What is the Total Male Population of Yuba County?
Total Male Population of Yuba County is 41,643.
What is the Total Female Population of Yuba County?
Total Female Population of Yuba County is 40,062.
What is the Ratio of Males per 100 Females in Yuba County?
There are 103.95 Males per 100 Females in Yuba County.
What is the Ratio of Females per 100 Males in Yuba County?
There are 96.20 Females per 100 Males in Yuba County.
What is the Median Population Age in Yuba County?
Median Population Age in Yuba County is 33.5 Years.
What is the Average Family Size in Yuba County
Average Family Size in Yuba County is 3.4 People.
What is the Average Household Size in Yuba County
Average Household Size in Yuba County is 2.9 People.
How Large is the Labor Force in Yuba County?
There are 36,582 People in the Labor Forcein in Yuba County.
What is the Percentage of People in the Labor Force in Yuba County?
59.3% of People are in the Labor Force in Yuba County.
What is the Unemployment Rate in Yuba County?
Unemployment Rate in Yuba County is 7.4%.