Yolo County, CA Map & Demographics
Yolo County Map
Yolo County Overview
$41,703
PER CAPITA INCOME
$111,069
AVG FAMILY INCOME
$85,097
AVG HOUSEHOLD INCOME
27.8%
WAGE / INCOME GAP [ % ]
72.2¢/ $1
WAGE / INCOME GAP [ $ ]
$11,090
FAMILY INCOME DEFICIT
0.49
INEQUALITY / GINI INDEX
217,141
TOTAL POPULATION
105,912
MALE POPULATION
111,229
FEMALE POPULATION
95.22
MALES / 100 FEMALES
105.02
FEMALES / 100 MALES
32.0
MEDIAN AGE
3.2
AVG FAMILY SIZE
2.7
AVG HOUSEHOLD SIZE
108,830
LABOR FORCE [ PEOPLE ]
61.3%
PERCENT IN LABOR FORCE
5.3%
UNEMPLOYMENT RATE
Income in Yolo County
Income Overview in Yolo County
Per Capita Income in Yolo County is $41,703, while median incomes of families and households are $111,069 and $85,097 respectively.
| Characteristic | Number | Measure |
| Per Capita Income | 217,141 | $41,703 |
| Median Family Income | 47,936 | $111,069 |
| Mean Family Income | 47,936 | $143,692 |
| Median Household Income | 76,107 | $85,097 |
| Mean Household Income | 76,107 | $117,611 |
| Income Deficit | 47,936 | $11,090 |
| Wage / Income Gap (%) | 217,141 | 27.83% |
| Wage / Income Gap ($) | 217,141 | 72.17¢ per $1 |
| Gini / Inequality Index | 217,141 | 0.49 |
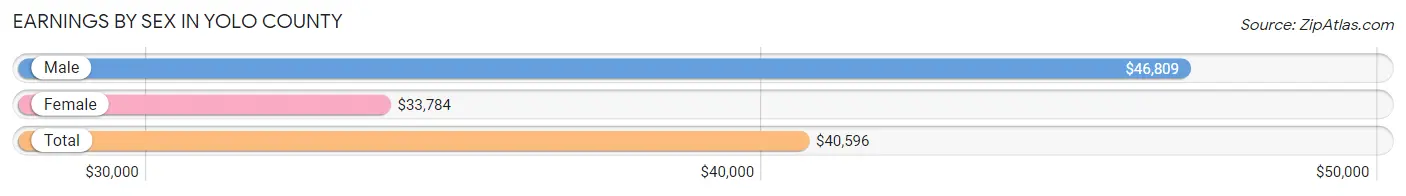
Earnings by Sex in Yolo County
Average Earnings in Yolo County are $40,596, $46,809 for men and $33,784 for women, a difference of 27.8%.
| Sex | Number | Average Earnings |
| Male | 59,138 (51.1%) | $46,809 |
| Female | 56,624 (48.9%) | $33,784 |
| Total | 115,762 (100.0%) | $40,596 |
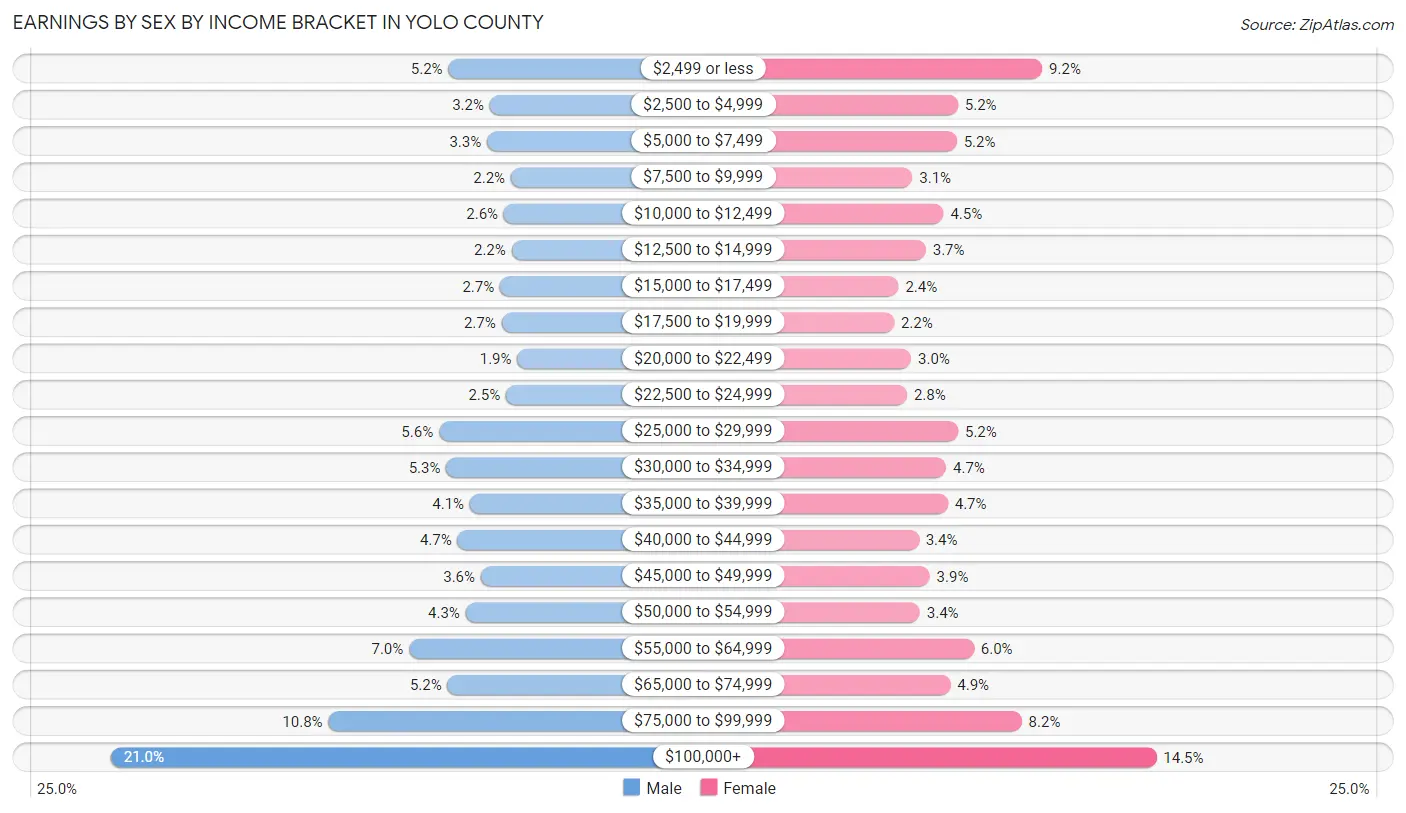
Earnings by Sex by Income Bracket in Yolo County
The most common earnings brackets in Yolo County are $100,000+ for men (12,394 | 21.0%) and $100,000+ for women (8,212 | 14.5%).
| Income | Male | Female |
| $2,499 or less | 3,045 (5.1%) | 5,180 (9.1%) |
| $2,500 to $4,999 | 1,900 (3.2%) | 2,942 (5.2%) |
| $5,000 to $7,499 | 1,976 (3.3%) | 2,915 (5.1%) |
| $7,500 to $9,999 | 1,313 (2.2%) | 1,738 (3.1%) |
| $10,000 to $12,499 | 1,508 (2.5%) | 2,564 (4.5%) |
| $12,500 to $14,999 | 1,293 (2.2%) | 2,093 (3.7%) |
| $15,000 to $17,499 | 1,617 (2.7%) | 1,372 (2.4%) |
| $17,500 to $19,999 | 1,573 (2.7%) | 1,254 (2.2%) |
| $20,000 to $22,499 | 1,134 (1.9%) | 1,705 (3.0%) |
| $22,500 to $24,999 | 1,447 (2.5%) | 1,595 (2.8%) |
| $25,000 to $29,999 | 3,305 (5.6%) | 2,949 (5.2%) |
| $30,000 to $34,999 | 3,105 (5.2%) | 2,632 (4.6%) |
| $35,000 to $39,999 | 2,450 (4.1%) | 2,678 (4.7%) |
| $40,000 to $44,999 | 2,794 (4.7%) | 1,908 (3.4%) |
| $45,000 to $49,999 | 2,146 (3.6%) | 2,199 (3.9%) |
| $50,000 to $54,999 | 2,565 (4.3%) | 1,939 (3.4%) |
| $55,000 to $64,999 | 4,133 (7.0%) | 3,367 (5.9%) |
| $65,000 to $74,999 | 3,068 (5.2%) | 2,744 (4.9%) |
| $75,000 to $99,999 | 6,372 (10.8%) | 4,638 (8.2%) |
| $100,000+ | 12,394 (21.0%) | 8,212 (14.5%) |
| Total | 59,138 (100.0%) | 56,624 (100.0%) |
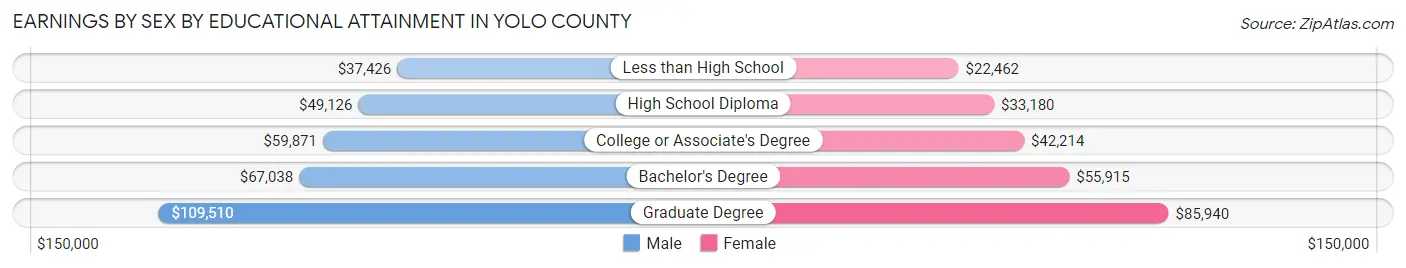
Earnings by Sex by Educational Attainment in Yolo County
Average earnings in Yolo County are $59,273 for men and $49,346 for women, a difference of 16.8%. Men with an educational attainment of graduate degree enjoy the highest average annual earnings of $109,510, while those with less than high school education earn the least with $37,426. Women with an educational attainment of graduate degree earn the most with the average annual earnings of $85,940, while those with less than high school education have the smallest earnings of $22,462.
| Educational Attainment | Male Income | Female Income |
| Less than High School | $37,426 | $22,462 |
| High School Diploma | $49,126 | $33,180 |
| College or Associate's Degree | $59,871 | $42,214 |
| Bachelor's Degree | $67,038 | $55,915 |
| Graduate Degree | $109,510 | $85,940 |
| Total | $59,273 | $49,346 |
Family Income in Yolo County
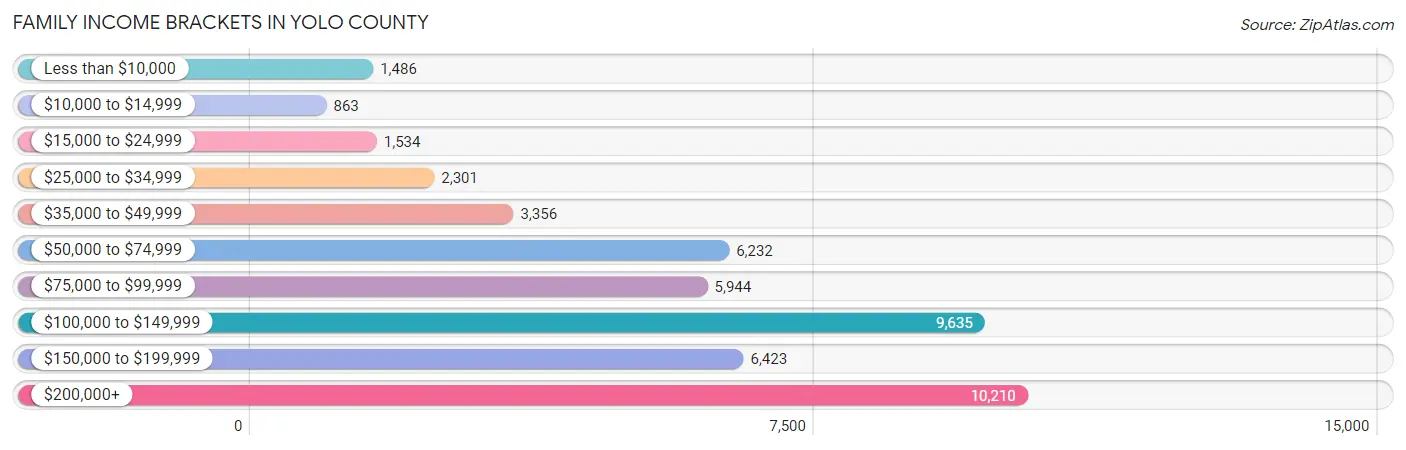
Family Income Brackets in Yolo County
According to the Yolo County family income data, there are 10,210 families falling into the $200,000+ income range, which is the most common income bracket and makes up 21.3% of all families. Conversely, the $10,000 to $14,999 income bracket is the least frequent group with only 863 families (1.8%) belonging to this category.
| Income Bracket | # Families | % Families |
| Less than $10,000 | 1,486 | 3.1% |
| $10,000 to $14,999 | 863 | 1.8% |
| $15,000 to $24,999 | 1,534 | 3.2% |
| $25,000 to $34,999 | 2,301 | 4.8% |
| $35,000 to $49,999 | 3,356 | 7.0% |
| $50,000 to $74,999 | 6,232 | 13.0% |
| $75,000 to $99,999 | 5,944 | 12.4% |
| $100,000 to $149,999 | 9,635 | 20.1% |
| $150,000 to $199,999 | 6,423 | 13.4% |
| $200,000+ | 10,210 | 21.3% |
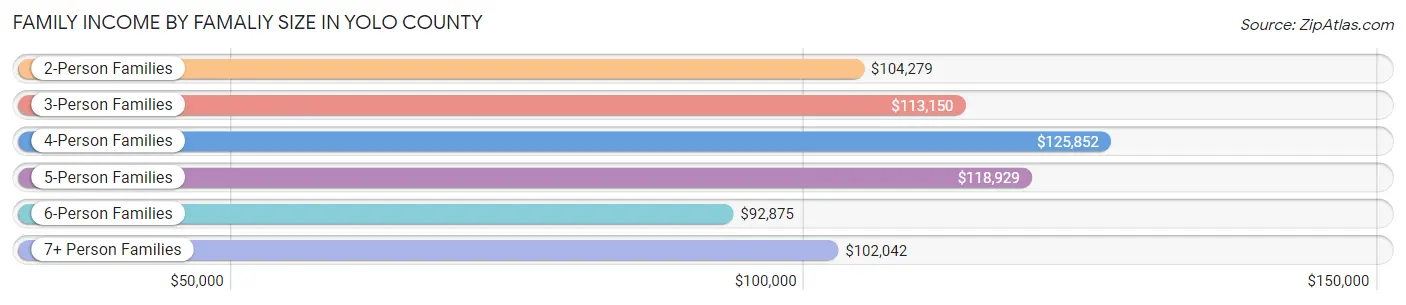
Family Income by Famaliy Size in Yolo County
4-person families (10,208 | 21.3%) account for the highest median family income in Yolo County with $125,852 per family, while 2-person families (19,993 | 41.7%) have the highest median income of $52,140 per family member.
| Income Bracket | # Families | Median Income |
| 2-Person Families | 19,993 (41.7%) | $104,279 |
| 3-Person Families | 11,260 (23.5%) | $113,150 |
| 4-Person Families | 10,208 (21.3%) | $125,852 |
| 5-Person Families | 4,148 (8.6%) | $118,929 |
| 6-Person Families | 1,258 (2.6%) | $92,875 |
| 7+ Person Families | 1,069 (2.2%) | $102,042 |
| Total | 47,936 (100.0%) | $111,069 |
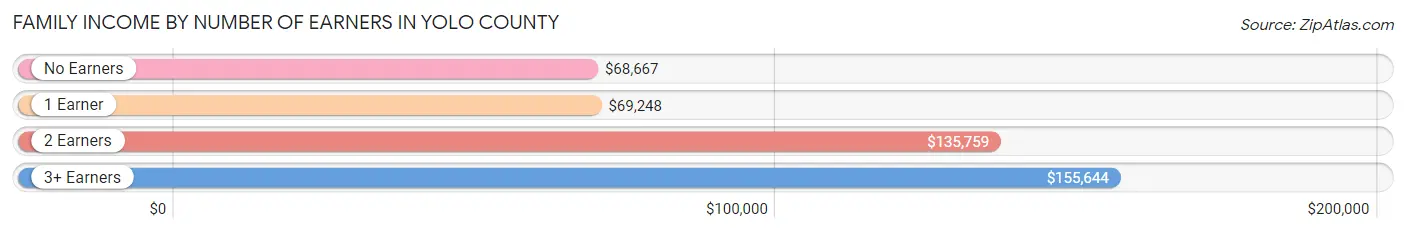
Family Income by Number of Earners in Yolo County
The median family income in Yolo County is $111,069, with families comprising 3+ earners (5,905) having the highest median family income of $155,644, while families with no earners (6,322) have the lowest median family income of $68,667, accounting for 12.3% and 13.2% of families, respectively.
| Number of Earners | # Families | Median Income |
| No Earners | 6,322 (13.2%) | $68,667 |
| 1 Earner | 15,204 (31.7%) | $69,248 |
| 2 Earners | 20,505 (42.8%) | $135,759 |
| 3+ Earners | 5,905 (12.3%) | $155,644 |
| Total | 47,936 (100.0%) | $111,069 |
Household Income in Yolo County
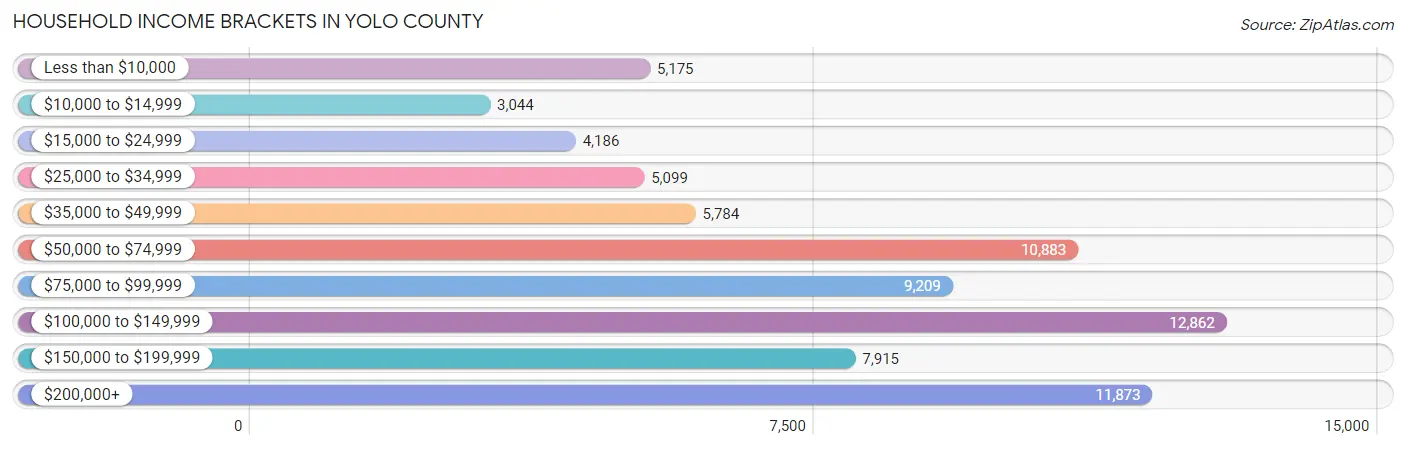
Household Income Brackets in Yolo County
With 12,862 households falling in the category, the $100,000 to $149,999 income range is the most frequent in Yolo County, accounting for 16.9% of all households. In contrast, only 3,044 households (4.0%) fall into the $10,000 to $14,999 income bracket, making it the least populous group.
| Income Bracket | # Households | % Households |
| Less than $10,000 | 5,175 | 6.8% |
| $10,000 to $14,999 | 3,044 | 4.0% |
| $15,000 to $24,999 | 4,186 | 5.5% |
| $25,000 to $34,999 | 5,099 | 6.7% |
| $35,000 to $49,999 | 5,784 | 7.6% |
| $50,000 to $74,999 | 10,883 | 14.3% |
| $75,000 to $99,999 | 9,209 | 12.1% |
| $100,000 to $149,999 | 12,862 | 16.9% |
| $150,000 to $199,999 | 7,915 | 10.4% |
| $200,000+ | 11,873 | 15.6% |
Household Income by Householder Age in Yolo County
The median household income in Yolo County is $85,097, with the highest median household income of $117,990 found in the 45 to 64 years age bracket for the primary householder. A total of 25,118 households (33.0%) fall into this category. Meanwhile, the 15 to 24 years age bracket for the primary householder has the lowest median household income of $29,175, with 9,363 households (12.3%) in this group.
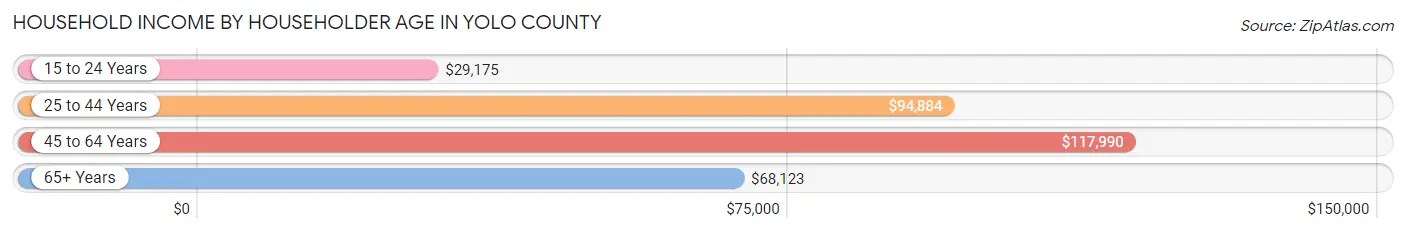
| Income Bracket | # Households | Median Income |
| 15 to 24 Years | 9,363 (12.3%) | $29,175 |
| 25 to 44 Years | 24,740 (32.5%) | $94,884 |
| 45 to 64 Years | 25,118 (33.0%) | $117,990 |
| 65+ Years | 16,886 (22.2%) | $68,123 |
| Total | 76,107 (100.0%) | $85,097 |
Poverty in Yolo County
Income Below Poverty by Sex and Age in Yolo County
With 15.9% poverty level for males and 18.9% for females among the residents of Yolo County, 18 to 24 year old males and 18 to 24 year old females are the most vulnerable to poverty, with 7,143 males (40.3%) and 10,314 females (51.8%) in their respective age groups living below the poverty level.
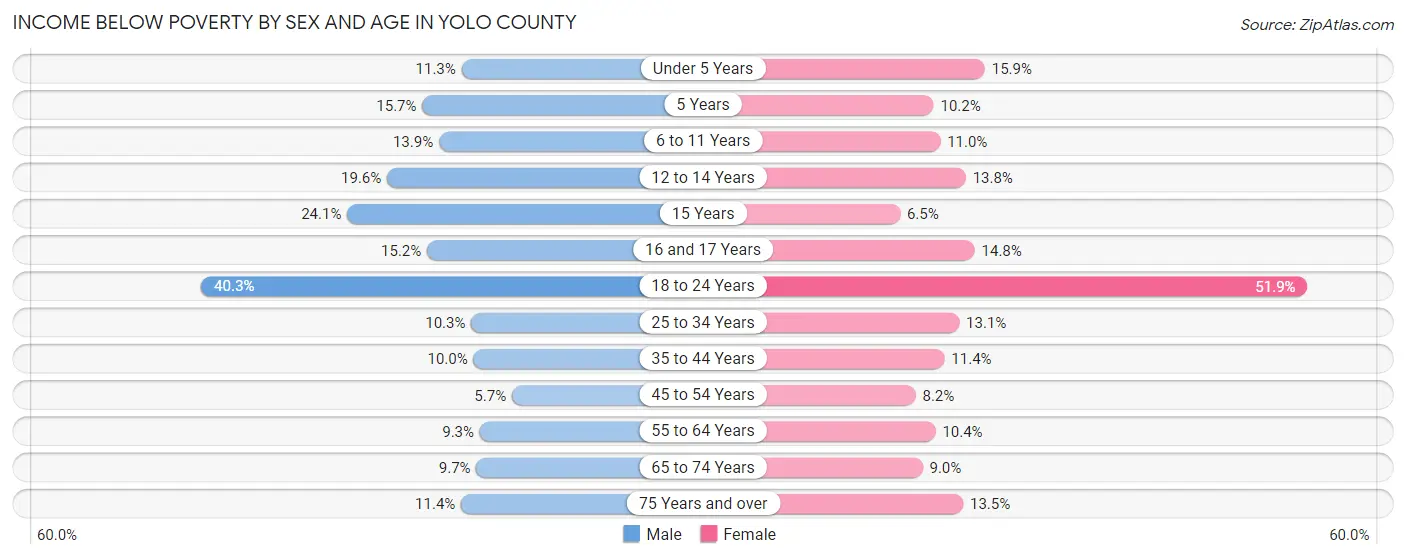
| Age Bracket | Male | Female |
| Under 5 Years | 622 (11.3%) | 857 (15.9%) |
| 5 Years | 175 (15.7%) | 109 (10.2%) |
| 6 to 11 Years | 1,101 (13.9%) | 798 (11.0%) |
| 12 to 14 Years | 723 (19.6%) | 559 (13.8%) |
| 15 Years | 374 (24.1%) | 101 (6.5%) |
| 16 and 17 Years | 378 (15.2%) | 344 (14.8%) |
| 18 to 24 Years | 7,143 (40.3%) | 10,314 (51.8%) |
| 25 to 34 Years | 1,538 (10.2%) | 1,862 (13.1%) |
| 35 to 44 Years | 1,303 (10.0%) | 1,478 (11.4%) |
| 45 to 54 Years | 655 (5.7%) | 953 (8.2%) |
| 55 to 64 Years | 995 (9.3%) | 1,194 (10.4%) |
| 65 to 74 Years | 742 (9.7%) | 804 (9.0%) |
| 75 Years and over | 519 (11.4%) | 880 (13.5%) |
| Total | 16,268 (15.9%) | 20,253 (18.9%) |
Income Above Poverty by Sex and Age in Yolo County
According to the poverty statistics in Yolo County, males aged 45 to 54 years and females aged 15 years are the age groups that are most secure financially, with 94.3% of males and 93.5% of females in these age groups living above the poverty line.
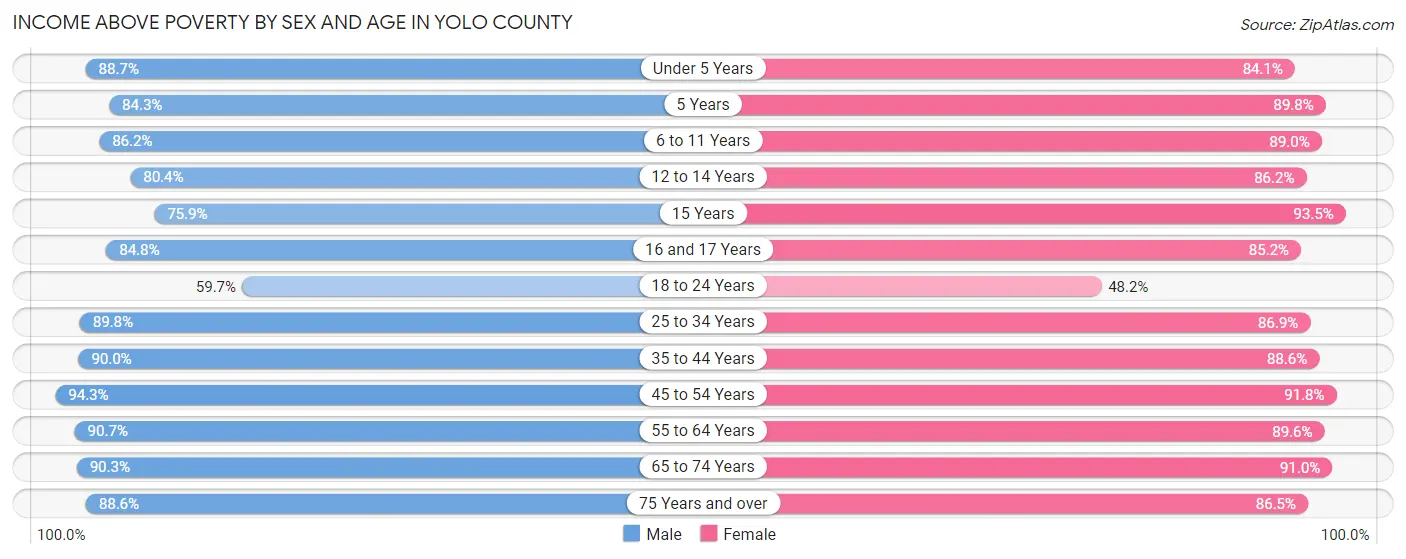
| Age Bracket | Male | Female |
| Under 5 Years | 4,869 (88.7%) | 4,522 (84.1%) |
| 5 Years | 940 (84.3%) | 958 (89.8%) |
| 6 to 11 Years | 6,846 (86.2%) | 6,481 (89.0%) |
| 12 to 14 Years | 2,961 (80.4%) | 3,491 (86.2%) |
| 15 Years | 1,180 (75.9%) | 1,458 (93.5%) |
| 16 and 17 Years | 2,114 (84.8%) | 1,982 (85.2%) |
| 18 to 24 Years | 10,569 (59.7%) | 9,578 (48.1%) |
| 25 to 34 Years | 13,462 (89.7%) | 12,387 (86.9%) |
| 35 to 44 Years | 11,726 (90.0%) | 11,448 (88.6%) |
| 45 to 54 Years | 10,787 (94.3%) | 10,656 (91.8%) |
| 55 to 64 Years | 9,705 (90.7%) | 10,249 (89.6%) |
| 65 to 74 Years | 6,921 (90.3%) | 8,138 (91.0%) |
| 75 Years and over | 4,041 (88.6%) | 5,639 (86.5%) |
| Total | 86,121 (84.1%) | 86,987 (81.1%) |
Income Below Poverty Among Married-Couple Families in Yolo County
The poverty statistics for married-couple families in Yolo County show that 5.1% or 1,851 of the total 35,973 families live below the poverty line. Families with 5 or more children have the highest poverty rate of 51.2%, comprising of 106 families. On the other hand, families with 1 or 2 children have the lowest poverty rate of 3.3%, which includes 438 families.
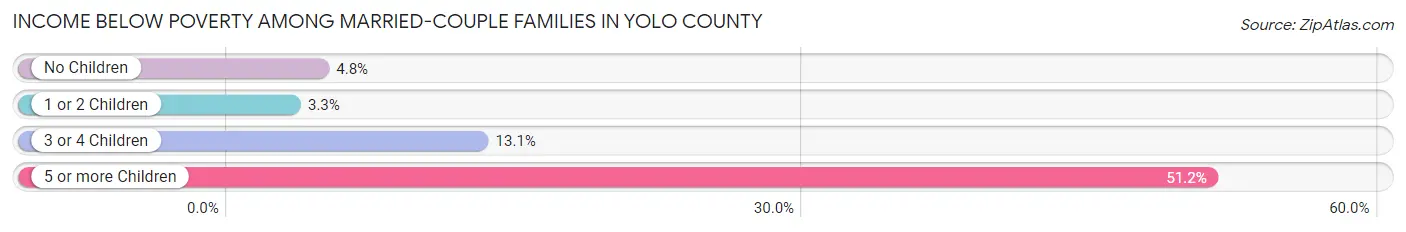
| Children | Above Poverty | Below Poverty |
| No Children | 18,688 (95.2%) | 937 (4.8%) |
| 1 or 2 Children | 12,877 (96.7%) | 438 (3.3%) |
| 3 or 4 Children | 2,456 (86.9%) | 370 (13.1%) |
| 5 or more Children | 101 (48.8%) | 106 (51.2%) |
| Total | 34,122 (94.9%) | 1,851 (5.1%) |
Income Below Poverty Among Single-Parent Households in Yolo County
According to the poverty data in Yolo County, 7.0% or 230 single-father households and 20.0% or 1,732 single-mother households are living below the poverty line. Among single-father households, those with 3 or 4 children have the highest poverty rate, with 23 households (15.4%) experiencing poverty. Likewise, among single-mother households, those with 5 or more children have the highest poverty rate, with 80 households (100.0%) falling below the poverty line.
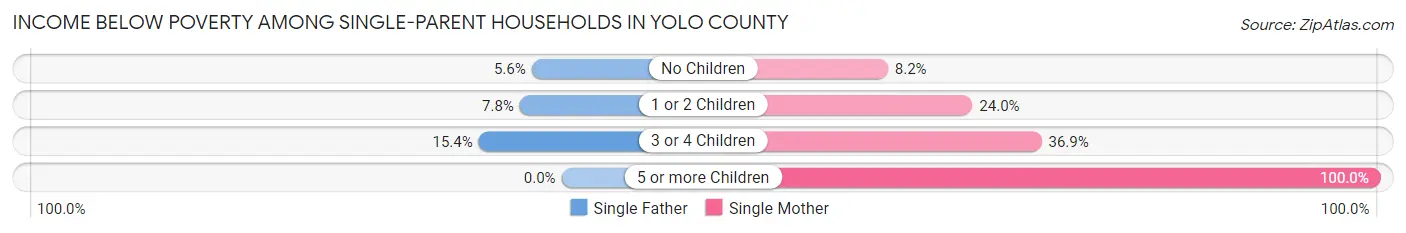
| Children | Single Father | Single Mother |
| No Children | 89 (5.6%) | 270 (8.2%) |
| 1 or 2 Children | 118 (7.8%) | 1,065 (24.0%) |
| 3 or 4 Children | 23 (15.4%) | 317 (36.9%) |
| 5 or more Children | 0 (0.0%) | 80 (100.0%) |
| Total | 230 (7.0%) | 1,732 (20.0%) |
Income Below Poverty Among Married-Couple vs Single-Parent Households in Yolo County
The poverty data for Yolo County shows that 1,851 of the married-couple family households (5.1%) and 1,962 of the single-parent households (16.4%) are living below the poverty level. Within the married-couple family households, those with 5 or more children have the highest poverty rate, with 106 households (51.2%) falling below the poverty line. Among the single-parent households, those with 5 or more children have the highest poverty rate, with 80 household (65.6%) living below poverty.
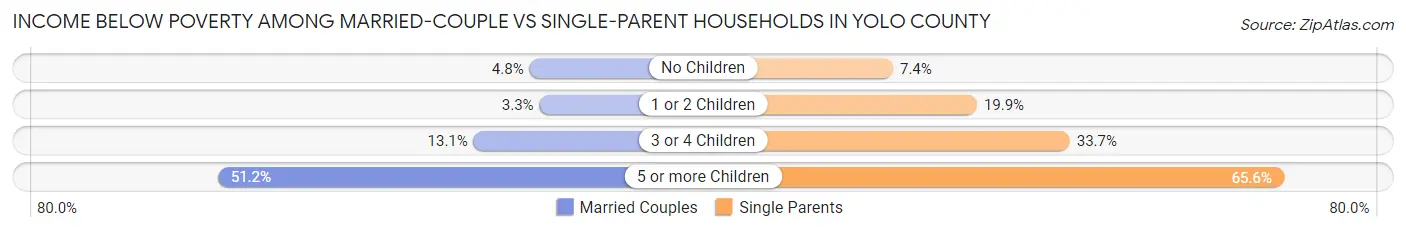
| Children | Married-Couple Families | Single-Parent Households |
| No Children | 937 (4.8%) | 359 (7.4%) |
| 1 or 2 Children | 438 (3.3%) | 1,183 (19.9%) |
| 3 or 4 Children | 370 (13.1%) | 340 (33.7%) |
| 5 or more Children | 106 (51.2%) | 80 (65.6%) |
| Total | 1,851 (5.1%) | 1,962 (16.4%) |
Race in Yolo County
The most populous races in Yolo County are White / Caucasian (127,655 | 58.8%), Hispanic or Latino (69,989 | 32.2%), and Asian (32,018 | 14.7%).
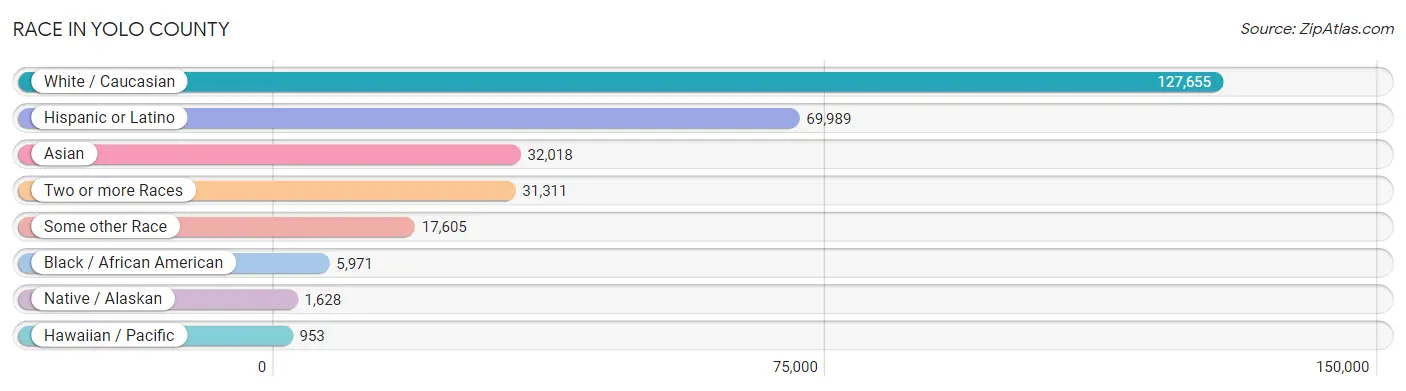
| Race | # Population | % Population |
| Asian | 32,018 | 14.7% |
| Black / African American | 5,971 | 2.8% |
| Hawaiian / Pacific | 953 | 0.4% |
| Hispanic or Latino | 69,989 | 32.2% |
| Native / Alaskan | 1,628 | 0.7% |
| White / Caucasian | 127,655 | 58.8% |
| Two or more Races | 31,311 | 14.4% |
| Some other Race | 17,605 | 8.1% |
| Total | 217,141 | 100.0% |
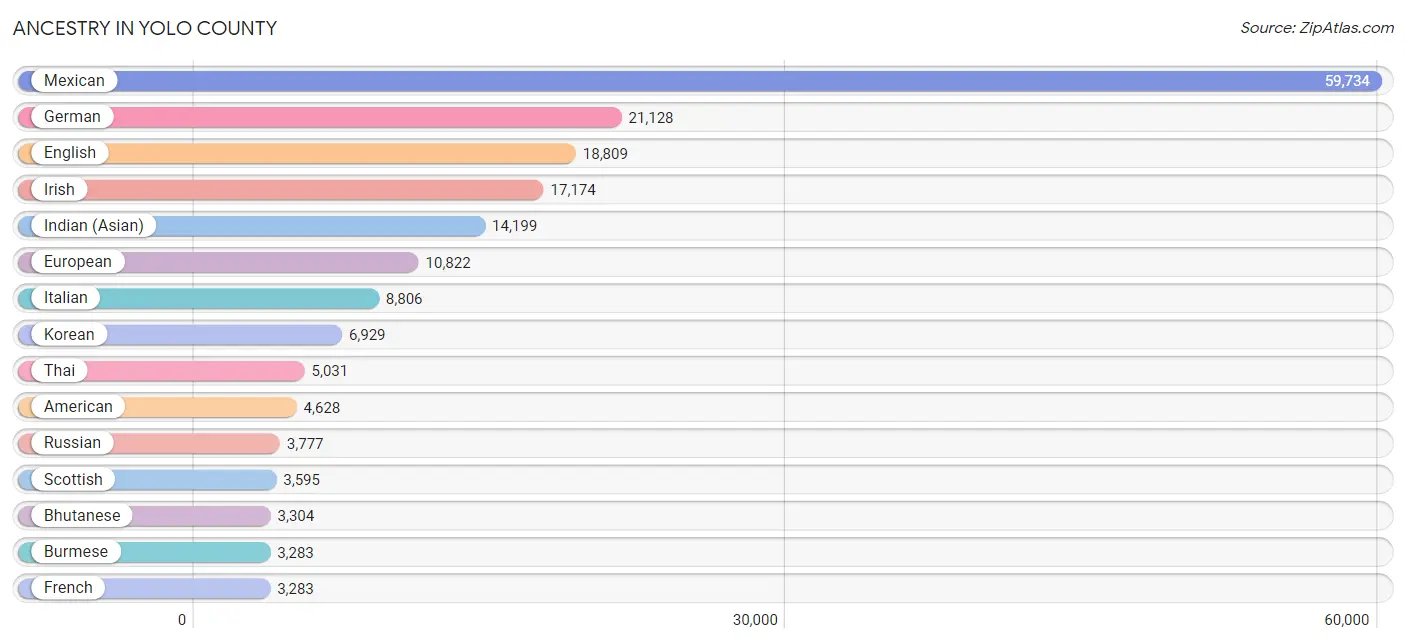
Ancestry in Yolo County
The most populous ancestries reported in Yolo County are Mexican (59,734 | 27.5%), German (21,128 | 9.7%), English (18,809 | 8.7%), Irish (17,174 | 7.9%), and Indian (Asian) (14,199 | 6.5%), together accounting for 60.4% of all Yolo County residents.
| Ancestry | # Population | % Population |
| Afghan | 1,050 | 0.5% |
| African | 1,129 | 0.5% |
| Alaska Native | 30 | 0.0% |
| Albanian | 7 | 0.0% |
| Aleut | 31 | 0.0% |
| Alsatian | 9 | 0.0% |
| American | 4,628 | 2.1% |
| Apache | 295 | 0.1% |
| Arab | 1,264 | 0.6% |
| Argentinean | 379 | 0.2% |
| Armenian | 288 | 0.1% |
| Assyrian / Chaldean / Syriac | 14 | 0.0% |
| Australian | 47 | 0.0% |
| Austrian | 436 | 0.2% |
| Bangladeshi | 379 | 0.2% |
| Basque | 154 | 0.1% |
| Belgian | 159 | 0.1% |
| Belizean | 22 | 0.0% |
| Bhutanese | 3,304 | 1.5% |
| Blackfeet | 146 | 0.1% |
| Bolivian | 4 | 0.0% |
| Brazilian | 398 | 0.2% |
| British | 1,190 | 0.5% |
| Bulgarian | 108 | 0.1% |
| Burmese | 3,283 | 1.5% |
| Cajun | 68 | 0.0% |
| Cambodian | 13 | 0.0% |
| Canadian | 337 | 0.2% |
| Central American | 2,472 | 1.1% |
| Central American Indian | 299 | 0.1% |
| Cherokee | 565 | 0.3% |
| Chickasaw | 31 | 0.0% |
| Chilean | 487 | 0.2% |
| Chinese | 23 | 0.0% |
| Chippewa | 50 | 0.0% |
| Choctaw | 233 | 0.1% |
| Colombian | 534 | 0.3% |
| Colville | 88 | 0.0% |
| Costa Rican | 38 | 0.0% |
| Cree | 74 | 0.0% |
| Creek | 41 | 0.0% |
| Croatian | 252 | 0.1% |
| Crow | 33 | 0.0% |
| Cuban | 392 | 0.2% |
| Czech | 588 | 0.3% |
| Czechoslovakian | 194 | 0.1% |
| Danish | 1,050 | 0.5% |
| Dominican | 9 | 0.0% |
| Dutch | 1,553 | 0.7% |
| Eastern European | 710 | 0.3% |
| Ecuadorian | 17 | 0.0% |
| Egyptian | 60 | 0.0% |
| English | 18,809 | 8.7% |
| Estonian | 56 | 0.0% |
| Ethiopian | 37 | 0.0% |
| European | 10,822 | 5.0% |
| Filipino | 801 | 0.4% |
| Finnish | 386 | 0.2% |
| French | 3,283 | 1.5% |
| French American Indian | 31 | 0.0% |
| French Canadian | 638 | 0.3% |
| German | 21,128 | 9.7% |
| German Russian | 10 | 0.0% |
| Ghanaian | 34 | 0.0% |
| Greek | 408 | 0.2% |
| Guamanian / Chamorro | 307 | 0.1% |
| Guatemalan | 675 | 0.3% |
| Guyanese | 20 | 0.0% |
| Haitian | 19 | 0.0% |
| Honduran | 272 | 0.1% |
| Hopi | 29 | 0.0% |
| Hungarian | 402 | 0.2% |
| Icelander | 58 | 0.0% |
| Indian (Asian) | 14,199 | 6.5% |
| Indonesian | 34 | 0.0% |
| Inupiat | 35 | 0.0% |
| Iranian | 743 | 0.3% |
| Iraqi | 39 | 0.0% |
| Irish | 17,174 | 7.9% |
| Iroquois | 62 | 0.0% |
| Israeli | 87 | 0.0% |
| Italian | 8,806 | 4.1% |
| Jamaican | 126 | 0.1% |
| Japanese | 766 | 0.4% |
| Jordanian | 22 | 0.0% |
| Kenyan | 15 | 0.0% |
| Korean | 6,929 | 3.2% |
| Laotian | 294 | 0.1% |
| Latvian | 56 | 0.0% |
| Lebanese | 432 | 0.2% |
| Lithuanian | 131 | 0.1% |
| Luxembourger | 7 | 0.0% |
| Macedonian | 31 | 0.0% |
| Malaysian | 411 | 0.2% |
| Maltese | 119 | 0.1% |
| Mexican | 59,734 | 27.5% |
| Mexican American Indian | 896 | 0.4% |
| Mongolian | 49 | 0.0% |
| Native Hawaiian | 497 | 0.2% |
| Navajo | 169 | 0.1% |
| Nepalese | 110 | 0.1% |
| New Zealander | 28 | 0.0% |
| Nicaraguan | 191 | 0.1% |
| Nigerian | 234 | 0.1% |
| Northern European | 497 | 0.2% |
| Norwegian | 3,015 | 1.4% |
| Okinawan | 28 | 0.0% |
| Pakistani | 265 | 0.1% |
| Palestinian | 54 | 0.0% |
| Panamanian | 128 | 0.1% |
| Paraguayan | 33 | 0.0% |
| Pennsylvania German | 29 | 0.0% |
| Peruvian | 462 | 0.2% |
| Polish | 2,406 | 1.1% |
| Portuguese | 2,644 | 1.2% |
| Pueblo | 55 | 0.0% |
| Puerto Rican | 814 | 0.4% |
| Romanian | 337 | 0.2% |
| Russian | 3,777 | 1.7% |
| Salvadoran | 1,168 | 0.5% |
| Samoan | 291 | 0.1% |
| Scandinavian | 545 | 0.3% |
| Scotch-Irish | 2,146 | 1.0% |
| Scottish | 3,595 | 1.7% |
| Seminole | 7 | 0.0% |
| Senegalese | 21 | 0.0% |
| Serbian | 44 | 0.0% |
| Sioux | 67 | 0.0% |
| Slavic | 48 | 0.0% |
| Slovak | 136 | 0.1% |
| Slovene | 122 | 0.1% |
| Somali | 15 | 0.0% |
| South African | 45 | 0.0% |
| South American | 2,310 | 1.1% |
| South American Indian | 161 | 0.1% |
| Spaniard | 2,176 | 1.0% |
| Spanish | 1,149 | 0.5% |
| Spanish American | 8 | 0.0% |
| Sri Lankan | 2,328 | 1.1% |
| Subsaharan African | 1,770 | 0.8% |
| Sudanese | 105 | 0.1% |
| Swedish | 2,427 | 1.1% |
| Swiss | 887 | 0.4% |
| Syrian | 145 | 0.1% |
| Thai | 5,031 | 2.3% |
| Tlingit-Haida | 31 | 0.0% |
| Tongan | 150 | 0.1% |
| Turkish | 320 | 0.2% |
| Ukrainian | 981 | 0.4% |
| Venezuelan | 367 | 0.2% |
| Vietnamese | 71 | 0.0% |
| Welsh | 762 | 0.4% |
| West Indian | 17 | 0.0% |
| Yakama | 17 | 0.0% |
| Yaqui | 91 | 0.0% |
| Yugoslavian | 156 | 0.1% | View All 156 Rows |
Immigrants in Yolo County
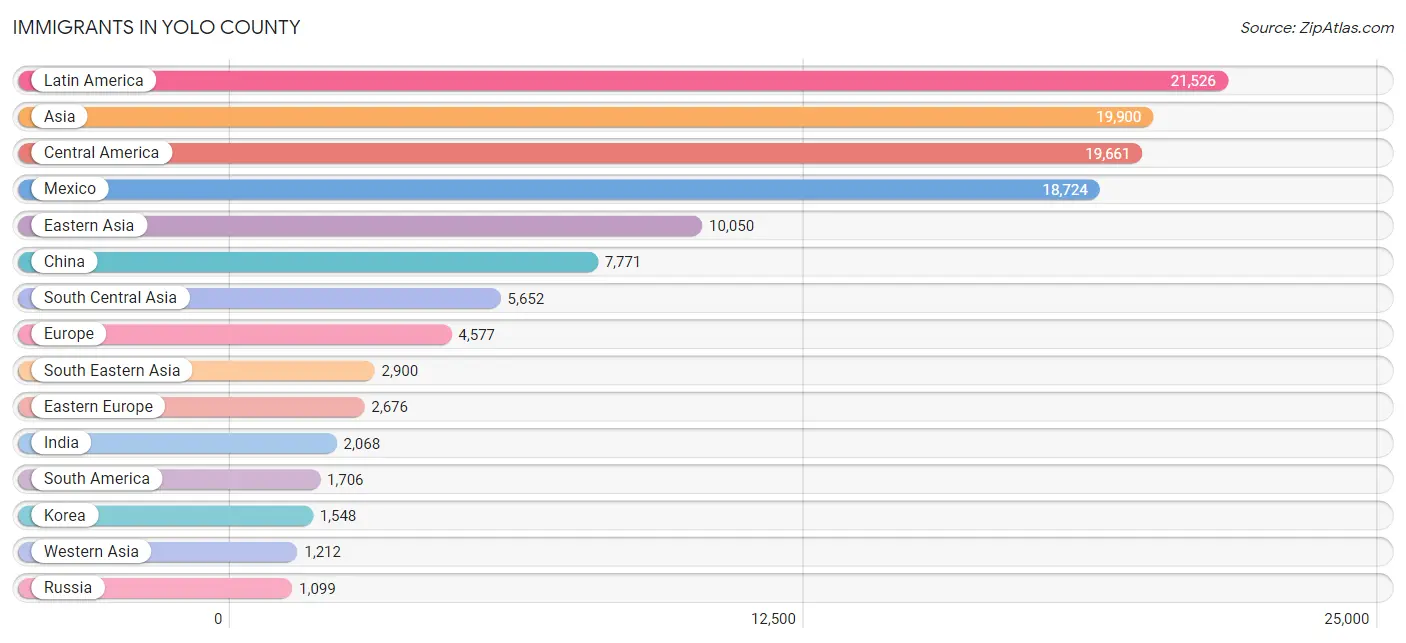
The most numerous immigrant groups reported in Yolo County came from Latin America (21,526 | 9.9%), Asia (19,900 | 9.2%), Central America (19,661 | 9.0%), Mexico (18,724 | 8.6%), and Eastern Asia (10,050 | 4.6%), together accounting for 41.4% of all Yolo County residents.
| Immigration Origin | # Population | % Population |
| Afghanistan | 747 | 0.3% |
| Africa | 721 | 0.3% |
| Albania | 37 | 0.0% |
| Argentina | 264 | 0.1% |
| Armenia | 4 | 0.0% |
| Asia | 19,900 | 9.2% |
| Australia | 121 | 0.1% |
| Austria | 24 | 0.0% |
| Azores | 20 | 0.0% |
| Bangladesh | 221 | 0.1% |
| Belarus | 47 | 0.0% |
| Belgium | 5 | 0.0% |
| Belize | 2 | 0.0% |
| Bolivia | 15 | 0.0% |
| Bosnia and Herzegovina | 8 | 0.0% |
| Brazil | 410 | 0.2% |
| Bulgaria | 60 | 0.0% |
| Cambodia | 328 | 0.2% |
| Canada | 510 | 0.2% |
| Caribbean | 159 | 0.1% |
| Central America | 19,661 | 9.0% |
| Chile | 254 | 0.1% |
| China | 7,771 | 3.6% |
| Colombia | 296 | 0.1% |
| Croatia | 10 | 0.0% |
| Cuba | 51 | 0.0% |
| Czechoslovakia | 24 | 0.0% |
| Denmark | 26 | 0.0% |
| Eastern Africa | 196 | 0.1% |
| Eastern Asia | 10,050 | 4.6% |
| Eastern Europe | 2,676 | 1.2% |
| Ecuador | 17 | 0.0% |
| El Salvador | 531 | 0.2% |
| England | 177 | 0.1% |
| Ethiopia | 34 | 0.0% |
| Europe | 4,577 | 2.1% |
| Fiji | 304 | 0.1% |
| France | 197 | 0.1% |
| Germany | 356 | 0.2% |
| Ghana | 19 | 0.0% |
| Greece | 36 | 0.0% |
| Guatemala | 310 | 0.1% |
| Guyana | 9 | 0.0% |
| Honduras | 67 | 0.0% |
| Hong Kong | 276 | 0.1% |
| Hungary | 34 | 0.0% |
| India | 2,068 | 0.9% |
| Indonesia | 54 | 0.0% |
| Iran | 619 | 0.3% |
| Iraq | 30 | 0.0% |
| Ireland | 70 | 0.0% |
| Israel | 90 | 0.0% |
| Italy | 159 | 0.1% |
| Jamaica | 45 | 0.0% |
| Japan | 727 | 0.3% |
| Jordan | 77 | 0.0% |
| Kazakhstan | 223 | 0.1% |
| Kenya | 47 | 0.0% |
| Korea | 1,548 | 0.7% |
| Laos | 186 | 0.1% |
| Latin America | 21,526 | 9.9% |
| Latvia | 84 | 0.0% |
| Lebanon | 177 | 0.1% |
| Liberia | 28 | 0.0% |
| Malaysia | 84 | 0.0% |
| Mexico | 18,724 | 8.6% |
| Middle Africa | 31 | 0.0% |
| Moldova | 30 | 0.0% |
| Nepal | 483 | 0.2% |
| Netherlands | 113 | 0.1% |
| Nicaragua | 27 | 0.0% |
| Nigeria | 189 | 0.1% |
| Northern Africa | 54 | 0.0% |
| Northern Europe | 593 | 0.3% |
| Norway | 46 | 0.0% |
| Oceania | 535 | 0.3% |
| Pakistan | 760 | 0.4% |
| Peru | 376 | 0.2% |
| Philippines | 1,090 | 0.5% |
| Poland | 140 | 0.1% |
| Portugal | 98 | 0.1% |
| Romania | 146 | 0.1% |
| Russia | 1,099 | 0.5% |
| Saudi Arabia | 130 | 0.1% |
| Scotland | 6 | 0.0% |
| Singapore | 20 | 0.0% |
| South Africa | 142 | 0.1% |
| South America | 1,706 | 0.8% |
| South Central Asia | 5,652 | 2.6% |
| South Eastern Asia | 2,900 | 1.3% |
| Southern Europe | 445 | 0.2% |
| Spain | 152 | 0.1% |
| Sri Lanka | 30 | 0.0% |
| Sudan | 34 | 0.0% |
| Sweden | 46 | 0.0% |
| Switzerland | 133 | 0.1% |
| Syria | 108 | 0.1% |
| Taiwan | 851 | 0.4% |
| Thailand | 421 | 0.2% |
| Trinidad and Tobago | 13 | 0.0% |
| Turkey | 389 | 0.2% |
| Ukraine | 823 | 0.4% |
| Uzbekistan | 419 | 0.2% |
| Venezuela | 58 | 0.0% |
| Vietnam | 677 | 0.3% |
| Western Africa | 285 | 0.1% |
| Western Asia | 1,212 | 0.6% |
| Western Europe | 828 | 0.4% |
| Yemen | 12 | 0.0% |
| Zaire | 31 | 0.0% |
| Zimbabwe | 15 | 0.0% | View All 111 Rows |
Sex and Age in Yolo County
Sex and Age in Yolo County
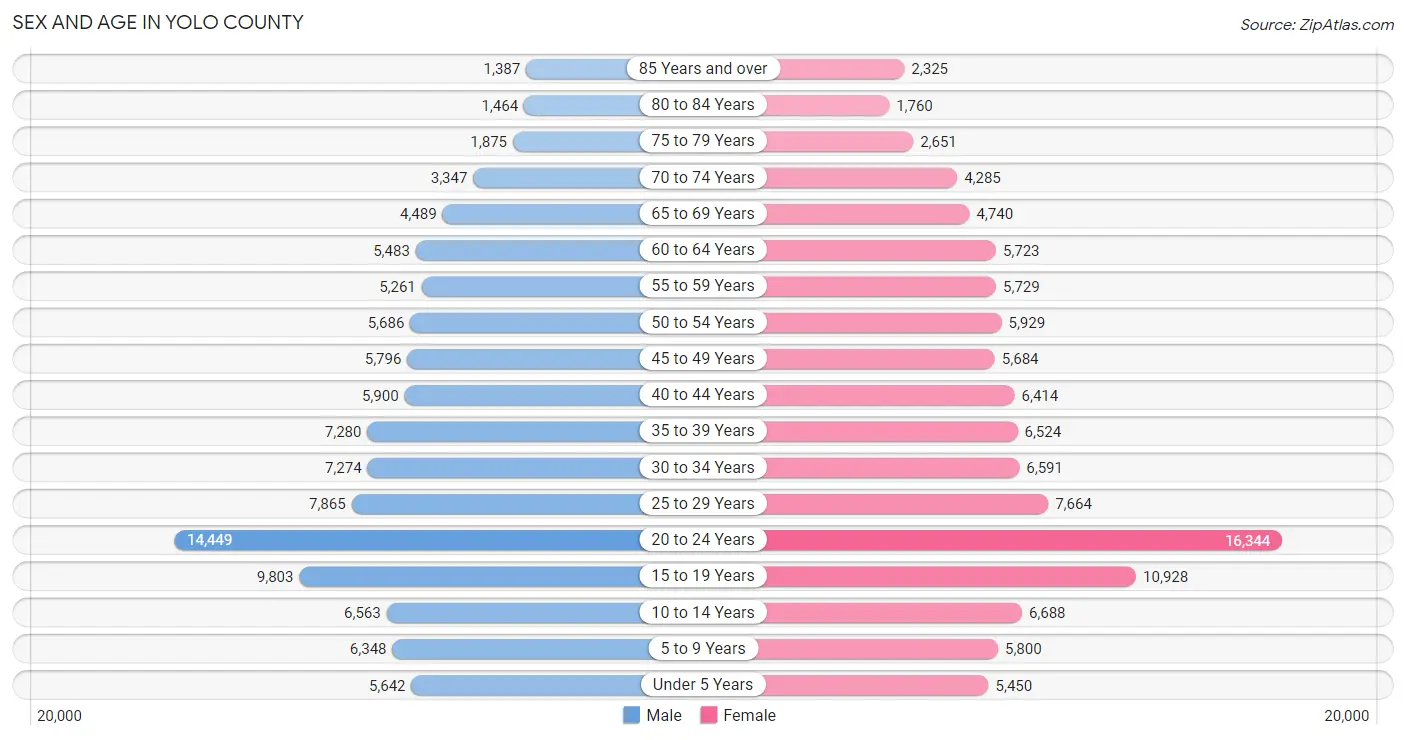
The most populous age groups in Yolo County are 20 to 24 Years (14,449 | 13.6%) for men and 20 to 24 Years (16,344 | 14.7%) for women.
| Age Bracket | Male | Female |
| Under 5 Years | 5,642 (5.3%) | 5,450 (4.9%) |
| 5 to 9 Years | 6,348 (6.0%) | 5,800 (5.2%) |
| 10 to 14 Years | 6,563 (6.2%) | 6,688 (6.0%) |
| 15 to 19 Years | 9,803 (9.3%) | 10,928 (9.8%) |
| 20 to 24 Years | 14,449 (13.6%) | 16,344 (14.7%) |
| 25 to 29 Years | 7,865 (7.4%) | 7,664 (6.9%) |
| 30 to 34 Years | 7,274 (6.9%) | 6,591 (5.9%) |
| 35 to 39 Years | 7,280 (6.9%) | 6,524 (5.9%) |
| 40 to 44 Years | 5,900 (5.6%) | 6,414 (5.8%) |
| 45 to 49 Years | 5,796 (5.5%) | 5,684 (5.1%) |
| 50 to 54 Years | 5,686 (5.4%) | 5,929 (5.3%) |
| 55 to 59 Years | 5,261 (5.0%) | 5,729 (5.1%) |
| 60 to 64 Years | 5,483 (5.2%) | 5,723 (5.1%) |
| 65 to 69 Years | 4,489 (4.2%) | 4,740 (4.3%) |
| 70 to 74 Years | 3,347 (3.2%) | 4,285 (3.8%) |
| 75 to 79 Years | 1,875 (1.8%) | 2,651 (2.4%) |
| 80 to 84 Years | 1,464 (1.4%) | 1,760 (1.6%) |
| 85 Years and over | 1,387 (1.3%) | 2,325 (2.1%) |
| Total | 105,912 (100.0%) | 111,229 (100.0%) |
Families and Households in Yolo County
Median Family Size in Yolo County
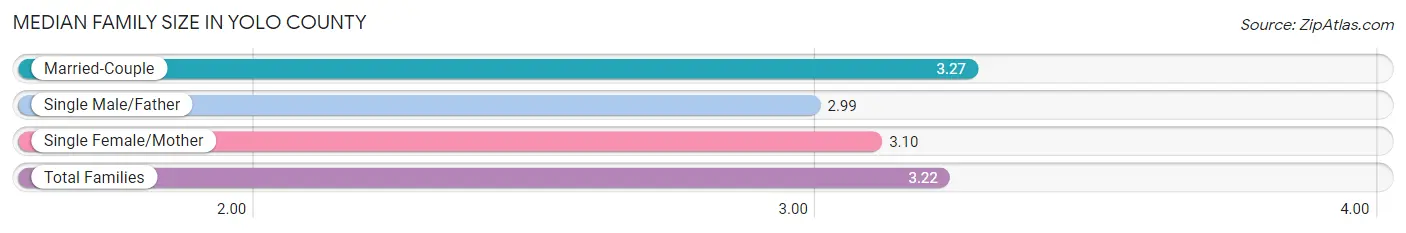
The median family size in Yolo County is 3.22 persons per family, with married-couple families (35,973 | 75.0%) accounting for the largest median family size of 3.27 persons per family. On the other hand, single male/father families (3,301 | 6.9%) represent the smallest median family size with 2.99 persons per family.
| Family Type | # Families | Family Size |
| Married-Couple | 35,973 (75.0%) | 3.27 |
| Single Male/Father | 3,301 (6.9%) | 2.99 |
| Single Female/Mother | 8,662 (18.1%) | 3.10 |
| Total Families | 47,936 (100.0%) | 3.22 |
Median Household Size in Yolo County
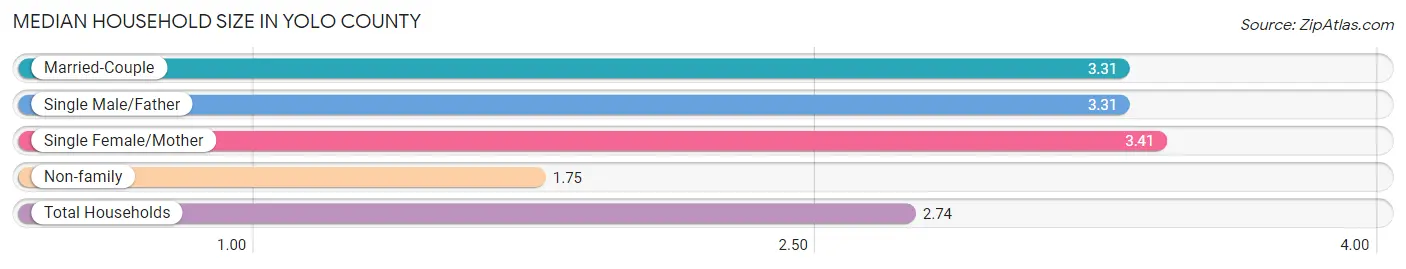
The median household size in Yolo County is 2.74 persons per household, with single female/mother households (8,662 | 11.4%) accounting for the largest median household size of 3.41 persons per household. non-family households (28,171 | 37.0%) represent the smallest median household size with 1.75 persons per household.
| Household Type | # Households | Household Size |
| Married-Couple | 35,973 (47.3%) | 3.31 |
| Single Male/Father | 3,301 (4.3%) | 3.31 |
| Single Female/Mother | 8,662 (11.4%) | 3.41 |
| Non-family | 28,171 (37.0%) | 1.75 |
| Total Households | 76,107 (100.0%) | 2.74 |
Household Size by Marriage Status in Yolo County
Out of a total of 76,107 households in Yolo County, 47,936 (63.0%) are family households, while 28,171 (37.0%) are nonfamily households. The most numerous type of family households are 2-person households, comprising 18,470, and the most common type of nonfamily households are 1-person households, comprising 16,687.
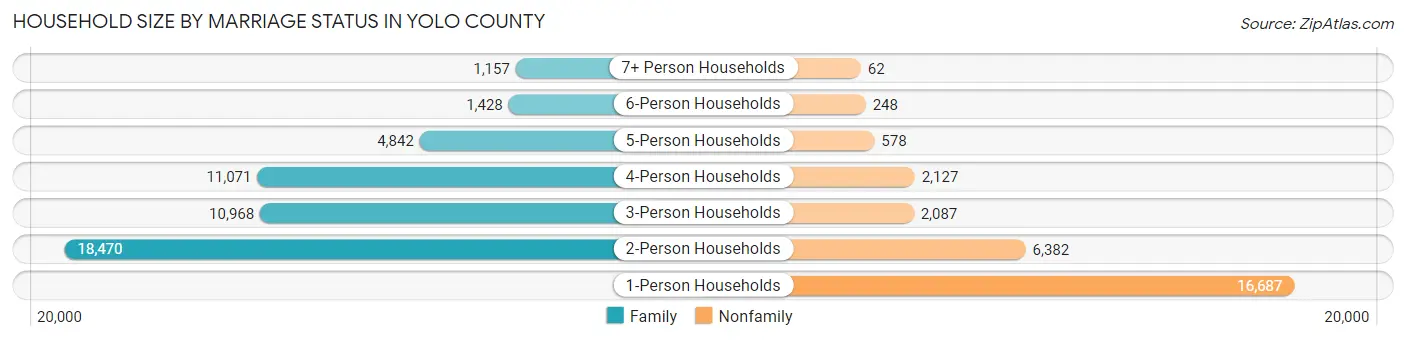
| Household Size | Family Households | Nonfamily Households |
| 1-Person Households | - | 16,687 (21.9%) |
| 2-Person Households | 18,470 (24.3%) | 6,382 (8.4%) |
| 3-Person Households | 10,968 (14.4%) | 2,087 (2.7%) |
| 4-Person Households | 11,071 (14.5%) | 2,127 (2.8%) |
| 5-Person Households | 4,842 (6.4%) | 578 (0.8%) |
| 6-Person Households | 1,428 (1.9%) | 248 (0.3%) |
| 7+ Person Households | 1,157 (1.5%) | 62 (0.1%) |
| Total | 47,936 (63.0%) | 28,171 (37.0%) |
Female Fertility in Yolo County
Fertility by Age in Yolo County
Average fertility rate in Yolo County is 39.0 births per 1,000 women. Women in the age bracket of 20 to 34 years have the highest fertility rate with 48.0 births per 1,000 women. Women in the age bracket of 20 to 34 years acount for 62.1% of all women with births.
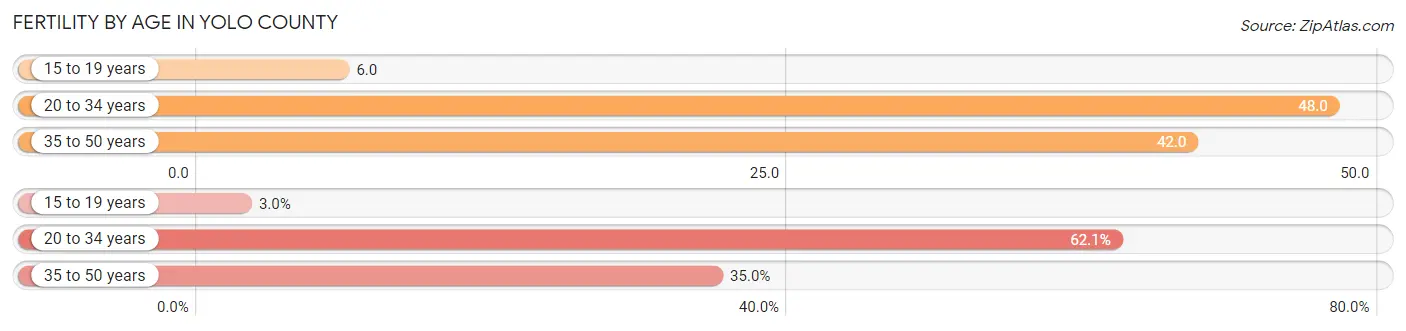
| Age Bracket | Women with Births | Births / 1,000 Women |
| 15 to 19 years | 71 (3.0%) | 6.0 |
| 20 to 34 years | 1,479 (62.1%) | 48.0 |
| 35 to 50 years | 833 (35.0%) | 42.0 |
| Total | 2,383 (100.0%) | 39.0 |
Fertility by Age by Marriage Status in Yolo County
68.0% of women with births (2,383) in Yolo County are married. The highest percentage of unmarried women with births falls into 15 to 19 years age bracket with 100.0% of them unmarried at the time of birth, while the lowest percentage of unmarried women with births belong to 20 to 34 years age bracket with 29.9% of them unmarried.
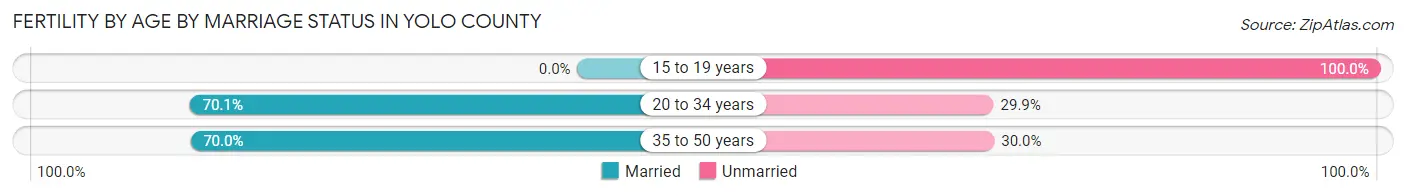
| Age Bracket | Married | Unmarried |
| 15 to 19 years | 0 (0.0%) | 71 (100.0%) |
| 20 to 34 years | 1,037 (70.1%) | 442 (29.9%) |
| 35 to 50 years | 583 (70.0%) | 250 (30.0%) |
| Total | 1,620 (68.0%) | 763 (32.0%) |
Fertility by Education in Yolo County
Average fertility rate in Yolo County is 39.0 births per 1,000 women. Women with the education attainment of bachelor's degree have the highest fertility rate of 50.0 births per 1,000 women, while women with the education attainment of less than high school have the lowest fertility at 28.0 births per 1,000 women. Women with the education attainment of college or associate's degree represent 31.1% of all women with births.
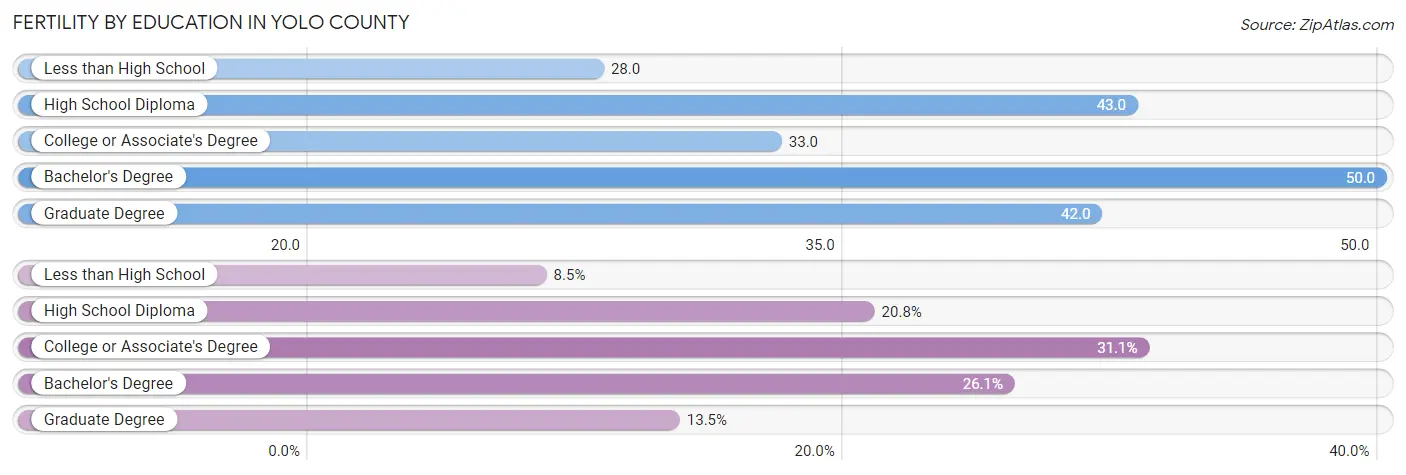
| Educational Attainment | Women with Births | Births / 1,000 Women |
| Less than High School | 203 (8.5%) | 28.0 |
| High School Diploma | 496 (20.8%) | 43.0 |
| College or Associate's Degree | 741 (31.1%) | 33.0 |
| Bachelor's Degree | 621 (26.1%) | 50.0 |
| Graduate Degree | 322 (13.5%) | 42.0 |
| Total | 2,383 (100.0%) | 39.0 |
Fertility by Education by Marriage Status in Yolo County
32.0% of women with births in Yolo County are unmarried. Women with the educational attainment of graduate degree are most likely to be married with 100.0% of them married at childbirth, while women with the educational attainment of less than high school are least likely to be married with 61.6% of them unmarried at childbirth.
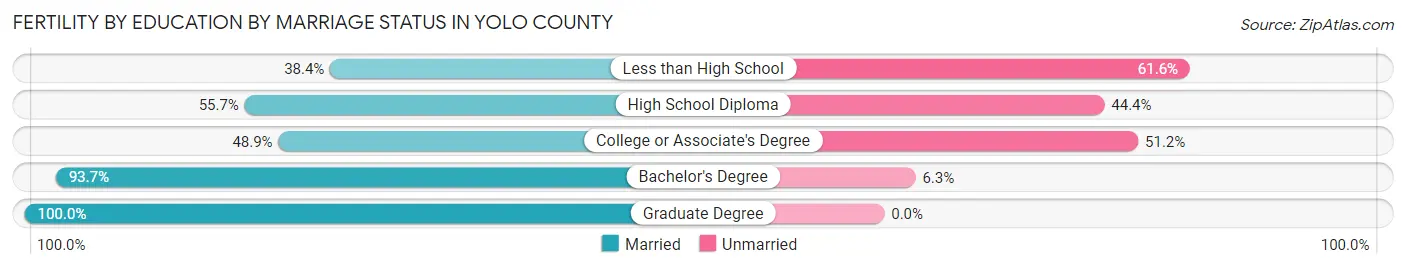
| Educational Attainment | Married | Unmarried |
| Less than High School | 78 (38.4%) | 125 (61.6%) |
| High School Diploma | 276 (55.6%) | 220 (44.4%) |
| College or Associate's Degree | 362 (48.8%) | 379 (51.1%) |
| Bachelor's Degree | 582 (93.7%) | 39 (6.3%) |
| Graduate Degree | 322 (100.0%) | 0 (0.0%) |
| Total | 1,620 (68.0%) | 763 (32.0%) |
Employment Characteristics in Yolo County
Employment by Class of Employer in Yolo County
Among the 100,577 employed individuals in Yolo County, private company employees (55,272 | 54.9%), state government employees (16,768 | 16.7%), and local government employees (9,321 | 9.3%) make up the most common classes of employment.
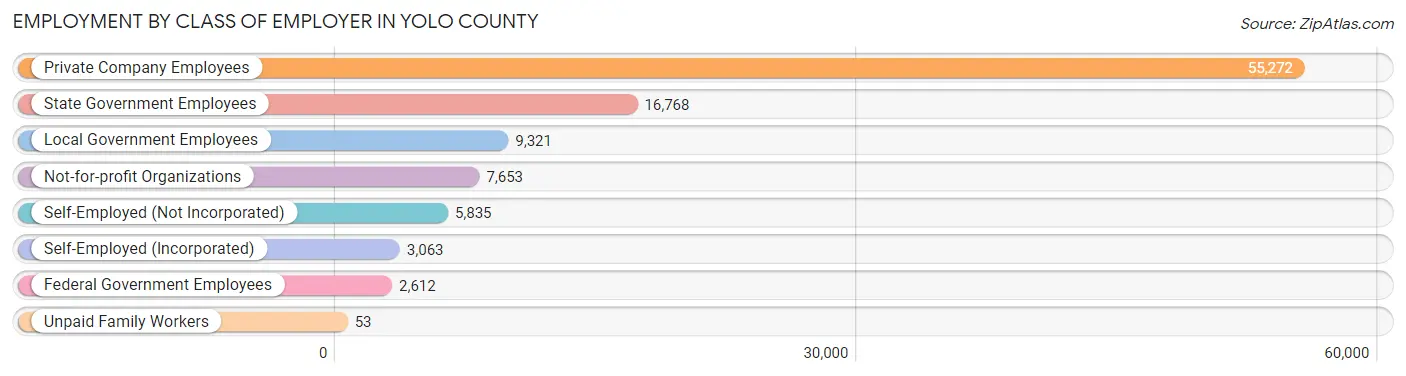
| Employer Class | # Employees | % Employees |
| Private Company Employees | 55,272 | 54.9% |
| Self-Employed (Incorporated) | 3,063 | 3.0% |
| Self-Employed (Not Incorporated) | 5,835 | 5.8% |
| Not-for-profit Organizations | 7,653 | 7.6% |
| Local Government Employees | 9,321 | 9.3% |
| State Government Employees | 16,768 | 16.7% |
| Federal Government Employees | 2,612 | 2.6% |
| Unpaid Family Workers | 53 | 0.1% |
| Total | 100,577 | 100.0% |
Employment Status by Age in Yolo County
According to the labor force statistics for Yolo County, out of the total population over 16 years of age (177,536), 61.3% or 108,830 individuals are in the labor force, with 5.3% or 5,768 of them unemployed. The age group with the highest labor force participation rate is 45 to 54 years, with 85.7% or 19,792 individuals in the labor force. Within the labor force, the 16 to 19 years age range has the highest percentage of unemployed individuals, with 20.1% or 984 of them being unemployed.
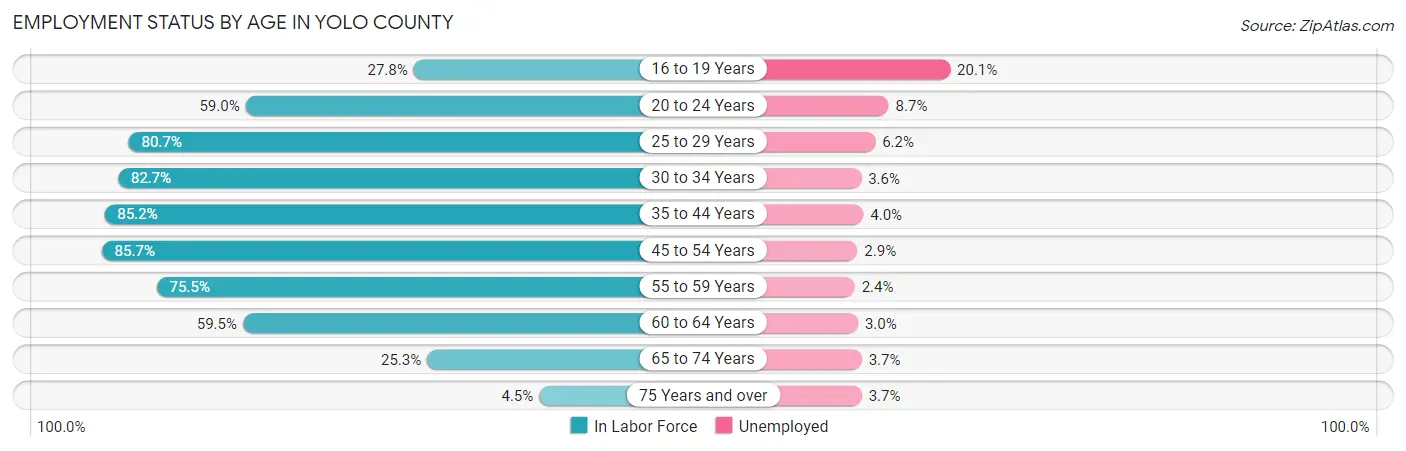
| Age Bracket | In Labor Force | Unemployed |
| 16 to 19 Years | 4,898 (27.8%) | 984 (20.1%) |
| 20 to 24 Years | 18,168 (59.0%) | 1,581 (8.7%) |
| 25 to 29 Years | 12,532 (80.7%) | 777 (6.2%) |
| 30 to 34 Years | 11,466 (82.7%) | 413 (3.6%) |
| 35 to 44 Years | 22,253 (85.2%) | 890 (4.0%) |
| 45 to 54 Years | 19,792 (85.7%) | 574 (2.9%) |
| 55 to 59 Years | 8,297 (75.5%) | 199 (2.4%) |
| 60 to 64 Years | 6,668 (59.5%) | 200 (3.0%) |
| 65 to 74 Years | 4,266 (25.3%) | 158 (3.7%) |
| 75 Years and over | 516 (4.5%) | 19 (3.7%) |
| Total | 108,830 (61.3%) | 5,768 (5.3%) |
Employment Status by Educational Attainment in Yolo County
According to labor force statistics for Yolo County, 80.4% of individuals (81,046) out of the total population between 25 and 64 years of age (100,803) are in the labor force, with 3.7% or 2,999 of them being unemployed. The group with the highest labor force participation rate are those with the educational attainment of bachelor's degree or higher, with 87.8% or 38,267 individuals in the labor force. Within the labor force, individuals with high school diploma education have the highest percentage of unemployment, with 5.2% or 712 of them being unemployed.
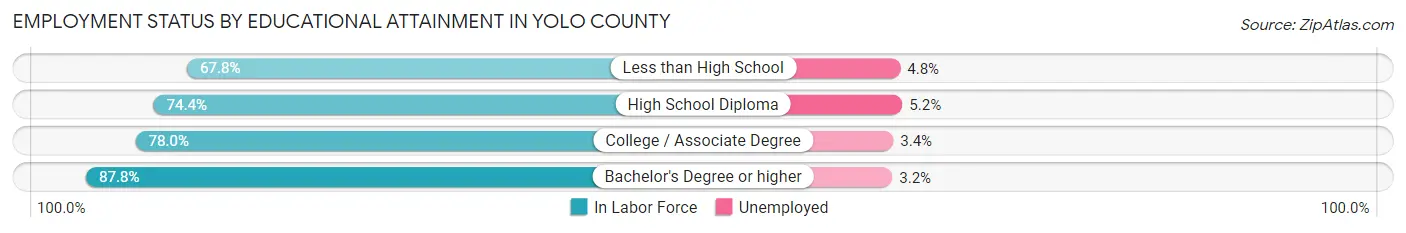
| Educational Attainment | In Labor Force | Unemployed |
| Less than High School | 7,928 (67.8%) | 561 (4.8%) |
| High School Diploma | 13,693 (74.4%) | 957 (5.2%) |
| College / Associate Degree | 21,155 (78.0%) | 922 (3.4%) |
| Bachelor's Degree or higher | 38,267 (87.8%) | 1,395 (3.2%) |
| Total | 81,046 (80.4%) | 3,730 (3.7%) |
Employment Occupations by Sex in Yolo County
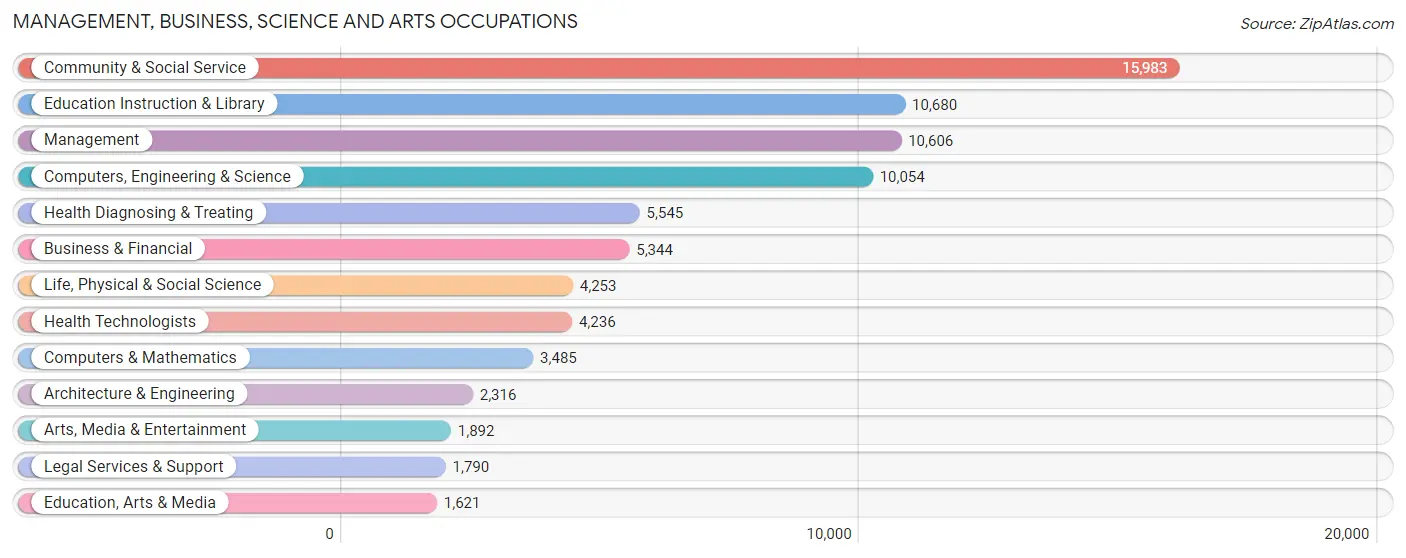
Management, Business, Science and Arts Occupations
The most common Management, Business, Science and Arts occupations in Yolo County are Community & Social Service (15,983 | 15.6%), Education Instruction & Library (10,680 | 10.4%), Management (10,606 | 10.3%), Computers, Engineering & Science (10,054 | 9.8%), and Health Diagnosing & Treating (5,545 | 5.4%).
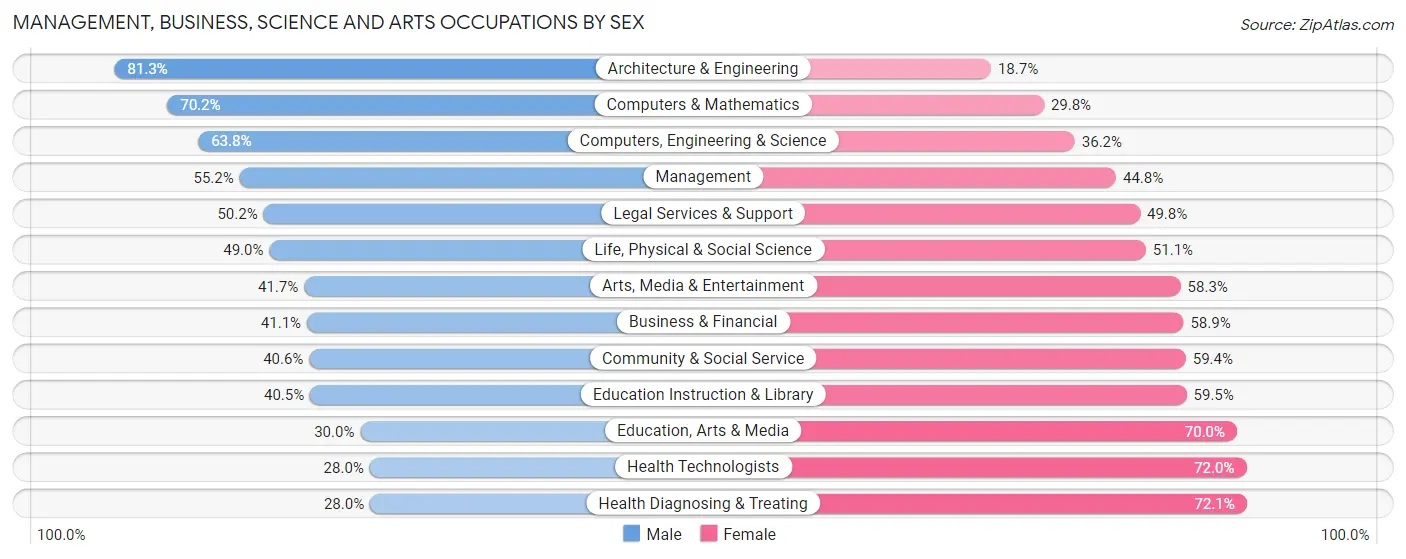
Management, Business, Science and Arts Occupations by Sex
Within the Management, Business, Science and Arts occupations in Yolo County, the most male-oriented occupations are Architecture & Engineering (81.3%), Computers & Mathematics (70.2%), and Computers, Engineering & Science (63.8%), while the most female-oriented occupations are Health Diagnosing & Treating (72.1%), Health Technologists (72.0%), and Education, Arts & Media (70.0%).
| Occupation | Male | Female |
| Management | 5,851 (55.2%) | 4,755 (44.8%) |
| Business & Financial | 2,197 (41.1%) | 3,147 (58.9%) |
| Computers, Engineering & Science | 6,411 (63.8%) | 3,643 (36.2%) |
| Computers & Mathematics | 2,447 (70.2%) | 1,038 (29.8%) |
| Architecture & Engineering | 1,882 (81.3%) | 434 (18.7%) |
| Life, Physical & Social Science | 2,082 (48.9%) | 2,171 (51.0%) |
| Community & Social Service | 6,494 (40.6%) | 9,489 (59.4%) |
| Education, Arts & Media | 486 (30.0%) | 1,135 (70.0%) |
| Legal Services & Support | 898 (50.2%) | 892 (49.8%) |
| Education Instruction & Library | 4,321 (40.5%) | 6,359 (59.5%) |
| Arts, Media & Entertainment | 789 (41.7%) | 1,103 (58.3%) |
| Health Diagnosing & Treating | 1,550 (28.0%) | 3,995 (72.1%) |
| Health Technologists | 1,187 (28.0%) | 3,049 (72.0%) |
| Total (Category) | 22,503 (47.3%) | 25,029 (52.7%) |
| Total (Overall) | 52,694 (51.3%) | 49,999 (48.7%) |
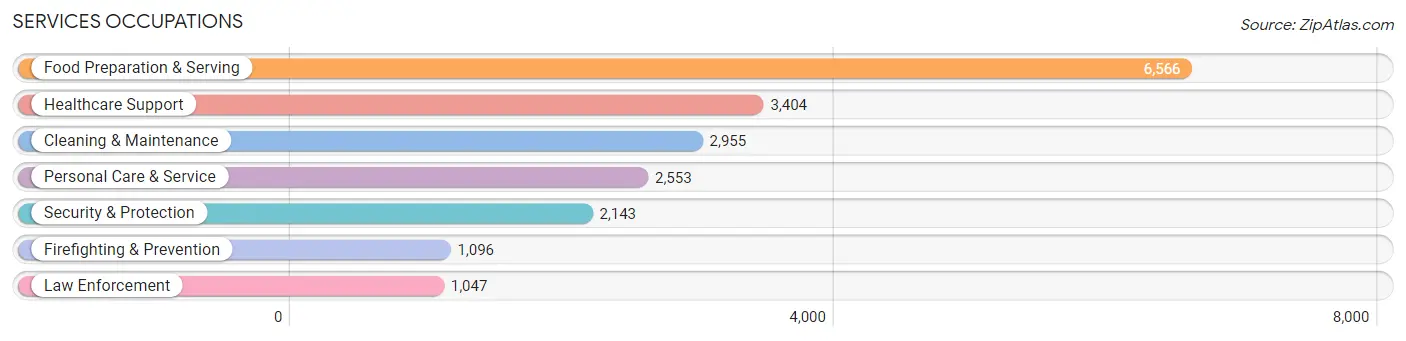
Services Occupations
The most common Services occupations in Yolo County are Food Preparation & Serving (6,566 | 6.4%), Healthcare Support (3,404 | 3.3%), Cleaning & Maintenance (2,955 | 2.9%), Personal Care & Service (2,553 | 2.5%), and Security & Protection (2,143 | 2.1%).
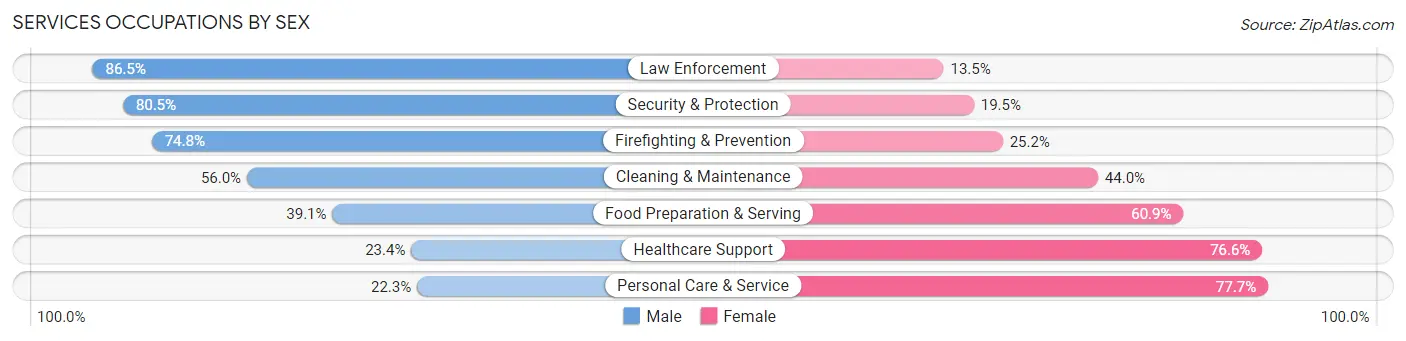
Services Occupations by Sex
Within the Services occupations in Yolo County, the most male-oriented occupations are Law Enforcement (86.5%), Security & Protection (80.5%), and Firefighting & Prevention (74.8%), while the most female-oriented occupations are Personal Care & Service (77.7%), Healthcare Support (76.6%), and Food Preparation & Serving (60.9%).
| Occupation | Male | Female |
| Healthcare Support | 798 (23.4%) | 2,606 (76.6%) |
| Security & Protection | 1,726 (80.5%) | 417 (19.5%) |
| Firefighting & Prevention | 820 (74.8%) | 276 (25.2%) |
| Law Enforcement | 906 (86.5%) | 141 (13.5%) |
| Food Preparation & Serving | 2,565 (39.1%) | 4,001 (60.9%) |
| Cleaning & Maintenance | 1,654 (56.0%) | 1,301 (44.0%) |
| Personal Care & Service | 569 (22.3%) | 1,984 (77.7%) |
| Total (Category) | 7,312 (41.5%) | 10,309 (58.5%) |
| Total (Overall) | 52,694 (51.3%) | 49,999 (48.7%) |
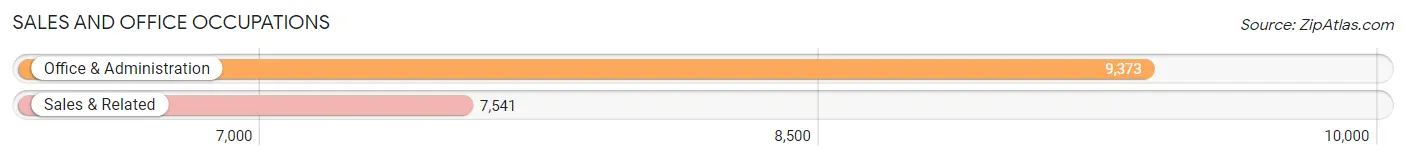
Sales and Office Occupations
The most common Sales and Office occupations in Yolo County are Office & Administration (9,373 | 9.1%), and Sales & Related (7,541 | 7.3%).
Sales and Office Occupations by Sex
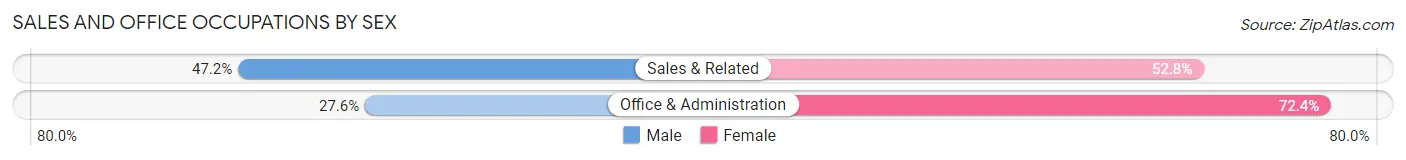
| Occupation | Male | Female |
| Sales & Related | 3,556 (47.2%) | 3,985 (52.8%) |
| Office & Administration | 2,589 (27.6%) | 6,784 (72.4%) |
| Total (Category) | 6,145 (36.3%) | 10,769 (63.7%) |
| Total (Overall) | 52,694 (51.3%) | 49,999 (48.7%) |
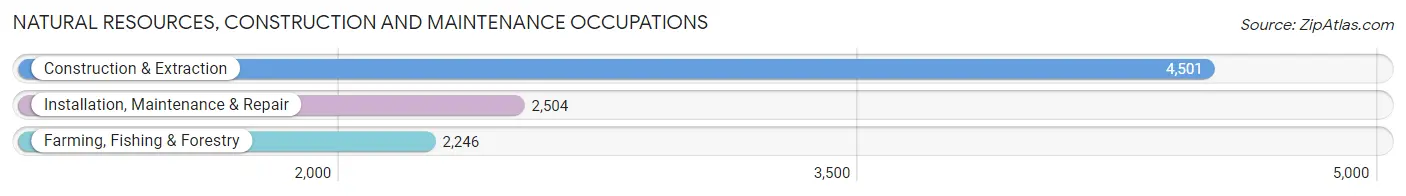
Natural Resources, Construction and Maintenance Occupations
The most common Natural Resources, Construction and Maintenance occupations in Yolo County are Construction & Extraction (4,501 | 4.4%), Installation, Maintenance & Repair (2,504 | 2.4%), and Farming, Fishing & Forestry (2,246 | 2.2%).
Natural Resources, Construction and Maintenance Occupations by Sex
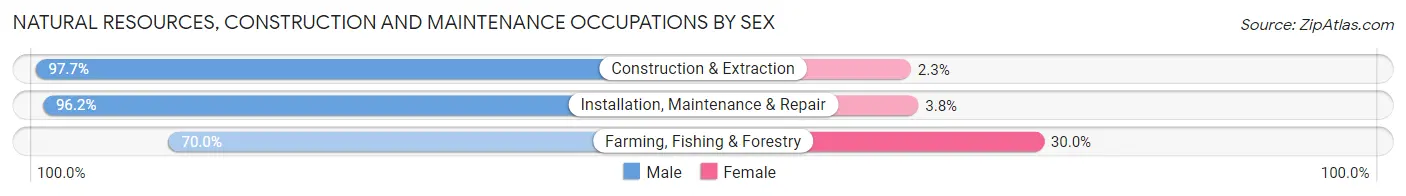
| Occupation | Male | Female |
| Farming, Fishing & Forestry | 1,573 (70.0%) | 673 (30.0%) |
| Construction & Extraction | 4,398 (97.7%) | 103 (2.3%) |
| Installation, Maintenance & Repair | 2,408 (96.2%) | 96 (3.8%) |
| Total (Category) | 8,379 (90.6%) | 872 (9.4%) |
| Total (Overall) | 52,694 (51.3%) | 49,999 (48.7%) |
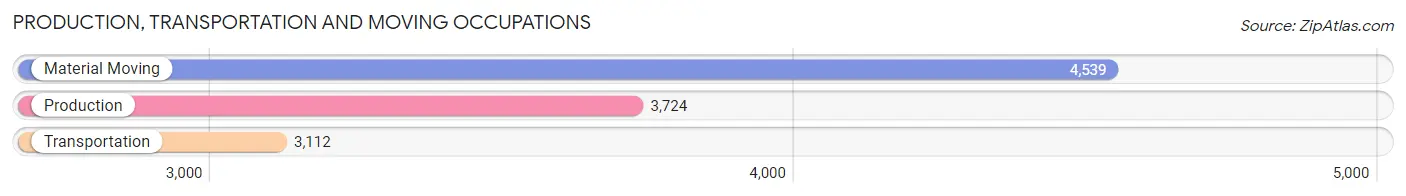
Production, Transportation and Moving Occupations
The most common Production, Transportation and Moving occupations in Yolo County are Material Moving (4,539 | 4.4%), Production (3,724 | 3.6%), and Transportation (3,112 | 3.0%).
Production, Transportation and Moving Occupations by Sex
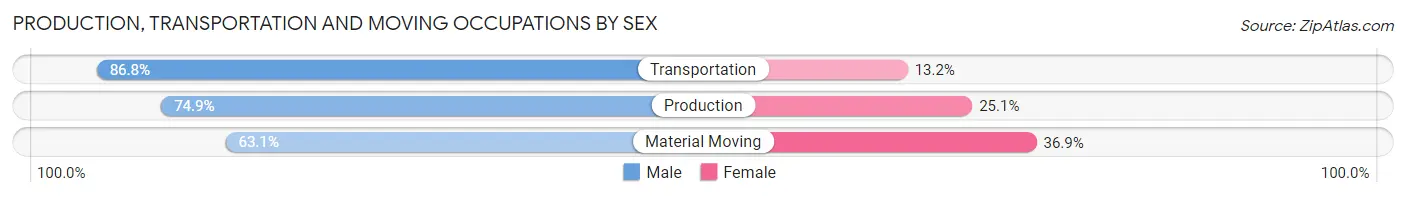
| Occupation | Male | Female |
| Production | 2,790 (74.9%) | 934 (25.1%) |
| Transportation | 2,700 (86.8%) | 412 (13.2%) |
| Material Moving | 2,865 (63.1%) | 1,674 (36.9%) |
| Total (Category) | 8,355 (73.5%) | 3,020 (26.6%) |
| Total (Overall) | 52,694 (51.3%) | 49,999 (48.7%) |
Employment Industries by Sex in Yolo County
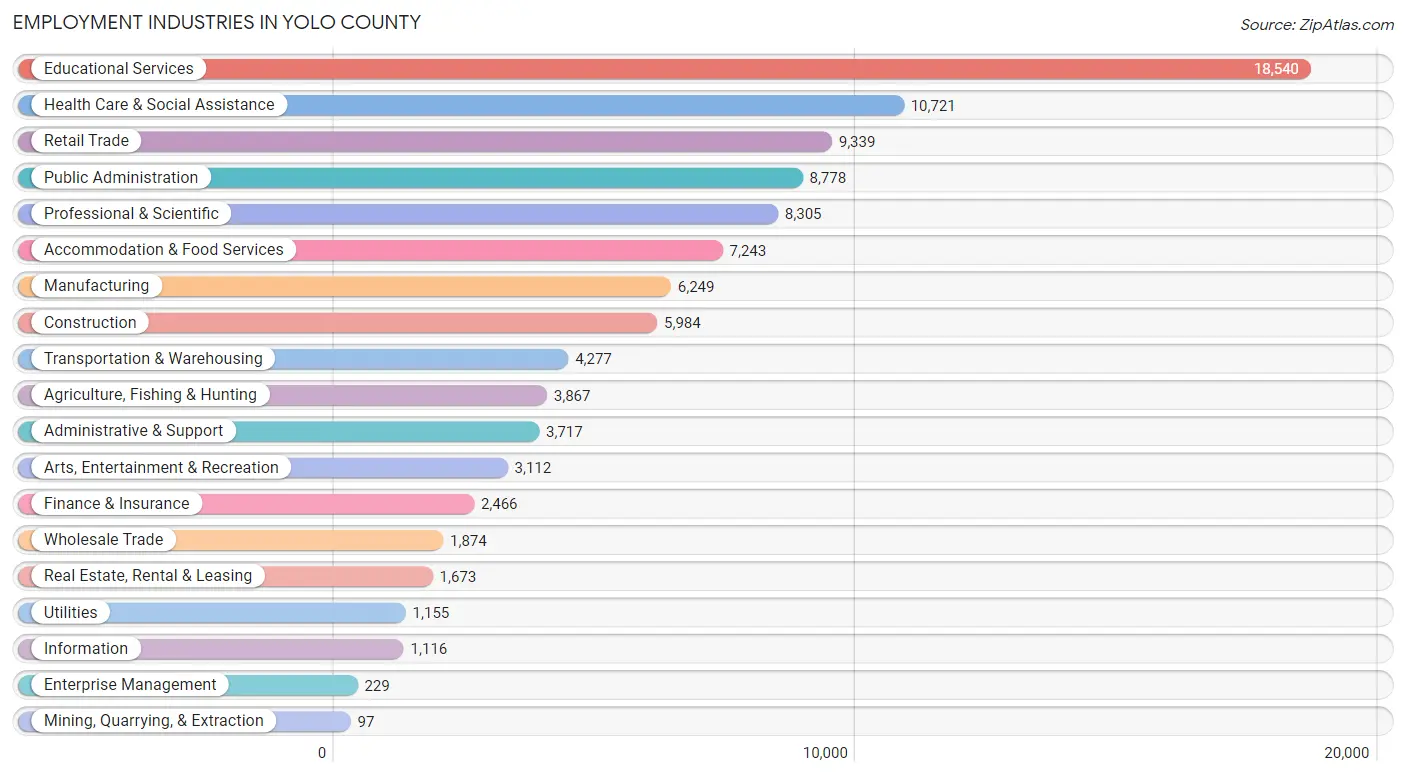
Employment Industries in Yolo County
The major employment industries in Yolo County include Educational Services (18,540 | 18.0%), Health Care & Social Assistance (10,721 | 10.4%), Retail Trade (9,339 | 9.1%), Public Administration (8,778 | 8.6%), and Professional & Scientific (8,305 | 8.1%).
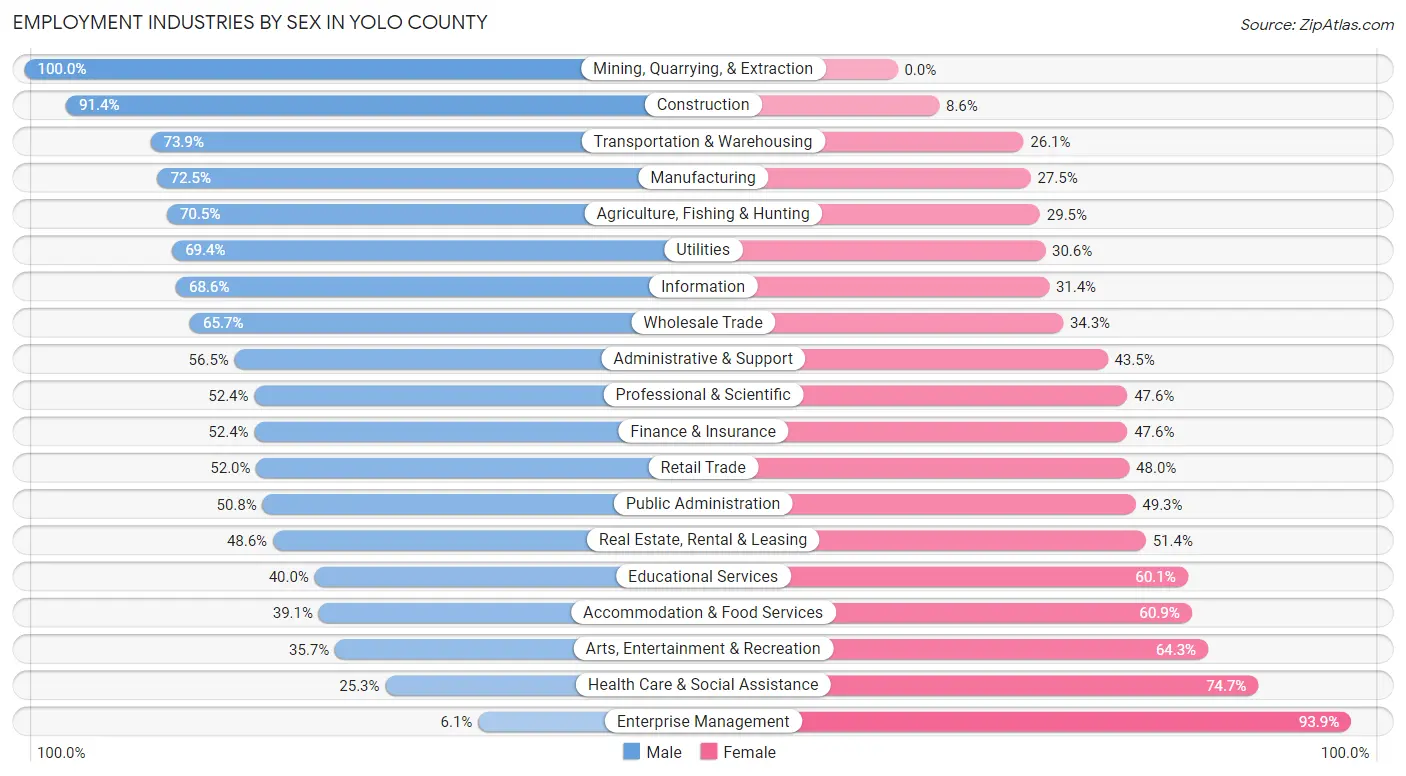
Employment Industries by Sex in Yolo County
The Yolo County industries that see more men than women are Mining, Quarrying, & Extraction (100.0%), Construction (91.4%), and Transportation & Warehousing (73.9%), whereas the industries that tend to have a higher number of women are Enterprise Management (93.9%), Health Care & Social Assistance (74.7%), and Arts, Entertainment & Recreation (64.3%).
| Industry | Male | Female |
| Agriculture, Fishing & Hunting | 2,727 (70.5%) | 1,140 (29.5%) |
| Mining, Quarrying, & Extraction | 97 (100.0%) | 0 (0.0%) |
| Construction | 5,469 (91.4%) | 515 (8.6%) |
| Manufacturing | 4,528 (72.5%) | 1,721 (27.5%) |
| Wholesale Trade | 1,232 (65.7%) | 642 (34.3%) |
| Retail Trade | 4,859 (52.0%) | 4,480 (48.0%) |
| Transportation & Warehousing | 3,162 (73.9%) | 1,115 (26.1%) |
| Utilities | 802 (69.4%) | 353 (30.6%) |
| Information | 766 (68.6%) | 350 (31.4%) |
| Finance & Insurance | 1,293 (52.4%) | 1,173 (47.6%) |
| Real Estate, Rental & Leasing | 813 (48.6%) | 860 (51.4%) |
| Professional & Scientific | 4,355 (52.4%) | 3,950 (47.6%) |
| Enterprise Management | 14 (6.1%) | 215 (93.9%) |
| Administrative & Support | 2,101 (56.5%) | 1,616 (43.5%) |
| Educational Services | 7,407 (40.0%) | 11,133 (60.1%) |
| Health Care & Social Assistance | 2,716 (25.3%) | 8,005 (74.7%) |
| Arts, Entertainment & Recreation | 1,112 (35.7%) | 2,000 (64.3%) |
| Accommodation & Food Services | 2,833 (39.1%) | 4,410 (60.9%) |
| Public Administration | 4,455 (50.7%) | 4,323 (49.2%) |
| Total | 52,694 (51.3%) | 49,999 (48.7%) |
Education in Yolo County
School Enrollment in Yolo County
The most common levels of schooling among the 78,043 students in Yolo County are college / undergraduate (34,656 | 44.4%), high school (10,961 | 14.0%), and elementary school (9,932 | 12.7%).
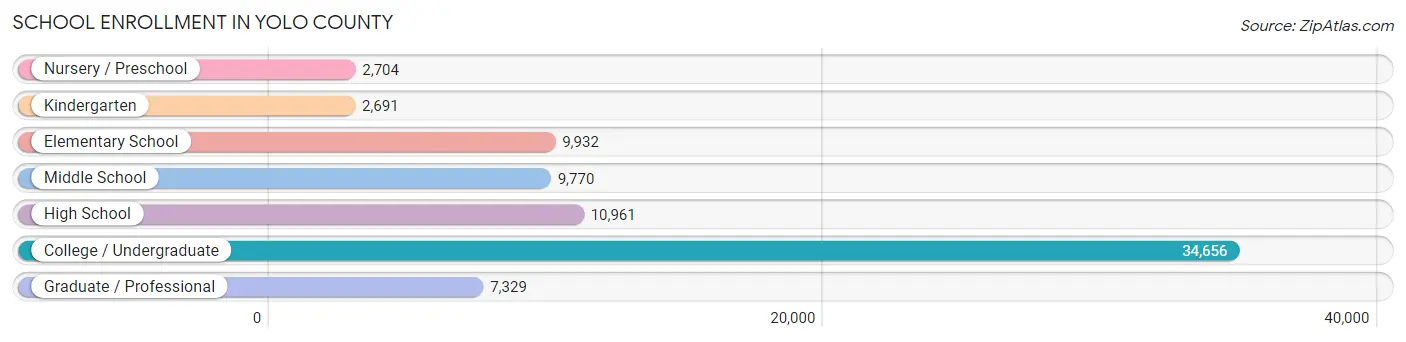
| School Level | # Students | % Students |
| Nursery / Preschool | 2,704 | 3.5% |
| Kindergarten | 2,691 | 3.5% |
| Elementary School | 9,932 | 12.7% |
| Middle School | 9,770 | 12.5% |
| High School | 10,961 | 14.0% |
| College / Undergraduate | 34,656 | 44.4% |
| Graduate / Professional | 7,329 | 9.4% |
| Total | 78,043 | 100.0% |
School Enrollment by Age by Funding Source in Yolo County
Out of a total of 78,043 students who are enrolled in schools in Yolo County, 6,321 (8.1%) attend a private institution, while the remaining 71,722 (91.9%) are enrolled in public schools. The age group of 3 to 4 year olds has the highest likelihood of being enrolled in private schools, with 1,073 (46.7% in the age bracket) enrolled. Conversely, the age group of 18 to 19 year olds has the lowest likelihood of being enrolled in a private school, with 11,581 (98.7% in the age bracket) attending a public institution.
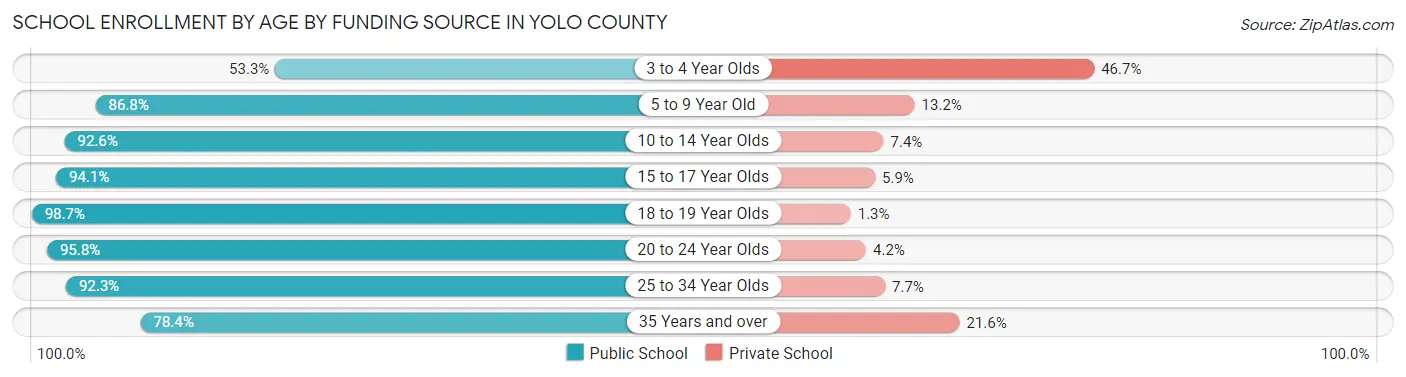
| Age Bracket | Public School | Private School |
| 3 to 4 Year Olds | 1,226 (53.3%) | 1,073 (46.7%) |
| 5 to 9 Year Old | 10,112 (86.8%) | 1,540 (13.2%) |
| 10 to 14 Year Olds | 12,060 (92.6%) | 970 (7.4%) |
| 15 to 17 Year Olds | 7,247 (94.1%) | 451 (5.9%) |
| 18 to 19 Year Olds | 11,581 (98.7%) | 156 (1.3%) |
| 20 to 24 Year Olds | 21,097 (95.8%) | 918 (4.2%) |
| 25 to 34 Year Olds | 5,844 (92.3%) | 488 (7.7%) |
| 35 Years and over | 2,572 (78.4%) | 708 (21.6%) |
| Total | 71,722 (91.9%) | 6,321 (8.1%) |
Educational Attainment by Field of Study in Yolo County
Bio, nature & agricultural (10,430 | 17.2%), social sciences (7,770 | 12.8%), business (5,652 | 9.3%), engineering (4,614 | 7.6%), and science & technology (4,416 | 7.3%) are the most common fields of study among 60,747 individuals in Yolo County who have obtained a bachelor's degree or higher.
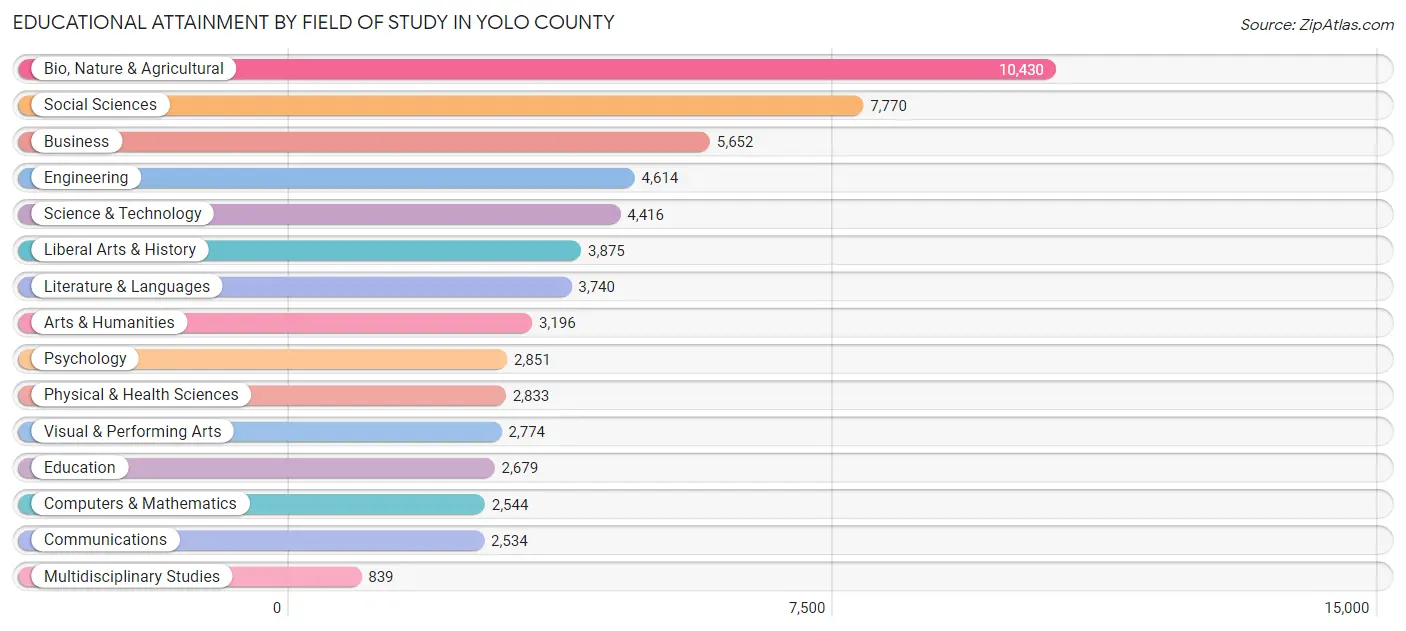
| Field of Study | # Graduates | % Graduates |
| Computers & Mathematics | 2,544 | 4.2% |
| Bio, Nature & Agricultural | 10,430 | 17.2% |
| Physical & Health Sciences | 2,833 | 4.7% |
| Psychology | 2,851 | 4.7% |
| Social Sciences | 7,770 | 12.8% |
| Engineering | 4,614 | 7.6% |
| Multidisciplinary Studies | 839 | 1.4% |
| Science & Technology | 4,416 | 7.3% |
| Business | 5,652 | 9.3% |
| Education | 2,679 | 4.4% |
| Literature & Languages | 3,740 | 6.2% |
| Liberal Arts & History | 3,875 | 6.4% |
| Visual & Performing Arts | 2,774 | 4.6% |
| Communications | 2,534 | 4.2% |
| Arts & Humanities | 3,196 | 5.3% |
| Total | 60,747 | 100.0% |
Transportation & Commute in Yolo County
Vehicle Availability by Sex in Yolo County
The most prevalent vehicle ownership categories in Yolo County are males with 2 vehicles (19,943, accounting for 38.7%) and females with 2 vehicles (19,426, making up 41.8%).
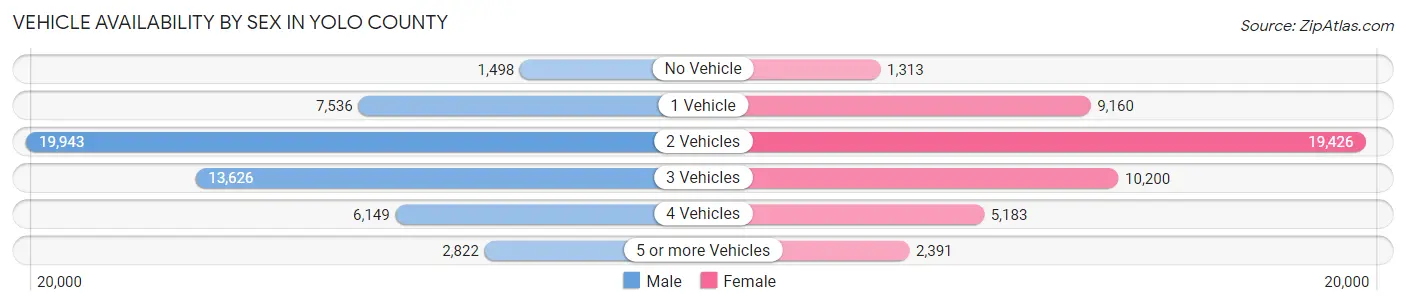
| Vehicles Available | Male | Female |
| No Vehicle | 1,498 (2.9%) | 1,313 (2.8%) |
| 1 Vehicle | 7,536 (14.6%) | 9,160 (19.2%) |
| 2 Vehicles | 19,943 (38.7%) | 19,426 (40.7%) |
| 3 Vehicles | 13,626 (26.4%) | 10,200 (21.4%) |
| 4 Vehicles | 6,149 (11.9%) | 5,183 (10.9%) |
| 5 or more Vehicles | 2,822 (5.5%) | 2,391 (5.0%) |
| Total | 51,574 (100.0%) | 47,673 (100.0%) |
Commute Time in Yolo County
The most frequently occuring commute durations in Yolo County are 10 to 14 minutes (16,173 commuters, 18.8%), 15 to 19 minutes (14,858 commuters, 17.3%), and 20 to 24 minutes (11,721 commuters, 13.6%).
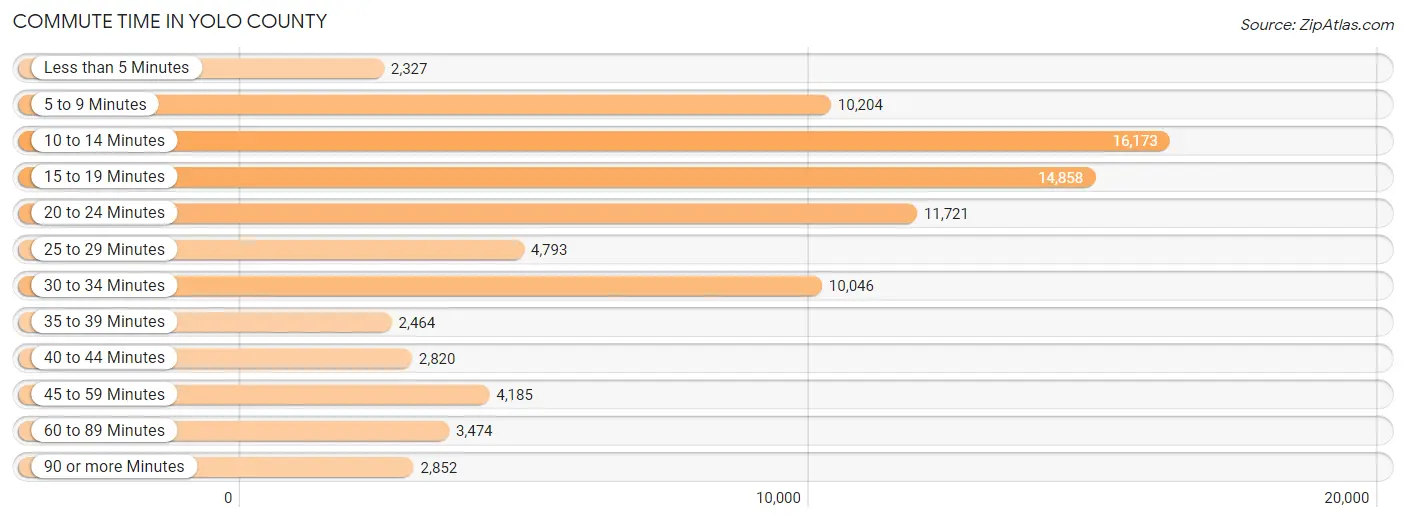
| Commute Time | # Commuters | % Commuters |
| Less than 5 Minutes | 2,327 | 2.7% |
| 5 to 9 Minutes | 10,204 | 11.9% |
| 10 to 14 Minutes | 16,173 | 18.8% |
| 15 to 19 Minutes | 14,858 | 17.3% |
| 20 to 24 Minutes | 11,721 | 13.6% |
| 25 to 29 Minutes | 4,793 | 5.6% |
| 30 to 34 Minutes | 10,046 | 11.7% |
| 35 to 39 Minutes | 2,464 | 2.9% |
| 40 to 44 Minutes | 2,820 | 3.3% |
| 45 to 59 Minutes | 4,185 | 4.9% |
| 60 to 89 Minutes | 3,474 | 4.0% |
| 90 or more Minutes | 2,852 | 3.3% |
Commute Time by Sex in Yolo County
The most common commute times in Yolo County are 10 to 14 minutes (7,583 commuters, 16.7%) for males and 10 to 14 minutes (8,590 commuters, 21.2%) for females.
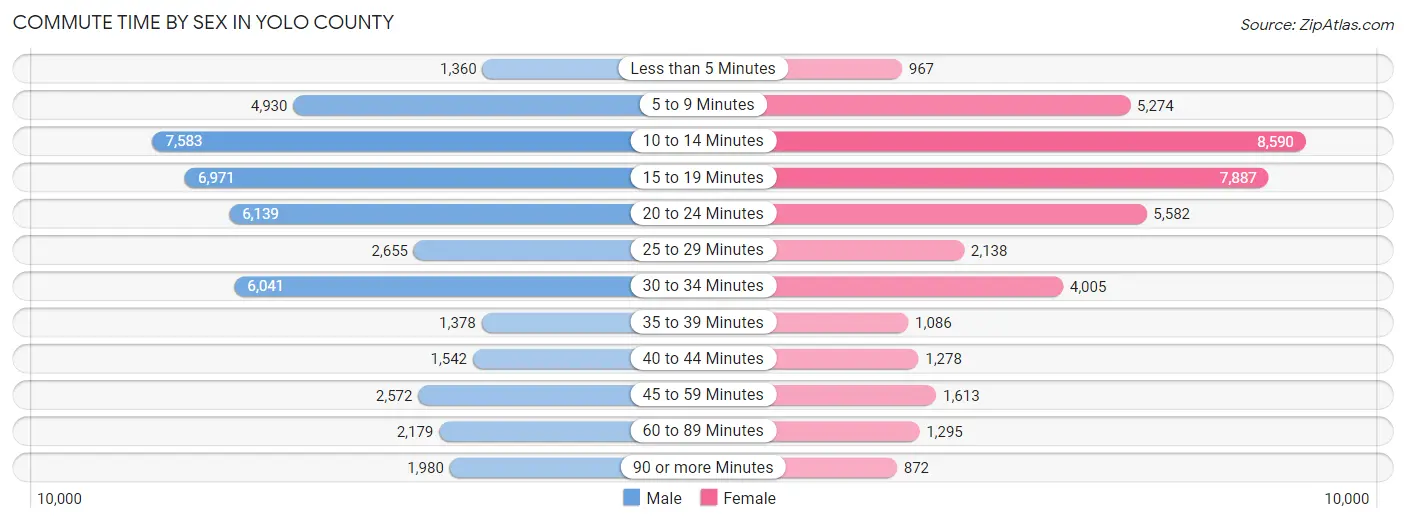
| Commute Time | Male | Female |
| Less than 5 Minutes | 1,360 (3.0%) | 967 (2.4%) |
| 5 to 9 Minutes | 4,930 (10.9%) | 5,274 (13.0%) |
| 10 to 14 Minutes | 7,583 (16.7%) | 8,590 (21.2%) |
| 15 to 19 Minutes | 6,971 (15.4%) | 7,887 (19.4%) |
| 20 to 24 Minutes | 6,139 (13.5%) | 5,582 (13.8%) |
| 25 to 29 Minutes | 2,655 (5.9%) | 2,138 (5.3%) |
| 30 to 34 Minutes | 6,041 (13.3%) | 4,005 (9.9%) |
| 35 to 39 Minutes | 1,378 (3.0%) | 1,086 (2.7%) |
| 40 to 44 Minutes | 1,542 (3.4%) | 1,278 (3.2%) |
| 45 to 59 Minutes | 2,572 (5.7%) | 1,613 (4.0%) |
| 60 to 89 Minutes | 2,179 (4.8%) | 1,295 (3.2%) |
| 90 or more Minutes | 1,980 (4.4%) | 872 (2.1%) |
Time of Departure to Work by Sex in Yolo County
The most frequent times of departure to work in Yolo County are 7:00 AM to 7:29 AM (5,427, 12.0%) for males and 7:30 AM to 7:59 AM (6,314, 15.6%) for females.
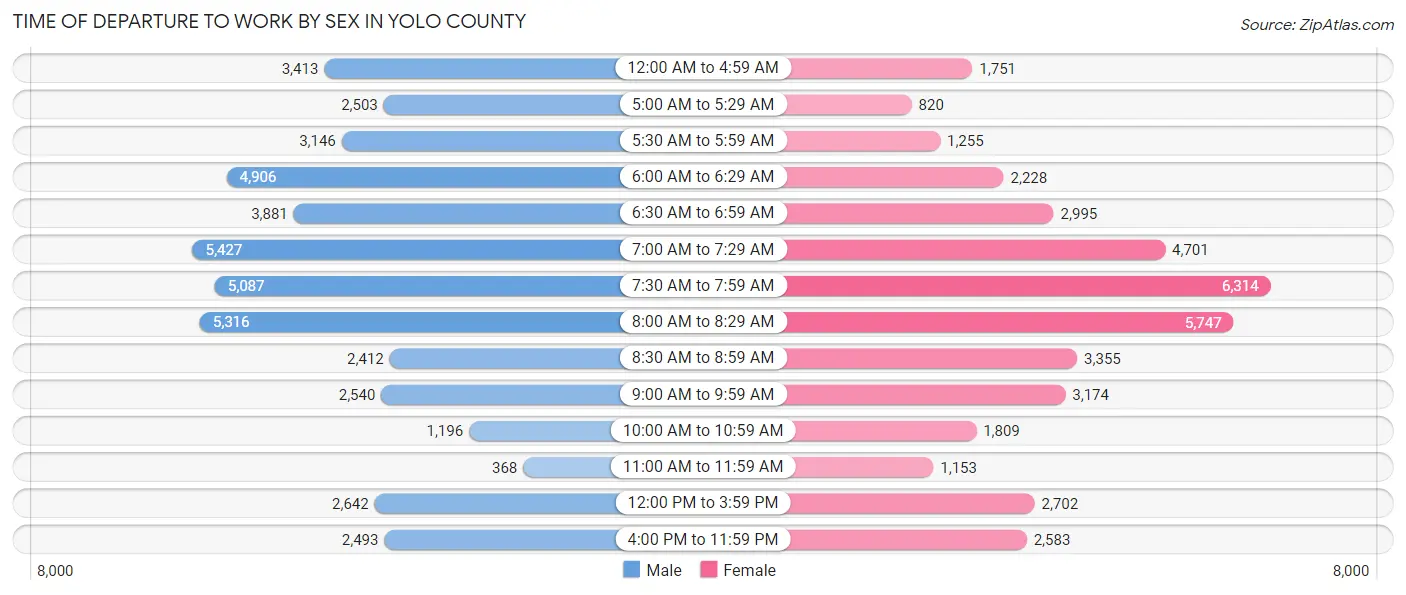
| Time of Departure | Male | Female |
| 12:00 AM to 4:59 AM | 3,413 (7.5%) | 1,751 (4.3%) |
| 5:00 AM to 5:29 AM | 2,503 (5.5%) | 820 (2.0%) |
| 5:30 AM to 5:59 AM | 3,146 (6.9%) | 1,255 (3.1%) |
| 6:00 AM to 6:29 AM | 4,906 (10.8%) | 2,228 (5.5%) |
| 6:30 AM to 6:59 AM | 3,881 (8.6%) | 2,995 (7.4%) |
| 7:00 AM to 7:29 AM | 5,427 (12.0%) | 4,701 (11.6%) |
| 7:30 AM to 7:59 AM | 5,087 (11.2%) | 6,314 (15.6%) |
| 8:00 AM to 8:29 AM | 5,316 (11.7%) | 5,747 (14.2%) |
| 8:30 AM to 8:59 AM | 2,412 (5.3%) | 3,355 (8.3%) |
| 9:00 AM to 9:59 AM | 2,540 (5.6%) | 3,174 (7.8%) |
| 10:00 AM to 10:59 AM | 1,196 (2.6%) | 1,809 (4.5%) |
| 11:00 AM to 11:59 AM | 368 (0.8%) | 1,153 (2.8%) |
| 12:00 PM to 3:59 PM | 2,642 (5.8%) | 2,702 (6.7%) |
| 4:00 PM to 11:59 PM | 2,493 (5.5%) | 2,583 (6.4%) |
| Total | 45,330 (100.0%) | 40,587 (100.0%) |
Housing Occupancy in Yolo County
Occupancy by Ownership in Yolo County
Of the total 76,107 dwellings in Yolo County, owner-occupied units account for 39,712 (52.2%), while renter-occupied units make up 36,395 (47.8%).
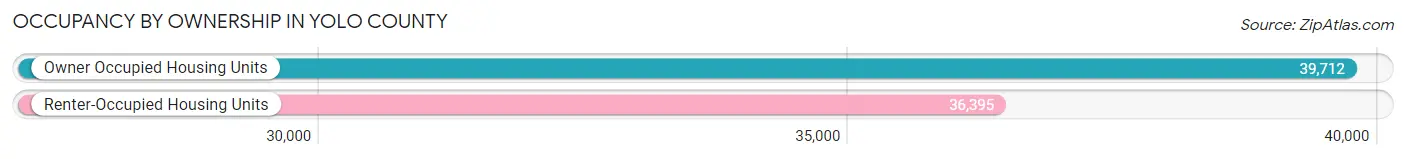
| Occupancy | # Housing Units | % Housing Units |
| Owner Occupied Housing Units | 39,712 | 52.2% |
| Renter-Occupied Housing Units | 36,395 | 47.8% |
| Total Occupied Housing Units | 76,107 | 100.0% |
Occupancy by Household Size in Yolo County
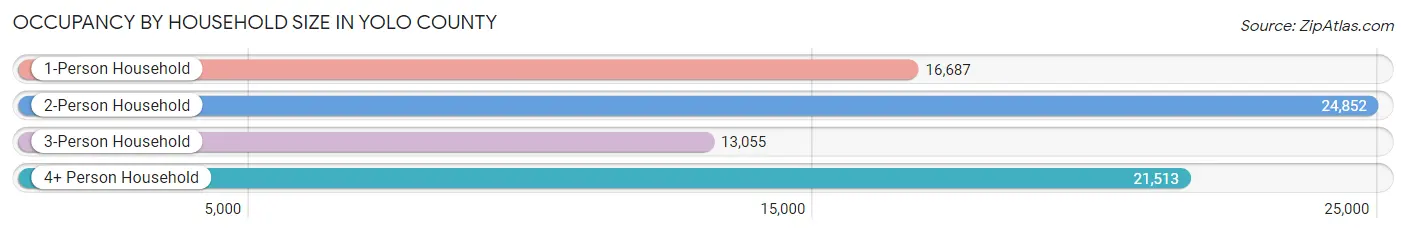
| Household Size | # Housing Units | % Housing Units |
| 1-Person Household | 16,687 | 21.9% |
| 2-Person Household | 24,852 | 32.7% |
| 3-Person Household | 13,055 | 17.2% |
| 4+ Person Household | 21,513 | 28.3% |
| Total Housing Units | 76,107 | 100.0% |
Occupancy by Ownership by Household Size in Yolo County
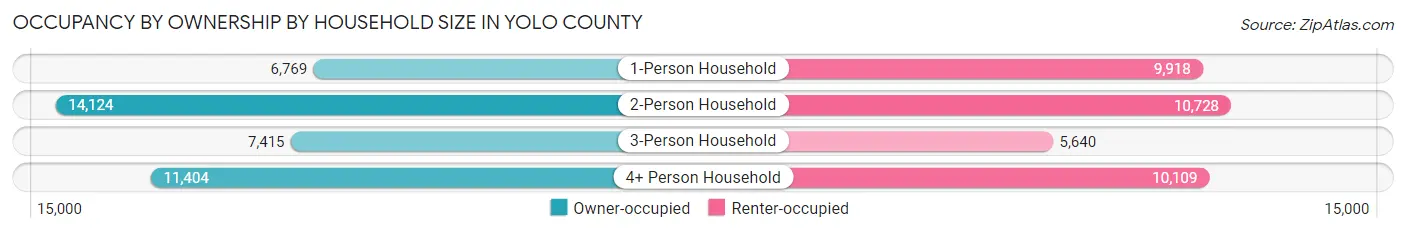
| Household Size | Owner-occupied | Renter-occupied |
| 1-Person Household | 6,769 (40.6%) | 9,918 (59.4%) |
| 2-Person Household | 14,124 (56.8%) | 10,728 (43.2%) |
| 3-Person Household | 7,415 (56.8%) | 5,640 (43.2%) |
| 4+ Person Household | 11,404 (53.0%) | 10,109 (47.0%) |
| Total Housing Units | 39,712 (52.2%) | 36,395 (47.8%) |
Occupancy by Educational Attainment in Yolo County

| Household Size | Owner-occupied | Renter-occupied |
| Less than High School | 2,803 (40.9%) | 4,057 (59.1%) |
| High School Diploma | 4,199 (37.0%) | 7,135 (62.9%) |
| College/Associate Degree | 11,371 (46.3%) | 13,210 (53.7%) |
| Bachelor's Degree or higher | 21,339 (64.0%) | 11,993 (36.0%) |
Occupancy by Age of Householder in Yolo County
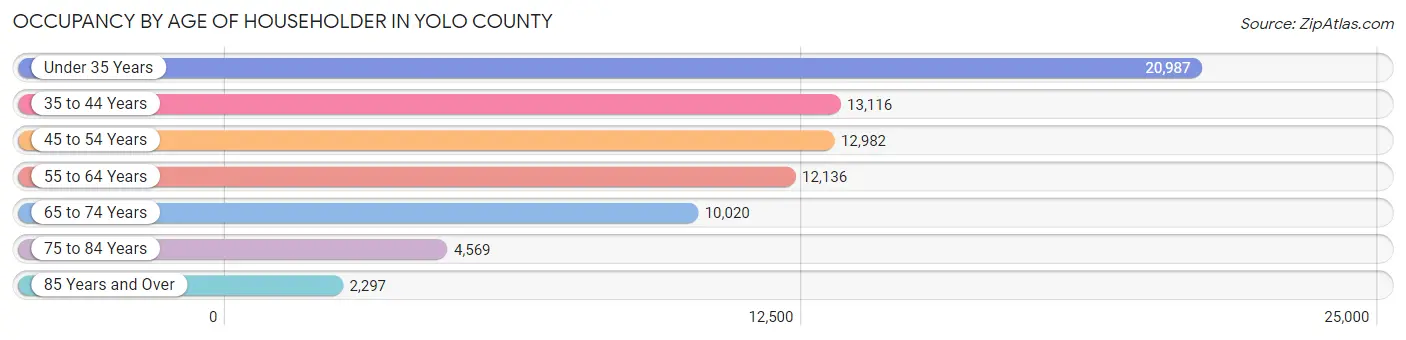
| Age Bracket | # Households | % Households |
| Under 35 Years | 20,987 | 27.6% |
| 35 to 44 Years | 13,116 | 17.2% |
| 45 to 54 Years | 12,982 | 17.1% |
| 55 to 64 Years | 12,136 | 16.0% |
| 65 to 74 Years | 10,020 | 13.2% |
| 75 to 84 Years | 4,569 | 6.0% |
| 85 Years and Over | 2,297 | 3.0% |
| Total | 76,107 | 100.0% |
Housing Finances in Yolo County
Median Income by Occupancy in Yolo County
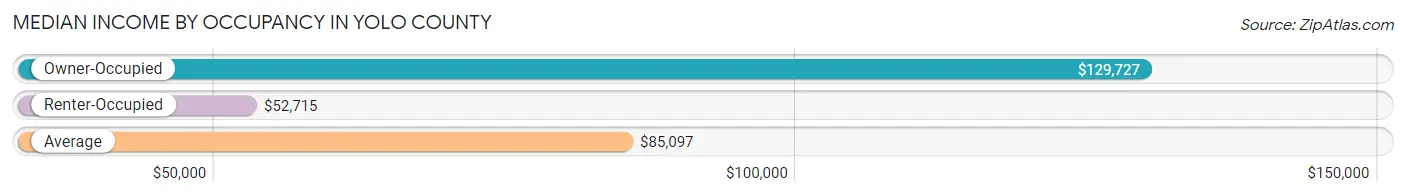
| Occupancy Type | # Households | Median Income |
| Owner-Occupied | 39,712 (52.2%) | $129,727 |
| Renter-Occupied | 36,395 (47.8%) | $52,715 |
| Average | 76,107 (100.0%) | $85,097 |
Occupancy by Householder Income Bracket in Yolo County
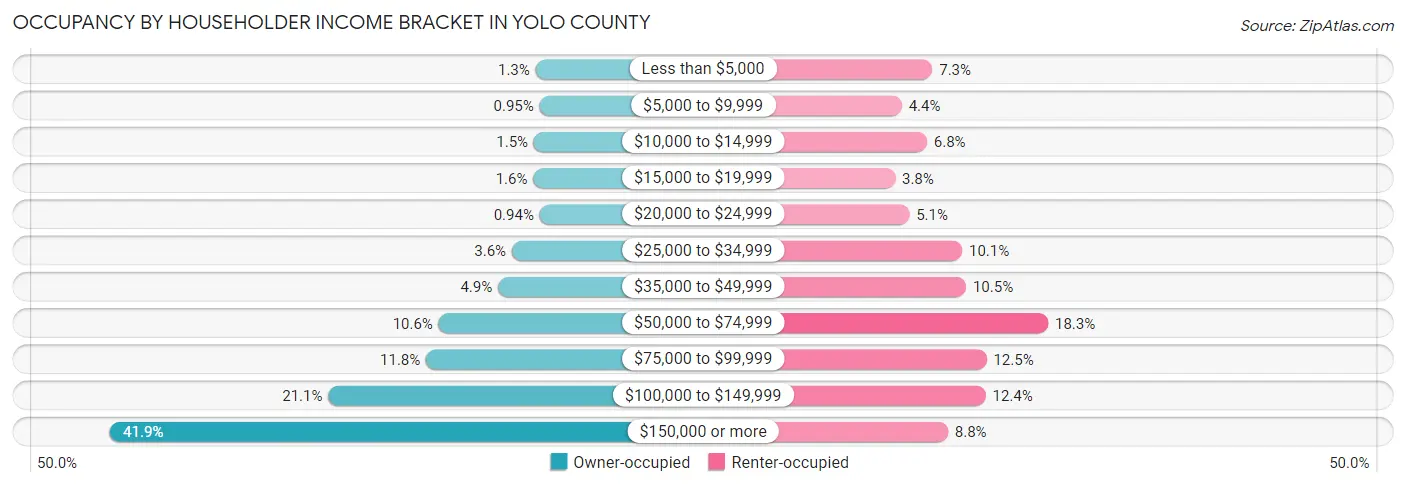
| Income Bracket | Owner-occupied | Renter-occupied |
| Less than $5,000 | 528 (1.3%) | 2,659 (7.3%) |
| $5,000 to $9,999 | 376 (0.9%) | 1,601 (4.4%) |
| $10,000 to $14,999 | 591 (1.5%) | 2,470 (6.8%) |
| $15,000 to $19,999 | 615 (1.5%) | 1,370 (3.8%) |
| $20,000 to $24,999 | 373 (0.9%) | 1,858 (5.1%) |
| $25,000 to $34,999 | 1,427 (3.6%) | 3,690 (10.1%) |
| $35,000 to $49,999 | 1,951 (4.9%) | 3,829 (10.5%) |
| $50,000 to $74,999 | 4,193 (10.6%) | 6,671 (18.3%) |
| $75,000 to $99,999 | 4,669 (11.8%) | 4,539 (12.5%) |
| $100,000 to $149,999 | 8,370 (21.1%) | 4,509 (12.4%) |
| $150,000 or more | 16,619 (41.8%) | 3,199 (8.8%) |
| Total | 39,712 (100.0%) | 36,395 (100.0%) |
Monthly Housing Cost Tiers in Yolo County
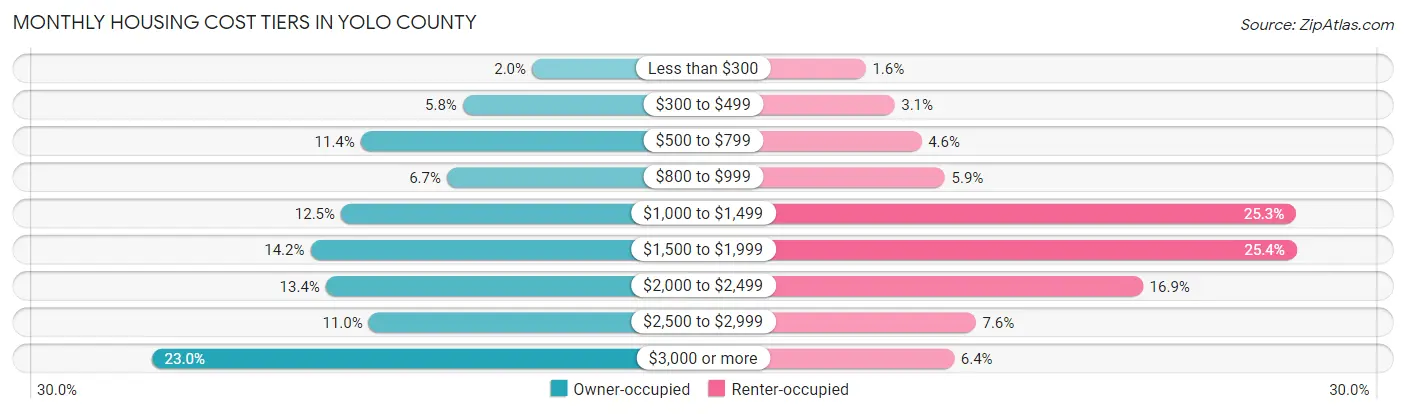
| Monthly Cost | Owner-occupied | Renter-occupied |
| Less than $300 | 786 (2.0%) | 565 (1.5%) |
| $300 to $499 | 2,302 (5.8%) | 1,142 (3.1%) |
| $500 to $799 | 4,543 (11.4%) | 1,686 (4.6%) |
| $800 to $999 | 2,654 (6.7%) | 2,156 (5.9%) |
| $1,000 to $1,499 | 4,974 (12.5%) | 9,219 (25.3%) |
| $1,500 to $1,999 | 5,647 (14.2%) | 9,228 (25.4%) |
| $2,000 to $2,499 | 5,309 (13.4%) | 6,137 (16.9%) |
| $2,500 to $2,999 | 4,370 (11.0%) | 2,778 (7.6%) |
| $3,000 or more | 9,127 (23.0%) | 2,339 (6.4%) |
| Total | 39,712 (100.0%) | 36,395 (100.0%) |
Physical Housing Characteristics in Yolo County
Housing Structures in Yolo County
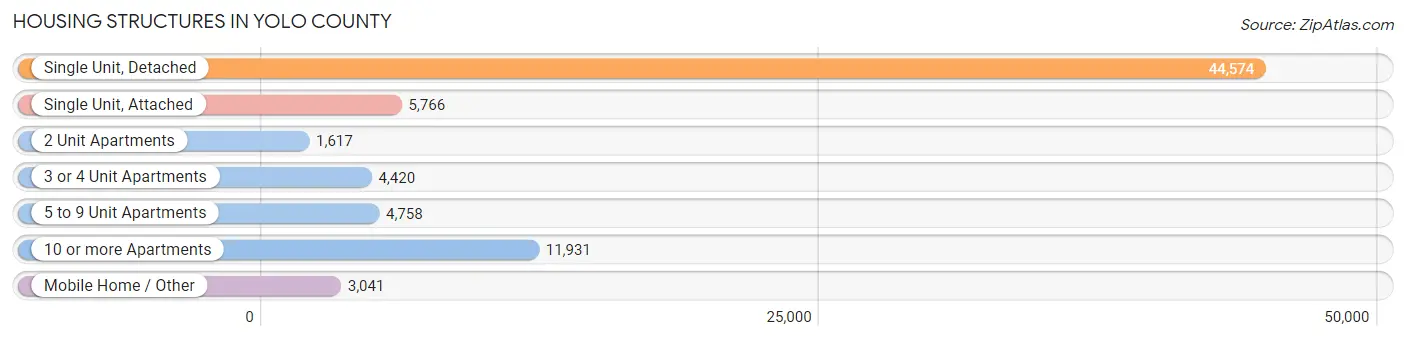
| Structure Type | # Housing Units | % Housing Units |
| Single Unit, Detached | 44,574 | 58.6% |
| Single Unit, Attached | 5,766 | 7.6% |
| 2 Unit Apartments | 1,617 | 2.1% |
| 3 or 4 Unit Apartments | 4,420 | 5.8% |
| 5 to 9 Unit Apartments | 4,758 | 6.2% |
| 10 or more Apartments | 11,931 | 15.7% |
| Mobile Home / Other | 3,041 | 4.0% |
| Total | 76,107 | 100.0% |
Housing Structures by Occupancy in Yolo County
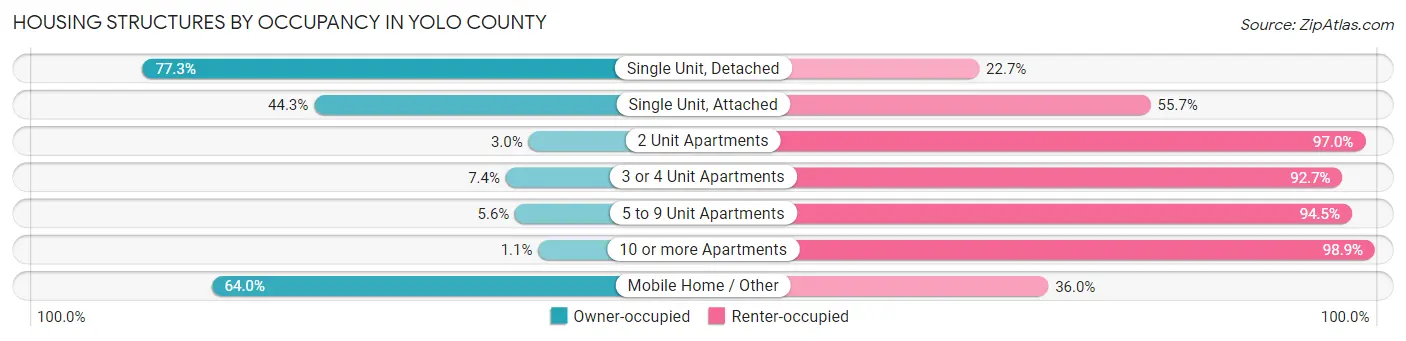
| Structure Type | Owner-occupied | Renter-occupied |
| Single Unit, Detached | 34,447 (77.3%) | 10,127 (22.7%) |
| Single Unit, Attached | 2,552 (44.3%) | 3,214 (55.7%) |
| 2 Unit Apartments | 48 (3.0%) | 1,569 (97.0%) |
| 3 or 4 Unit Apartments | 325 (7.3%) | 4,095 (92.6%) |
| 5 to 9 Unit Apartments | 264 (5.6%) | 4,494 (94.5%) |
| 10 or more Apartments | 130 (1.1%) | 11,801 (98.9%) |
| Mobile Home / Other | 1,946 (64.0%) | 1,095 (36.0%) |
| Total | 39,712 (52.2%) | 36,395 (47.8%) |
Housing Structures by Number of Rooms in Yolo County
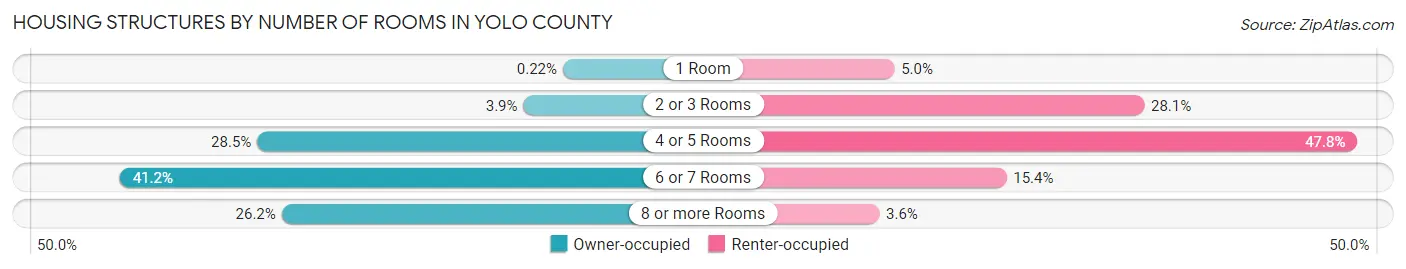
| Number of Rooms | Owner-occupied | Renter-occupied |
| 1 Room | 87 (0.2%) | 1,827 (5.0%) |
| 2 or 3 Rooms | 1,535 (3.9%) | 10,237 (28.1%) |
| 4 or 5 Rooms | 11,314 (28.5%) | 17,413 (47.8%) |
| 6 or 7 Rooms | 16,361 (41.2%) | 5,602 (15.4%) |
| 8 or more Rooms | 10,415 (26.2%) | 1,316 (3.6%) |
| Total | 39,712 (100.0%) | 36,395 (100.0%) |
Housing Structure by Heating Type in Yolo County
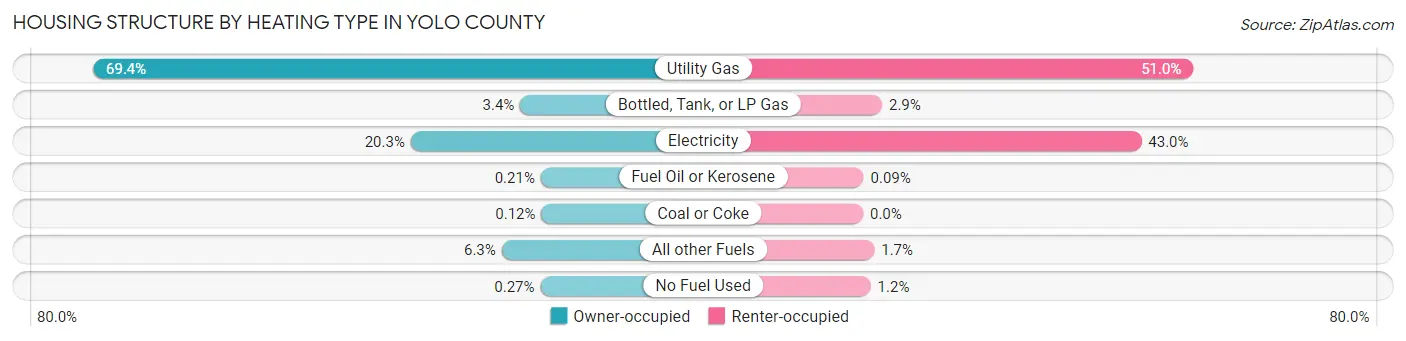
| Heating Type | Owner-occupied | Renter-occupied |
| Utility Gas | 27,575 (69.4%) | 18,572 (51.0%) |
| Bottled, Tank, or LP Gas | 1,346 (3.4%) | 1,071 (2.9%) |
| Electricity | 8,067 (20.3%) | 15,656 (43.0%) |
| Fuel Oil or Kerosene | 83 (0.2%) | 32 (0.1%) |
| Coal or Coke | 48 (0.1%) | 0 (0.0%) |
| All other Fuels | 2,484 (6.3%) | 635 (1.7%) |
| No Fuel Used | 109 (0.3%) | 429 (1.2%) |
| Total | 39,712 (100.0%) | 36,395 (100.0%) |
Household Vehicle Usage in Yolo County
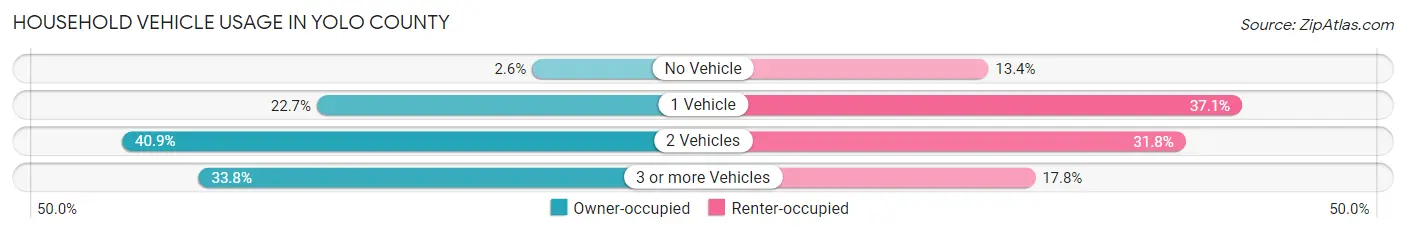
| Vehicles per Household | Owner-occupied | Renter-occupied |
| No Vehicle | 1,043 (2.6%) | 4,872 (13.4%) |
| 1 Vehicle | 9,021 (22.7%) | 13,487 (37.1%) |
| 2 Vehicles | 16,240 (40.9%) | 11,572 (31.8%) |
| 3 or more Vehicles | 13,408 (33.8%) | 6,464 (17.8%) |
| Total | 39,712 (100.0%) | 36,395 (100.0%) |
Real Estate & Mortgages in Yolo County
Real Estate and Mortgage Overview in Yolo County
| Characteristic | Without Mortgage | With Mortgage |
| Housing Units | 12,972 | 26,740 |
| Median Property Value | $521,100 | $567,500 |
| Median Household Income | $94,487 | $12,636 |
| Monthly Housing Costs | $734 | $9,082 |
| Real Estate Taxes | $3,441 | $408 |
Property Value by Mortgage Status in Yolo County
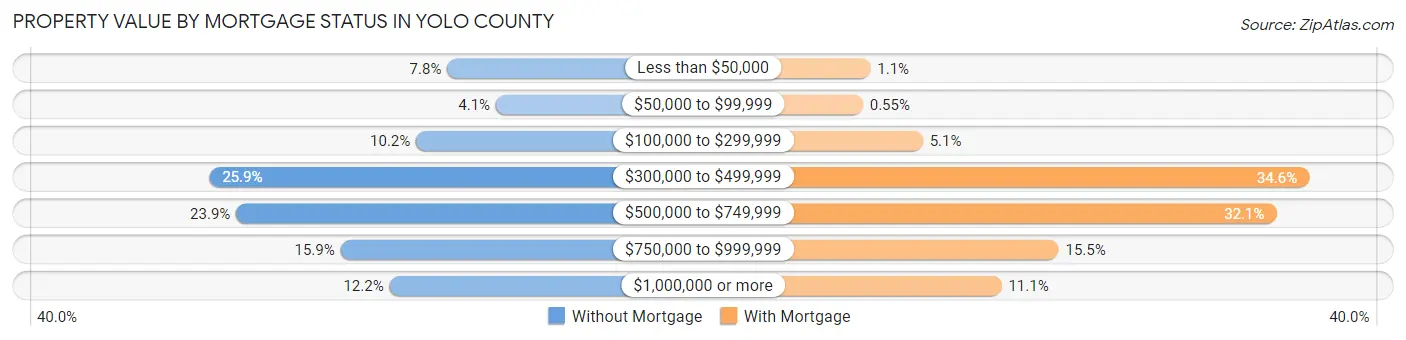
| Property Value | Without Mortgage | With Mortgage |
| Less than $50,000 | 1,012 (7.8%) | 301 (1.1%) |
| $50,000 to $99,999 | 530 (4.1%) | 147 (0.5%) |
| $100,000 to $299,999 | 1,319 (10.2%) | 1,368 (5.1%) |
| $300,000 to $499,999 | 3,363 (25.9%) | 9,238 (34.5%) |
| $500,000 to $749,999 | 3,098 (23.9%) | 8,574 (32.1%) |
| $750,000 to $999,999 | 2,067 (15.9%) | 4,138 (15.5%) |
| $1,000,000 or more | 1,583 (12.2%) | 2,974 (11.1%) |
| Total | 12,972 (100.0%) | 26,740 (100.0%) |
Household Income by Mortgage Status in Yolo County
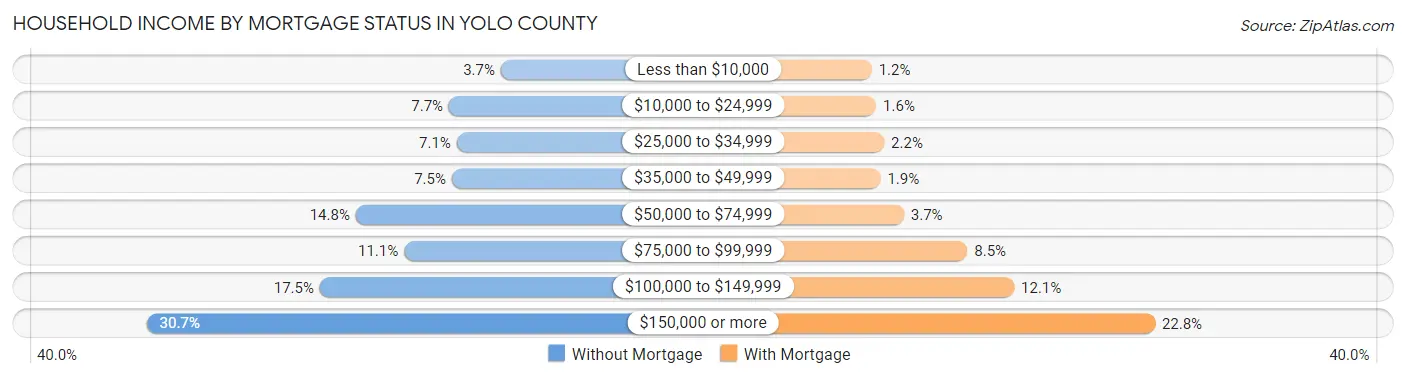
| Household Income | Without Mortgage | With Mortgage |
| Less than $10,000 | 483 (3.7%) | 329 (1.2%) |
| $10,000 to $24,999 | 995 (7.7%) | 421 (1.6%) |
| $25,000 to $34,999 | 919 (7.1%) | 584 (2.2%) |
| $35,000 to $49,999 | 967 (7.4%) | 508 (1.9%) |
| $50,000 to $74,999 | 1,916 (14.8%) | 984 (3.7%) |
| $75,000 to $99,999 | 1,438 (11.1%) | 2,277 (8.5%) |
| $100,000 to $149,999 | 2,271 (17.5%) | 3,231 (12.1%) |
| $150,000 or more | 3,983 (30.7%) | 6,099 (22.8%) |
| Total | 12,972 (100.0%) | 26,740 (100.0%) |
Property Value to Household Income Ratio in Yolo County
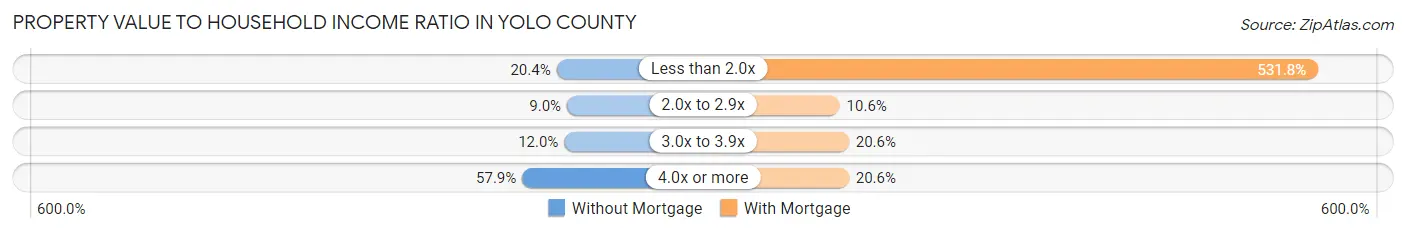
| Value-to-Income Ratio | Without Mortgage | With Mortgage |
| Less than 2.0x | 2,645 (20.4%) | 142,214 (531.8%) |
| 2.0x to 2.9x | 1,173 (9.0%) | 2,844 (10.6%) |
| 3.0x to 3.9x | 1,558 (12.0%) | 5,509 (20.6%) |
| 4.0x or more | 7,510 (57.9%) | 5,501 (20.6%) |
| Total | 12,972 (100.0%) | 26,740 (100.0%) |
Real Estate Taxes by Mortgage Status in Yolo County
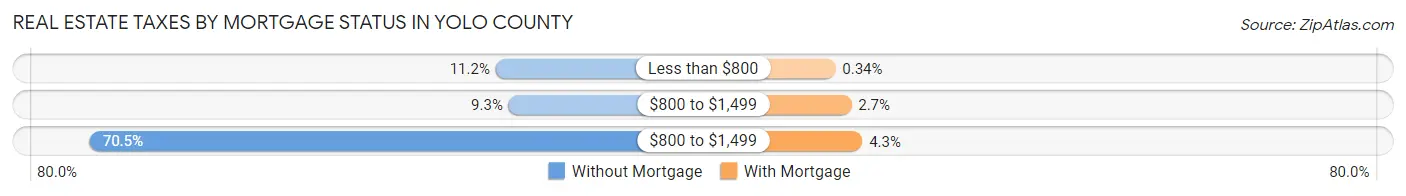
| Property Taxes | Without Mortgage | With Mortgage |
| Less than $800 | 1,448 (11.2%) | 91 (0.3%) |
| $800 to $1,499 | 1,201 (9.3%) | 711 (2.7%) |
| $800 to $1,499 | 9,141 (70.5%) | 1,139 (4.3%) |
| Total | 12,972 (100.0%) | 26,740 (100.0%) |
Health & Disability in Yolo County
Health Insurance Coverage by Age in Yolo County
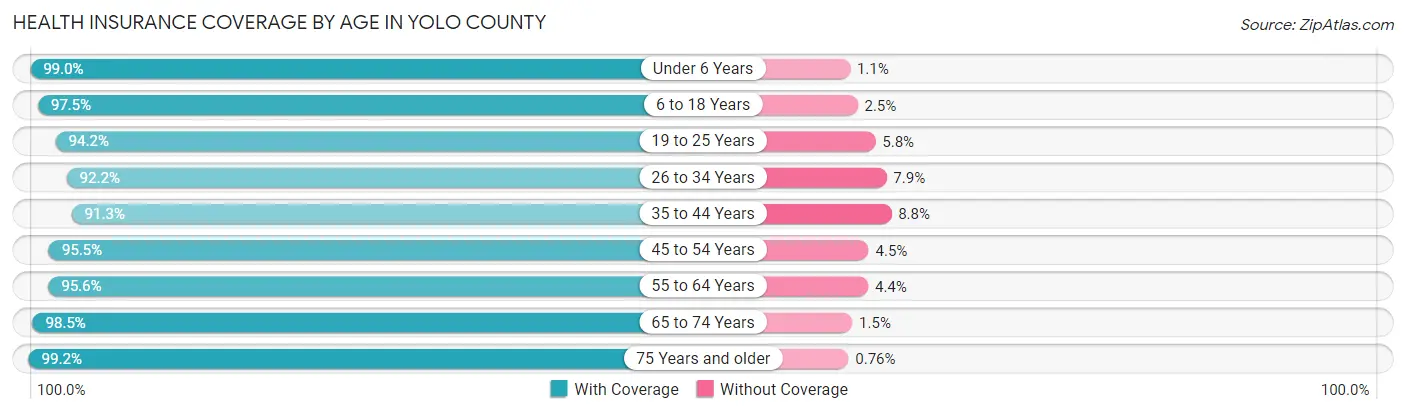
| Age Bracket | With Coverage | Without Coverage |
| Under 6 Years | 13,152 (99.0%) | 140 (1.1%) |
| 6 to 18 Years | 36,660 (97.5%) | 930 (2.5%) |
| 19 to 25 Years | 37,944 (94.2%) | 2,331 (5.8%) |
| 26 to 34 Years | 23,661 (92.1%) | 2,015 (7.9%) |
| 35 to 44 Years | 23,636 (91.2%) | 2,267 (8.7%) |
| 45 to 54 Years | 21,987 (95.5%) | 1,043 (4.5%) |
| 55 to 64 Years | 21,161 (95.6%) | 982 (4.4%) |
| 65 to 74 Years | 16,361 (98.5%) | 244 (1.5%) |
| 75 Years and older | 10,995 (99.2%) | 84 (0.8%) |
| Total | 205,557 (95.3%) | 10,036 (4.7%) |
Health Insurance Coverage by Citizenship Status in Yolo County
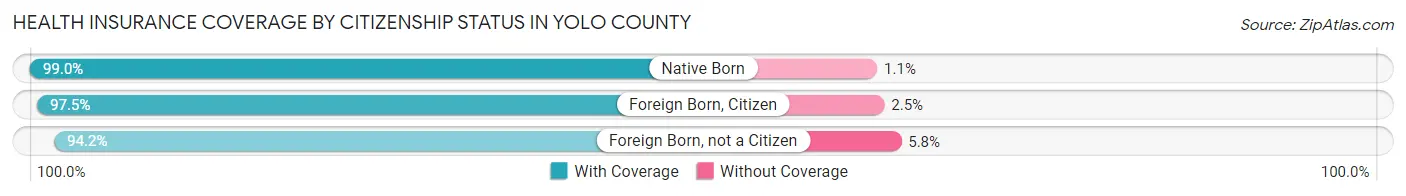
| Citizenship Status | With Coverage | Without Coverage |
| Native Born | 13,152 (99.0%) | 140 (1.1%) |
| Foreign Born, Citizen | 36,660 (97.5%) | 930 (2.5%) |
| Foreign Born, not a Citizen | 37,944 (94.2%) | 2,331 (5.8%) |
Health Insurance Coverage by Household Income in Yolo County
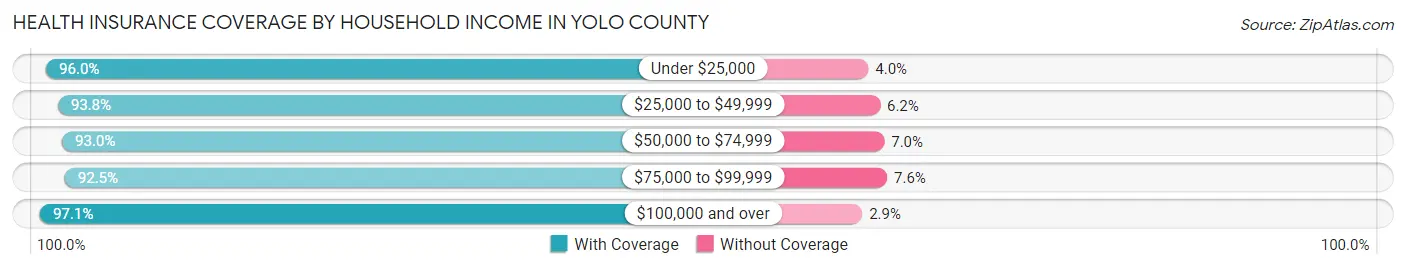
| Household Income | With Coverage | Without Coverage |
| Under $25,000 | 24,596 (96.0%) | 1,036 (4.0%) |
| $25,000 to $49,999 | 24,426 (93.8%) | 1,622 (6.2%) |
| $50,000 to $74,999 | 26,669 (93.0%) | 2,012 (7.0%) |
| $75,000 to $99,999 | 23,785 (92.4%) | 1,942 (7.5%) |
| $100,000 and over | 99,388 (97.1%) | 2,959 (2.9%) |
Public vs Private Health Insurance Coverage by Age in Yolo County
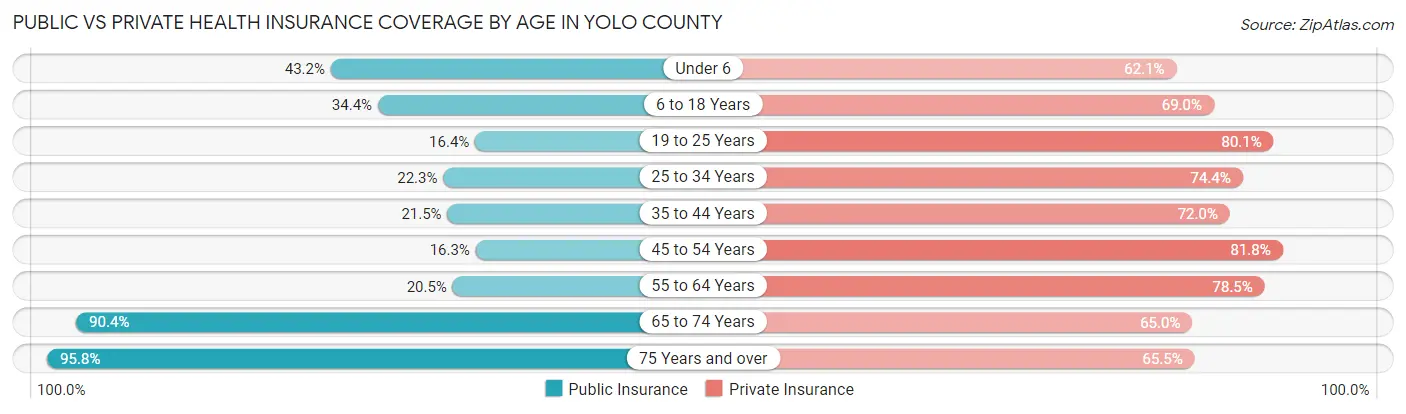
| Age Bracket | Public Insurance | Private Insurance |
| Under 6 | 5,737 (43.2%) | 8,254 (62.1%) |
| 6 to 18 Years | 12,939 (34.4%) | 25,951 (69.0%) |
| 19 to 25 Years | 6,595 (16.4%) | 32,272 (80.1%) |
| 25 to 34 Years | 5,720 (22.3%) | 19,104 (74.4%) |
| 35 to 44 Years | 5,573 (21.5%) | 18,650 (72.0%) |
| 45 to 54 Years | 3,748 (16.3%) | 18,840 (81.8%) |
| 55 to 64 Years | 4,549 (20.5%) | 17,378 (78.5%) |
| 65 to 74 Years | 15,014 (90.4%) | 10,800 (65.0%) |
| 75 Years and over | 10,618 (95.8%) | 7,254 (65.5%) |
| Total | 70,493 (32.7%) | 158,503 (73.5%) |
Disability Status by Sex by Age in Yolo County
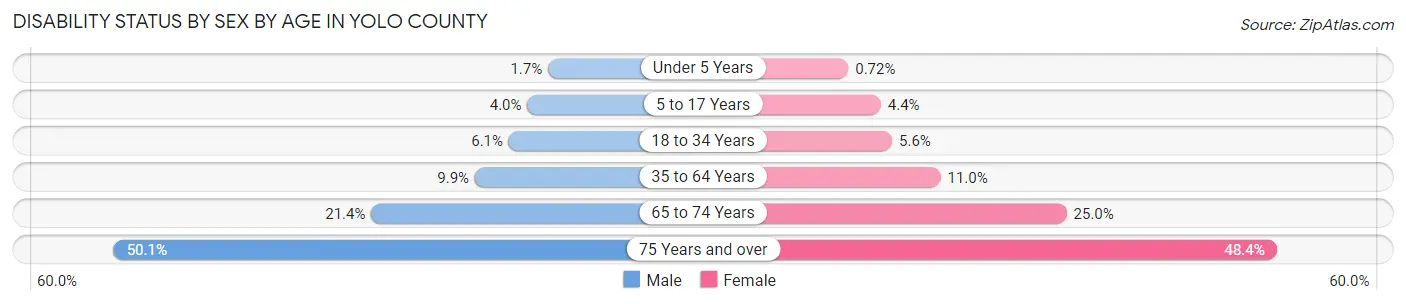
| Age Bracket | Male | Female |
| Under 5 Years | 96 (1.7%) | 39 (0.7%) |
| 5 to 17 Years | 680 (4.0%) | 716 (4.3%) |
| 18 to 34 Years | 2,122 (6.1%) | 2,092 (5.6%) |
| 35 to 64 Years | 3,458 (9.9%) | 3,957 (11.0%) |
| 65 to 74 Years | 1,639 (21.4%) | 2,238 (25.0%) |
| 75 Years and over | 2,283 (50.1%) | 3,156 (48.4%) |
Disability Class by Sex by Age in Yolo County
Disability Class: Hearing Difficulty
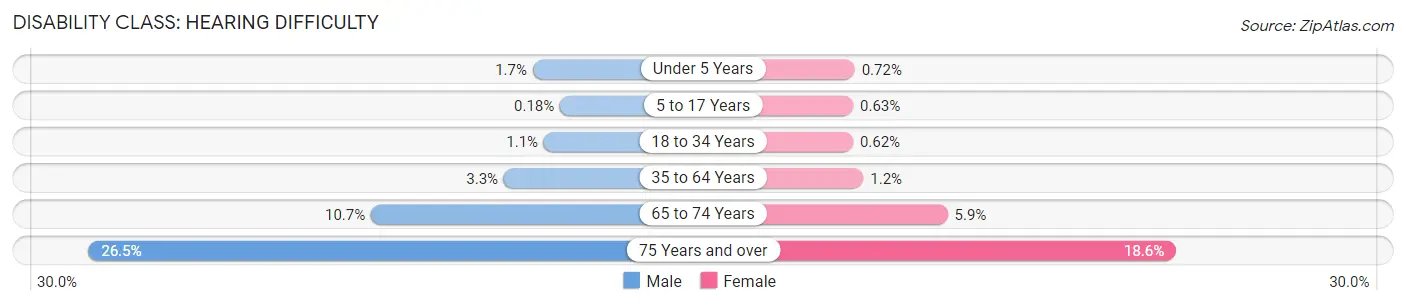
| Age Bracket | Male | Female |
| Under 5 Years | 96 (1.7%) | 39 (0.7%) |
| 5 to 17 Years | 30 (0.2%) | 103 (0.6%) |
| 18 to 34 Years | 379 (1.1%) | 230 (0.6%) |
| 35 to 64 Years | 1,160 (3.3%) | 433 (1.2%) |
| 65 to 74 Years | 821 (10.7%) | 527 (5.9%) |
| 75 Years and over | 1,206 (26.5%) | 1,213 (18.6%) |
Disability Class: Vision Difficulty
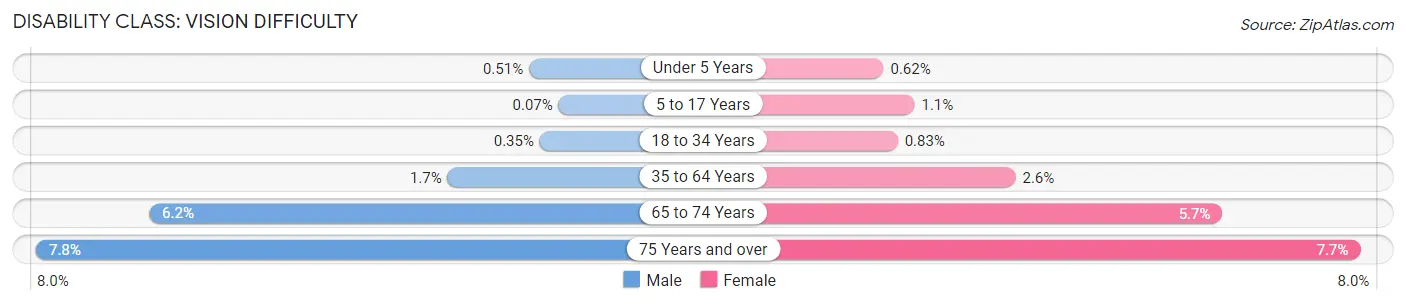
| Age Bracket | Male | Female |
| Under 5 Years | 29 (0.5%) | 34 (0.6%) |
| 5 to 17 Years | 12 (0.1%) | 177 (1.1%) |
| 18 to 34 Years | 123 (0.4%) | 310 (0.8%) |
| 35 to 64 Years | 605 (1.7%) | 928 (2.6%) |
| 65 to 74 Years | 471 (6.1%) | 505 (5.7%) |
| 75 Years and over | 357 (7.8%) | 502 (7.7%) |
Disability Class: Cognitive Difficulty
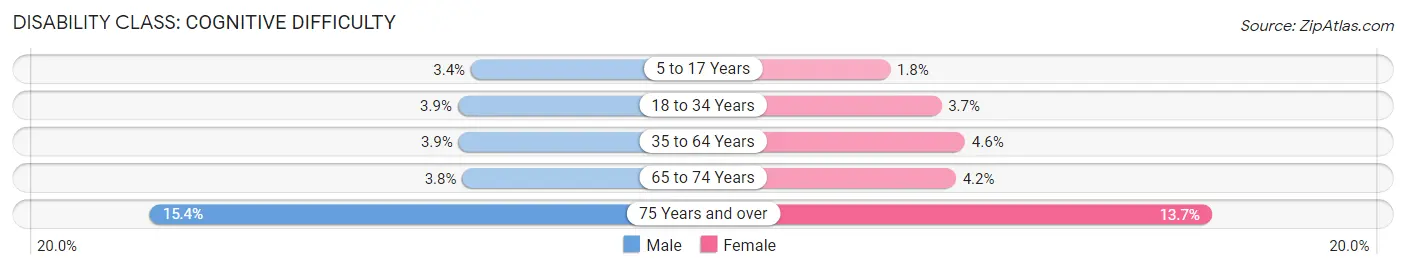
| Age Bracket | Male | Female |
| 5 to 17 Years | 583 (3.4%) | 294 (1.8%) |
| 18 to 34 Years | 1,369 (3.9%) | 1,379 (3.7%) |
| 35 to 64 Years | 1,364 (3.9%) | 1,643 (4.6%) |
| 65 to 74 Years | 287 (3.7%) | 378 (4.2%) |
| 75 Years and over | 700 (15.3%) | 895 (13.7%) |
Disability Class: Ambulatory Difficulty
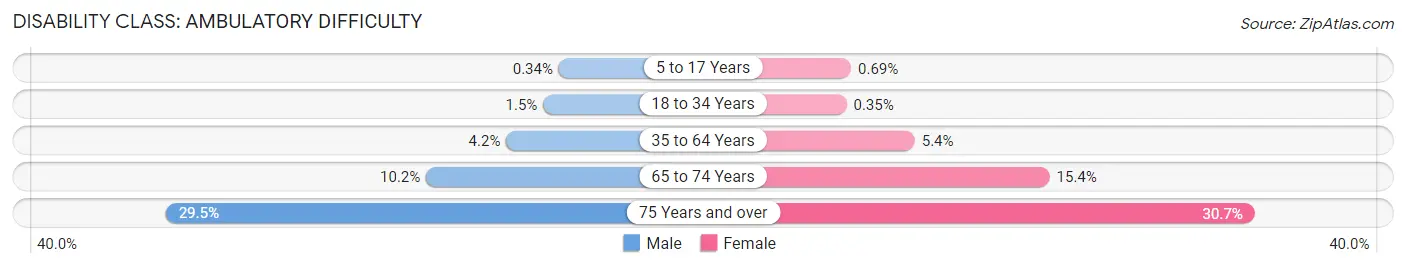
| Age Bracket | Male | Female |
| 5 to 17 Years | 57 (0.3%) | 113 (0.7%) |
| 18 to 34 Years | 523 (1.5%) | 129 (0.4%) |
| 35 to 64 Years | 1,488 (4.2%) | 1,949 (5.4%) |
| 65 to 74 Years | 781 (10.2%) | 1,380 (15.4%) |
| 75 Years and over | 1,346 (29.5%) | 1,998 (30.6%) |
Disability Class: Self-Care Difficulty
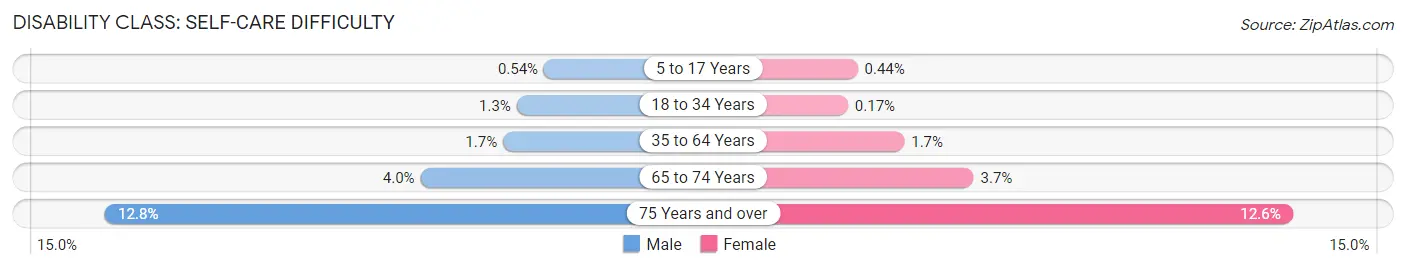
| Age Bracket | Male | Female |
| 5 to 17 Years | 92 (0.5%) | 73 (0.4%) |
| 18 to 34 Years | 453 (1.3%) | 64 (0.2%) |
| 35 to 64 Years | 589 (1.7%) | 627 (1.7%) |
| 65 to 74 Years | 305 (4.0%) | 328 (3.7%) |
| 75 Years and over | 582 (12.8%) | 818 (12.6%) |
Technology Access in Yolo County
Computing Device Access in Yolo County
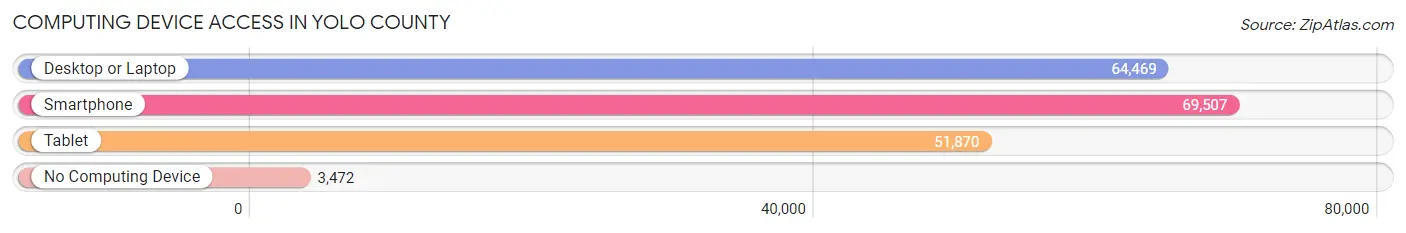
| Device Type | # Households | % Households |
| Desktop or Laptop | 64,469 | 84.7% |
| Smartphone | 69,507 | 91.3% |
| Tablet | 51,870 | 68.1% |
| No Computing Device | 3,472 | 4.6% |
| Total | 76,107 | 100.0% |
Internet Access in Yolo County
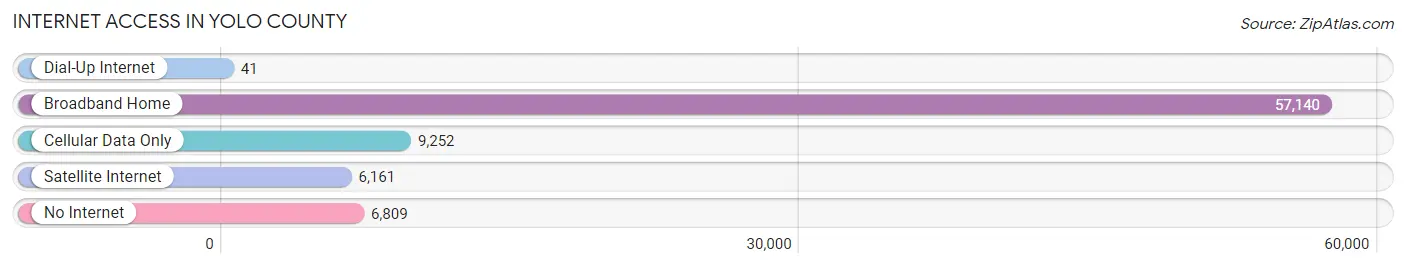
| Internet Type | # Households | % Households |
| Dial-Up Internet | 41 | 0.1% |
| Broadband Home | 57,140 | 75.1% |
| Cellular Data Only | 9,252 | 12.2% |
| Satellite Internet | 6,161 | 8.1% |
| No Internet | 6,809 | 8.9% |
| Total | 76,107 | 100.0% |
Yolo County Summary
Yolo County is located in the Central Valley of California, and is bordered by the Sacramento River to the north, the Sierra Nevada Mountains to the east, and the San Joaquin Valley to the south. It is part of the Greater Sacramento metropolitan area, and is home to a population of over 200,000 people.
History
Yolo County was established in 1850, and was named after the Native American tribe that lived in the area, the Yolos. The county was originally part of the larger Colusa County, but was split off in 1851. The county seat is Woodland, which was founded in 1853.
The county has a long history of agriculture, and was once known as the “Breadbasket of California” due to its abundance of wheat and other grains. The county is still home to a large agricultural industry, and is the leading producer of tomatoes, prunes, and walnuts in the state.
Geography
Yolo County covers an area of 1,024 square miles, and is located in the Central Valley of California. The county is bordered by the Sacramento River to the north, the Sierra Nevada Mountains to the east, and the San Joaquin Valley to the south. The county is home to several rivers, including the Sacramento, Putah, and Cache.
The county is divided into two distinct regions: the northern region is mostly flat and is home to the majority of the county’s population, while the southern region is more mountainous and is home to the Yolo County State Park.
Economy
Yolo County has a diverse economy, with agriculture, manufacturing, and technology being the main industries. The county is home to several large companies, including the J.R. Simplot Company, the world’s largest potato processor, and the Blue Diamond Growers, the world’s largest almond processor.
The county is also home to several universities and colleges, including the University of California, Davis, and Woodland Community College.
Demographics
As of the 2010 census, Yolo County had a population of 200,878 people. The racial makeup of the county was 68.2% White, 8.2% African American, 0.7% Native American, 11.3% Asian, 0.3% Pacific Islander, and 8.2% from other races. Hispanic or Latino of any race made up 24.3% of the population.
The median household income in Yolo County was $60,845, and the median family income was $71,845. The per capita income was $27,845. About 11.2% of the population was below the poverty line.
Yolo County is a diverse and vibrant county with a rich history and a bright future. It is home to a variety of industries, and is a great place to live, work, and play.
Common Questions
What is Per Capita Income in Yolo County?
Per Capita income in Yolo County is $41,703.
What is the Median Family Income in Yolo County?
Median Family Income in Yolo County is $111,069.
What is the Median Household income in Yolo County?
Median Household Income in Yolo County is $85,097.
What is Income or Wage Gap in Yolo County?
Income or Wage Gap in Yolo County is 27.8%.
Women in Yolo County earn 72.2 cents for every dollar earned by a man.
What is Family Income Deficit in Yolo County?
Family Income Deficit in Yolo County is $11,090.
Families that are below poverty line in Yolo County earn $11,090 less on average than the poverty threshold level.
What is Inequality or Gini Index in Yolo County?
Inequality or Gini Index in Yolo County is 0.49.
What is the Total Population of Yolo County?
Total Population of Yolo County is 217,141.
What is the Total Male Population of Yolo County?
Total Male Population of Yolo County is 105,912.
What is the Total Female Population of Yolo County?
Total Female Population of Yolo County is 111,229.
What is the Ratio of Males per 100 Females in Yolo County?
There are 95.22 Males per 100 Females in Yolo County.
What is the Ratio of Females per 100 Males in Yolo County?
There are 105.02 Females per 100 Males in Yolo County.
What is the Median Population Age in Yolo County?
Median Population Age in Yolo County is 32.0 Years.
What is the Average Family Size in Yolo County
Average Family Size in Yolo County is 3.2 People.
What is the Average Household Size in Yolo County
Average Household Size in Yolo County is 2.7 People.
How Large is the Labor Force in Yolo County?
There are 108,830 People in the Labor Forcein in Yolo County.
What is the Percentage of People in the Labor Force in Yolo County?
61.3% of People are in the Labor Force in Yolo County.
What is the Unemployment Rate in Yolo County?
Unemployment Rate in Yolo County is 5.3%.