Tulare County, CA Map & Demographics
Tulare County Map
Tulare County Overview
$26,282
PER CAPITA INCOME
$67,525
AVG FAMILY INCOME
$64,474
AVG HOUSEHOLD INCOME
26.0%
WAGE / INCOME GAP [ % ]
74.0¢/ $1
WAGE / INCOME GAP [ $ ]
$12,091
FAMILY INCOME DEFICIT
0.45
INEQUALITY / GINI INDEX
473,446
TOTAL POPULATION
238,140
MALE POPULATION
235,306
FEMALE POPULATION
101.20
MALES / 100 FEMALES
98.81
FEMALES / 100 MALES
31.5
MEDIAN AGE
3.8
AVG FAMILY SIZE
3.3
AVG HOUSEHOLD SIZE
210,434
LABOR FORCE [ PEOPLE ]
60.7%
PERCENT IN LABOR FORCE
9.0%
UNEMPLOYMENT RATE
Income in Tulare County
Income Overview in Tulare County
Per Capita Income in Tulare County is $26,282, while median incomes of families and households are $67,525 and $64,474 respectively.
| Characteristic | Number | Measure |
| Per Capita Income | 473,446 | $26,282 |
| Median Family Income | 110,113 | $67,525 |
| Mean Family Income | 110,113 | $90,421 |
| Median Household Income | 140,670 | $64,474 |
| Mean Household Income | 140,670 | $85,832 |
| Income Deficit | 110,113 | $12,091 |
| Wage / Income Gap (%) | 473,446 | 26.04% |
| Wage / Income Gap ($) | 473,446 | 73.96¢ per $1 |
| Gini / Inequality Index | 473,446 | 0.45 |
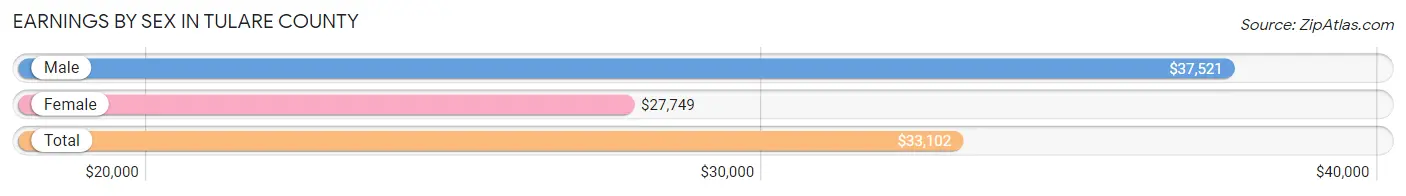
Earnings by Sex in Tulare County
Average Earnings in Tulare County are $33,102, $37,521 for men and $27,749 for women, a difference of 26.0%.
| Sex | Number | Average Earnings |
| Male | 119,072 (55.8%) | $37,521 |
| Female | 94,203 (44.2%) | $27,749 |
| Total | 213,275 (100.0%) | $33,102 |
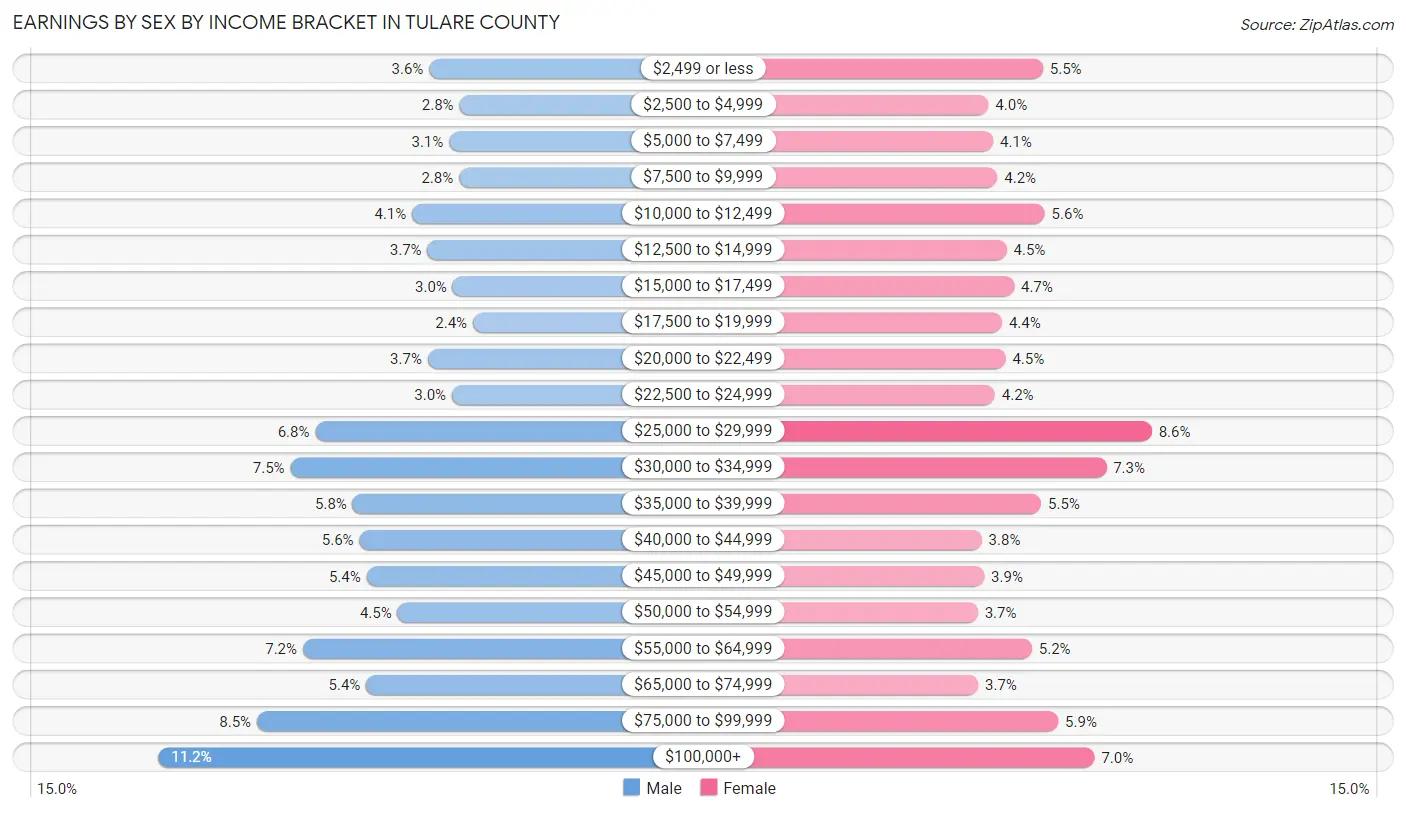
Earnings by Sex by Income Bracket in Tulare County
The most common earnings brackets in Tulare County are $100,000+ for men (13,381 | 11.2%) and $25,000 to $29,999 for women (8,075 | 8.6%).
| Income | Male | Female |
| $2,499 or less | 4,317 (3.6%) | 5,189 (5.5%) |
| $2,500 to $4,999 | 3,316 (2.8%) | 3,753 (4.0%) |
| $5,000 to $7,499 | 3,653 (3.1%) | 3,869 (4.1%) |
| $7,500 to $9,999 | 3,325 (2.8%) | 3,984 (4.2%) |
| $10,000 to $12,499 | 4,889 (4.1%) | 5,236 (5.6%) |
| $12,500 to $14,999 | 4,380 (3.7%) | 4,232 (4.5%) |
| $15,000 to $17,499 | 3,533 (3.0%) | 4,428 (4.7%) |
| $17,500 to $19,999 | 2,853 (2.4%) | 4,111 (4.4%) |
| $20,000 to $22,499 | 4,365 (3.7%) | 4,202 (4.5%) |
| $22,500 to $24,999 | 3,566 (3.0%) | 3,915 (4.2%) |
| $25,000 to $29,999 | 8,131 (6.8%) | 8,075 (8.6%) |
| $30,000 to $34,999 | 8,970 (7.5%) | 6,865 (7.3%) |
| $35,000 to $39,999 | 6,880 (5.8%) | 5,144 (5.5%) |
| $40,000 to $44,999 | 6,656 (5.6%) | 3,567 (3.8%) |
| $45,000 to $49,999 | 6,417 (5.4%) | 3,636 (3.9%) |
| $50,000 to $54,999 | 5,381 (4.5%) | 3,468 (3.7%) |
| $55,000 to $64,999 | 8,548 (7.2%) | 4,900 (5.2%) |
| $65,000 to $74,999 | 6,428 (5.4%) | 3,477 (3.7%) |
| $75,000 to $99,999 | 10,083 (8.5%) | 5,593 (5.9%) |
| $100,000+ | 13,381 (11.2%) | 6,559 (7.0%) |
| Total | 119,072 (100.0%) | 94,203 (100.0%) |
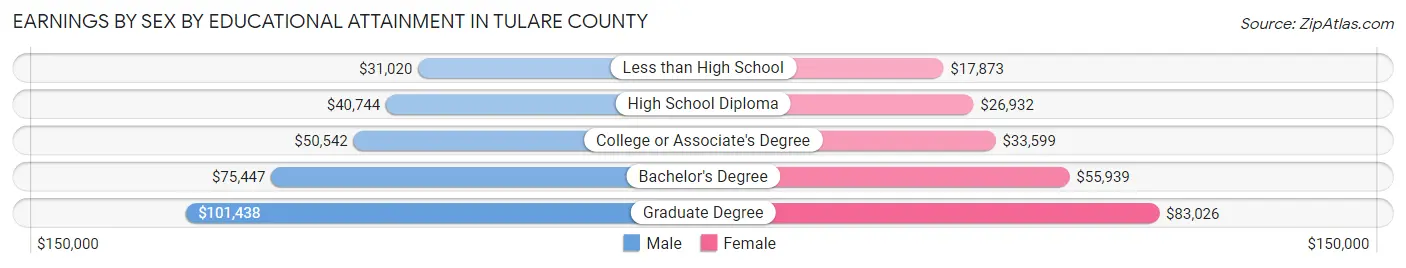
Earnings by Sex by Educational Attainment in Tulare County
Average earnings in Tulare County are $43,251 for men and $31,438 for women, a difference of 27.3%. Men with an educational attainment of graduate degree enjoy the highest average annual earnings of $101,438, while those with less than high school education earn the least with $31,020. Women with an educational attainment of graduate degree earn the most with the average annual earnings of $83,026, while those with less than high school education have the smallest earnings of $17,873.
| Educational Attainment | Male Income | Female Income |
| Less than High School | $31,020 | $17,873 |
| High School Diploma | $40,744 | $26,932 |
| College or Associate's Degree | $50,542 | $33,599 |
| Bachelor's Degree | $75,447 | $55,939 |
| Graduate Degree | $101,438 | $83,026 |
| Total | $43,251 | $31,438 |
Family Income in Tulare County
Family Income Brackets in Tulare County
According to the Tulare County family income data, there are 21,142 families falling into the $50,000 to $74,999 income range, which is the most common income bracket and makes up 19.2% of all families. Conversely, the $10,000 to $14,999 income bracket is the least frequent group with only 3,083 families (2.8%) belonging to this category.
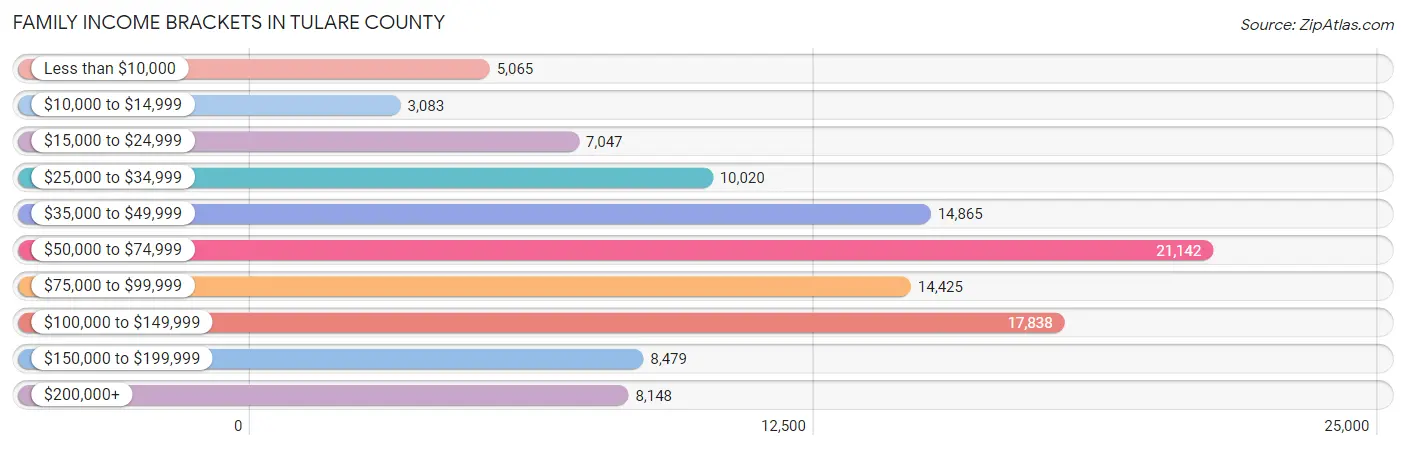
| Income Bracket | # Families | % Families |
| Less than $10,000 | 5,065 | 4.6% |
| $10,000 to $14,999 | 3,083 | 2.8% |
| $15,000 to $24,999 | 7,047 | 6.4% |
| $25,000 to $34,999 | 10,020 | 9.1% |
| $35,000 to $49,999 | 14,865 | 13.5% |
| $50,000 to $74,999 | 21,142 | 19.2% |
| $75,000 to $99,999 | 14,425 | 13.1% |
| $100,000 to $149,999 | 17,838 | 16.2% |
| $150,000 to $199,999 | 8,479 | 7.7% |
| $200,000+ | 8,148 | 7.4% |
Family Income by Famaliy Size in Tulare County
7+ person families (4,494 | 4.1%) account for the highest median family income in Tulare County with $101,302 per family, while 2-person families (36,345 | 33.0%) have the highest median income of $30,308 per family member.
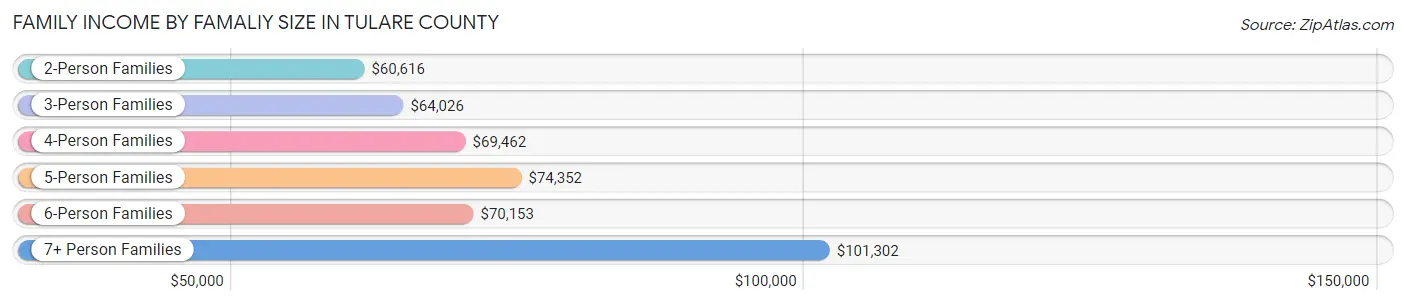
| Income Bracket | # Families | Median Income |
| 2-Person Families | 36,345 (33.0%) | $60,616 |
| 3-Person Families | 24,004 (21.8%) | $64,026 |
| 4-Person Families | 21,893 (19.9%) | $69,462 |
| 5-Person Families | 15,366 (14.0%) | $74,352 |
| 6-Person Families | 8,011 (7.3%) | $70,153 |
| 7+ Person Families | 4,494 (4.1%) | $101,302 |
| Total | 110,113 (100.0%) | $67,525 |
Family Income by Number of Earners in Tulare County
The median family income in Tulare County is $67,525, with families comprising 3+ earners (15,548) having the highest median family income of $113,070, while families with no earners (13,723) have the lowest median family income of $32,776, accounting for 14.1% and 12.5% of families, respectively.
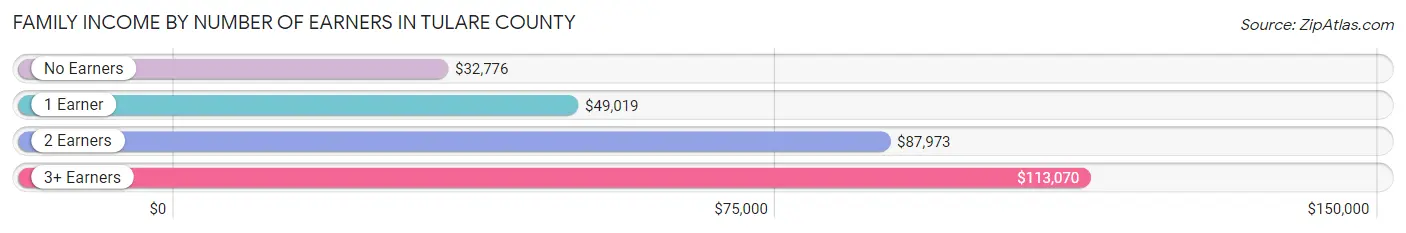
| Number of Earners | # Families | Median Income |
| No Earners | 13,723 (12.5%) | $32,776 |
| 1 Earner | 42,220 (38.3%) | $49,019 |
| 2 Earners | 38,622 (35.1%) | $87,973 |
| 3+ Earners | 15,548 (14.1%) | $113,070 |
| Total | 110,113 (100.0%) | $67,525 |
Household Income in Tulare County
Household Income Brackets in Tulare County
With 26,165 households falling in the category, the $50,000 to $74,999 income range is the most frequent in Tulare County, accounting for 18.6% of all households. In contrast, only 5,486 households (3.9%) fall into the $10,000 to $14,999 income bracket, making it the least populous group.
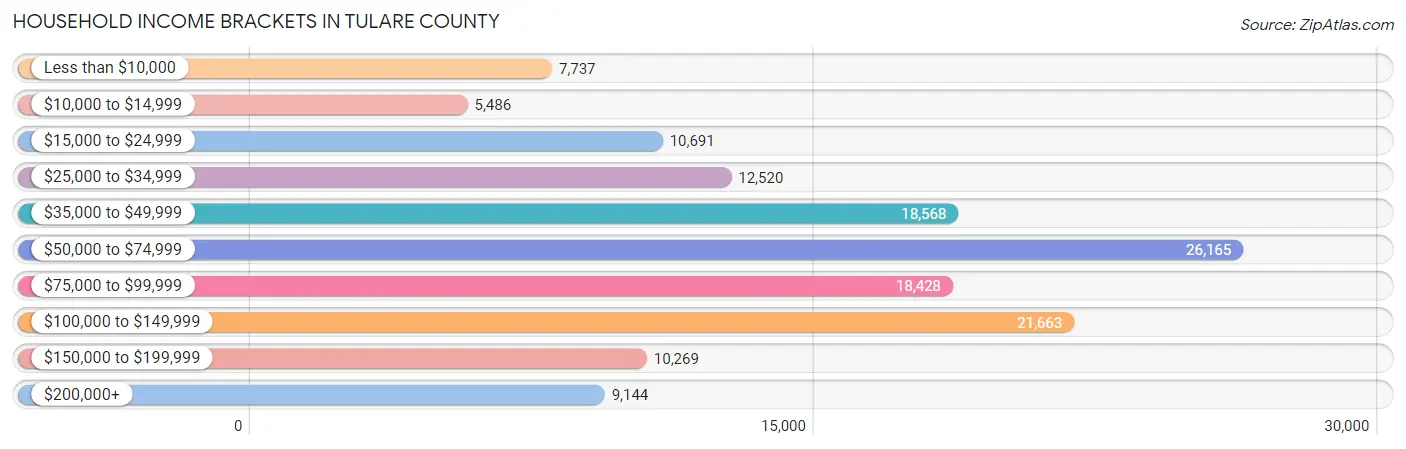
| Income Bracket | # Households | % Households |
| Less than $10,000 | 7,737 | 5.5% |
| $10,000 to $14,999 | 5,486 | 3.9% |
| $15,000 to $24,999 | 10,691 | 7.6% |
| $25,000 to $34,999 | 12,520 | 8.9% |
| $35,000 to $49,999 | 18,568 | 13.2% |
| $50,000 to $74,999 | 26,165 | 18.6% |
| $75,000 to $99,999 | 18,428 | 13.1% |
| $100,000 to $149,999 | 21,663 | 15.4% |
| $150,000 to $199,999 | 10,269 | 7.3% |
| $200,000+ | 9,144 | 6.5% |
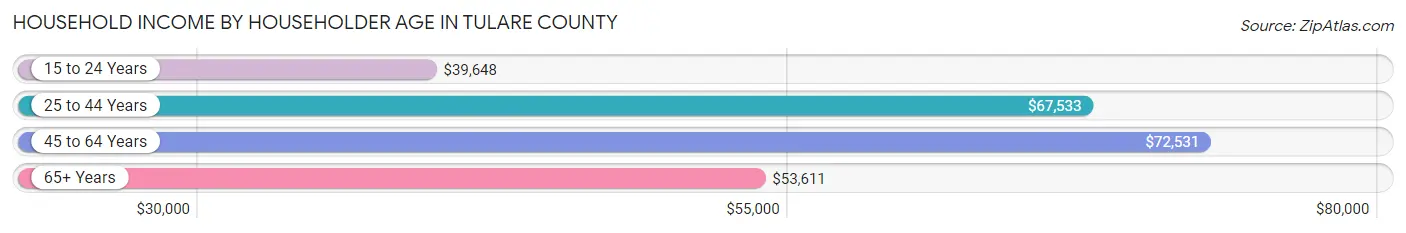
Household Income by Householder Age in Tulare County
The median household income in Tulare County is $64,474, with the highest median household income of $72,531 found in the 45 to 64 years age bracket for the primary householder. A total of 50,785 households (36.1%) fall into this category. Meanwhile, the 15 to 24 years age bracket for the primary householder has the lowest median household income of $39,648, with 5,408 households (3.8%) in this group.
| Income Bracket | # Households | Median Income |
| 15 to 24 Years | 5,408 (3.8%) | $39,648 |
| 25 to 44 Years | 53,978 (38.4%) | $67,533 |
| 45 to 64 Years | 50,785 (36.1%) | $72,531 |
| 65+ Years | 30,499 (21.7%) | $53,611 |
| Total | 140,670 (100.0%) | $64,474 |
Poverty in Tulare County
Income Below Poverty by Sex and Age in Tulare County
With 17.1% poverty level for males and 19.9% for females among the residents of Tulare County, under 5 year old males and under 5 year old females are the most vulnerable to poverty, with 4,800 males (27.3%) and 4,465 females (26.3%) in their respective age groups living below the poverty level.
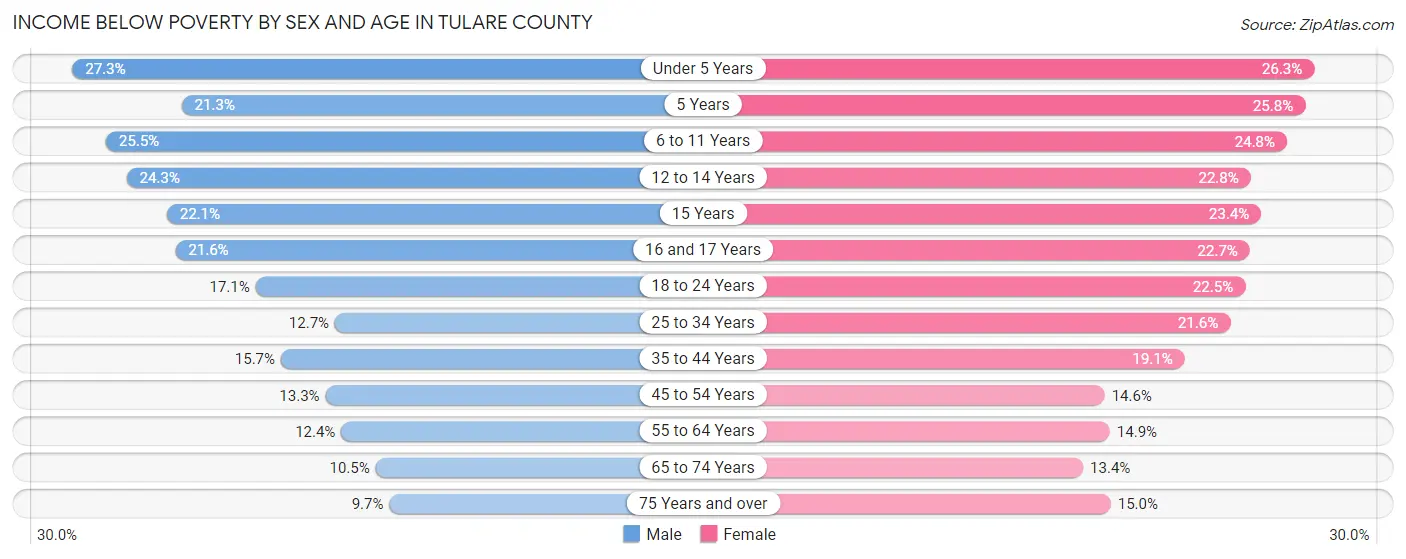
| Age Bracket | Male | Female |
| Under 5 Years | 4,800 (27.3%) | 4,465 (26.3%) |
| 5 Years | 898 (21.3%) | 933 (25.8%) |
| 6 to 11 Years | 6,369 (25.5%) | 5,945 (24.8%) |
| 12 to 14 Years | 3,099 (24.3%) | 2,790 (22.8%) |
| 15 Years | 918 (22.1%) | 1,007 (23.4%) |
| 16 and 17 Years | 1,824 (21.6%) | 1,752 (22.7%) |
| 18 to 24 Years | 4,254 (17.1%) | 5,465 (22.5%) |
| 25 to 34 Years | 4,226 (12.7%) | 7,015 (21.6%) |
| 35 to 44 Years | 4,837 (15.7%) | 5,735 (19.1%) |
| 45 to 54 Years | 3,477 (13.3%) | 3,716 (14.6%) |
| 55 to 64 Years | 2,845 (12.4%) | 3,499 (14.9%) |
| 65 to 74 Years | 1,605 (10.5%) | 2,275 (13.4%) |
| 75 Years and over | 855 (9.7%) | 1,787 (15.0%) |
| Total | 40,007 (17.1%) | 46,384 (19.9%) |
Income Above Poverty by Sex and Age in Tulare County
According to the poverty statistics in Tulare County, males aged 75 years and over and females aged 65 to 74 years are the age groups that are most secure financially, with 90.3% of males and 86.6% of females in these age groups living above the poverty line.
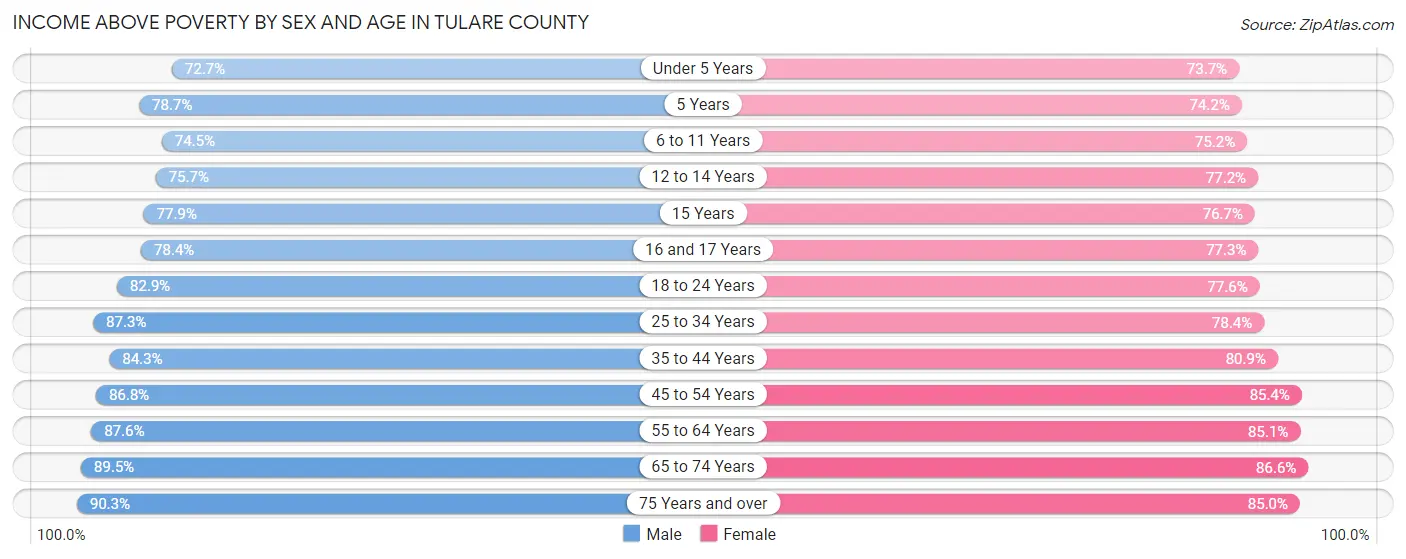
| Age Bracket | Male | Female |
| Under 5 Years | 12,756 (72.7%) | 12,511 (73.7%) |
| 5 Years | 3,325 (78.7%) | 2,685 (74.2%) |
| 6 to 11 Years | 18,635 (74.5%) | 18,049 (75.2%) |
| 12 to 14 Years | 9,646 (75.7%) | 9,467 (77.2%) |
| 15 Years | 3,239 (77.9%) | 3,306 (76.6%) |
| 16 and 17 Years | 6,622 (78.4%) | 5,961 (77.3%) |
| 18 to 24 Years | 20,561 (82.9%) | 18,881 (77.5%) |
| 25 to 34 Years | 29,010 (87.3%) | 25,439 (78.4%) |
| 35 to 44 Years | 25,908 (84.3%) | 24,306 (80.9%) |
| 45 to 54 Years | 22,768 (86.8%) | 21,668 (85.4%) |
| 55 to 64 Years | 20,153 (87.6%) | 19,934 (85.1%) |
| 65 to 74 Years | 13,736 (89.5%) | 14,646 (86.6%) |
| 75 Years and over | 7,971 (90.3%) | 10,145 (85.0%) |
| Total | 194,330 (82.9%) | 186,998 (80.1%) |
Income Below Poverty Among Married-Couple Families in Tulare County
The poverty statistics for married-couple families in Tulare County show that 10.5% or 7,681 of the total 72,778 families live below the poverty line. Families with 5 or more children have the highest poverty rate of 31.1%, comprising of 408 families. On the other hand, families with no children have the lowest poverty rate of 5.8%, which includes 1,963 families.
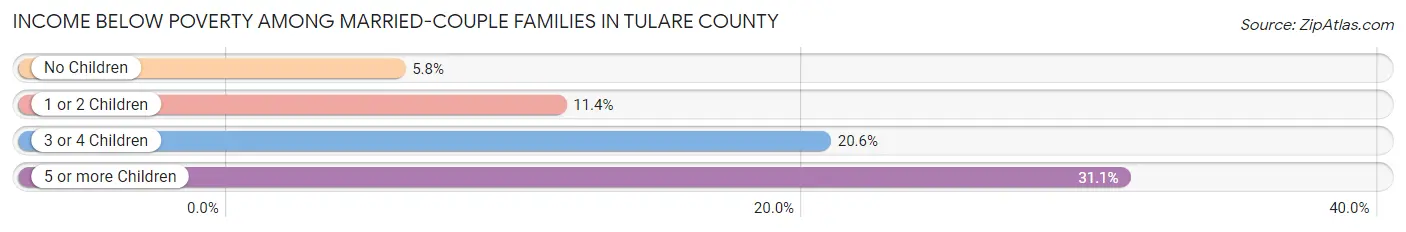
| Children | Above Poverty | Below Poverty |
| No Children | 31,746 (94.2%) | 1,963 (5.8%) |
| 1 or 2 Children | 23,869 (88.6%) | 3,079 (11.4%) |
| 3 or 4 Children | 8,577 (79.4%) | 2,231 (20.6%) |
| 5 or more Children | 905 (68.9%) | 408 (31.1%) |
| Total | 65,097 (89.4%) | 7,681 (10.5%) |
Income Below Poverty Among Single-Parent Households in Tulare County
According to the poverty data in Tulare County, 13.7% or 1,718 single-father households and 28.7% or 7,106 single-mother households are living below the poverty line. Among single-father households, those with 3 or 4 children have the highest poverty rate, with 520 households (26.5%) experiencing poverty. Likewise, among single-mother households, those with 3 or 4 children have the highest poverty rate, with 2,545 households (58.2%) falling below the poverty line.
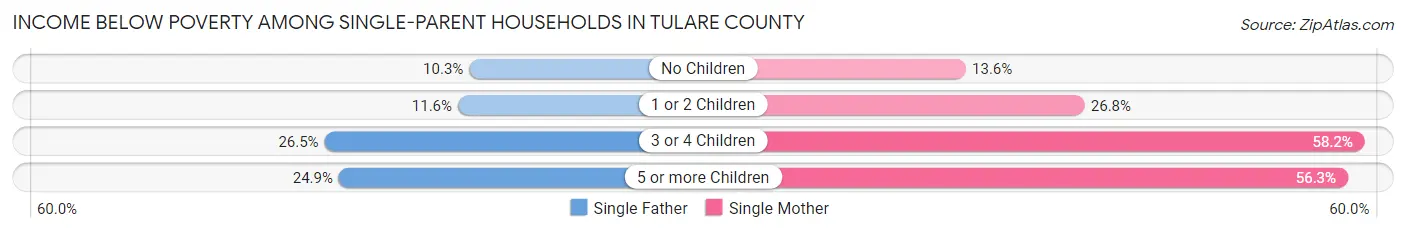
| Children | Single Father | Single Mother |
| No Children | 476 (10.3%) | 1,106 (13.6%) |
| 1 or 2 Children | 665 (11.6%) | 3,144 (26.8%) |
| 3 or 4 Children | 520 (26.5%) | 2,545 (58.2%) |
| 5 or more Children | 57 (24.9%) | 311 (56.3%) |
| Total | 1,718 (13.7%) | 7,106 (28.7%) |
Income Below Poverty Among Married-Couple vs Single-Parent Households in Tulare County
The poverty data for Tulare County shows that 7,681 of the married-couple family households (10.5%) and 8,824 of the single-parent households (23.6%) are living below the poverty level. Within the married-couple family households, those with 5 or more children have the highest poverty rate, with 408 households (31.1%) falling below the poverty line. Among the single-parent households, those with 3 or 4 children have the highest poverty rate, with 3,065 household (48.4%) living below poverty.
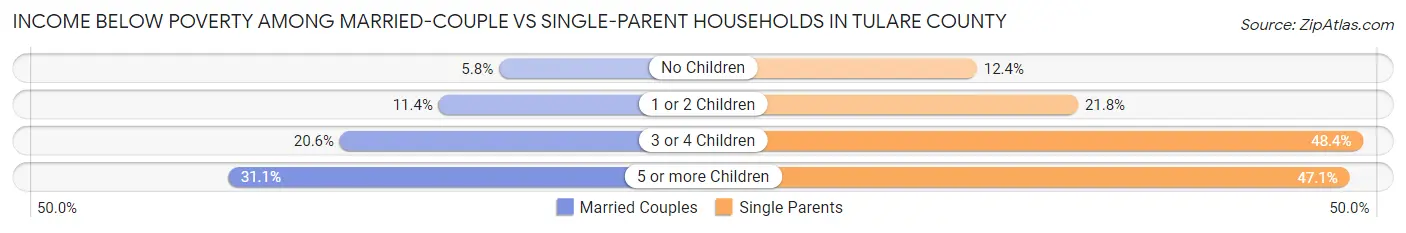
| Children | Married-Couple Families | Single-Parent Households |
| No Children | 1,963 (5.8%) | 1,582 (12.4%) |
| 1 or 2 Children | 3,079 (11.4%) | 3,809 (21.8%) |
| 3 or 4 Children | 2,231 (20.6%) | 3,065 (48.4%) |
| 5 or more Children | 408 (31.1%) | 368 (47.1%) |
| Total | 7,681 (10.5%) | 8,824 (23.6%) |
Race in Tulare County
The most populous races in Tulare County are Hispanic or Latino (312,954 | 66.1%), White / Caucasian (240,811 | 50.9%), and Some other Race (117,855 | 24.9%).
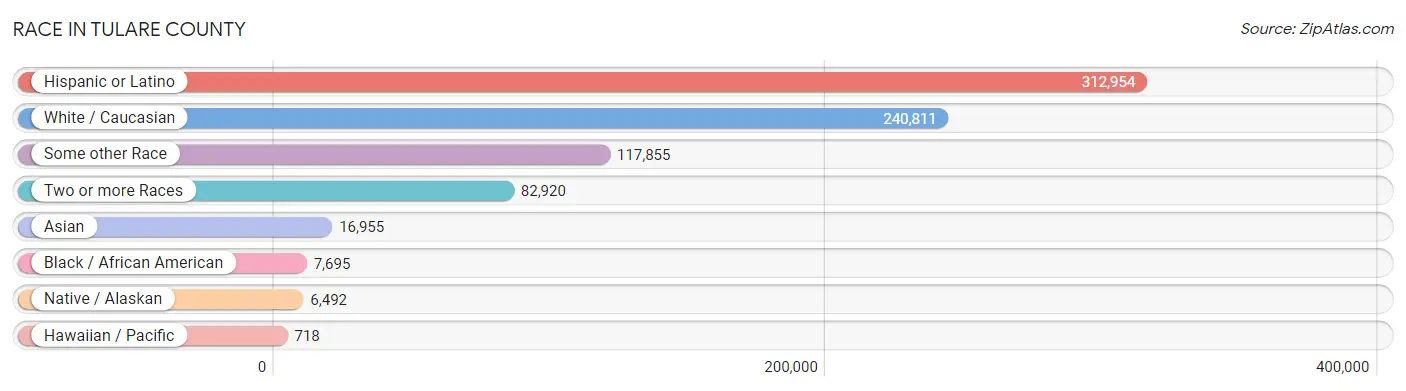
| Race | # Population | % Population |
| Asian | 16,955 | 3.6% |
| Black / African American | 7,695 | 1.6% |
| Hawaiian / Pacific | 718 | 0.2% |
| Hispanic or Latino | 312,954 | 66.1% |
| Native / Alaskan | 6,492 | 1.4% |
| White / Caucasian | 240,811 | 50.9% |
| Two or more Races | 82,920 | 17.5% |
| Some other Race | 117,855 | 24.9% |
| Total | 473,446 | 100.0% |
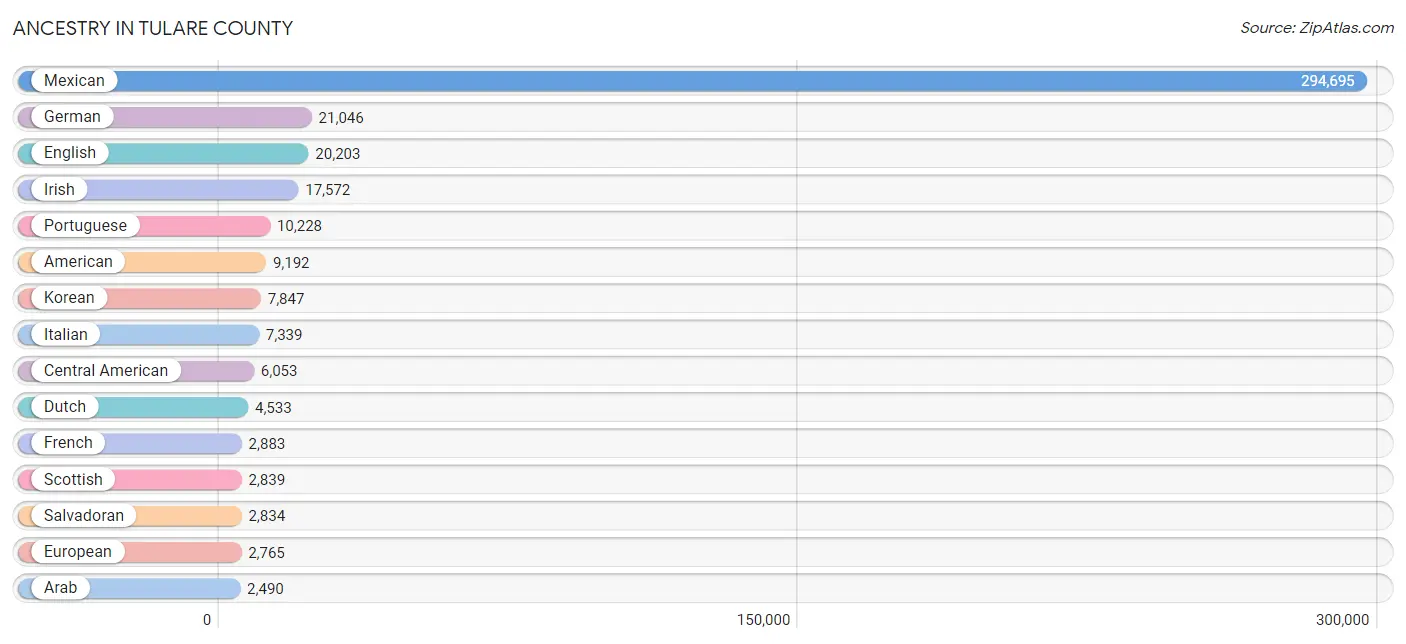
Ancestry in Tulare County
The most populous ancestries reported in Tulare County are Mexican (294,695 | 62.2%), German (21,046 | 4.4%), English (20,203 | 4.3%), Irish (17,572 | 3.7%), and Portuguese (10,228 | 2.2%), together accounting for 76.8% of all Tulare County residents.
| Ancestry | # Population | % Population |
| African | 372 | 0.1% |
| Alsatian | 5 | 0.0% |
| American | 9,192 | 1.9% |
| Apache | 1,253 | 0.3% |
| Arab | 2,490 | 0.5% |
| Arapaho | 89 | 0.0% |
| Argentinean | 259 | 0.1% |
| Armenian | 442 | 0.1% |
| Australian | 39 | 0.0% |
| Austrian | 147 | 0.0% |
| Bangladeshi | 1,762 | 0.4% |
| Basque | 352 | 0.1% |
| Belgian | 149 | 0.0% |
| Belizean | 179 | 0.0% |
| Bhutanese | 1,484 | 0.3% |
| Blackfeet | 292 | 0.1% |
| Bolivian | 33 | 0.0% |
| Brazilian | 58 | 0.0% |
| British | 1,159 | 0.2% |
| Burmese | 1,007 | 0.2% |
| Cambodian | 52 | 0.0% |
| Canadian | 526 | 0.1% |
| Celtic | 30 | 0.0% |
| Central American | 6,053 | 1.3% |
| Central American Indian | 515 | 0.1% |
| Cherokee | 1,307 | 0.3% |
| Cheyenne | 8 | 0.0% |
| Chickasaw | 205 | 0.0% |
| Chilean | 209 | 0.0% |
| Chippewa | 32 | 0.0% |
| Choctaw | 519 | 0.1% |
| Colombian | 374 | 0.1% |
| Comanche | 167 | 0.0% |
| Costa Rican | 123 | 0.0% |
| Cree | 3 | 0.0% |
| Creek | 49 | 0.0% |
| Croatian | 113 | 0.0% |
| Cuban | 729 | 0.2% |
| Czech | 272 | 0.1% |
| Czechoslovakian | 111 | 0.0% |
| Danish | 601 | 0.1% |
| Delaware | 4 | 0.0% |
| Dominican | 83 | 0.0% |
| Dutch | 4,533 | 1.0% |
| Dutch West Indian | 26 | 0.0% |
| Eastern European | 182 | 0.0% |
| Ecuadorian | 31 | 0.0% |
| Egyptian | 117 | 0.0% |
| English | 20,203 | 4.3% |
| Estonian | 7 | 0.0% |
| Ethiopian | 265 | 0.1% |
| European | 2,765 | 0.6% |
| Fijian | 11 | 0.0% |
| Filipino | 12 | 0.0% |
| Finnish | 298 | 0.1% |
| French | 2,883 | 0.6% |
| French American Indian | 24 | 0.0% |
| French Canadian | 491 | 0.1% |
| German | 21,046 | 4.4% |
| German Russian | 12 | 0.0% |
| Greek | 199 | 0.0% |
| Guamanian / Chamorro | 391 | 0.1% |
| Guatemalan | 1,966 | 0.4% |
| Guyanese | 17 | 0.0% |
| Haitian | 176 | 0.0% |
| Honduran | 573 | 0.1% |
| Hopi | 91 | 0.0% |
| Hungarian | 437 | 0.1% |
| Indian (Asian) | 2,216 | 0.5% |
| Inupiat | 2 | 0.0% |
| Iranian | 257 | 0.1% |
| Irish | 17,572 | 3.7% |
| Iroquois | 127 | 0.0% |
| Israeli | 31 | 0.0% |
| Italian | 7,339 | 1.5% |
| Jamaican | 38 | 0.0% |
| Japanese | 96 | 0.0% |
| Jordanian | 187 | 0.0% |
| Korean | 7,847 | 1.7% |
| Laotian | 196 | 0.0% |
| Latvian | 5 | 0.0% |
| Lebanese | 87 | 0.0% |
| Lithuanian | 80 | 0.0% |
| Malaysian | 2,027 | 0.4% |
| Marshallese | 11 | 0.0% |
| Mexican | 294,695 | 62.2% |
| Mexican American Indian | 2,255 | 0.5% |
| Moroccan | 32 | 0.0% |
| Native Hawaiian | 332 | 0.1% |
| Navajo | 327 | 0.1% |
| Nepalese | 445 | 0.1% |
| New Zealander | 7 | 0.0% |
| Nicaraguan | 440 | 0.1% |
| Nigerian | 62 | 0.0% |
| Northern European | 406 | 0.1% |
| Norwegian | 2,226 | 0.5% |
| Osage | 56 | 0.0% |
| Paiute | 94 | 0.0% |
| Pakistani | 188 | 0.0% |
| Palestinian | 709 | 0.2% |
| Panamanian | 117 | 0.0% |
| Pennsylvania German | 5 | 0.0% |
| Peruvian | 831 | 0.2% |
| Pima | 52 | 0.0% |
| Polish | 1,295 | 0.3% |
| Portuguese | 10,228 | 2.2% |
| Potawatomi | 35 | 0.0% |
| Pueblo | 55 | 0.0% |
| Puerto Rican | 1,505 | 0.3% |
| Romanian | 220 | 0.1% |
| Russian | 867 | 0.2% |
| Salvadoran | 2,834 | 0.6% |
| Samoan | 108 | 0.0% |
| Scandinavian | 880 | 0.2% |
| Scotch-Irish | 1,560 | 0.3% |
| Scottish | 2,839 | 0.6% |
| Seminole | 173 | 0.0% |
| Serbian | 120 | 0.0% |
| Shoshone | 23 | 0.0% |
| Sioux | 328 | 0.1% |
| Slavic | 53 | 0.0% |
| Slovak | 9 | 0.0% |
| South American | 1,782 | 0.4% |
| South American Indian | 386 | 0.1% |
| Spaniard | 1,368 | 0.3% |
| Spanish | 1,325 | 0.3% |
| Spanish American | 87 | 0.0% |
| Spanish American Indian | 40 | 0.0% |
| Sri Lankan | 752 | 0.2% |
| Subsaharan African | 718 | 0.2% |
| Swedish | 2,102 | 0.4% |
| Swiss | 497 | 0.1% |
| Syrian | 173 | 0.0% |
| Thai | 1,739 | 0.4% |
| Tohono O'Odham | 51 | 0.0% |
| Tongan | 13 | 0.0% |
| Turkish | 29 | 0.0% |
| Ukrainian | 787 | 0.2% |
| Ute | 10 | 0.0% |
| Venezuelan | 21 | 0.0% |
| Vietnamese | 121 | 0.0% |
| Welsh | 1,201 | 0.3% |
| Yaqui | 138 | 0.0% |
| Yugoslavian | 35 | 0.0% |
| Yuman | 19 | 0.0% | View All 145 Rows |
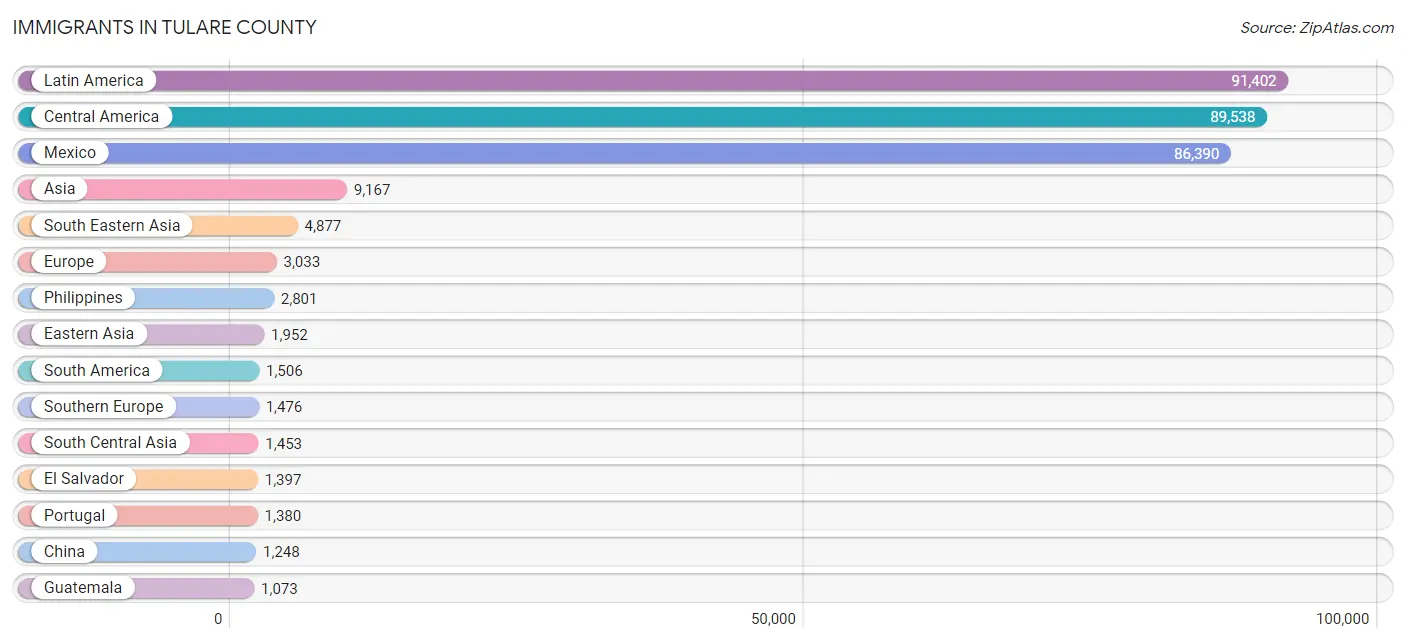
Immigrants in Tulare County
The most numerous immigrant groups reported in Tulare County came from Latin America (91,402 | 19.3%), Central America (89,538 | 18.9%), Mexico (86,390 | 18.2%), Asia (9,167 | 1.9%), and South Eastern Asia (4,877 | 1.0%), together accounting for 59.4% of all Tulare County residents.
| Immigration Origin | # Population | % Population |
| Africa | 429 | 0.1% |
| Argentina | 185 | 0.0% |
| Armenia | 26 | 0.0% |
| Asia | 9,167 | 1.9% |
| Australia | 3 | 0.0% |
| Austria | 16 | 0.0% |
| Azores | 538 | 0.1% |
| Bangladesh | 61 | 0.0% |
| Belgium | 23 | 0.0% |
| Belize | 9 | 0.0% |
| Bolivia | 42 | 0.0% |
| Brazil | 234 | 0.1% |
| Cambodia | 146 | 0.0% |
| Canada | 263 | 0.1% |
| Caribbean | 358 | 0.1% |
| Central America | 89,538 | 18.9% |
| Chile | 177 | 0.0% |
| China | 1,248 | 0.3% |
| Colombia | 183 | 0.0% |
| Congo | 3 | 0.0% |
| Costa Rica | 120 | 0.0% |
| Croatia | 26 | 0.0% |
| Cuba | 307 | 0.1% |
| Denmark | 9 | 0.0% |
| Dominican Republic | 21 | 0.0% |
| Eastern Africa | 227 | 0.1% |
| Eastern Asia | 1,952 | 0.4% |
| Eastern Europe | 584 | 0.1% |
| Ecuador | 35 | 0.0% |
| Egypt | 95 | 0.0% |
| El Salvador | 1,397 | 0.3% |
| England | 68 | 0.0% |
| Eritrea | 21 | 0.0% |
| Ethiopia | 176 | 0.0% |
| Europe | 3,033 | 0.6% |
| Fiji | 78 | 0.0% |
| France | 33 | 0.0% |
| Germany | 261 | 0.1% |
| Ghana | 8 | 0.0% |
| Guatemala | 1,073 | 0.2% |
| Guyana | 27 | 0.0% |
| Haiti | 13 | 0.0% |
| Honduras | 373 | 0.1% |
| Hong Kong | 102 | 0.0% |
| India | 1,032 | 0.2% |
| Indonesia | 14 | 0.0% |
| Iran | 39 | 0.0% |
| Ireland | 27 | 0.0% |
| Israel | 54 | 0.0% |
| Italy | 61 | 0.0% |
| Jamaica | 17 | 0.0% |
| Japan | 118 | 0.0% |
| Jordan | 82 | 0.0% |
| Kenya | 25 | 0.0% |
| Korea | 586 | 0.1% |
| Laos | 813 | 0.2% |
| Latin America | 91,402 | 19.3% |
| Latvia | 10 | 0.0% |
| Lebanon | 28 | 0.0% |
| Mexico | 86,390 | 18.2% |
| Middle Africa | 3 | 0.0% |
| Nepal | 31 | 0.0% |
| Netherlands | 129 | 0.0% |
| Nicaragua | 163 | 0.0% |
| Nigeria | 46 | 0.0% |
| Northern Africa | 114 | 0.0% |
| Northern Europe | 486 | 0.1% |
| Norway | 58 | 0.0% |
| Oceania | 164 | 0.0% |
| Pakistan | 174 | 0.0% |
| Panama | 13 | 0.0% |
| Peru | 588 | 0.1% |
| Philippines | 2,801 | 0.6% |
| Poland | 34 | 0.0% |
| Portugal | 1,380 | 0.3% |
| Romania | 128 | 0.0% |
| Russia | 85 | 0.0% |
| Saudi Arabia | 3 | 0.0% |
| Serbia | 33 | 0.0% |
| Singapore | 9 | 0.0% |
| South America | 1,506 | 0.3% |
| South Central Asia | 1,453 | 0.3% |
| South Eastern Asia | 4,877 | 1.0% |
| Southern Europe | 1,476 | 0.3% |
| Spain | 35 | 0.0% |
| Sri Lanka | 94 | 0.0% |
| Sweden | 3 | 0.0% |
| Switzerland | 25 | 0.0% |
| Syria | 259 | 0.1% |
| Taiwan | 93 | 0.0% |
| Thailand | 709 | 0.2% |
| Turkey | 5 | 0.0% |
| Uganda | 5 | 0.0% |
| Ukraine | 216 | 0.1% |
| Venezuela | 35 | 0.0% |
| Vietnam | 385 | 0.1% |
| Western Africa | 54 | 0.0% |
| Western Asia | 831 | 0.2% |
| Western Europe | 487 | 0.1% |
| Yemen | 374 | 0.1% | View All 100 Rows |
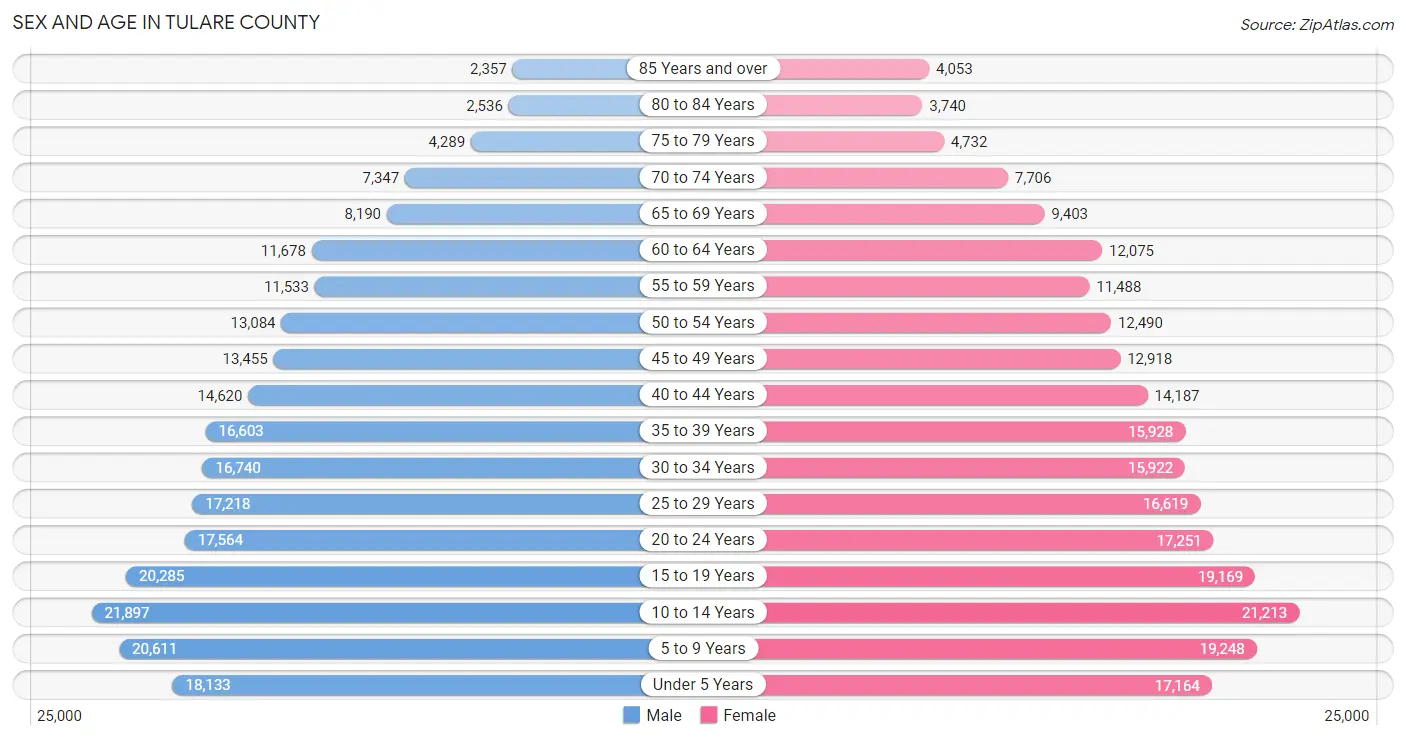
Sex and Age in Tulare County
Sex and Age in Tulare County
The most populous age groups in Tulare County are 10 to 14 Years (21,897 | 9.2%) for men and 10 to 14 Years (21,213 | 9.0%) for women.
| Age Bracket | Male | Female |
| Under 5 Years | 18,133 (7.6%) | 17,164 (7.3%) |
| 5 to 9 Years | 20,611 (8.6%) | 19,248 (8.2%) |
| 10 to 14 Years | 21,897 (9.2%) | 21,213 (9.0%) |
| 15 to 19 Years | 20,285 (8.5%) | 19,169 (8.2%) |
| 20 to 24 Years | 17,564 (7.4%) | 17,251 (7.3%) |
| 25 to 29 Years | 17,218 (7.2%) | 16,619 (7.1%) |
| 30 to 34 Years | 16,740 (7.0%) | 15,922 (6.8%) |
| 35 to 39 Years | 16,603 (7.0%) | 15,928 (6.8%) |
| 40 to 44 Years | 14,620 (6.1%) | 14,187 (6.0%) |
| 45 to 49 Years | 13,455 (5.7%) | 12,918 (5.5%) |
| 50 to 54 Years | 13,084 (5.5%) | 12,490 (5.3%) |
| 55 to 59 Years | 11,533 (4.8%) | 11,488 (4.9%) |
| 60 to 64 Years | 11,678 (4.9%) | 12,075 (5.1%) |
| 65 to 69 Years | 8,190 (3.4%) | 9,403 (4.0%) |
| 70 to 74 Years | 7,347 (3.1%) | 7,706 (3.3%) |
| 75 to 79 Years | 4,289 (1.8%) | 4,732 (2.0%) |
| 80 to 84 Years | 2,536 (1.1%) | 3,740 (1.6%) |
| 85 Years and over | 2,357 (1.0%) | 4,053 (1.7%) |
| Total | 238,140 (100.0%) | 235,306 (100.0%) |
Families and Households in Tulare County
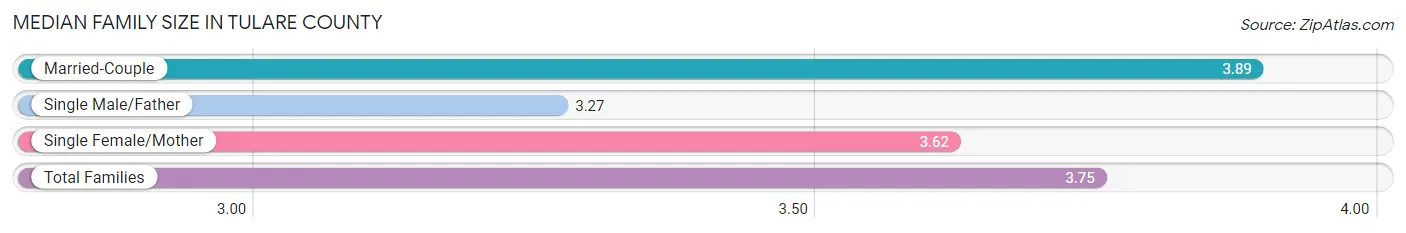
Median Family Size in Tulare County
The median family size in Tulare County is 3.75 persons per family, with married-couple families (72,778 | 66.1%) accounting for the largest median family size of 3.89 persons per family. On the other hand, single male/father families (12,546 | 11.4%) represent the smallest median family size with 3.27 persons per family.
| Family Type | # Families | Family Size |
| Married-Couple | 72,778 (66.1%) | 3.89 |
| Single Male/Father | 12,546 (11.4%) | 3.27 |
| Single Female/Mother | 24,789 (22.5%) | 3.62 |
| Total Families | 110,113 (100.0%) | 3.75 |
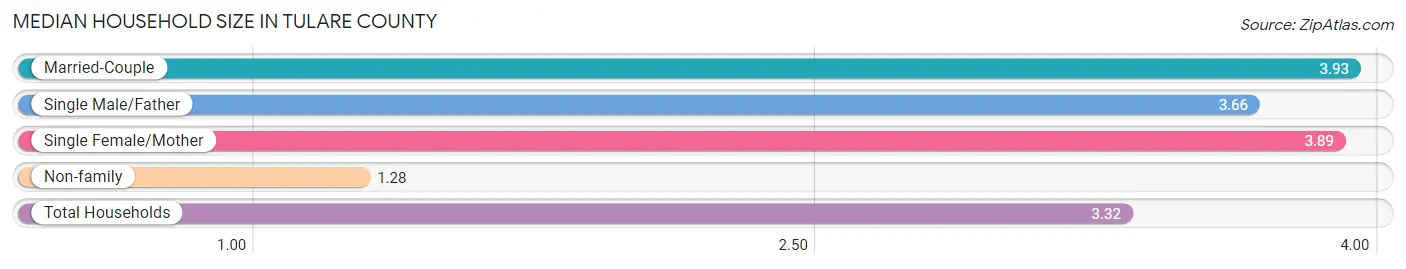
Median Household Size in Tulare County
The median household size in Tulare County is 3.32 persons per household, with married-couple households (72,778 | 51.7%) accounting for the largest median household size of 3.93 persons per household. non-family households (30,557 | 21.7%) represent the smallest median household size with 1.28 persons per household.
| Household Type | # Households | Household Size |
| Married-Couple | 72,778 (51.7%) | 3.93 |
| Single Male/Father | 12,546 (8.9%) | 3.66 |
| Single Female/Mother | 24,789 (17.6%) | 3.89 |
| Non-family | 30,557 (21.7%) | 1.28 |
| Total Households | 140,670 (100.0%) | 3.32 |
Household Size by Marriage Status in Tulare County
Out of a total of 140,670 households in Tulare County, 110,113 (78.3%) are family households, while 30,557 (21.7%) are nonfamily households. The most numerous type of family households are 2-person households, comprising 32,296, and the most common type of nonfamily households are 1-person households, comprising 24,403.
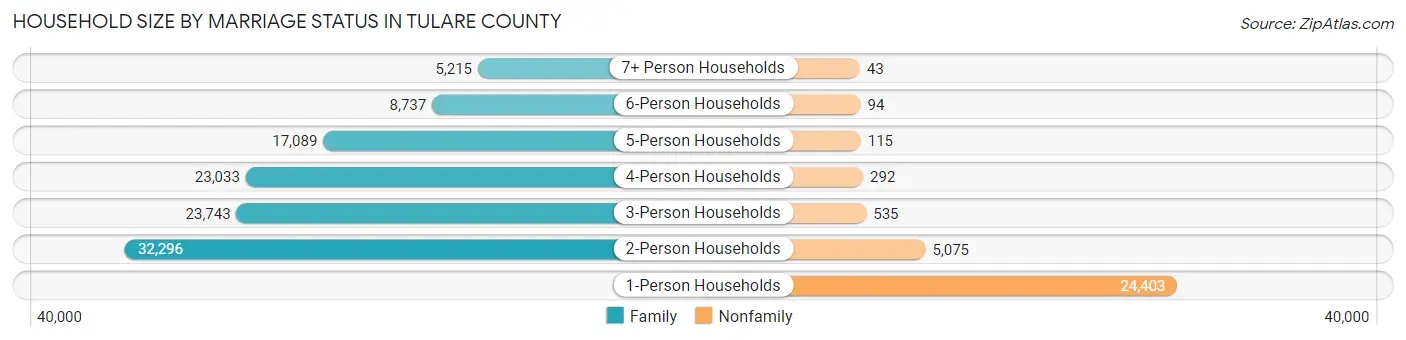
| Household Size | Family Households | Nonfamily Households |
| 1-Person Households | - | 24,403 (17.3%) |
| 2-Person Households | 32,296 (23.0%) | 5,075 (3.6%) |
| 3-Person Households | 23,743 (16.9%) | 535 (0.4%) |
| 4-Person Households | 23,033 (16.4%) | 292 (0.2%) |
| 5-Person Households | 17,089 (12.1%) | 115 (0.1%) |
| 6-Person Households | 8,737 (6.2%) | 94 (0.1%) |
| 7+ Person Households | 5,215 (3.7%) | 43 (0.0%) |
| Total | 110,113 (78.3%) | 30,557 (21.7%) |
Female Fertility in Tulare County
Fertility by Age in Tulare County
Average fertility rate in Tulare County is 64.0 births per 1,000 women. Women in the age bracket of 20 to 34 years have the highest fertility rate with 104.0 births per 1,000 women. Women in the age bracket of 20 to 34 years acount for 70.9% of all women with births.
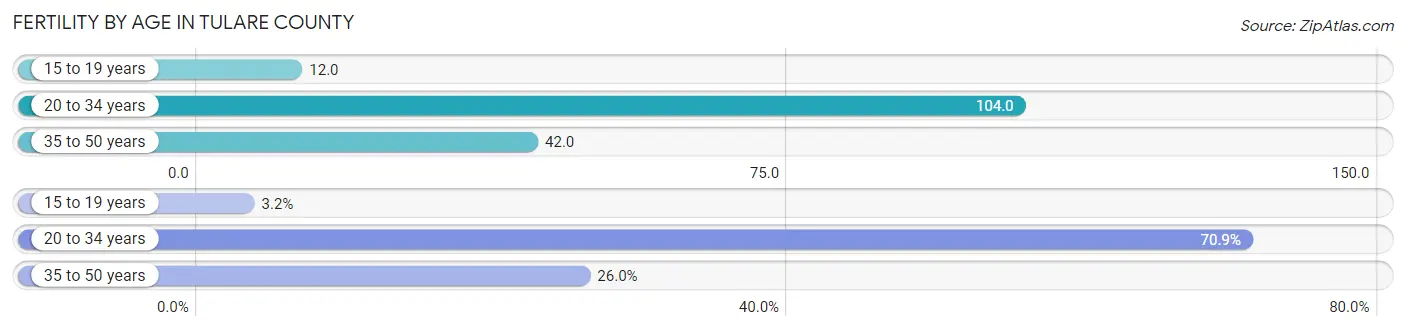
| Age Bracket | Women with Births | Births / 1,000 Women |
| 15 to 19 years | 231 (3.2%) | 12.0 |
| 20 to 34 years | 5,179 (70.9%) | 104.0 |
| 35 to 50 years | 1,896 (26.0%) | 42.0 |
| Total | 7,306 (100.0%) | 64.0 |
Fertility by Age by Marriage Status in Tulare County
57.8% of women with births (7,306) in Tulare County are married. The highest percentage of unmarried women with births falls into 15 to 19 years age bracket with 69.3% of them unmarried at the time of birth, while the lowest percentage of unmarried women with births belong to 35 to 50 years age bracket with 31.2% of them unmarried.
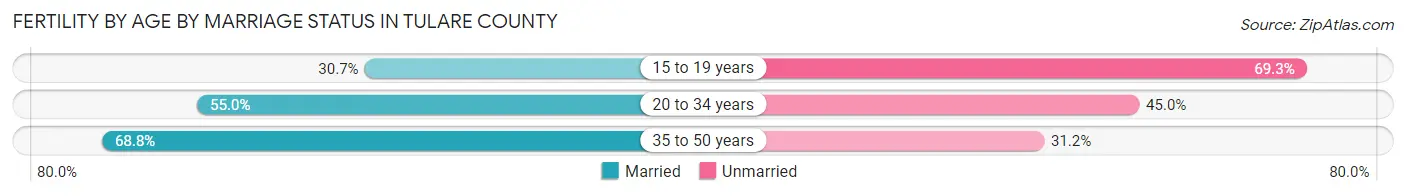
| Age Bracket | Married | Unmarried |
| 15 to 19 years | 71 (30.7%) | 160 (69.3%) |
| 20 to 34 years | 2,848 (55.0%) | 2,331 (45.0%) |
| 35 to 50 years | 1,304 (68.8%) | 592 (31.2%) |
| Total | 4,223 (57.8%) | 3,083 (42.2%) |
Fertility by Education in Tulare County
Average fertility rate in Tulare County is 64.0 births per 1,000 women. Women with the education attainment of high school diploma have the highest fertility rate of 81.0 births per 1,000 women, while women with the education attainment of less than high school have the lowest fertility at 37.0 births per 1,000 women. Women with the education attainment of college or associate's degree represent 37.7% of all women with births.
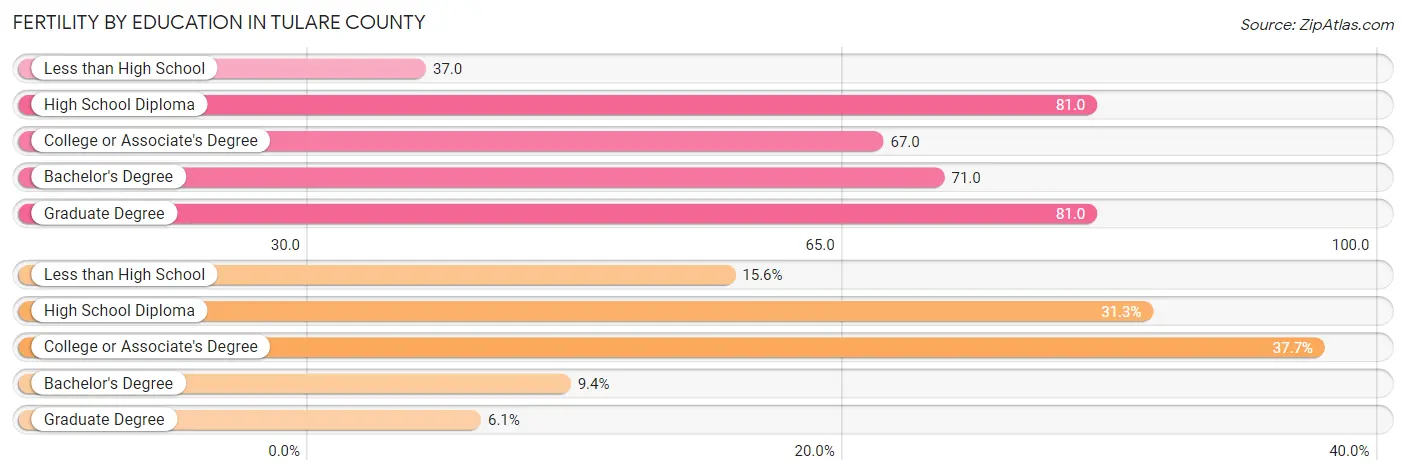
| Educational Attainment | Women with Births | Births / 1,000 Women |
| Less than High School | 1,139 (15.6%) | 37.0 |
| High School Diploma | 2,283 (31.2%) | 81.0 |
| College or Associate's Degree | 2,753 (37.7%) | 67.0 |
| Bachelor's Degree | 688 (9.4%) | 71.0 |
| Graduate Degree | 443 (6.1%) | 81.0 |
| Total | 7,306 (100.0%) | 64.0 |
Fertility by Education by Marriage Status in Tulare County
42.2% of women with births in Tulare County are unmarried. Women with the educational attainment of graduate degree are most likely to be married with 76.5% of them married at childbirth, while women with the educational attainment of less than high school are least likely to be married with 48.1% of them unmarried at childbirth.
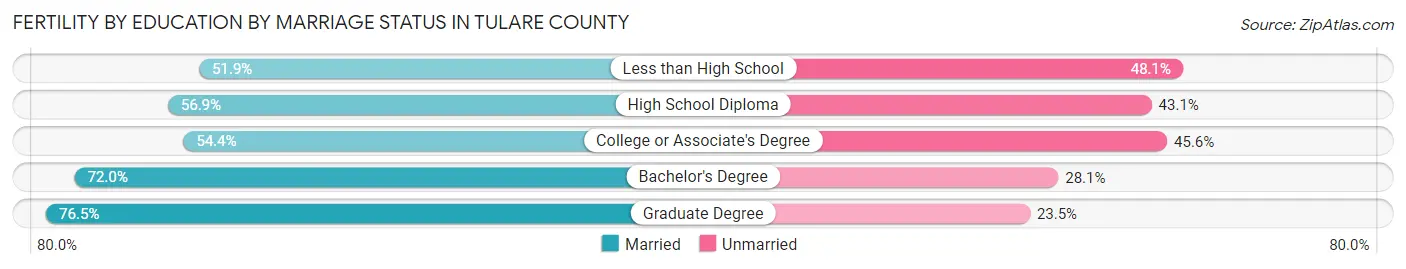
| Educational Attainment | Married | Unmarried |
| Less than High School | 591 (51.9%) | 548 (48.1%) |
| High School Diploma | 1,299 (56.9%) | 984 (43.1%) |
| College or Associate's Degree | 1,498 (54.4%) | 1,255 (45.6%) |
| Bachelor's Degree | 495 (72.0%) | 193 (28.1%) |
| Graduate Degree | 339 (76.5%) | 104 (23.5%) |
| Total | 4,223 (57.8%) | 3,083 (42.2%) |
Employment Characteristics in Tulare County
Employment by Class of Employer in Tulare County
Among the 184,620 employed individuals in Tulare County, private company employees (120,995 | 65.5%), local government employees (19,921 | 10.8%), and self-employed (not incorporated) (12,673 | 6.9%) make up the most common classes of employment.
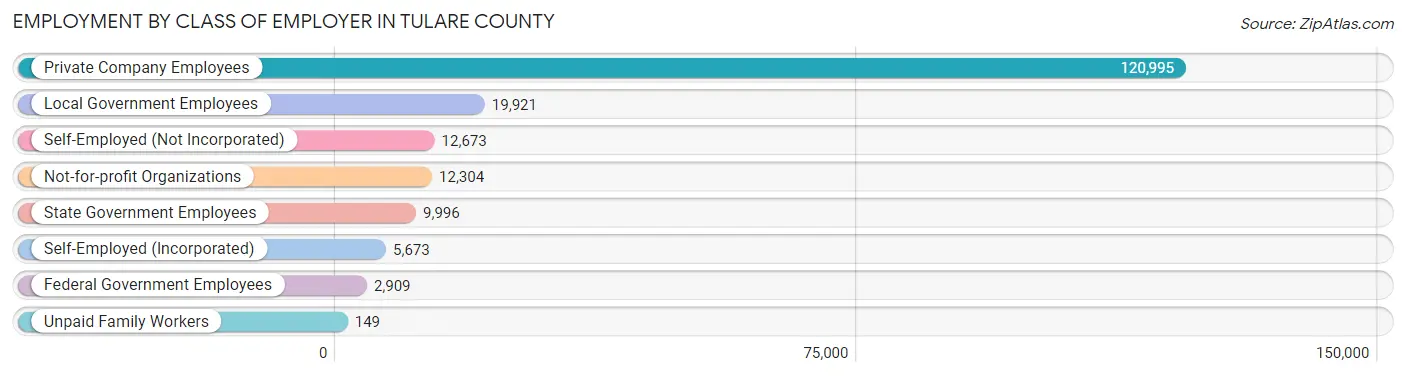
| Employer Class | # Employees | % Employees |
| Private Company Employees | 120,995 | 65.5% |
| Self-Employed (Incorporated) | 5,673 | 3.1% |
| Self-Employed (Not Incorporated) | 12,673 | 6.9% |
| Not-for-profit Organizations | 12,304 | 6.7% |
| Local Government Employees | 19,921 | 10.8% |
| State Government Employees | 9,996 | 5.4% |
| Federal Government Employees | 2,909 | 1.6% |
| Unpaid Family Workers | 149 | 0.1% |
| Total | 184,620 | 100.0% |
Employment Status by Age in Tulare County
According to the labor force statistics for Tulare County, out of the total population over 16 years of age (346,679), 60.7% or 210,434 individuals are in the labor force, with 9.0% or 18,939 of them unemployed. The age group with the highest labor force participation rate is 25 to 29 years, with 78.8% or 26,664 individuals in the labor force. Within the labor force, the 16 to 19 years age range has the highest percentage of unemployed individuals, with 17.9% or 1,562 of them being unemployed.
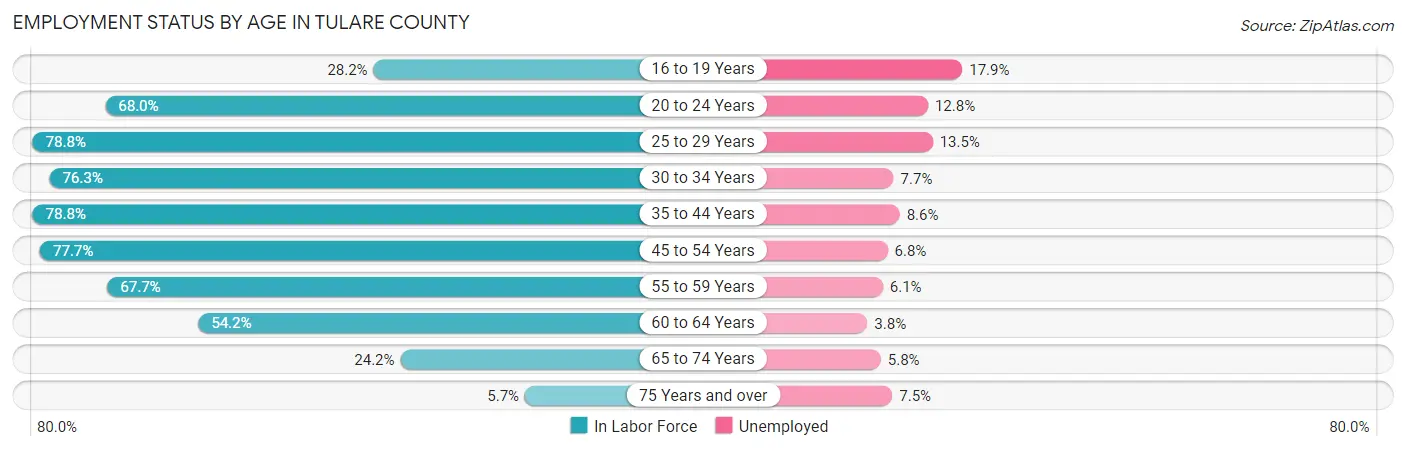
| Age Bracket | In Labor Force | Unemployed |
| 16 to 19 Years | 8,729 (28.2%) | 1,562 (17.9%) |
| 20 to 24 Years | 23,674 (68.0%) | 3,030 (12.8%) |
| 25 to 29 Years | 26,664 (78.8%) | 3,600 (13.5%) |
| 30 to 34 Years | 24,921 (76.3%) | 1,919 (7.7%) |
| 35 to 44 Years | 48,334 (78.8%) | 4,157 (8.6%) |
| 45 to 54 Years | 40,363 (77.7%) | 2,745 (6.8%) |
| 55 to 59 Years | 15,585 (67.7%) | 951 (6.1%) |
| 60 to 64 Years | 12,874 (54.2%) | 489 (3.8%) |
| 65 to 74 Years | 7,900 (24.2%) | 458 (5.8%) |
| 75 Years and over | 1,237 (5.7%) | 93 (7.5%) |
| Total | 210,434 (60.7%) | 18,939 (9.0%) |
Employment Status by Educational Attainment in Tulare County
According to labor force statistics for Tulare County, 74.5% of individuals (168,786) out of the total population between 25 and 64 years of age (226,558) are in the labor force, with 8.2% or 13,840 of them being unemployed. The group with the highest labor force participation rate are those with the educational attainment of bachelor's degree or higher, with 87.6% or 30,056 individuals in the labor force. Within the labor force, individuals with less than high school education have the highest percentage of unemployment, with 13.0% or 4,981 of them being unemployed.
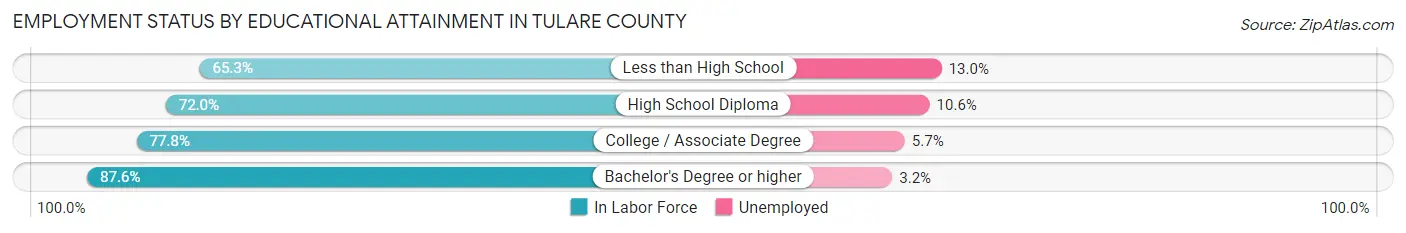
| Educational Attainment | In Labor Force | Unemployed |
| Less than High School | 38,317 (65.3%) | 7,628 (13.0%) |
| High School Diploma | 43,754 (72.0%) | 6,442 (10.6%) |
| College / Associate Degree | 56,637 (77.8%) | 4,149 (5.7%) |
| Bachelor's Degree or higher | 30,056 (87.6%) | 1,098 (3.2%) |
| Total | 168,786 (74.5%) | 18,578 (8.2%) |
Employment Occupations by Sex in Tulare County
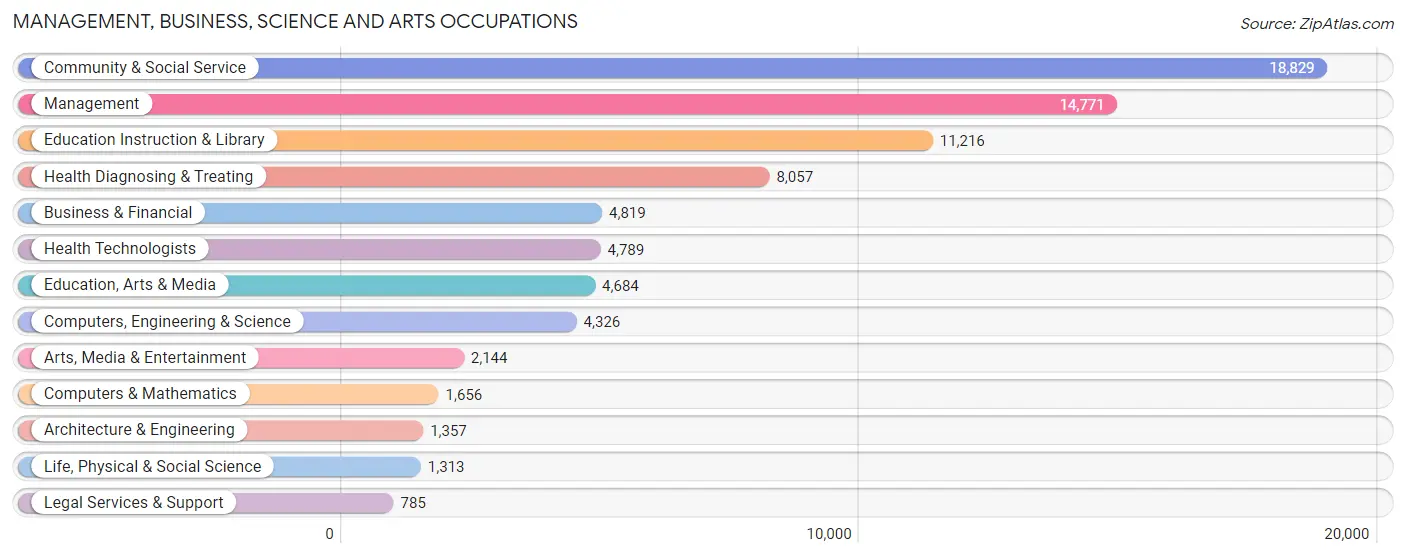
Management, Business, Science and Arts Occupations
The most common Management, Business, Science and Arts occupations in Tulare County are Community & Social Service (18,829 | 9.9%), Management (14,771 | 7.7%), Education Instruction & Library (11,216 | 5.9%), Health Diagnosing & Treating (8,057 | 4.2%), and Business & Financial (4,819 | 2.5%).
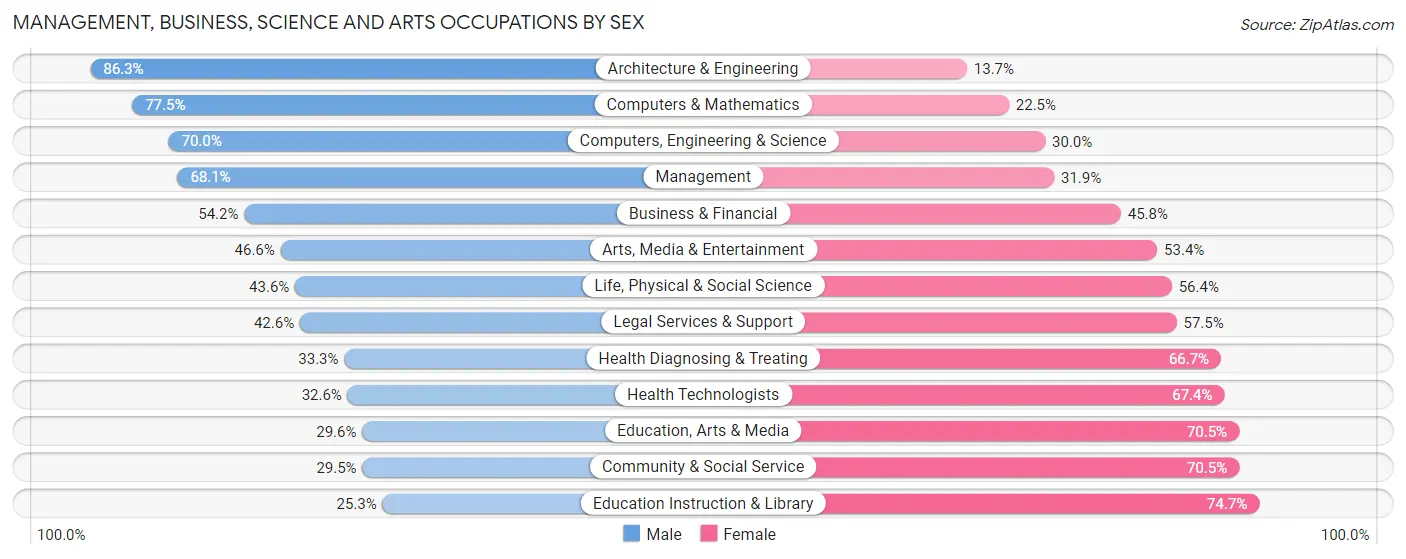
Management, Business, Science and Arts Occupations by Sex
Within the Management, Business, Science and Arts occupations in Tulare County, the most male-oriented occupations are Architecture & Engineering (86.3%), Computers & Mathematics (77.5%), and Computers, Engineering & Science (70.0%), while the most female-oriented occupations are Education Instruction & Library (74.7%), Community & Social Service (70.5%), and Education, Arts & Media (70.5%).
| Occupation | Male | Female |
| Management | 10,060 (68.1%) | 4,711 (31.9%) |
| Business & Financial | 2,611 (54.2%) | 2,208 (45.8%) |
| Computers, Engineering & Science | 3,027 (70.0%) | 1,299 (30.0%) |
| Computers & Mathematics | 1,284 (77.5%) | 372 (22.5%) |
| Architecture & Engineering | 1,171 (86.3%) | 186 (13.7%) |
| Life, Physical & Social Science | 572 (43.6%) | 741 (56.4%) |
| Community & Social Service | 5,558 (29.5%) | 13,271 (70.5%) |
| Education, Arts & Media | 1,384 (29.5%) | 3,300 (70.5%) |
| Legal Services & Support | 334 (42.5%) | 451 (57.5%) |
| Education Instruction & Library | 2,841 (25.3%) | 8,375 (74.7%) |
| Arts, Media & Entertainment | 999 (46.6%) | 1,145 (53.4%) |
| Health Diagnosing & Treating | 2,683 (33.3%) | 5,374 (66.7%) |
| Health Technologists | 1,561 (32.6%) | 3,228 (67.4%) |
| Total (Category) | 23,939 (47.1%) | 26,863 (52.9%) |
| Total (Overall) | 107,678 (56.4%) | 83,205 (43.6%) |
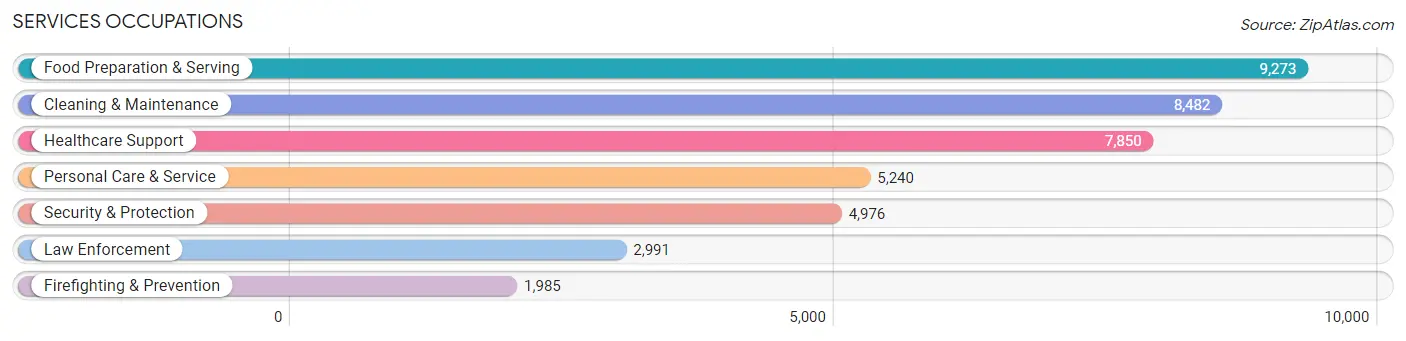
Services Occupations
The most common Services occupations in Tulare County are Food Preparation & Serving (9,273 | 4.9%), Cleaning & Maintenance (8,482 | 4.4%), Healthcare Support (7,850 | 4.1%), Personal Care & Service (5,240 | 2.8%), and Security & Protection (4,976 | 2.6%).
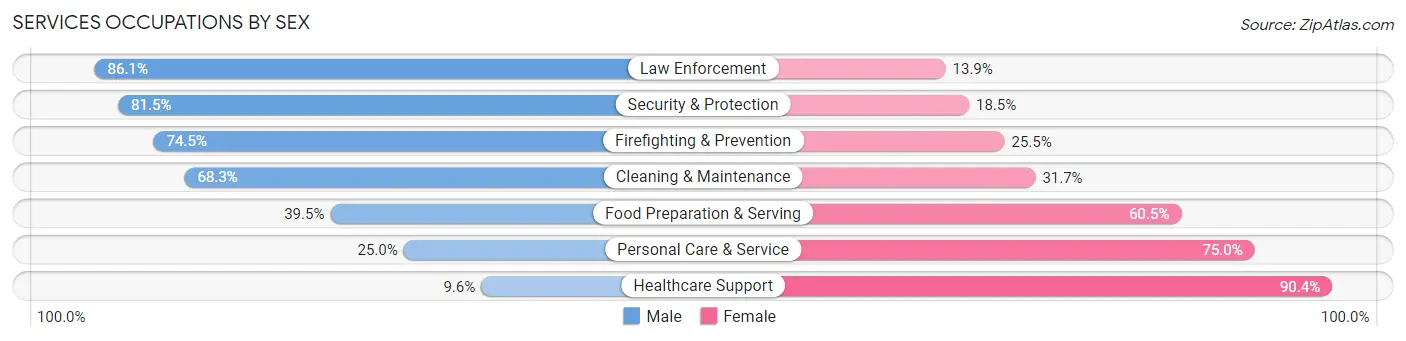
Services Occupations by Sex
Within the Services occupations in Tulare County, the most male-oriented occupations are Law Enforcement (86.1%), Security & Protection (81.5%), and Firefighting & Prevention (74.5%), while the most female-oriented occupations are Healthcare Support (90.4%), Personal Care & Service (75.0%), and Food Preparation & Serving (60.5%).
| Occupation | Male | Female |
| Healthcare Support | 755 (9.6%) | 7,095 (90.4%) |
| Security & Protection | 4,054 (81.5%) | 922 (18.5%) |
| Firefighting & Prevention | 1,478 (74.5%) | 507 (25.5%) |
| Law Enforcement | 2,576 (86.1%) | 415 (13.9%) |
| Food Preparation & Serving | 3,661 (39.5%) | 5,612 (60.5%) |
| Cleaning & Maintenance | 5,797 (68.3%) | 2,685 (31.7%) |
| Personal Care & Service | 1,308 (25.0%) | 3,932 (75.0%) |
| Total (Category) | 15,575 (43.5%) | 20,246 (56.5%) |
| Total (Overall) | 107,678 (56.4%) | 83,205 (43.6%) |
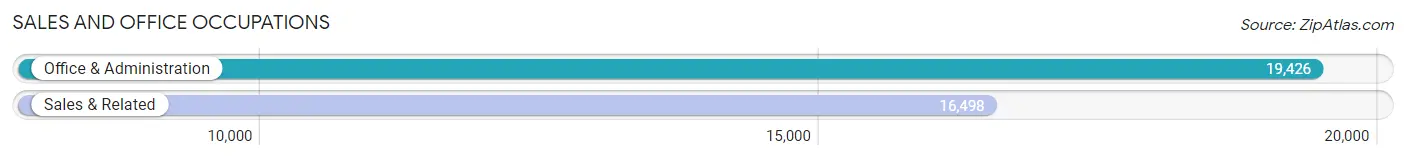
Sales and Office Occupations
The most common Sales and Office occupations in Tulare County are Office & Administration (19,426 | 10.2%), and Sales & Related (16,498 | 8.6%).
Sales and Office Occupations by Sex
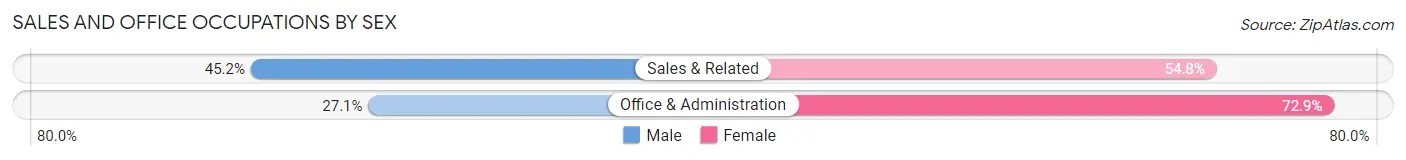
| Occupation | Male | Female |
| Sales & Related | 7,457 (45.2%) | 9,041 (54.8%) |
| Office & Administration | 5,267 (27.1%) | 14,159 (72.9%) |
| Total (Category) | 12,724 (35.4%) | 23,200 (64.6%) |
| Total (Overall) | 107,678 (56.4%) | 83,205 (43.6%) |
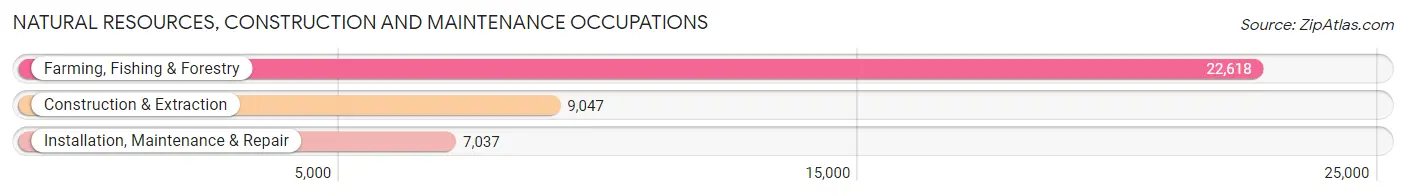
Natural Resources, Construction and Maintenance Occupations
The most common Natural Resources, Construction and Maintenance occupations in Tulare County are Farming, Fishing & Forestry (22,618 | 11.8%), Construction & Extraction (9,047 | 4.7%), and Installation, Maintenance & Repair (7,037 | 3.7%).
Natural Resources, Construction and Maintenance Occupations by Sex
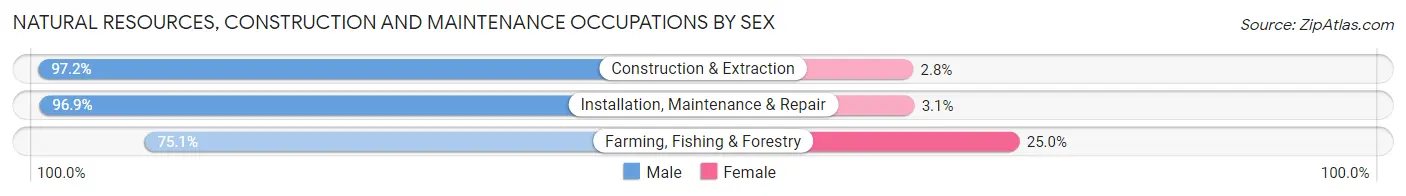
| Occupation | Male | Female |
| Farming, Fishing & Forestry | 16,975 (75.0%) | 5,643 (24.9%) |
| Construction & Extraction | 8,790 (97.2%) | 257 (2.8%) |
| Installation, Maintenance & Repair | 6,820 (96.9%) | 217 (3.1%) |
| Total (Category) | 32,585 (84.2%) | 6,117 (15.8%) |
| Total (Overall) | 107,678 (56.4%) | 83,205 (43.6%) |
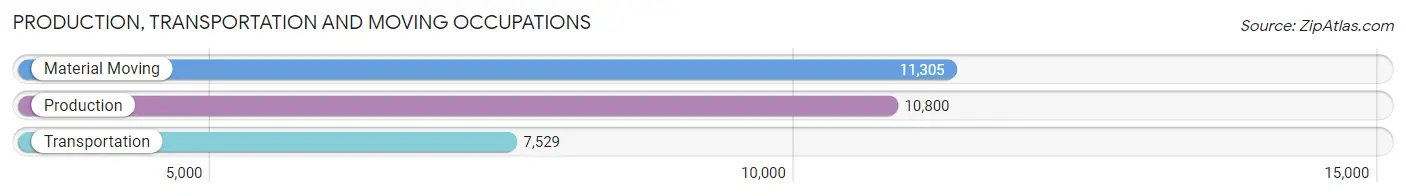
Production, Transportation and Moving Occupations
The most common Production, Transportation and Moving occupations in Tulare County are Material Moving (11,305 | 5.9%), Production (10,800 | 5.7%), and Transportation (7,529 | 3.9%).
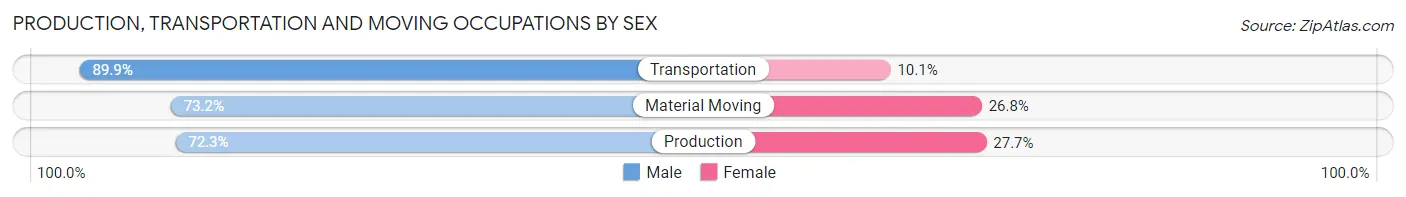
Production, Transportation and Moving Occupations by Sex
| Occupation | Male | Female |
| Production | 7,812 (72.3%) | 2,988 (27.7%) |
| Transportation | 6,770 (89.9%) | 759 (10.1%) |
| Material Moving | 8,273 (73.2%) | 3,032 (26.8%) |
| Total (Category) | 22,855 (77.1%) | 6,779 (22.9%) |
| Total (Overall) | 107,678 (56.4%) | 83,205 (43.6%) |
Employment Industries by Sex in Tulare County
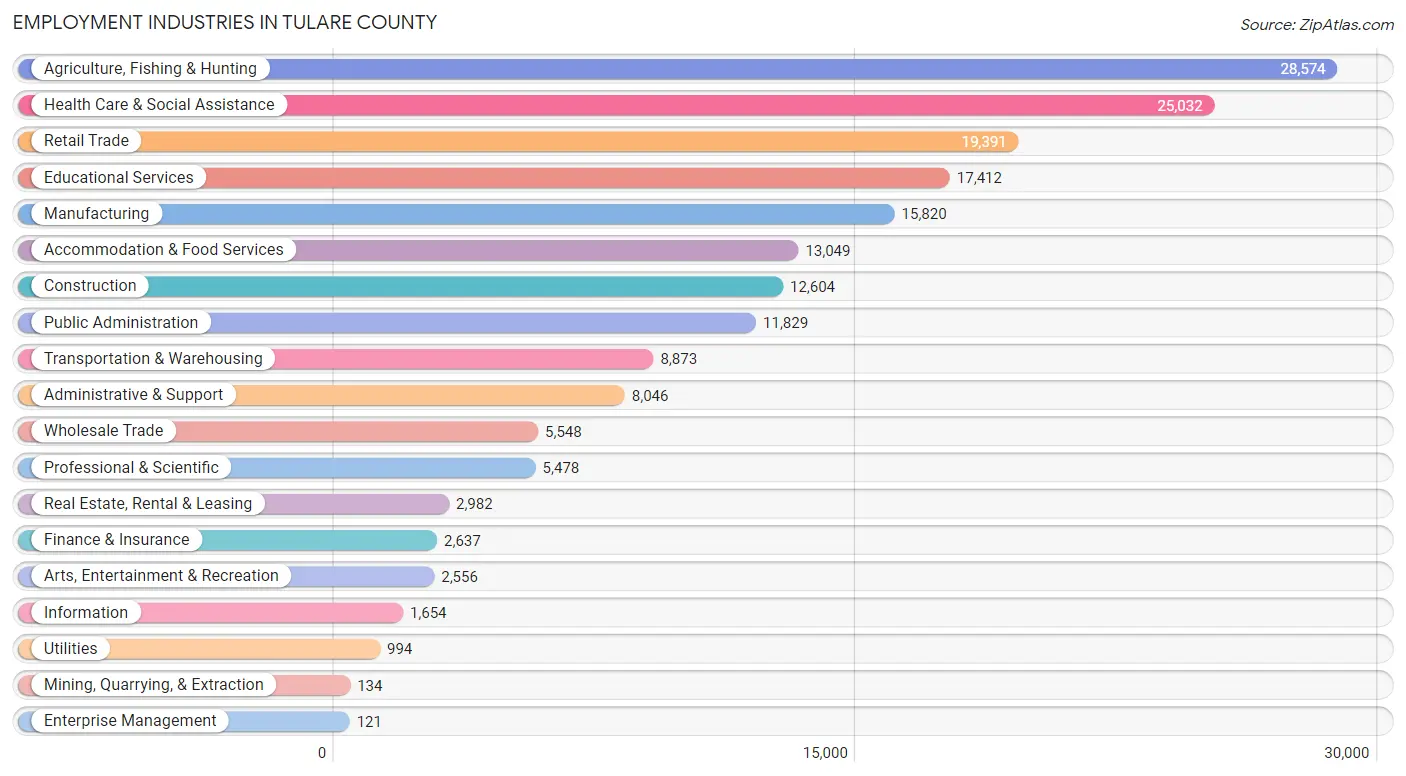
Employment Industries in Tulare County
The major employment industries in Tulare County include Agriculture, Fishing & Hunting (28,574 | 15.0%), Health Care & Social Assistance (25,032 | 13.1%), Retail Trade (19,391 | 10.2%), Educational Services (17,412 | 9.1%), and Manufacturing (15,820 | 8.3%).
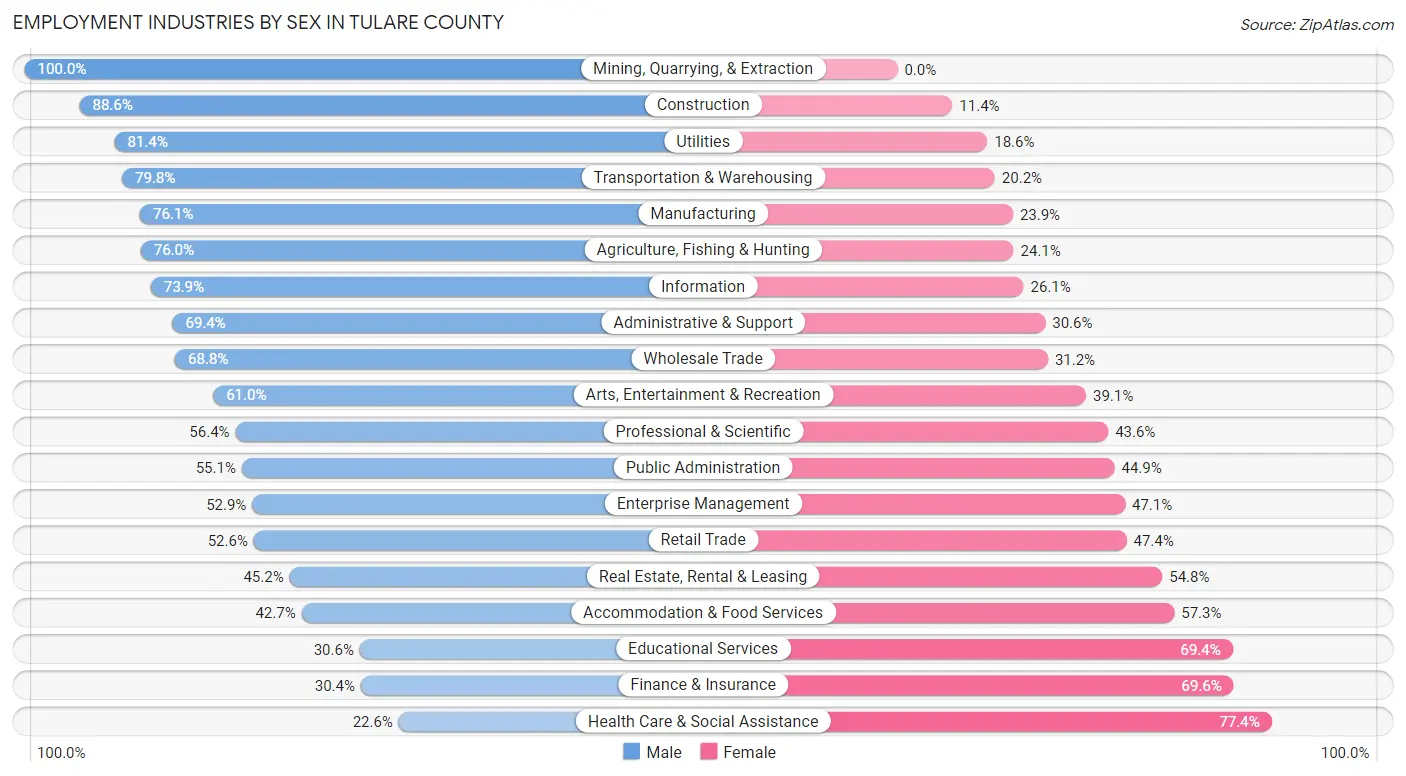
Employment Industries by Sex in Tulare County
The Tulare County industries that see more men than women are Mining, Quarrying, & Extraction (100.0%), Construction (88.6%), and Utilities (81.4%), whereas the industries that tend to have a higher number of women are Health Care & Social Assistance (77.4%), Finance & Insurance (69.6%), and Educational Services (69.4%).
| Industry | Male | Female |
| Agriculture, Fishing & Hunting | 21,702 (75.9%) | 6,872 (24.0%) |
| Mining, Quarrying, & Extraction | 134 (100.0%) | 0 (0.0%) |
| Construction | 11,170 (88.6%) | 1,434 (11.4%) |
| Manufacturing | 12,037 (76.1%) | 3,783 (23.9%) |
| Wholesale Trade | 3,819 (68.8%) | 1,729 (31.2%) |
| Retail Trade | 10,193 (52.6%) | 9,198 (47.4%) |
| Transportation & Warehousing | 7,082 (79.8%) | 1,791 (20.2%) |
| Utilities | 809 (81.4%) | 185 (18.6%) |
| Information | 1,222 (73.9%) | 432 (26.1%) |
| Finance & Insurance | 802 (30.4%) | 1,835 (69.6%) |
| Real Estate, Rental & Leasing | 1,347 (45.2%) | 1,635 (54.8%) |
| Professional & Scientific | 3,088 (56.4%) | 2,390 (43.6%) |
| Enterprise Management | 64 (52.9%) | 57 (47.1%) |
| Administrative & Support | 5,583 (69.4%) | 2,463 (30.6%) |
| Educational Services | 5,333 (30.6%) | 12,079 (69.4%) |
| Health Care & Social Assistance | 5,649 (22.6%) | 19,383 (77.4%) |
| Arts, Entertainment & Recreation | 1,558 (61.0%) | 998 (39.1%) |
| Accommodation & Food Services | 5,570 (42.7%) | 7,479 (57.3%) |
| Public Administration | 6,513 (55.1%) | 5,316 (44.9%) |
| Total | 107,678 (56.4%) | 83,205 (43.6%) |
Education in Tulare County
School Enrollment in Tulare County
The most common levels of schooling among the 142,266 students in Tulare County are high school (33,710 | 23.7%), middle school (33,506 | 23.5%), and elementary school (31,655 | 22.3%).
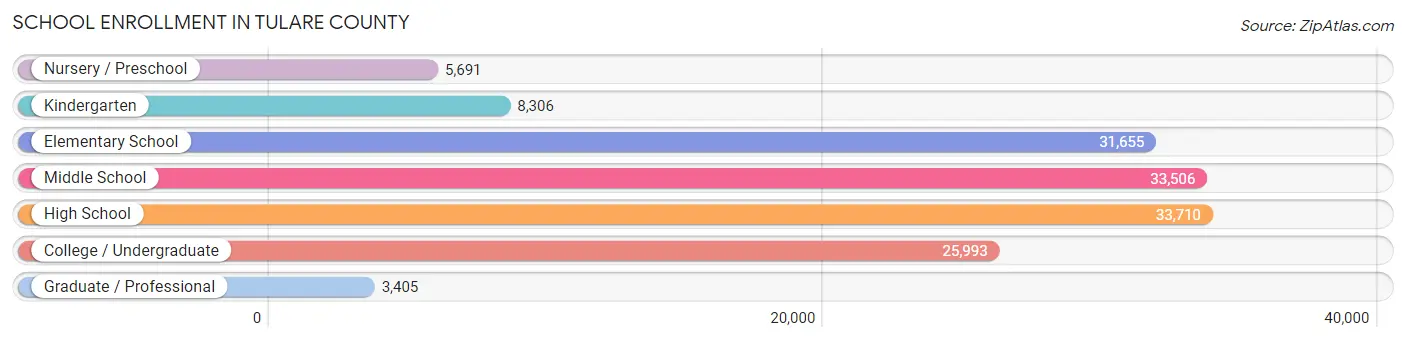
| School Level | # Students | % Students |
| Nursery / Preschool | 5,691 | 4.0% |
| Kindergarten | 8,306 | 5.8% |
| Elementary School | 31,655 | 22.3% |
| Middle School | 33,506 | 23.5% |
| High School | 33,710 | 23.7% |
| College / Undergraduate | 25,993 | 18.3% |
| Graduate / Professional | 3,405 | 2.4% |
| Total | 142,266 | 100.0% |
School Enrollment by Age by Funding Source in Tulare County
Out of a total of 142,266 students who are enrolled in schools in Tulare County, 13,373 (9.4%) attend a private institution, while the remaining 128,893 (90.6%) are enrolled in public schools. The age group of 35 years and over has the highest likelihood of being enrolled in private schools, with 1,398 (28.7% in the age bracket) enrolled. Conversely, the age group of 15 to 17 year olds has the lowest likelihood of being enrolled in a private school, with 22,592 (94.9% in the age bracket) attending a public institution.
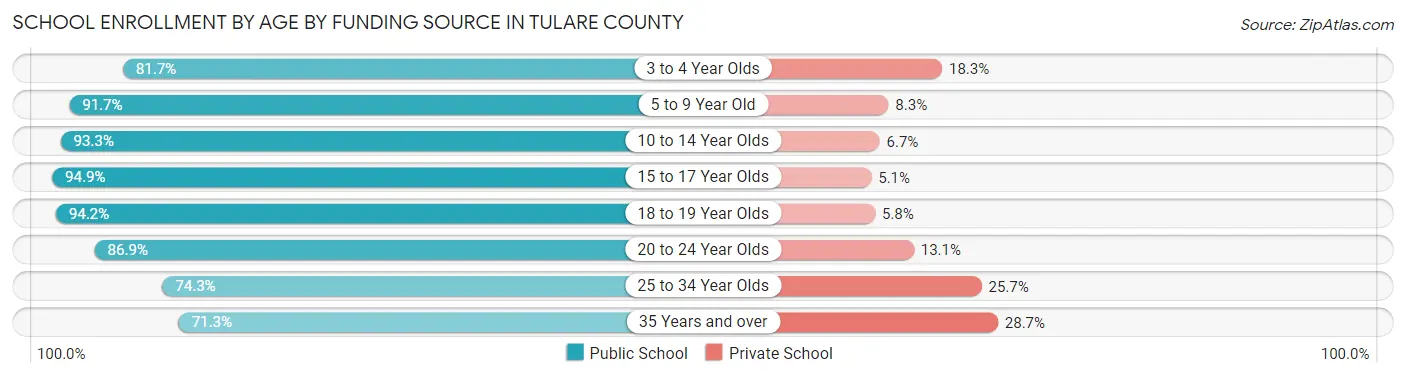
| Age Bracket | Public School | Private School |
| 3 to 4 Year Olds | 3,848 (81.7%) | 863 (18.3%) |
| 5 to 9 Year Old | 34,619 (91.7%) | 3,147 (8.3%) |
| 10 to 14 Year Olds | 39,413 (93.3%) | 2,828 (6.7%) |
| 15 to 17 Year Olds | 22,592 (94.9%) | 1,224 (5.1%) |
| 18 to 19 Year Olds | 9,312 (94.2%) | 577 (5.8%) |
| 20 to 24 Year Olds | 10,312 (86.9%) | 1,549 (13.1%) |
| 25 to 34 Year Olds | 5,287 (74.3%) | 1,827 (25.7%) |
| 35 Years and over | 3,470 (71.3%) | 1,398 (28.7%) |
| Total | 128,893 (90.6%) | 13,373 (9.4%) |
Educational Attainment by Field of Study in Tulare County
Business (7,218 | 15.4%), education (5,874 | 12.6%), bio, nature & agricultural (5,180 | 11.1%), science & technology (4,684 | 10.0%), and arts & humanities (4,067 | 8.7%) are the most common fields of study among 46,789 individuals in Tulare County who have obtained a bachelor's degree or higher.
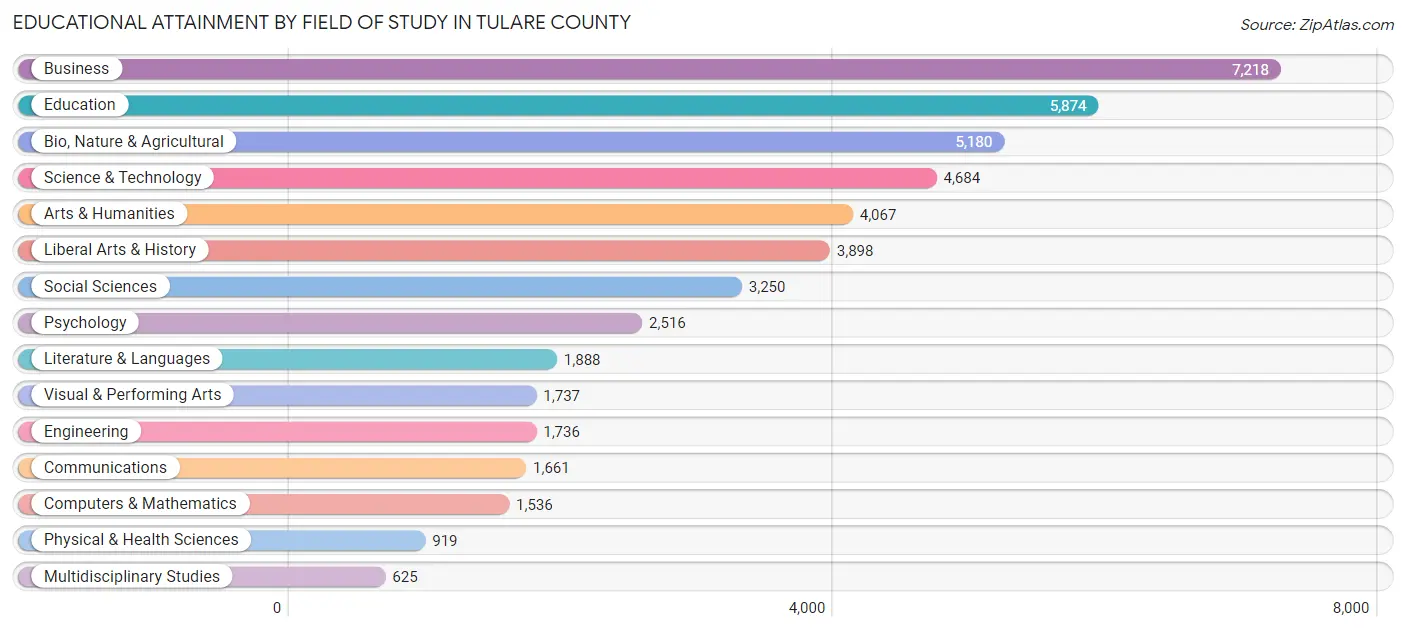
| Field of Study | # Graduates | % Graduates |
| Computers & Mathematics | 1,536 | 3.3% |
| Bio, Nature & Agricultural | 5,180 | 11.1% |
| Physical & Health Sciences | 919 | 2.0% |
| Psychology | 2,516 | 5.4% |
| Social Sciences | 3,250 | 7.0% |
| Engineering | 1,736 | 3.7% |
| Multidisciplinary Studies | 625 | 1.3% |
| Science & Technology | 4,684 | 10.0% |
| Business | 7,218 | 15.4% |
| Education | 5,874 | 12.6% |
| Literature & Languages | 1,888 | 4.0% |
| Liberal Arts & History | 3,898 | 8.3% |
| Visual & Performing Arts | 1,737 | 3.7% |
| Communications | 1,661 | 3.5% |
| Arts & Humanities | 4,067 | 8.7% |
| Total | 46,789 | 100.0% |
Transportation & Commute in Tulare County
Vehicle Availability by Sex in Tulare County
The most prevalent vehicle ownership categories in Tulare County are males with 2 vehicles (42,537, accounting for 40.6%) and females with 2 vehicles (29,160, making up 53.5%).
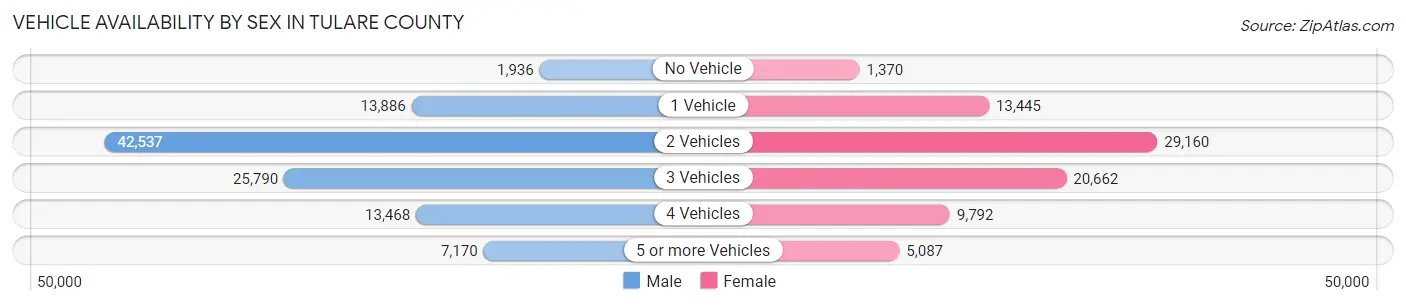
| Vehicles Available | Male | Female |
| No Vehicle | 1,936 (1.8%) | 1,370 (1.7%) |
| 1 Vehicle | 13,886 (13.3%) | 13,445 (16.9%) |
| 2 Vehicles | 42,537 (40.6%) | 29,160 (36.7%) |
| 3 Vehicles | 25,790 (24.6%) | 20,662 (26.0%) |
| 4 Vehicles | 13,468 (12.9%) | 9,792 (12.3%) |
| 5 or more Vehicles | 7,170 (6.8%) | 5,087 (6.4%) |
| Total | 104,787 (100.0%) | 79,516 (100.0%) |
Commute Time in Tulare County
The most frequently occuring commute durations in Tulare County are 10 to 14 minutes (31,262 commuters, 17.9%), 15 to 19 minutes (28,800 commuters, 16.5%), and 5 to 9 minutes (24,986 commuters, 14.3%).
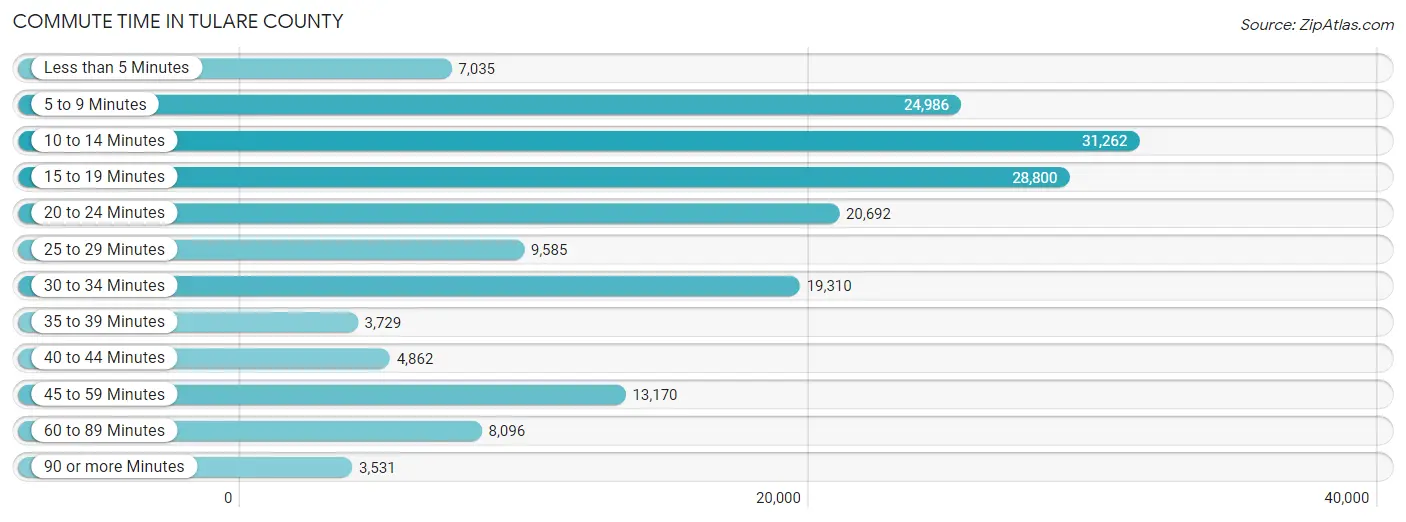
| Commute Time | # Commuters | % Commuters |
| Less than 5 Minutes | 7,035 | 4.0% |
| 5 to 9 Minutes | 24,986 | 14.3% |
| 10 to 14 Minutes | 31,262 | 17.9% |
| 15 to 19 Minutes | 28,800 | 16.5% |
| 20 to 24 Minutes | 20,692 | 11.8% |
| 25 to 29 Minutes | 9,585 | 5.5% |
| 30 to 34 Minutes | 19,310 | 11.0% |
| 35 to 39 Minutes | 3,729 | 2.1% |
| 40 to 44 Minutes | 4,862 | 2.8% |
| 45 to 59 Minutes | 13,170 | 7.5% |
| 60 to 89 Minutes | 8,096 | 4.6% |
| 90 or more Minutes | 3,531 | 2.0% |
Commute Time by Sex in Tulare County
The most common commute times in Tulare County are 10 to 14 minutes (16,574 commuters, 16.5%) for males and 10 to 14 minutes (14,688 commuters, 19.7%) for females.
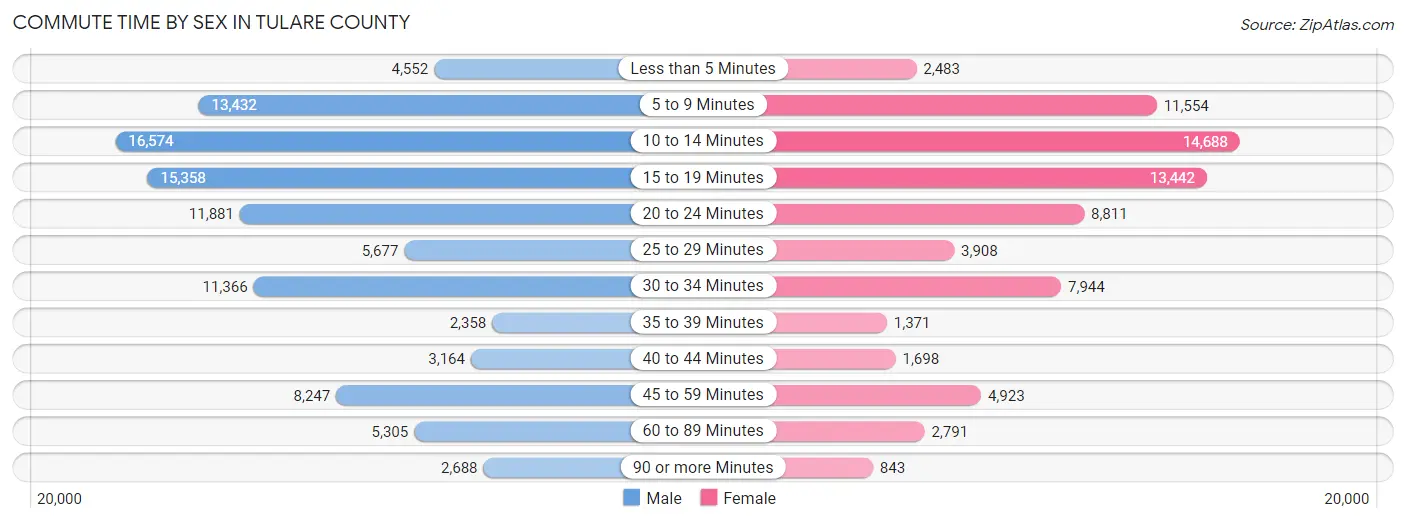
| Commute Time | Male | Female |
| Less than 5 Minutes | 4,552 (4.5%) | 2,483 (3.3%) |
| 5 to 9 Minutes | 13,432 (13.4%) | 11,554 (15.5%) |
| 10 to 14 Minutes | 16,574 (16.5%) | 14,688 (19.7%) |
| 15 to 19 Minutes | 15,358 (15.3%) | 13,442 (18.0%) |
| 20 to 24 Minutes | 11,881 (11.8%) | 8,811 (11.8%) |
| 25 to 29 Minutes | 5,677 (5.6%) | 3,908 (5.2%) |
| 30 to 34 Minutes | 11,366 (11.3%) | 7,944 (10.7%) |
| 35 to 39 Minutes | 2,358 (2.3%) | 1,371 (1.8%) |
| 40 to 44 Minutes | 3,164 (3.2%) | 1,698 (2.3%) |
| 45 to 59 Minutes | 8,247 (8.2%) | 4,923 (6.6%) |
| 60 to 89 Minutes | 5,305 (5.3%) | 2,791 (3.7%) |
| 90 or more Minutes | 2,688 (2.7%) | 843 (1.1%) |
Time of Departure to Work by Sex in Tulare County
The most frequent times of departure to work in Tulare County are 6:00 AM to 6:29 AM (11,972, 11.9%) for males and 7:30 AM to 7:59 AM (13,202, 17.7%) for females.
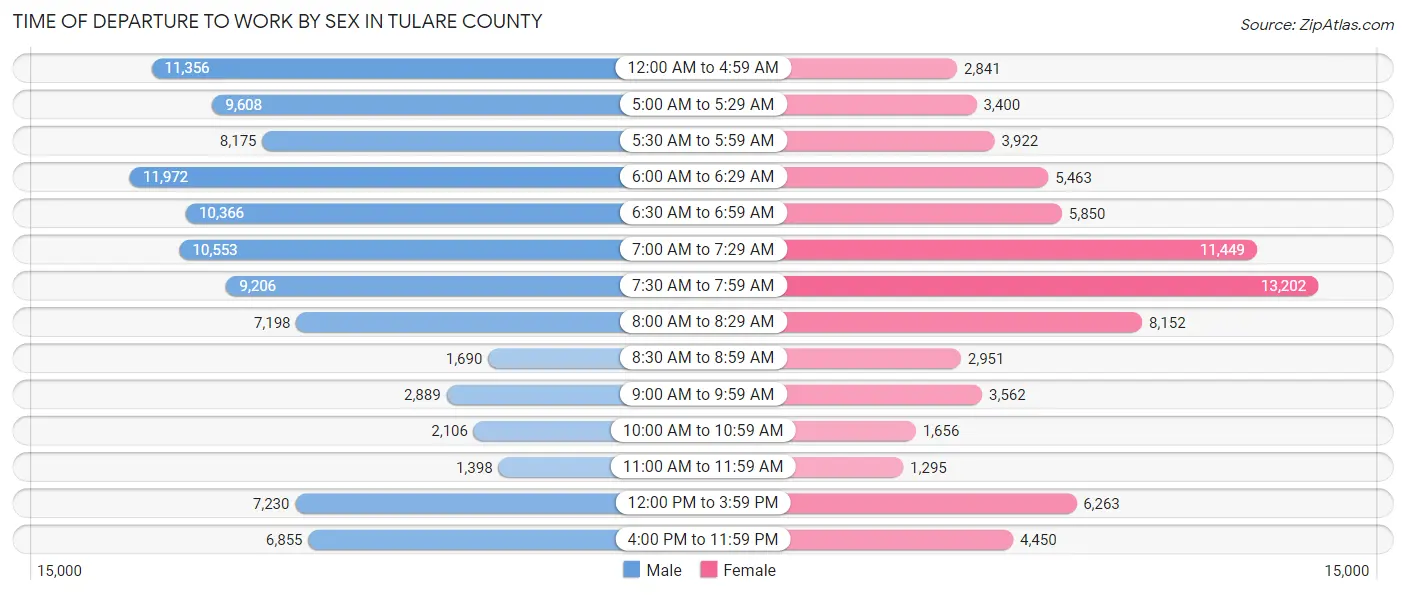
| Time of Departure | Male | Female |
| 12:00 AM to 4:59 AM | 11,356 (11.3%) | 2,841 (3.8%) |
| 5:00 AM to 5:29 AM | 9,608 (9.6%) | 3,400 (4.6%) |
| 5:30 AM to 5:59 AM | 8,175 (8.1%) | 3,922 (5.3%) |
| 6:00 AM to 6:29 AM | 11,972 (11.9%) | 5,463 (7.3%) |
| 6:30 AM to 6:59 AM | 10,366 (10.3%) | 5,850 (7.9%) |
| 7:00 AM to 7:29 AM | 10,553 (10.5%) | 11,449 (15.4%) |
| 7:30 AM to 7:59 AM | 9,206 (9.1%) | 13,202 (17.7%) |
| 8:00 AM to 8:29 AM | 7,198 (7.1%) | 8,152 (11.0%) |
| 8:30 AM to 8:59 AM | 1,690 (1.7%) | 2,951 (4.0%) |
| 9:00 AM to 9:59 AM | 2,889 (2.9%) | 3,562 (4.8%) |
| 10:00 AM to 10:59 AM | 2,106 (2.1%) | 1,656 (2.2%) |
| 11:00 AM to 11:59 AM | 1,398 (1.4%) | 1,295 (1.7%) |
| 12:00 PM to 3:59 PM | 7,230 (7.2%) | 6,263 (8.4%) |
| 4:00 PM to 11:59 PM | 6,855 (6.8%) | 4,450 (6.0%) |
| Total | 100,602 (100.0%) | 74,456 (100.0%) |
Housing Occupancy in Tulare County
Occupancy by Ownership in Tulare County
Of the total 140,670 dwellings in Tulare County, owner-occupied units account for 82,078 (58.4%), while renter-occupied units make up 58,592 (41.6%).
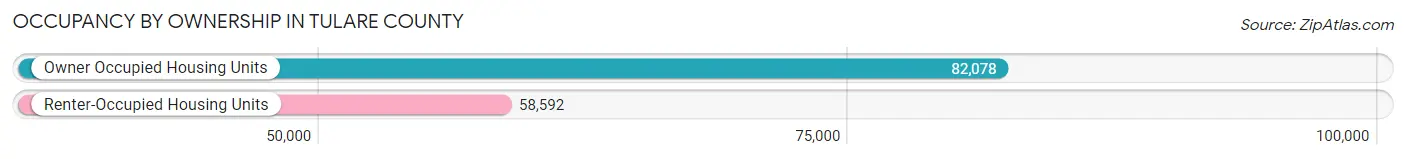
| Occupancy | # Housing Units | % Housing Units |
| Owner Occupied Housing Units | 82,078 | 58.4% |
| Renter-Occupied Housing Units | 58,592 | 41.6% |
| Total Occupied Housing Units | 140,670 | 100.0% |
Occupancy by Household Size in Tulare County
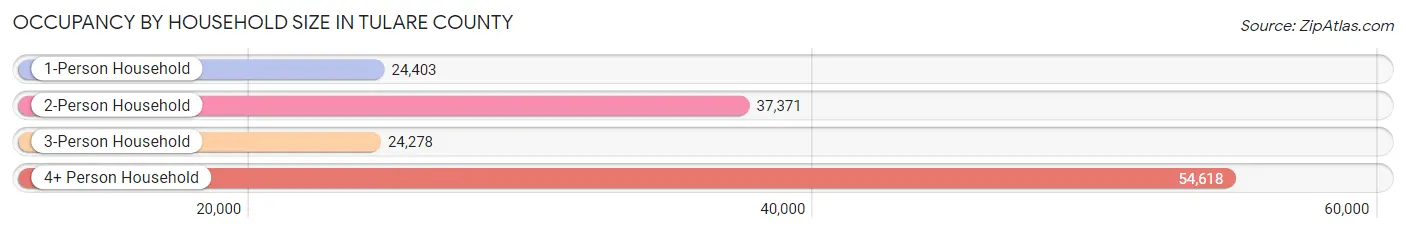
| Household Size | # Housing Units | % Housing Units |
| 1-Person Household | 24,403 | 17.3% |
| 2-Person Household | 37,371 | 26.6% |
| 3-Person Household | 24,278 | 17.3% |
| 4+ Person Household | 54,618 | 38.8% |
| Total Housing Units | 140,670 | 100.0% |
Occupancy by Ownership by Household Size in Tulare County
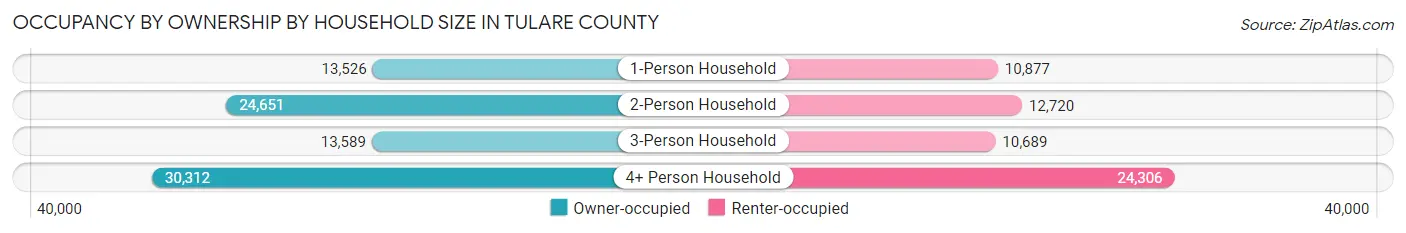
| Household Size | Owner-occupied | Renter-occupied |
| 1-Person Household | 13,526 (55.4%) | 10,877 (44.6%) |
| 2-Person Household | 24,651 (66.0%) | 12,720 (34.0%) |
| 3-Person Household | 13,589 (56.0%) | 10,689 (44.0%) |
| 4+ Person Household | 30,312 (55.5%) | 24,306 (44.5%) |
| Total Housing Units | 82,078 (58.4%) | 58,592 (41.6%) |
Occupancy by Educational Attainment in Tulare County
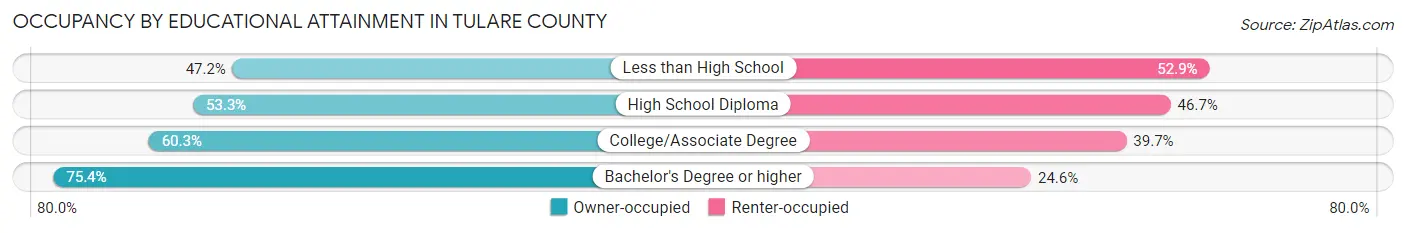
| Household Size | Owner-occupied | Renter-occupied |
| Less than High School | 15,605 (47.1%) | 17,495 (52.8%) |
| High School Diploma | 18,050 (53.3%) | 15,819 (46.7%) |
| College/Associate Degree | 28,605 (60.3%) | 18,822 (39.7%) |
| Bachelor's Degree or higher | 19,818 (75.4%) | 6,456 (24.6%) |
Occupancy by Age of Householder in Tulare County
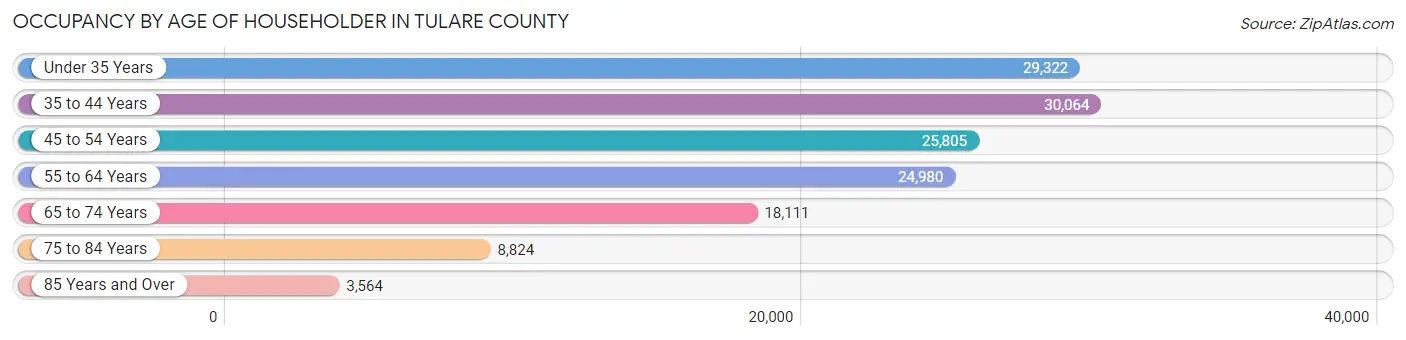
| Age Bracket | # Households | % Households |
| Under 35 Years | 29,322 | 20.8% |
| 35 to 44 Years | 30,064 | 21.4% |
| 45 to 54 Years | 25,805 | 18.3% |
| 55 to 64 Years | 24,980 | 17.8% |
| 65 to 74 Years | 18,111 | 12.9% |
| 75 to 84 Years | 8,824 | 6.3% |
| 85 Years and Over | 3,564 | 2.5% |
| Total | 140,670 | 100.0% |
Housing Finances in Tulare County
Median Income by Occupancy in Tulare County
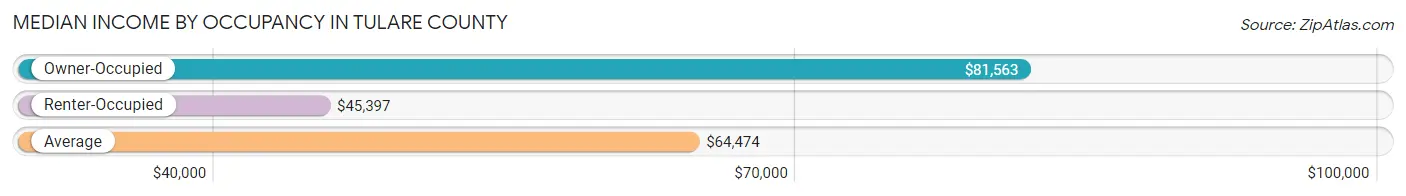
| Occupancy Type | # Households | Median Income |
| Owner-Occupied | 82,078 (58.4%) | $81,563 |
| Renter-Occupied | 58,592 (41.6%) | $45,397 |
| Average | 140,670 (100.0%) | $64,474 |
Occupancy by Householder Income Bracket in Tulare County
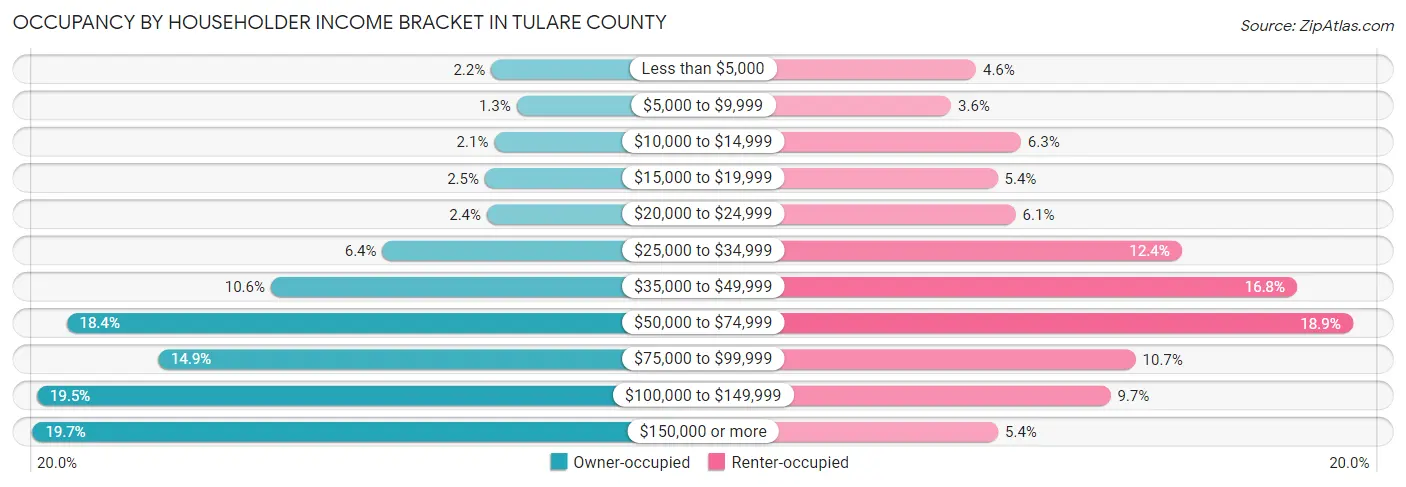
| Income Bracket | Owner-occupied | Renter-occupied |
| Less than $5,000 | 1,827 (2.2%) | 2,692 (4.6%) |
| $5,000 to $9,999 | 1,038 (1.3%) | 2,133 (3.6%) |
| $10,000 to $14,999 | 1,734 (2.1%) | 3,691 (6.3%) |
| $15,000 to $19,999 | 2,028 (2.5%) | 3,169 (5.4%) |
| $20,000 to $24,999 | 1,965 (2.4%) | 3,572 (6.1%) |
| $25,000 to $34,999 | 5,230 (6.4%) | 7,275 (12.4%) |
| $35,000 to $49,999 | 8,714 (10.6%) | 9,849 (16.8%) |
| $50,000 to $74,999 | 15,099 (18.4%) | 11,090 (18.9%) |
| $75,000 to $99,999 | 12,242 (14.9%) | 6,251 (10.7%) |
| $100,000 to $149,999 | 16,030 (19.5%) | 5,689 (9.7%) |
| $150,000 or more | 16,171 (19.7%) | 3,181 (5.4%) |
| Total | 82,078 (100.0%) | 58,592 (100.0%) |
Monthly Housing Cost Tiers in Tulare County
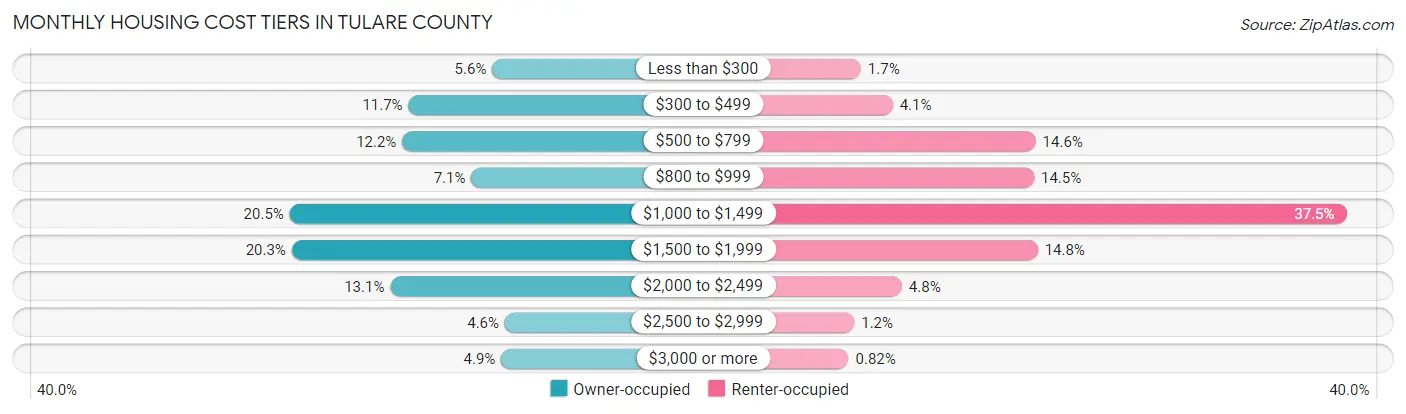
| Monthly Cost | Owner-occupied | Renter-occupied |
| Less than $300 | 4,566 (5.6%) | 1,014 (1.7%) |
| $300 to $499 | 9,630 (11.7%) | 2,387 (4.1%) |
| $500 to $799 | 10,007 (12.2%) | 8,555 (14.6%) |
| $800 to $999 | 5,825 (7.1%) | 8,485 (14.5%) |
| $1,000 to $1,499 | 16,807 (20.5%) | 21,963 (37.5%) |
| $1,500 to $1,999 | 16,690 (20.3%) | 8,644 (14.7%) |
| $2,000 to $2,499 | 10,731 (13.1%) | 2,784 (4.8%) |
| $2,500 to $2,999 | 3,803 (4.6%) | 726 (1.2%) |
| $3,000 or more | 4,019 (4.9%) | 482 (0.8%) |
| Total | 82,078 (100.0%) | 58,592 (100.0%) |
Physical Housing Characteristics in Tulare County
Housing Structures in Tulare County
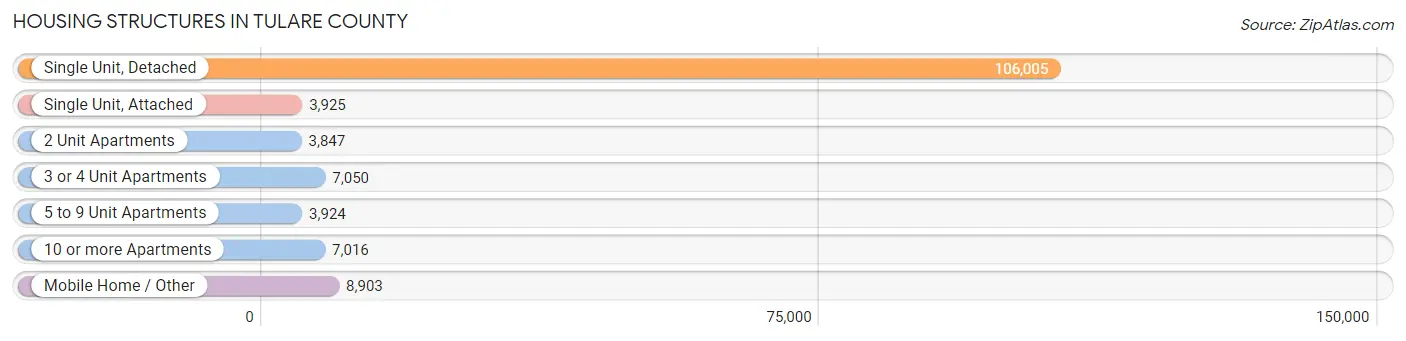
| Structure Type | # Housing Units | % Housing Units |
| Single Unit, Detached | 106,005 | 75.4% |
| Single Unit, Attached | 3,925 | 2.8% |
| 2 Unit Apartments | 3,847 | 2.7% |
| 3 or 4 Unit Apartments | 7,050 | 5.0% |
| 5 to 9 Unit Apartments | 3,924 | 2.8% |
| 10 or more Apartments | 7,016 | 5.0% |
| Mobile Home / Other | 8,903 | 6.3% |
| Total | 140,670 | 100.0% |
Housing Structures by Occupancy in Tulare County
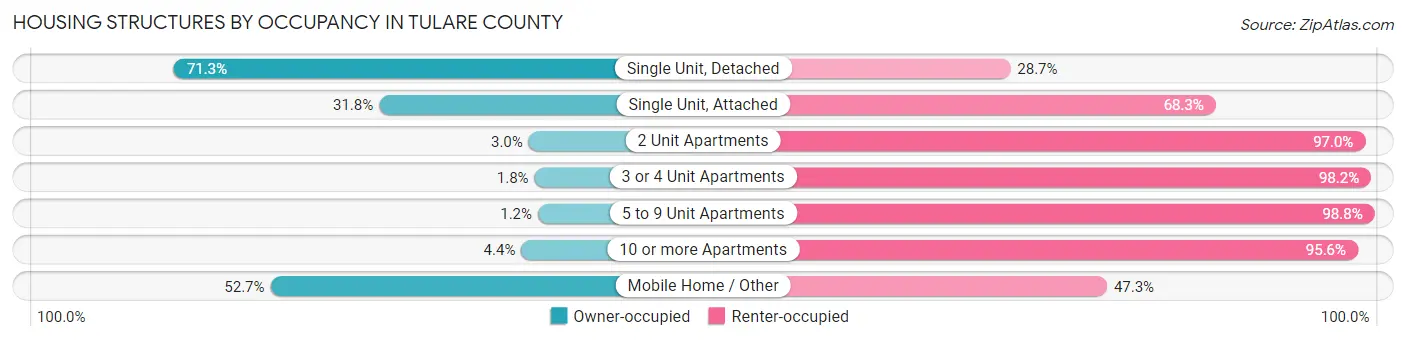
| Structure Type | Owner-occupied | Renter-occupied |
| Single Unit, Detached | 75,545 (71.3%) | 30,460 (28.7%) |
| Single Unit, Attached | 1,246 (31.8%) | 2,679 (68.2%) |
| 2 Unit Apartments | 114 (3.0%) | 3,733 (97.0%) |
| 3 or 4 Unit Apartments | 130 (1.8%) | 6,920 (98.2%) |
| 5 to 9 Unit Apartments | 46 (1.2%) | 3,878 (98.8%) |
| 10 or more Apartments | 307 (4.4%) | 6,709 (95.6%) |
| Mobile Home / Other | 4,690 (52.7%) | 4,213 (47.3%) |
| Total | 82,078 (58.4%) | 58,592 (41.6%) |
Housing Structures by Number of Rooms in Tulare County
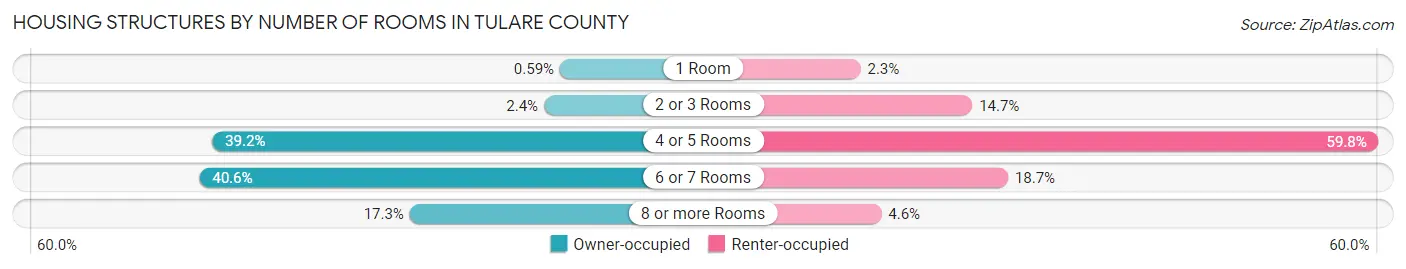
| Number of Rooms | Owner-occupied | Renter-occupied |
| 1 Room | 485 (0.6%) | 1,340 (2.3%) |
| 2 or 3 Rooms | 1,940 (2.4%) | 8,604 (14.7%) |
| 4 or 5 Rooms | 32,161 (39.2%) | 35,024 (59.8%) |
| 6 or 7 Rooms | 33,329 (40.6%) | 10,928 (18.6%) |
| 8 or more Rooms | 14,163 (17.3%) | 2,696 (4.6%) |
| Total | 82,078 (100.0%) | 58,592 (100.0%) |
Housing Structure by Heating Type in Tulare County
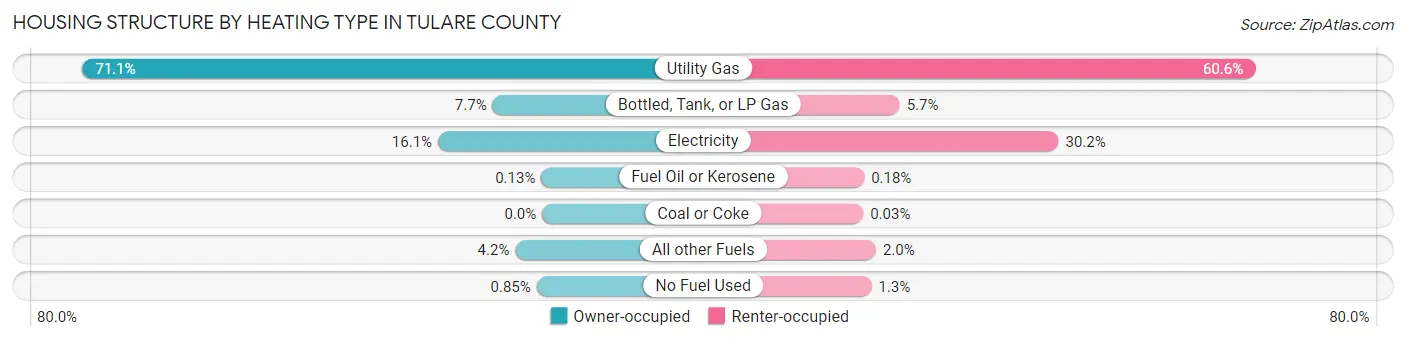
| Heating Type | Owner-occupied | Renter-occupied |
| Utility Gas | 58,345 (71.1%) | 35,501 (60.6%) |
| Bottled, Tank, or LP Gas | 6,298 (7.7%) | 3,321 (5.7%) |
| Electricity | 13,222 (16.1%) | 17,706 (30.2%) |
| Fuel Oil or Kerosene | 108 (0.1%) | 107 (0.2%) |
| Coal or Coke | 0 (0.0%) | 20 (0.0%) |
| All other Fuels | 3,405 (4.2%) | 1,177 (2.0%) |
| No Fuel Used | 700 (0.9%) | 760 (1.3%) |
| Total | 82,078 (100.0%) | 58,592 (100.0%) |
Household Vehicle Usage in Tulare County
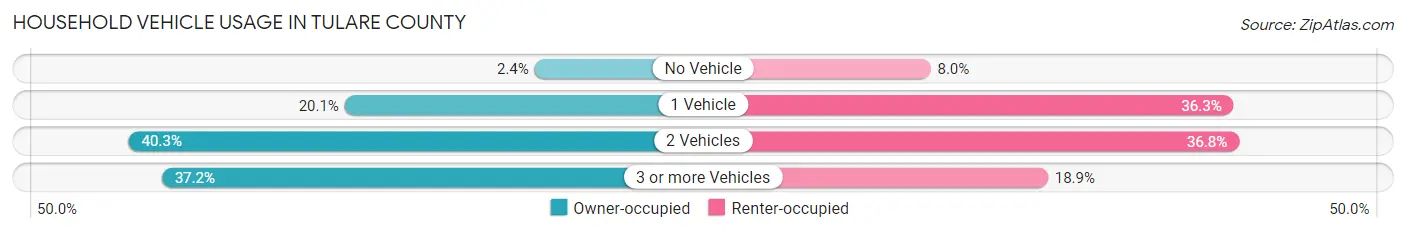
| Vehicles per Household | Owner-occupied | Renter-occupied |
| No Vehicle | 1,960 (2.4%) | 4,683 (8.0%) |
| 1 Vehicle | 16,513 (20.1%) | 21,254 (36.3%) |
| 2 Vehicles | 33,074 (40.3%) | 21,557 (36.8%) |
| 3 or more Vehicles | 30,531 (37.2%) | 11,098 (18.9%) |
| Total | 82,078 (100.0%) | 58,592 (100.0%) |
Real Estate & Mortgages in Tulare County
Real Estate and Mortgage Overview in Tulare County
| Characteristic | Without Mortgage | With Mortgage |
| Housing Units | 27,086 | 54,992 |
| Median Property Value | $246,500 | $292,600 |
| Median Household Income | $62,834 | $12,453 |
| Monthly Housing Costs | $498 | $3,918 |
| Real Estate Taxes | $1,554 | $1,616 |
Property Value by Mortgage Status in Tulare County
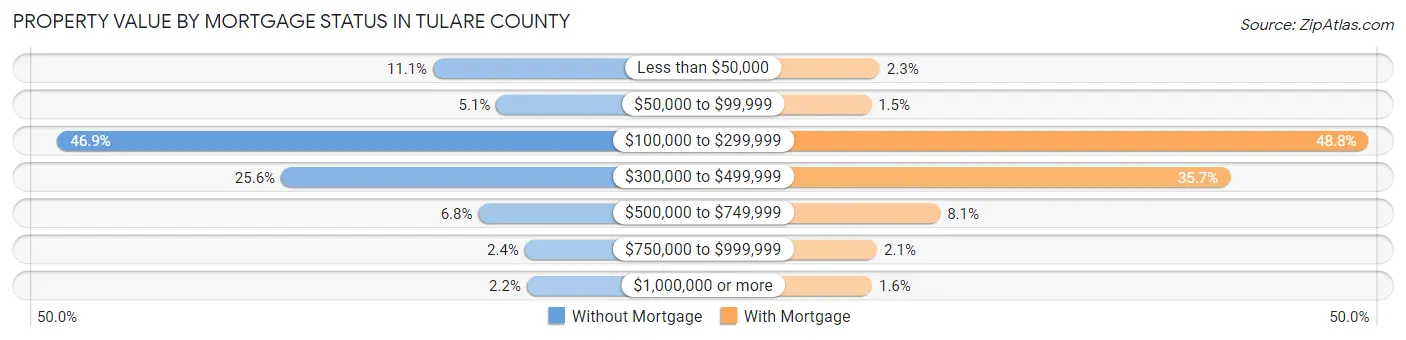
| Property Value | Without Mortgage | With Mortgage |
| Less than $50,000 | 3,008 (11.1%) | 1,274 (2.3%) |
| $50,000 to $99,999 | 1,379 (5.1%) | 822 (1.5%) |
| $100,000 to $299,999 | 12,695 (46.9%) | 26,859 (48.8%) |
| $300,000 to $499,999 | 6,932 (25.6%) | 19,608 (35.7%) |
| $500,000 to $749,999 | 1,840 (6.8%) | 4,433 (8.1%) |
| $750,000 to $999,999 | 641 (2.4%) | 1,132 (2.1%) |
| $1,000,000 or more | 591 (2.2%) | 864 (1.6%) |
| Total | 27,086 (100.0%) | 54,992 (100.0%) |
Household Income by Mortgage Status in Tulare County
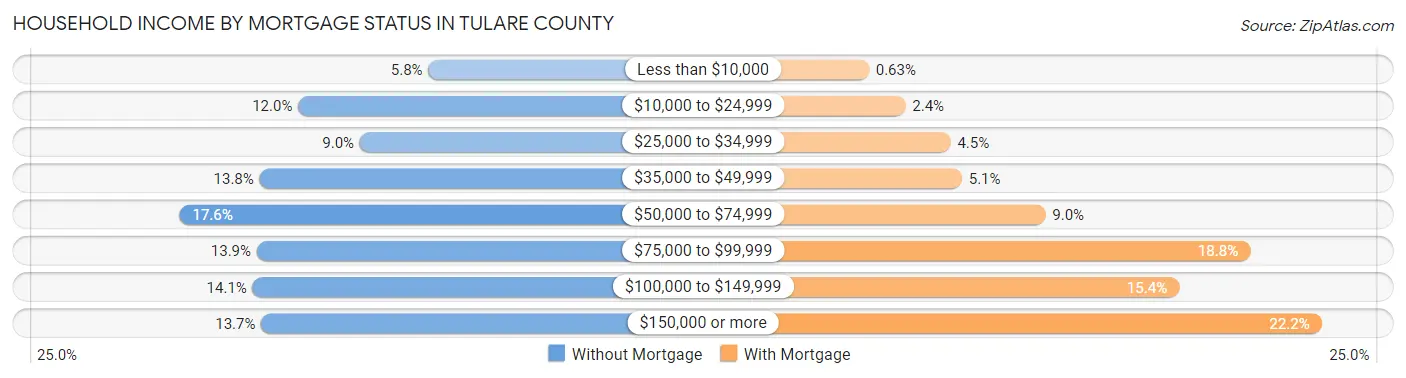
| Household Income | Without Mortgage | With Mortgage |
| Less than $10,000 | 1,564 (5.8%) | 344 (0.6%) |
| $10,000 to $24,999 | 3,241 (12.0%) | 1,301 (2.4%) |
| $25,000 to $34,999 | 2,447 (9.0%) | 2,486 (4.5%) |
| $35,000 to $49,999 | 3,740 (13.8%) | 2,783 (5.1%) |
| $50,000 to $74,999 | 4,772 (17.6%) | 4,974 (9.0%) |
| $75,000 to $99,999 | 3,775 (13.9%) | 10,327 (18.8%) |
| $100,000 to $149,999 | 3,829 (14.1%) | 8,467 (15.4%) |
| $150,000 or more | 3,718 (13.7%) | 12,201 (22.2%) |
| Total | 27,086 (100.0%) | 54,992 (100.0%) |
Property Value to Household Income Ratio in Tulare County
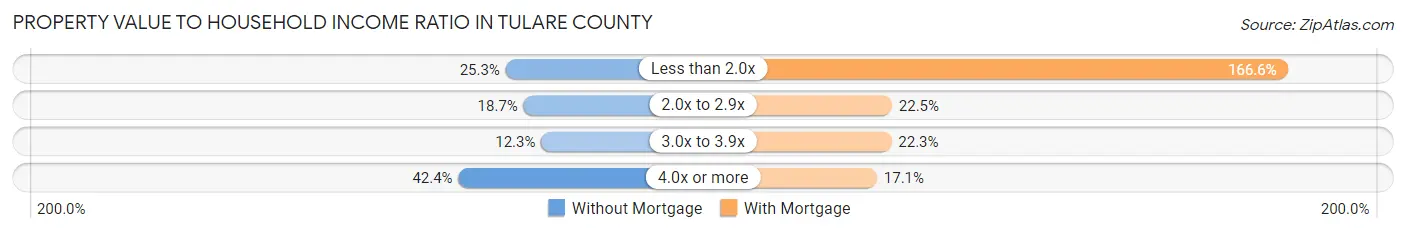
| Value-to-Income Ratio | Without Mortgage | With Mortgage |
| Less than 2.0x | 6,841 (25.3%) | 91,612 (166.6%) |
| 2.0x to 2.9x | 5,073 (18.7%) | 12,373 (22.5%) |
| 3.0x to 3.9x | 3,339 (12.3%) | 12,271 (22.3%) |
| 4.0x or more | 11,489 (42.4%) | 9,378 (17.1%) |
| Total | 27,086 (100.0%) | 54,992 (100.0%) |
Real Estate Taxes by Mortgage Status in Tulare County
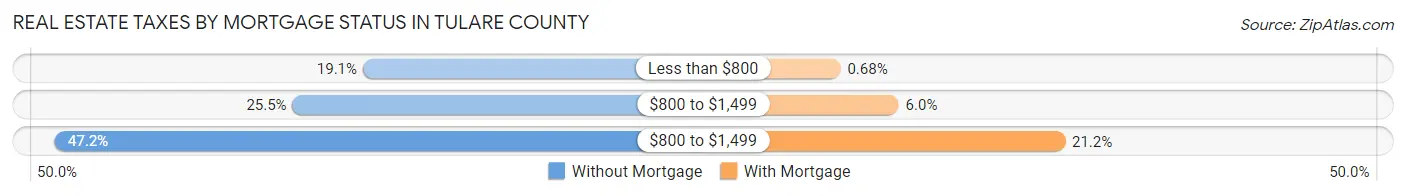
| Property Taxes | Without Mortgage | With Mortgage |
| Less than $800 | 5,176 (19.1%) | 373 (0.7%) |
| $800 to $1,499 | 6,918 (25.5%) | 3,295 (6.0%) |
| $800 to $1,499 | 12,794 (47.2%) | 11,652 (21.2%) |
| Total | 27,086 (100.0%) | 54,992 (100.0%) |
Health & Disability in Tulare County
Health Insurance Coverage by Age in Tulare County
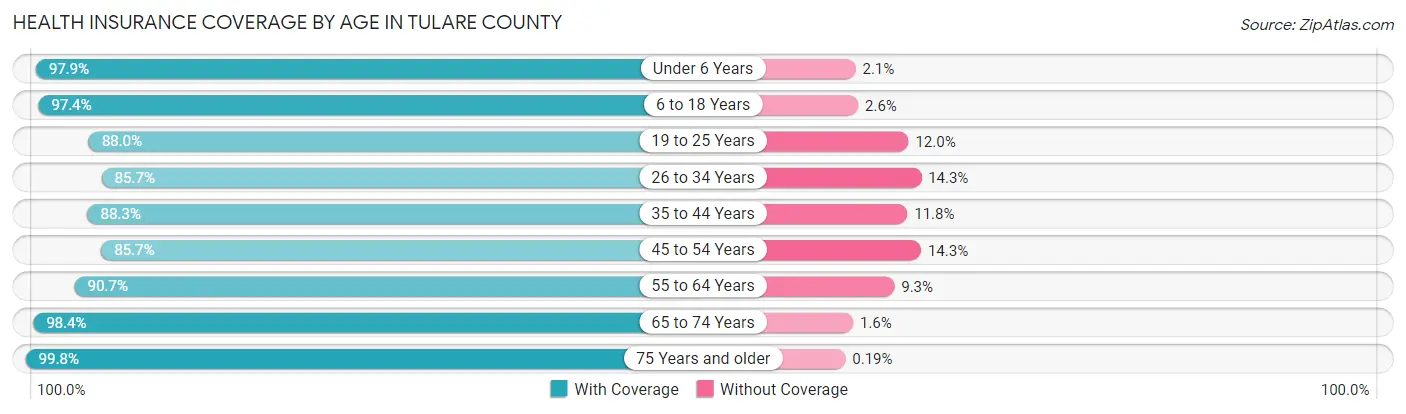
| Age Bracket | With Coverage | Without Coverage |
| Under 6 Years | 42,276 (97.9%) | 906 (2.1%) |
| 6 to 18 Years | 104,517 (97.4%) | 2,762 (2.6%) |
| 19 to 25 Years | 42,735 (88.0%) | 5,809 (12.0%) |
| 26 to 34 Years | 50,034 (85.7%) | 8,379 (14.3%) |
| 35 to 44 Years | 53,606 (88.2%) | 7,136 (11.7%) |
| 45 to 54 Years | 44,158 (85.7%) | 7,369 (14.3%) |
| 55 to 64 Years | 42,080 (90.7%) | 4,325 (9.3%) |
| 65 to 74 Years | 31,744 (98.4%) | 518 (1.6%) |
| 75 Years and older | 20,718 (99.8%) | 40 (0.2%) |
| Total | 431,868 (92.1%) | 37,244 (7.9%) |
Health Insurance Coverage by Citizenship Status in Tulare County
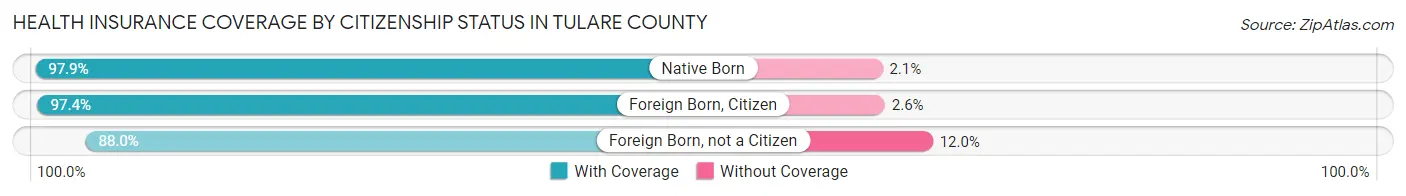
| Citizenship Status | With Coverage | Without Coverage |
| Native Born | 42,276 (97.9%) | 906 (2.1%) |
| Foreign Born, Citizen | 104,517 (97.4%) | 2,762 (2.6%) |
| Foreign Born, not a Citizen | 42,735 (88.0%) | 5,809 (12.0%) |
Health Insurance Coverage by Household Income in Tulare County
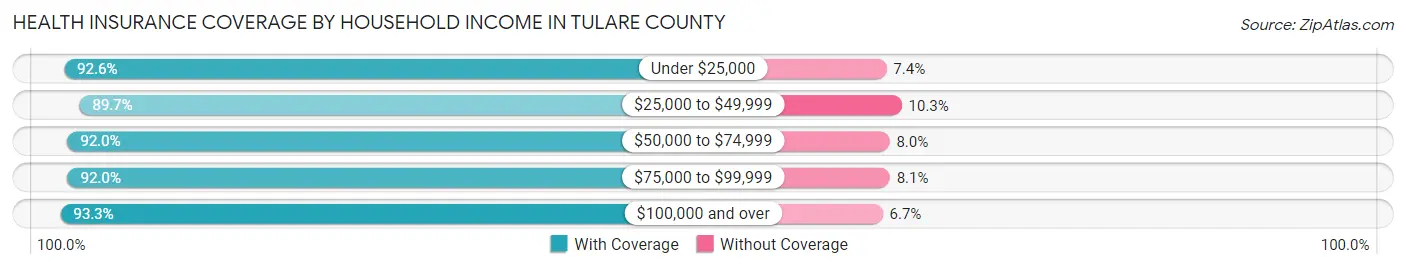
| Household Income | With Coverage | Without Coverage |
| Under $25,000 | 55,297 (92.6%) | 4,434 (7.4%) |
| $25,000 to $49,999 | 86,536 (89.7%) | 9,903 (10.3%) |
| $50,000 to $74,999 | 80,287 (92.0%) | 6,978 (8.0%) |
| $75,000 to $99,999 | 58,342 (91.9%) | 5,106 (8.1%) |
| $100,000 and over | 149,249 (93.3%) | 10,733 (6.7%) |
Public vs Private Health Insurance Coverage by Age in Tulare County
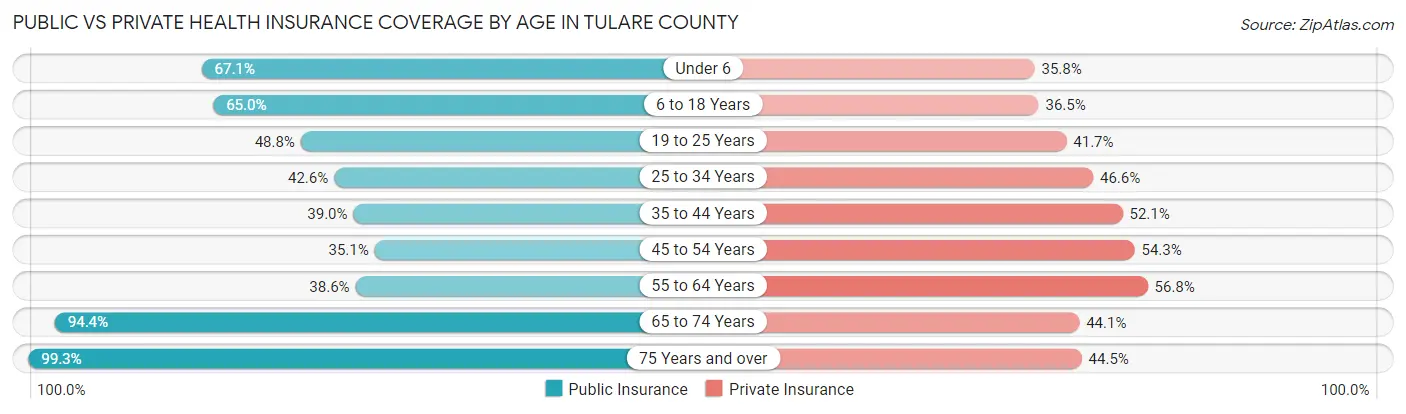
| Age Bracket | Public Insurance | Private Insurance |
| Under 6 | 28,991 (67.1%) | 15,452 (35.8%) |
| 6 to 18 Years | 69,705 (65.0%) | 39,174 (36.5%) |
| 19 to 25 Years | 23,666 (48.7%) | 20,234 (41.7%) |
| 25 to 34 Years | 24,862 (42.6%) | 27,246 (46.6%) |
| 35 to 44 Years | 23,680 (39.0%) | 31,650 (52.1%) |
| 45 to 54 Years | 18,059 (35.0%) | 28,001 (54.3%) |
| 55 to 64 Years | 17,912 (38.6%) | 26,339 (56.8%) |
| 65 to 74 Years | 30,449 (94.4%) | 14,217 (44.1%) |
| 75 Years and over | 20,613 (99.3%) | 9,242 (44.5%) |
| Total | 257,937 (55.0%) | 211,555 (45.1%) |
Disability Status by Sex by Age in Tulare County
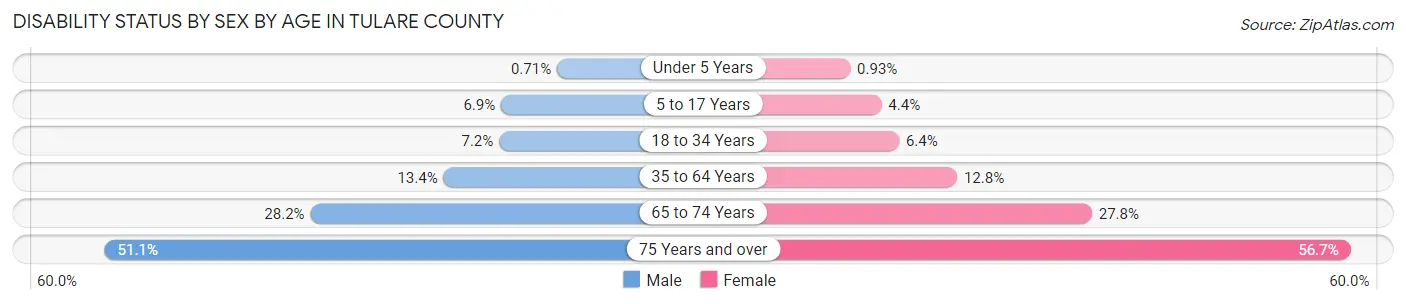
| Age Bracket | Male | Female |
| Under 5 Years | 128 (0.7%) | 159 (0.9%) |
| 5 to 17 Years | 3,822 (6.9%) | 2,313 (4.4%) |
| 18 to 34 Years | 4,134 (7.1%) | 3,615 (6.4%) |
| 35 to 64 Years | 10,659 (13.4%) | 10,120 (12.8%) |
| 65 to 74 Years | 4,321 (28.2%) | 4,711 (27.8%) |
| 75 Years and over | 4,508 (51.1%) | 6,760 (56.7%) |
Disability Class by Sex by Age in Tulare County
Disability Class: Hearing Difficulty
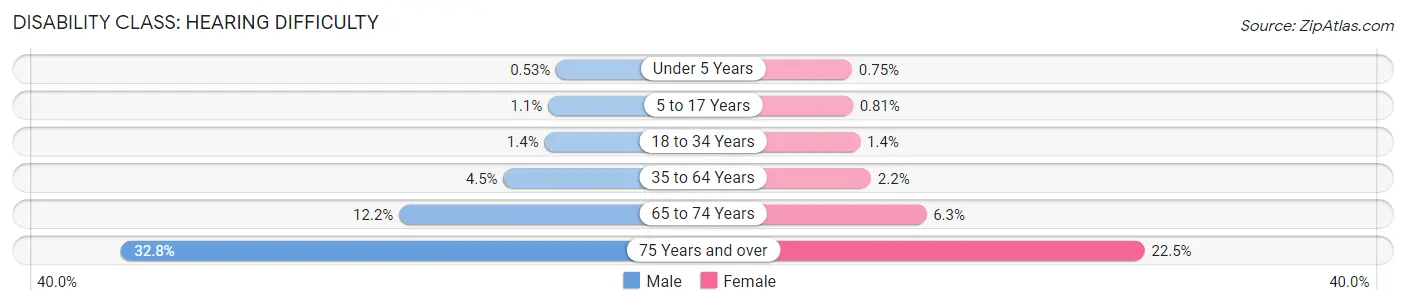
| Age Bracket | Male | Female |
| Under 5 Years | 96 (0.5%) | 128 (0.7%) |
| 5 to 17 Years | 622 (1.1%) | 425 (0.8%) |
| 18 to 34 Years | 812 (1.4%) | 773 (1.4%) |
| 35 to 64 Years | 3,553 (4.4%) | 1,701 (2.2%) |
| 65 to 74 Years | 1,870 (12.2%) | 1,061 (6.3%) |
| 75 Years and over | 2,896 (32.8%) | 2,681 (22.5%) |
Disability Class: Vision Difficulty
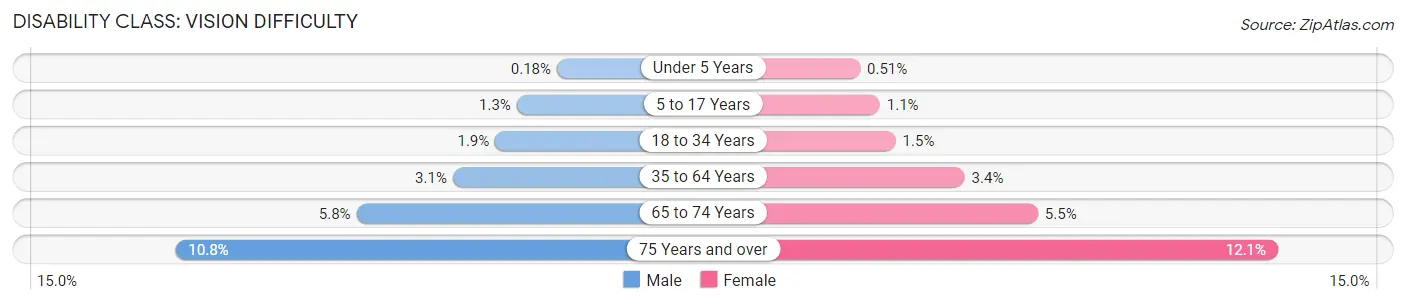
| Age Bracket | Male | Female |
| Under 5 Years | 32 (0.2%) | 88 (0.5%) |
| 5 to 17 Years | 718 (1.3%) | 557 (1.1%) |
| 18 to 34 Years | 1,099 (1.9%) | 851 (1.5%) |
| 35 to 64 Years | 2,456 (3.1%) | 2,699 (3.4%) |
| 65 to 74 Years | 884 (5.8%) | 924 (5.5%) |
| 75 Years and over | 953 (10.8%) | 1,449 (12.1%) |
Disability Class: Cognitive Difficulty
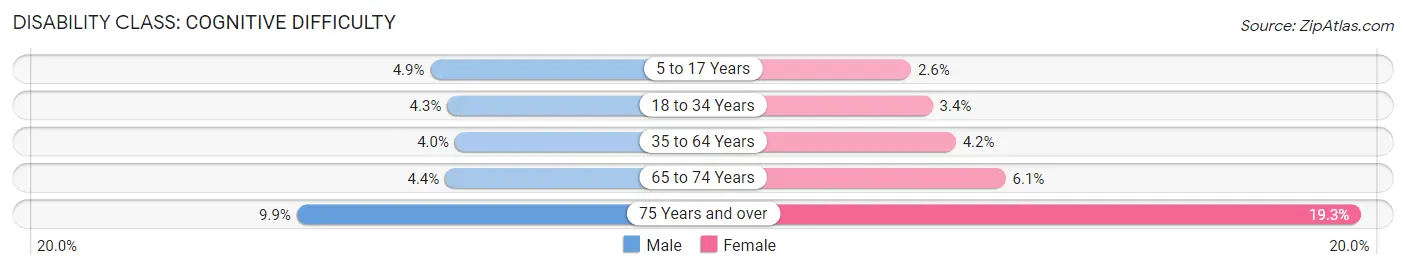
| Age Bracket | Male | Female |
| 5 to 17 Years | 2,724 (4.9%) | 1,350 (2.6%) |
| 18 to 34 Years | 2,494 (4.3%) | 1,911 (3.4%) |
| 35 to 64 Years | 3,218 (4.0%) | 3,332 (4.2%) |
| 65 to 74 Years | 674 (4.4%) | 1,029 (6.1%) |
| 75 Years and over | 874 (9.9%) | 2,301 (19.3%) |
Disability Class: Ambulatory Difficulty
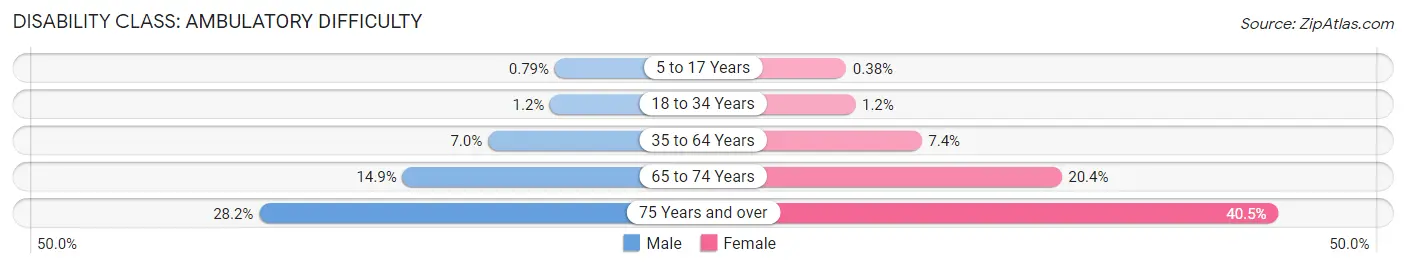
| Age Bracket | Male | Female |
| 5 to 17 Years | 435 (0.8%) | 197 (0.4%) |
| 18 to 34 Years | 703 (1.2%) | 700 (1.2%) |
| 35 to 64 Years | 5,580 (7.0%) | 5,818 (7.4%) |
| 65 to 74 Years | 2,291 (14.9%) | 3,447 (20.4%) |
| 75 Years and over | 2,492 (28.2%) | 4,835 (40.5%) |
Disability Class: Self-Care Difficulty
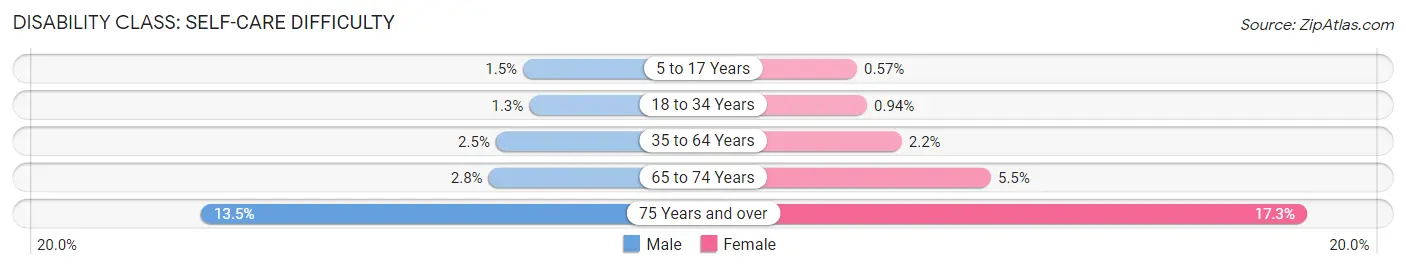
| Age Bracket | Male | Female |
| 5 to 17 Years | 824 (1.5%) | 301 (0.6%) |
| 18 to 34 Years | 733 (1.3%) | 533 (0.9%) |
| 35 to 64 Years | 2,006 (2.5%) | 1,758 (2.2%) |
| 65 to 74 Years | 427 (2.8%) | 937 (5.5%) |
| 75 Years and over | 1,187 (13.5%) | 2,060 (17.3%) |
Technology Access in Tulare County
Computing Device Access in Tulare County
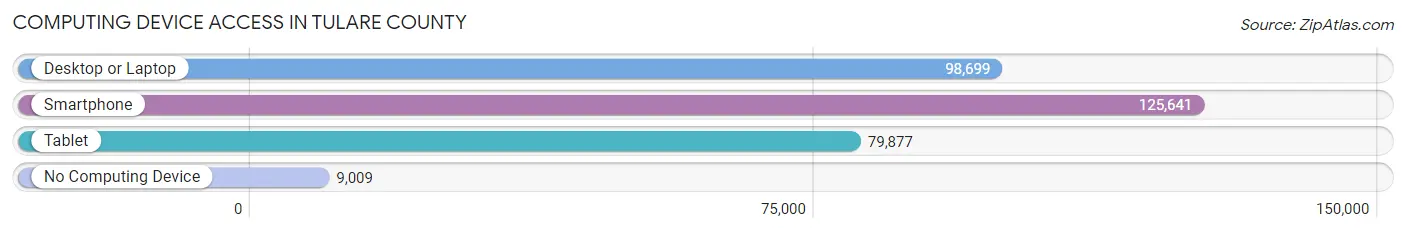
| Device Type | # Households | % Households |
| Desktop or Laptop | 98,699 | 70.2% |
| Smartphone | 125,641 | 89.3% |
| Tablet | 79,877 | 56.8% |
| No Computing Device | 9,009 | 6.4% |
| Total | 140,670 | 100.0% |
Internet Access in Tulare County
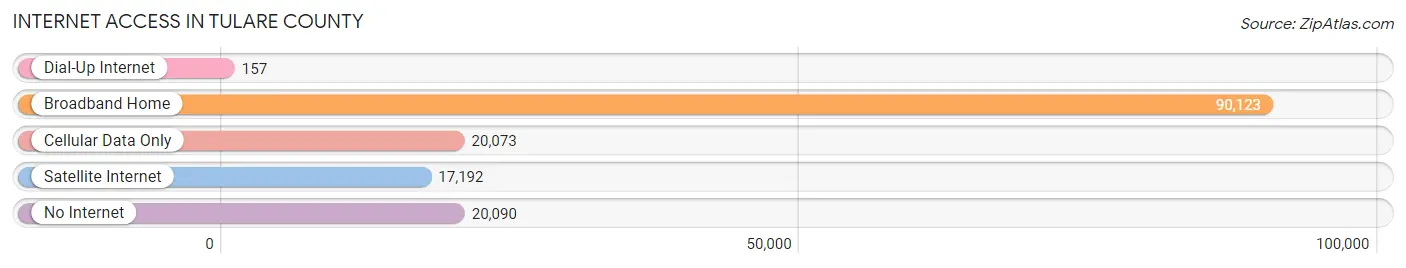
| Internet Type | # Households | % Households |
| Dial-Up Internet | 157 | 0.1% |
| Broadband Home | 90,123 | 64.1% |
| Cellular Data Only | 20,073 | 14.3% |
| Satellite Internet | 17,192 | 12.2% |
| No Internet | 20,090 | 14.3% |
| Total | 140,670 | 100.0% |
Tulare County Summary
Tulare County is located in the Central Valley of California, and is the second largest county in the state. It is bordered by Fresno County to the north, Kern County to the east, Kings County to the south, and Merced County to the west. The county seat is Visalia, and the largest city is Tulare. The county has a total area of 4,863 square miles, making it the second largest county in California.
History
Tulare County was formed in 1852 from parts of Mariposa, Fresno, and Kern counties. It was named after the Tulare Lake, which was once the largest freshwater lake west of the Great Lakes. The lake was formed by the Kings River, which still runs through the county today.
The first inhabitants of the area were the Yokuts, who lived in the area for thousands of years before the arrival of Europeans. The first Europeans to explore the area were Spanish missionaries, who arrived in the late 1700s. The area was later settled by ranchers and farmers, and the county was officially established in 1852.
Geography
Tulare County is located in the Central Valley of California, and is bordered by Fresno County to the north, Kern County to the east, Kings County to the south, and Merced County to the west. The county has a total area of 4,863 square miles, making it the second largest county in California.
The county is divided into two distinct regions: the Sierra Nevada Mountains to the east, and the San Joaquin Valley to the west. The Sierra Nevada Mountains are home to Sequoia National Park, which is known for its giant sequoia trees. The San Joaquin Valley is home to the cities of Visalia, Tulare, and Porterville.
The county is home to several rivers, including the Kings River, Kaweah River, Tule River, and Kern River. The Kings River is the largest river in the county, and is the source of the Tulare Lake. The lake is now mostly dry, but was once the largest freshwater lake west of the Great Lakes.
Economy
Tulare County has a diverse economy, with agriculture, manufacturing, and tourism being the main industries. Agriculture is the largest industry in the county, and is responsible for over half of the county’s total economic output. The county is home to some of the most productive agricultural land in the world, and is a major producer of dairy products, fruits, vegetables, and nuts.
Manufacturing is also an important part of the county’s economy, with companies such as Kaweah Container, Tulare County Plastics, and Tulare County Steel being major employers. Tourism is also an important part of the county’s economy, with Sequoia National Park and other attractions drawing visitors from around the world.
Demographics
As of the 2010 census, Tulare County had a population of 442,179. The population is made up of a diverse mix of ethnicities, with the largest groups being Hispanic (47.2%), White (37.2%), and Asian (7.2%). The median household income in the county is $45,845, and the median age is 30.7 years.
Conclusion
Tulare County is a large and diverse county located in the Central Valley of California. It is home to Sequoia National Park, and is a major producer of agricultural products. The county has a diverse economy, with agriculture, manufacturing, and tourism being the main industries. The population is made up of a diverse mix of ethnicities, with the largest groups being Hispanic, White, and Asian.
Common Questions
What is Per Capita Income in Tulare County?
Per Capita income in Tulare County is $26,282.
What is the Median Family Income in Tulare County?
Median Family Income in Tulare County is $67,525.
What is the Median Household income in Tulare County?
Median Household Income in Tulare County is $64,474.
What is Income or Wage Gap in Tulare County?
Income or Wage Gap in Tulare County is 26.0%.
Women in Tulare County earn 74.0 cents for every dollar earned by a man.
What is Family Income Deficit in Tulare County?
Family Income Deficit in Tulare County is $12,091.
Families that are below poverty line in Tulare County earn $12,091 less on average than the poverty threshold level.
What is Inequality or Gini Index in Tulare County?
Inequality or Gini Index in Tulare County is 0.45.
What is the Total Population of Tulare County?
Total Population of Tulare County is 473,446.
What is the Total Male Population of Tulare County?
Total Male Population of Tulare County is 238,140.
What is the Total Female Population of Tulare County?
Total Female Population of Tulare County is 235,306.
What is the Ratio of Males per 100 Females in Tulare County?
There are 101.20 Males per 100 Females in Tulare County.
What is the Ratio of Females per 100 Males in Tulare County?
There are 98.81 Females per 100 Males in Tulare County.
What is the Median Population Age in Tulare County?
Median Population Age in Tulare County is 31.5 Years.
What is the Average Family Size in Tulare County
Average Family Size in Tulare County is 3.8 People.
What is the Average Household Size in Tulare County
Average Household Size in Tulare County is 3.3 People.
How Large is the Labor Force in Tulare County?
There are 210,434 People in the Labor Forcein in Tulare County.
What is the Percentage of People in the Labor Force in Tulare County?
60.7% of People are in the Labor Force in Tulare County.
What is the Unemployment Rate in Tulare County?
Unemployment Rate in Tulare County is 9.0%.