Tehama County, CA Map & Demographics
Tehama County Map
Tehama County Overview
$33,800
PER CAPITA INCOME
$73,102
AVG FAMILY INCOME
$59,029
AVG HOUSEHOLD INCOME
20.8%
WAGE / INCOME GAP [ % ]
79.2¢/ $1
WAGE / INCOME GAP [ $ ]
$10,488
FAMILY INCOME DEFICIT
0.51
INEQUALITY / GINI INDEX
65,484
TOTAL POPULATION
32,562
MALE POPULATION
32,922
FEMALE POPULATION
98.91
MALES / 100 FEMALES
101.11
FEMALES / 100 MALES
40.3
MEDIAN AGE
3.2
AVG FAMILY SIZE
2.6
AVG HOUSEHOLD SIZE
27,655
LABOR FORCE [ PEOPLE ]
53.6%
PERCENT IN LABOR FORCE
7.4%
UNEMPLOYMENT RATE
Tehama County Area Codes
Income in Tehama County
Income Overview in Tehama County
Per Capita Income in Tehama County is $33,800, while median incomes of families and households are $73,102 and $59,029 respectively.
| Characteristic | Number | Measure |
| Per Capita Income | 65,484 | $33,800 |
| Median Family Income | 16,803 | $73,102 |
| Mean Family Income | 16,803 | $104,502 |
| Median Household Income | 24,623 | $59,029 |
| Mean Household Income | 24,623 | $87,477 |
| Income Deficit | 16,803 | $10,488 |
| Wage / Income Gap (%) | 65,484 | 20.83% |
| Wage / Income Gap ($) | 65,484 | 79.17¢ per $1 |
| Gini / Inequality Index | 65,484 | 0.51 |
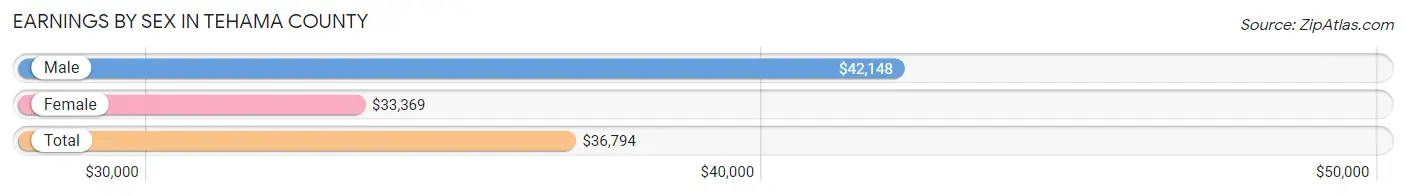
Earnings by Sex in Tehama County
Average Earnings in Tehama County are $36,794, $42,148 for men and $33,369 for women, a difference of 20.8%.
| Sex | Number | Average Earnings |
| Male | 15,191 (53.2%) | $42,148 |
| Female | 13,357 (46.8%) | $33,369 |
| Total | 28,548 (100.0%) | $36,794 |
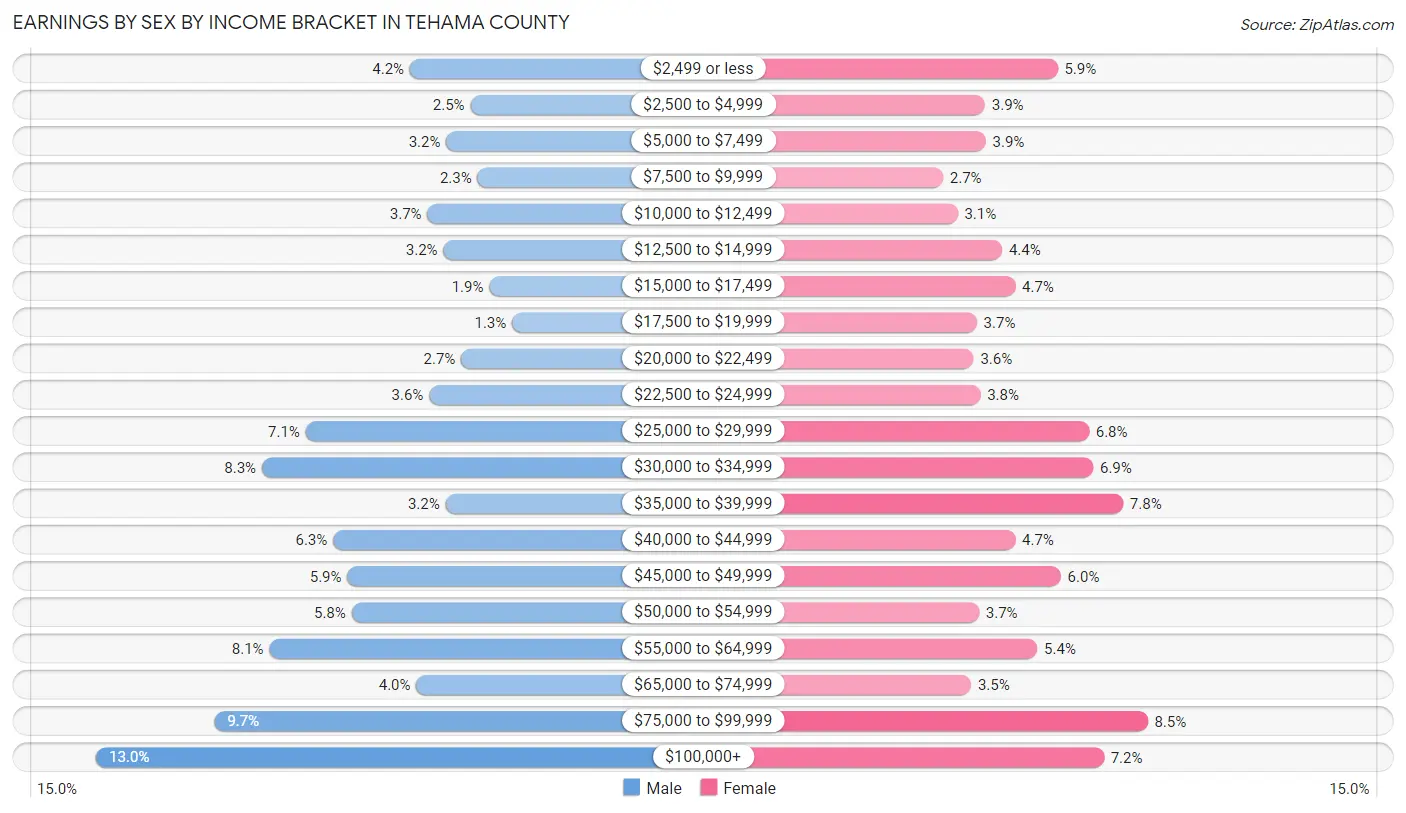
Earnings by Sex by Income Bracket in Tehama County
The most common earnings brackets in Tehama County are $100,000+ for men (1,973 | 13.0%) and $75,000 to $99,999 for women (1,129 | 8.5%).
| Income | Male | Female |
| $2,499 or less | 633 (4.2%) | 791 (5.9%) |
| $2,500 to $4,999 | 375 (2.5%) | 518 (3.9%) |
| $5,000 to $7,499 | 478 (3.2%) | 521 (3.9%) |
| $7,500 to $9,999 | 345 (2.3%) | 361 (2.7%) |
| $10,000 to $12,499 | 559 (3.7%) | 416 (3.1%) |
| $12,500 to $14,999 | 491 (3.2%) | 582 (4.4%) |
| $15,000 to $17,499 | 295 (1.9%) | 632 (4.7%) |
| $17,500 to $19,999 | 197 (1.3%) | 488 (3.6%) |
| $20,000 to $22,499 | 414 (2.7%) | 475 (3.6%) |
| $22,500 to $24,999 | 552 (3.6%) | 501 (3.7%) |
| $25,000 to $29,999 | 1,079 (7.1%) | 908 (6.8%) |
| $30,000 to $34,999 | 1,266 (8.3%) | 924 (6.9%) |
| $35,000 to $39,999 | 482 (3.2%) | 1,037 (7.8%) |
| $40,000 to $44,999 | 961 (6.3%) | 632 (4.7%) |
| $45,000 to $49,999 | 901 (5.9%) | 803 (6.0%) |
| $50,000 to $54,999 | 882 (5.8%) | 495 (3.7%) |
| $55,000 to $64,999 | 1,233 (8.1%) | 714 (5.3%) |
| $65,000 to $74,999 | 606 (4.0%) | 466 (3.5%) |
| $75,000 to $99,999 | 1,469 (9.7%) | 1,129 (8.5%) |
| $100,000+ | 1,973 (13.0%) | 964 (7.2%) |
| Total | 15,191 (100.0%) | 13,357 (100.0%) |
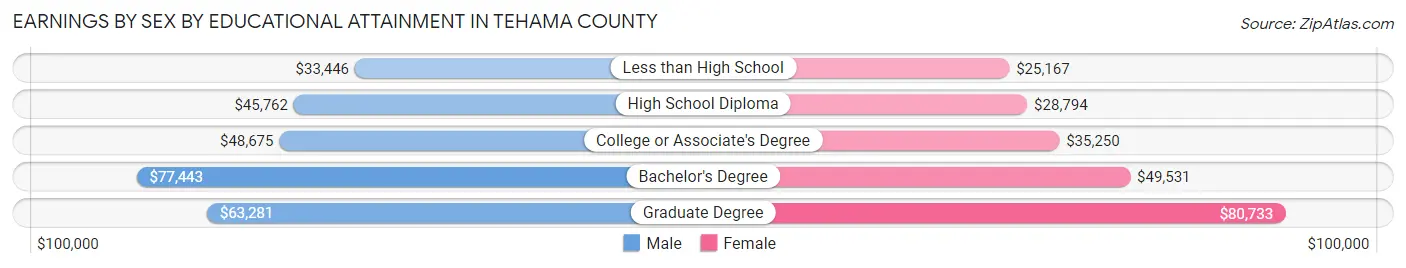
Earnings by Sex by Educational Attainment in Tehama County
Average earnings in Tehama County are $47,061 for men and $36,630 for women, a difference of 22.2%. Men with an educational attainment of bachelor's degree enjoy the highest average annual earnings of $77,443, while those with less than high school education earn the least with $33,446. Women with an educational attainment of graduate degree earn the most with the average annual earnings of $80,733, while those with less than high school education have the smallest earnings of $25,167.
| Educational Attainment | Male Income | Female Income |
| Less than High School | $33,446 | $25,167 |
| High School Diploma | $45,762 | $28,794 |
| College or Associate's Degree | $48,675 | $35,250 |
| Bachelor's Degree | $77,443 | $49,531 |
| Graduate Degree | $63,281 | $80,733 |
| Total | $47,061 | $36,630 |
Family Income in Tehama County
Family Income Brackets in Tehama County
According to the Tehama County family income data, there are 3,277 families falling into the $50,000 to $74,999 income range, which is the most common income bracket and makes up 19.5% of all families. Conversely, the $10,000 to $14,999 income bracket is the least frequent group with only 504 families (3.0%) belonging to this category.
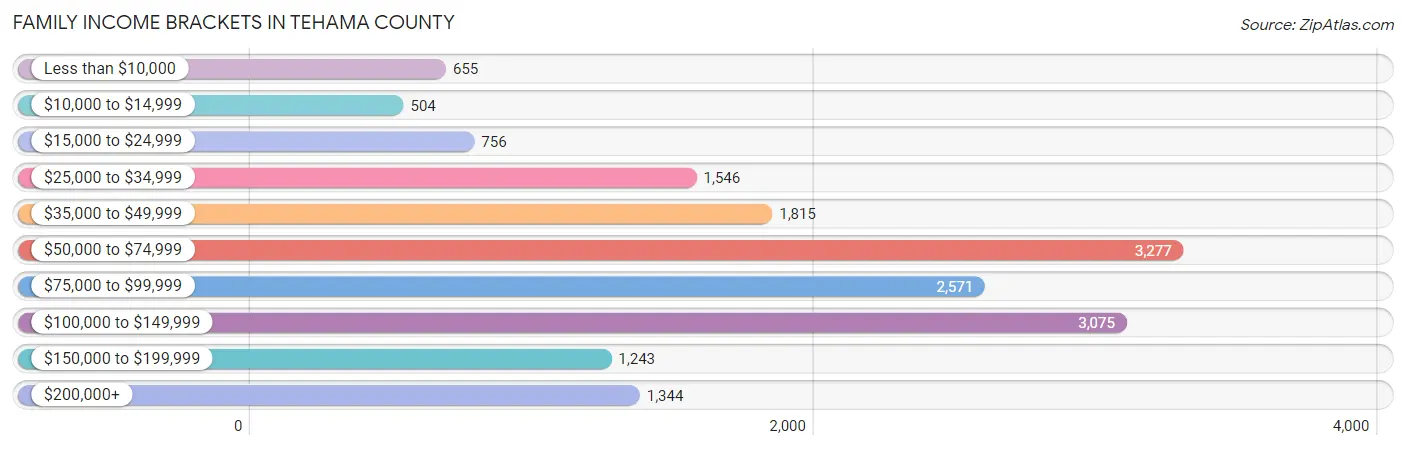
| Income Bracket | # Families | % Families |
| Less than $10,000 | 655 | 3.9% |
| $10,000 to $14,999 | 504 | 3.0% |
| $15,000 to $24,999 | 756 | 4.5% |
| $25,000 to $34,999 | 1,546 | 9.2% |
| $35,000 to $49,999 | 1,815 | 10.8% |
| $50,000 to $74,999 | 3,277 | 19.5% |
| $75,000 to $99,999 | 2,571 | 15.3% |
| $100,000 to $149,999 | 3,075 | 18.3% |
| $150,000 to $199,999 | 1,243 | 7.4% |
| $200,000+ | 1,344 | 8.0% |
Family Income by Famaliy Size in Tehama County
7+ person families (602 | 3.6%) account for the highest median family income in Tehama County with $96,026 per family, while 2-person families (8,105 | 48.2%) have the highest median income of $33,432 per family member.
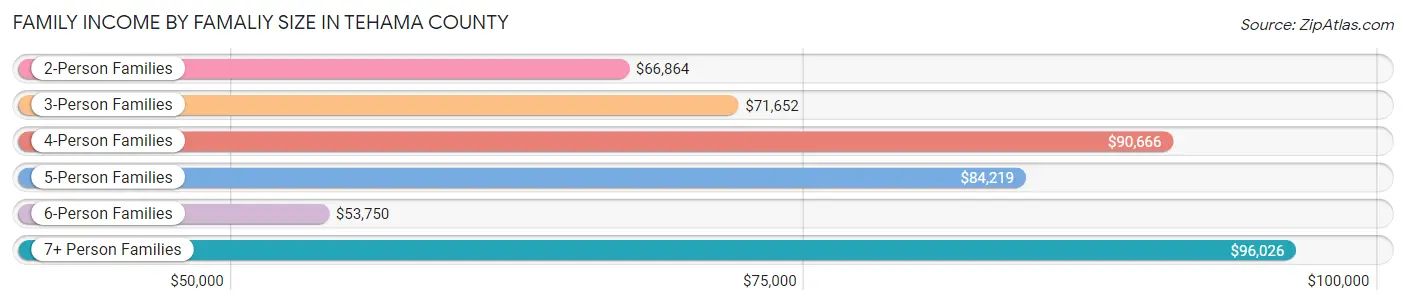
| Income Bracket | # Families | Median Income |
| 2-Person Families | 8,105 (48.2%) | $66,864 |
| 3-Person Families | 3,553 (21.1%) | $71,652 |
| 4-Person Families | 2,715 (16.2%) | $90,666 |
| 5-Person Families | 1,162 (6.9%) | $84,219 |
| 6-Person Families | 666 (4.0%) | $53,750 |
| 7+ Person Families | 602 (3.6%) | $96,026 |
| Total | 16,803 (100.0%) | $73,102 |
Family Income by Number of Earners in Tehama County
The median family income in Tehama County is $73,102, with families comprising 3+ earners (1,651) having the highest median family income of $113,570, while families with no earners (3,867) have the lowest median family income of $43,273, accounting for 9.8% and 23.0% of families, respectively.
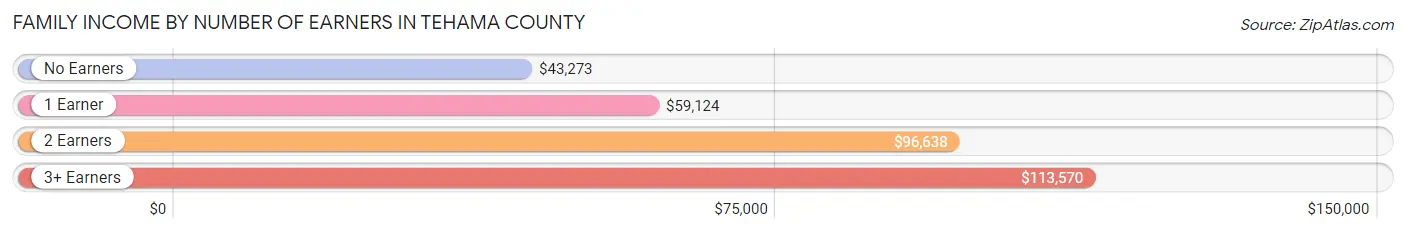
| Number of Earners | # Families | Median Income |
| No Earners | 3,867 (23.0%) | $43,273 |
| 1 Earner | 5,848 (34.8%) | $59,124 |
| 2 Earners | 5,437 (32.4%) | $96,638 |
| 3+ Earners | 1,651 (9.8%) | $113,570 |
| Total | 16,803 (100.0%) | $73,102 |
Household Income in Tehama County
Household Income Brackets in Tehama County
With 4,432 households falling in the category, the $50,000 to $74,999 income range is the most frequent in Tehama County, accounting for 18.0% of all households. In contrast, only 1,453 households (5.9%) fall into the less than $10,000 income bracket, making it the least populous group.
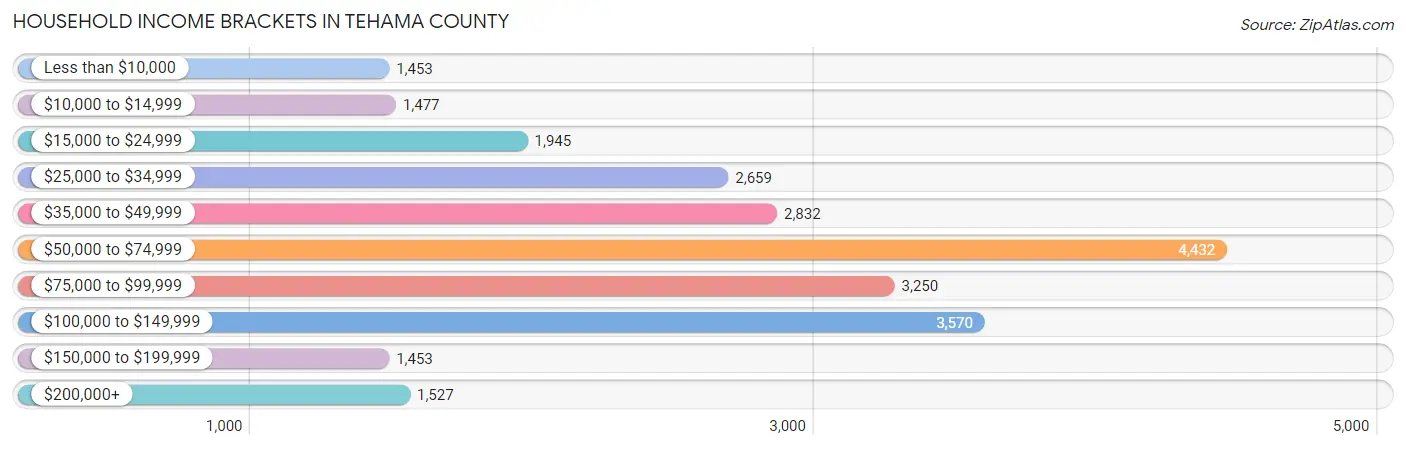
| Income Bracket | # Households | % Households |
| Less than $10,000 | 1,453 | 5.9% |
| $10,000 to $14,999 | 1,477 | 6.0% |
| $15,000 to $24,999 | 1,945 | 7.9% |
| $25,000 to $34,999 | 2,659 | 10.8% |
| $35,000 to $49,999 | 2,832 | 11.5% |
| $50,000 to $74,999 | 4,432 | 18.0% |
| $75,000 to $99,999 | 3,250 | 13.2% |
| $100,000 to $149,999 | 3,570 | 14.5% |
| $150,000 to $199,999 | 1,453 | 5.9% |
| $200,000+ | 1,527 | 6.2% |
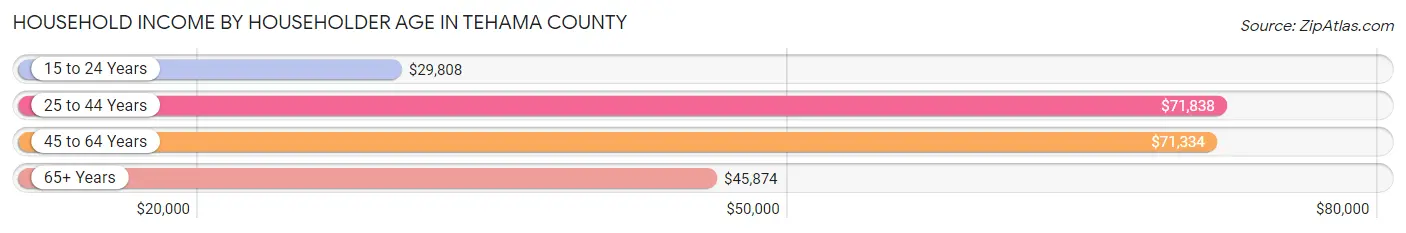
Household Income by Householder Age in Tehama County
The median household income in Tehama County is $59,029, with the highest median household income of $71,838 found in the 25 to 44 years age bracket for the primary householder. A total of 7,073 households (28.7%) fall into this category. Meanwhile, the 15 to 24 years age bracket for the primary householder has the lowest median household income of $29,808, with 830 households (3.4%) in this group.
| Income Bracket | # Households | Median Income |
| 15 to 24 Years | 830 (3.4%) | $29,808 |
| 25 to 44 Years | 7,073 (28.7%) | $71,838 |
| 45 to 64 Years | 8,661 (35.2%) | $71,334 |
| 65+ Years | 8,059 (32.7%) | $45,874 |
| Total | 24,623 (100.0%) | $59,029 |
Poverty in Tehama County
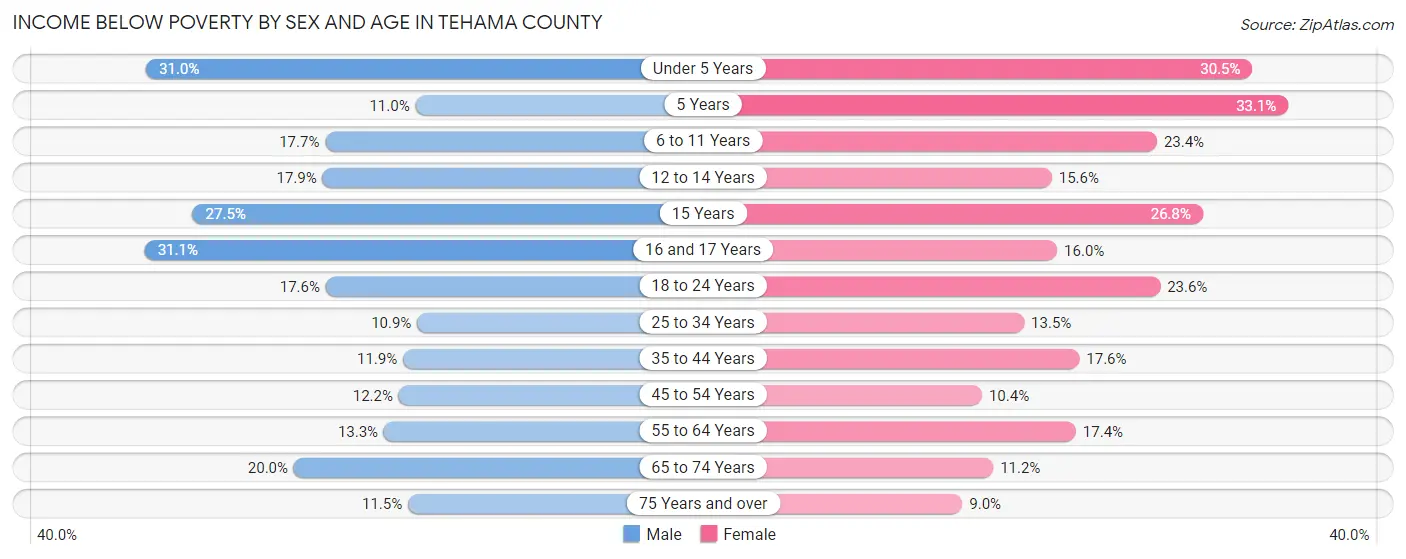
Income Below Poverty by Sex and Age in Tehama County
With 15.9% poverty level for males and 16.5% for females among the residents of Tehama County, 16 and 17 year old males and 5 year old females are the most vulnerable to poverty, with 257 males (31.1%) and 113 females (33.1%) in their respective age groups living below the poverty level.
| Age Bracket | Male | Female |
| Under 5 Years | 570 (31.0%) | 569 (30.5%) |
| 5 Years | 65 (11.0%) | 113 (33.1%) |
| 6 to 11 Years | 461 (17.7%) | 525 (23.4%) |
| 12 to 14 Years | 236 (17.9%) | 277 (15.6%) |
| 15 Years | 161 (27.5%) | 119 (26.8%) |
| 16 and 17 Years | 257 (31.1%) | 137 (16.0%) |
| 18 to 24 Years | 443 (17.6%) | 561 (23.6%) |
| 25 to 34 Years | 435 (10.8%) | 525 (13.5%) |
| 35 to 44 Years | 459 (11.9%) | 645 (17.6%) |
| 45 to 54 Years | 442 (12.2%) | 374 (10.4%) |
| 55 to 64 Years | 580 (13.3%) | 822 (17.4%) |
| 65 to 74 Years | 724 (20.0%) | 439 (11.2%) |
| 75 Years and over | 273 (11.5%) | 271 (8.9%) |
| Total | 5,106 (15.9%) | 5,377 (16.5%) |
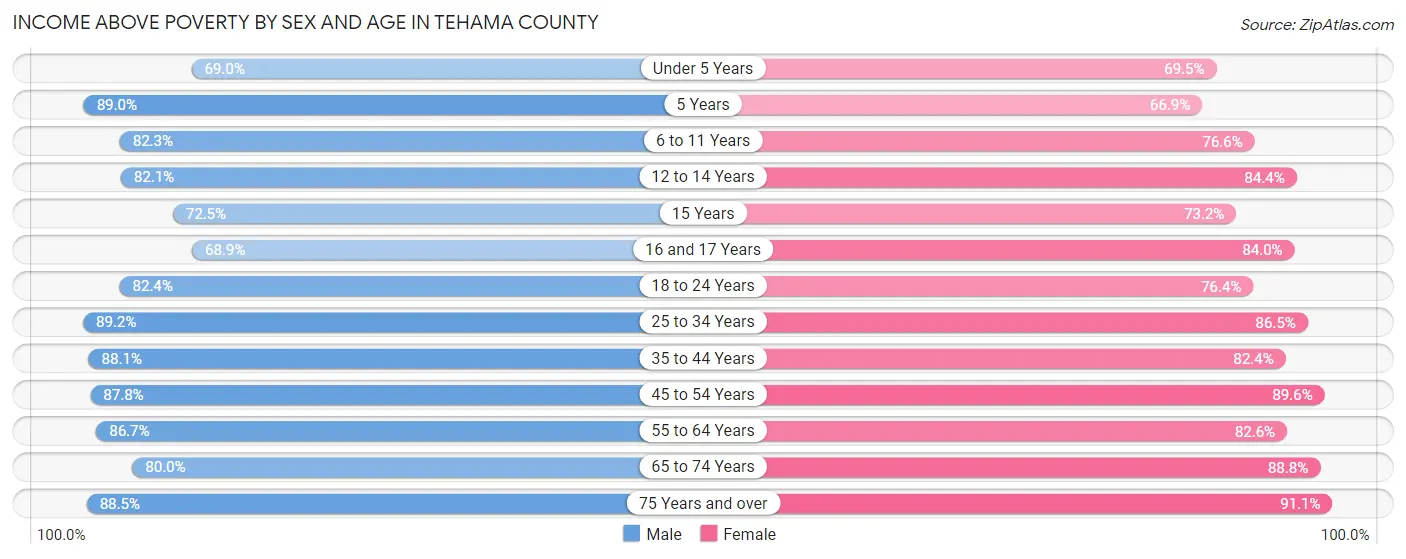
Income Above Poverty by Sex and Age in Tehama County
According to the poverty statistics in Tehama County, males aged 25 to 34 years and females aged 75 years and over are the age groups that are most secure financially, with 89.1% of males and 91.0% of females in these age groups living above the poverty line.
| Age Bracket | Male | Female |
| Under 5 Years | 1,270 (69.0%) | 1,298 (69.5%) |
| 5 Years | 527 (89.0%) | 228 (66.9%) |
| 6 to 11 Years | 2,146 (82.3%) | 1,719 (76.6%) |
| 12 to 14 Years | 1,084 (82.1%) | 1,500 (84.4%) |
| 15 Years | 424 (72.5%) | 325 (73.2%) |
| 16 and 17 Years | 570 (68.9%) | 720 (84.0%) |
| 18 to 24 Years | 2,068 (82.4%) | 1,812 (76.4%) |
| 25 to 34 Years | 3,575 (89.1%) | 3,352 (86.5%) |
| 35 to 44 Years | 3,397 (88.1%) | 3,012 (82.4%) |
| 45 to 54 Years | 3,175 (87.8%) | 3,217 (89.6%) |
| 55 to 64 Years | 3,775 (86.7%) | 3,907 (82.6%) |
| 65 to 74 Years | 2,894 (80.0%) | 3,468 (88.8%) |
| 75 Years and over | 2,094 (88.5%) | 2,756 (91.0%) |
| Total | 26,999 (84.1%) | 27,314 (83.6%) |
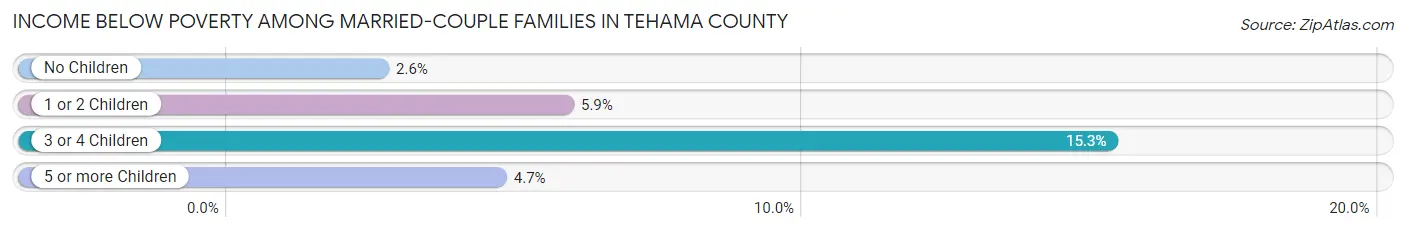
Income Below Poverty Among Married-Couple Families in Tehama County
The poverty statistics for married-couple families in Tehama County show that 4.8% or 562 of the total 11,648 families live below the poverty line. Families with 3 or 4 children have the highest poverty rate of 15.3%, comprising of 163 families. On the other hand, families with no children have the lowest poverty rate of 2.6%, which includes 178 families.
| Children | Above Poverty | Below Poverty |
| No Children | 6,596 (97.4%) | 178 (2.6%) |
| 1 or 2 Children | 3,426 (94.2%) | 213 (5.9%) |
| 3 or 4 Children | 901 (84.7%) | 163 (15.3%) |
| 5 or more Children | 163 (95.3%) | 8 (4.7%) |
| Total | 11,086 (95.2%) | 562 (4.8%) |
Income Below Poverty Among Single-Parent Households in Tehama County
According to the poverty data in Tehama County, 17.1% or 305 single-father households and 29.9% or 1,007 single-mother households are living below the poverty line. Among single-father households, those with 3 or 4 children have the highest poverty rate, with 56 households (65.1%) experiencing poverty. Likewise, among single-mother households, those with 3 or 4 children have the highest poverty rate, with 240 households (69.6%) falling below the poverty line.
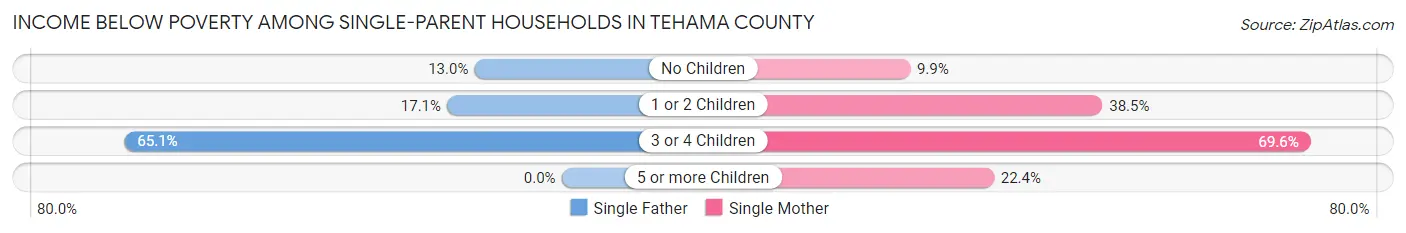
| Children | Single Father | Single Mother |
| No Children | 97 (13.0%) | 133 (9.9%) |
| 1 or 2 Children | 152 (17.1%) | 617 (38.5%) |
| 3 or 4 Children | 56 (65.1%) | 240 (69.6%) |
| 5 or more Children | 0 (0.0%) | 17 (22.4%) |
| Total | 305 (17.1%) | 1,007 (29.9%) |
Income Below Poverty Among Married-Couple vs Single-Parent Households in Tehama County
The poverty data for Tehama County shows that 562 of the married-couple family households (4.8%) and 1,312 of the single-parent households (25.5%) are living below the poverty level. Within the married-couple family households, those with 3 or 4 children have the highest poverty rate, with 163 households (15.3%) falling below the poverty line. Among the single-parent households, those with 3 or 4 children have the highest poverty rate, with 296 household (68.7%) living below poverty.
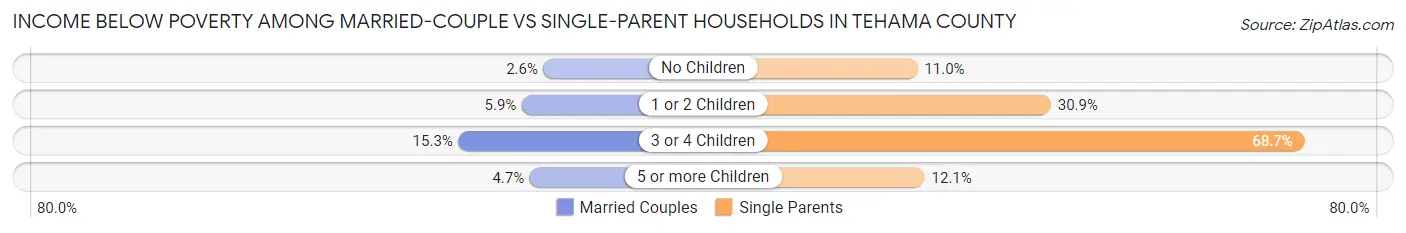
| Children | Married-Couple Families | Single-Parent Households |
| No Children | 178 (2.6%) | 230 (11.0%) |
| 1 or 2 Children | 213 (5.9%) | 769 (30.9%) |
| 3 or 4 Children | 163 (15.3%) | 296 (68.7%) |
| 5 or more Children | 8 (4.7%) | 17 (12.1%) |
| Total | 562 (4.8%) | 1,312 (25.5%) |
Race in Tehama County
The most populous races in Tehama County are White / Caucasian (48,781 | 74.5%), Hispanic or Latino (17,585 | 26.9%), and Two or more Races (9,372 | 14.3%).
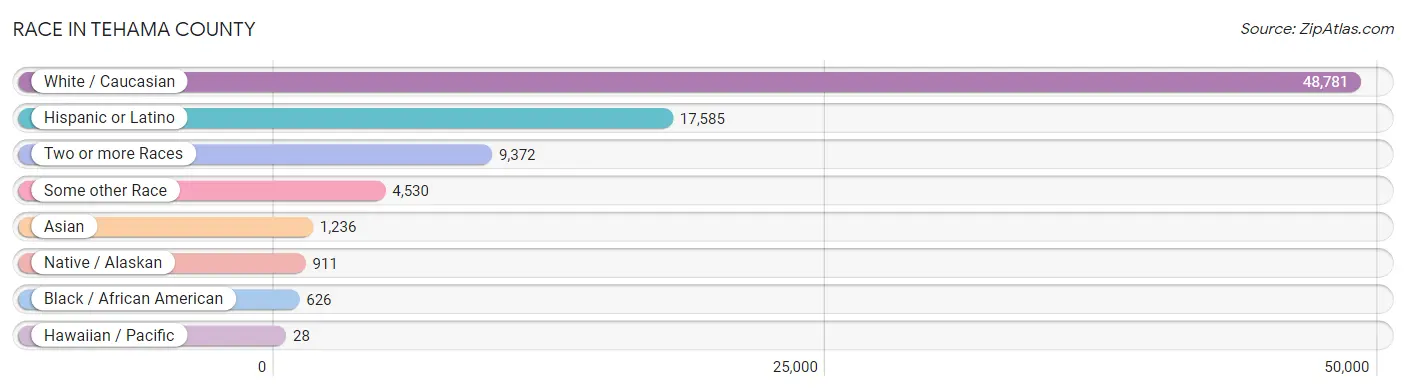
| Race | # Population | % Population |
| Asian | 1,236 | 1.9% |
| Black / African American | 626 | 1.0% |
| Hawaiian / Pacific | 28 | 0.0% |
| Hispanic or Latino | 17,585 | 26.9% |
| Native / Alaskan | 911 | 1.4% |
| White / Caucasian | 48,781 | 74.5% |
| Two or more Races | 9,372 | 14.3% |
| Some other Race | 4,530 | 6.9% |
| Total | 65,484 | 100.0% |
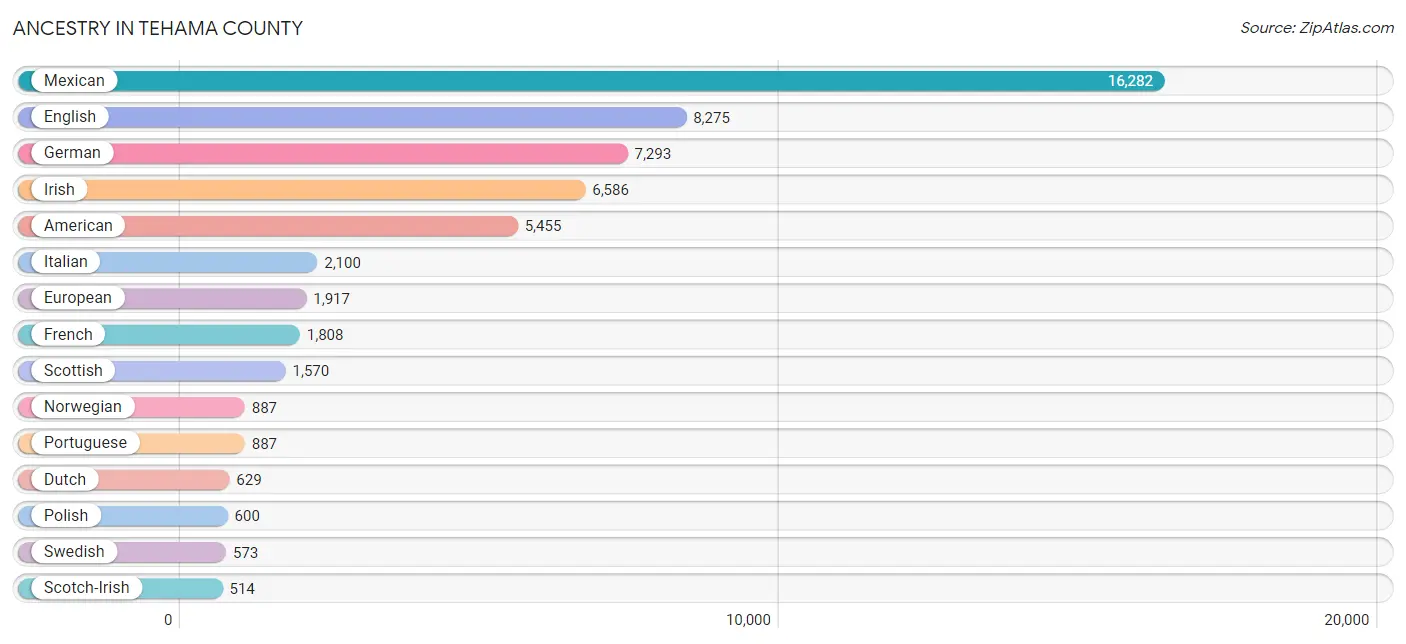
Ancestry in Tehama County
The most populous ancestries reported in Tehama County are Mexican (16,282 | 24.9%), English (8,275 | 12.6%), German (7,293 | 11.1%), Irish (6,586 | 10.1%), and American (5,455 | 8.3%), together accounting for 67.0% of all Tehama County residents.
| Ancestry | # Population | % Population |
| African | 98 | 0.2% |
| Alaska Native | 1 | 0.0% |
| Alaskan Athabascan | 32 | 0.1% |
| American | 5,455 | 8.3% |
| Apache | 118 | 0.2% |
| Arab | 81 | 0.1% |
| Assyrian / Chaldean / Syriac | 4 | 0.0% |
| Australian | 108 | 0.2% |
| Austrian | 105 | 0.2% |
| Bangladeshi | 369 | 0.6% |
| Basque | 49 | 0.1% |
| Belgian | 3 | 0.0% |
| Bhutanese | 46 | 0.1% |
| Blackfeet | 228 | 0.4% |
| Bolivian | 7 | 0.0% |
| British | 472 | 0.7% |
| Burmese | 52 | 0.1% |
| Canadian | 55 | 0.1% |
| Central American | 211 | 0.3% |
| Central American Indian | 49 | 0.1% |
| Cherokee | 502 | 0.8% |
| Chickasaw | 39 | 0.1% |
| Chippewa | 91 | 0.1% |
| Choctaw | 67 | 0.1% |
| Colombian | 44 | 0.1% |
| Comanche | 5 | 0.0% |
| Costa Rican | 44 | 0.1% |
| Creek | 34 | 0.1% |
| Croatian | 14 | 0.0% |
| Cuban | 24 | 0.0% |
| Czech | 147 | 0.2% |
| Czechoslovakian | 70 | 0.1% |
| Danish | 484 | 0.7% |
| Dutch | 629 | 1.0% |
| Dutch West Indian | 9 | 0.0% |
| Eastern European | 108 | 0.2% |
| Ecuadorian | 77 | 0.1% |
| Egyptian | 57 | 0.1% |
| English | 8,275 | 12.6% |
| European | 1,917 | 2.9% |
| Finnish | 52 | 0.1% |
| French | 1,808 | 2.8% |
| French American Indian | 6 | 0.0% |
| French Canadian | 91 | 0.1% |
| German | 7,293 | 11.1% |
| Greek | 45 | 0.1% |
| Guatemalan | 3 | 0.0% |
| Honduran | 1 | 0.0% |
| Hopi | 7 | 0.0% |
| Hungarian | 71 | 0.1% |
| Indian (Asian) | 148 | 0.2% |
| Inupiat | 38 | 0.1% |
| Irish | 6,586 | 10.1% |
| Israeli | 44 | 0.1% |
| Italian | 2,100 | 3.2% |
| Jamaican | 3 | 0.0% |
| Japanese | 3 | 0.0% |
| Kenyan | 16 | 0.0% |
| Korean | 374 | 0.6% |
| Laotian | 2 | 0.0% |
| Lumbee | 28 | 0.0% |
| Malaysian | 406 | 0.6% |
| Mexican | 16,282 | 24.9% |
| Mexican American Indian | 65 | 0.1% |
| Native Hawaiian | 29 | 0.0% |
| Navajo | 18 | 0.0% |
| Nicaraguan | 13 | 0.0% |
| Northern European | 196 | 0.3% |
| Norwegian | 887 | 1.3% |
| Ottawa | 56 | 0.1% |
| Paraguayan | 14 | 0.0% |
| Pennsylvania German | 39 | 0.1% |
| Peruvian | 41 | 0.1% |
| Polish | 600 | 0.9% |
| Portuguese | 887 | 1.3% |
| Potawatomi | 48 | 0.1% |
| Puerto Rican | 288 | 0.4% |
| Romanian | 20 | 0.0% |
| Russian | 249 | 0.4% |
| Salvadoran | 150 | 0.2% |
| Samoan | 15 | 0.0% |
| Scandinavian | 181 | 0.3% |
| Scotch-Irish | 514 | 0.8% |
| Scottish | 1,570 | 2.4% |
| Serbian | 5 | 0.0% |
| Sioux | 109 | 0.2% |
| Slavic | 40 | 0.1% |
| Slovak | 22 | 0.0% |
| South African | 39 | 0.1% |
| South American | 183 | 0.3% |
| Spaniard | 250 | 0.4% |
| Spanish | 188 | 0.3% |
| Spanish American | 2 | 0.0% |
| Sri Lankan | 104 | 0.2% |
| Subsaharan African | 153 | 0.2% |
| Swedish | 573 | 0.9% |
| Swiss | 186 | 0.3% |
| Thai | 144 | 0.2% |
| Tongan | 18 | 0.0% |
| Turkish | 5 | 0.0% |
| Ukrainian | 60 | 0.1% |
| Welsh | 358 | 0.5% |
| Yakama | 27 | 0.0% |
| Yugoslavian | 49 | 0.1% | View All 104 Rows |
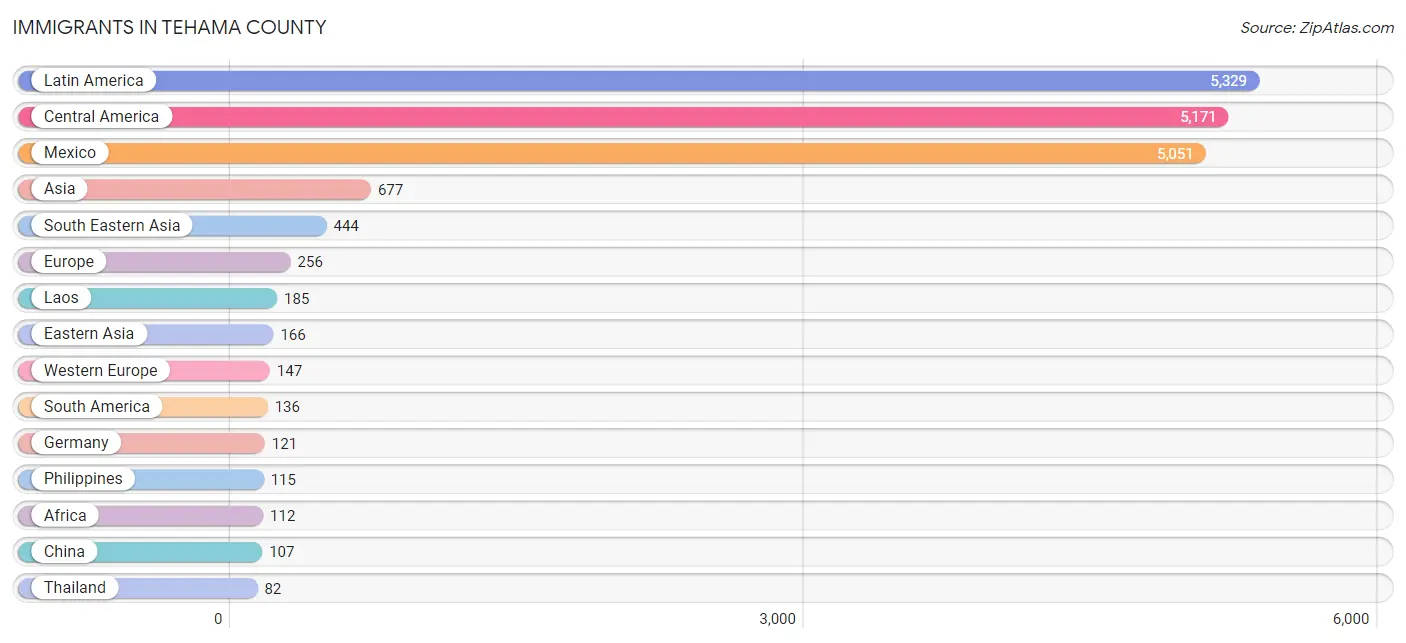
Immigrants in Tehama County
The most numerous immigrant groups reported in Tehama County came from Latin America (5,329 | 8.1%), Central America (5,171 | 7.9%), Mexico (5,051 | 7.7%), Asia (677 | 1.0%), and South Eastern Asia (444 | 0.7%), together accounting for 25.5% of all Tehama County residents.
| Immigration Origin | # Population | % Population |
| Africa | 112 | 0.2% |
| Asia | 677 | 1.0% |
| Bolivia | 7 | 0.0% |
| Cambodia | 3 | 0.0% |
| Canada | 41 | 0.1% |
| Caribbean | 22 | 0.0% |
| Central America | 5,171 | 7.9% |
| Chile | 21 | 0.0% |
| China | 107 | 0.2% |
| Costa Rica | 24 | 0.0% |
| Cuba | 19 | 0.0% |
| Czechoslovakia | 2 | 0.0% |
| Eastern Africa | 16 | 0.0% |
| Eastern Asia | 166 | 0.3% |
| Eastern Europe | 42 | 0.1% |
| Ecuador | 77 | 0.1% |
| Egypt | 57 | 0.1% |
| El Salvador | 61 | 0.1% |
| England | 51 | 0.1% |
| Europe | 256 | 0.4% |
| Germany | 121 | 0.2% |
| Guatemala | 3 | 0.0% |
| India | 56 | 0.1% |
| Iran | 11 | 0.0% |
| Ireland | 14 | 0.0% |
| Jamaica | 3 | 0.0% |
| Japan | 17 | 0.0% |
| Kenya | 16 | 0.0% |
| Korea | 42 | 0.1% |
| Laos | 185 | 0.3% |
| Latin America | 5,329 | 8.1% |
| Mexico | 5,051 | 7.7% |
| Netherlands | 16 | 0.0% |
| Nicaragua | 32 | 0.1% |
| Northern Africa | 57 | 0.1% |
| Northern Europe | 67 | 0.1% |
| Oceania | 23 | 0.0% |
| Peru | 17 | 0.0% |
| Philippines | 115 | 0.2% |
| Poland | 3 | 0.0% |
| Romania | 20 | 0.0% |
| Russia | 14 | 0.0% |
| South Africa | 39 | 0.1% |
| South America | 136 | 0.2% |
| South Central Asia | 67 | 0.1% |
| South Eastern Asia | 444 | 0.7% |
| Switzerland | 10 | 0.0% |
| Taiwan | 53 | 0.1% |
| Thailand | 82 | 0.1% |
| Vietnam | 59 | 0.1% |
| Western Europe | 147 | 0.2% | View All 51 Rows |
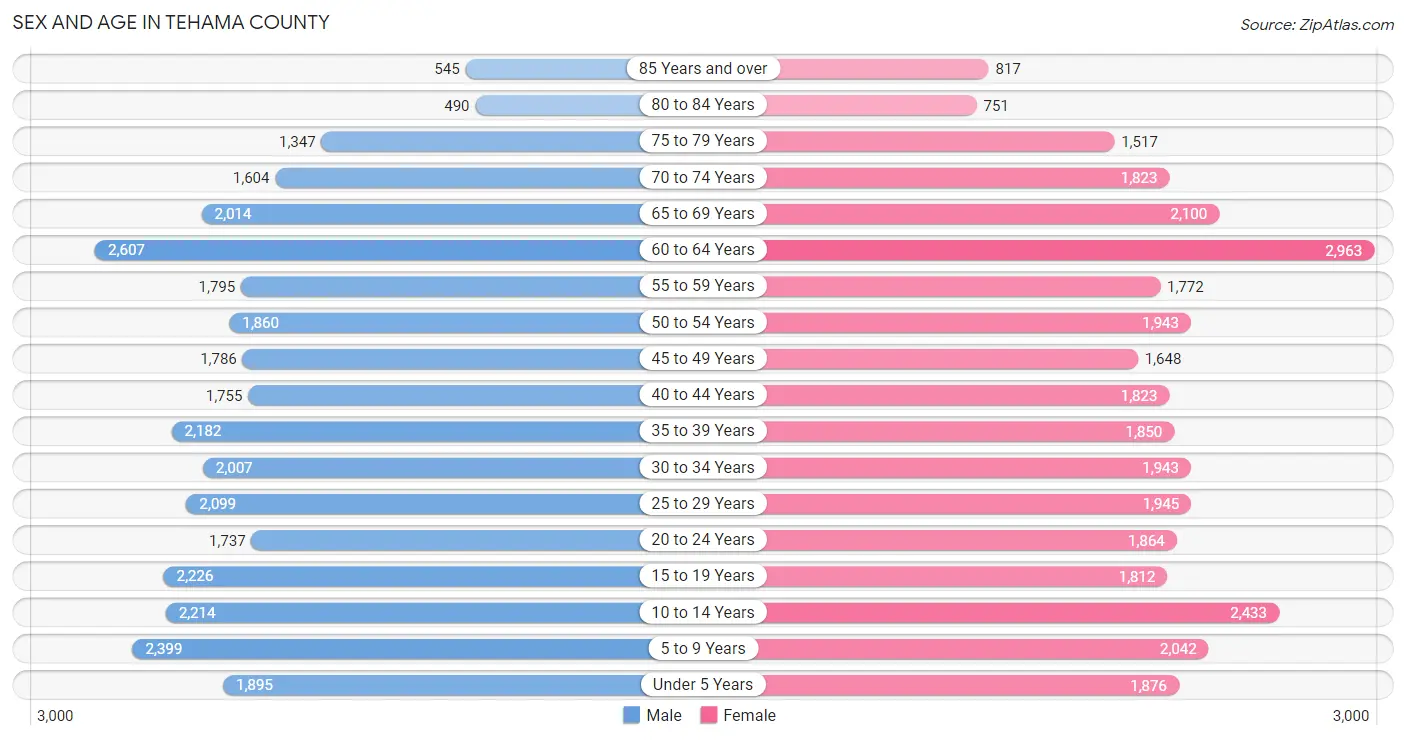
Sex and Age in Tehama County
Sex and Age in Tehama County
The most populous age groups in Tehama County are 60 to 64 Years (2,607 | 8.0%) for men and 60 to 64 Years (2,963 | 9.0%) for women.
| Age Bracket | Male | Female |
| Under 5 Years | 1,895 (5.8%) | 1,876 (5.7%) |
| 5 to 9 Years | 2,399 (7.4%) | 2,042 (6.2%) |
| 10 to 14 Years | 2,214 (6.8%) | 2,433 (7.4%) |
| 15 to 19 Years | 2,226 (6.8%) | 1,812 (5.5%) |
| 20 to 24 Years | 1,737 (5.3%) | 1,864 (5.7%) |
| 25 to 29 Years | 2,099 (6.5%) | 1,945 (5.9%) |
| 30 to 34 Years | 2,007 (6.2%) | 1,943 (5.9%) |
| 35 to 39 Years | 2,182 (6.7%) | 1,850 (5.6%) |
| 40 to 44 Years | 1,755 (5.4%) | 1,823 (5.5%) |
| 45 to 49 Years | 1,786 (5.5%) | 1,648 (5.0%) |
| 50 to 54 Years | 1,860 (5.7%) | 1,943 (5.9%) |
| 55 to 59 Years | 1,795 (5.5%) | 1,772 (5.4%) |
| 60 to 64 Years | 2,607 (8.0%) | 2,963 (9.0%) |
| 65 to 69 Years | 2,014 (6.2%) | 2,100 (6.4%) |
| 70 to 74 Years | 1,604 (4.9%) | 1,823 (5.5%) |
| 75 to 79 Years | 1,347 (4.1%) | 1,517 (4.6%) |
| 80 to 84 Years | 490 (1.5%) | 751 (2.3%) |
| 85 Years and over | 545 (1.7%) | 817 (2.5%) |
| Total | 32,562 (100.0%) | 32,922 (100.0%) |
Families and Households in Tehama County
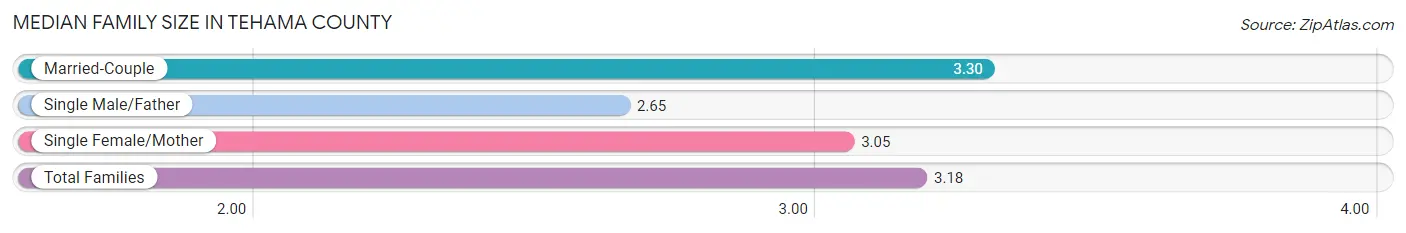
Median Family Size in Tehama County
The median family size in Tehama County is 3.18 persons per family, with married-couple families (11,648 | 69.3%) accounting for the largest median family size of 3.3 persons per family. On the other hand, single male/father families (1,787 | 10.6%) represent the smallest median family size with 2.65 persons per family.
| Family Type | # Families | Family Size |
| Married-Couple | 11,648 (69.3%) | 3.30 |
| Single Male/Father | 1,787 (10.6%) | 2.65 |
| Single Female/Mother | 3,368 (20.0%) | 3.05 |
| Total Families | 16,803 (100.0%) | 3.18 |
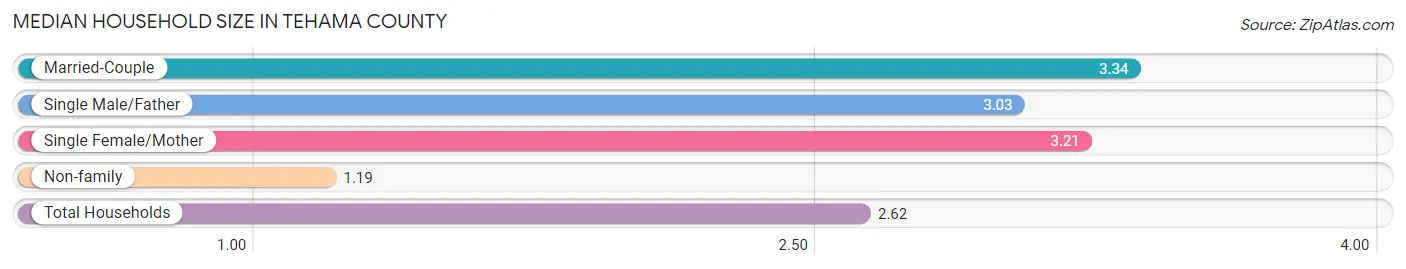
Median Household Size in Tehama County
The median household size in Tehama County is 2.62 persons per household, with married-couple households (11,648 | 47.3%) accounting for the largest median household size of 3.34 persons per household. non-family households (7,820 | 31.8%) represent the smallest median household size with 1.19 persons per household.
| Household Type | # Households | Household Size |
| Married-Couple | 11,648 (47.3%) | 3.34 |
| Single Male/Father | 1,787 (7.3%) | 3.03 |
| Single Female/Mother | 3,368 (13.7%) | 3.21 |
| Non-family | 7,820 (31.8%) | 1.19 |
| Total Households | 24,623 (100.0%) | 2.62 |
Household Size by Marriage Status in Tehama County
Out of a total of 24,623 households in Tehama County, 16,803 (68.2%) are family households, while 7,820 (31.8%) are nonfamily households. The most numerous type of family households are 2-person households, comprising 7,649, and the most common type of nonfamily households are 1-person households, comprising 6,492.
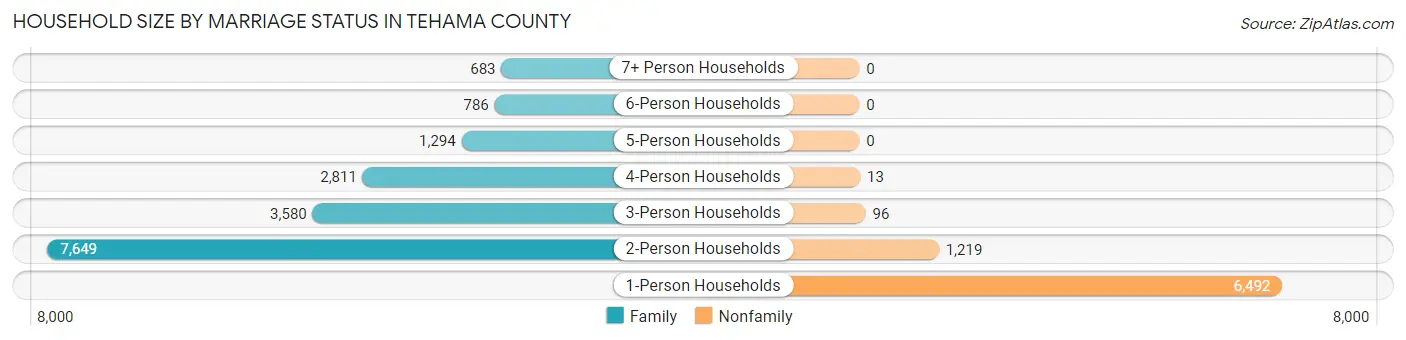
| Household Size | Family Households | Nonfamily Households |
| 1-Person Households | - | 6,492 (26.4%) |
| 2-Person Households | 7,649 (31.1%) | 1,219 (5.0%) |
| 3-Person Households | 3,580 (14.5%) | 96 (0.4%) |
| 4-Person Households | 2,811 (11.4%) | 13 (0.1%) |
| 5-Person Households | 1,294 (5.3%) | 0 (0.0%) |
| 6-Person Households | 786 (3.2%) | 0 (0.0%) |
| 7+ Person Households | 683 (2.8%) | 0 (0.0%) |
| Total | 16,803 (68.2%) | 7,820 (31.8%) |
Female Fertility in Tehama County
Fertility by Age in Tehama County
Average fertility rate in Tehama County is 57.0 births per 1,000 women. Women in the age bracket of 20 to 34 years have the highest fertility rate with 123.0 births per 1,000 women. Women in the age bracket of 20 to 34 years acount for 92.2% of all women with births.
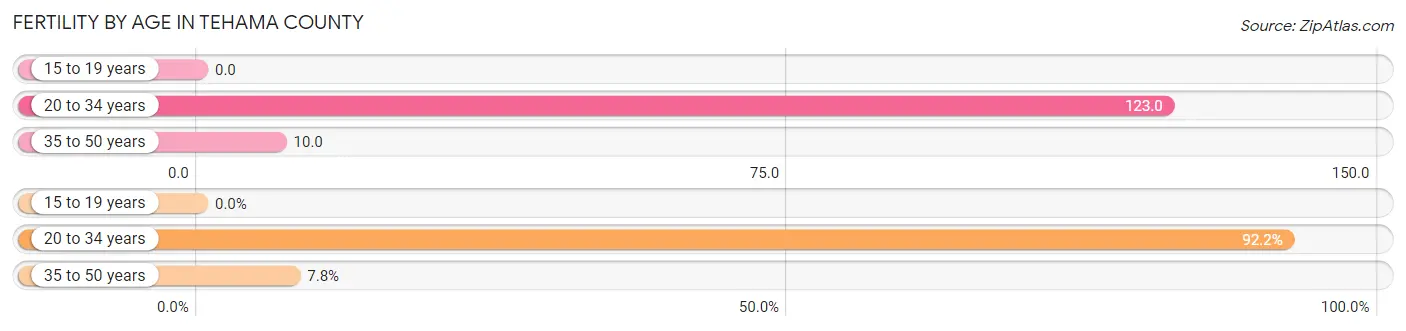
| Age Bracket | Women with Births | Births / 1,000 Women |
| 15 to 19 years | 0 (0.0%) | 0.0 |
| 20 to 34 years | 706 (92.2%) | 123.0 |
| 35 to 50 years | 60 (7.8%) | 10.0 |
| Total | 766 (100.0%) | 57.0 |
Fertility by Age by Marriage Status in Tehama County
54.0% of women with births (766) in Tehama County are married. The highest percentage of unmarried women with births falls into 20 to 34 years age bracket with 49.3% of them unmarried at the time of birth, while the lowest percentage of unmarried women with births belong to 35 to 50 years age bracket with 6.7% of them unmarried.
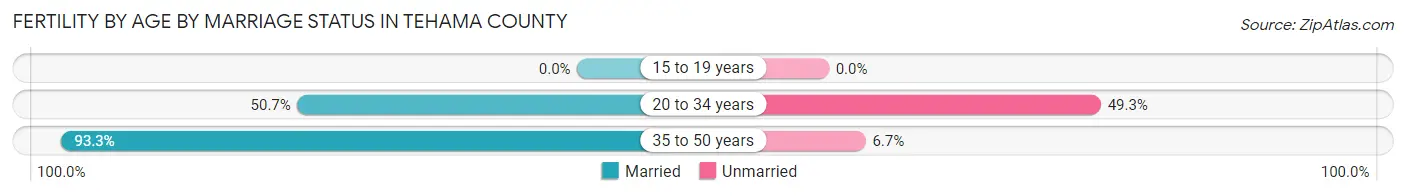
| Age Bracket | Married | Unmarried |
| 15 to 19 years | 0 (0.0%) | 0 (0.0%) |
| 20 to 34 years | 358 (50.7%) | 348 (49.3%) |
| 35 to 50 years | 56 (93.3%) | 4 (6.7%) |
| Total | 414 (54.0%) | 352 (46.0%) |
Fertility by Education in Tehama County
Average fertility rate in Tehama County is 57.0 births per 1,000 women. Women with the education attainment of high school diploma have the highest fertility rate of 118.0 births per 1,000 women, while women with the education attainment of bachelor's degree have the lowest fertility at 25.0 births per 1,000 women. Women with the education attainment of high school diploma represent 48.4% of all women with births.
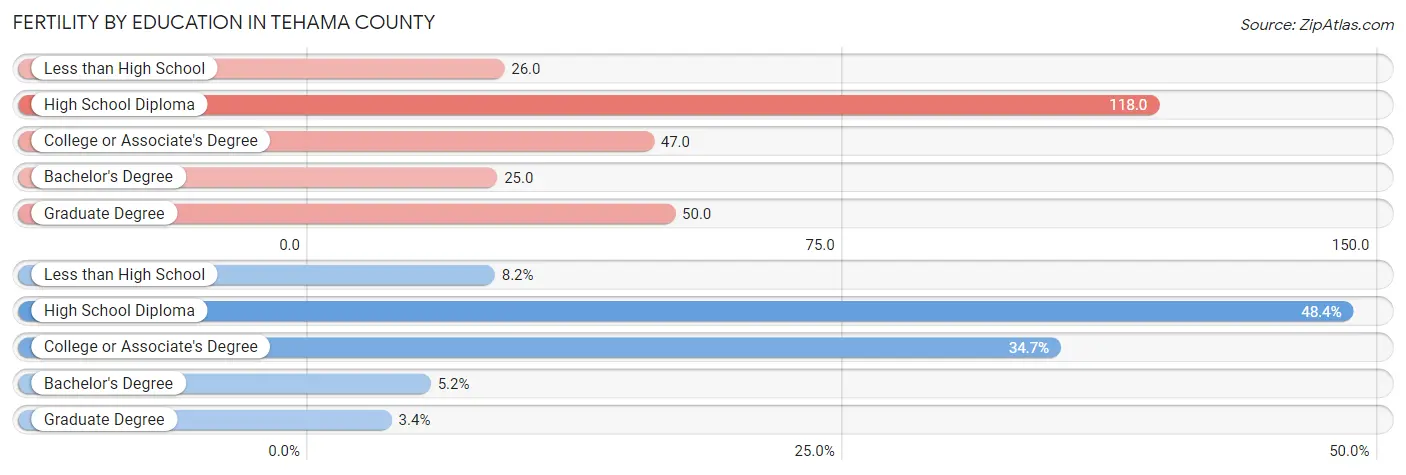
| Educational Attainment | Women with Births | Births / 1,000 Women |
| Less than High School | 63 (8.2%) | 26.0 |
| High School Diploma | 371 (48.4%) | 118.0 |
| College or Associate's Degree | 266 (34.7%) | 47.0 |
| Bachelor's Degree | 40 (5.2%) | 25.0 |
| Graduate Degree | 26 (3.4%) | 50.0 |
| Total | 766 (100.0%) | 57.0 |
Fertility by Education by Marriage Status in Tehama County
46.0% of women with births in Tehama County are unmarried. Women with the educational attainment of bachelor's degree are most likely to be married with 100.0% of them married at childbirth, while women with the educational attainment of less than high school are least likely to be married with 100.0% of them unmarried at childbirth.
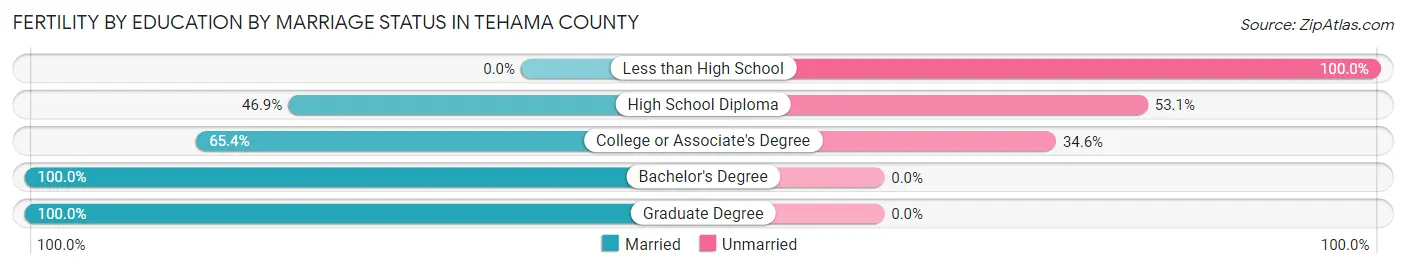
| Educational Attainment | Married | Unmarried |
| Less than High School | 0 (0.0%) | 63 (100.0%) |
| High School Diploma | 174 (46.9%) | 197 (53.1%) |
| College or Associate's Degree | 174 (65.4%) | 92 (34.6%) |
| Bachelor's Degree | 40 (100.0%) | 0 (0.0%) |
| Graduate Degree | 26 (100.0%) | 0 (0.0%) |
| Total | 414 (54.0%) | 352 (46.0%) |
Employment Characteristics in Tehama County
Employment by Class of Employer in Tehama County
Among the 24,769 employed individuals in Tehama County, private company employees (14,755 | 59.6%), local government employees (3,596 | 14.5%), and self-employed (not incorporated) (1,914 | 7.7%) make up the most common classes of employment.
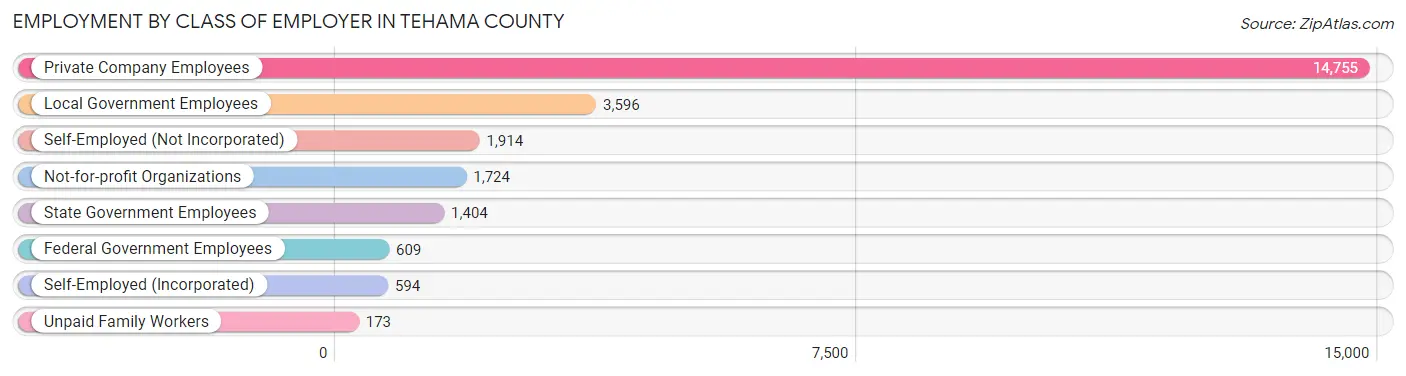
| Employer Class | # Employees | % Employees |
| Private Company Employees | 14,755 | 59.6% |
| Self-Employed (Incorporated) | 594 | 2.4% |
| Self-Employed (Not Incorporated) | 1,914 | 7.7% |
| Not-for-profit Organizations | 1,724 | 7.0% |
| Local Government Employees | 3,596 | 14.5% |
| State Government Employees | 1,404 | 5.7% |
| Federal Government Employees | 609 | 2.5% |
| Unpaid Family Workers | 173 | 0.7% |
| Total | 24,769 | 100.0% |
Employment Status by Age in Tehama County
According to the labor force statistics for Tehama County, out of the total population over 16 years of age (51,596), 53.6% or 27,655 individuals are in the labor force, with 7.4% or 2,046 of them unemployed. The age group with the highest labor force participation rate is 25 to 29 years, with 79.5% or 3,215 individuals in the labor force. Within the labor force, the 75 years and over age range has the highest percentage of unemployed individuals, with 21.1% or 67 of them being unemployed.
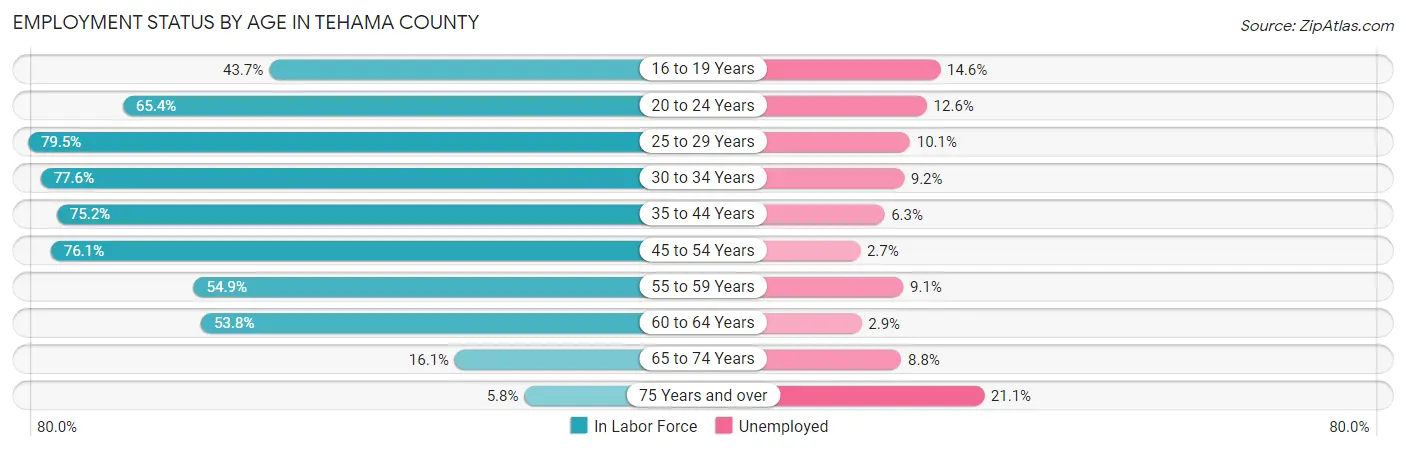
| Age Bracket | In Labor Force | Unemployed |
| 16 to 19 Years | 1,315 (43.7%) | 192 (14.6%) |
| 20 to 24 Years | 2,355 (65.4%) | 297 (12.6%) |
| 25 to 29 Years | 3,215 (79.5%) | 325 (10.1%) |
| 30 to 34 Years | 3,065 (77.6%) | 282 (9.2%) |
| 35 to 44 Years | 5,723 (75.2%) | 361 (6.3%) |
| 45 to 54 Years | 5,507 (76.1%) | 149 (2.7%) |
| 55 to 59 Years | 1,958 (54.9%) | 178 (9.1%) |
| 60 to 64 Years | 2,997 (53.8%) | 87 (2.9%) |
| 65 to 74 Years | 1,214 (16.1%) | 107 (8.8%) |
| 75 Years and over | 317 (5.8%) | 67 (21.1%) |
| Total | 27,655 (53.6%) | 2,046 (7.4%) |
Employment Status by Educational Attainment in Tehama County
According to labor force statistics for Tehama County, 70.2% of individuals (22,449) out of the total population between 25 and 64 years of age (31,978) are in the labor force, with 6.1% or 1,369 of them being unemployed. The group with the highest labor force participation rate are those with the educational attainment of bachelor's degree or higher, with 77.2% or 4,445 individuals in the labor force. Within the labor force, individuals with high school diploma education have the highest percentage of unemployment, with 6.8% or 441 of them being unemployed.
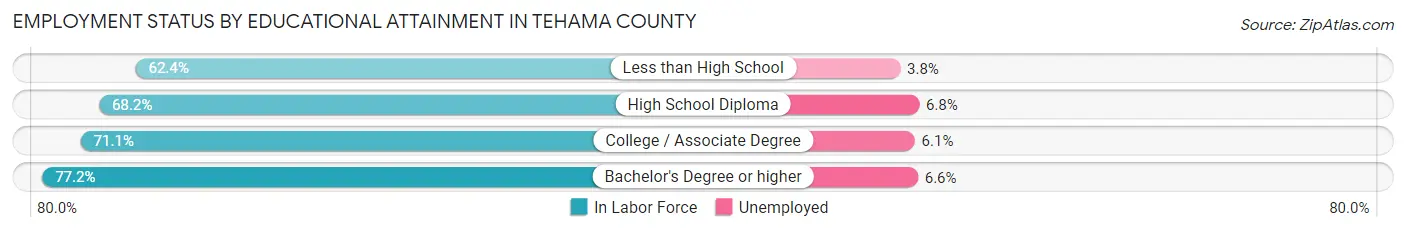
| Educational Attainment | In Labor Force | Unemployed |
| Less than High School | 2,504 (62.4%) | 152 (3.8%) |
| High School Diploma | 6,478 (68.2%) | 646 (6.8%) |
| College / Associate Degree | 9,036 (71.1%) | 775 (6.1%) |
| Bachelor's Degree or higher | 4,445 (77.2%) | 380 (6.6%) |
| Total | 22,449 (70.2%) | 1,951 (6.1%) |
Employment Occupations by Sex in Tehama County
Management, Business, Science and Arts Occupations
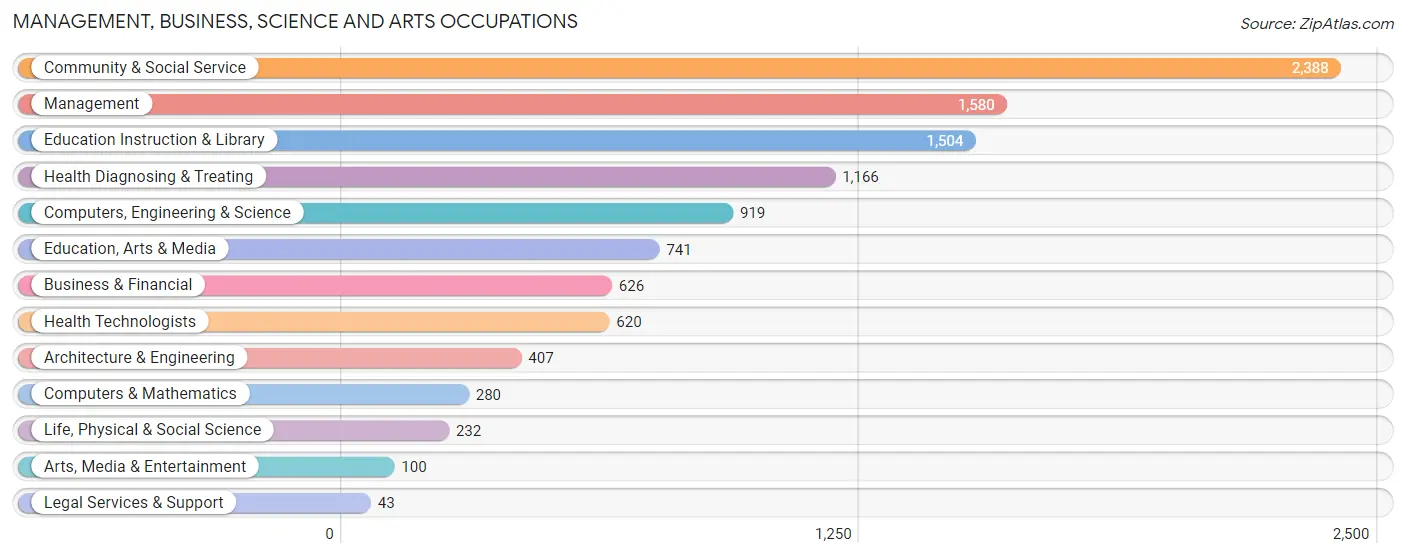
The most common Management, Business, Science and Arts occupations in Tehama County are Community & Social Service (2,388 | 9.3%), Management (1,580 | 6.2%), Education Instruction & Library (1,504 | 5.9%), Health Diagnosing & Treating (1,166 | 4.6%), and Computers, Engineering & Science (919 | 3.6%).
Management, Business, Science and Arts Occupations by Sex
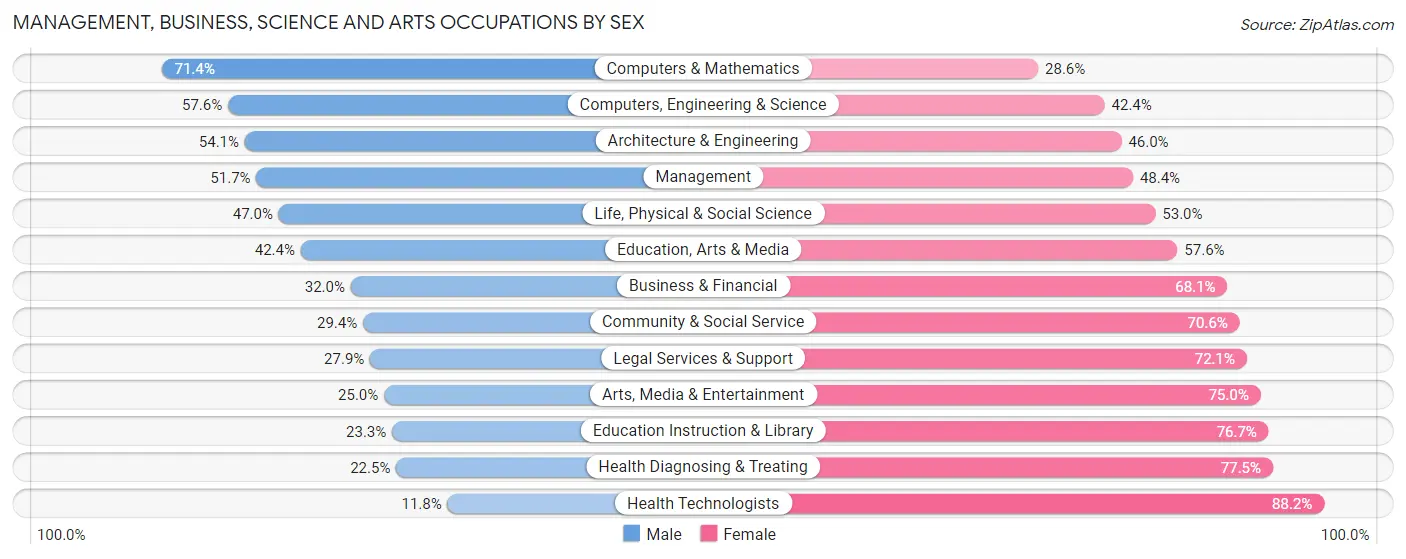
Within the Management, Business, Science and Arts occupations in Tehama County, the most male-oriented occupations are Computers & Mathematics (71.4%), Computers, Engineering & Science (57.6%), and Architecture & Engineering (54.0%), while the most female-oriented occupations are Health Technologists (88.2%), Health Diagnosing & Treating (77.5%), and Education Instruction & Library (76.7%).
| Occupation | Male | Female |
| Management | 816 (51.6%) | 764 (48.3%) |
| Business & Financial | 200 (32.0%) | 426 (68.0%) |
| Computers, Engineering & Science | 529 (57.6%) | 390 (42.4%) |
| Computers & Mathematics | 200 (71.4%) | 80 (28.6%) |
| Architecture & Engineering | 220 (54.0%) | 187 (46.0%) |
| Life, Physical & Social Science | 109 (47.0%) | 123 (53.0%) |
| Community & Social Service | 702 (29.4%) | 1,686 (70.6%) |
| Education, Arts & Media | 314 (42.4%) | 427 (57.6%) |
| Legal Services & Support | 12 (27.9%) | 31 (72.1%) |
| Education Instruction & Library | 351 (23.3%) | 1,153 (76.7%) |
| Arts, Media & Entertainment | 25 (25.0%) | 75 (75.0%) |
| Health Diagnosing & Treating | 262 (22.5%) | 904 (77.5%) |
| Health Technologists | 73 (11.8%) | 547 (88.2%) |
| Total (Category) | 2,509 (37.6%) | 4,170 (62.4%) |
| Total (Overall) | 13,588 (53.1%) | 12,009 (46.9%) |
Services Occupations
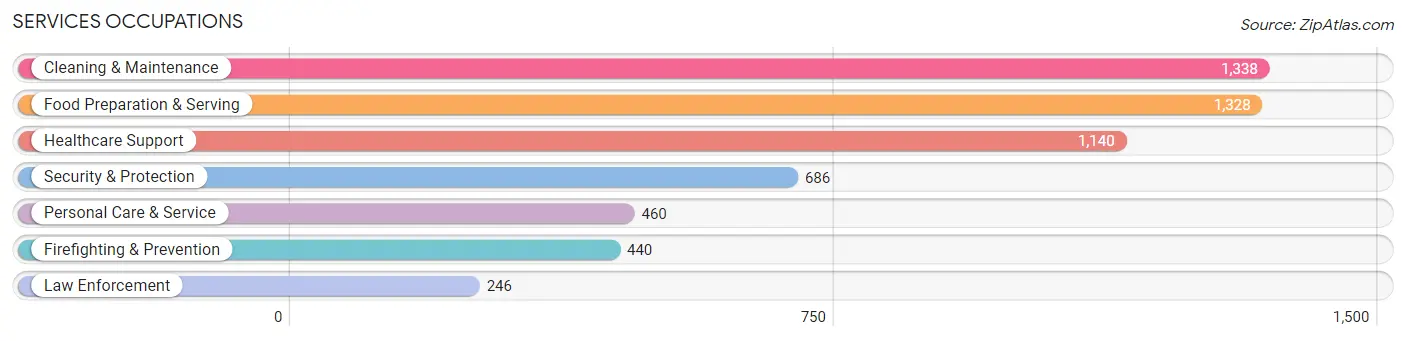
The most common Services occupations in Tehama County are Cleaning & Maintenance (1,338 | 5.2%), Food Preparation & Serving (1,328 | 5.2%), Healthcare Support (1,140 | 4.4%), Security & Protection (686 | 2.7%), and Personal Care & Service (460 | 1.8%).
Services Occupations by Sex
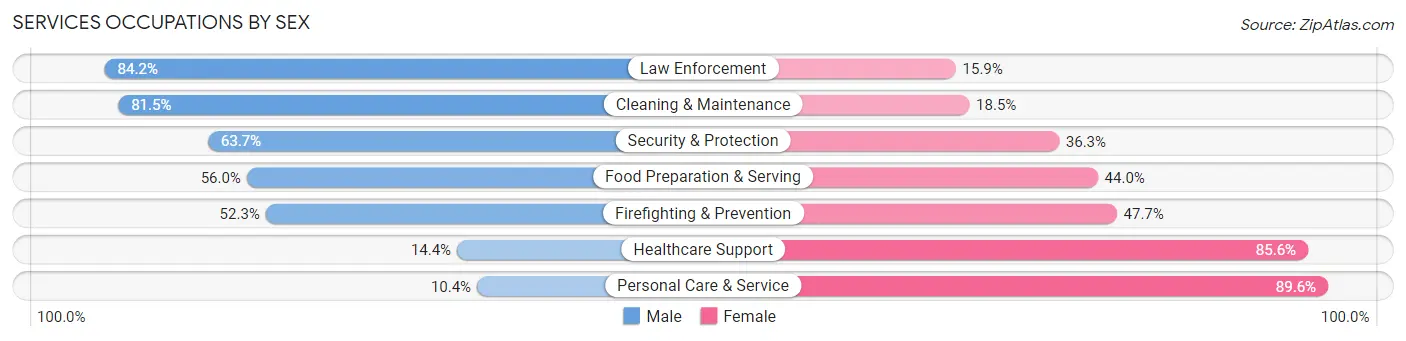
Within the Services occupations in Tehama County, the most male-oriented occupations are Law Enforcement (84.2%), Cleaning & Maintenance (81.5%), and Security & Protection (63.7%), while the most female-oriented occupations are Personal Care & Service (89.6%), Healthcare Support (85.6%), and Firefighting & Prevention (47.7%).
| Occupation | Male | Female |
| Healthcare Support | 164 (14.4%) | 976 (85.6%) |
| Security & Protection | 437 (63.7%) | 249 (36.3%) |
| Firefighting & Prevention | 230 (52.3%) | 210 (47.7%) |
| Law Enforcement | 207 (84.2%) | 39 (15.9%) |
| Food Preparation & Serving | 744 (56.0%) | 584 (44.0%) |
| Cleaning & Maintenance | 1,090 (81.5%) | 248 (18.5%) |
| Personal Care & Service | 48 (10.4%) | 412 (89.6%) |
| Total (Category) | 2,483 (50.1%) | 2,469 (49.9%) |
| Total (Overall) | 13,588 (53.1%) | 12,009 (46.9%) |
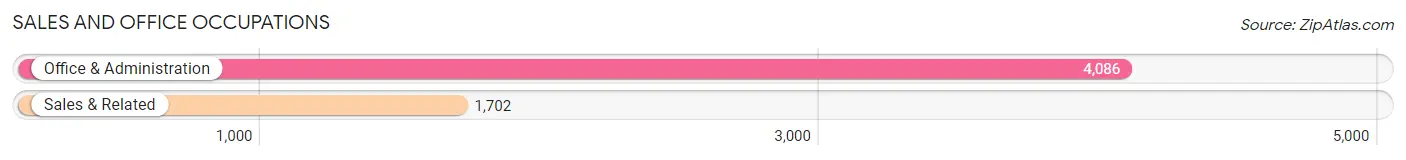
Sales and Office Occupations
The most common Sales and Office occupations in Tehama County are Office & Administration (4,086 | 16.0%), and Sales & Related (1,702 | 6.7%).
Sales and Office Occupations by Sex
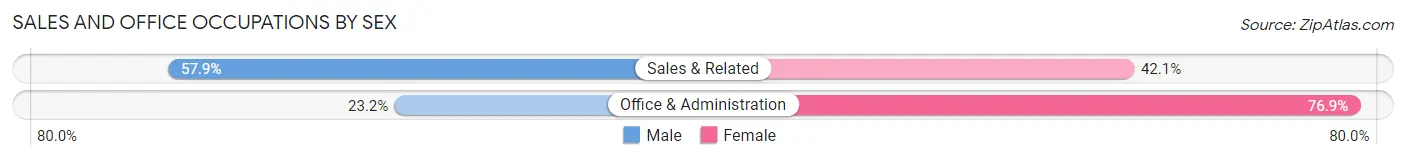
| Occupation | Male | Female |
| Sales & Related | 986 (57.9%) | 716 (42.1%) |
| Office & Administration | 946 (23.2%) | 3,140 (76.8%) |
| Total (Category) | 1,932 (33.4%) | 3,856 (66.6%) |
| Total (Overall) | 13,588 (53.1%) | 12,009 (46.9%) |
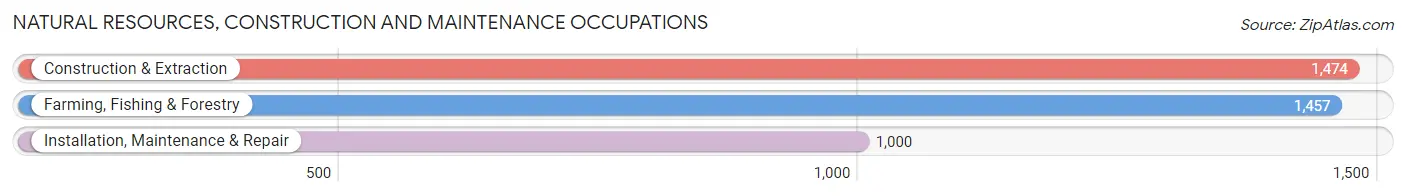
Natural Resources, Construction and Maintenance Occupations
The most common Natural Resources, Construction and Maintenance occupations in Tehama County are Construction & Extraction (1,474 | 5.8%), Farming, Fishing & Forestry (1,457 | 5.7%), and Installation, Maintenance & Repair (1,000 | 3.9%).
Natural Resources, Construction and Maintenance Occupations by Sex
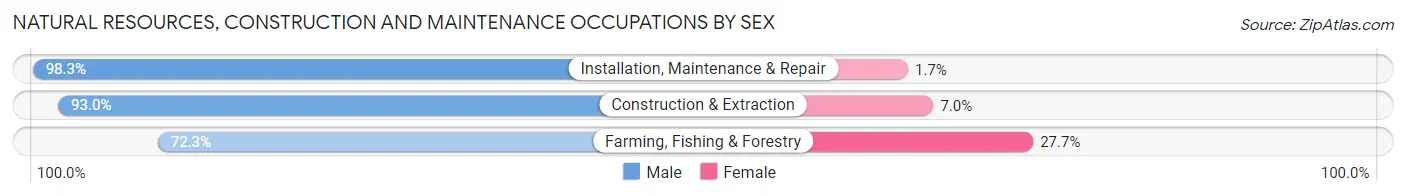
| Occupation | Male | Female |
| Farming, Fishing & Forestry | 1,053 (72.3%) | 404 (27.7%) |
| Construction & Extraction | 1,371 (93.0%) | 103 (7.0%) |
| Installation, Maintenance & Repair | 983 (98.3%) | 17 (1.7%) |
| Total (Category) | 3,407 (86.7%) | 524 (13.3%) |
| Total (Overall) | 13,588 (53.1%) | 12,009 (46.9%) |
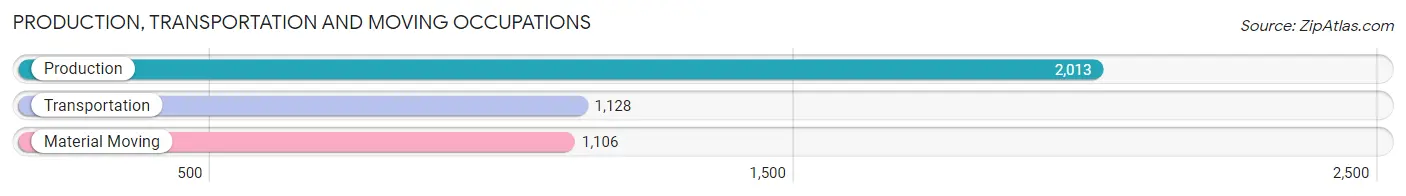
Production, Transportation and Moving Occupations
The most common Production, Transportation and Moving occupations in Tehama County are Production (2,013 | 7.9%), Transportation (1,128 | 4.4%), and Material Moving (1,106 | 4.3%).
Production, Transportation and Moving Occupations by Sex
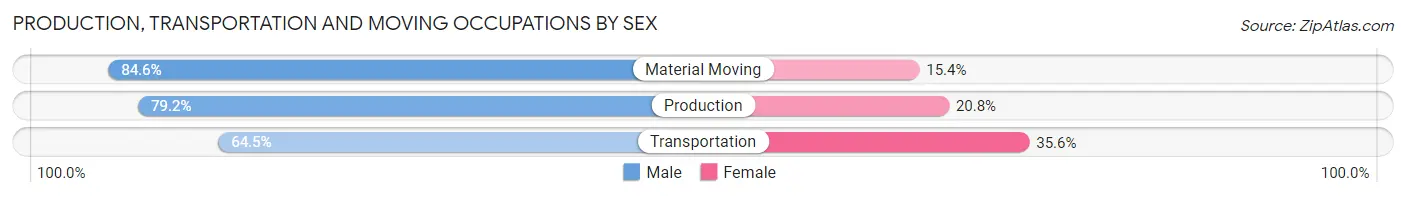
| Occupation | Male | Female |
| Production | 1,594 (79.2%) | 419 (20.8%) |
| Transportation | 727 (64.4%) | 401 (35.5%) |
| Material Moving | 936 (84.6%) | 170 (15.4%) |
| Total (Category) | 3,257 (76.7%) | 990 (23.3%) |
| Total (Overall) | 13,588 (53.1%) | 12,009 (46.9%) |
Employment Industries by Sex in Tehama County
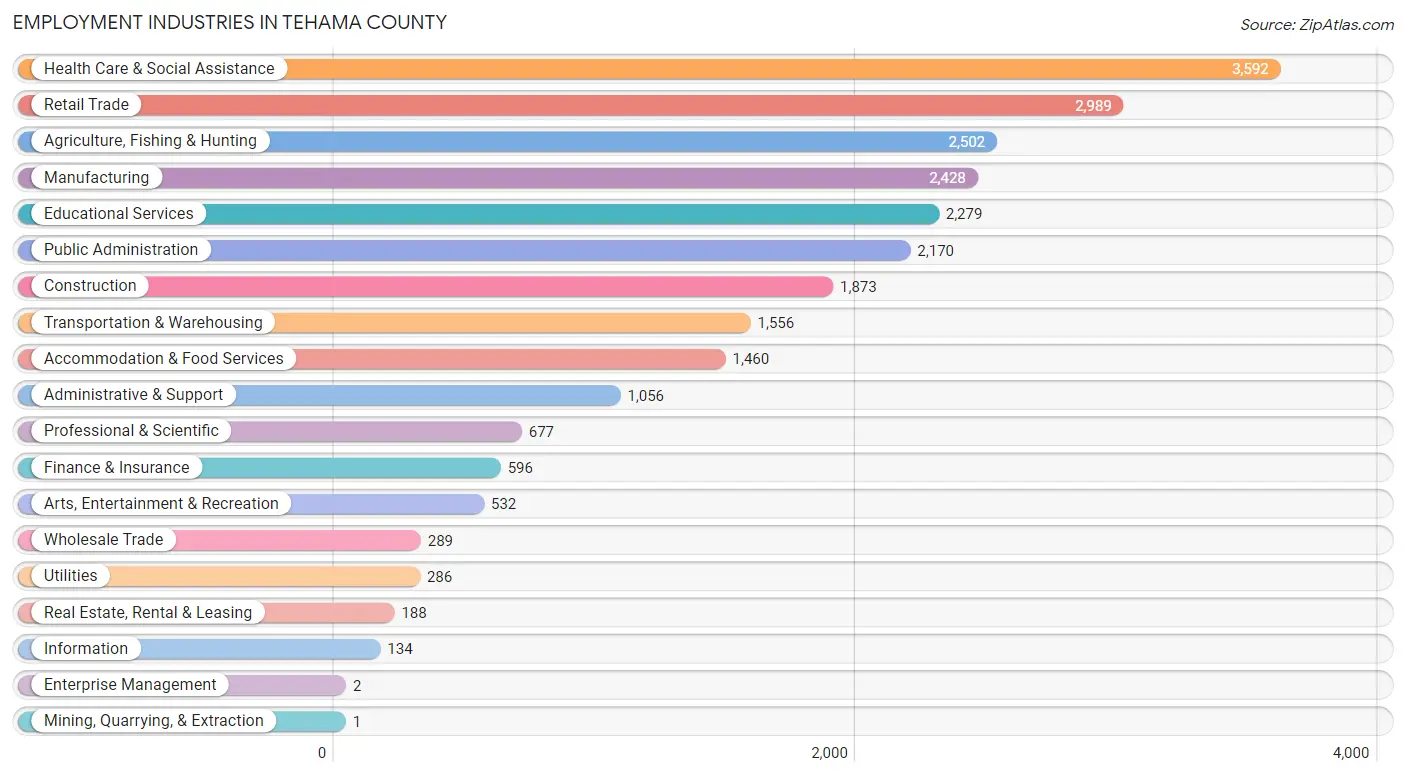
Employment Industries in Tehama County
The major employment industries in Tehama County include Health Care & Social Assistance (3,592 | 14.0%), Retail Trade (2,989 | 11.7%), Agriculture, Fishing & Hunting (2,502 | 9.8%), Manufacturing (2,428 | 9.5%), and Educational Services (2,279 | 8.9%).
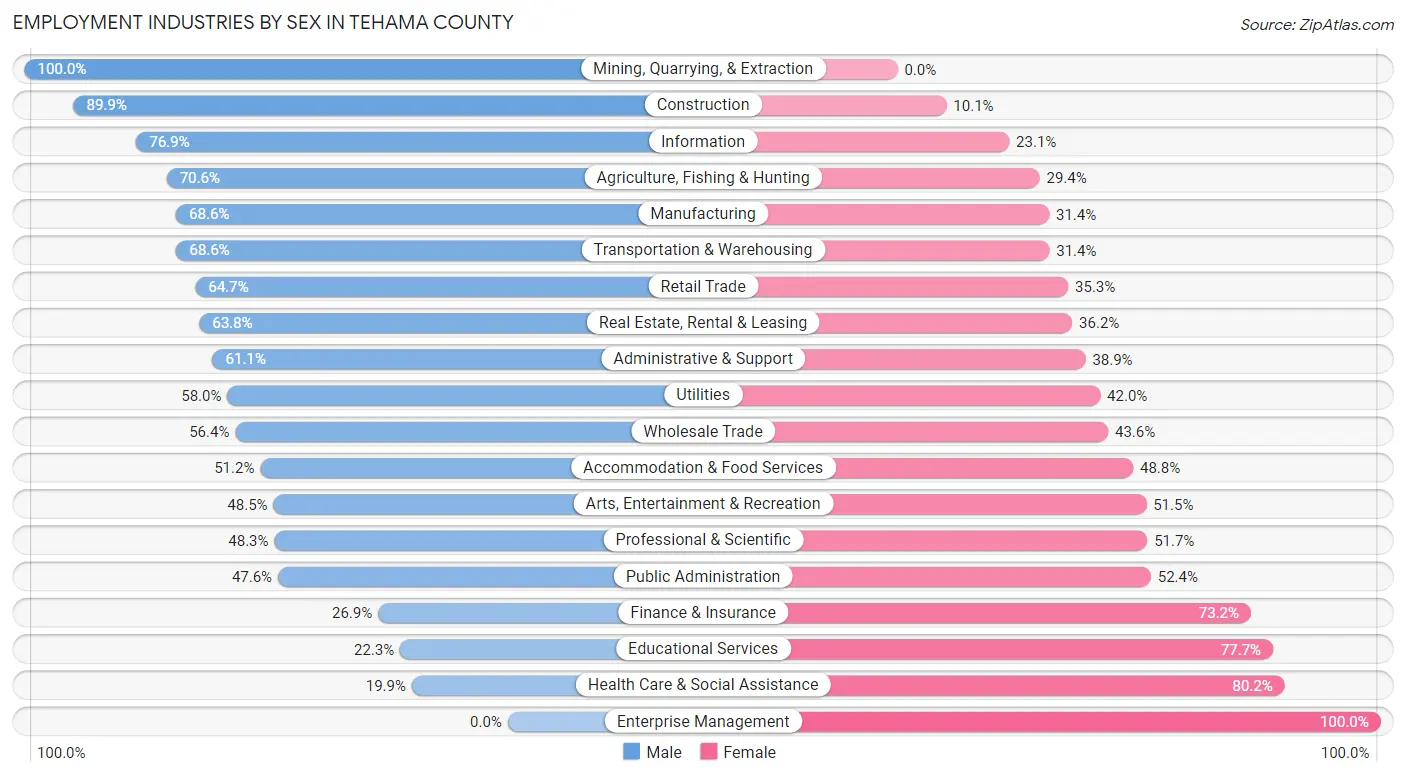
Employment Industries by Sex in Tehama County
The Tehama County industries that see more men than women are Mining, Quarrying, & Extraction (100.0%), Construction (89.9%), and Information (76.9%), whereas the industries that tend to have a higher number of women are Enterprise Management (100.0%), Health Care & Social Assistance (80.1%), and Educational Services (77.7%).
| Industry | Male | Female |
| Agriculture, Fishing & Hunting | 1,766 (70.6%) | 736 (29.4%) |
| Mining, Quarrying, & Extraction | 1 (100.0%) | 0 (0.0%) |
| Construction | 1,683 (89.9%) | 190 (10.1%) |
| Manufacturing | 1,666 (68.6%) | 762 (31.4%) |
| Wholesale Trade | 163 (56.4%) | 126 (43.6%) |
| Retail Trade | 1,933 (64.7%) | 1,056 (35.3%) |
| Transportation & Warehousing | 1,067 (68.6%) | 489 (31.4%) |
| Utilities | 166 (58.0%) | 120 (42.0%) |
| Information | 103 (76.9%) | 31 (23.1%) |
| Finance & Insurance | 160 (26.9%) | 436 (73.2%) |
| Real Estate, Rental & Leasing | 120 (63.8%) | 68 (36.2%) |
| Professional & Scientific | 327 (48.3%) | 350 (51.7%) |
| Enterprise Management | 0 (0.0%) | 2 (100.0%) |
| Administrative & Support | 645 (61.1%) | 411 (38.9%) |
| Educational Services | 508 (22.3%) | 1,771 (77.7%) |
| Health Care & Social Assistance | 713 (19.9%) | 2,879 (80.1%) |
| Arts, Entertainment & Recreation | 258 (48.5%) | 274 (51.5%) |
| Accommodation & Food Services | 748 (51.2%) | 712 (48.8%) |
| Public Administration | 1,032 (47.6%) | 1,138 (52.4%) |
| Total | 13,588 (53.1%) | 12,009 (46.9%) |
Education in Tehama County
School Enrollment in Tehama County
The most common levels of schooling among the 15,561 students in Tehama County are high school (3,838 | 24.7%), middle school (3,444 | 22.1%), and elementary school (3,175 | 20.4%).
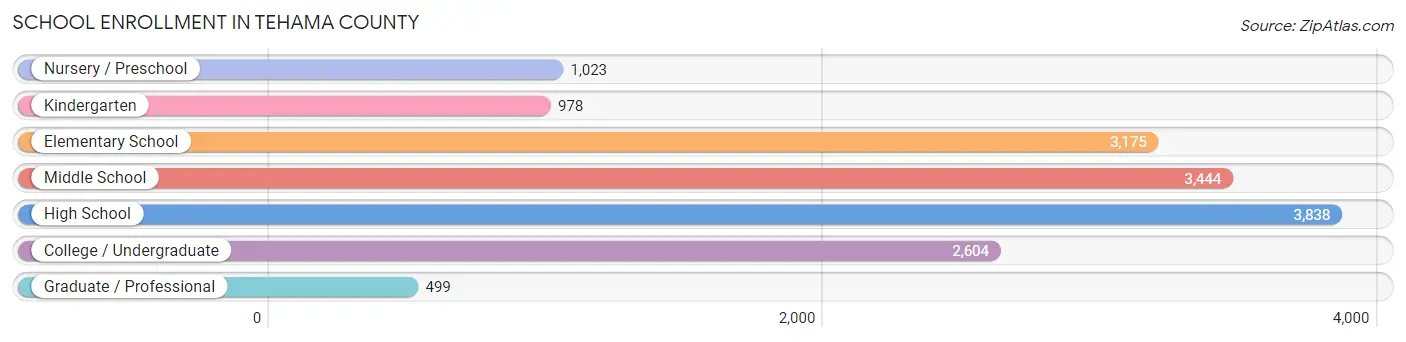
| School Level | # Students | % Students |
| Nursery / Preschool | 1,023 | 6.6% |
| Kindergarten | 978 | 6.3% |
| Elementary School | 3,175 | 20.4% |
| Middle School | 3,444 | 22.1% |
| High School | 3,838 | 24.7% |
| College / Undergraduate | 2,604 | 16.7% |
| Graduate / Professional | 499 | 3.2% |
| Total | 15,561 | 100.0% |
School Enrollment by Age by Funding Source in Tehama County
Out of a total of 15,561 students who are enrolled in schools in Tehama County, 1,572 (10.1%) attend a private institution, while the remaining 13,989 (89.9%) are enrolled in public schools. The age group of 20 to 24 year olds has the highest likelihood of being enrolled in private schools, with 250 (29.9% in the age bracket) enrolled. Conversely, the age group of 25 to 34 year olds has the lowest likelihood of being enrolled in a private school, with 990 (96.5% in the age bracket) attending a public institution.
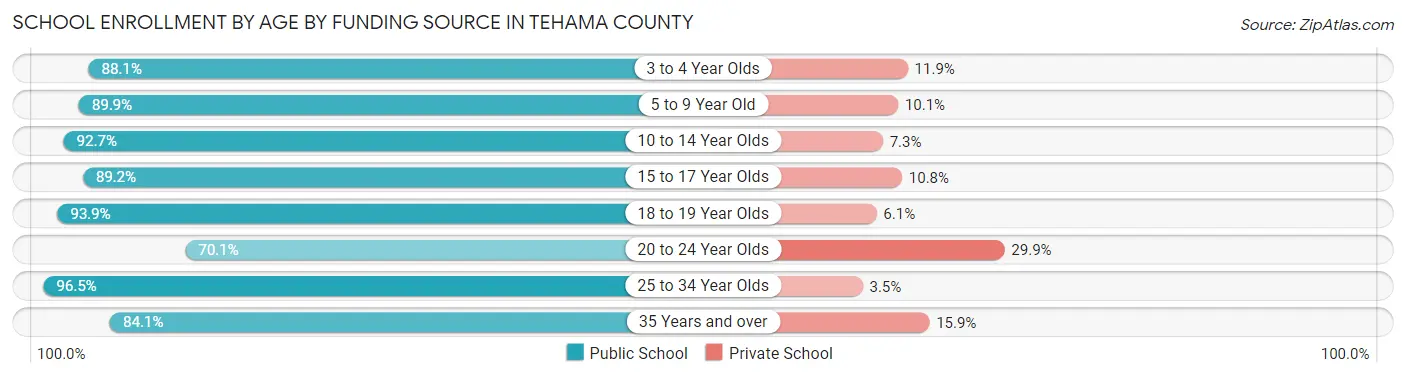
| Age Bracket | Public School | Private School |
| 3 to 4 Year Olds | 569 (88.1%) | 77 (11.9%) |
| 5 to 9 Year Old | 3,904 (89.9%) | 439 (10.1%) |
| 10 to 14 Year Olds | 4,274 (92.7%) | 335 (7.3%) |
| 15 to 17 Year Olds | 2,263 (89.2%) | 275 (10.8%) |
| 18 to 19 Year Olds | 785 (93.9%) | 51 (6.1%) |
| 20 to 24 Year Olds | 585 (70.1%) | 250 (29.9%) |
| 25 to 34 Year Olds | 990 (96.5%) | 36 (3.5%) |
| 35 Years and over | 612 (84.1%) | 116 (15.9%) |
| Total | 13,989 (89.9%) | 1,572 (10.1%) |
Educational Attainment by Field of Study in Tehama County
Education (1,304 | 15.2%), business (987 | 11.5%), bio, nature & agricultural (853 | 9.9%), psychology (800 | 9.3%), and arts & humanities (739 | 8.6%) are the most common fields of study among 8,604 individuals in Tehama County who have obtained a bachelor's degree or higher.
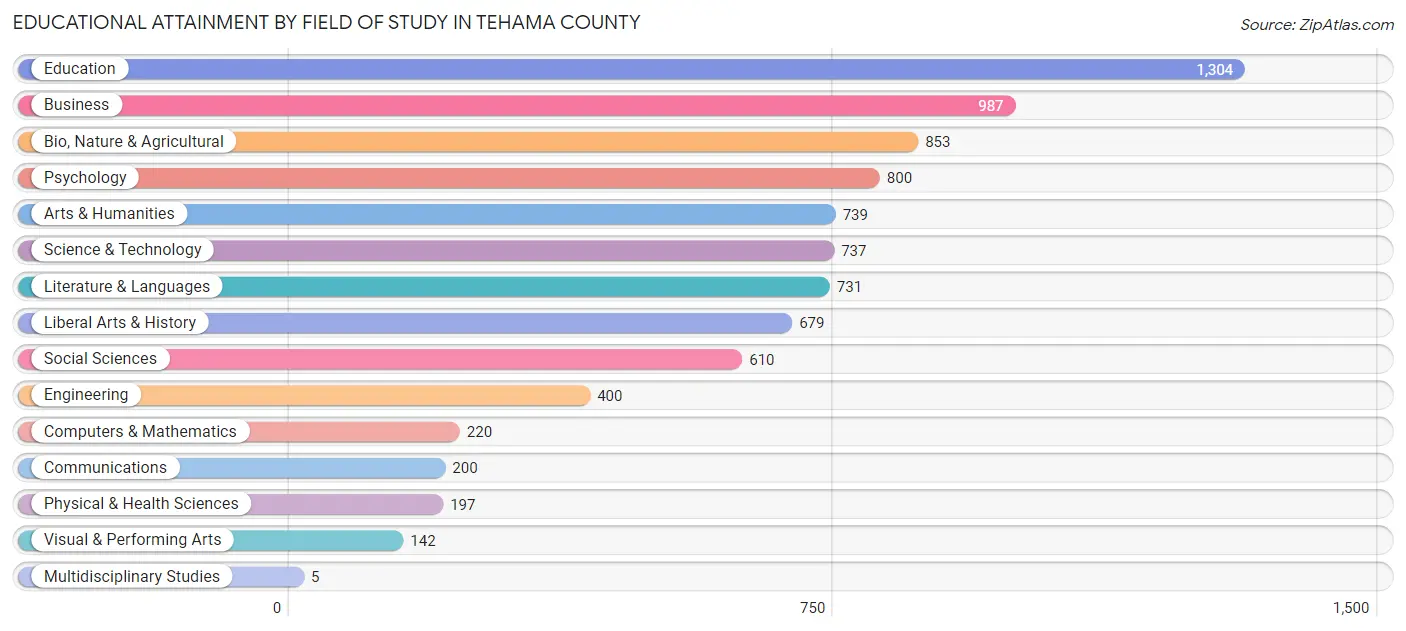
| Field of Study | # Graduates | % Graduates |
| Computers & Mathematics | 220 | 2.6% |
| Bio, Nature & Agricultural | 853 | 9.9% |
| Physical & Health Sciences | 197 | 2.3% |
| Psychology | 800 | 9.3% |
| Social Sciences | 610 | 7.1% |
| Engineering | 400 | 4.6% |
| Multidisciplinary Studies | 5 | 0.1% |
| Science & Technology | 737 | 8.6% |
| Business | 987 | 11.5% |
| Education | 1,304 | 15.2% |
| Literature & Languages | 731 | 8.5% |
| Liberal Arts & History | 679 | 7.9% |
| Visual & Performing Arts | 142 | 1.7% |
| Communications | 200 | 2.3% |
| Arts & Humanities | 739 | 8.6% |
| Total | 8,604 | 100.0% |
Transportation & Commute in Tehama County
Vehicle Availability by Sex in Tehama County
The most prevalent vehicle ownership categories in Tehama County are males with 2 vehicles (4,798, accounting for 36.3%) and females with 2 vehicles (3,573, making up 42.2%).
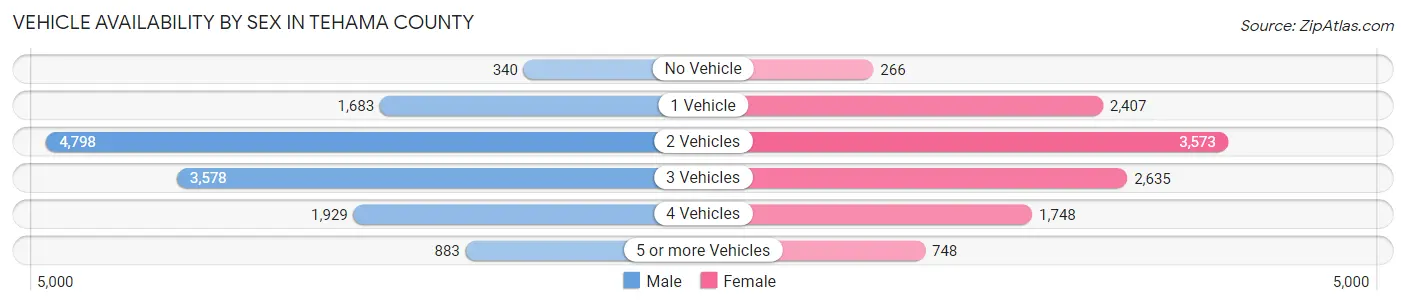
| Vehicles Available | Male | Female |
| No Vehicle | 340 (2.6%) | 266 (2.3%) |
| 1 Vehicle | 1,683 (12.7%) | 2,407 (21.2%) |
| 2 Vehicles | 4,798 (36.3%) | 3,573 (31.4%) |
| 3 Vehicles | 3,578 (27.1%) | 2,635 (23.2%) |
| 4 Vehicles | 1,929 (14.6%) | 1,748 (15.4%) |
| 5 or more Vehicles | 883 (6.7%) | 748 (6.6%) |
| Total | 13,211 (100.0%) | 11,377 (100.0%) |
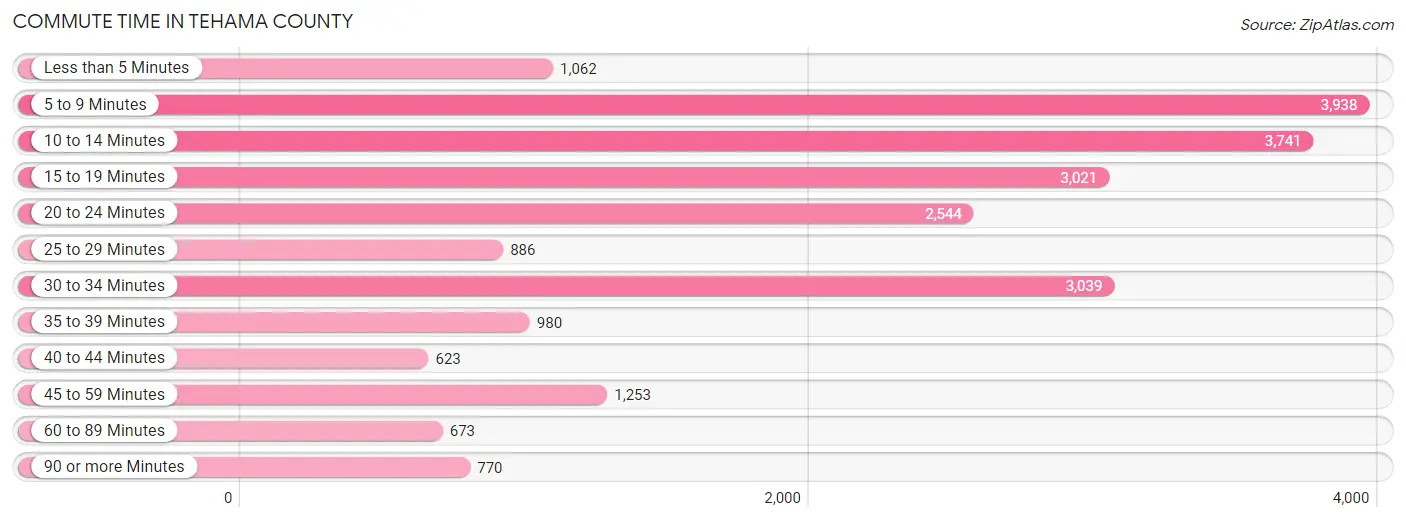
Commute Time in Tehama County
The most frequently occuring commute durations in Tehama County are 5 to 9 minutes (3,938 commuters, 17.5%), 10 to 14 minutes (3,741 commuters, 16.6%), and 30 to 34 minutes (3,039 commuters, 13.5%).
| Commute Time | # Commuters | % Commuters |
| Less than 5 Minutes | 1,062 | 4.7% |
| 5 to 9 Minutes | 3,938 | 17.5% |
| 10 to 14 Minutes | 3,741 | 16.6% |
| 15 to 19 Minutes | 3,021 | 13.4% |
| 20 to 24 Minutes | 2,544 | 11.3% |
| 25 to 29 Minutes | 886 | 3.9% |
| 30 to 34 Minutes | 3,039 | 13.5% |
| 35 to 39 Minutes | 980 | 4.3% |
| 40 to 44 Minutes | 623 | 2.8% |
| 45 to 59 Minutes | 1,253 | 5.6% |
| 60 to 89 Minutes | 673 | 3.0% |
| 90 or more Minutes | 770 | 3.4% |
Commute Time by Sex in Tehama County
The most common commute times in Tehama County are 10 to 14 minutes (1,874 commuters, 15.2%) for males and 5 to 9 minutes (2,219 commuters, 21.7%) for females.
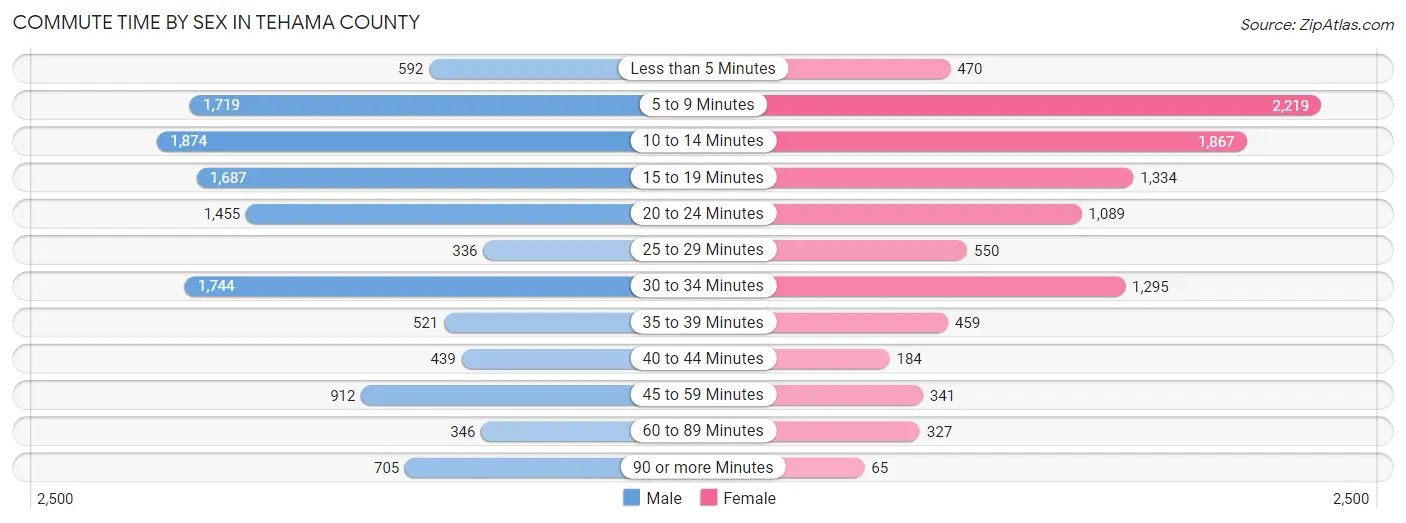
| Commute Time | Male | Female |
| Less than 5 Minutes | 592 (4.8%) | 470 (4.6%) |
| 5 to 9 Minutes | 1,719 (13.9%) | 2,219 (21.7%) |
| 10 to 14 Minutes | 1,874 (15.2%) | 1,867 (18.3%) |
| 15 to 19 Minutes | 1,687 (13.7%) | 1,334 (13.1%) |
| 20 to 24 Minutes | 1,455 (11.8%) | 1,089 (10.7%) |
| 25 to 29 Minutes | 336 (2.7%) | 550 (5.4%) |
| 30 to 34 Minutes | 1,744 (14.1%) | 1,295 (12.7%) |
| 35 to 39 Minutes | 521 (4.2%) | 459 (4.5%) |
| 40 to 44 Minutes | 439 (3.6%) | 184 (1.8%) |
| 45 to 59 Minutes | 912 (7.4%) | 341 (3.3%) |
| 60 to 89 Minutes | 346 (2.8%) | 327 (3.2%) |
| 90 or more Minutes | 705 (5.7%) | 65 (0.6%) |
Time of Departure to Work by Sex in Tehama County
The most frequent times of departure to work in Tehama County are 12:00 AM to 4:59 AM (1,928, 15.6%) for males and 7:30 AM to 7:59 AM (2,238, 21.9%) for females.
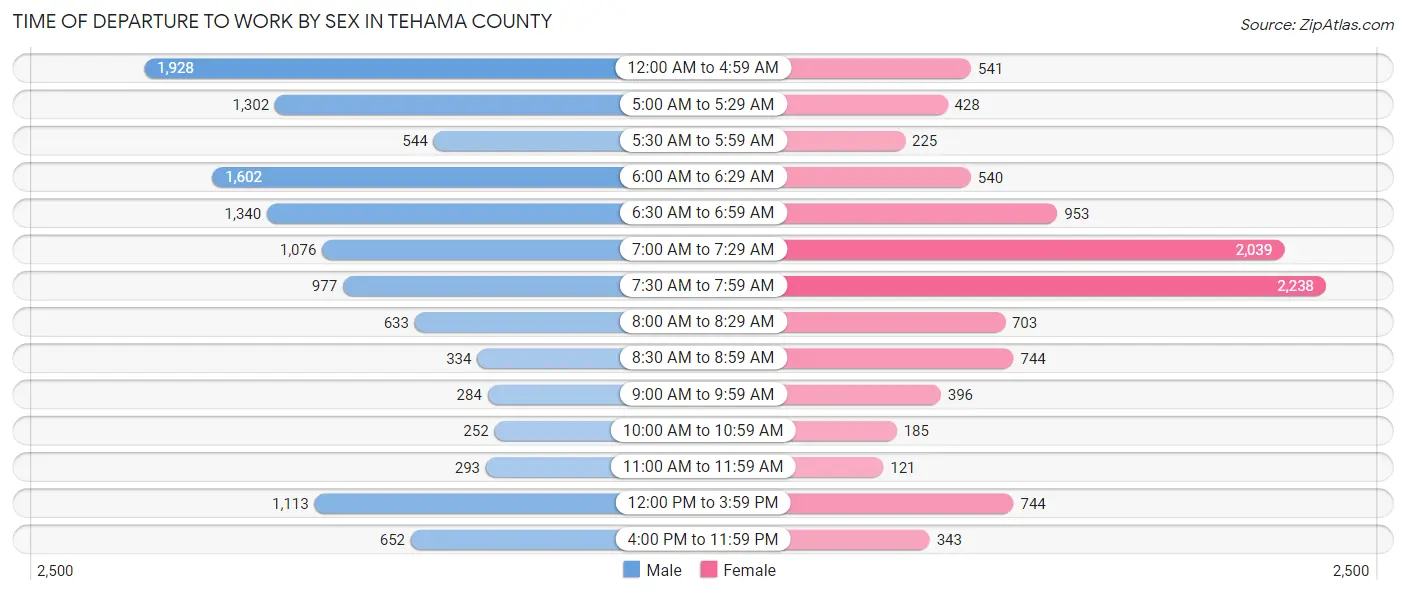
| Time of Departure | Male | Female |
| 12:00 AM to 4:59 AM | 1,928 (15.6%) | 541 (5.3%) |
| 5:00 AM to 5:29 AM | 1,302 (10.6%) | 428 (4.2%) |
| 5:30 AM to 5:59 AM | 544 (4.4%) | 225 (2.2%) |
| 6:00 AM to 6:29 AM | 1,602 (13.0%) | 540 (5.3%) |
| 6:30 AM to 6:59 AM | 1,340 (10.9%) | 953 (9.3%) |
| 7:00 AM to 7:29 AM | 1,076 (8.7%) | 2,039 (20.0%) |
| 7:30 AM to 7:59 AM | 977 (7.9%) | 2,238 (21.9%) |
| 8:00 AM to 8:29 AM | 633 (5.1%) | 703 (6.9%) |
| 8:30 AM to 8:59 AM | 334 (2.7%) | 744 (7.3%) |
| 9:00 AM to 9:59 AM | 284 (2.3%) | 396 (3.9%) |
| 10:00 AM to 10:59 AM | 252 (2.0%) | 185 (1.8%) |
| 11:00 AM to 11:59 AM | 293 (2.4%) | 121 (1.2%) |
| 12:00 PM to 3:59 PM | 1,113 (9.0%) | 744 (7.3%) |
| 4:00 PM to 11:59 PM | 652 (5.3%) | 343 (3.4%) |
| Total | 12,330 (100.0%) | 10,200 (100.0%) |
Housing Occupancy in Tehama County
Occupancy by Ownership in Tehama County
Of the total 24,623 dwellings in Tehama County, owner-occupied units account for 16,520 (67.1%), while renter-occupied units make up 8,103 (32.9%).
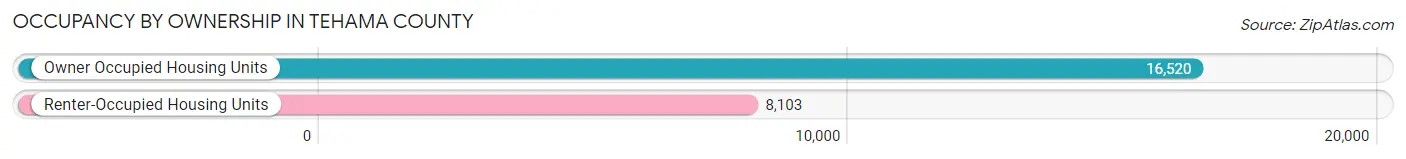
| Occupancy | # Housing Units | % Housing Units |
| Owner Occupied Housing Units | 16,520 | 67.1% |
| Renter-Occupied Housing Units | 8,103 | 32.9% |
| Total Occupied Housing Units | 24,623 | 100.0% |
Occupancy by Household Size in Tehama County
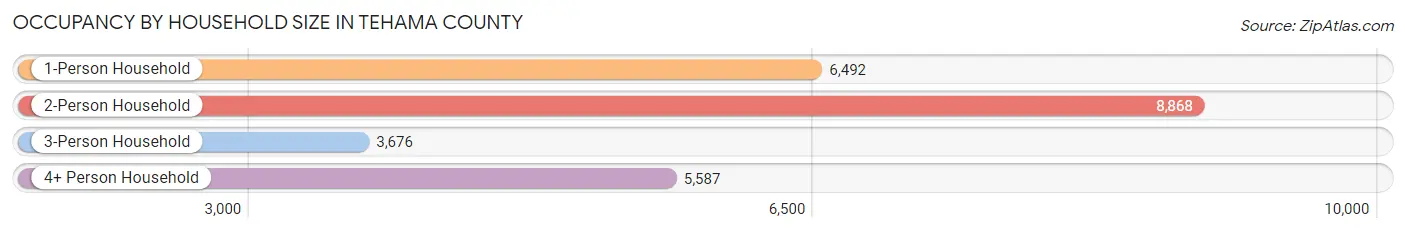
| Household Size | # Housing Units | % Housing Units |
| 1-Person Household | 6,492 | 26.4% |
| 2-Person Household | 8,868 | 36.0% |
| 3-Person Household | 3,676 | 14.9% |
| 4+ Person Household | 5,587 | 22.7% |
| Total Housing Units | 24,623 | 100.0% |
Occupancy by Ownership by Household Size in Tehama County
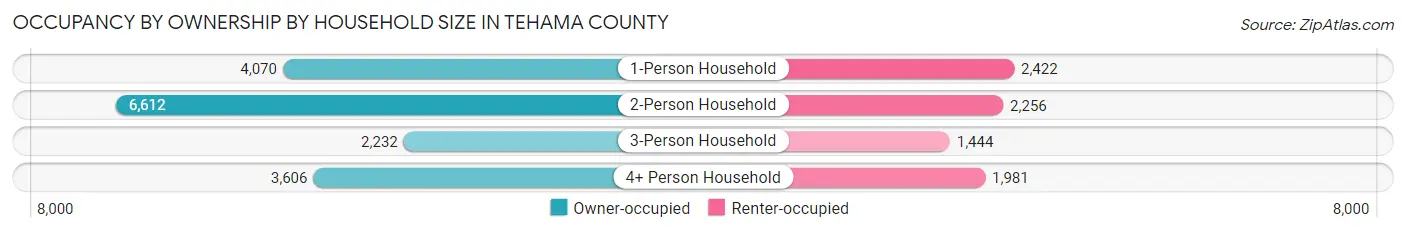
| Household Size | Owner-occupied | Renter-occupied |
| 1-Person Household | 4,070 (62.7%) | 2,422 (37.3%) |
| 2-Person Household | 6,612 (74.6%) | 2,256 (25.4%) |
| 3-Person Household | 2,232 (60.7%) | 1,444 (39.3%) |
| 4+ Person Household | 3,606 (64.5%) | 1,981 (35.5%) |
| Total Housing Units | 16,520 (67.1%) | 8,103 (32.9%) |
Occupancy by Educational Attainment in Tehama County
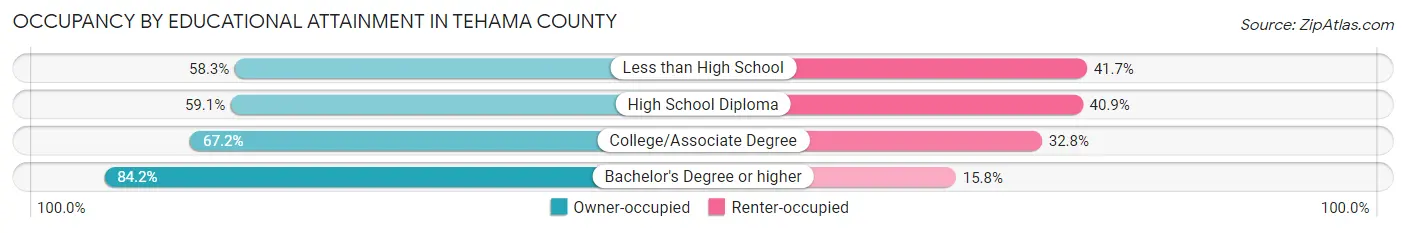
| Household Size | Owner-occupied | Renter-occupied |
| Less than High School | 1,774 (58.3%) | 1,271 (41.7%) |
| High School Diploma | 3,696 (59.1%) | 2,560 (40.9%) |
| College/Associate Degree | 7,305 (67.2%) | 3,570 (32.8%) |
| Bachelor's Degree or higher | 3,745 (84.2%) | 702 (15.8%) |
Occupancy by Age of Householder in Tehama County
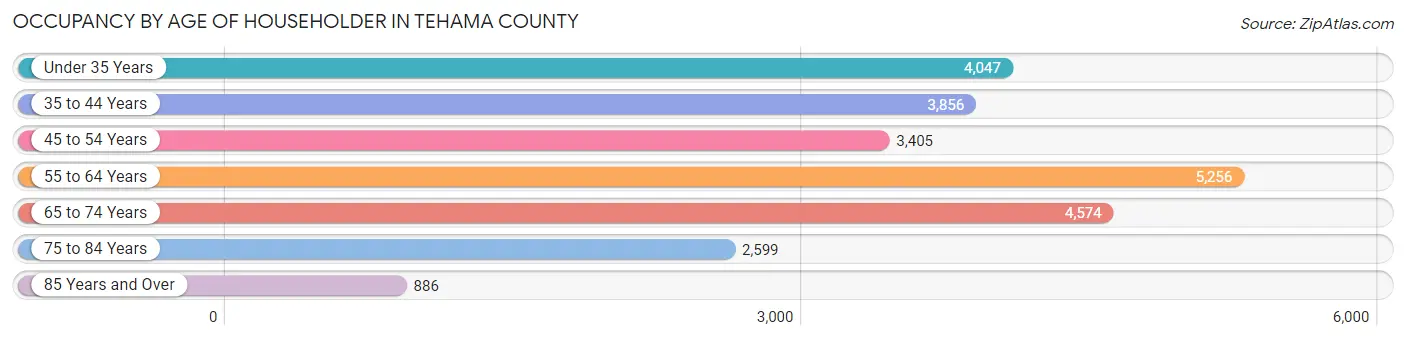
| Age Bracket | # Households | % Households |
| Under 35 Years | 4,047 | 16.4% |
| 35 to 44 Years | 3,856 | 15.7% |
| 45 to 54 Years | 3,405 | 13.8% |
| 55 to 64 Years | 5,256 | 21.3% |
| 65 to 74 Years | 4,574 | 18.6% |
| 75 to 84 Years | 2,599 | 10.6% |
| 85 Years and Over | 886 | 3.6% |
| Total | 24,623 | 100.0% |
Housing Finances in Tehama County
Median Income by Occupancy in Tehama County
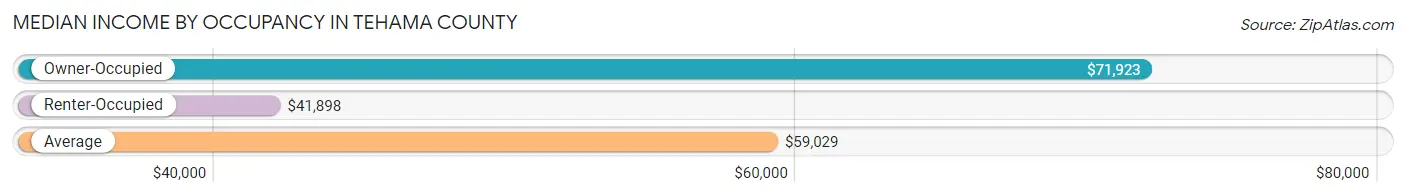
| Occupancy Type | # Households | Median Income |
| Owner-Occupied | 16,520 (67.1%) | $71,923 |
| Renter-Occupied | 8,103 (32.9%) | $41,898 |
| Average | 24,623 (100.0%) | $59,029 |
Occupancy by Householder Income Bracket in Tehama County
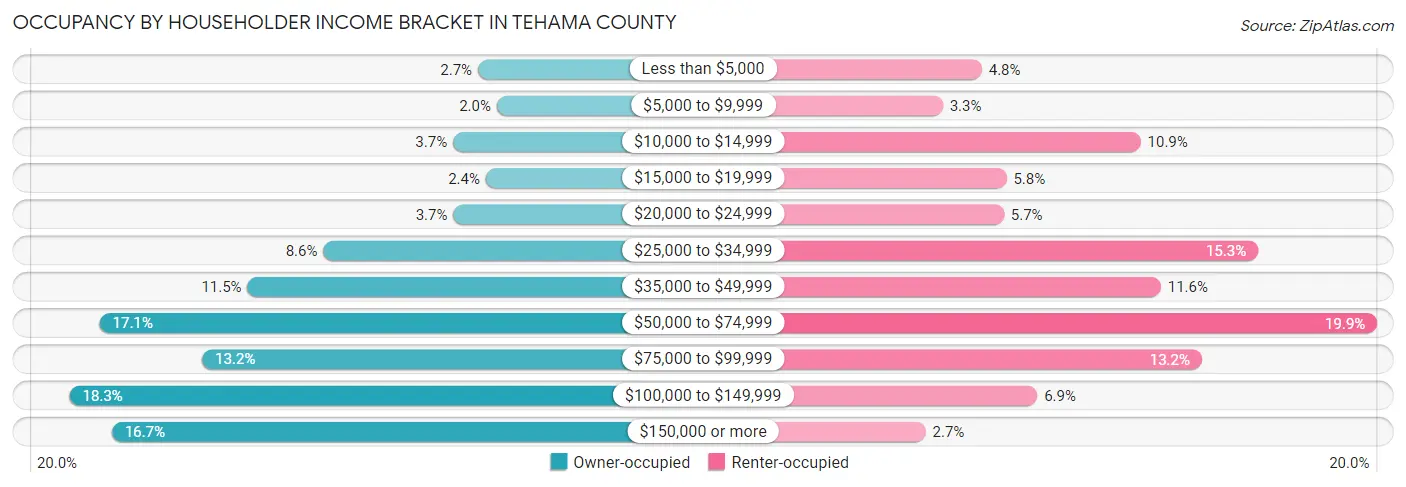
| Income Bracket | Owner-occupied | Renter-occupied |
| Less than $5,000 | 451 (2.7%) | 390 (4.8%) |
| $5,000 to $9,999 | 332 (2.0%) | 269 (3.3%) |
| $10,000 to $14,999 | 608 (3.7%) | 880 (10.9%) |
| $15,000 to $19,999 | 402 (2.4%) | 466 (5.8%) |
| $20,000 to $24,999 | 607 (3.7%) | 458 (5.7%) |
| $25,000 to $34,999 | 1,424 (8.6%) | 1,242 (15.3%) |
| $35,000 to $49,999 | 1,901 (11.5%) | 942 (11.6%) |
| $50,000 to $74,999 | 2,831 (17.1%) | 1,610 (19.9%) |
| $75,000 to $99,999 | 2,187 (13.2%) | 1,069 (13.2%) |
| $100,000 to $149,999 | 3,021 (18.3%) | 561 (6.9%) |
| $150,000 or more | 2,756 (16.7%) | 216 (2.7%) |
| Total | 16,520 (100.0%) | 8,103 (100.0%) |
Monthly Housing Cost Tiers in Tehama County
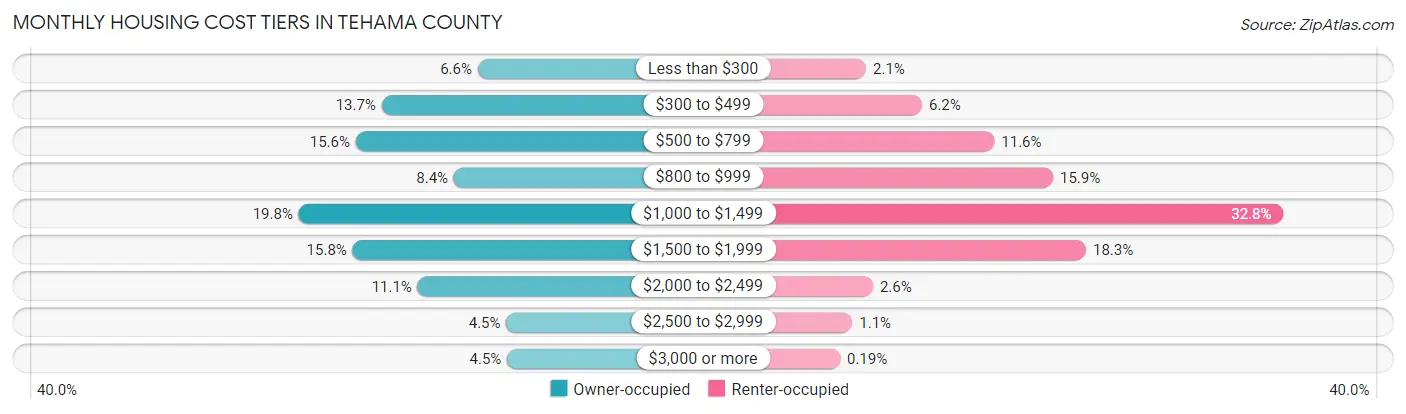
| Monthly Cost | Owner-occupied | Renter-occupied |
| Less than $300 | 1,094 (6.6%) | 171 (2.1%) |
| $300 to $499 | 2,264 (13.7%) | 505 (6.2%) |
| $500 to $799 | 2,579 (15.6%) | 937 (11.6%) |
| $800 to $999 | 1,385 (8.4%) | 1,287 (15.9%) |
| $1,000 to $1,499 | 3,273 (19.8%) | 2,661 (32.8%) |
| $1,500 to $1,999 | 2,616 (15.8%) | 1,484 (18.3%) |
| $2,000 to $2,499 | 1,826 (11.1%) | 212 (2.6%) |
| $2,500 to $2,999 | 747 (4.5%) | 89 (1.1%) |
| $3,000 or more | 736 (4.5%) | 15 (0.2%) |
| Total | 16,520 (100.0%) | 8,103 (100.0%) |
Physical Housing Characteristics in Tehama County
Housing Structures in Tehama County
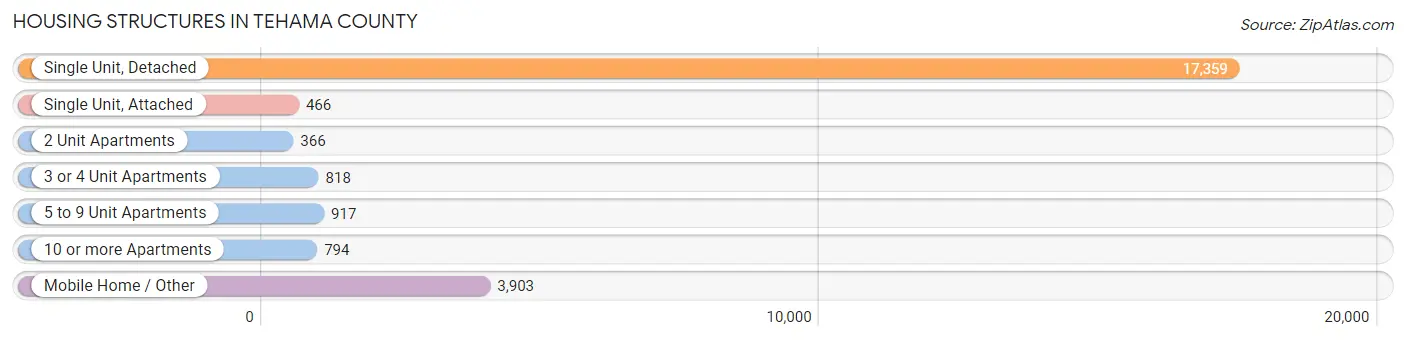
| Structure Type | # Housing Units | % Housing Units |
| Single Unit, Detached | 17,359 | 70.5% |
| Single Unit, Attached | 466 | 1.9% |
| 2 Unit Apartments | 366 | 1.5% |
| 3 or 4 Unit Apartments | 818 | 3.3% |
| 5 to 9 Unit Apartments | 917 | 3.7% |
| 10 or more Apartments | 794 | 3.2% |
| Mobile Home / Other | 3,903 | 15.9% |
| Total | 24,623 | 100.0% |
Housing Structures by Occupancy in Tehama County
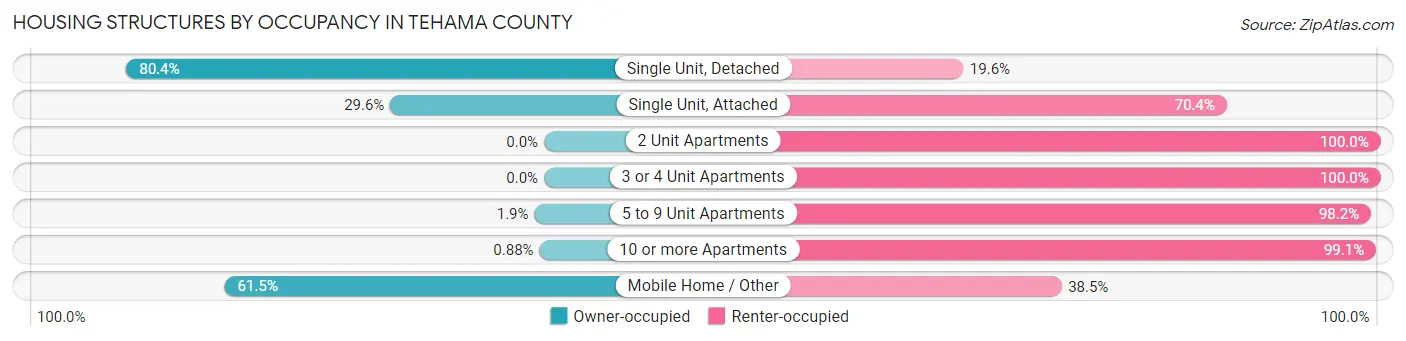
| Structure Type | Owner-occupied | Renter-occupied |
| Single Unit, Detached | 13,958 (80.4%) | 3,401 (19.6%) |
| Single Unit, Attached | 138 (29.6%) | 328 (70.4%) |
| 2 Unit Apartments | 0 (0.0%) | 366 (100.0%) |
| 3 or 4 Unit Apartments | 0 (0.0%) | 818 (100.0%) |
| 5 to 9 Unit Apartments | 17 (1.8%) | 900 (98.2%) |
| 10 or more Apartments | 7 (0.9%) | 787 (99.1%) |
| Mobile Home / Other | 2,400 (61.5%) | 1,503 (38.5%) |
| Total | 16,520 (67.1%) | 8,103 (32.9%) |
Housing Structures by Number of Rooms in Tehama County
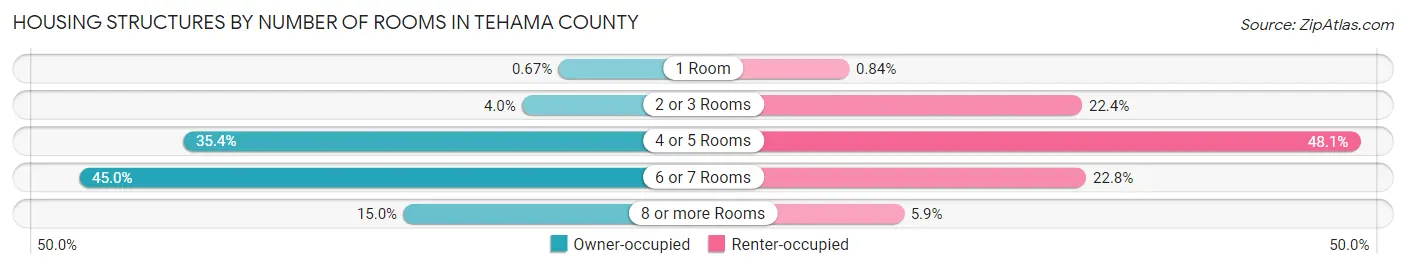
| Number of Rooms | Owner-occupied | Renter-occupied |
| 1 Room | 111 (0.7%) | 68 (0.8%) |
| 2 or 3 Rooms | 666 (4.0%) | 1,814 (22.4%) |
| 4 or 5 Rooms | 5,839 (35.3%) | 3,898 (48.1%) |
| 6 or 7 Rooms | 7,425 (45.0%) | 1,845 (22.8%) |
| 8 or more Rooms | 2,479 (15.0%) | 478 (5.9%) |
| Total | 16,520 (100.0%) | 8,103 (100.0%) |
Housing Structure by Heating Type in Tehama County
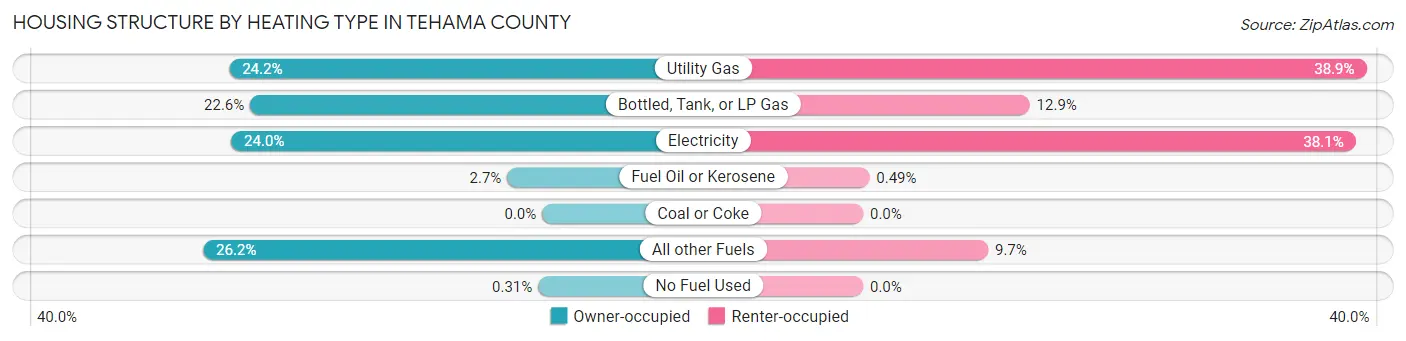
| Heating Type | Owner-occupied | Renter-occupied |
| Utility Gas | 3,994 (24.2%) | 3,152 (38.9%) |
| Bottled, Tank, or LP Gas | 3,729 (22.6%) | 1,044 (12.9%) |
| Electricity | 3,971 (24.0%) | 3,084 (38.1%) |
| Fuel Oil or Kerosene | 446 (2.7%) | 40 (0.5%) |
| Coal or Coke | 0 (0.0%) | 0 (0.0%) |
| All other Fuels | 4,328 (26.2%) | 783 (9.7%) |
| No Fuel Used | 52 (0.3%) | 0 (0.0%) |
| Total | 16,520 (100.0%) | 8,103 (100.0%) |
Household Vehicle Usage in Tehama County
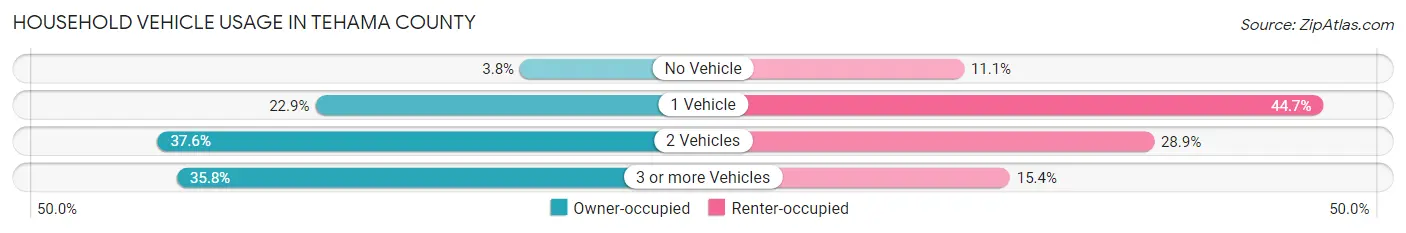
| Vehicles per Household | Owner-occupied | Renter-occupied |
| No Vehicle | 621 (3.8%) | 900 (11.1%) |
| 1 Vehicle | 3,778 (22.9%) | 3,618 (44.7%) |
| 2 Vehicles | 6,210 (37.6%) | 2,338 (28.8%) |
| 3 or more Vehicles | 5,911 (35.8%) | 1,247 (15.4%) |
| Total | 16,520 (100.0%) | 8,103 (100.0%) |
Real Estate & Mortgages in Tehama County
Real Estate and Mortgage Overview in Tehama County
| Characteristic | Without Mortgage | With Mortgage |
| Housing Units | 6,745 | 9,775 |
| Median Property Value | $258,300 | $309,500 |
| Median Household Income | $51,819 | $1,904 |
| Monthly Housing Costs | $505 | $732 |
| Real Estate Taxes | $1,432 | $488 |
Property Value by Mortgage Status in Tehama County
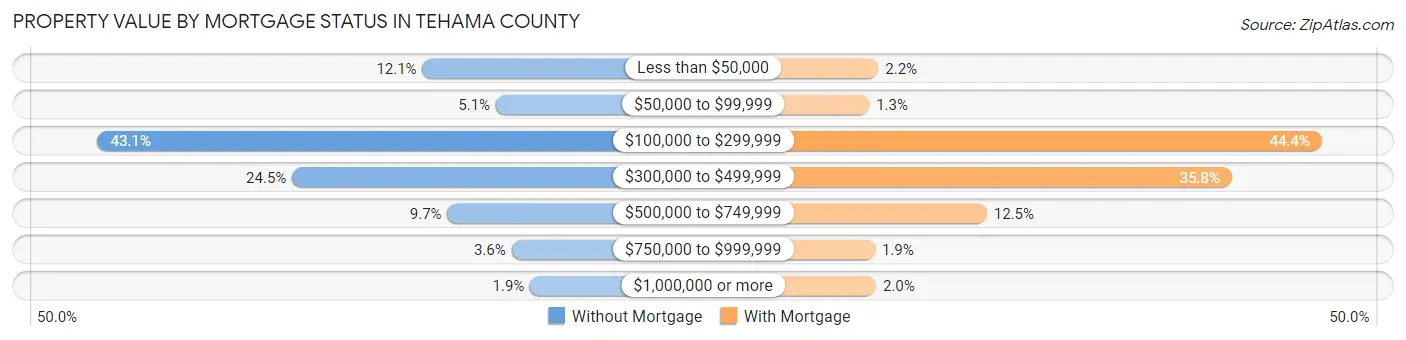
| Property Value | Without Mortgage | With Mortgage |
| Less than $50,000 | 817 (12.1%) | 212 (2.2%) |
| $50,000 to $99,999 | 345 (5.1%) | 127 (1.3%) |
| $100,000 to $299,999 | 2,904 (43.0%) | 4,340 (44.4%) |
| $300,000 to $499,999 | 1,654 (24.5%) | 3,502 (35.8%) |
| $500,000 to $749,999 | 656 (9.7%) | 1,222 (12.5%) |
| $750,000 to $999,999 | 244 (3.6%) | 181 (1.8%) |
| $1,000,000 or more | 125 (1.8%) | 191 (1.9%) |
| Total | 6,745 (100.0%) | 9,775 (100.0%) |
Household Income by Mortgage Status in Tehama County
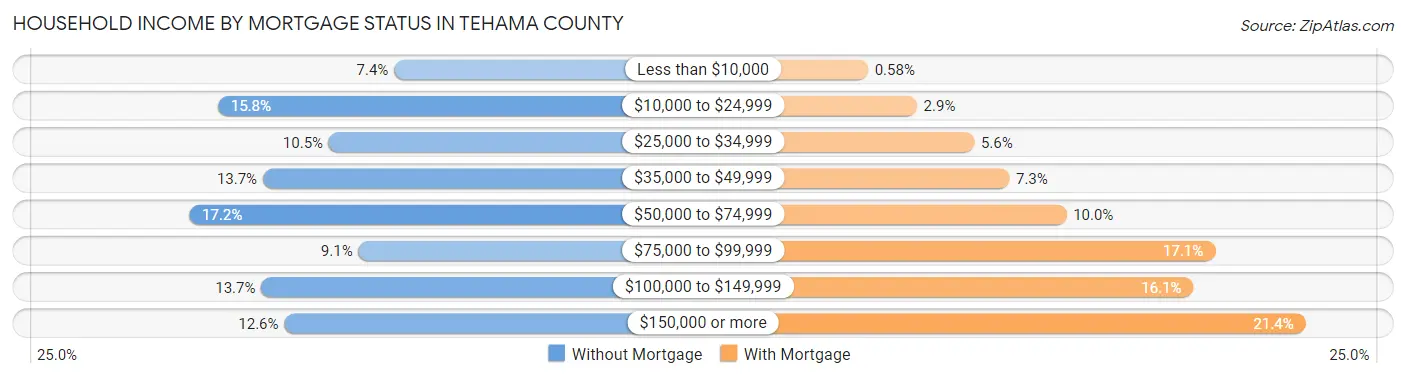
| Household Income | Without Mortgage | With Mortgage |
| Less than $10,000 | 499 (7.4%) | 57 (0.6%) |
| $10,000 to $24,999 | 1,066 (15.8%) | 284 (2.9%) |
| $25,000 to $34,999 | 709 (10.5%) | 551 (5.6%) |
| $35,000 to $49,999 | 921 (13.7%) | 715 (7.3%) |
| $50,000 to $74,999 | 1,158 (17.2%) | 980 (10.0%) |
| $75,000 to $99,999 | 614 (9.1%) | 1,673 (17.1%) |
| $100,000 to $149,999 | 926 (13.7%) | 1,573 (16.1%) |
| $150,000 or more | 852 (12.6%) | 2,095 (21.4%) |
| Total | 6,745 (100.0%) | 9,775 (100.0%) |
Property Value to Household Income Ratio in Tehama County
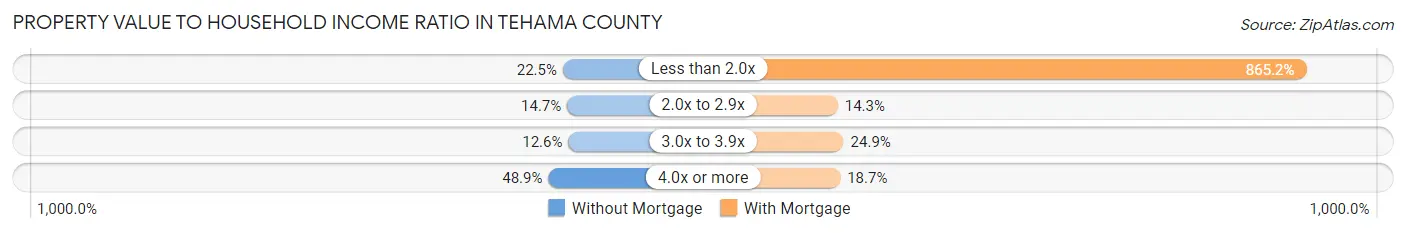
| Value-to-Income Ratio | Without Mortgage | With Mortgage |
| Less than 2.0x | 1,518 (22.5%) | 84,570 (865.2%) |
| 2.0x to 2.9x | 994 (14.7%) | 1,400 (14.3%) |
| 3.0x to 3.9x | 849 (12.6%) | 2,437 (24.9%) |
| 4.0x or more | 3,295 (48.8%) | 1,831 (18.7%) |
| Total | 6,745 (100.0%) | 9,775 (100.0%) |
Real Estate Taxes by Mortgage Status in Tehama County
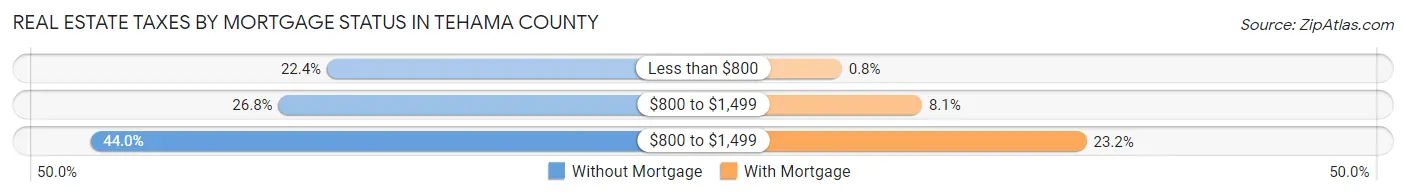
| Property Taxes | Without Mortgage | With Mortgage |
| Less than $800 | 1,510 (22.4%) | 78 (0.8%) |
| $800 to $1,499 | 1,809 (26.8%) | 794 (8.1%) |
| $800 to $1,499 | 2,968 (44.0%) | 2,263 (23.2%) |
| Total | 6,745 (100.0%) | 9,775 (100.0%) |
Health & Disability in Tehama County
Health Insurance Coverage by Age in Tehama County
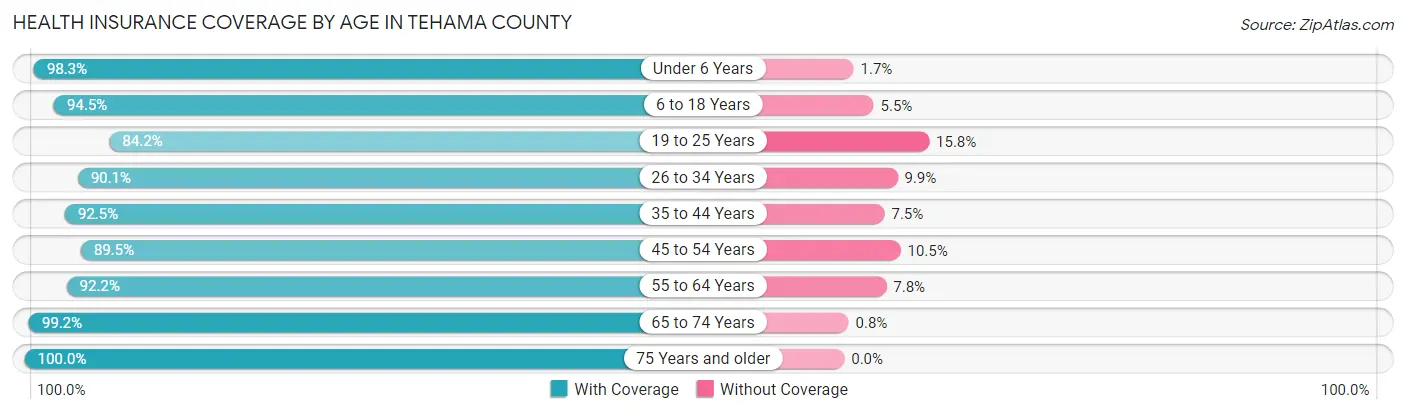
| Age Bracket | With Coverage | Without Coverage |
| Under 6 Years | 4,704 (98.3%) | 83 (1.7%) |
| 6 to 18 Years | 10,862 (94.5%) | 629 (5.5%) |
| 19 to 25 Years | 4,309 (84.2%) | 810 (15.8%) |
| 26 to 34 Years | 6,238 (90.1%) | 686 (9.9%) |
| 35 to 44 Years | 6,949 (92.5%) | 564 (7.5%) |
| 45 to 54 Years | 6,452 (89.5%) | 756 (10.5%) |
| 55 to 64 Years | 8,364 (92.2%) | 712 (7.8%) |
| 65 to 74 Years | 7,465 (99.2%) | 60 (0.8%) |
| 75 Years and older | 5,394 (100.0%) | 0 (0.0%) |
| Total | 60,737 (93.4%) | 4,300 (6.6%) |
Health Insurance Coverage by Citizenship Status in Tehama County
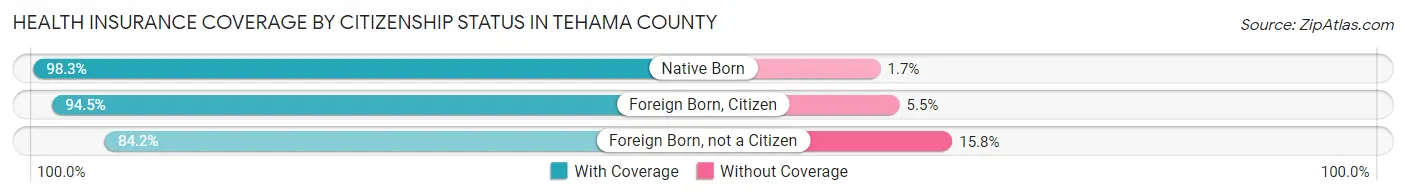
| Citizenship Status | With Coverage | Without Coverage |
| Native Born | 4,704 (98.3%) | 83 (1.7%) |
| Foreign Born, Citizen | 10,862 (94.5%) | 629 (5.5%) |
| Foreign Born, not a Citizen | 4,309 (84.2%) | 810 (15.8%) |
Health Insurance Coverage by Household Income in Tehama County
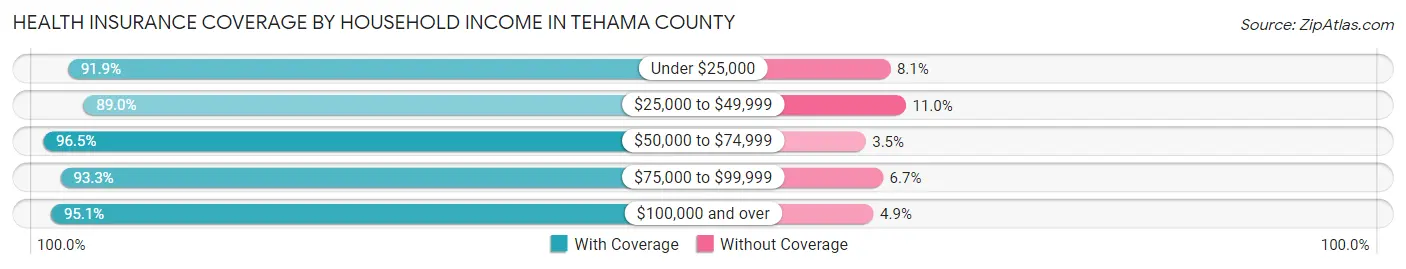
| Household Income | With Coverage | Without Coverage |
| Under $25,000 | 7,467 (91.9%) | 657 (8.1%) |
| $25,000 to $49,999 | 11,709 (89.0%) | 1,449 (11.0%) |
| $50,000 to $74,999 | 11,690 (96.5%) | 419 (3.5%) |
| $75,000 to $99,999 | 9,843 (93.3%) | 709 (6.7%) |
| $100,000 and over | 19,491 (95.1%) | 1,012 (4.9%) |
Public vs Private Health Insurance Coverage by Age in Tehama County
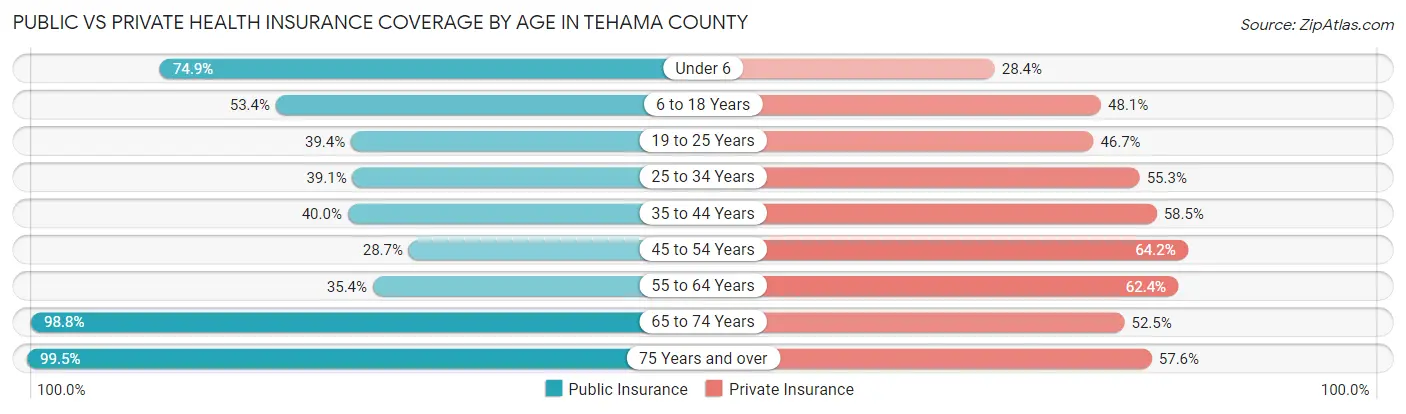
| Age Bracket | Public Insurance | Private Insurance |
| Under 6 | 3,584 (74.9%) | 1,360 (28.4%) |
| 6 to 18 Years | 6,134 (53.4%) | 5,531 (48.1%) |
| 19 to 25 Years | 2,017 (39.4%) | 2,391 (46.7%) |
| 25 to 34 Years | 2,710 (39.1%) | 3,829 (55.3%) |
| 35 to 44 Years | 3,007 (40.0%) | 4,391 (58.5%) |
| 45 to 54 Years | 2,068 (28.7%) | 4,625 (64.2%) |
| 55 to 64 Years | 3,209 (35.4%) | 5,662 (62.4%) |
| 65 to 74 Years | 7,435 (98.8%) | 3,950 (52.5%) |
| 75 Years and over | 5,368 (99.5%) | 3,104 (57.6%) |
| Total | 35,532 (54.6%) | 34,843 (53.6%) |
Disability Status by Sex by Age in Tehama County
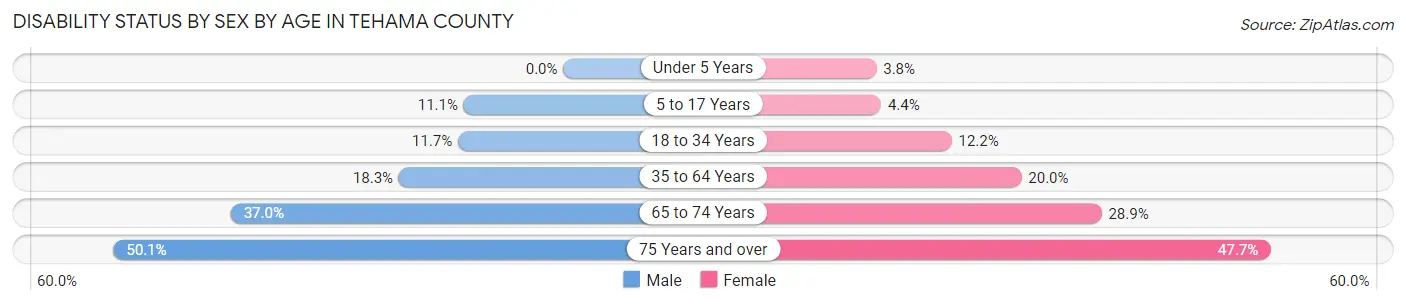
| Age Bracket | Male | Female |
| Under 5 Years | 0 (0.0%) | 72 (3.8%) |
| 5 to 17 Years | 668 (11.1%) | 252 (4.4%) |
| 18 to 34 Years | 762 (11.7%) | 764 (12.2%) |
| 35 to 64 Years | 2,164 (18.3%) | 2,395 (20.0%) |
| 65 to 74 Years | 1,340 (37.0%) | 1,130 (28.9%) |
| 75 Years and over | 1,186 (50.1%) | 1,444 (47.7%) |
Disability Class by Sex by Age in Tehama County
Disability Class: Hearing Difficulty
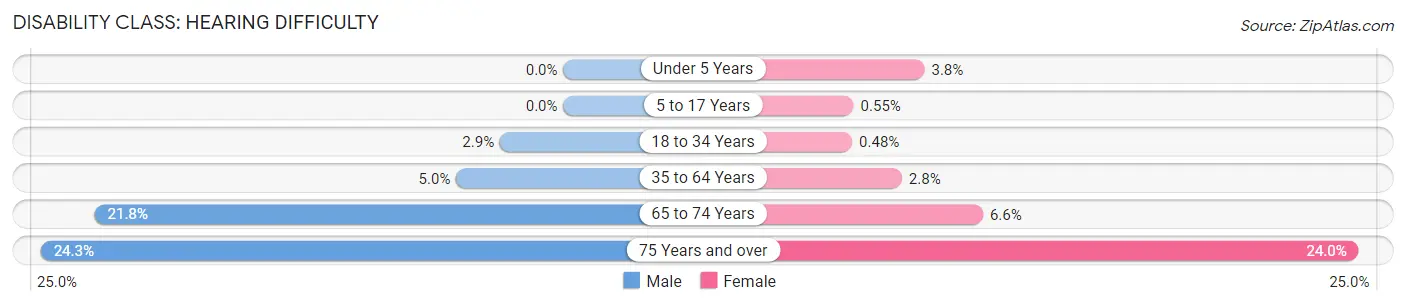
| Age Bracket | Male | Female |
| Under 5 Years | 0 (0.0%) | 72 (3.8%) |
| 5 to 17 Years | 0 (0.0%) | 32 (0.5%) |
| 18 to 34 Years | 191 (2.9%) | 30 (0.5%) |
| 35 to 64 Years | 587 (5.0%) | 334 (2.8%) |
| 65 to 74 Years | 787 (21.7%) | 256 (6.6%) |
| 75 Years and over | 574 (24.2%) | 726 (24.0%) |
Disability Class: Vision Difficulty
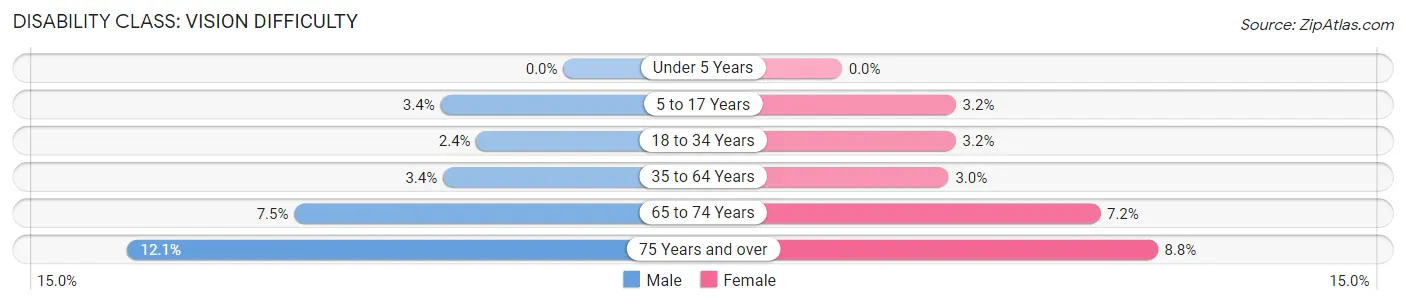
| Age Bracket | Male | Female |
| Under 5 Years | 0 (0.0%) | 0 (0.0%) |
| 5 to 17 Years | 206 (3.4%) | 183 (3.2%) |
| 18 to 34 Years | 157 (2.4%) | 198 (3.2%) |
| 35 to 64 Years | 396 (3.4%) | 356 (3.0%) |
| 65 to 74 Years | 271 (7.5%) | 281 (7.2%) |
| 75 Years and over | 287 (12.1%) | 266 (8.8%) |
Disability Class: Cognitive Difficulty
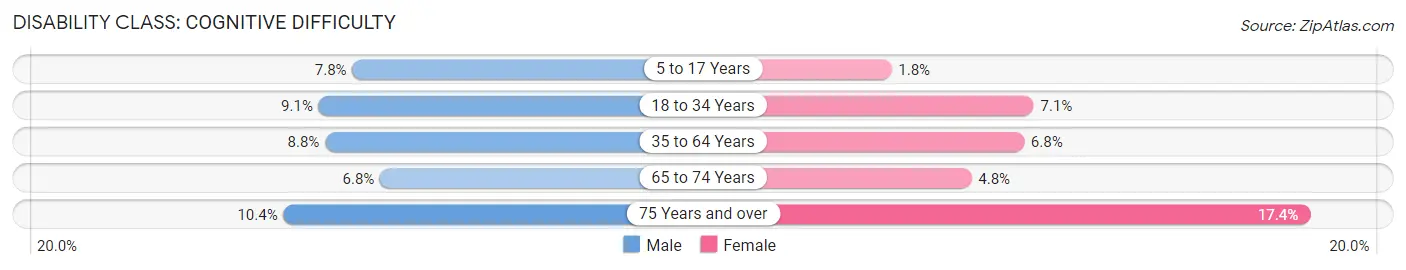
| Age Bracket | Male | Female |
| 5 to 17 Years | 472 (7.8%) | 106 (1.8%) |
| 18 to 34 Years | 590 (9.1%) | 445 (7.1%) |
| 35 to 64 Years | 1,045 (8.8%) | 810 (6.8%) |
| 65 to 74 Years | 246 (6.8%) | 188 (4.8%) |
| 75 Years and over | 246 (10.4%) | 526 (17.4%) |
Disability Class: Ambulatory Difficulty
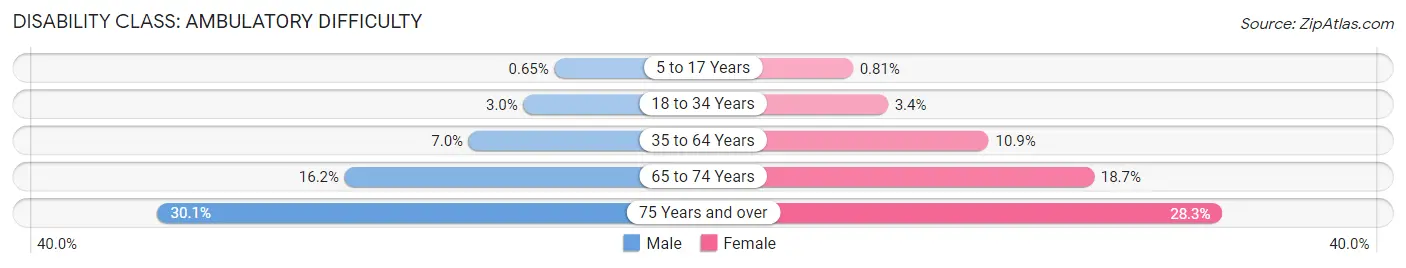
| Age Bracket | Male | Female |
| 5 to 17 Years | 39 (0.6%) | 47 (0.8%) |
| 18 to 34 Years | 192 (2.9%) | 213 (3.4%) |
| 35 to 64 Years | 828 (7.0%) | 1,306 (10.9%) |
| 65 to 74 Years | 587 (16.2%) | 731 (18.7%) |
| 75 Years and over | 713 (30.1%) | 855 (28.2%) |
Disability Class: Self-Care Difficulty
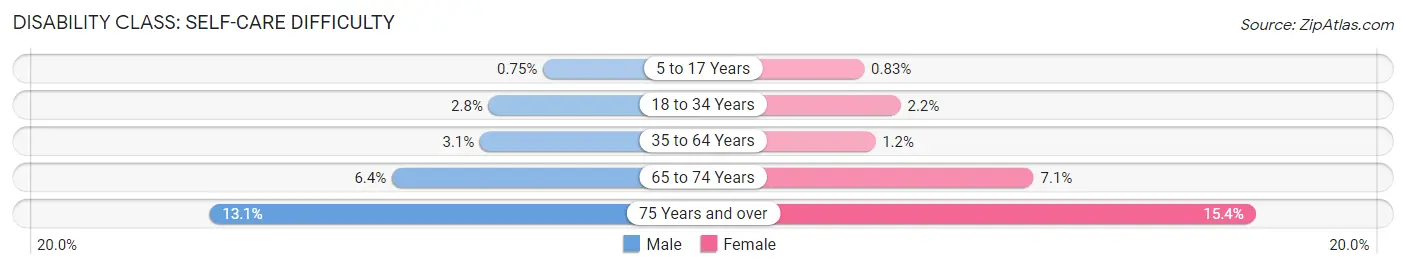
| Age Bracket | Male | Female |
| 5 to 17 Years | 45 (0.7%) | 48 (0.8%) |
| 18 to 34 Years | 180 (2.8%) | 136 (2.2%) |
| 35 to 64 Years | 365 (3.1%) | 148 (1.2%) |
| 65 to 74 Years | 230 (6.4%) | 278 (7.1%) |
| 75 Years and over | 311 (13.1%) | 465 (15.4%) |
Technology Access in Tehama County
Computing Device Access in Tehama County
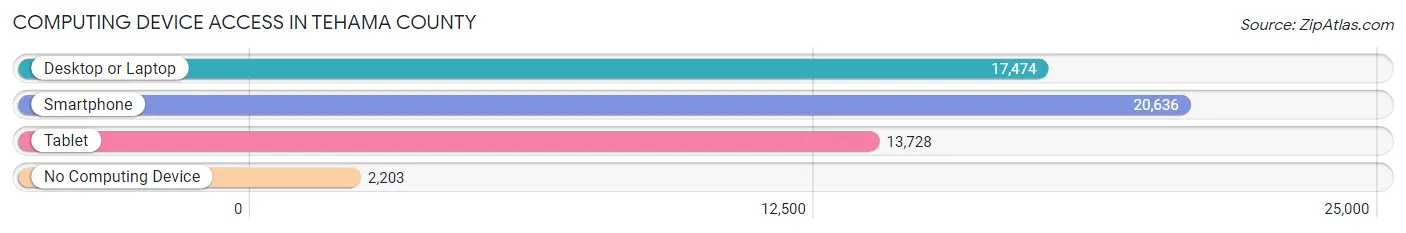
| Device Type | # Households | % Households |
| Desktop or Laptop | 17,474 | 71.0% |
| Smartphone | 20,636 | 83.8% |
| Tablet | 13,728 | 55.7% |
| No Computing Device | 2,203 | 8.9% |
| Total | 24,623 | 100.0% |
Internet Access in Tehama County
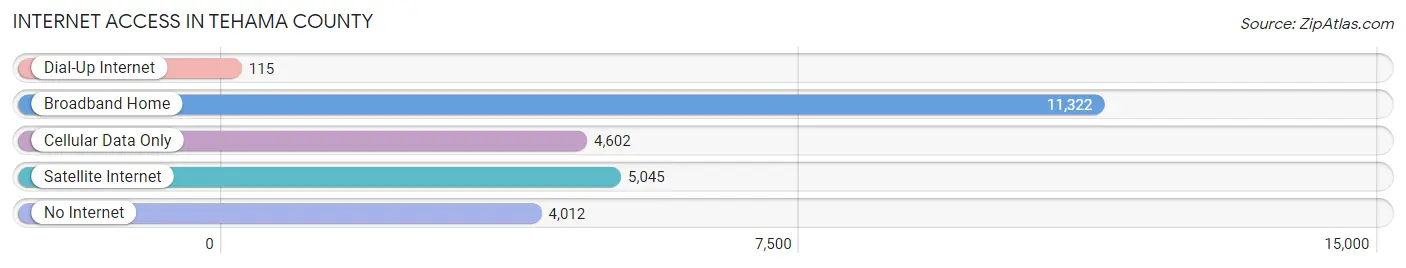
| Internet Type | # Households | % Households |
| Dial-Up Internet | 115 | 0.5% |
| Broadband Home | 11,322 | 46.0% |
| Cellular Data Only | 4,602 | 18.7% |
| Satellite Internet | 5,045 | 20.5% |
| No Internet | 4,012 | 16.3% |
| Total | 24,623 | 100.0% |
Tehama County Summary
Tehama County is located in the northern part of California, in the Central Valley region. It is bordered by Shasta County to the north, Glenn County to the west, Butte County to the east, and Colusa County to the south. The county seat is Red Bluff, and the largest city is Red Bluff. The population of Tehama County was 63,463 in the 2010 census, making it the fourth least populous county in California.
Geography
Tehama County covers an area of 2,962 square miles, making it the fifth largest county in California. The terrain is mostly flat, with rolling hills in the east and south. The Sacramento River forms the northern boundary of the county, and the Sacramento Valley lies to the east. The western part of the county is part of the Coast Range, and the eastern part is part of the Sierra Nevada. The highest point in the county is South Yolla Bolly Mountain, at 8,092 feet.
The climate of Tehama County is Mediterranean, with hot, dry summers and cool, wet winters. Average temperatures range from a low of 33°F in January to a high of 95°F in July. Average annual precipitation is 22 inches.
History
The area that is now Tehama County was originally inhabited by the Nomlaki and Wintun Native American tribes. The first European settlers arrived in the area in the early 1850s, and the county was established in 1856. The county was named after the Tehama tribe, which had lived in the area for centuries.
The county was initially an agricultural area, with wheat, barley, and oats being the main crops. In the late 19th century, the county began to develop as a tourist destination, with the establishment of resorts and spas in the area.
Economy
The economy of Tehama County is largely based on agriculture, with wheat, barley, oats, and hay being the main crops. Other crops grown in the county include walnuts, almonds, prunes, and olives. Livestock production is also important, with cattle, sheep, and goats being the main animals raised.
The county is also home to several manufacturing companies, including a paper mill, a wood products plant, and a food processing plant. Tourism is also an important part of the economy, with visitors coming to the area to enjoy the natural beauty and recreational opportunities.
Demographics
As of the 2010 census, the population of Tehama County was 63,463. The racial makeup of the county was 79.2% White, 0.7% African American, 1.3% Native American, 0.7% Asian, 0.2% Pacific Islander, 14.2% from other races, and 3.7% from two or more races. Hispanic or Latino of any race were 24.3% of the population.
The median household income in Tehama County was $41,945, and the median family income was $48,945. The per capita income was $20,945. About 15.2% of the population was below the poverty line.
Tehama County is served by two school districts, the Red Bluff Union Elementary School District and the Corning Union Elementary School District. The county is also home to several higher education institutions, including Shasta College, Simpson University, and the University of California, Davis.
Common Questions
What is Per Capita Income in Tehama County?
Per Capita income in Tehama County is $33,800.
What is the Median Family Income in Tehama County?
Median Family Income in Tehama County is $73,102.
What is the Median Household income in Tehama County?
Median Household Income in Tehama County is $59,029.
What is Income or Wage Gap in Tehama County?
Income or Wage Gap in Tehama County is 20.8%.
Women in Tehama County earn 79.2 cents for every dollar earned by a man.
What is Family Income Deficit in Tehama County?
Family Income Deficit in Tehama County is $10,488.
Families that are below poverty line in Tehama County earn $10,488 less on average than the poverty threshold level.
What is Inequality or Gini Index in Tehama County?
Inequality or Gini Index in Tehama County is 0.51.
What is the Total Population of Tehama County?
Total Population of Tehama County is 65,484.
What is the Total Male Population of Tehama County?
Total Male Population of Tehama County is 32,562.
What is the Total Female Population of Tehama County?
Total Female Population of Tehama County is 32,922.
What is the Ratio of Males per 100 Females in Tehama County?
There are 98.91 Males per 100 Females in Tehama County.
What is the Ratio of Females per 100 Males in Tehama County?
There are 101.11 Females per 100 Males in Tehama County.
What is the Median Population Age in Tehama County?
Median Population Age in Tehama County is 40.3 Years.
What is the Average Family Size in Tehama County
Average Family Size in Tehama County is 3.2 People.
What is the Average Household Size in Tehama County
Average Household Size in Tehama County is 2.6 People.
How Large is the Labor Force in Tehama County?
There are 27,655 People in the Labor Forcein in Tehama County.
What is the Percentage of People in the Labor Force in Tehama County?
53.6% of People are in the Labor Force in Tehama County.
What is the Unemployment Rate in Tehama County?
Unemployment Rate in Tehama County is 7.4%.