Sutter County, CA Map & Demographics
Sutter County Map
Sutter County Overview
$34,039
PER CAPITA INCOME
$83,847
AVG FAMILY INCOME
$72,654
AVG HOUSEHOLD INCOME
29.3%
WAGE / INCOME GAP [ % ]
70.7¢/ $1
WAGE / INCOME GAP [ $ ]
$10,795
FAMILY INCOME DEFICIT
0.46
INEQUALITY / GINI INDEX
99,101
TOTAL POPULATION
49,828
MALE POPULATION
49,273
FEMALE POPULATION
101.13
MALES / 100 FEMALES
98.89
FEMALES / 100 MALES
36.0
MEDIAN AGE
3.5
AVG FAMILY SIZE
3.0
AVG HOUSEHOLD SIZE
46,503
LABOR FORCE [ PEOPLE ]
60.6%
PERCENT IN LABOR FORCE
7.6%
UNEMPLOYMENT RATE
Income in Sutter County
Income Overview in Sutter County
Per Capita Income in Sutter County is $34,039, while median incomes of families and households are $83,847 and $72,654 respectively.
| Characteristic | Number | Measure |
| Per Capita Income | 99,101 | $34,039 |
| Median Family Income | 23,854 | $83,847 |
| Mean Family Income | 23,854 | $112,727 |
| Median Household Income | 33,041 | $72,654 |
| Mean Household Income | 33,041 | $100,982 |
| Income Deficit | 23,854 | $10,795 |
| Wage / Income Gap (%) | 99,101 | 29.28% |
| Wage / Income Gap ($) | 99,101 | 70.72¢ per $1 |
| Gini / Inequality Index | 99,101 | 0.46 |
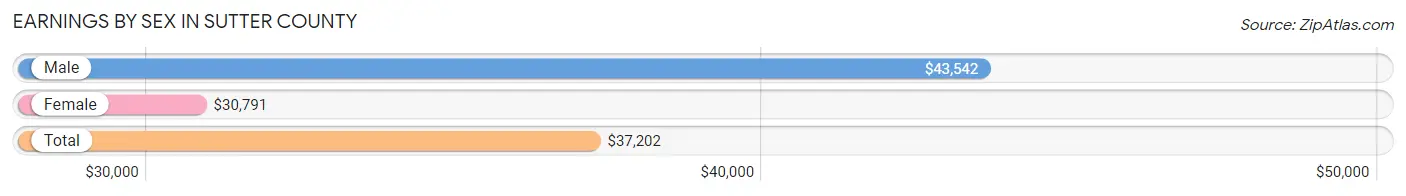
Earnings by Sex in Sutter County
Average Earnings in Sutter County are $37,202, $43,542 for men and $30,791 for women, a difference of 29.3%.
| Sex | Number | Average Earnings |
| Male | 26,304 (54.9%) | $43,542 |
| Female | 21,599 (45.1%) | $30,791 |
| Total | 47,903 (100.0%) | $37,202 |
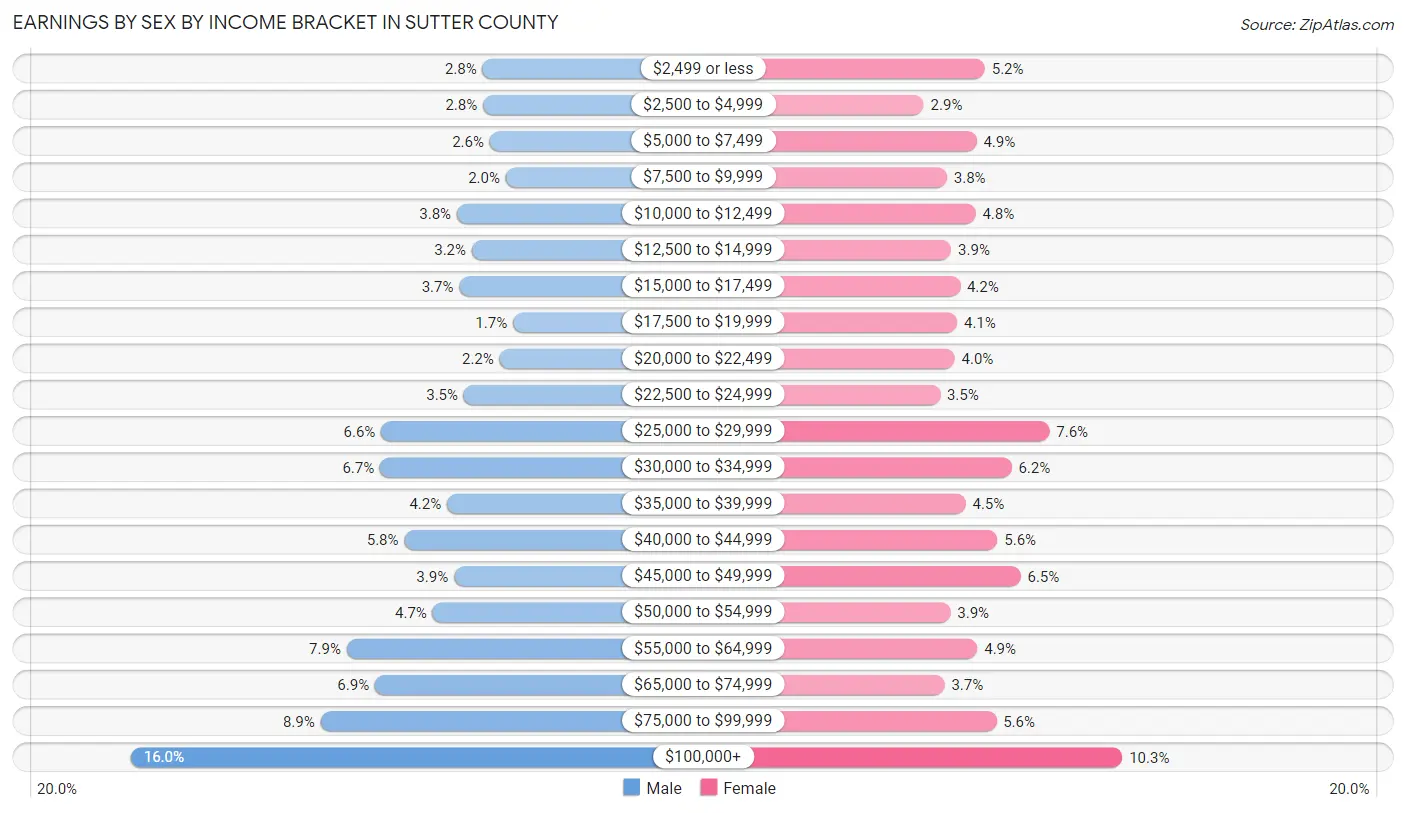
Earnings by Sex by Income Bracket in Sutter County
The most common earnings brackets in Sutter County are $100,000+ for men (4,214 | 16.0%) and $100,000+ for women (2,228 | 10.3%).
| Income | Male | Female |
| $2,499 or less | 746 (2.8%) | 1,117 (5.2%) |
| $2,500 to $4,999 | 742 (2.8%) | 621 (2.9%) |
| $5,000 to $7,499 | 677 (2.6%) | 1,049 (4.9%) |
| $7,500 to $9,999 | 518 (2.0%) | 810 (3.7%) |
| $10,000 to $12,499 | 1,000 (3.8%) | 1,042 (4.8%) |
| $12,500 to $14,999 | 853 (3.2%) | 844 (3.9%) |
| $15,000 to $17,499 | 976 (3.7%) | 916 (4.2%) |
| $17,500 to $19,999 | 448 (1.7%) | 891 (4.1%) |
| $20,000 to $22,499 | 579 (2.2%) | 873 (4.0%) |
| $22,500 to $24,999 | 931 (3.5%) | 754 (3.5%) |
| $25,000 to $29,999 | 1,746 (6.6%) | 1,639 (7.6%) |
| $30,000 to $34,999 | 1,757 (6.7%) | 1,333 (6.2%) |
| $35,000 to $39,999 | 1,096 (4.2%) | 962 (4.4%) |
| $40,000 to $44,999 | 1,518 (5.8%) | 1,219 (5.6%) |
| $45,000 to $49,999 | 1,028 (3.9%) | 1,406 (6.5%) |
| $50,000 to $54,999 | 1,238 (4.7%) | 837 (3.9%) |
| $55,000 to $64,999 | 2,085 (7.9%) | 1,057 (4.9%) |
| $65,000 to $74,999 | 1,808 (6.9%) | 791 (3.7%) |
| $75,000 to $99,999 | 2,344 (8.9%) | 1,210 (5.6%) |
| $100,000+ | 4,214 (16.0%) | 2,228 (10.3%) |
| Total | 26,304 (100.0%) | 21,599 (100.0%) |
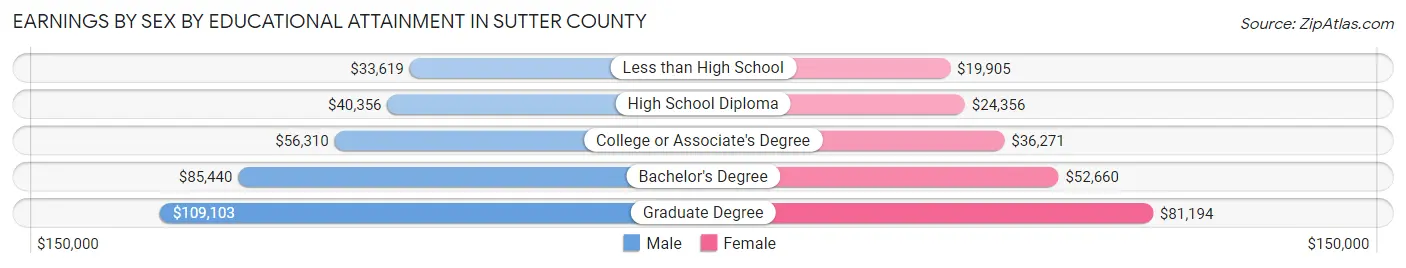
Earnings by Sex by Educational Attainment in Sutter County
Average earnings in Sutter County are $49,958 for men and $34,487 for women, a difference of 31.0%. Men with an educational attainment of graduate degree enjoy the highest average annual earnings of $109,103, while those with less than high school education earn the least with $33,619. Women with an educational attainment of graduate degree earn the most with the average annual earnings of $81,194, while those with less than high school education have the smallest earnings of $19,905.
| Educational Attainment | Male Income | Female Income |
| Less than High School | $33,619 | $19,905 |
| High School Diploma | $40,356 | $24,356 |
| College or Associate's Degree | $56,310 | $36,271 |
| Bachelor's Degree | $85,440 | $52,660 |
| Graduate Degree | $109,103 | $81,194 |
| Total | $49,958 | $34,487 |
Family Income in Sutter County
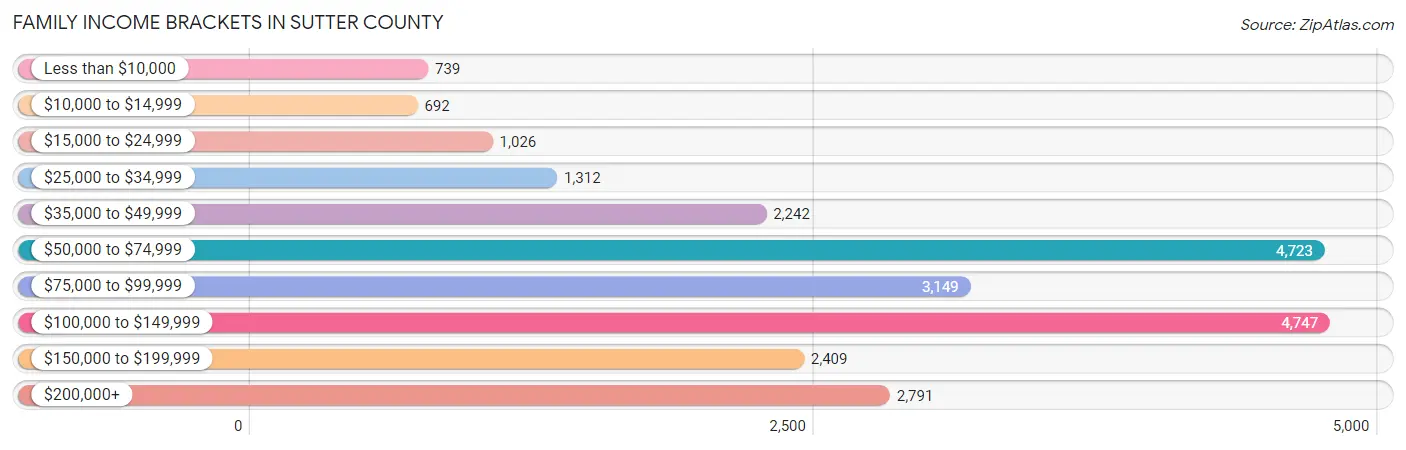
Family Income Brackets in Sutter County
According to the Sutter County family income data, there are 4,747 families falling into the $100,000 to $149,999 income range, which is the most common income bracket and makes up 19.9% of all families. Conversely, the $10,000 to $14,999 income bracket is the least frequent group with only 692 families (2.9%) belonging to this category.
| Income Bracket | # Families | % Families |
| Less than $10,000 | 739 | 3.1% |
| $10,000 to $14,999 | 692 | 2.9% |
| $15,000 to $24,999 | 1,026 | 4.3% |
| $25,000 to $34,999 | 1,312 | 5.5% |
| $35,000 to $49,999 | 2,242 | 9.4% |
| $50,000 to $74,999 | 4,723 | 19.8% |
| $75,000 to $99,999 | 3,149 | 13.2% |
| $100,000 to $149,999 | 4,747 | 19.9% |
| $150,000 to $199,999 | 2,409 | 10.1% |
| $200,000+ | 2,791 | 11.7% |
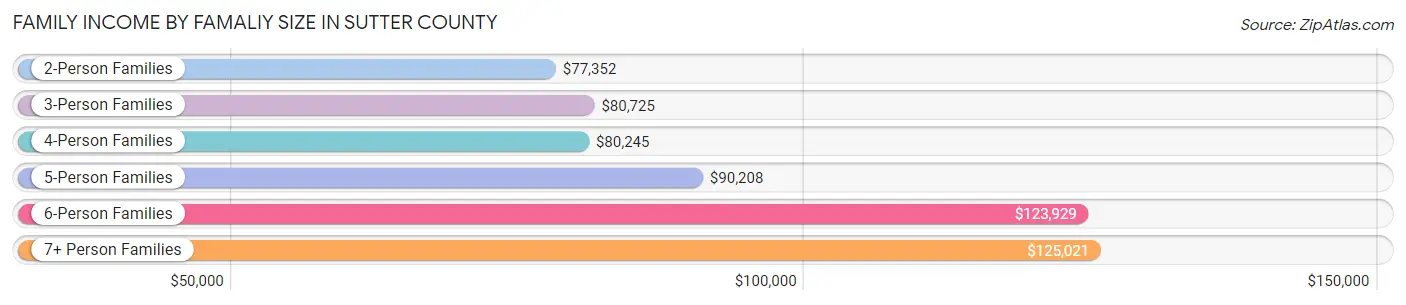
Family Income by Famaliy Size in Sutter County
7+ person families (1,025 | 4.3%) account for the highest median family income in Sutter County with $125,021 per family, while 2-person families (9,486 | 39.8%) have the highest median income of $38,676 per family member.
| Income Bracket | # Families | Median Income |
| 2-Person Families | 9,486 (39.8%) | $77,352 |
| 3-Person Families | 5,105 (21.4%) | $80,725 |
| 4-Person Families | 4,552 (19.1%) | $80,245 |
| 5-Person Families | 2,262 (9.5%) | $90,208 |
| 6-Person Families | 1,424 (6.0%) | $123,929 |
| 7+ Person Families | 1,025 (4.3%) | $125,021 |
| Total | 23,854 (100.0%) | $83,847 |
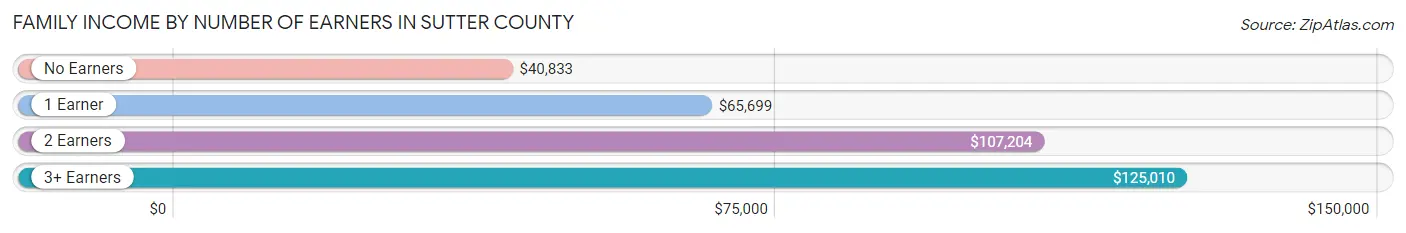
Family Income by Number of Earners in Sutter County
The median family income in Sutter County is $83,847, with families comprising 3+ earners (3,661) having the highest median family income of $125,010, while families with no earners (3,314) have the lowest median family income of $40,833, accounting for 15.3% and 13.9% of families, respectively.
| Number of Earners | # Families | Median Income |
| No Earners | 3,314 (13.9%) | $40,833 |
| 1 Earner | 8,041 (33.7%) | $65,699 |
| 2 Earners | 8,838 (37.0%) | $107,204 |
| 3+ Earners | 3,661 (15.3%) | $125,010 |
| Total | 23,854 (100.0%) | $83,847 |
Household Income in Sutter County
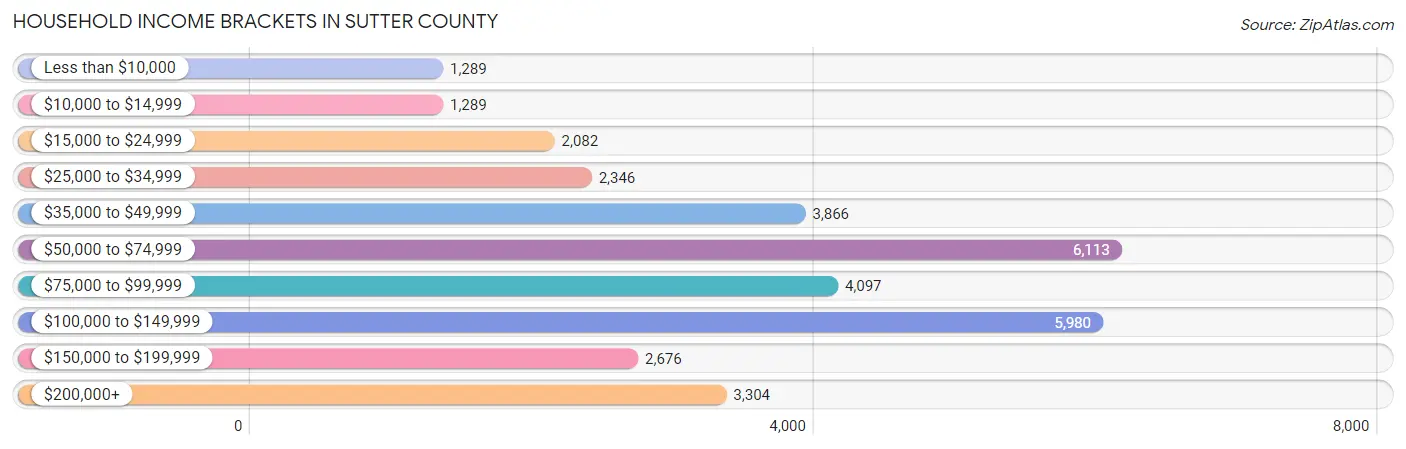
Household Income Brackets in Sutter County
With 6,113 households falling in the category, the $50,000 to $74,999 income range is the most frequent in Sutter County, accounting for 18.5% of all households. In contrast, only 1,289 households (3.9%) fall into the less than $10,000 income bracket, making it the least populous group.
| Income Bracket | # Households | % Households |
| Less than $10,000 | 1,289 | 3.9% |
| $10,000 to $14,999 | 1,289 | 3.9% |
| $15,000 to $24,999 | 2,082 | 6.3% |
| $25,000 to $34,999 | 2,346 | 7.1% |
| $35,000 to $49,999 | 3,866 | 11.7% |
| $50,000 to $74,999 | 6,113 | 18.5% |
| $75,000 to $99,999 | 4,097 | 12.4% |
| $100,000 to $149,999 | 5,980 | 18.1% |
| $150,000 to $199,999 | 2,676 | 8.1% |
| $200,000+ | 3,304 | 10.0% |
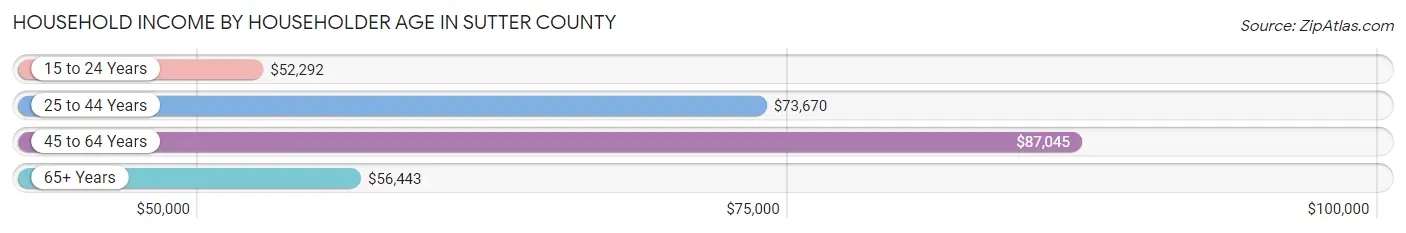
Household Income by Householder Age in Sutter County
The median household income in Sutter County is $72,654, with the highest median household income of $87,045 found in the 45 to 64 years age bracket for the primary householder. A total of 12,118 households (36.7%) fall into this category. Meanwhile, the 15 to 24 years age bracket for the primary householder has the lowest median household income of $52,292, with 1,310 households (4.0%) in this group.
| Income Bracket | # Households | Median Income |
| 15 to 24 Years | 1,310 (4.0%) | $52,292 |
| 25 to 44 Years | 10,952 (33.2%) | $73,670 |
| 45 to 64 Years | 12,118 (36.7%) | $87,045 |
| 65+ Years | 8,661 (26.2%) | $56,443 |
| Total | 33,041 (100.0%) | $72,654 |
Poverty in Sutter County
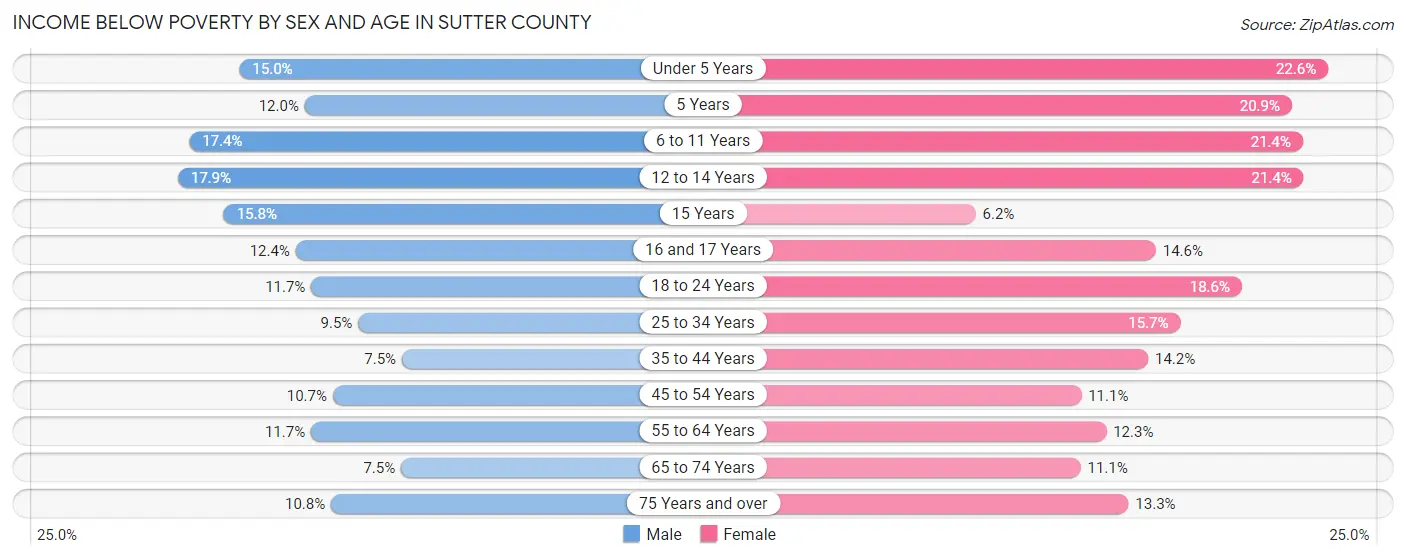
Income Below Poverty by Sex and Age in Sutter County
With 11.4% poverty level for males and 15.2% for females among the residents of Sutter County, 12 to 14 year old males and under 5 year old females are the most vulnerable to poverty, with 419 males (17.9%) and 663 females (22.6%) in their respective age groups living below the poverty level.
| Age Bracket | Male | Female |
| Under 5 Years | 488 (15.0%) | 663 (22.6%) |
| 5 Years | 105 (12.0%) | 166 (20.9%) |
| 6 to 11 Years | 720 (17.4%) | 814 (21.4%) |
| 12 to 14 Years | 419 (17.9%) | 471 (21.4%) |
| 15 Years | 139 (15.8%) | 50 (6.2%) |
| 16 and 17 Years | 185 (12.4%) | 202 (14.6%) |
| 18 to 24 Years | 542 (11.7%) | 782 (18.6%) |
| 25 to 34 Years | 664 (9.5%) | 1,071 (15.7%) |
| 35 to 44 Years | 463 (7.5%) | 856 (14.2%) |
| 45 to 54 Years | 607 (10.7%) | 623 (11.1%) |
| 55 to 64 Years | 695 (11.7%) | 733 (12.3%) |
| 65 to 74 Years | 314 (7.5%) | 498 (11.1%) |
| 75 Years and over | 296 (10.8%) | 499 (13.3%) |
| Total | 5,637 (11.4%) | 7,428 (15.2%) |
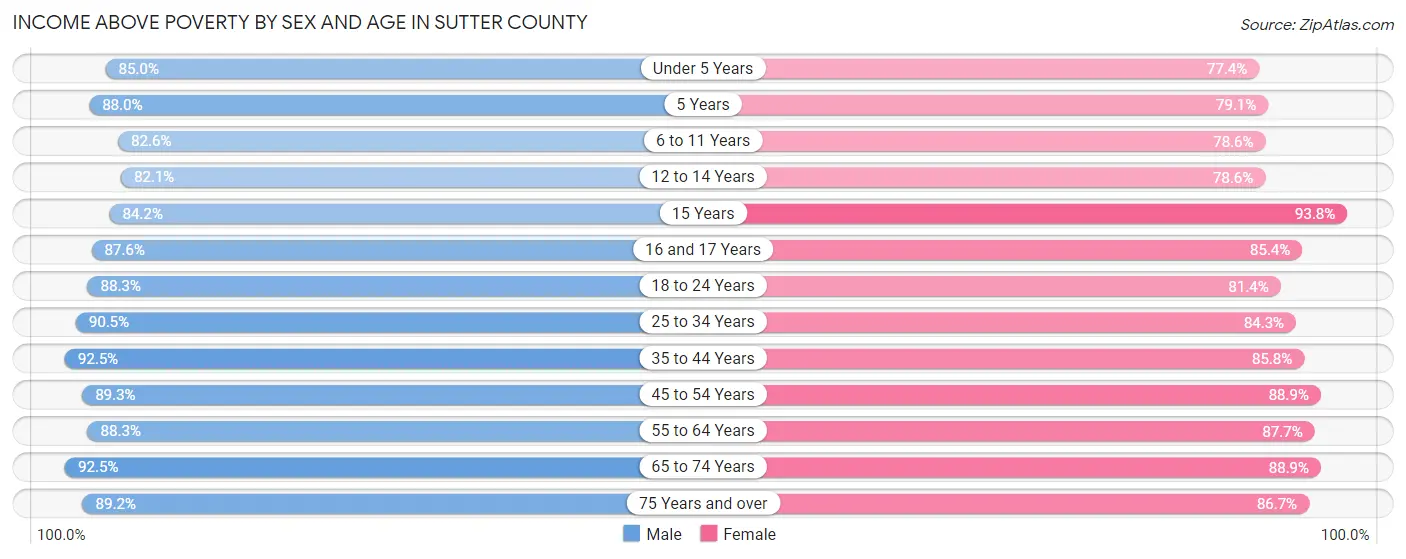
Income Above Poverty by Sex and Age in Sutter County
According to the poverty statistics in Sutter County, males aged 35 to 44 years and females aged 15 years are the age groups that are most secure financially, with 92.5% of males and 93.8% of females in these age groups living above the poverty line.
| Age Bracket | Male | Female |
| Under 5 Years | 2,758 (85.0%) | 2,276 (77.4%) |
| 5 Years | 770 (88.0%) | 629 (79.1%) |
| 6 to 11 Years | 3,428 (82.6%) | 2,991 (78.6%) |
| 12 to 14 Years | 1,923 (82.1%) | 1,727 (78.6%) |
| 15 Years | 743 (84.2%) | 755 (93.8%) |
| 16 and 17 Years | 1,305 (87.6%) | 1,184 (85.4%) |
| 18 to 24 Years | 4,090 (88.3%) | 3,432 (81.4%) |
| 25 to 34 Years | 6,309 (90.5%) | 5,745 (84.3%) |
| 35 to 44 Years | 5,722 (92.5%) | 5,169 (85.8%) |
| 45 to 54 Years | 5,065 (89.3%) | 4,983 (88.9%) |
| 55 to 64 Years | 5,241 (88.3%) | 5,243 (87.7%) |
| 65 to 74 Years | 3,858 (92.5%) | 3,998 (88.9%) |
| 75 Years and over | 2,450 (89.2%) | 3,254 (86.7%) |
| Total | 43,662 (88.6%) | 41,386 (84.8%) |
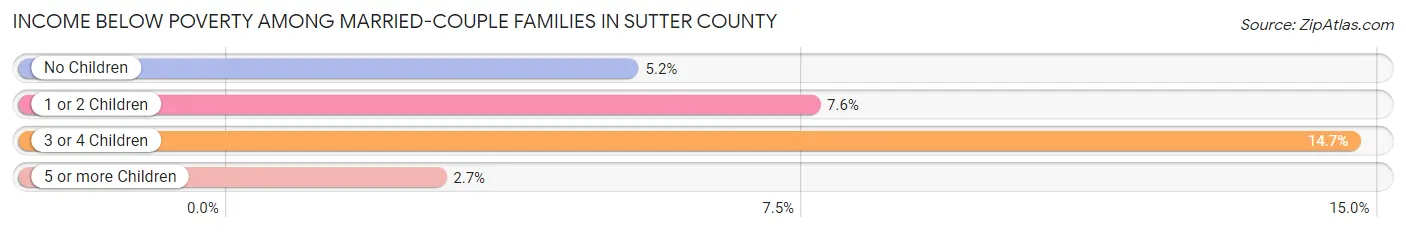
Income Below Poverty Among Married-Couple Families in Sutter County
The poverty statistics for married-couple families in Sutter County show that 7.0% or 1,171 of the total 16,641 families live below the poverty line. Families with 3 or 4 children have the highest poverty rate of 14.6%, comprising of 255 families. On the other hand, families with 5 or more children have the lowest poverty rate of 2.7%, which includes 4 families.
| Children | Above Poverty | Below Poverty |
| No Children | 8,343 (94.8%) | 460 (5.2%) |
| 1 or 2 Children | 5,498 (92.4%) | 452 (7.6%) |
| 3 or 4 Children | 1,486 (85.4%) | 255 (14.6%) |
| 5 or more Children | 143 (97.3%) | 4 (2.7%) |
| Total | 15,470 (93.0%) | 1,171 (7.0%) |
Income Below Poverty Among Single-Parent Households in Sutter County
According to the poverty data in Sutter County, 11.2% or 319 single-father households and 24.8% or 1,084 single-mother households are living below the poverty line. Among single-father households, those with 1 or 2 children have the highest poverty rate, with 231 households (16.1%) experiencing poverty. Likewise, among single-mother households, those with 3 or 4 children have the highest poverty rate, with 294 households (80.5%) falling below the poverty line.
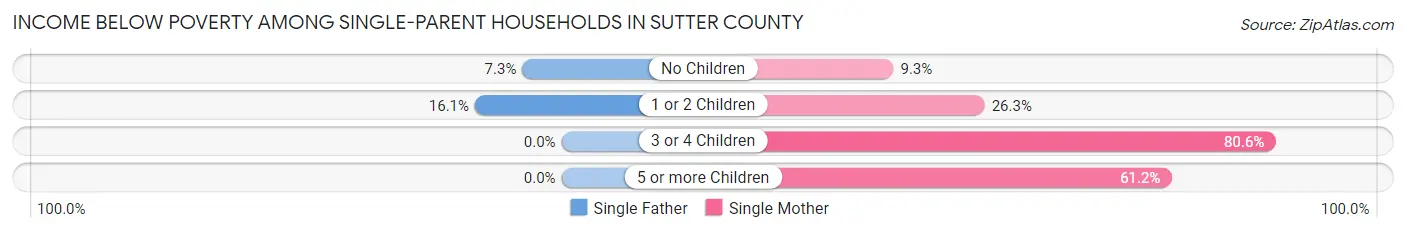
| Children | Single Father | Single Mother |
| No Children | 88 (7.3%) | 155 (9.3%) |
| 1 or 2 Children | 231 (16.1%) | 594 (26.3%) |
| 3 or 4 Children | 0 (0.0%) | 294 (80.5%) |
| 5 or more Children | 0 (0.0%) | 41 (61.2%) |
| Total | 319 (11.2%) | 1,084 (24.8%) |
Income Below Poverty Among Married-Couple vs Single-Parent Households in Sutter County
The poverty data for Sutter County shows that 1,171 of the married-couple family households (7.0%) and 1,403 of the single-parent households (19.5%) are living below the poverty level. Within the married-couple family households, those with 3 or 4 children have the highest poverty rate, with 255 households (14.6%) falling below the poverty line. Among the single-parent households, those with 5 or more children have the highest poverty rate, with 41 household (53.9%) living below poverty.
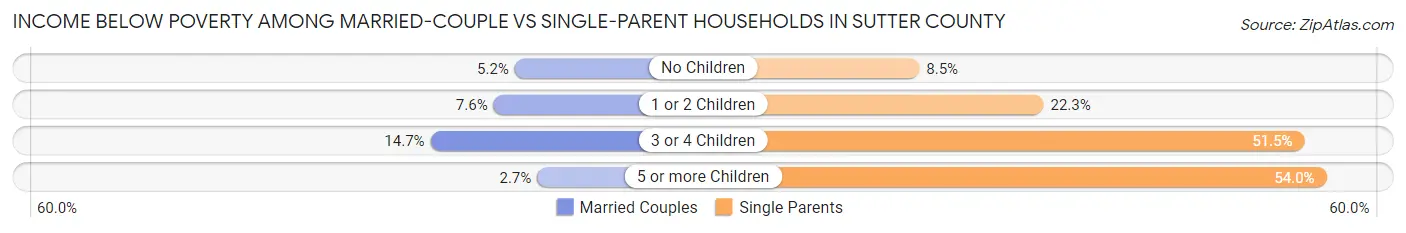
| Children | Married-Couple Families | Single-Parent Households |
| No Children | 460 (5.2%) | 243 (8.5%) |
| 1 or 2 Children | 452 (7.6%) | 825 (22.3%) |
| 3 or 4 Children | 255 (14.6%) | 294 (51.5%) |
| 5 or more Children | 4 (2.7%) | 41 (53.9%) |
| Total | 1,171 (7.0%) | 1,403 (19.5%) |
Race in Sutter County
The most populous races in Sutter County are White / Caucasian (53,760 | 54.2%), Hispanic or Latino (31,993 | 32.3%), and Asian (16,490 | 16.6%).
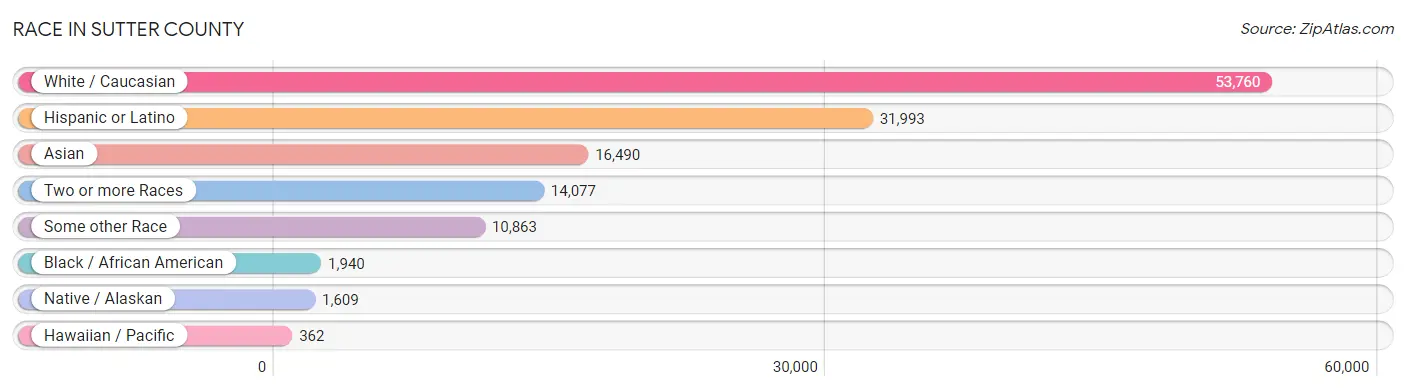
| Race | # Population | % Population |
| Asian | 16,490 | 16.6% |
| Black / African American | 1,940 | 2.0% |
| Hawaiian / Pacific | 362 | 0.4% |
| Hispanic or Latino | 31,993 | 32.3% |
| Native / Alaskan | 1,609 | 1.6% |
| White / Caucasian | 53,760 | 54.2% |
| Two or more Races | 14,077 | 14.2% |
| Some other Race | 10,863 | 11.0% |
| Total | 99,101 | 100.0% |
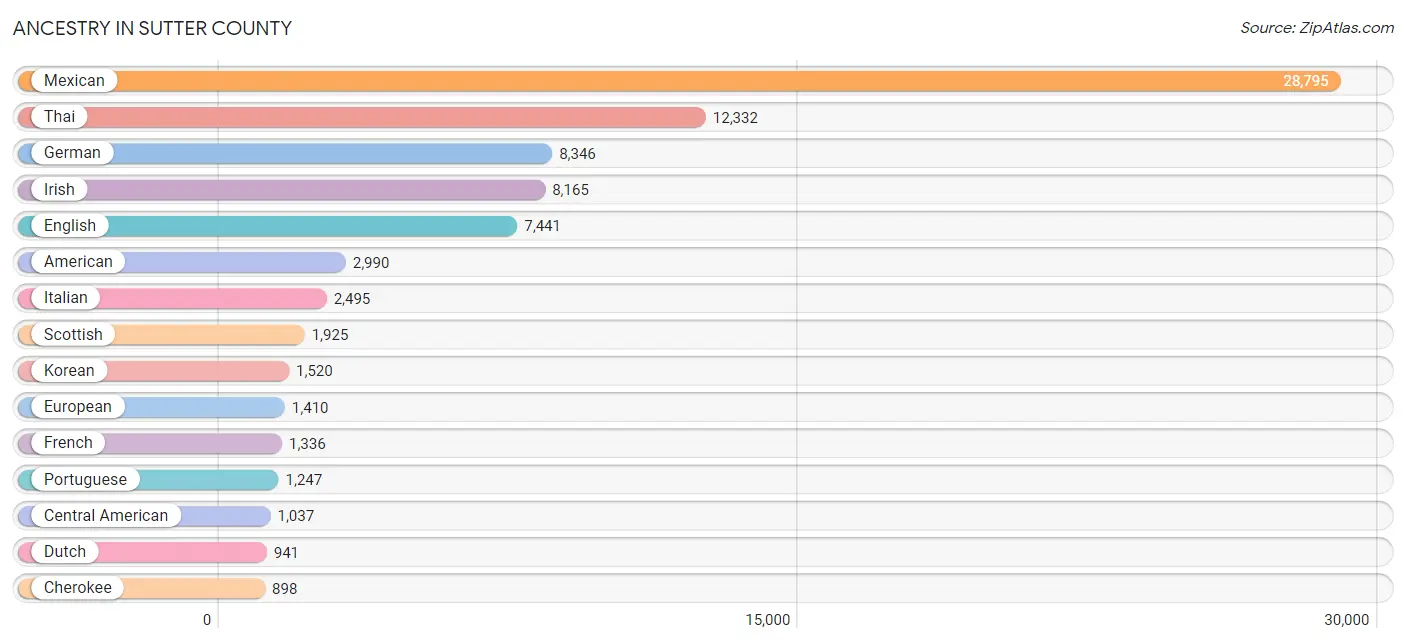
Ancestry in Sutter County
The most populous ancestries reported in Sutter County are Mexican (28,795 | 29.1%), Thai (12,332 | 12.4%), German (8,346 | 8.4%), Irish (8,165 | 8.2%), and English (7,441 | 7.5%), together accounting for 65.7% of all Sutter County residents.
| Ancestry | # Population | % Population |
| Afghan | 504 | 0.5% |
| African | 426 | 0.4% |
| Aleut | 17 | 0.0% |
| American | 2,990 | 3.0% |
| Apache | 325 | 0.3% |
| Arab | 362 | 0.4% |
| Arapaho | 14 | 0.0% |
| Armenian | 91 | 0.1% |
| Australian | 12 | 0.0% |
| Austrian | 43 | 0.0% |
| Bangladeshi | 852 | 0.9% |
| Basque | 33 | 0.0% |
| Belizean | 26 | 0.0% |
| Bhutanese | 634 | 0.6% |
| Blackfeet | 73 | 0.1% |
| Brazilian | 4 | 0.0% |
| British | 482 | 0.5% |
| Burmese | 227 | 0.2% |
| Cajun | 9 | 0.0% |
| Canadian | 51 | 0.1% |
| Celtic | 29 | 0.0% |
| Central American | 1,037 | 1.1% |
| Central American Indian | 330 | 0.3% |
| Cherokee | 898 | 0.9% |
| Chickasaw | 42 | 0.0% |
| Chippewa | 28 | 0.0% |
| Choctaw | 173 | 0.2% |
| Colombian | 204 | 0.2% |
| Comanche | 72 | 0.1% |
| Creek | 4 | 0.0% |
| Croatian | 43 | 0.0% |
| Cuban | 56 | 0.1% |
| Czech | 214 | 0.2% |
| Czechoslovakian | 58 | 0.1% |
| Danish | 459 | 0.5% |
| Delaware | 15 | 0.0% |
| Dominican | 164 | 0.2% |
| Dutch | 941 | 0.9% |
| Dutch West Indian | 23 | 0.0% |
| Eastern European | 45 | 0.1% |
| Egyptian | 137 | 0.1% |
| English | 7,441 | 7.5% |
| Ethiopian | 16 | 0.0% |
| European | 1,410 | 1.4% |
| Filipino | 31 | 0.0% |
| Finnish | 61 | 0.1% |
| French | 1,336 | 1.3% |
| French American Indian | 4 | 0.0% |
| French Canadian | 219 | 0.2% |
| German | 8,346 | 8.4% |
| Greek | 155 | 0.2% |
| Guamanian / Chamorro | 323 | 0.3% |
| Guatemalan | 326 | 0.3% |
| Haitian | 24 | 0.0% |
| Honduran | 22 | 0.0% |
| Hungarian | 21 | 0.0% |
| Indian (Asian) | 431 | 0.4% |
| Indonesian | 26 | 0.0% |
| Inupiat | 15 | 0.0% |
| Iranian | 65 | 0.1% |
| Irish | 8,165 | 8.2% |
| Italian | 2,495 | 2.5% |
| Jamaican | 1 | 0.0% |
| Japanese | 275 | 0.3% |
| Kenyan | 40 | 0.0% |
| Korean | 1,520 | 1.5% |
| Laotian | 29 | 0.0% |
| Lebanese | 110 | 0.1% |
| Lithuanian | 8 | 0.0% |
| Luxembourger | 4 | 0.0% |
| Malaysian | 27 | 0.0% |
| Maltese | 36 | 0.0% |
| Mexican | 28,795 | 29.1% |
| Mexican American Indian | 573 | 0.6% |
| Native Hawaiian | 214 | 0.2% |
| Navajo | 25 | 0.0% |
| Nepalese | 30 | 0.0% |
| Nicaraguan | 383 | 0.4% |
| Northern European | 177 | 0.2% |
| Norwegian | 840 | 0.9% |
| Osage | 15 | 0.0% |
| Ottawa | 2 | 0.0% |
| Pakistani | 141 | 0.1% |
| Palestinian | 30 | 0.0% |
| Panamanian | 44 | 0.0% |
| Pennsylvania German | 37 | 0.0% |
| Peruvian | 11 | 0.0% |
| Polish | 526 | 0.5% |
| Portuguese | 1,247 | 1.3% |
| Potawatomi | 3 | 0.0% |
| Pueblo | 40 | 0.0% |
| Puerto Rican | 762 | 0.8% |
| Romanian | 17 | 0.0% |
| Russian | 182 | 0.2% |
| Salvadoran | 216 | 0.2% |
| Samoan | 261 | 0.3% |
| Scandinavian | 343 | 0.4% |
| Scotch-Irish | 502 | 0.5% |
| Scottish | 1,925 | 1.9% |
| Serbian | 8 | 0.0% |
| Shoshone | 9 | 0.0% |
| Slavic | 4 | 0.0% |
| South African | 36 | 0.0% |
| South American | 215 | 0.2% |
| Spaniard | 258 | 0.3% |
| Spanish | 227 | 0.2% |
| Spanish American | 31 | 0.0% |
| Sri Lankan | 400 | 0.4% |
| Subsaharan African | 518 | 0.5% |
| Swedish | 766 | 0.8% |
| Swiss | 175 | 0.2% |
| Thai | 12,332 | 12.4% |
| Tongan | 25 | 0.0% |
| Trinidadian and Tobagonian | 29 | 0.0% |
| Ukrainian | 85 | 0.1% |
| Ute | 12 | 0.0% |
| Vietnamese | 26 | 0.0% |
| Welsh | 559 | 0.6% |
| West Indian | 45 | 0.1% |
| Yugoslavian | 52 | 0.1% | View All 120 Rows |
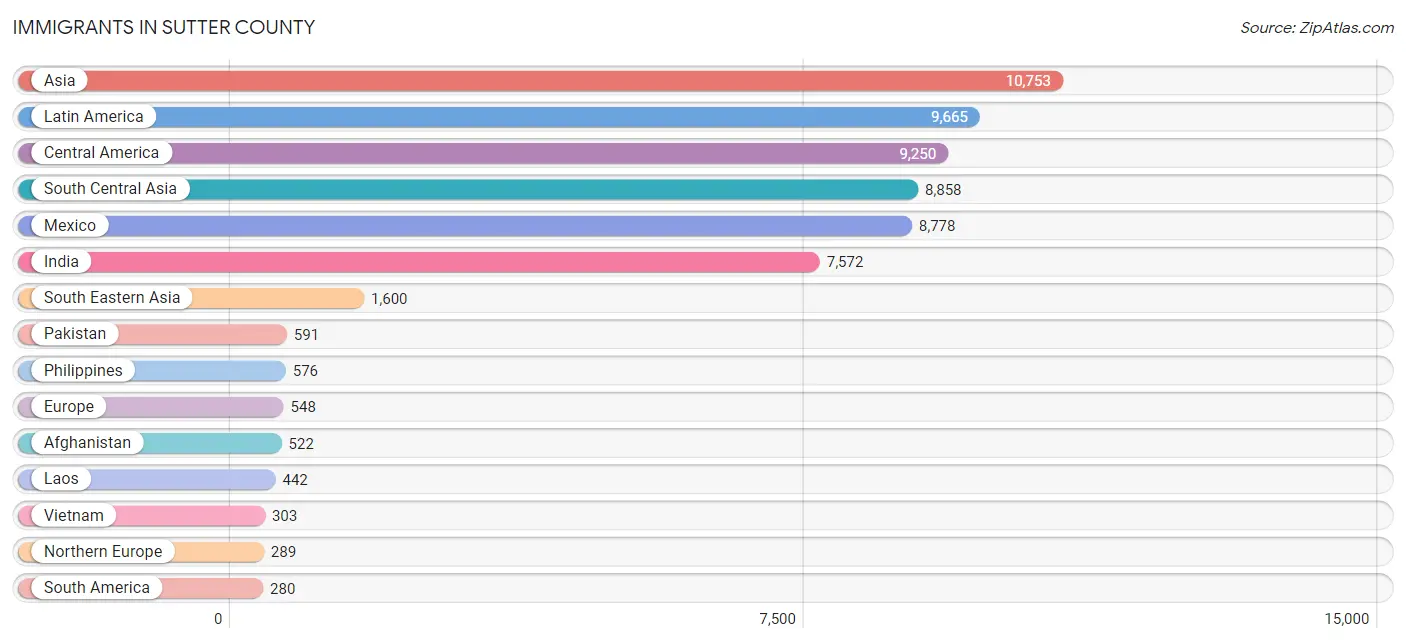
Immigrants in Sutter County
The most numerous immigrant groups reported in Sutter County came from Asia (10,753 | 10.8%), Latin America (9,665 | 9.8%), Central America (9,250 | 9.3%), South Central Asia (8,858 | 8.9%), and Mexico (8,778 | 8.9%), together accounting for 47.7% of all Sutter County residents.
| Immigration Origin | # Population | % Population |
| Afghanistan | 522 | 0.5% |
| Africa | 201 | 0.2% |
| Asia | 10,753 | 10.8% |
| Australia | 2 | 0.0% |
| Austria | 1 | 0.0% |
| Azores | 5 | 0.0% |
| Bangladesh | 101 | 0.1% |
| Belarus | 16 | 0.0% |
| Belize | 58 | 0.1% |
| Bolivia | 6 | 0.0% |
| Brazil | 38 | 0.0% |
| Cambodia | 29 | 0.0% |
| Canada | 207 | 0.2% |
| Caribbean | 135 | 0.1% |
| Central America | 9,250 | 9.3% |
| China | 86 | 0.1% |
| Colombia | 175 | 0.2% |
| Denmark | 5 | 0.0% |
| Dominican Republic | 118 | 0.1% |
| Eastern Africa | 59 | 0.1% |
| Eastern Asia | 241 | 0.2% |
| Eastern Europe | 108 | 0.1% |
| Egypt | 73 | 0.1% |
| El Salvador | 73 | 0.1% |
| England | 209 | 0.2% |
| Ethiopia | 59 | 0.1% |
| Europe | 548 | 0.5% |
| Fiji | 72 | 0.1% |
| France | 60 | 0.1% |
| Germany | 39 | 0.0% |
| Greece | 7 | 0.0% |
| Guatemala | 80 | 0.1% |
| Guyana | 48 | 0.1% |
| Honduras | 11 | 0.0% |
| Hong Kong | 16 | 0.0% |
| Hungary | 2 | 0.0% |
| India | 7,572 | 7.6% |
| Indonesia | 5 | 0.0% |
| Iran | 67 | 0.1% |
| Ireland | 31 | 0.0% |
| Italy | 16 | 0.0% |
| Japan | 68 | 0.1% |
| Korea | 87 | 0.1% |
| Laos | 442 | 0.4% |
| Latin America | 9,665 | 9.8% |
| Liberia | 1 | 0.0% |
| Mexico | 8,778 | 8.9% |
| Netherlands | 8 | 0.0% |
| Nicaragua | 206 | 0.2% |
| Nigeria | 16 | 0.0% |
| Northern Africa | 80 | 0.1% |
| Northern Europe | 289 | 0.3% |
| Oceania | 175 | 0.2% |
| Pakistan | 591 | 0.6% |
| Panama | 44 | 0.0% |
| Peru | 11 | 0.0% |
| Philippines | 576 | 0.6% |
| Poland | 12 | 0.0% |
| Portugal | 5 | 0.0% |
| Romania | 10 | 0.0% |
| Russia | 6 | 0.0% |
| Serbia | 8 | 0.0% |
| South Africa | 45 | 0.1% |
| South America | 280 | 0.3% |
| South Central Asia | 8,858 | 8.9% |
| South Eastern Asia | 1,600 | 1.6% |
| Southern Europe | 35 | 0.0% |
| Sweden | 2 | 0.0% |
| Switzerland | 8 | 0.0% |
| Taiwan | 40 | 0.0% |
| Thailand | 210 | 0.2% |
| Trinidad and Tobago | 17 | 0.0% |
| Turkey | 9 | 0.0% |
| Ukraine | 44 | 0.0% |
| Vietnam | 303 | 0.3% |
| Western Africa | 17 | 0.0% |
| Western Asia | 29 | 0.0% |
| Western Europe | 116 | 0.1% | View All 78 Rows |
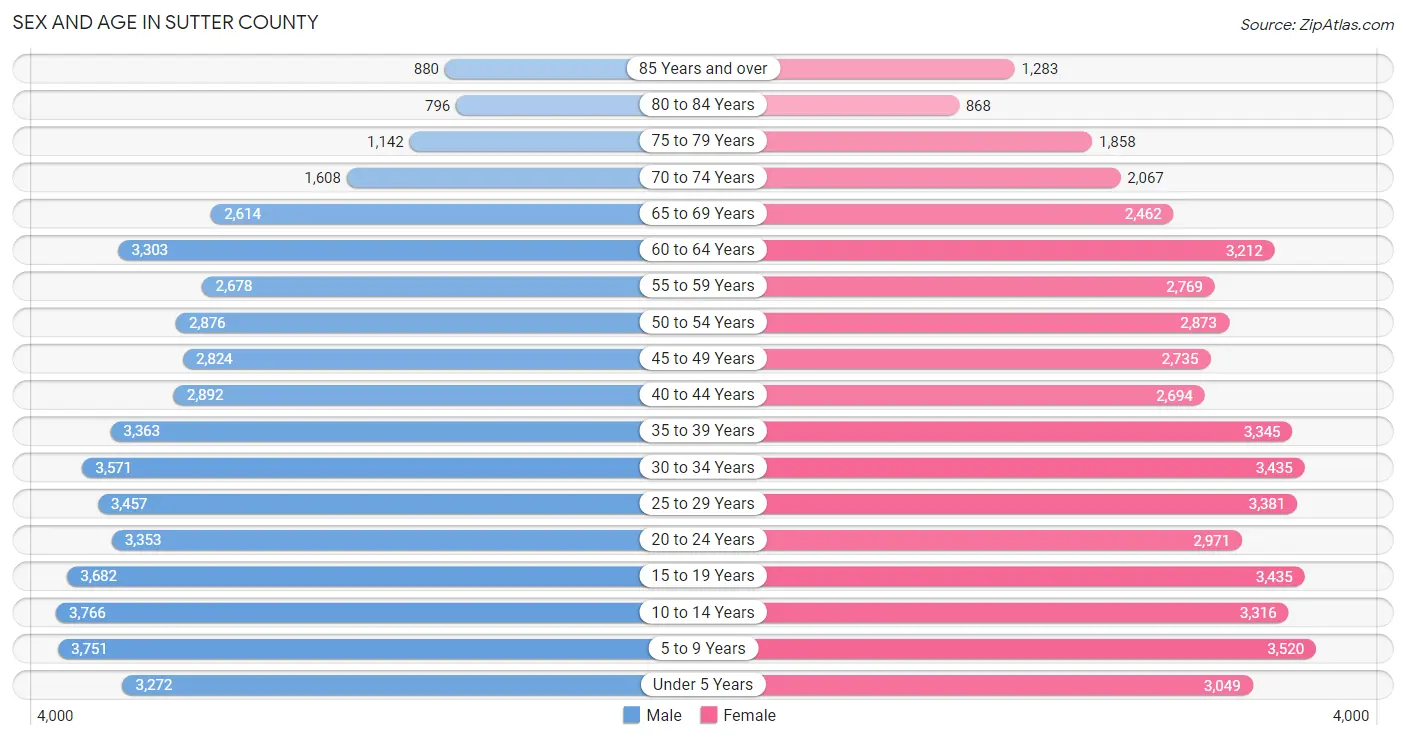
Sex and Age in Sutter County
Sex and Age in Sutter County
The most populous age groups in Sutter County are 10 to 14 Years (3,766 | 7.6%) for men and 5 to 9 Years (3,520 | 7.1%) for women.
| Age Bracket | Male | Female |
| Under 5 Years | 3,272 (6.6%) | 3,049 (6.2%) |
| 5 to 9 Years | 3,751 (7.5%) | 3,520 (7.1%) |
| 10 to 14 Years | 3,766 (7.6%) | 3,316 (6.7%) |
| 15 to 19 Years | 3,682 (7.4%) | 3,435 (7.0%) |
| 20 to 24 Years | 3,353 (6.7%) | 2,971 (6.0%) |
| 25 to 29 Years | 3,457 (6.9%) | 3,381 (6.9%) |
| 30 to 34 Years | 3,571 (7.2%) | 3,435 (7.0%) |
| 35 to 39 Years | 3,363 (6.8%) | 3,345 (6.8%) |
| 40 to 44 Years | 2,892 (5.8%) | 2,694 (5.5%) |
| 45 to 49 Years | 2,824 (5.7%) | 2,735 (5.6%) |
| 50 to 54 Years | 2,876 (5.8%) | 2,873 (5.8%) |
| 55 to 59 Years | 2,678 (5.4%) | 2,769 (5.6%) |
| 60 to 64 Years | 3,303 (6.6%) | 3,212 (6.5%) |
| 65 to 69 Years | 2,614 (5.2%) | 2,462 (5.0%) |
| 70 to 74 Years | 1,608 (3.2%) | 2,067 (4.2%) |
| 75 to 79 Years | 1,142 (2.3%) | 1,858 (3.8%) |
| 80 to 84 Years | 796 (1.6%) | 868 (1.8%) |
| 85 Years and over | 880 (1.8%) | 1,283 (2.6%) |
| Total | 49,828 (100.0%) | 49,273 (100.0%) |
Families and Households in Sutter County
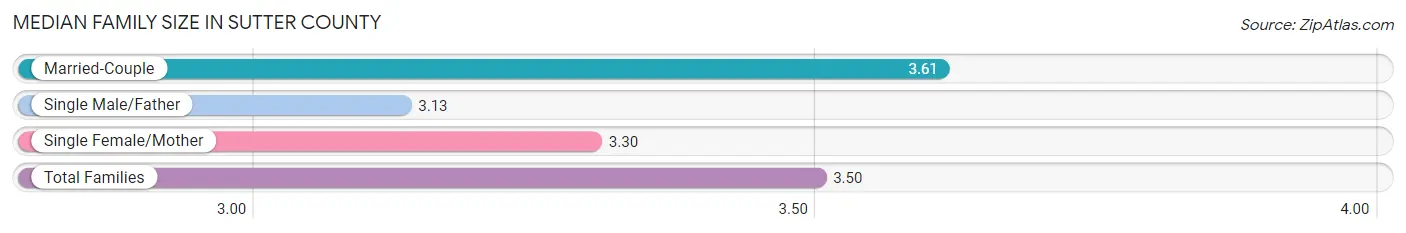
Median Family Size in Sutter County
The median family size in Sutter County is 3.50 persons per family, with married-couple families (16,641 | 69.8%) accounting for the largest median family size of 3.61 persons per family. On the other hand, single male/father families (2,851 | 11.9%) represent the smallest median family size with 3.13 persons per family.
| Family Type | # Families | Family Size |
| Married-Couple | 16,641 (69.8%) | 3.61 |
| Single Male/Father | 2,851 (11.9%) | 3.13 |
| Single Female/Mother | 4,362 (18.3%) | 3.30 |
| Total Families | 23,854 (100.0%) | 3.50 |
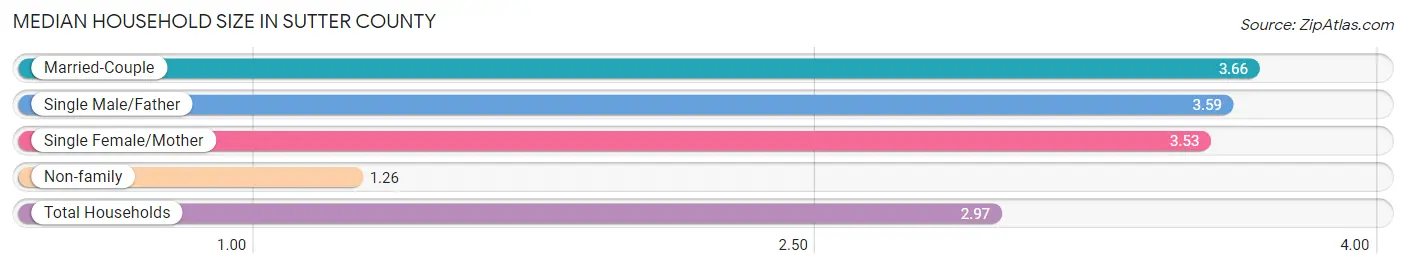
Median Household Size in Sutter County
The median household size in Sutter County is 2.97 persons per household, with married-couple households (16,641 | 50.4%) accounting for the largest median household size of 3.66 persons per household. non-family households (9,187 | 27.8%) represent the smallest median household size with 1.26 persons per household.
| Household Type | # Households | Household Size |
| Married-Couple | 16,641 (50.4%) | 3.66 |
| Single Male/Father | 2,851 (8.6%) | 3.59 |
| Single Female/Mother | 4,362 (13.2%) | 3.53 |
| Non-family | 9,187 (27.8%) | 1.26 |
| Total Households | 33,041 (100.0%) | 2.97 |
Household Size by Marriage Status in Sutter County
Out of a total of 33,041 households in Sutter County, 23,854 (72.2%) are family households, while 9,187 (27.8%) are nonfamily households. The most numerous type of family households are 2-person households, comprising 8,368, and the most common type of nonfamily households are 1-person households, comprising 7,181.
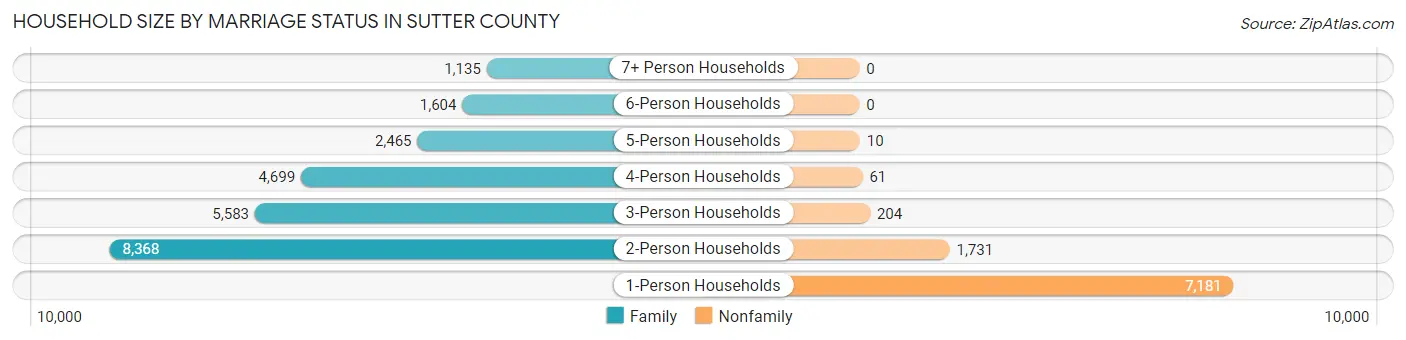
| Household Size | Family Households | Nonfamily Households |
| 1-Person Households | - | 7,181 (21.7%) |
| 2-Person Households | 8,368 (25.3%) | 1,731 (5.2%) |
| 3-Person Households | 5,583 (16.9%) | 204 (0.6%) |
| 4-Person Households | 4,699 (14.2%) | 61 (0.2%) |
| 5-Person Households | 2,465 (7.5%) | 10 (0.0%) |
| 6-Person Households | 1,604 (4.9%) | 0 (0.0%) |
| 7+ Person Households | 1,135 (3.4%) | 0 (0.0%) |
| Total | 23,854 (72.2%) | 9,187 (27.8%) |
Female Fertility in Sutter County
Fertility by Age in Sutter County
Average fertility rate in Sutter County is 59.0 births per 1,000 women. Women in the age bracket of 20 to 34 years have the highest fertility rate with 101.0 births per 1,000 women. Women in the age bracket of 20 to 34 years acount for 74.4% of all women with births.
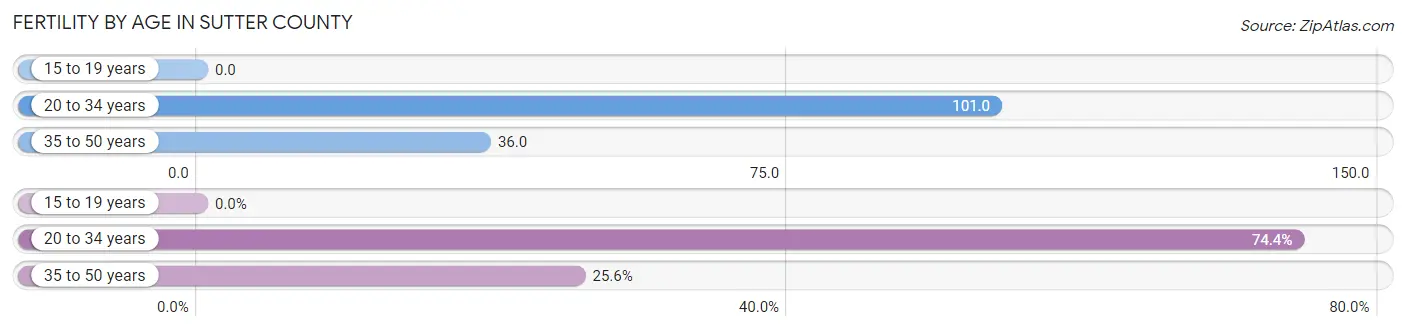
| Age Bracket | Women with Births | Births / 1,000 Women |
| 15 to 19 years | 0 (0.0%) | 0.0 |
| 20 to 34 years | 987 (74.4%) | 101.0 |
| 35 to 50 years | 340 (25.6%) | 36.0 |
| Total | 1,327 (100.0%) | 59.0 |
Fertility by Age by Marriage Status in Sutter County
73.1% of women with births (1,327) in Sutter County are married. The highest percentage of unmarried women with births falls into 20 to 34 years age bracket with 27.3% of them unmarried at the time of birth, while the lowest percentage of unmarried women with births belong to 35 to 50 years age bracket with 25.9% of them unmarried.
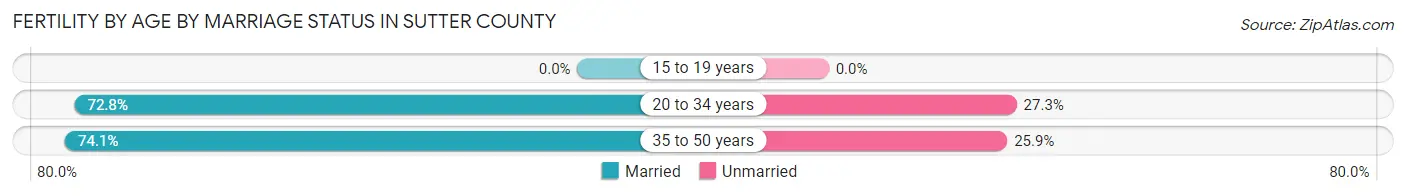
| Age Bracket | Married | Unmarried |
| 15 to 19 years | 0 (0.0%) | 0 (0.0%) |
| 20 to 34 years | 718 (72.8%) | 269 (27.3%) |
| 35 to 50 years | 252 (74.1%) | 88 (25.9%) |
| Total | 970 (73.1%) | 357 (26.9%) |
Fertility by Education in Sutter County
Average fertility rate in Sutter County is 59.0 births per 1,000 women. Women with the education attainment of bachelor's degree have the highest fertility rate of 99.0 births per 1,000 women, while women with the education attainment of less than high school have the lowest fertility at 23.0 births per 1,000 women. Women with the education attainment of college or associate's degree represent 39.5% of all women with births.
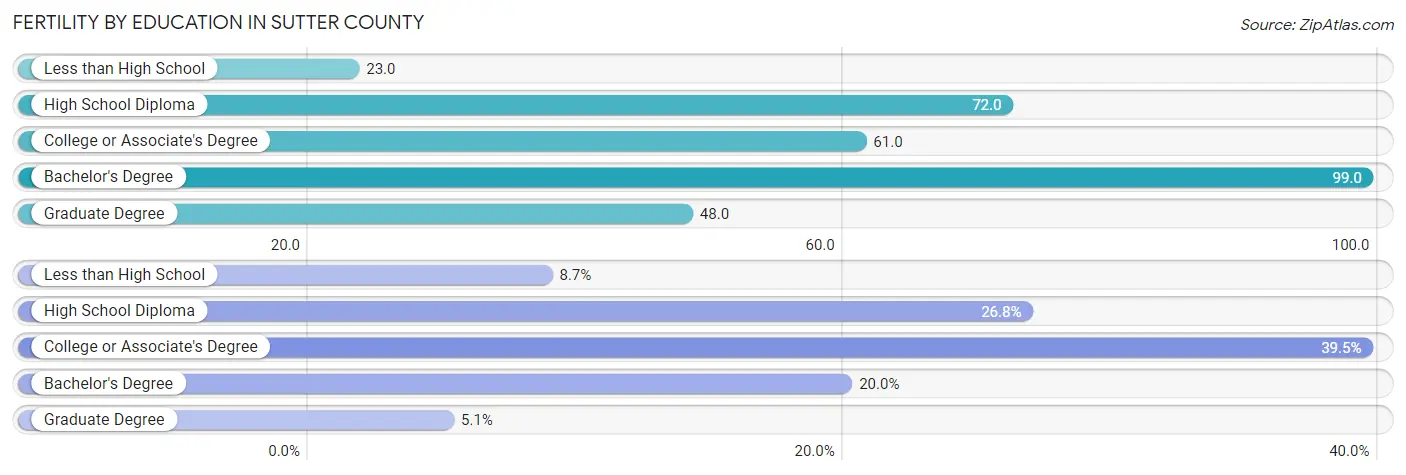
| Educational Attainment | Women with Births | Births / 1,000 Women |
| Less than High School | 116 (8.7%) | 23.0 |
| High School Diploma | 355 (26.8%) | 72.0 |
| College or Associate's Degree | 524 (39.5%) | 61.0 |
| Bachelor's Degree | 265 (20.0%) | 99.0 |
| Graduate Degree | 67 (5.1%) | 48.0 |
| Total | 1,327 (100.0%) | 59.0 |
Fertility by Education by Marriage Status in Sutter County
26.9% of women with births in Sutter County are unmarried. Women with the educational attainment of graduate degree are most likely to be married with 100.0% of them married at childbirth, while women with the educational attainment of less than high school are least likely to be married with 54.3% of them unmarried at childbirth.
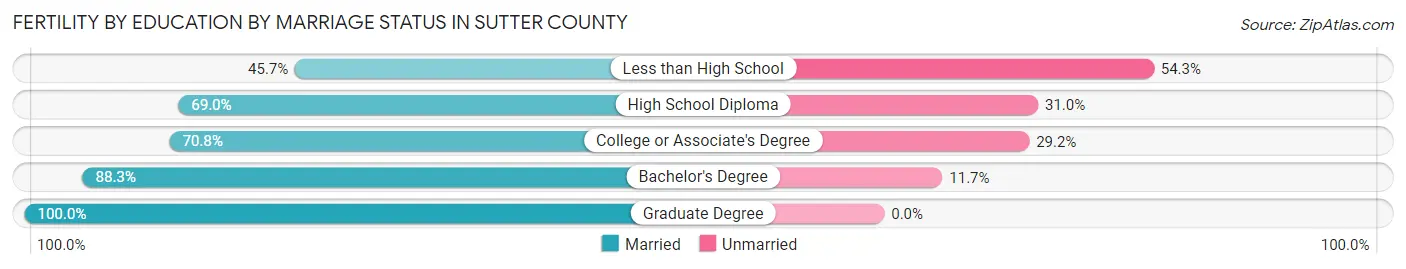
| Educational Attainment | Married | Unmarried |
| Less than High School | 53 (45.7%) | 63 (54.3%) |
| High School Diploma | 245 (69.0%) | 110 (31.0%) |
| College or Associate's Degree | 371 (70.8%) | 153 (29.2%) |
| Bachelor's Degree | 234 (88.3%) | 31 (11.7%) |
| Graduate Degree | 67 (100.0%) | 0 (0.0%) |
| Total | 970 (73.1%) | 357 (26.9%) |
Employment Characteristics in Sutter County
Employment by Class of Employer in Sutter County
Among the 41,767 employed individuals in Sutter County, private company employees (27,484 | 65.8%), local government employees (4,082 | 9.8%), and self-employed (not incorporated) (3,237 | 7.7%) make up the most common classes of employment.
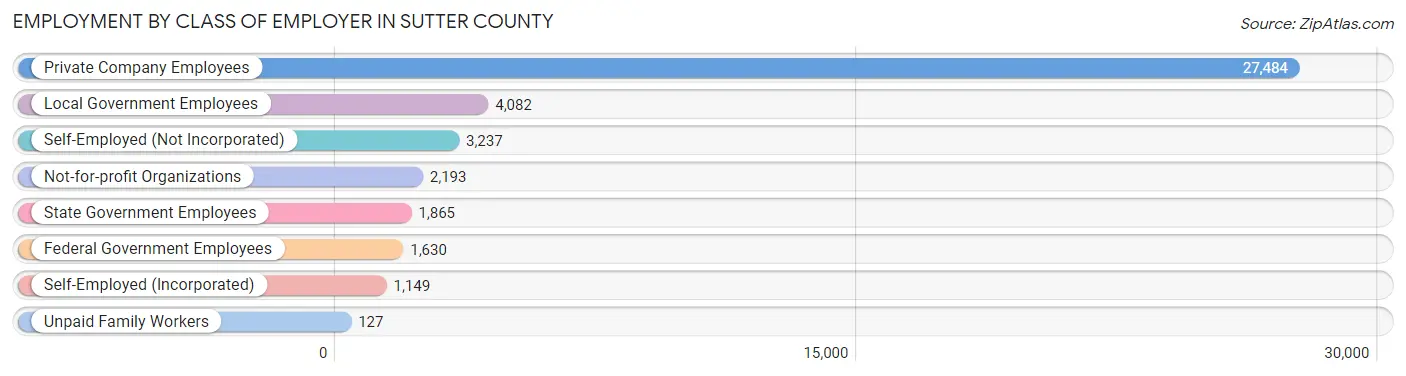
| Employer Class | # Employees | % Employees |
| Private Company Employees | 27,484 | 65.8% |
| Self-Employed (Incorporated) | 1,149 | 2.8% |
| Self-Employed (Not Incorporated) | 3,237 | 7.7% |
| Not-for-profit Organizations | 2,193 | 5.2% |
| Local Government Employees | 4,082 | 9.8% |
| State Government Employees | 1,865 | 4.5% |
| Federal Government Employees | 1,630 | 3.9% |
| Unpaid Family Workers | 127 | 0.3% |
| Total | 41,767 | 100.0% |
Employment Status by Age in Sutter County
According to the labor force statistics for Sutter County, out of the total population over 16 years of age (76,738), 60.6% or 46,503 individuals are in the labor force, with 7.6% or 3,534 of them unemployed. The age group with the highest labor force participation rate is 25 to 29 years, with 80.5% or 5,505 individuals in the labor force. Within the labor force, the 16 to 19 years age range has the highest percentage of unemployed individuals, with 27.6% or 433 of them being unemployed.
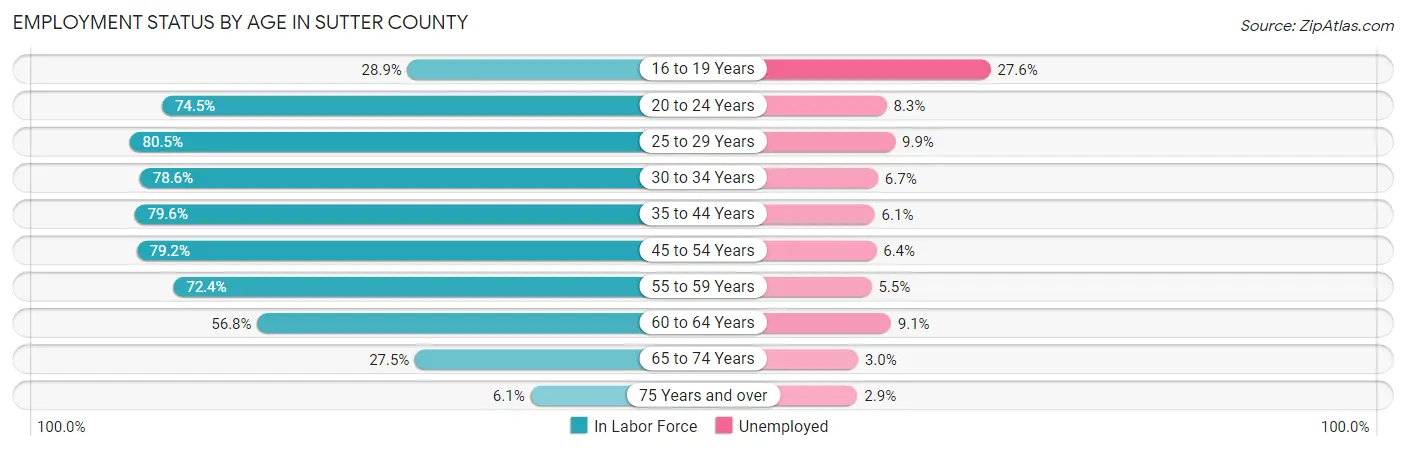
| Age Bracket | In Labor Force | Unemployed |
| 16 to 19 Years | 1,569 (28.9%) | 433 (27.6%) |
| 20 to 24 Years | 4,711 (74.5%) | 391 (8.3%) |
| 25 to 29 Years | 5,505 (80.5%) | 545 (9.9%) |
| 30 to 34 Years | 5,507 (78.6%) | 369 (6.7%) |
| 35 to 44 Years | 9,786 (79.6%) | 597 (6.1%) |
| 45 to 54 Years | 8,956 (79.2%) | 573 (6.4%) |
| 55 to 59 Years | 3,944 (72.4%) | 217 (5.5%) |
| 60 to 64 Years | 3,701 (56.8%) | 337 (9.1%) |
| 65 to 74 Years | 2,407 (27.5%) | 72 (3.0%) |
| 75 Years and over | 416 (6.1%) | 12 (2.9%) |
| Total | 46,503 (60.6%) | 3,534 (7.6%) |
Employment Status by Educational Attainment in Sutter County
According to labor force statistics for Sutter County, 75.7% of individuals (37,402) out of the total population between 25 and 64 years of age (49,408) are in the labor force, with 7.0% or 2,618 of them being unemployed. The group with the highest labor force participation rate are those with the educational attainment of bachelor's degree or higher, with 84.5% or 8,853 individuals in the labor force. Within the labor force, individuals with college / associate degree education have the highest percentage of unemployment, with 8.9% or 1,180 of them being unemployed.
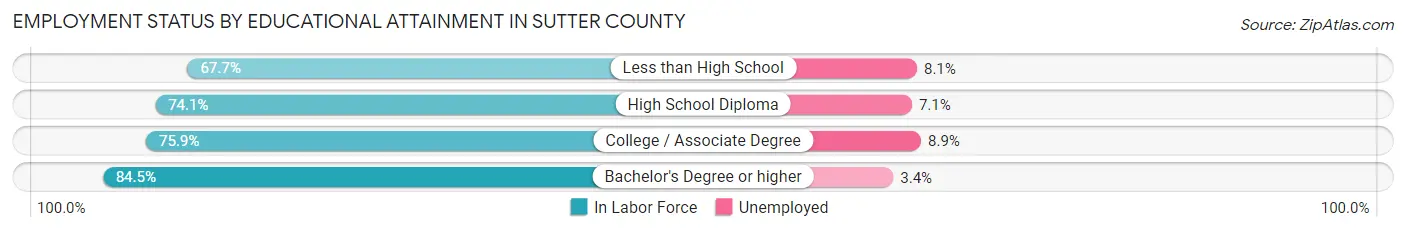
| Educational Attainment | In Labor Force | Unemployed |
| Less than High School | 6,342 (67.7%) | 759 (8.1%) |
| High School Diploma | 8,962 (74.1%) | 859 (7.1%) |
| College / Associate Degree | 13,258 (75.9%) | 1,555 (8.9%) |
| Bachelor's Degree or higher | 8,853 (84.5%) | 356 (3.4%) |
| Total | 37,402 (75.7%) | 3,459 (7.0%) |
Employment Occupations by Sex in Sutter County
Management, Business, Science and Arts Occupations
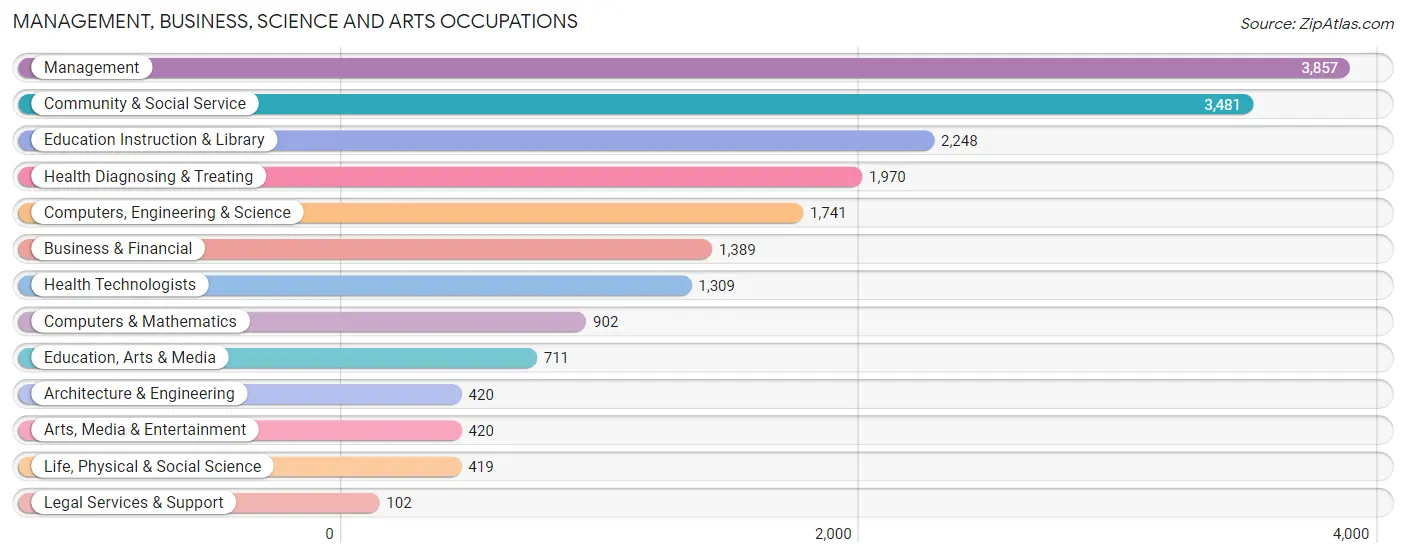
The most common Management, Business, Science and Arts occupations in Sutter County are Management (3,857 | 9.1%), Community & Social Service (3,481 | 8.2%), Education Instruction & Library (2,248 | 5.3%), Health Diagnosing & Treating (1,970 | 4.7%), and Computers, Engineering & Science (1,741 | 4.1%).
Management, Business, Science and Arts Occupations by Sex
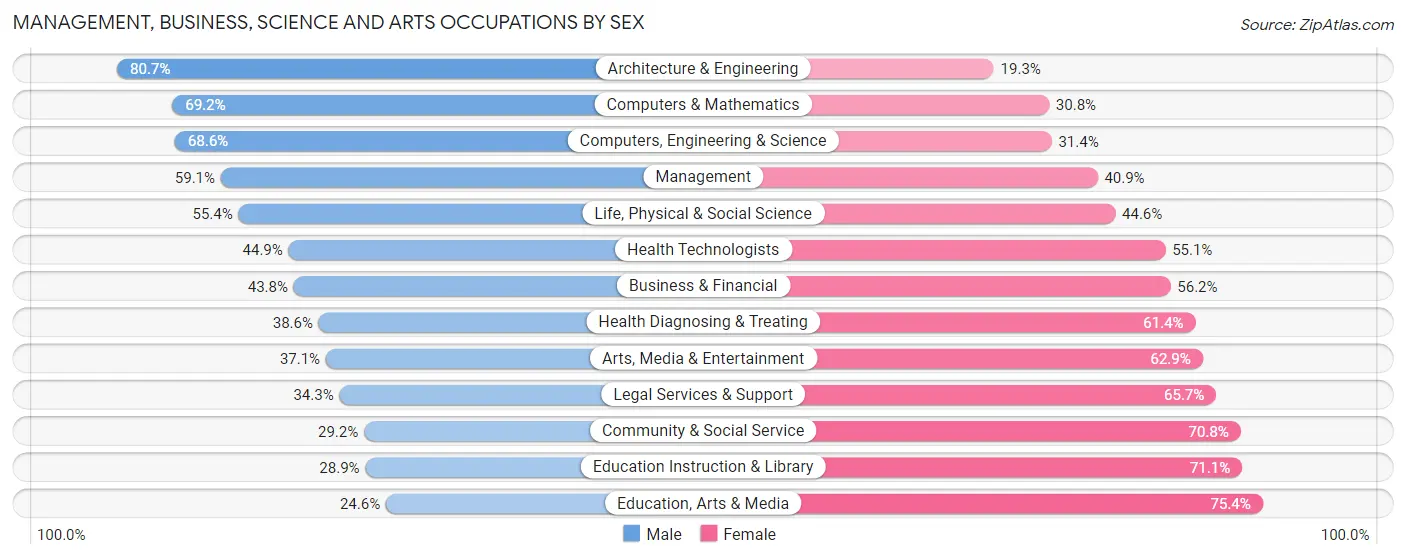
Within the Management, Business, Science and Arts occupations in Sutter County, the most male-oriented occupations are Architecture & Engineering (80.7%), Computers & Mathematics (69.2%), and Computers, Engineering & Science (68.6%), while the most female-oriented occupations are Education, Arts & Media (75.4%), Education Instruction & Library (71.1%), and Community & Social Service (70.8%).
| Occupation | Male | Female |
| Management | 2,278 (59.1%) | 1,579 (40.9%) |
| Business & Financial | 609 (43.8%) | 780 (56.2%) |
| Computers, Engineering & Science | 1,195 (68.6%) | 546 (31.4%) |
| Computers & Mathematics | 624 (69.2%) | 278 (30.8%) |
| Architecture & Engineering | 339 (80.7%) | 81 (19.3%) |
| Life, Physical & Social Science | 232 (55.4%) | 187 (44.6%) |
| Community & Social Service | 1,016 (29.2%) | 2,465 (70.8%) |
| Education, Arts & Media | 175 (24.6%) | 536 (75.4%) |
| Legal Services & Support | 35 (34.3%) | 67 (65.7%) |
| Education Instruction & Library | 650 (28.9%) | 1,598 (71.1%) |
| Arts, Media & Entertainment | 156 (37.1%) | 264 (62.9%) |
| Health Diagnosing & Treating | 761 (38.6%) | 1,209 (61.4%) |
| Health Technologists | 588 (44.9%) | 721 (55.1%) |
| Total (Category) | 5,859 (47.1%) | 6,579 (52.9%) |
| Total (Overall) | 23,383 (55.3%) | 18,868 (44.7%) |
Services Occupations
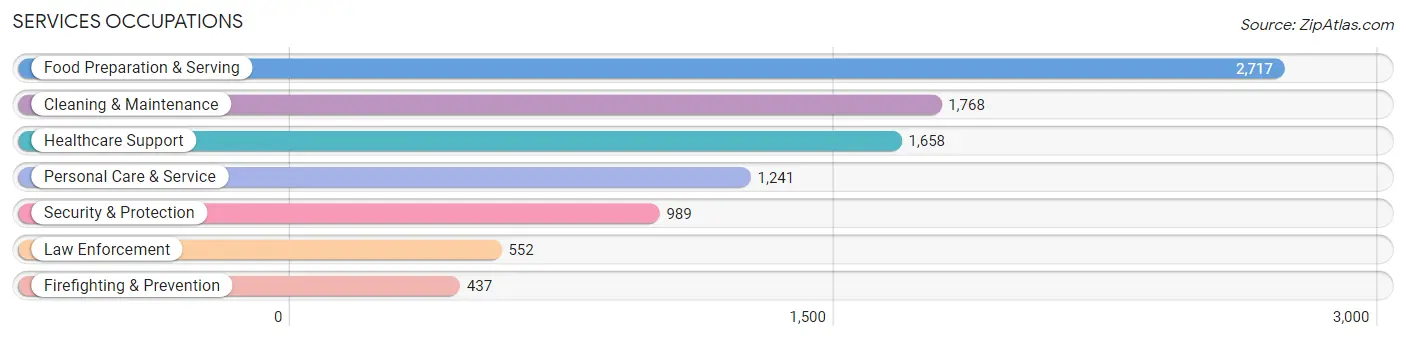
The most common Services occupations in Sutter County are Food Preparation & Serving (2,717 | 6.4%), Cleaning & Maintenance (1,768 | 4.2%), Healthcare Support (1,658 | 3.9%), Personal Care & Service (1,241 | 2.9%), and Security & Protection (989 | 2.3%).
Services Occupations by Sex
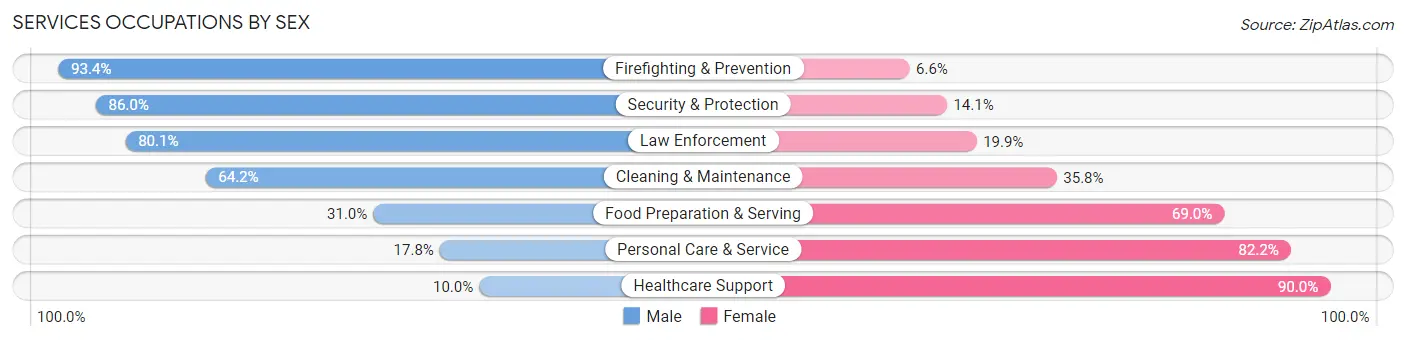
Within the Services occupations in Sutter County, the most male-oriented occupations are Firefighting & Prevention (93.4%), Security & Protection (86.0%), and Law Enforcement (80.1%), while the most female-oriented occupations are Healthcare Support (90.0%), Personal Care & Service (82.2%), and Food Preparation & Serving (69.0%).
| Occupation | Male | Female |
| Healthcare Support | 166 (10.0%) | 1,492 (90.0%) |
| Security & Protection | 850 (86.0%) | 139 (14.1%) |
| Firefighting & Prevention | 408 (93.4%) | 29 (6.6%) |
| Law Enforcement | 442 (80.1%) | 110 (19.9%) |
| Food Preparation & Serving | 842 (31.0%) | 1,875 (69.0%) |
| Cleaning & Maintenance | 1,135 (64.2%) | 633 (35.8%) |
| Personal Care & Service | 221 (17.8%) | 1,020 (82.2%) |
| Total (Category) | 3,214 (38.4%) | 5,159 (61.6%) |
| Total (Overall) | 23,383 (55.3%) | 18,868 (44.7%) |
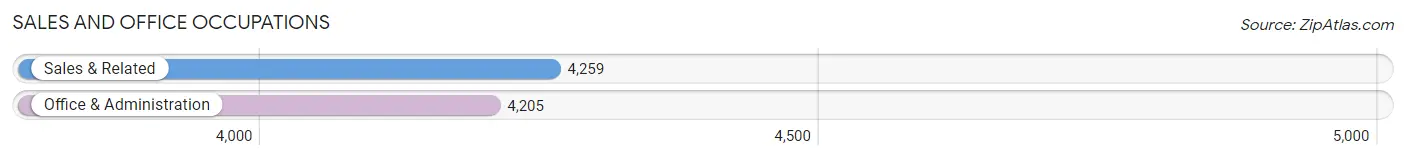
Sales and Office Occupations
The most common Sales and Office occupations in Sutter County are Sales & Related (4,259 | 10.1%), and Office & Administration (4,205 | 10.0%).
Sales and Office Occupations by Sex
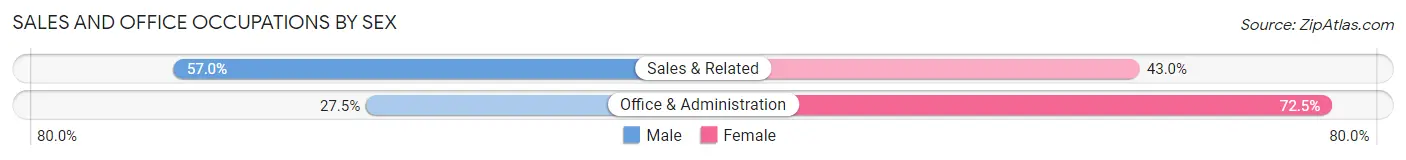
| Occupation | Male | Female |
| Sales & Related | 2,429 (57.0%) | 1,830 (43.0%) |
| Office & Administration | 1,155 (27.5%) | 3,050 (72.5%) |
| Total (Category) | 3,584 (42.3%) | 4,880 (57.7%) |
| Total (Overall) | 23,383 (55.3%) | 18,868 (44.7%) |
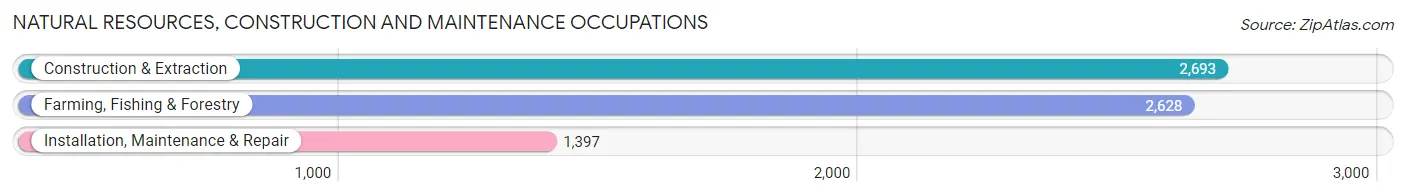
Natural Resources, Construction and Maintenance Occupations
The most common Natural Resources, Construction and Maintenance occupations in Sutter County are Construction & Extraction (2,693 | 6.4%), Farming, Fishing & Forestry (2,628 | 6.2%), and Installation, Maintenance & Repair (1,397 | 3.3%).
Natural Resources, Construction and Maintenance Occupations by Sex
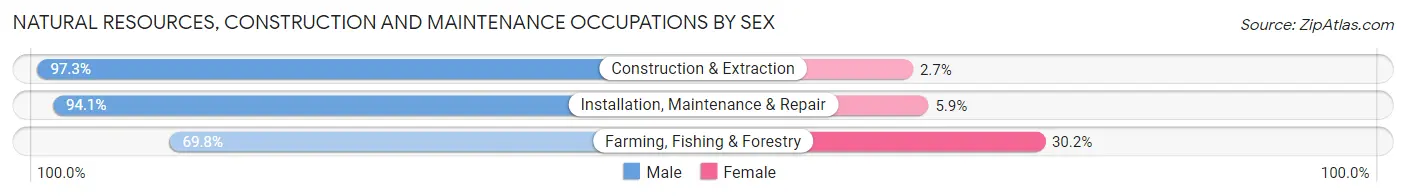
| Occupation | Male | Female |
| Farming, Fishing & Forestry | 1,835 (69.8%) | 793 (30.2%) |
| Construction & Extraction | 2,620 (97.3%) | 73 (2.7%) |
| Installation, Maintenance & Repair | 1,314 (94.1%) | 83 (5.9%) |
| Total (Category) | 5,769 (85.9%) | 949 (14.1%) |
| Total (Overall) | 23,383 (55.3%) | 18,868 (44.7%) |
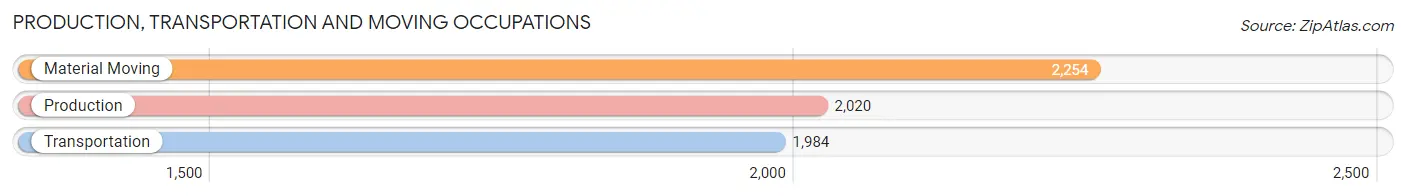
Production, Transportation and Moving Occupations
The most common Production, Transportation and Moving occupations in Sutter County are Material Moving (2,254 | 5.3%), Production (2,020 | 4.8%), and Transportation (1,984 | 4.7%).
Production, Transportation and Moving Occupations by Sex
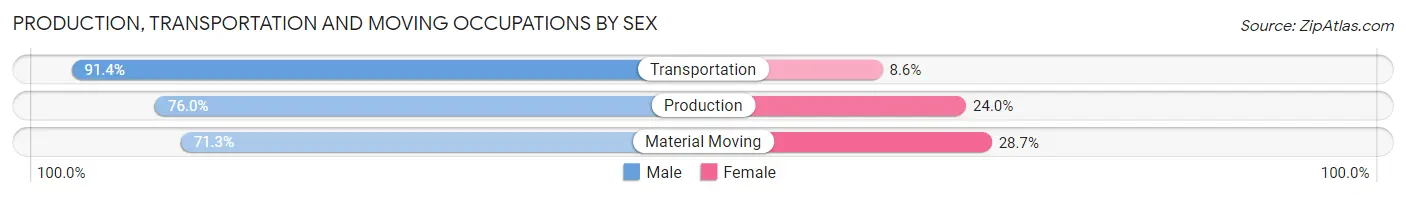
| Occupation | Male | Female |
| Production | 1,536 (76.0%) | 484 (24.0%) |
| Transportation | 1,813 (91.4%) | 171 (8.6%) |
| Material Moving | 1,608 (71.3%) | 646 (28.7%) |
| Total (Category) | 4,957 (79.2%) | 1,301 (20.8%) |
| Total (Overall) | 23,383 (55.3%) | 18,868 (44.7%) |
Employment Industries by Sex in Sutter County
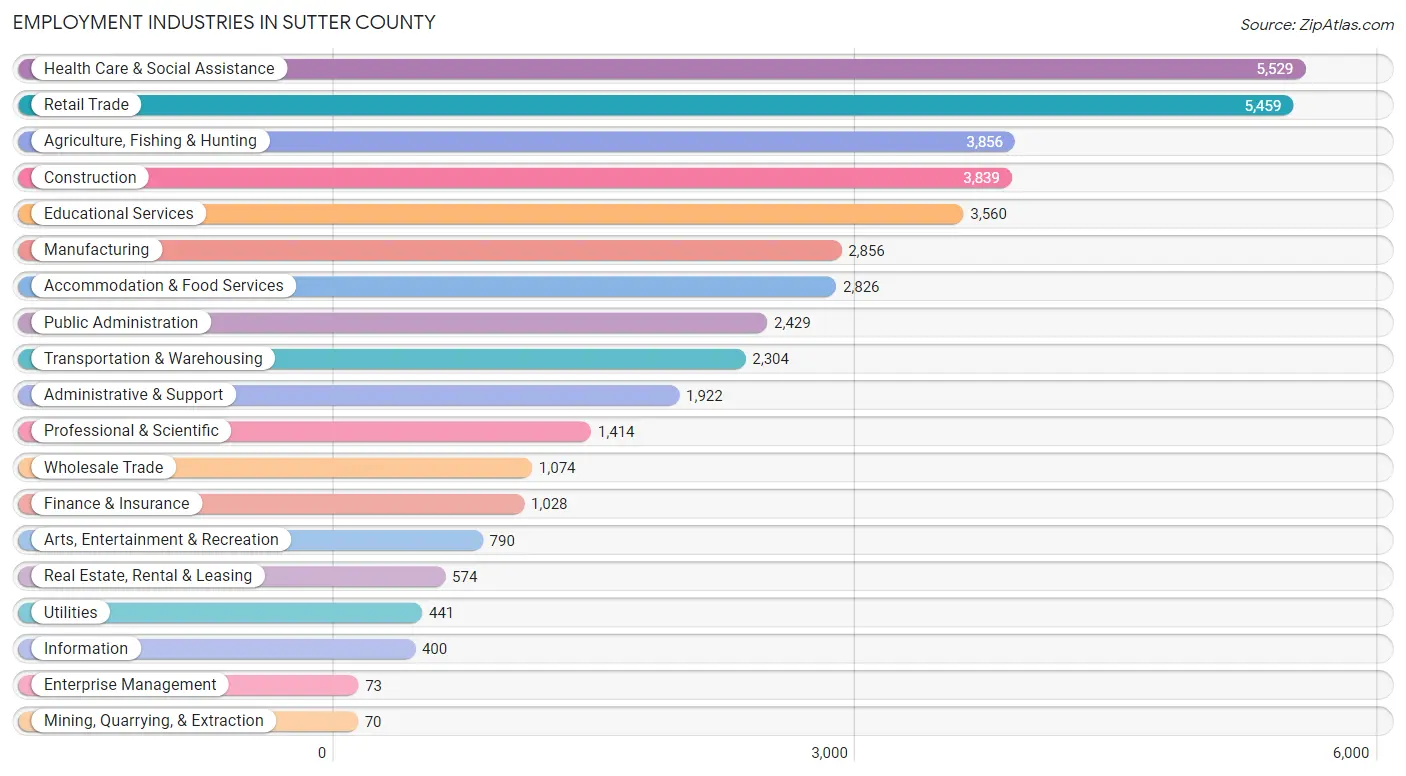
Employment Industries in Sutter County
The major employment industries in Sutter County include Health Care & Social Assistance (5,529 | 13.1%), Retail Trade (5,459 | 12.9%), Agriculture, Fishing & Hunting (3,856 | 9.1%), Construction (3,839 | 9.1%), and Educational Services (3,560 | 8.4%).
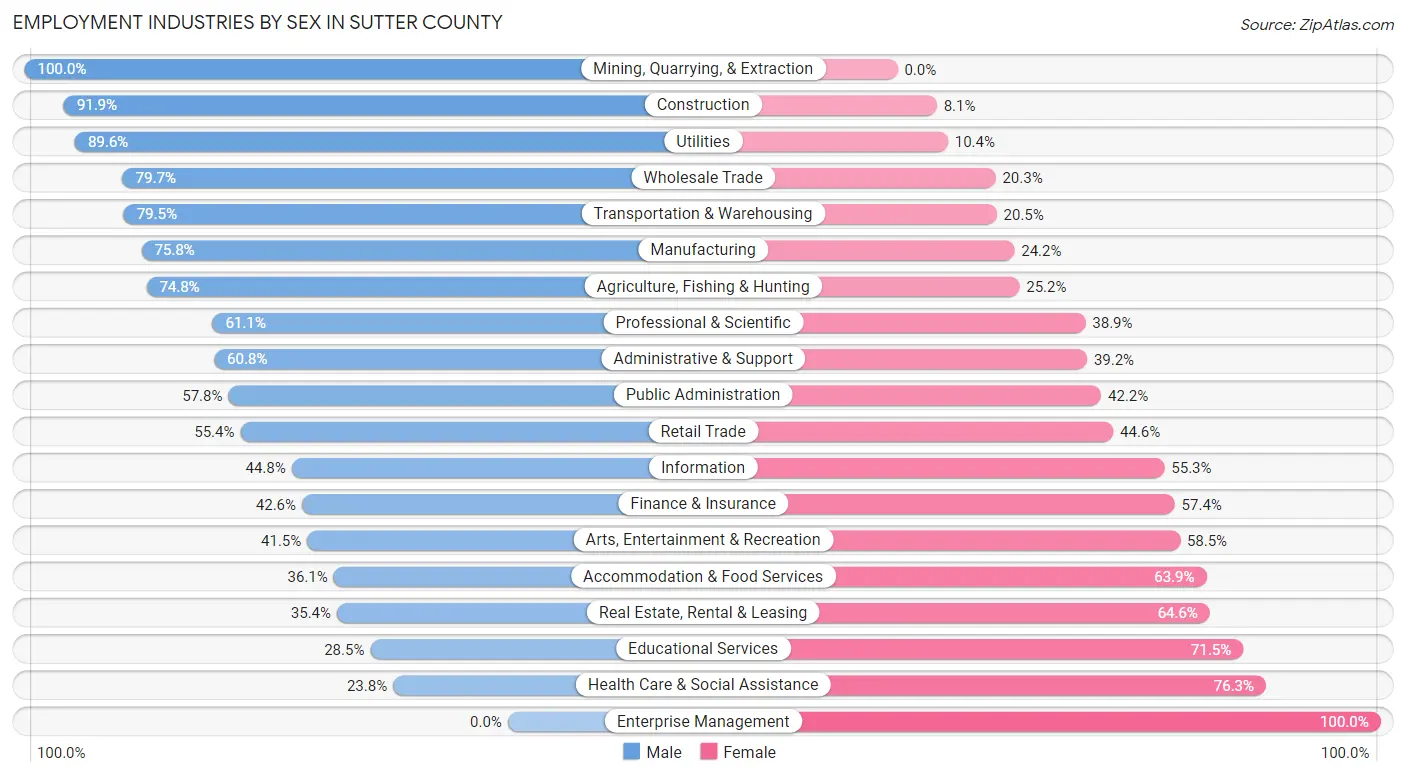
Employment Industries by Sex in Sutter County
The Sutter County industries that see more men than women are Mining, Quarrying, & Extraction (100.0%), Construction (91.9%), and Utilities (89.6%), whereas the industries that tend to have a higher number of women are Enterprise Management (100.0%), Health Care & Social Assistance (76.2%), and Educational Services (71.5%).
| Industry | Male | Female |
| Agriculture, Fishing & Hunting | 2,883 (74.8%) | 973 (25.2%) |
| Mining, Quarrying, & Extraction | 70 (100.0%) | 0 (0.0%) |
| Construction | 3,527 (91.9%) | 312 (8.1%) |
| Manufacturing | 2,165 (75.8%) | 691 (24.2%) |
| Wholesale Trade | 856 (79.7%) | 218 (20.3%) |
| Retail Trade | 3,022 (55.4%) | 2,437 (44.6%) |
| Transportation & Warehousing | 1,831 (79.5%) | 473 (20.5%) |
| Utilities | 395 (89.6%) | 46 (10.4%) |
| Information | 179 (44.8%) | 221 (55.2%) |
| Finance & Insurance | 438 (42.6%) | 590 (57.4%) |
| Real Estate, Rental & Leasing | 203 (35.4%) | 371 (64.6%) |
| Professional & Scientific | 864 (61.1%) | 550 (38.9%) |
| Enterprise Management | 0 (0.0%) | 73 (100.0%) |
| Administrative & Support | 1,168 (60.8%) | 754 (39.2%) |
| Educational Services | 1,013 (28.5%) | 2,547 (71.5%) |
| Health Care & Social Assistance | 1,313 (23.7%) | 4,216 (76.2%) |
| Arts, Entertainment & Recreation | 328 (41.5%) | 462 (58.5%) |
| Accommodation & Food Services | 1,019 (36.1%) | 1,807 (63.9%) |
| Public Administration | 1,405 (57.8%) | 1,024 (42.2%) |
| Total | 23,383 (55.3%) | 18,868 (44.7%) |
Education in Sutter County
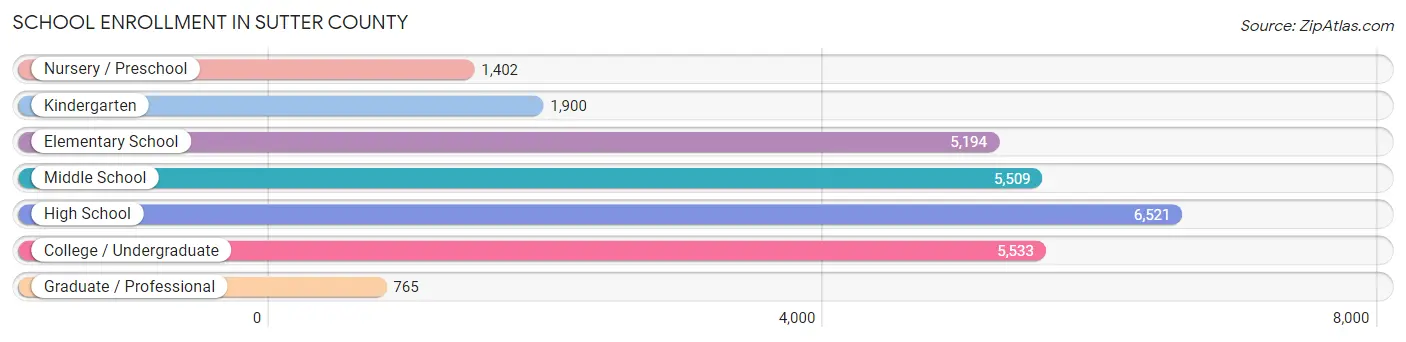
School Enrollment in Sutter County
The most common levels of schooling among the 26,824 students in Sutter County are high school (6,521 | 24.3%), college / undergraduate (5,533 | 20.6%), and middle school (5,509 | 20.5%).
| School Level | # Students | % Students |
| Nursery / Preschool | 1,402 | 5.2% |
| Kindergarten | 1,900 | 7.1% |
| Elementary School | 5,194 | 19.4% |
| Middle School | 5,509 | 20.5% |
| High School | 6,521 | 24.3% |
| College / Undergraduate | 5,533 | 20.6% |
| Graduate / Professional | 765 | 2.9% |
| Total | 26,824 | 100.0% |
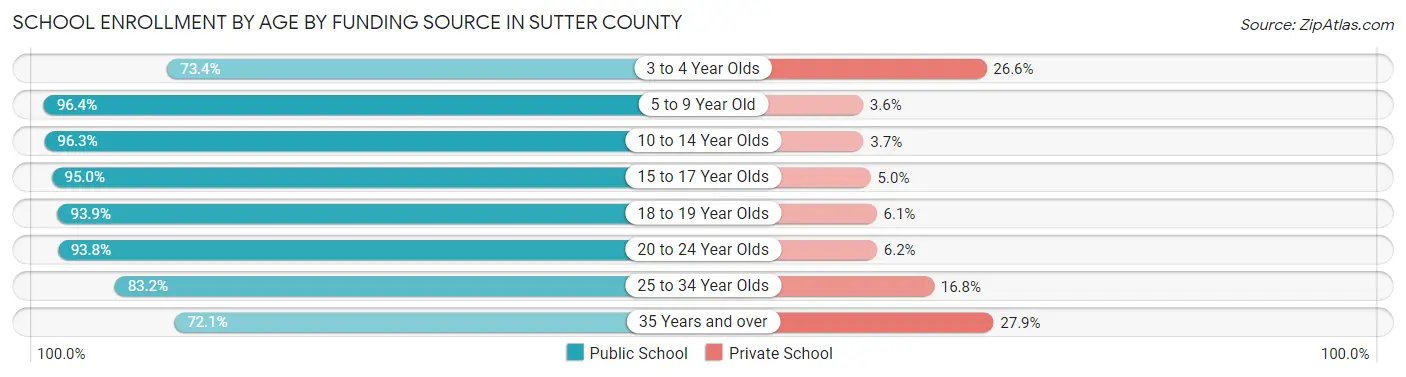
School Enrollment by Age by Funding Source in Sutter County
Out of a total of 26,824 students who are enrolled in schools in Sutter County, 1,905 (7.1%) attend a private institution, while the remaining 24,919 (92.9%) are enrolled in public schools. The age group of 35 years and over has the highest likelihood of being enrolled in private schools, with 339 (27.9% in the age bracket) enrolled. Conversely, the age group of 5 to 9 year old has the lowest likelihood of being enrolled in a private school, with 6,753 (96.4% in the age bracket) attending a public institution.
| Age Bracket | Public School | Private School |
| 3 to 4 Year Olds | 790 (73.4%) | 286 (26.6%) |
| 5 to 9 Year Old | 6,753 (96.4%) | 251 (3.6%) |
| 10 to 14 Year Olds | 6,692 (96.3%) | 256 (3.7%) |
| 15 to 17 Year Olds | 4,302 (95.0%) | 228 (5.0%) |
| 18 to 19 Year Olds | 1,666 (93.9%) | 109 (6.1%) |
| 20 to 24 Year Olds | 2,474 (93.8%) | 163 (6.2%) |
| 25 to 34 Year Olds | 1,363 (83.2%) | 275 (16.8%) |
| 35 Years and over | 877 (72.1%) | 339 (27.9%) |
| Total | 24,919 (92.9%) | 1,905 (7.1%) |
Educational Attainment by Field of Study in Sutter County
Business (2,077 | 14.4%), science & technology (1,687 | 11.7%), social sciences (1,510 | 10.4%), bio, nature & agricultural (1,326 | 9.2%), and arts & humanities (1,325 | 9.2%) are the most common fields of study among 14,459 individuals in Sutter County who have obtained a bachelor's degree or higher.
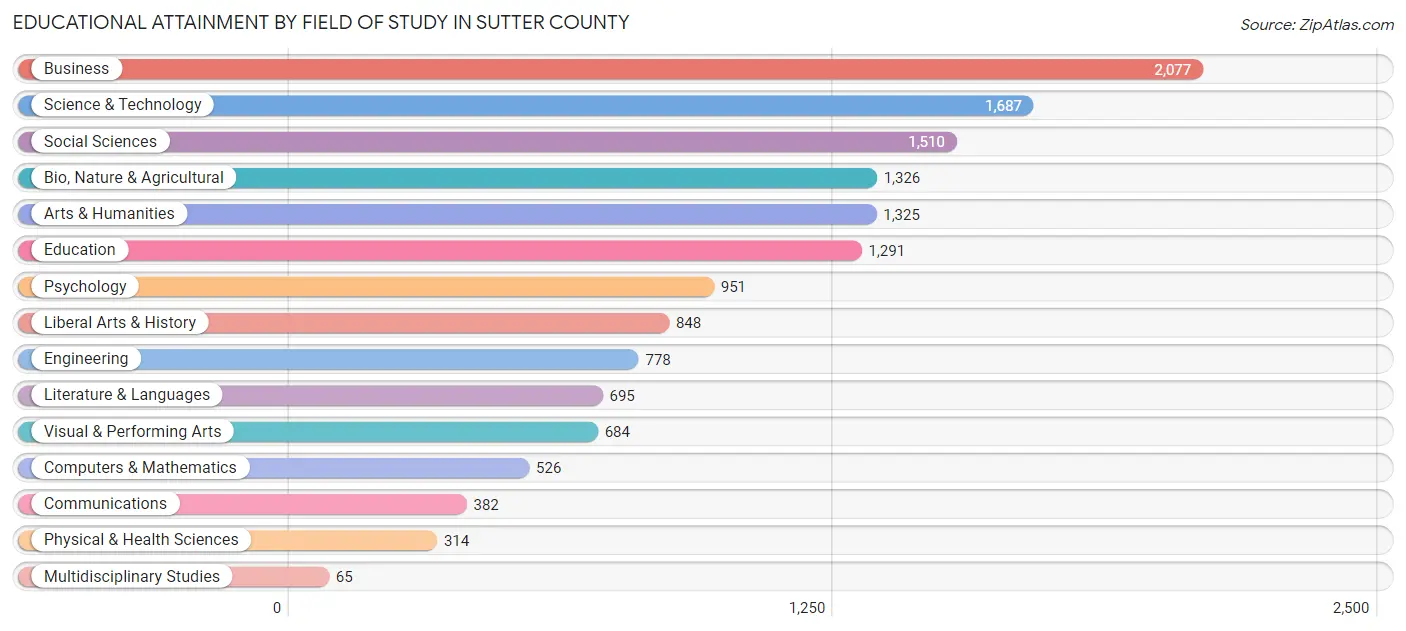
| Field of Study | # Graduates | % Graduates |
| Computers & Mathematics | 526 | 3.6% |
| Bio, Nature & Agricultural | 1,326 | 9.2% |
| Physical & Health Sciences | 314 | 2.2% |
| Psychology | 951 | 6.6% |
| Social Sciences | 1,510 | 10.4% |
| Engineering | 778 | 5.4% |
| Multidisciplinary Studies | 65 | 0.4% |
| Science & Technology | 1,687 | 11.7% |
| Business | 2,077 | 14.4% |
| Education | 1,291 | 8.9% |
| Literature & Languages | 695 | 4.8% |
| Liberal Arts & History | 848 | 5.9% |
| Visual & Performing Arts | 684 | 4.7% |
| Communications | 382 | 2.6% |
| Arts & Humanities | 1,325 | 9.2% |
| Total | 14,459 | 100.0% |
Transportation & Commute in Sutter County
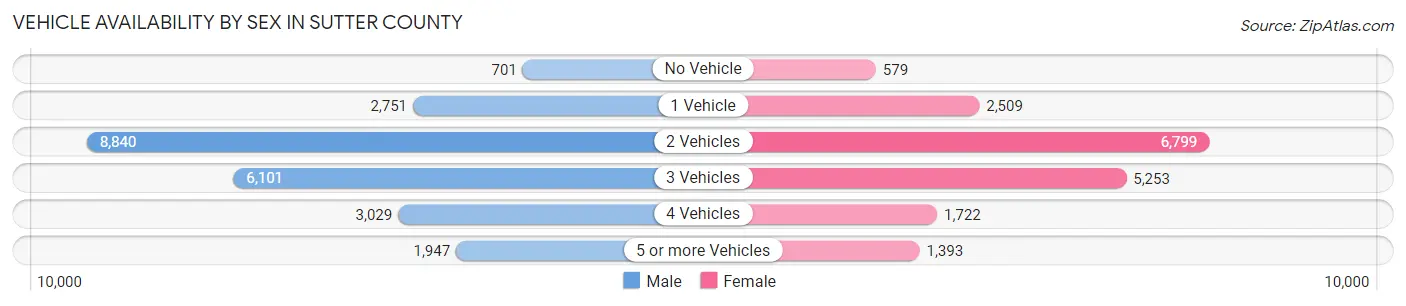
Vehicle Availability by Sex in Sutter County
The most prevalent vehicle ownership categories in Sutter County are males with 2 vehicles (8,840, accounting for 37.8%) and females with 2 vehicles (6,799, making up 48.4%).
| Vehicles Available | Male | Female |
| No Vehicle | 701 (3.0%) | 579 (3.2%) |
| 1 Vehicle | 2,751 (11.8%) | 2,509 (13.7%) |
| 2 Vehicles | 8,840 (37.8%) | 6,799 (37.2%) |
| 3 Vehicles | 6,101 (26.1%) | 5,253 (28.8%) |
| 4 Vehicles | 3,029 (13.0%) | 1,722 (9.4%) |
| 5 or more Vehicles | 1,947 (8.3%) | 1,393 (7.6%) |
| Total | 23,369 (100.0%) | 18,255 (100.0%) |
Commute Time in Sutter County
The most frequently occuring commute durations in Sutter County are 10 to 14 minutes (7,436 commuters, 19.1%), 15 to 19 minutes (5,587 commuters, 14.4%), and 5 to 9 minutes (4,987 commuters, 12.8%).
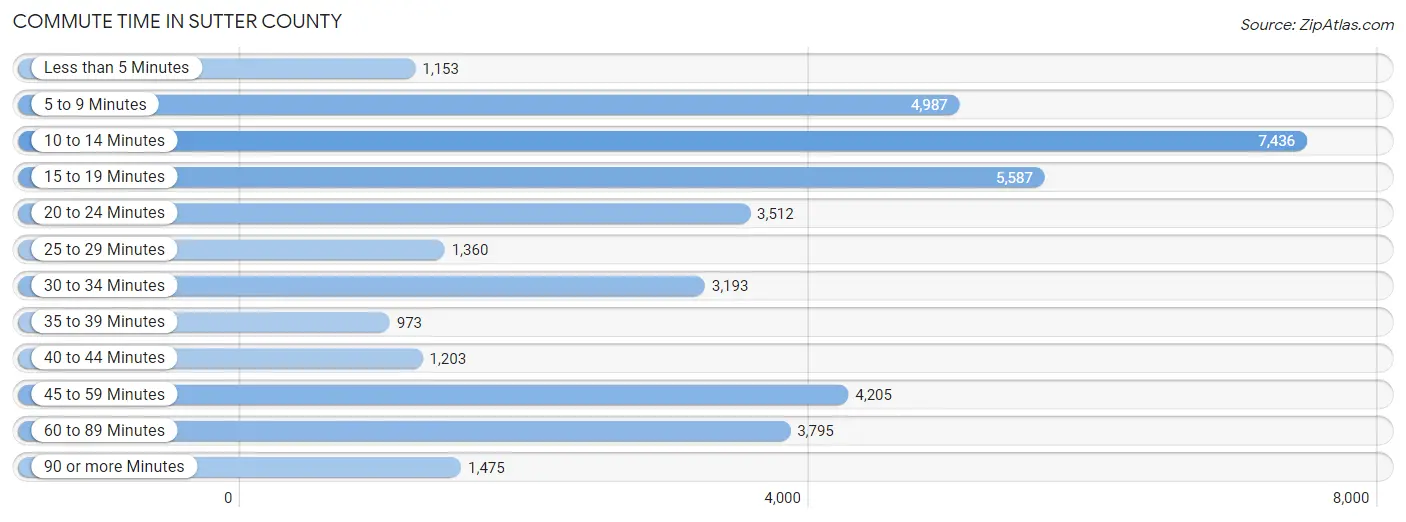
| Commute Time | # Commuters | % Commuters |
| Less than 5 Minutes | 1,153 | 3.0% |
| 5 to 9 Minutes | 4,987 | 12.8% |
| 10 to 14 Minutes | 7,436 | 19.1% |
| 15 to 19 Minutes | 5,587 | 14.4% |
| 20 to 24 Minutes | 3,512 | 9.0% |
| 25 to 29 Minutes | 1,360 | 3.5% |
| 30 to 34 Minutes | 3,193 | 8.2% |
| 35 to 39 Minutes | 973 | 2.5% |
| 40 to 44 Minutes | 1,203 | 3.1% |
| 45 to 59 Minutes | 4,205 | 10.8% |
| 60 to 89 Minutes | 3,795 | 9.8% |
| 90 or more Minutes | 1,475 | 3.8% |
Commute Time by Sex in Sutter County
The most common commute times in Sutter County are 10 to 14 minutes (3,814 commuters, 17.5%) for males and 10 to 14 minutes (3,622 commuters, 21.1%) for females.
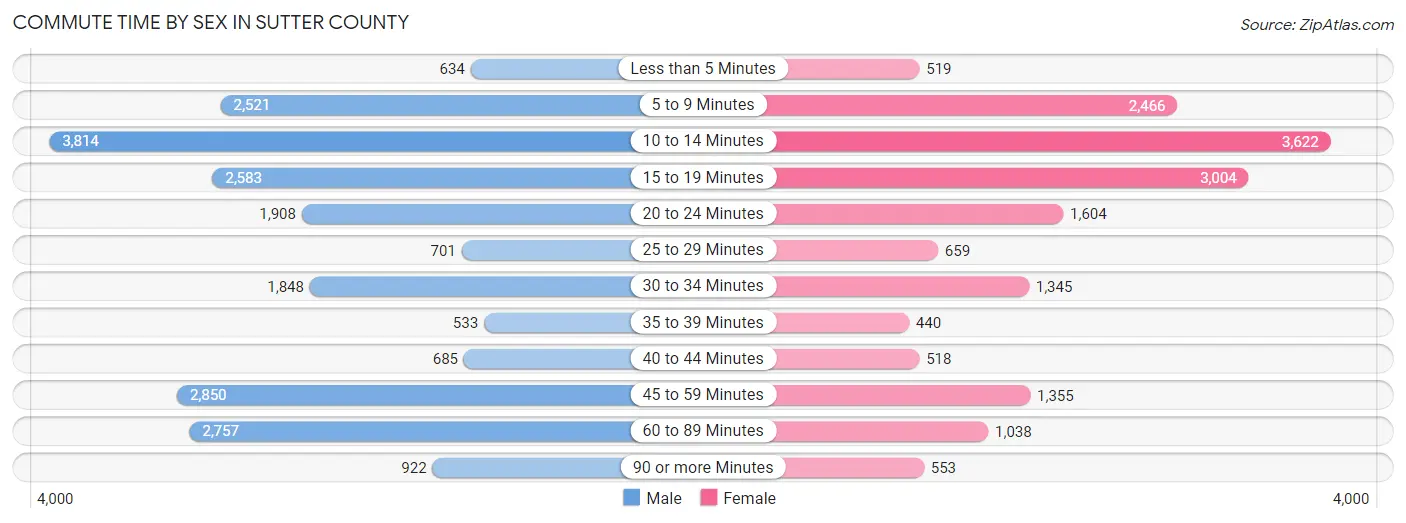
| Commute Time | Male | Female |
| Less than 5 Minutes | 634 (2.9%) | 519 (3.0%) |
| 5 to 9 Minutes | 2,521 (11.6%) | 2,466 (14.4%) |
| 10 to 14 Minutes | 3,814 (17.5%) | 3,622 (21.1%) |
| 15 to 19 Minutes | 2,583 (11.9%) | 3,004 (17.5%) |
| 20 to 24 Minutes | 1,908 (8.8%) | 1,604 (9.4%) |
| 25 to 29 Minutes | 701 (3.2%) | 659 (3.8%) |
| 30 to 34 Minutes | 1,848 (8.5%) | 1,345 (7.9%) |
| 35 to 39 Minutes | 533 (2.5%) | 440 (2.6%) |
| 40 to 44 Minutes | 685 (3.2%) | 518 (3.0%) |
| 45 to 59 Minutes | 2,850 (13.1%) | 1,355 (7.9%) |
| 60 to 89 Minutes | 2,757 (12.7%) | 1,038 (6.1%) |
| 90 or more Minutes | 922 (4.2%) | 553 (3.2%) |
Time of Departure to Work by Sex in Sutter County
The most frequent times of departure to work in Sutter County are 7:00 AM to 7:29 AM (3,255, 15.0%) for males and 7:30 AM to 7:59 AM (2,655, 15.5%) for females.
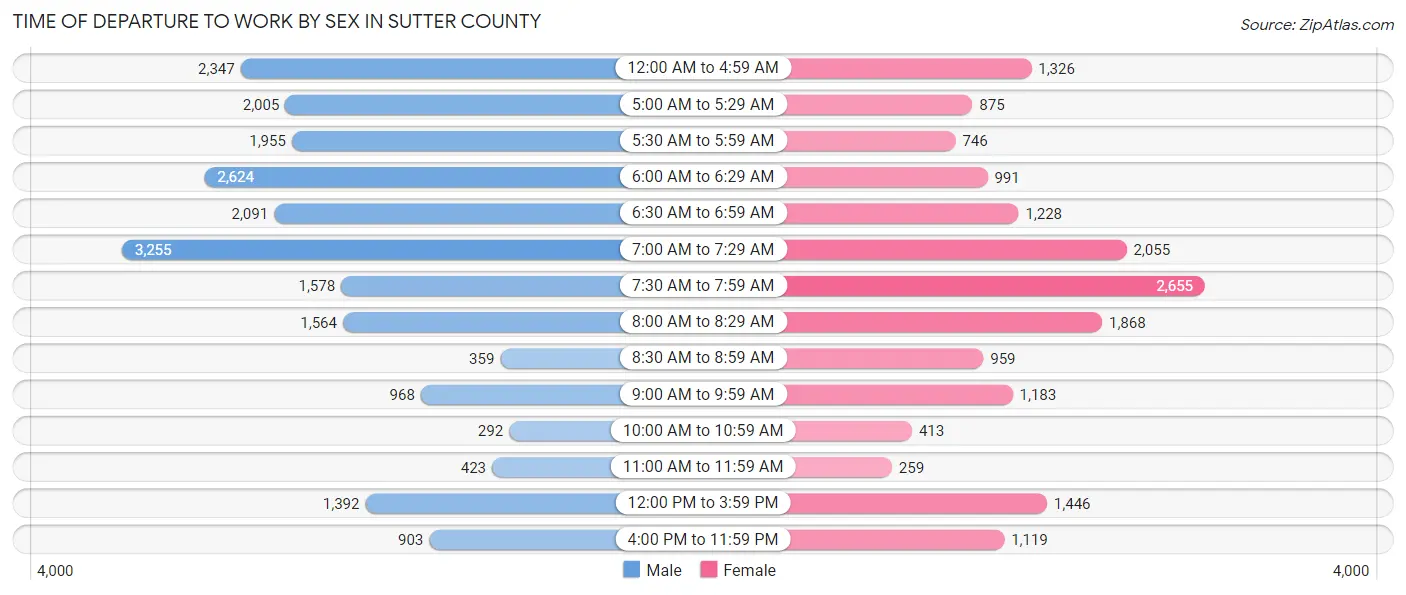
| Time of Departure | Male | Female |
| 12:00 AM to 4:59 AM | 2,347 (10.8%) | 1,326 (7.7%) |
| 5:00 AM to 5:29 AM | 2,005 (9.2%) | 875 (5.1%) |
| 5:30 AM to 5:59 AM | 1,955 (9.0%) | 746 (4.4%) |
| 6:00 AM to 6:29 AM | 2,624 (12.1%) | 991 (5.8%) |
| 6:30 AM to 6:59 AM | 2,091 (9.6%) | 1,228 (7.2%) |
| 7:00 AM to 7:29 AM | 3,255 (15.0%) | 2,055 (12.0%) |
| 7:30 AM to 7:59 AM | 1,578 (7.2%) | 2,655 (15.5%) |
| 8:00 AM to 8:29 AM | 1,564 (7.2%) | 1,868 (10.9%) |
| 8:30 AM to 8:59 AM | 359 (1.7%) | 959 (5.6%) |
| 9:00 AM to 9:59 AM | 968 (4.4%) | 1,183 (6.9%) |
| 10:00 AM to 10:59 AM | 292 (1.3%) | 413 (2.4%) |
| 11:00 AM to 11:59 AM | 423 (1.9%) | 259 (1.5%) |
| 12:00 PM to 3:59 PM | 1,392 (6.4%) | 1,446 (8.4%) |
| 4:00 PM to 11:59 PM | 903 (4.2%) | 1,119 (6.5%) |
| Total | 21,756 (100.0%) | 17,123 (100.0%) |
Housing Occupancy in Sutter County
Occupancy by Ownership in Sutter County
Of the total 33,041 dwellings in Sutter County, owner-occupied units account for 19,680 (59.6%), while renter-occupied units make up 13,361 (40.4%).
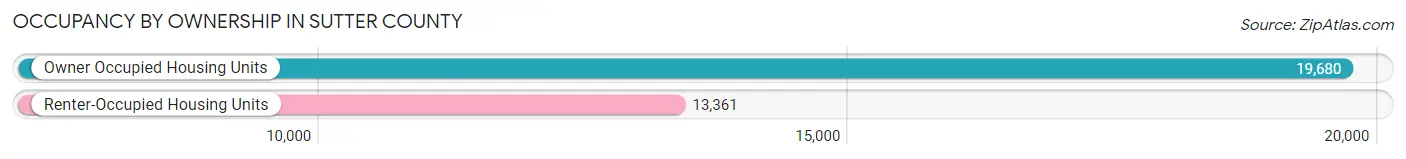
| Occupancy | # Housing Units | % Housing Units |
| Owner Occupied Housing Units | 19,680 | 59.6% |
| Renter-Occupied Housing Units | 13,361 | 40.4% |
| Total Occupied Housing Units | 33,041 | 100.0% |
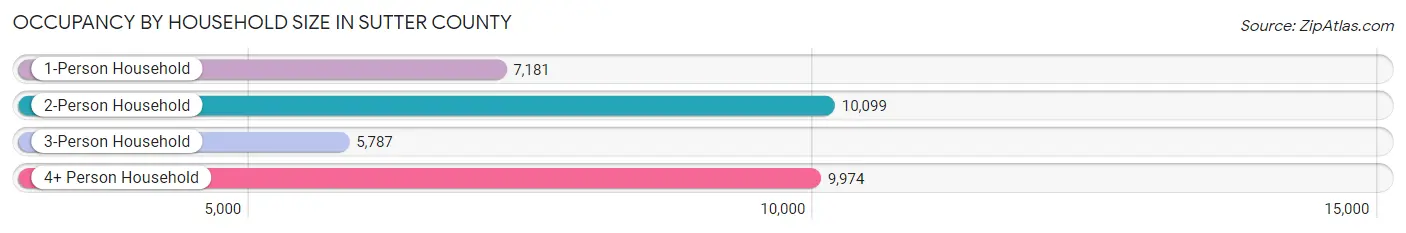
Occupancy by Household Size in Sutter County
| Household Size | # Housing Units | % Housing Units |
| 1-Person Household | 7,181 | 21.7% |
| 2-Person Household | 10,099 | 30.6% |
| 3-Person Household | 5,787 | 17.5% |
| 4+ Person Household | 9,974 | 30.2% |
| Total Housing Units | 33,041 | 100.0% |
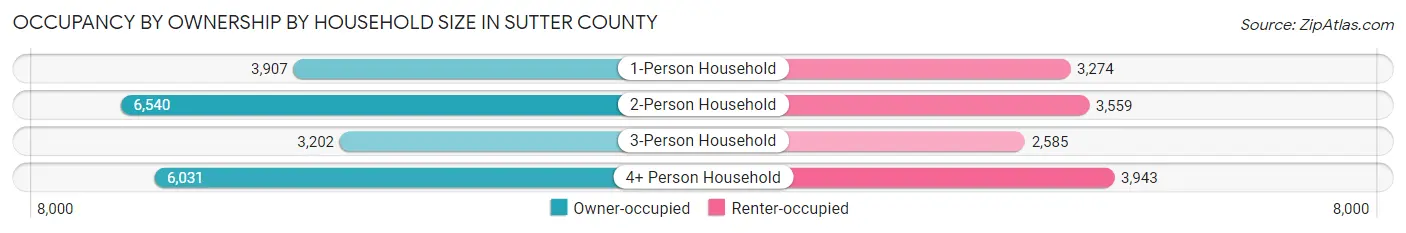
Occupancy by Ownership by Household Size in Sutter County
| Household Size | Owner-occupied | Renter-occupied |
| 1-Person Household | 3,907 (54.4%) | 3,274 (45.6%) |
| 2-Person Household | 6,540 (64.8%) | 3,559 (35.2%) |
| 3-Person Household | 3,202 (55.3%) | 2,585 (44.7%) |
| 4+ Person Household | 6,031 (60.5%) | 3,943 (39.5%) |
| Total Housing Units | 19,680 (59.6%) | 13,361 (40.4%) |
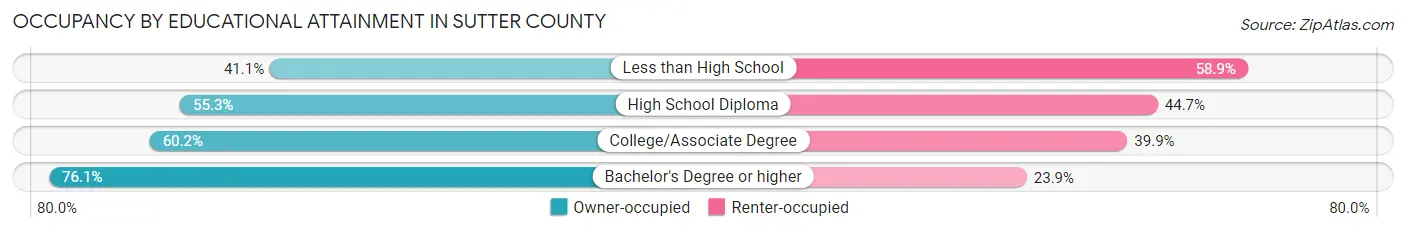
Occupancy by Educational Attainment in Sutter County
| Household Size | Owner-occupied | Renter-occupied |
| Less than High School | 2,271 (41.1%) | 3,257 (58.9%) |
| High School Diploma | 4,012 (55.3%) | 3,241 (44.7%) |
| College/Associate Degree | 7,624 (60.2%) | 5,050 (39.9%) |
| Bachelor's Degree or higher | 5,773 (76.1%) | 1,813 (23.9%) |
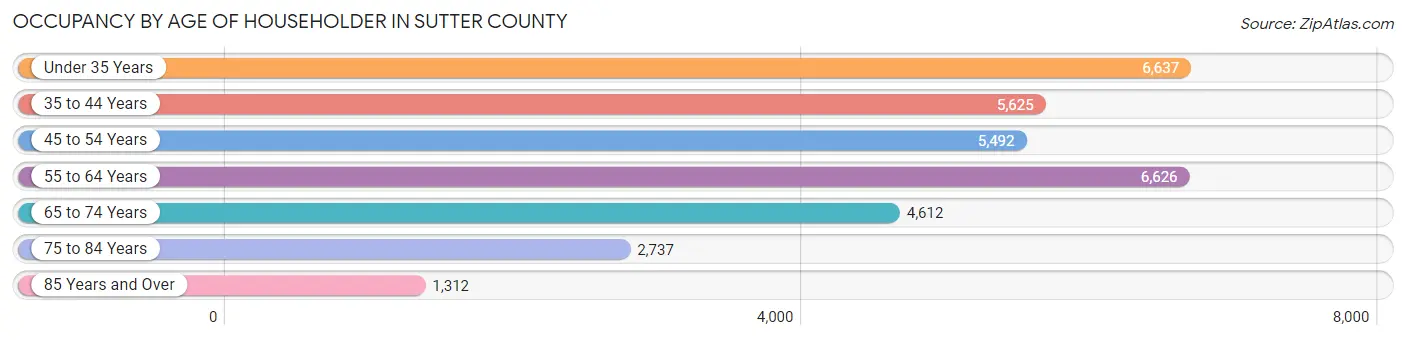
Occupancy by Age of Householder in Sutter County
| Age Bracket | # Households | % Households |
| Under 35 Years | 6,637 | 20.1% |
| 35 to 44 Years | 5,625 | 17.0% |
| 45 to 54 Years | 5,492 | 16.6% |
| 55 to 64 Years | 6,626 | 20.1% |
| 65 to 74 Years | 4,612 | 14.0% |
| 75 to 84 Years | 2,737 | 8.3% |
| 85 Years and Over | 1,312 | 4.0% |
| Total | 33,041 | 100.0% |
Housing Finances in Sutter County
Median Income by Occupancy in Sutter County
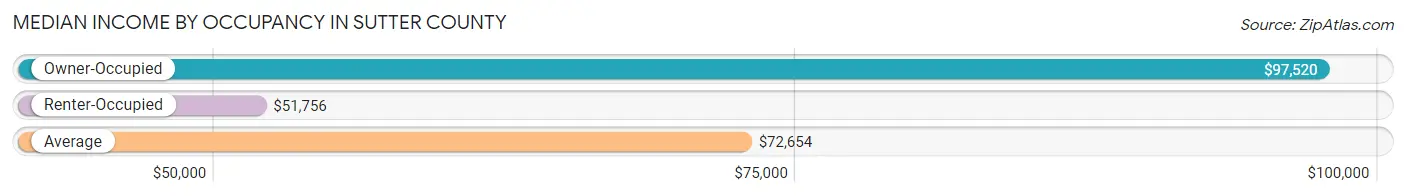
| Occupancy Type | # Households | Median Income |
| Owner-Occupied | 19,680 (59.6%) | $97,520 |
| Renter-Occupied | 13,361 (40.4%) | $51,756 |
| Average | 33,041 (100.0%) | $72,654 |
Occupancy by Householder Income Bracket in Sutter County
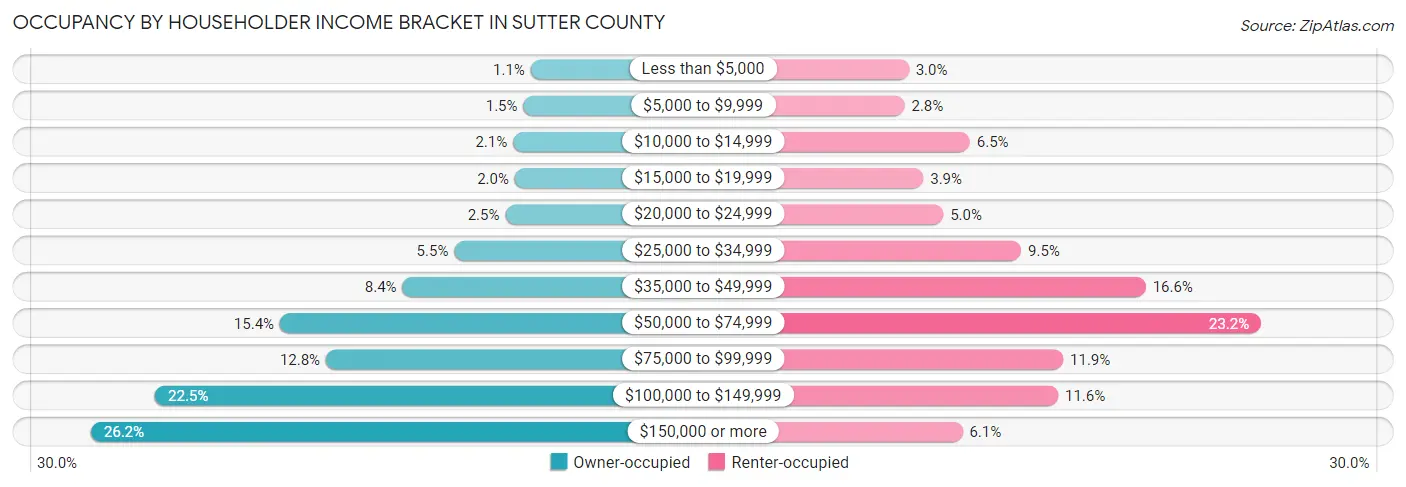
| Income Bracket | Owner-occupied | Renter-occupied |
| Less than $5,000 | 212 (1.1%) | 406 (3.0%) |
| $5,000 to $9,999 | 295 (1.5%) | 374 (2.8%) |
| $10,000 to $14,999 | 412 (2.1%) | 873 (6.5%) |
| $15,000 to $19,999 | 392 (2.0%) | 517 (3.9%) |
| $20,000 to $24,999 | 498 (2.5%) | 669 (5.0%) |
| $25,000 to $34,999 | 1,073 (5.4%) | 1,264 (9.5%) |
| $35,000 to $49,999 | 1,655 (8.4%) | 2,215 (16.6%) |
| $50,000 to $74,999 | 3,033 (15.4%) | 3,096 (23.2%) |
| $75,000 to $99,999 | 2,516 (12.8%) | 1,585 (11.9%) |
| $100,000 to $149,999 | 4,435 (22.5%) | 1,546 (11.6%) |
| $150,000 or more | 5,159 (26.2%) | 816 (6.1%) |
| Total | 19,680 (100.0%) | 13,361 (100.0%) |
Monthly Housing Cost Tiers in Sutter County
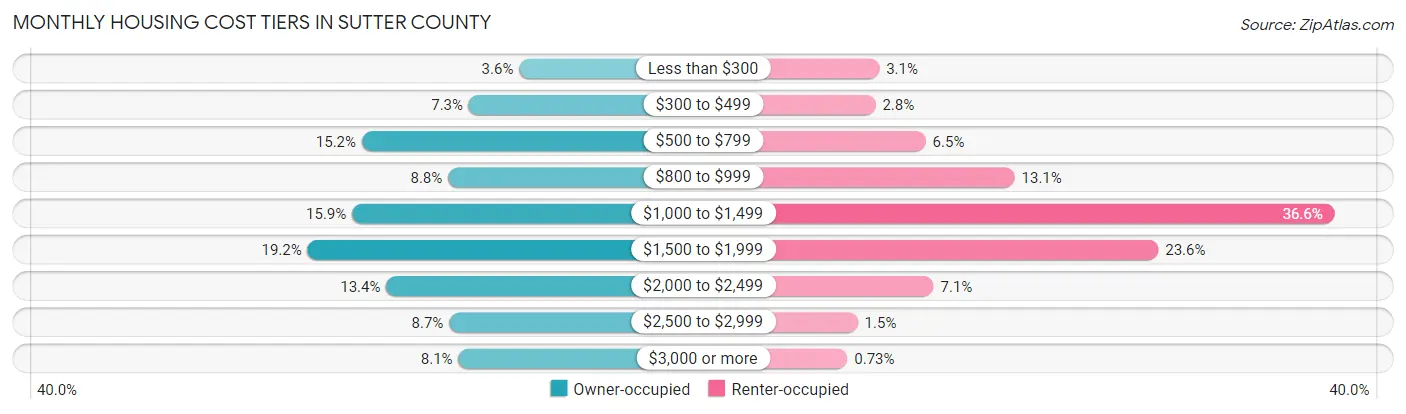
| Monthly Cost | Owner-occupied | Renter-occupied |
| Less than $300 | 702 (3.6%) | 412 (3.1%) |
| $300 to $499 | 1,432 (7.3%) | 374 (2.8%) |
| $500 to $799 | 2,983 (15.2%) | 869 (6.5%) |
| $800 to $999 | 1,734 (8.8%) | 1,744 (13.1%) |
| $1,000 to $1,499 | 3,125 (15.9%) | 4,893 (36.6%) |
| $1,500 to $1,999 | 3,771 (19.2%) | 3,157 (23.6%) |
| $2,000 to $2,499 | 2,630 (13.4%) | 946 (7.1%) |
| $2,500 to $2,999 | 1,719 (8.7%) | 199 (1.5%) |
| $3,000 or more | 1,584 (8.1%) | 97 (0.7%) |
| Total | 19,680 (100.0%) | 13,361 (100.0%) |
Physical Housing Characteristics in Sutter County
Housing Structures in Sutter County
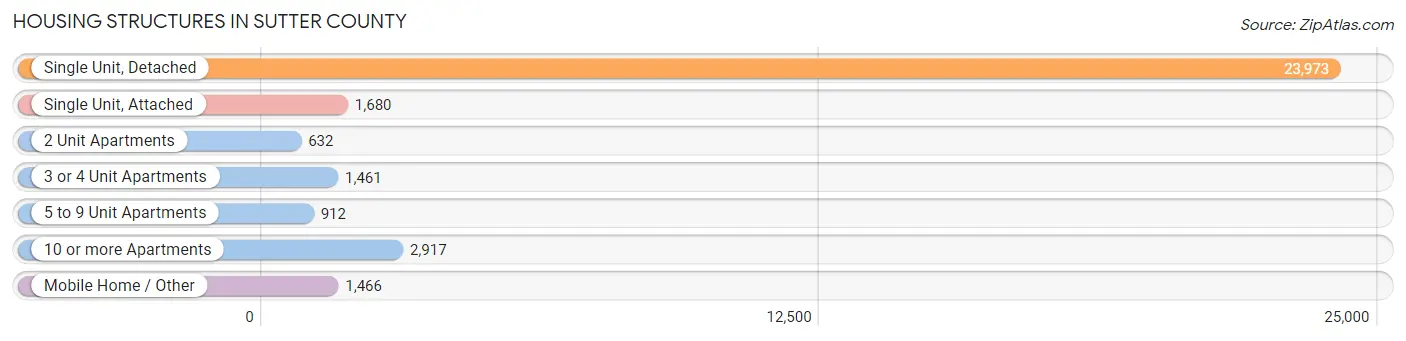
| Structure Type | # Housing Units | % Housing Units |
| Single Unit, Detached | 23,973 | 72.6% |
| Single Unit, Attached | 1,680 | 5.1% |
| 2 Unit Apartments | 632 | 1.9% |
| 3 or 4 Unit Apartments | 1,461 | 4.4% |
| 5 to 9 Unit Apartments | 912 | 2.8% |
| 10 or more Apartments | 2,917 | 8.8% |
| Mobile Home / Other | 1,466 | 4.4% |
| Total | 33,041 | 100.0% |
Housing Structures by Occupancy in Sutter County
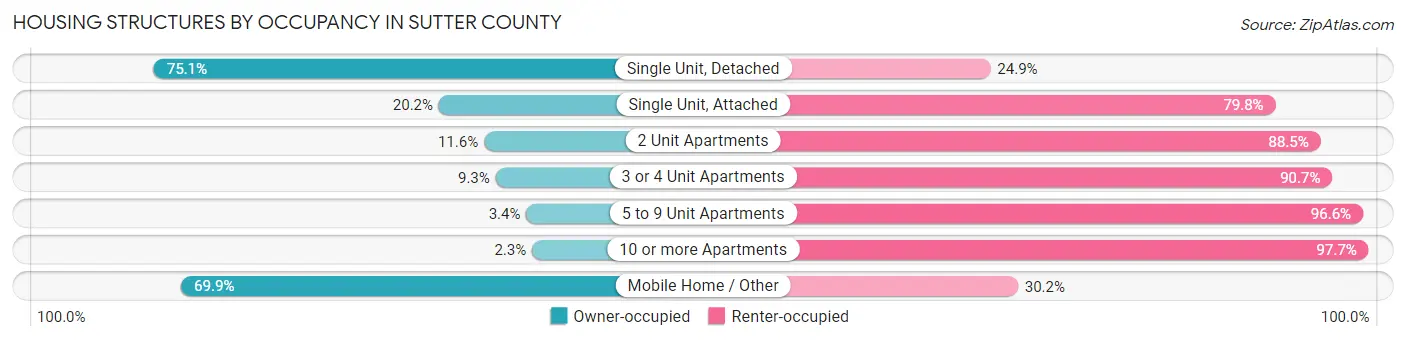
| Structure Type | Owner-occupied | Renter-occupied |
| Single Unit, Detached | 18,009 (75.1%) | 5,964 (24.9%) |
| Single Unit, Attached | 340 (20.2%) | 1,340 (79.8%) |
| 2 Unit Apartments | 73 (11.6%) | 559 (88.4%) |
| 3 or 4 Unit Apartments | 136 (9.3%) | 1,325 (90.7%) |
| 5 to 9 Unit Apartments | 31 (3.4%) | 881 (96.6%) |
| 10 or more Apartments | 67 (2.3%) | 2,850 (97.7%) |
| Mobile Home / Other | 1,024 (69.9%) | 442 (30.1%) |
| Total | 19,680 (59.6%) | 13,361 (40.4%) |
Housing Structures by Number of Rooms in Sutter County
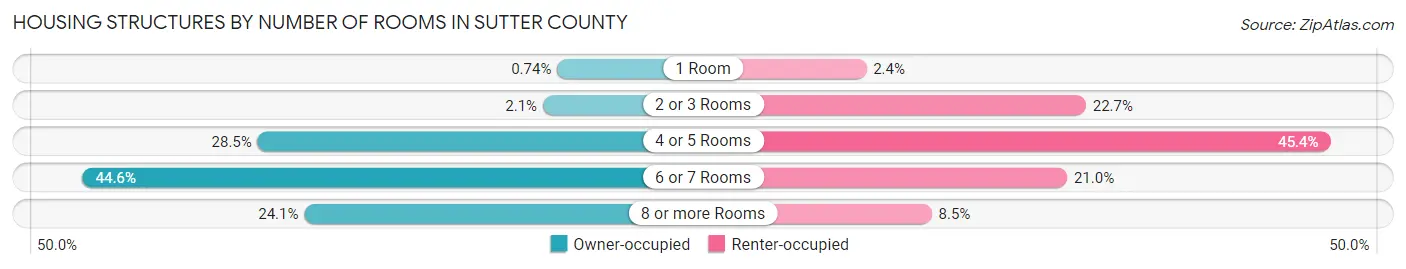
| Number of Rooms | Owner-occupied | Renter-occupied |
| 1 Room | 145 (0.7%) | 325 (2.4%) |
| 2 or 3 Rooms | 406 (2.1%) | 3,038 (22.7%) |
| 4 or 5 Rooms | 5,598 (28.4%) | 6,059 (45.4%) |
| 6 or 7 Rooms | 8,783 (44.6%) | 2,806 (21.0%) |
| 8 or more Rooms | 4,748 (24.1%) | 1,133 (8.5%) |
| Total | 19,680 (100.0%) | 13,361 (100.0%) |
Housing Structure by Heating Type in Sutter County
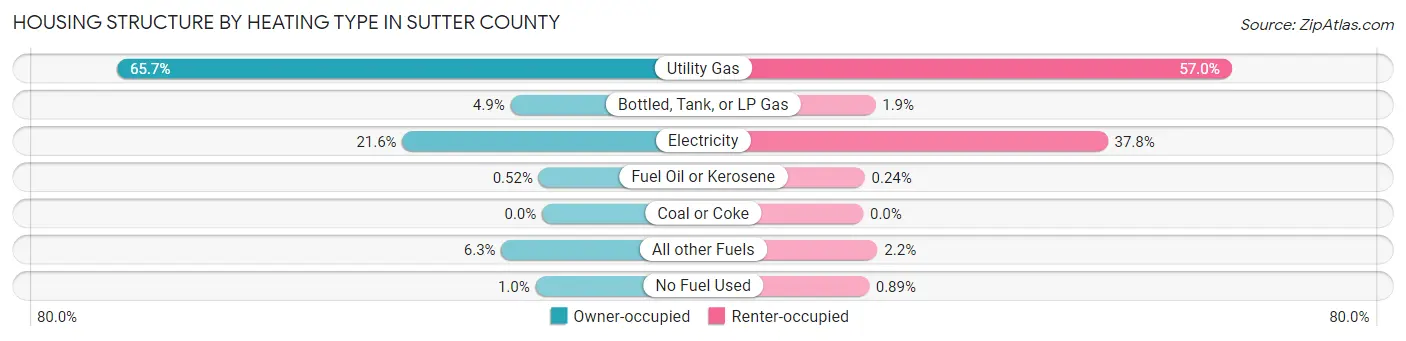
| Heating Type | Owner-occupied | Renter-occupied |
| Utility Gas | 12,931 (65.7%) | 7,610 (57.0%) |
| Bottled, Tank, or LP Gas | 962 (4.9%) | 253 (1.9%) |
| Electricity | 4,248 (21.6%) | 5,050 (37.8%) |
| Fuel Oil or Kerosene | 103 (0.5%) | 32 (0.2%) |
| Coal or Coke | 0 (0.0%) | 0 (0.0%) |
| All other Fuels | 1,237 (6.3%) | 297 (2.2%) |
| No Fuel Used | 199 (1.0%) | 119 (0.9%) |
| Total | 19,680 (100.0%) | 13,361 (100.0%) |
Household Vehicle Usage in Sutter County
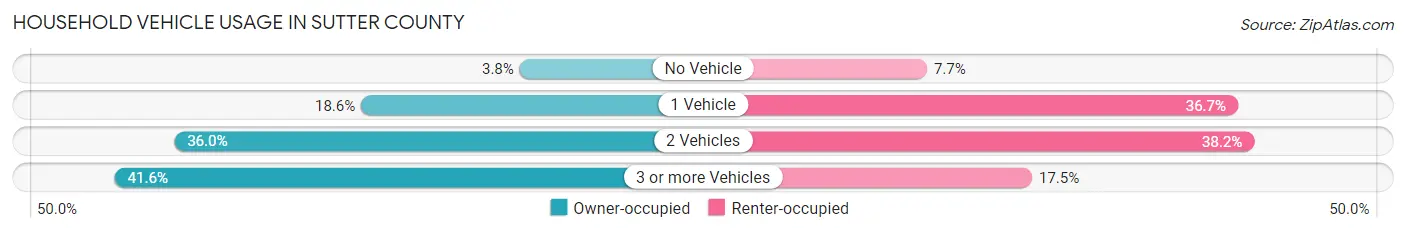
| Vehicles per Household | Owner-occupied | Renter-occupied |
| No Vehicle | 746 (3.8%) | 1,024 (7.7%) |
| 1 Vehicle | 3,658 (18.6%) | 4,899 (36.7%) |
| 2 Vehicles | 7,091 (36.0%) | 5,104 (38.2%) |
| 3 or more Vehicles | 8,185 (41.6%) | 2,334 (17.5%) |
| Total | 19,680 (100.0%) | 13,361 (100.0%) |
Real Estate & Mortgages in Sutter County
Real Estate and Mortgage Overview in Sutter County
| Characteristic | Without Mortgage | With Mortgage |
| Housing Units | 6,987 | 12,693 |
| Median Property Value | $352,500 | $385,500 |
| Median Household Income | $77,449 | $3,727 |
| Monthly Housing Costs | $633 | $1,567 |
| Real Estate Taxes | $2,610 | $163 |
Property Value by Mortgage Status in Sutter County
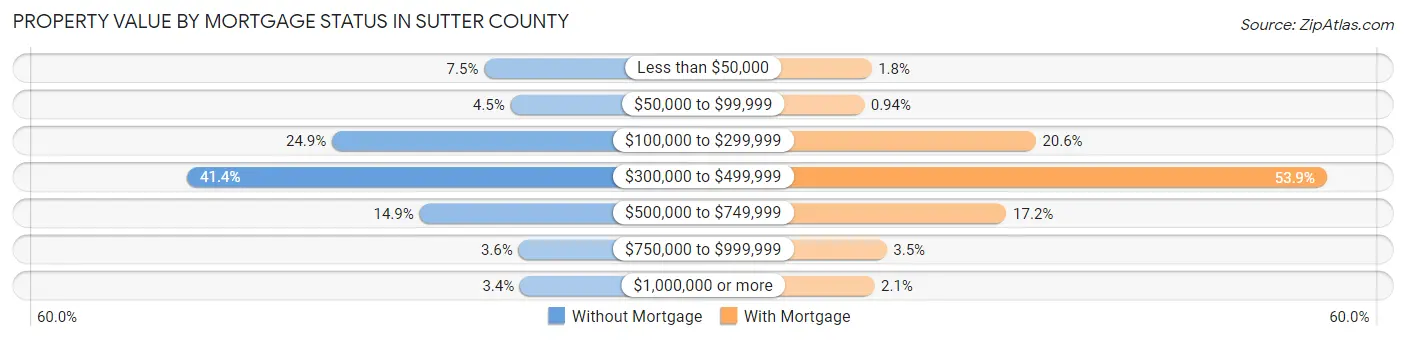
| Property Value | Without Mortgage | With Mortgage |
| Less than $50,000 | 522 (7.5%) | 227 (1.8%) |
| $50,000 to $99,999 | 312 (4.5%) | 119 (0.9%) |
| $100,000 to $299,999 | 1,737 (24.9%) | 2,610 (20.6%) |
| $300,000 to $499,999 | 2,894 (41.4%) | 6,837 (53.9%) |
| $500,000 to $749,999 | 1,038 (14.9%) | 2,184 (17.2%) |
| $750,000 to $999,999 | 248 (3.5%) | 447 (3.5%) |
| $1,000,000 or more | 236 (3.4%) | 269 (2.1%) |
| Total | 6,987 (100.0%) | 12,693 (100.0%) |
Household Income by Mortgage Status in Sutter County
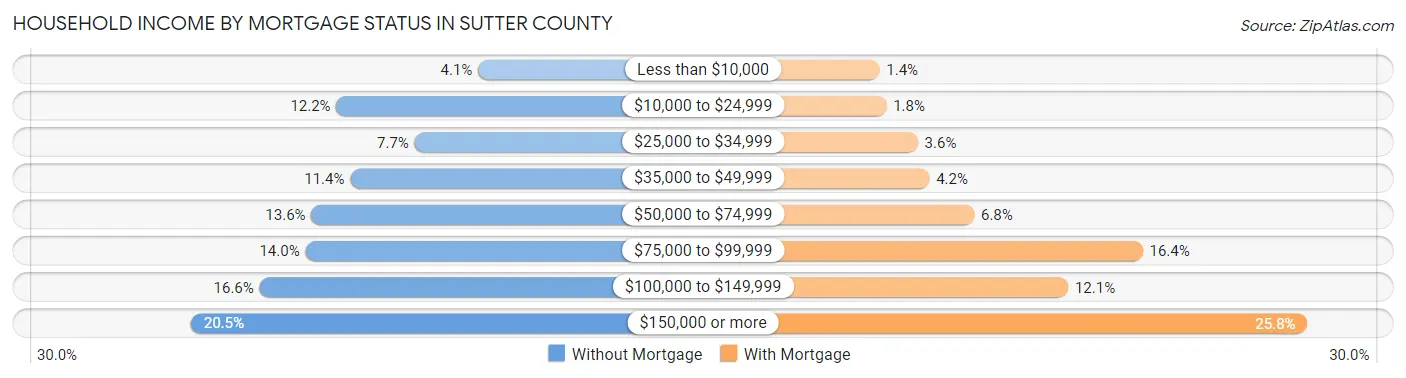
| Household Income | Without Mortgage | With Mortgage |
| Less than $10,000 | 285 (4.1%) | 173 (1.4%) |
| $10,000 to $24,999 | 851 (12.2%) | 222 (1.8%) |
| $25,000 to $34,999 | 539 (7.7%) | 451 (3.5%) |
| $35,000 to $49,999 | 796 (11.4%) | 534 (4.2%) |
| $50,000 to $74,999 | 951 (13.6%) | 859 (6.8%) |
| $75,000 to $99,999 | 975 (14.0%) | 2,082 (16.4%) |
| $100,000 to $149,999 | 1,158 (16.6%) | 1,541 (12.1%) |
| $150,000 or more | 1,432 (20.5%) | 3,277 (25.8%) |
| Total | 6,987 (100.0%) | 12,693 (100.0%) |
Property Value to Household Income Ratio in Sutter County
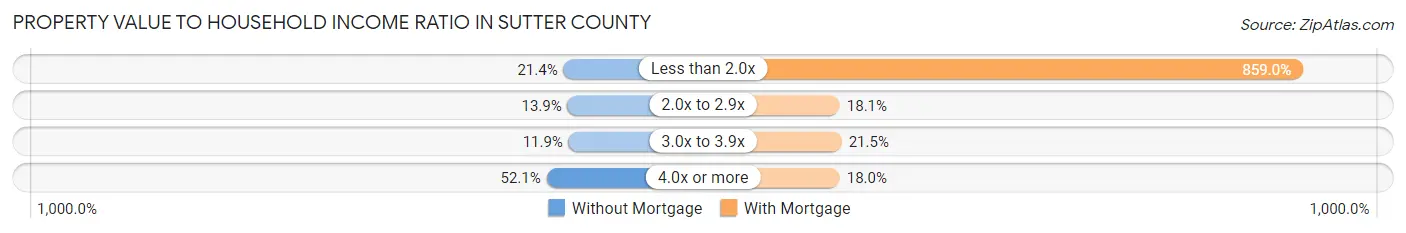
| Value-to-Income Ratio | Without Mortgage | With Mortgage |
| Less than 2.0x | 1,492 (21.3%) | 109,038 (859.0%) |
| 2.0x to 2.9x | 974 (13.9%) | 2,296 (18.1%) |
| 3.0x to 3.9x | 830 (11.9%) | 2,726 (21.5%) |
| 4.0x or more | 3,639 (52.1%) | 2,286 (18.0%) |
| Total | 6,987 (100.0%) | 12,693 (100.0%) |
Real Estate Taxes by Mortgage Status in Sutter County
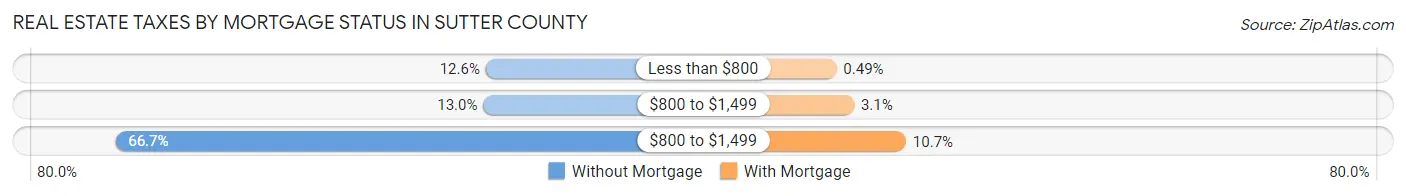
| Property Taxes | Without Mortgage | With Mortgage |
| Less than $800 | 882 (12.6%) | 62 (0.5%) |
| $800 to $1,499 | 907 (13.0%) | 388 (3.1%) |
| $800 to $1,499 | 4,663 (66.7%) | 1,352 (10.6%) |
| Total | 6,987 (100.0%) | 12,693 (100.0%) |
Health & Disability in Sutter County
Health Insurance Coverage by Age in Sutter County
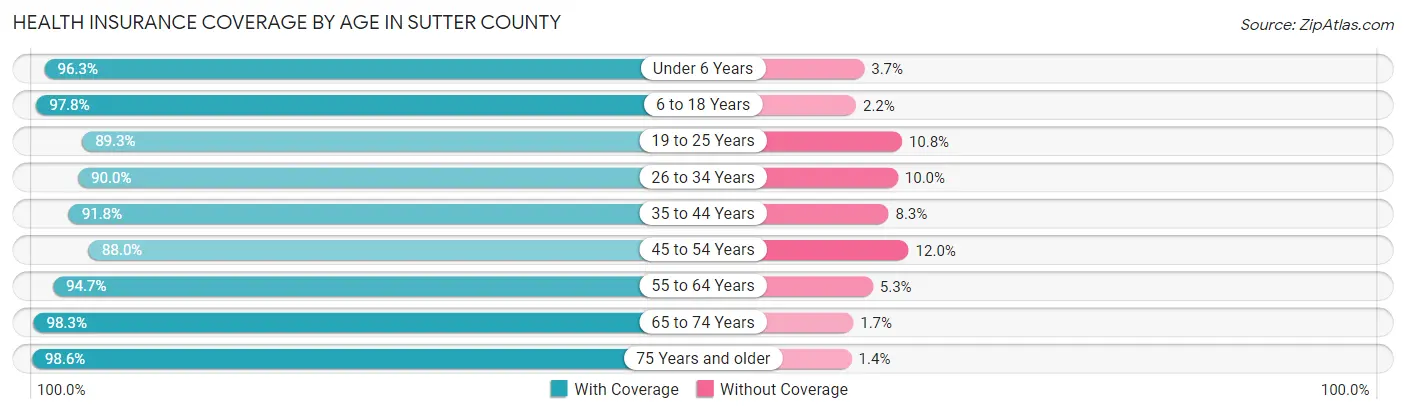
| Age Bracket | With Coverage | Without Coverage |
| Under 6 Years | 7,693 (96.3%) | 298 (3.7%) |
| 6 to 18 Years | 18,445 (97.8%) | 413 (2.2%) |
| 19 to 25 Years | 7,432 (89.2%) | 895 (10.7%) |
| 26 to 34 Years | 10,765 (90.0%) | 1,195 (10.0%) |
| 35 to 44 Years | 11,167 (91.7%) | 1,004 (8.3%) |
| 45 to 54 Years | 9,925 (88.0%) | 1,353 (12.0%) |
| 55 to 64 Years | 11,278 (94.7%) | 634 (5.3%) |
| 65 to 74 Years | 8,522 (98.3%) | 146 (1.7%) |
| 75 Years and older | 6,410 (98.6%) | 89 (1.4%) |
| Total | 91,637 (93.8%) | 6,027 (6.2%) |
Health Insurance Coverage by Citizenship Status in Sutter County
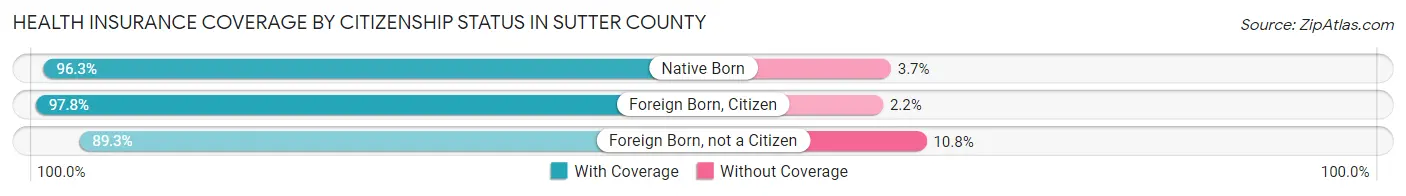
| Citizenship Status | With Coverage | Without Coverage |
| Native Born | 7,693 (96.3%) | 298 (3.7%) |
| Foreign Born, Citizen | 18,445 (97.8%) | 413 (2.2%) |
| Foreign Born, not a Citizen | 7,432 (89.2%) | 895 (10.7%) |
Health Insurance Coverage by Household Income in Sutter County
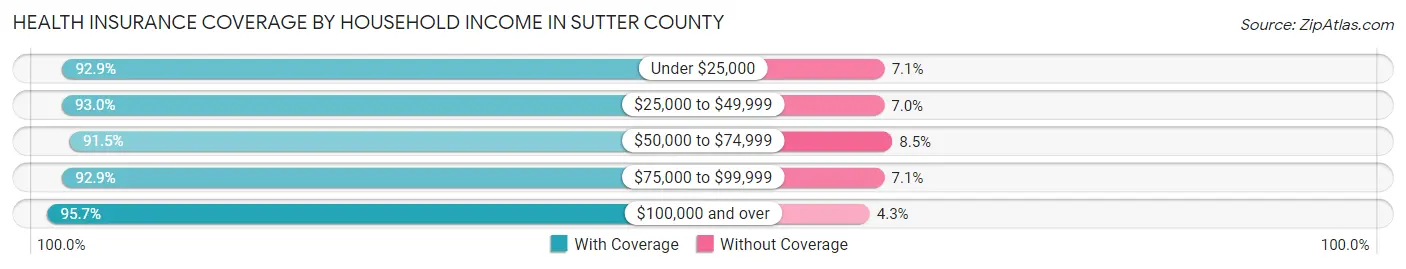
| Household Income | With Coverage | Without Coverage |
| Under $25,000 | 8,713 (92.9%) | 666 (7.1%) |
| $25,000 to $49,999 | 14,324 (93.0%) | 1,083 (7.0%) |
| $50,000 to $74,999 | 17,157 (91.5%) | 1,602 (8.5%) |
| $75,000 to $99,999 | 11,177 (92.9%) | 851 (7.1%) |
| $100,000 and over | 39,952 (95.7%) | 1,805 (4.3%) |
Public vs Private Health Insurance Coverage by Age in Sutter County
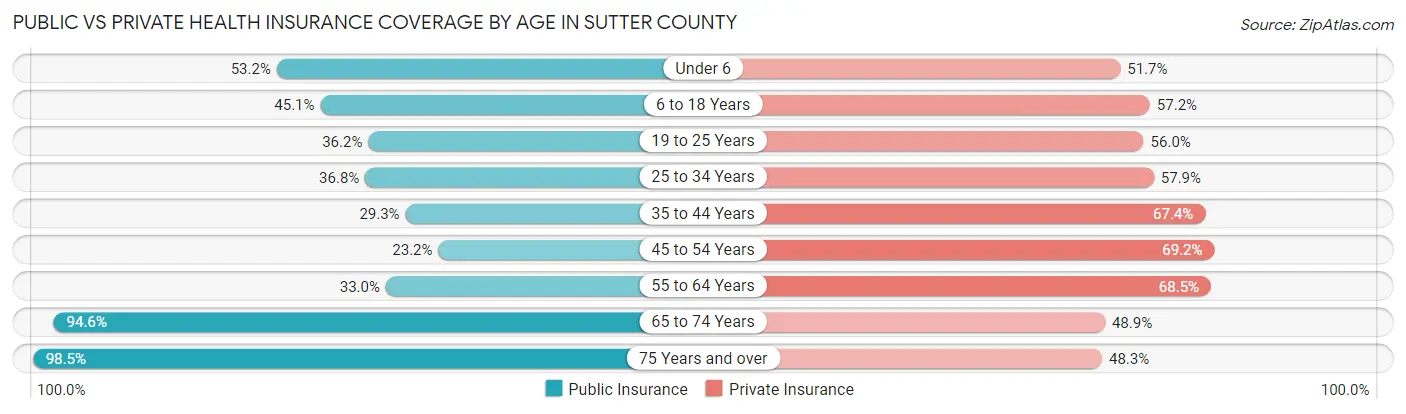
| Age Bracket | Public Insurance | Private Insurance |
| Under 6 | 4,251 (53.2%) | 4,131 (51.7%) |
| 6 to 18 Years | 8,505 (45.1%) | 10,784 (57.2%) |
| 19 to 25 Years | 3,016 (36.2%) | 4,666 (56.0%) |
| 25 to 34 Years | 4,400 (36.8%) | 6,927 (57.9%) |
| 35 to 44 Years | 3,567 (29.3%) | 8,208 (67.4%) |
| 45 to 54 Years | 2,617 (23.2%) | 7,799 (69.2%) |
| 55 to 64 Years | 3,926 (33.0%) | 8,161 (68.5%) |
| 65 to 74 Years | 8,201 (94.6%) | 4,234 (48.8%) |
| 75 Years and over | 6,401 (98.5%) | 3,139 (48.3%) |
| Total | 44,884 (46.0%) | 58,049 (59.4%) |
Disability Status by Sex by Age in Sutter County
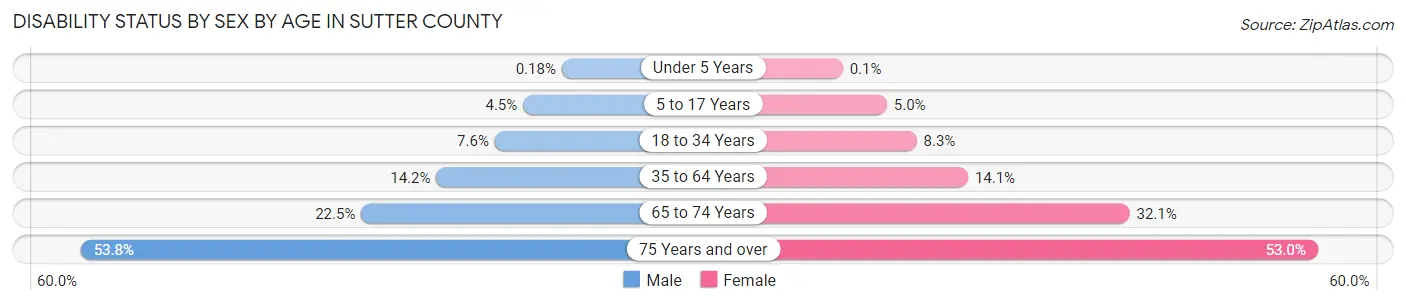
| Age Bracket | Male | Female |
| Under 5 Years | 6 (0.2%) | 3 (0.1%) |
| 5 to 17 Years | 443 (4.5%) | 453 (5.0%) |
| 18 to 34 Years | 844 (7.6%) | 904 (8.3%) |
| 35 to 64 Years | 2,515 (14.1%) | 2,472 (14.1%) |
| 65 to 74 Years | 939 (22.5%) | 1,441 (32.1%) |
| 75 Years and over | 1,476 (53.7%) | 1,989 (53.0%) |
Disability Class by Sex by Age in Sutter County
Disability Class: Hearing Difficulty
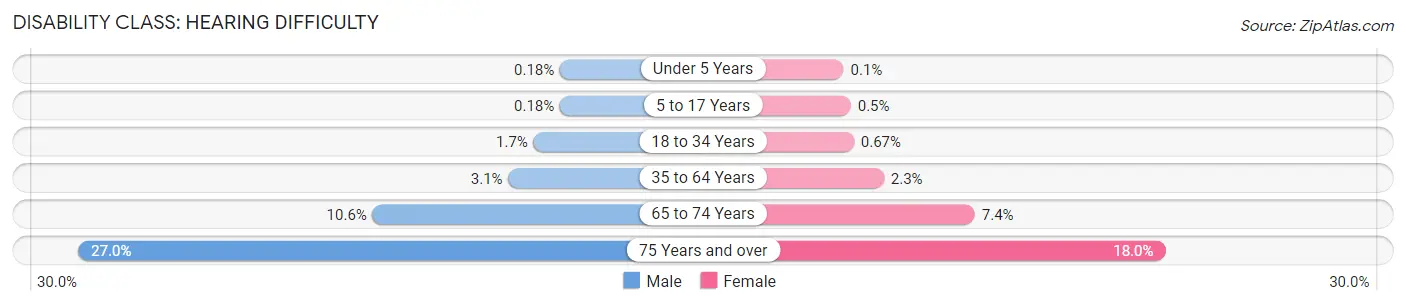
| Age Bracket | Male | Female |
| Under 5 Years | 6 (0.2%) | 3 (0.1%) |
| 5 to 17 Years | 18 (0.2%) | 45 (0.5%) |
| 18 to 34 Years | 182 (1.7%) | 73 (0.7%) |
| 35 to 64 Years | 544 (3.1%) | 411 (2.3%) |
| 65 to 74 Years | 443 (10.6%) | 333 (7.4%) |
| 75 Years and over | 742 (27.0%) | 676 (18.0%) |
Disability Class: Vision Difficulty
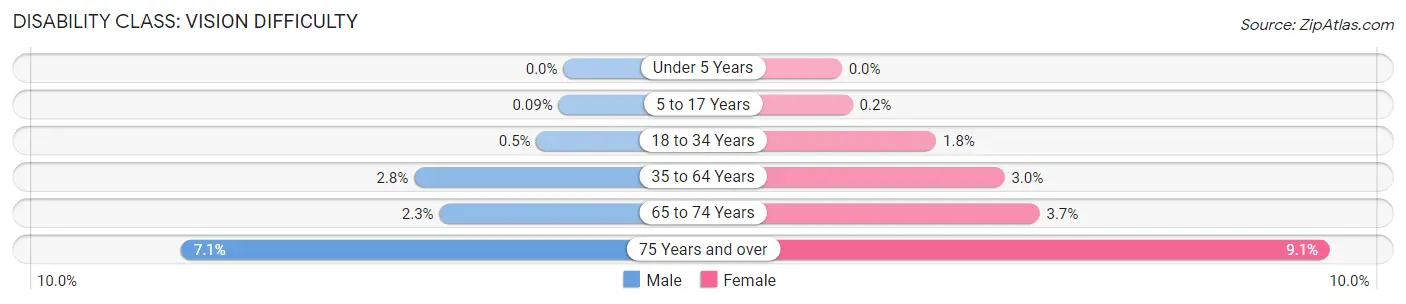
| Age Bracket | Male | Female |
| Under 5 Years | 0 (0.0%) | 0 (0.0%) |
| 5 to 17 Years | 9 (0.1%) | 18 (0.2%) |
| 18 to 34 Years | 55 (0.5%) | 190 (1.8%) |
| 35 to 64 Years | 493 (2.8%) | 532 (3.0%) |
| 65 to 74 Years | 96 (2.3%) | 165 (3.7%) |
| 75 Years and over | 195 (7.1%) | 340 (9.1%) |
Disability Class: Cognitive Difficulty
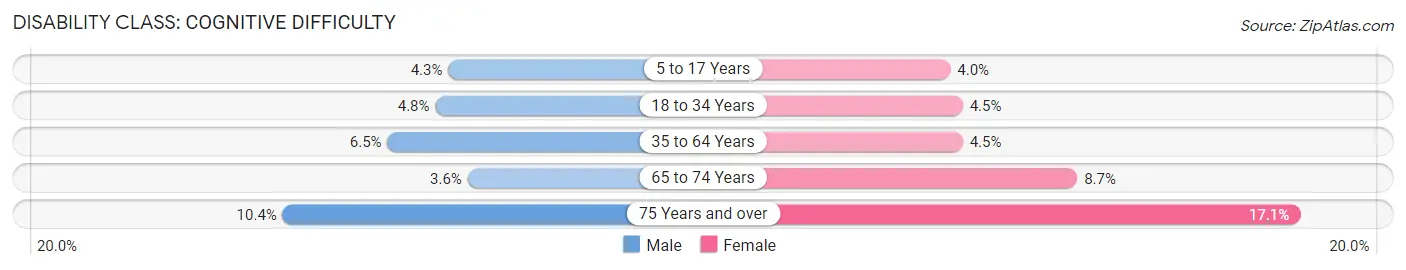
| Age Bracket | Male | Female |
| 5 to 17 Years | 422 (4.3%) | 364 (4.0%) |
| 18 to 34 Years | 525 (4.8%) | 487 (4.5%) |
| 35 to 64 Years | 1,160 (6.5%) | 789 (4.5%) |
| 65 to 74 Years | 148 (3.5%) | 393 (8.7%) |
| 75 Years and over | 286 (10.4%) | 640 (17.1%) |
Disability Class: Ambulatory Difficulty
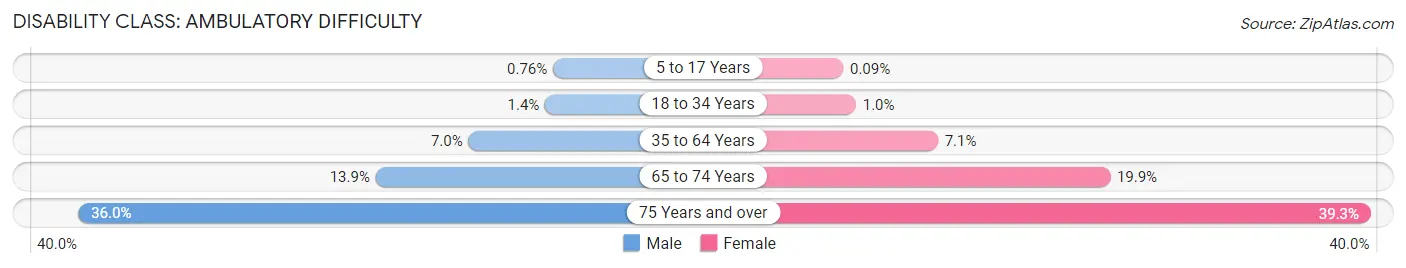
| Age Bracket | Male | Female |
| 5 to 17 Years | 75 (0.8%) | 8 (0.1%) |
| 18 to 34 Years | 149 (1.3%) | 113 (1.0%) |
| 35 to 64 Years | 1,252 (7.0%) | 1,253 (7.1%) |
| 65 to 74 Years | 581 (13.9%) | 895 (19.9%) |
| 75 Years and over | 989 (36.0%) | 1,474 (39.3%) |
Disability Class: Self-Care Difficulty
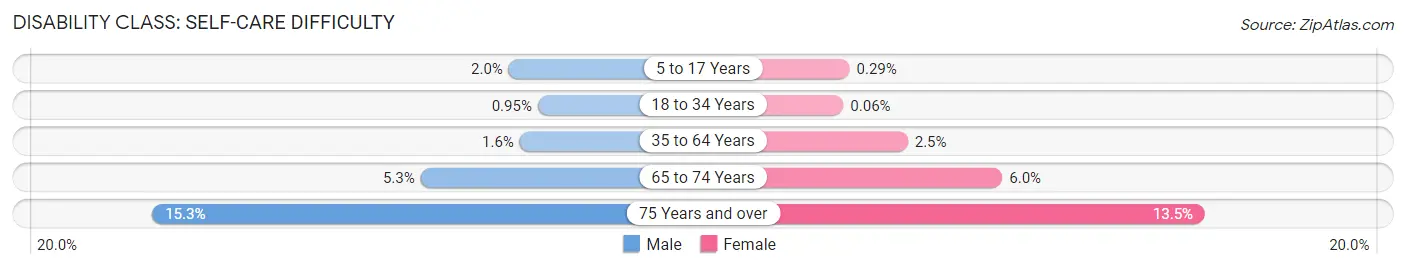
| Age Bracket | Male | Female |
| 5 to 17 Years | 201 (2.0%) | 26 (0.3%) |
| 18 to 34 Years | 105 (0.9%) | 7 (0.1%) |
| 35 to 64 Years | 288 (1.6%) | 431 (2.5%) |
| 65 to 74 Years | 221 (5.3%) | 268 (6.0%) |
| 75 Years and over | 419 (15.3%) | 506 (13.5%) |
Technology Access in Sutter County
Computing Device Access in Sutter County
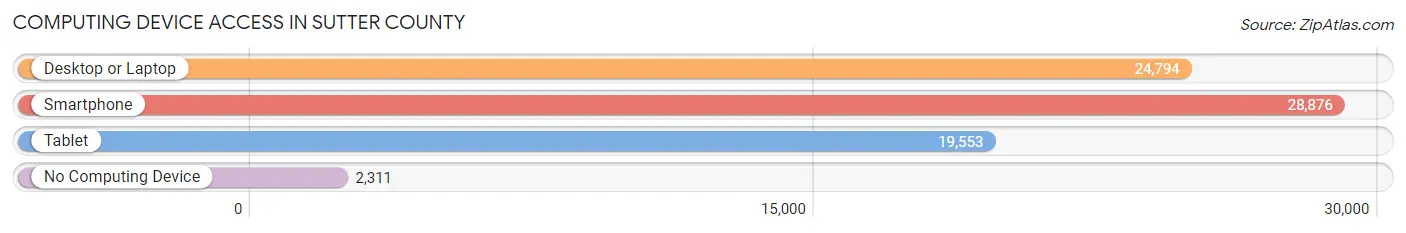
| Device Type | # Households | % Households |
| Desktop or Laptop | 24,794 | 75.0% |
| Smartphone | 28,876 | 87.4% |
| Tablet | 19,553 | 59.2% |
| No Computing Device | 2,311 | 7.0% |
| Total | 33,041 | 100.0% |
Internet Access in Sutter County
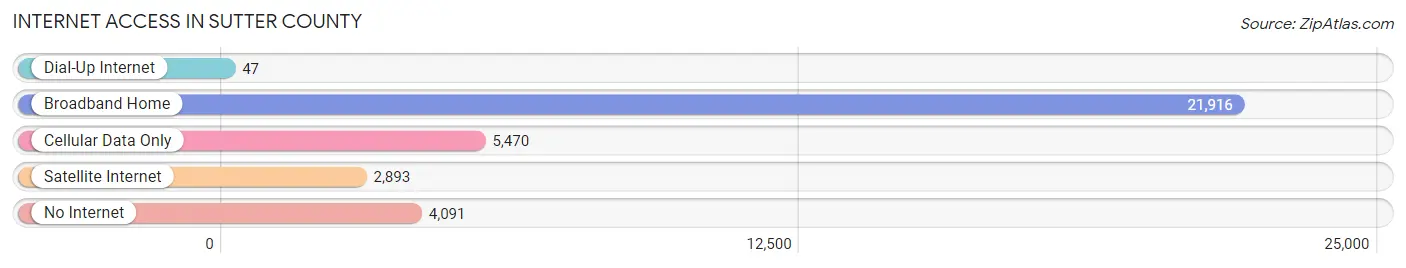
| Internet Type | # Households | % Households |
| Dial-Up Internet | 47 | 0.1% |
| Broadband Home | 21,916 | 66.3% |
| Cellular Data Only | 5,470 | 16.6% |
| Satellite Internet | 2,893 | 8.8% |
| No Internet | 4,091 | 12.4% |
| Total | 33,041 | 100.0% |
Sutter County Summary
Sutter County is located in the Central Valley of California, and is part of the Sacramento-San Joaquin Delta region. It is bordered by Yuba County to the north, Colusa County to the east, and Yolo County to the south. The county seat is Yuba City, and the largest city is Yuba City. The county has a total area of 644 square miles, and a population of 94,737 as of the 2010 census.
History
Sutter County was established in 1850, and was named after John Sutter, a Swiss immigrant who established a trading post in the area in 1839. Sutter County was one of the original counties of California, and was formed from parts of Yuba and Colusa Counties.
The county was originally inhabited by the Maidu and Miwok Native American tribes. The first European settlers in the area were trappers and fur traders, who were followed by gold miners during the California Gold Rush of 1849.
Geography
Sutter County is located in the Central Valley of California, and is part of the Sacramento-San Joaquin Delta region. It is bordered by Yuba County to the north, Colusa County to the east, and Yolo County to the south. The county has a total area of 644 square miles, and is mostly flat, with some rolling hills in the northern part of the county.
The Feather River is the main waterway in the county, and is used for irrigation and recreation. The county is also home to several lakes, including Lake Sutter, which is a popular destination for fishing and boating.
Economy
Agriculture is the main economic activity in Sutter County, and the county is one of the top agricultural producers in the state. The main crops grown in the county are rice, tomatoes, almonds, walnuts, and grapes. Livestock production is also important, and the county is home to several large dairy farms.
The county is also home to several manufacturing companies, including a large food processing plant and a paper mill. The county is also home to several military bases, including Beale Air Force Base and the Yuba City Army Depot.
Demographics
As of the 2010 census, Sutter County had a population of 94,737. The racial makeup of the county was 68.3% White, 5.2% African American, 1.2% Native American, 8.2% Asian, 0.3% Pacific Islander, 11.7% from other races, and 5.3% from two or more races. Hispanic or Latino of any race were 24.2% of the population.
The median household income in the county was $50,845, and the median family income was $58,945. The per capita income was $22,845. About 13.2% of the population was below the poverty line.
Common Questions
What is Per Capita Income in Sutter County?
Per Capita income in Sutter County is $34,039.
What is the Median Family Income in Sutter County?
Median Family Income in Sutter County is $83,847.
What is the Median Household income in Sutter County?
Median Household Income in Sutter County is $72,654.
What is Income or Wage Gap in Sutter County?
Income or Wage Gap in Sutter County is 29.3%.
Women in Sutter County earn 70.7 cents for every dollar earned by a man.
What is Family Income Deficit in Sutter County?
Family Income Deficit in Sutter County is $10,795.
Families that are below poverty line in Sutter County earn $10,795 less on average than the poverty threshold level.
What is Inequality or Gini Index in Sutter County?
Inequality or Gini Index in Sutter County is 0.46.
What is the Total Population of Sutter County?
Total Population of Sutter County is 99,101.
What is the Total Male Population of Sutter County?
Total Male Population of Sutter County is 49,828.
What is the Total Female Population of Sutter County?
Total Female Population of Sutter County is 49,273.
What is the Ratio of Males per 100 Females in Sutter County?
There are 101.13 Males per 100 Females in Sutter County.
What is the Ratio of Females per 100 Males in Sutter County?
There are 98.89 Females per 100 Males in Sutter County.
What is the Median Population Age in Sutter County?
Median Population Age in Sutter County is 36.0 Years.
What is the Average Family Size in Sutter County
Average Family Size in Sutter County is 3.5 People.
What is the Average Household Size in Sutter County
Average Household Size in Sutter County is 3.0 People.
How Large is the Labor Force in Sutter County?
There are 46,503 People in the Labor Forcein in Sutter County.
What is the Percentage of People in the Labor Force in Sutter County?
60.6% of People are in the Labor Force in Sutter County.
What is the Unemployment Rate in Sutter County?
Unemployment Rate in Sutter County is 7.6%.