Sonoma County, CA Map & Demographics
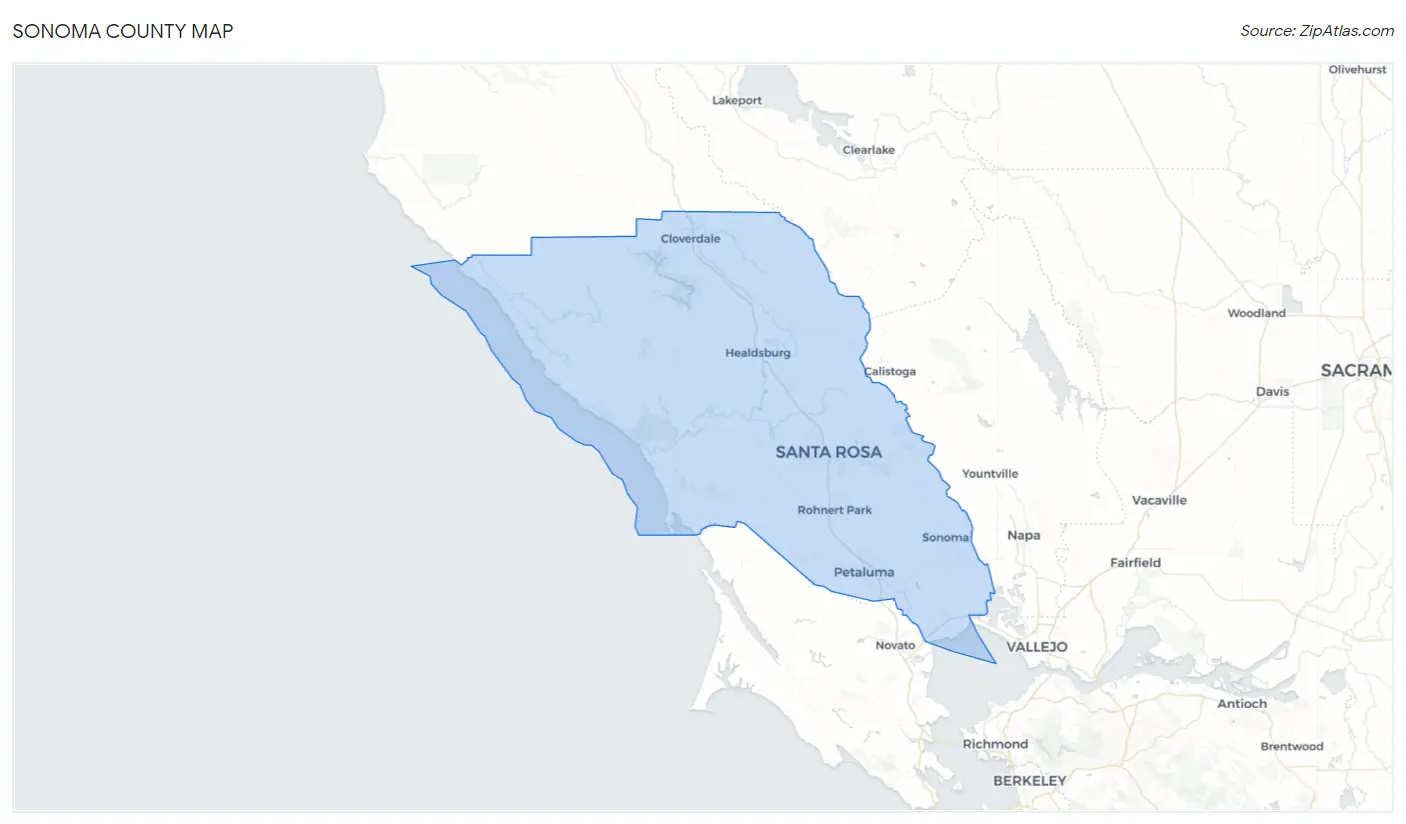
Sonoma County Map
Sonoma County Overview
$52,523
PER CAPITA INCOME
$119,780
AVG FAMILY INCOME
$99,266
AVG HOUSEHOLD INCOME
24.3%
WAGE / INCOME GAP [ % ]
75.7¢/ $1
WAGE / INCOME GAP [ $ ]
$11,105
FAMILY INCOME DEFICIT
0.46
INEQUALITY / GINI INDEX
488,436
TOTAL POPULATION
240,478
MALE POPULATION
247,958
FEMALE POPULATION
96.98
MALES / 100 FEMALES
103.11
FEMALES / 100 MALES
42.7
MEDIAN AGE
3.1
AVG FAMILY SIZE
2.5
AVG HOUSEHOLD SIZE
262,343
LABOR FORCE [ PEOPLE ]
64.6%
PERCENT IN LABOR FORCE
5.2%
UNEMPLOYMENT RATE
Sonoma County Area Codes
Income in Sonoma County
Income Overview in Sonoma County
Per Capita Income in Sonoma County is $52,523, while median incomes of families and households are $119,780 and $99,266 respectively.
| Characteristic | Number | Measure |
| Per Capita Income | 488,436 | $52,523 |
| Median Family Income | 120,088 | $119,780 |
| Mean Family Income | 120,088 | $153,473 |
| Median Household Income | 189,653 | $99,266 |
| Mean Household Income | 189,653 | $133,119 |
| Income Deficit | 120,088 | $11,105 |
| Wage / Income Gap (%) | 488,436 | 24.27% |
| Wage / Income Gap ($) | 488,436 | 75.73¢ per $1 |
| Gini / Inequality Index | 488,436 | 0.46 |
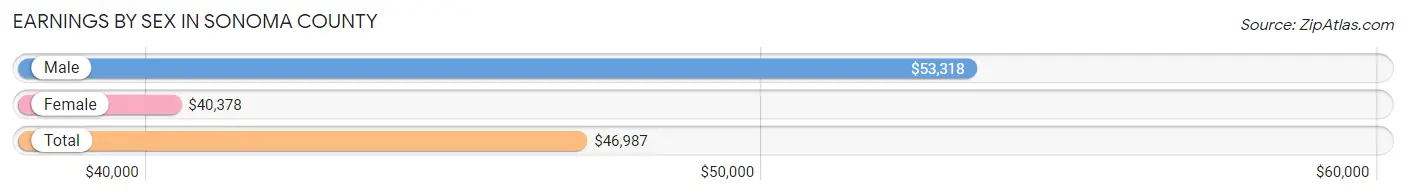
Earnings by Sex in Sonoma County
Average Earnings in Sonoma County are $46,987, $53,318 for men and $40,378 for women, a difference of 24.3%.
| Sex | Number | Average Earnings |
| Male | 143,976 (52.6%) | $53,318 |
| Female | 129,863 (47.4%) | $40,378 |
| Total | 273,839 (100.0%) | $46,987 |
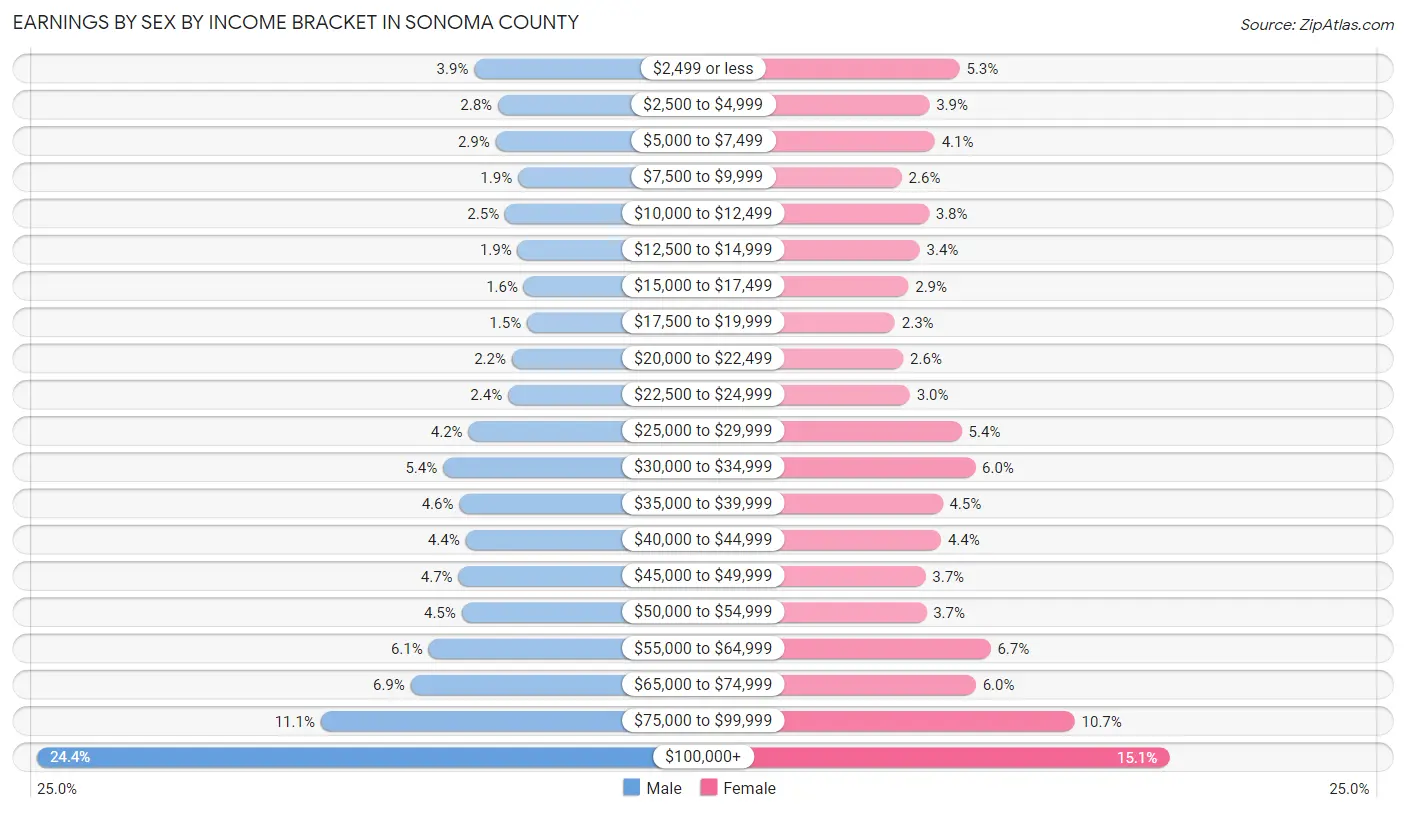
Earnings by Sex by Income Bracket in Sonoma County
The most common earnings brackets in Sonoma County are $100,000+ for men (35,162 | 24.4%) and $100,000+ for women (19,594 | 15.1%).
| Income | Male | Female |
| $2,499 or less | 5,677 (3.9%) | 6,852 (5.3%) |
| $2,500 to $4,999 | 4,073 (2.8%) | 5,014 (3.9%) |
| $5,000 to $7,499 | 4,240 (2.9%) | 5,349 (4.1%) |
| $7,500 to $9,999 | 2,728 (1.9%) | 3,342 (2.6%) |
| $10,000 to $12,499 | 3,600 (2.5%) | 4,986 (3.8%) |
| $12,500 to $14,999 | 2,752 (1.9%) | 4,424 (3.4%) |
| $15,000 to $17,499 | 2,331 (1.6%) | 3,737 (2.9%) |
| $17,500 to $19,999 | 2,111 (1.5%) | 2,917 (2.2%) |
| $20,000 to $22,499 | 3,140 (2.2%) | 3,427 (2.6%) |
| $22,500 to $24,999 | 3,400 (2.4%) | 3,833 (2.9%) |
| $25,000 to $29,999 | 6,059 (4.2%) | 6,984 (5.4%) |
| $30,000 to $34,999 | 7,770 (5.4%) | 7,804 (6.0%) |
| $35,000 to $39,999 | 6,683 (4.6%) | 5,820 (4.5%) |
| $40,000 to $44,999 | 6,256 (4.3%) | 5,724 (4.4%) |
| $45,000 to $49,999 | 6,735 (4.7%) | 4,781 (3.7%) |
| $50,000 to $54,999 | 6,517 (4.5%) | 4,831 (3.7%) |
| $55,000 to $64,999 | 8,758 (6.1%) | 8,745 (6.7%) |
| $65,000 to $74,999 | 9,964 (6.9%) | 7,840 (6.0%) |
| $75,000 to $99,999 | 16,020 (11.1%) | 13,859 (10.7%) |
| $100,000+ | 35,162 (24.4%) | 19,594 (15.1%) |
| Total | 143,976 (100.0%) | 129,863 (100.0%) |
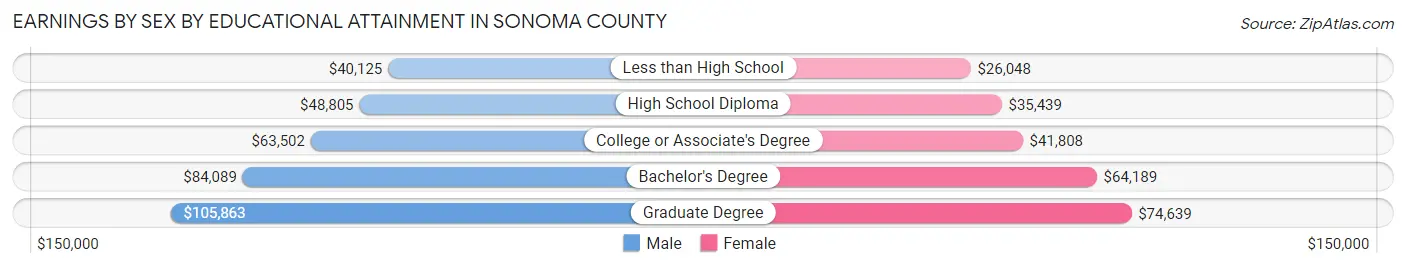
Earnings by Sex by Educational Attainment in Sonoma County
Average earnings in Sonoma County are $61,352 for men and $47,068 for women, a difference of 23.3%. Men with an educational attainment of graduate degree enjoy the highest average annual earnings of $105,863, while those with less than high school education earn the least with $40,125. Women with an educational attainment of graduate degree earn the most with the average annual earnings of $74,639, while those with less than high school education have the smallest earnings of $26,048.
| Educational Attainment | Male Income | Female Income |
| Less than High School | $40,125 | $26,048 |
| High School Diploma | $48,805 | $35,439 |
| College or Associate's Degree | $63,502 | $41,808 |
| Bachelor's Degree | $84,089 | $64,189 |
| Graduate Degree | $105,863 | $74,639 |
| Total | $61,352 | $47,068 |
Family Income in Sonoma County
Family Income Brackets in Sonoma County
According to the Sonoma County family income data, there are 26,059 families falling into the $100,000 to $149,999 income range, which is the most common income bracket and makes up 21.7% of all families. Conversely, the $10,000 to $14,999 income bracket is the least frequent group with only 1,321 families (1.1%) belonging to this category.
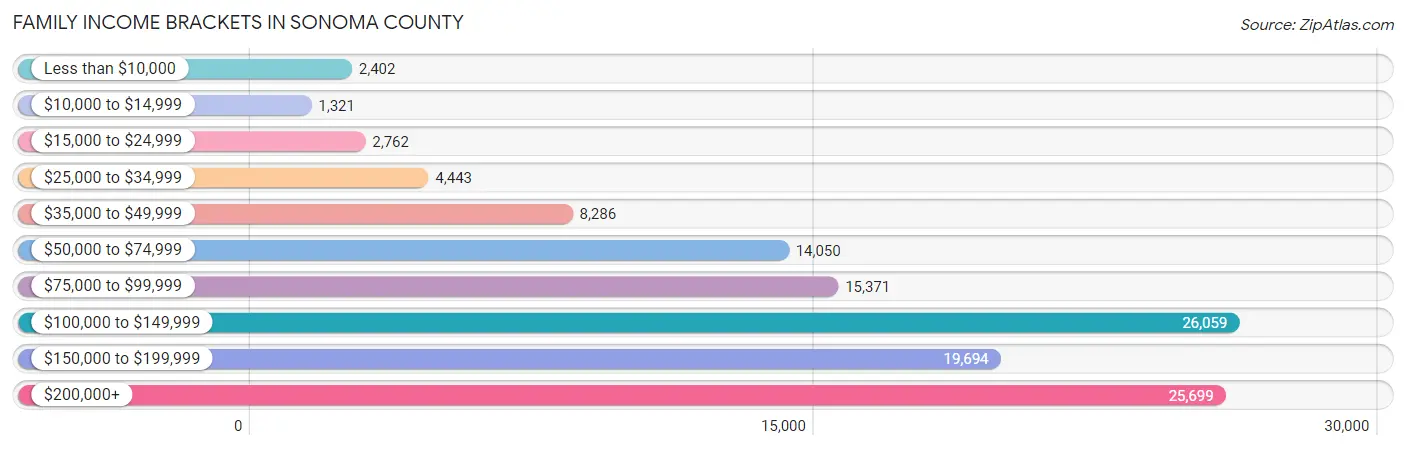
| Income Bracket | # Families | % Families |
| Less than $10,000 | 2,402 | 2.0% |
| $10,000 to $14,999 | 1,321 | 1.1% |
| $15,000 to $24,999 | 2,762 | 2.3% |
| $25,000 to $34,999 | 4,443 | 3.7% |
| $35,000 to $49,999 | 8,286 | 6.9% |
| $50,000 to $74,999 | 14,050 | 11.7% |
| $75,000 to $99,999 | 15,371 | 12.8% |
| $100,000 to $149,999 | 26,059 | 21.7% |
| $150,000 to $199,999 | 19,694 | 16.4% |
| $200,000+ | 25,699 | 21.4% |
Family Income by Famaliy Size in Sonoma County
7+ person families (1,459 | 1.2%) account for the highest median family income in Sonoma County with $162,074 per family, while 2-person families (57,147 | 47.6%) have the highest median income of $56,170 per family member.
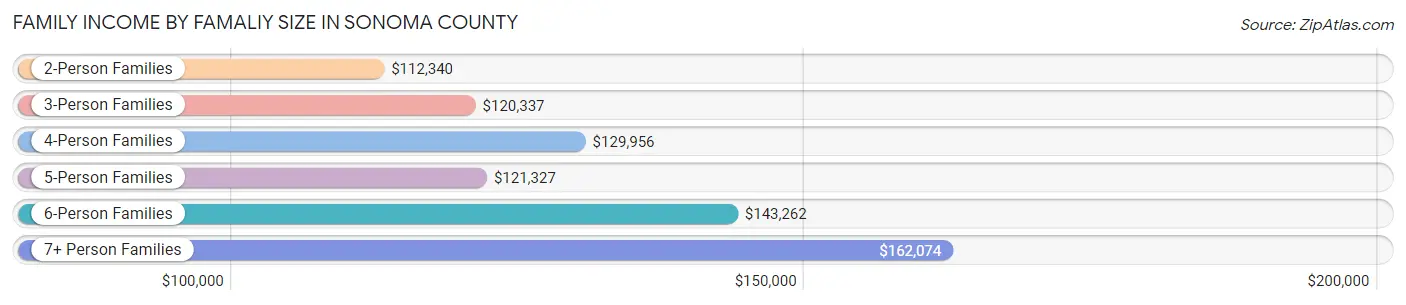
| Income Bracket | # Families | Median Income |
| 2-Person Families | 57,147 (47.6%) | $112,340 |
| 3-Person Families | 26,247 (21.9%) | $120,337 |
| 4-Person Families | 23,054 (19.2%) | $129,956 |
| 5-Person Families | 9,148 (7.6%) | $121,327 |
| 6-Person Families | 3,033 (2.5%) | $143,262 |
| 7+ Person Families | 1,459 (1.2%) | $162,074 |
| Total | 120,088 (100.0%) | $119,780 |
Family Income by Number of Earners in Sonoma County
The median family income in Sonoma County is $119,780, with families comprising 3+ earners (16,451) having the highest median family income of $160,946, while families with no earners (16,862) have the lowest median family income of $77,617, accounting for 13.7% and 14.0% of families, respectively.
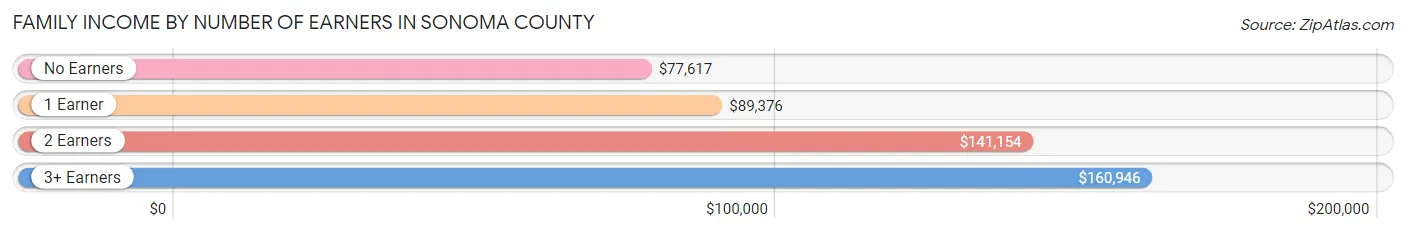
| Number of Earners | # Families | Median Income |
| No Earners | 16,862 (14.0%) | $77,617 |
| 1 Earner | 35,149 (29.3%) | $89,376 |
| 2 Earners | 51,626 (43.0%) | $141,154 |
| 3+ Earners | 16,451 (13.7%) | $160,946 |
| Total | 120,088 (100.0%) | $119,780 |
Household Income in Sonoma County
Household Income Brackets in Sonoma County
With 36,224 households falling in the category, the $100,000 to $149,999 income range is the most frequent in Sonoma County, accounting for 19.1% of all households. In contrast, only 4,552 households (2.4%) fall into the $10,000 to $14,999 income bracket, making it the least populous group.
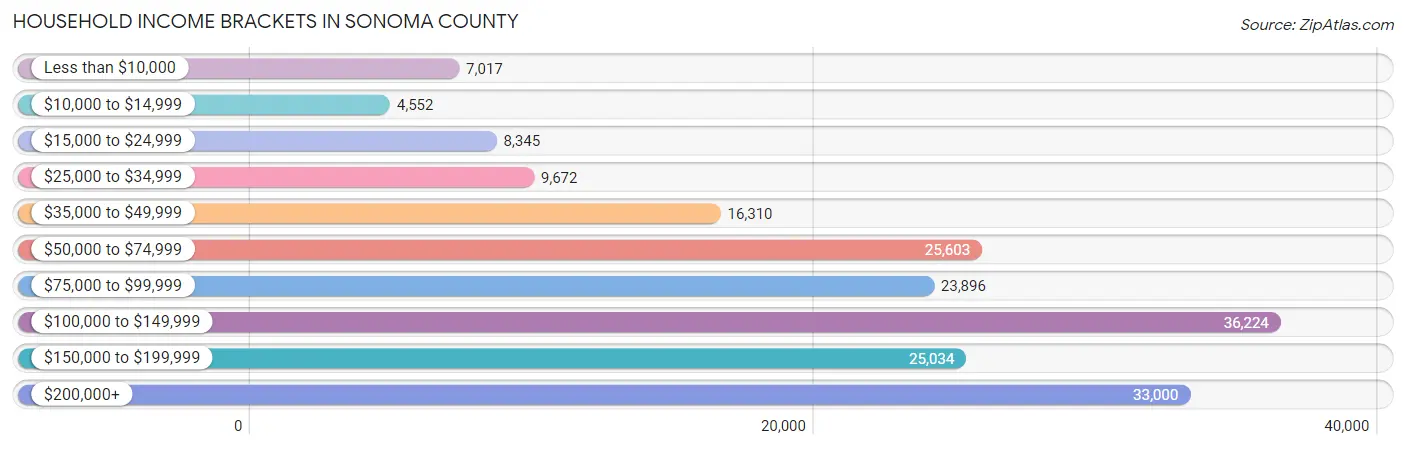
| Income Bracket | # Households | % Households |
| Less than $10,000 | 7,017 | 3.7% |
| $10,000 to $14,999 | 4,552 | 2.4% |
| $15,000 to $24,999 | 8,345 | 4.4% |
| $25,000 to $34,999 | 9,672 | 5.1% |
| $35,000 to $49,999 | 16,310 | 8.6% |
| $50,000 to $74,999 | 25,603 | 13.5% |
| $75,000 to $99,999 | 23,896 | 12.6% |
| $100,000 to $149,999 | 36,224 | 19.1% |
| $150,000 to $199,999 | 25,034 | 13.2% |
| $200,000+ | 33,000 | 17.4% |
Household Income by Householder Age in Sonoma County
The median household income in Sonoma County is $99,266, with the highest median household income of $124,245 found in the 45 to 64 years age bracket for the primary householder. A total of 69,095 households (36.4%) fall into this category. Meanwhile, the 15 to 24 years age bracket for the primary householder has the lowest median household income of $59,250, with 4,782 households (2.5%) in this group.
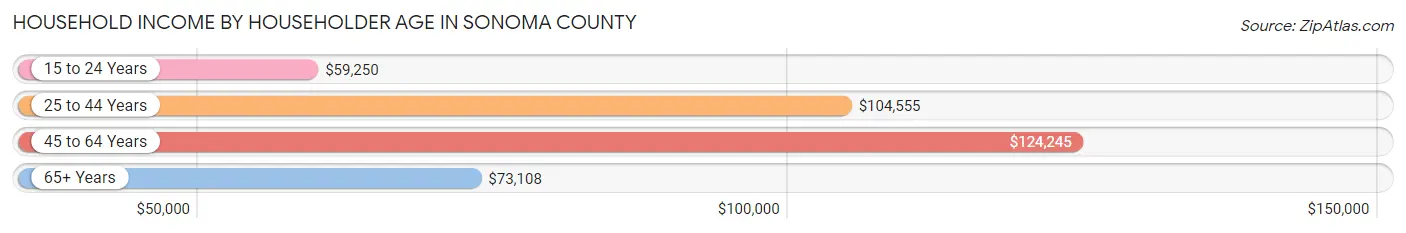
| Income Bracket | # Households | Median Income |
| 15 to 24 Years | 4,782 (2.5%) | $59,250 |
| 25 to 44 Years | 53,340 (28.1%) | $104,555 |
| 45 to 64 Years | 69,095 (36.4%) | $124,245 |
| 65+ Years | 62,436 (32.9%) | $73,108 |
| Total | 189,653 (100.0%) | $99,266 |
Poverty in Sonoma County
Income Below Poverty by Sex and Age in Sonoma County
With 8.2% poverty level for males and 9.6% for females among the residents of Sonoma County, 15 year old males and 15 year old females are the most vulnerable to poverty, with 541 males (19.6%) and 670 females (22.0%) in their respective age groups living below the poverty level.
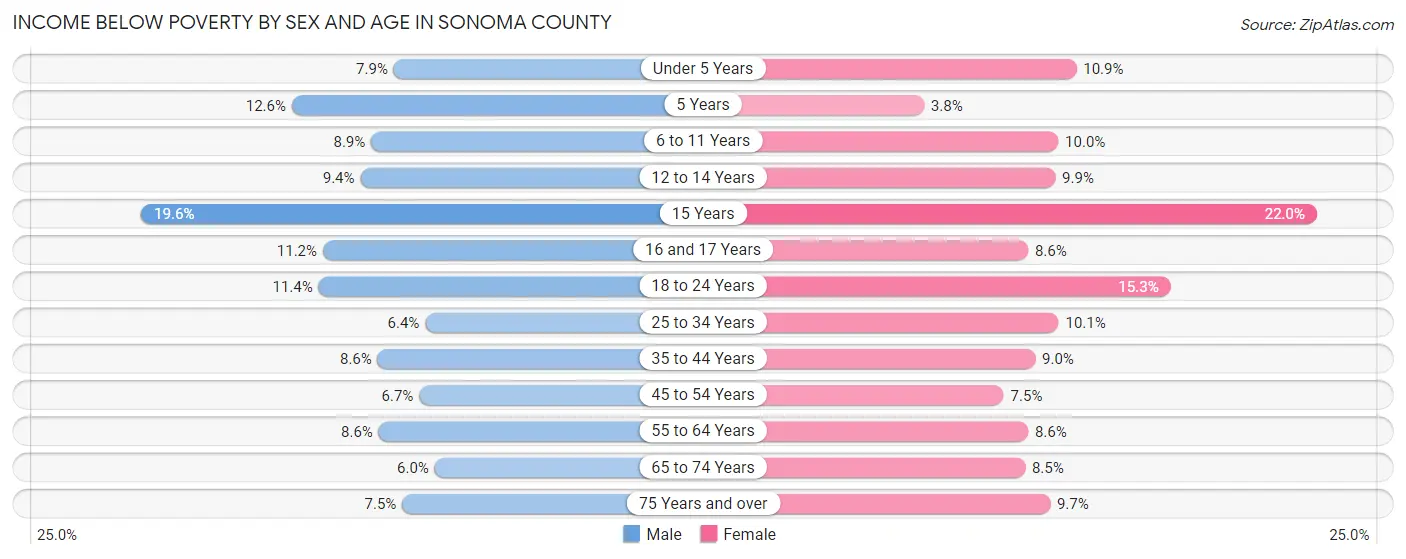
| Age Bracket | Male | Female |
| Under 5 Years | 905 (7.9%) | 1,198 (10.9%) |
| 5 Years | 370 (12.6%) | 82 (3.8%) |
| 6 to 11 Years | 1,384 (8.9%) | 1,480 (10.0%) |
| 12 to 14 Years | 752 (9.4%) | 879 (9.9%) |
| 15 Years | 541 (19.6%) | 670 (22.0%) |
| 16 and 17 Years | 689 (11.2%) | 475 (8.6%) |
| 18 to 24 Years | 2,152 (11.4%) | 2,815 (15.2%) |
| 25 to 34 Years | 1,969 (6.4%) | 2,971 (10.1%) |
| 35 to 44 Years | 2,755 (8.6%) | 2,791 (9.0%) |
| 45 to 54 Years | 2,044 (6.7%) | 2,259 (7.5%) |
| 55 to 64 Years | 2,837 (8.6%) | 3,095 (8.6%) |
| 65 to 74 Years | 1,699 (6.0%) | 2,761 (8.5%) |
| 75 Years and over | 1,203 (7.5%) | 2,149 (9.7%) |
| Total | 19,300 (8.2%) | 23,625 (9.6%) |
Income Above Poverty by Sex and Age in Sonoma County
According to the poverty statistics in Sonoma County, males aged 65 to 74 years and females aged 5 years are the age groups that are most secure financially, with 94.0% of males and 96.2% of females in these age groups living above the poverty line.
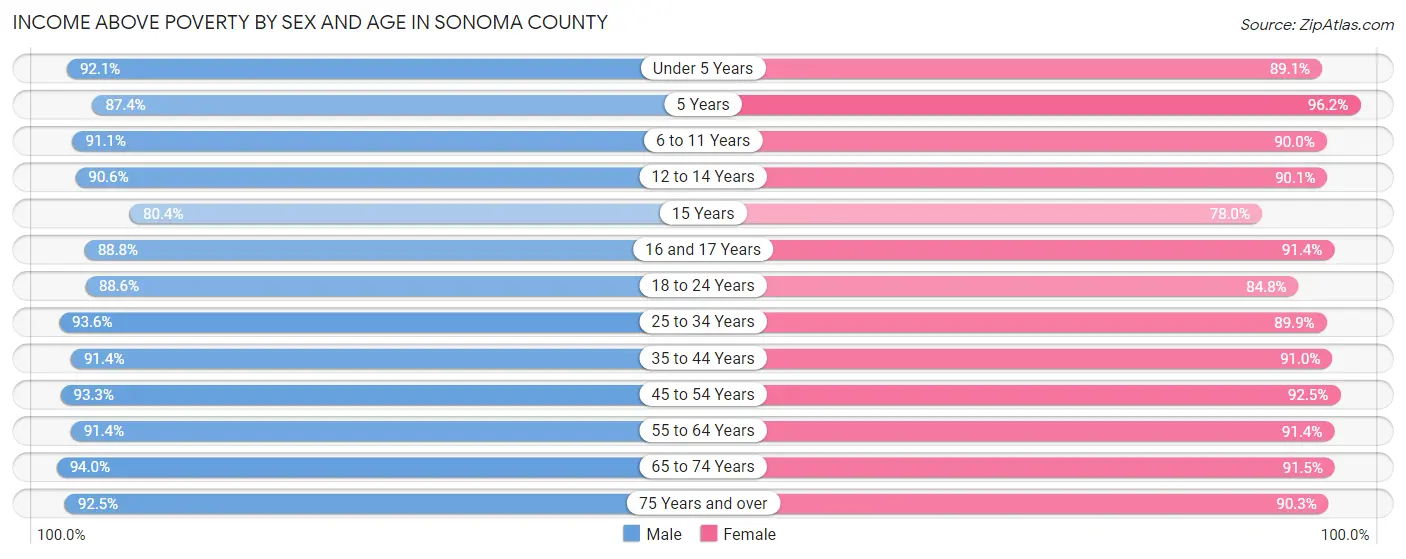
| Age Bracket | Male | Female |
| Under 5 Years | 10,593 (92.1%) | 9,818 (89.1%) |
| 5 Years | 2,567 (87.4%) | 2,070 (96.2%) |
| 6 to 11 Years | 14,126 (91.1%) | 13,264 (90.0%) |
| 12 to 14 Years | 7,233 (90.6%) | 8,001 (90.1%) |
| 15 Years | 2,221 (80.4%) | 2,370 (78.0%) |
| 16 and 17 Years | 5,484 (88.8%) | 5,024 (91.4%) |
| 18 to 24 Years | 16,788 (88.6%) | 15,645 (84.8%) |
| 25 to 34 Years | 28,742 (93.6%) | 26,556 (89.9%) |
| 35 to 44 Years | 29,214 (91.4%) | 28,319 (91.0%) |
| 45 to 54 Years | 28,503 (93.3%) | 27,828 (92.5%) |
| 55 to 64 Years | 30,249 (91.4%) | 32,728 (91.4%) |
| 65 to 74 Years | 26,741 (94.0%) | 29,736 (91.5%) |
| 75 Years and over | 14,883 (92.5%) | 20,088 (90.3%) |
| Total | 217,344 (91.8%) | 221,447 (90.4%) |
Income Below Poverty Among Married-Couple Families in Sonoma County
The poverty statistics for married-couple families in Sonoma County show that 2.6% or 2,425 of the total 91,378 families live below the poverty line. Families with 3 or 4 children have the highest poverty rate of 6.8%, comprising of 373 families. On the other hand, families with no children have the lowest poverty rate of 2.0%, which includes 1,115 families.
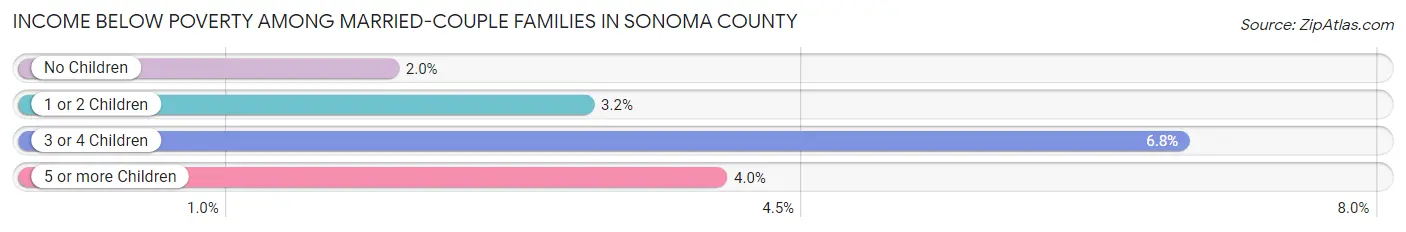
| Children | Above Poverty | Below Poverty |
| No Children | 55,304 (98.0%) | 1,115 (2.0%) |
| 1 or 2 Children | 28,316 (96.8%) | 928 (3.2%) |
| 3 or 4 Children | 5,116 (93.2%) | 373 (6.8%) |
| 5 or more Children | 217 (96.0%) | 9 (4.0%) |
| Total | 88,953 (97.4%) | 2,425 (2.6%) |
Income Below Poverty Among Single-Parent Households in Sonoma County
According to the poverty data in Sonoma County, 10.1% or 1,064 single-father households and 13.6% or 2,470 single-mother households are living below the poverty line. Among single-father households, those with 3 or 4 children have the highest poverty rate, with 459 households (39.7%) experiencing poverty. Likewise, among single-mother households, those with 3 or 4 children have the highest poverty rate, with 497 households (34.9%) falling below the poverty line.
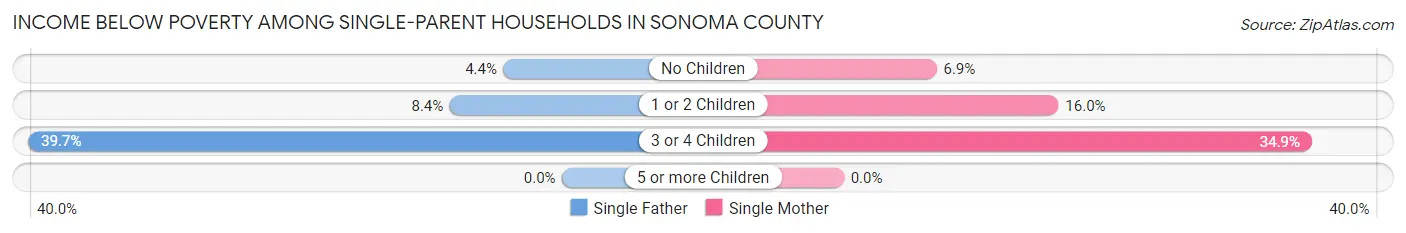
| Children | Single Father | Single Mother |
| No Children | 191 (4.4%) | 538 (6.9%) |
| 1 or 2 Children | 414 (8.4%) | 1,435 (16.0%) |
| 3 or 4 Children | 459 (39.7%) | 497 (34.9%) |
| 5 or more Children | 0 (0.0%) | 0 (0.0%) |
| Total | 1,064 (10.1%) | 2,470 (13.6%) |
Income Below Poverty Among Married-Couple vs Single-Parent Households in Sonoma County
The poverty data for Sonoma County shows that 2,425 of the married-couple family households (2.6%) and 3,534 of the single-parent households (12.3%) are living below the poverty level. Within the married-couple family households, those with 3 or 4 children have the highest poverty rate, with 373 households (6.8%) falling below the poverty line. Among the single-parent households, those with 3 or 4 children have the highest poverty rate, with 956 household (37.0%) living below poverty.
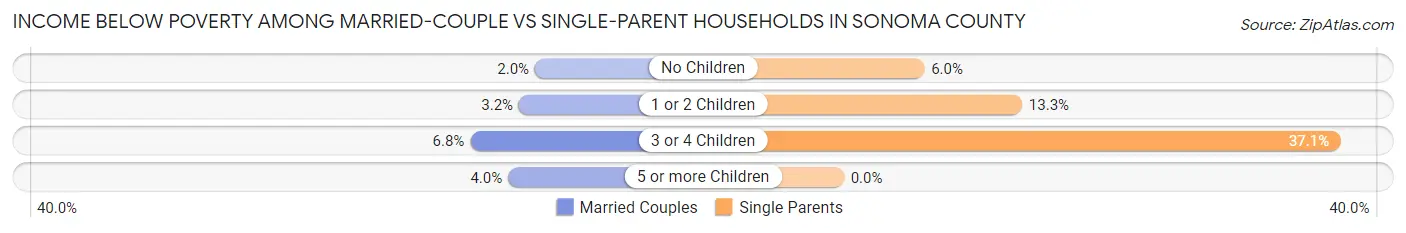
| Children | Married-Couple Families | Single-Parent Households |
| No Children | 1,115 (2.0%) | 729 (6.0%) |
| 1 or 2 Children | 928 (3.2%) | 1,849 (13.3%) |
| 3 or 4 Children | 373 (6.8%) | 956 (37.0%) |
| 5 or more Children | 9 (4.0%) | 0 (0.0%) |
| Total | 2,425 (2.6%) | 3,534 (12.3%) |
Race in Sonoma County
The most populous races in Sonoma County are White / Caucasian (330,543 | 67.7%), Hispanic or Latino (136,614 | 28.0%), and Some other Race (66,293 | 13.6%).
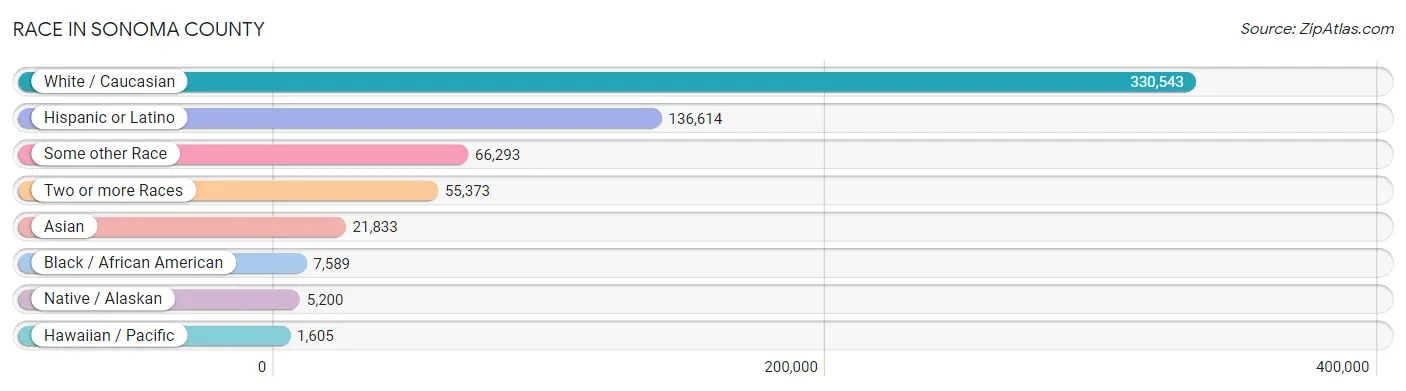
| Race | # Population | % Population |
| Asian | 21,833 | 4.5% |
| Black / African American | 7,589 | 1.5% |
| Hawaiian / Pacific | 1,605 | 0.3% |
| Hispanic or Latino | 136,614 | 28.0% |
| Native / Alaskan | 5,200 | 1.1% |
| White / Caucasian | 330,543 | 67.7% |
| Two or more Races | 55,373 | 11.3% |
| Some other Race | 66,293 | 13.6% |
| Total | 488,436 | 100.0% |
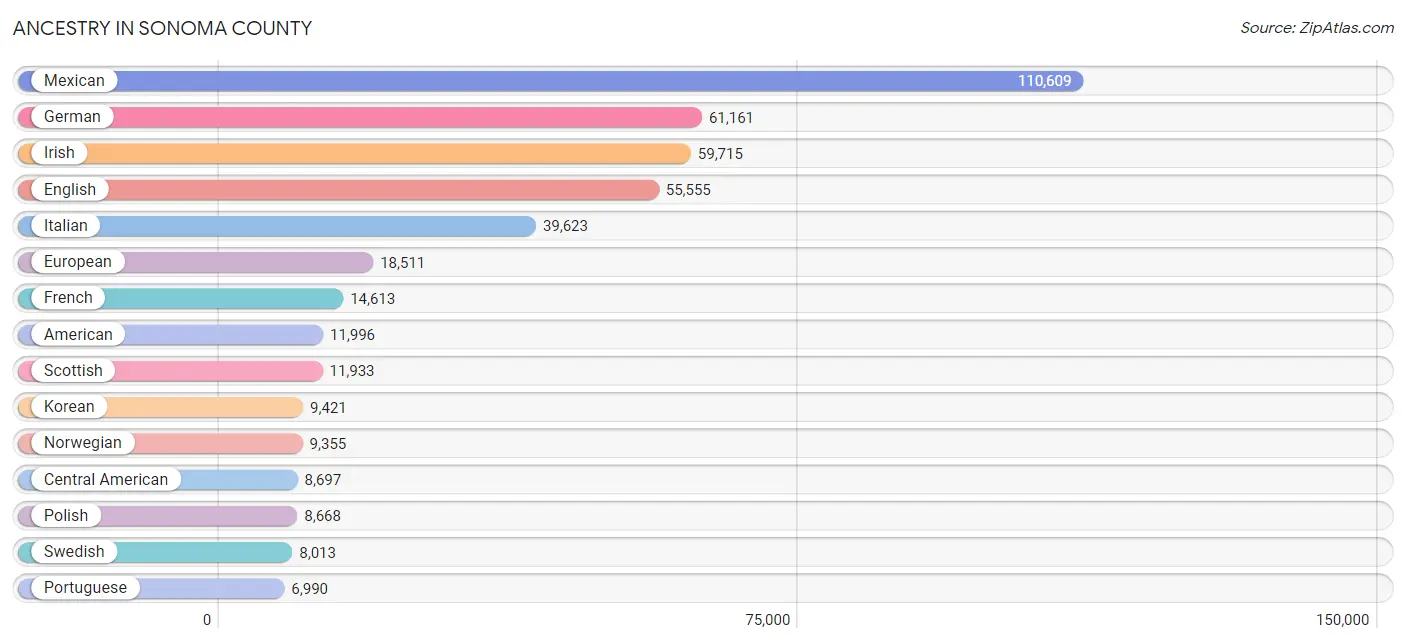
Ancestry in Sonoma County
The most populous ancestries reported in Sonoma County are Mexican (110,609 | 22.7%), German (61,161 | 12.5%), Irish (59,715 | 12.2%), English (55,555 | 11.4%), and Italian (39,623 | 8.1%), together accounting for 66.9% of all Sonoma County residents.
| Ancestry | # Population | % Population |
| Afghan | 116 | 0.0% |
| African | 560 | 0.1% |
| Alaska Native | 88 | 0.0% |
| Alaskan Athabascan | 22 | 0.0% |
| Albanian | 38 | 0.0% |
| Aleut | 39 | 0.0% |
| Alsatian | 2 | 0.0% |
| American | 11,996 | 2.5% |
| Apache | 693 | 0.1% |
| Arab | 2,173 | 0.4% |
| Argentinean | 767 | 0.2% |
| Armenian | 806 | 0.2% |
| Assyrian / Chaldean / Syriac | 274 | 0.1% |
| Australian | 428 | 0.1% |
| Austrian | 1,561 | 0.3% |
| Bangladeshi | 143 | 0.0% |
| Basque | 720 | 0.2% |
| Belgian | 639 | 0.1% |
| Belizean | 24 | 0.0% |
| Bhutanese | 3,556 | 0.7% |
| Blackfeet | 384 | 0.1% |
| Bolivian | 47 | 0.0% |
| Brazilian | 510 | 0.1% |
| British | 4,584 | 0.9% |
| Bulgarian | 189 | 0.0% |
| Burmese | 1,838 | 0.4% |
| Cajun | 48 | 0.0% |
| Canadian | 1,494 | 0.3% |
| Cape Verdean | 24 | 0.0% |
| Carpatho Rusyn | 9 | 0.0% |
| Celtic | 181 | 0.0% |
| Central American | 8,697 | 1.8% |
| Central American Indian | 1,365 | 0.3% |
| Cherokee | 1,475 | 0.3% |
| Cheyenne | 127 | 0.0% |
| Chickasaw | 73 | 0.0% |
| Chilean | 260 | 0.1% |
| Chinese | 86 | 0.0% |
| Chippewa | 383 | 0.1% |
| Choctaw | 370 | 0.1% |
| Colombian | 1,228 | 0.3% |
| Colville | 9 | 0.0% |
| Comanche | 148 | 0.0% |
| Costa Rican | 251 | 0.1% |
| Cree | 22 | 0.0% |
| Creek | 133 | 0.0% |
| Croatian | 817 | 0.2% |
| Cuban | 1,043 | 0.2% |
| Cypriot | 3 | 0.0% |
| Czech | 1,780 | 0.4% |
| Czechoslovakian | 338 | 0.1% |
| Danish | 5,211 | 1.1% |
| Delaware | 82 | 0.0% |
| Dominican | 45 | 0.0% |
| Dutch | 5,503 | 1.1% |
| Eastern European | 2,320 | 0.5% |
| Ecuadorian | 373 | 0.1% |
| Egyptian | 290 | 0.1% |
| English | 55,555 | 11.4% |
| Estonian | 134 | 0.0% |
| Ethiopian | 343 | 0.1% |
| European | 18,511 | 3.8% |
| Filipino | 562 | 0.1% |
| Finnish | 1,409 | 0.3% |
| French | 14,613 | 3.0% |
| French American Indian | 36 | 0.0% |
| French Canadian | 1,987 | 0.4% |
| German | 61,161 | 12.5% |
| German Russian | 7 | 0.0% |
| Greek | 2,744 | 0.6% |
| Guamanian / Chamorro | 336 | 0.1% |
| Guatemalan | 1,940 | 0.4% |
| Guyanese | 8 | 0.0% |
| Haitian | 464 | 0.1% |
| Honduran | 579 | 0.1% |
| Hopi | 65 | 0.0% |
| Hungarian | 1,984 | 0.4% |
| Icelander | 117 | 0.0% |
| Indian (Asian) | 6,800 | 1.4% |
| Indonesian | 77 | 0.0% |
| Inupiat | 29 | 0.0% |
| Iranian | 842 | 0.2% |
| Irish | 59,715 | 12.2% |
| Iroquois | 142 | 0.0% |
| Israeli | 78 | 0.0% |
| Italian | 39,623 | 8.1% |
| Jamaican | 226 | 0.1% |
| Japanese | 1,082 | 0.2% |
| Jordanian | 410 | 0.1% |
| Kenyan | 356 | 0.1% |
| Korean | 9,421 | 1.9% |
| Laotian | 255 | 0.1% |
| Latvian | 383 | 0.1% |
| Lebanese | 623 | 0.1% |
| Liberian | 40 | 0.0% |
| Lithuanian | 796 | 0.2% |
| Luxembourger | 90 | 0.0% |
| Macedonian | 7 | 0.0% |
| Malaysian | 799 | 0.2% |
| Maltese | 362 | 0.1% |
| Mexican | 110,609 | 22.7% |
| Mexican American Indian | 2,619 | 0.5% |
| Mongolian | 16 | 0.0% |
| Moroccan | 68 | 0.0% |
| Native Hawaiian | 1,565 | 0.3% |
| Navajo | 291 | 0.1% |
| New Zealander | 100 | 0.0% |
| Nicaraguan | 1,009 | 0.2% |
| Nigerian | 237 | 0.1% |
| Northern European | 2,550 | 0.5% |
| Norwegian | 9,355 | 1.9% |
| Okinawan | 29 | 0.0% |
| Osage | 237 | 0.1% |
| Ottawa | 112 | 0.0% |
| Paiute | 70 | 0.0% |
| Pakistani | 432 | 0.1% |
| Palestinian | 423 | 0.1% |
| Panamanian | 252 | 0.1% |
| Pennsylvania German | 56 | 0.0% |
| Peruvian | 691 | 0.1% |
| Pima | 81 | 0.0% |
| Polish | 8,668 | 1.8% |
| Portuguese | 6,990 | 1.4% |
| Potawatomi | 9 | 0.0% |
| Pueblo | 93 | 0.0% |
| Puerto Rican | 2,255 | 0.5% |
| Puget Sound Salish | 9 | 0.0% |
| Romanian | 583 | 0.1% |
| Russian | 6,206 | 1.3% |
| Salvadoran | 4,546 | 0.9% |
| Samoan | 429 | 0.1% |
| Scandinavian | 3,041 | 0.6% |
| Scotch-Irish | 5,439 | 1.1% |
| Scottish | 11,933 | 2.4% |
| Seminole | 39 | 0.0% |
| Serbian | 189 | 0.0% |
| Shoshone | 309 | 0.1% |
| Sierra Leonean | 41 | 0.0% |
| Sioux | 321 | 0.1% |
| Slavic | 167 | 0.0% |
| Slovak | 558 | 0.1% |
| Slovene | 92 | 0.0% |
| South African | 42 | 0.0% |
| South American | 3,512 | 0.7% |
| South American Indian | 154 | 0.0% |
| Spaniard | 3,099 | 0.6% |
| Spanish | 3,379 | 0.7% |
| Spanish American | 3 | 0.0% |
| Spanish American Indian | 96 | 0.0% |
| Sri Lankan | 3,784 | 0.8% |
| Subsaharan African | 2,118 | 0.4% |
| Swedish | 8,013 | 1.6% |
| Swiss | 3,713 | 0.8% |
| Syrian | 140 | 0.0% |
| Thai | 3,448 | 0.7% |
| Tlingit-Haida | 55 | 0.0% |
| Tongan | 15 | 0.0% |
| Trinidadian and Tobagonian | 8 | 0.0% |
| Turkish | 179 | 0.0% |
| Ugandan | 334 | 0.1% |
| Ukrainian | 1,308 | 0.3% |
| Uruguayan | 25 | 0.0% |
| Ute | 40 | 0.0% |
| Venezuelan | 79 | 0.0% |
| Vietnamese | 13 | 0.0% |
| Welsh | 3,572 | 0.7% |
| West Indian | 139 | 0.0% |
| Yaqui | 111 | 0.0% |
| Yugoslavian | 514 | 0.1% |
| Yup'ik | 29 | 0.0% | View All 170 Rows |
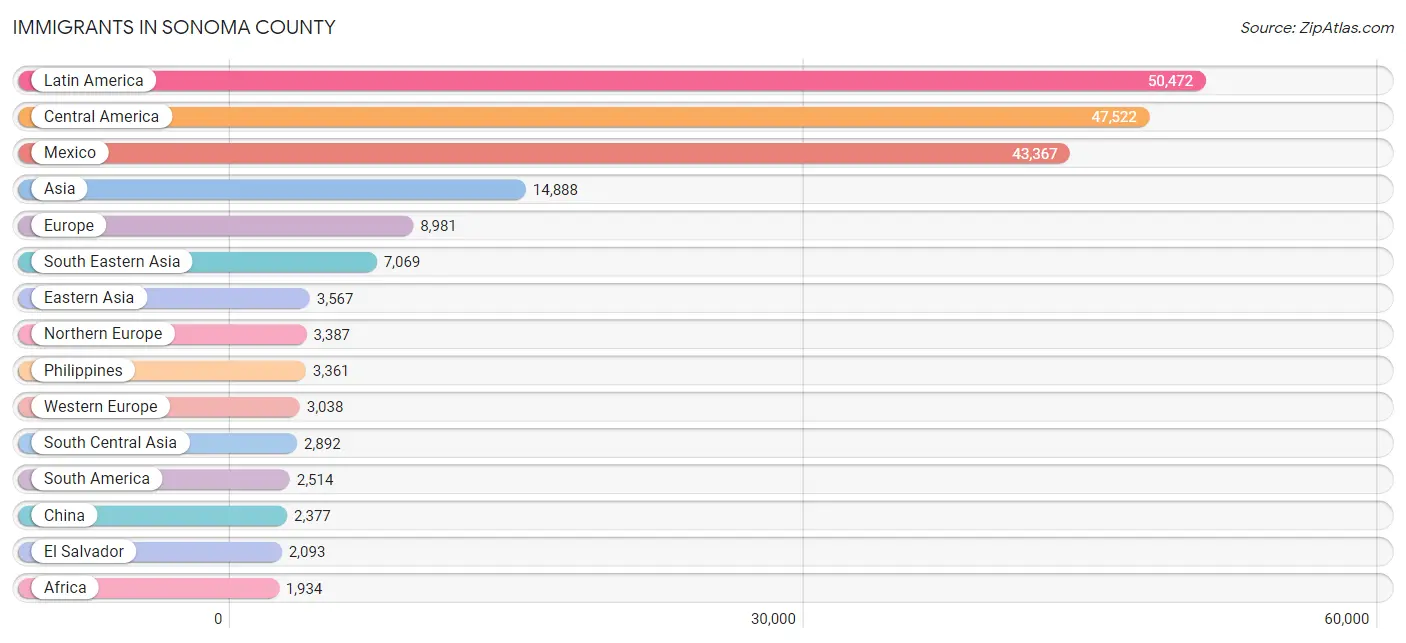
Immigrants in Sonoma County
The most numerous immigrant groups reported in Sonoma County came from Latin America (50,472 | 10.3%), Central America (47,522 | 9.7%), Mexico (43,367 | 8.9%), Asia (14,888 | 3.0%), and Europe (8,981 | 1.8%), together accounting for 33.8% of all Sonoma County residents.
| Immigration Origin | # Population | % Population |
| Afghanistan | 76 | 0.0% |
| Africa | 1,934 | 0.4% |
| Argentina | 550 | 0.1% |
| Armenia | 24 | 0.0% |
| Asia | 14,888 | 3.0% |
| Australia | 454 | 0.1% |
| Austria | 158 | 0.0% |
| Azores | 42 | 0.0% |
| Bangladesh | 13 | 0.0% |
| Barbados | 10 | 0.0% |
| Belarus | 23 | 0.0% |
| Belgium | 77 | 0.0% |
| Bolivia | 14 | 0.0% |
| Bosnia and Herzegovina | 32 | 0.0% |
| Brazil | 553 | 0.1% |
| Bulgaria | 94 | 0.0% |
| Cabo Verde | 27 | 0.0% |
| Cambodia | 804 | 0.2% |
| Cameroon | 17 | 0.0% |
| Canada | 1,748 | 0.4% |
| Caribbean | 436 | 0.1% |
| Central America | 47,522 | 9.7% |
| Chile | 98 | 0.0% |
| China | 2,377 | 0.5% |
| Colombia | 447 | 0.1% |
| Costa Rica | 180 | 0.0% |
| Cuba | 209 | 0.0% |
| Czechoslovakia | 106 | 0.0% |
| Denmark | 181 | 0.0% |
| Dominican Republic | 25 | 0.0% |
| Eastern Africa | 1,042 | 0.2% |
| Eastern Asia | 3,567 | 0.7% |
| Eastern Europe | 1,473 | 0.3% |
| Ecuador | 268 | 0.1% |
| Egypt | 76 | 0.0% |
| El Salvador | 2,093 | 0.4% |
| England | 766 | 0.2% |
| Eritrea | 180 | 0.0% |
| Ethiopia | 78 | 0.0% |
| Europe | 8,981 | 1.8% |
| Fiji | 910 | 0.2% |
| France | 498 | 0.1% |
| Germany | 1,612 | 0.3% |
| Greece | 70 | 0.0% |
| Guatemala | 1,234 | 0.3% |
| Guyana | 8 | 0.0% |
| Haiti | 153 | 0.0% |
| Honduras | 224 | 0.1% |
| Hong Kong | 130 | 0.0% |
| Hungary | 131 | 0.0% |
| India | 1,592 | 0.3% |
| Indonesia | 136 | 0.0% |
| Iran | 528 | 0.1% |
| Iraq | 87 | 0.0% |
| Ireland | 505 | 0.1% |
| Israel | 255 | 0.1% |
| Italy | 482 | 0.1% |
| Jamaica | 22 | 0.0% |
| Japan | 357 | 0.1% |
| Jordan | 451 | 0.1% |
| Kazakhstan | 37 | 0.0% |
| Kenya | 423 | 0.1% |
| Korea | 833 | 0.2% |
| Kuwait | 72 | 0.0% |
| Laos | 290 | 0.1% |
| Latin America | 50,472 | 10.3% |
| Latvia | 22 | 0.0% |
| Lebanon | 52 | 0.0% |
| Liberia | 17 | 0.0% |
| Lithuania | 58 | 0.0% |
| Malaysia | 28 | 0.0% |
| Mexico | 43,367 | 8.9% |
| Middle Africa | 109 | 0.0% |
| Moldova | 25 | 0.0% |
| Morocco | 109 | 0.0% |
| Nepal | 519 | 0.1% |
| Netherlands | 412 | 0.1% |
| Nicaragua | 311 | 0.1% |
| Nigeria | 130 | 0.0% |
| North Macedonia | 7 | 0.0% |
| Northern Africa | 215 | 0.0% |
| Northern Europe | 3,387 | 0.7% |
| Norway | 202 | 0.0% |
| Oceania | 1,551 | 0.3% |
| Pakistan | 56 | 0.0% |
| Panama | 85 | 0.0% |
| Peru | 516 | 0.1% |
| Philippines | 3,361 | 0.7% |
| Poland | 203 | 0.0% |
| Portugal | 221 | 0.1% |
| Romania | 161 | 0.0% |
| Russia | 339 | 0.1% |
| Saudi Arabia | 27 | 0.0% |
| Scotland | 196 | 0.0% |
| Serbia | 8 | 0.0% |
| Sierra Leone | 20 | 0.0% |
| Singapore | 45 | 0.0% |
| Somalia | 41 | 0.0% |
| South Africa | 227 | 0.1% |
| South America | 2,514 | 0.5% |
| South Central Asia | 2,892 | 0.6% |
| South Eastern Asia | 7,069 | 1.5% |
| Southern Europe | 1,083 | 0.2% |
| Spain | 270 | 0.1% |
| Sri Lanka | 52 | 0.0% |
| Sweden | 185 | 0.0% |
| Switzerland | 273 | 0.1% |
| Syria | 46 | 0.0% |
| Taiwan | 610 | 0.1% |
| Thailand | 510 | 0.1% |
| Turkey | 150 | 0.0% |
| Uganda | 247 | 0.1% |
| Ukraine | 206 | 0.0% |
| Uruguay | 31 | 0.0% |
| Uzbekistan | 7 | 0.0% |
| Venezuela | 22 | 0.0% |
| Vietnam | 1,795 | 0.4% |
| Western Africa | 341 | 0.1% |
| Western Asia | 1,278 | 0.3% |
| Western Europe | 3,038 | 0.6% |
| Zimbabwe | 53 | 0.0% | View All 121 Rows |
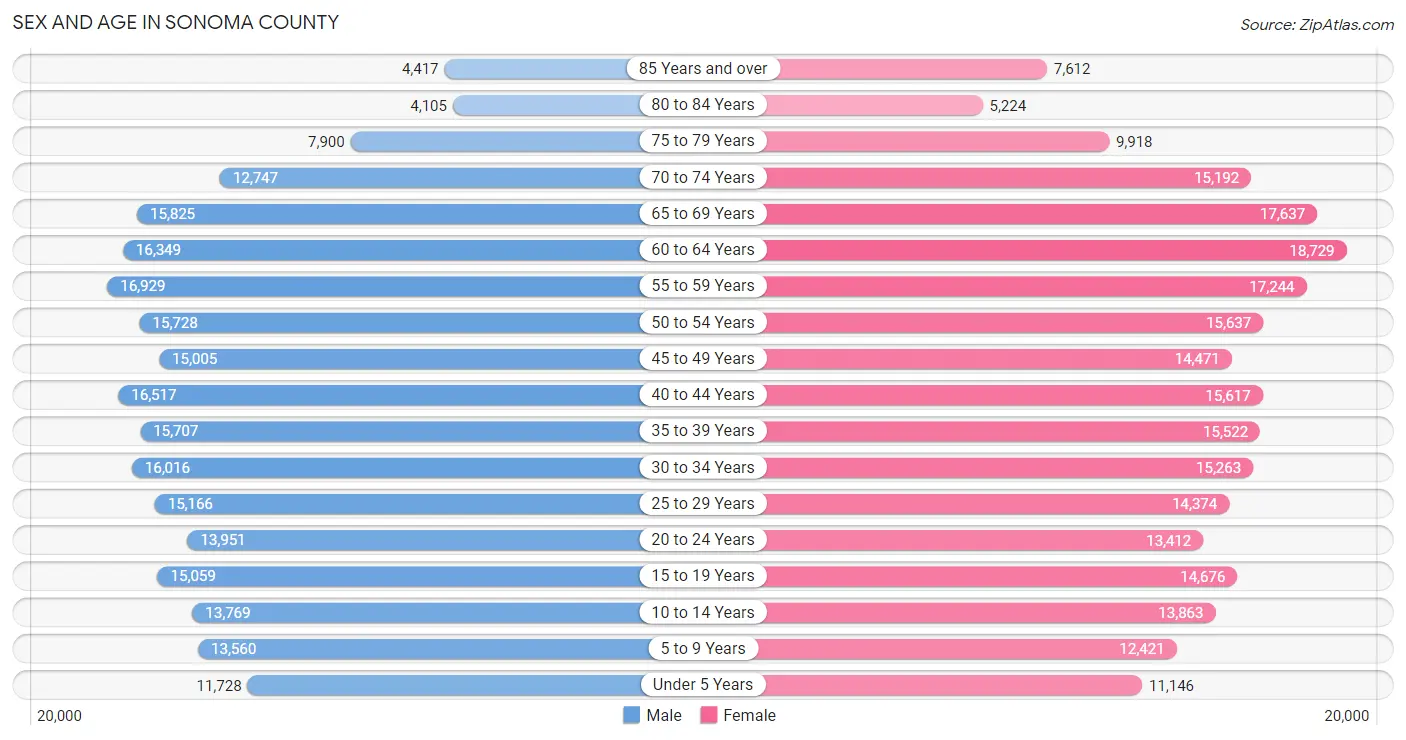
Sex and Age in Sonoma County
Sex and Age in Sonoma County
The most populous age groups in Sonoma County are 55 to 59 Years (16,929 | 7.0%) for men and 60 to 64 Years (18,729 | 7.5%) for women.
| Age Bracket | Male | Female |
| Under 5 Years | 11,728 (4.9%) | 11,146 (4.5%) |
| 5 to 9 Years | 13,560 (5.6%) | 12,421 (5.0%) |
| 10 to 14 Years | 13,769 (5.7%) | 13,863 (5.6%) |
| 15 to 19 Years | 15,059 (6.3%) | 14,676 (5.9%) |
| 20 to 24 Years | 13,951 (5.8%) | 13,412 (5.4%) |
| 25 to 29 Years | 15,166 (6.3%) | 14,374 (5.8%) |
| 30 to 34 Years | 16,016 (6.7%) | 15,263 (6.2%) |
| 35 to 39 Years | 15,707 (6.5%) | 15,522 (6.3%) |
| 40 to 44 Years | 16,517 (6.9%) | 15,617 (6.3%) |
| 45 to 49 Years | 15,005 (6.2%) | 14,471 (5.8%) |
| 50 to 54 Years | 15,728 (6.5%) | 15,637 (6.3%) |
| 55 to 59 Years | 16,929 (7.0%) | 17,244 (7.0%) |
| 60 to 64 Years | 16,349 (6.8%) | 18,729 (7.5%) |
| 65 to 69 Years | 15,825 (6.6%) | 17,637 (7.1%) |
| 70 to 74 Years | 12,747 (5.3%) | 15,192 (6.1%) |
| 75 to 79 Years | 7,900 (3.3%) | 9,918 (4.0%) |
| 80 to 84 Years | 4,105 (1.7%) | 5,224 (2.1%) |
| 85 Years and over | 4,417 (1.8%) | 7,612 (3.1%) |
| Total | 240,478 (100.0%) | 247,958 (100.0%) |
Families and Households in Sonoma County
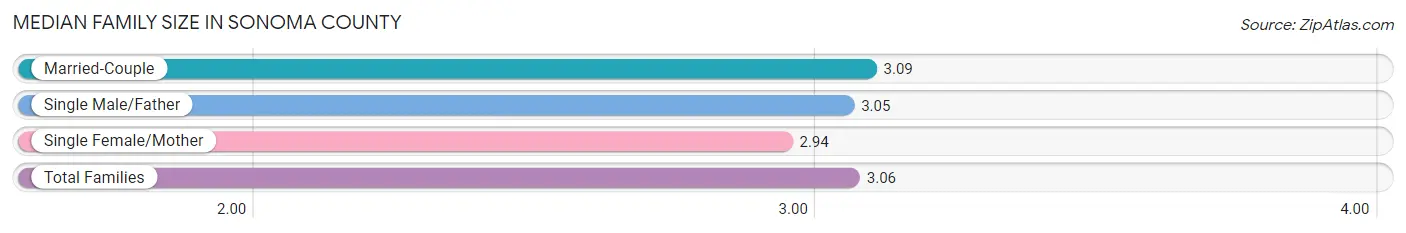
Median Family Size in Sonoma County
The median family size in Sonoma County is 3.06 persons per family, with married-couple families (91,378 | 76.1%) accounting for the largest median family size of 3.09 persons per family. On the other hand, single female/mother families (18,195 | 15.1%) represent the smallest median family size with 2.94 persons per family.
| Family Type | # Families | Family Size |
| Married-Couple | 91,378 (76.1%) | 3.09 |
| Single Male/Father | 10,515 (8.8%) | 3.05 |
| Single Female/Mother | 18,195 (15.1%) | 2.94 |
| Total Families | 120,088 (100.0%) | 3.06 |
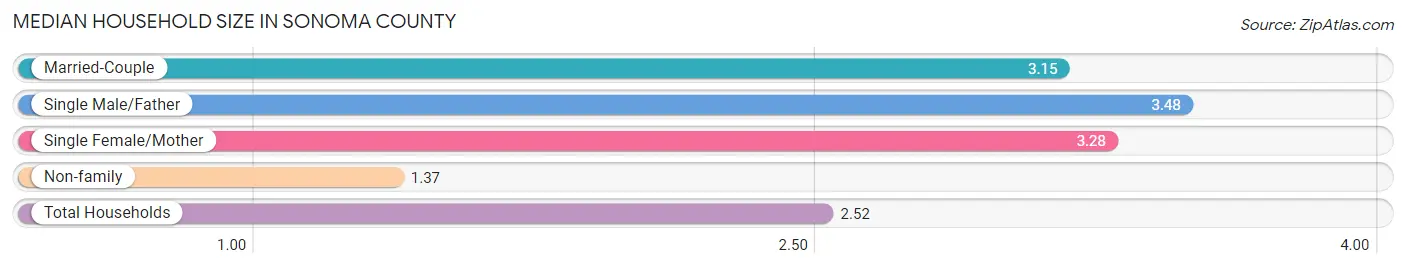
Median Household Size in Sonoma County
The median household size in Sonoma County is 2.52 persons per household, with single male/father households (10,515 | 5.5%) accounting for the largest median household size of 3.48 persons per household. non-family households (69,565 | 36.7%) represent the smallest median household size with 1.37 persons per household.
| Household Type | # Households | Household Size |
| Married-Couple | 91,378 (48.2%) | 3.15 |
| Single Male/Father | 10,515 (5.5%) | 3.48 |
| Single Female/Mother | 18,195 (9.6%) | 3.28 |
| Non-family | 69,565 (36.7%) | 1.37 |
| Total Households | 189,653 (100.0%) | 2.52 |
Household Size by Marriage Status in Sonoma County
Out of a total of 189,653 households in Sonoma County, 120,088 (63.3%) are family households, while 69,565 (36.7%) are nonfamily households. The most numerous type of family households are 2-person households, comprising 51,744, and the most common type of nonfamily households are 1-person households, comprising 51,114.
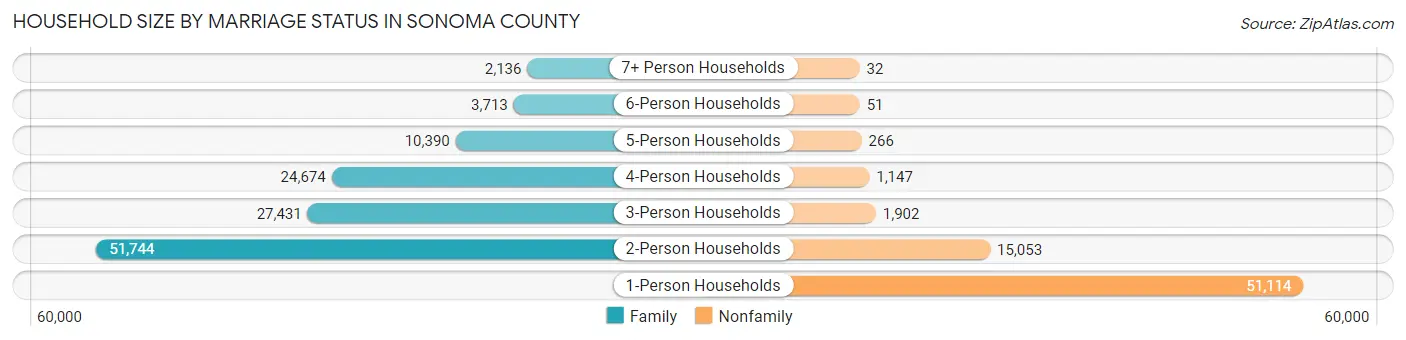
| Household Size | Family Households | Nonfamily Households |
| 1-Person Households | - | 51,114 (27.0%) |
| 2-Person Households | 51,744 (27.3%) | 15,053 (7.9%) |
| 3-Person Households | 27,431 (14.5%) | 1,902 (1.0%) |
| 4-Person Households | 24,674 (13.0%) | 1,147 (0.6%) |
| 5-Person Households | 10,390 (5.5%) | 266 (0.1%) |
| 6-Person Households | 3,713 (2.0%) | 51 (0.0%) |
| 7+ Person Households | 2,136 (1.1%) | 32 (0.0%) |
| Total | 120,088 (63.3%) | 69,565 (36.7%) |
Female Fertility in Sonoma County
Fertility by Age in Sonoma County
Average fertility rate in Sonoma County is 46.0 births per 1,000 women. Women in the age bracket of 20 to 34 years have the highest fertility rate with 68.0 births per 1,000 women. Women in the age bracket of 20 to 34 years acount for 59.4% of all women with births.
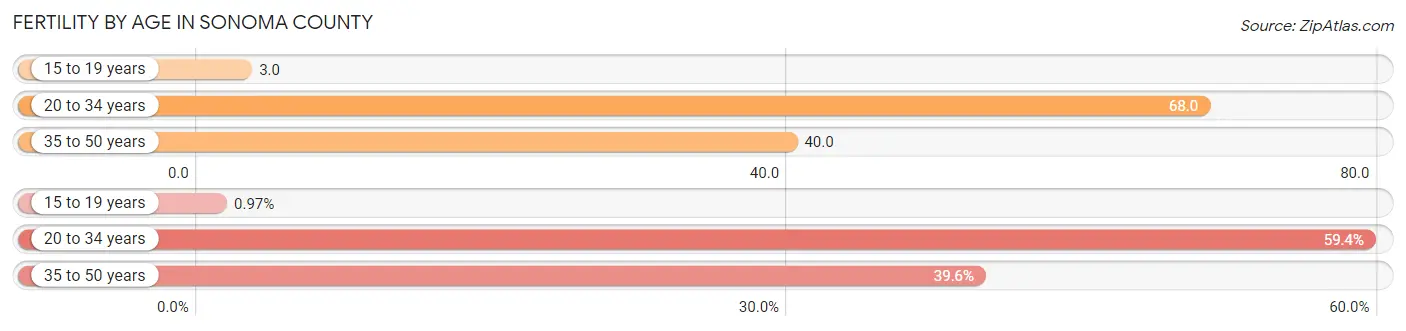
| Age Bracket | Women with Births | Births / 1,000 Women |
| 15 to 19 years | 48 (1.0%) | 3.0 |
| 20 to 34 years | 2,947 (59.4%) | 68.0 |
| 35 to 50 years | 1,963 (39.6%) | 40.0 |
| Total | 4,958 (100.0%) | 46.0 |
Fertility by Age by Marriage Status in Sonoma County
73.3% of women with births (4,958) in Sonoma County are married. The highest percentage of unmarried women with births falls into 15 to 19 years age bracket with 100.0% of them unmarried at the time of birth, while the lowest percentage of unmarried women with births belong to 35 to 50 years age bracket with 14.0% of them unmarried.
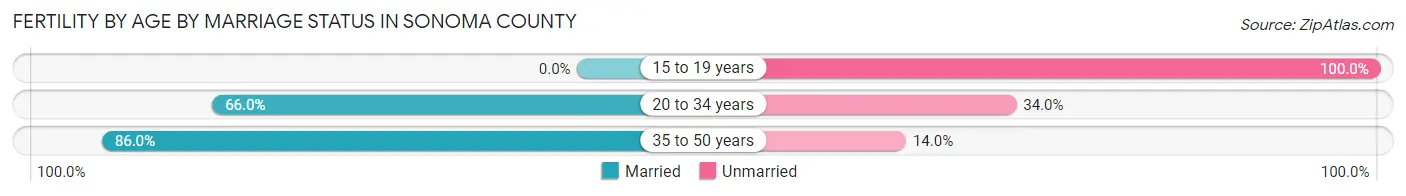
| Age Bracket | Married | Unmarried |
| 15 to 19 years | 0 (0.0%) | 48 (100.0%) |
| 20 to 34 years | 1,945 (66.0%) | 1,002 (34.0%) |
| 35 to 50 years | 1,688 (86.0%) | 275 (14.0%) |
| Total | 3,634 (73.3%) | 1,324 (26.7%) |
Fertility by Education in Sonoma County
Average fertility rate in Sonoma County is 46.0 births per 1,000 women. Women with the education attainment of graduate degree have the highest fertility rate of 60.0 births per 1,000 women, while women with the education attainment of less than high school have the lowest fertility at 17.0 births per 1,000 women. Women with the education attainment of college or associate's degree represent 37.5% of all women with births.
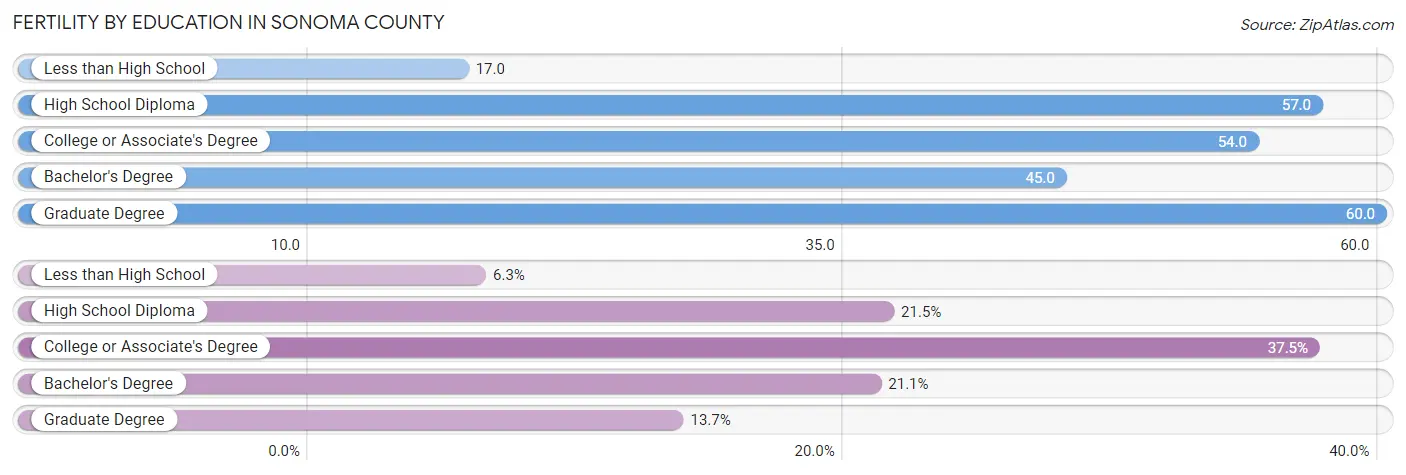
| Educational Attainment | Women with Births | Births / 1,000 Women |
| Less than High School | 310 (6.2%) | 17.0 |
| High School Diploma | 1,068 (21.5%) | 57.0 |
| College or Associate's Degree | 1,859 (37.5%) | 54.0 |
| Bachelor's Degree | 1,044 (21.1%) | 45.0 |
| Graduate Degree | 677 (13.7%) | 60.0 |
| Total | 4,958 (100.0%) | 46.0 |
Fertility by Education by Marriage Status in Sonoma County
26.7% of women with births in Sonoma County are unmarried. Women with the educational attainment of graduate degree are most likely to be married with 90.0% of them married at childbirth, while women with the educational attainment of high school diploma are least likely to be married with 40.4% of them unmarried at childbirth.
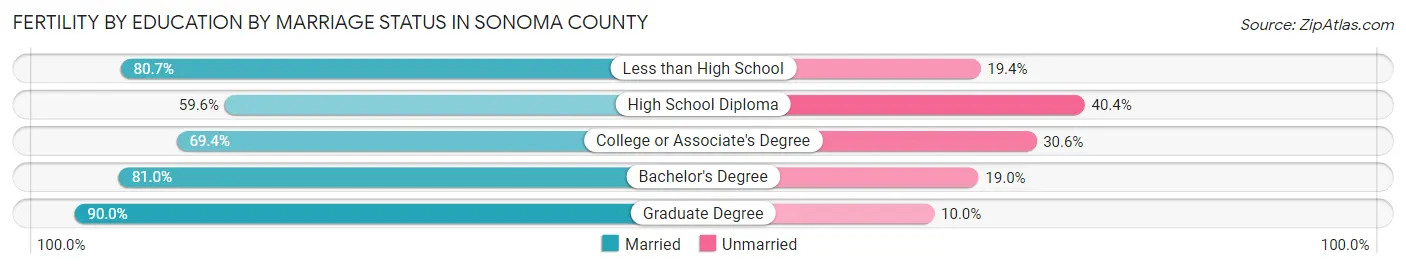
| Educational Attainment | Married | Unmarried |
| Less than High School | 250 (80.6%) | 60 (19.4%) |
| High School Diploma | 637 (59.6%) | 431 (40.4%) |
| College or Associate's Degree | 1,290 (69.4%) | 569 (30.6%) |
| Bachelor's Degree | 846 (81.0%) | 198 (19.0%) |
| Graduate Degree | 609 (90.0%) | 68 (10.0%) |
| Total | 3,634 (73.3%) | 1,324 (26.7%) |
Employment Characteristics in Sonoma County
Employment by Class of Employer in Sonoma County
Among the 242,102 employed individuals in Sonoma County, private company employees (153,385 | 63.4%), self-employed (not incorporated) (23,993 | 9.9%), and local government employees (21,968 | 9.1%) make up the most common classes of employment.
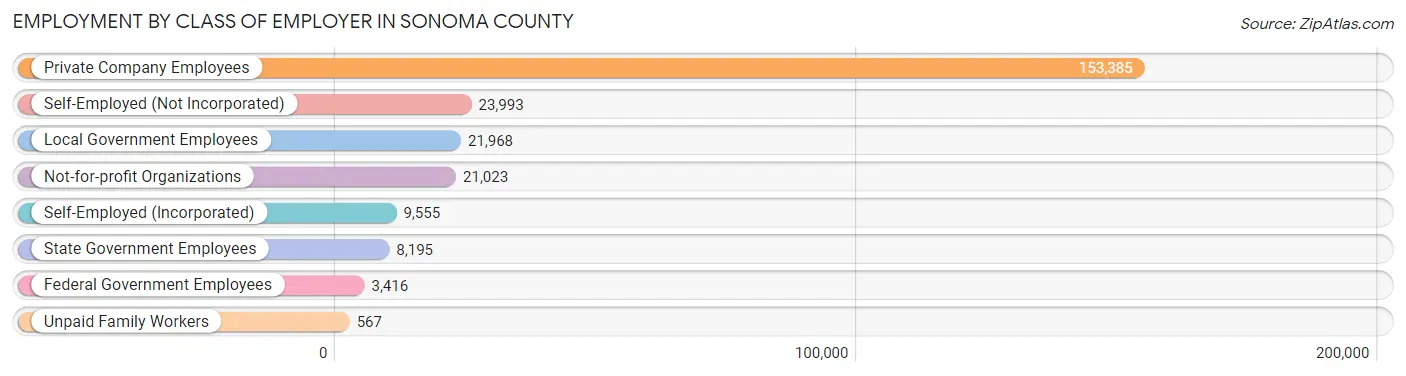
| Employer Class | # Employees | % Employees |
| Private Company Employees | 153,385 | 63.4% |
| Self-Employed (Incorporated) | 9,555 | 4.0% |
| Self-Employed (Not Incorporated) | 23,993 | 9.9% |
| Not-for-profit Organizations | 21,023 | 8.7% |
| Local Government Employees | 21,968 | 9.1% |
| State Government Employees | 8,195 | 3.4% |
| Federal Government Employees | 3,416 | 1.4% |
| Unpaid Family Workers | 567 | 0.2% |
| Total | 242,102 | 100.0% |
Employment Status by Age in Sonoma County
According to the labor force statistics for Sonoma County, out of the total population over 16 years of age (406,104), 64.6% or 262,343 individuals are in the labor force, with 5.2% or 13,642 of them unemployed. The age group with the highest labor force participation rate is 30 to 34 years, with 88.3% or 27,619 individuals in the labor force. Within the labor force, the 16 to 19 years age range has the highest percentage of unemployed individuals, with 12.1% or 1,234 of them being unemployed.
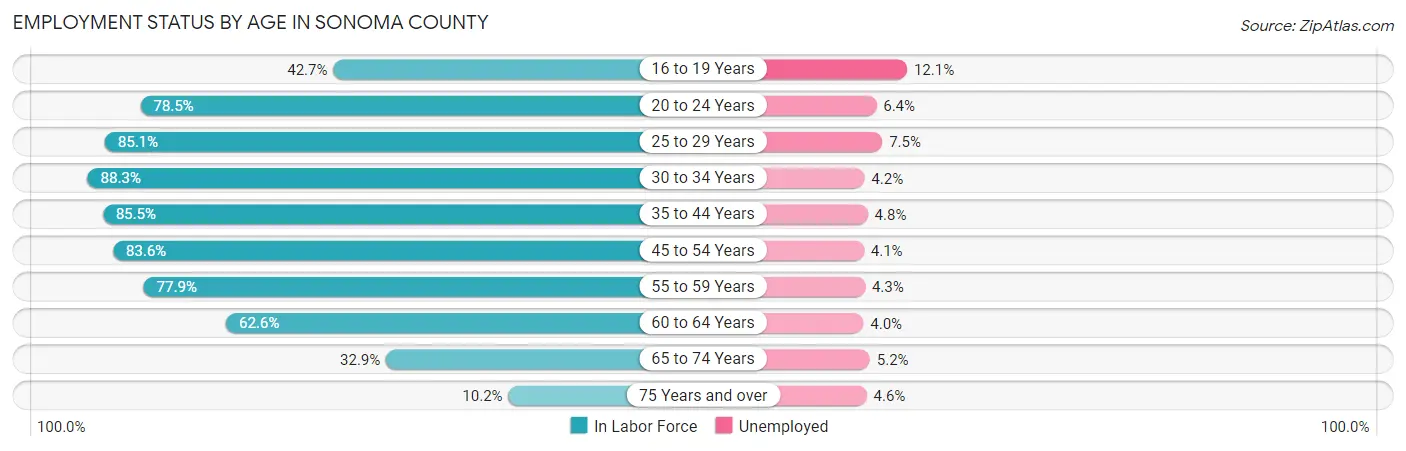
| Age Bracket | In Labor Force | Unemployed |
| 16 to 19 Years | 10,201 (42.7%) | 1,234 (12.1%) |
| 20 to 24 Years | 21,480 (78.5%) | 1,375 (6.4%) |
| 25 to 29 Years | 25,139 (85.1%) | 1,885 (7.5%) |
| 30 to 34 Years | 27,619 (88.3%) | 1,160 (4.2%) |
| 35 to 44 Years | 54,175 (85.5%) | 2,600 (4.8%) |
| 45 to 54 Years | 50,863 (83.6%) | 2,085 (4.1%) |
| 55 to 59 Years | 26,621 (77.9%) | 1,145 (4.3%) |
| 60 to 64 Years | 21,959 (62.6%) | 878 (4.0%) |
| 65 to 74 Years | 20,201 (32.9%) | 1,050 (5.2%) |
| 75 Years and over | 3,996 (10.2%) | 184 (4.6%) |
| Total | 262,343 (64.6%) | 13,642 (5.2%) |
Employment Status by Educational Attainment in Sonoma County
According to labor force statistics for Sonoma County, 81.2% of individuals (206,470) out of the total population between 25 and 64 years of age (254,274) are in the labor force, with 4.7% or 9,704 of them being unemployed. The group with the highest labor force participation rate are those with the educational attainment of bachelor's degree or higher, with 86.7% or 79,027 individuals in the labor force. Within the labor force, individuals with less than high school education have the highest percentage of unemployment, with 5.9% or 1,292 of them being unemployed.
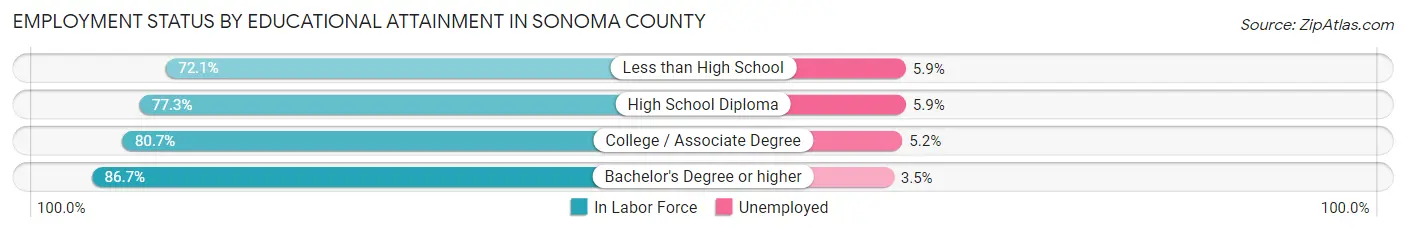
| Educational Attainment | In Labor Force | Unemployed |
| Less than High School | 21,897 (72.1%) | 1,792 (5.9%) |
| High School Diploma | 37,487 (77.3%) | 2,861 (5.9%) |
| College / Associate Degree | 67,995 (80.7%) | 4,381 (5.2%) |
| Bachelor's Degree or higher | 79,027 (86.7%) | 3,190 (3.5%) |
| Total | 206,470 (81.2%) | 11,951 (4.7%) |
Employment Occupations by Sex in Sonoma County
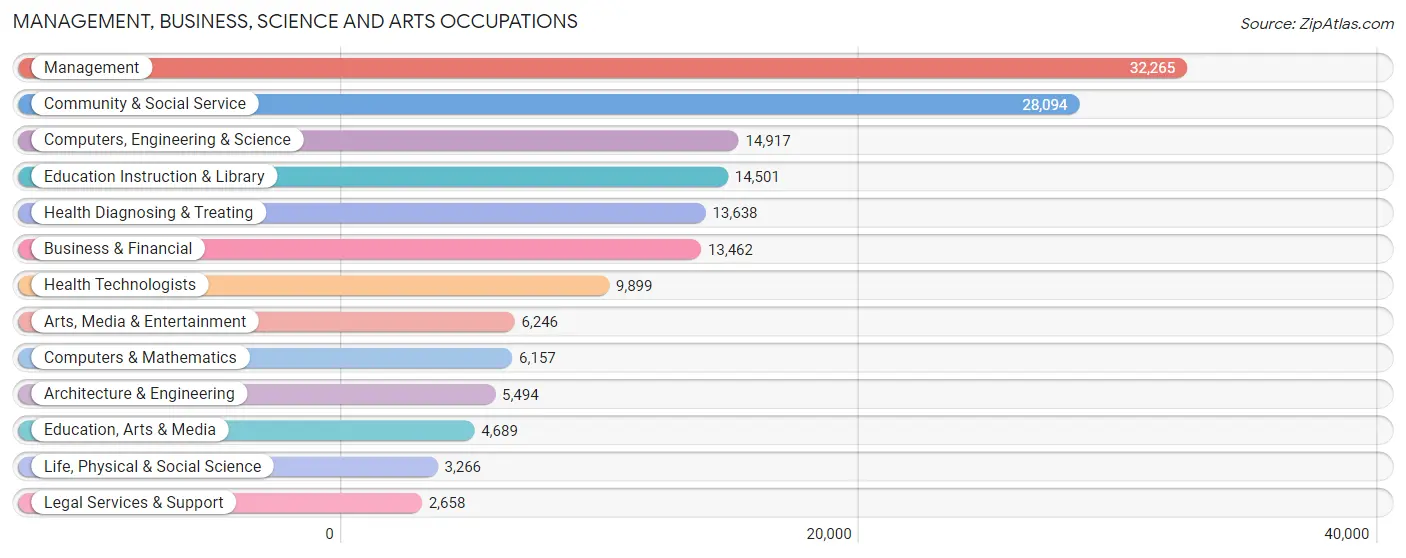
Management, Business, Science and Arts Occupations
The most common Management, Business, Science and Arts occupations in Sonoma County are Management (32,265 | 13.0%), Community & Social Service (28,094 | 11.3%), Computers, Engineering & Science (14,917 | 6.0%), Education Instruction & Library (14,501 | 5.9%), and Health Diagnosing & Treating (13,638 | 5.5%).
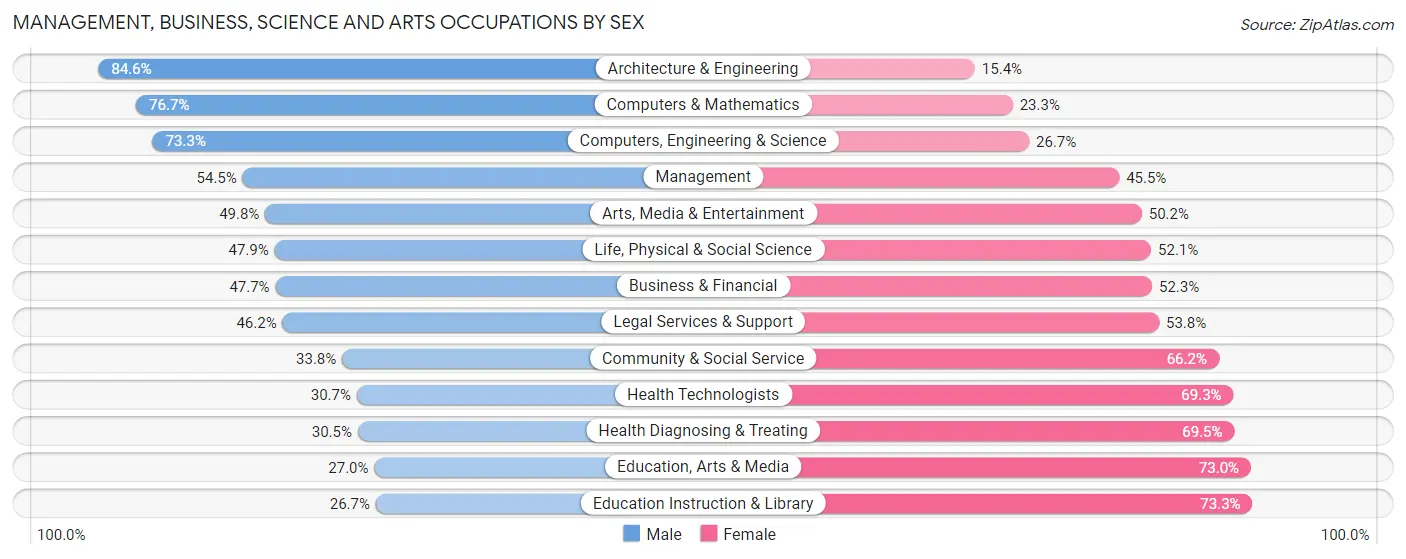
Management, Business, Science and Arts Occupations by Sex
Within the Management, Business, Science and Arts occupations in Sonoma County, the most male-oriented occupations are Architecture & Engineering (84.6%), Computers & Mathematics (76.7%), and Computers, Engineering & Science (73.3%), while the most female-oriented occupations are Education Instruction & Library (73.3%), Education, Arts & Media (73.0%), and Health Diagnosing & Treating (69.5%).
| Occupation | Male | Female |
| Management | 17,592 (54.5%) | 14,673 (45.5%) |
| Business & Financial | 6,417 (47.7%) | 7,045 (52.3%) |
| Computers, Engineering & Science | 10,936 (73.3%) | 3,981 (26.7%) |
| Computers & Mathematics | 4,724 (76.7%) | 1,433 (23.3%) |
| Architecture & Engineering | 4,649 (84.6%) | 845 (15.4%) |
| Life, Physical & Social Science | 1,563 (47.9%) | 1,703 (52.1%) |
| Community & Social Service | 9,484 (33.8%) | 18,610 (66.2%) |
| Education, Arts & Media | 1,268 (27.0%) | 3,421 (73.0%) |
| Legal Services & Support | 1,228 (46.2%) | 1,430 (53.8%) |
| Education Instruction & Library | 3,877 (26.7%) | 10,624 (73.3%) |
| Arts, Media & Entertainment | 3,111 (49.8%) | 3,135 (50.2%) |
| Health Diagnosing & Treating | 4,159 (30.5%) | 9,479 (69.5%) |
| Health Technologists | 3,039 (30.7%) | 6,860 (69.3%) |
| Total (Category) | 48,588 (47.5%) | 53,788 (52.5%) |
| Total (Overall) | 130,255 (52.5%) | 117,660 (47.5%) |
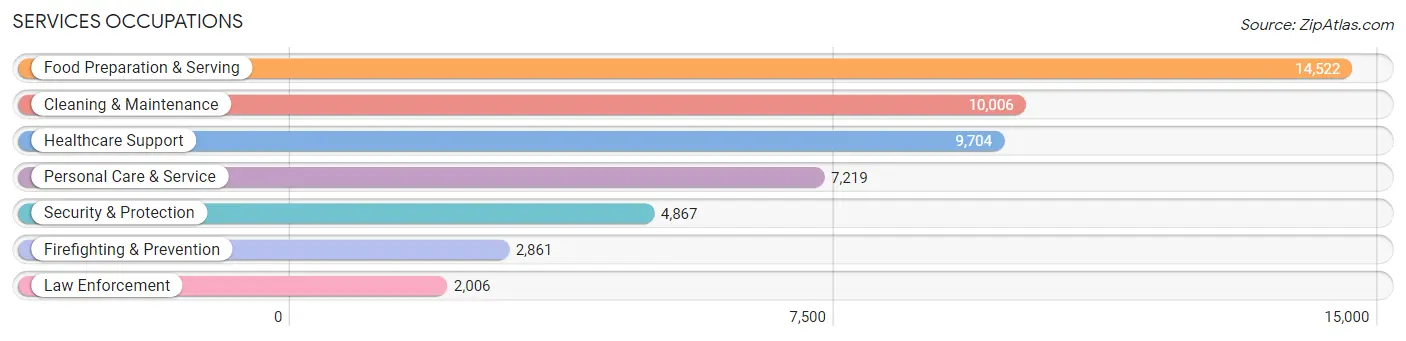
Services Occupations
The most common Services occupations in Sonoma County are Food Preparation & Serving (14,522 | 5.9%), Cleaning & Maintenance (10,006 | 4.0%), Healthcare Support (9,704 | 3.9%), Personal Care & Service (7,219 | 2.9%), and Security & Protection (4,867 | 2.0%).
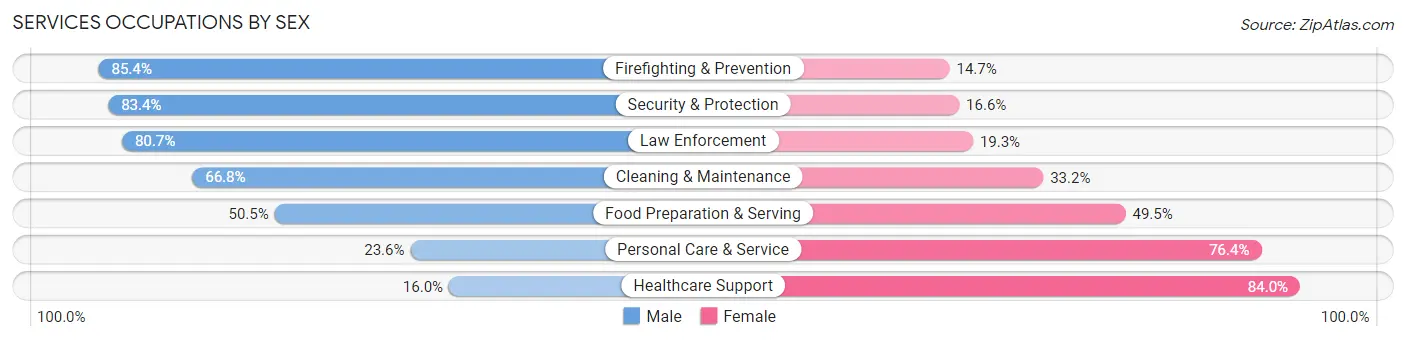
Services Occupations by Sex
Within the Services occupations in Sonoma County, the most male-oriented occupations are Firefighting & Prevention (85.4%), Security & Protection (83.4%), and Law Enforcement (80.7%), while the most female-oriented occupations are Healthcare Support (84.0%), Personal Care & Service (76.4%), and Food Preparation & Serving (49.5%).
| Occupation | Male | Female |
| Healthcare Support | 1,551 (16.0%) | 8,153 (84.0%) |
| Security & Protection | 4,061 (83.4%) | 806 (16.6%) |
| Firefighting & Prevention | 2,442 (85.4%) | 419 (14.6%) |
| Law Enforcement | 1,619 (80.7%) | 387 (19.3%) |
| Food Preparation & Serving | 7,334 (50.5%) | 7,188 (49.5%) |
| Cleaning & Maintenance | 6,683 (66.8%) | 3,323 (33.2%) |
| Personal Care & Service | 1,706 (23.6%) | 5,513 (76.4%) |
| Total (Category) | 21,335 (46.1%) | 24,983 (53.9%) |
| Total (Overall) | 130,255 (52.5%) | 117,660 (47.5%) |
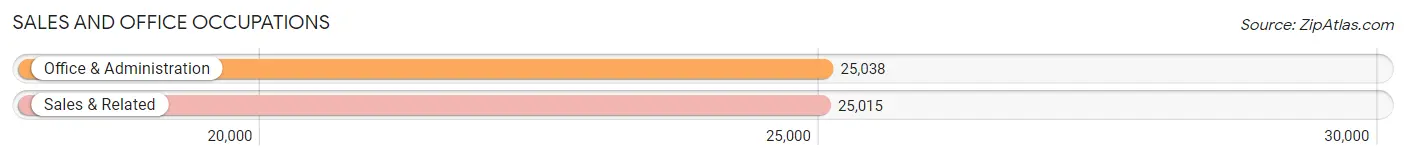
Sales and Office Occupations
The most common Sales and Office occupations in Sonoma County are Office & Administration (25,038 | 10.1%), and Sales & Related (25,015 | 10.1%).
Sales and Office Occupations by Sex
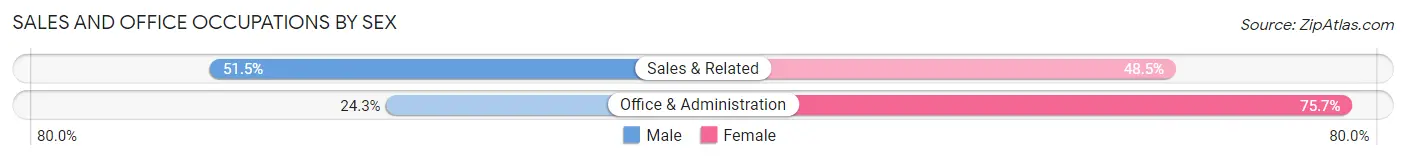
| Occupation | Male | Female |
| Sales & Related | 12,877 (51.5%) | 12,138 (48.5%) |
| Office & Administration | 6,095 (24.3%) | 18,943 (75.7%) |
| Total (Category) | 18,972 (37.9%) | 31,081 (62.1%) |
| Total (Overall) | 130,255 (52.5%) | 117,660 (47.5%) |
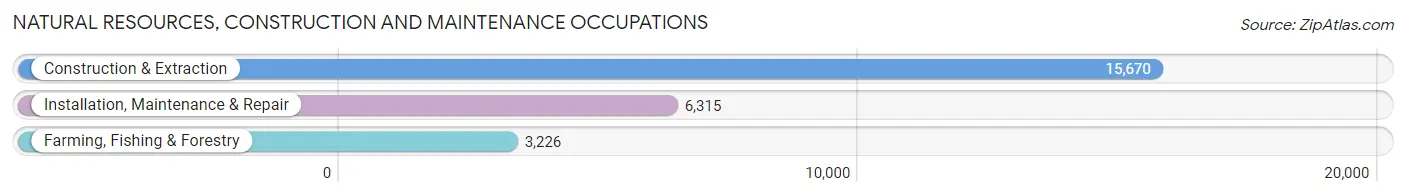
Natural Resources, Construction and Maintenance Occupations
The most common Natural Resources, Construction and Maintenance occupations in Sonoma County are Construction & Extraction (15,670 | 6.3%), Installation, Maintenance & Repair (6,315 | 2.5%), and Farming, Fishing & Forestry (3,226 | 1.3%).
Natural Resources, Construction and Maintenance Occupations by Sex
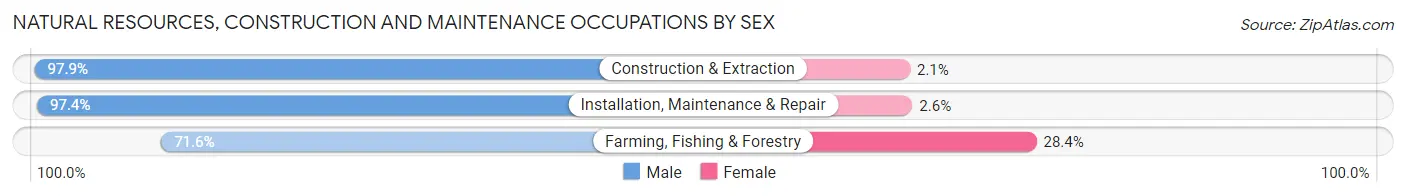
| Occupation | Male | Female |
| Farming, Fishing & Forestry | 2,309 (71.6%) | 917 (28.4%) |
| Construction & Extraction | 15,341 (97.9%) | 329 (2.1%) |
| Installation, Maintenance & Repair | 6,151 (97.4%) | 164 (2.6%) |
| Total (Category) | 23,801 (94.4%) | 1,410 (5.6%) |
| Total (Overall) | 130,255 (52.5%) | 117,660 (47.5%) |
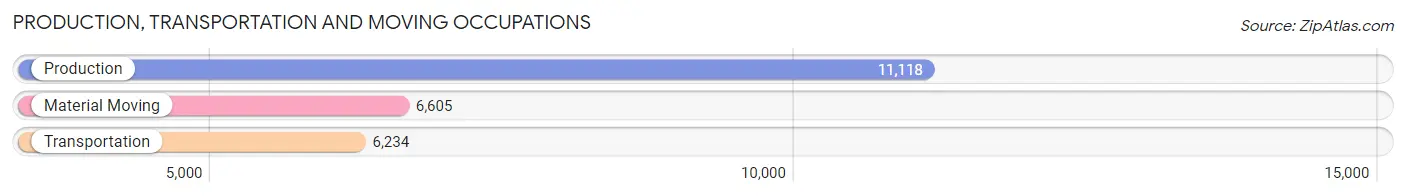
Production, Transportation and Moving Occupations
The most common Production, Transportation and Moving occupations in Sonoma County are Production (11,118 | 4.5%), Material Moving (6,605 | 2.7%), and Transportation (6,234 | 2.5%).
Production, Transportation and Moving Occupations by Sex
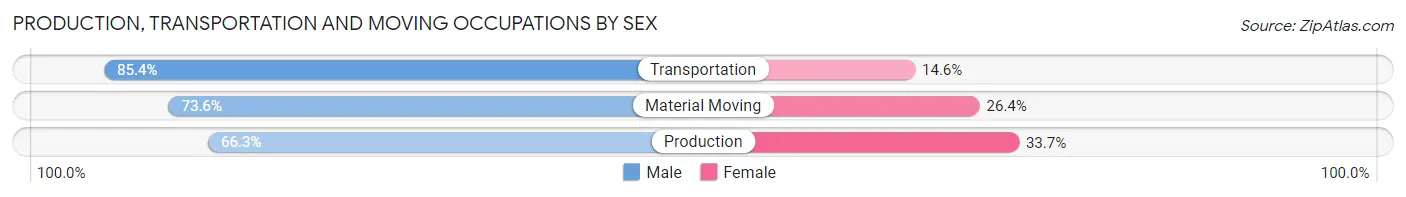
| Occupation | Male | Female |
| Production | 7,376 (66.3%) | 3,742 (33.7%) |
| Transportation | 5,324 (85.4%) | 910 (14.6%) |
| Material Moving | 4,859 (73.6%) | 1,746 (26.4%) |
| Total (Category) | 17,559 (73.3%) | 6,398 (26.7%) |
| Total (Overall) | 130,255 (52.5%) | 117,660 (47.5%) |
Employment Industries by Sex in Sonoma County
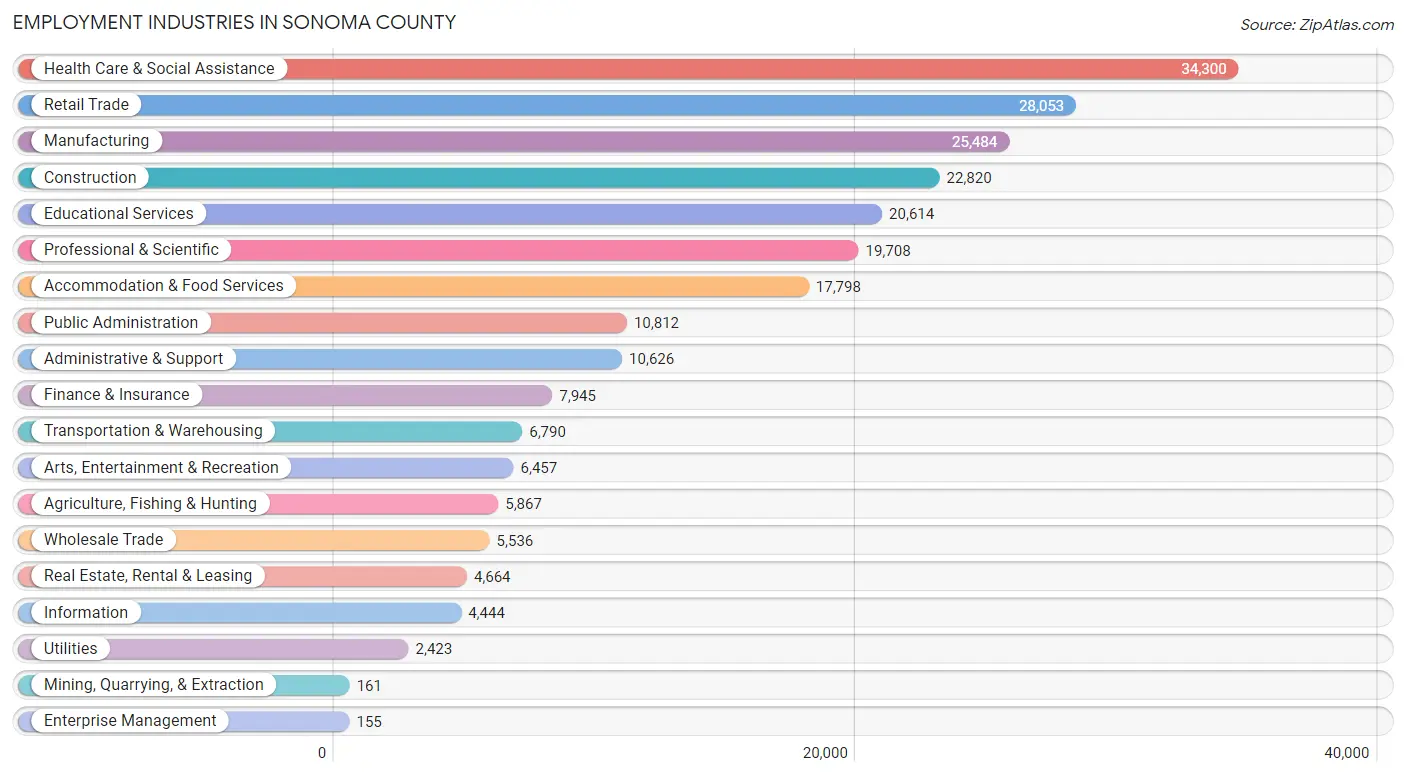
Employment Industries in Sonoma County
The major employment industries in Sonoma County include Health Care & Social Assistance (34,300 | 13.8%), Retail Trade (28,053 | 11.3%), Manufacturing (25,484 | 10.3%), Construction (22,820 | 9.2%), and Educational Services (20,614 | 8.3%).
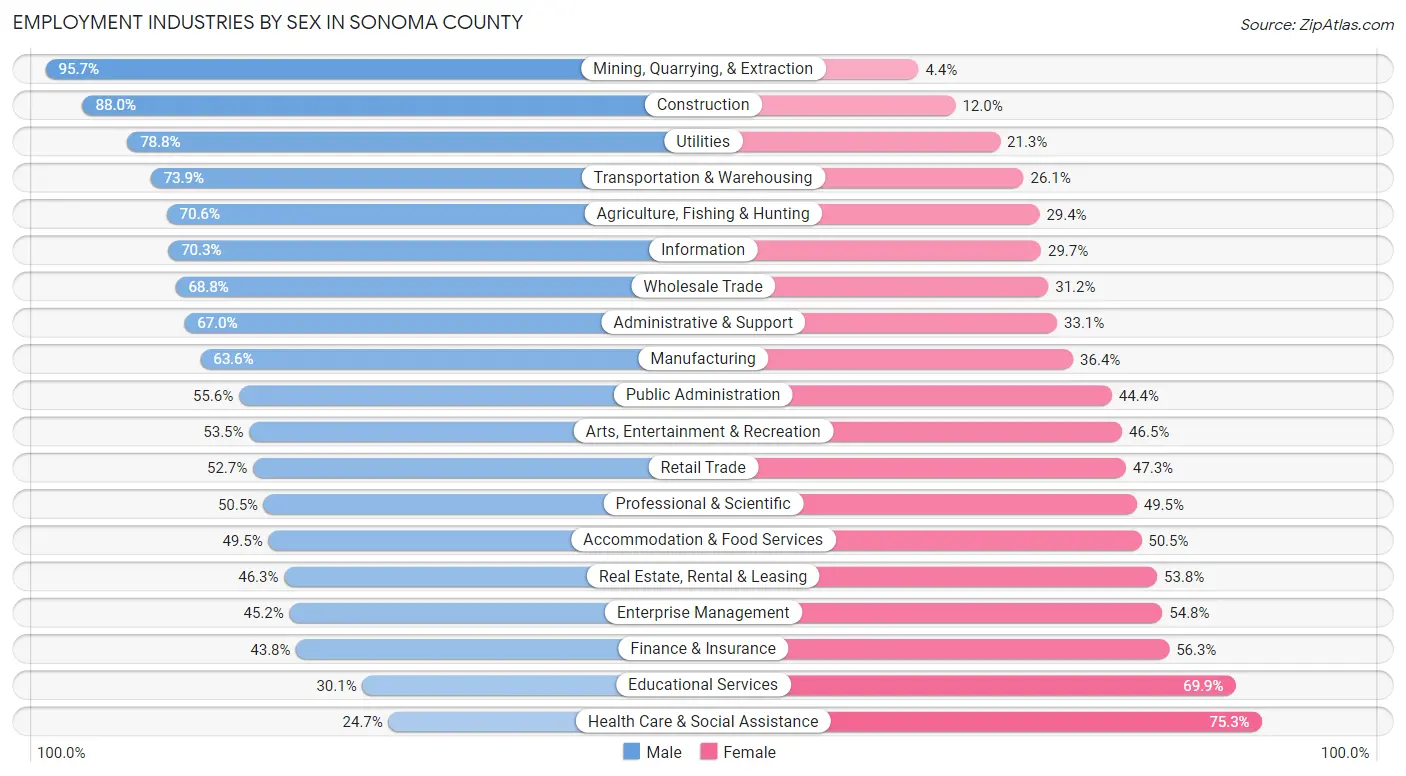
Employment Industries by Sex in Sonoma County
The Sonoma County industries that see more men than women are Mining, Quarrying, & Extraction (95.7%), Construction (88.0%), and Utilities (78.7%), whereas the industries that tend to have a higher number of women are Health Care & Social Assistance (75.3%), Educational Services (69.9%), and Finance & Insurance (56.2%).
| Industry | Male | Female |
| Agriculture, Fishing & Hunting | 4,142 (70.6%) | 1,725 (29.4%) |
| Mining, Quarrying, & Extraction | 154 (95.7%) | 7 (4.3%) |
| Construction | 20,078 (88.0%) | 2,742 (12.0%) |
| Manufacturing | 16,213 (63.6%) | 9,271 (36.4%) |
| Wholesale Trade | 3,807 (68.8%) | 1,729 (31.2%) |
| Retail Trade | 14,786 (52.7%) | 13,267 (47.3%) |
| Transportation & Warehousing | 5,017 (73.9%) | 1,773 (26.1%) |
| Utilities | 1,908 (78.7%) | 515 (21.2%) |
| Information | 3,123 (70.3%) | 1,321 (29.7%) |
| Finance & Insurance | 3,476 (43.8%) | 4,469 (56.2%) |
| Real Estate, Rental & Leasing | 2,157 (46.3%) | 2,507 (53.7%) |
| Professional & Scientific | 9,944 (50.5%) | 9,764 (49.5%) |
| Enterprise Management | 70 (45.2%) | 85 (54.8%) |
| Administrative & Support | 7,114 (66.9%) | 3,512 (33.1%) |
| Educational Services | 6,197 (30.1%) | 14,417 (69.9%) |
| Health Care & Social Assistance | 8,460 (24.7%) | 25,840 (75.3%) |
| Arts, Entertainment & Recreation | 3,453 (53.5%) | 3,004 (46.5%) |
| Accommodation & Food Services | 8,814 (49.5%) | 8,984 (50.5%) |
| Public Administration | 6,013 (55.6%) | 4,799 (44.4%) |
| Total | 130,255 (52.5%) | 117,660 (47.5%) |
Education in Sonoma County
School Enrollment in Sonoma County
The most common levels of schooling among the 109,119 students in Sonoma County are college / undergraduate (26,866 | 24.6%), high school (24,643 | 22.6%), and middle school (21,201 | 19.4%).
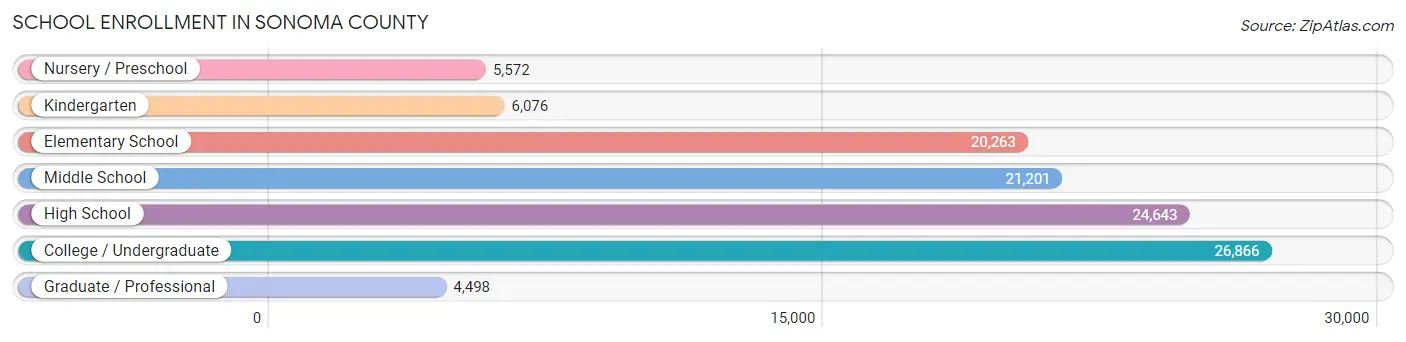
| School Level | # Students | % Students |
| Nursery / Preschool | 5,572 | 5.1% |
| Kindergarten | 6,076 | 5.6% |
| Elementary School | 20,263 | 18.6% |
| Middle School | 21,201 | 19.4% |
| High School | 24,643 | 22.6% |
| College / Undergraduate | 26,866 | 24.6% |
| Graduate / Professional | 4,498 | 4.1% |
| Total | 109,119 | 100.0% |
School Enrollment by Age by Funding Source in Sonoma County
Out of a total of 109,119 students who are enrolled in schools in Sonoma County, 12,876 (11.8%) attend a private institution, while the remaining 96,243 (88.2%) are enrolled in public schools. The age group of 3 to 4 year olds has the highest likelihood of being enrolled in private schools, with 2,431 (54.3% in the age bracket) enrolled. Conversely, the age group of 20 to 24 year olds has the lowest likelihood of being enrolled in a private school, with 11,112 (92.8% in the age bracket) attending a public institution.
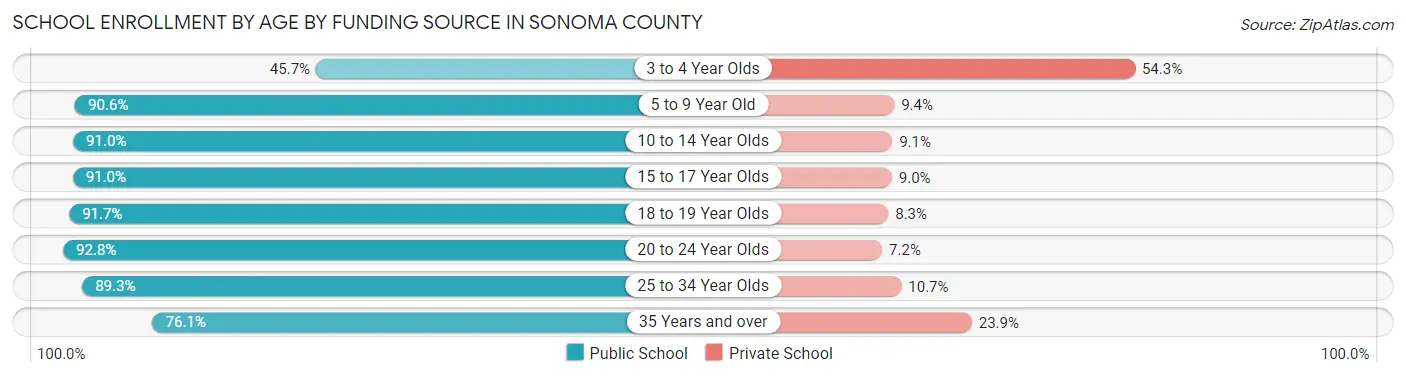
| Age Bracket | Public School | Private School |
| 3 to 4 Year Olds | 2,049 (45.7%) | 2,431 (54.3%) |
| 5 to 9 Year Old | 22,635 (90.6%) | 2,352 (9.4%) |
| 10 to 14 Year Olds | 24,708 (90.9%) | 2,460 (9.0%) |
| 15 to 17 Year Olds | 15,612 (91.0%) | 1,541 (9.0%) |
| 18 to 19 Year Olds | 8,288 (91.7%) | 751 (8.3%) |
| 20 to 24 Year Olds | 11,112 (92.8%) | 858 (7.2%) |
| 25 to 34 Year Olds | 6,696 (89.3%) | 806 (10.7%) |
| 35 Years and over | 5,193 (76.1%) | 1,627 (23.9%) |
| Total | 96,243 (88.2%) | 12,876 (11.8%) |
Educational Attainment by Field of Study in Sonoma County
Business (21,617 | 14.8%), social sciences (17,531 | 12.0%), bio, nature & agricultural (13,260 | 9.1%), science & technology (11,856 | 8.1%), and liberal arts & history (10,322 | 7.1%) are the most common fields of study among 146,110 individuals in Sonoma County who have obtained a bachelor's degree or higher.
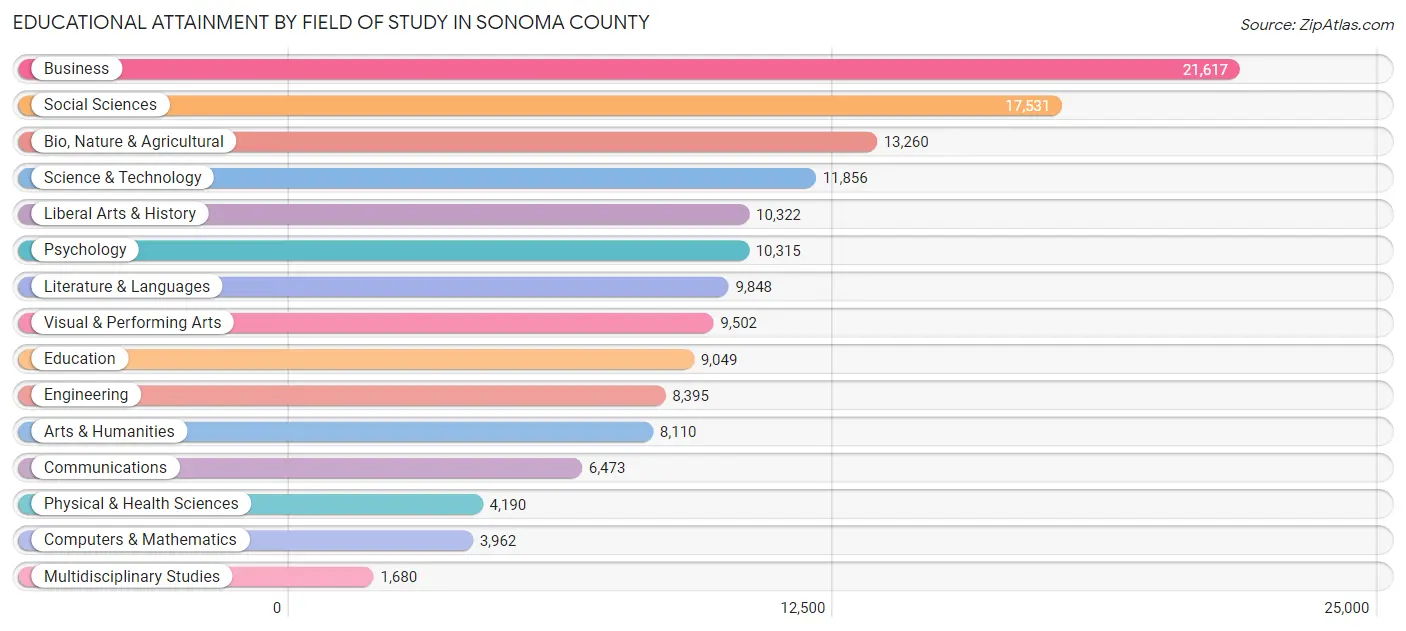
| Field of Study | # Graduates | % Graduates |
| Computers & Mathematics | 3,962 | 2.7% |
| Bio, Nature & Agricultural | 13,260 | 9.1% |
| Physical & Health Sciences | 4,190 | 2.9% |
| Psychology | 10,315 | 7.1% |
| Social Sciences | 17,531 | 12.0% |
| Engineering | 8,395 | 5.8% |
| Multidisciplinary Studies | 1,680 | 1.1% |
| Science & Technology | 11,856 | 8.1% |
| Business | 21,617 | 14.8% |
| Education | 9,049 | 6.2% |
| Literature & Languages | 9,848 | 6.7% |
| Liberal Arts & History | 10,322 | 7.1% |
| Visual & Performing Arts | 9,502 | 6.5% |
| Communications | 6,473 | 4.4% |
| Arts & Humanities | 8,110 | 5.6% |
| Total | 146,110 | 100.0% |
Transportation & Commute in Sonoma County
Vehicle Availability by Sex in Sonoma County
The most prevalent vehicle ownership categories in Sonoma County are males with 2 vehicles (50,130, accounting for 39.6%) and females with 2 vehicles (43,473, making up 44.2%).
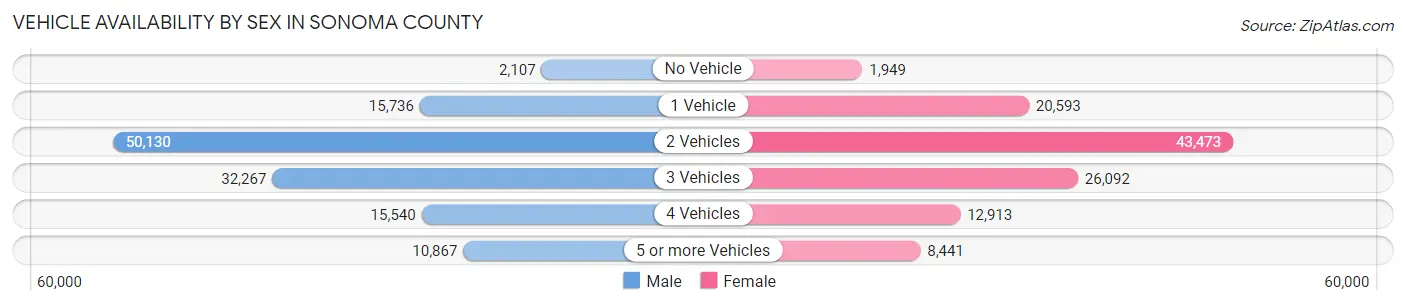
| Vehicles Available | Male | Female |
| No Vehicle | 2,107 (1.7%) | 1,949 (1.7%) |
| 1 Vehicle | 15,736 (12.4%) | 20,593 (18.1%) |
| 2 Vehicles | 50,130 (39.6%) | 43,473 (38.3%) |
| 3 Vehicles | 32,267 (25.5%) | 26,092 (23.0%) |
| 4 Vehicles | 15,540 (12.3%) | 12,913 (11.4%) |
| 5 or more Vehicles | 10,867 (8.6%) | 8,441 (7.4%) |
| Total | 126,647 (100.0%) | 113,461 (100.0%) |
Commute Time in Sonoma County
The most frequently occuring commute durations in Sonoma County are 15 to 19 minutes (35,616 commuters, 16.9%), 10 to 14 minutes (35,202 commuters, 16.7%), and 20 to 24 minutes (28,530 commuters, 13.5%).
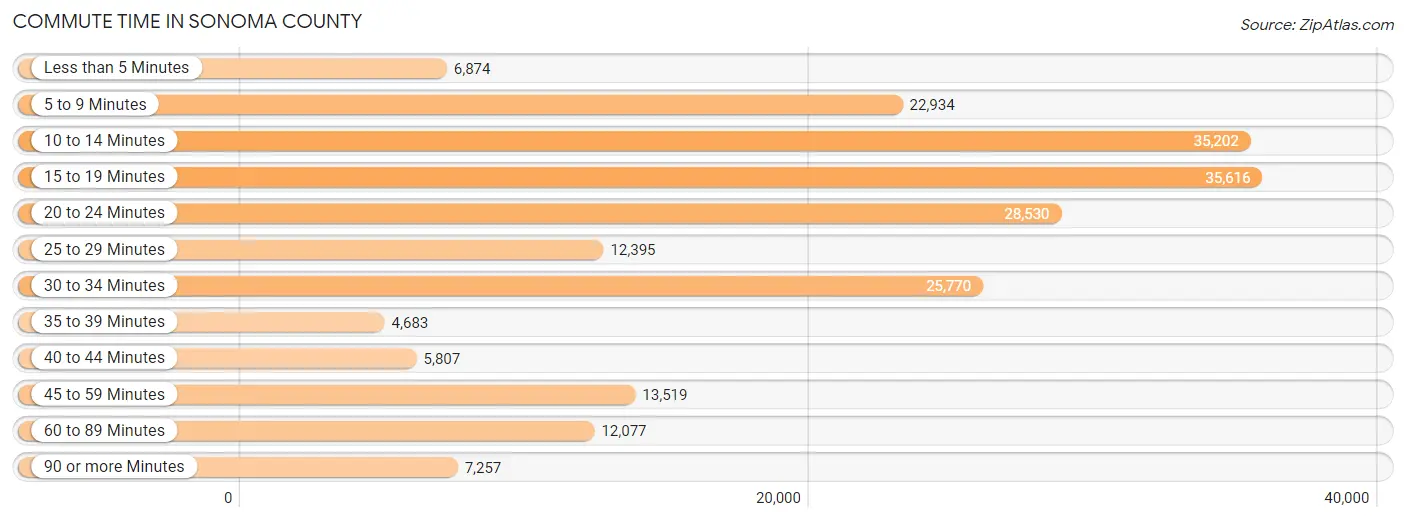
| Commute Time | # Commuters | % Commuters |
| Less than 5 Minutes | 6,874 | 3.3% |
| 5 to 9 Minutes | 22,934 | 10.9% |
| 10 to 14 Minutes | 35,202 | 16.7% |
| 15 to 19 Minutes | 35,616 | 16.9% |
| 20 to 24 Minutes | 28,530 | 13.5% |
| 25 to 29 Minutes | 12,395 | 5.9% |
| 30 to 34 Minutes | 25,770 | 12.2% |
| 35 to 39 Minutes | 4,683 | 2.2% |
| 40 to 44 Minutes | 5,807 | 2.8% |
| 45 to 59 Minutes | 13,519 | 6.4% |
| 60 to 89 Minutes | 12,077 | 5.7% |
| 90 or more Minutes | 7,257 | 3.4% |
Commute Time by Sex in Sonoma County
The most common commute times in Sonoma County are 15 to 19 minutes (18,782 commuters, 16.6%) for males and 10 to 14 minutes (17,104 commuters, 17.6%) for females.
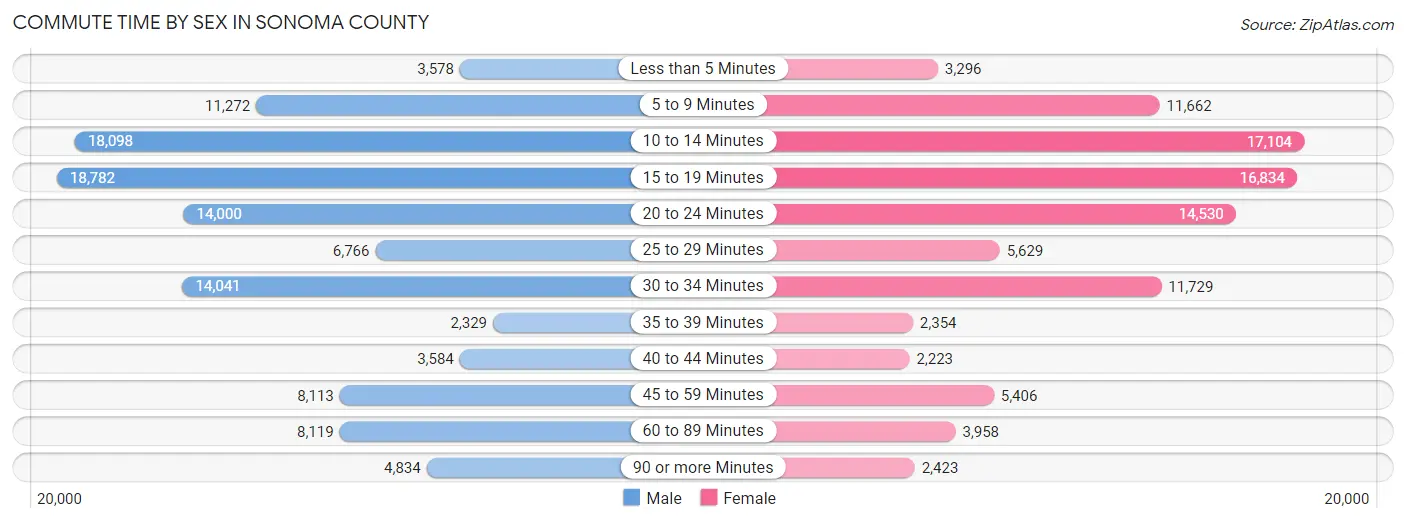
| Commute Time | Male | Female |
| Less than 5 Minutes | 3,578 (3.2%) | 3,296 (3.4%) |
| 5 to 9 Minutes | 11,272 (9.9%) | 11,662 (12.0%) |
| 10 to 14 Minutes | 18,098 (15.9%) | 17,104 (17.6%) |
| 15 to 19 Minutes | 18,782 (16.6%) | 16,834 (17.3%) |
| 20 to 24 Minutes | 14,000 (12.3%) | 14,530 (15.0%) |
| 25 to 29 Minutes | 6,766 (6.0%) | 5,629 (5.8%) |
| 30 to 34 Minutes | 14,041 (12.4%) | 11,729 (12.1%) |
| 35 to 39 Minutes | 2,329 (2.1%) | 2,354 (2.4%) |
| 40 to 44 Minutes | 3,584 (3.2%) | 2,223 (2.3%) |
| 45 to 59 Minutes | 8,113 (7.1%) | 5,406 (5.6%) |
| 60 to 89 Minutes | 8,119 (7.1%) | 3,958 (4.1%) |
| 90 or more Minutes | 4,834 (4.3%) | 2,423 (2.5%) |
Time of Departure to Work by Sex in Sonoma County
The most frequent times of departure to work in Sonoma County are 7:00 AM to 7:29 AM (14,142, 12.5%) for males and 7:30 AM to 7:59 AM (15,918, 16.4%) for females.
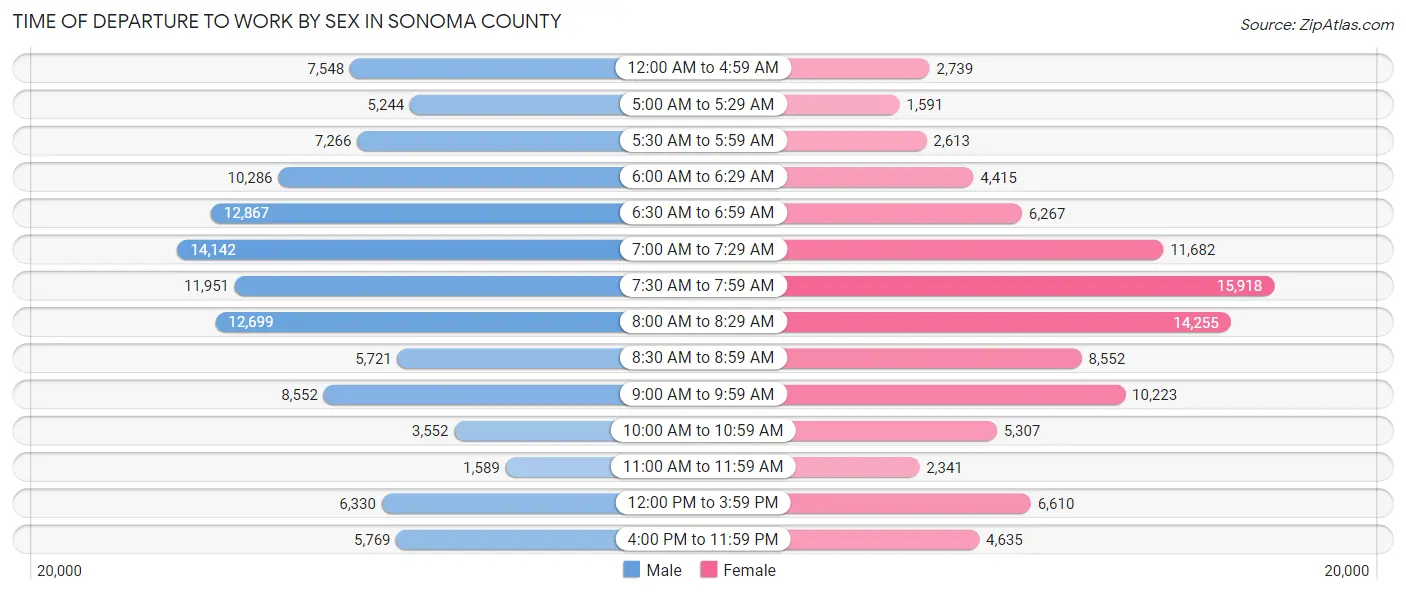
| Time of Departure | Male | Female |
| 12:00 AM to 4:59 AM | 7,548 (6.7%) | 2,739 (2.8%) |
| 5:00 AM to 5:29 AM | 5,244 (4.6%) | 1,591 (1.6%) |
| 5:30 AM to 5:59 AM | 7,266 (6.4%) | 2,613 (2.7%) |
| 6:00 AM to 6:29 AM | 10,286 (9.1%) | 4,415 (4.5%) |
| 6:30 AM to 6:59 AM | 12,867 (11.3%) | 6,267 (6.5%) |
| 7:00 AM to 7:29 AM | 14,142 (12.5%) | 11,682 (12.0%) |
| 7:30 AM to 7:59 AM | 11,951 (10.5%) | 15,918 (16.4%) |
| 8:00 AM to 8:29 AM | 12,699 (11.2%) | 14,255 (14.7%) |
| 8:30 AM to 8:59 AM | 5,721 (5.0%) | 8,552 (8.8%) |
| 9:00 AM to 9:59 AM | 8,552 (7.5%) | 10,223 (10.5%) |
| 10:00 AM to 10:59 AM | 3,552 (3.1%) | 5,307 (5.5%) |
| 11:00 AM to 11:59 AM | 1,589 (1.4%) | 2,341 (2.4%) |
| 12:00 PM to 3:59 PM | 6,330 (5.6%) | 6,610 (6.8%) |
| 4:00 PM to 11:59 PM | 5,769 (5.1%) | 4,635 (4.8%) |
| Total | 113,516 (100.0%) | 97,148 (100.0%) |
Housing Occupancy in Sonoma County
Occupancy by Ownership in Sonoma County
Of the total 189,653 dwellings in Sonoma County, owner-occupied units account for 116,921 (61.7%), while renter-occupied units make up 72,732 (38.4%).
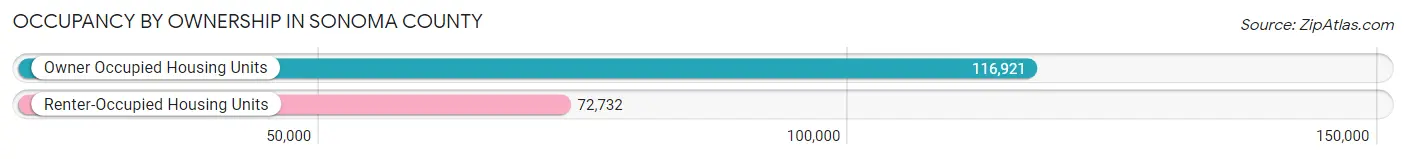
| Occupancy | # Housing Units | % Housing Units |
| Owner Occupied Housing Units | 116,921 | 61.7% |
| Renter-Occupied Housing Units | 72,732 | 38.4% |
| Total Occupied Housing Units | 189,653 | 100.0% |
Occupancy by Household Size in Sonoma County
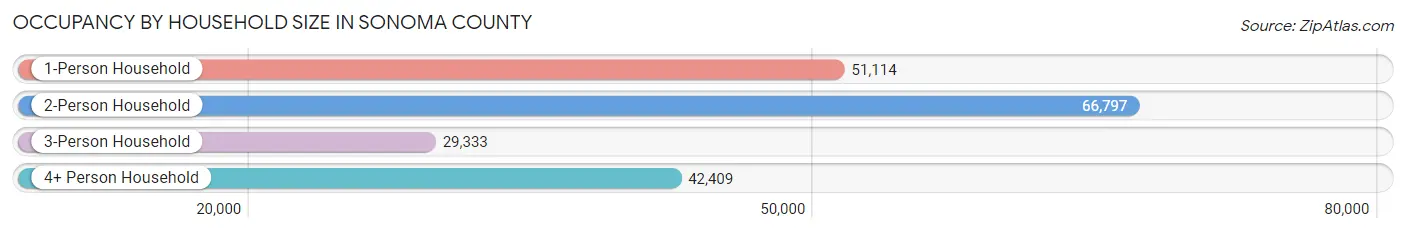
| Household Size | # Housing Units | % Housing Units |
| 1-Person Household | 51,114 | 27.0% |
| 2-Person Household | 66,797 | 35.2% |
| 3-Person Household | 29,333 | 15.5% |
| 4+ Person Household | 42,409 | 22.4% |
| Total Housing Units | 189,653 | 100.0% |
Occupancy by Ownership by Household Size in Sonoma County
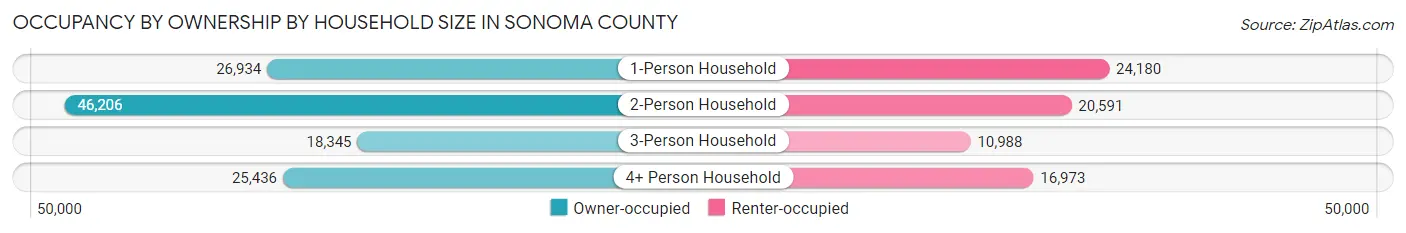
| Household Size | Owner-occupied | Renter-occupied |
| 1-Person Household | 26,934 (52.7%) | 24,180 (47.3%) |
| 2-Person Household | 46,206 (69.2%) | 20,591 (30.8%) |
| 3-Person Household | 18,345 (62.5%) | 10,988 (37.5%) |
| 4+ Person Household | 25,436 (60.0%) | 16,973 (40.0%) |
| Total Housing Units | 116,921 (61.7%) | 72,732 (38.4%) |
Occupancy by Educational Attainment in Sonoma County
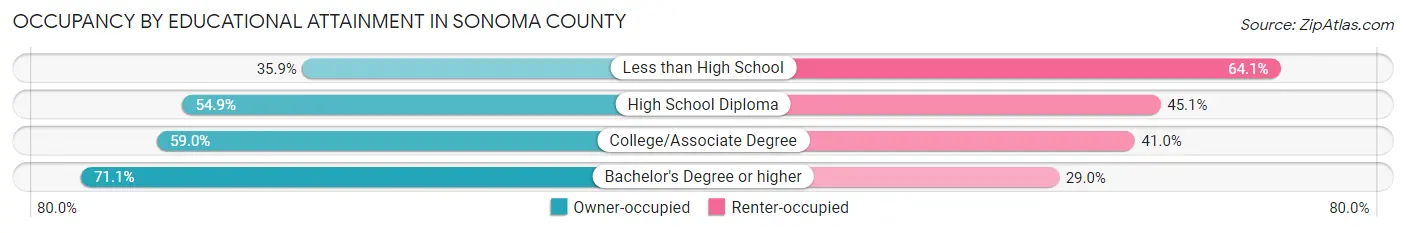
| Household Size | Owner-occupied | Renter-occupied |
| Less than High School | 5,354 (35.9%) | 9,564 (64.1%) |
| High School Diploma | 15,374 (54.9%) | 12,607 (45.1%) |
| College/Associate Degree | 39,553 (59.0%) | 27,481 (41.0%) |
| Bachelor's Degree or higher | 56,640 (71.1%) | 23,080 (28.9%) |
Occupancy by Age of Householder in Sonoma County
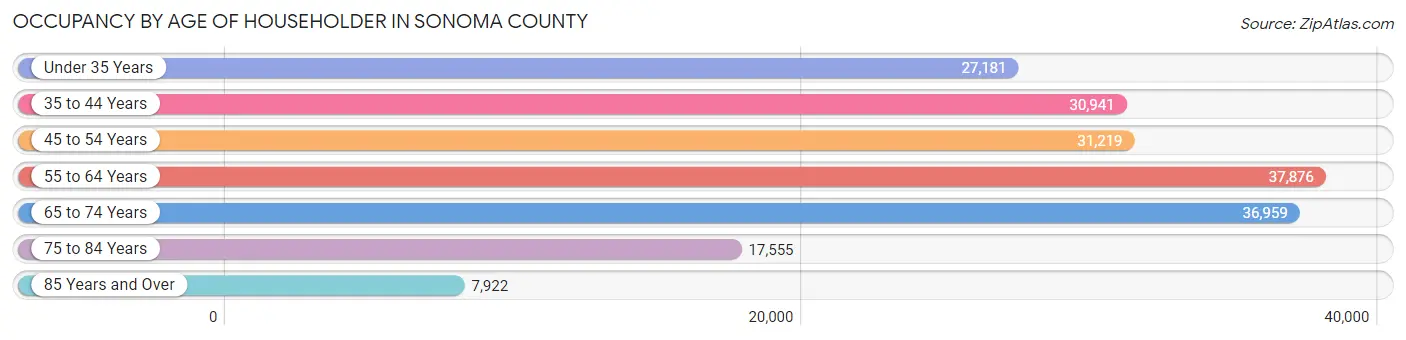
| Age Bracket | # Households | % Households |
| Under 35 Years | 27,181 | 14.3% |
| 35 to 44 Years | 30,941 | 16.3% |
| 45 to 54 Years | 31,219 | 16.5% |
| 55 to 64 Years | 37,876 | 20.0% |
| 65 to 74 Years | 36,959 | 19.5% |
| 75 to 84 Years | 17,555 | 9.3% |
| 85 Years and Over | 7,922 | 4.2% |
| Total | 189,653 | 100.0% |
Housing Finances in Sonoma County
Median Income by Occupancy in Sonoma County
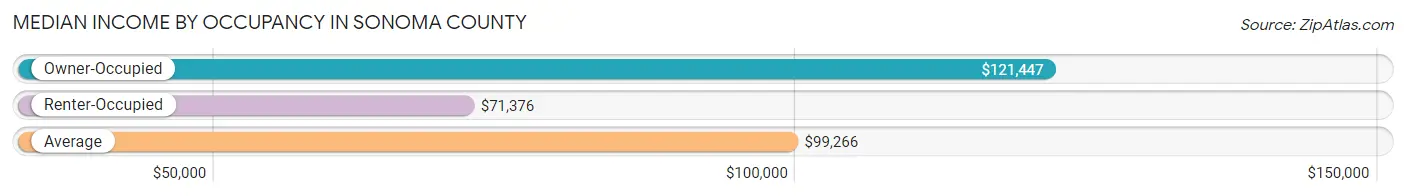
| Occupancy Type | # Households | Median Income |
| Owner-Occupied | 116,921 (61.7%) | $121,447 |
| Renter-Occupied | 72,732 (38.4%) | $71,376 |
| Average | 189,653 (100.0%) | $99,266 |
Occupancy by Householder Income Bracket in Sonoma County
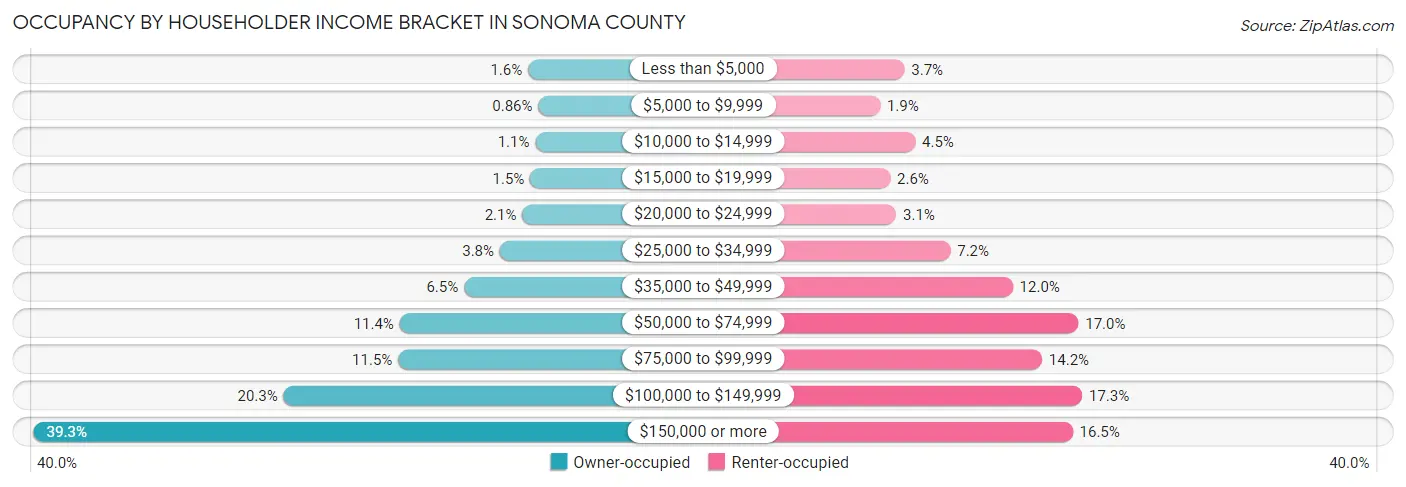
| Income Bracket | Owner-occupied | Renter-occupied |
| Less than $5,000 | 1,918 (1.6%) | 2,705 (3.7%) |
| $5,000 to $9,999 | 1,004 (0.9%) | 1,355 (1.9%) |
| $10,000 to $14,999 | 1,279 (1.1%) | 3,303 (4.5%) |
| $15,000 to $19,999 | 1,728 (1.5%) | 1,916 (2.6%) |
| $20,000 to $24,999 | 2,431 (2.1%) | 2,247 (3.1%) |
| $25,000 to $34,999 | 4,436 (3.8%) | 5,248 (7.2%) |
| $35,000 to $49,999 | 7,622 (6.5%) | 8,706 (12.0%) |
| $50,000 to $74,999 | 13,348 (11.4%) | 12,345 (17.0%) |
| $75,000 to $99,999 | 13,493 (11.5%) | 10,326 (14.2%) |
| $100,000 to $149,999 | 23,704 (20.3%) | 12,550 (17.3%) |
| $150,000 or more | 45,958 (39.3%) | 12,031 (16.5%) |
| Total | 116,921 (100.0%) | 72,732 (100.0%) |
Monthly Housing Cost Tiers in Sonoma County
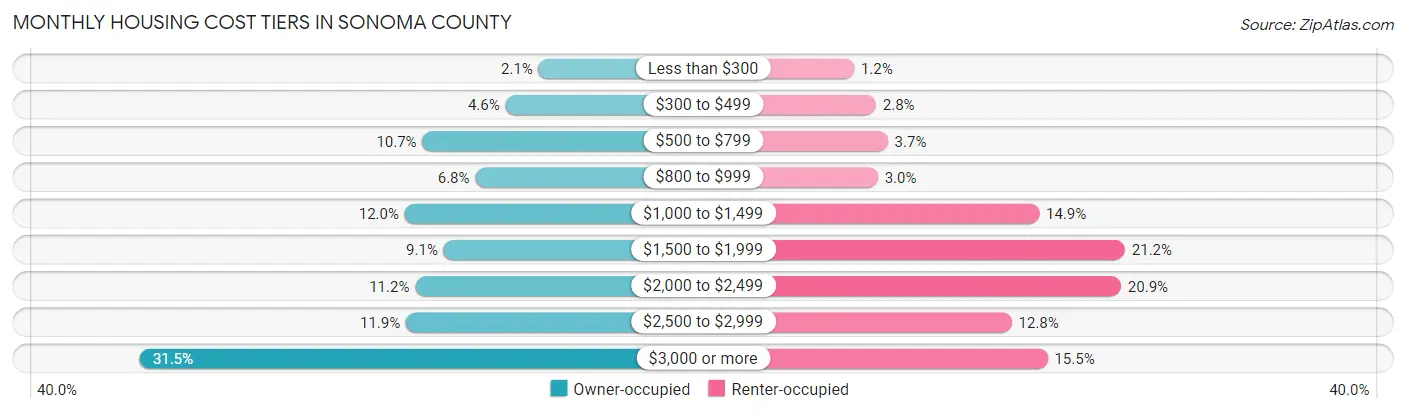
| Monthly Cost | Owner-occupied | Renter-occupied |
| Less than $300 | 2,506 (2.1%) | 886 (1.2%) |
| $300 to $499 | 5,358 (4.6%) | 2,058 (2.8%) |
| $500 to $799 | 12,510 (10.7%) | 2,693 (3.7%) |
| $800 to $999 | 7,949 (6.8%) | 2,163 (3.0%) |
| $1,000 to $1,499 | 14,029 (12.0%) | 10,801 (14.8%) |
| $1,500 to $1,999 | 10,670 (9.1%) | 15,395 (21.2%) |
| $2,000 to $2,499 | 13,131 (11.2%) | 15,188 (20.9%) |
| $2,500 to $2,999 | 13,927 (11.9%) | 9,332 (12.8%) |
| $3,000 or more | 36,841 (31.5%) | 11,255 (15.5%) |
| Total | 116,921 (100.0%) | 72,732 (100.0%) |
Physical Housing Characteristics in Sonoma County
Housing Structures in Sonoma County
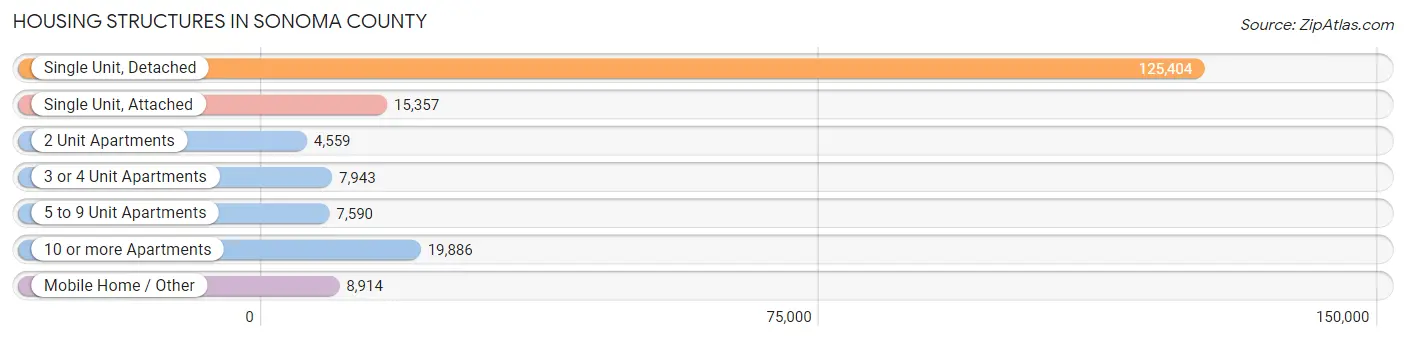
| Structure Type | # Housing Units | % Housing Units |
| Single Unit, Detached | 125,404 | 66.1% |
| Single Unit, Attached | 15,357 | 8.1% |
| 2 Unit Apartments | 4,559 | 2.4% |
| 3 or 4 Unit Apartments | 7,943 | 4.2% |
| 5 to 9 Unit Apartments | 7,590 | 4.0% |
| 10 or more Apartments | 19,886 | 10.5% |
| Mobile Home / Other | 8,914 | 4.7% |
| Total | 189,653 | 100.0% |
Housing Structures by Occupancy in Sonoma County
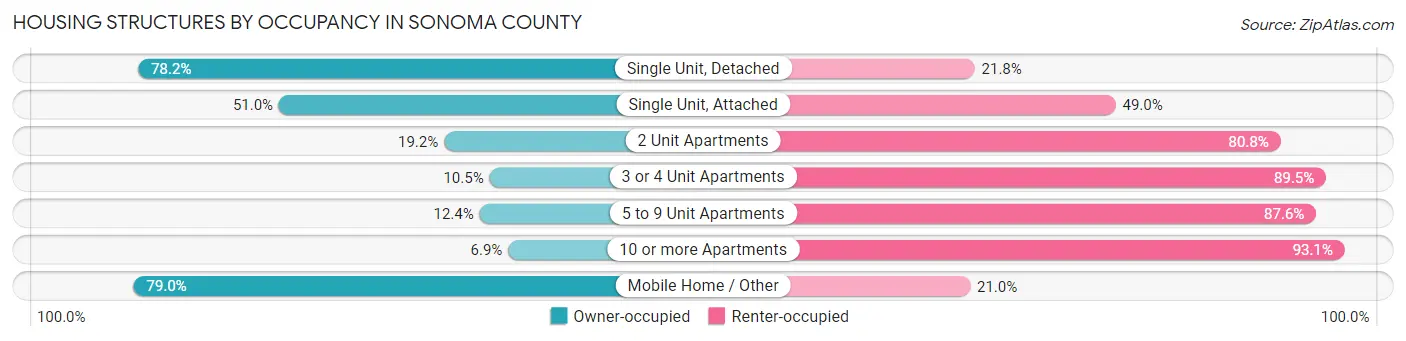
| Structure Type | Owner-occupied | Renter-occupied |
| Single Unit, Detached | 98,014 (78.2%) | 27,390 (21.8%) |
| Single Unit, Attached | 7,837 (51.0%) | 7,520 (49.0%) |
| 2 Unit Apartments | 877 (19.2%) | 3,682 (80.8%) |
| 3 or 4 Unit Apartments | 833 (10.5%) | 7,110 (89.5%) |
| 5 to 9 Unit Apartments | 941 (12.4%) | 6,649 (87.6%) |
| 10 or more Apartments | 1,373 (6.9%) | 18,513 (93.1%) |
| Mobile Home / Other | 7,046 (79.0%) | 1,868 (21.0%) |
| Total | 116,921 (61.7%) | 72,732 (38.4%) |
Housing Structures by Number of Rooms in Sonoma County
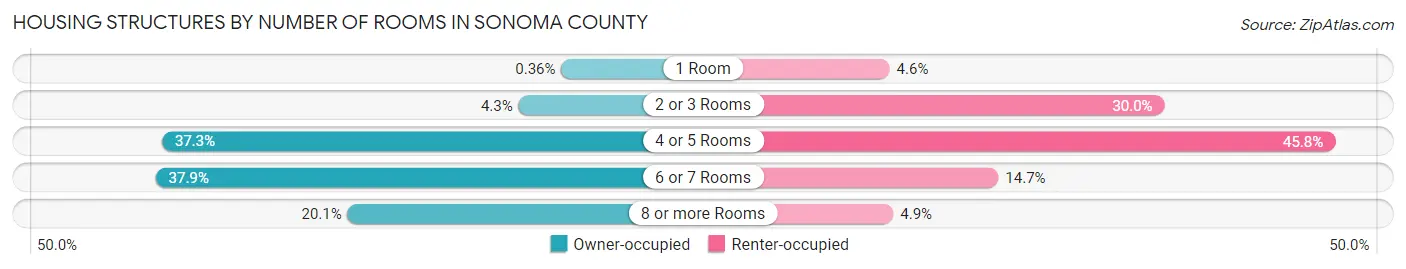
| Number of Rooms | Owner-occupied | Renter-occupied |
| 1 Room | 419 (0.4%) | 3,344 (4.6%) |
| 2 or 3 Rooms | 5,053 (4.3%) | 21,828 (30.0%) |
| 4 or 5 Rooms | 43,621 (37.3%) | 33,305 (45.8%) |
| 6 or 7 Rooms | 44,291 (37.9%) | 10,660 (14.7%) |
| 8 or more Rooms | 23,537 (20.1%) | 3,595 (4.9%) |
| Total | 116,921 (100.0%) | 72,732 (100.0%) |
Housing Structure by Heating Type in Sonoma County
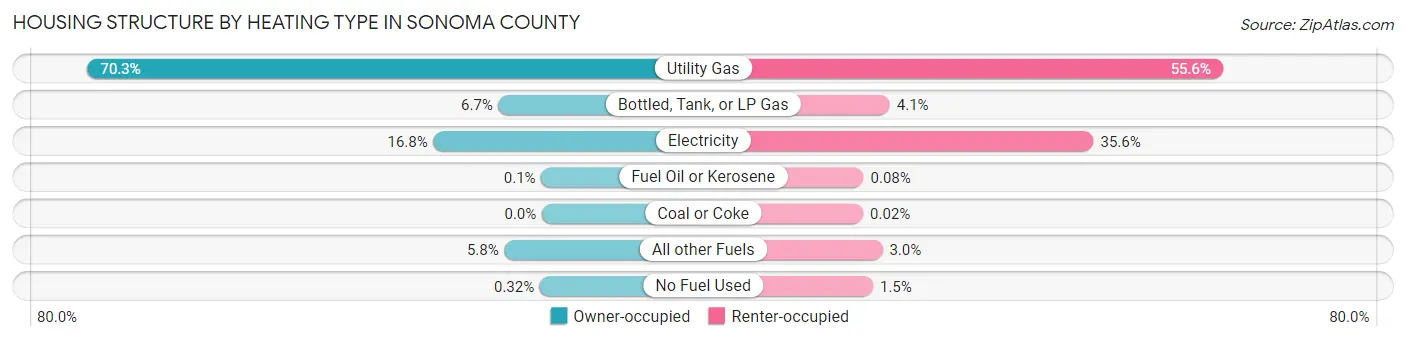
| Heating Type | Owner-occupied | Renter-occupied |
| Utility Gas | 82,182 (70.3%) | 40,436 (55.6%) |
| Bottled, Tank, or LP Gas | 7,844 (6.7%) | 3,009 (4.1%) |
| Electricity | 19,616 (16.8%) | 25,921 (35.6%) |
| Fuel Oil or Kerosene | 116 (0.1%) | 55 (0.1%) |
| Coal or Coke | 0 (0.0%) | 11 (0.0%) |
| All other Fuels | 6,790 (5.8%) | 2,179 (3.0%) |
| No Fuel Used | 373 (0.3%) | 1,121 (1.5%) |
| Total | 116,921 (100.0%) | 72,732 (100.0%) |
Household Vehicle Usage in Sonoma County
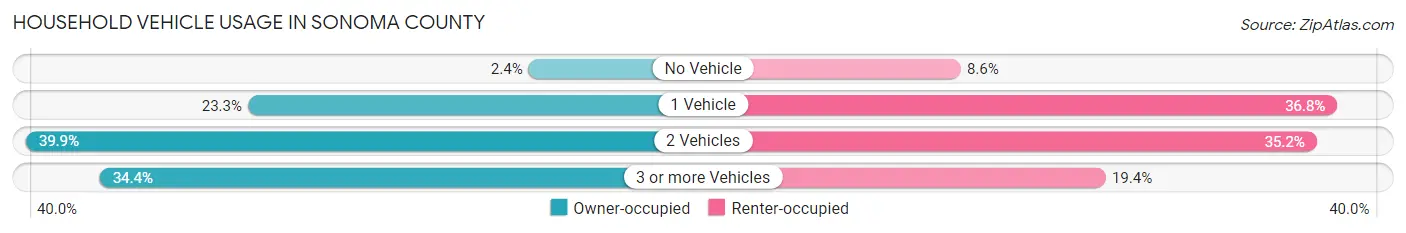
| Vehicles per Household | Owner-occupied | Renter-occupied |
| No Vehicle | 2,769 (2.4%) | 6,246 (8.6%) |
| 1 Vehicle | 27,282 (23.3%) | 26,737 (36.8%) |
| 2 Vehicles | 46,662 (39.9%) | 25,626 (35.2%) |
| 3 or more Vehicles | 40,208 (34.4%) | 14,123 (19.4%) |
| Total | 116,921 (100.0%) | 72,732 (100.0%) |
Real Estate & Mortgages in Sonoma County
Real Estate and Mortgage Overview in Sonoma County
| Characteristic | Without Mortgage | With Mortgage |
| Housing Units | 39,828 | 77,093 |
| Median Property Value | $730,600 | $756,900 |
| Median Household Income | $82,355 | $35,594 |
| Monthly Housing Costs | $820 | $36,242 |
| Real Estate Taxes | $4,324 | $1,464 |
Property Value by Mortgage Status in Sonoma County
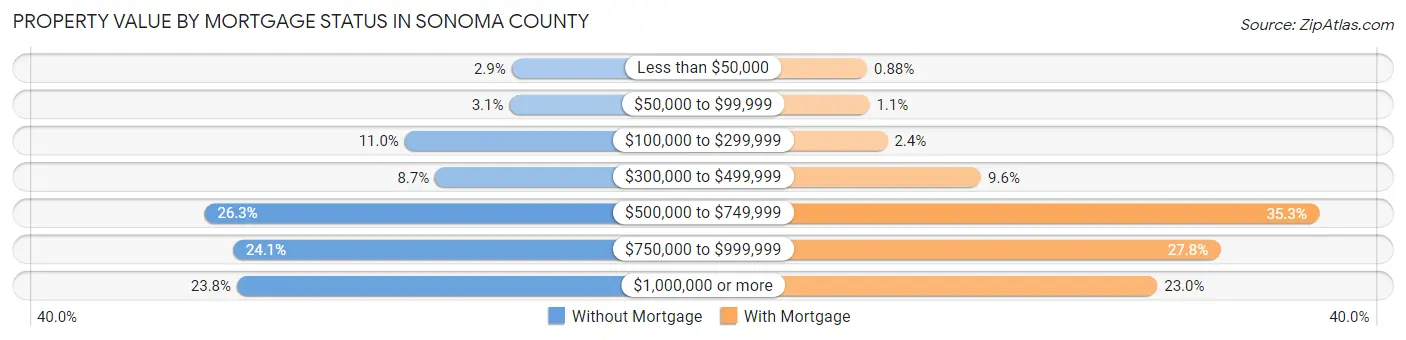
| Property Value | Without Mortgage | With Mortgage |
| Less than $50,000 | 1,155 (2.9%) | 682 (0.9%) |
| $50,000 to $99,999 | 1,222 (3.1%) | 820 (1.1%) |
| $100,000 to $299,999 | 4,397 (11.0%) | 1,876 (2.4%) |
| $300,000 to $499,999 | 3,476 (8.7%) | 7,376 (9.6%) |
| $500,000 to $749,999 | 10,476 (26.3%) | 27,203 (35.3%) |
| $750,000 to $999,999 | 9,611 (24.1%) | 21,409 (27.8%) |
| $1,000,000 or more | 9,491 (23.8%) | 17,727 (23.0%) |
| Total | 39,828 (100.0%) | 77,093 (100.0%) |
Household Income by Mortgage Status in Sonoma County
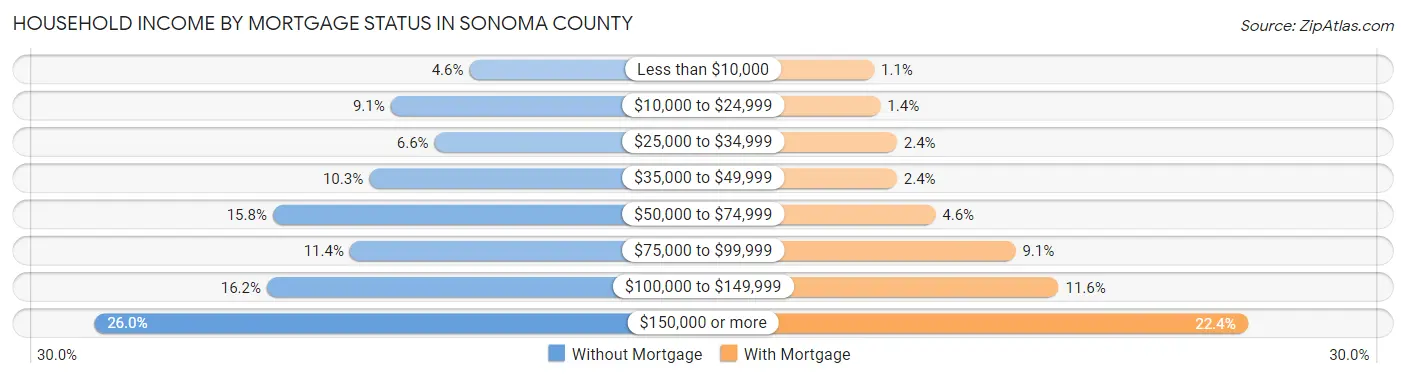
| Household Income | Without Mortgage | With Mortgage |
| Less than $10,000 | 1,829 (4.6%) | 818 (1.1%) |
| $10,000 to $24,999 | 3,619 (9.1%) | 1,093 (1.4%) |
| $25,000 to $34,999 | 2,620 (6.6%) | 1,819 (2.4%) |
| $35,000 to $49,999 | 4,109 (10.3%) | 1,816 (2.4%) |
| $50,000 to $74,999 | 6,299 (15.8%) | 3,513 (4.6%) |
| $75,000 to $99,999 | 4,550 (11.4%) | 7,049 (9.1%) |
| $100,000 to $149,999 | 6,438 (16.2%) | 8,943 (11.6%) |
| $150,000 or more | 10,364 (26.0%) | 17,266 (22.4%) |
| Total | 39,828 (100.0%) | 77,093 (100.0%) |
Property Value to Household Income Ratio in Sonoma County
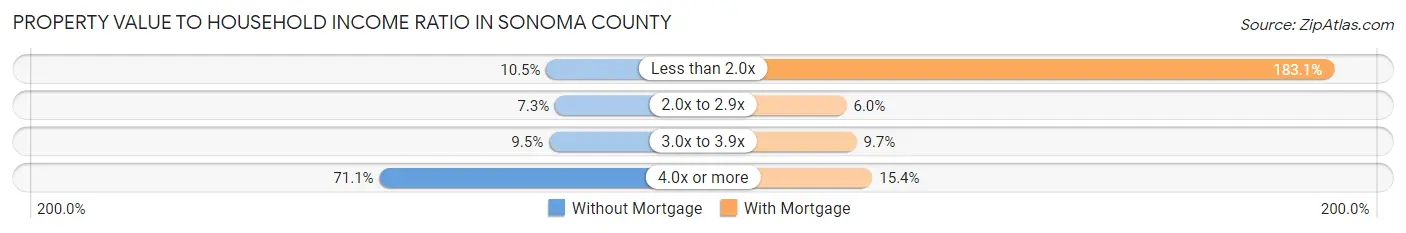
| Value-to-Income Ratio | Without Mortgage | With Mortgage |
| Less than 2.0x | 4,174 (10.5%) | 141,144 (183.1%) |
| 2.0x to 2.9x | 2,914 (7.3%) | 4,645 (6.0%) |
| 3.0x to 3.9x | 3,794 (9.5%) | 7,444 (9.7%) |
| 4.0x or more | 28,327 (71.1%) | 11,882 (15.4%) |
| Total | 39,828 (100.0%) | 77,093 (100.0%) |
Real Estate Taxes by Mortgage Status in Sonoma County
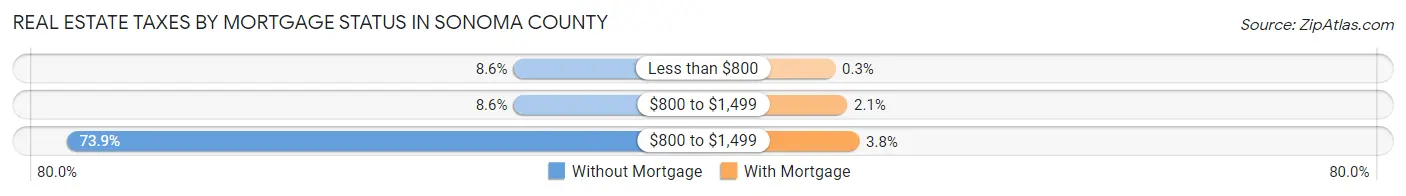
| Property Taxes | Without Mortgage | With Mortgage |
| Less than $800 | 3,417 (8.6%) | 232 (0.3%) |
| $800 to $1,499 | 3,422 (8.6%) | 1,580 (2.1%) |
| $800 to $1,499 | 29,413 (73.9%) | 2,937 (3.8%) |
| Total | 39,828 (100.0%) | 77,093 (100.0%) |
Health & Disability in Sonoma County
Health Insurance Coverage by Age in Sonoma County
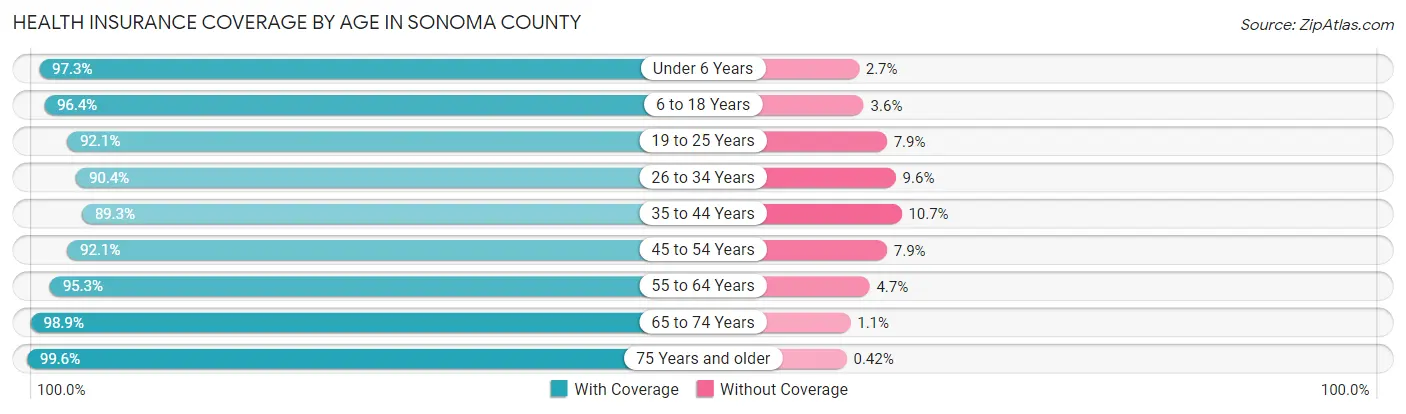
| Age Bracket | With Coverage | Without Coverage |
| Under 6 Years | 27,225 (97.3%) | 755 (2.7%) |
| 6 to 18 Years | 70,035 (96.4%) | 2,623 (3.6%) |
| 19 to 25 Years | 35,546 (92.1%) | 3,055 (7.9%) |
| 26 to 34 Years | 48,599 (90.4%) | 5,148 (9.6%) |
| 35 to 44 Years | 56,222 (89.3%) | 6,707 (10.7%) |
| 45 to 54 Years | 55,757 (92.1%) | 4,801 (7.9%) |
| 55 to 64 Years | 65,693 (95.3%) | 3,235 (4.7%) |
| 65 to 74 Years | 60,254 (98.9%) | 683 (1.1%) |
| 75 Years and older | 38,161 (99.6%) | 162 (0.4%) |
| Total | 457,492 (94.4%) | 27,169 (5.6%) |
Health Insurance Coverage by Citizenship Status in Sonoma County
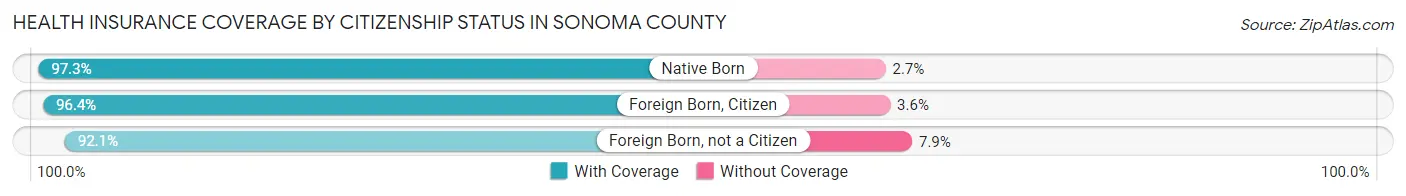
| Citizenship Status | With Coverage | Without Coverage |
| Native Born | 27,225 (97.3%) | 755 (2.7%) |
| Foreign Born, Citizen | 70,035 (96.4%) | 2,623 (3.6%) |
| Foreign Born, not a Citizen | 35,546 (92.1%) | 3,055 (7.9%) |
Health Insurance Coverage by Household Income in Sonoma County
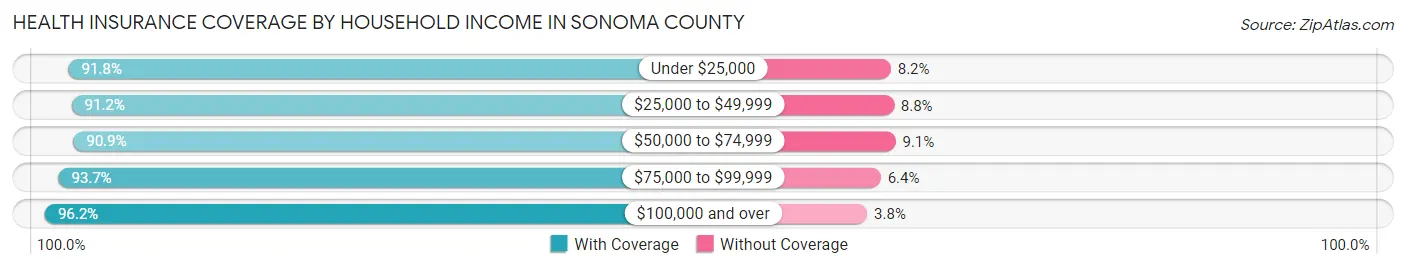
| Household Income | With Coverage | Without Coverage |
| Under $25,000 | 28,594 (91.8%) | 2,568 (8.2%) |
| $25,000 to $49,999 | 46,499 (91.2%) | 4,495 (8.8%) |
| $50,000 to $74,999 | 52,717 (90.9%) | 5,295 (9.1%) |
| $75,000 to $99,999 | 58,291 (93.6%) | 3,953 (6.4%) |
| $100,000 and over | 264,960 (96.2%) | 10,517 (3.8%) |
Public vs Private Health Insurance Coverage by Age in Sonoma County
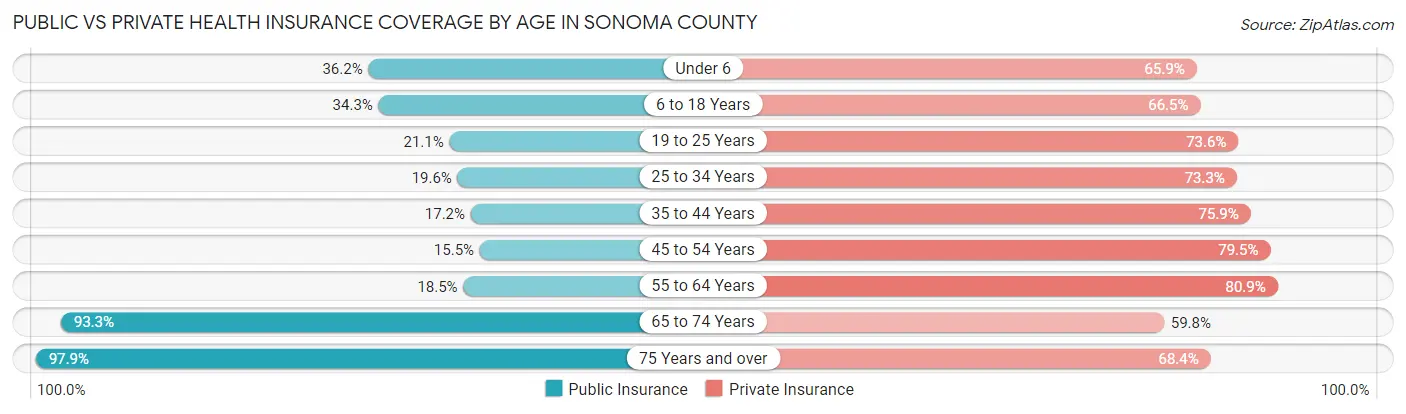
| Age Bracket | Public Insurance | Private Insurance |
| Under 6 | 10,119 (36.2%) | 18,427 (65.9%) |
| 6 to 18 Years | 24,907 (34.3%) | 48,350 (66.5%) |
| 19 to 25 Years | 8,154 (21.1%) | 28,402 (73.6%) |
| 25 to 34 Years | 10,539 (19.6%) | 39,389 (73.3%) |
| 35 to 44 Years | 10,807 (17.2%) | 47,749 (75.9%) |
| 45 to 54 Years | 9,381 (15.5%) | 48,159 (79.5%) |
| 55 to 64 Years | 12,780 (18.5%) | 55,746 (80.9%) |
| 65 to 74 Years | 56,845 (93.3%) | 36,414 (59.8%) |
| 75 Years and over | 37,528 (97.9%) | 26,227 (68.4%) |
| Total | 181,060 (37.4%) | 348,863 (72.0%) |
Disability Status by Sex by Age in Sonoma County
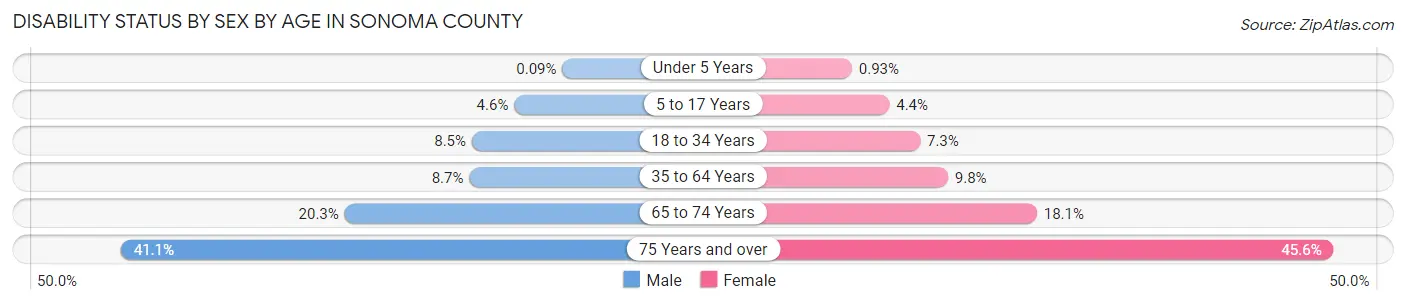
| Age Bracket | Male | Female |
| Under 5 Years | 11 (0.1%) | 104 (0.9%) |
| 5 to 17 Years | 1,652 (4.6%) | 1,536 (4.4%) |
| 18 to 34 Years | 4,259 (8.5%) | 3,549 (7.3%) |
| 35 to 64 Years | 8,327 (8.7%) | 9,544 (9.8%) |
| 65 to 74 Years | 5,773 (20.3%) | 5,882 (18.1%) |
| 75 Years and over | 6,606 (41.1%) | 10,146 (45.6%) |
Disability Class by Sex by Age in Sonoma County
Disability Class: Hearing Difficulty
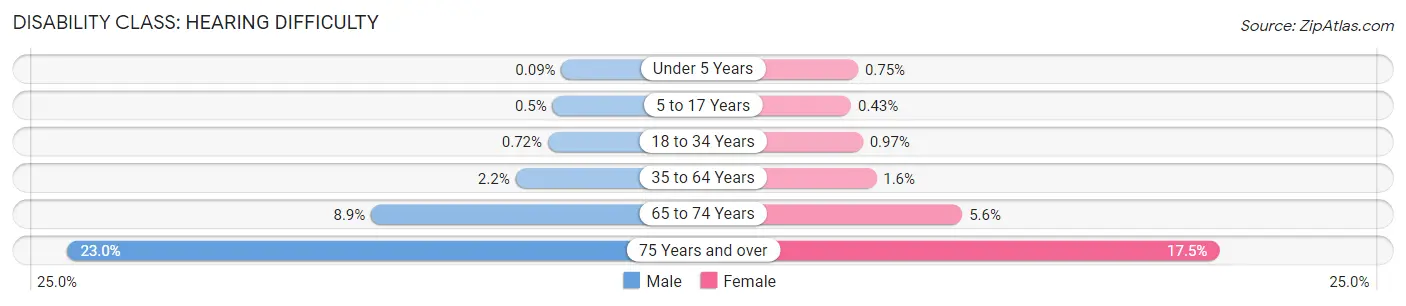
| Age Bracket | Male | Female |
| Under 5 Years | 11 (0.1%) | 84 (0.7%) |
| 5 to 17 Years | 181 (0.5%) | 149 (0.4%) |
| 18 to 34 Years | 362 (0.7%) | 476 (1.0%) |
| 35 to 64 Years | 2,115 (2.2%) | 1,549 (1.6%) |
| 65 to 74 Years | 2,537 (8.9%) | 1,816 (5.6%) |
| 75 Years and over | 3,702 (23.0%) | 3,894 (17.5%) |
Disability Class: Vision Difficulty
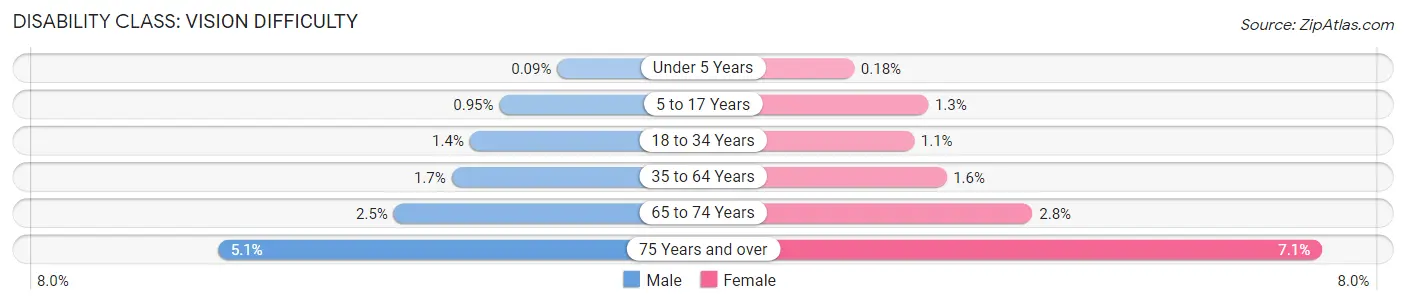
| Age Bracket | Male | Female |
| Under 5 Years | 11 (0.1%) | 20 (0.2%) |
| 5 to 17 Years | 345 (0.9%) | 446 (1.3%) |
| 18 to 34 Years | 698 (1.4%) | 522 (1.1%) |
| 35 to 64 Years | 1,585 (1.7%) | 1,504 (1.5%) |
| 65 to 74 Years | 718 (2.5%) | 921 (2.8%) |
| 75 Years and over | 825 (5.1%) | 1,586 (7.1%) |
Disability Class: Cognitive Difficulty
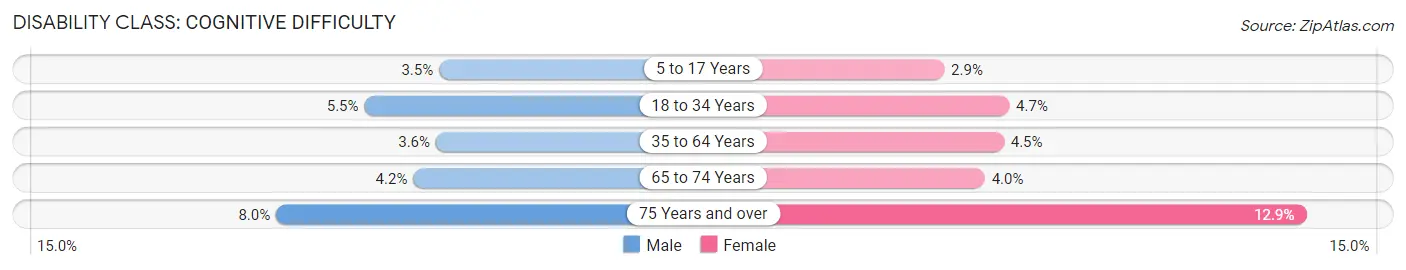
| Age Bracket | Male | Female |
| 5 to 17 Years | 1,256 (3.5%) | 993 (2.9%) |
| 18 to 34 Years | 2,780 (5.5%) | 2,279 (4.7%) |
| 35 to 64 Years | 3,391 (3.5%) | 4,376 (4.5%) |
| 65 to 74 Years | 1,189 (4.2%) | 1,295 (4.0%) |
| 75 Years and over | 1,287 (8.0%) | 2,875 (12.9%) |
Disability Class: Ambulatory Difficulty
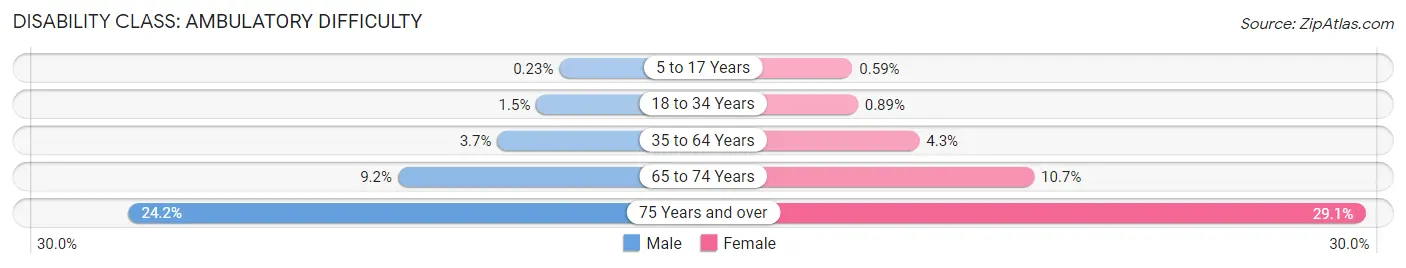
| Age Bracket | Male | Female |
| 5 to 17 Years | 85 (0.2%) | 204 (0.6%) |
| 18 to 34 Years | 756 (1.5%) | 436 (0.9%) |
| 35 to 64 Years | 3,508 (3.7%) | 4,196 (4.3%) |
| 65 to 74 Years | 2,621 (9.2%) | 3,480 (10.7%) |
| 75 Years and over | 3,894 (24.2%) | 6,477 (29.1%) |
Disability Class: Self-Care Difficulty
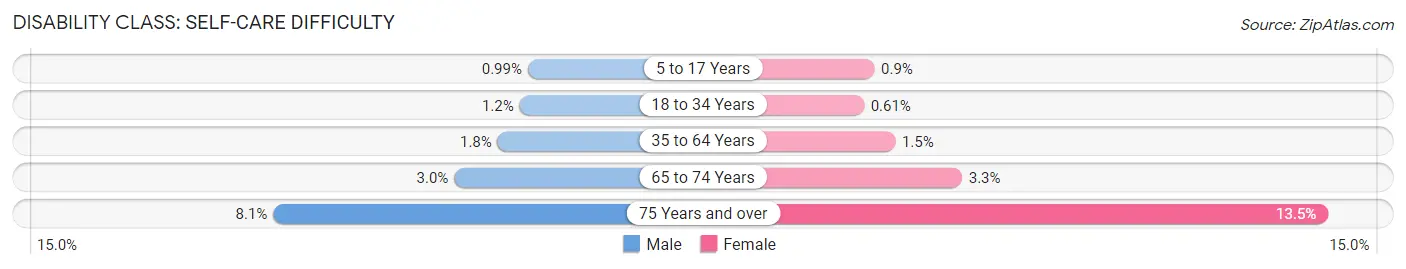
| Age Bracket | Male | Female |
| 5 to 17 Years | 359 (1.0%) | 312 (0.9%) |
| 18 to 34 Years | 613 (1.2%) | 298 (0.6%) |
| 35 to 64 Years | 1,749 (1.8%) | 1,436 (1.5%) |
| 65 to 74 Years | 865 (3.0%) | 1,084 (3.3%) |
| 75 Years and over | 1,299 (8.1%) | 3,011 (13.5%) |
Technology Access in Sonoma County
Computing Device Access in Sonoma County
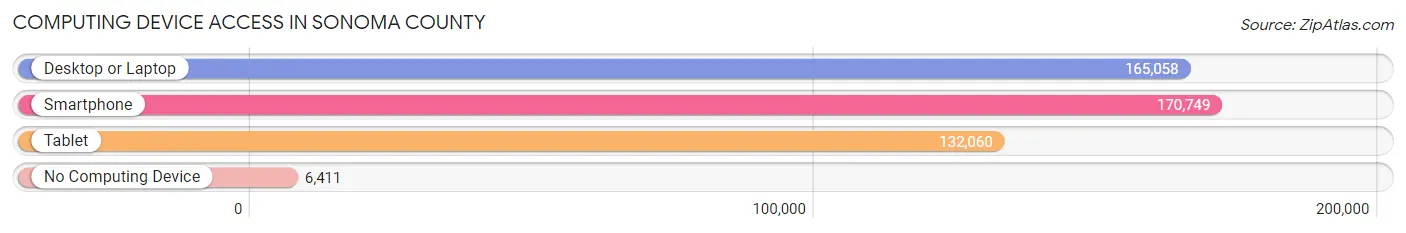
| Device Type | # Households | % Households |
| Desktop or Laptop | 165,058 | 87.0% |
| Smartphone | 170,749 | 90.0% |
| Tablet | 132,060 | 69.6% |
| No Computing Device | 6,411 | 3.4% |
| Total | 189,653 | 100.0% |
Internet Access in Sonoma County
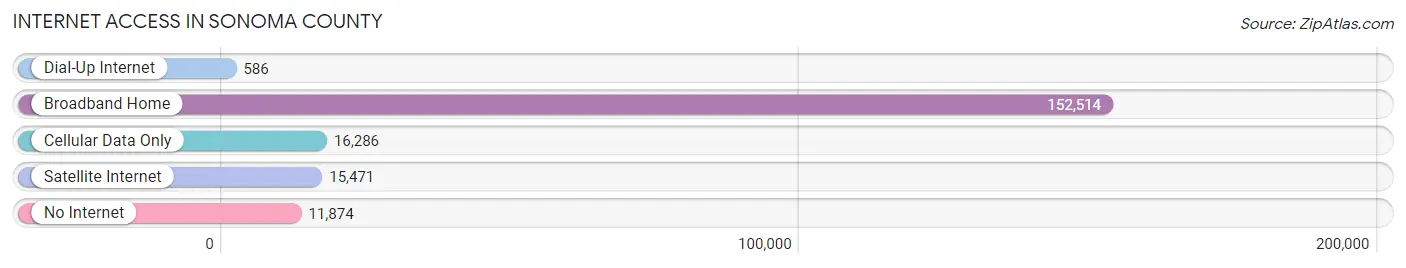
| Internet Type | # Households | % Households |
| Dial-Up Internet | 586 | 0.3% |
| Broadband Home | 152,514 | 80.4% |
| Cellular Data Only | 16,286 | 8.6% |
| Satellite Internet | 15,471 | 8.2% |
| No Internet | 11,874 | 6.3% |
| Total | 189,653 | 100.0% |
Sonoma County Summary
Sonoma County is located in the northern part of California, in the San Francisco Bay Area. It is bordered by Marin County to the west, Napa County to the south, and Mendocino County to the north. Sonoma County is home to a population of over 500,000 people, making it the fourth most populous county in California.
History
The history of Sonoma County dates back to the early 19th century, when it was part of the Mexican province of Alta California. In 1821, Mexico ceded the area to the United States, and it became part of the state of California in 1850. During the Gold Rush of 1849, Sonoma County was a popular destination for prospectors, and the population grew rapidly.
In the late 19th century, Sonoma County was a major producer of wine, and the area became known as the “Wine Country.” The wine industry continues to be a major part of the county’s economy today.
Geography
Sonoma County covers an area of 1,768 square miles, making it the largest county in the Bay Area. The county is divided into two distinct regions: the coastal region and the inland region. The coastal region is characterized by rolling hills, redwood forests, and rugged coastline. The inland region is more mountainous, with higher elevations and a more diverse landscape.
The county is home to several rivers, including the Russian River, the Petaluma River, and the Napa River. The county also contains several lakes, including Lake Sonoma, Clear Lake, and Lake Mendocino.
Economy
Sonoma County’s economy is largely driven by the wine industry, which accounts for over $2 billion in annual revenue. The county is also home to a number of other industries, including tourism, agriculture, and technology.
The county is home to several major employers, including the Sonoma County Water Agency, the Sonoma County Airport, and the Sonoma County Office of Education. The county also has a thriving small business sector, with over 10,000 businesses employing over 50,000 people.
Demographics
As of the 2010 census, Sonoma County had a population of 483,878. The population is racially and ethnically diverse, with the largest racial group being White (63.2%), followed by Hispanic or Latino (19.2%), Asian (7.2%), and African American (3.3%).
The median household income in Sonoma County is $68,845, and the median home value is $541,000. The county has a high rate of homeownership, with over 70% of residents owning their own homes.
Sonoma County is a diverse and vibrant region with a rich history and a bright future. The county’s economy is driven by the wine industry, and the area is home to a number of other industries, including tourism, agriculture, and technology. The county is also home to a diverse population, with a variety of racial and ethnic backgrounds. Sonoma County is an ideal place to live, work, and play.
Common Questions
What is Per Capita Income in Sonoma County?
Per Capita income in Sonoma County is $52,523.
What is the Median Family Income in Sonoma County?
Median Family Income in Sonoma County is $119,780.
What is the Median Household income in Sonoma County?
Median Household Income in Sonoma County is $99,266.
What is Income or Wage Gap in Sonoma County?
Income or Wage Gap in Sonoma County is 24.3%.
Women in Sonoma County earn 75.7 cents for every dollar earned by a man.
What is Family Income Deficit in Sonoma County?
Family Income Deficit in Sonoma County is $11,105.
Families that are below poverty line in Sonoma County earn $11,105 less on average than the poverty threshold level.
What is Inequality or Gini Index in Sonoma County?
Inequality or Gini Index in Sonoma County is 0.46.
What is the Total Population of Sonoma County?
Total Population of Sonoma County is 488,436.
What is the Total Male Population of Sonoma County?
Total Male Population of Sonoma County is 240,478.
What is the Total Female Population of Sonoma County?
Total Female Population of Sonoma County is 247,958.
What is the Ratio of Males per 100 Females in Sonoma County?
There are 96.98 Males per 100 Females in Sonoma County.
What is the Ratio of Females per 100 Males in Sonoma County?
There are 103.11 Females per 100 Males in Sonoma County.
What is the Median Population Age in Sonoma County?
Median Population Age in Sonoma County is 42.7 Years.
What is the Average Family Size in Sonoma County
Average Family Size in Sonoma County is 3.1 People.
What is the Average Household Size in Sonoma County
Average Household Size in Sonoma County is 2.5 People.
How Large is the Labor Force in Sonoma County?
There are 262,343 People in the Labor Forcein in Sonoma County.
What is the Percentage of People in the Labor Force in Sonoma County?
64.6% of People are in the Labor Force in Sonoma County.
What is the Unemployment Rate in Sonoma County?
Unemployment Rate in Sonoma County is 5.2%.