Solano County, CA Map & Demographics
Solano County Map
Solano County Overview
$42,886
PER CAPITA INCOME
$110,159
AVG FAMILY INCOME
$97,037
AVG HOUSEHOLD INCOME
22.2%
WAGE / INCOME GAP [ % ]
77.8¢/ $1
WAGE / INCOME GAP [ $ ]
$10,903
FAMILY INCOME DEFICIT
0.42
INEQUALITY / GINI INDEX
450,995
TOTAL POPULATION
225,302
MALE POPULATION
225,693
FEMALE POPULATION
99.83
MALES / 100 FEMALES
100.17
FEMALES / 100 MALES
38.8
MEDIAN AGE
3.4
AVG FAMILY SIZE
2.8
AVG HOUSEHOLD SIZE
229,620
LABOR FORCE [ PEOPLE ]
63.2%
PERCENT IN LABOR FORCE
5.9%
UNEMPLOYMENT RATE
Income in Solano County
Income Overview in Solano County
Per Capita Income in Solano County is $42,886, while median incomes of families and households are $110,159 and $97,037 respectively.
| Characteristic | Number | Measure |
| Per Capita Income | 450,995 | $42,886 |
| Median Family Income | 109,390 | $110,159 |
| Mean Family Income | 109,390 | $134,307 |
| Median Household Income | 154,987 | $97,037 |
| Mean Household Income | 154,987 | $121,293 |
| Income Deficit | 109,390 | $10,903 |
| Wage / Income Gap (%) | 450,995 | 22.20% |
| Wage / Income Gap ($) | 450,995 | 77.80¢ per $1 |
| Gini / Inequality Index | 450,995 | 0.42 |
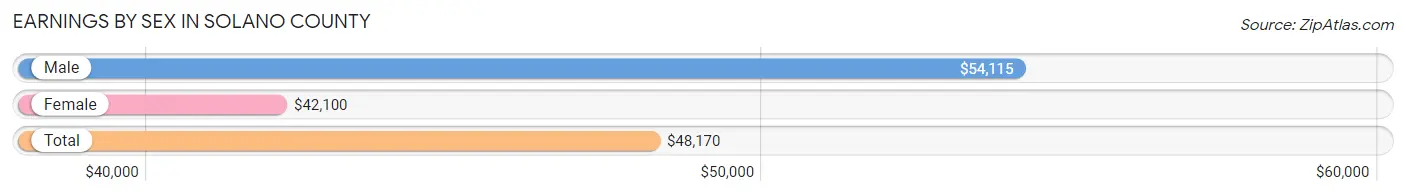
Earnings by Sex in Solano County
Average Earnings in Solano County are $48,170, $54,115 for men and $42,100 for women, a difference of 22.2%.
| Sex | Number | Average Earnings |
| Male | 124,685 (52.8%) | $54,115 |
| Female | 111,577 (47.2%) | $42,100 |
| Total | 236,262 (100.0%) | $48,170 |
Earnings by Sex by Income Bracket in Solano County
The most common earnings brackets in Solano County are $100,000+ for men (26,942 | 21.6%) and $100,000+ for women (16,403 | 14.7%).
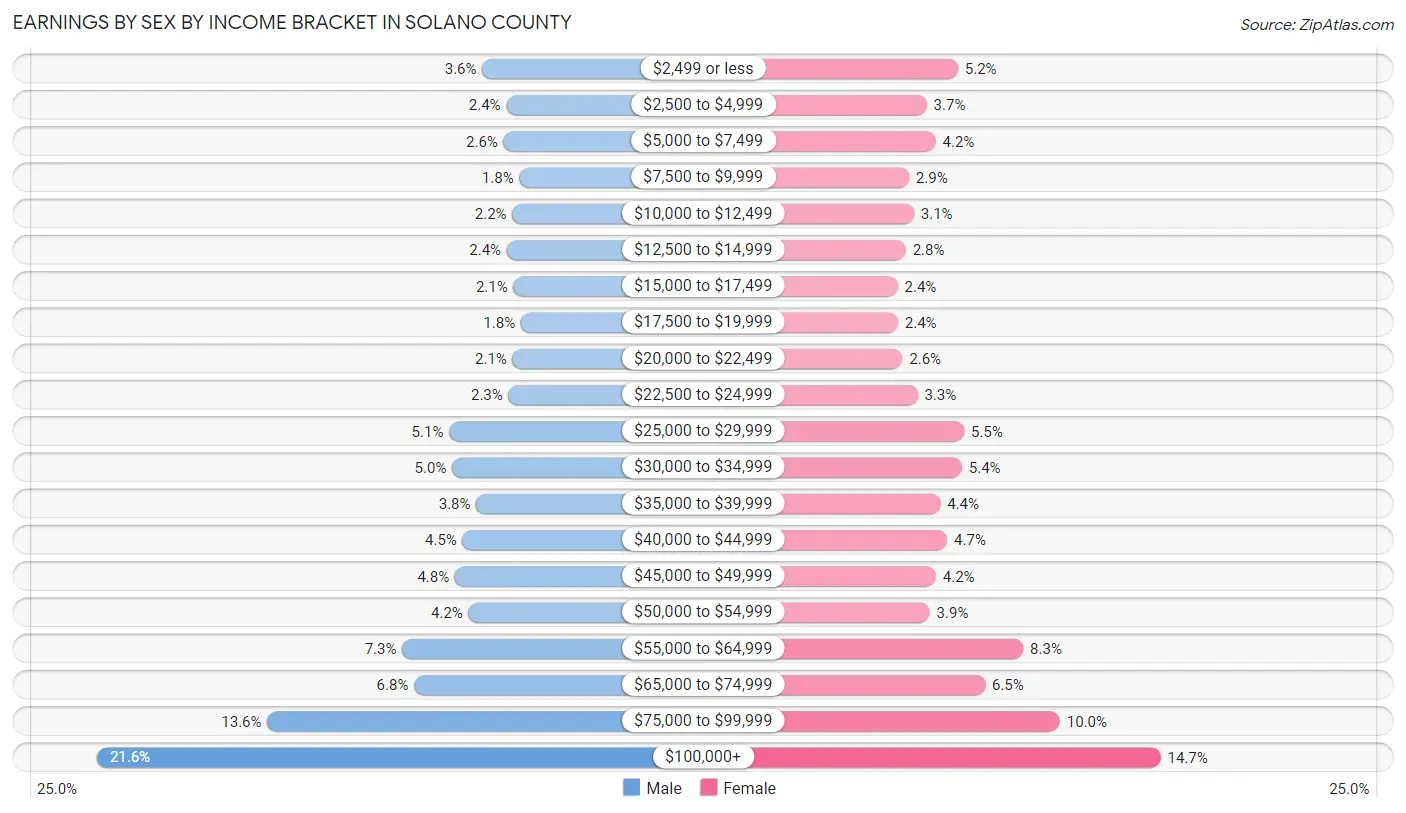
| Income | Male | Female |
| $2,499 or less | 4,437 (3.6%) | 5,801 (5.2%) |
| $2,500 to $4,999 | 3,033 (2.4%) | 4,171 (3.7%) |
| $5,000 to $7,499 | 3,198 (2.6%) | 4,637 (4.2%) |
| $7,500 to $9,999 | 2,266 (1.8%) | 3,242 (2.9%) |
| $10,000 to $12,499 | 2,677 (2.1%) | 3,501 (3.1%) |
| $12,500 to $14,999 | 3,010 (2.4%) | 3,084 (2.8%) |
| $15,000 to $17,499 | 2,621 (2.1%) | 2,656 (2.4%) |
| $17,500 to $19,999 | 2,182 (1.8%) | 2,671 (2.4%) |
| $20,000 to $22,499 | 2,673 (2.1%) | 2,898 (2.6%) |
| $22,500 to $24,999 | 2,909 (2.3%) | 3,691 (3.3%) |
| $25,000 to $29,999 | 6,376 (5.1%) | 6,125 (5.5%) |
| $30,000 to $34,999 | 6,197 (5.0%) | 6,018 (5.4%) |
| $35,000 to $39,999 | 4,785 (3.8%) | 4,883 (4.4%) |
| $40,000 to $44,999 | 5,587 (4.5%) | 5,239 (4.7%) |
| $45,000 to $49,999 | 6,037 (4.8%) | 4,648 (4.2%) |
| $50,000 to $54,999 | 5,242 (4.2%) | 4,334 (3.9%) |
| $55,000 to $64,999 | 9,109 (7.3%) | 9,218 (8.3%) |
| $65,000 to $74,999 | 8,411 (6.8%) | 7,220 (6.5%) |
| $75,000 to $99,999 | 16,993 (13.6%) | 11,137 (10.0%) |
| $100,000+ | 26,942 (21.6%) | 16,403 (14.7%) |
| Total | 124,685 (100.0%) | 111,577 (100.0%) |
Earnings by Sex by Educational Attainment in Solano County
Average earnings in Solano County are $62,510 for men and $49,141 for women, a difference of 21.4%. Men with an educational attainment of graduate degree enjoy the highest average annual earnings of $95,893, while those with less than high school education earn the least with $40,853. Women with an educational attainment of graduate degree earn the most with the average annual earnings of $85,771, while those with less than high school education have the smallest earnings of $25,557.
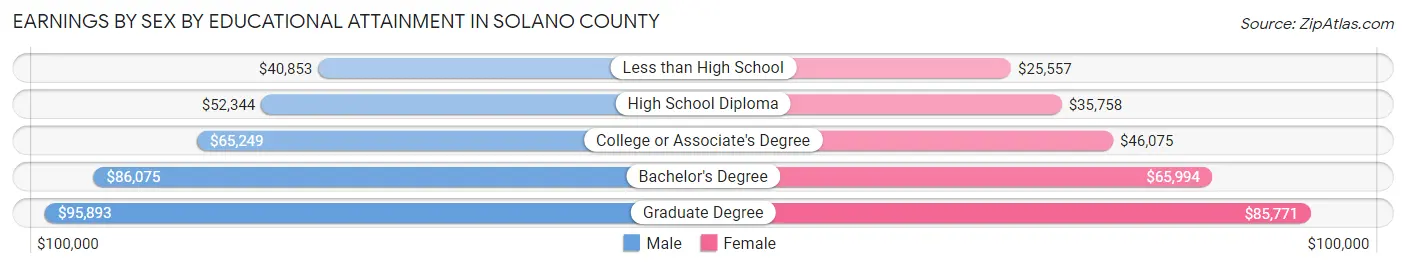
| Educational Attainment | Male Income | Female Income |
| Less than High School | $40,853 | $25,557 |
| High School Diploma | $52,344 | $35,758 |
| College or Associate's Degree | $65,249 | $46,075 |
| Bachelor's Degree | $86,075 | $65,994 |
| Graduate Degree | $95,893 | $85,771 |
| Total | $62,510 | $49,141 |
Family Income in Solano County
Family Income Brackets in Solano County
According to the Solano County family income data, there are 25,160 families falling into the $100,000 to $149,999 income range, which is the most common income bracket and makes up 23.0% of all families. Conversely, the $10,000 to $14,999 income bracket is the least frequent group with only 1,203 families (1.1%) belonging to this category.
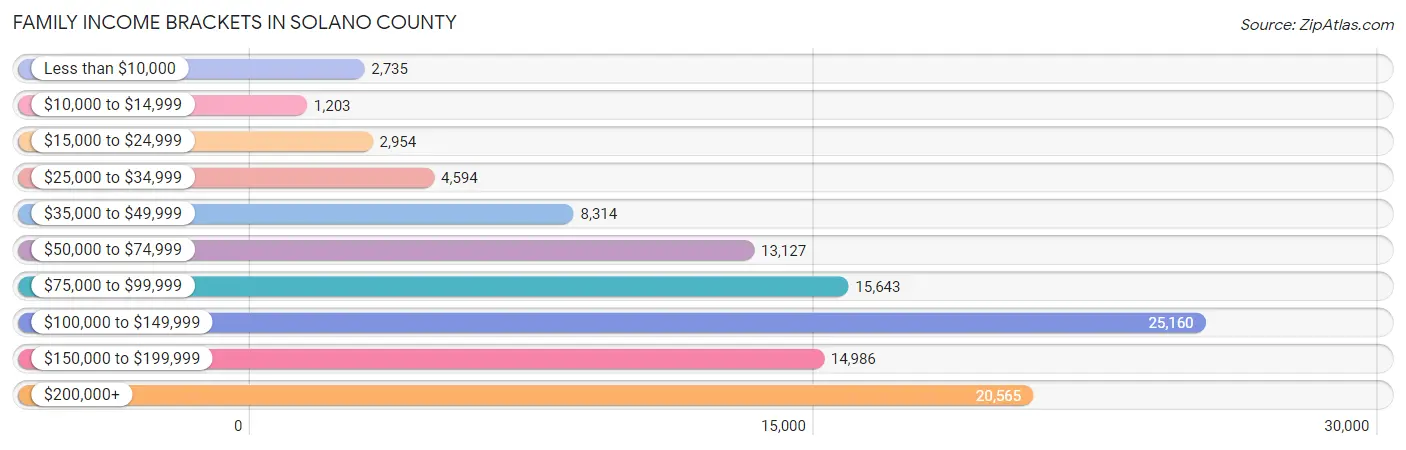
| Income Bracket | # Families | % Families |
| Less than $10,000 | 2,735 | 2.5% |
| $10,000 to $14,999 | 1,203 | 1.1% |
| $15,000 to $24,999 | 2,954 | 2.7% |
| $25,000 to $34,999 | 4,594 | 4.2% |
| $35,000 to $49,999 | 8,314 | 7.6% |
| $50,000 to $74,999 | 13,127 | 12.0% |
| $75,000 to $99,999 | 15,643 | 14.3% |
| $100,000 to $149,999 | 25,160 | 23.0% |
| $150,000 to $199,999 | 14,986 | 13.7% |
| $200,000+ | 20,565 | 18.8% |
Family Income by Famaliy Size in Solano County
7+ person families (2,850 | 2.6%) account for the highest median family income in Solano County with $137,143 per family, while 2-person families (45,391 | 41.5%) have the highest median income of $48,809 per family member.
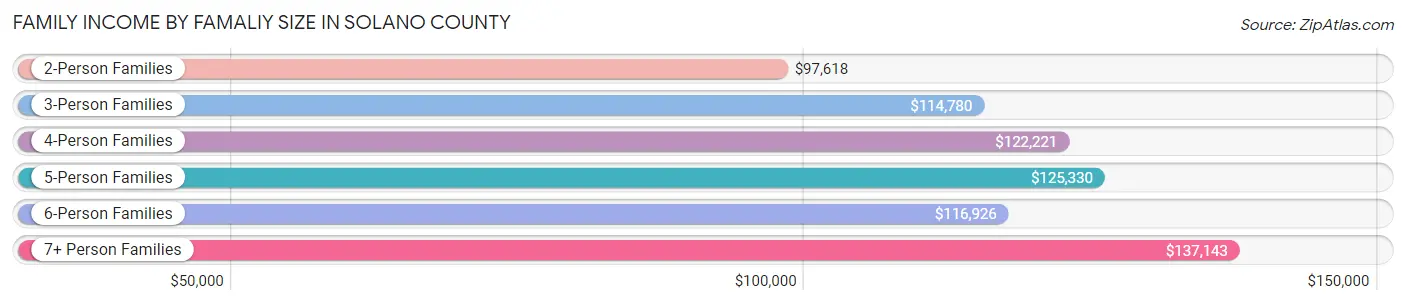
| Income Bracket | # Families | Median Income |
| 2-Person Families | 45,391 (41.5%) | $97,618 |
| 3-Person Families | 25,840 (23.6%) | $114,780 |
| 4-Person Families | 20,475 (18.7%) | $122,221 |
| 5-Person Families | 10,935 (10.0%) | $125,330 |
| 6-Person Families | 3,899 (3.6%) | $116,926 |
| 7+ Person Families | 2,850 (2.6%) | $137,143 |
| Total | 109,390 (100.0%) | $110,159 |
Family Income by Number of Earners in Solano County
The median family income in Solano County is $110,159, with families comprising 3+ earners (16,811) having the highest median family income of $162,951, while families with no earners (14,393) have the lowest median family income of $67,670, accounting for 15.4% and 13.2% of families, respectively.
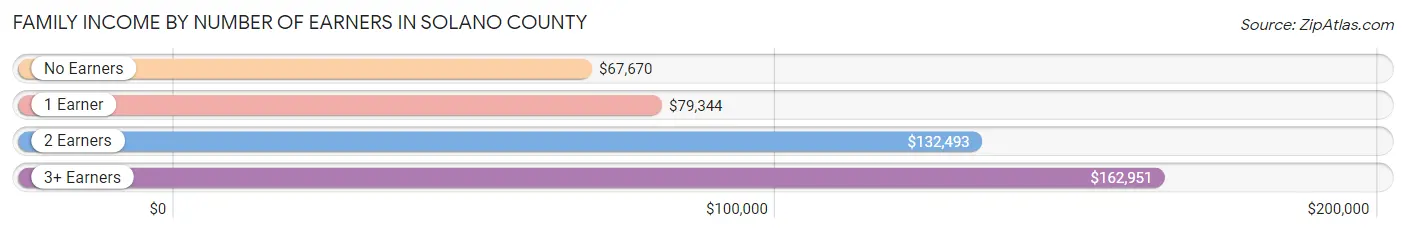
| Number of Earners | # Families | Median Income |
| No Earners | 14,393 (13.2%) | $67,670 |
| 1 Earner | 34,876 (31.9%) | $79,344 |
| 2 Earners | 43,310 (39.6%) | $132,493 |
| 3+ Earners | 16,811 (15.4%) | $162,951 |
| Total | 109,390 (100.0%) | $110,159 |
Household Income in Solano County
Household Income Brackets in Solano County
With 32,702 households falling in the category, the $100,000 to $149,999 income range is the most frequent in Solano County, accounting for 21.1% of all households. In contrast, only 3,410 households (2.2%) fall into the $10,000 to $14,999 income bracket, making it the least populous group.
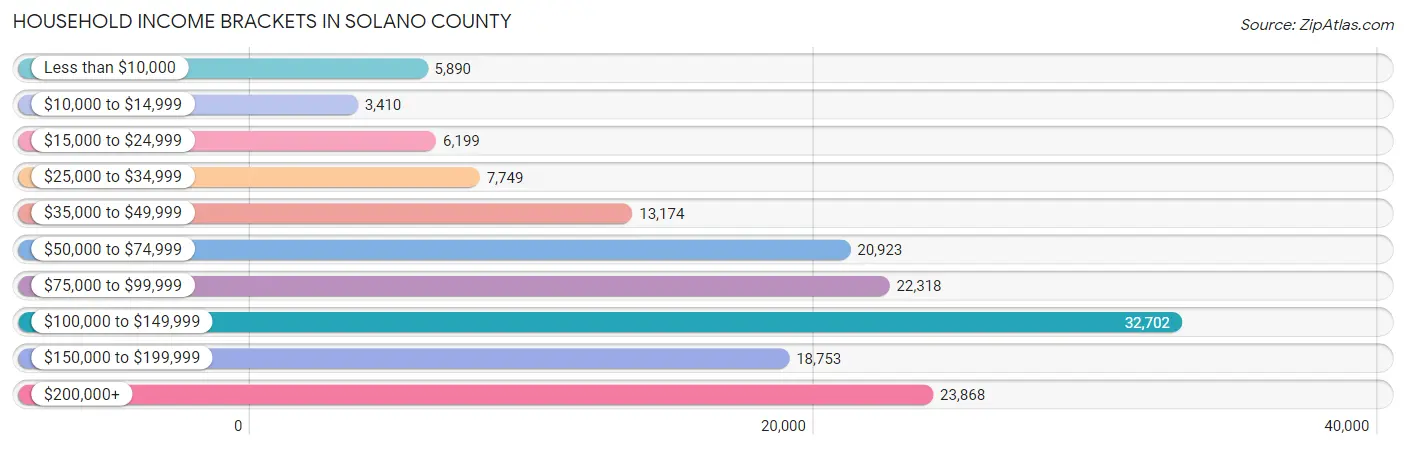
| Income Bracket | # Households | % Households |
| Less than $10,000 | 5,890 | 3.8% |
| $10,000 to $14,999 | 3,410 | 2.2% |
| $15,000 to $24,999 | 6,199 | 4.0% |
| $25,000 to $34,999 | 7,749 | 5.0% |
| $35,000 to $49,999 | 13,174 | 8.5% |
| $50,000 to $74,999 | 20,923 | 13.5% |
| $75,000 to $99,999 | 22,318 | 14.4% |
| $100,000 to $149,999 | 32,702 | 21.1% |
| $150,000 to $199,999 | 18,753 | 12.1% |
| $200,000+ | 23,868 | 15.4% |
Household Income by Householder Age in Solano County
The median household income in Solano County is $97,037, with the highest median household income of $113,447 found in the 45 to 64 years age bracket for the primary householder. A total of 58,742 households (37.9%) fall into this category. Meanwhile, the 15 to 24 years age bracket for the primary householder has the lowest median household income of $58,031, with 3,219 households (2.1%) in this group.
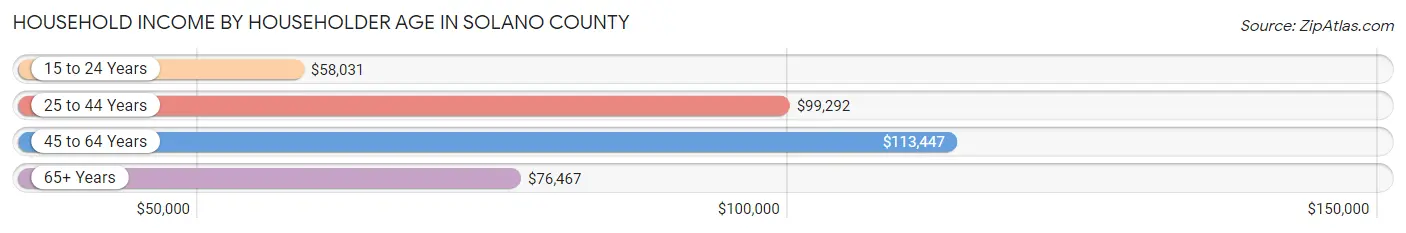
| Income Bracket | # Households | Median Income |
| 15 to 24 Years | 3,219 (2.1%) | $58,031 |
| 25 to 44 Years | 51,003 (32.9%) | $99,292 |
| 45 to 64 Years | 58,742 (37.9%) | $113,447 |
| 65+ Years | 42,023 (27.1%) | $76,467 |
| Total | 154,987 (100.0%) | $97,037 |
Poverty in Solano County
Income Below Poverty by Sex and Age in Solano County
With 8.4% poverty level for males and 9.6% for females among the residents of Solano County, 5 year old males and 16 and 17 year old females are the most vulnerable to poverty, with 468 males (16.9%) and 766 females (14.4%) in their respective age groups living below the poverty level.
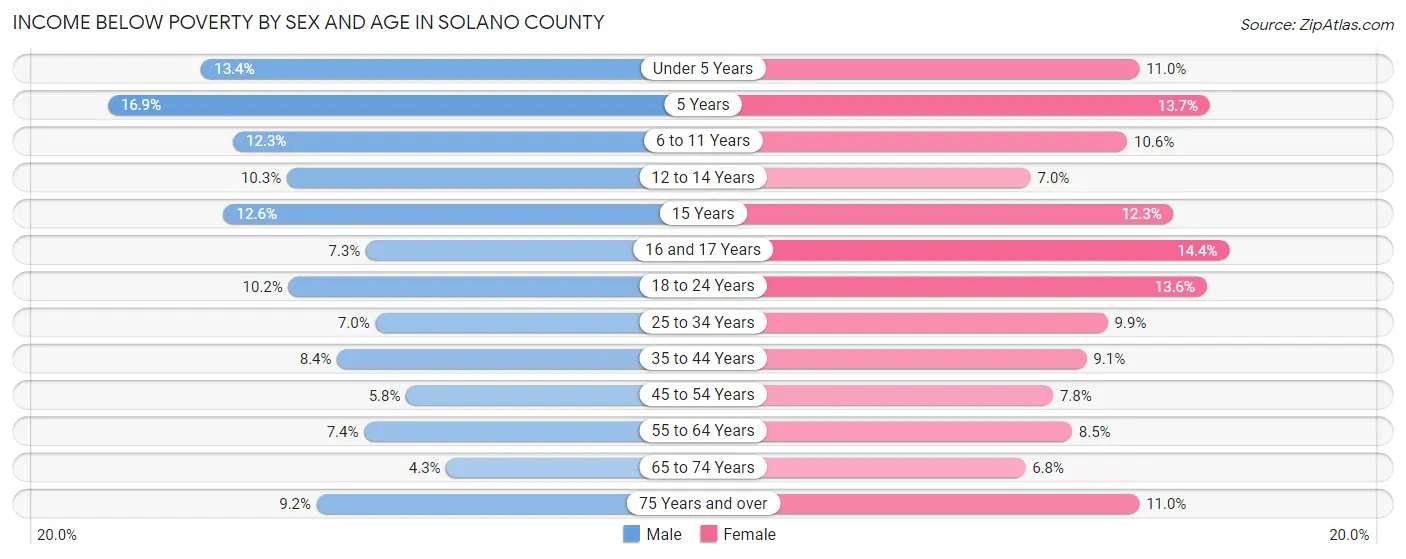
| Age Bracket | Male | Female |
| Under 5 Years | 1,799 (13.4%) | 1,379 (11.0%) |
| 5 Years | 468 (16.9%) | 357 (13.7%) |
| 6 to 11 Years | 2,096 (12.3%) | 1,697 (10.6%) |
| 12 to 14 Years | 847 (10.3%) | 572 (7.0%) |
| 15 Years | 321 (12.6%) | 365 (12.3%) |
| 16 and 17 Years | 437 (7.3%) | 766 (14.4%) |
| 18 to 24 Years | 2,017 (10.2%) | 2,465 (13.6%) |
| 25 to 34 Years | 2,233 (7.0%) | 3,049 (9.9%) |
| 35 to 44 Years | 2,471 (8.4%) | 2,631 (9.1%) |
| 45 to 54 Years | 1,540 (5.8%) | 2,114 (7.8%) |
| 55 to 64 Years | 2,035 (7.4%) | 2,608 (8.5%) |
| 65 to 74 Years | 893 (4.3%) | 1,649 (6.8%) |
| 75 Years and over | 1,059 (9.1%) | 1,837 (11.0%) |
| Total | 18,216 (8.4%) | 21,489 (9.6%) |
Income Above Poverty by Sex and Age in Solano County
According to the poverty statistics in Solano County, males aged 65 to 74 years and females aged 65 to 74 years are the age groups that are most secure financially, with 95.7% of males and 93.2% of females in these age groups living above the poverty line.
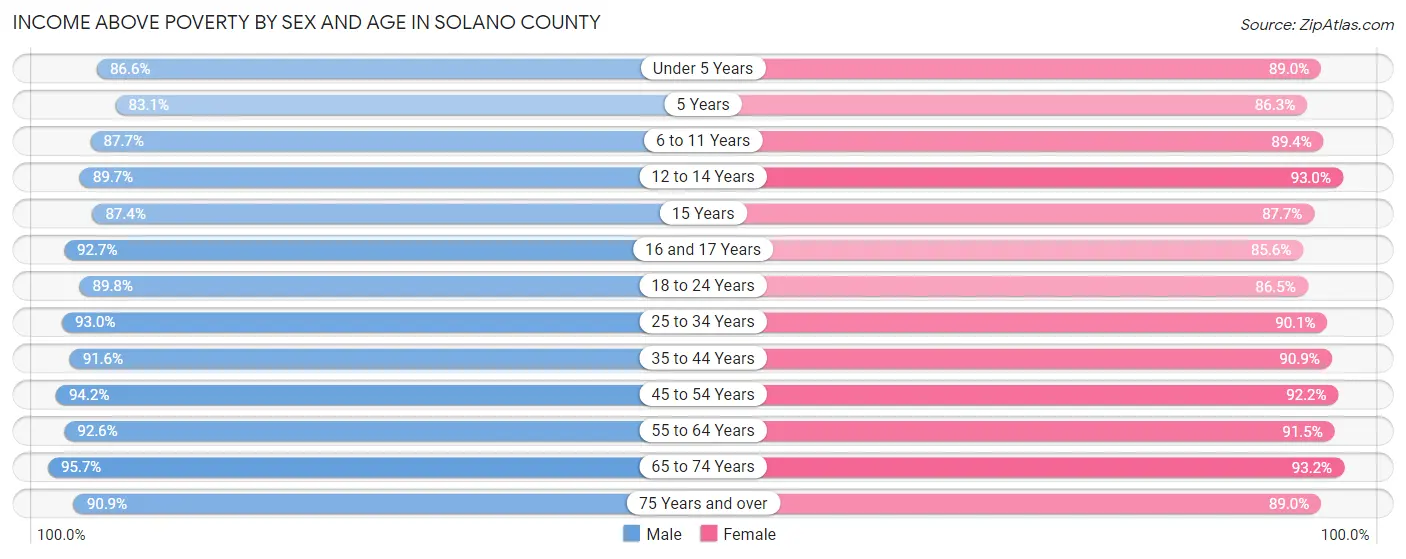
| Age Bracket | Male | Female |
| Under 5 Years | 11,586 (86.6%) | 11,109 (89.0%) |
| 5 Years | 2,300 (83.1%) | 2,257 (86.3%) |
| 6 to 11 Years | 15,000 (87.7%) | 14,326 (89.4%) |
| 12 to 14 Years | 7,405 (89.7%) | 7,588 (93.0%) |
| 15 Years | 2,224 (87.4%) | 2,597 (87.7%) |
| 16 and 17 Years | 5,530 (92.7%) | 4,557 (85.6%) |
| 18 to 24 Years | 17,764 (89.8%) | 15,724 (86.5%) |
| 25 to 34 Years | 29,800 (93.0%) | 27,848 (90.1%) |
| 35 to 44 Years | 26,980 (91.6%) | 26,350 (90.9%) |
| 45 to 54 Years | 24,891 (94.2%) | 24,854 (92.2%) |
| 55 to 64 Years | 25,485 (92.6%) | 27,914 (91.5%) |
| 65 to 74 Years | 19,699 (95.7%) | 22,576 (93.2%) |
| 75 Years and over | 10,511 (90.8%) | 14,798 (89.0%) |
| Total | 199,175 (91.6%) | 202,498 (90.4%) |
Income Below Poverty Among Married-Couple Families in Solano County
The poverty statistics for married-couple families in Solano County show that 3.4% or 2,623 of the total 77,945 families live below the poverty line. Families with 5 or more children have the highest poverty rate of 7.1%, comprising of 29 families. On the other hand, families with no children have the lowest poverty rate of 2.9%, which includes 1,326 families.
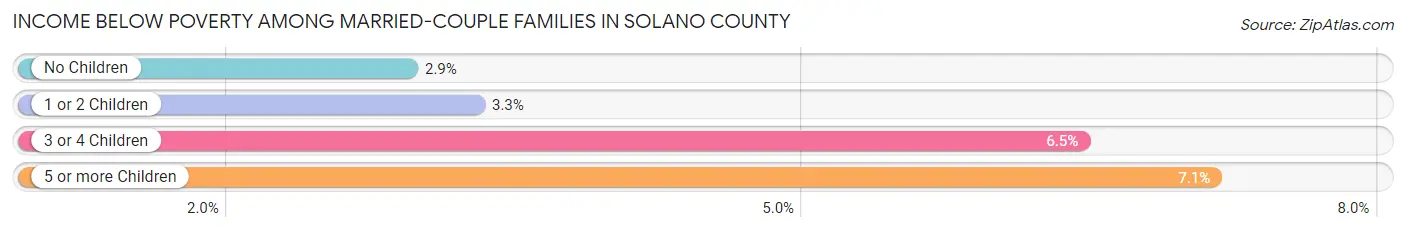
| Children | Above Poverty | Below Poverty |
| No Children | 43,784 (97.1%) | 1,326 (2.9%) |
| 1 or 2 Children | 25,169 (96.7%) | 855 (3.3%) |
| 3 or 4 Children | 5,992 (93.5%) | 413 (6.5%) |
| 5 or more Children | 377 (92.9%) | 29 (7.1%) |
| Total | 75,322 (96.6%) | 2,623 (3.4%) |
Income Below Poverty Among Single-Parent Households in Solano County
According to the poverty data in Solano County, 8.3% or 853 single-father households and 15.9% or 3,353 single-mother households are living below the poverty line. Among single-father households, those with 3 or 4 children have the highest poverty rate, with 252 households (27.5%) experiencing poverty. Likewise, among single-mother households, those with 5 or more children have the highest poverty rate, with 103 households (78.0%) falling below the poverty line.
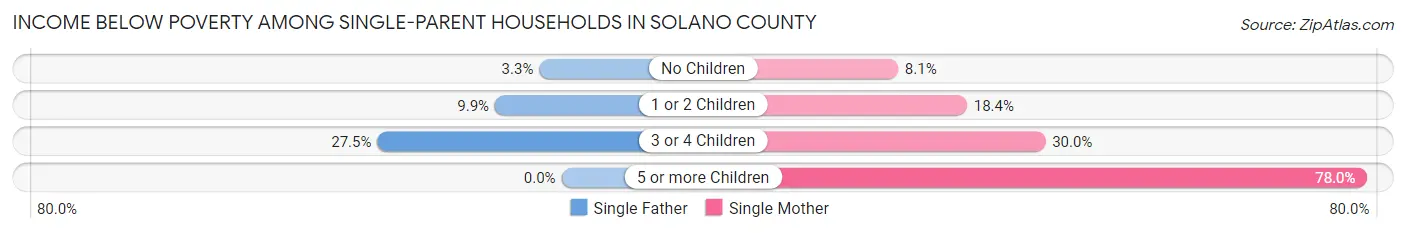
| Children | Single Father | Single Mother |
| No Children | 163 (3.3%) | 708 (8.1%) |
| 1 or 2 Children | 438 (9.9%) | 1,794 (18.3%) |
| 3 or 4 Children | 252 (27.5%) | 748 (30.0%) |
| 5 or more Children | 0 (0.0%) | 103 (78.0%) |
| Total | 853 (8.3%) | 3,353 (15.9%) |
Income Below Poverty Among Married-Couple vs Single-Parent Households in Solano County
The poverty data for Solano County shows that 2,623 of the married-couple family households (3.4%) and 4,206 of the single-parent households (13.4%) are living below the poverty level. Within the married-couple family households, those with 5 or more children have the highest poverty rate, with 29 households (7.1%) falling below the poverty line. Among the single-parent households, those with 5 or more children have the highest poverty rate, with 103 household (67.3%) living below poverty.
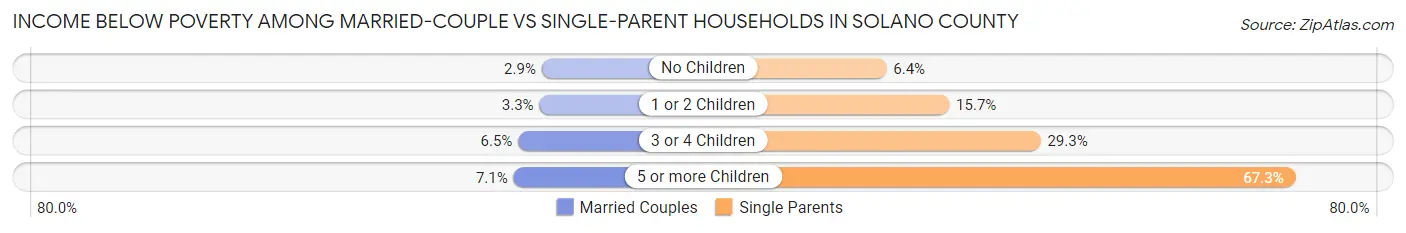
| Children | Married-Couple Families | Single-Parent Households |
| No Children | 1,326 (2.9%) | 871 (6.4%) |
| 1 or 2 Children | 855 (3.3%) | 2,232 (15.7%) |
| 3 or 4 Children | 413 (6.5%) | 1,000 (29.3%) |
| 5 or more Children | 29 (7.1%) | 103 (67.3%) |
| Total | 2,623 (3.4%) | 4,206 (13.4%) |
Race in Solano County
The most populous races in Solano County are White / Caucasian (207,575 | 46.0%), Hispanic or Latino (126,198 | 28.0%), and Asian (70,814 | 15.7%).
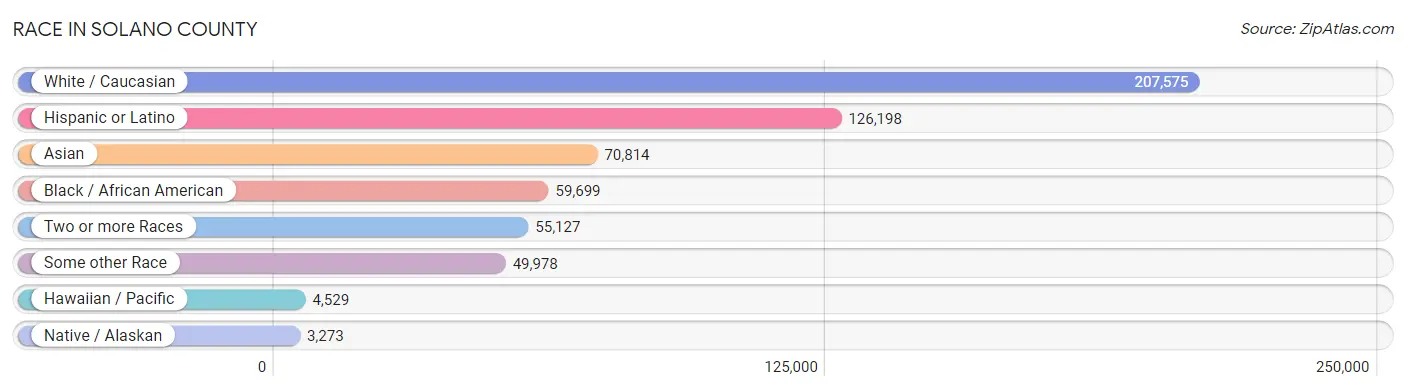
| Race | # Population | % Population |
| Asian | 70,814 | 15.7% |
| Black / African American | 59,699 | 13.2% |
| Hawaiian / Pacific | 4,529 | 1.0% |
| Hispanic or Latino | 126,198 | 28.0% |
| Native / Alaskan | 3,273 | 0.7% |
| White / Caucasian | 207,575 | 46.0% |
| Two or more Races | 55,127 | 12.2% |
| Some other Race | 49,978 | 11.1% |
| Total | 450,995 | 100.0% |
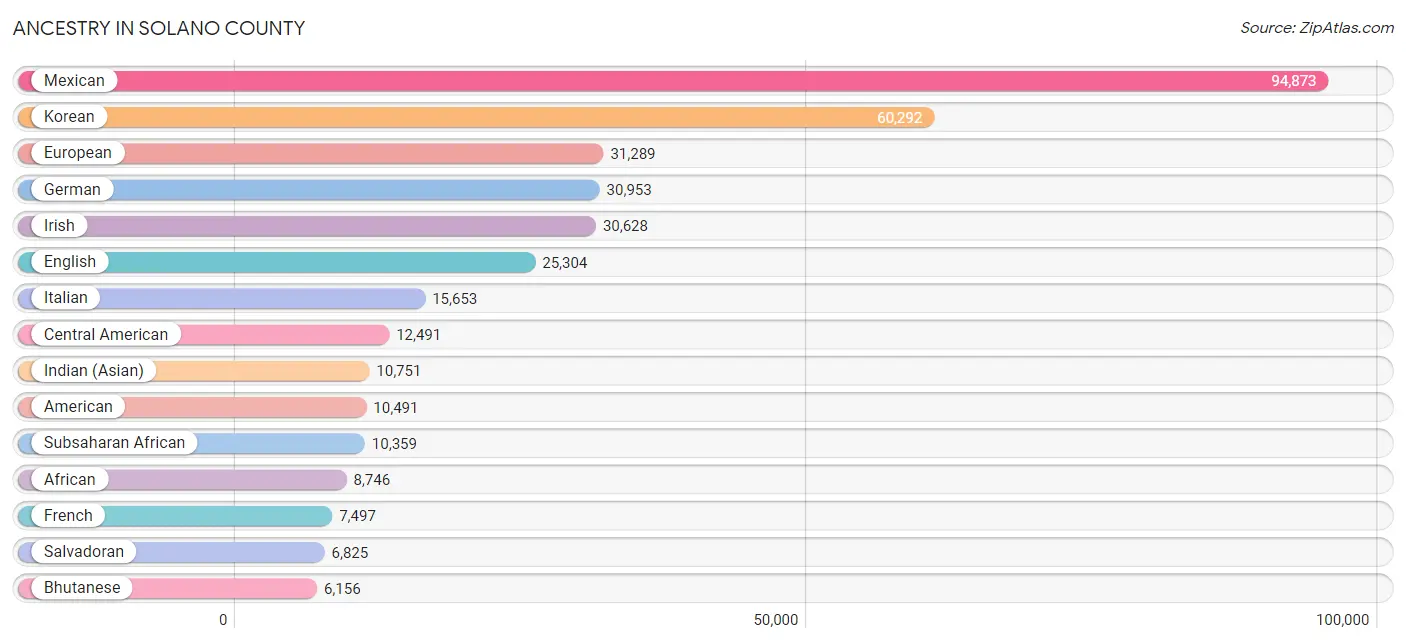
Ancestry in Solano County
The most populous ancestries reported in Solano County are Mexican (94,873 | 21.0%), Korean (60,292 | 13.4%), European (31,289 | 6.9%), German (30,953 | 6.9%), and Irish (30,628 | 6.8%), together accounting for 55.0% of all Solano County residents.
| Ancestry | # Population | % Population |
| Afghan | 212 | 0.1% |
| African | 8,746 | 1.9% |
| Alaska Native | 14 | 0.0% |
| Aleut | 7 | 0.0% |
| American | 10,491 | 2.3% |
| Apache | 200 | 0.0% |
| Arab | 1,700 | 0.4% |
| Argentinean | 125 | 0.0% |
| Armenian | 297 | 0.1% |
| Assyrian / Chaldean / Syriac | 77 | 0.0% |
| Australian | 24 | 0.0% |
| Austrian | 696 | 0.2% |
| Bangladeshi | 499 | 0.1% |
| Basque | 162 | 0.0% |
| Belgian | 377 | 0.1% |
| Belizean | 109 | 0.0% |
| Bermudan | 10 | 0.0% |
| Bhutanese | 6,156 | 1.4% |
| Blackfeet | 562 | 0.1% |
| Bolivian | 154 | 0.0% |
| Brazilian | 334 | 0.1% |
| British | 2,396 | 0.5% |
| British West Indian | 75 | 0.0% |
| Bulgarian | 98 | 0.0% |
| Burmese | 3,559 | 0.8% |
| Cajun | 65 | 0.0% |
| Cambodian | 4 | 0.0% |
| Canadian | 580 | 0.1% |
| Cape Verdean | 58 | 0.0% |
| Celtic | 31 | 0.0% |
| Central American | 12,491 | 2.8% |
| Central American Indian | 569 | 0.1% |
| Cherokee | 1,811 | 0.4% |
| Chickasaw | 191 | 0.0% |
| Chilean | 528 | 0.1% |
| Chinese | 48 | 0.0% |
| Chippewa | 221 | 0.1% |
| Choctaw | 476 | 0.1% |
| Colombian | 633 | 0.1% |
| Comanche | 51 | 0.0% |
| Costa Rican | 53 | 0.0% |
| Cree | 97 | 0.0% |
| Creek | 183 | 0.0% |
| Croatian | 361 | 0.1% |
| Crow | 15 | 0.0% |
| Cuban | 783 | 0.2% |
| Czech | 307 | 0.1% |
| Czechoslovakian | 183 | 0.0% |
| Danish | 1,900 | 0.4% |
| Delaware | 141 | 0.0% |
| Dominican | 488 | 0.1% |
| Dutch | 2,515 | 0.6% |
| Eastern European | 677 | 0.2% |
| Ecuadorian | 192 | 0.0% |
| Egyptian | 308 | 0.1% |
| English | 25,304 | 5.6% |
| Estonian | 13 | 0.0% |
| Ethiopian | 322 | 0.1% |
| European | 31,289 | 6.9% |
| Fijian | 21 | 0.0% |
| Filipino | 237 | 0.1% |
| Finnish | 607 | 0.1% |
| French | 7,497 | 1.7% |
| French Canadian | 1,308 | 0.3% |
| German | 30,953 | 6.9% |
| German Russian | 39 | 0.0% |
| Ghanaian | 104 | 0.0% |
| Greek | 1,299 | 0.3% |
| Guamanian / Chamorro | 3,027 | 0.7% |
| Guatemalan | 2,735 | 0.6% |
| Guyanese | 29 | 0.0% |
| Haitian | 132 | 0.0% |
| Honduran | 373 | 0.1% |
| Hungarian | 527 | 0.1% |
| Icelander | 53 | 0.0% |
| Indian (Asian) | 10,751 | 2.4% |
| Indonesian | 115 | 0.0% |
| Inupiat | 21 | 0.0% |
| Iranian | 611 | 0.1% |
| Iraqi | 28 | 0.0% |
| Irish | 30,628 | 6.8% |
| Iroquois | 80 | 0.0% |
| Israeli | 157 | 0.0% |
| Italian | 15,653 | 3.5% |
| Jamaican | 719 | 0.2% |
| Japanese | 327 | 0.1% |
| Jordanian | 118 | 0.0% |
| Kenyan | 56 | 0.0% |
| Kiowa | 14 | 0.0% |
| Korean | 60,292 | 13.4% |
| Laotian | 426 | 0.1% |
| Latvian | 18 | 0.0% |
| Lebanese | 266 | 0.1% |
| Liberian | 62 | 0.0% |
| Lithuanian | 712 | 0.2% |
| Luxembourger | 14 | 0.0% |
| Macedonian | 63 | 0.0% |
| Malaysian | 1,246 | 0.3% |
| Maltese | 203 | 0.1% |
| Mexican | 94,873 | 21.0% |
| Mexican American Indian | 1,266 | 0.3% |
| Mongolian | 143 | 0.0% |
| Moroccan | 80 | 0.0% |
| Native Hawaiian | 2,565 | 0.6% |
| Navajo | 419 | 0.1% |
| Nepalese | 295 | 0.1% |
| New Zealander | 47 | 0.0% |
| Nicaraguan | 2,126 | 0.5% |
| Nigerian | 571 | 0.1% |
| Northern European | 908 | 0.2% |
| Norwegian | 4,496 | 1.0% |
| Osage | 86 | 0.0% |
| Ottawa | 2 | 0.0% |
| Paiute | 21 | 0.0% |
| Pakistani | 1,120 | 0.3% |
| Palestinian | 430 | 0.1% |
| Panamanian | 361 | 0.1% |
| Paraguayan | 1 | 0.0% |
| Pennsylvania German | 71 | 0.0% |
| Peruvian | 1,238 | 0.3% |
| Polish | 3,938 | 0.9% |
| Portuguese | 5,431 | 1.2% |
| Potawatomi | 9 | 0.0% |
| Pueblo | 575 | 0.1% |
| Puerto Rican | 4,986 | 1.1% |
| Romanian | 296 | 0.1% |
| Russian | 1,910 | 0.4% |
| Salvadoran | 6,825 | 1.5% |
| Samoan | 1,761 | 0.4% |
| Scandinavian | 1,229 | 0.3% |
| Scotch-Irish | 3,046 | 0.7% |
| Scottish | 4,482 | 1.0% |
| Seminole | 6 | 0.0% |
| Senegalese | 9 | 0.0% |
| Serbian | 299 | 0.1% |
| Shoshone | 6 | 0.0% |
| Sioux | 119 | 0.0% |
| Slavic | 211 | 0.1% |
| Slovak | 184 | 0.0% |
| Slovene | 134 | 0.0% |
| Somali | 21 | 0.0% |
| South African | 53 | 0.0% |
| South American | 3,563 | 0.8% |
| South American Indian | 70 | 0.0% |
| Spaniard | 3,426 | 0.8% |
| Spanish | 2,337 | 0.5% |
| Spanish American | 25 | 0.0% |
| Sri Lankan | 3,916 | 0.9% |
| Subsaharan African | 10,359 | 2.3% |
| Sudanese | 31 | 0.0% |
| Swedish | 3,362 | 0.7% |
| Swiss | 835 | 0.2% |
| Syrian | 87 | 0.0% |
| Taiwanese | 92 | 0.0% |
| Thai | 5,150 | 1.1% |
| Tlingit-Haida | 87 | 0.0% |
| Tohono O'Odham | 95 | 0.0% |
| Tongan | 349 | 0.1% |
| Trinidadian and Tobagonian | 62 | 0.0% |
| Tsimshian | 23 | 0.0% |
| Turkish | 76 | 0.0% |
| Ugandan | 23 | 0.0% |
| Ukrainian | 616 | 0.1% |
| Uruguayan | 260 | 0.1% |
| Ute | 12 | 0.0% |
| Venezuelan | 331 | 0.1% |
| Welsh | 1,689 | 0.4% |
| West Indian | 222 | 0.1% |
| Yaqui | 228 | 0.1% |
| Yugoslavian | 172 | 0.0% |
| Yuman | 15 | 0.0% | View All 171 Rows |
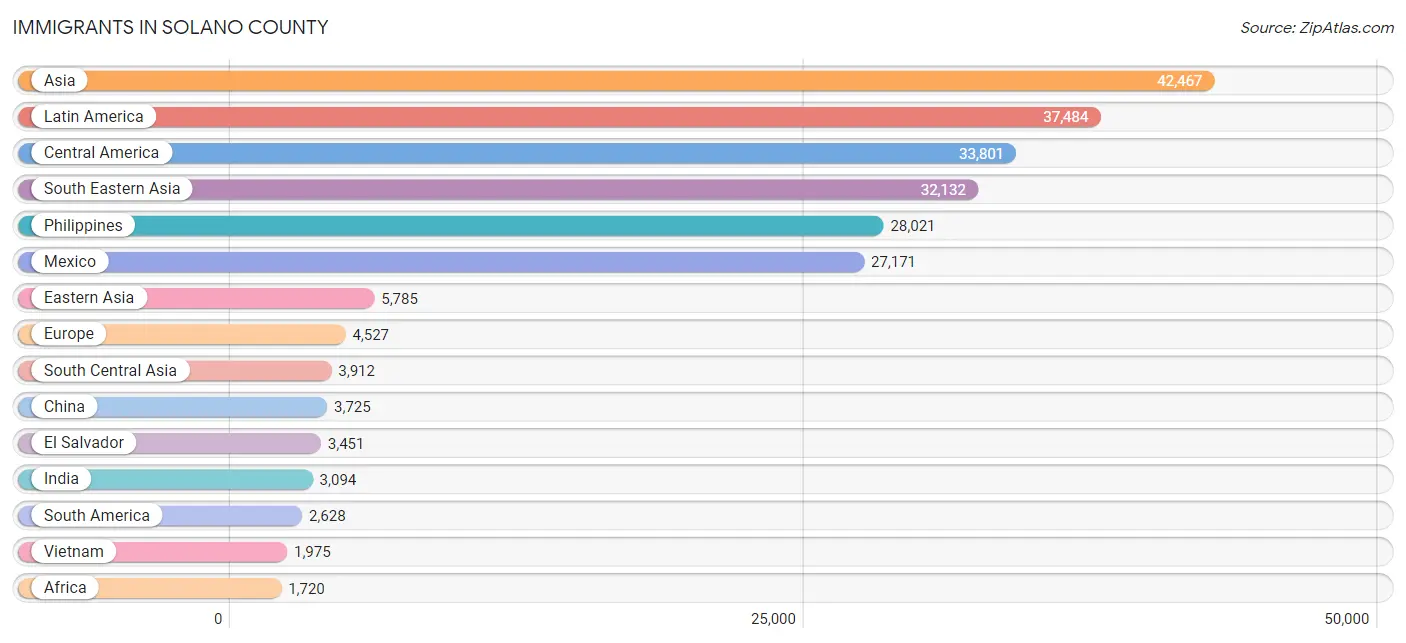
Immigrants in Solano County
The most numerous immigrant groups reported in Solano County came from Asia (42,467 | 9.4%), Latin America (37,484 | 8.3%), Central America (33,801 | 7.5%), South Eastern Asia (32,132 | 7.1%), and Philippines (28,021 | 6.2%), together accounting for 38.5% of all Solano County residents.
| Immigration Origin | # Population | % Population |
| Afghanistan | 211 | 0.1% |
| Africa | 1,720 | 0.4% |
| Argentina | 112 | 0.0% |
| Armenia | 11 | 0.0% |
| Asia | 42,467 | 9.4% |
| Australia | 102 | 0.0% |
| Austria | 29 | 0.0% |
| Azores | 116 | 0.0% |
| Bangladesh | 1 | 0.0% |
| Belarus | 19 | 0.0% |
| Belgium | 32 | 0.0% |
| Belize | 9 | 0.0% |
| Bolivia | 39 | 0.0% |
| Bosnia and Herzegovina | 6 | 0.0% |
| Brazil | 594 | 0.1% |
| Bulgaria | 70 | 0.0% |
| Cambodia | 140 | 0.0% |
| Cameroon | 33 | 0.0% |
| Canada | 971 | 0.2% |
| Caribbean | 1,055 | 0.2% |
| Central America | 33,801 | 7.5% |
| Chile | 166 | 0.0% |
| China | 3,725 | 0.8% |
| Colombia | 414 | 0.1% |
| Congo | 34 | 0.0% |
| Costa Rica | 178 | 0.0% |
| Croatia | 48 | 0.0% |
| Cuba | 473 | 0.1% |
| Czechoslovakia | 52 | 0.0% |
| Denmark | 43 | 0.0% |
| Dominica | 23 | 0.0% |
| Dominican Republic | 179 | 0.0% |
| Eastern Africa | 458 | 0.1% |
| Eastern Asia | 5,785 | 1.3% |
| Eastern Europe | 1,146 | 0.3% |
| Ecuador | 75 | 0.0% |
| Egypt | 190 | 0.0% |
| El Salvador | 3,451 | 0.8% |
| England | 426 | 0.1% |
| Eritrea | 25 | 0.0% |
| Ethiopia | 195 | 0.0% |
| Europe | 4,527 | 1.0% |
| Fiji | 778 | 0.2% |
| France | 250 | 0.1% |
| Germany | 732 | 0.2% |
| Ghana | 77 | 0.0% |
| Greece | 212 | 0.1% |
| Guatemala | 1,530 | 0.3% |
| Haiti | 96 | 0.0% |
| Honduras | 262 | 0.1% |
| Hong Kong | 590 | 0.1% |
| Hungary | 113 | 0.0% |
| India | 3,094 | 0.7% |
| Indonesia | 218 | 0.1% |
| Iran | 293 | 0.1% |
| Iraq | 30 | 0.0% |
| Ireland | 133 | 0.0% |
| Israel | 42 | 0.0% |
| Italy | 318 | 0.1% |
| Jamaica | 229 | 0.1% |
| Japan | 1,022 | 0.2% |
| Jordan | 130 | 0.0% |
| Kazakhstan | 21 | 0.0% |
| Kenya | 56 | 0.0% |
| Korea | 1,038 | 0.2% |
| Kuwait | 14 | 0.0% |
| Laos | 558 | 0.1% |
| Latin America | 37,484 | 8.3% |
| Lebanon | 103 | 0.0% |
| Liberia | 85 | 0.0% |
| Lithuania | 42 | 0.0% |
| Malaysia | 189 | 0.0% |
| Mexico | 27,171 | 6.0% |
| Micronesia | 67 | 0.0% |
| Middle Africa | 67 | 0.0% |
| Moldova | 8 | 0.0% |
| Morocco | 35 | 0.0% |
| Nepal | 166 | 0.0% |
| Netherlands | 135 | 0.0% |
| Nicaragua | 1,039 | 0.2% |
| Nigeria | 351 | 0.1% |
| North Macedonia | 32 | 0.0% |
| Northern Africa | 324 | 0.1% |
| Northern Europe | 1,251 | 0.3% |
| Norway | 5 | 0.0% |
| Oceania | 1,431 | 0.3% |
| Pakistan | 60 | 0.0% |
| Panama | 161 | 0.0% |
| Peru | 749 | 0.2% |
| Philippines | 28,021 | 6.2% |
| Poland | 90 | 0.0% |
| Portugal | 325 | 0.1% |
| Russia | 384 | 0.1% |
| Saudi Arabia | 29 | 0.0% |
| Scotland | 91 | 0.0% |
| Senegal | 9 | 0.0% |
| Sierra Leone | 114 | 0.0% |
| Singapore | 27 | 0.0% |
| Somalia | 16 | 0.0% |
| South Africa | 80 | 0.0% |
| South America | 2,628 | 0.6% |
| South Central Asia | 3,912 | 0.9% |
| South Eastern Asia | 32,132 | 7.1% |
| Southern Europe | 924 | 0.2% |
| Spain | 69 | 0.0% |
| Sri Lanka | 24 | 0.0% |
| Sudan | 14 | 0.0% |
| Sweden | 19 | 0.0% |
| Switzerland | 28 | 0.0% |
| Syria | 13 | 0.0% |
| Taiwan | 416 | 0.1% |
| Thailand | 861 | 0.2% |
| Turkey | 60 | 0.0% |
| Uganda | 40 | 0.0% |
| Ukraine | 270 | 0.1% |
| Uruguay | 260 | 0.1% |
| Uzbekistan | 42 | 0.0% |
| Venezuela | 197 | 0.0% |
| Vietnam | 1,975 | 0.4% |
| West Indies | 38 | 0.0% |
| Western Africa | 665 | 0.2% |
| Western Asia | 528 | 0.1% |
| Western Europe | 1,206 | 0.3% |
| Yemen | 52 | 0.0% | View All 124 Rows |
Sex and Age in Solano County
Sex and Age in Solano County
The most populous age groups in Solano County are 30 to 34 Years (16,942 | 7.5%) for men and 30 to 34 Years (15,926 | 7.1%) for women.
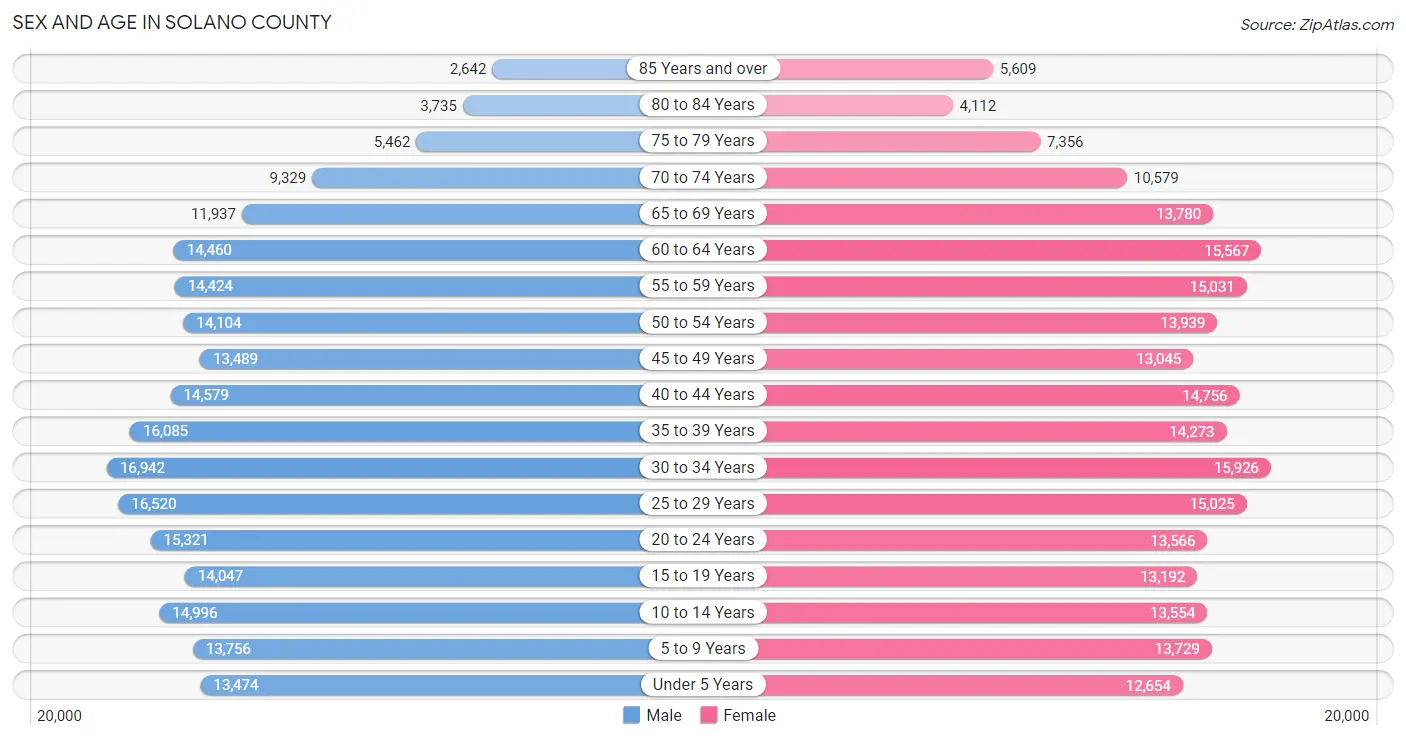
| Age Bracket | Male | Female |
| Under 5 Years | 13,474 (6.0%) | 12,654 (5.6%) |
| 5 to 9 Years | 13,756 (6.1%) | 13,729 (6.1%) |
| 10 to 14 Years | 14,996 (6.7%) | 13,554 (6.0%) |
| 15 to 19 Years | 14,047 (6.2%) | 13,192 (5.9%) |
| 20 to 24 Years | 15,321 (6.8%) | 13,566 (6.0%) |
| 25 to 29 Years | 16,520 (7.3%) | 15,025 (6.7%) |
| 30 to 34 Years | 16,942 (7.5%) | 15,926 (7.1%) |
| 35 to 39 Years | 16,085 (7.1%) | 14,273 (6.3%) |
| 40 to 44 Years | 14,579 (6.5%) | 14,756 (6.5%) |
| 45 to 49 Years | 13,489 (6.0%) | 13,045 (5.8%) |
| 50 to 54 Years | 14,104 (6.3%) | 13,939 (6.2%) |
| 55 to 59 Years | 14,424 (6.4%) | 15,031 (6.7%) |
| 60 to 64 Years | 14,460 (6.4%) | 15,567 (6.9%) |
| 65 to 69 Years | 11,937 (5.3%) | 13,780 (6.1%) |
| 70 to 74 Years | 9,329 (4.1%) | 10,579 (4.7%) |
| 75 to 79 Years | 5,462 (2.4%) | 7,356 (3.3%) |
| 80 to 84 Years | 3,735 (1.7%) | 4,112 (1.8%) |
| 85 Years and over | 2,642 (1.2%) | 5,609 (2.5%) |
| Total | 225,302 (100.0%) | 225,693 (100.0%) |
Families and Households in Solano County
Median Family Size in Solano County
The median family size in Solano County is 3.36 persons per family, with married-couple families (77,945 | 71.3%) accounting for the largest median family size of 3.41 persons per family. On the other hand, single male/father families (10,285 | 9.4%) represent the smallest median family size with 2.94 persons per family.
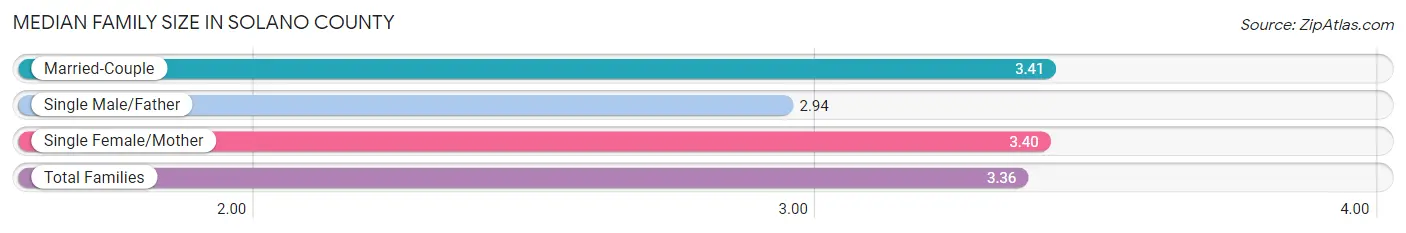
| Family Type | # Families | Family Size |
| Married-Couple | 77,945 (71.3%) | 3.41 |
| Single Male/Father | 10,285 (9.4%) | 2.94 |
| Single Female/Mother | 21,160 (19.3%) | 3.40 |
| Total Families | 109,390 (100.0%) | 3.36 |
Median Household Size in Solano County
The median household size in Solano County is 2.84 persons per household, with single female/mother households (21,160 | 13.7%) accounting for the largest median household size of 3.71 persons per household. non-family households (45,597 | 29.4%) represent the smallest median household size with 1.28 persons per household.
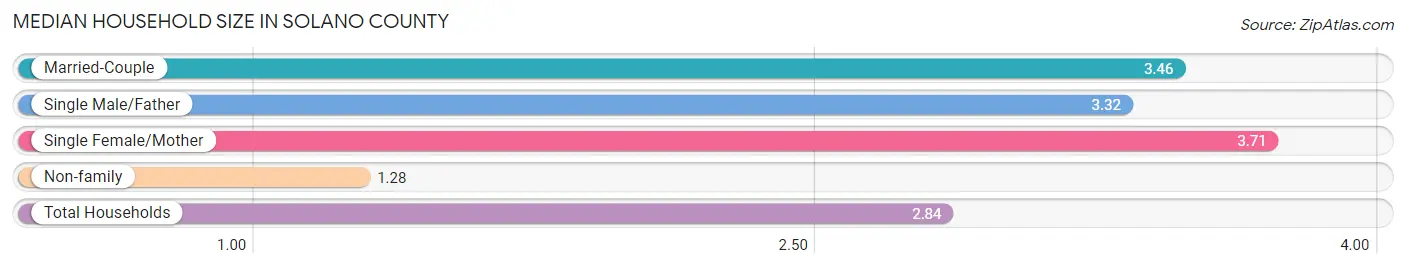
| Household Type | # Households | Household Size |
| Married-Couple | 77,945 (50.3%) | 3.46 |
| Single Male/Father | 10,285 (6.6%) | 3.32 |
| Single Female/Mother | 21,160 (13.7%) | 3.71 |
| Non-family | 45,597 (29.4%) | 1.28 |
| Total Households | 154,987 (100.0%) | 2.84 |
Household Size by Marriage Status in Solano County
Out of a total of 154,987 households in Solano County, 109,390 (70.6%) are family households, while 45,597 (29.4%) are nonfamily households. The most numerous type of family households are 2-person households, comprising 41,064, and the most common type of nonfamily households are 1-person households, comprising 36,451.
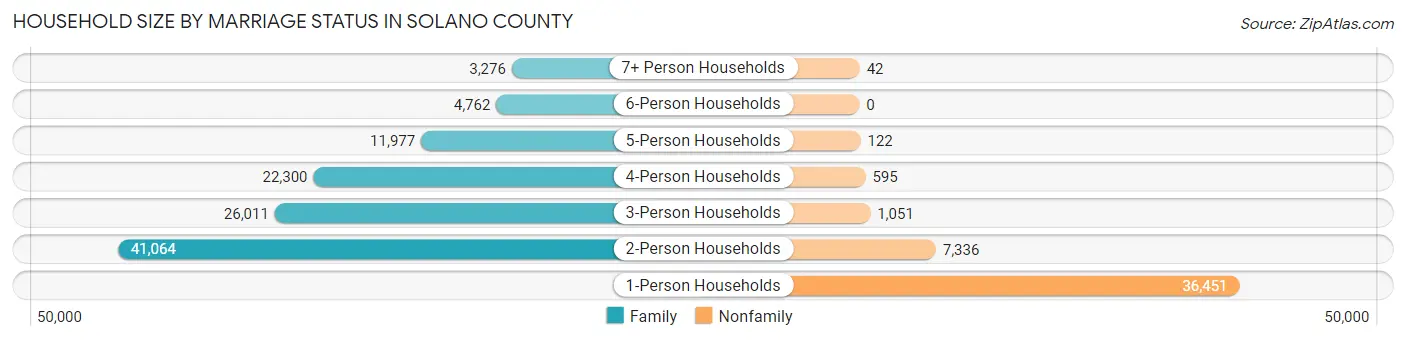
| Household Size | Family Households | Nonfamily Households |
| 1-Person Households | - | 36,451 (23.5%) |
| 2-Person Households | 41,064 (26.5%) | 7,336 (4.7%) |
| 3-Person Households | 26,011 (16.8%) | 1,051 (0.7%) |
| 4-Person Households | 22,300 (14.4%) | 595 (0.4%) |
| 5-Person Households | 11,977 (7.7%) | 122 (0.1%) |
| 6-Person Households | 4,762 (3.1%) | 0 (0.0%) |
| 7+ Person Households | 3,276 (2.1%) | 42 (0.0%) |
| Total | 109,390 (70.6%) | 45,597 (29.4%) |
Female Fertility in Solano County
Fertility by Age in Solano County
Average fertility rate in Solano County is 57.0 births per 1,000 women. Women in the age bracket of 20 to 34 years have the highest fertility rate with 90.0 births per 1,000 women. Women in the age bracket of 20 to 34 years acount for 68.8% of all women with births.
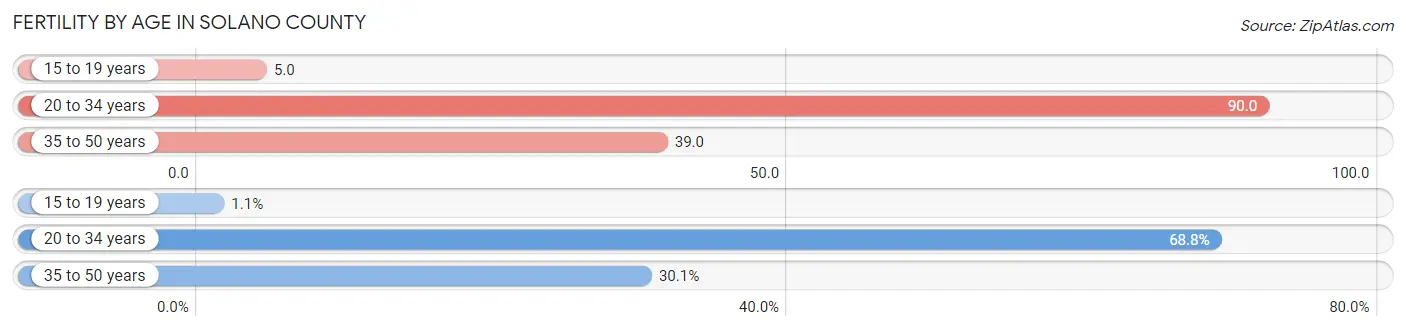
| Age Bracket | Women with Births | Births / 1,000 Women |
| 15 to 19 years | 65 (1.1%) | 5.0 |
| 20 to 34 years | 4,026 (68.8%) | 90.0 |
| 35 to 50 years | 1,764 (30.1%) | 39.0 |
| Total | 5,855 (100.0%) | 57.0 |
Fertility by Age by Marriage Status in Solano County
64.4% of women with births (5,855) in Solano County are married. The highest percentage of unmarried women with births falls into 20 to 34 years age bracket with 41.6% of them unmarried at the time of birth, while the lowest percentage of unmarried women with births belong to 35 to 50 years age bracket with 21.8% of them unmarried.
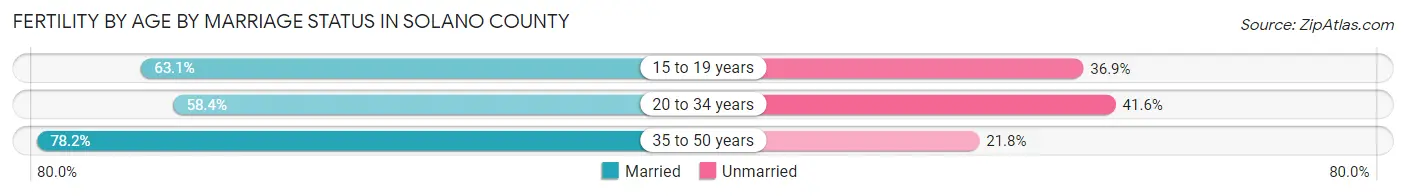
| Age Bracket | Married | Unmarried |
| 15 to 19 years | 41 (63.1%) | 24 (36.9%) |
| 20 to 34 years | 2,351 (58.4%) | 1,675 (41.6%) |
| 35 to 50 years | 1,379 (78.2%) | 385 (21.8%) |
| Total | 3,771 (64.4%) | 2,084 (35.6%) |
Fertility by Education in Solano County
Average fertility rate in Solano County is 57.0 births per 1,000 women. Women with the education attainment of bachelor's degree have the highest fertility rate of 65.0 births per 1,000 women, while women with the education attainment of less than high school have the lowest fertility at 43.0 births per 1,000 women. Women with the education attainment of college or associate's degree represent 37.3% of all women with births.
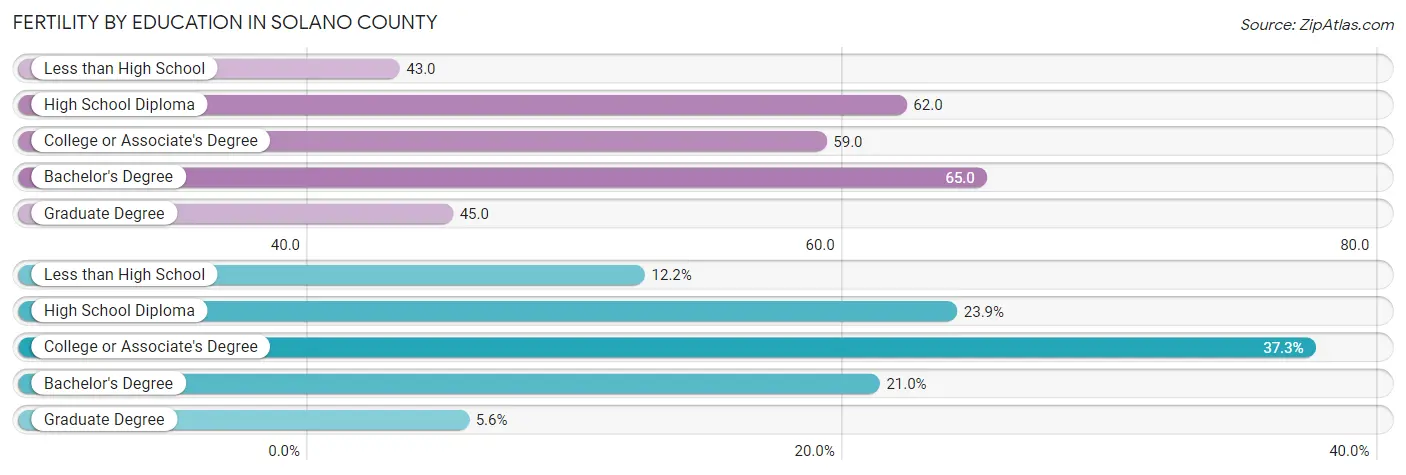
| Educational Attainment | Women with Births | Births / 1,000 Women |
| Less than High School | 714 (12.2%) | 43.0 |
| High School Diploma | 1,399 (23.9%) | 62.0 |
| College or Associate's Degree | 2,185 (37.3%) | 59.0 |
| Bachelor's Degree | 1,229 (21.0%) | 65.0 |
| Graduate Degree | 328 (5.6%) | 45.0 |
| Total | 5,855 (100.0%) | 57.0 |
Fertility by Education by Marriage Status in Solano County
35.6% of women with births in Solano County are unmarried. Women with the educational attainment of graduate degree are most likely to be married with 91.8% of them married at childbirth, while women with the educational attainment of high school diploma are least likely to be married with 50.8% of them unmarried at childbirth.
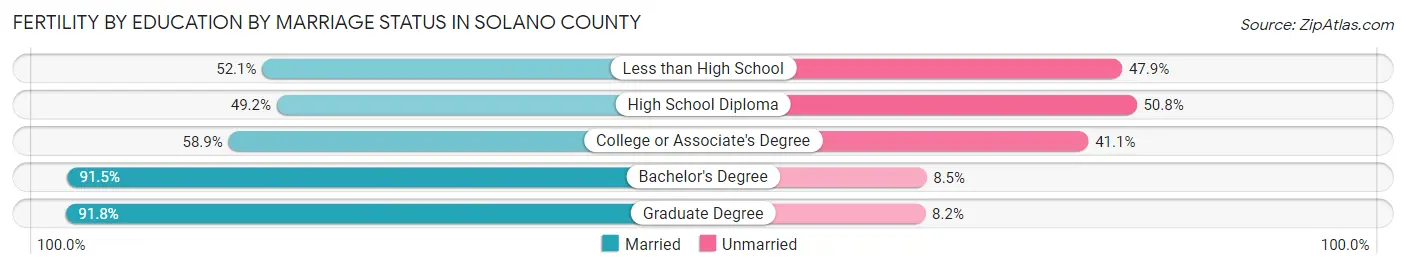
| Educational Attainment | Married | Unmarried |
| Less than High School | 372 (52.1%) | 342 (47.9%) |
| High School Diploma | 688 (49.2%) | 711 (50.8%) |
| College or Associate's Degree | 1,287 (58.9%) | 898 (41.1%) |
| Bachelor's Degree | 1,125 (91.5%) | 104 (8.5%) |
| Graduate Degree | 301 (91.8%) | 27 (8.2%) |
| Total | 3,771 (64.4%) | 2,084 (35.6%) |
Employment Characteristics in Solano County
Employment by Class of Employer in Solano County
Among the 209,755 employed individuals in Solano County, private company employees (132,548 | 63.2%), local government employees (19,877 | 9.5%), and not-for-profit organizations (17,471 | 8.3%) make up the most common classes of employment.
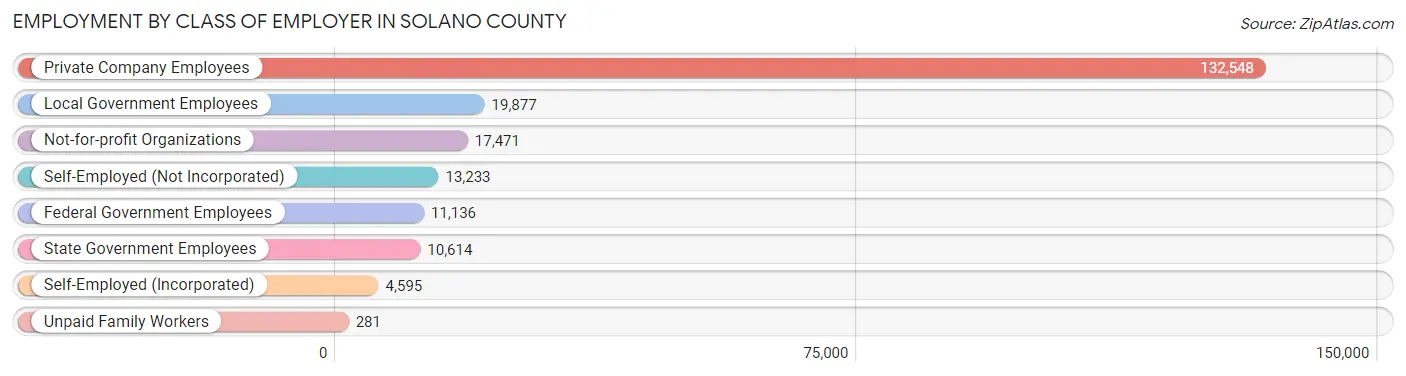
| Employer Class | # Employees | % Employees |
| Private Company Employees | 132,548 | 63.2% |
| Self-Employed (Incorporated) | 4,595 | 2.2% |
| Self-Employed (Not Incorporated) | 13,233 | 6.3% |
| Not-for-profit Organizations | 17,471 | 8.3% |
| Local Government Employees | 19,877 | 9.5% |
| State Government Employees | 10,614 | 5.1% |
| Federal Government Employees | 11,136 | 5.3% |
| Unpaid Family Workers | 281 | 0.1% |
| Total | 209,755 | 100.0% |
Employment Status by Age in Solano County
According to the labor force statistics for Solano County, out of the total population over 16 years of age (363,323), 63.2% or 229,620 individuals are in the labor force, with 5.9% or 13,548 of them unemployed. The age group with the highest labor force participation rate is 25 to 29 years, with 82.5% or 26,025 individuals in the labor force. Within the labor force, the 16 to 19 years age range has the highest percentage of unemployed individuals, with 14.4% or 1,252 of them being unemployed.
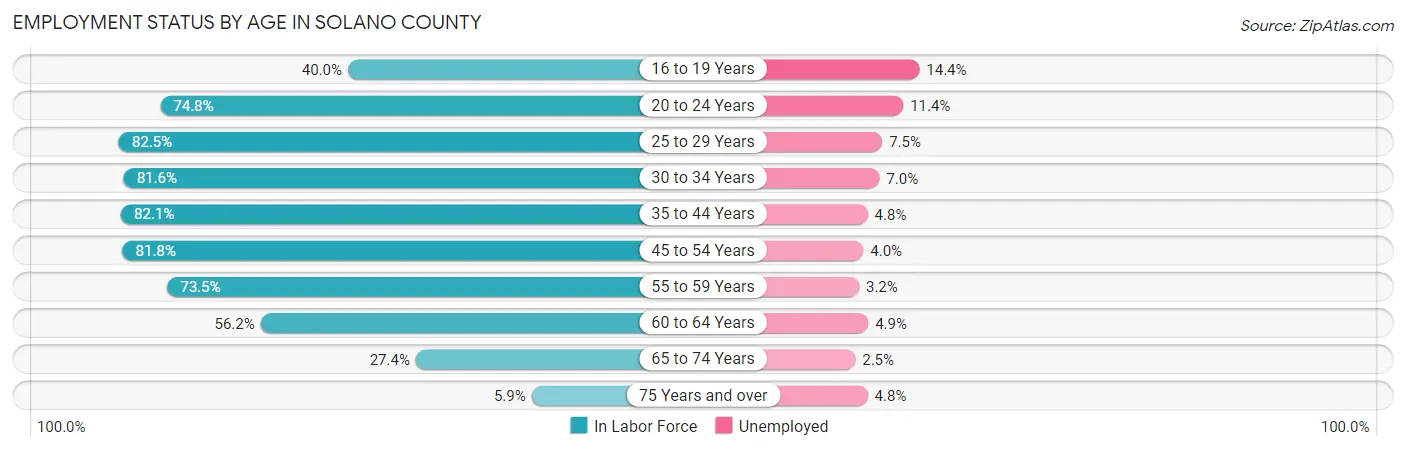
| Age Bracket | In Labor Force | Unemployed |
| 16 to 19 Years | 8,692 (40.0%) | 1,252 (14.4%) |
| 20 to 24 Years | 21,607 (74.8%) | 2,463 (11.4%) |
| 25 to 29 Years | 26,025 (82.5%) | 1,952 (7.5%) |
| 30 to 34 Years | 26,820 (81.6%) | 1,877 (7.0%) |
| 35 to 44 Years | 49,008 (82.1%) | 2,352 (4.8%) |
| 45 to 54 Years | 44,644 (81.8%) | 1,786 (4.0%) |
| 55 to 59 Years | 21,649 (73.5%) | 693 (3.2%) |
| 60 to 64 Years | 16,875 (56.2%) | 827 (4.9%) |
| 65 to 74 Years | 12,501 (27.4%) | 313 (2.5%) |
| 75 Years and over | 1,706 (5.9%) | 82 (4.8%) |
| Total | 229,620 (63.2%) | 13,548 (5.9%) |
Employment Status by Educational Attainment in Solano County
According to labor force statistics for Solano County, 77.7% of individuals (185,054) out of the total population between 25 and 64 years of age (238,165) are in the labor force, with 5.1% or 9,438 of them being unemployed. The group with the highest labor force participation rate are those with the educational attainment of bachelor's degree or higher, with 85.9% or 56,599 individuals in the labor force. Within the labor force, individuals with less than high school education have the highest percentage of unemployment, with 8.4% or 1,439 of them being unemployed.
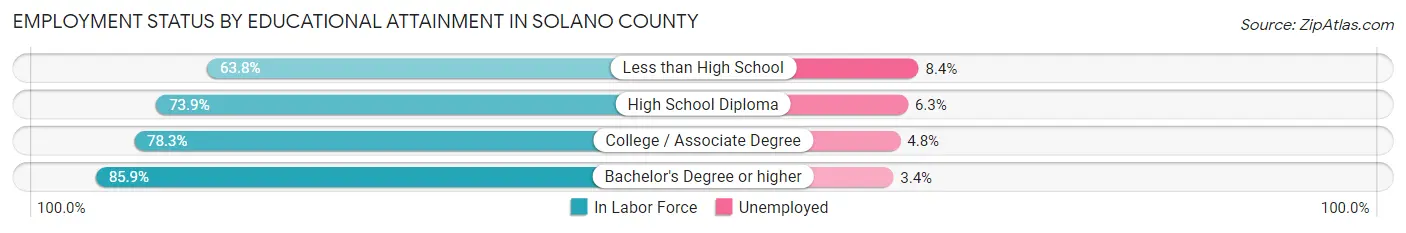
| Educational Attainment | In Labor Force | Unemployed |
| Less than High School | 17,128 (63.8%) | 2,255 (8.4%) |
| High School Diploma | 42,335 (73.9%) | 3,609 (6.3%) |
| College / Associate Degree | 69,016 (78.3%) | 4,231 (4.8%) |
| Bachelor's Degree or higher | 56,599 (85.9%) | 2,240 (3.4%) |
| Total | 185,054 (77.7%) | 12,146 (5.1%) |
Employment Occupations by Sex in Solano County
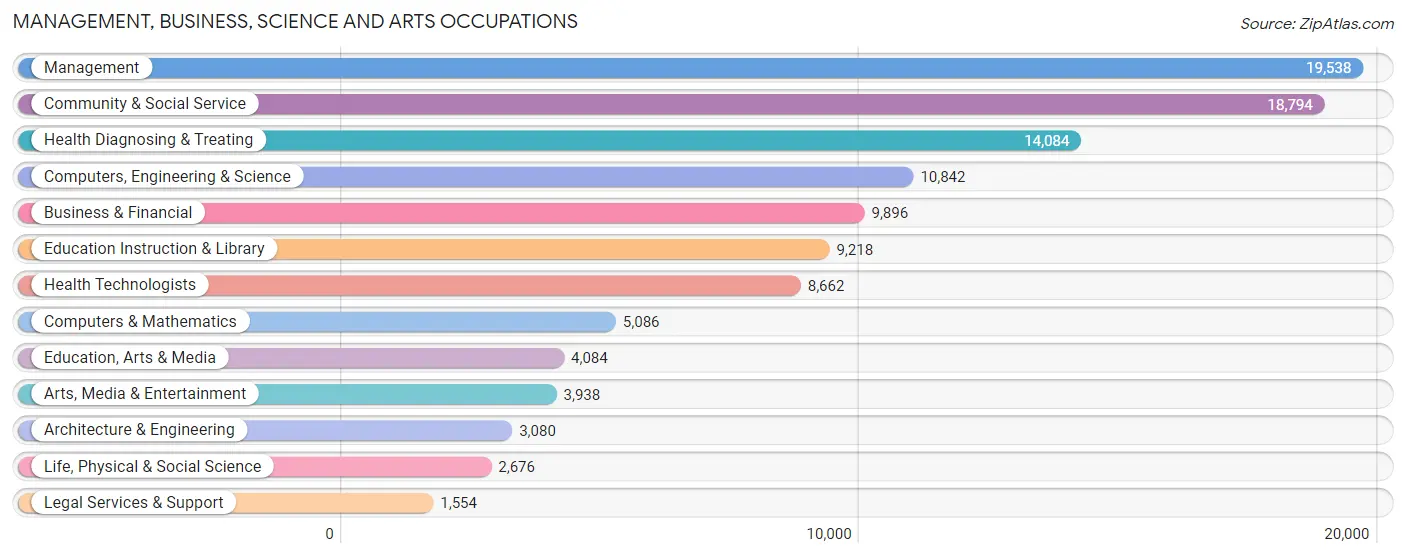
Management, Business, Science and Arts Occupations
The most common Management, Business, Science and Arts occupations in Solano County are Management (19,538 | 9.2%), Community & Social Service (18,794 | 8.9%), Health Diagnosing & Treating (14,084 | 6.6%), Computers, Engineering & Science (10,842 | 5.1%), and Business & Financial (9,896 | 4.7%).
Management, Business, Science and Arts Occupations by Sex
Within the Management, Business, Science and Arts occupations in Solano County, the most male-oriented occupations are Architecture & Engineering (76.4%), Computers & Mathematics (75.9%), and Computers, Engineering & Science (69.7%), while the most female-oriented occupations are Education Instruction & Library (73.9%), Health Diagnosing & Treating (70.7%), and Health Technologists (69.9%).
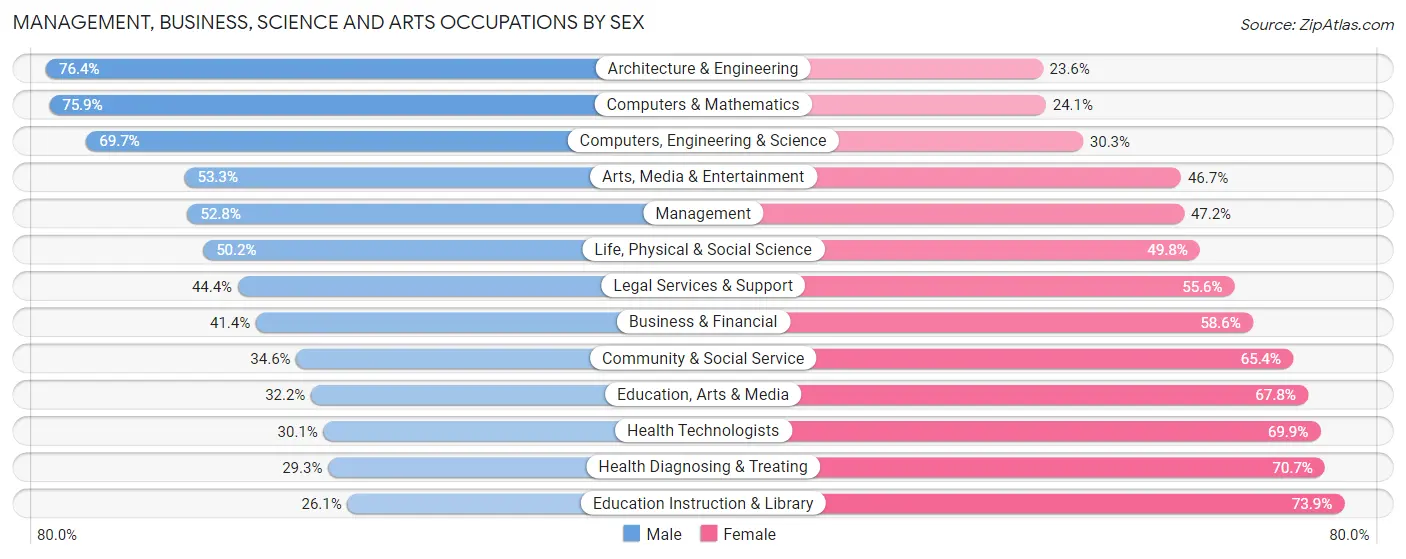
| Occupation | Male | Female |
| Management | 10,318 (52.8%) | 9,220 (47.2%) |
| Business & Financial | 4,095 (41.4%) | 5,801 (58.6%) |
| Computers, Engineering & Science | 7,555 (69.7%) | 3,287 (30.3%) |
| Computers & Mathematics | 3,859 (75.9%) | 1,227 (24.1%) |
| Architecture & Engineering | 2,353 (76.4%) | 727 (23.6%) |
| Life, Physical & Social Science | 1,343 (50.2%) | 1,333 (49.8%) |
| Community & Social Service | 6,510 (34.6%) | 12,284 (65.4%) |
| Education, Arts & Media | 1,314 (32.2%) | 2,770 (67.8%) |
| Legal Services & Support | 690 (44.4%) | 864 (55.6%) |
| Education Instruction & Library | 2,407 (26.1%) | 6,811 (73.9%) |
| Arts, Media & Entertainment | 2,099 (53.3%) | 1,839 (46.7%) |
| Health Diagnosing & Treating | 4,131 (29.3%) | 9,953 (70.7%) |
| Health Technologists | 2,607 (30.1%) | 6,055 (69.9%) |
| Total (Category) | 32,609 (44.6%) | 40,545 (55.4%) |
| Total (Overall) | 111,138 (52.4%) | 101,020 (47.6%) |
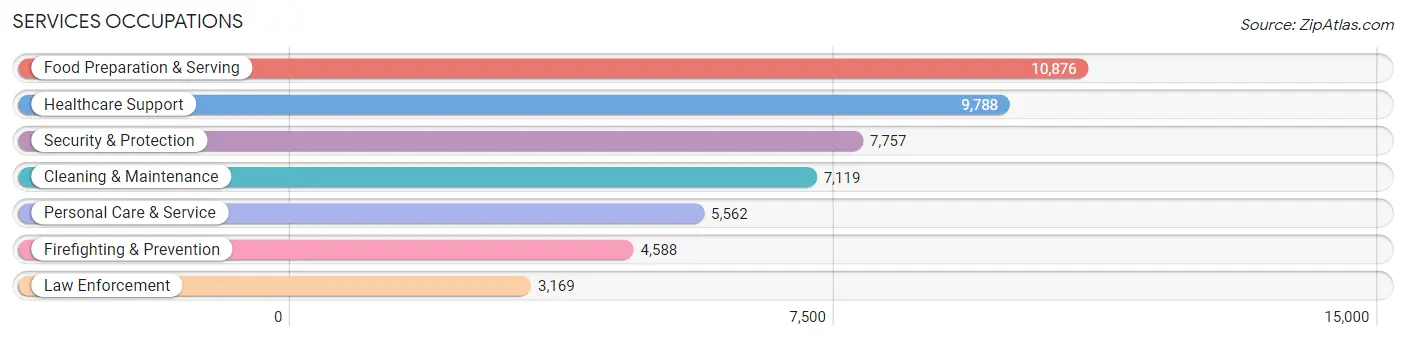
Services Occupations
The most common Services occupations in Solano County are Food Preparation & Serving (10,876 | 5.1%), Healthcare Support (9,788 | 4.6%), Security & Protection (7,757 | 3.7%), Cleaning & Maintenance (7,119 | 3.4%), and Personal Care & Service (5,562 | 2.6%).
Services Occupations by Sex
Within the Services occupations in Solano County, the most male-oriented occupations are Law Enforcement (81.9%), Security & Protection (76.7%), and Firefighting & Prevention (73.1%), while the most female-oriented occupations are Healthcare Support (82.5%), Personal Care & Service (76.2%), and Food Preparation & Serving (57.5%).
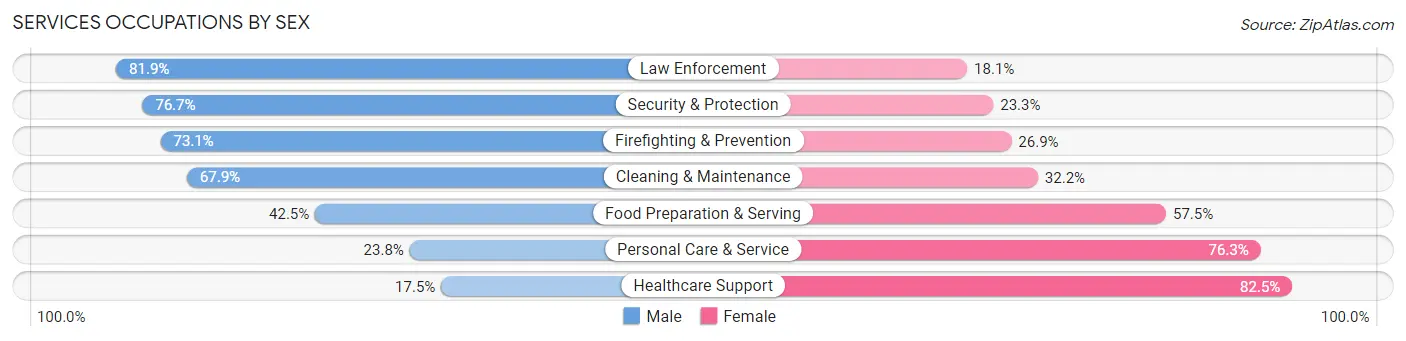
| Occupation | Male | Female |
| Healthcare Support | 1,714 (17.5%) | 8,074 (82.5%) |
| Security & Protection | 5,948 (76.7%) | 1,809 (23.3%) |
| Firefighting & Prevention | 3,354 (73.1%) | 1,234 (26.9%) |
| Law Enforcement | 2,594 (81.9%) | 575 (18.1%) |
| Food Preparation & Serving | 4,619 (42.5%) | 6,257 (57.5%) |
| Cleaning & Maintenance | 4,830 (67.8%) | 2,289 (32.2%) |
| Personal Care & Service | 1,321 (23.7%) | 4,241 (76.2%) |
| Total (Category) | 18,432 (44.8%) | 22,670 (55.2%) |
| Total (Overall) | 111,138 (52.4%) | 101,020 (47.6%) |
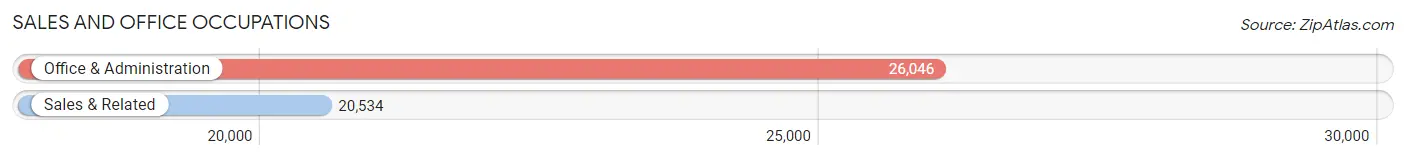
Sales and Office Occupations
The most common Sales and Office occupations in Solano County are Office & Administration (26,046 | 12.3%), and Sales & Related (20,534 | 9.7%).
Sales and Office Occupations by Sex
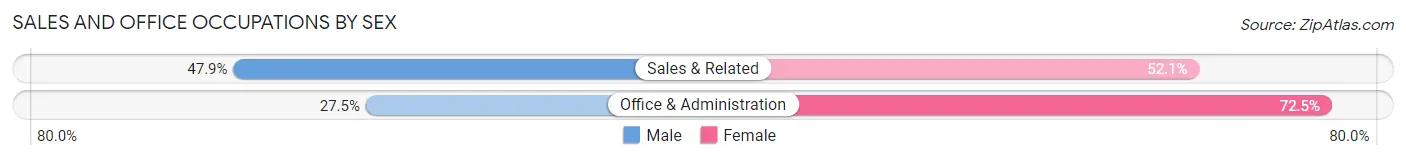
| Occupation | Male | Female |
| Sales & Related | 9,831 (47.9%) | 10,703 (52.1%) |
| Office & Administration | 7,164 (27.5%) | 18,882 (72.5%) |
| Total (Category) | 16,995 (36.5%) | 29,585 (63.5%) |
| Total (Overall) | 111,138 (52.4%) | 101,020 (47.6%) |
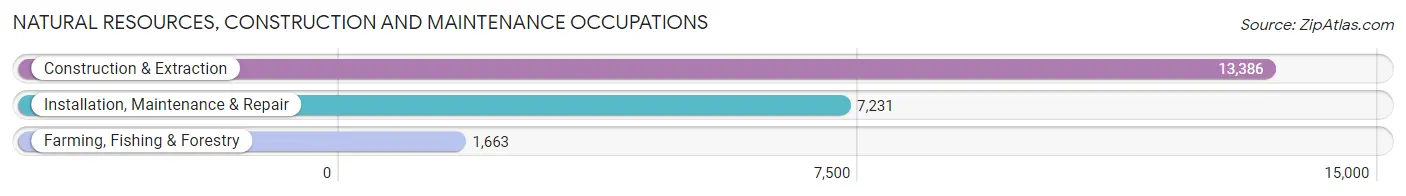
Natural Resources, Construction and Maintenance Occupations
The most common Natural Resources, Construction and Maintenance occupations in Solano County are Construction & Extraction (13,386 | 6.3%), Installation, Maintenance & Repair (7,231 | 3.4%), and Farming, Fishing & Forestry (1,663 | 0.8%).
Natural Resources, Construction and Maintenance Occupations by Sex
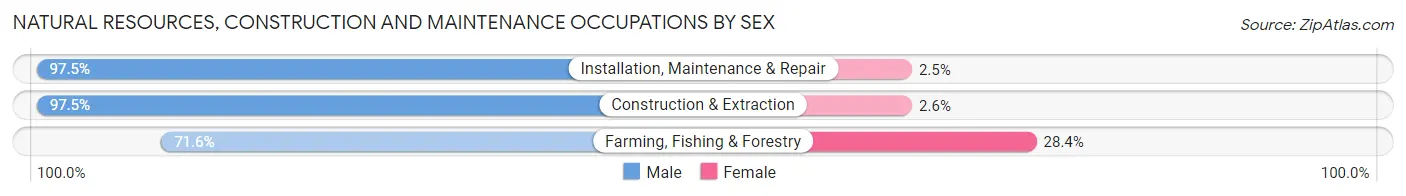
| Occupation | Male | Female |
| Farming, Fishing & Forestry | 1,190 (71.6%) | 473 (28.4%) |
| Construction & Extraction | 13,045 (97.5%) | 341 (2.5%) |
| Installation, Maintenance & Repair | 7,050 (97.5%) | 181 (2.5%) |
| Total (Category) | 21,285 (95.5%) | 995 (4.5%) |
| Total (Overall) | 111,138 (52.4%) | 101,020 (47.6%) |
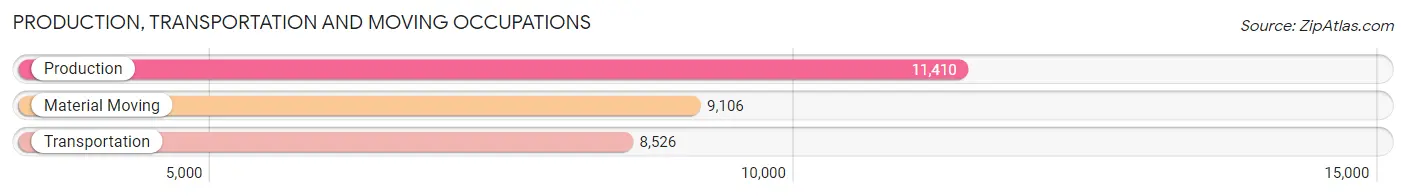
Production, Transportation and Moving Occupations
The most common Production, Transportation and Moving occupations in Solano County are Production (11,410 | 5.4%), Material Moving (9,106 | 4.3%), and Transportation (8,526 | 4.0%).
Production, Transportation and Moving Occupations by Sex
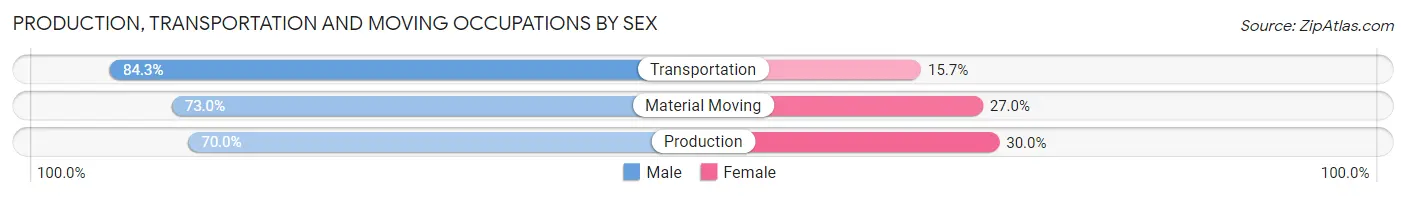
| Occupation | Male | Female |
| Production | 7,983 (70.0%) | 3,427 (30.0%) |
| Transportation | 7,188 (84.3%) | 1,338 (15.7%) |
| Material Moving | 6,646 (73.0%) | 2,460 (27.0%) |
| Total (Category) | 21,817 (75.1%) | 7,225 (24.9%) |
| Total (Overall) | 111,138 (52.4%) | 101,020 (47.6%) |
Employment Industries by Sex in Solano County
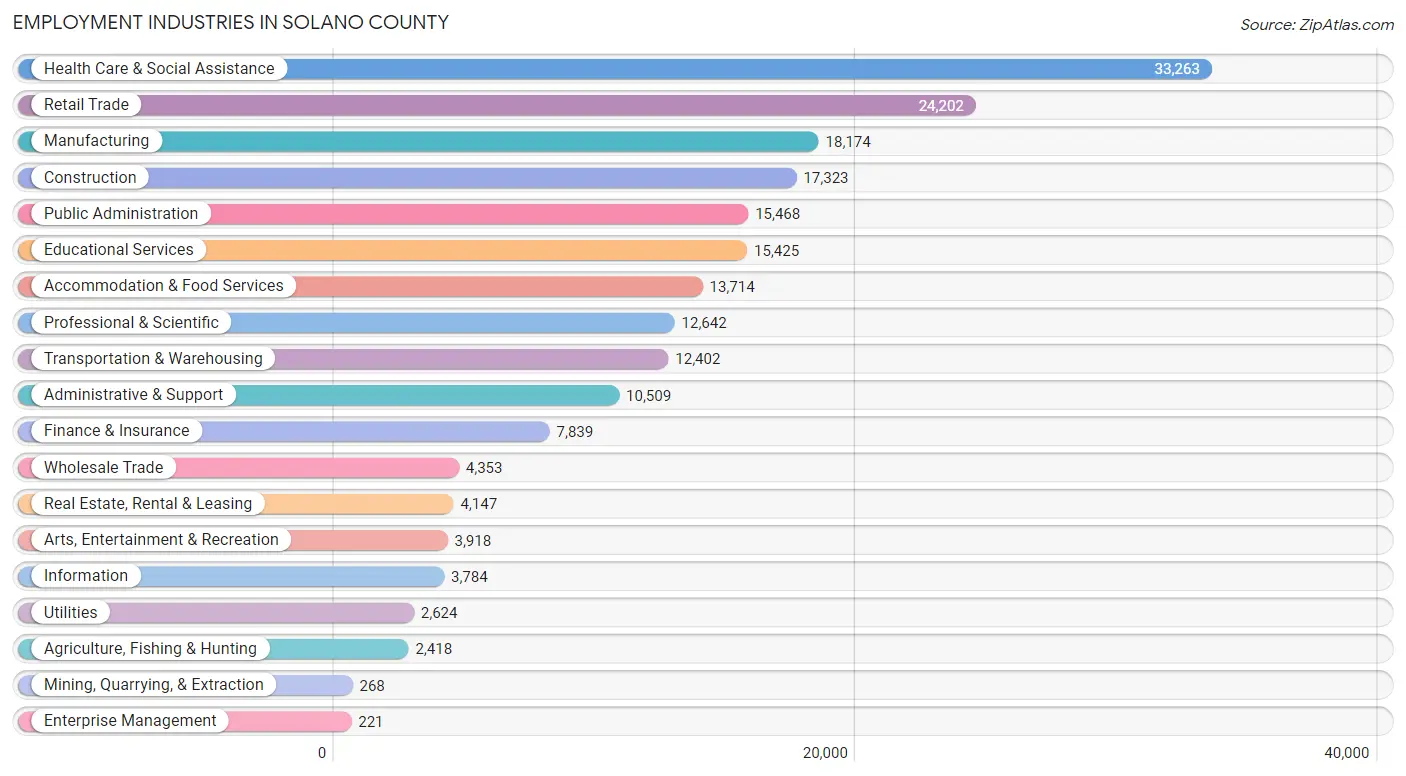
Employment Industries in Solano County
The major employment industries in Solano County include Health Care & Social Assistance (33,263 | 15.7%), Retail Trade (24,202 | 11.4%), Manufacturing (18,174 | 8.6%), Construction (17,323 | 8.2%), and Public Administration (15,468 | 7.3%).
Employment Industries by Sex in Solano County
The Solano County industries that see more men than women are Mining, Quarrying, & Extraction (96.6%), Construction (89.2%), and Transportation & Warehousing (72.8%), whereas the industries that tend to have a higher number of women are Health Care & Social Assistance (74.1%), Educational Services (67.2%), and Finance & Insurance (62.9%).
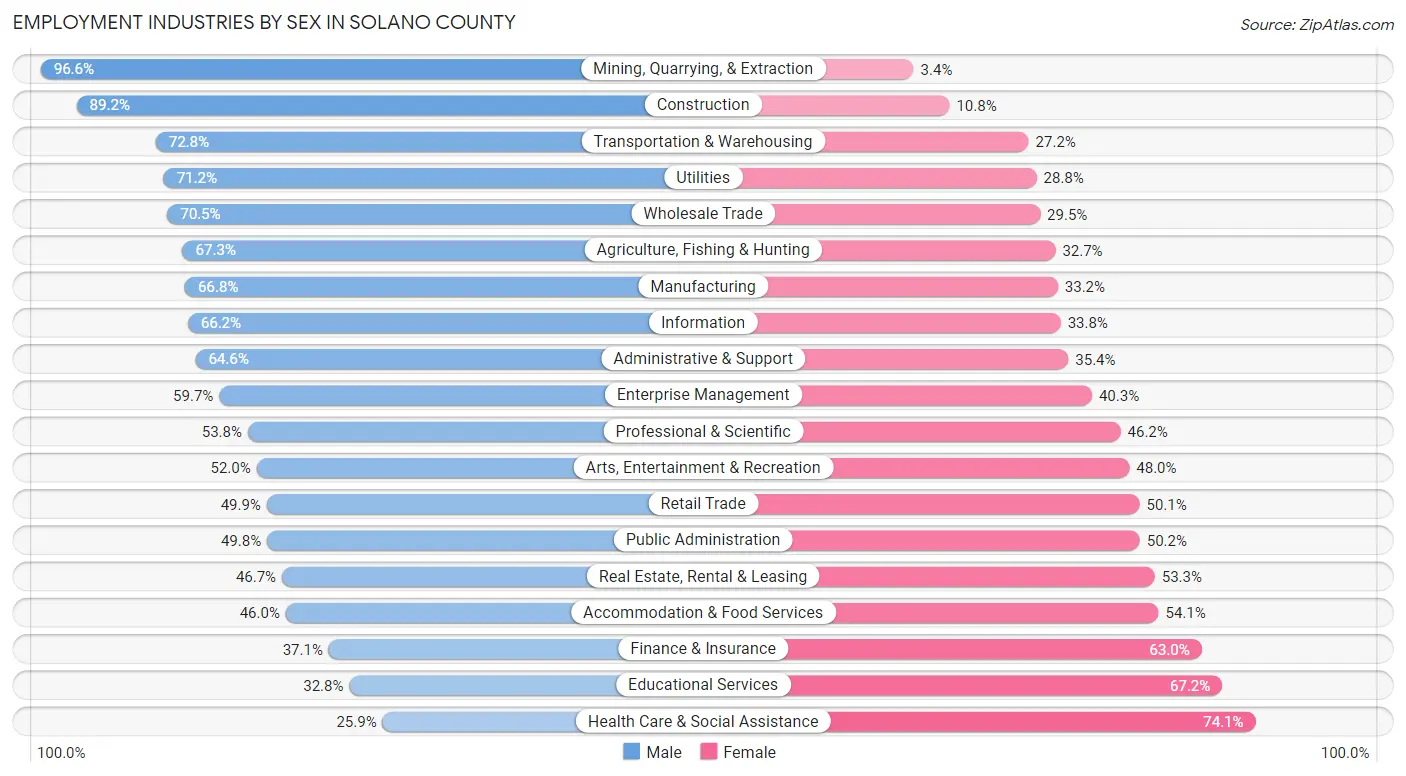
| Industry | Male | Female |
| Agriculture, Fishing & Hunting | 1,627 (67.3%) | 791 (32.7%) |
| Mining, Quarrying, & Extraction | 259 (96.6%) | 9 (3.4%) |
| Construction | 15,455 (89.2%) | 1,868 (10.8%) |
| Manufacturing | 12,138 (66.8%) | 6,036 (33.2%) |
| Wholesale Trade | 3,067 (70.5%) | 1,286 (29.5%) |
| Retail Trade | 12,075 (49.9%) | 12,127 (50.1%) |
| Transportation & Warehousing | 9,034 (72.8%) | 3,368 (27.2%) |
| Utilities | 1,868 (71.2%) | 756 (28.8%) |
| Information | 2,505 (66.2%) | 1,279 (33.8%) |
| Finance & Insurance | 2,904 (37.0%) | 4,935 (62.9%) |
| Real Estate, Rental & Leasing | 1,938 (46.7%) | 2,209 (53.3%) |
| Professional & Scientific | 6,801 (53.8%) | 5,841 (46.2%) |
| Enterprise Management | 132 (59.7%) | 89 (40.3%) |
| Administrative & Support | 6,791 (64.6%) | 3,718 (35.4%) |
| Educational Services | 5,060 (32.8%) | 10,365 (67.2%) |
| Health Care & Social Assistance | 8,621 (25.9%) | 24,642 (74.1%) |
| Arts, Entertainment & Recreation | 2,037 (52.0%) | 1,881 (48.0%) |
| Accommodation & Food Services | 6,302 (46.0%) | 7,412 (54.0%) |
| Public Administration | 7,707 (49.8%) | 7,761 (50.2%) |
| Total | 111,138 (52.4%) | 101,020 (47.6%) |
Education in Solano County
School Enrollment in Solano County
The most common levels of schooling among the 108,269 students in Solano County are college / undergraduate (25,652 | 23.7%), high school (23,234 | 21.5%), and middle school (21,864 | 20.2%).
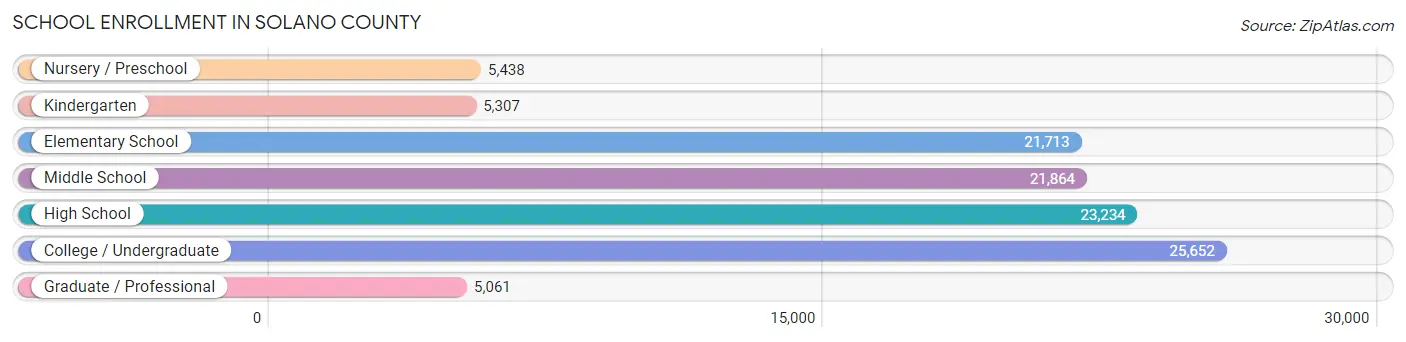
| School Level | # Students | % Students |
| Nursery / Preschool | 5,438 | 5.0% |
| Kindergarten | 5,307 | 4.9% |
| Elementary School | 21,713 | 20.1% |
| Middle School | 21,864 | 20.2% |
| High School | 23,234 | 21.5% |
| College / Undergraduate | 25,652 | 23.7% |
| Graduate / Professional | 5,061 | 4.7% |
| Total | 108,269 | 100.0% |
School Enrollment by Age by Funding Source in Solano County
Out of a total of 108,269 students who are enrolled in schools in Solano County, 14,941 (13.8%) attend a private institution, while the remaining 93,328 (86.2%) are enrolled in public schools. The age group of 3 to 4 year olds has the highest likelihood of being enrolled in private schools, with 2,003 (46.8% in the age bracket) enrolled. Conversely, the age group of 15 to 17 year olds has the lowest likelihood of being enrolled in a private school, with 15,236 (94.4% in the age bracket) attending a public institution.
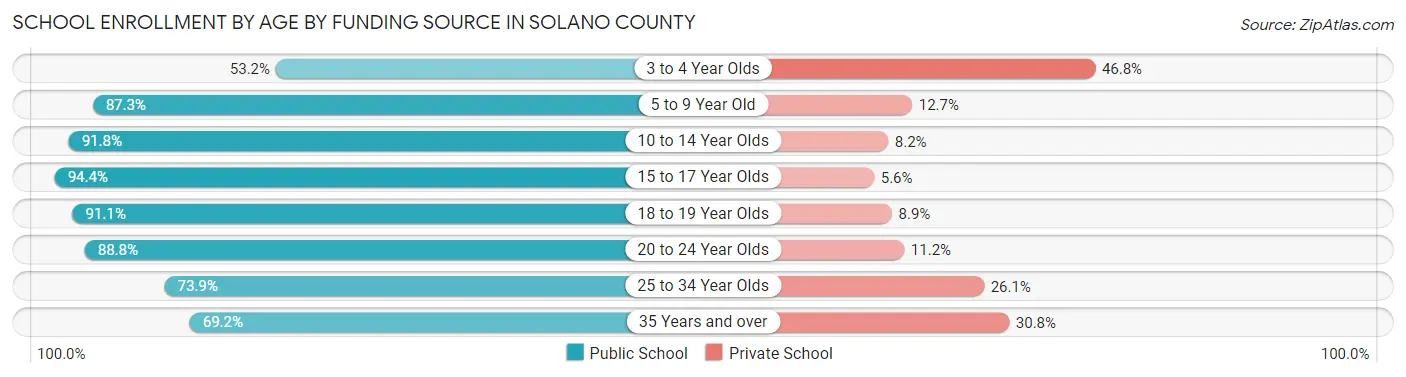
| Age Bracket | Public School | Private School |
| 3 to 4 Year Olds | 2,277 (53.2%) | 2,003 (46.8%) |
| 5 to 9 Year Old | 22,219 (87.3%) | 3,230 (12.7%) |
| 10 to 14 Year Olds | 25,428 (91.8%) | 2,281 (8.2%) |
| 15 to 17 Year Olds | 15,236 (94.4%) | 906 (5.6%) |
| 18 to 19 Year Olds | 6,509 (91.1%) | 638 (8.9%) |
| 20 to 24 Year Olds | 9,823 (88.8%) | 1,242 (11.2%) |
| 25 to 34 Year Olds | 6,528 (73.9%) | 2,303 (26.1%) |
| 35 Years and over | 5,293 (69.2%) | 2,353 (30.8%) |
| Total | 93,328 (86.2%) | 14,941 (13.8%) |
Educational Attainment by Field of Study in Solano County
Business (17,490 | 18.6%), science & technology (12,370 | 13.2%), social sciences (8,884 | 9.5%), arts & humanities (7,692 | 8.2%), and bio, nature & agricultural (7,079 | 7.5%) are the most common fields of study among 93,792 individuals in Solano County who have obtained a bachelor's degree or higher.
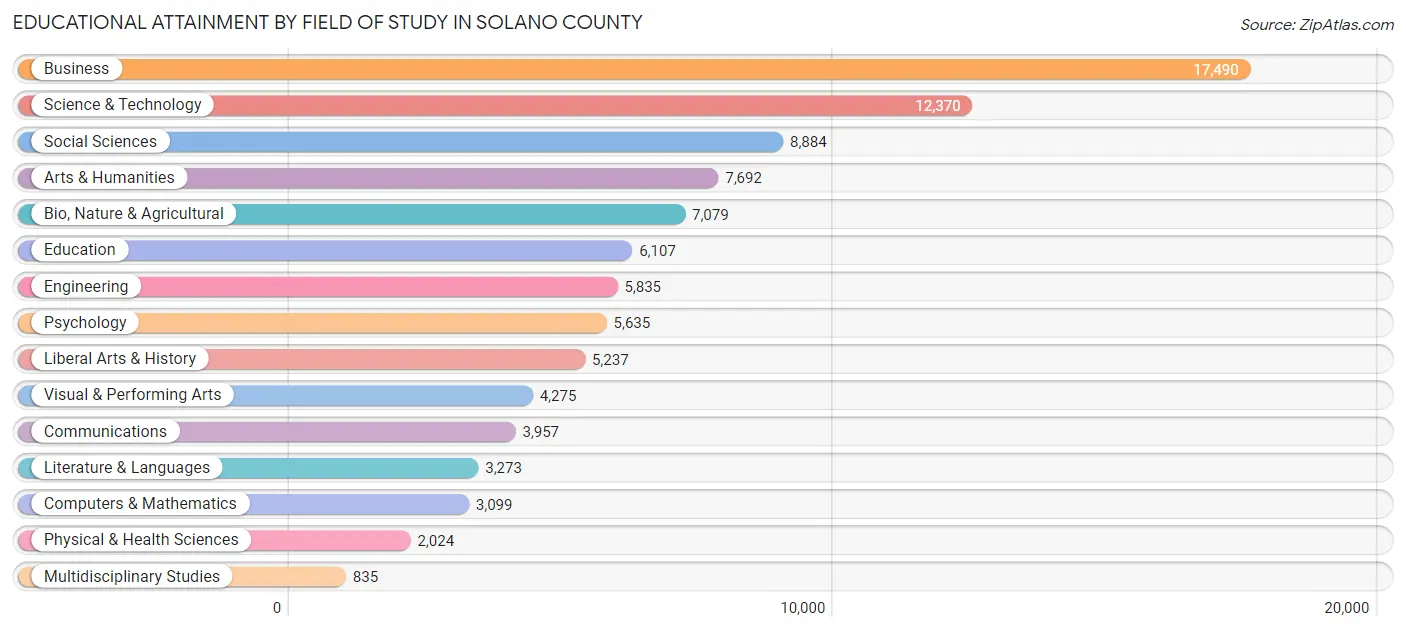
| Field of Study | # Graduates | % Graduates |
| Computers & Mathematics | 3,099 | 3.3% |
| Bio, Nature & Agricultural | 7,079 | 7.5% |
| Physical & Health Sciences | 2,024 | 2.2% |
| Psychology | 5,635 | 6.0% |
| Social Sciences | 8,884 | 9.5% |
| Engineering | 5,835 | 6.2% |
| Multidisciplinary Studies | 835 | 0.9% |
| Science & Technology | 12,370 | 13.2% |
| Business | 17,490 | 18.6% |
| Education | 6,107 | 6.5% |
| Literature & Languages | 3,273 | 3.5% |
| Liberal Arts & History | 5,237 | 5.6% |
| Visual & Performing Arts | 4,275 | 4.6% |
| Communications | 3,957 | 4.2% |
| Arts & Humanities | 7,692 | 8.2% |
| Total | 93,792 | 100.0% |
Transportation & Commute in Solano County
Vehicle Availability by Sex in Solano County
The most prevalent vehicle ownership categories in Solano County are males with 2 vehicles (38,890, accounting for 35.0%) and females with 2 vehicles (32,357, making up 39.7%).
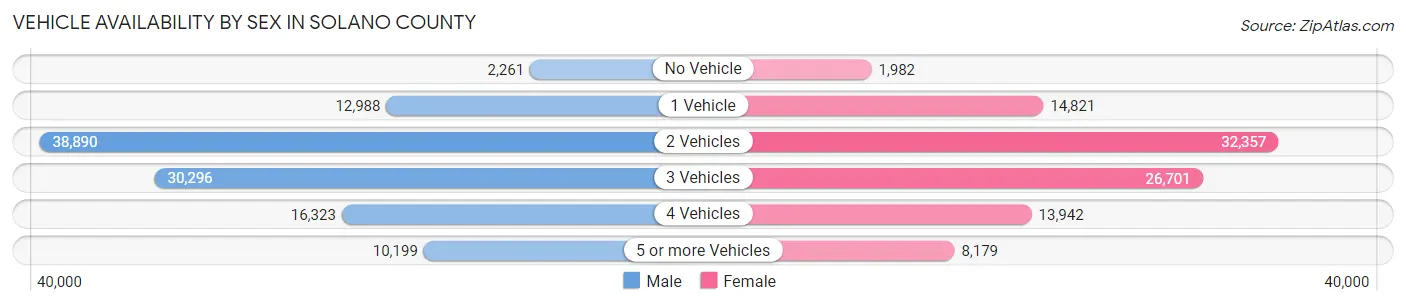
| Vehicles Available | Male | Female |
| No Vehicle | 2,261 (2.0%) | 1,982 (2.0%) |
| 1 Vehicle | 12,988 (11.7%) | 14,821 (15.1%) |
| 2 Vehicles | 38,890 (35.0%) | 32,357 (33.0%) |
| 3 Vehicles | 30,296 (27.3%) | 26,701 (27.3%) |
| 4 Vehicles | 16,323 (14.7%) | 13,942 (14.2%) |
| 5 or more Vehicles | 10,199 (9.2%) | 8,179 (8.4%) |
| Total | 110,957 (100.0%) | 97,982 (100.0%) |
Commute Time in Solano County
The most frequently occuring commute durations in Solano County are 15 to 19 minutes (24,843 commuters, 13.1%), 10 to 14 minutes (24,542 commuters, 12.9%), and 30 to 34 minutes (22,516 commuters, 11.9%).
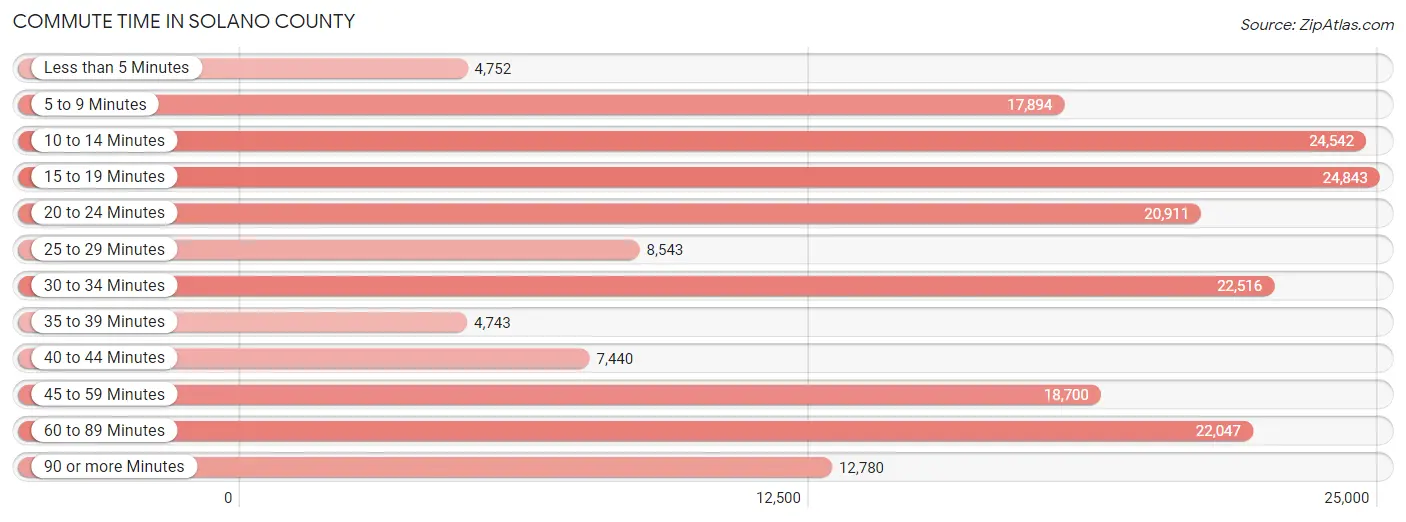
| Commute Time | # Commuters | % Commuters |
| Less than 5 Minutes | 4,752 | 2.5% |
| 5 to 9 Minutes | 17,894 | 9.4% |
| 10 to 14 Minutes | 24,542 | 12.9% |
| 15 to 19 Minutes | 24,843 | 13.1% |
| 20 to 24 Minutes | 20,911 | 11.0% |
| 25 to 29 Minutes | 8,543 | 4.5% |
| 30 to 34 Minutes | 22,516 | 11.9% |
| 35 to 39 Minutes | 4,743 | 2.5% |
| 40 to 44 Minutes | 7,440 | 3.9% |
| 45 to 59 Minutes | 18,700 | 9.9% |
| 60 to 89 Minutes | 22,047 | 11.6% |
| 90 or more Minutes | 12,780 | 6.7% |
Commute Time by Sex in Solano County
The most common commute times in Solano County are 60 to 89 minutes (14,596 commuters, 14.2%) for males and 10 to 14 minutes (13,016 commuters, 15.0%) for females.
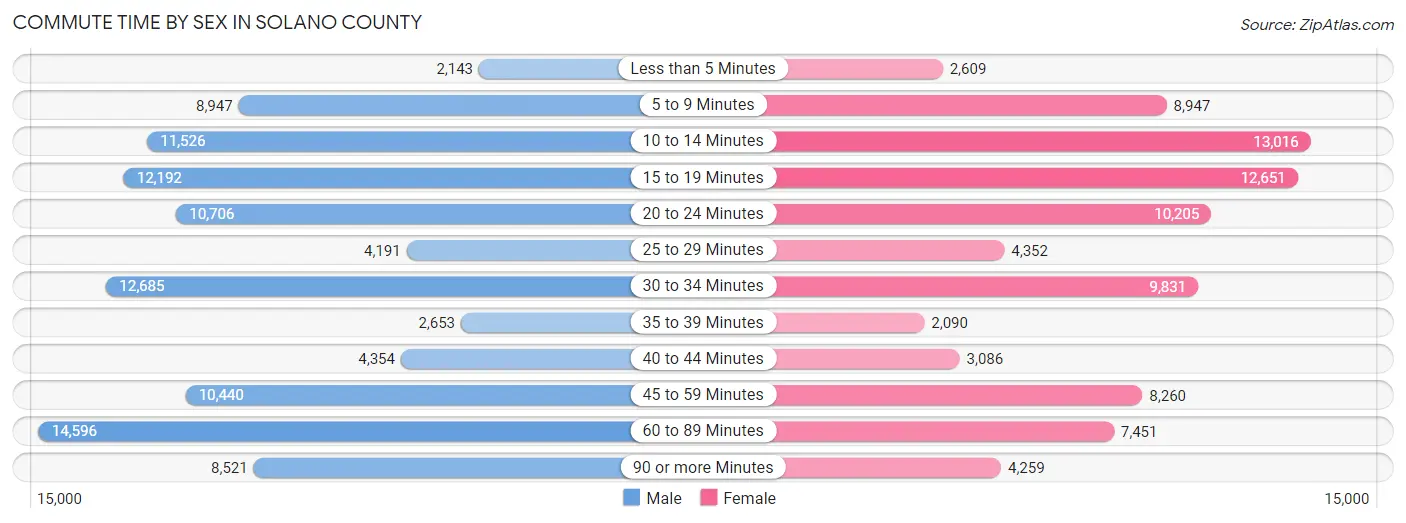
| Commute Time | Male | Female |
| Less than 5 Minutes | 2,143 (2.1%) | 2,609 (3.0%) |
| 5 to 9 Minutes | 8,947 (8.7%) | 8,947 (10.3%) |
| 10 to 14 Minutes | 11,526 (11.2%) | 13,016 (15.0%) |
| 15 to 19 Minutes | 12,192 (11.8%) | 12,651 (14.6%) |
| 20 to 24 Minutes | 10,706 (10.4%) | 10,205 (11.8%) |
| 25 to 29 Minutes | 4,191 (4.1%) | 4,352 (5.0%) |
| 30 to 34 Minutes | 12,685 (12.3%) | 9,831 (11.3%) |
| 35 to 39 Minutes | 2,653 (2.6%) | 2,090 (2.4%) |
| 40 to 44 Minutes | 4,354 (4.2%) | 3,086 (3.6%) |
| 45 to 59 Minutes | 10,440 (10.1%) | 8,260 (9.5%) |
| 60 to 89 Minutes | 14,596 (14.2%) | 7,451 (8.6%) |
| 90 or more Minutes | 8,521 (8.3%) | 4,259 (4.9%) |
Time of Departure to Work by Sex in Solano County
The most frequent times of departure to work in Solano County are 12:00 AM to 4:59 AM (12,167, 11.8%) for males and 7:00 AM to 7:29 AM (13,063, 15.1%) for females.
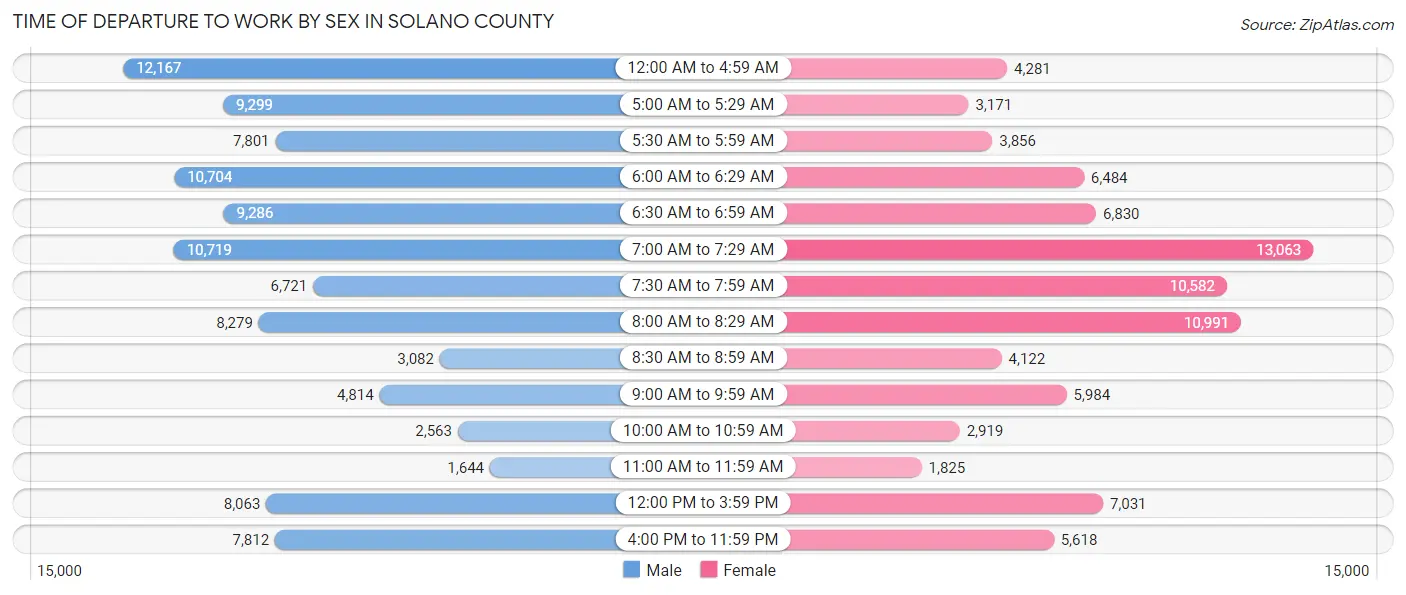
| Time of Departure | Male | Female |
| 12:00 AM to 4:59 AM | 12,167 (11.8%) | 4,281 (4.9%) |
| 5:00 AM to 5:29 AM | 9,299 (9.0%) | 3,171 (3.7%) |
| 5:30 AM to 5:59 AM | 7,801 (7.6%) | 3,856 (4.4%) |
| 6:00 AM to 6:29 AM | 10,704 (10.4%) | 6,484 (7.5%) |
| 6:30 AM to 6:59 AM | 9,286 (9.0%) | 6,830 (7.9%) |
| 7:00 AM to 7:29 AM | 10,719 (10.4%) | 13,063 (15.1%) |
| 7:30 AM to 7:59 AM | 6,721 (6.5%) | 10,582 (12.2%) |
| 8:00 AM to 8:29 AM | 8,279 (8.0%) | 10,991 (12.7%) |
| 8:30 AM to 8:59 AM | 3,082 (3.0%) | 4,122 (4.8%) |
| 9:00 AM to 9:59 AM | 4,814 (4.7%) | 5,984 (6.9%) |
| 10:00 AM to 10:59 AM | 2,563 (2.5%) | 2,919 (3.4%) |
| 11:00 AM to 11:59 AM | 1,644 (1.6%) | 1,825 (2.1%) |
| 12:00 PM to 3:59 PM | 8,063 (7.8%) | 7,031 (8.1%) |
| 4:00 PM to 11:59 PM | 7,812 (7.6%) | 5,618 (6.5%) |
| Total | 102,954 (100.0%) | 86,757 (100.0%) |
Housing Occupancy in Solano County
Occupancy by Ownership in Solano County
Of the total 154,987 dwellings in Solano County, owner-occupied units account for 97,692 (63.0%), while renter-occupied units make up 57,295 (37.0%).
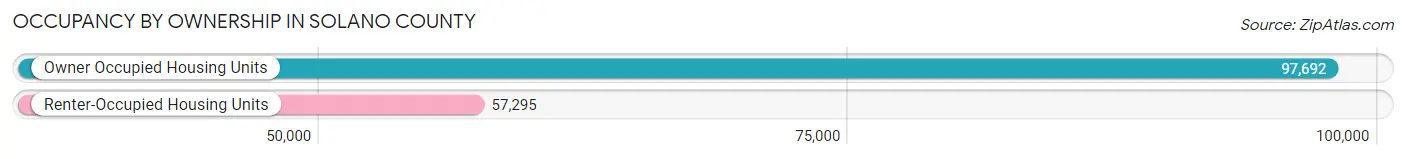
| Occupancy | # Housing Units | % Housing Units |
| Owner Occupied Housing Units | 97,692 | 63.0% |
| Renter-Occupied Housing Units | 57,295 | 37.0% |
| Total Occupied Housing Units | 154,987 | 100.0% |
Occupancy by Household Size in Solano County
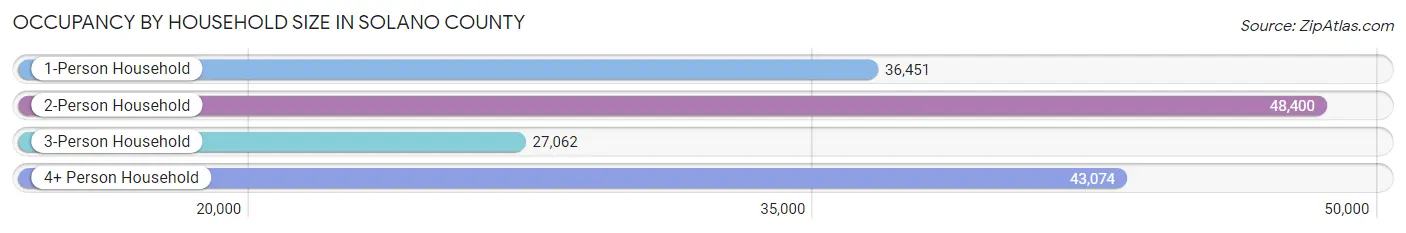
| Household Size | # Housing Units | % Housing Units |
| 1-Person Household | 36,451 | 23.5% |
| 2-Person Household | 48,400 | 31.2% |
| 3-Person Household | 27,062 | 17.5% |
| 4+ Person Household | 43,074 | 27.8% |
| Total Housing Units | 154,987 | 100.0% |
Occupancy by Ownership by Household Size in Solano County
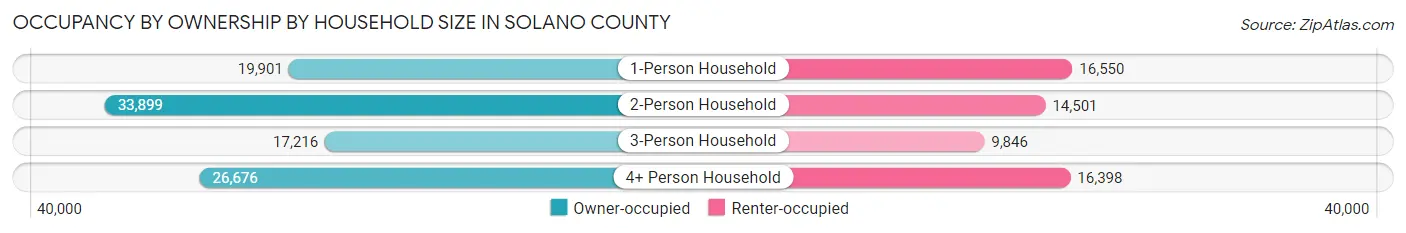
| Household Size | Owner-occupied | Renter-occupied |
| 1-Person Household | 19,901 (54.6%) | 16,550 (45.4%) |
| 2-Person Household | 33,899 (70.0%) | 14,501 (30.0%) |
| 3-Person Household | 17,216 (63.6%) | 9,846 (36.4%) |
| 4+ Person Household | 26,676 (61.9%) | 16,398 (38.1%) |
| Total Housing Units | 97,692 (63.0%) | 57,295 (37.0%) |
Occupancy by Educational Attainment in Solano County
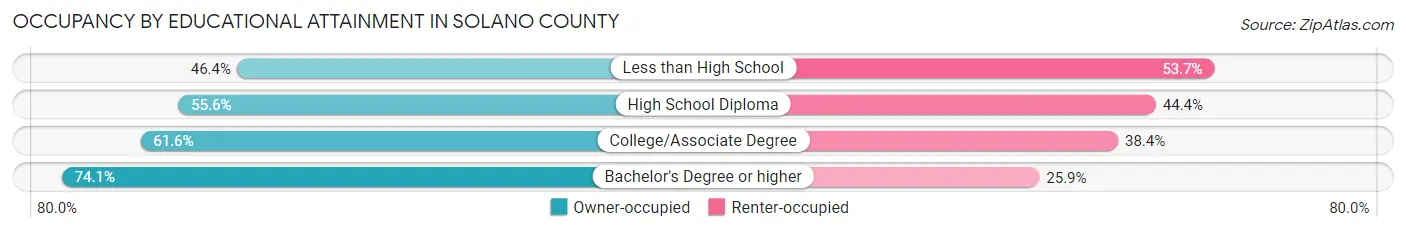
| Household Size | Owner-occupied | Renter-occupied |
| Less than High School | 5,874 (46.4%) | 6,799 (53.6%) |
| High School Diploma | 17,928 (55.6%) | 14,293 (44.4%) |
| College/Associate Degree | 38,069 (61.6%) | 23,696 (38.4%) |
| Bachelor's Degree or higher | 35,821 (74.1%) | 12,507 (25.9%) |
Occupancy by Age of Householder in Solano County
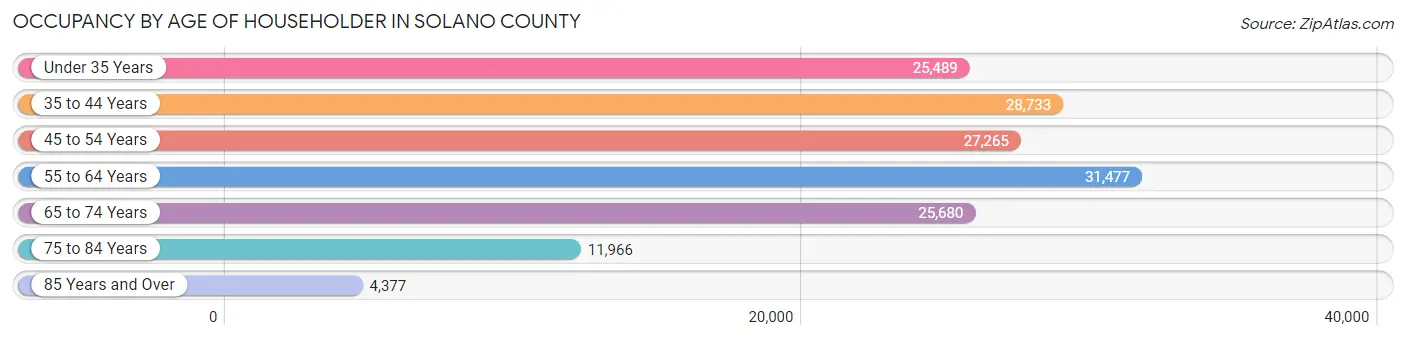
| Age Bracket | # Households | % Households |
| Under 35 Years | 25,489 | 16.5% |
| 35 to 44 Years | 28,733 | 18.5% |
| 45 to 54 Years | 27,265 | 17.6% |
| 55 to 64 Years | 31,477 | 20.3% |
| 65 to 74 Years | 25,680 | 16.6% |
| 75 to 84 Years | 11,966 | 7.7% |
| 85 Years and Over | 4,377 | 2.8% |
| Total | 154,987 | 100.0% |
Housing Finances in Solano County
Median Income by Occupancy in Solano County
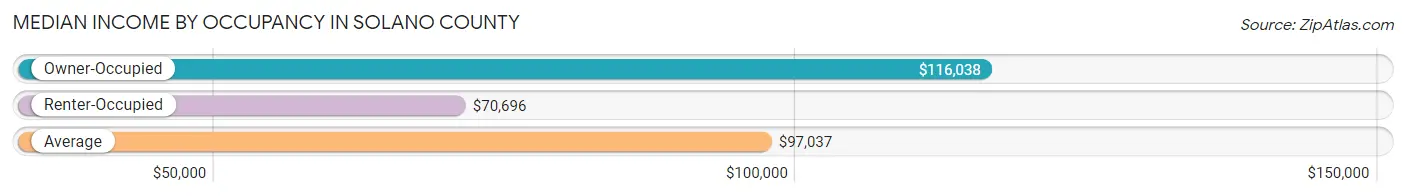
| Occupancy Type | # Households | Median Income |
| Owner-Occupied | 97,692 (63.0%) | $116,038 |
| Renter-Occupied | 57,295 (37.0%) | $70,696 |
| Average | 154,987 (100.0%) | $97,037 |
Occupancy by Householder Income Bracket in Solano County
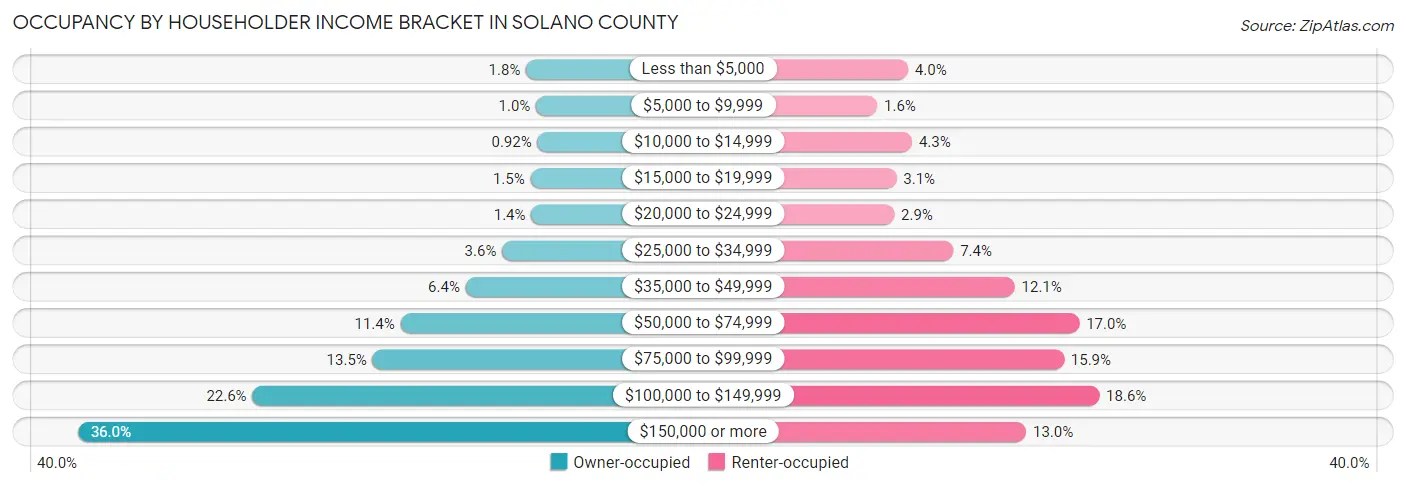
| Income Bracket | Owner-occupied | Renter-occupied |
| Less than $5,000 | 1,738 (1.8%) | 2,286 (4.0%) |
| $5,000 to $9,999 | 1,001 (1.0%) | 939 (1.6%) |
| $10,000 to $14,999 | 894 (0.9%) | 2,464 (4.3%) |
| $15,000 to $19,999 | 1,420 (1.5%) | 1,783 (3.1%) |
| $20,000 to $24,999 | 1,355 (1.4%) | 1,686 (2.9%) |
| $25,000 to $34,999 | 3,524 (3.6%) | 4,260 (7.4%) |
| $35,000 to $49,999 | 6,244 (6.4%) | 6,943 (12.1%) |
| $50,000 to $74,999 | 11,102 (11.4%) | 9,764 (17.0%) |
| $75,000 to $99,999 | 13,168 (13.5%) | 9,095 (15.9%) |
| $100,000 to $149,999 | 22,121 (22.6%) | 10,633 (18.6%) |
| $150,000 or more | 35,125 (35.9%) | 7,442 (13.0%) |
| Total | 97,692 (100.0%) | 57,295 (100.0%) |
Monthly Housing Cost Tiers in Solano County
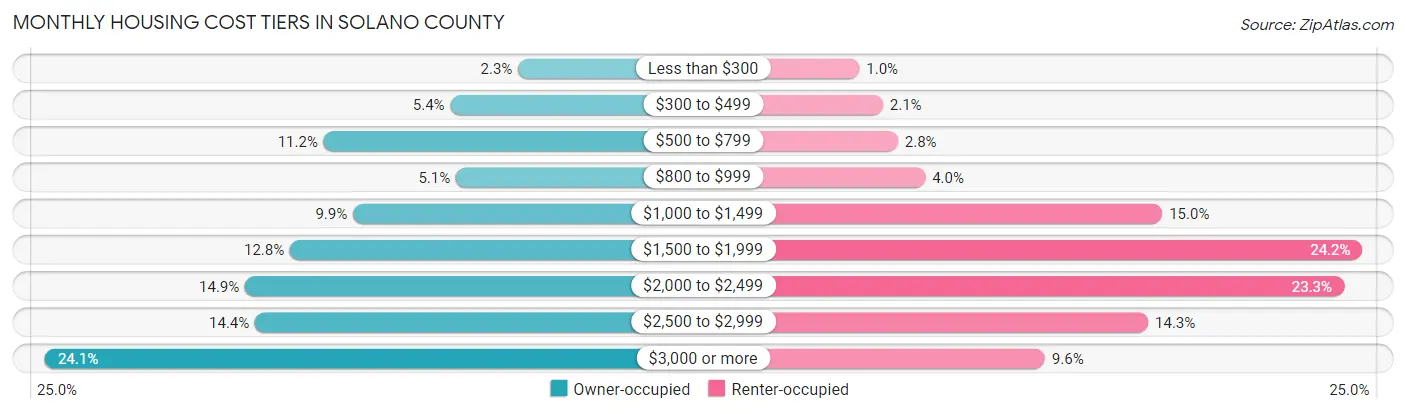
| Monthly Cost | Owner-occupied | Renter-occupied |
| Less than $300 | 2,224 (2.3%) | 579 (1.0%) |
| $300 to $499 | 5,278 (5.4%) | 1,198 (2.1%) |
| $500 to $799 | 10,968 (11.2%) | 1,594 (2.8%) |
| $800 to $999 | 5,020 (5.1%) | 2,315 (4.0%) |
| $1,000 to $1,499 | 9,653 (9.9%) | 8,566 (14.9%) |
| $1,500 to $1,999 | 12,481 (12.8%) | 13,843 (24.2%) |
| $2,000 to $2,499 | 14,505 (14.8%) | 13,355 (23.3%) |
| $2,500 to $2,999 | 14,054 (14.4%) | 8,191 (14.3%) |
| $3,000 or more | 23,509 (24.1%) | 5,473 (9.6%) |
| Total | 97,692 (100.0%) | 57,295 (100.0%) |
Physical Housing Characteristics in Solano County
Housing Structures in Solano County
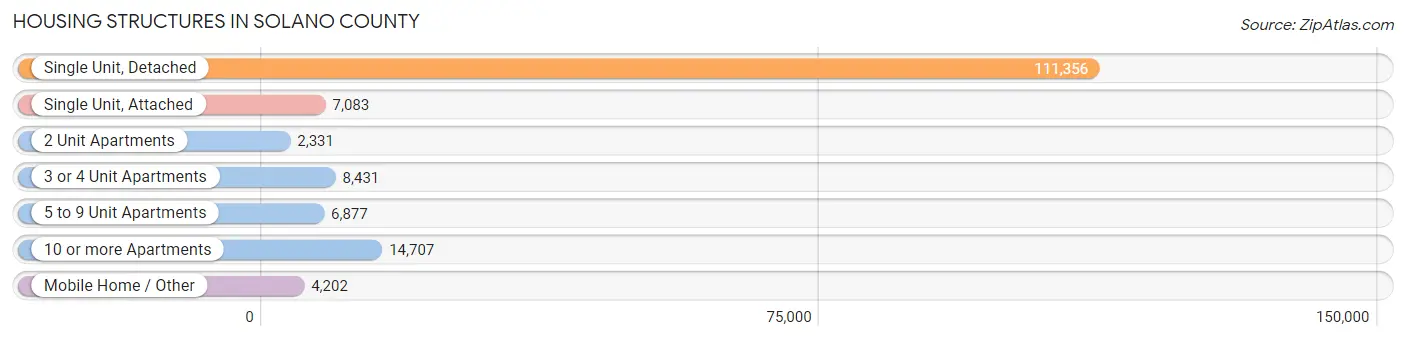
| Structure Type | # Housing Units | % Housing Units |
| Single Unit, Detached | 111,356 | 71.9% |
| Single Unit, Attached | 7,083 | 4.6% |
| 2 Unit Apartments | 2,331 | 1.5% |
| 3 or 4 Unit Apartments | 8,431 | 5.4% |
| 5 to 9 Unit Apartments | 6,877 | 4.4% |
| 10 or more Apartments | 14,707 | 9.5% |
| Mobile Home / Other | 4,202 | 2.7% |
| Total | 154,987 | 100.0% |
Housing Structures by Occupancy in Solano County
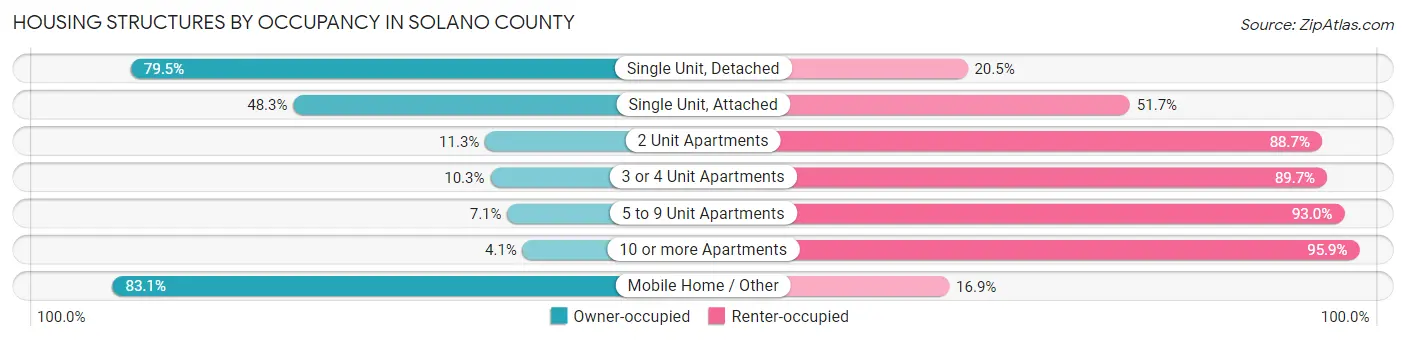
| Structure Type | Owner-occupied | Renter-occupied |
| Single Unit, Detached | 88,561 (79.5%) | 22,795 (20.5%) |
| Single Unit, Attached | 3,418 (48.3%) | 3,665 (51.7%) |
| 2 Unit Apartments | 264 (11.3%) | 2,067 (88.7%) |
| 3 or 4 Unit Apartments | 871 (10.3%) | 7,560 (89.7%) |
| 5 to 9 Unit Apartments | 485 (7.0%) | 6,392 (92.9%) |
| 10 or more Apartments | 603 (4.1%) | 14,104 (95.9%) |
| Mobile Home / Other | 3,490 (83.1%) | 712 (16.9%) |
| Total | 97,692 (63.0%) | 57,295 (37.0%) |
Housing Structures by Number of Rooms in Solano County
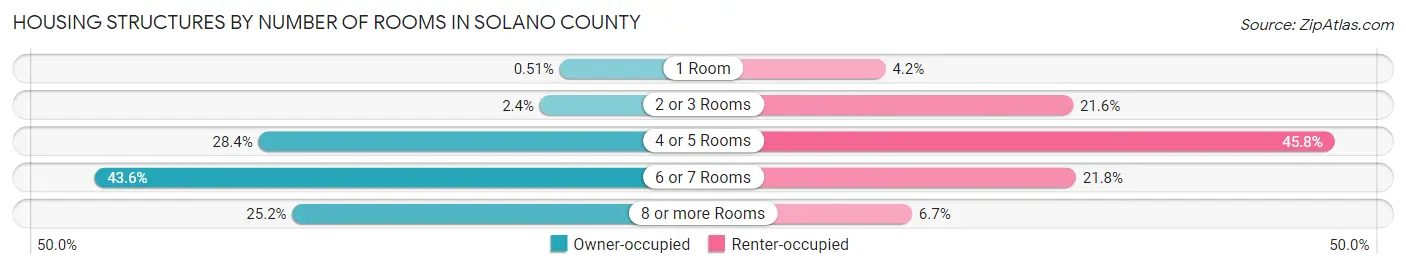
| Number of Rooms | Owner-occupied | Renter-occupied |
| 1 Room | 501 (0.5%) | 2,412 (4.2%) |
| 2 or 3 Rooms | 2,292 (2.4%) | 12,354 (21.6%) |
| 4 or 5 Rooms | 27,702 (28.4%) | 26,215 (45.8%) |
| 6 or 7 Rooms | 42,550 (43.6%) | 12,500 (21.8%) |
| 8 or more Rooms | 24,647 (25.2%) | 3,814 (6.7%) |
| Total | 97,692 (100.0%) | 57,295 (100.0%) |
Housing Structure by Heating Type in Solano County
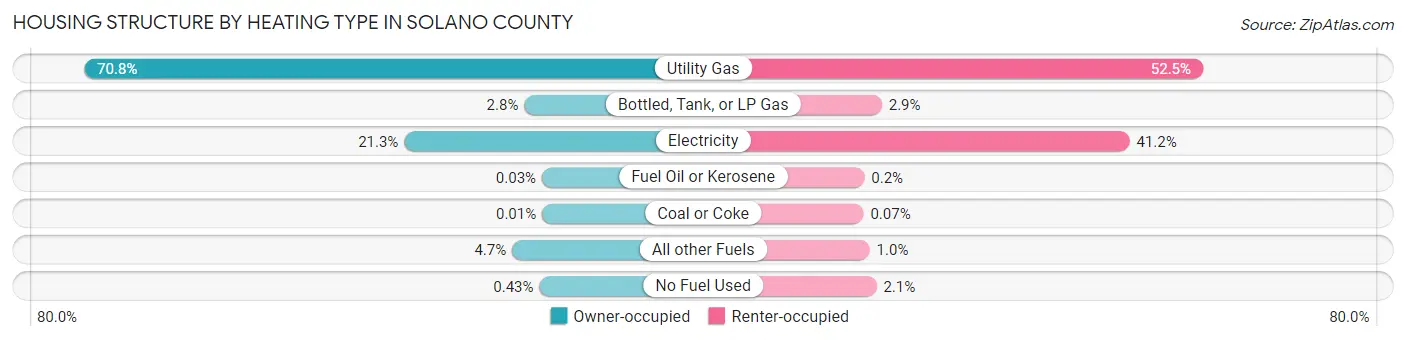
| Heating Type | Owner-occupied | Renter-occupied |
| Utility Gas | 69,173 (70.8%) | 30,098 (52.5%) |
| Bottled, Tank, or LP Gas | 2,694 (2.8%) | 1,664 (2.9%) |
| Electricity | 20,824 (21.3%) | 23,607 (41.2%) |
| Fuel Oil or Kerosene | 27 (0.0%) | 112 (0.2%) |
| Coal or Coke | 5 (0.0%) | 41 (0.1%) |
| All other Fuels | 4,545 (4.6%) | 583 (1.0%) |
| No Fuel Used | 424 (0.4%) | 1,190 (2.1%) |
| Total | 97,692 (100.0%) | 57,295 (100.0%) |
Household Vehicle Usage in Solano County
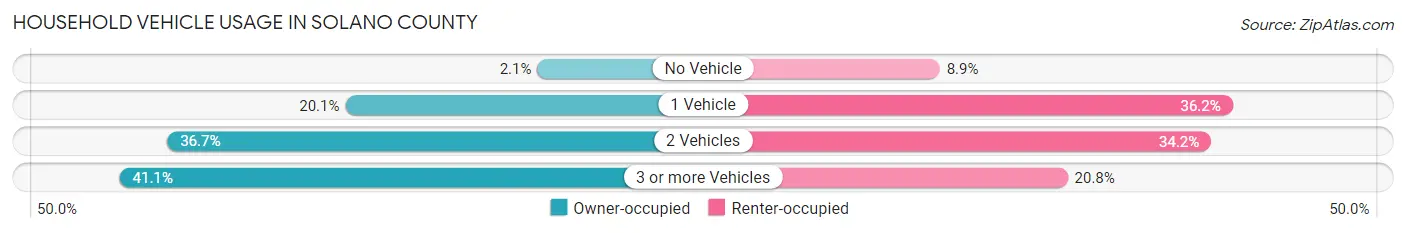
| Vehicles per Household | Owner-occupied | Renter-occupied |
| No Vehicle | 2,088 (2.1%) | 5,070 (8.8%) |
| 1 Vehicle | 19,593 (20.1%) | 20,732 (36.2%) |
| 2 Vehicles | 35,832 (36.7%) | 19,582 (34.2%) |
| 3 or more Vehicles | 40,179 (41.1%) | 11,911 (20.8%) |
| Total | 97,692 (100.0%) | 57,295 (100.0%) |
Real Estate & Mortgages in Solano County
Real Estate and Mortgage Overview in Solano County
| Characteristic | Without Mortgage | With Mortgage |
| Housing Units | 26,416 | 71,276 |
| Median Property Value | $493,500 | $566,200 |
| Median Household Income | $82,528 | $29,278 |
| Monthly Housing Costs | $662 | $23,416 |
| Real Estate Taxes | $3,148 | $1,322 |
Property Value by Mortgage Status in Solano County
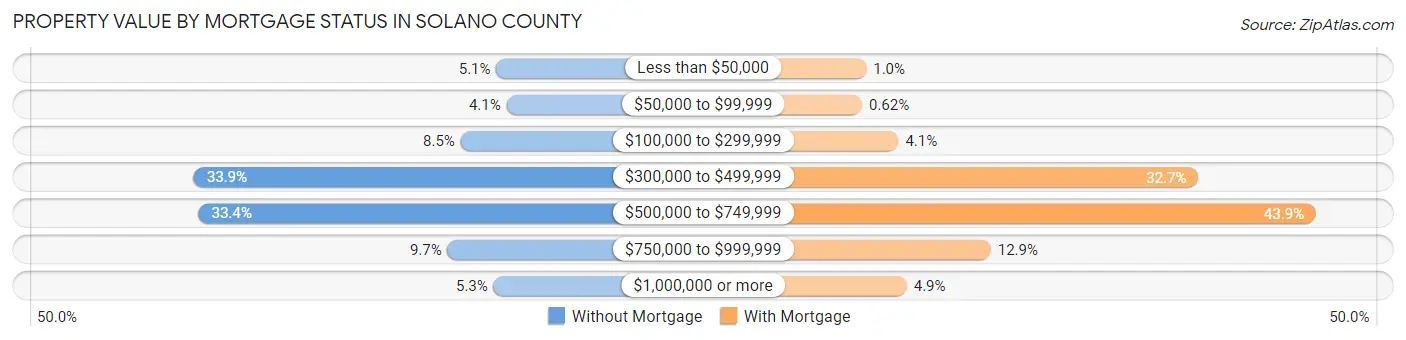
| Property Value | Without Mortgage | With Mortgage |
| Less than $50,000 | 1,340 (5.1%) | 729 (1.0%) |
| $50,000 to $99,999 | 1,083 (4.1%) | 441 (0.6%) |
| $100,000 to $299,999 | 2,238 (8.5%) | 2,912 (4.1%) |
| $300,000 to $499,999 | 8,951 (33.9%) | 23,273 (32.7%) |
| $500,000 to $749,999 | 8,830 (33.4%) | 31,262 (43.9%) |
| $750,000 to $999,999 | 2,567 (9.7%) | 9,183 (12.9%) |
| $1,000,000 or more | 1,407 (5.3%) | 3,476 (4.9%) |
| Total | 26,416 (100.0%) | 71,276 (100.0%) |
Household Income by Mortgage Status in Solano County
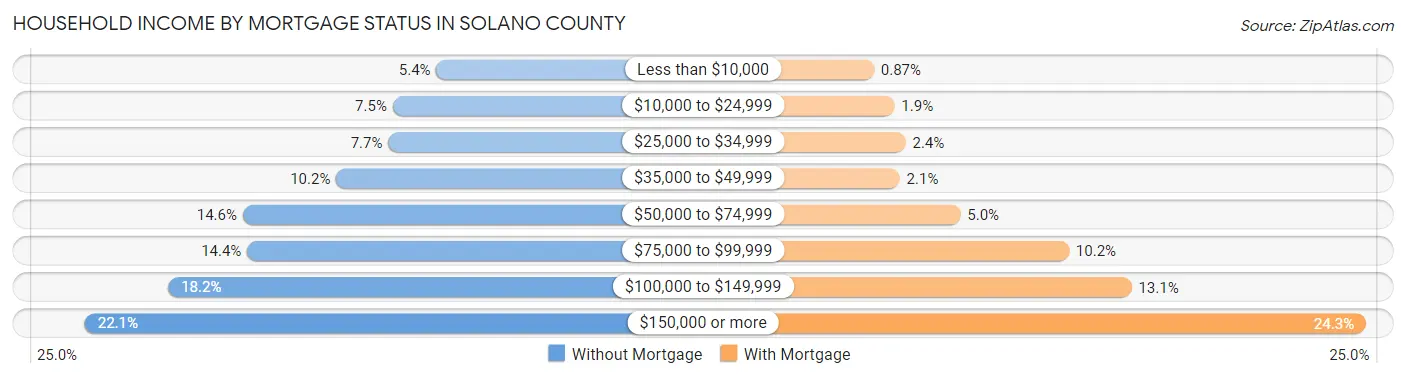
| Household Income | Without Mortgage | With Mortgage |
| Less than $10,000 | 1,423 (5.4%) | 620 (0.9%) |
| $10,000 to $24,999 | 1,974 (7.5%) | 1,316 (1.8%) |
| $25,000 to $34,999 | 2,029 (7.7%) | 1,695 (2.4%) |
| $35,000 to $49,999 | 2,684 (10.2%) | 1,495 (2.1%) |
| $50,000 to $74,999 | 3,860 (14.6%) | 3,560 (5.0%) |
| $75,000 to $99,999 | 3,803 (14.4%) | 7,242 (10.2%) |
| $100,000 to $149,999 | 4,796 (18.2%) | 9,365 (13.1%) |
| $150,000 or more | 5,847 (22.1%) | 17,325 (24.3%) |
| Total | 26,416 (100.0%) | 71,276 (100.0%) |
Property Value to Household Income Ratio in Solano County
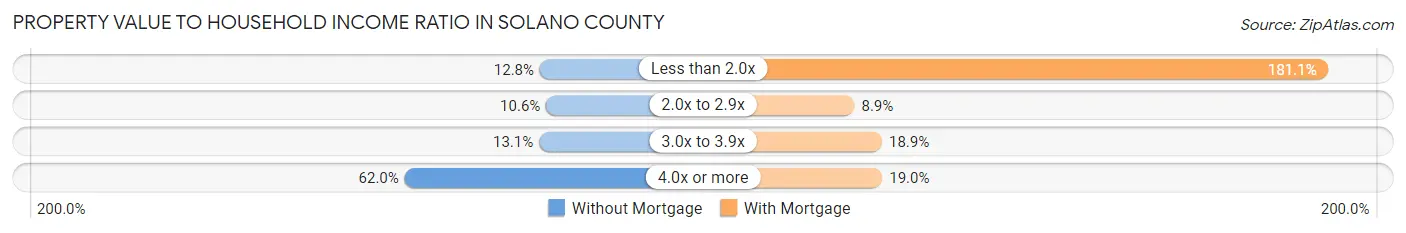
| Value-to-Income Ratio | Without Mortgage | With Mortgage |
| Less than 2.0x | 3,391 (12.8%) | 129,065 (181.1%) |
| 2.0x to 2.9x | 2,786 (10.5%) | 6,369 (8.9%) |
| 3.0x to 3.9x | 3,470 (13.1%) | 13,498 (18.9%) |
| 4.0x or more | 16,373 (62.0%) | 13,570 (19.0%) |
| Total | 26,416 (100.0%) | 71,276 (100.0%) |
Real Estate Taxes by Mortgage Status in Solano County
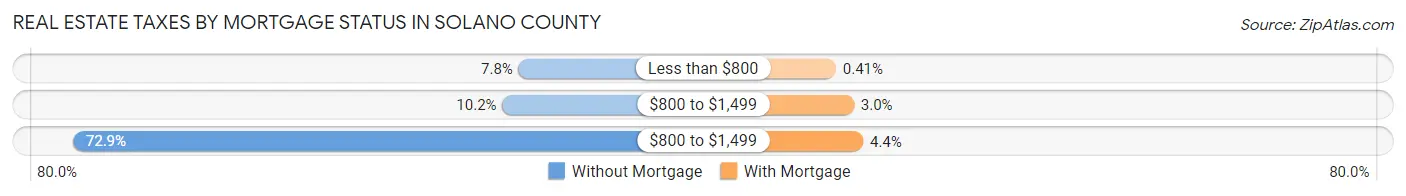
| Property Taxes | Without Mortgage | With Mortgage |
| Less than $800 | 2,062 (7.8%) | 290 (0.4%) |
| $800 to $1,499 | 2,688 (10.2%) | 2,166 (3.0%) |
| $800 to $1,499 | 19,269 (72.9%) | 3,125 (4.4%) |
| Total | 26,416 (100.0%) | 71,276 (100.0%) |
Health & Disability in Solano County
Health Insurance Coverage by Age in Solano County
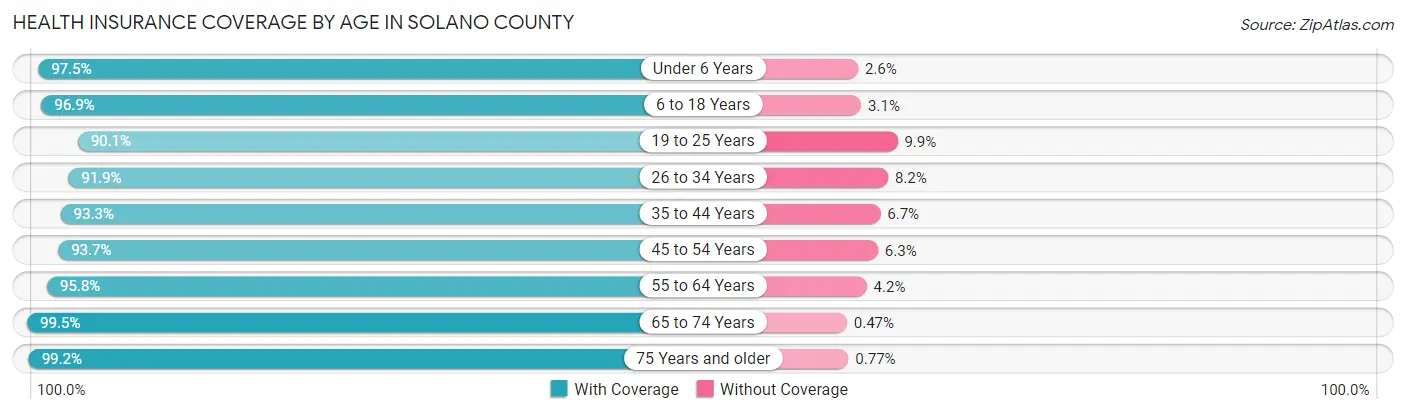
| Age Bracket | With Coverage | Without Coverage |
| Under 6 Years | 30,779 (97.5%) | 805 (2.5%) |
| 6 to 18 Years | 70,638 (96.9%) | 2,293 (3.1%) |
| 19 to 25 Years | 33,660 (90.1%) | 3,702 (9.9%) |
| 26 to 34 Years | 51,197 (91.8%) | 4,543 (8.2%) |
| 35 to 44 Years | 53,663 (93.3%) | 3,864 (6.7%) |
| 45 to 54 Years | 49,802 (93.7%) | 3,330 (6.3%) |
| 55 to 64 Years | 55,607 (95.8%) | 2,420 (4.2%) |
| 65 to 74 Years | 44,607 (99.5%) | 210 (0.5%) |
| 75 Years and older | 27,989 (99.2%) | 216 (0.8%) |
| Total | 417,942 (95.1%) | 21,383 (4.9%) |
Health Insurance Coverage by Citizenship Status in Solano County
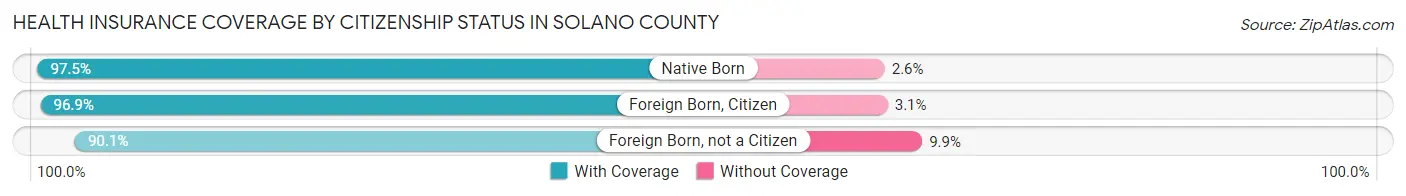
| Citizenship Status | With Coverage | Without Coverage |
| Native Born | 30,779 (97.5%) | 805 (2.5%) |
| Foreign Born, Citizen | 70,638 (96.9%) | 2,293 (3.1%) |
| Foreign Born, not a Citizen | 33,660 (90.1%) | 3,702 (9.9%) |
Health Insurance Coverage by Household Income in Solano County
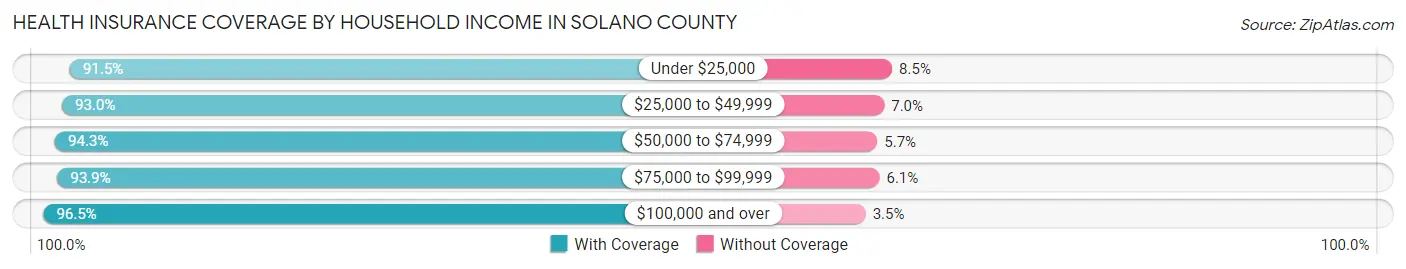
| Household Income | With Coverage | Without Coverage |
| Under $25,000 | 25,206 (91.5%) | 2,343 (8.5%) |
| $25,000 to $49,999 | 44,422 (93.0%) | 3,354 (7.0%) |
| $50,000 to $74,999 | 48,478 (94.3%) | 2,941 (5.7%) |
| $75,000 to $99,999 | 57,270 (93.9%) | 3,740 (6.1%) |
| $100,000 and over | 240,161 (96.5%) | 8,809 (3.5%) |
Public vs Private Health Insurance Coverage by Age in Solano County
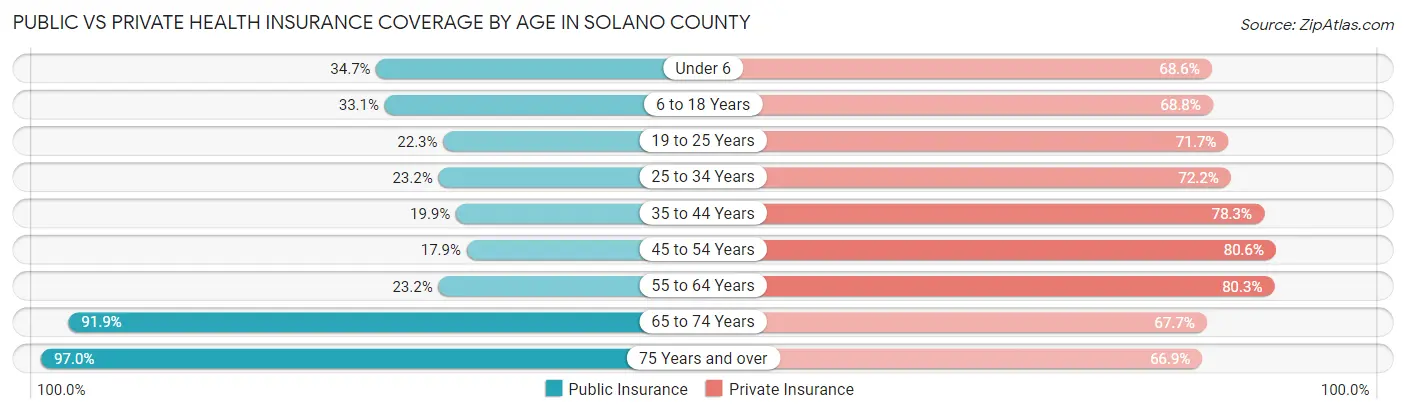
| Age Bracket | Public Insurance | Private Insurance |
| Under 6 | 10,960 (34.7%) | 21,676 (68.6%) |
| 6 to 18 Years | 24,166 (33.1%) | 50,192 (68.8%) |
| 19 to 25 Years | 8,322 (22.3%) | 26,794 (71.7%) |
| 25 to 34 Years | 12,922 (23.2%) | 40,222 (72.2%) |
| 35 to 44 Years | 11,448 (19.9%) | 45,058 (78.3%) |
| 45 to 54 Years | 9,524 (17.9%) | 42,799 (80.5%) |
| 55 to 64 Years | 13,448 (23.2%) | 46,572 (80.3%) |
| 65 to 74 Years | 41,169 (91.9%) | 30,352 (67.7%) |
| 75 Years and over | 27,346 (97.0%) | 18,865 (66.9%) |
| Total | 159,305 (36.3%) | 322,530 (73.4%) |
Disability Status by Sex by Age in Solano County
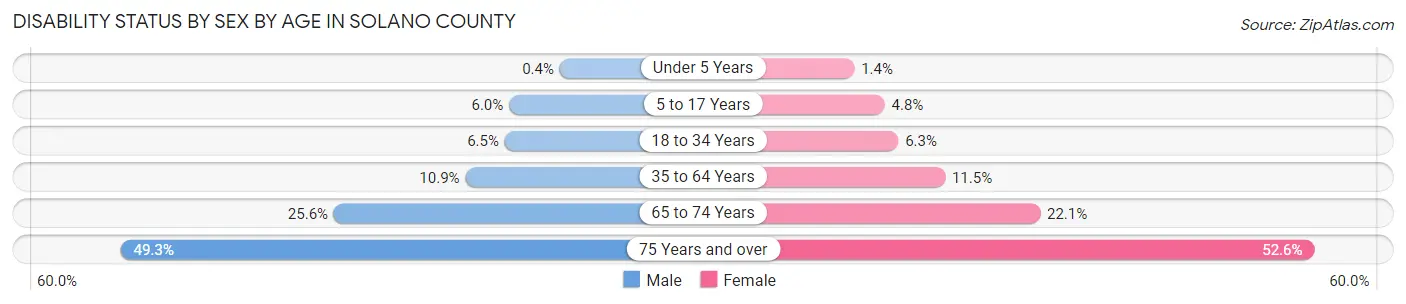
| Age Bracket | Male | Female |
| Under 5 Years | 54 (0.4%) | 175 (1.4%) |
| 5 to 17 Years | 2,249 (6.0%) | 1,695 (4.8%) |
| 18 to 34 Years | 3,250 (6.5%) | 3,063 (6.3%) |
| 35 to 64 Years | 8,999 (10.9%) | 9,903 (11.5%) |
| 65 to 74 Years | 5,261 (25.6%) | 5,350 (22.1%) |
| 75 Years and over | 5,705 (49.3%) | 8,754 (52.6%) |
Disability Class by Sex by Age in Solano County
Disability Class: Hearing Difficulty
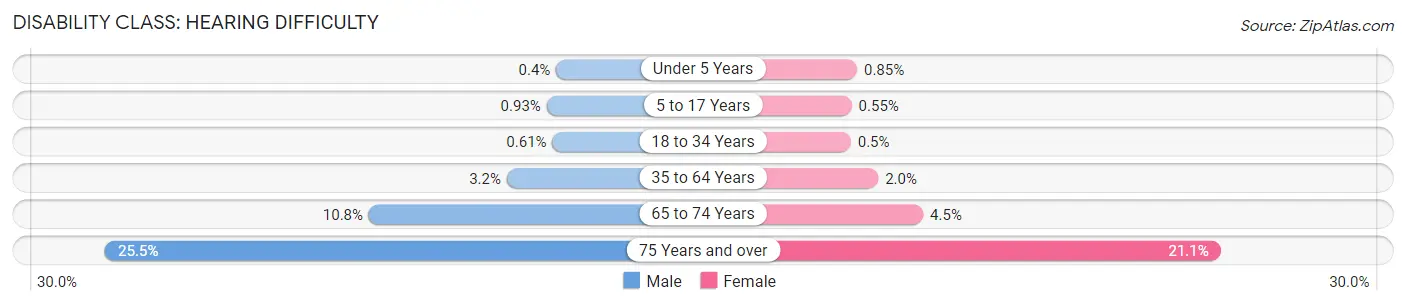
| Age Bracket | Male | Female |
| Under 5 Years | 54 (0.4%) | 107 (0.9%) |
| 5 to 17 Years | 345 (0.9%) | 195 (0.5%) |
| 18 to 34 Years | 303 (0.6%) | 243 (0.5%) |
| 35 to 64 Years | 2,599 (3.2%) | 1,748 (2.0%) |
| 65 to 74 Years | 2,230 (10.8%) | 1,097 (4.5%) |
| 75 Years and over | 2,953 (25.5%) | 3,508 (21.1%) |
Disability Class: Vision Difficulty
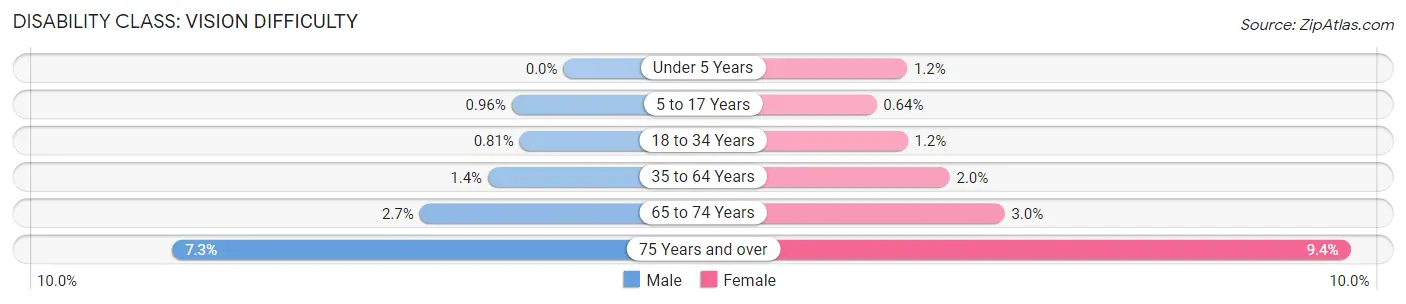
| Age Bracket | Male | Female |
| Under 5 Years | 0 (0.0%) | 153 (1.2%) |
| 5 to 17 Years | 357 (1.0%) | 228 (0.6%) |
| 18 to 34 Years | 402 (0.8%) | 594 (1.2%) |
| 35 to 64 Years | 1,157 (1.4%) | 1,721 (2.0%) |
| 65 to 74 Years | 550 (2.7%) | 732 (3.0%) |
| 75 Years and over | 840 (7.3%) | 1,571 (9.4%) |
Disability Class: Cognitive Difficulty
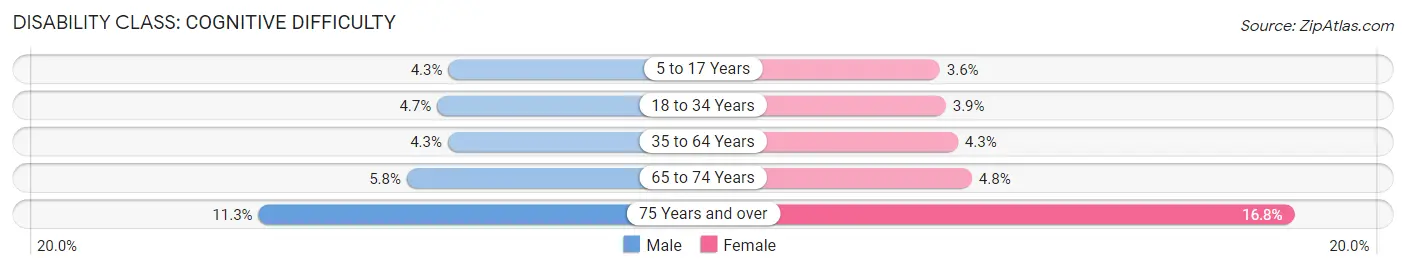
| Age Bracket | Male | Female |
| 5 to 17 Years | 1,591 (4.3%) | 1,296 (3.6%) |
| 18 to 34 Years | 2,340 (4.7%) | 1,882 (3.9%) |
| 35 to 64 Years | 3,537 (4.3%) | 3,717 (4.3%) |
| 65 to 74 Years | 1,196 (5.8%) | 1,171 (4.8%) |
| 75 Years and over | 1,310 (11.3%) | 2,794 (16.8%) |
Disability Class: Ambulatory Difficulty
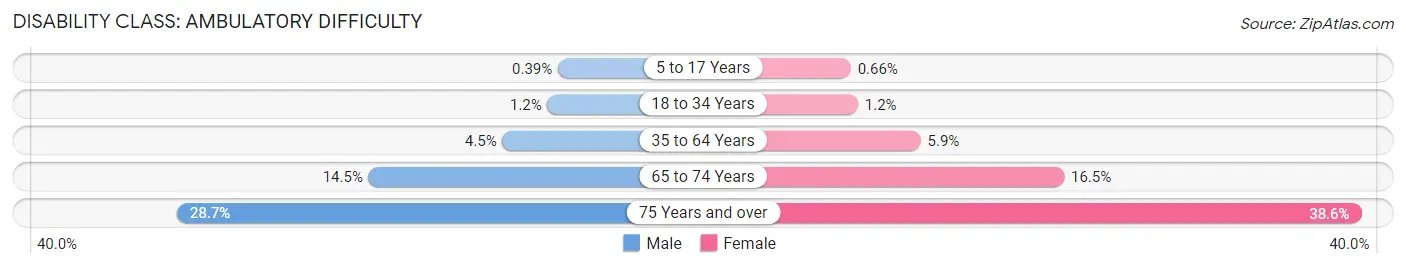
| Age Bracket | Male | Female |
| 5 to 17 Years | 145 (0.4%) | 236 (0.7%) |
| 18 to 34 Years | 582 (1.2%) | 579 (1.2%) |
| 35 to 64 Years | 3,726 (4.5%) | 5,040 (5.9%) |
| 65 to 74 Years | 2,975 (14.4%) | 3,997 (16.5%) |
| 75 Years and over | 3,320 (28.7%) | 6,416 (38.6%) |
Disability Class: Self-Care Difficulty
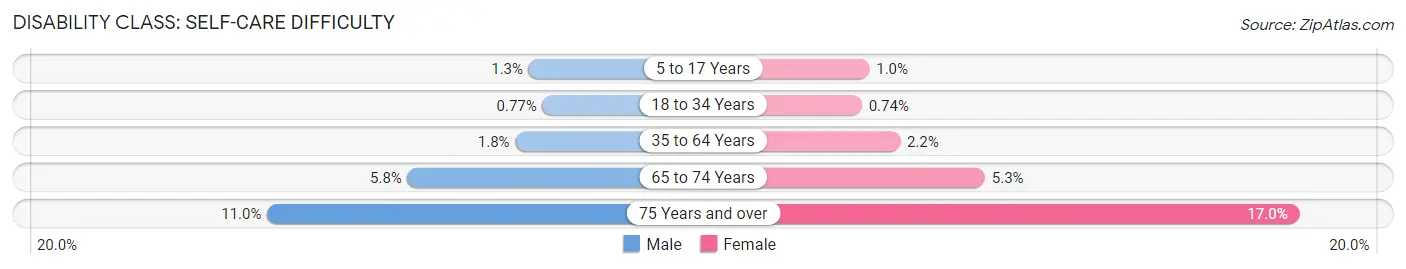
| Age Bracket | Male | Female |
| 5 to 17 Years | 478 (1.3%) | 362 (1.0%) |
| 18 to 34 Years | 384 (0.8%) | 359 (0.7%) |
| 35 to 64 Years | 1,467 (1.8%) | 1,860 (2.2%) |
| 65 to 74 Years | 1,191 (5.8%) | 1,287 (5.3%) |
| 75 Years and over | 1,272 (11.0%) | 2,827 (17.0%) |
Technology Access in Solano County
Computing Device Access in Solano County
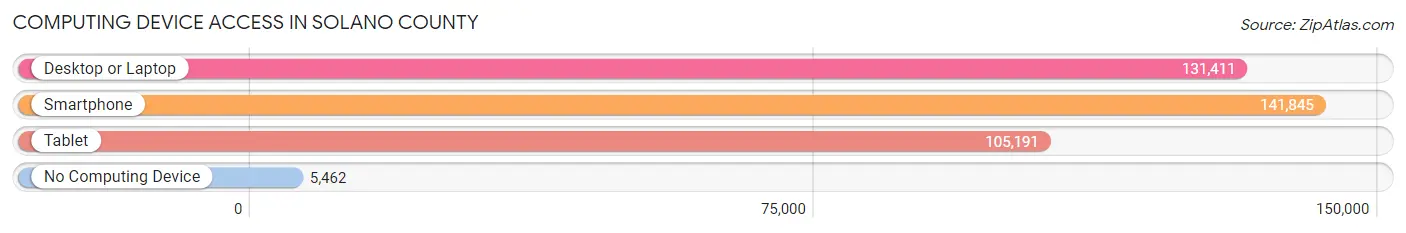
| Device Type | # Households | % Households |
| Desktop or Laptop | 131,411 | 84.8% |
| Smartphone | 141,845 | 91.5% |
| Tablet | 105,191 | 67.9% |
| No Computing Device | 5,462 | 3.5% |
| Total | 154,987 | 100.0% |
Internet Access in Solano County
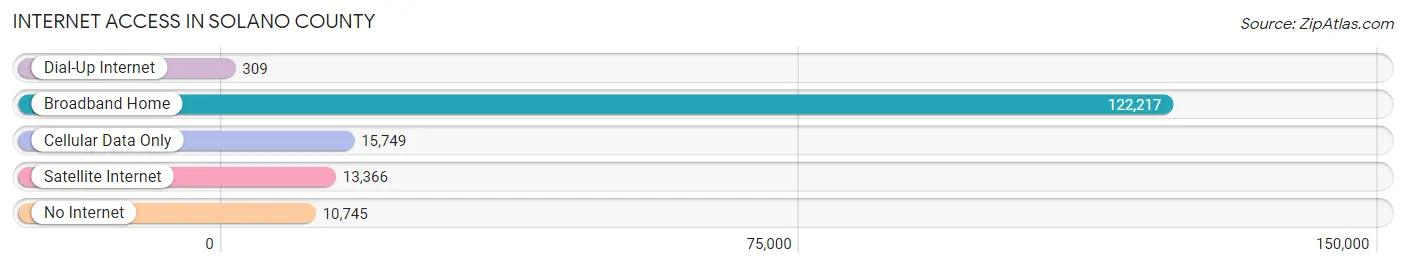
| Internet Type | # Households | % Households |
| Dial-Up Internet | 309 | 0.2% |
| Broadband Home | 122,217 | 78.9% |
| Cellular Data Only | 15,749 | 10.2% |
| Satellite Internet | 13,366 | 8.6% |
| No Internet | 10,745 | 6.9% |
| Total | 154,987 | 100.0% |
Solano County Summary
Solano County is located in the northern part of California, in the San Francisco Bay Area. It is bordered by Napa, Yolo, Sacramento, and Contra Costa counties. The county seat is Fairfield, and the largest city is Vallejo. The county has a population of 431,498, making it the fifth most populous county in California.
History
Solano County was formed in 1850 from parts of Yolo and Contra Costa counties. It was named after Chief Solano of the Suisun Native American tribe, who lived in the area. The county was originally part of the Rancho Suisun Mexican land grant.
In the late 19th century, the county was a major agricultural center, producing wheat, barley, oats, and other grains. The county also had a thriving dairy industry.
In the early 20th century, the county experienced a population boom due to the growth of the military bases in the area. The Mare Island Naval Shipyard, located in Vallejo, was the first naval base on the West Coast. The Travis Air Force Base, located in Fairfield, was also established during this time.
Geography
Solano County covers an area of 906 square miles. It is located in the northern part of California, in the San Francisco Bay Area. The county is bordered by Napa, Yolo, Sacramento, and Contra Costa counties.
The county is divided into two distinct regions: the coastal plain and the interior valley. The coastal plain is located along the western edge of the county and is characterized by rolling hills and valleys. The interior valley is located in the center of the county and is characterized by flat terrain.
The county is home to several rivers, including the Napa River, the Petaluma River, and the Suisun Bay. The county also contains several lakes, including Lake Berryessa and Lake Solano.
Economy
Solano County has a diverse economy, with a mix of agriculture, manufacturing, and services. The county is home to several major employers, including the Travis Air Force Base, the Mare Island Naval Shipyard, and the Vallejo Naval and Historical Museum.
Agriculture is an important part of the county’s economy. The county is home to several wineries and vineyards, as well as a thriving dairy industry. The county also produces a variety of fruits and vegetables, including tomatoes, corn, and melons.
Manufacturing is also an important part of the county’s economy. The county is home to several major manufacturers, including Genentech, Solano County Manufacturing, and Vallejo Manufacturing.
Demographics
As of the 2010 census, Solano County had a population of 431,498. The racial makeup of the county was 57.2% White, 11.3% African American, 0.7% Native American, 11.7% Asian, 0.3% Pacific Islander, and 18.2% from other races. Hispanic or Latino of any race were 28.3% of the population.
The median household income in the county was $63,837, and the median family income was $76,824. The per capita income was $30,845. About 11.2% of the population was below the poverty line.
Common Questions
What is Per Capita Income in Solano County?
Per Capita income in Solano County is $42,886.
What is the Median Family Income in Solano County?
Median Family Income in Solano County is $110,159.
What is the Median Household income in Solano County?
Median Household Income in Solano County is $97,037.
What is Income or Wage Gap in Solano County?
Income or Wage Gap in Solano County is 22.2%.
Women in Solano County earn 77.8 cents for every dollar earned by a man.
What is Family Income Deficit in Solano County?
Family Income Deficit in Solano County is $10,903.
Families that are below poverty line in Solano County earn $10,903 less on average than the poverty threshold level.
What is Inequality or Gini Index in Solano County?
Inequality or Gini Index in Solano County is 0.42.
What is the Total Population of Solano County?
Total Population of Solano County is 450,995.
What is the Total Male Population of Solano County?
Total Male Population of Solano County is 225,302.
What is the Total Female Population of Solano County?
Total Female Population of Solano County is 225,693.
What is the Ratio of Males per 100 Females in Solano County?
There are 99.83 Males per 100 Females in Solano County.
What is the Ratio of Females per 100 Males in Solano County?
There are 100.17 Females per 100 Males in Solano County.
What is the Median Population Age in Solano County?
Median Population Age in Solano County is 38.8 Years.
What is the Average Family Size in Solano County
Average Family Size in Solano County is 3.4 People.
What is the Average Household Size in Solano County
Average Household Size in Solano County is 2.8 People.
How Large is the Labor Force in Solano County?
There are 229,620 People in the Labor Forcein in Solano County.
What is the Percentage of People in the Labor Force in Solano County?
63.2% of People are in the Labor Force in Solano County.
What is the Unemployment Rate in Solano County?
Unemployment Rate in Solano County is 5.9%.