Siskiyou County, CA Map & Demographics
Siskiyou County Map
Siskiyou County Overview
$33,650
PER CAPITA INCOME
$67,908
AVG FAMILY INCOME
$53,898
AVG HOUSEHOLD INCOME
33.9%
WAGE / INCOME GAP [ % ]
66.1¢/ $1
WAGE / INCOME GAP [ $ ]
$9,597
FAMILY INCOME DEFICIT
0.49
INEQUALITY / GINI INDEX
44,049
TOTAL POPULATION
22,035
MALE POPULATION
22,014
FEMALE POPULATION
100.10
MALES / 100 FEMALES
99.90
FEMALES / 100 MALES
47.2
MEDIAN AGE
3.0
AVG FAMILY SIZE
2.3
AVG HOUSEHOLD SIZE
18,001
LABOR FORCE [ PEOPLE ]
49.8%
PERCENT IN LABOR FORCE
7.4%
UNEMPLOYMENT RATE
Siskiyou County Area Codes
Income in Siskiyou County
Income Overview in Siskiyou County
Per Capita Income in Siskiyou County is $33,650, while median incomes of families and households are $67,908 and $53,898 respectively.
| Characteristic | Number | Measure |
| Per Capita Income | 44,049 | $33,650 |
| Median Family Income | 10,877 | $67,908 |
| Mean Family Income | 10,877 | $91,300 |
| Median Household Income | 18,768 | $53,898 |
| Mean Household Income | 18,768 | $76,371 |
| Income Deficit | 10,877 | $9,597 |
| Wage / Income Gap (%) | 44,049 | 33.93% |
| Wage / Income Gap ($) | 44,049 | 66.07¢ per $1 |
| Gini / Inequality Index | 44,049 | 0.49 |
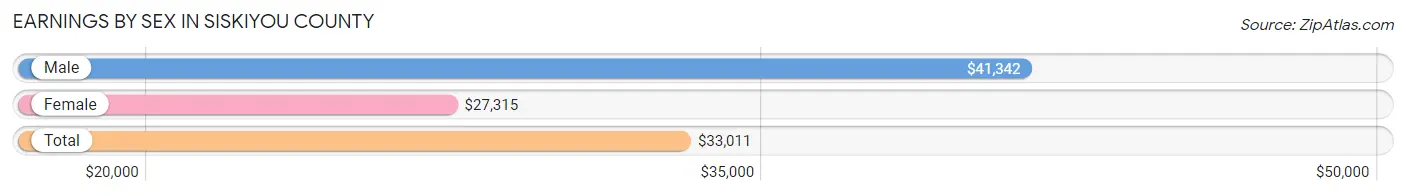
Earnings by Sex in Siskiyou County
Average Earnings in Siskiyou County are $33,011, $41,342 for men and $27,315 for women, a difference of 33.9%.
| Sex | Number | Average Earnings |
| Male | 9,711 (50.9%) | $41,342 |
| Female | 9,349 (49.0%) | $27,315 |
| Total | 19,060 (100.0%) | $33,011 |
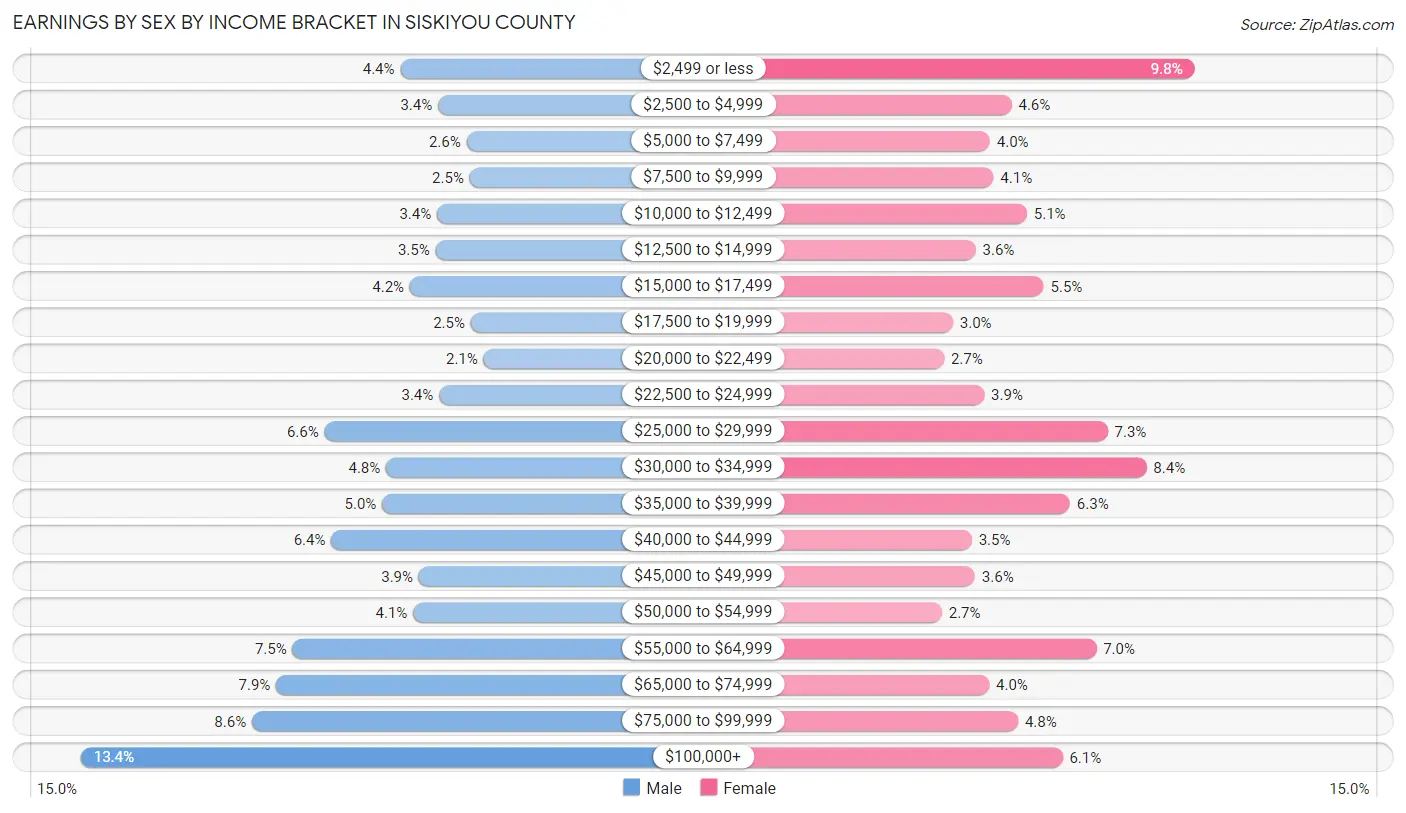
Earnings by Sex by Income Bracket in Siskiyou County
The most common earnings brackets in Siskiyou County are $100,000+ for men (1,303 | 13.4%) and $2,499 or less for women (913 | 9.8%).
| Income | Male | Female |
| $2,499 or less | 431 (4.4%) | 913 (9.8%) |
| $2,500 to $4,999 | 328 (3.4%) | 433 (4.6%) |
| $5,000 to $7,499 | 251 (2.6%) | 376 (4.0%) |
| $7,500 to $9,999 | 242 (2.5%) | 385 (4.1%) |
| $10,000 to $12,499 | 331 (3.4%) | 473 (5.1%) |
| $12,500 to $14,999 | 335 (3.5%) | 338 (3.6%) |
| $15,000 to $17,499 | 405 (4.2%) | 517 (5.5%) |
| $17,500 to $19,999 | 239 (2.5%) | 279 (3.0%) |
| $20,000 to $22,499 | 204 (2.1%) | 255 (2.7%) |
| $22,500 to $24,999 | 325 (3.4%) | 361 (3.9%) |
| $25,000 to $29,999 | 638 (6.6%) | 685 (7.3%) |
| $30,000 to $34,999 | 470 (4.8%) | 787 (8.4%) |
| $35,000 to $39,999 | 481 (5.0%) | 586 (6.3%) |
| $40,000 to $44,999 | 620 (6.4%) | 328 (3.5%) |
| $45,000 to $49,999 | 381 (3.9%) | 337 (3.6%) |
| $50,000 to $54,999 | 396 (4.1%) | 250 (2.7%) |
| $55,000 to $64,999 | 725 (7.5%) | 655 (7.0%) |
| $65,000 to $74,999 | 770 (7.9%) | 374 (4.0%) |
| $75,000 to $99,999 | 836 (8.6%) | 450 (4.8%) |
| $100,000+ | 1,303 (13.4%) | 567 (6.1%) |
| Total | 9,711 (100.0%) | 9,349 (100.0%) |
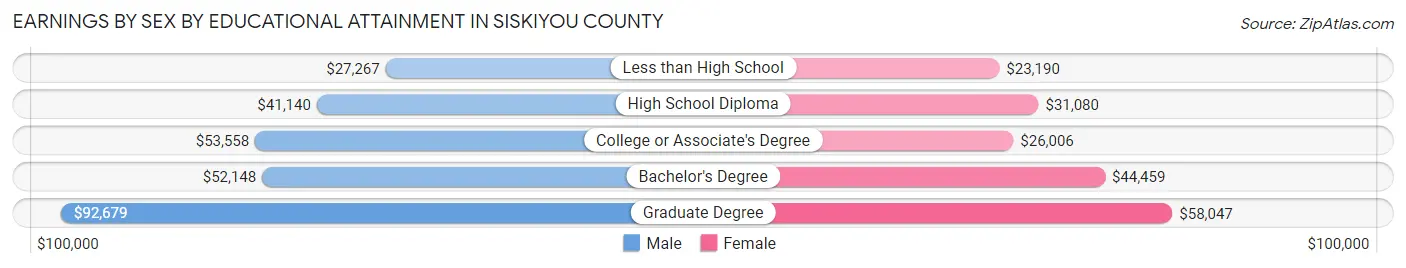
Earnings by Sex by Educational Attainment in Siskiyou County
Average earnings in Siskiyou County are $44,910 for men and $30,324 for women, a difference of 32.5%. Men with an educational attainment of graduate degree enjoy the highest average annual earnings of $92,679, while those with less than high school education earn the least with $27,267. Women with an educational attainment of graduate degree earn the most with the average annual earnings of $58,047, while those with less than high school education have the smallest earnings of $23,190.
| Educational Attainment | Male Income | Female Income |
| Less than High School | $27,267 | $23,190 |
| High School Diploma | $41,140 | $31,080 |
| College or Associate's Degree | $53,558 | $26,006 |
| Bachelor's Degree | $52,148 | $44,459 |
| Graduate Degree | $92,679 | $58,047 |
| Total | $44,910 | $30,324 |
Family Income in Siskiyou County
Family Income Brackets in Siskiyou County
According to the Siskiyou County family income data, there are 2,480 families falling into the $50,000 to $74,999 income range, which is the most common income bracket and makes up 22.8% of all families. Conversely, the $10,000 to $14,999 income bracket is the least frequent group with only 218 families (2.0%) belonging to this category.
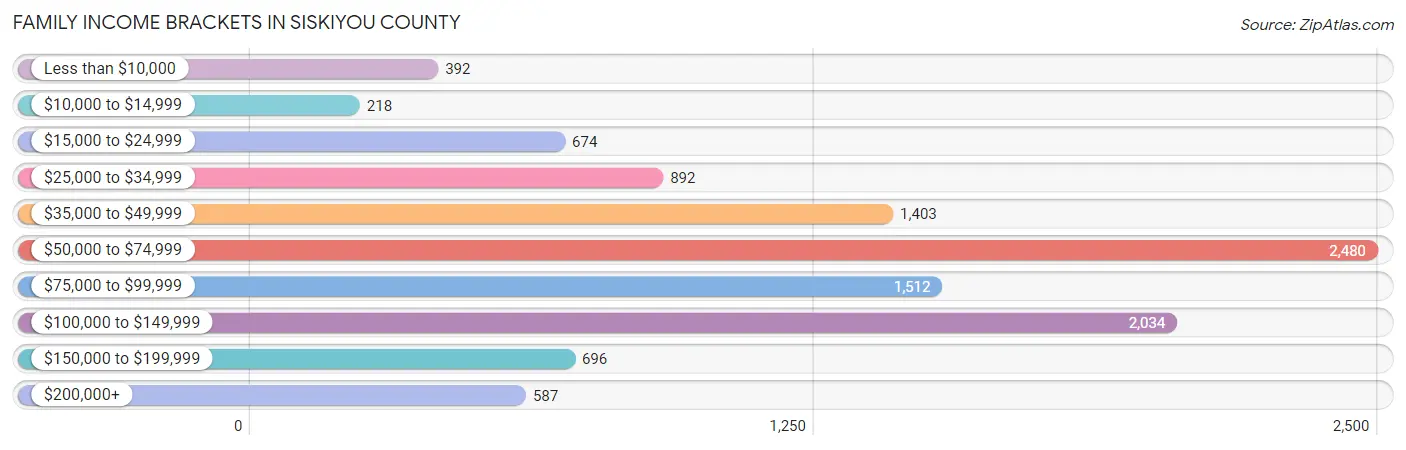
| Income Bracket | # Families | % Families |
| Less than $10,000 | 392 | 3.6% |
| $10,000 to $14,999 | 218 | 2.0% |
| $15,000 to $24,999 | 674 | 6.2% |
| $25,000 to $34,999 | 892 | 8.2% |
| $35,000 to $49,999 | 1,403 | 12.9% |
| $50,000 to $74,999 | 2,480 | 22.8% |
| $75,000 to $99,999 | 1,512 | 13.9% |
| $100,000 to $149,999 | 2,034 | 18.7% |
| $150,000 to $199,999 | 696 | 6.4% |
| $200,000+ | 587 | 5.4% |
Family Income by Famaliy Size in Siskiyou County
7+ person families (115 | 1.1%) account for the highest median family income in Siskiyou County with $120,179 per family, while 2-person families (6,580 | 60.5%) have the highest median income of $31,381 per family member.
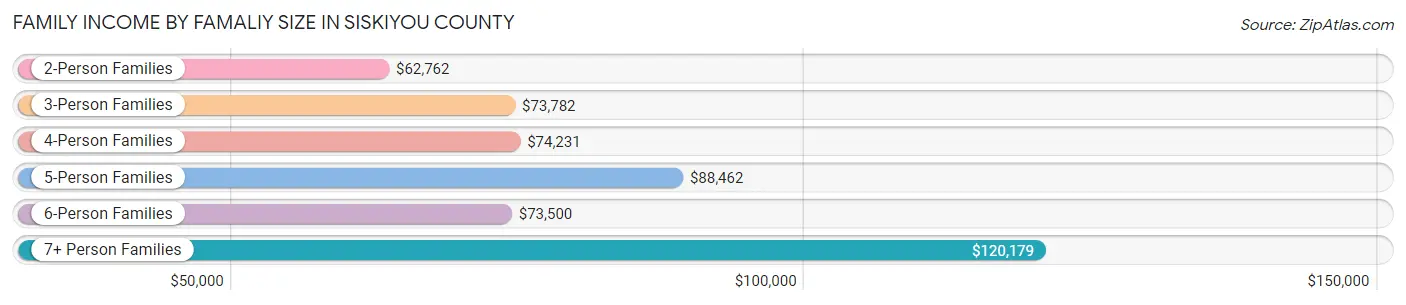
| Income Bracket | # Families | Median Income |
| 2-Person Families | 6,580 (60.5%) | $62,762 |
| 3-Person Families | 1,792 (16.5%) | $73,782 |
| 4-Person Families | 1,436 (13.2%) | $74,231 |
| 5-Person Families | 672 (6.2%) | $88,462 |
| 6-Person Families | 282 (2.6%) | $73,500 |
| 7+ Person Families | 115 (1.1%) | $120,179 |
| Total | 10,877 (100.0%) | $67,908 |
Family Income by Number of Earners in Siskiyou County
The median family income in Siskiyou County is $67,908, with families comprising 3+ earners (482) having the highest median family income of $109,000, while families with no earners (2,856) have the lowest median family income of $48,405, accounting for 4.4% and 26.3% of families, respectively.
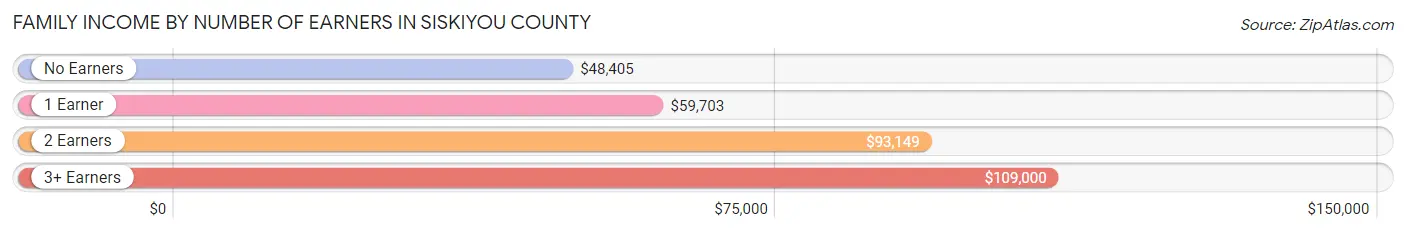
| Number of Earners | # Families | Median Income |
| No Earners | 2,856 (26.3%) | $48,405 |
| 1 Earner | 3,932 (36.1%) | $59,703 |
| 2 Earners | 3,607 (33.2%) | $93,149 |
| 3+ Earners | 482 (4.4%) | $109,000 |
| Total | 10,877 (100.0%) | $67,908 |
Household Income in Siskiyou County
Household Income Brackets in Siskiyou County
With 3,453 households falling in the category, the $50,000 to $74,999 income range is the most frequent in Siskiyou County, accounting for 18.4% of all households. In contrast, only 788 households (4.2%) fall into the $200,000+ income bracket, making it the least populous group.
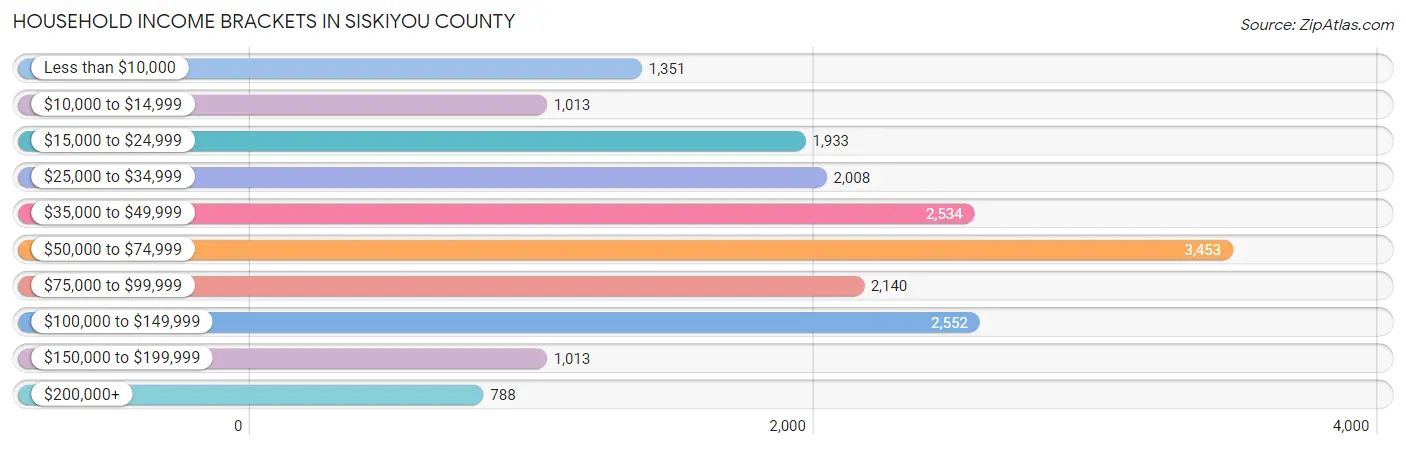
| Income Bracket | # Households | % Households |
| Less than $10,000 | 1,351 | 7.2% |
| $10,000 to $14,999 | 1,013 | 5.4% |
| $15,000 to $24,999 | 1,933 | 10.3% |
| $25,000 to $34,999 | 2,008 | 10.7% |
| $35,000 to $49,999 | 2,534 | 13.5% |
| $50,000 to $74,999 | 3,453 | 18.4% |
| $75,000 to $99,999 | 2,140 | 11.4% |
| $100,000 to $149,999 | 2,552 | 13.6% |
| $150,000 to $199,999 | 1,013 | 5.4% |
| $200,000+ | 788 | 4.2% |
Household Income by Householder Age in Siskiyou County
The median household income in Siskiyou County is $53,898, with the highest median household income of $66,901 found in the 25 to 44 years age bracket for the primary householder. A total of 4,267 households (22.7%) fall into this category. Meanwhile, the 15 to 24 years age bracket for the primary householder has the lowest median household income of $35,098, with 598 households (3.2%) in this group.
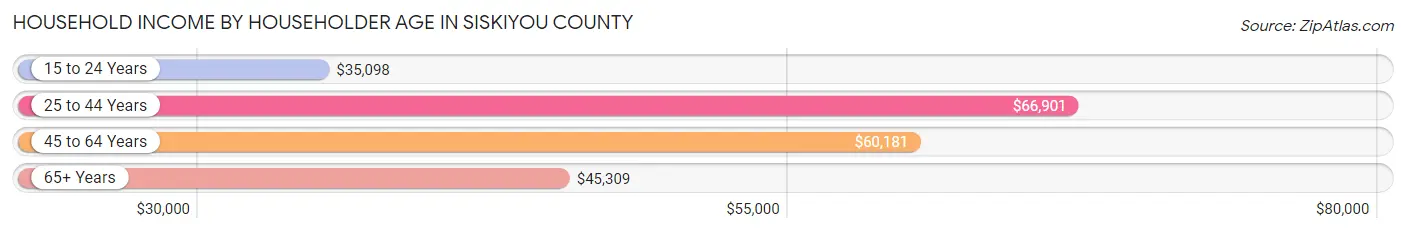
| Income Bracket | # Households | Median Income |
| 15 to 24 Years | 598 (3.2%) | $35,098 |
| 25 to 44 Years | 4,267 (22.7%) | $66,901 |
| 45 to 64 Years | 6,434 (34.3%) | $60,181 |
| 65+ Years | 7,469 (39.8%) | $45,309 |
| Total | 18,768 (100.0%) | $53,898 |
Poverty in Siskiyou County
Income Below Poverty by Sex and Age in Siskiyou County
With 16.0% poverty level for males and 17.3% for females among the residents of Siskiyou County, 16 and 17 year old males and 5 year old females are the most vulnerable to poverty, with 199 males (35.0%) and 172 females (56.8%) in their respective age groups living below the poverty level.
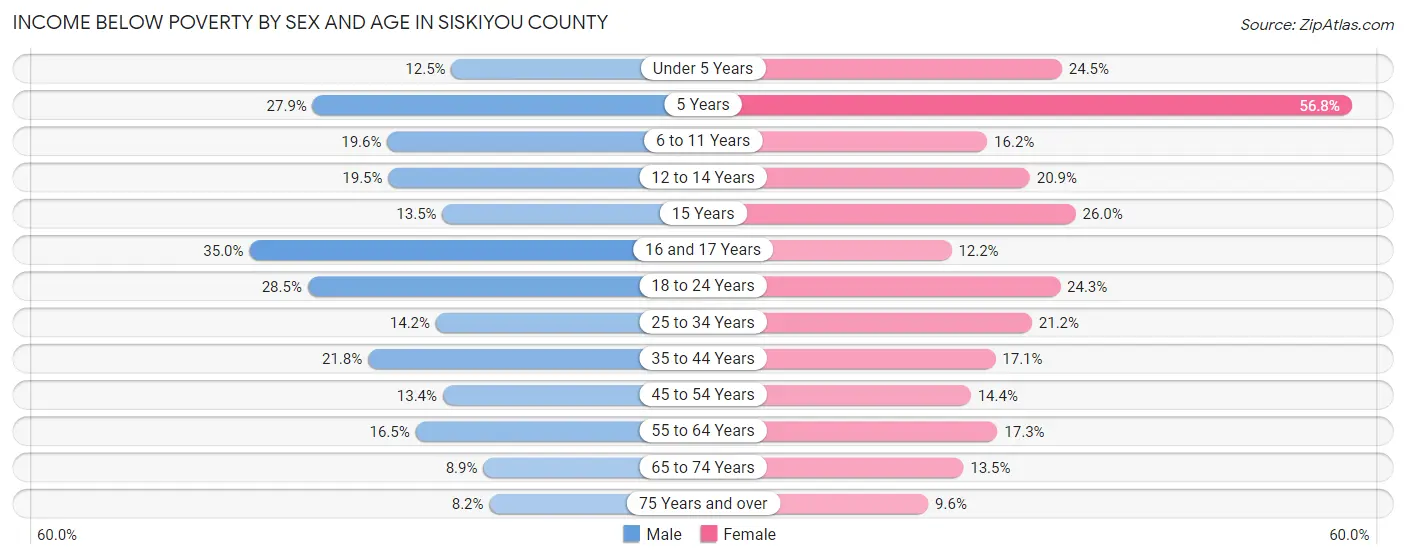
| Age Bracket | Male | Female |
| Under 5 Years | 137 (12.5%) | 250 (24.5%) |
| 5 Years | 43 (27.9%) | 172 (56.8%) |
| 6 to 11 Years | 300 (19.6%) | 226 (16.2%) |
| 12 to 14 Years | 190 (19.5%) | 170 (20.9%) |
| 15 Years | 33 (13.5%) | 75 (26.0%) |
| 16 and 17 Years | 199 (35.0%) | 48 (12.2%) |
| 18 to 24 Years | 431 (28.5%) | 343 (24.3%) |
| 25 to 34 Years | 314 (14.2%) | 445 (21.2%) |
| 35 to 44 Years | 531 (21.7%) | 391 (17.1%) |
| 45 to 54 Years | 313 (13.4%) | 341 (14.4%) |
| 55 to 64 Years | 529 (16.5%) | 608 (17.3%) |
| 65 to 74 Years | 315 (8.9%) | 499 (13.5%) |
| 75 Years and over | 165 (8.2%) | 221 (9.6%) |
| Total | 3,500 (16.0%) | 3,789 (17.3%) |
Income Above Poverty by Sex and Age in Siskiyou County
According to the poverty statistics in Siskiyou County, males aged 75 years and over and females aged 75 years and over are the age groups that are most secure financially, with 91.8% of males and 90.4% of females in these age groups living above the poverty line.
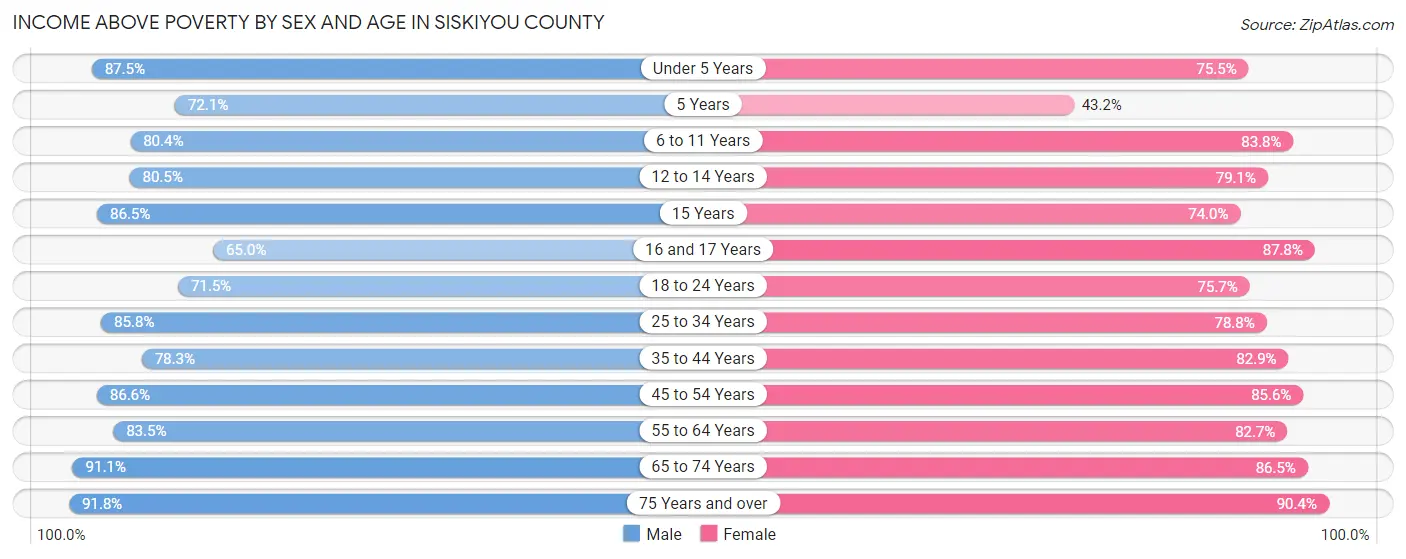
| Age Bracket | Male | Female |
| Under 5 Years | 962 (87.5%) | 770 (75.5%) |
| 5 Years | 111 (72.1%) | 131 (43.2%) |
| 6 to 11 Years | 1,230 (80.4%) | 1,170 (83.8%) |
| 12 to 14 Years | 785 (80.5%) | 642 (79.1%) |
| 15 Years | 212 (86.5%) | 213 (74.0%) |
| 16 and 17 Years | 370 (65.0%) | 345 (87.8%) |
| 18 to 24 Years | 1,083 (71.5%) | 1,068 (75.7%) |
| 25 to 34 Years | 1,898 (85.8%) | 1,657 (78.8%) |
| 35 to 44 Years | 1,910 (78.2%) | 1,895 (82.9%) |
| 45 to 54 Years | 2,019 (86.6%) | 2,033 (85.6%) |
| 55 to 64 Years | 2,685 (83.5%) | 2,900 (82.7%) |
| 65 to 74 Years | 3,218 (91.1%) | 3,188 (86.5%) |
| 75 Years and over | 1,837 (91.8%) | 2,077 (90.4%) |
| Total | 18,320 (84.0%) | 18,089 (82.7%) |
Income Below Poverty Among Married-Couple Families in Siskiyou County
The poverty statistics for married-couple families in Siskiyou County show that 5.3% or 432 of the total 8,106 families live below the poverty line. Families with 5 or more children have the highest poverty rate of 22.6%, comprising of 12 families. On the other hand, families with 1 or 2 children have the lowest poverty rate of 3.5%, which includes 70 families.
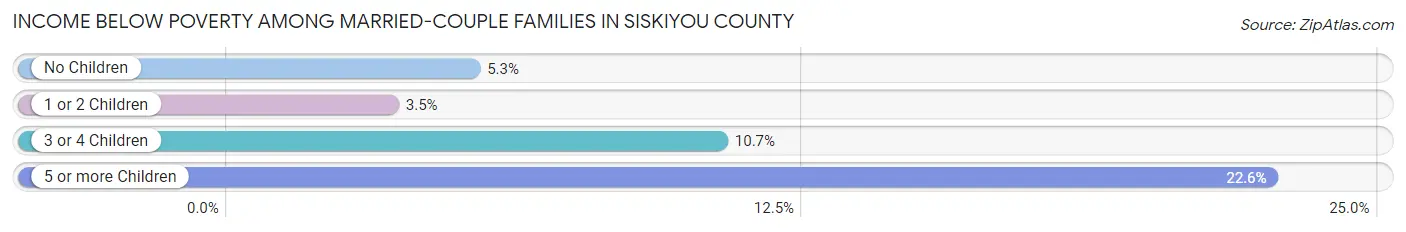
| Children | Above Poverty | Below Poverty |
| No Children | 5,194 (94.7%) | 289 (5.3%) |
| 1 or 2 Children | 1,928 (96.5%) | 70 (3.5%) |
| 3 or 4 Children | 511 (89.3%) | 61 (10.7%) |
| 5 or more Children | 41 (77.4%) | 12 (22.6%) |
| Total | 7,674 (94.7%) | 432 (5.3%) |
Income Below Poverty Among Single-Parent Households in Siskiyou County
According to the poverty data in Siskiyou County, 21.5% or 165 single-father households and 27.4% or 548 single-mother households are living below the poverty line. Among single-father households, those with 3 or 4 children have the highest poverty rate, with 3 households (30.0%) experiencing poverty. Likewise, among single-mother households, those with 3 or 4 children have the highest poverty rate, with 167 households (52.0%) falling below the poverty line.
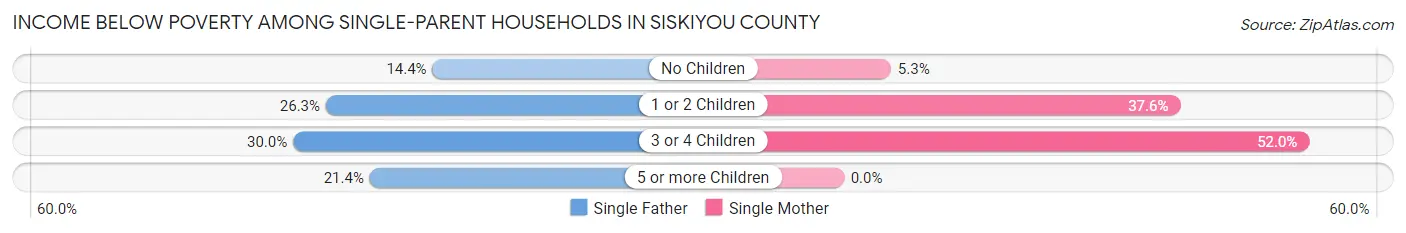
| Children | Single Father | Single Mother |
| No Children | 45 (14.4%) | 41 (5.3%) |
| 1 or 2 Children | 114 (26.3%) | 340 (37.6%) |
| 3 or 4 Children | 3 (30.0%) | 167 (52.0%) |
| 5 or more Children | 3 (21.4%) | 0 (0.0%) |
| Total | 165 (21.5%) | 548 (27.4%) |
Income Below Poverty Among Married-Couple vs Single-Parent Households in Siskiyou County
The poverty data for Siskiyou County shows that 432 of the married-couple family households (5.3%) and 713 of the single-parent households (25.7%) are living below the poverty level. Within the married-couple family households, those with 5 or more children have the highest poverty rate, with 12 households (22.6%) falling below the poverty line. Among the single-parent households, those with 3 or 4 children have the highest poverty rate, with 170 household (51.4%) living below poverty.
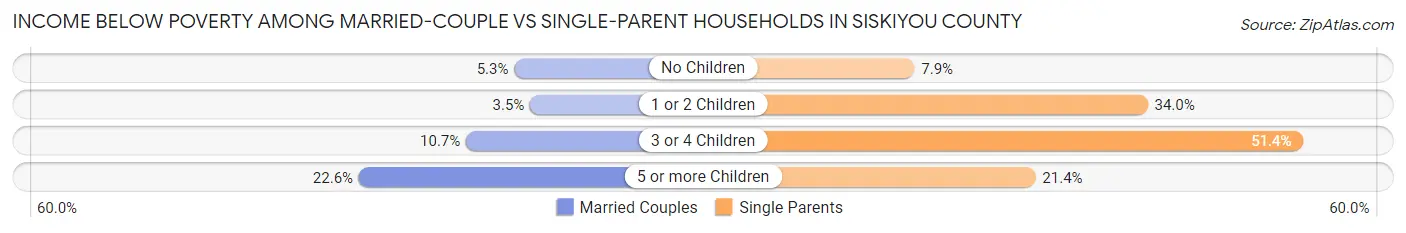
| Children | Married-Couple Families | Single-Parent Households |
| No Children | 289 (5.3%) | 86 (7.9%) |
| 1 or 2 Children | 70 (3.5%) | 454 (34.0%) |
| 3 or 4 Children | 61 (10.7%) | 170 (51.4%) |
| 5 or more Children | 12 (22.6%) | 3 (21.4%) |
| Total | 432 (5.3%) | 713 (25.7%) |
Race in Siskiyou County
The most populous races in Siskiyou County are White / Caucasian (35,233 | 80.0%), Hispanic or Latino (5,957 | 13.5%), and Two or more Races (4,636 | 10.5%).
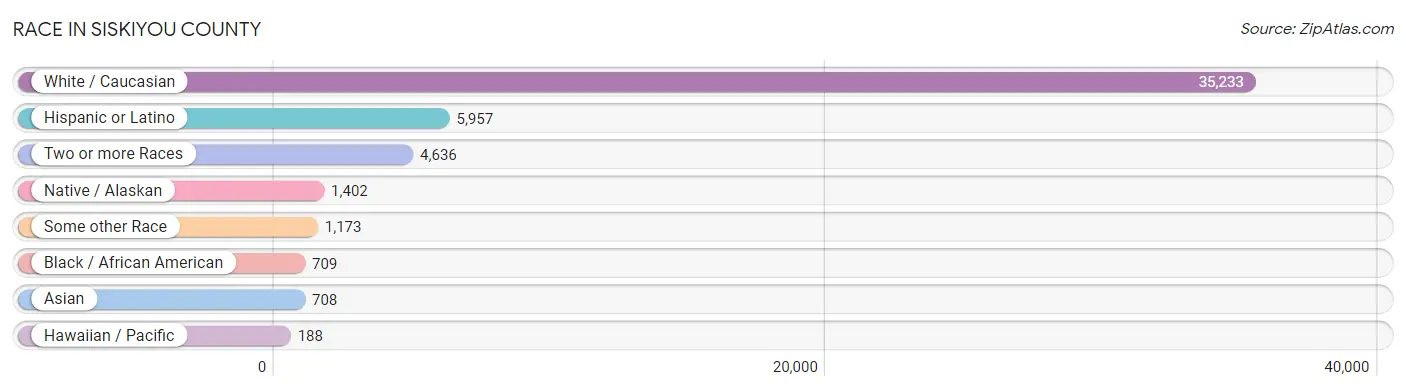
| Race | # Population | % Population |
| Asian | 708 | 1.6% |
| Black / African American | 709 | 1.6% |
| Hawaiian / Pacific | 188 | 0.4% |
| Hispanic or Latino | 5,957 | 13.5% |
| Native / Alaskan | 1,402 | 3.2% |
| White / Caucasian | 35,233 | 80.0% |
| Two or more Races | 4,636 | 10.5% |
| Some other Race | 1,173 | 2.7% |
| Total | 44,049 | 100.0% |
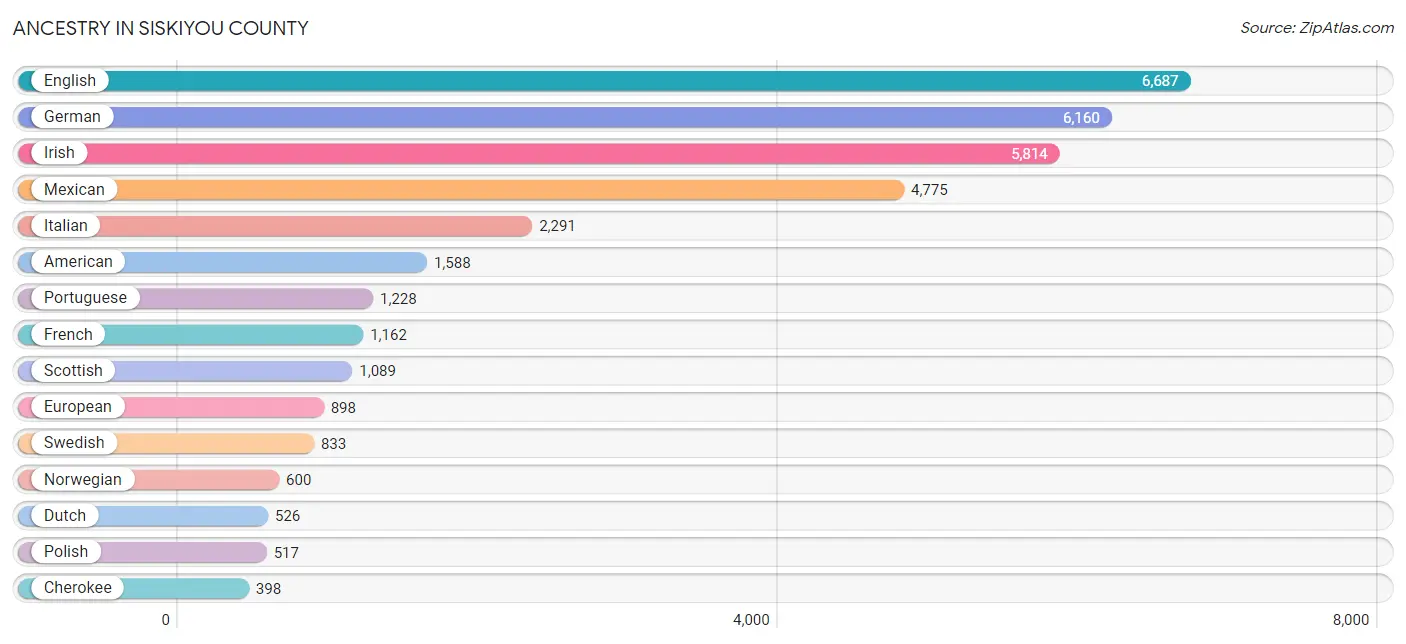
Ancestry in Siskiyou County
The most populous ancestries reported in Siskiyou County are English (6,687 | 15.2%), German (6,160 | 14.0%), Irish (5,814 | 13.2%), Mexican (4,775 | 10.8%), and Italian (2,291 | 5.2%), together accounting for 58.4% of all Siskiyou County residents.
| Ancestry | # Population | % Population |
| African | 42 | 0.1% |
| Albanian | 3 | 0.0% |
| Aleut | 2 | 0.0% |
| American | 1,588 | 3.6% |
| Apache | 68 | 0.2% |
| Arab | 115 | 0.3% |
| Argentinean | 7 | 0.0% |
| Armenian | 1 | 0.0% |
| Australian | 27 | 0.1% |
| Austrian | 22 | 0.1% |
| Bangladeshi | 96 | 0.2% |
| Basque | 13 | 0.0% |
| Belgian | 12 | 0.0% |
| Bhutanese | 192 | 0.4% |
| Blackfeet | 42 | 0.1% |
| Bolivian | 20 | 0.1% |
| Brazilian | 29 | 0.1% |
| British | 246 | 0.6% |
| Bulgarian | 2 | 0.0% |
| Burmese | 54 | 0.1% |
| Canadian | 59 | 0.1% |
| Central American | 313 | 0.7% |
| Central American Indian | 36 | 0.1% |
| Cherokee | 398 | 0.9% |
| Chickasaw | 18 | 0.0% |
| Chilean | 14 | 0.0% |
| Chinese | 22 | 0.1% |
| Chippewa | 27 | 0.1% |
| Choctaw | 229 | 0.5% |
| Colombian | 3 | 0.0% |
| Comanche | 31 | 0.1% |
| Costa Rican | 2 | 0.0% |
| Cree | 43 | 0.1% |
| Creek | 56 | 0.1% |
| Croatian | 42 | 0.1% |
| Crow | 1 | 0.0% |
| Cuban | 82 | 0.2% |
| Czech | 88 | 0.2% |
| Czechoslovakian | 57 | 0.1% |
| Danish | 198 | 0.4% |
| Delaware | 2 | 0.0% |
| Dominican | 2 | 0.0% |
| Dutch | 526 | 1.2% |
| Dutch West Indian | 7 | 0.0% |
| Eastern European | 118 | 0.3% |
| English | 6,687 | 15.2% |
| European | 898 | 2.0% |
| Finnish | 196 | 0.4% |
| French | 1,162 | 2.6% |
| French American Indian | 3 | 0.0% |
| French Canadian | 167 | 0.4% |
| German | 6,160 | 14.0% |
| Greek | 287 | 0.6% |
| Guamanian / Chamorro | 8 | 0.0% |
| Guatemalan | 76 | 0.2% |
| Honduran | 2 | 0.0% |
| Hungarian | 57 | 0.1% |
| Icelander | 55 | 0.1% |
| Indian (Asian) | 309 | 0.7% |
| Inupiat | 2 | 0.0% |
| Iranian | 6 | 0.0% |
| Irish | 5,814 | 13.2% |
| Iroquois | 4 | 0.0% |
| Italian | 2,291 | 5.2% |
| Japanese | 3 | 0.0% |
| Korean | 351 | 0.8% |
| Laotian | 11 | 0.0% |
| Lebanese | 64 | 0.2% |
| Lithuanian | 30 | 0.1% |
| Lumbee | 9 | 0.0% |
| Luxembourger | 4 | 0.0% |
| Macedonian | 23 | 0.1% |
| Malaysian | 134 | 0.3% |
| Maltese | 16 | 0.0% |
| Mexican | 4,775 | 10.8% |
| Mexican American Indian | 104 | 0.2% |
| Native Hawaiian | 115 | 0.3% |
| Navajo | 40 | 0.1% |
| New Zealander | 3 | 0.0% |
| Nicaraguan | 36 | 0.1% |
| Northern European | 237 | 0.5% |
| Norwegian | 600 | 1.4% |
| Pakistani | 31 | 0.1% |
| Palestinian | 29 | 0.1% |
| Pennsylvania German | 2 | 0.0% |
| Peruvian | 61 | 0.1% |
| Polish | 517 | 1.2% |
| Portuguese | 1,228 | 2.8% |
| Potawatomi | 5 | 0.0% |
| Pueblo | 2 | 0.0% |
| Puerto Rican | 258 | 0.6% |
| Romanian | 33 | 0.1% |
| Russian | 201 | 0.5% |
| Salvadoran | 192 | 0.4% |
| Samoan | 174 | 0.4% |
| Scandinavian | 328 | 0.7% |
| Scotch-Irish | 397 | 0.9% |
| Scottish | 1,089 | 2.5% |
| Serbian | 9 | 0.0% |
| Shoshone | 1 | 0.0% |
| Sioux | 35 | 0.1% |
| Slavic | 18 | 0.0% |
| Slovak | 29 | 0.1% |
| Slovene | 19 | 0.0% |
| South American | 112 | 0.3% |
| Spaniard | 146 | 0.3% |
| Spanish | 172 | 0.4% |
| Sri Lankan | 14 | 0.0% |
| Subsaharan African | 42 | 0.1% |
| Swedish | 833 | 1.9% |
| Swiss | 141 | 0.3% |
| Syrian | 4 | 0.0% |
| Thai | 155 | 0.4% |
| Tlingit-Haida | 11 | 0.0% |
| Ukrainian | 108 | 0.3% |
| Uruguayan | 7 | 0.0% |
| Welsh | 295 | 0.7% |
| Yaqui | 32 | 0.1% |
| Yugoslavian | 17 | 0.0% | View All 119 Rows |
Immigrants in Siskiyou County
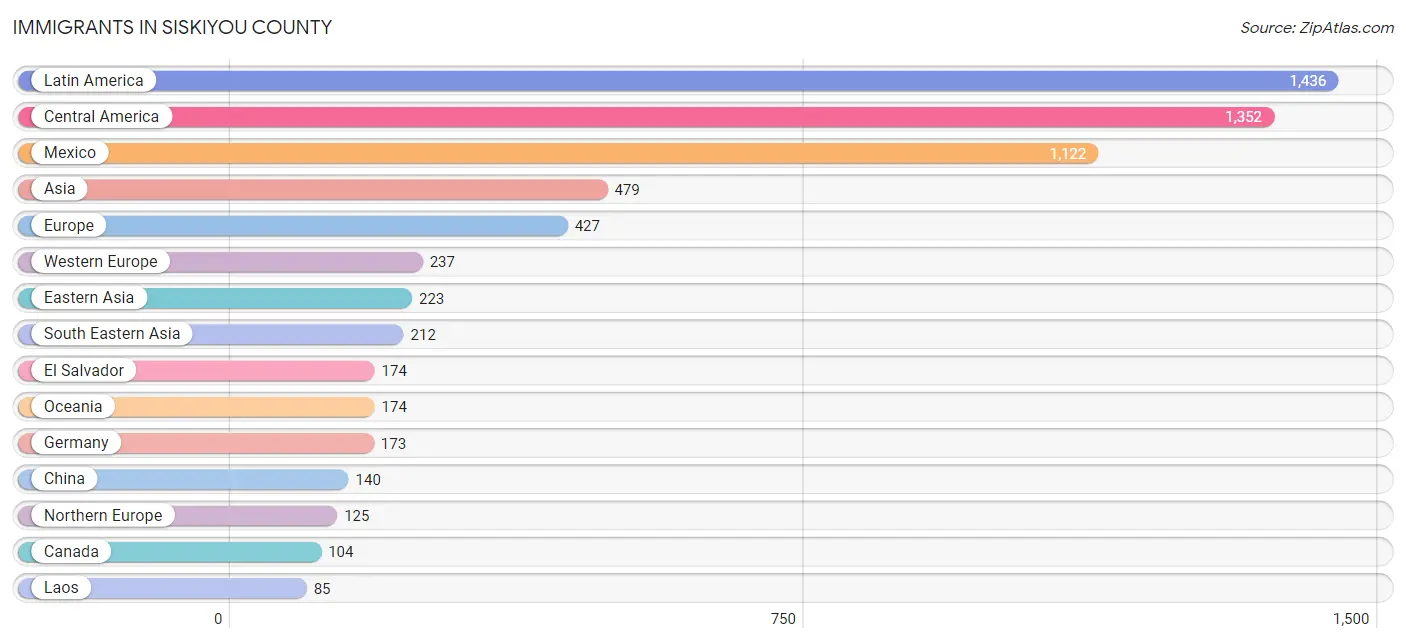
The most numerous immigrant groups reported in Siskiyou County came from Latin America (1,436 | 3.3%), Central America (1,352 | 3.1%), Mexico (1,122 | 2.5%), Asia (479 | 1.1%), and Europe (427 | 1.0%), together accounting for 10.9% of all Siskiyou County residents.
| Immigration Origin | # Population | % Population |
| Africa | 32 | 0.1% |
| Argentina | 7 | 0.0% |
| Asia | 479 | 1.1% |
| Australia | 38 | 0.1% |
| Belgium | 1 | 0.0% |
| Bolivia | 20 | 0.1% |
| Brazil | 10 | 0.0% |
| Cambodia | 3 | 0.0% |
| Canada | 104 | 0.2% |
| Caribbean | 15 | 0.0% |
| Central America | 1,352 | 3.1% |
| Chile | 14 | 0.0% |
| China | 140 | 0.3% |
| Costa Rica | 2 | 0.0% |
| Cuba | 9 | 0.0% |
| Denmark | 5 | 0.0% |
| Eastern Africa | 3 | 0.0% |
| Eastern Asia | 223 | 0.5% |
| Eastern Europe | 42 | 0.1% |
| El Salvador | 174 | 0.4% |
| England | 38 | 0.1% |
| Europe | 427 | 1.0% |
| Fiji | 6 | 0.0% |
| France | 23 | 0.1% |
| Germany | 173 | 0.4% |
| Greece | 2 | 0.0% |
| Guatemala | 29 | 0.1% |
| Honduras | 22 | 0.1% |
| Hong Kong | 14 | 0.0% |
| India | 33 | 0.1% |
| Indonesia | 7 | 0.0% |
| Iran | 6 | 0.0% |
| Ireland | 15 | 0.0% |
| Italy | 21 | 0.1% |
| Jamaica | 6 | 0.0% |
| Japan | 19 | 0.0% |
| Kazakhstan | 1 | 0.0% |
| Korea | 64 | 0.2% |
| Laos | 85 | 0.2% |
| Latin America | 1,436 | 3.3% |
| Mexico | 1,122 | 2.5% |
| Netherlands | 14 | 0.0% |
| Nicaragua | 3 | 0.0% |
| Northern Europe | 125 | 0.3% |
| Oceania | 174 | 0.4% |
| Peru | 18 | 0.0% |
| Philippines | 50 | 0.1% |
| Russia | 18 | 0.0% |
| Sierra Leone | 12 | 0.0% |
| South Africa | 17 | 0.0% |
| South America | 69 | 0.2% |
| South Central Asia | 44 | 0.1% |
| South Eastern Asia | 212 | 0.5% |
| Southern Europe | 23 | 0.1% |
| Sri Lanka | 4 | 0.0% |
| Sweden | 6 | 0.0% |
| Switzerland | 26 | 0.1% |
| Thailand | 16 | 0.0% |
| Ukraine | 11 | 0.0% |
| Vietnam | 51 | 0.1% |
| Western Africa | 12 | 0.0% |
| Western Europe | 237 | 0.5% |
| Zimbabwe | 3 | 0.0% | View All 63 Rows |
Sex and Age in Siskiyou County
Sex and Age in Siskiyou County
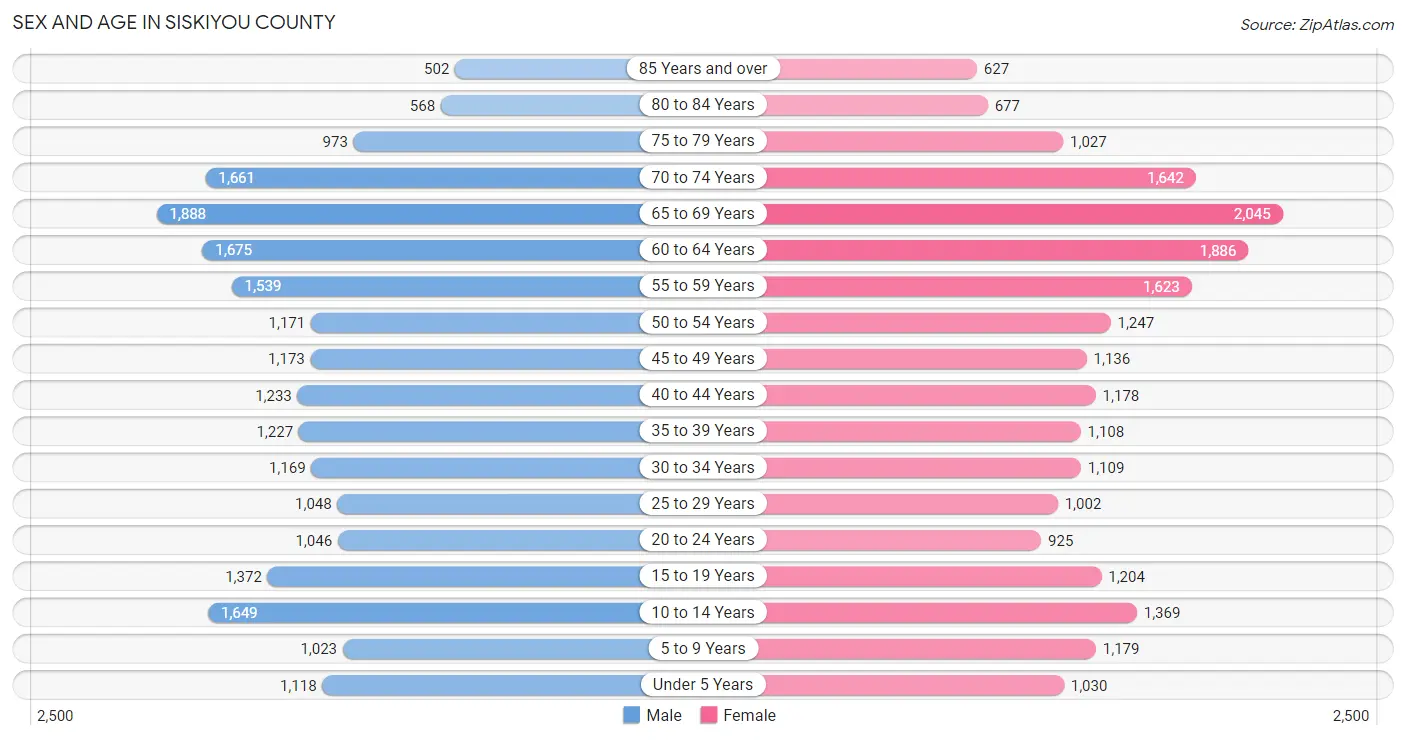
The most populous age groups in Siskiyou County are 65 to 69 Years (1,888 | 8.6%) for men and 65 to 69 Years (2,045 | 9.3%) for women.
| Age Bracket | Male | Female |
| Under 5 Years | 1,118 (5.1%) | 1,030 (4.7%) |
| 5 to 9 Years | 1,023 (4.6%) | 1,179 (5.4%) |
| 10 to 14 Years | 1,649 (7.5%) | 1,369 (6.2%) |
| 15 to 19 Years | 1,372 (6.2%) | 1,204 (5.5%) |
| 20 to 24 Years | 1,046 (4.8%) | 925 (4.2%) |
| 25 to 29 Years | 1,048 (4.8%) | 1,002 (4.5%) |
| 30 to 34 Years | 1,169 (5.3%) | 1,109 (5.0%) |
| 35 to 39 Years | 1,227 (5.6%) | 1,108 (5.0%) |
| 40 to 44 Years | 1,233 (5.6%) | 1,178 (5.3%) |
| 45 to 49 Years | 1,173 (5.3%) | 1,136 (5.2%) |
| 50 to 54 Years | 1,171 (5.3%) | 1,247 (5.7%) |
| 55 to 59 Years | 1,539 (7.0%) | 1,623 (7.4%) |
| 60 to 64 Years | 1,675 (7.6%) | 1,886 (8.6%) |
| 65 to 69 Years | 1,888 (8.6%) | 2,045 (9.3%) |
| 70 to 74 Years | 1,661 (7.5%) | 1,642 (7.5%) |
| 75 to 79 Years | 973 (4.4%) | 1,027 (4.7%) |
| 80 to 84 Years | 568 (2.6%) | 677 (3.1%) |
| 85 Years and over | 502 (2.3%) | 627 (2.9%) |
| Total | 22,035 (100.0%) | 22,014 (100.0%) |
Families and Households in Siskiyou County
Median Family Size in Siskiyou County
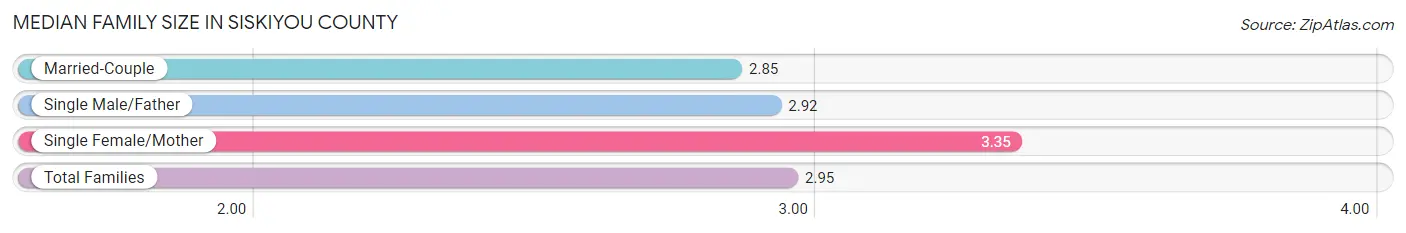
The median family size in Siskiyou County is 2.95 persons per family, with single female/mother families (2,002 | 18.4%) accounting for the largest median family size of 3.35 persons per family. On the other hand, married-couple families (8,106 | 74.5%) represent the smallest median family size with 2.85 persons per family.
| Family Type | # Families | Family Size |
| Married-Couple | 8,106 (74.5%) | 2.85 |
| Single Male/Father | 769 (7.1%) | 2.92 |
| Single Female/Mother | 2,002 (18.4%) | 3.35 |
| Total Families | 10,877 (100.0%) | 2.95 |
Median Household Size in Siskiyou County
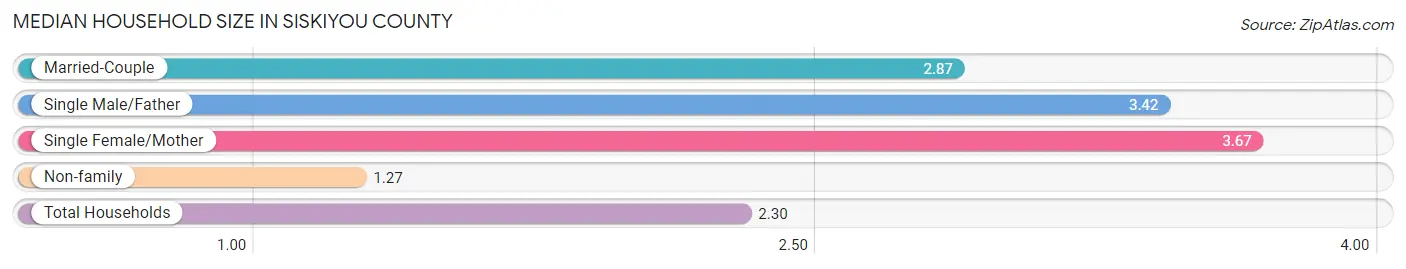
The median household size in Siskiyou County is 2.30 persons per household, with single female/mother households (2,002 | 10.7%) accounting for the largest median household size of 3.67 persons per household. non-family households (7,891 | 42.0%) represent the smallest median household size with 1.27 persons per household.
| Household Type | # Households | Household Size |
| Married-Couple | 8,106 (43.2%) | 2.87 |
| Single Male/Father | 769 (4.1%) | 3.42 |
| Single Female/Mother | 2,002 (10.7%) | 3.67 |
| Non-family | 7,891 (42.0%) | 1.27 |
| Total Households | 18,768 (100.0%) | 2.30 |
Household Size by Marriage Status in Siskiyou County
Out of a total of 18,768 households in Siskiyou County, 10,877 (58.0%) are family households, while 7,891 (42.0%) are nonfamily households. The most numerous type of family households are 2-person households, comprising 6,278, and the most common type of nonfamily households are 1-person households, comprising 6,370.
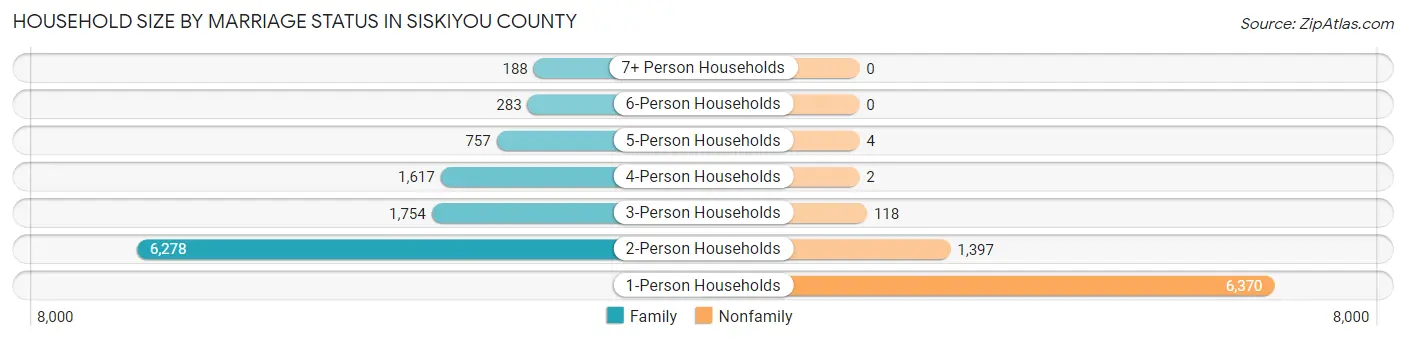
| Household Size | Family Households | Nonfamily Households |
| 1-Person Households | - | 6,370 (33.9%) |
| 2-Person Households | 6,278 (33.5%) | 1,397 (7.4%) |
| 3-Person Households | 1,754 (9.3%) | 118 (0.6%) |
| 4-Person Households | 1,617 (8.6%) | 2 (0.0%) |
| 5-Person Households | 757 (4.0%) | 4 (0.0%) |
| 6-Person Households | 283 (1.5%) | 0 (0.0%) |
| 7+ Person Households | 188 (1.0%) | 0 (0.0%) |
| Total | 10,877 (58.0%) | 7,891 (42.0%) |
Female Fertility in Siskiyou County
Fertility by Age in Siskiyou County
Average fertility rate in Siskiyou County is 30.0 births per 1,000 women. Women in the age bracket of 20 to 34 years have the highest fertility rate with 50.0 births per 1,000 women. Women in the age bracket of 20 to 34 years acount for 64.0% of all women with births.
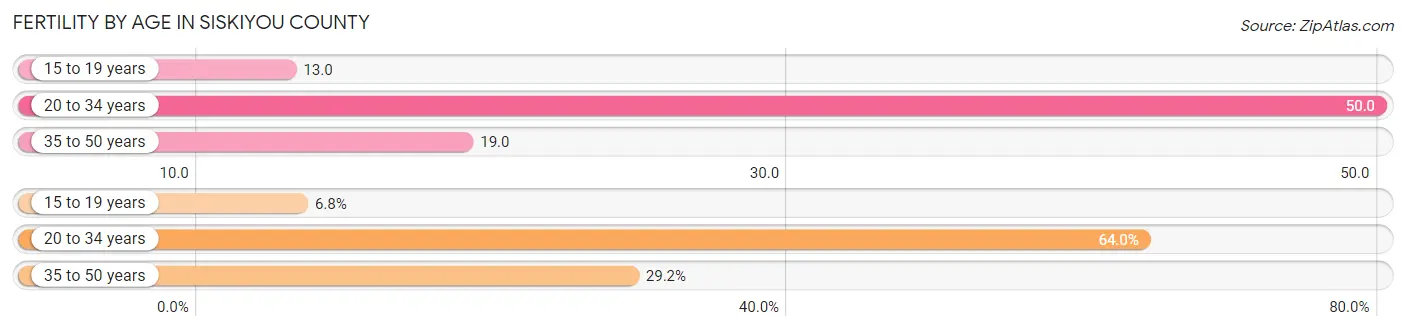
| Age Bracket | Women with Births | Births / 1,000 Women |
| 15 to 19 years | 16 (6.8%) | 13.0 |
| 20 to 34 years | 151 (64.0%) | 50.0 |
| 35 to 50 years | 69 (29.2%) | 19.0 |
| Total | 236 (100.0%) | 30.0 |
Fertility by Age by Marriage Status in Siskiyou County
66.1% of women with births (236) in Siskiyou County are married. The highest percentage of unmarried women with births falls into 15 to 19 years age bracket with 100.0% of them unmarried at the time of birth, while the lowest percentage of unmarried women with births belong to 35 to 50 years age bracket with 4.3% of them unmarried.
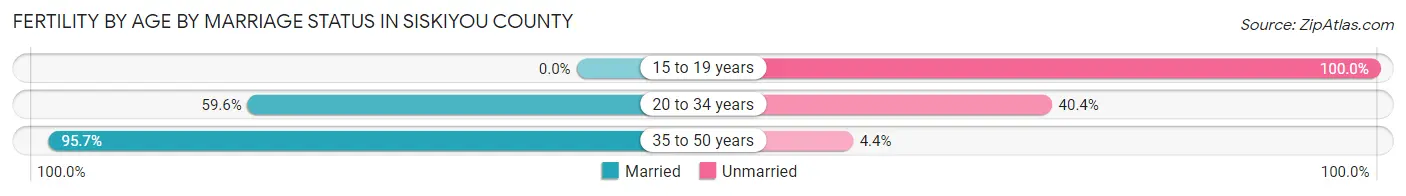
| Age Bracket | Married | Unmarried |
| 15 to 19 years | 0 (0.0%) | 16 (100.0%) |
| 20 to 34 years | 90 (59.6%) | 61 (40.4%) |
| 35 to 50 years | 66 (95.7%) | 3 (4.3%) |
| Total | 156 (66.1%) | 80 (33.9%) |
Fertility by Education in Siskiyou County
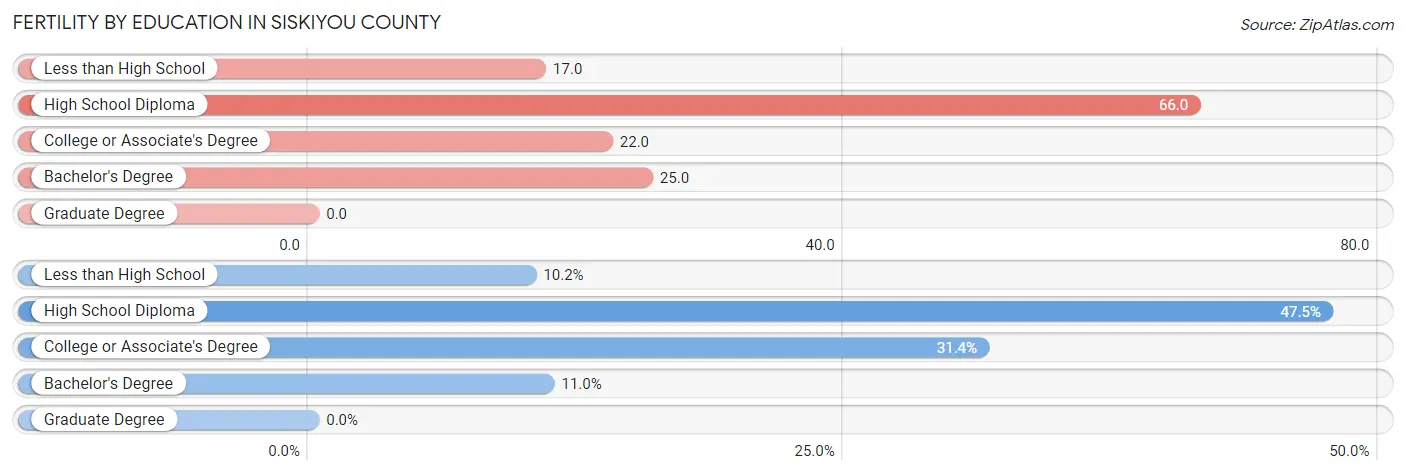
| Educational Attainment | Women with Births | Births / 1,000 Women |
| Less than High School | 24 (10.2%) | 17.0 |
| High School Diploma | 112 (47.5%) | 66.0 |
| College or Associate's Degree | 74 (31.4%) | 22.0 |
| Bachelor's Degree | 26 (11.0%) | 25.0 |
| Graduate Degree | 0 (0.0%) | 0.0 |
| Total | 236 (100.0%) | 30.0 |
Fertility by Education by Marriage Status in Siskiyou County
33.9% of women with births in Siskiyou County are unmarried. Women with the educational attainment of bachelor's degree are most likely to be married with 100.0% of them married at childbirth, while women with the educational attainment of less than high school are least likely to be married with 62.5% of them unmarried at childbirth.
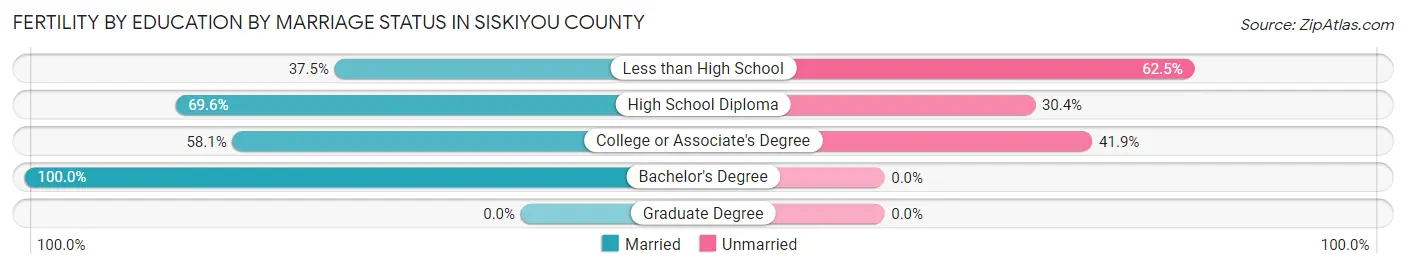
| Educational Attainment | Married | Unmarried |
| Less than High School | 9 (37.5%) | 15 (62.5%) |
| High School Diploma | 78 (69.6%) | 34 (30.4%) |
| College or Associate's Degree | 43 (58.1%) | 31 (41.9%) |
| Bachelor's Degree | 26 (100.0%) | 0 (0.0%) |
| Graduate Degree | 0 (0.0%) | 0 (0.0%) |
| Total | 156 (66.1%) | 80 (33.9%) |
Employment Characteristics in Siskiyou County
Employment by Class of Employer in Siskiyou County
Among the 15,974 employed individuals in Siskiyou County, private company employees (8,269 | 51.8%), local government employees (1,958 | 12.3%), and self-employed (not incorporated) (1,614 | 10.1%) make up the most common classes of employment.
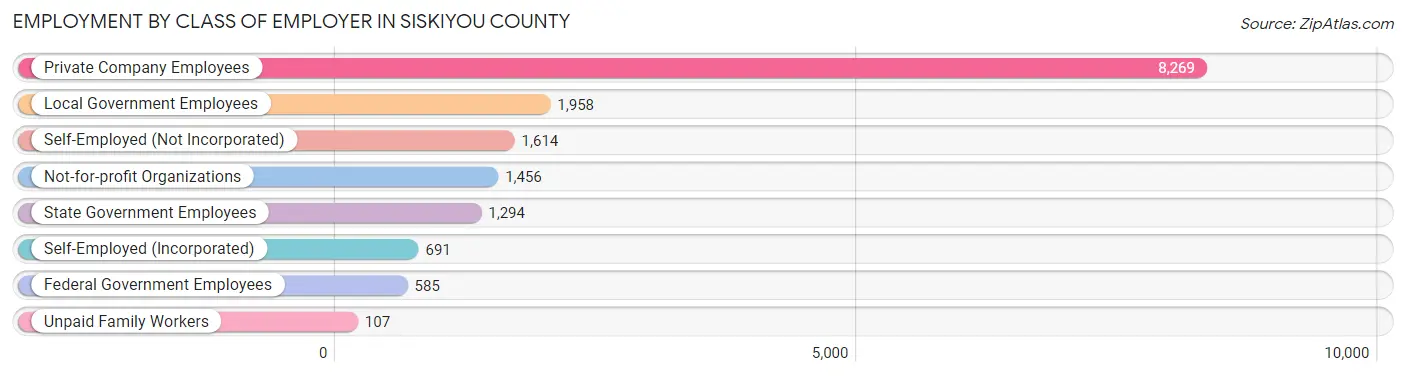
| Employer Class | # Employees | % Employees |
| Private Company Employees | 8,269 | 51.8% |
| Self-Employed (Incorporated) | 691 | 4.3% |
| Self-Employed (Not Incorporated) | 1,614 | 10.1% |
| Not-for-profit Organizations | 1,456 | 9.1% |
| Local Government Employees | 1,958 | 12.3% |
| State Government Employees | 1,294 | 8.1% |
| Federal Government Employees | 585 | 3.7% |
| Unpaid Family Workers | 107 | 0.7% |
| Total | 15,974 | 100.0% |
Employment Status by Age in Siskiyou County
According to the labor force statistics for Siskiyou County, out of the total population over 16 years of age (36,147), 49.8% or 18,001 individuals are in the labor force, with 7.4% or 1,332 of them unemployed. The age group with the highest labor force participation rate is 25 to 29 years, with 80.9% or 1,658 individuals in the labor force. Within the labor force, the 16 to 19 years age range has the highest percentage of unemployed individuals, with 24.6% or 154 of them being unemployed.
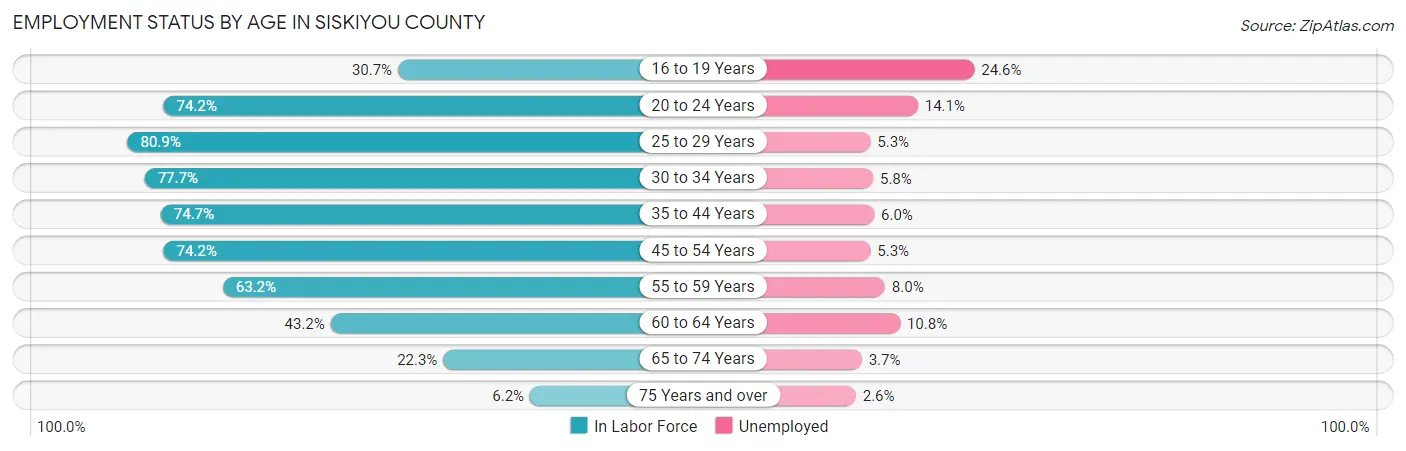
| Age Bracket | In Labor Force | Unemployed |
| 16 to 19 Years | 627 (30.7%) | 154 (24.6%) |
| 20 to 24 Years | 1,462 (74.2%) | 206 (14.1%) |
| 25 to 29 Years | 1,658 (80.9%) | 88 (5.3%) |
| 30 to 34 Years | 1,770 (77.7%) | 103 (5.8%) |
| 35 to 44 Years | 3,545 (74.7%) | 213 (6.0%) |
| 45 to 54 Years | 3,507 (74.2%) | 186 (5.3%) |
| 55 to 59 Years | 1,998 (63.2%) | 160 (8.0%) |
| 60 to 64 Years | 1,538 (43.2%) | 166 (10.8%) |
| 65 to 74 Years | 1,614 (22.3%) | 60 (3.7%) |
| 75 Years and over | 271 (6.2%) | 7 (2.6%) |
| Total | 18,001 (49.8%) | 1,332 (7.4%) |
Employment Status by Educational Attainment in Siskiyou County
According to labor force statistics for Siskiyou County, 68.3% of individuals (14,018) out of the total population between 25 and 64 years of age (20,524) are in the labor force, with 6.5% or 911 of them being unemployed. The group with the highest labor force participation rate are those with the educational attainment of bachelor's degree or higher, with 79.1% or 3,141 individuals in the labor force. Within the labor force, individuals with less than high school education have the highest percentage of unemployment, with 7.4% or 81 of them being unemployed.
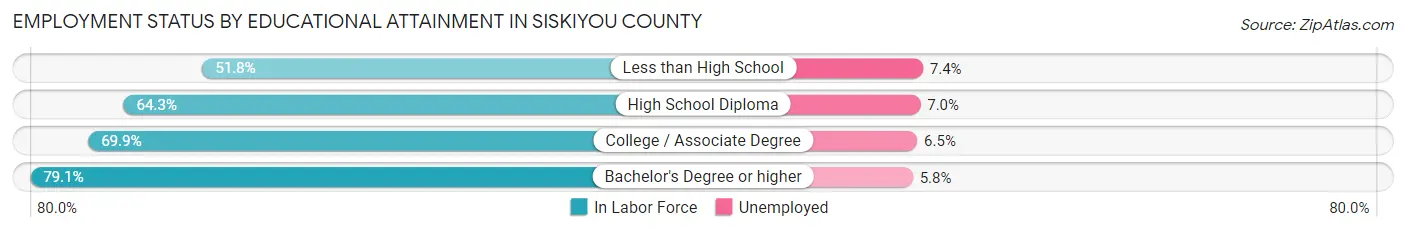
| Educational Attainment | In Labor Force | Unemployed |
| Less than High School | 1,089 (51.8%) | 156 (7.4%) |
| High School Diploma | 3,694 (64.3%) | 402 (7.0%) |
| College / Associate Degree | 6,085 (69.9%) | 566 (6.5%) |
| Bachelor's Degree or higher | 3,141 (79.1%) | 230 (5.8%) |
| Total | 14,018 (68.3%) | 1,334 (6.5%) |
Employment Occupations by Sex in Siskiyou County
Management, Business, Science and Arts Occupations
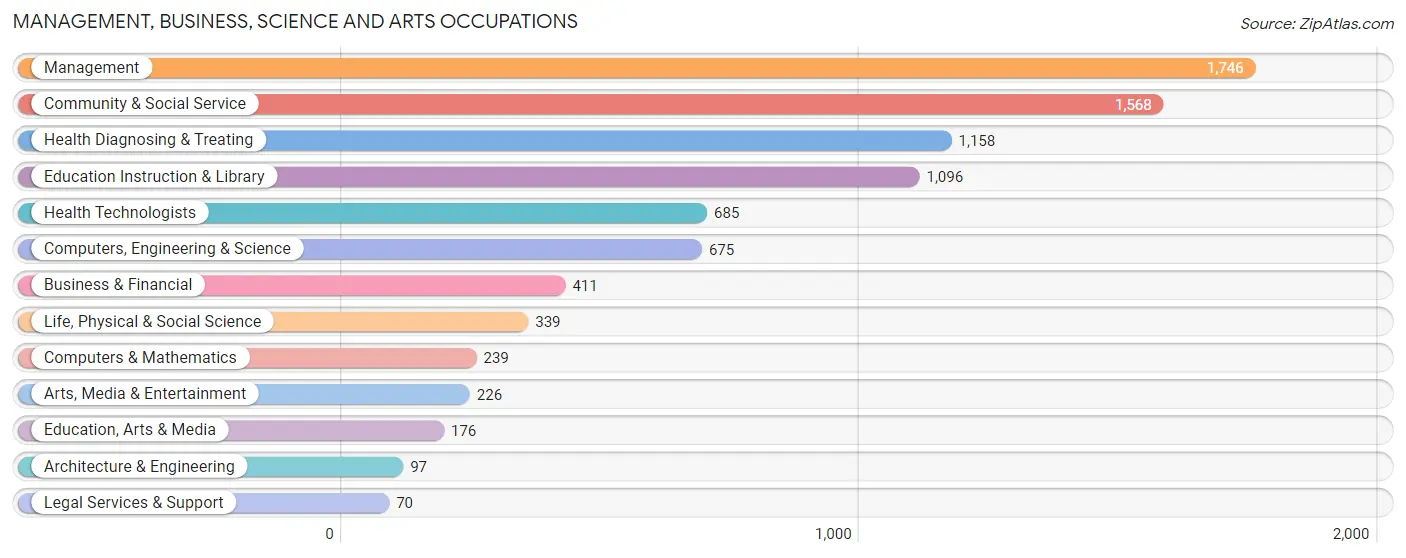
The most common Management, Business, Science and Arts occupations in Siskiyou County are Management (1,746 | 10.5%), Community & Social Service (1,568 | 9.4%), Health Diagnosing & Treating (1,158 | 7.0%), Education Instruction & Library (1,096 | 6.6%), and Health Technologists (685 | 4.1%).
Management, Business, Science and Arts Occupations by Sex
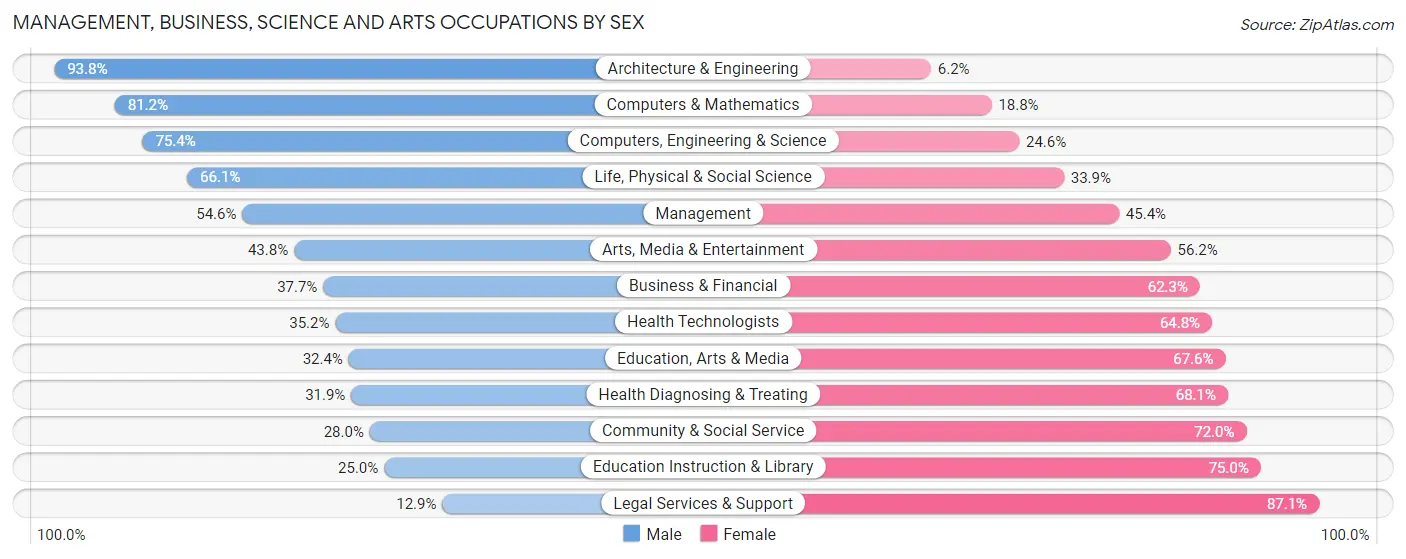
Within the Management, Business, Science and Arts occupations in Siskiyou County, the most male-oriented occupations are Architecture & Engineering (93.8%), Computers & Mathematics (81.2%), and Computers, Engineering & Science (75.4%), while the most female-oriented occupations are Legal Services & Support (87.1%), Education Instruction & Library (75.0%), and Community & Social Service (72.0%).
| Occupation | Male | Female |
| Management | 953 (54.6%) | 793 (45.4%) |
| Business & Financial | 155 (37.7%) | 256 (62.3%) |
| Computers, Engineering & Science | 509 (75.4%) | 166 (24.6%) |
| Computers & Mathematics | 194 (81.2%) | 45 (18.8%) |
| Architecture & Engineering | 91 (93.8%) | 6 (6.2%) |
| Life, Physical & Social Science | 224 (66.1%) | 115 (33.9%) |
| Community & Social Service | 439 (28.0%) | 1,129 (72.0%) |
| Education, Arts & Media | 57 (32.4%) | 119 (67.6%) |
| Legal Services & Support | 9 (12.9%) | 61 (87.1%) |
| Education Instruction & Library | 274 (25.0%) | 822 (75.0%) |
| Arts, Media & Entertainment | 99 (43.8%) | 127 (56.2%) |
| Health Diagnosing & Treating | 369 (31.9%) | 789 (68.1%) |
| Health Technologists | 241 (35.2%) | 444 (64.8%) |
| Total (Category) | 2,425 (43.6%) | 3,133 (56.4%) |
| Total (Overall) | 8,635 (51.9%) | 7,988 (48.0%) |
Services Occupations
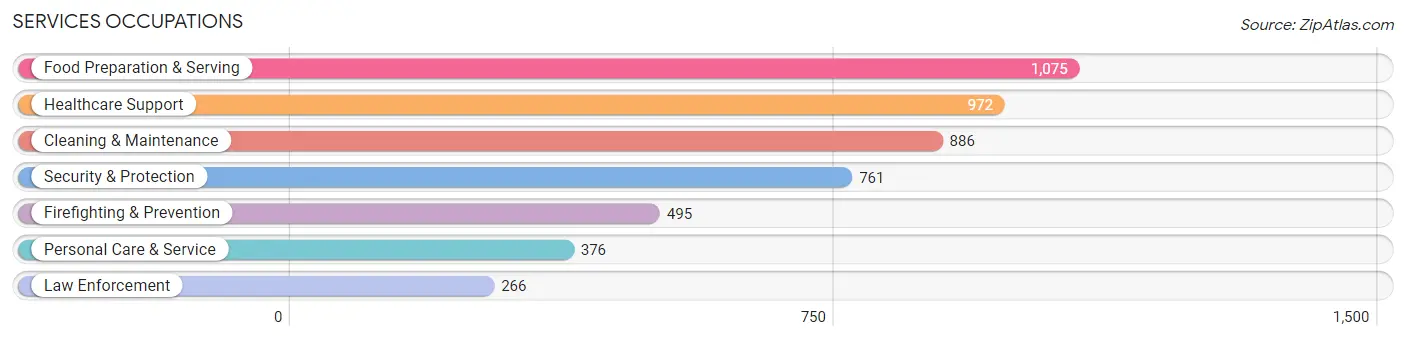
The most common Services occupations in Siskiyou County are Food Preparation & Serving (1,075 | 6.5%), Healthcare Support (972 | 5.9%), Cleaning & Maintenance (886 | 5.3%), Security & Protection (761 | 4.6%), and Firefighting & Prevention (495 | 3.0%).
Services Occupations by Sex
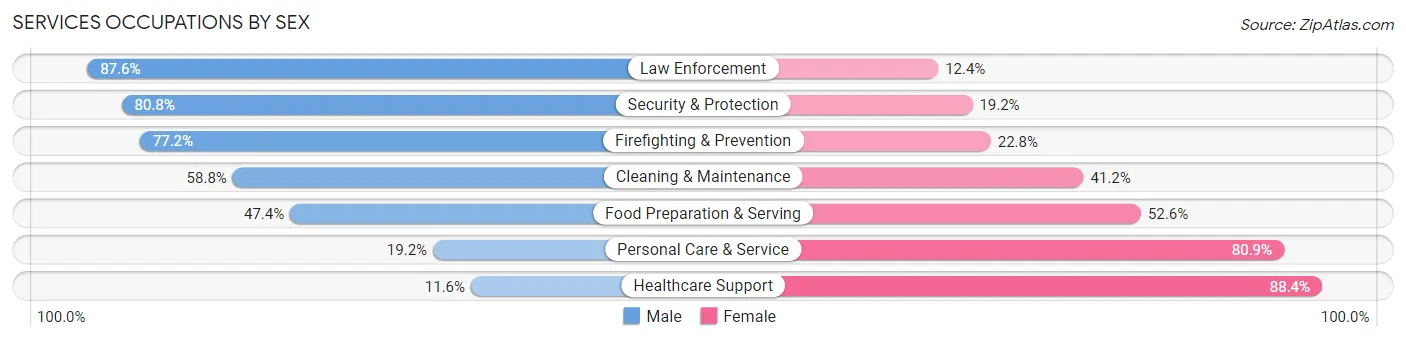
Within the Services occupations in Siskiyou County, the most male-oriented occupations are Law Enforcement (87.6%), Security & Protection (80.8%), and Firefighting & Prevention (77.2%), while the most female-oriented occupations are Healthcare Support (88.4%), Personal Care & Service (80.8%), and Food Preparation & Serving (52.6%).
| Occupation | Male | Female |
| Healthcare Support | 113 (11.6%) | 859 (88.4%) |
| Security & Protection | 615 (80.8%) | 146 (19.2%) |
| Firefighting & Prevention | 382 (77.2%) | 113 (22.8%) |
| Law Enforcement | 233 (87.6%) | 33 (12.4%) |
| Food Preparation & Serving | 510 (47.4%) | 565 (52.6%) |
| Cleaning & Maintenance | 521 (58.8%) | 365 (41.2%) |
| Personal Care & Service | 72 (19.2%) | 304 (80.8%) |
| Total (Category) | 1,831 (45.0%) | 2,239 (55.0%) |
| Total (Overall) | 8,635 (51.9%) | 7,988 (48.0%) |
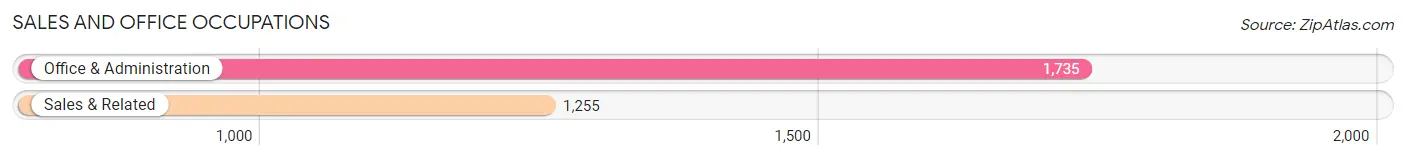
Sales and Office Occupations
The most common Sales and Office occupations in Siskiyou County are Office & Administration (1,735 | 10.4%), and Sales & Related (1,255 | 7.5%).
Sales and Office Occupations by Sex
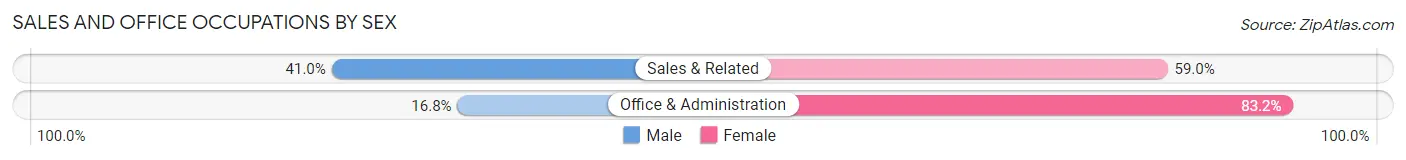
| Occupation | Male | Female |
| Sales & Related | 514 (41.0%) | 741 (59.0%) |
| Office & Administration | 291 (16.8%) | 1,444 (83.2%) |
| Total (Category) | 805 (26.9%) | 2,185 (73.1%) |
| Total (Overall) | 8,635 (51.9%) | 7,988 (48.0%) |
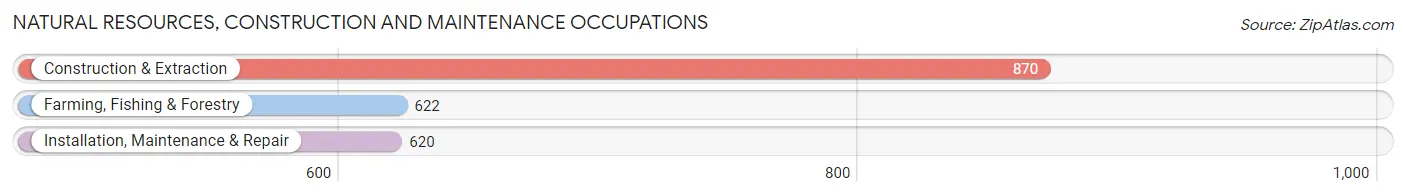
Natural Resources, Construction and Maintenance Occupations
The most common Natural Resources, Construction and Maintenance occupations in Siskiyou County are Construction & Extraction (870 | 5.2%), Farming, Fishing & Forestry (622 | 3.7%), and Installation, Maintenance & Repair (620 | 3.7%).
Natural Resources, Construction and Maintenance Occupations by Sex
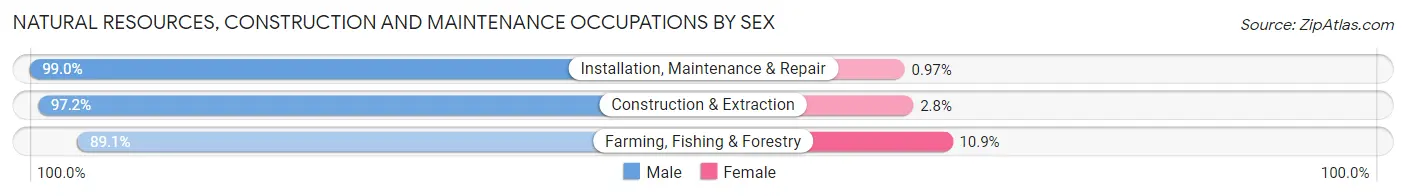
| Occupation | Male | Female |
| Farming, Fishing & Forestry | 554 (89.1%) | 68 (10.9%) |
| Construction & Extraction | 846 (97.2%) | 24 (2.8%) |
| Installation, Maintenance & Repair | 614 (99.0%) | 6 (1.0%) |
| Total (Category) | 2,014 (95.4%) | 98 (4.6%) |
| Total (Overall) | 8,635 (51.9%) | 7,988 (48.0%) |
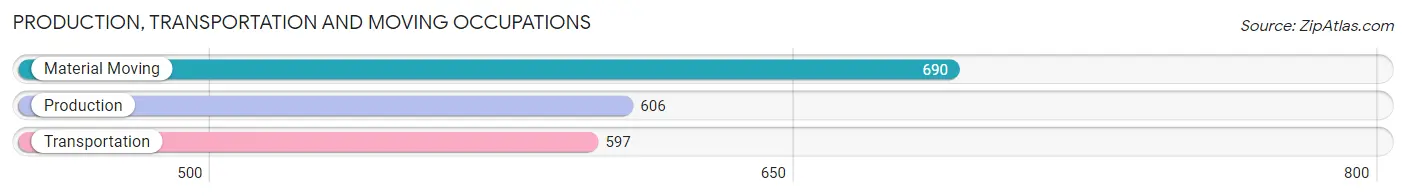
Production, Transportation and Moving Occupations
The most common Production, Transportation and Moving occupations in Siskiyou County are Material Moving (690 | 4.2%), Production (606 | 3.6%), and Transportation (597 | 3.6%).
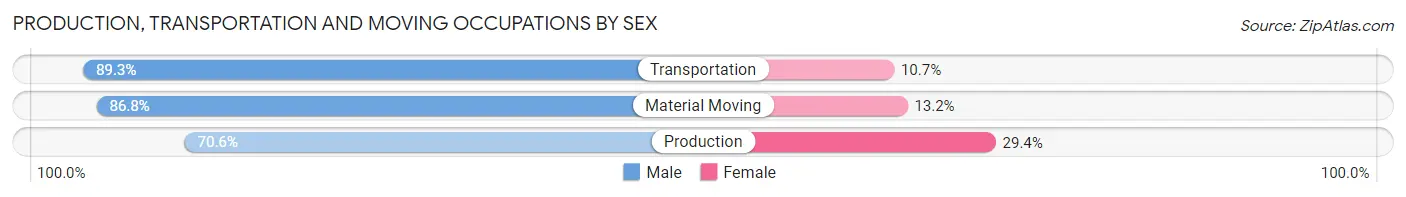
Production, Transportation and Moving Occupations by Sex
| Occupation | Male | Female |
| Production | 428 (70.6%) | 178 (29.4%) |
| Transportation | 533 (89.3%) | 64 (10.7%) |
| Material Moving | 599 (86.8%) | 91 (13.2%) |
| Total (Category) | 1,560 (82.4%) | 333 (17.6%) |
| Total (Overall) | 8,635 (51.9%) | 7,988 (48.0%) |
Employment Industries by Sex in Siskiyou County
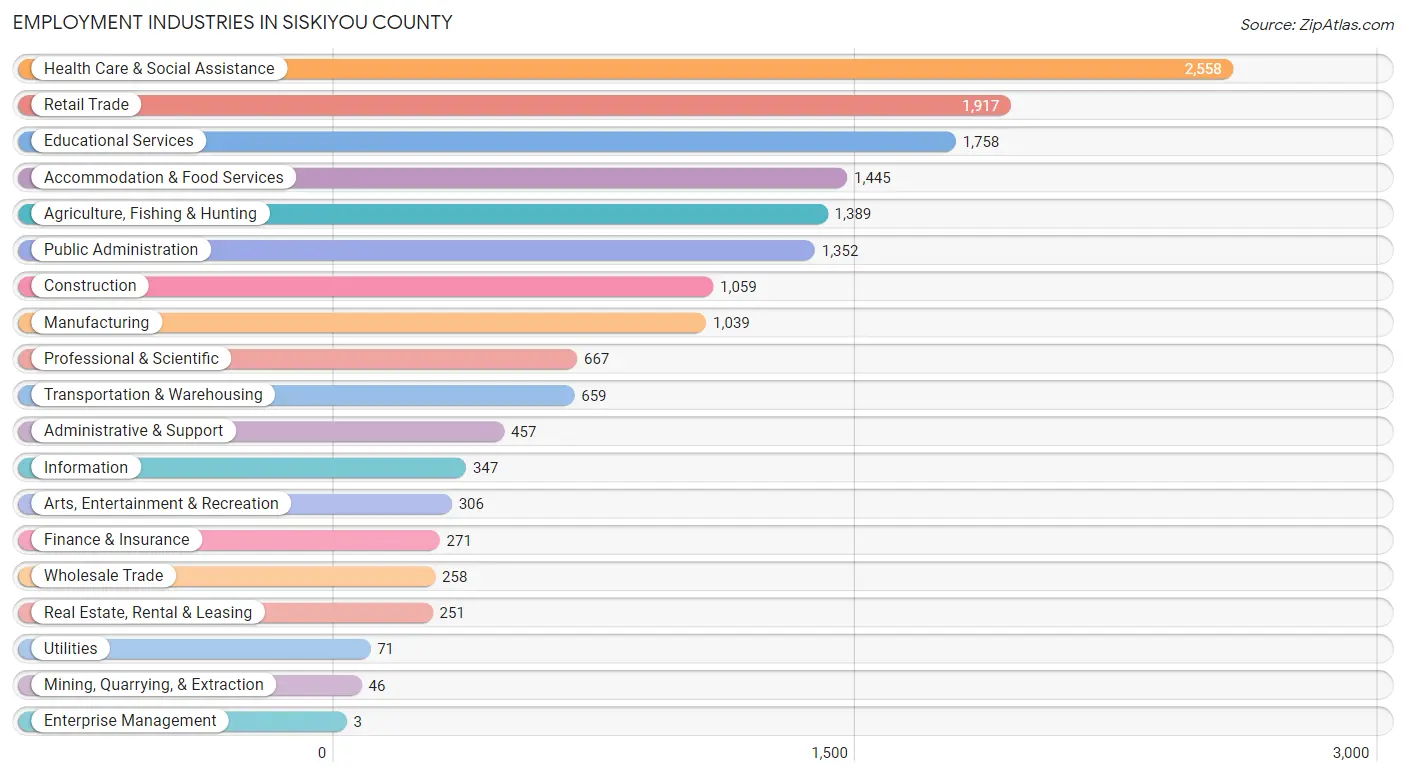
Employment Industries in Siskiyou County
The major employment industries in Siskiyou County include Health Care & Social Assistance (2,558 | 15.4%), Retail Trade (1,917 | 11.5%), Educational Services (1,758 | 10.6%), Accommodation & Food Services (1,445 | 8.7%), and Agriculture, Fishing & Hunting (1,389 | 8.4%).
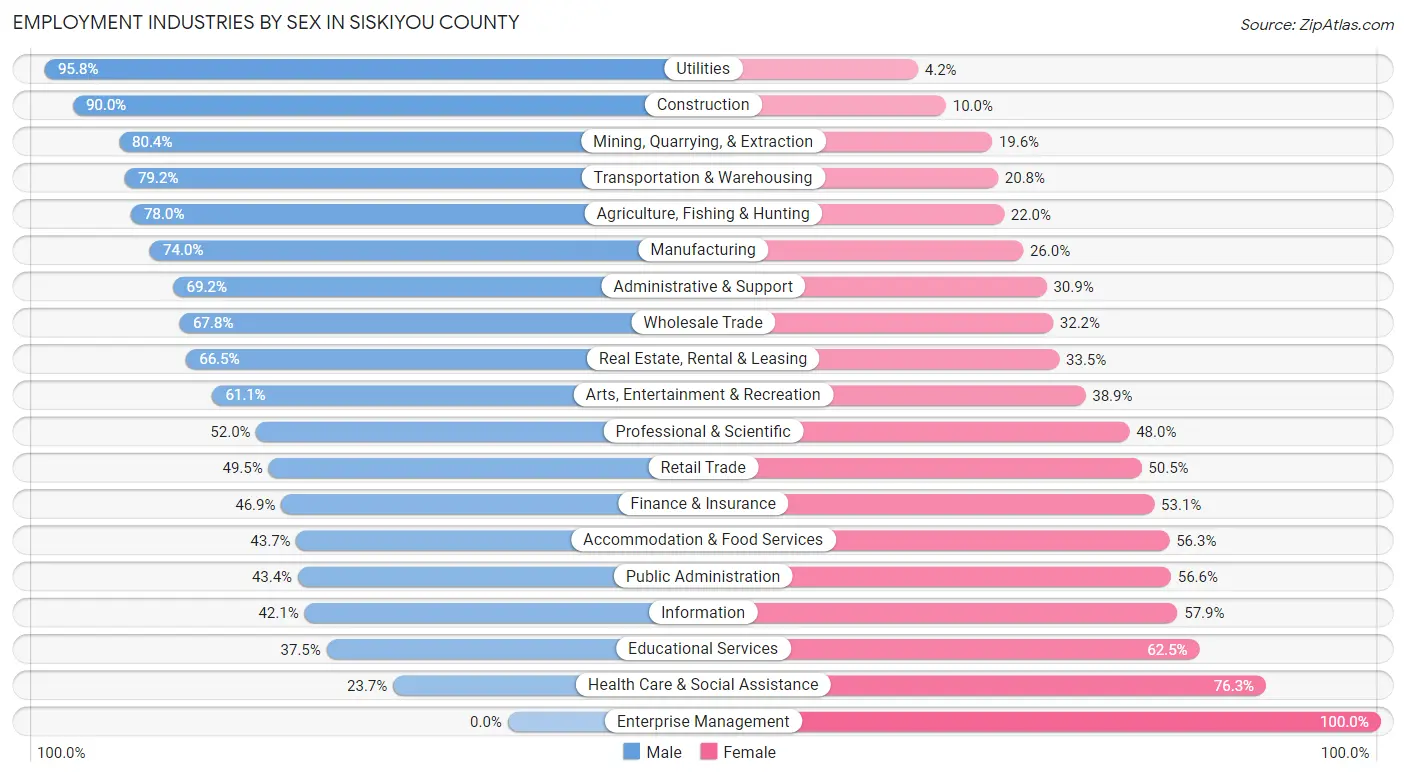
Employment Industries by Sex in Siskiyou County
The Siskiyou County industries that see more men than women are Utilities (95.8%), Construction (90.0%), and Mining, Quarrying, & Extraction (80.4%), whereas the industries that tend to have a higher number of women are Enterprise Management (100.0%), Health Care & Social Assistance (76.3%), and Educational Services (62.5%).
| Industry | Male | Female |
| Agriculture, Fishing & Hunting | 1,083 (78.0%) | 306 (22.0%) |
| Mining, Quarrying, & Extraction | 37 (80.4%) | 9 (19.6%) |
| Construction | 953 (90.0%) | 106 (10.0%) |
| Manufacturing | 769 (74.0%) | 270 (26.0%) |
| Wholesale Trade | 175 (67.8%) | 83 (32.2%) |
| Retail Trade | 949 (49.5%) | 968 (50.5%) |
| Transportation & Warehousing | 522 (79.2%) | 137 (20.8%) |
| Utilities | 68 (95.8%) | 3 (4.2%) |
| Information | 146 (42.1%) | 201 (57.9%) |
| Finance & Insurance | 127 (46.9%) | 144 (53.1%) |
| Real Estate, Rental & Leasing | 167 (66.5%) | 84 (33.5%) |
| Professional & Scientific | 347 (52.0%) | 320 (48.0%) |
| Enterprise Management | 0 (0.0%) | 3 (100.0%) |
| Administrative & Support | 316 (69.2%) | 141 (30.8%) |
| Educational Services | 659 (37.5%) | 1,099 (62.5%) |
| Health Care & Social Assistance | 607 (23.7%) | 1,951 (76.3%) |
| Arts, Entertainment & Recreation | 187 (61.1%) | 119 (38.9%) |
| Accommodation & Food Services | 632 (43.7%) | 813 (56.3%) |
| Public Administration | 587 (43.4%) | 765 (56.6%) |
| Total | 8,635 (51.9%) | 7,988 (48.0%) |
Education in Siskiyou County
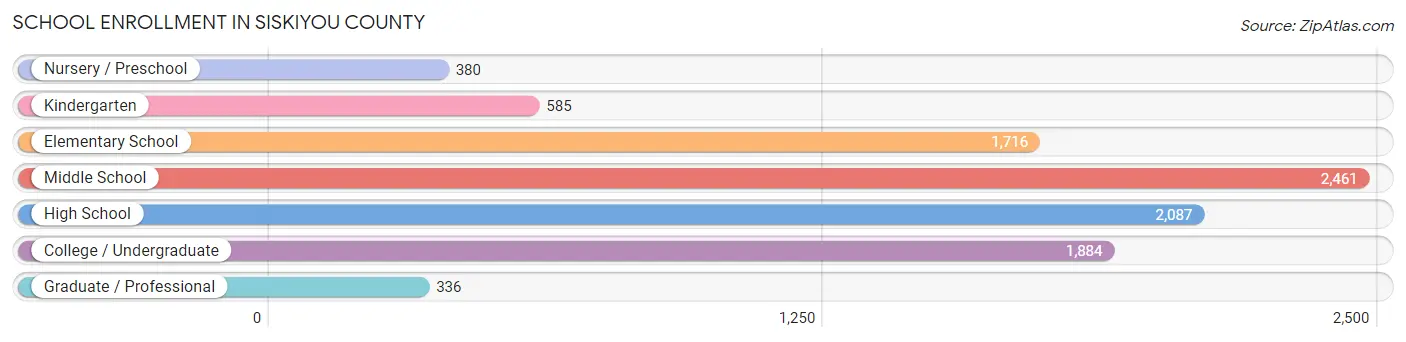
School Enrollment in Siskiyou County
The most common levels of schooling among the 9,449 students in Siskiyou County are middle school (2,461 | 26.1%), high school (2,087 | 22.1%), and college / undergraduate (1,884 | 19.9%).
| School Level | # Students | % Students |
| Nursery / Preschool | 380 | 4.0% |
| Kindergarten | 585 | 6.2% |
| Elementary School | 1,716 | 18.2% |
| Middle School | 2,461 | 26.1% |
| High School | 2,087 | 22.1% |
| College / Undergraduate | 1,884 | 19.9% |
| Graduate / Professional | 336 | 3.6% |
| Total | 9,449 | 100.0% |
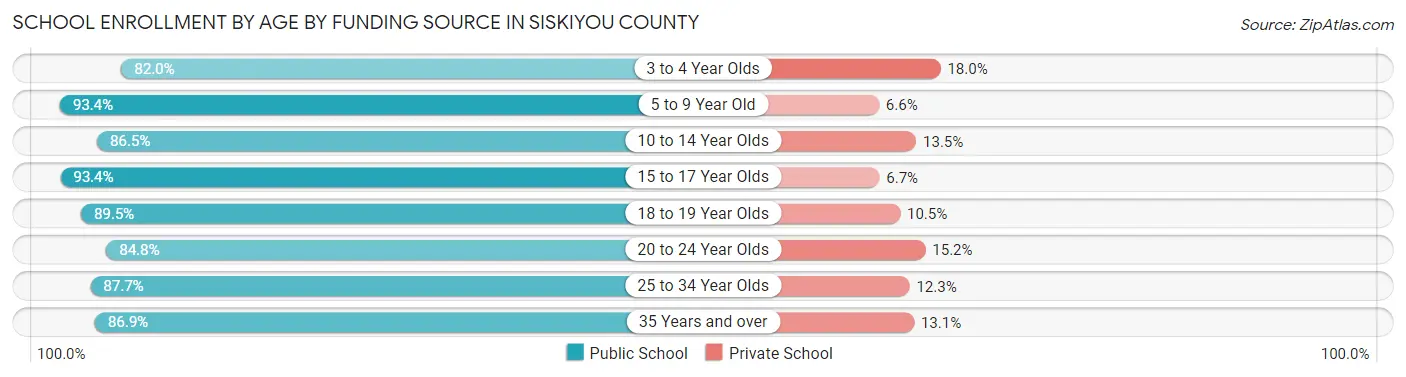
School Enrollment by Age by Funding Source in Siskiyou County
Out of a total of 9,449 students who are enrolled in schools in Siskiyou County, 1,020 (10.8%) attend a private institution, while the remaining 8,429 (89.2%) are enrolled in public schools. The age group of 3 to 4 year olds has the highest likelihood of being enrolled in private schools, with 66 (18.0% in the age bracket) enrolled. Conversely, the age group of 5 to 9 year old has the lowest likelihood of being enrolled in a private school, with 1,953 (93.4% in the age bracket) attending a public institution.
| Age Bracket | Public School | Private School |
| 3 to 4 Year Olds | 300 (82.0%) | 66 (18.0%) |
| 5 to 9 Year Old | 1,953 (93.4%) | 137 (6.6%) |
| 10 to 14 Year Olds | 2,545 (86.5%) | 397 (13.5%) |
| 15 to 17 Year Olds | 1,389 (93.3%) | 99 (6.7%) |
| 18 to 19 Year Olds | 665 (89.5%) | 78 (10.5%) |
| 20 to 24 Year Olds | 479 (84.8%) | 86 (15.2%) |
| 25 to 34 Year Olds | 465 (87.7%) | 65 (12.3%) |
| 35 Years and over | 630 (86.9%) | 95 (13.1%) |
| Total | 8,429 (89.2%) | 1,020 (10.8%) |
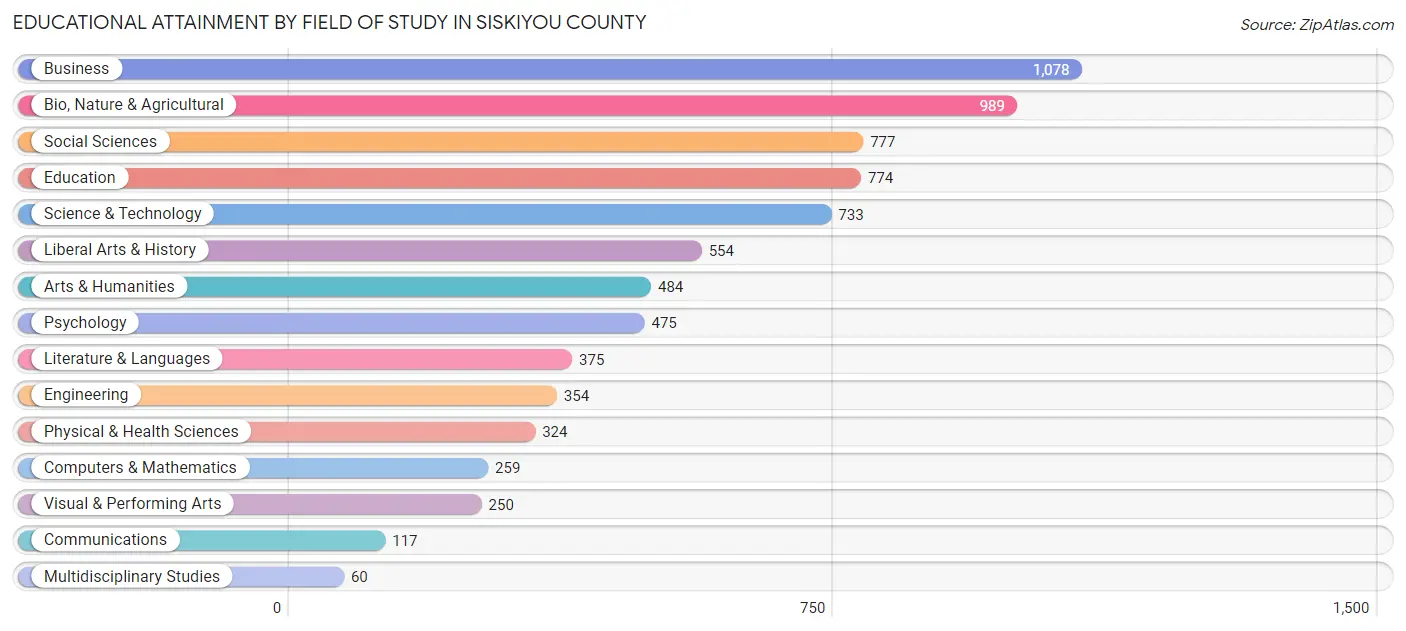
Educational Attainment by Field of Study in Siskiyou County
Business (1,078 | 14.2%), bio, nature & agricultural (989 | 13.0%), social sciences (777 | 10.2%), education (774 | 10.2%), and science & technology (733 | 9.6%) are the most common fields of study among 7,603 individuals in Siskiyou County who have obtained a bachelor's degree or higher.
| Field of Study | # Graduates | % Graduates |
| Computers & Mathematics | 259 | 3.4% |
| Bio, Nature & Agricultural | 989 | 13.0% |
| Physical & Health Sciences | 324 | 4.3% |
| Psychology | 475 | 6.2% |
| Social Sciences | 777 | 10.2% |
| Engineering | 354 | 4.7% |
| Multidisciplinary Studies | 60 | 0.8% |
| Science & Technology | 733 | 9.6% |
| Business | 1,078 | 14.2% |
| Education | 774 | 10.2% |
| Literature & Languages | 375 | 4.9% |
| Liberal Arts & History | 554 | 7.3% |
| Visual & Performing Arts | 250 | 3.3% |
| Communications | 117 | 1.5% |
| Arts & Humanities | 484 | 6.4% |
| Total | 7,603 | 100.0% |
Transportation & Commute in Siskiyou County
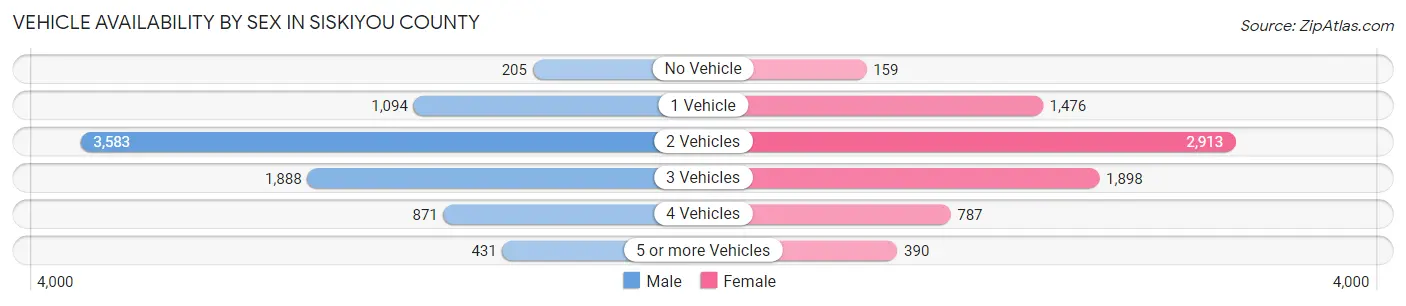
Vehicle Availability by Sex in Siskiyou County
The most prevalent vehicle ownership categories in Siskiyou County are males with 2 vehicles (3,583, accounting for 44.4%) and females with 2 vehicles (2,913, making up 47.0%).
| Vehicles Available | Male | Female |
| No Vehicle | 205 (2.5%) | 159 (2.1%) |
| 1 Vehicle | 1,094 (13.6%) | 1,476 (19.4%) |
| 2 Vehicles | 3,583 (44.4%) | 2,913 (38.2%) |
| 3 Vehicles | 1,888 (23.4%) | 1,898 (24.9%) |
| 4 Vehicles | 871 (10.8%) | 787 (10.3%) |
| 5 or more Vehicles | 431 (5.3%) | 390 (5.1%) |
| Total | 8,072 (100.0%) | 7,623 (100.0%) |
Commute Time in Siskiyou County
The most frequently occuring commute durations in Siskiyou County are 5 to 9 minutes (3,131 commuters, 21.7%), 15 to 19 minutes (2,111 commuters, 14.6%), and 10 to 14 minutes (2,043 commuters, 14.1%).
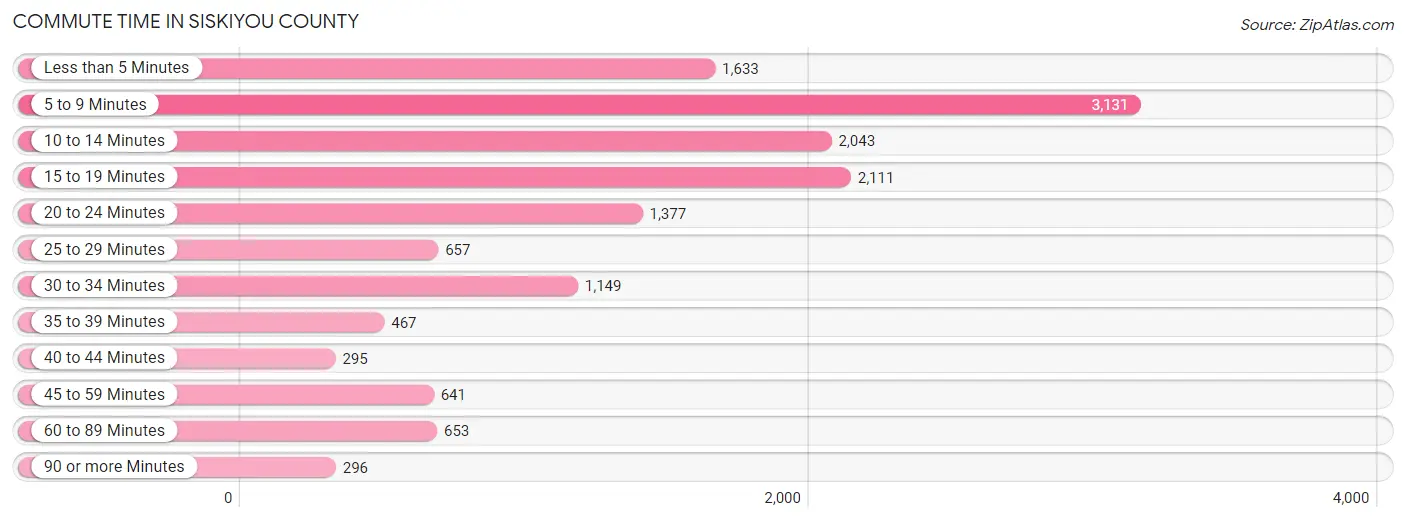
| Commute Time | # Commuters | % Commuters |
| Less than 5 Minutes | 1,633 | 11.3% |
| 5 to 9 Minutes | 3,131 | 21.7% |
| 10 to 14 Minutes | 2,043 | 14.1% |
| 15 to 19 Minutes | 2,111 | 14.6% |
| 20 to 24 Minutes | 1,377 | 9.5% |
| 25 to 29 Minutes | 657 | 4.5% |
| 30 to 34 Minutes | 1,149 | 8.0% |
| 35 to 39 Minutes | 467 | 3.2% |
| 40 to 44 Minutes | 295 | 2.0% |
| 45 to 59 Minutes | 641 | 4.4% |
| 60 to 89 Minutes | 653 | 4.5% |
| 90 or more Minutes | 296 | 2.1% |
Commute Time by Sex in Siskiyou County
The most common commute times in Siskiyou County are 5 to 9 minutes (1,344 commuters, 17.8%) for males and 5 to 9 minutes (1,787 commuters, 25.8%) for females.
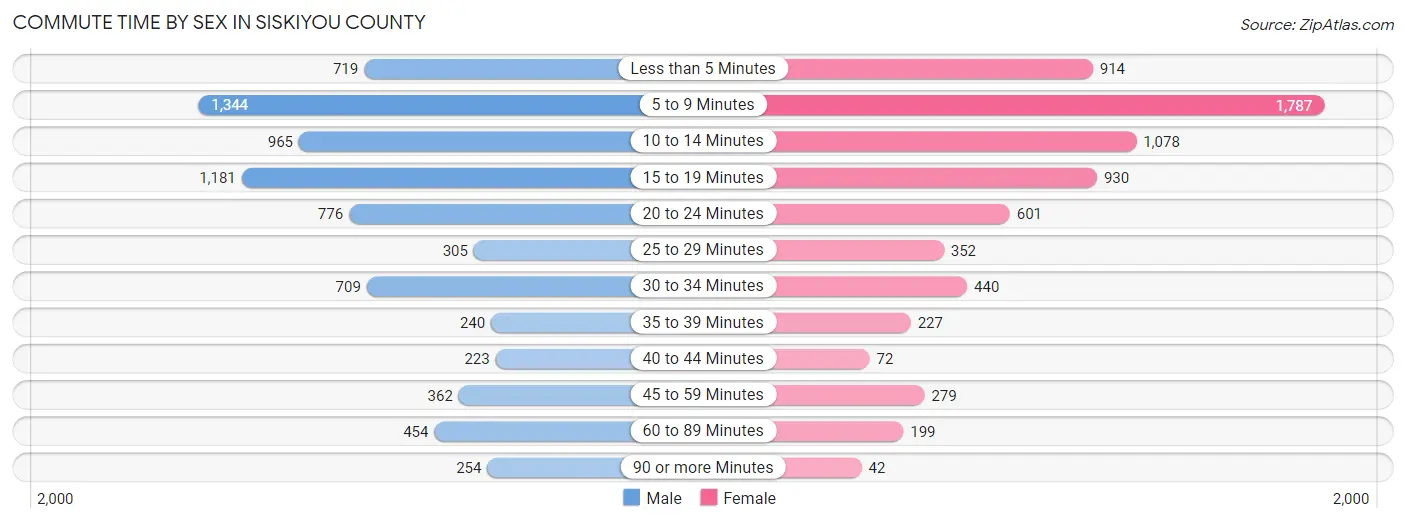
| Commute Time | Male | Female |
| Less than 5 Minutes | 719 (9.6%) | 914 (13.2%) |
| 5 to 9 Minutes | 1,344 (17.8%) | 1,787 (25.8%) |
| 10 to 14 Minutes | 965 (12.8%) | 1,078 (15.6%) |
| 15 to 19 Minutes | 1,181 (15.7%) | 930 (13.4%) |
| 20 to 24 Minutes | 776 (10.3%) | 601 (8.7%) |
| 25 to 29 Minutes | 305 (4.1%) | 352 (5.1%) |
| 30 to 34 Minutes | 709 (9.4%) | 440 (6.4%) |
| 35 to 39 Minutes | 240 (3.2%) | 227 (3.3%) |
| 40 to 44 Minutes | 223 (3.0%) | 72 (1.0%) |
| 45 to 59 Minutes | 362 (4.8%) | 279 (4.0%) |
| 60 to 89 Minutes | 454 (6.0%) | 199 (2.9%) |
| 90 or more Minutes | 254 (3.4%) | 42 (0.6%) |
Time of Departure to Work by Sex in Siskiyou County
The most frequent times of departure to work in Siskiyou County are 7:00 AM to 7:29 AM (1,167, 15.5%) for males and 7:30 AM to 7:59 AM (1,623, 23.4%) for females.
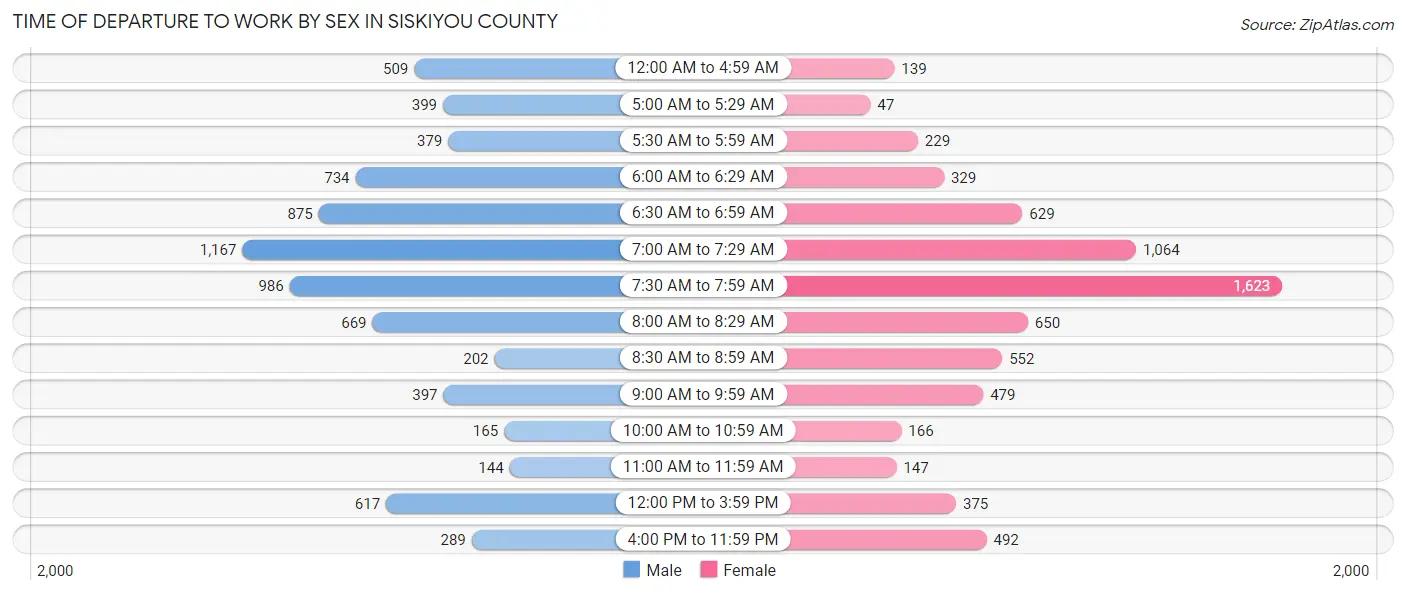
| Time of Departure | Male | Female |
| 12:00 AM to 4:59 AM | 509 (6.8%) | 139 (2.0%) |
| 5:00 AM to 5:29 AM | 399 (5.3%) | 47 (0.7%) |
| 5:30 AM to 5:59 AM | 379 (5.0%) | 229 (3.3%) |
| 6:00 AM to 6:29 AM | 734 (9.8%) | 329 (4.8%) |
| 6:30 AM to 6:59 AM | 875 (11.6%) | 629 (9.1%) |
| 7:00 AM to 7:29 AM | 1,167 (15.5%) | 1,064 (15.4%) |
| 7:30 AM to 7:59 AM | 986 (13.1%) | 1,623 (23.4%) |
| 8:00 AM to 8:29 AM | 669 (8.9%) | 650 (9.4%) |
| 8:30 AM to 8:59 AM | 202 (2.7%) | 552 (8.0%) |
| 9:00 AM to 9:59 AM | 397 (5.3%) | 479 (6.9%) |
| 10:00 AM to 10:59 AM | 165 (2.2%) | 166 (2.4%) |
| 11:00 AM to 11:59 AM | 144 (1.9%) | 147 (2.1%) |
| 12:00 PM to 3:59 PM | 617 (8.2%) | 375 (5.4%) |
| 4:00 PM to 11:59 PM | 289 (3.8%) | 492 (7.1%) |
| Total | 7,532 (100.0%) | 6,921 (100.0%) |
Housing Occupancy in Siskiyou County
Occupancy by Ownership in Siskiyou County
Of the total 18,768 dwellings in Siskiyou County, owner-occupied units account for 12,744 (67.9%), while renter-occupied units make up 6,024 (32.1%).
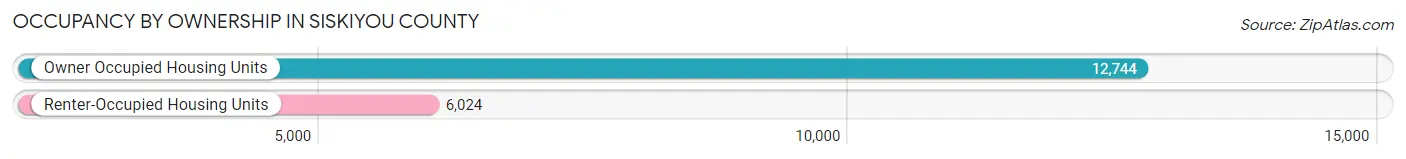
| Occupancy | # Housing Units | % Housing Units |
| Owner Occupied Housing Units | 12,744 | 67.9% |
| Renter-Occupied Housing Units | 6,024 | 32.1% |
| Total Occupied Housing Units | 18,768 | 100.0% |
Occupancy by Household Size in Siskiyou County
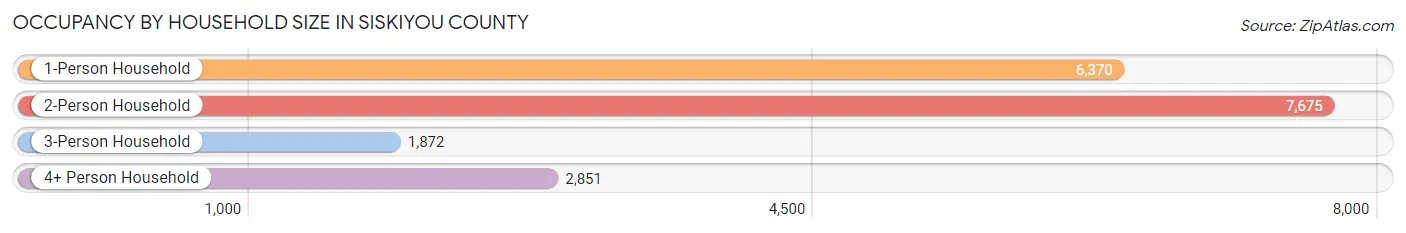
| Household Size | # Housing Units | % Housing Units |
| 1-Person Household | 6,370 | 33.9% |
| 2-Person Household | 7,675 | 40.9% |
| 3-Person Household | 1,872 | 10.0% |
| 4+ Person Household | 2,851 | 15.2% |
| Total Housing Units | 18,768 | 100.0% |
Occupancy by Ownership by Household Size in Siskiyou County
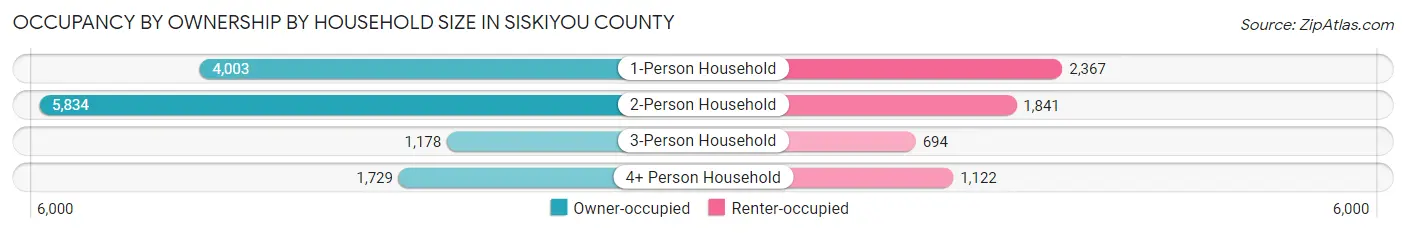
| Household Size | Owner-occupied | Renter-occupied |
| 1-Person Household | 4,003 (62.8%) | 2,367 (37.2%) |
| 2-Person Household | 5,834 (76.0%) | 1,841 (24.0%) |
| 3-Person Household | 1,178 (62.9%) | 694 (37.1%) |
| 4+ Person Household | 1,729 (60.7%) | 1,122 (39.4%) |
| Total Housing Units | 12,744 (67.9%) | 6,024 (32.1%) |
Occupancy by Educational Attainment in Siskiyou County
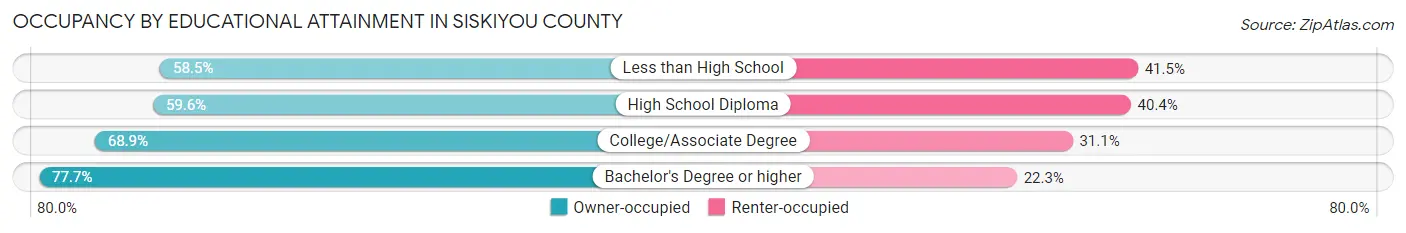
| Household Size | Owner-occupied | Renter-occupied |
| Less than High School | 808 (58.5%) | 573 (41.5%) |
| High School Diploma | 2,766 (59.6%) | 1,872 (40.4%) |
| College/Associate Degree | 5,733 (68.9%) | 2,593 (31.1%) |
| Bachelor's Degree or higher | 3,437 (77.7%) | 986 (22.3%) |
Occupancy by Age of Householder in Siskiyou County
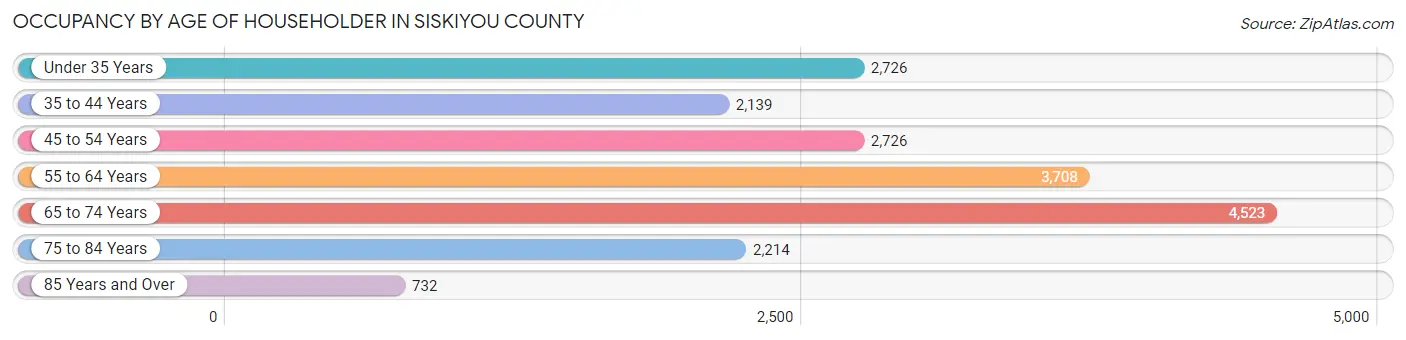
| Age Bracket | # Households | % Households |
| Under 35 Years | 2,726 | 14.5% |
| 35 to 44 Years | 2,139 | 11.4% |
| 45 to 54 Years | 2,726 | 14.5% |
| 55 to 64 Years | 3,708 | 19.8% |
| 65 to 74 Years | 4,523 | 24.1% |
| 75 to 84 Years | 2,214 | 11.8% |
| 85 Years and Over | 732 | 3.9% |
| Total | 18,768 | 100.0% |
Housing Finances in Siskiyou County
Median Income by Occupancy in Siskiyou County
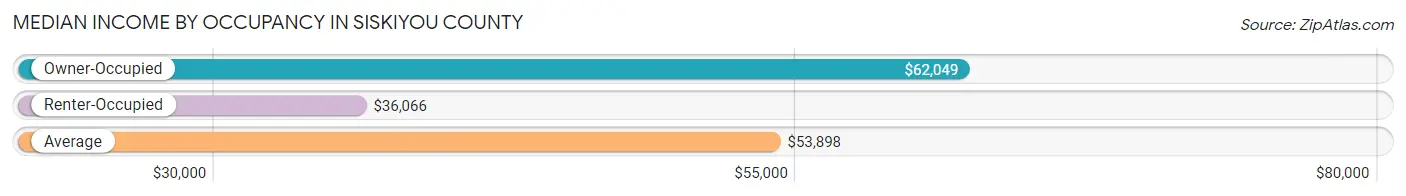
| Occupancy Type | # Households | Median Income |
| Owner-Occupied | 12,744 (67.9%) | $62,049 |
| Renter-Occupied | 6,024 (32.1%) | $36,066 |
| Average | 18,768 (100.0%) | $53,898 |
Occupancy by Householder Income Bracket in Siskiyou County
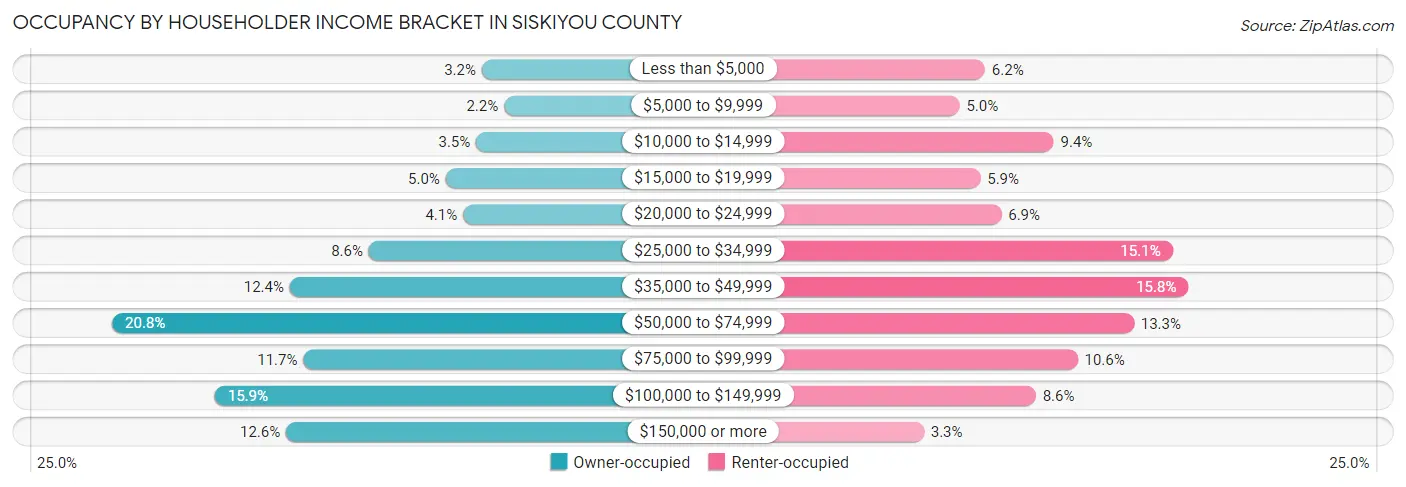
| Income Bracket | Owner-occupied | Renter-occupied |
| Less than $5,000 | 411 (3.2%) | 371 (6.2%) |
| $5,000 to $9,999 | 277 (2.2%) | 298 (5.0%) |
| $10,000 to $14,999 | 446 (3.5%) | 568 (9.4%) |
| $15,000 to $19,999 | 631 (5.0%) | 358 (5.9%) |
| $20,000 to $24,999 | 525 (4.1%) | 418 (6.9%) |
| $25,000 to $34,999 | 1,097 (8.6%) | 909 (15.1%) |
| $35,000 to $49,999 | 1,576 (12.4%) | 954 (15.8%) |
| $50,000 to $74,999 | 2,654 (20.8%) | 798 (13.3%) |
| $75,000 to $99,999 | 1,495 (11.7%) | 637 (10.6%) |
| $100,000 to $149,999 | 2,032 (15.9%) | 517 (8.6%) |
| $150,000 or more | 1,600 (12.6%) | 196 (3.3%) |
| Total | 12,744 (100.0%) | 6,024 (100.0%) |
Monthly Housing Cost Tiers in Siskiyou County
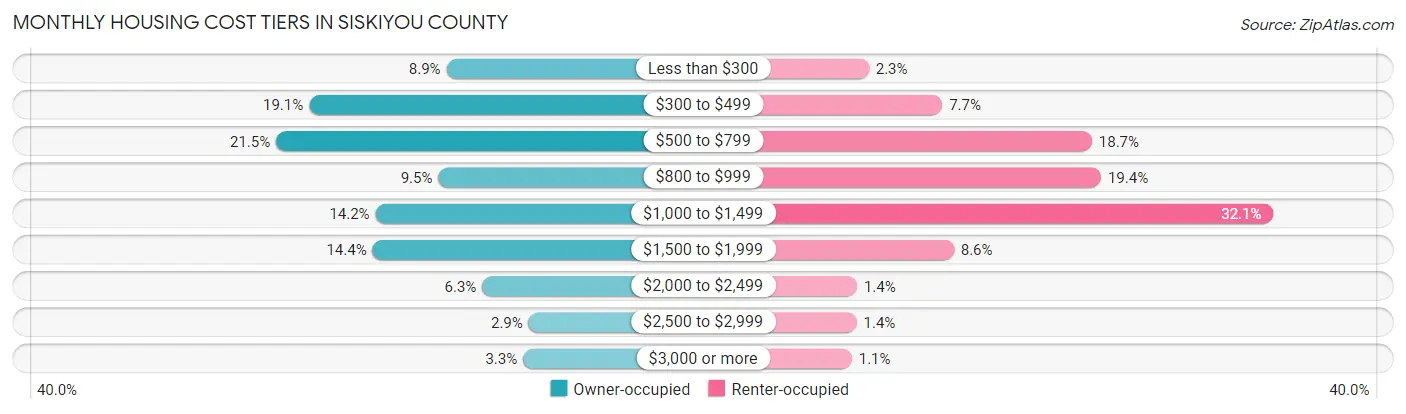
| Monthly Cost | Owner-occupied | Renter-occupied |
| Less than $300 | 1,138 (8.9%) | 139 (2.3%) |
| $300 to $499 | 2,428 (19.1%) | 465 (7.7%) |
| $500 to $799 | 2,738 (21.5%) | 1,129 (18.7%) |
| $800 to $999 | 1,214 (9.5%) | 1,169 (19.4%) |
| $1,000 to $1,499 | 1,805 (14.2%) | 1,934 (32.1%) |
| $1,500 to $1,999 | 1,832 (14.4%) | 516 (8.6%) |
| $2,000 to $2,499 | 803 (6.3%) | 87 (1.4%) |
| $2,500 to $2,999 | 367 (2.9%) | 85 (1.4%) |
| $3,000 or more | 419 (3.3%) | 64 (1.1%) |
| Total | 12,744 (100.0%) | 6,024 (100.0%) |
Physical Housing Characteristics in Siskiyou County
Housing Structures in Siskiyou County
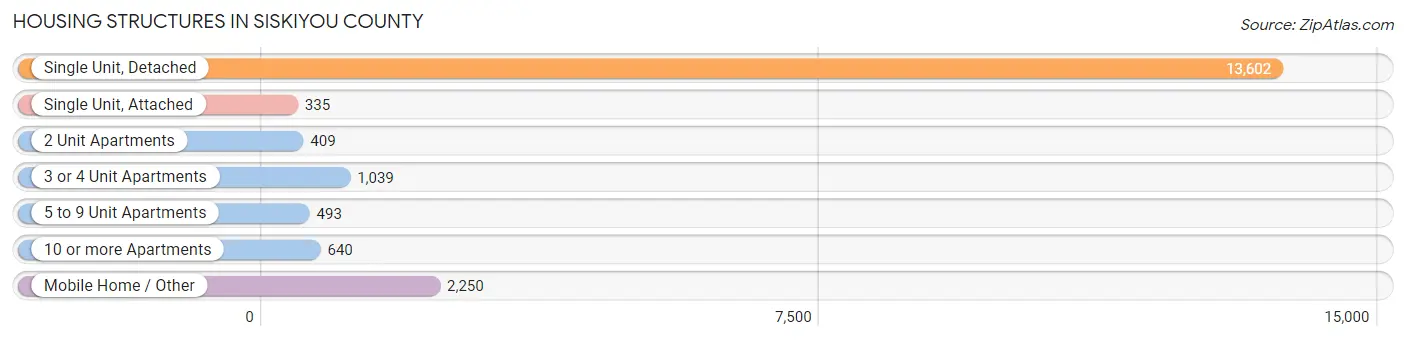
| Structure Type | # Housing Units | % Housing Units |
| Single Unit, Detached | 13,602 | 72.5% |
| Single Unit, Attached | 335 | 1.8% |
| 2 Unit Apartments | 409 | 2.2% |
| 3 or 4 Unit Apartments | 1,039 | 5.5% |
| 5 to 9 Unit Apartments | 493 | 2.6% |
| 10 or more Apartments | 640 | 3.4% |
| Mobile Home / Other | 2,250 | 12.0% |
| Total | 18,768 | 100.0% |
Housing Structures by Occupancy in Siskiyou County
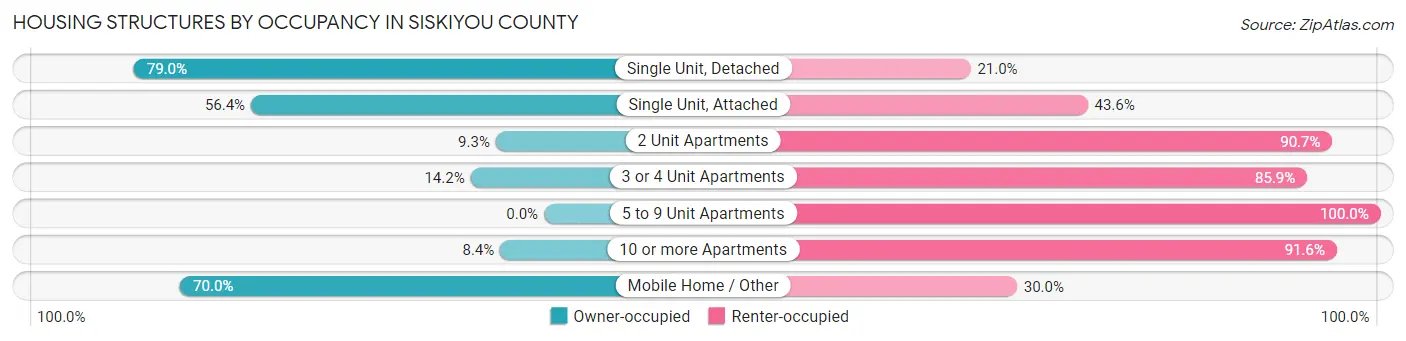
| Structure Type | Owner-occupied | Renter-occupied |
| Single Unit, Detached | 10,740 (79.0%) | 2,862 (21.0%) |
| Single Unit, Attached | 189 (56.4%) | 146 (43.6%) |
| 2 Unit Apartments | 38 (9.3%) | 371 (90.7%) |
| 3 or 4 Unit Apartments | 147 (14.1%) | 892 (85.9%) |
| 5 to 9 Unit Apartments | 0 (0.0%) | 493 (100.0%) |
| 10 or more Apartments | 54 (8.4%) | 586 (91.6%) |
| Mobile Home / Other | 1,576 (70.0%) | 674 (30.0%) |
| Total | 12,744 (67.9%) | 6,024 (32.1%) |
Housing Structures by Number of Rooms in Siskiyou County
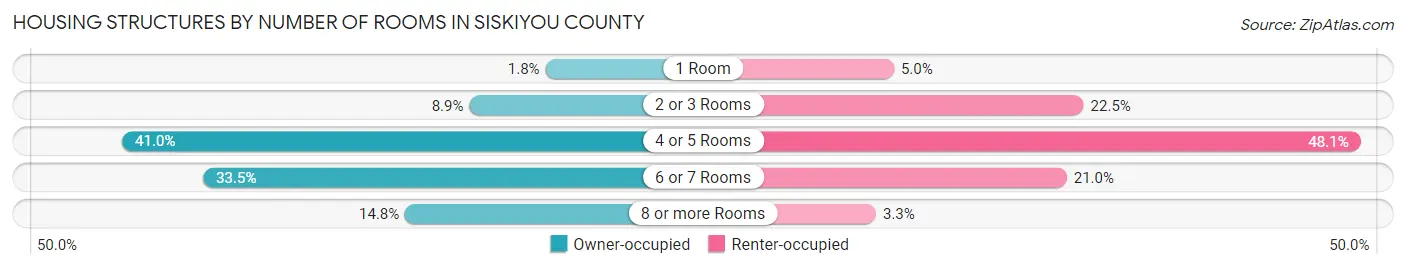
| Number of Rooms | Owner-occupied | Renter-occupied |
| 1 Room | 233 (1.8%) | 301 (5.0%) |
| 2 or 3 Rooms | 1,131 (8.9%) | 1,358 (22.5%) |
| 4 or 5 Rooms | 5,223 (41.0%) | 2,900 (48.1%) |
| 6 or 7 Rooms | 4,269 (33.5%) | 1,264 (21.0%) |
| 8 or more Rooms | 1,888 (14.8%) | 201 (3.3%) |
| Total | 12,744 (100.0%) | 6,024 (100.0%) |
Housing Structure by Heating Type in Siskiyou County
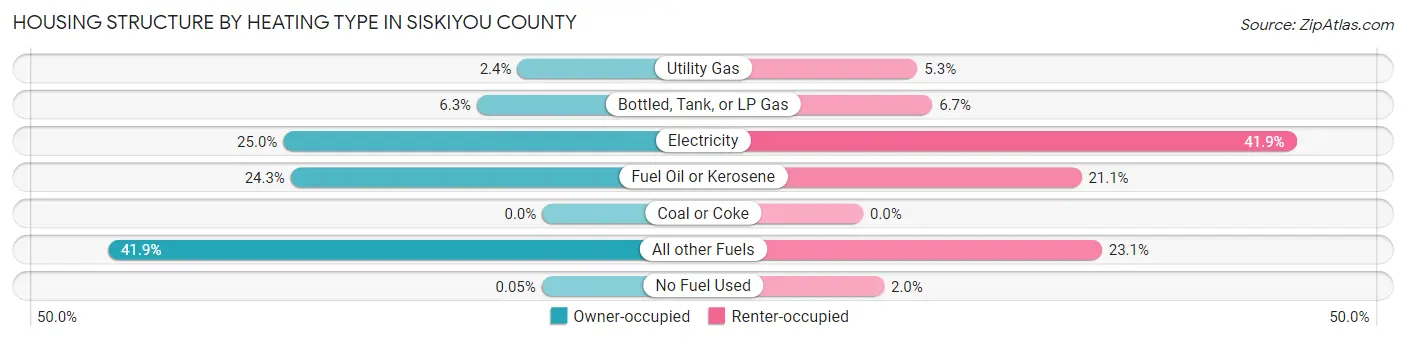
| Heating Type | Owner-occupied | Renter-occupied |
| Utility Gas | 306 (2.4%) | 316 (5.2%) |
| Bottled, Tank, or LP Gas | 803 (6.3%) | 403 (6.7%) |
| Electricity | 3,188 (25.0%) | 2,522 (41.9%) |
| Fuel Oil or Kerosene | 3,095 (24.3%) | 1,271 (21.1%) |
| Coal or Coke | 0 (0.0%) | 0 (0.0%) |
| All other Fuels | 5,345 (41.9%) | 1,390 (23.1%) |
| No Fuel Used | 7 (0.1%) | 122 (2.0%) |
| Total | 12,744 (100.0%) | 6,024 (100.0%) |
Household Vehicle Usage in Siskiyou County
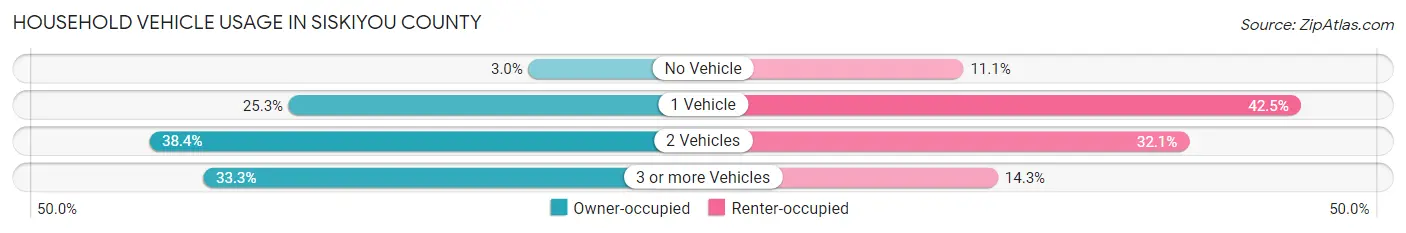
| Vehicles per Household | Owner-occupied | Renter-occupied |
| No Vehicle | 376 (2.9%) | 667 (11.1%) |
| 1 Vehicle | 3,228 (25.3%) | 2,562 (42.5%) |
| 2 Vehicles | 4,891 (38.4%) | 1,935 (32.1%) |
| 3 or more Vehicles | 4,249 (33.3%) | 860 (14.3%) |
| Total | 12,744 (100.0%) | 6,024 (100.0%) |
Real Estate & Mortgages in Siskiyou County
Real Estate and Mortgage Overview in Siskiyou County
| Characteristic | Without Mortgage | With Mortgage |
| Housing Units | 6,837 | 5,907 |
| Median Property Value | $236,600 | $287,600 |
| Median Household Income | $49,682 | $970 |
| Monthly Housing Costs | $492 | $407 |
| Real Estate Taxes | $1,462 | $113 |
Property Value by Mortgage Status in Siskiyou County
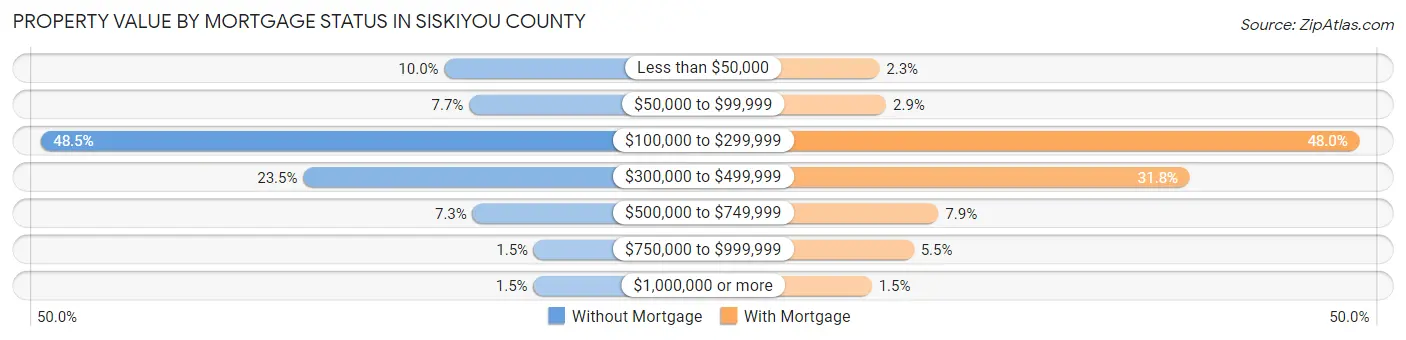
| Property Value | Without Mortgage | With Mortgage |
| Less than $50,000 | 685 (10.0%) | 134 (2.3%) |
| $50,000 to $99,999 | 524 (7.7%) | 172 (2.9%) |
| $100,000 to $299,999 | 3,316 (48.5%) | 2,836 (48.0%) |
| $300,000 to $499,999 | 1,604 (23.5%) | 1,881 (31.8%) |
| $500,000 to $749,999 | 501 (7.3%) | 466 (7.9%) |
| $750,000 to $999,999 | 102 (1.5%) | 327 (5.5%) |
| $1,000,000 or more | 105 (1.5%) | 91 (1.5%) |
| Total | 6,837 (100.0%) | 5,907 (100.0%) |
Household Income by Mortgage Status in Siskiyou County
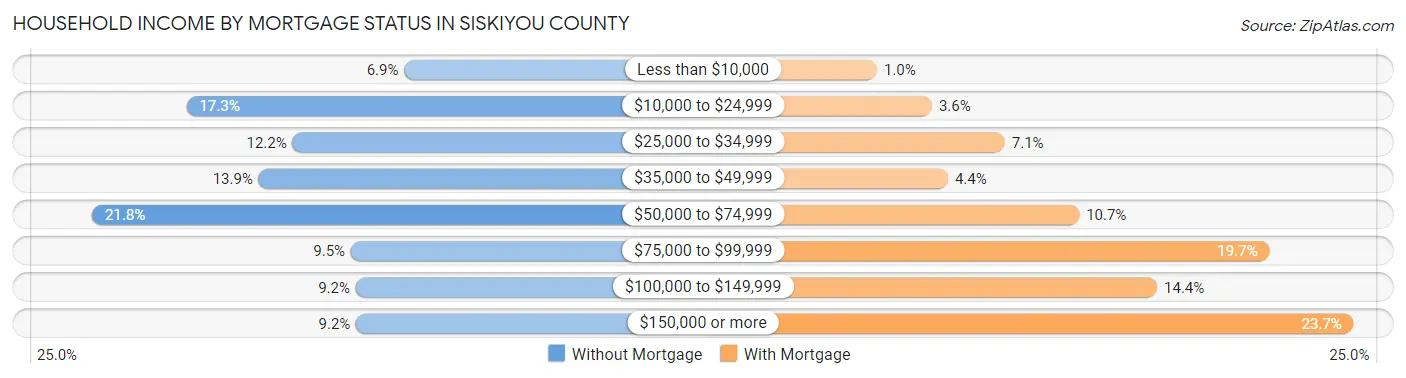
| Household Income | Without Mortgage | With Mortgage |
| Less than $10,000 | 473 (6.9%) | 60 (1.0%) |
| $10,000 to $24,999 | 1,182 (17.3%) | 215 (3.6%) |
| $25,000 to $34,999 | 837 (12.2%) | 420 (7.1%) |
| $35,000 to $49,999 | 947 (13.9%) | 260 (4.4%) |
| $50,000 to $74,999 | 1,490 (21.8%) | 629 (10.6%) |
| $75,000 to $99,999 | 647 (9.5%) | 1,164 (19.7%) |
| $100,000 to $149,999 | 631 (9.2%) | 848 (14.4%) |
| $150,000 or more | 630 (9.2%) | 1,401 (23.7%) |
| Total | 6,837 (100.0%) | 5,907 (100.0%) |
Property Value to Household Income Ratio in Siskiyou County
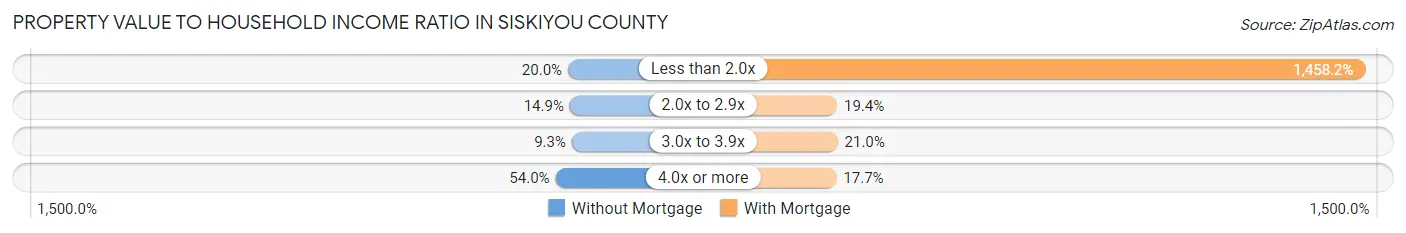
| Value-to-Income Ratio | Without Mortgage | With Mortgage |
| Less than 2.0x | 1,364 (20.0%) | 86,138 (1,458.2%) |
| 2.0x to 2.9x | 1,021 (14.9%) | 1,144 (19.4%) |
| 3.0x to 3.9x | 636 (9.3%) | 1,241 (21.0%) |
| 4.0x or more | 3,695 (54.0%) | 1,047 (17.7%) |
| Total | 6,837 (100.0%) | 5,907 (100.0%) |
Real Estate Taxes by Mortgage Status in Siskiyou County
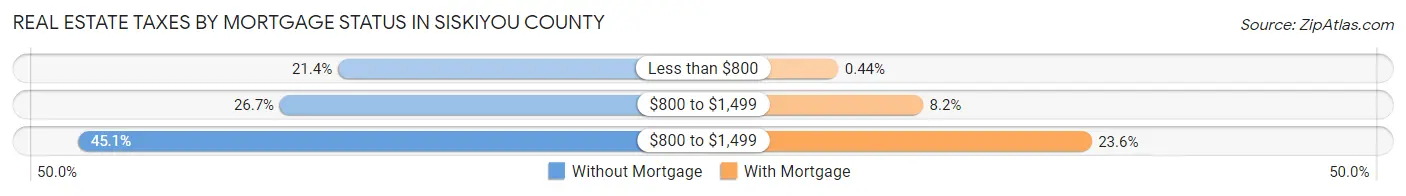
| Property Taxes | Without Mortgage | With Mortgage |
| Less than $800 | 1,462 (21.4%) | 26 (0.4%) |
| $800 to $1,499 | 1,824 (26.7%) | 483 (8.2%) |
| $800 to $1,499 | 3,086 (45.1%) | 1,393 (23.6%) |
| Total | 6,837 (100.0%) | 5,907 (100.0%) |
Health & Disability in Siskiyou County
Health Insurance Coverage by Age in Siskiyou County
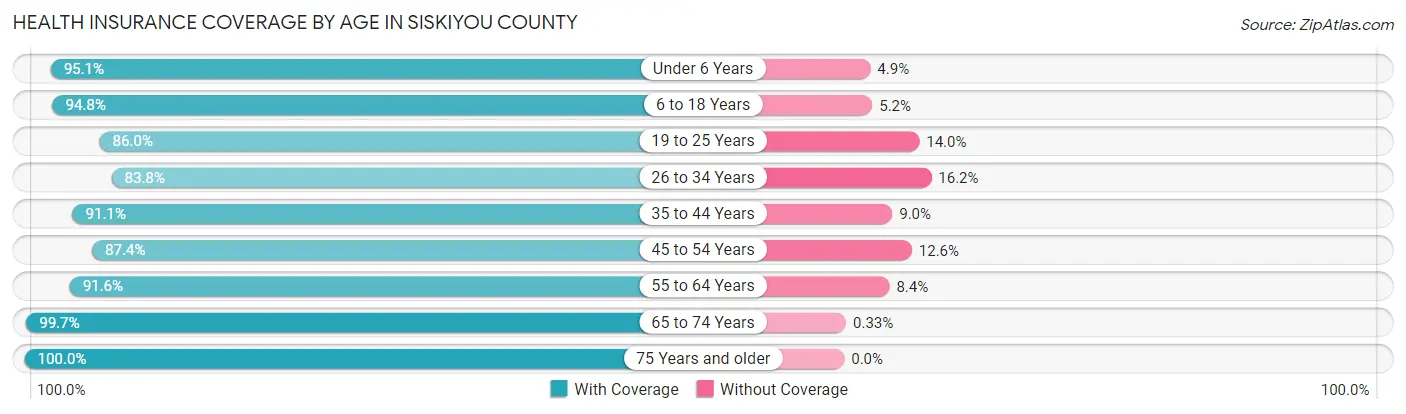
| Age Bracket | With Coverage | Without Coverage |
| Under 6 Years | 2,481 (95.1%) | 127 (4.9%) |
| 6 to 18 Years | 6,644 (94.8%) | 366 (5.2%) |
| 19 to 25 Years | 2,239 (86.0%) | 364 (14.0%) |
| 26 to 34 Years | 3,339 (83.8%) | 647 (16.2%) |
| 35 to 44 Years | 4,301 (91.0%) | 423 (8.9%) |
| 45 to 54 Years | 4,113 (87.4%) | 593 (12.6%) |
| 55 to 64 Years | 6,156 (91.6%) | 566 (8.4%) |
| 65 to 74 Years | 7,196 (99.7%) | 24 (0.3%) |
| 75 Years and older | 4,300 (100.0%) | 0 (0.0%) |
| Total | 40,769 (92.9%) | 3,110 (7.1%) |
Health Insurance Coverage by Citizenship Status in Siskiyou County
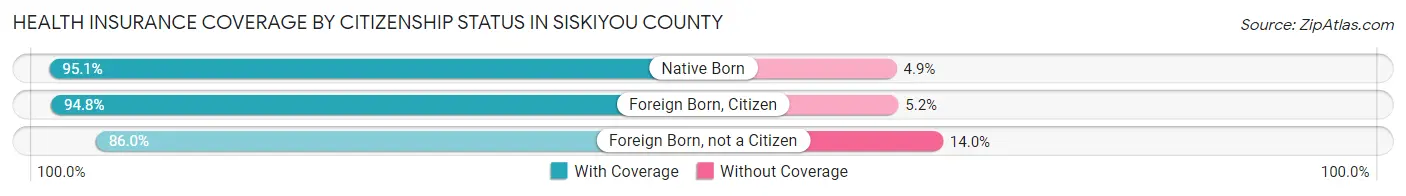
| Citizenship Status | With Coverage | Without Coverage |
| Native Born | 2,481 (95.1%) | 127 (4.9%) |
| Foreign Born, Citizen | 6,644 (94.8%) | 366 (5.2%) |
| Foreign Born, not a Citizen | 2,239 (86.0%) | 364 (14.0%) |
Health Insurance Coverage by Household Income in Siskiyou County
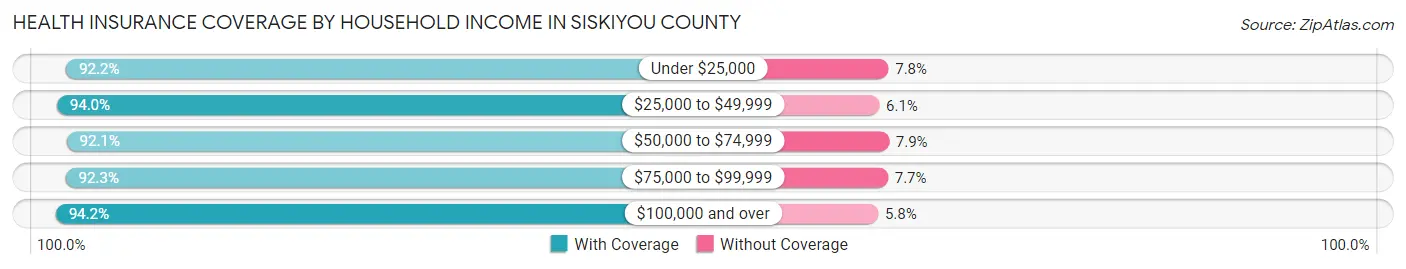
| Household Income | With Coverage | Without Coverage |
| Under $25,000 | 6,307 (92.2%) | 531 (7.8%) |
| $25,000 to $49,999 | 8,955 (94.0%) | 577 (6.0%) |
| $50,000 to $74,999 | 7,826 (92.1%) | 669 (7.9%) |
| $75,000 to $99,999 | 5,232 (92.3%) | 435 (7.7%) |
| $100,000 and over | 11,953 (94.2%) | 742 (5.8%) |
Public vs Private Health Insurance Coverage by Age in Siskiyou County
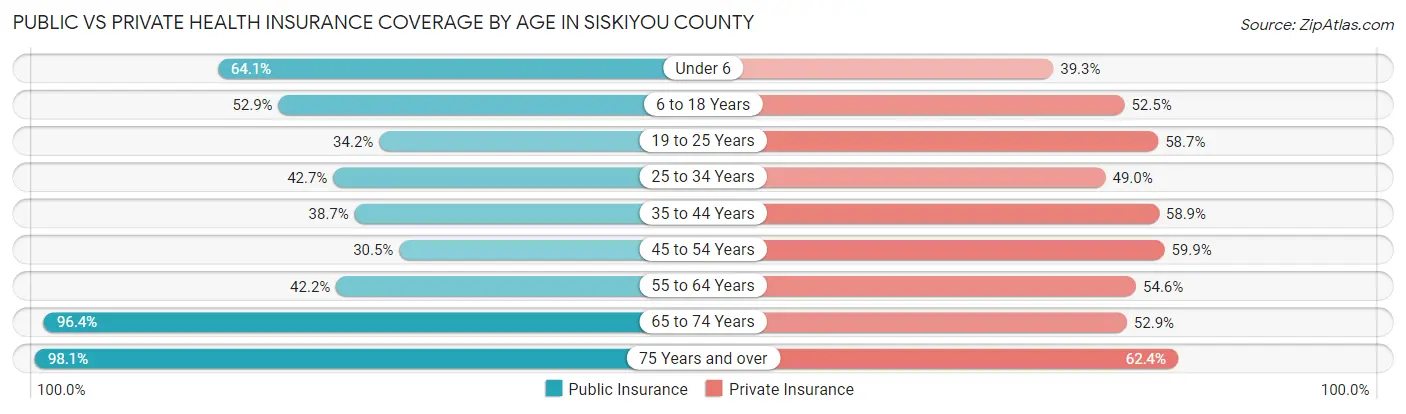
| Age Bracket | Public Insurance | Private Insurance |
| Under 6 | 1,672 (64.1%) | 1,024 (39.3%) |
| 6 to 18 Years | 3,707 (52.9%) | 3,678 (52.5%) |
| 19 to 25 Years | 890 (34.2%) | 1,529 (58.7%) |
| 25 to 34 Years | 1,703 (42.7%) | 1,951 (48.9%) |
| 35 to 44 Years | 1,830 (38.7%) | 2,780 (58.9%) |
| 45 to 54 Years | 1,434 (30.5%) | 2,819 (59.9%) |
| 55 to 64 Years | 2,835 (42.2%) | 3,672 (54.6%) |
| 65 to 74 Years | 6,961 (96.4%) | 3,821 (52.9%) |
| 75 Years and over | 4,218 (98.1%) | 2,682 (62.4%) |
| Total | 25,250 (57.5%) | 23,956 (54.6%) |
Disability Status by Sex by Age in Siskiyou County
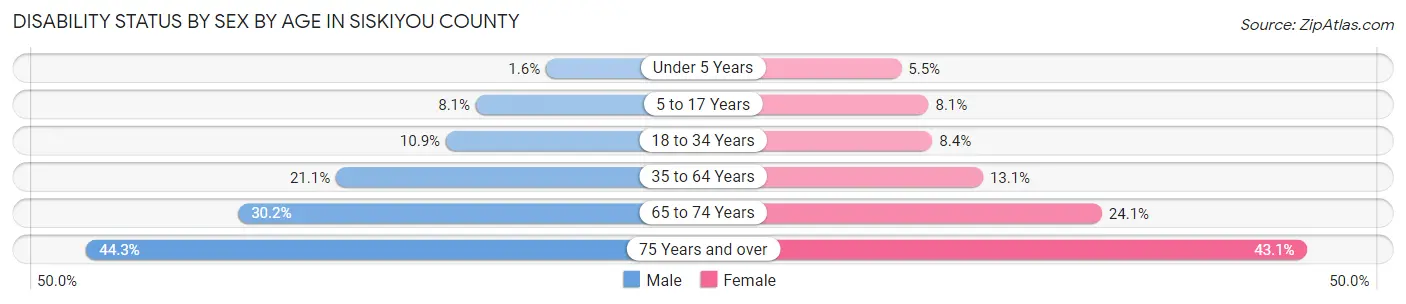
| Age Bracket | Male | Female |
| Under 5 Years | 18 (1.6%) | 57 (5.5%) |
| 5 to 17 Years | 283 (8.1%) | 260 (8.1%) |
| 18 to 34 Years | 413 (10.9%) | 299 (8.4%) |
| 35 to 64 Years | 1,685 (21.1%) | 1,070 (13.1%) |
| 65 to 74 Years | 1,066 (30.2%) | 890 (24.1%) |
| 75 Years and over | 886 (44.3%) | 991 (43.1%) |
Disability Class by Sex by Age in Siskiyou County
Disability Class: Hearing Difficulty
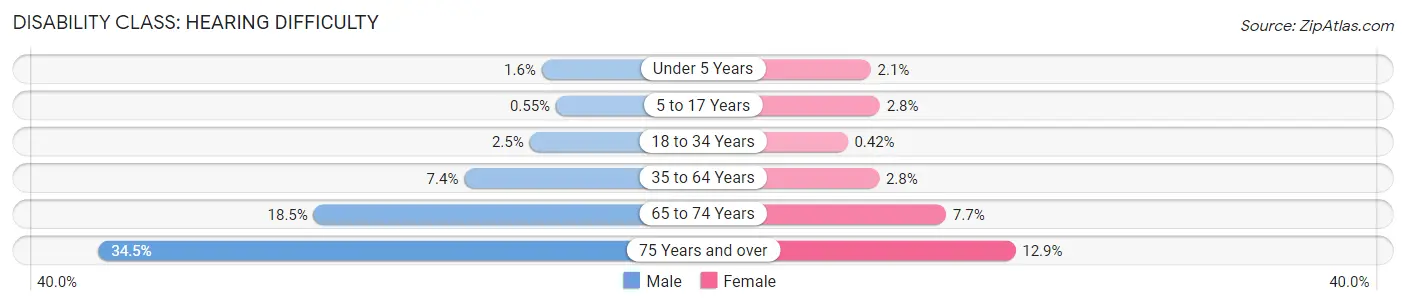
| Age Bracket | Male | Female |
| Under 5 Years | 18 (1.6%) | 22 (2.1%) |
| 5 to 17 Years | 19 (0.5%) | 91 (2.8%) |
| 18 to 34 Years | 95 (2.5%) | 15 (0.4%) |
| 35 to 64 Years | 588 (7.4%) | 225 (2.8%) |
| 65 to 74 Years | 655 (18.5%) | 285 (7.7%) |
| 75 Years and over | 691 (34.5%) | 296 (12.9%) |
Disability Class: Vision Difficulty
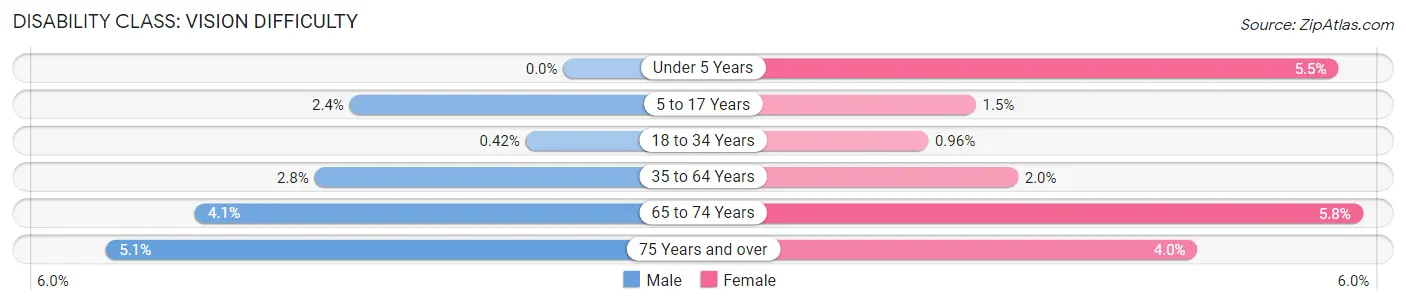
| Age Bracket | Male | Female |
| Under 5 Years | 0 (0.0%) | 57 (5.5%) |
| 5 to 17 Years | 83 (2.4%) | 48 (1.5%) |
| 18 to 34 Years | 16 (0.4%) | 34 (1.0%) |
| 35 to 64 Years | 221 (2.8%) | 160 (2.0%) |
| 65 to 74 Years | 145 (4.1%) | 214 (5.8%) |
| 75 Years and over | 102 (5.1%) | 91 (4.0%) |
Disability Class: Cognitive Difficulty
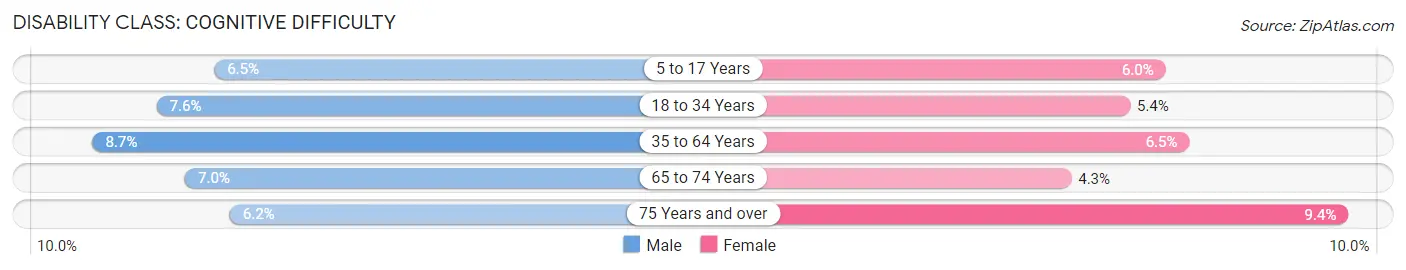
| Age Bracket | Male | Female |
| 5 to 17 Years | 226 (6.5%) | 194 (6.0%) |
| 18 to 34 Years | 286 (7.5%) | 190 (5.3%) |
| 35 to 64 Years | 698 (8.7%) | 527 (6.5%) |
| 65 to 74 Years | 248 (7.0%) | 157 (4.3%) |
| 75 Years and over | 124 (6.2%) | 216 (9.4%) |
Disability Class: Ambulatory Difficulty
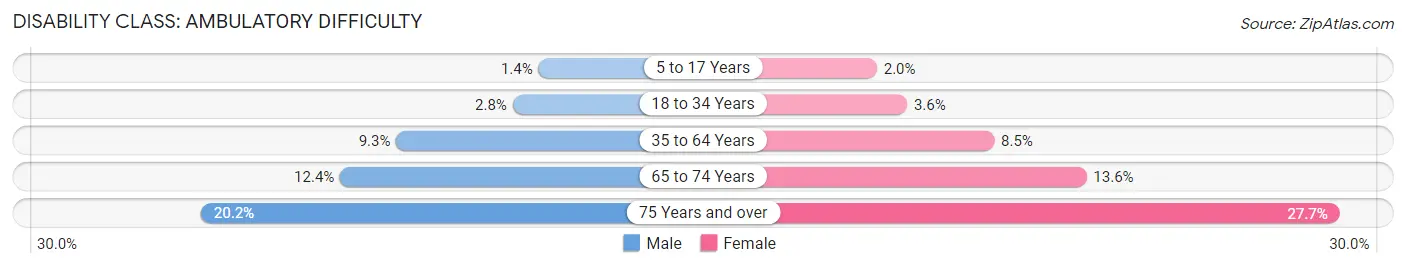
| Age Bracket | Male | Female |
| 5 to 17 Years | 48 (1.4%) | 63 (1.9%) |
| 18 to 34 Years | 107 (2.8%) | 129 (3.6%) |
| 35 to 64 Years | 743 (9.3%) | 692 (8.5%) |
| 65 to 74 Years | 439 (12.4%) | 502 (13.6%) |
| 75 Years and over | 404 (20.2%) | 637 (27.7%) |
Disability Class: Self-Care Difficulty
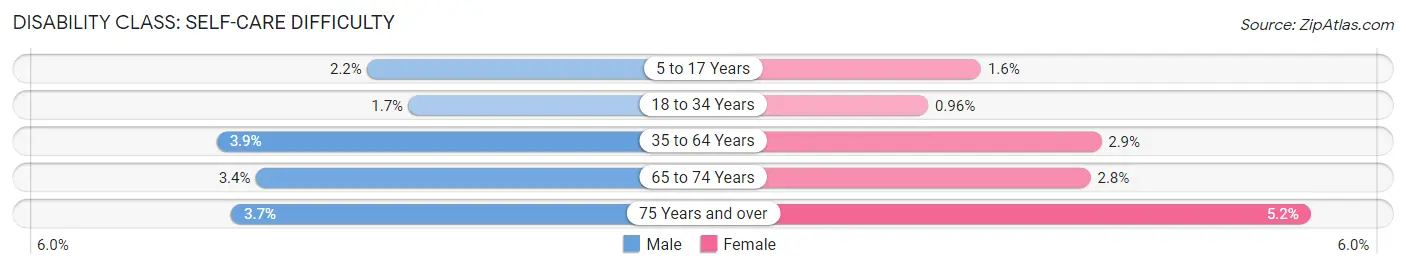
| Age Bracket | Male | Female |
| 5 to 17 Years | 76 (2.2%) | 50 (1.5%) |
| 18 to 34 Years | 65 (1.7%) | 34 (1.0%) |
| 35 to 64 Years | 308 (3.9%) | 236 (2.9%) |
| 65 to 74 Years | 121 (3.4%) | 102 (2.8%) |
| 75 Years and over | 74 (3.7%) | 120 (5.2%) |
Technology Access in Siskiyou County
Computing Device Access in Siskiyou County
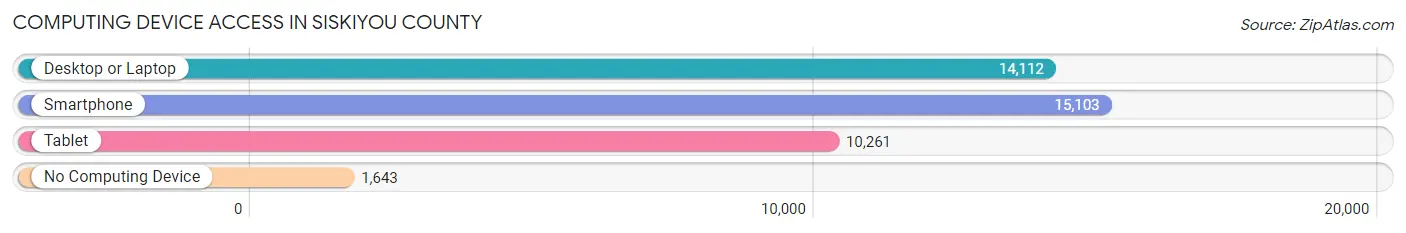
| Device Type | # Households | % Households |
| Desktop or Laptop | 14,112 | 75.2% |
| Smartphone | 15,103 | 80.5% |
| Tablet | 10,261 | 54.7% |
| No Computing Device | 1,643 | 8.7% |
| Total | 18,768 | 100.0% |
Internet Access in Siskiyou County
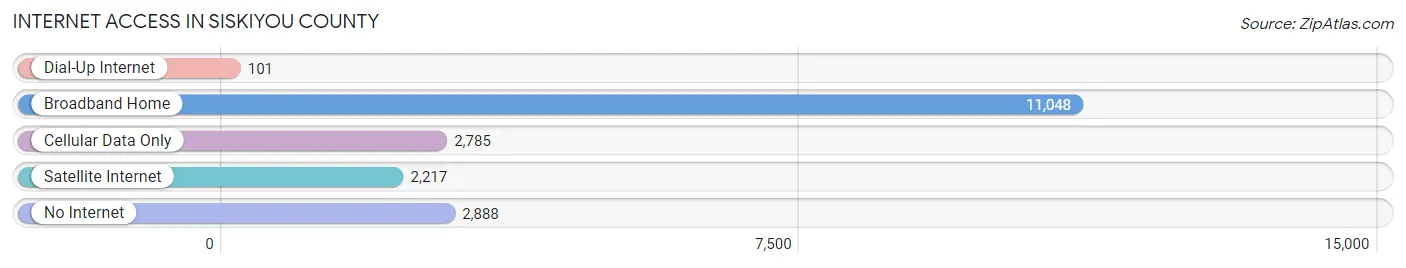
| Internet Type | # Households | % Households |
| Dial-Up Internet | 101 | 0.5% |
| Broadband Home | 11,048 | 58.9% |
| Cellular Data Only | 2,785 | 14.8% |
| Satellite Internet | 2,217 | 11.8% |
| No Internet | 2,888 | 15.4% |
| Total | 18,768 | 100.0% |
Siskiyou County Summary
Siskiyou County is located in the northernmost part of California, bordering Oregon to the north and Nevada to the east. It is the fifth-largest county in the state, covering an area of 6,347 square miles. The county is home to a diverse population of approximately 44,000 people, with the majority of the population living in the cities of Yreka, Weed, Mount Shasta, and Dunsmuir.
History
Siskiyou County was formed in 1852 from parts of Shasta and Klamath counties. The county was named after the Siskiyou Mountains, which were named by early explorer Peter Skene Ogden in 1826. The county was originally inhabited by the Shasta, Modoc, and Karuk Native American tribes.
The first European settlers arrived in the area in the early 1850s, and the county was officially established in 1852. The county was initially used for mining and logging, and the population grew rapidly. In the late 1800s, the county became a popular tourist destination due to its scenic beauty and outdoor recreation opportunities.
Geography
Siskiyou County is located in the northernmost part of California, bordering Oregon to the north and Nevada to the east. It is the fifth-largest county in the state, covering an area of 6,347 square miles. The county is home to a diverse landscape, ranging from the Cascade Mountains to the Klamath Mountains, and from the Shasta Valley to the Scott Valley.
The county is home to several rivers, including the Klamath, Scott, Shasta, and Salmon rivers. The county is also home to several lakes, including Lake Siskiyou, Lake Shastina, and Lake McCloud.
Economy
Siskiyou County’s economy is largely based on agriculture, forestry, and tourism. The county is home to several large agricultural operations, including cattle ranches, dairy farms, and fruit orchards. The county is also home to several timber companies, which harvest timber from the county’s forests.
Tourism is also an important part of the county’s economy. The county is home to several popular tourist destinations, including Mount Shasta, Lava Beds National Monument, and the Klamath National Forest.
Demographics
As of the 2010 census, Siskiyou County had a population of 44,900. The population is spread out across the county, with the majority of the population living in the cities of Yreka, Weed, Mount Shasta, and Dunsmuir.
The county is home to a diverse population, with the largest ethnic groups being White (77.3%), Hispanic or Latino (7.2%), and Native American (4.2%). The median household income in the county is $41,845, and the median age is 41.7 years.
Conclusion
Siskiyou County is a diverse and beautiful county located in the northernmost part of California. The county is home to a diverse population of approximately 44,000 people, and the economy is largely based on agriculture, forestry, and tourism. The county is home to several popular tourist destinations, including Mount Shasta, Lava Beds National Monument, and the Klamath National Forest. Siskiyou County is a great place to live, work, and visit.
Common Questions
What is Per Capita Income in Siskiyou County?
Per Capita income in Siskiyou County is $33,650.
What is the Median Family Income in Siskiyou County?
Median Family Income in Siskiyou County is $67,908.
What is the Median Household income in Siskiyou County?
Median Household Income in Siskiyou County is $53,898.
What is Income or Wage Gap in Siskiyou County?
Income or Wage Gap in Siskiyou County is 33.9%.
Women in Siskiyou County earn 66.1 cents for every dollar earned by a man.
What is Family Income Deficit in Siskiyou County?
Family Income Deficit in Siskiyou County is $9,597.
Families that are below poverty line in Siskiyou County earn $9,597 less on average than the poverty threshold level.
What is Inequality or Gini Index in Siskiyou County?
Inequality or Gini Index in Siskiyou County is 0.49.
What is the Total Population of Siskiyou County?
Total Population of Siskiyou County is 44,049.
What is the Total Male Population of Siskiyou County?
Total Male Population of Siskiyou County is 22,035.
What is the Total Female Population of Siskiyou County?
Total Female Population of Siskiyou County is 22,014.
What is the Ratio of Males per 100 Females in Siskiyou County?
There are 100.10 Males per 100 Females in Siskiyou County.
What is the Ratio of Females per 100 Males in Siskiyou County?
There are 99.90 Females per 100 Males in Siskiyou County.
What is the Median Population Age in Siskiyou County?
Median Population Age in Siskiyou County is 47.2 Years.
What is the Average Family Size in Siskiyou County
Average Family Size in Siskiyou County is 3.0 People.
What is the Average Household Size in Siskiyou County
Average Household Size in Siskiyou County is 2.3 People.
How Large is the Labor Force in Siskiyou County?
There are 18,001 People in the Labor Forcein in Siskiyou County.
What is the Percentage of People in the Labor Force in Siskiyou County?
49.8% of People are in the Labor Force in Siskiyou County.
What is the Unemployment Rate in Siskiyou County?
Unemployment Rate in Siskiyou County is 7.4%.