Sierra County, CA Map & Demographics
Sierra County Map
Sierra County Overview
$37,692
PER CAPITA INCOME
$73,917
AVG FAMILY INCOME
$61,108
AVG HOUSEHOLD INCOME
57.6%
WAGE / INCOME GAP [ % ]
42.4¢/ $1
WAGE / INCOME GAP [ $ ]
0.48
INEQUALITY / GINI INDEX
2,916
TOTAL POPULATION
1,411
MALE POPULATION
1,505
FEMALE POPULATION
93.75
MALES / 100 FEMALES
106.66
FEMALES / 100 MALES
54.9
MEDIAN AGE
3.2
AVG FAMILY SIZE
2.5
AVG HOUSEHOLD SIZE
1,318
LABOR FORCE [ PEOPLE ]
51.9%
PERCENT IN LABOR FORCE
5.6%
UNEMPLOYMENT RATE
Sierra County Area Codes
Income in Sierra County
Income Overview in Sierra County
Per Capita Income in Sierra County is $37,692, while median incomes of families and households are $73,917 and $61,108 respectively.
| Characteristic | Number | Measure |
| Per Capita Income | 2,916 | $37,692 |
| Median Family Income | 719 | $73,917 |
| Mean Family Income | 719 | $107,177 |
| Median Household Income | 1,135 | $61,108 |
| Mean Household Income | 1,135 | $89,205 |
| Income Deficit | 719 | $0 |
| Wage / Income Gap (%) | 2,916 | 57.65% |
| Wage / Income Gap ($) | 2,916 | 42.35¢ per $1 |
| Gini / Inequality Index | 2,916 | 0.48 |
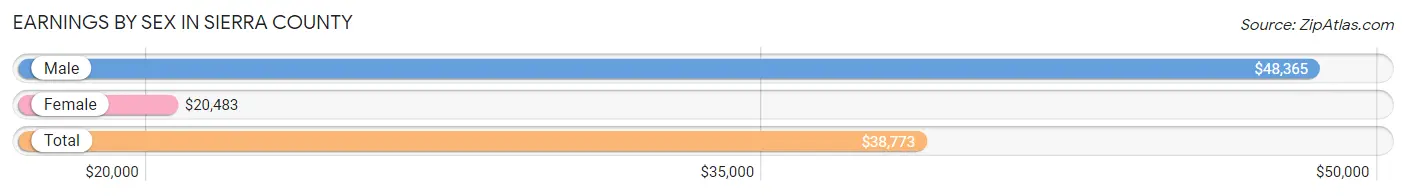
Earnings by Sex in Sierra County
Average Earnings in Sierra County are $38,773, $48,365 for men and $20,483 for women, a difference of 57.7%.
| Sex | Number | Average Earnings |
| Male | 689 (46.8%) | $48,365 |
| Female | 783 (53.2%) | $20,483 |
| Total | 1,472 (100.0%) | $38,773 |
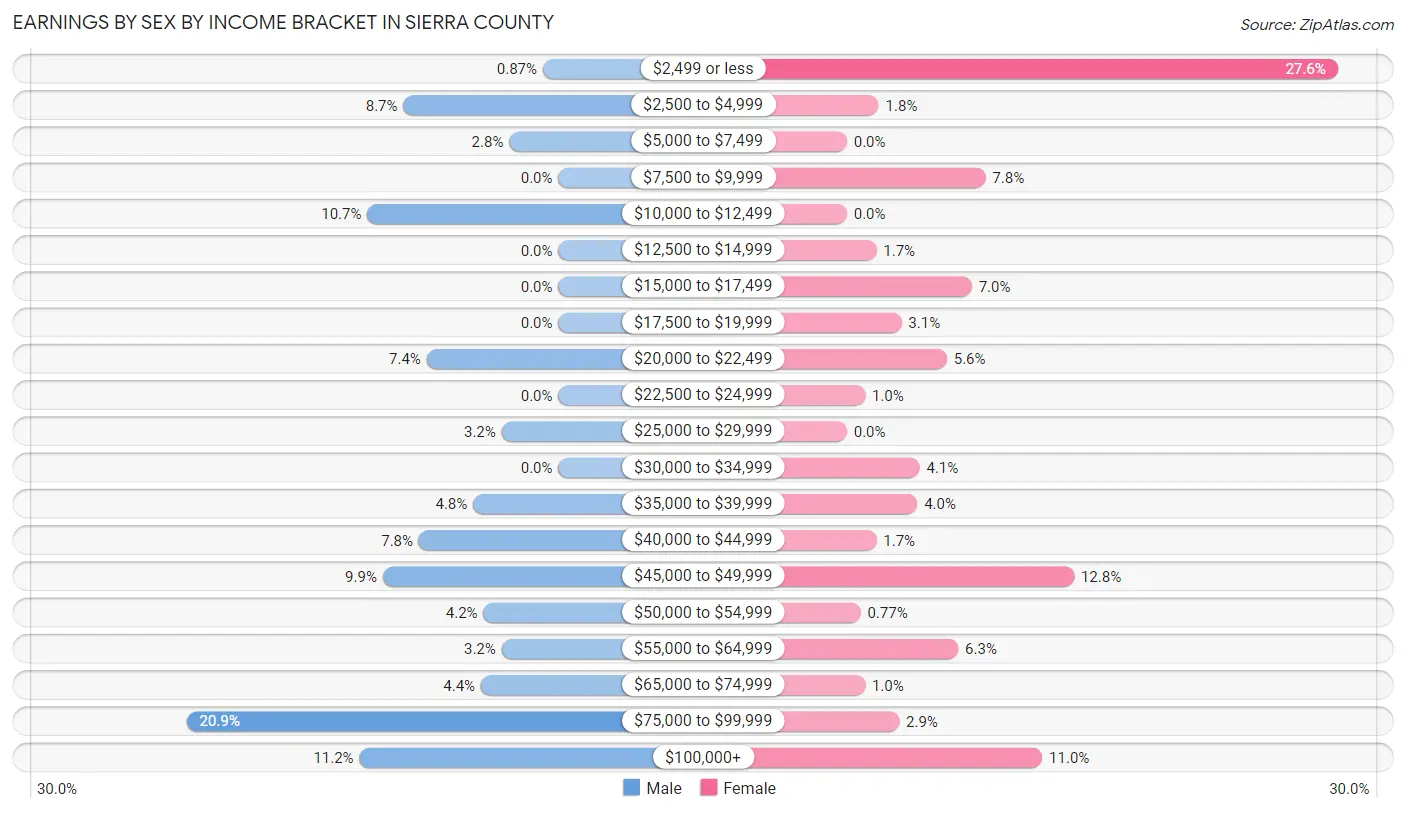
Earnings by Sex by Income Bracket in Sierra County
The most common earnings brackets in Sierra County are $75,000 to $99,999 for men (144 | 20.9%) and $2,499 or less for women (216 | 27.6%).
| Income | Male | Female |
| $2,499 or less | 6 (0.9%) | 216 (27.6%) |
| $2,500 to $4,999 | 60 (8.7%) | 14 (1.8%) |
| $5,000 to $7,499 | 19 (2.8%) | 0 (0.0%) |
| $7,500 to $9,999 | 0 (0.0%) | 61 (7.8%) |
| $10,000 to $12,499 | 74 (10.7%) | 0 (0.0%) |
| $12,500 to $14,999 | 0 (0.0%) | 13 (1.7%) |
| $15,000 to $17,499 | 0 (0.0%) | 55 (7.0%) |
| $17,500 to $19,999 | 0 (0.0%) | 24 (3.1%) |
| $20,000 to $22,499 | 51 (7.4%) | 44 (5.6%) |
| $22,500 to $24,999 | 0 (0.0%) | 8 (1.0%) |
| $25,000 to $29,999 | 22 (3.2%) | 0 (0.0%) |
| $30,000 to $34,999 | 0 (0.0%) | 32 (4.1%) |
| $35,000 to $39,999 | 33 (4.8%) | 31 (4.0%) |
| $40,000 to $44,999 | 54 (7.8%) | 13 (1.7%) |
| $45,000 to $49,999 | 68 (9.9%) | 100 (12.8%) |
| $50,000 to $54,999 | 29 (4.2%) | 6 (0.8%) |
| $55,000 to $64,999 | 22 (3.2%) | 49 (6.3%) |
| $65,000 to $74,999 | 30 (4.3%) | 8 (1.0%) |
| $75,000 to $99,999 | 144 (20.9%) | 23 (2.9%) |
| $100,000+ | 77 (11.2%) | 86 (11.0%) |
| Total | 689 (100.0%) | 783 (100.0%) |
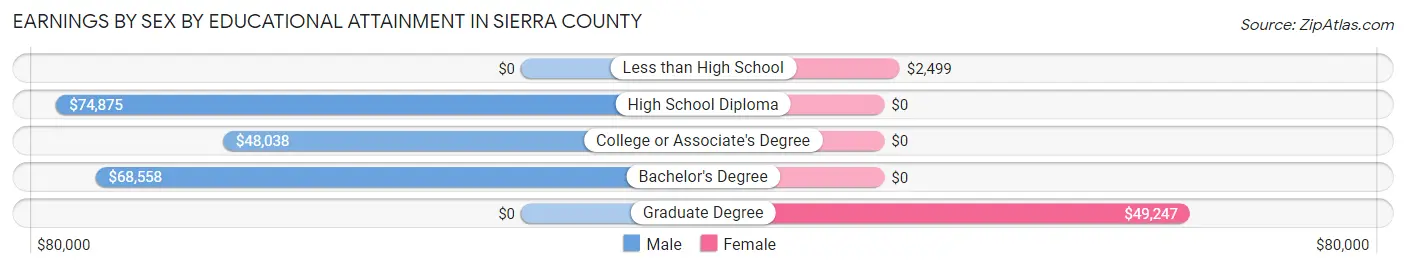
Earnings by Sex by Educational Attainment in Sierra County
Average earnings in Sierra County are $48,615 for men and $47,750 for women, a difference of 1.8%. Men with an educational attainment of high school diploma enjoy the highest average annual earnings of $74,875, while those with college or associate's degree education earn the least with $48,038. Women with an educational attainment of graduate degree earn the most with the average annual earnings of $49,247, while those with less than high school education have the smallest earnings of $2,499.
| Educational Attainment | Male Income | Female Income |
| Less than High School | - | - |
| High School Diploma | $74,875 | $0 |
| College or Associate's Degree | $48,038 | $0 |
| Bachelor's Degree | $68,558 | $0 |
| Graduate Degree | - | - |
| Total | $48,615 | $47,750 |
Family Income in Sierra County
Family Income Brackets in Sierra County
According to the Sierra County family income data, there are 169 families falling into the $50,000 to $74,999 income range, which is the most common income bracket and makes up 23.5% of all families. Conversely, the $10,000 to $14,999 income bracket is the least frequent group with only 7 families (1.0%) belonging to this category.
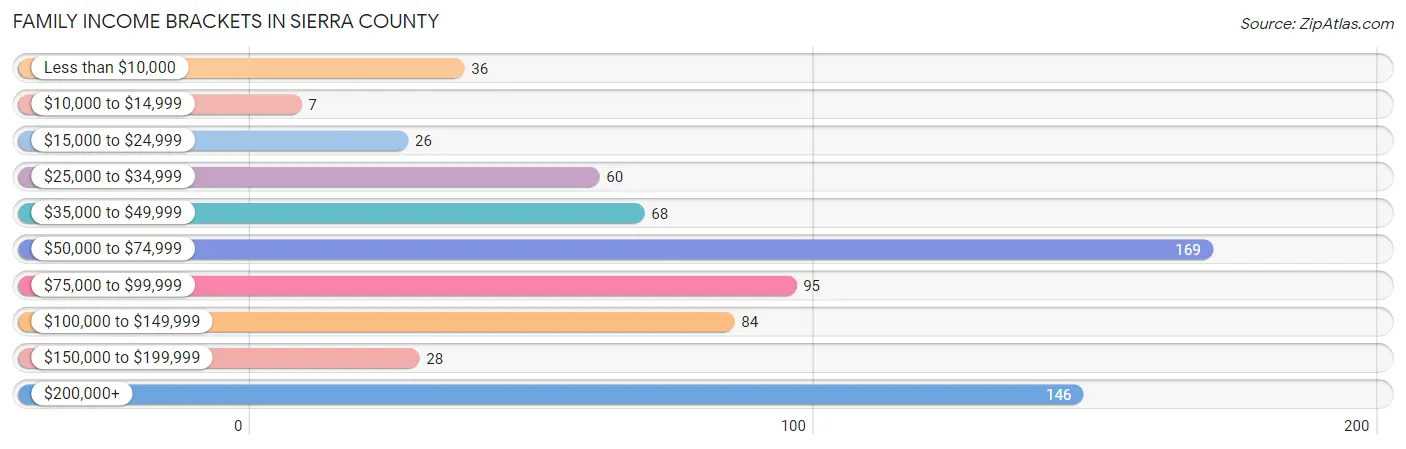
| Income Bracket | # Families | % Families |
| Less than $10,000 | 36 | 5.0% |
| $10,000 to $14,999 | 7 | 1.0% |
| $15,000 to $24,999 | 26 | 3.6% |
| $25,000 to $34,999 | 60 | 8.3% |
| $35,000 to $49,999 | 68 | 9.5% |
| $50,000 to $74,999 | 169 | 23.5% |
| $75,000 to $99,999 | 95 | 13.2% |
| $100,000 to $149,999 | 84 | 11.7% |
| $150,000 to $199,999 | 28 | 3.9% |
| $200,000+ | 146 | 20.3% |
Family Income by Famaliy Size in Sierra County
2-person families (564 | 78.4%) account for the highest median family income in Sierra County with $69,219 per family, while 2-person families (564 | 78.4%) have the highest median income of $34,610 per family member.
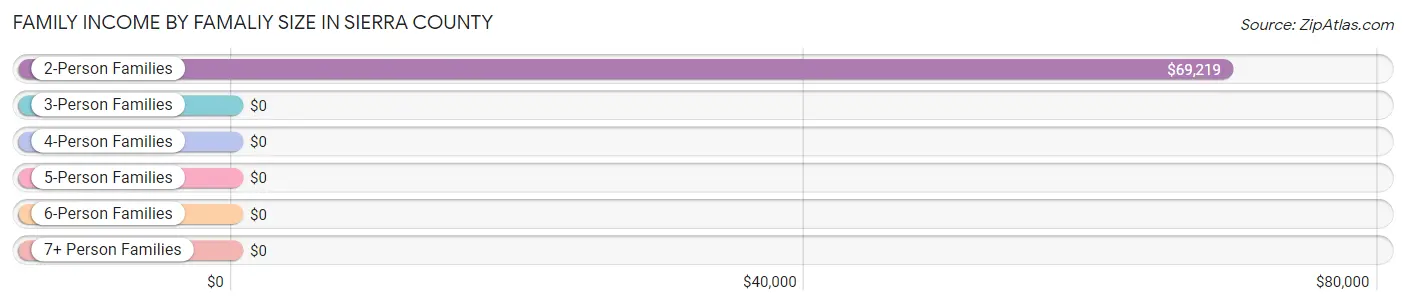
| Income Bracket | # Families | Median Income |
| 2-Person Families | 564 (78.4%) | $69,219 |
| 3-Person Families | 36 (5.0%) | $0 |
| 4-Person Families | 92 (12.8%) | $0 |
| 5-Person Families | 13 (1.8%) | $0 |
| 6-Person Families | 14 (1.9%) | $0 |
| 7+ Person Families | 0 (0.0%) | $0 |
| Total | 719 (100.0%) | $73,917 |
Family Income by Number of Earners in Sierra County
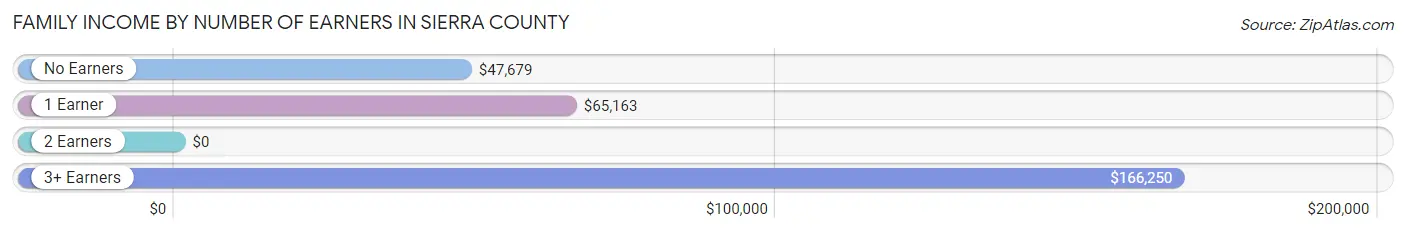
| Number of Earners | # Families | Median Income |
| No Earners | 182 (25.3%) | $47,679 |
| 1 Earner | 253 (35.2%) | $65,163 |
| 2 Earners | 254 (35.3%) | $0 |
| 3+ Earners | 30 (4.2%) | $166,250 |
| Total | 719 (100.0%) | $73,917 |
Household Income in Sierra County
Household Income Brackets in Sierra County
With 213 households falling in the category, the $50,000 to $74,999 income range is the most frequent in Sierra County, accounting for 18.8% of all households. In contrast, only 28 households (2.5%) fall into the $150,000 to $199,999 income bracket, making it the least populous group.
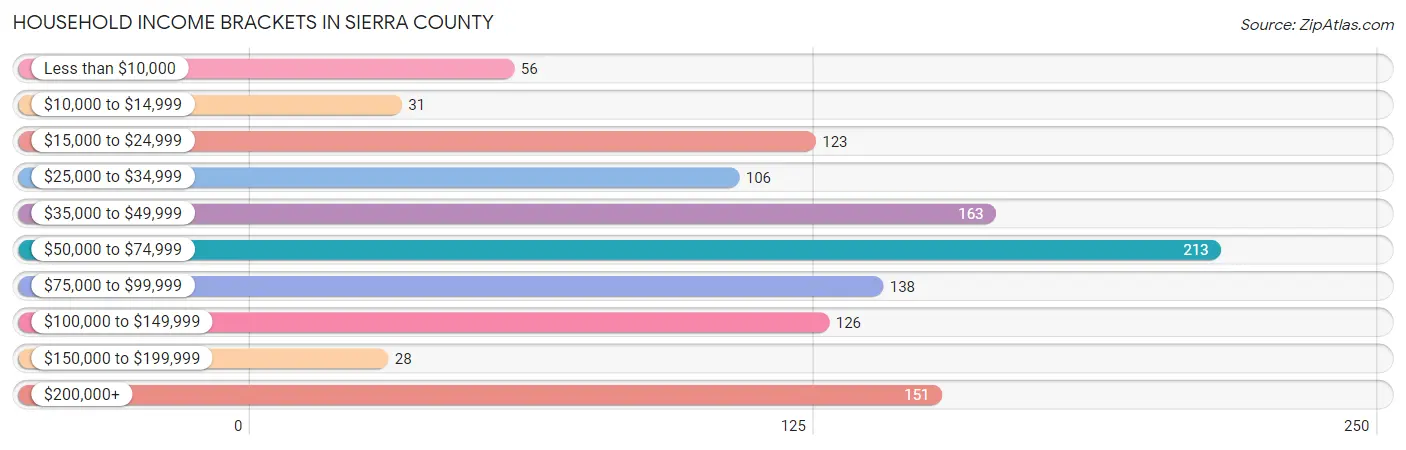
| Income Bracket | # Households | % Households |
| Less than $10,000 | 56 | 4.9% |
| $10,000 to $14,999 | 31 | 2.7% |
| $15,000 to $24,999 | 123 | 10.8% |
| $25,000 to $34,999 | 106 | 9.3% |
| $35,000 to $49,999 | 163 | 14.4% |
| $50,000 to $74,999 | 213 | 18.8% |
| $75,000 to $99,999 | 138 | 12.2% |
| $100,000 to $149,999 | 126 | 11.1% |
| $150,000 to $199,999 | 28 | 2.5% |
| $200,000+ | 151 | 13.3% |
Household Income by Householder Age in Sierra County
The median household income in Sierra County is $61,108, with the highest median household income of $84,103 found in the 25 to 44 years age bracket for the primary householder. A total of 135 households (11.9%) fall into this category.
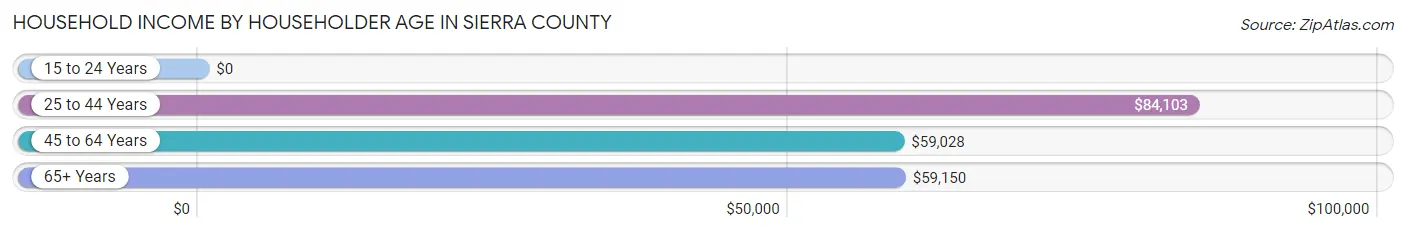
| Income Bracket | # Households | Median Income |
| 15 to 24 Years | 0 (0.0%) | $0 |
| 25 to 44 Years | 135 (11.9%) | $84,103 |
| 45 to 64 Years | 529 (46.6%) | $59,028 |
| 65+ Years | 471 (41.5%) | $59,150 |
| Total | 1,135 (100.0%) | $61,108 |
Poverty in Sierra County
Income Below Poverty by Sex and Age in Sierra County
With 11.7% poverty level for males and 13.4% for females among the residents of Sierra County, 12 to 14 year old males and 75 year old and over females are the most vulnerable to poverty, with 54 males (52.4%) and 85 females (42.1%) in their respective age groups living below the poverty level.
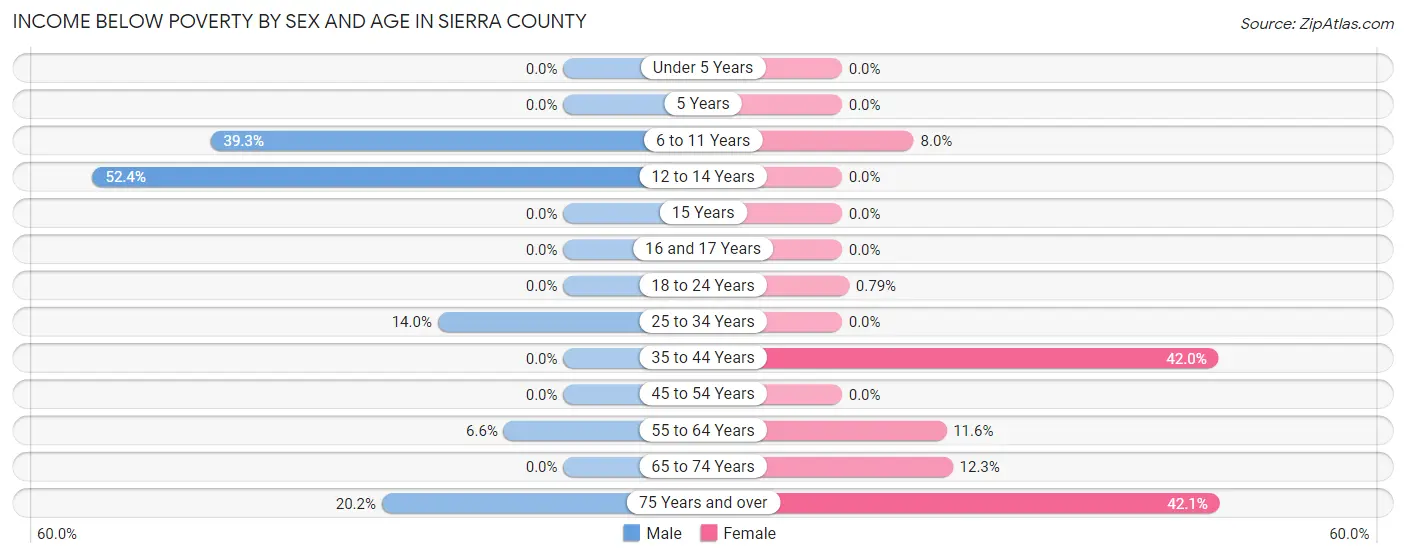
| Age Bracket | Male | Female |
| Under 5 Years | 0 (0.0%) | 0 (0.0%) |
| 5 Years | 0 (0.0%) | 0 (0.0%) |
| 6 to 11 Years | 33 (39.3%) | 4 (8.0%) |
| 12 to 14 Years | 54 (52.4%) | 0 (0.0%) |
| 15 Years | 0 (0.0%) | 0 (0.0%) |
| 16 and 17 Years | 0 (0.0%) | 0 (0.0%) |
| 18 to 24 Years | 0 (0.0%) | 2 (0.8%) |
| 25 to 34 Years | 20 (14.0%) | 0 (0.0%) |
| 35 to 44 Years | 0 (0.0%) | 47 (42.0%) |
| 45 to 54 Years | 0 (0.0%) | 0 (0.0%) |
| 55 to 64 Years | 19 (6.6%) | 30 (11.6%) |
| 65 to 74 Years | 0 (0.0%) | 29 (12.3%) |
| 75 Years and over | 36 (20.2%) | 85 (42.1%) |
| Total | 162 (11.7%) | 197 (13.4%) |
Income Above Poverty by Sex and Age in Sierra County
According to the poverty statistics in Sierra County, males aged 15 years and females aged 12 to 14 years are the age groups that are most secure financially, with 100.0% of males and 100.0% of females in these age groups living above the poverty line.
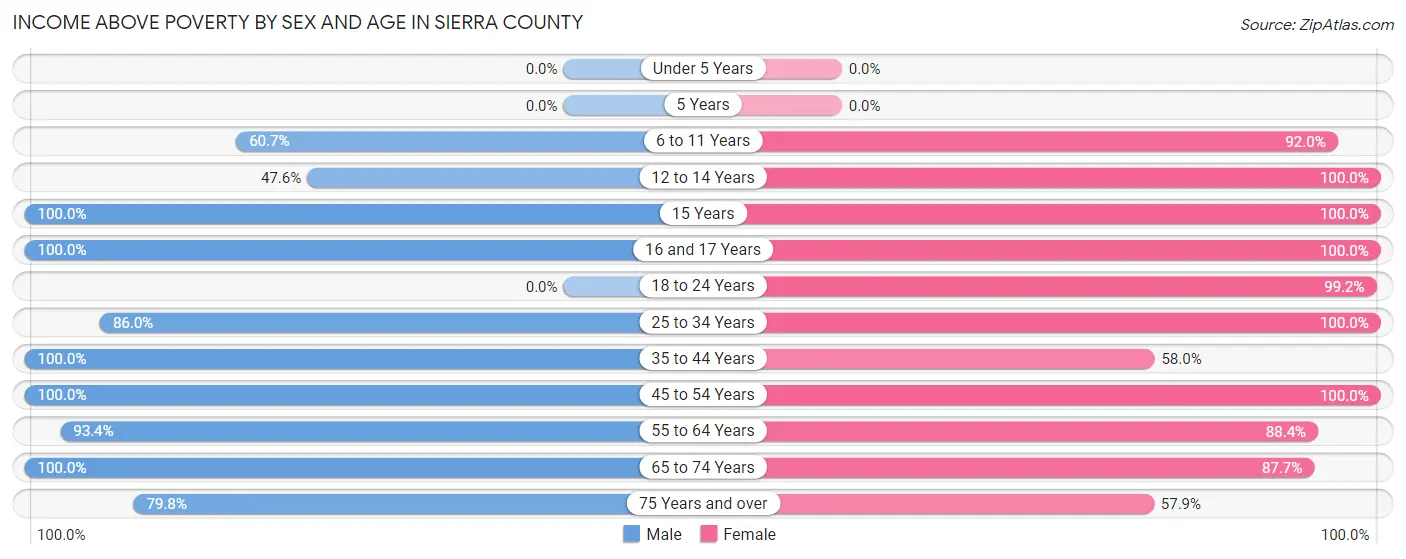
| Age Bracket | Male | Female |
| Under 5 Years | 0 (0.0%) | 0 (0.0%) |
| 5 Years | 0 (0.0%) | 0 (0.0%) |
| 6 to 11 Years | 51 (60.7%) | 46 (92.0%) |
| 12 to 14 Years | 49 (47.6%) | 101 (100.0%) |
| 15 Years | 6 (100.0%) | 33 (100.0%) |
| 16 and 17 Years | 23 (100.0%) | 6 (100.0%) |
| 18 to 24 Years | 0 (0.0%) | 252 (99.2%) |
| 25 to 34 Years | 123 (86.0%) | 40 (100.0%) |
| 35 to 44 Years | 161 (100.0%) | 65 (58.0%) |
| 45 to 54 Years | 133 (100.0%) | 181 (100.0%) |
| 55 to 64 Years | 267 (93.4%) | 228 (88.4%) |
| 65 to 74 Years | 265 (100.0%) | 206 (87.7%) |
| 75 Years and over | 142 (79.8%) | 117 (57.9%) |
| Total | 1,220 (88.3%) | 1,275 (86.6%) |
Income Below Poverty Among Married-Couple Families in Sierra County
The poverty statistics for married-couple families in Sierra County show that 5.7% or 36 of the total 631 families live below the poverty line. Families with no children have the highest poverty rate of 6.6%, comprising of 36 families. On the other hand, families with 1 or 2 children have the lowest poverty rate of 0.0%, which includes 0 families.
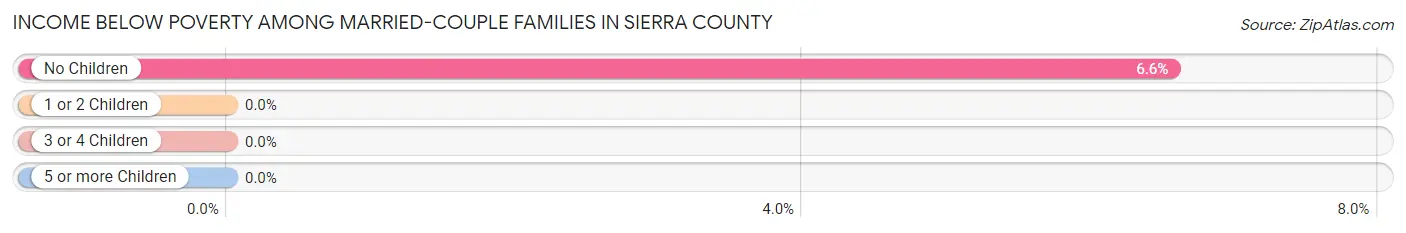
| Children | Above Poverty | Below Poverty |
| No Children | 513 (93.4%) | 36 (6.6%) |
| 1 or 2 Children | 55 (100.0%) | 0 (0.0%) |
| 3 or 4 Children | 27 (100.0%) | 0 (0.0%) |
| 5 or more Children | 0 (0.0%) | 0 (0.0%) |
| Total | 595 (94.3%) | 36 (5.7%) |
Income Below Poverty Among Single-Parent Households in Sierra County
According to the poverty data in Sierra County, 16.4% or 10 single-father households and 48.1% or 13 single-mother households are living below the poverty line. Among single-father households, those with 1 or 2 children have the highest poverty rate, with 10 households (100.0%) experiencing poverty. Likewise, among single-mother households, those with no children have the highest poverty rate, with 7 households (100.0%) falling below the poverty line.
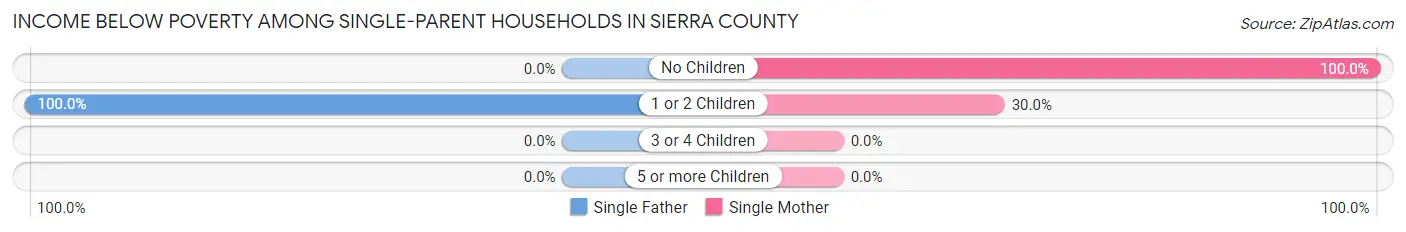
| Children | Single Father | Single Mother |
| No Children | 0 (0.0%) | 7 (100.0%) |
| 1 or 2 Children | 10 (100.0%) | 6 (30.0%) |
| 3 or 4 Children | 0 (0.0%) | 0 (0.0%) |
| 5 or more Children | 0 (0.0%) | 0 (0.0%) |
| Total | 10 (16.4%) | 13 (48.1%) |
Income Below Poverty Among Married-Couple vs Single-Parent Households in Sierra County
The poverty data for Sierra County shows that 36 of the married-couple family households (5.7%) and 23 of the single-parent households (26.1%) are living below the poverty level. Within the married-couple family households, those with no children have the highest poverty rate, with 36 households (6.6%) falling below the poverty line. Among the single-parent households, those with 1 or 2 children have the highest poverty rate, with 16 household (53.3%) living below poverty.
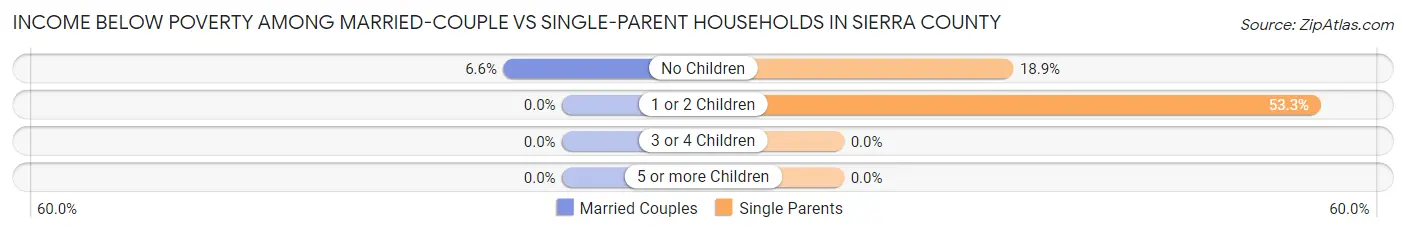
| Children | Married-Couple Families | Single-Parent Households |
| No Children | 36 (6.6%) | 7 (18.9%) |
| 1 or 2 Children | 0 (0.0%) | 16 (53.3%) |
| 3 or 4 Children | 0 (0.0%) | 0 (0.0%) |
| 5 or more Children | 0 (0.0%) | 0 (0.0%) |
| Total | 36 (5.7%) | 23 (26.1%) |
Race in Sierra County
The most populous races in Sierra County are White / Caucasian (2,600 | 89.2%), Hispanic or Latino (332 | 11.4%), and Some other Race (147 | 5.0%).
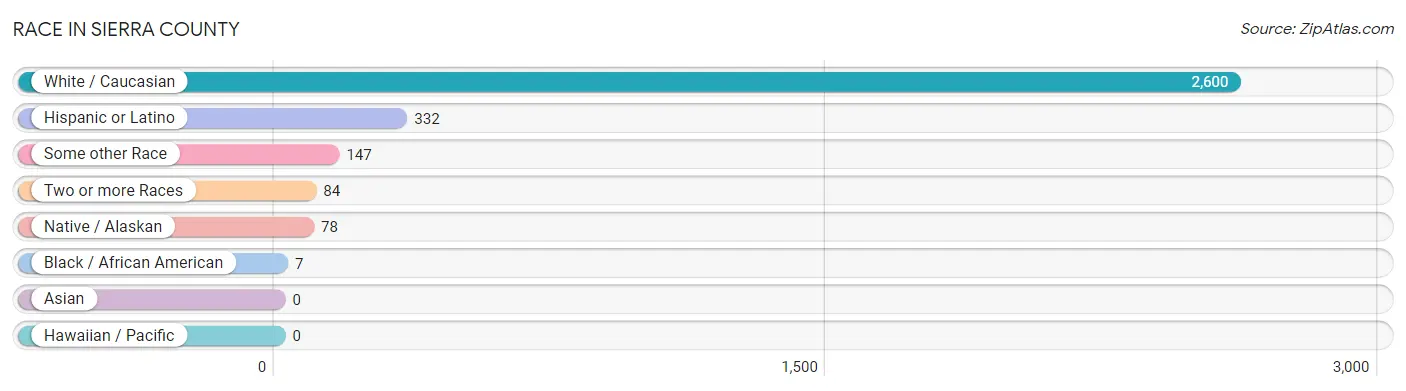
| Race | # Population | % Population |
| Asian | 0 | 0.0% |
| Black / African American | 7 | 0.2% |
| Hawaiian / Pacific | 0 | 0.0% |
| Hispanic or Latino | 332 | 11.4% |
| Native / Alaskan | 78 | 2.7% |
| White / Caucasian | 2,600 | 89.2% |
| Two or more Races | 84 | 2.9% |
| Some other Race | 147 | 5.0% |
| Total | 2,916 | 100.0% |
Ancestry in Sierra County
The most populous ancestries reported in Sierra County are English (445 | 15.3%), German (389 | 13.3%), Irish (327 | 11.2%), Mexican (306 | 10.5%), and Swiss (168 | 5.8%), together accounting for 56.1% of all Sierra County residents.
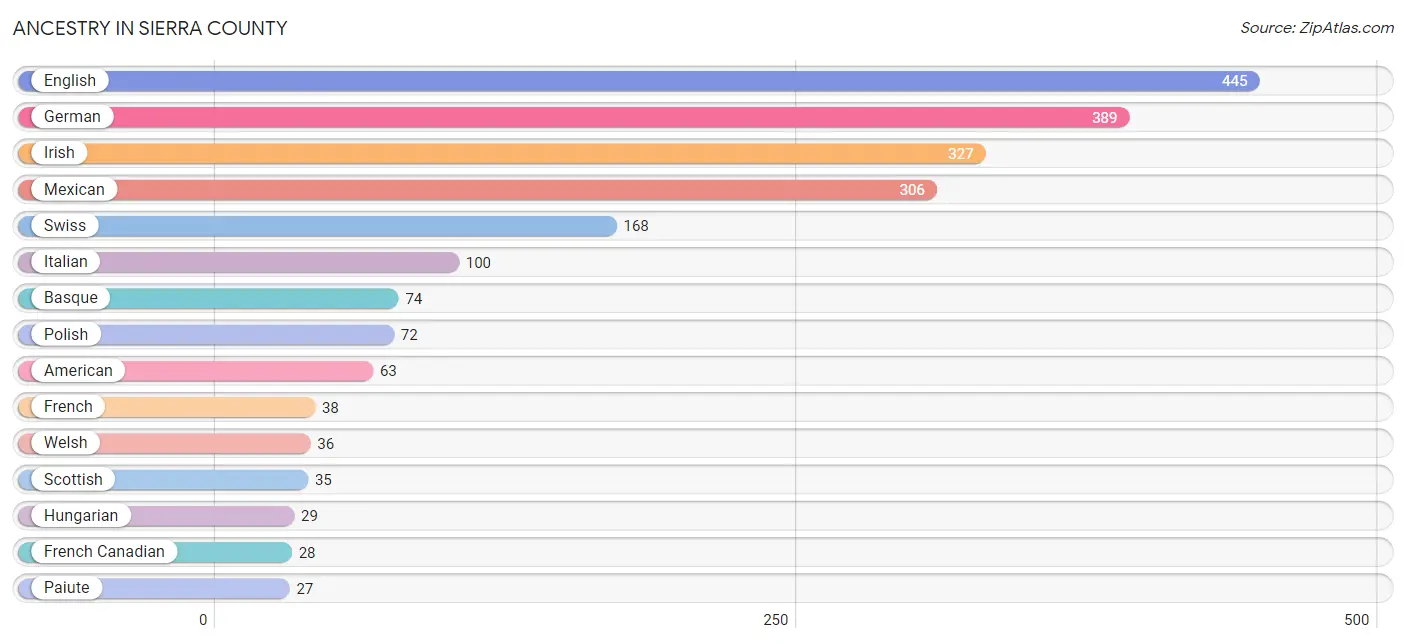
| Ancestry | # Population | % Population |
| American | 63 | 2.2% |
| Basque | 74 | 2.5% |
| British | 5 | 0.2% |
| Central American | 8 | 0.3% |
| Cherokee | 14 | 0.5% |
| Choctaw | 6 | 0.2% |
| Czech | 13 | 0.4% |
| Dutch | 10 | 0.3% |
| English | 445 | 15.3% |
| European | 17 | 0.6% |
| Finnish | 23 | 0.8% |
| French | 38 | 1.3% |
| French Canadian | 28 | 1.0% |
| German | 389 | 13.3% |
| Greek | 5 | 0.2% |
| Hungarian | 29 | 1.0% |
| Irish | 327 | 11.2% |
| Italian | 100 | 3.4% |
| Mexican | 306 | 10.5% |
| Norwegian | 13 | 0.4% |
| Paiute | 27 | 0.9% |
| Polish | 72 | 2.5% |
| Portuguese | 5 | 0.2% |
| Potawatomi | 4 | 0.1% |
| Russian | 10 | 0.3% |
| Salvadoran | 8 | 0.3% |
| Scotch-Irish | 22 | 0.7% |
| Scottish | 35 | 1.2% |
| Spanish | 18 | 0.6% |
| Swedish | 12 | 0.4% |
| Swiss | 168 | 5.8% |
| Welsh | 36 | 1.2% | View All 32 Rows |
Immigrants in Sierra County
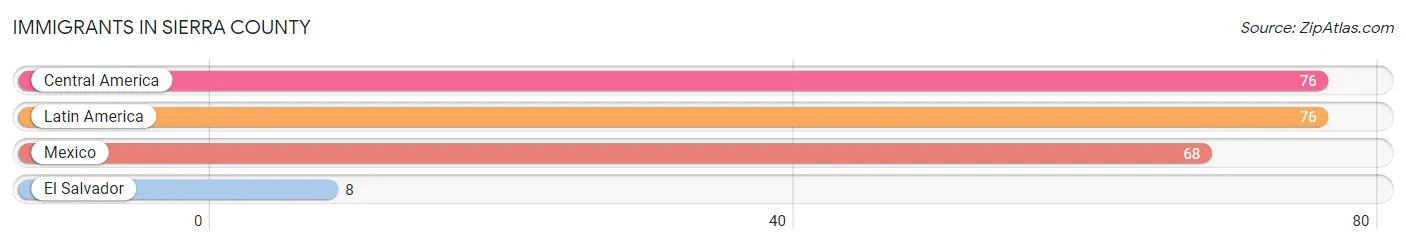
The most numerous immigrant groups reported in Sierra County came from Central America (76 | 2.6%), Latin America (76 | 2.6%), Mexico (68 | 2.3%), and El Salvador (8 | 0.3%), together accounting for 7.8% of all Sierra County residents.
| Immigration Origin | # Population | % Population |
| Central America | 76 | 2.6% |
| El Salvador | 8 | 0.3% |
| Latin America | 76 | 2.6% |
| Mexico | 68 | 2.3% | View All 4 Rows |
Sex and Age in Sierra County
Sex and Age in Sierra County
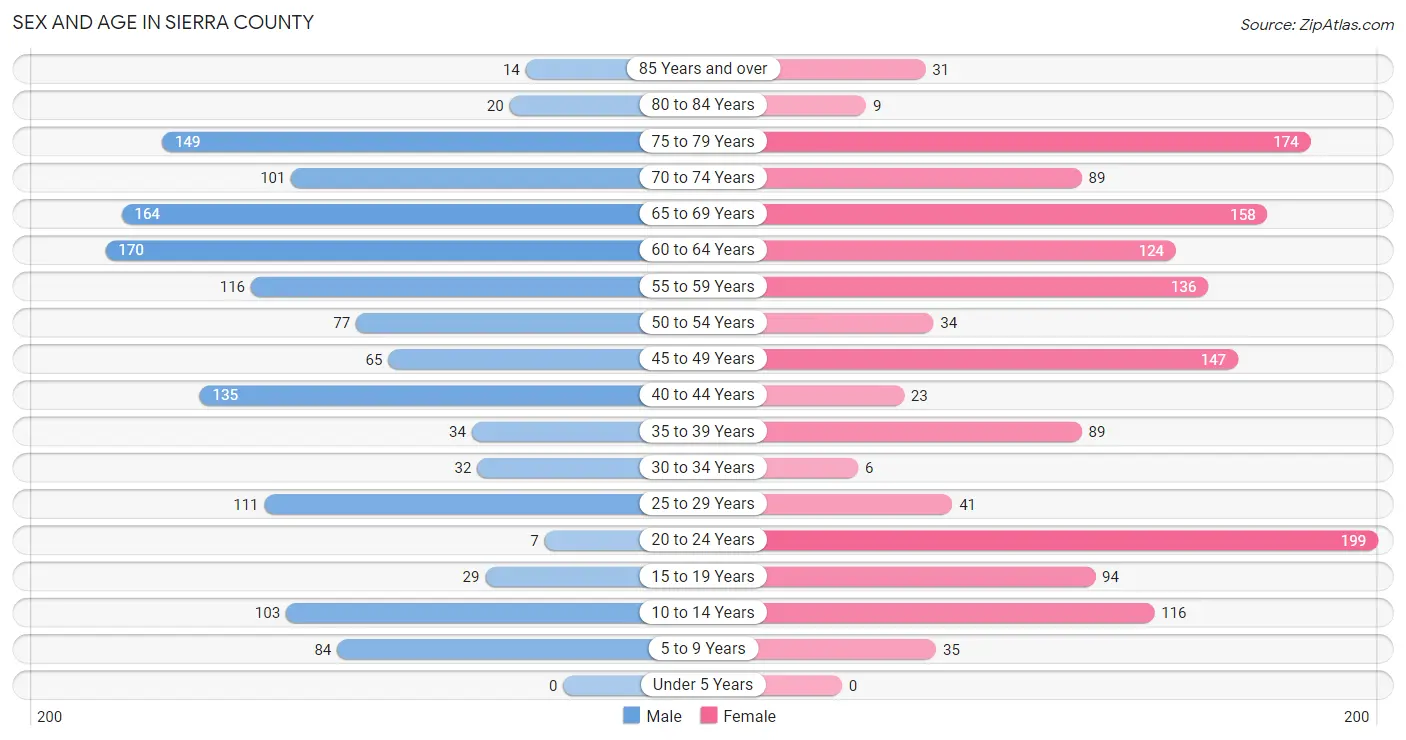
The most populous age groups in Sierra County are 60 to 64 Years (170 | 12.0%) for men and 20 to 24 Years (199 | 13.2%) for women.
| Age Bracket | Male | Female |
| Under 5 Years | 0 (0.0%) | 0 (0.0%) |
| 5 to 9 Years | 84 (5.9%) | 35 (2.3%) |
| 10 to 14 Years | 103 (7.3%) | 116 (7.7%) |
| 15 to 19 Years | 29 (2.1%) | 94 (6.2%) |
| 20 to 24 Years | 7 (0.5%) | 199 (13.2%) |
| 25 to 29 Years | 111 (7.9%) | 41 (2.7%) |
| 30 to 34 Years | 32 (2.3%) | 6 (0.4%) |
| 35 to 39 Years | 34 (2.4%) | 89 (5.9%) |
| 40 to 44 Years | 135 (9.6%) | 23 (1.5%) |
| 45 to 49 Years | 65 (4.6%) | 147 (9.8%) |
| 50 to 54 Years | 77 (5.5%) | 34 (2.3%) |
| 55 to 59 Years | 116 (8.2%) | 136 (9.0%) |
| 60 to 64 Years | 170 (12.0%) | 124 (8.2%) |
| 65 to 69 Years | 164 (11.6%) | 158 (10.5%) |
| 70 to 74 Years | 101 (7.2%) | 89 (5.9%) |
| 75 to 79 Years | 149 (10.6%) | 174 (11.6%) |
| 80 to 84 Years | 20 (1.4%) | 9 (0.6%) |
| 85 Years and over | 14 (1.0%) | 31 (2.1%) |
| Total | 1,411 (100.0%) | 1,505 (100.0%) |
Families and Households in Sierra County
Median Family Size in Sierra County
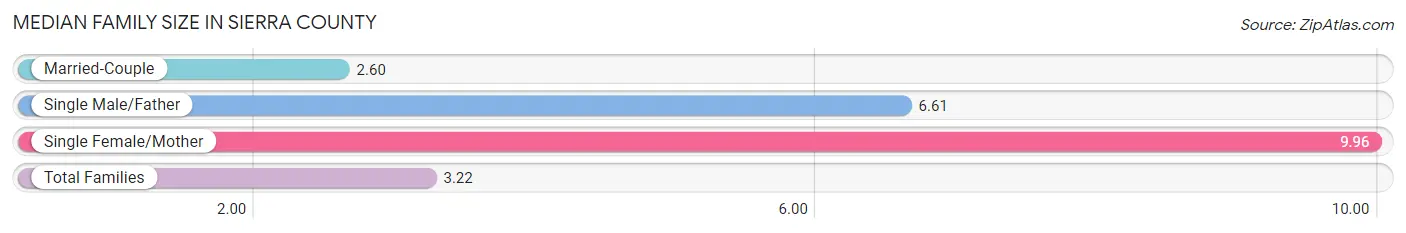
The median family size in Sierra County is 3.22 persons per family, with single female/mother families (27 | 3.8%) accounting for the largest median family size of 9.96 persons per family. On the other hand, married-couple families (631 | 87.8%) represent the smallest median family size with 2.60 persons per family.
| Family Type | # Families | Family Size |
| Married-Couple | 631 (87.8%) | 2.60 |
| Single Male/Father | 61 (8.5%) | 6.61 |
| Single Female/Mother | 27 (3.8%) | 9.96 |
| Total Families | 719 (100.0%) | 3.22 |
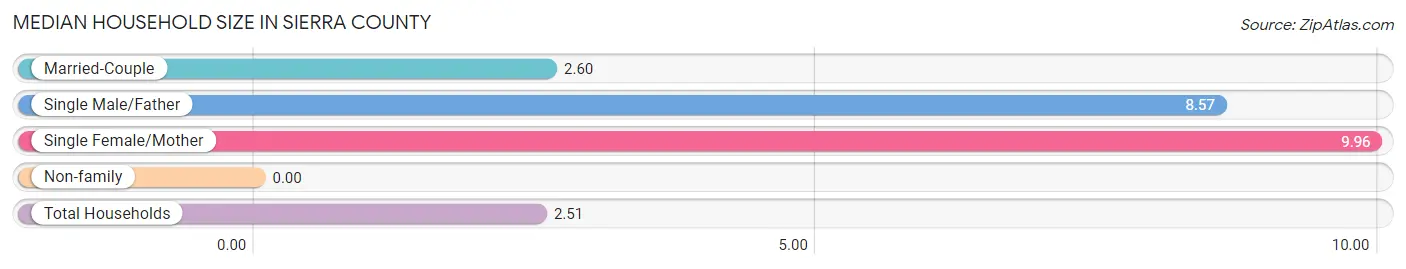
Median Household Size in Sierra County
| Household Type | # Households | Household Size |
| Married-Couple | 631 (55.6%) | 2.60 |
| Single Male/Father | 61 (5.4%) | 8.57 |
| Single Female/Mother | 27 (2.4%) | 9.96 |
| Non-family | 416 (36.6%) | - |
| Total Households | 1,135 (100.0%) | 2.51 |
Household Size by Marriage Status in Sierra County
Out of a total of 1,135 households in Sierra County, 719 (63.3%) are family households, while 416 (36.6%) are nonfamily households. The most numerous type of family households are 2-person households, comprising 540, and the most common type of nonfamily households are 1-person households, comprising 416.
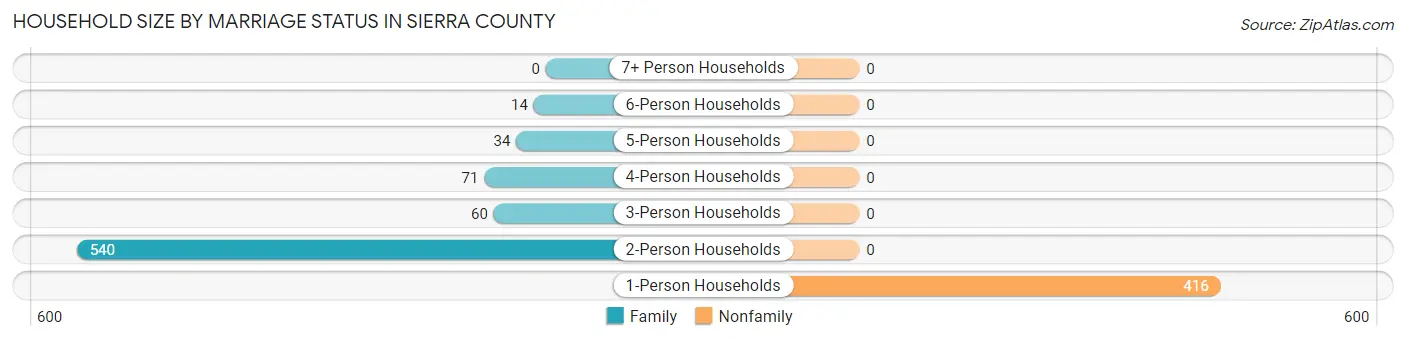
| Household Size | Family Households | Nonfamily Households |
| 1-Person Households | - | 416 (36.6%) |
| 2-Person Households | 540 (47.6%) | 0 (0.0%) |
| 3-Person Households | 60 (5.3%) | 0 (0.0%) |
| 4-Person Households | 71 (6.3%) | 0 (0.0%) |
| 5-Person Households | 34 (3.0%) | 0 (0.0%) |
| 6-Person Households | 14 (1.2%) | 0 (0.0%) |
| 7+ Person Households | 0 (0.0%) | 0 (0.0%) |
| Total | 719 (63.3%) | 416 (36.6%) |
Female Fertility in Sierra County
Fertility by Age in Sierra County
Average fertility rate in Sierra County is 2.0 births per 1,000 women. Women in the age bracket of 20 to 34 years have the highest fertility rate with 4.0 births per 1,000 women. Women in the age bracket of 20 to 34 years acount for 100.0% of all women with births.
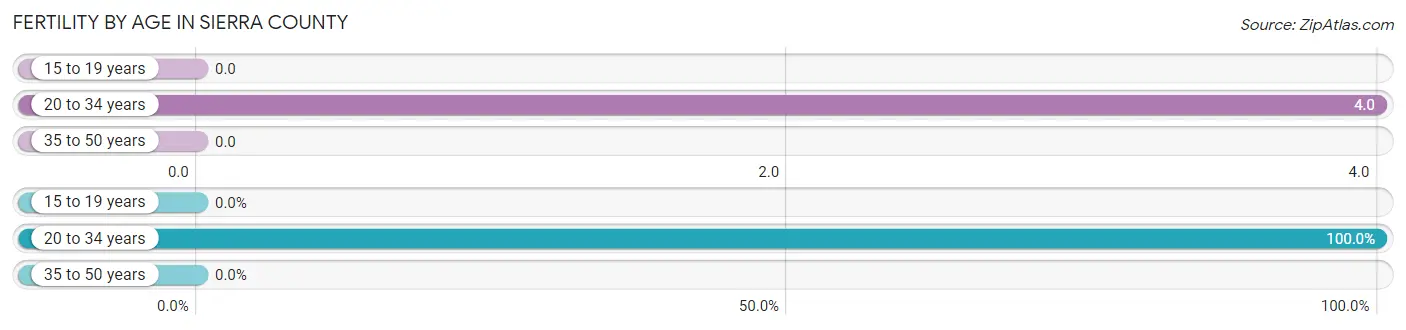
| Age Bracket | Women with Births | Births / 1,000 Women |
| 15 to 19 years | 0 (0.0%) | 0.0 |
| 20 to 34 years | 1 (100.0%) | 4.0 |
| 35 to 50 years | 0 (0.0%) | 0.0 |
| Total | 1 (100.0%) | 2.0 |
Fertility by Age by Marriage Status in Sierra County
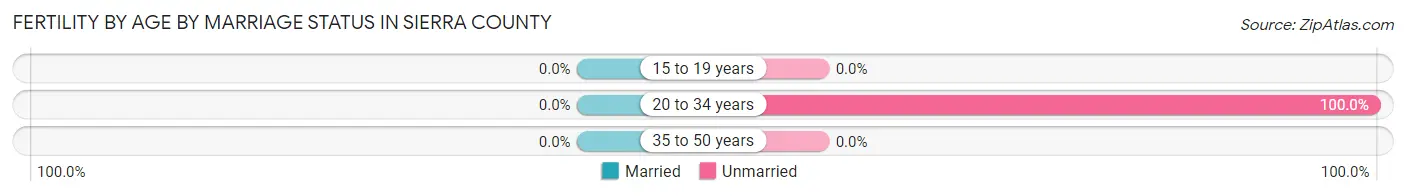
| Age Bracket | Married | Unmarried |
| 15 to 19 years | 0 (0.0%) | 0 (0.0%) |
| 20 to 34 years | 0 (0.0%) | 1 (100.0%) |
| 35 to 50 years | 0 (0.0%) | 0 (0.0%) |
| Total | 0 (0.0%) | 1 (100.0%) |
Fertility by Education in Sierra County
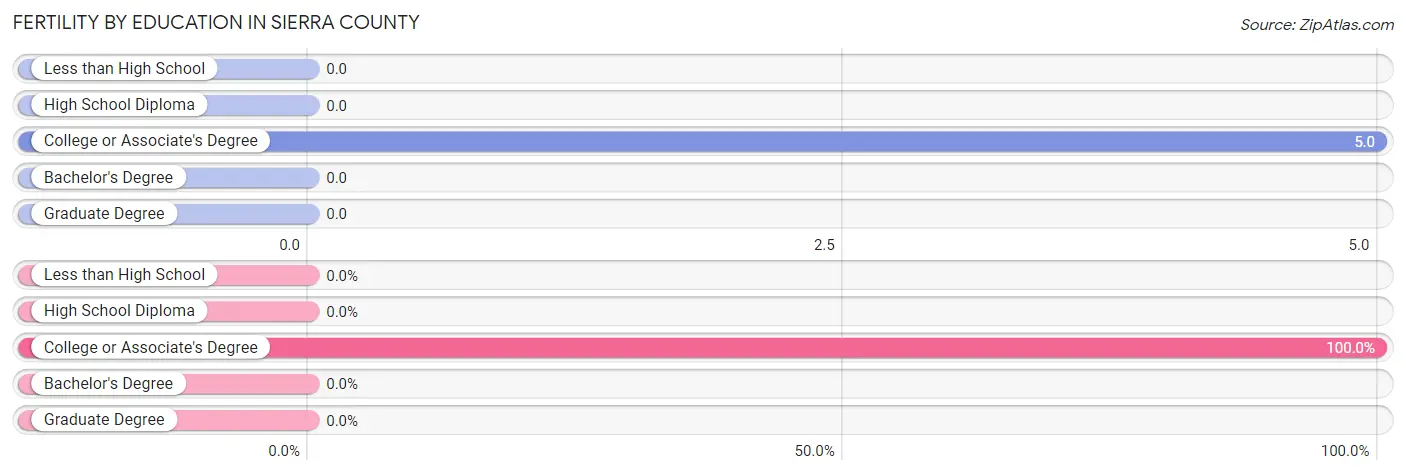
| Educational Attainment | Women with Births | Births / 1,000 Women |
| Less than High School | 0 (0.0%) | 0.0 |
| High School Diploma | 0 (0.0%) | 0.0 |
| College or Associate's Degree | 1 (100.0%) | 5.0 |
| Bachelor's Degree | 0 (0.0%) | 0.0 |
| Graduate Degree | 0 (0.0%) | 0.0 |
| Total | 1 (100.0%) | 2.0 |
Fertility by Education by Marriage Status in Sierra County
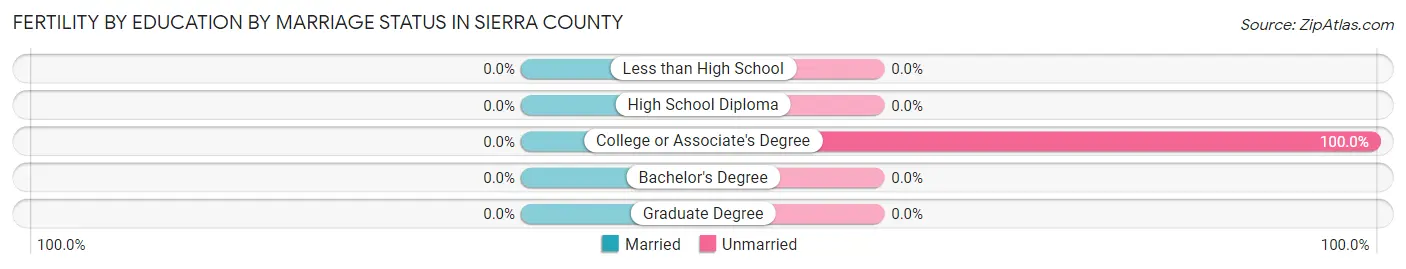
| Educational Attainment | Married | Unmarried |
| Less than High School | 0 (0.0%) | 0 (0.0%) |
| High School Diploma | 0 (0.0%) | 0 (0.0%) |
| College or Associate's Degree | 0 (0.0%) | 1 (100.0%) |
| Bachelor's Degree | 0 (0.0%) | 0 (0.0%) |
| Graduate Degree | 0 (0.0%) | 0 (0.0%) |
| Total | 0 (0.0%) | 1 (100.0%) |
Employment Characteristics in Sierra County
Employment by Class of Employer in Sierra County
Among the 1,216 employed individuals in Sierra County, private company employees (602 | 49.5%), state government employees (172 | 14.1%), and self-employed (not incorporated) (159 | 13.1%) make up the most common classes of employment.
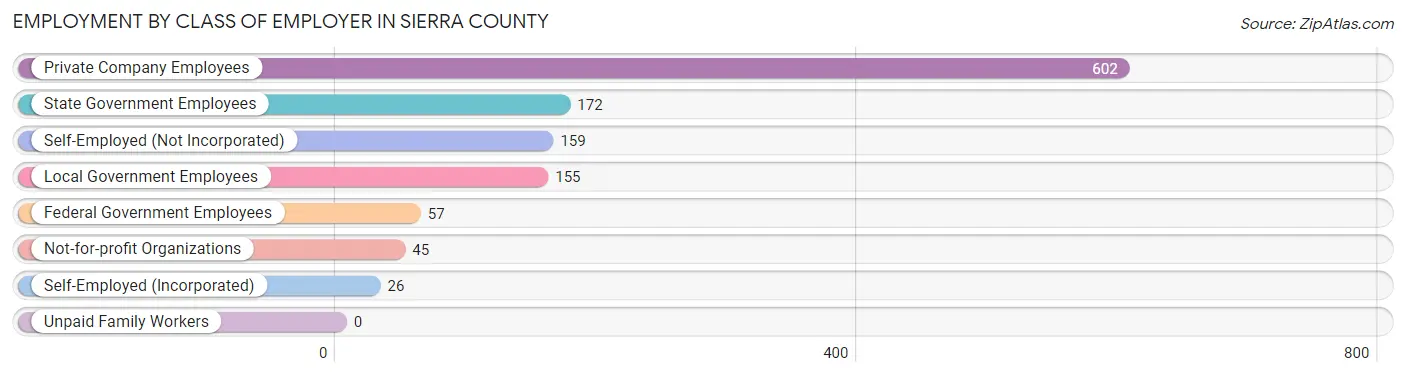
| Employer Class | # Employees | % Employees |
| Private Company Employees | 602 | 49.5% |
| Self-Employed (Incorporated) | 26 | 2.1% |
| Self-Employed (Not Incorporated) | 159 | 13.1% |
| Not-for-profit Organizations | 45 | 3.7% |
| Local Government Employees | 155 | 12.8% |
| State Government Employees | 172 | 14.1% |
| Federal Government Employees | 57 | 4.7% |
| Unpaid Family Workers | 0 | 0.0% |
| Total | 1,216 | 100.0% |
Employment Status by Age in Sierra County
According to the labor force statistics for Sierra County, out of the total population over 16 years of age (2,539), 51.9% or 1,318 individuals are in the labor force, with 5.6% or 74 of them unemployed. The age group with the highest labor force participation rate is 20 to 24 years, with 95.6% or 197 individuals in the labor force. Within the labor force, the 25 to 29 years age range has the highest percentage of unemployed individuals, with 46.2% or 67 of them being unemployed.
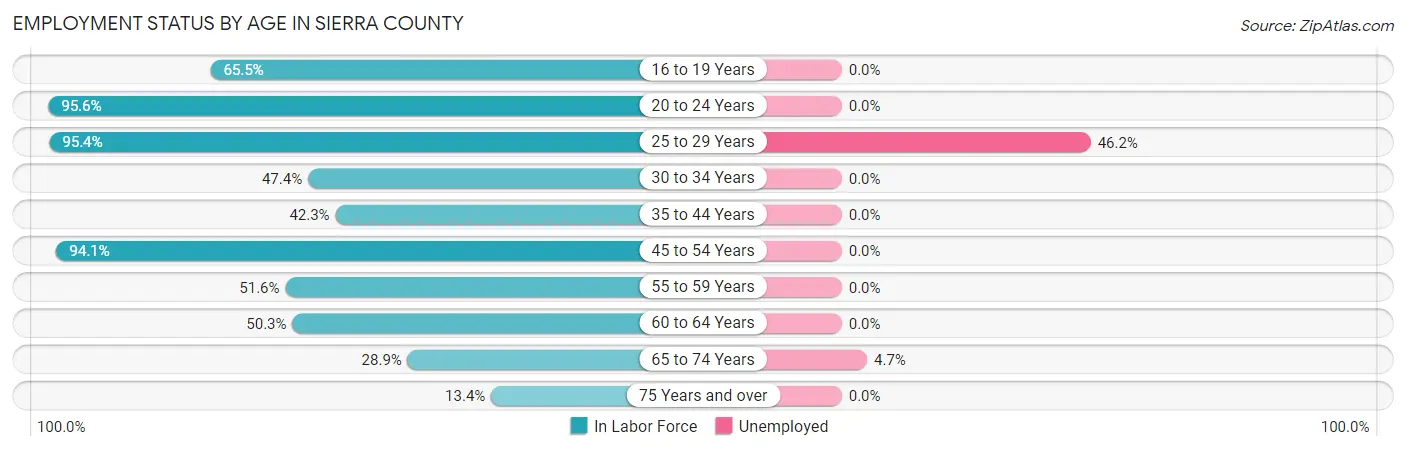
| Age Bracket | In Labor Force | Unemployed |
| 16 to 19 Years | 55 (65.5%) | 0 (0.0%) |
| 20 to 24 Years | 197 (95.6%) | 0 (0.0%) |
| 25 to 29 Years | 145 (95.4%) | 67 (46.2%) |
| 30 to 34 Years | 18 (47.4%) | 0 (0.0%) |
| 35 to 44 Years | 119 (42.3%) | 0 (0.0%) |
| 45 to 54 Years | 304 (94.1%) | 0 (0.0%) |
| 55 to 59 Years | 130 (51.6%) | 0 (0.0%) |
| 60 to 64 Years | 148 (50.3%) | 0 (0.0%) |
| 65 to 74 Years | 148 (28.9%) | 7 (4.7%) |
| 75 Years and over | 53 (13.4%) | 0 (0.0%) |
| Total | 1,318 (51.9%) | 74 (5.6%) |
Employment Status by Educational Attainment in Sierra County
According to labor force statistics for Sierra County, 64.5% of individuals (864) out of the total population between 25 and 64 years of age (1,340) are in the labor force, with 7.8% or 67 of them being unemployed. The group with the highest labor force participation rate are those with the educational attainment of bachelor's degree or higher, with 94.5% or 308 individuals in the labor force. Within the labor force, individuals with college / associate degree education have the highest percentage of unemployment, with 21.1% or 67 of them being unemployed.
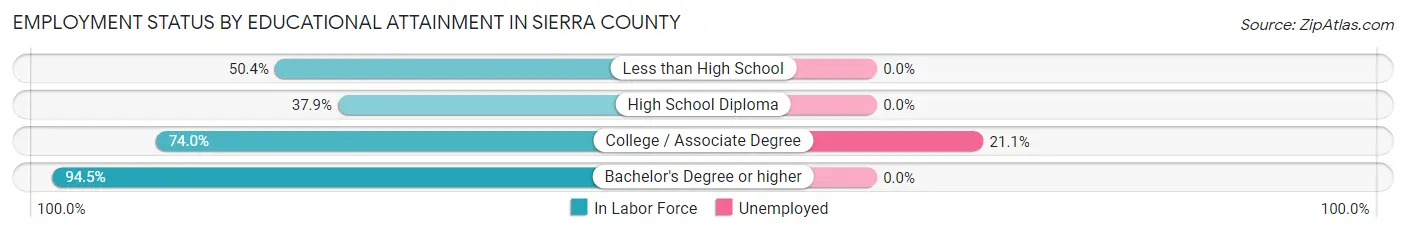
| Educational Attainment | In Labor Force | Unemployed |
| Less than High School | 67 (50.4%) | 0 (0.0%) |
| High School Diploma | 171 (37.9%) | 0 (0.0%) |
| College / Associate Degree | 318 (74.0%) | 91 (21.1%) |
| Bachelor's Degree or higher | 308 (94.5%) | 0 (0.0%) |
| Total | 864 (64.5%) | 105 (7.8%) |
Employment Occupations by Sex in Sierra County
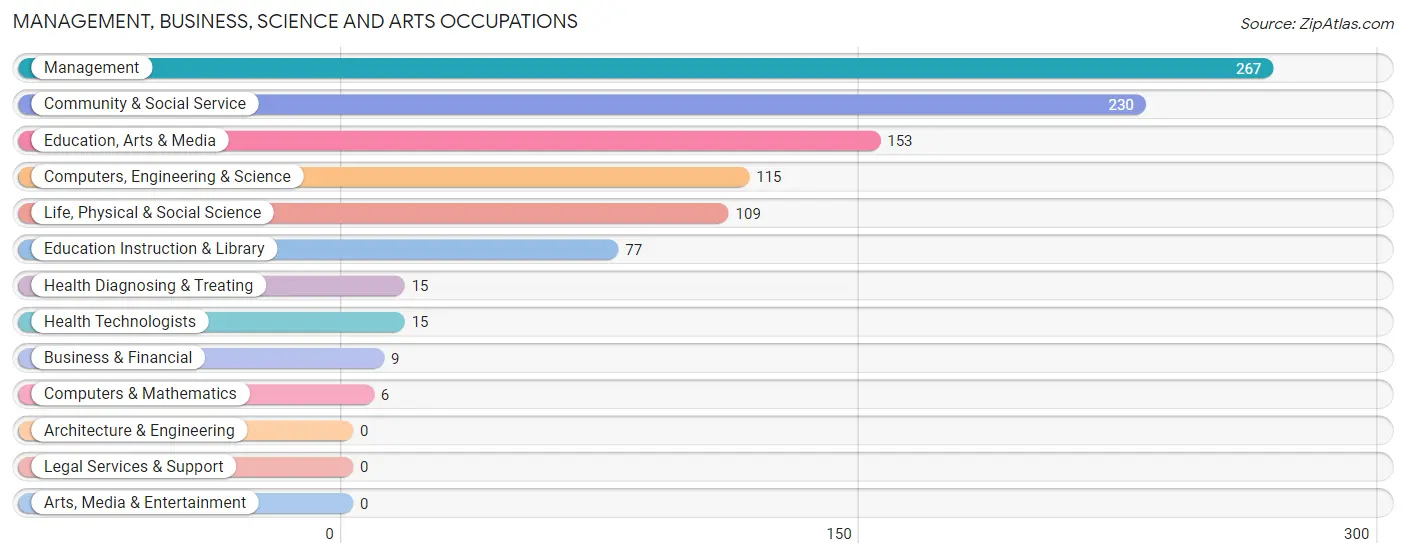
Management, Business, Science and Arts Occupations
The most common Management, Business, Science and Arts occupations in Sierra County are Management (267 | 21.5%), Community & Social Service (230 | 18.5%), Education, Arts & Media (153 | 12.3%), Computers, Engineering & Science (115 | 9.2%), and Life, Physical & Social Science (109 | 8.8%).
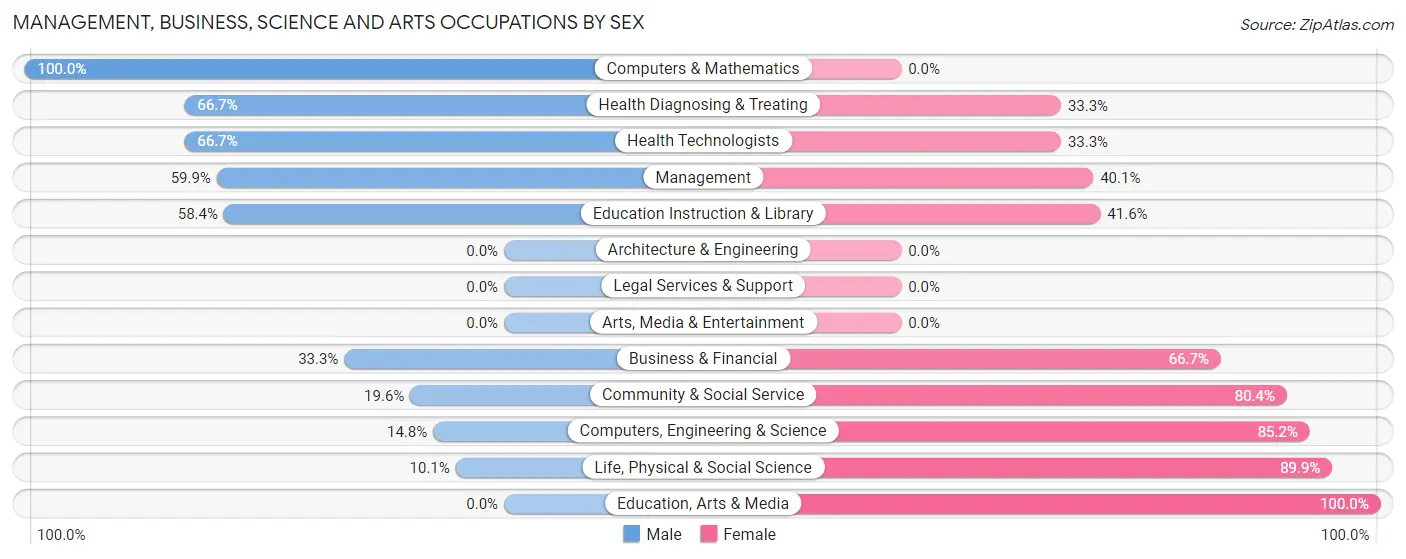
Management, Business, Science and Arts Occupations by Sex
Within the Management, Business, Science and Arts occupations in Sierra County, the most male-oriented occupations are Computers & Mathematics (100.0%), Health Diagnosing & Treating (66.7%), and Health Technologists (66.7%), while the most female-oriented occupations are Education, Arts & Media (100.0%), Life, Physical & Social Science (89.9%), and Computers, Engineering & Science (85.2%).
| Occupation | Male | Female |
| Management | 160 (59.9%) | 107 (40.1%) |
| Business & Financial | 3 (33.3%) | 6 (66.7%) |
| Computers, Engineering & Science | 17 (14.8%) | 98 (85.2%) |
| Computers & Mathematics | 6 (100.0%) | 0 (0.0%) |
| Architecture & Engineering | 0 (0.0%) | 0 (0.0%) |
| Life, Physical & Social Science | 11 (10.1%) | 98 (89.9%) |
| Community & Social Service | 45 (19.6%) | 185 (80.4%) |
| Education, Arts & Media | 0 (0.0%) | 153 (100.0%) |
| Legal Services & Support | 0 (0.0%) | 0 (0.0%) |
| Education Instruction & Library | 45 (58.4%) | 32 (41.6%) |
| Arts, Media & Entertainment | 0 (0.0%) | 0 (0.0%) |
| Health Diagnosing & Treating | 10 (66.7%) | 5 (33.3%) |
| Health Technologists | 10 (66.7%) | 5 (33.3%) |
| Total (Category) | 235 (36.9%) | 401 (63.0%) |
| Total (Overall) | 522 (42.0%) | 721 (58.0%) |
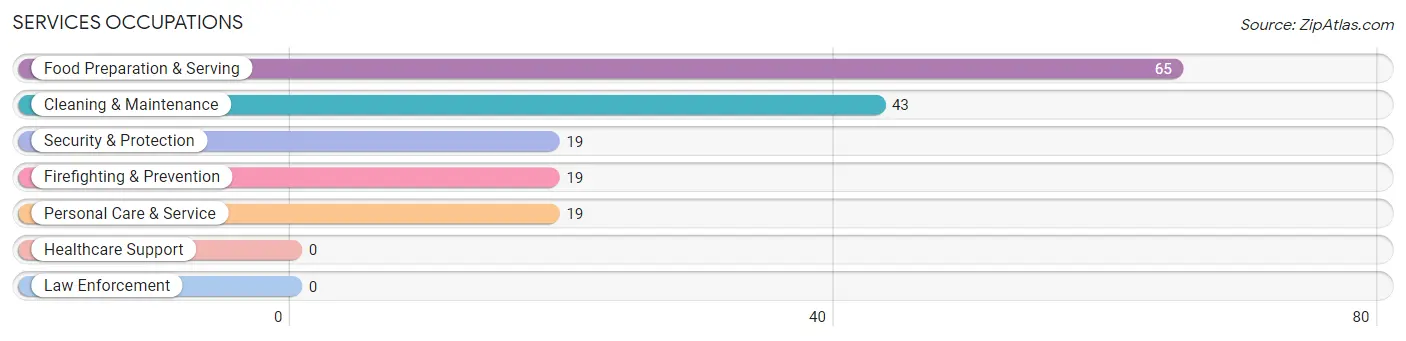
Services Occupations
The most common Services occupations in Sierra County are Food Preparation & Serving (65 | 5.2%), Cleaning & Maintenance (43 | 3.5%), Security & Protection (19 | 1.5%), Firefighting & Prevention (19 | 1.5%), and Personal Care & Service (19 | 1.5%).
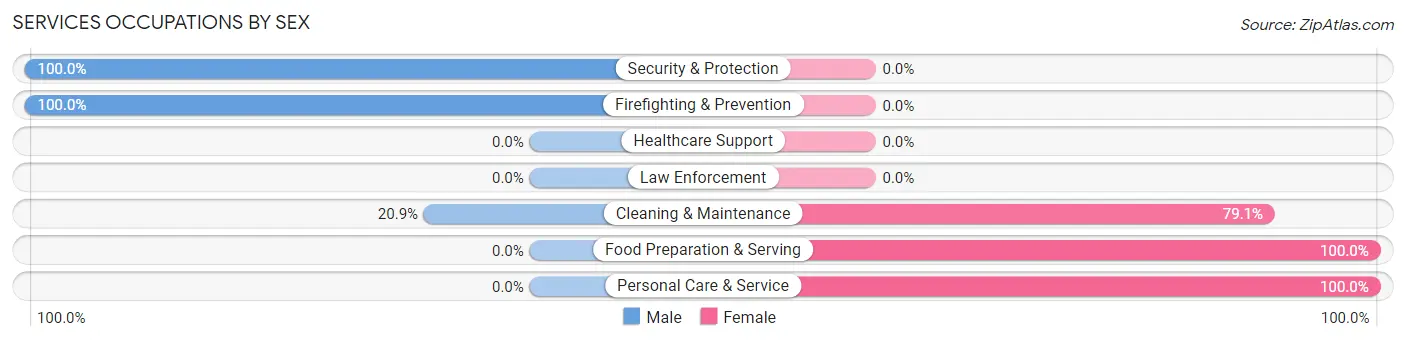
Services Occupations by Sex
Within the Services occupations in Sierra County, the most male-oriented occupations are Security & Protection (100.0%), Firefighting & Prevention (100.0%), and Cleaning & Maintenance (20.9%), while the most female-oriented occupations are Food Preparation & Serving (100.0%), Personal Care & Service (100.0%), and Cleaning & Maintenance (79.1%).
| Occupation | Male | Female |
| Healthcare Support | 0 (0.0%) | 0 (0.0%) |
| Security & Protection | 19 (100.0%) | 0 (0.0%) |
| Firefighting & Prevention | 19 (100.0%) | 0 (0.0%) |
| Law Enforcement | 0 (0.0%) | 0 (0.0%) |
| Food Preparation & Serving | 0 (0.0%) | 65 (100.0%) |
| Cleaning & Maintenance | 9 (20.9%) | 34 (79.1%) |
| Personal Care & Service | 0 (0.0%) | 19 (100.0%) |
| Total (Category) | 28 (19.2%) | 118 (80.8%) |
| Total (Overall) | 522 (42.0%) | 721 (58.0%) |
Sales and Office Occupations
The most common Sales and Office occupations in Sierra County are Sales & Related (115 | 9.2%), and Office & Administration (101 | 8.1%).
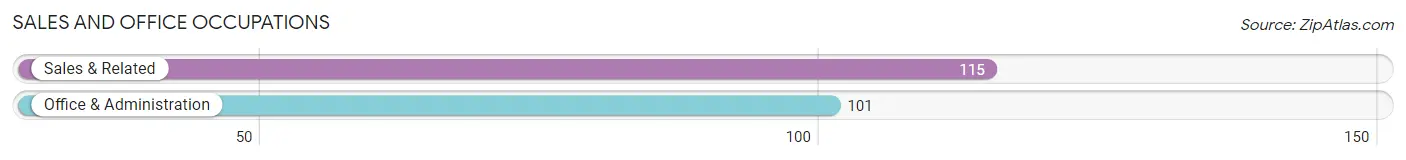
Sales and Office Occupations by Sex

| Occupation | Male | Female |
| Sales & Related | 14 (12.2%) | 101 (87.8%) |
| Office & Administration | 0 (0.0%) | 101 (100.0%) |
| Total (Category) | 14 (6.5%) | 202 (93.5%) |
| Total (Overall) | 522 (42.0%) | 721 (58.0%) |
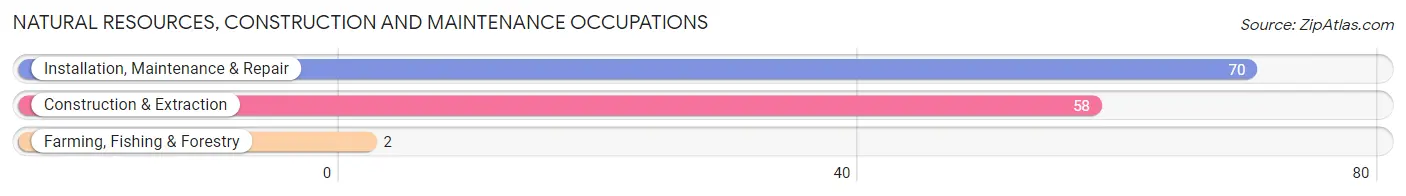
Natural Resources, Construction and Maintenance Occupations
The most common Natural Resources, Construction and Maintenance occupations in Sierra County are Installation, Maintenance & Repair (70 | 5.6%), Construction & Extraction (58 | 4.7%), and Farming, Fishing & Forestry (2 | 0.2%).
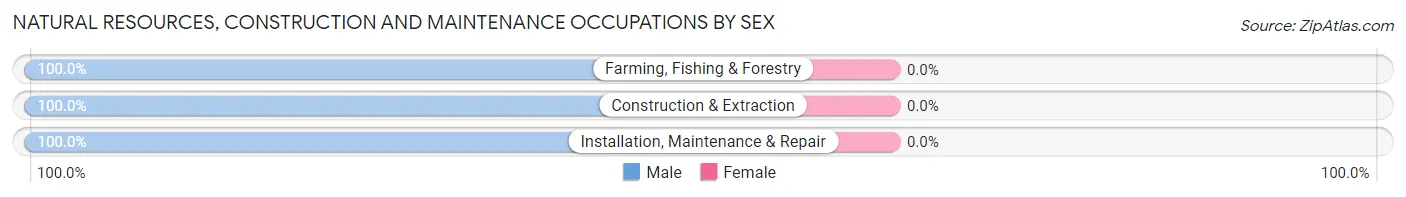
Natural Resources, Construction and Maintenance Occupations by Sex
| Occupation | Male | Female |
| Farming, Fishing & Forestry | 2 (100.0%) | 0 (0.0%) |
| Construction & Extraction | 58 (100.0%) | 0 (0.0%) |
| Installation, Maintenance & Repair | 70 (100.0%) | 0 (0.0%) |
| Total (Category) | 130 (100.0%) | 0 (0.0%) |
| Total (Overall) | 522 (42.0%) | 721 (58.0%) |
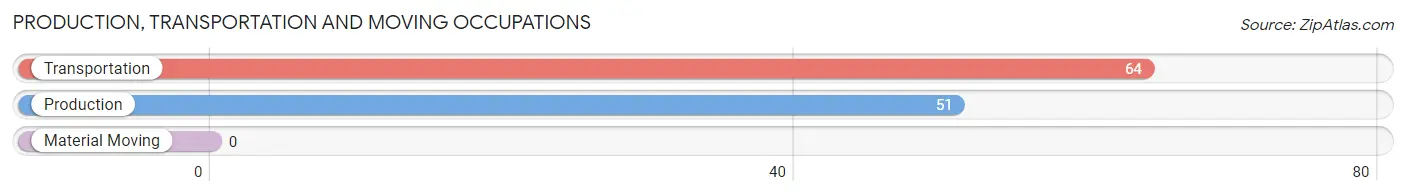
Production, Transportation and Moving Occupations
The most common Production, Transportation and Moving occupations in Sierra County are Transportation (64 | 5.1%), and Production (51 | 4.1%).
Production, Transportation and Moving Occupations by Sex
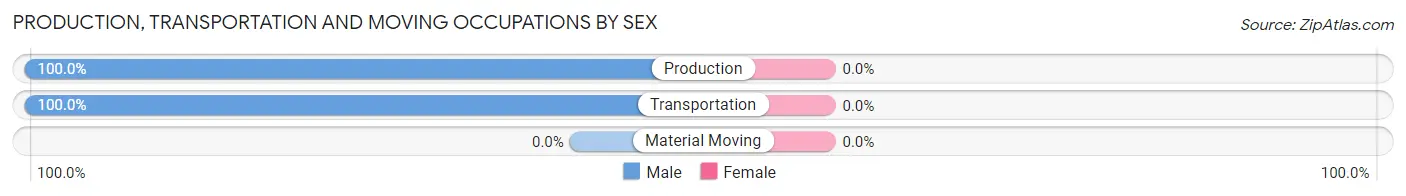
| Occupation | Male | Female |
| Production | 51 (100.0%) | 0 (0.0%) |
| Transportation | 64 (100.0%) | 0 (0.0%) |
| Material Moving | 0 (0.0%) | 0 (0.0%) |
| Total (Category) | 115 (100.0%) | 0 (0.0%) |
| Total (Overall) | 522 (42.0%) | 721 (58.0%) |
Employment Industries by Sex in Sierra County
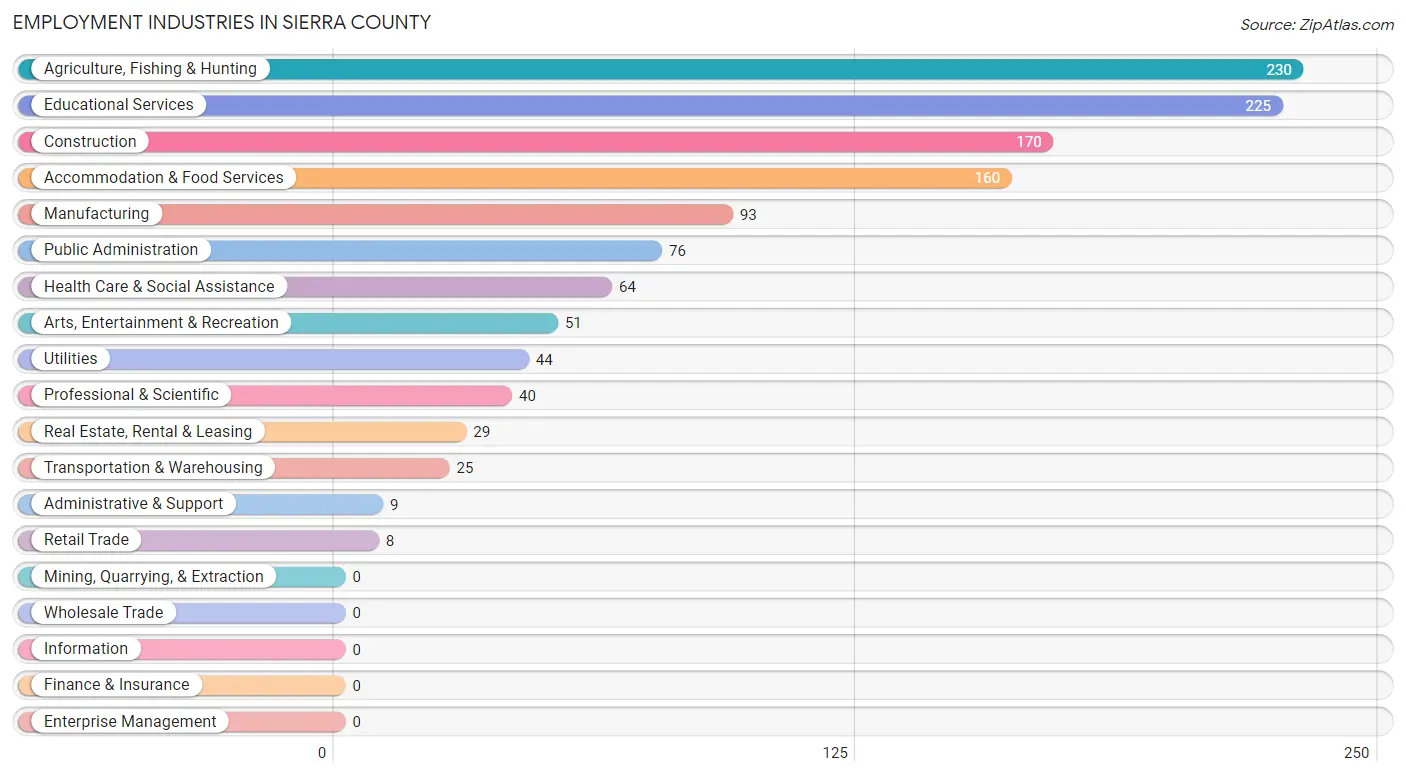
Employment Industries in Sierra County
The major employment industries in Sierra County include Agriculture, Fishing & Hunting (230 | 18.5%), Educational Services (225 | 18.1%), Construction (170 | 13.7%), Accommodation & Food Services (160 | 12.9%), and Manufacturing (93 | 7.5%).
Employment Industries by Sex in Sierra County
The Sierra County industries that see more men than women are Retail Trade (100.0%), Transportation & Warehousing (100.0%), and Utilities (100.0%), whereas the industries that tend to have a higher number of women are Real Estate, Rental & Leasing (100.0%), Accommodation & Food Services (100.0%), and Professional & Scientific (85.0%).
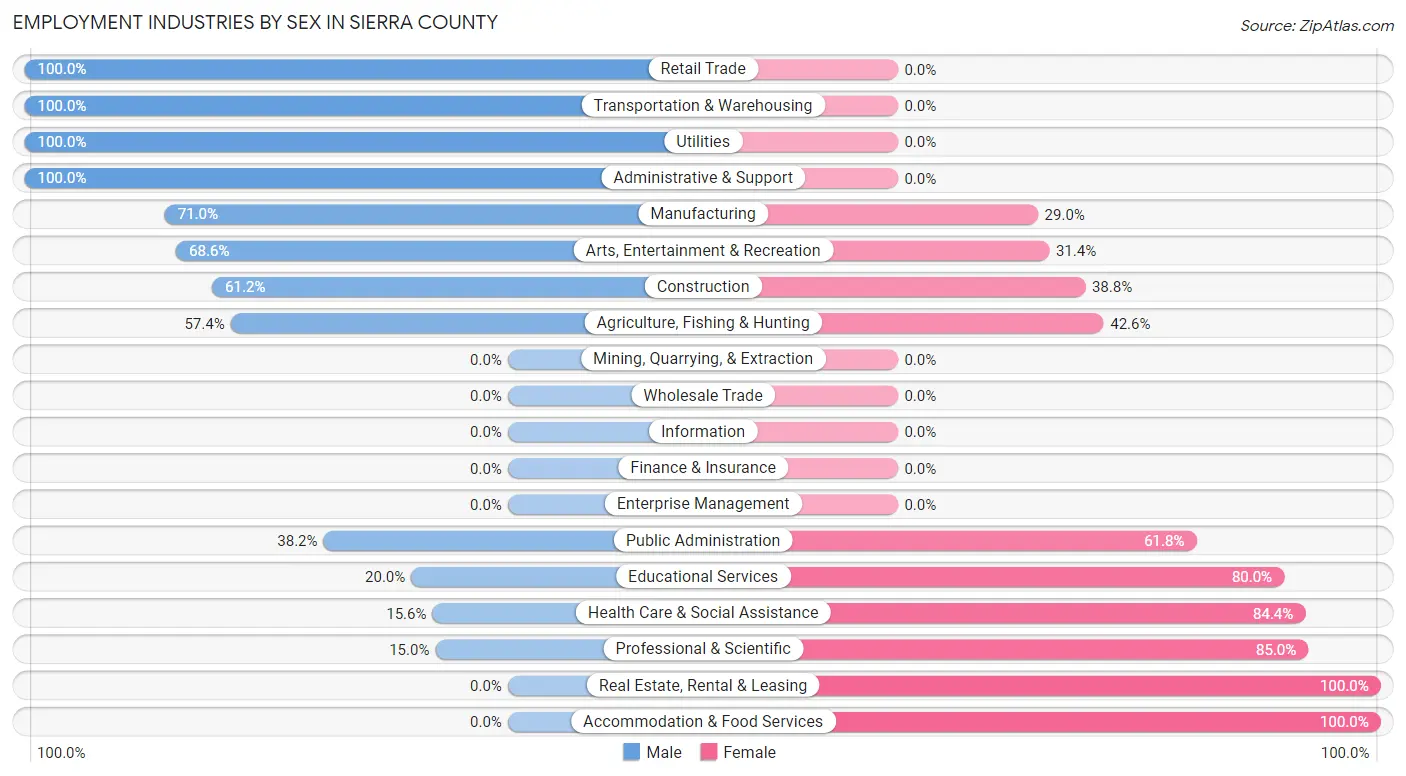
| Industry | Male | Female |
| Agriculture, Fishing & Hunting | 132 (57.4%) | 98 (42.6%) |
| Mining, Quarrying, & Extraction | 0 (0.0%) | 0 (0.0%) |
| Construction | 104 (61.2%) | 66 (38.8%) |
| Manufacturing | 66 (71.0%) | 27 (29.0%) |
| Wholesale Trade | 0 (0.0%) | 0 (0.0%) |
| Retail Trade | 8 (100.0%) | 0 (0.0%) |
| Transportation & Warehousing | 25 (100.0%) | 0 (0.0%) |
| Utilities | 44 (100.0%) | 0 (0.0%) |
| Information | 0 (0.0%) | 0 (0.0%) |
| Finance & Insurance | 0 (0.0%) | 0 (0.0%) |
| Real Estate, Rental & Leasing | 0 (0.0%) | 29 (100.0%) |
| Professional & Scientific | 6 (15.0%) | 34 (85.0%) |
| Enterprise Management | 0 (0.0%) | 0 (0.0%) |
| Administrative & Support | 9 (100.0%) | 0 (0.0%) |
| Educational Services | 45 (20.0%) | 180 (80.0%) |
| Health Care & Social Assistance | 10 (15.6%) | 54 (84.4%) |
| Arts, Entertainment & Recreation | 35 (68.6%) | 16 (31.4%) |
| Accommodation & Food Services | 0 (0.0%) | 160 (100.0%) |
| Public Administration | 29 (38.2%) | 47 (61.8%) |
| Total | 522 (42.0%) | 721 (58.0%) |
Education in Sierra County
School Enrollment in Sierra County
The most common levels of schooling among the 658 students in Sierra County are college / undergraduate (252 | 38.3%), middle school (219 | 33.3%), and elementary school (102 | 15.5%).
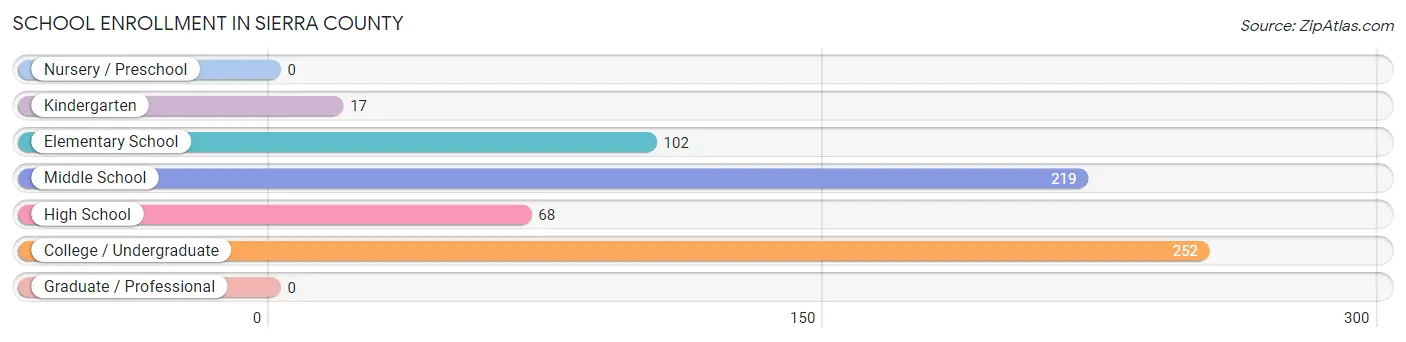
| School Level | # Students | % Students |
| Nursery / Preschool | 0 | 0.0% |
| Kindergarten | 17 | 2.6% |
| Elementary School | 102 | 15.5% |
| Middle School | 219 | 33.3% |
| High School | 68 | 10.3% |
| College / Undergraduate | 252 | 38.3% |
| Graduate / Professional | 0 | 0.0% |
| Total | 658 | 100.0% |
School Enrollment by Age by Funding Source in Sierra County
Out of a total of 658 students who are enrolled in schools in Sierra County, 68 (10.3%) attend a private institution, while the remaining 590 (89.7%) are enrolled in public schools. The age group of 5 to 9 year old has the highest likelihood of being enrolled in private schools, with 68 (57.1% in the age bracket) enrolled. Conversely, the age group of 10 to 14 year olds has the lowest likelihood of being enrolled in a private school, with 219 (100.0% in the age bracket) attending a public institution.
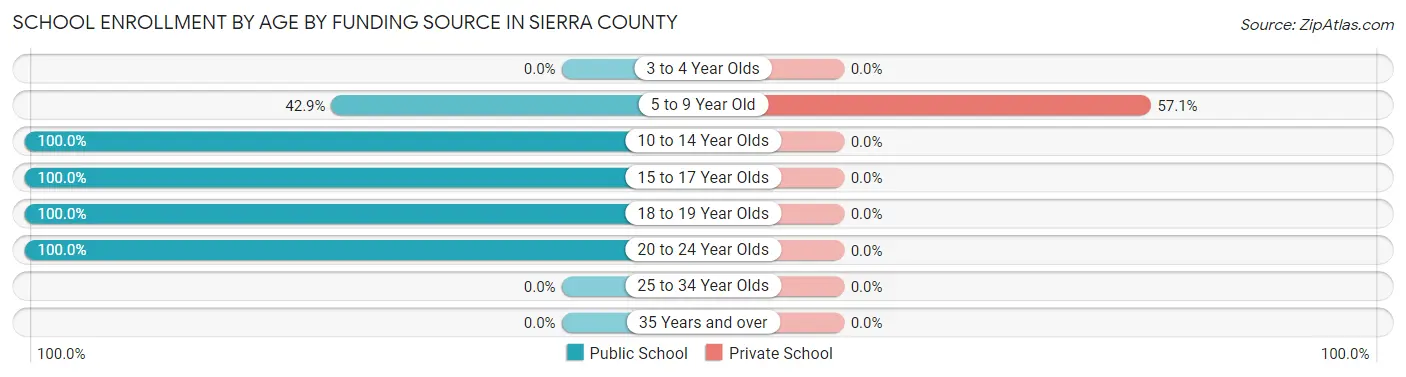
| Age Bracket | Public School | Private School |
| 3 to 4 Year Olds | 0 (0.0%) | 0 (0.0%) |
| 5 to 9 Year Old | 51 (42.9%) | 68 (57.1%) |
| 10 to 14 Year Olds | 219 (100.0%) | 0 (0.0%) |
| 15 to 17 Year Olds | 68 (100.0%) | 0 (0.0%) |
| 18 to 19 Year Olds | 55 (100.0%) | 0 (0.0%) |
| 20 to 24 Year Olds | 197 (100.0%) | 0 (0.0%) |
| 25 to 34 Year Olds | 0 (0.0%) | 0 (0.0%) |
| 35 Years and over | 0 (0.0%) | 0 (0.0%) |
| Total | 590 (89.7%) | 68 (10.3%) |
Educational Attainment by Field of Study in Sierra County
Bio, nature & agricultural (128 | 23.2%), education (127 | 23.0%), liberal arts & history (53 | 9.6%), social sciences (50 | 9.1%), and arts & humanities (49 | 8.9%) are the most common fields of study among 552 individuals in Sierra County who have obtained a bachelor's degree or higher.
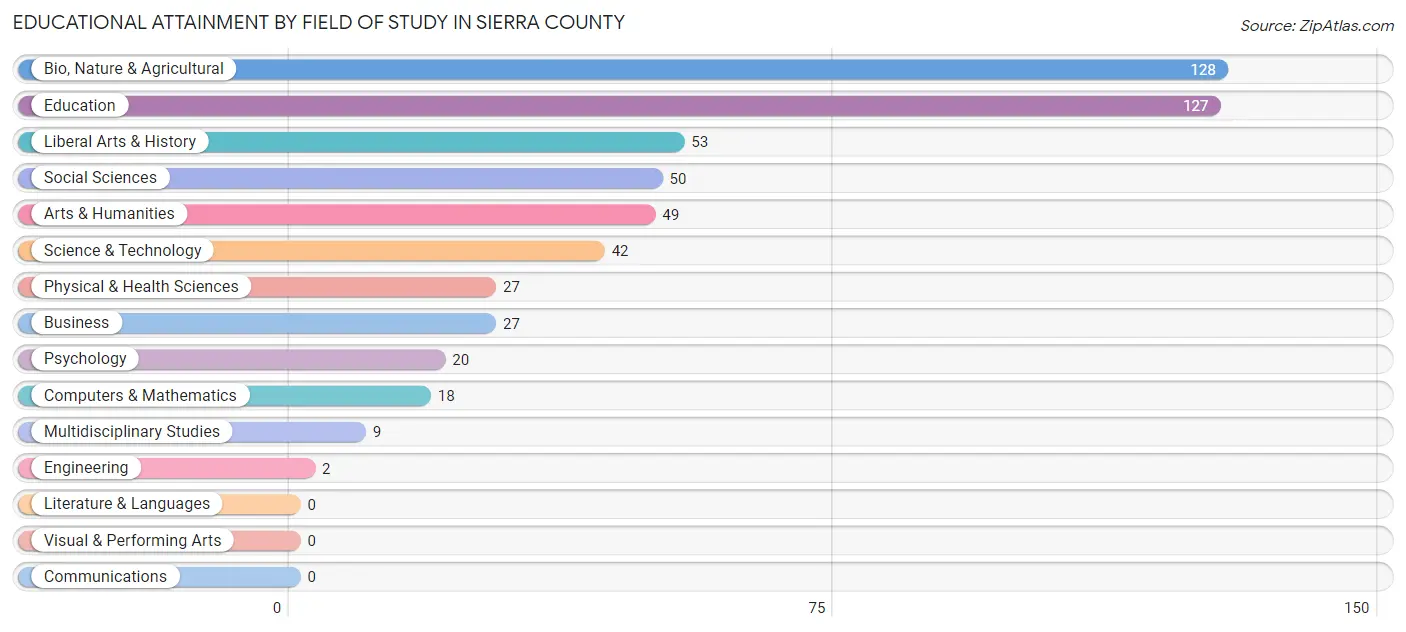
| Field of Study | # Graduates | % Graduates |
| Computers & Mathematics | 18 | 3.3% |
| Bio, Nature & Agricultural | 128 | 23.2% |
| Physical & Health Sciences | 27 | 4.9% |
| Psychology | 20 | 3.6% |
| Social Sciences | 50 | 9.1% |
| Engineering | 2 | 0.4% |
| Multidisciplinary Studies | 9 | 1.6% |
| Science & Technology | 42 | 7.6% |
| Business | 27 | 4.9% |
| Education | 127 | 23.0% |
| Literature & Languages | 0 | 0.0% |
| Liberal Arts & History | 53 | 9.6% |
| Visual & Performing Arts | 0 | 0.0% |
| Communications | 0 | 0.0% |
| Arts & Humanities | 49 | 8.9% |
| Total | 552 | 100.0% |
Transportation & Commute in Sierra County
Vehicle Availability by Sex in Sierra County
The most prevalent vehicle ownership categories in Sierra County are males with 2 vehicles (177, accounting for 34.8%) and females with 2 vehicles (291, making up 25.1%).
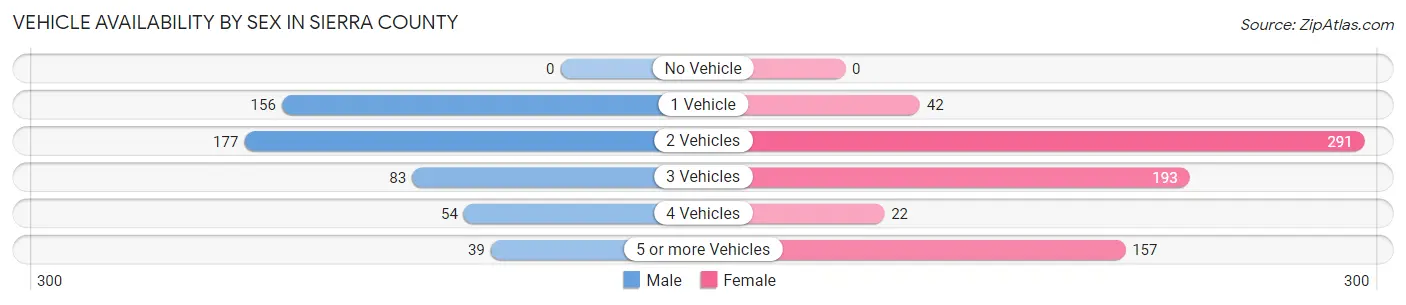
| Vehicles Available | Male | Female |
| No Vehicle | 0 (0.0%) | 0 (0.0%) |
| 1 Vehicle | 156 (30.6%) | 42 (6.0%) |
| 2 Vehicles | 177 (34.8%) | 291 (41.3%) |
| 3 Vehicles | 83 (16.3%) | 193 (27.4%) |
| 4 Vehicles | 54 (10.6%) | 22 (3.1%) |
| 5 or more Vehicles | 39 (7.7%) | 157 (22.3%) |
| Total | 509 (100.0%) | 705 (100.0%) |
Commute Time in Sierra County
The most frequently occuring commute durations in Sierra County are 30 to 34 minutes (222 commuters, 20.7%), less than 5 minutes (198 commuters, 18.5%), and 60 to 89 minutes (130 commuters, 12.1%).
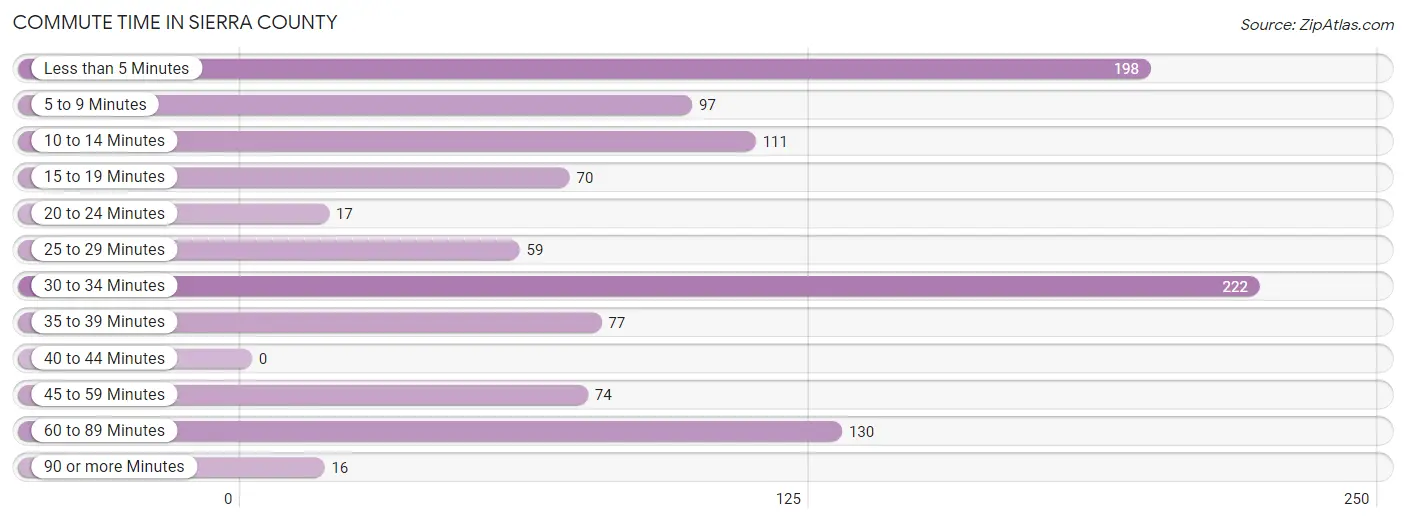
| Commute Time | # Commuters | % Commuters |
| Less than 5 Minutes | 198 | 18.5% |
| 5 to 9 Minutes | 97 | 9.1% |
| 10 to 14 Minutes | 111 | 10.4% |
| 15 to 19 Minutes | 70 | 6.5% |
| 20 to 24 Minutes | 17 | 1.6% |
| 25 to 29 Minutes | 59 | 5.5% |
| 30 to 34 Minutes | 222 | 20.7% |
| 35 to 39 Minutes | 77 | 7.2% |
| 40 to 44 Minutes | 0 | 0.0% |
| 45 to 59 Minutes | 74 | 6.9% |
| 60 to 89 Minutes | 130 | 12.1% |
| 90 or more Minutes | 16 | 1.5% |
Commute Time by Sex in Sierra County
The most common commute times in Sierra County are less than 5 minutes (169 commuters, 36.0%) for males and 30 to 34 minutes (222 commuters, 36.9%) for females.
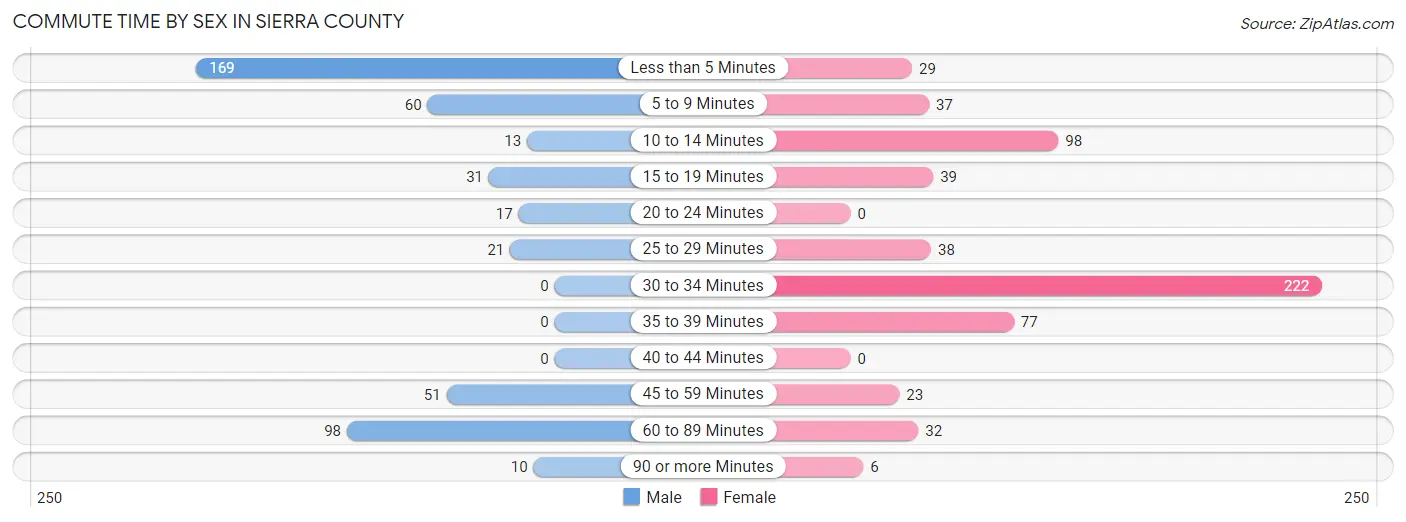
| Commute Time | Male | Female |
| Less than 5 Minutes | 169 (36.0%) | 29 (4.8%) |
| 5 to 9 Minutes | 60 (12.8%) | 37 (6.2%) |
| 10 to 14 Minutes | 13 (2.8%) | 98 (16.3%) |
| 15 to 19 Minutes | 31 (6.6%) | 39 (6.5%) |
| 20 to 24 Minutes | 17 (3.6%) | 0 (0.0%) |
| 25 to 29 Minutes | 21 (4.5%) | 38 (6.3%) |
| 30 to 34 Minutes | 0 (0.0%) | 222 (36.9%) |
| 35 to 39 Minutes | 0 (0.0%) | 77 (12.8%) |
| 40 to 44 Minutes | 0 (0.0%) | 0 (0.0%) |
| 45 to 59 Minutes | 51 (10.8%) | 23 (3.8%) |
| 60 to 89 Minutes | 98 (20.8%) | 32 (5.3%) |
| 90 or more Minutes | 10 (2.1%) | 6 (1.0%) |
Time of Departure to Work by Sex in Sierra County
The most frequent times of departure to work in Sierra County are 7:00 AM to 7:29 AM (182, 38.7%) for males and 8:30 AM to 8:59 AM (192, 32.0%) for females.
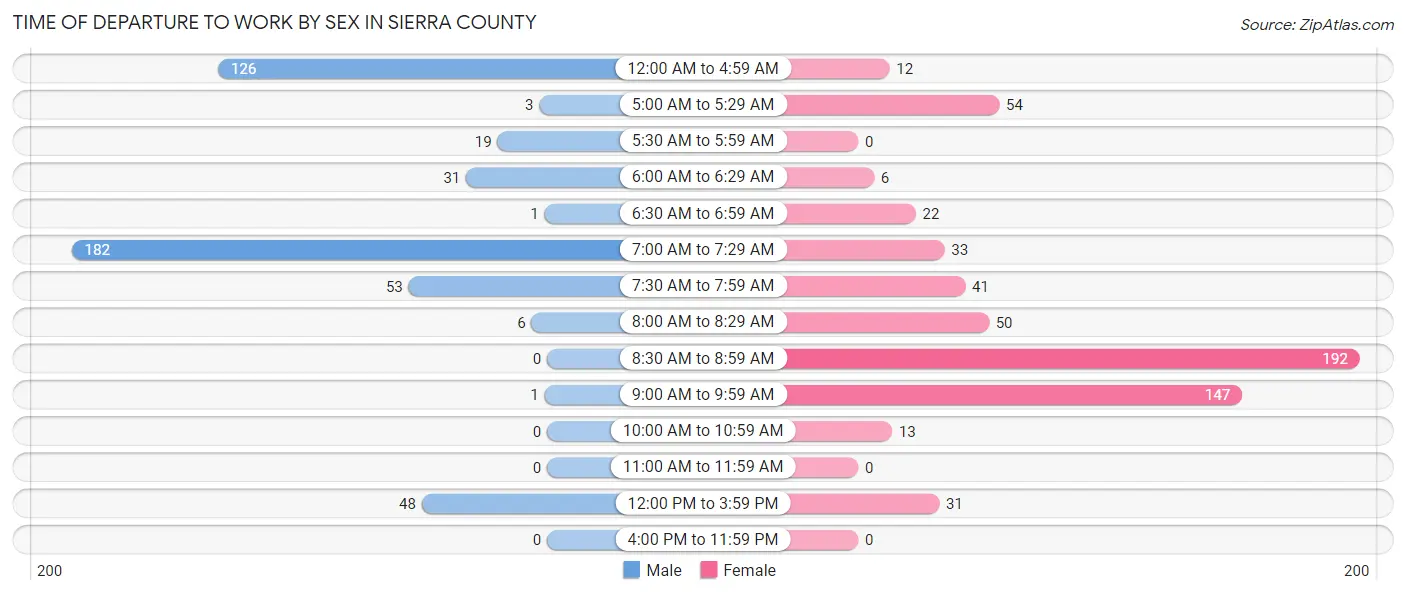
| Time of Departure | Male | Female |
| 12:00 AM to 4:59 AM | 126 (26.8%) | 12 (2.0%) |
| 5:00 AM to 5:29 AM | 3 (0.6%) | 54 (9.0%) |
| 5:30 AM to 5:59 AM | 19 (4.0%) | 0 (0.0%) |
| 6:00 AM to 6:29 AM | 31 (6.6%) | 6 (1.0%) |
| 6:30 AM to 6:59 AM | 1 (0.2%) | 22 (3.7%) |
| 7:00 AM to 7:29 AM | 182 (38.7%) | 33 (5.5%) |
| 7:30 AM to 7:59 AM | 53 (11.3%) | 41 (6.8%) |
| 8:00 AM to 8:29 AM | 6 (1.3%) | 50 (8.3%) |
| 8:30 AM to 8:59 AM | 0 (0.0%) | 192 (32.0%) |
| 9:00 AM to 9:59 AM | 1 (0.2%) | 147 (24.5%) |
| 10:00 AM to 10:59 AM | 0 (0.0%) | 13 (2.2%) |
| 11:00 AM to 11:59 AM | 0 (0.0%) | 0 (0.0%) |
| 12:00 PM to 3:59 PM | 48 (10.2%) | 31 (5.2%) |
| 4:00 PM to 11:59 PM | 0 (0.0%) | 0 (0.0%) |
| Total | 470 (100.0%) | 601 (100.0%) |
Housing Occupancy in Sierra County
Occupancy by Ownership in Sierra County
Of the total 1,135 dwellings in Sierra County, owner-occupied units account for 940 (82.8%), while renter-occupied units make up 195 (17.2%).
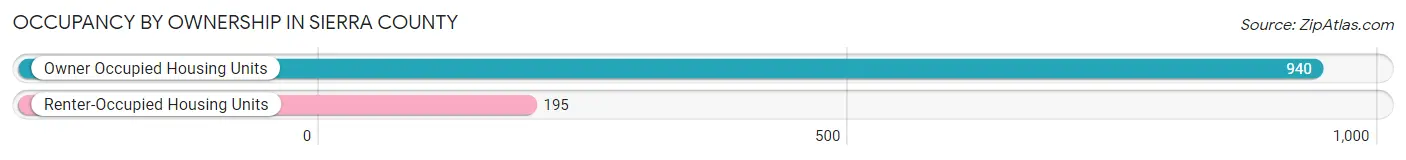
| Occupancy | # Housing Units | % Housing Units |
| Owner Occupied Housing Units | 940 | 82.8% |
| Renter-Occupied Housing Units | 195 | 17.2% |
| Total Occupied Housing Units | 1,135 | 100.0% |
Occupancy by Household Size in Sierra County
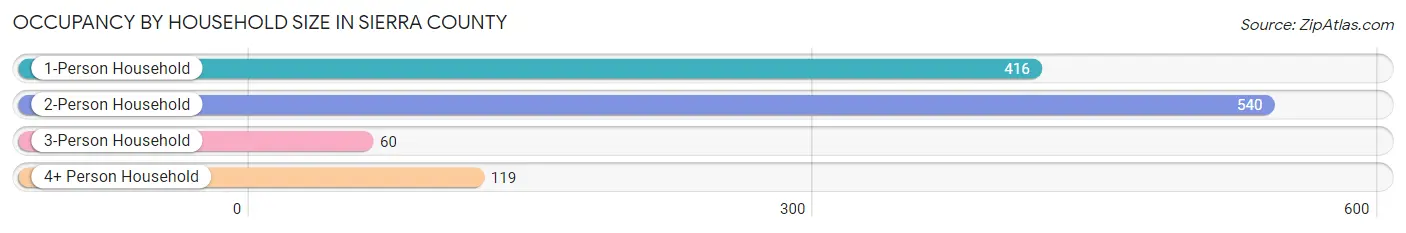
| Household Size | # Housing Units | % Housing Units |
| 1-Person Household | 416 | 36.6% |
| 2-Person Household | 540 | 47.6% |
| 3-Person Household | 60 | 5.3% |
| 4+ Person Household | 119 | 10.5% |
| Total Housing Units | 1,135 | 100.0% |
Occupancy by Ownership by Household Size in Sierra County
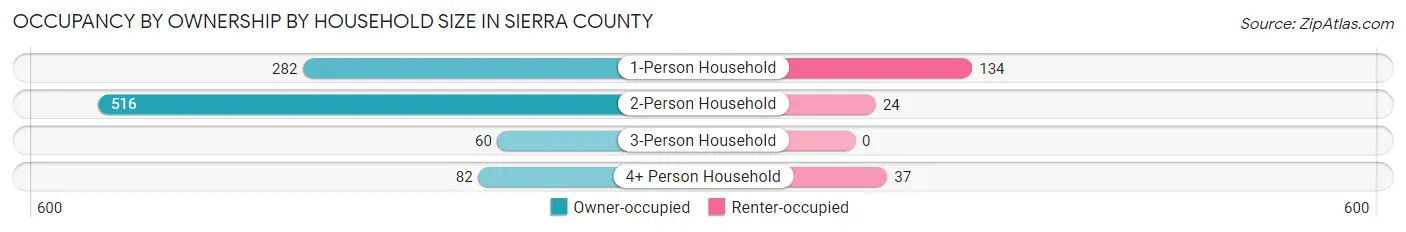
| Household Size | Owner-occupied | Renter-occupied |
| 1-Person Household | 282 (67.8%) | 134 (32.2%) |
| 2-Person Household | 516 (95.6%) | 24 (4.4%) |
| 3-Person Household | 60 (100.0%) | 0 (0.0%) |
| 4+ Person Household | 82 (68.9%) | 37 (31.1%) |
| Total Housing Units | 940 (82.8%) | 195 (17.2%) |
Occupancy by Educational Attainment in Sierra County
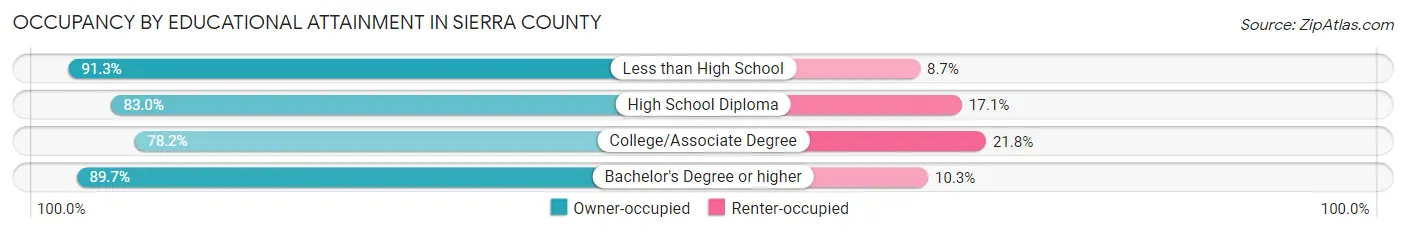
| Household Size | Owner-occupied | Renter-occupied |
| Less than High School | 63 (91.3%) | 6 (8.7%) |
| High School Diploma | 287 (83.0%) | 59 (17.1%) |
| College/Associate Degree | 381 (78.2%) | 106 (21.8%) |
| Bachelor's Degree or higher | 209 (89.7%) | 24 (10.3%) |
Occupancy by Age of Householder in Sierra County
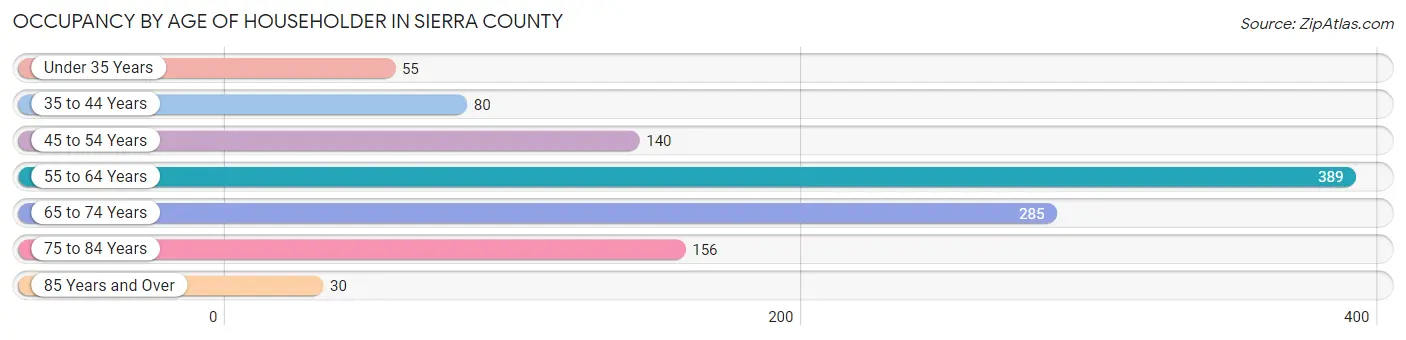
| Age Bracket | # Households | % Households |
| Under 35 Years | 55 | 4.9% |
| 35 to 44 Years | 80 | 7.0% |
| 45 to 54 Years | 140 | 12.3% |
| 55 to 64 Years | 389 | 34.3% |
| 65 to 74 Years | 285 | 25.1% |
| 75 to 84 Years | 156 | 13.7% |
| 85 Years and Over | 30 | 2.6% |
| Total | 1,135 | 100.0% |
Housing Finances in Sierra County
Median Income by Occupancy in Sierra County
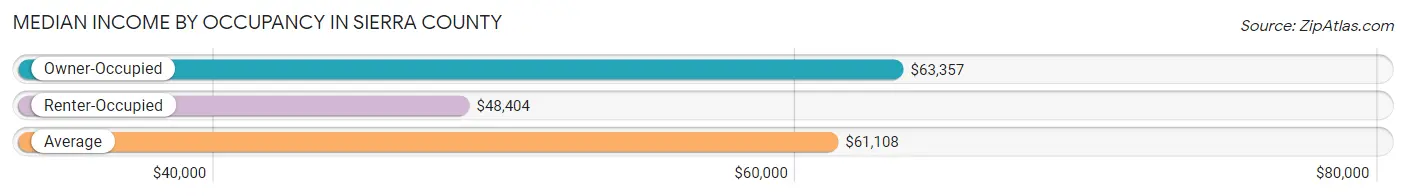
| Occupancy Type | # Households | Median Income |
| Owner-Occupied | 940 (82.8%) | $63,357 |
| Renter-Occupied | 195 (17.2%) | $48,404 |
| Average | 1,135 (100.0%) | $61,108 |
Occupancy by Householder Income Bracket in Sierra County
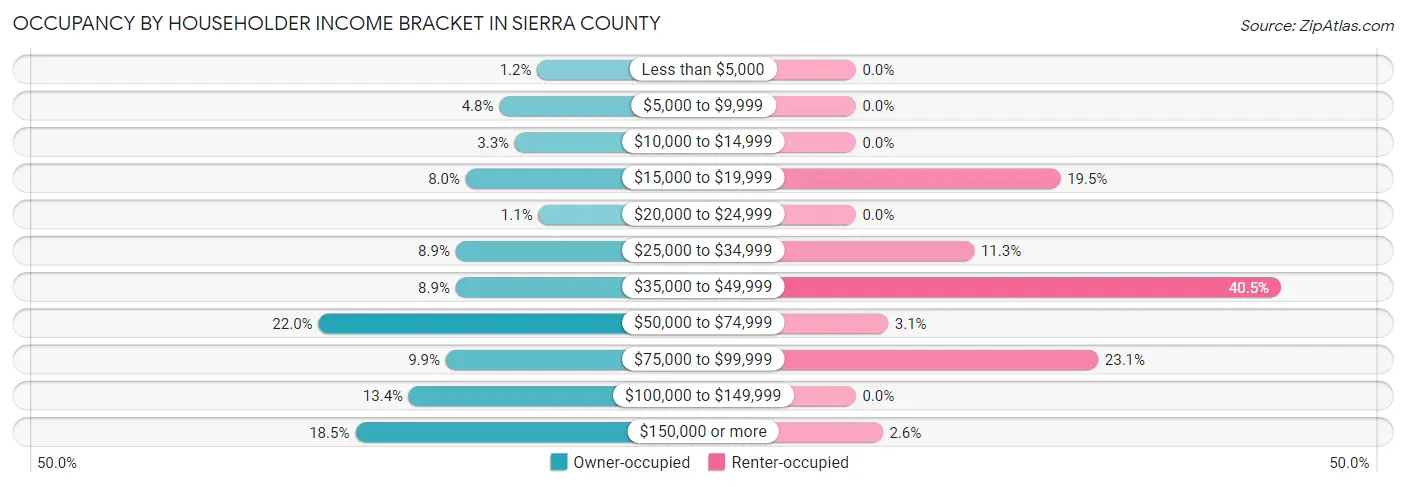
| Income Bracket | Owner-occupied | Renter-occupied |
| Less than $5,000 | 11 (1.2%) | 0 (0.0%) |
| $5,000 to $9,999 | 45 (4.8%) | 0 (0.0%) |
| $10,000 to $14,999 | 31 (3.3%) | 0 (0.0%) |
| $15,000 to $19,999 | 75 (8.0%) | 38 (19.5%) |
| $20,000 to $24,999 | 10 (1.1%) | 0 (0.0%) |
| $25,000 to $34,999 | 84 (8.9%) | 22 (11.3%) |
| $35,000 to $49,999 | 84 (8.9%) | 79 (40.5%) |
| $50,000 to $74,999 | 207 (22.0%) | 6 (3.1%) |
| $75,000 to $99,999 | 93 (9.9%) | 45 (23.1%) |
| $100,000 to $149,999 | 126 (13.4%) | 0 (0.0%) |
| $150,000 or more | 174 (18.5%) | 5 (2.6%) |
| Total | 940 (100.0%) | 195 (100.0%) |
Monthly Housing Cost Tiers in Sierra County
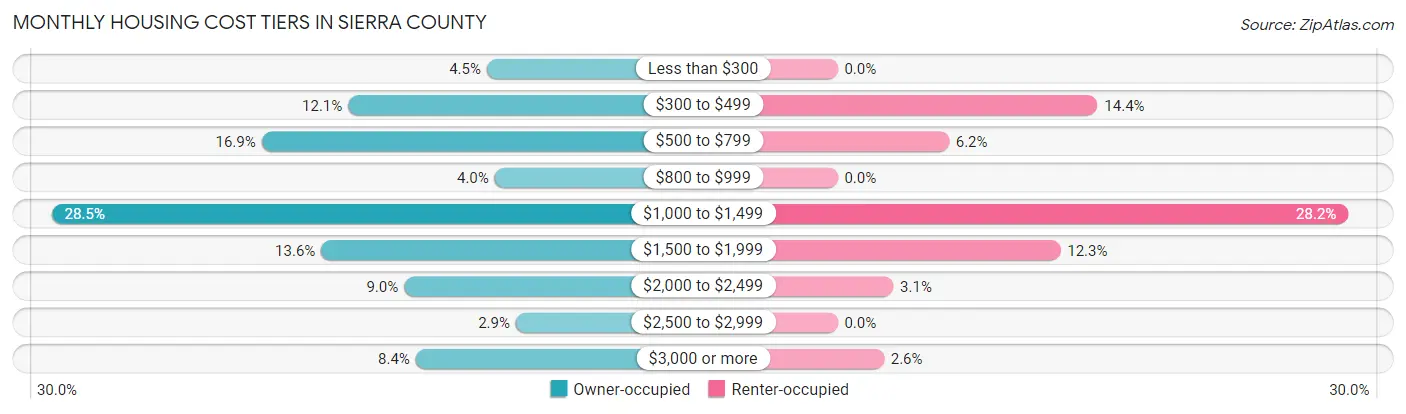
| Monthly Cost | Owner-occupied | Renter-occupied |
| Less than $300 | 42 (4.5%) | 0 (0.0%) |
| $300 to $499 | 114 (12.1%) | 28 (14.4%) |
| $500 to $799 | 159 (16.9%) | 12 (6.1%) |
| $800 to $999 | 38 (4.0%) | 0 (0.0%) |
| $1,000 to $1,499 | 268 (28.5%) | 55 (28.2%) |
| $1,500 to $1,999 | 128 (13.6%) | 24 (12.3%) |
| $2,000 to $2,499 | 85 (9.0%) | 6 (3.1%) |
| $2,500 to $2,999 | 27 (2.9%) | 0 (0.0%) |
| $3,000 or more | 79 (8.4%) | 5 (2.6%) |
| Total | 940 (100.0%) | 195 (100.0%) |
Physical Housing Characteristics in Sierra County
Housing Structures in Sierra County
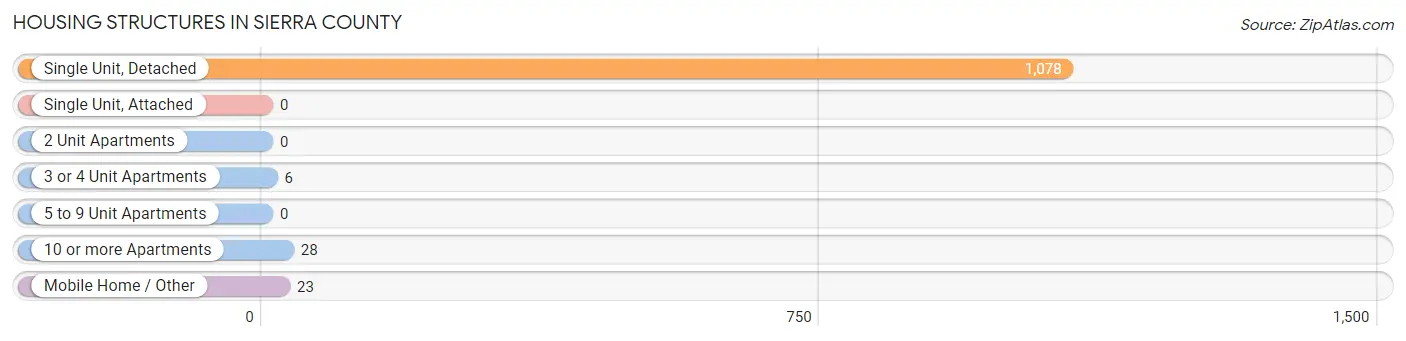
| Structure Type | # Housing Units | % Housing Units |
| Single Unit, Detached | 1,078 | 95.0% |
| Single Unit, Attached | 0 | 0.0% |
| 2 Unit Apartments | 0 | 0.0% |
| 3 or 4 Unit Apartments | 6 | 0.5% |
| 5 to 9 Unit Apartments | 0 | 0.0% |
| 10 or more Apartments | 28 | 2.5% |
| Mobile Home / Other | 23 | 2.0% |
| Total | 1,135 | 100.0% |
Housing Structures by Occupancy in Sierra County
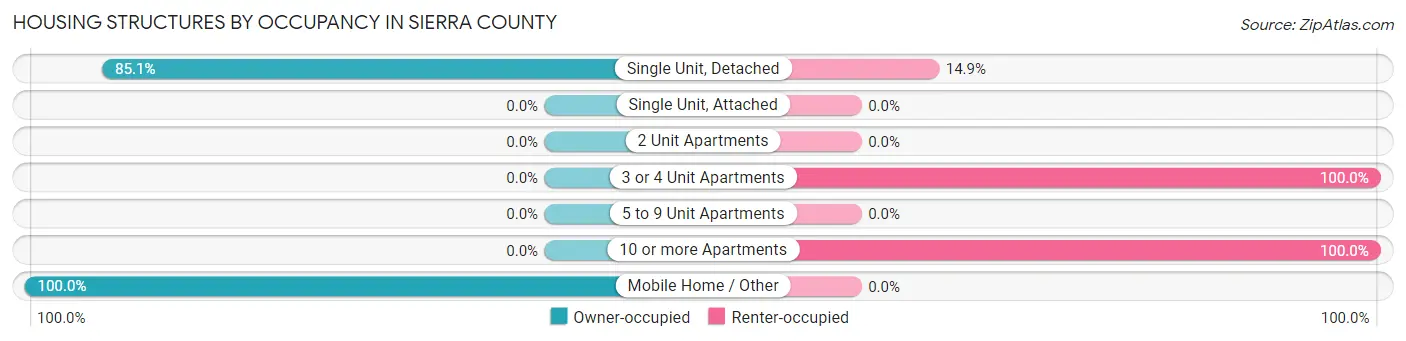
| Structure Type | Owner-occupied | Renter-occupied |
| Single Unit, Detached | 917 (85.1%) | 161 (14.9%) |
| Single Unit, Attached | 0 (0.0%) | 0 (0.0%) |
| 2 Unit Apartments | 0 (0.0%) | 0 (0.0%) |
| 3 or 4 Unit Apartments | 0 (0.0%) | 6 (100.0%) |
| 5 to 9 Unit Apartments | 0 (0.0%) | 0 (0.0%) |
| 10 or more Apartments | 0 (0.0%) | 28 (100.0%) |
| Mobile Home / Other | 23 (100.0%) | 0 (0.0%) |
| Total | 940 (82.8%) | 195 (17.2%) |
Housing Structures by Number of Rooms in Sierra County
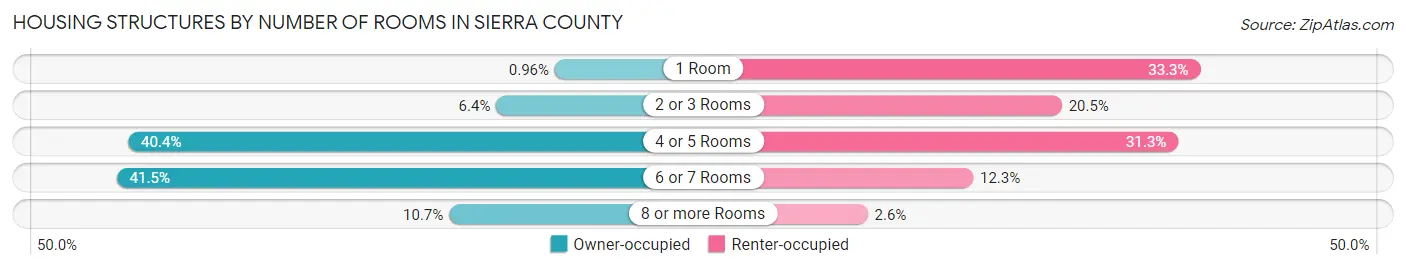
| Number of Rooms | Owner-occupied | Renter-occupied |
| 1 Room | 9 (1.0%) | 65 (33.3%) |
| 2 or 3 Rooms | 60 (6.4%) | 40 (20.5%) |
| 4 or 5 Rooms | 380 (40.4%) | 61 (31.3%) |
| 6 or 7 Rooms | 390 (41.5%) | 24 (12.3%) |
| 8 or more Rooms | 101 (10.7%) | 5 (2.6%) |
| Total | 940 (100.0%) | 195 (100.0%) |
Housing Structure by Heating Type in Sierra County
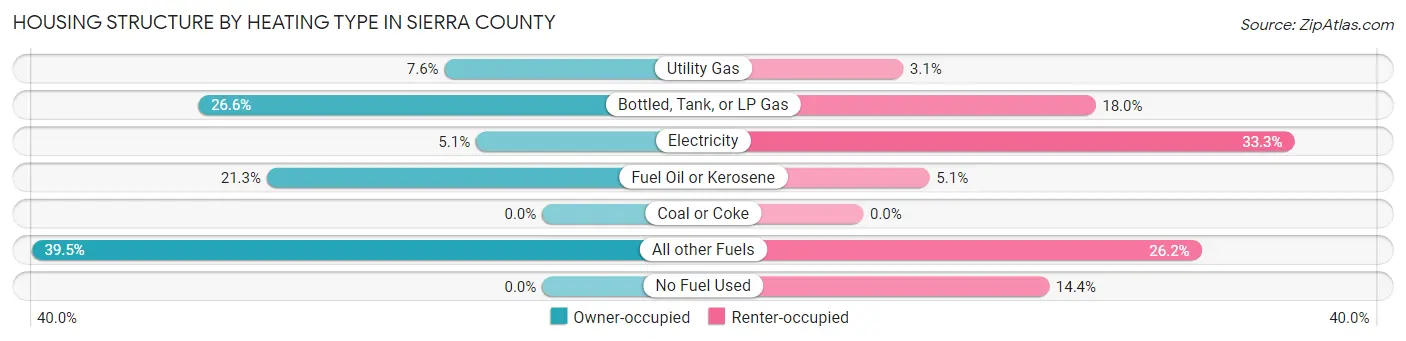
| Heating Type | Owner-occupied | Renter-occupied |
| Utility Gas | 71 (7.5%) | 6 (3.1%) |
| Bottled, Tank, or LP Gas | 250 (26.6%) | 35 (17.9%) |
| Electricity | 48 (5.1%) | 65 (33.3%) |
| Fuel Oil or Kerosene | 200 (21.3%) | 10 (5.1%) |
| Coal or Coke | 0 (0.0%) | 0 (0.0%) |
| All other Fuels | 371 (39.5%) | 51 (26.2%) |
| No Fuel Used | 0 (0.0%) | 28 (14.4%) |
| Total | 940 (100.0%) | 195 (100.0%) |
Household Vehicle Usage in Sierra County
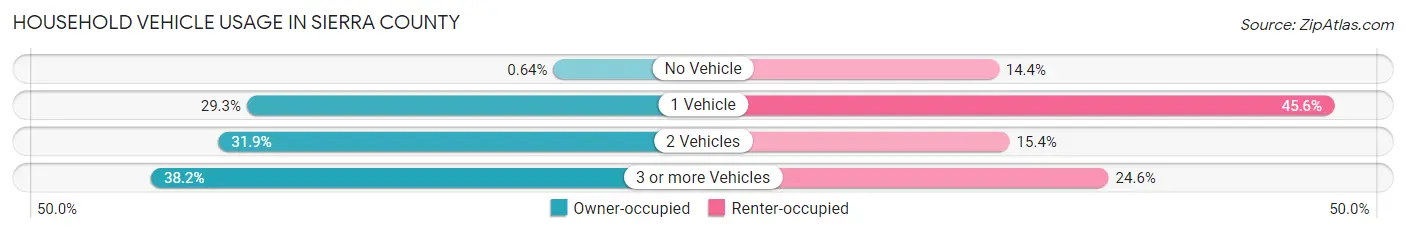
| Vehicles per Household | Owner-occupied | Renter-occupied |
| No Vehicle | 6 (0.6%) | 28 (14.4%) |
| 1 Vehicle | 275 (29.3%) | 89 (45.6%) |
| 2 Vehicles | 300 (31.9%) | 30 (15.4%) |
| 3 or more Vehicles | 359 (38.2%) | 48 (24.6%) |
| Total | 940 (100.0%) | 195 (100.0%) |
Real Estate & Mortgages in Sierra County
Real Estate and Mortgage Overview in Sierra County
| Characteristic | Without Mortgage | With Mortgage |
| Housing Units | 392 | 548 |
| Median Property Value | $299,100 | $283,500 |
| Median Household Income | $60,896 | $130 |
| Monthly Housing Costs | $551 | $79 |
| Real Estate Taxes | $1,850 | $8 |
Property Value by Mortgage Status in Sierra County
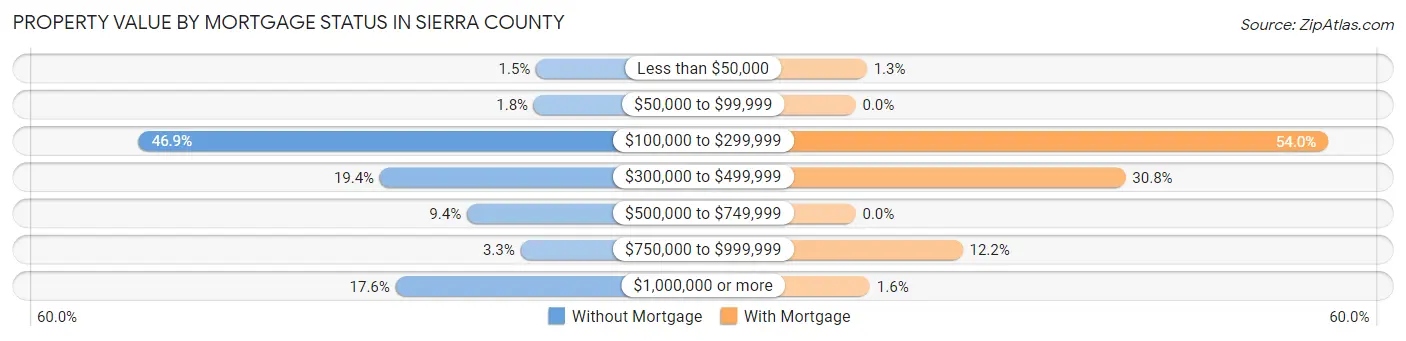
| Property Value | Without Mortgage | With Mortgage |
| Less than $50,000 | 6 (1.5%) | 7 (1.3%) |
| $50,000 to $99,999 | 7 (1.8%) | 0 (0.0%) |
| $100,000 to $299,999 | 184 (46.9%) | 296 (54.0%) |
| $300,000 to $499,999 | 76 (19.4%) | 169 (30.8%) |
| $500,000 to $749,999 | 37 (9.4%) | 0 (0.0%) |
| $750,000 to $999,999 | 13 (3.3%) | 67 (12.2%) |
| $1,000,000 or more | 69 (17.6%) | 9 (1.6%) |
| Total | 392 (100.0%) | 548 (100.0%) |
Household Income by Mortgage Status in Sierra County
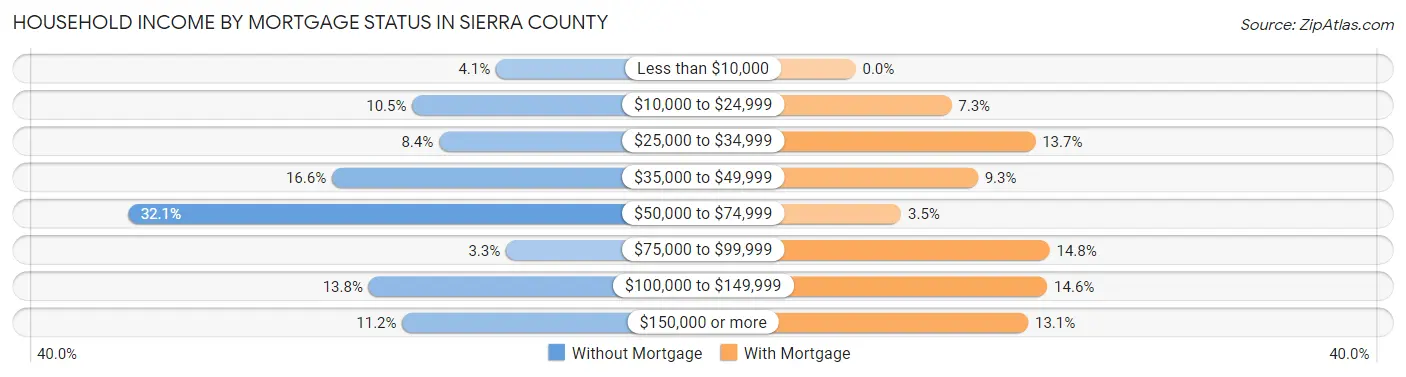
| Household Income | Without Mortgage | With Mortgage |
| Less than $10,000 | 16 (4.1%) | 0 (0.0%) |
| $10,000 to $24,999 | 41 (10.5%) | 40 (7.3%) |
| $25,000 to $34,999 | 33 (8.4%) | 75 (13.7%) |
| $35,000 to $49,999 | 65 (16.6%) | 51 (9.3%) |
| $50,000 to $74,999 | 126 (32.1%) | 19 (3.5%) |
| $75,000 to $99,999 | 13 (3.3%) | 81 (14.8%) |
| $100,000 to $149,999 | 54 (13.8%) | 80 (14.6%) |
| $150,000 or more | 44 (11.2%) | 72 (13.1%) |
| Total | 392 (100.0%) | 548 (100.0%) |
Property Value to Household Income Ratio in Sierra County
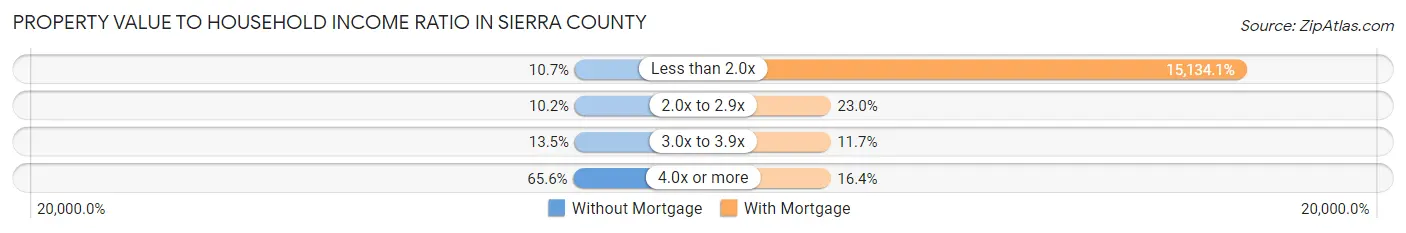
| Value-to-Income Ratio | Without Mortgage | With Mortgage |
| Less than 2.0x | 42 (10.7%) | 82,935 (15,134.1%) |
| 2.0x to 2.9x | 40 (10.2%) | 126 (23.0%) |
| 3.0x to 3.9x | 53 (13.5%) | 64 (11.7%) |
| 4.0x or more | 257 (65.6%) | 90 (16.4%) |
| Total | 392 (100.0%) | 548 (100.0%) |
Real Estate Taxes by Mortgage Status in Sierra County
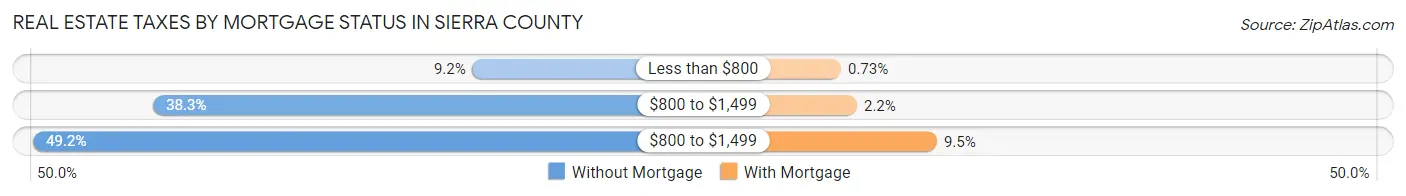
| Property Taxes | Without Mortgage | With Mortgage |
| Less than $800 | 36 (9.2%) | 4 (0.7%) |
| $800 to $1,499 | 150 (38.3%) | 12 (2.2%) |
| $800 to $1,499 | 193 (49.2%) | 52 (9.5%) |
| Total | 392 (100.0%) | 548 (100.0%) |
Health & Disability in Sierra County
Health Insurance Coverage by Age in Sierra County
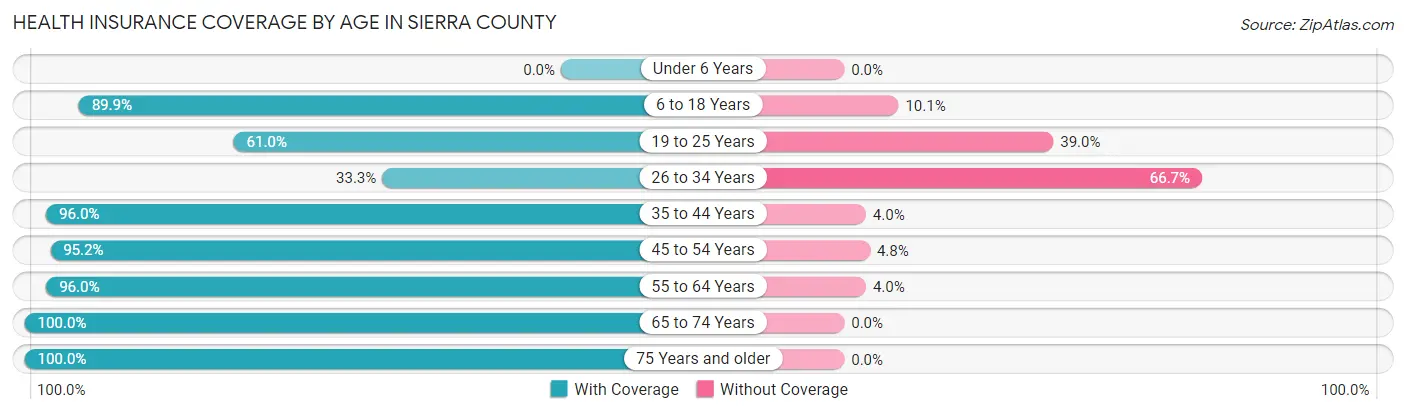
| Age Bracket | With Coverage | Without Coverage |
| Under 6 Years | 0 (0.0%) | 0 (0.0%) |
| 6 to 18 Years | 365 (89.9%) | 41 (10.1%) |
| 19 to 25 Years | 155 (61.0%) | 99 (39.0%) |
| 26 to 34 Years | 61 (33.3%) | 122 (66.7%) |
| 35 to 44 Years | 262 (96.0%) | 11 (4.0%) |
| 45 to 54 Years | 299 (95.2%) | 15 (4.8%) |
| 55 to 64 Years | 522 (96.0%) | 22 (4.0%) |
| 65 to 74 Years | 500 (100.0%) | 0 (0.0%) |
| 75 Years and older | 380 (100.0%) | 0 (0.0%) |
| Total | 2,544 (89.1%) | 310 (10.9%) |
Health Insurance Coverage by Citizenship Status in Sierra County

| Citizenship Status | With Coverage | Without Coverage |
| Native Born | 0 (0.0%) | 0 (0.0%) |
| Foreign Born, Citizen | 365 (89.9%) | 41 (10.1%) |
| Foreign Born, not a Citizen | 155 (61.0%) | 99 (39.0%) |
Health Insurance Coverage by Household Income in Sierra County
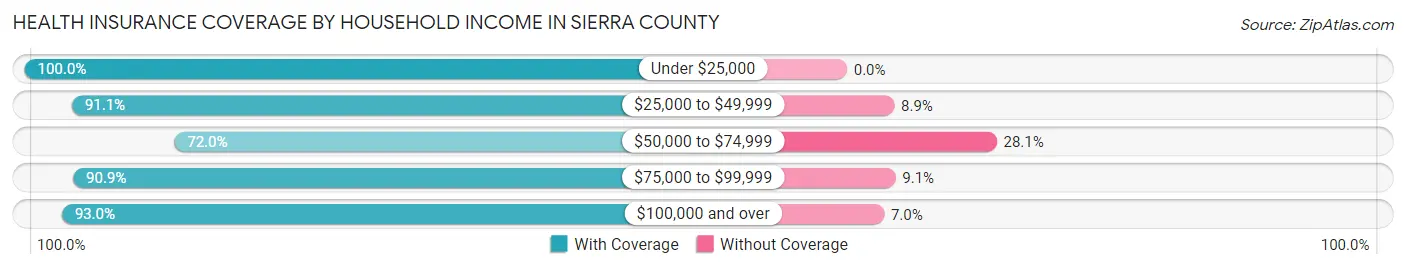
| Household Income | With Coverage | Without Coverage |
| Under $25,000 | 447 (100.0%) | 0 (0.0%) |
| $25,000 to $49,999 | 370 (91.1%) | 36 (8.9%) |
| $50,000 to $74,999 | 431 (72.0%) | 168 (28.1%) |
| $75,000 to $99,999 | 330 (90.9%) | 33 (9.1%) |
| $100,000 and over | 962 (93.0%) | 72 (7.0%) |
Public vs Private Health Insurance Coverage by Age in Sierra County
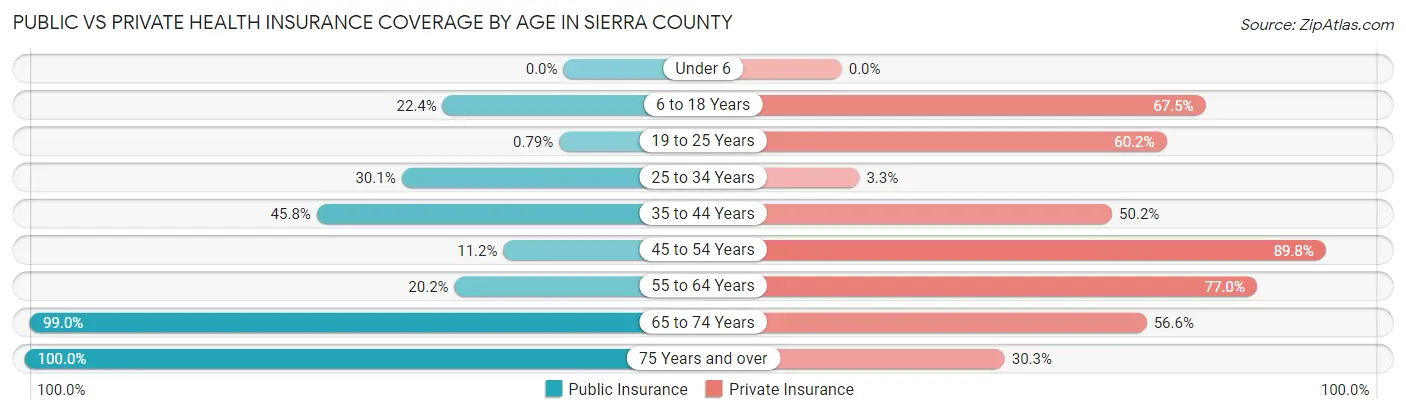
| Age Bracket | Public Insurance | Private Insurance |
| Under 6 | 0 (0.0%) | 0 (0.0%) |
| 6 to 18 Years | 91 (22.4%) | 274 (67.5%) |
| 19 to 25 Years | 2 (0.8%) | 153 (60.2%) |
| 25 to 34 Years | 55 (30.0%) | 6 (3.3%) |
| 35 to 44 Years | 125 (45.8%) | 137 (50.2%) |
| 45 to 54 Years | 35 (11.2%) | 282 (89.8%) |
| 55 to 64 Years | 110 (20.2%) | 419 (77.0%) |
| 65 to 74 Years | 495 (99.0%) | 283 (56.6%) |
| 75 Years and over | 380 (100.0%) | 115 (30.3%) |
| Total | 1,293 (45.3%) | 1,669 (58.5%) |
Disability Status by Sex by Age in Sierra County
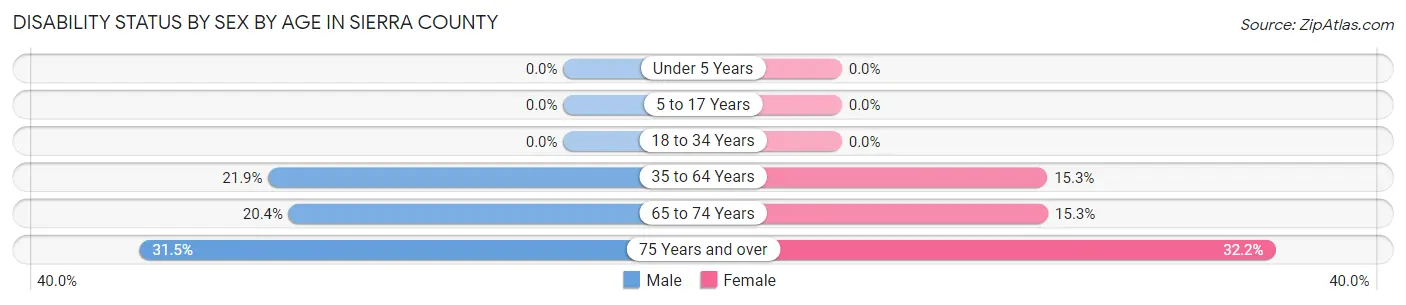
| Age Bracket | Male | Female |
| Under 5 Years | 0 (0.0%) | 0 (0.0%) |
| 5 to 17 Years | 0 (0.0%) | 0 (0.0%) |
| 18 to 34 Years | 0 (0.0%) | 0 (0.0%) |
| 35 to 64 Years | 127 (21.9%) | 84 (15.2%) |
| 65 to 74 Years | 54 (20.4%) | 36 (15.3%) |
| 75 Years and over | 56 (31.5%) | 65 (32.2%) |
Disability Class by Sex by Age in Sierra County
Disability Class: Hearing Difficulty
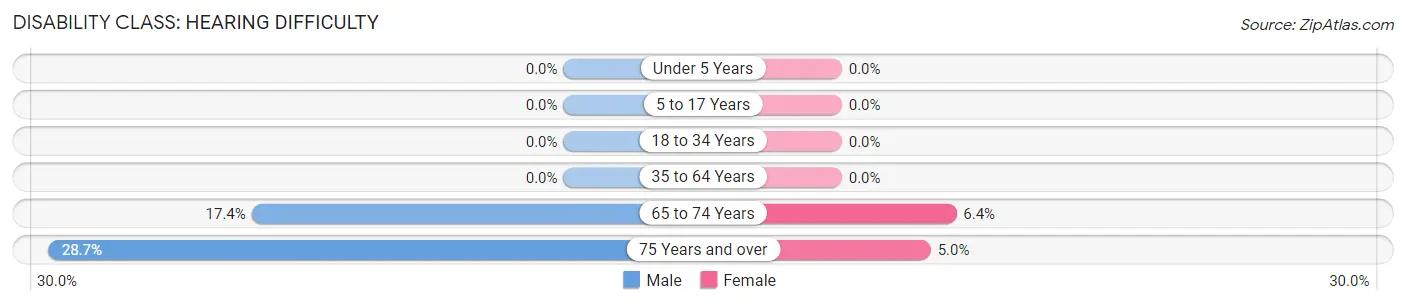
| Age Bracket | Male | Female |
| Under 5 Years | 0 (0.0%) | 0 (0.0%) |
| 5 to 17 Years | 0 (0.0%) | 0 (0.0%) |
| 18 to 34 Years | 0 (0.0%) | 0 (0.0%) |
| 35 to 64 Years | 0 (0.0%) | 0 (0.0%) |
| 65 to 74 Years | 46 (17.4%) | 15 (6.4%) |
| 75 Years and over | 51 (28.6%) | 10 (5.0%) |
Disability Class: Vision Difficulty
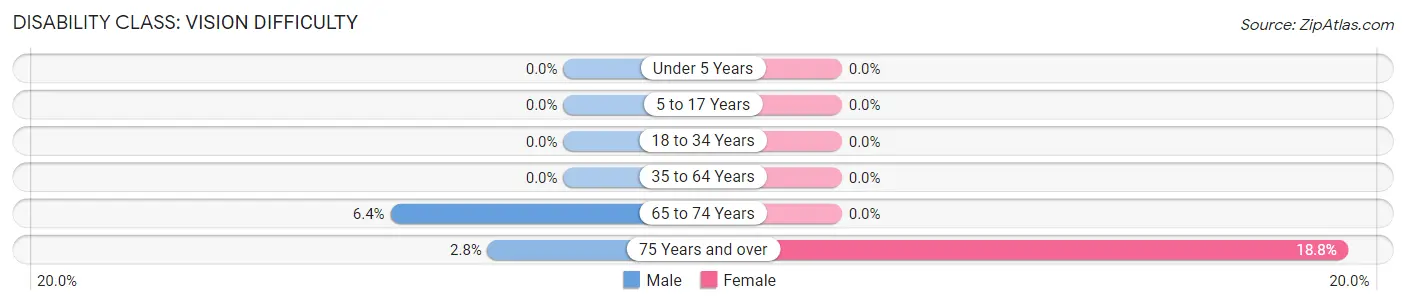
| Age Bracket | Male | Female |
| Under 5 Years | 0 (0.0%) | 0 (0.0%) |
| 5 to 17 Years | 0 (0.0%) | 0 (0.0%) |
| 18 to 34 Years | 0 (0.0%) | 0 (0.0%) |
| 35 to 64 Years | 0 (0.0%) | 0 (0.0%) |
| 65 to 74 Years | 17 (6.4%) | 0 (0.0%) |
| 75 Years and over | 5 (2.8%) | 38 (18.8%) |
Disability Class: Cognitive Difficulty
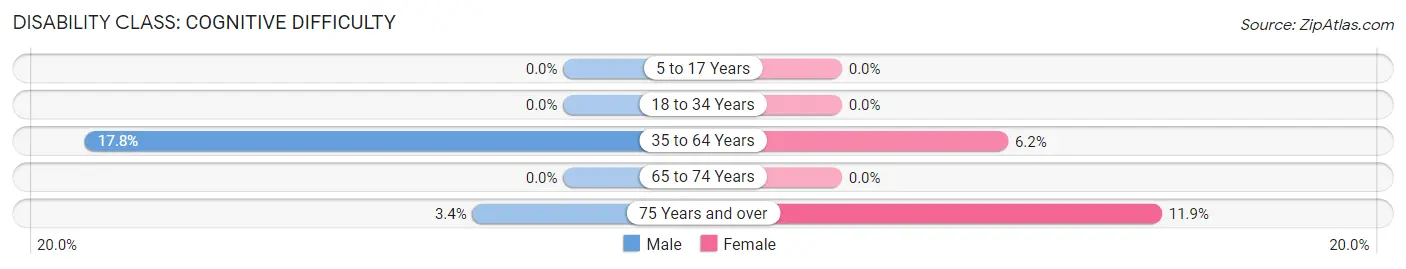
| Age Bracket | Male | Female |
| 5 to 17 Years | 0 (0.0%) | 0 (0.0%) |
| 18 to 34 Years | 0 (0.0%) | 0 (0.0%) |
| 35 to 64 Years | 103 (17.8%) | 34 (6.2%) |
| 65 to 74 Years | 0 (0.0%) | 0 (0.0%) |
| 75 Years and over | 6 (3.4%) | 24 (11.9%) |
Disability Class: Ambulatory Difficulty
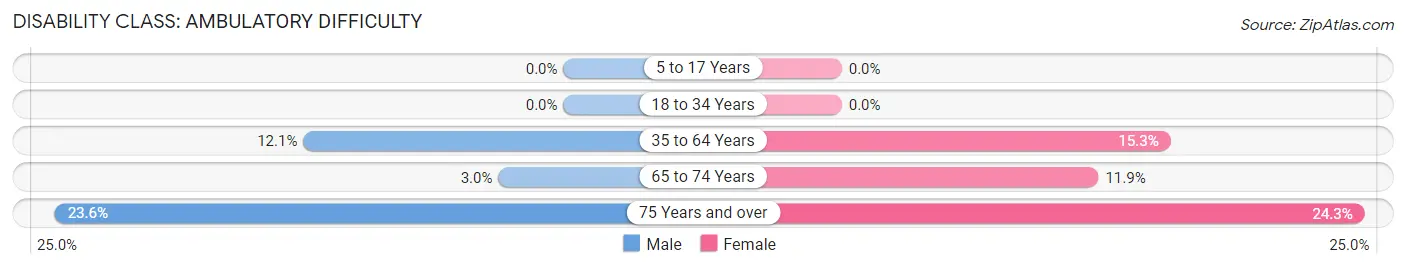
| Age Bracket | Male | Female |
| 5 to 17 Years | 0 (0.0%) | 0 (0.0%) |
| 18 to 34 Years | 0 (0.0%) | 0 (0.0%) |
| 35 to 64 Years | 70 (12.1%) | 84 (15.2%) |
| 65 to 74 Years | 8 (3.0%) | 28 (11.9%) |
| 75 Years and over | 42 (23.6%) | 49 (24.3%) |
Disability Class: Self-Care Difficulty
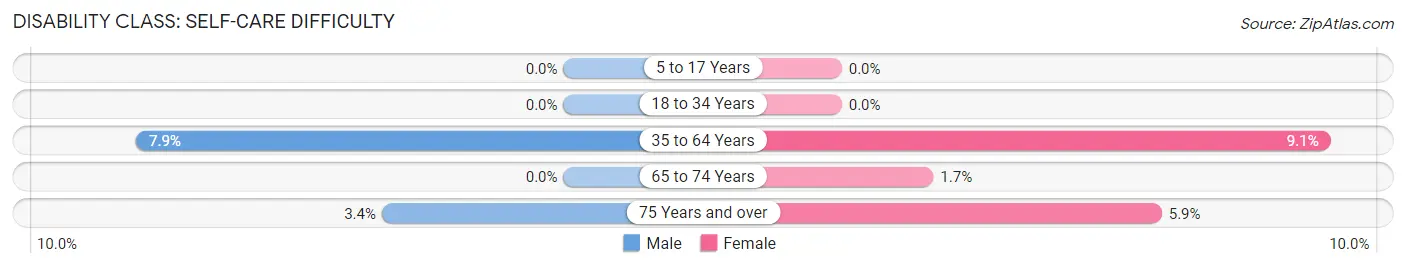
| Age Bracket | Male | Female |
| 5 to 17 Years | 0 (0.0%) | 0 (0.0%) |
| 18 to 34 Years | 0 (0.0%) | 0 (0.0%) |
| 35 to 64 Years | 46 (7.9%) | 50 (9.1%) |
| 65 to 74 Years | 0 (0.0%) | 4 (1.7%) |
| 75 Years and over | 6 (3.4%) | 12 (5.9%) |
Technology Access in Sierra County
Computing Device Access in Sierra County
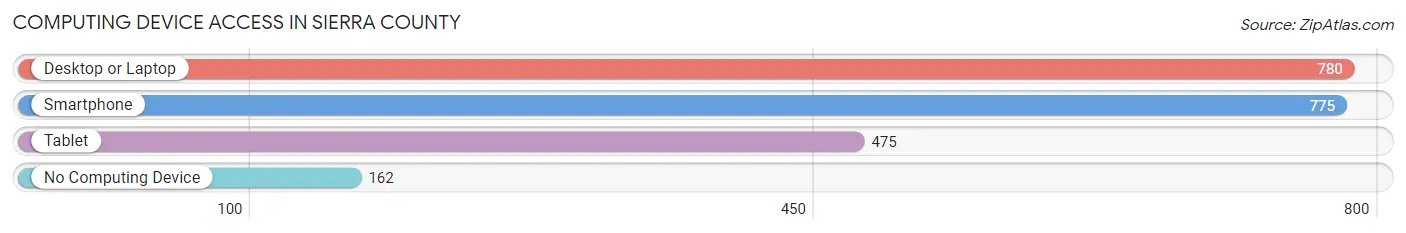
| Device Type | # Households | % Households |
| Desktop or Laptop | 780 | 68.7% |
| Smartphone | 775 | 68.3% |
| Tablet | 475 | 41.8% |
| No Computing Device | 162 | 14.3% |
| Total | 1,135 | 100.0% |
Internet Access in Sierra County
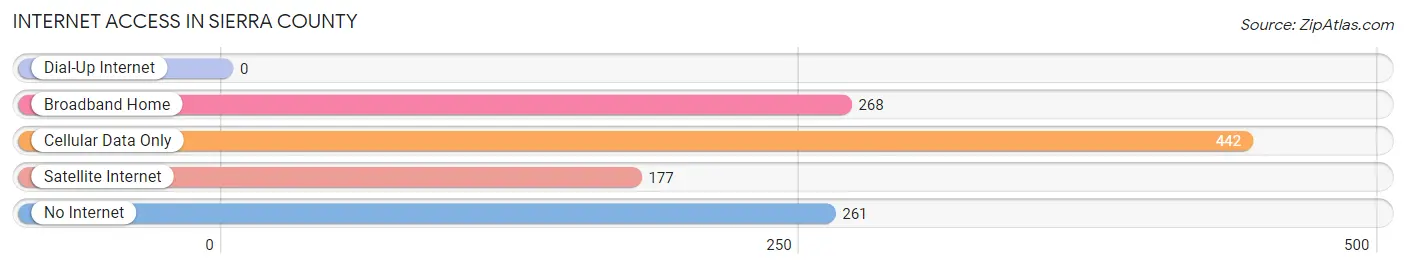
| Internet Type | # Households | % Households |
| Dial-Up Internet | 0 | 0.0% |
| Broadband Home | 268 | 23.6% |
| Cellular Data Only | 442 | 38.9% |
| Satellite Internet | 177 | 15.6% |
| No Internet | 261 | 23.0% |
| Total | 1,135 | 100.0% |
Sierra County Summary
Sierra County is a county located in the northeastern corner of the U.S. state of California. As of the 2010 census, the population was 3,240, making it the second-least populous county in California. The county seat is Downieville. The county is in the Sierra Nevada, northeast of Sacramento on the border with Nevada.
History
Sierra County was formed in 1852 from parts of Yuba County. The county derives its name from the Sierra Nevada. Prior to the California Gold Rush, the area was home to both the Maidu and the Washoe peoples.
The first European American to arrive in the area was James W. Marshall, who discovered gold at Sutter's Mill in Coloma in 1848. The Gold Rush brought many miners and settlers to the area, and by 1850, the population had grown to over 10,000.
In 1851, parts of Yuba County were split off to create Sierra County, with Downieville as the county seat. The county was named after the Sierra Nevada mountain range.
Geography
Sierra County is located in the northeastern corner of California, in the Sierra Nevada mountain range. It is bordered by Nevada to the east, Placer County to the south, and Plumas and Lassen counties to the west. The county covers an area of 1,109 square miles, making it the second-smallest county in California.
The county is divided into two distinct regions: the Sierra Valley and the Sierra Nevada. The Sierra Valley is a large, flat valley surrounded by mountains, while the Sierra Nevada is a rugged mountain range with peaks reaching up to 11,000 feet.
The highest point in the county is Mount Lola, at 10,365 feet. The county also contains several rivers, including the Yuba, Bear, and American rivers.
Economy
Sierra County is a rural county with a small population and a limited economy. The county's main industries are agriculture, timber, and tourism.
Agriculture is the largest industry in the county, with cattle ranching and hay production being the main crops. The timber industry is also important, with logging and lumber mills providing jobs for many residents.
Tourism is also an important part of the economy, with many visitors coming to the area to enjoy the outdoor recreation opportunities. The county is home to several ski resorts, including the Sierra-at-Tahoe ski resort.
Demographics
As of the 2010 census, there were 3,240 people, 1,323 households, and 890 families residing in the county. The population density was 2.9 people per square mile. There were 1,845 housing units at an average density of 1.7 per square mile.
The racial makeup of the county was 92.3% White, 0.3% African American, 1.2% Native American, 0.3% Asian, 0.1% Pacific Islander, 3.2% from other races, and 2.6% from two or more races. Hispanic or Latino of any race were 8.2% of the population.
The median income for a household in the county was $37,813, and the median income for a family was $45,938. The per capita income for the county was $19,837. About 11.2% of families and 14.2% of the population were below the poverty line, including 19.2% of those under age 18 and 8.2% of those age 65 or over.
Common Questions
What is Per Capita Income in Sierra County?
Per Capita income in Sierra County is $37,692.
What is the Median Family Income in Sierra County?
Median Family Income in Sierra County is $73,917.
What is the Median Household income in Sierra County?
Median Household Income in Sierra County is $61,108.
What is Income or Wage Gap in Sierra County?
Income or Wage Gap in Sierra County is 57.6%.
Women in Sierra County earn 42.4 cents for every dollar earned by a man.
What is Inequality or Gini Index in Sierra County?
Inequality or Gini Index in Sierra County is 0.48.
What is the Total Population of Sierra County?
Total Population of Sierra County is 2,916.
What is the Total Male Population of Sierra County?
Total Male Population of Sierra County is 1,411.
What is the Total Female Population of Sierra County?
Total Female Population of Sierra County is 1,505.
What is the Ratio of Males per 100 Females in Sierra County?
There are 93.75 Males per 100 Females in Sierra County.
What is the Ratio of Females per 100 Males in Sierra County?
There are 106.66 Females per 100 Males in Sierra County.
What is the Median Population Age in Sierra County?
Median Population Age in Sierra County is 54.9 Years.
What is the Average Family Size in Sierra County
Average Family Size in Sierra County is 3.2 People.
What is the Average Household Size in Sierra County
Average Household Size in Sierra County is 2.5 People.
How Large is the Labor Force in Sierra County?
There are 1,318 People in the Labor Forcein in Sierra County.
What is the Percentage of People in the Labor Force in Sierra County?
51.9% of People are in the Labor Force in Sierra County.
What is the Unemployment Rate in Sierra County?
Unemployment Rate in Sierra County is 5.6%.