Santa Barbara County, CA Map & Demographics
Santa Barbara County Map
Santa Barbara County Overview
$44,635
PER CAPITA INCOME
$105,067
AVG FAMILY INCOME
$92,332
AVG HOUSEHOLD INCOME
30.5%
WAGE / INCOME GAP [ % ]
69.5¢/ $1
WAGE / INCOME GAP [ $ ]
$10,969
FAMILY INCOME DEFICIT
0.49
INEQUALITY / GINI INDEX
445,213
TOTAL POPULATION
223,753
MALE POPULATION
221,460
FEMALE POPULATION
101.04
MALES / 100 FEMALES
98.98
FEMALES / 100 MALES
34.3
MEDIAN AGE
3.4
AVG FAMILY SIZE
2.9
AVG HOUSEHOLD SIZE
224,302
LABOR FORCE [ PEOPLE ]
62.7%
PERCENT IN LABOR FORCE
6.0%
UNEMPLOYMENT RATE
Income in Santa Barbara County
Income Overview in Santa Barbara County
Per Capita Income in Santa Barbara County is $44,635, while median incomes of families and households are $105,067 and $92,332 respectively.
| Characteristic | Number | Measure |
| Per Capita Income | 445,213 | $44,635 |
| Median Family Income | 96,947 | $105,067 |
| Mean Family Income | 96,947 | $147,801 |
| Median Household Income | 148,032 | $92,332 |
| Mean Household Income | 148,032 | $131,742 |
| Income Deficit | 96,947 | $10,969 |
| Wage / Income Gap (%) | 445,213 | 30.52% |
| Wage / Income Gap ($) | 445,213 | 69.48¢ per $1 |
| Gini / Inequality Index | 445,213 | 0.49 |
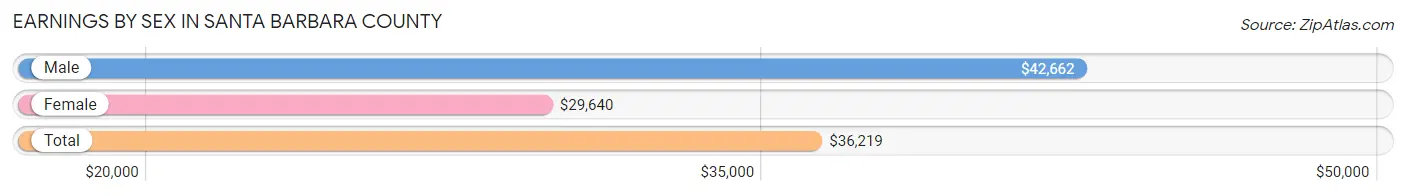
Earnings by Sex in Santa Barbara County
Average Earnings in Santa Barbara County are $36,219, $42,662 for men and $29,640 for women, a difference of 30.5%.
| Sex | Number | Average Earnings |
| Male | 129,394 (54.0%) | $42,662 |
| Female | 110,065 (46.0%) | $29,640 |
| Total | 239,459 (100.0%) | $36,219 |
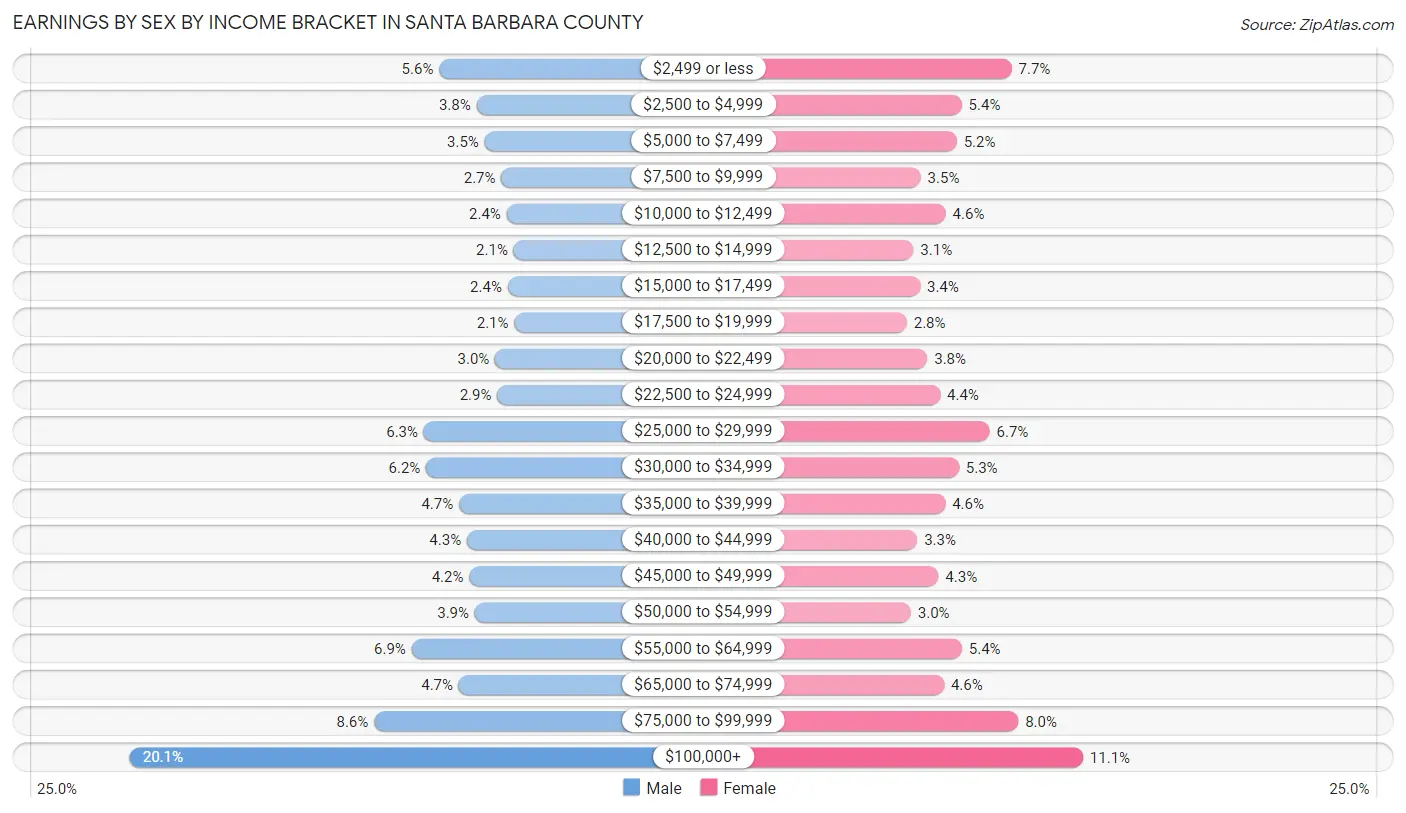
Earnings by Sex by Income Bracket in Santa Barbara County
The most common earnings brackets in Santa Barbara County are $100,000+ for men (25,971 | 20.1%) and $100,000+ for women (12,168 | 11.1%).
| Income | Male | Female |
| $2,499 or less | 7,214 (5.6%) | 8,499 (7.7%) |
| $2,500 to $4,999 | 4,953 (3.8%) | 5,925 (5.4%) |
| $5,000 to $7,499 | 4,459 (3.5%) | 5,672 (5.1%) |
| $7,500 to $9,999 | 3,456 (2.7%) | 3,805 (3.5%) |
| $10,000 to $12,499 | 3,132 (2.4%) | 5,093 (4.6%) |
| $12,500 to $14,999 | 2,701 (2.1%) | 3,435 (3.1%) |
| $15,000 to $17,499 | 3,066 (2.4%) | 3,773 (3.4%) |
| $17,500 to $19,999 | 2,669 (2.1%) | 3,093 (2.8%) |
| $20,000 to $22,499 | 3,828 (3.0%) | 4,145 (3.8%) |
| $22,500 to $24,999 | 3,700 (2.9%) | 4,811 (4.4%) |
| $25,000 to $29,999 | 8,158 (6.3%) | 7,363 (6.7%) |
| $30,000 to $34,999 | 8,004 (6.2%) | 5,779 (5.2%) |
| $35,000 to $39,999 | 6,017 (4.6%) | 5,077 (4.6%) |
| $40,000 to $44,999 | 5,534 (4.3%) | 3,630 (3.3%) |
| $45,000 to $49,999 | 5,392 (4.2%) | 4,718 (4.3%) |
| $50,000 to $54,999 | 5,056 (3.9%) | 3,302 (3.0%) |
| $55,000 to $64,999 | 8,889 (6.9%) | 5,929 (5.4%) |
| $65,000 to $74,999 | 6,034 (4.7%) | 5,013 (4.5%) |
| $75,000 to $99,999 | 11,161 (8.6%) | 8,835 (8.0%) |
| $100,000+ | 25,971 (20.1%) | 12,168 (11.1%) |
| Total | 129,394 (100.0%) | 110,065 (100.0%) |
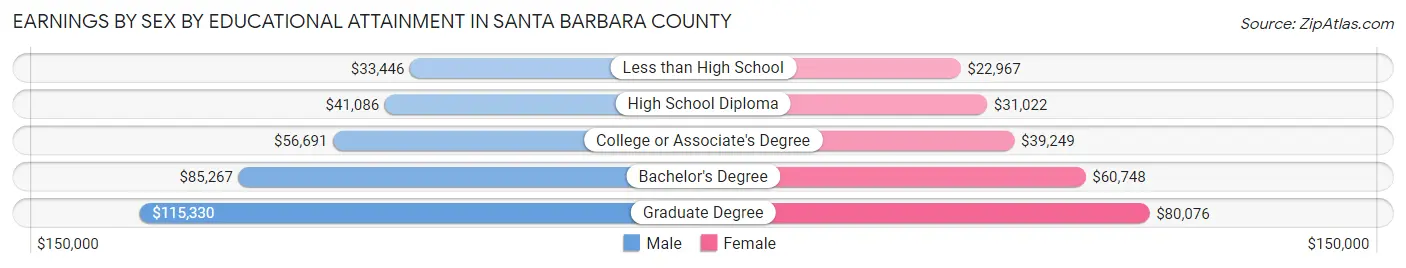
Earnings by Sex by Educational Attainment in Santa Barbara County
Average earnings in Santa Barbara County are $54,283 for men and $40,574 for women, a difference of 25.3%. Men with an educational attainment of graduate degree enjoy the highest average annual earnings of $115,330, while those with less than high school education earn the least with $33,446. Women with an educational attainment of graduate degree earn the most with the average annual earnings of $80,076, while those with less than high school education have the smallest earnings of $22,967.
| Educational Attainment | Male Income | Female Income |
| Less than High School | $33,446 | $22,967 |
| High School Diploma | $41,086 | $31,022 |
| College or Associate's Degree | $56,691 | $39,249 |
| Bachelor's Degree | $85,267 | $60,748 |
| Graduate Degree | $115,330 | $80,076 |
| Total | $54,283 | $40,574 |
Family Income in Santa Barbara County
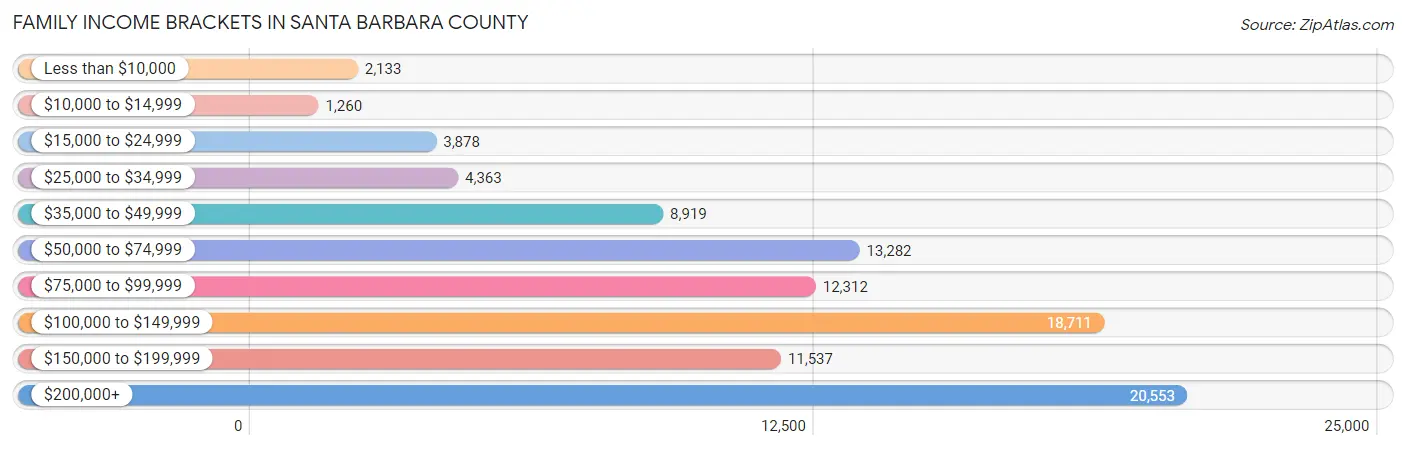
Family Income Brackets in Santa Barbara County
According to the Santa Barbara County family income data, there are 20,553 families falling into the $200,000+ income range, which is the most common income bracket and makes up 21.2% of all families. Conversely, the $10,000 to $14,999 income bracket is the least frequent group with only 1,260 families (1.3%) belonging to this category.
| Income Bracket | # Families | % Families |
| Less than $10,000 | 2,133 | 2.2% |
| $10,000 to $14,999 | 1,260 | 1.3% |
| $15,000 to $24,999 | 3,878 | 4.0% |
| $25,000 to $34,999 | 4,363 | 4.5% |
| $35,000 to $49,999 | 8,919 | 9.2% |
| $50,000 to $74,999 | 13,282 | 13.7% |
| $75,000 to $99,999 | 12,312 | 12.7% |
| $100,000 to $149,999 | 18,711 | 19.3% |
| $150,000 to $199,999 | 11,537 | 11.9% |
| $200,000+ | 20,553 | 21.2% |
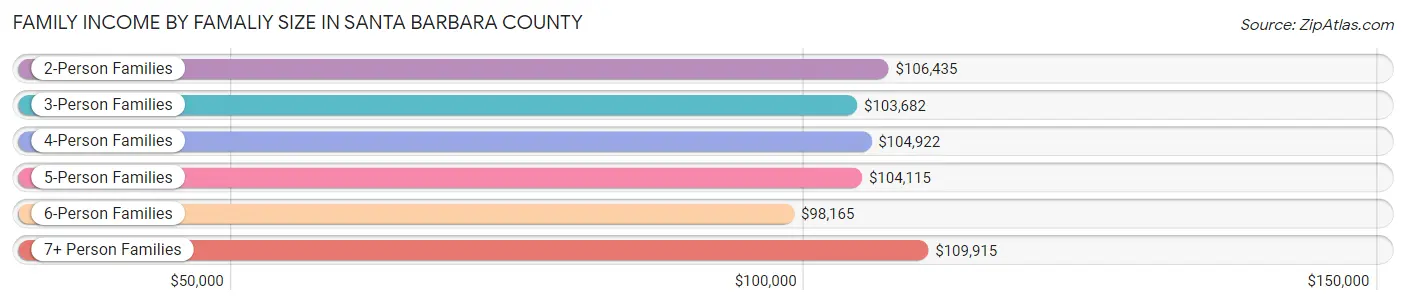
Family Income by Famaliy Size in Santa Barbara County
7+ person families (3,395 | 3.5%) account for the highest median family income in Santa Barbara County with $109,915 per family, while 2-person families (41,200 | 42.5%) have the highest median income of $53,218 per family member.
| Income Bracket | # Families | Median Income |
| 2-Person Families | 41,200 (42.5%) | $106,435 |
| 3-Person Families | 19,484 (20.1%) | $103,682 |
| 4-Person Families | 18,696 (19.3%) | $104,922 |
| 5-Person Families | 9,748 (10.1%) | $104,115 |
| 6-Person Families | 4,424 (4.6%) | $98,165 |
| 7+ Person Families | 3,395 (3.5%) | $109,915 |
| Total | 96,947 (100.0%) | $105,067 |
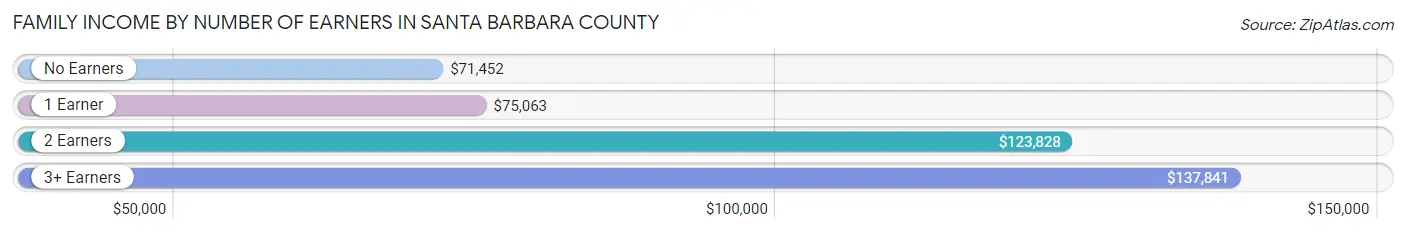
Family Income by Number of Earners in Santa Barbara County
The median family income in Santa Barbara County is $105,067, with families comprising 3+ earners (15,690) having the highest median family income of $137,841, while families with no earners (13,575) have the lowest median family income of $71,452, accounting for 16.2% and 14.0% of families, respectively.
| Number of Earners | # Families | Median Income |
| No Earners | 13,575 (14.0%) | $71,452 |
| 1 Earner | 29,255 (30.2%) | $75,063 |
| 2 Earners | 38,427 (39.6%) | $123,828 |
| 3+ Earners | 15,690 (16.2%) | $137,841 |
| Total | 96,947 (100.0%) | $105,067 |
Household Income in Santa Barbara County
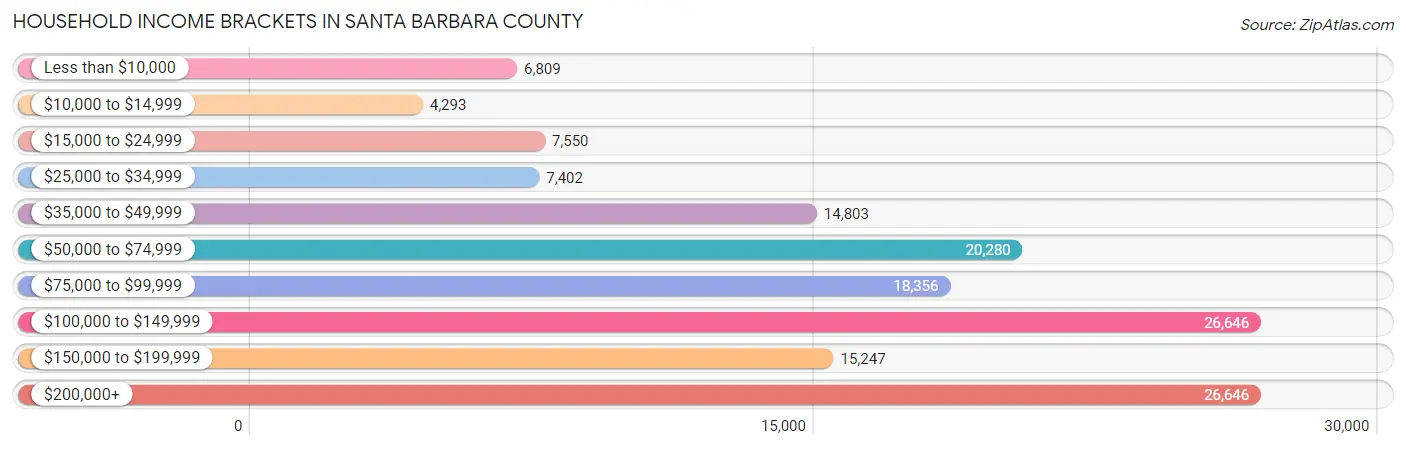
Household Income Brackets in Santa Barbara County
With 26,646 households falling in the category, the $100,000 to $149,999 income range is the most frequent in Santa Barbara County, accounting for 18.0% of all households. In contrast, only 4,293 households (2.9%) fall into the $10,000 to $14,999 income bracket, making it the least populous group.
| Income Bracket | # Households | % Households |
| Less than $10,000 | 6,809 | 4.6% |
| $10,000 to $14,999 | 4,293 | 2.9% |
| $15,000 to $24,999 | 7,550 | 5.1% |
| $25,000 to $34,999 | 7,402 | 5.0% |
| $35,000 to $49,999 | 14,803 | 10.0% |
| $50,000 to $74,999 | 20,280 | 13.7% |
| $75,000 to $99,999 | 18,356 | 12.4% |
| $100,000 to $149,999 | 26,646 | 18.0% |
| $150,000 to $199,999 | 15,247 | 10.3% |
| $200,000+ | 26,646 | 18.0% |
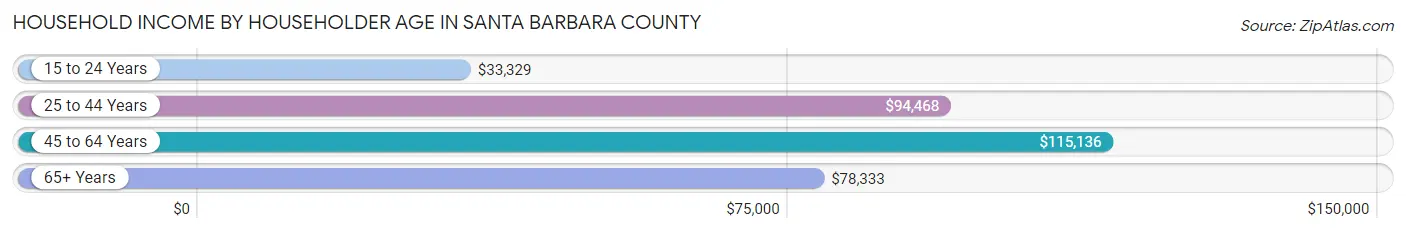
Household Income by Householder Age in Santa Barbara County
The median household income in Santa Barbara County is $92,332, with the highest median household income of $115,136 found in the 45 to 64 years age bracket for the primary householder. A total of 50,536 households (34.1%) fall into this category. Meanwhile, the 15 to 24 years age bracket for the primary householder has the lowest median household income of $33,329, with 9,388 households (6.3%) in this group.
| Income Bracket | # Households | Median Income |
| 15 to 24 Years | 9,388 (6.3%) | $33,329 |
| 25 to 44 Years | 45,736 (30.9%) | $94,468 |
| 45 to 64 Years | 50,536 (34.1%) | $115,136 |
| 65+ Years | 42,372 (28.6%) | $78,333 |
| Total | 148,032 (100.0%) | $92,332 |
Poverty in Santa Barbara County
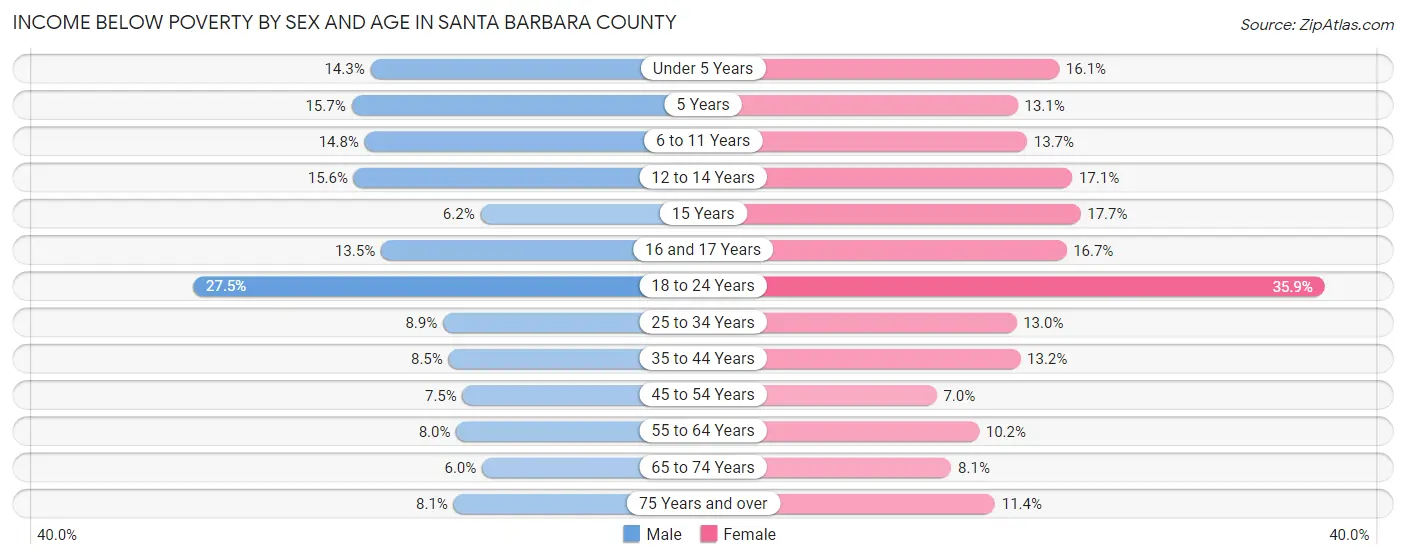
Income Below Poverty by Sex and Age in Santa Barbara County
With 12.1% poverty level for males and 15.0% for females among the residents of Santa Barbara County, 18 to 24 year old males and 18 to 24 year old females are the most vulnerable to poverty, with 7,935 males (27.5%) and 10,020 females (35.8%) in their respective age groups living below the poverty level.
| Age Bracket | Male | Female |
| Under 5 Years | 1,901 (14.3%) | 2,023 (16.1%) |
| 5 Years | 420 (15.7%) | 308 (13.1%) |
| 6 to 11 Years | 2,481 (14.7%) | 2,126 (13.7%) |
| 12 to 14 Years | 1,269 (15.6%) | 1,438 (17.1%) |
| 15 Years | 151 (6.1%) | 511 (17.7%) |
| 16 and 17 Years | 762 (13.5%) | 859 (16.7%) |
| 18 to 24 Years | 7,935 (27.5%) | 10,020 (35.8%) |
| 25 to 34 Years | 2,657 (8.9%) | 3,564 (13.0%) |
| 35 to 44 Years | 2,211 (8.5%) | 3,228 (13.2%) |
| 45 to 54 Years | 1,745 (7.5%) | 1,597 (7.0%) |
| 55 to 64 Years | 1,928 (8.0%) | 2,556 (10.2%) |
| 65 to 74 Years | 1,121 (6.0%) | 1,657 (8.1%) |
| 75 Years and over | 1,038 (8.1%) | 2,007 (11.4%) |
| Total | 25,619 (12.1%) | 31,894 (15.0%) |
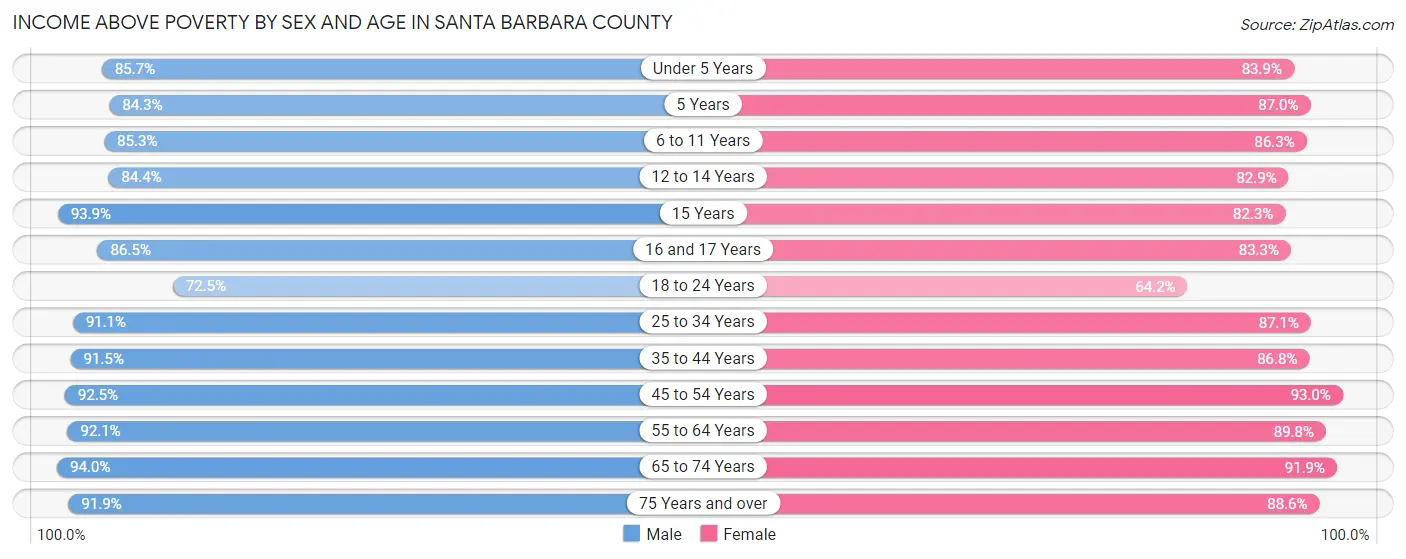
Income Above Poverty by Sex and Age in Santa Barbara County
According to the poverty statistics in Santa Barbara County, males aged 65 to 74 years and females aged 45 to 54 years are the age groups that are most secure financially, with 94.0% of males and 93.0% of females in these age groups living above the poverty line.
| Age Bracket | Male | Female |
| Under 5 Years | 11,371 (85.7%) | 10,529 (83.9%) |
| 5 Years | 2,250 (84.3%) | 2,052 (87.0%) |
| 6 to 11 Years | 14,345 (85.3%) | 13,344 (86.3%) |
| 12 to 14 Years | 6,886 (84.4%) | 6,974 (82.9%) |
| 15 Years | 2,304 (93.9%) | 2,374 (82.3%) |
| 16 and 17 Years | 4,864 (86.5%) | 4,297 (83.3%) |
| 18 to 24 Years | 20,917 (72.5%) | 17,929 (64.1%) |
| 25 to 34 Years | 27,080 (91.1%) | 23,960 (87.1%) |
| 35 to 44 Years | 23,746 (91.5%) | 21,148 (86.8%) |
| 45 to 54 Years | 21,593 (92.5%) | 21,105 (93.0%) |
| 55 to 64 Years | 22,311 (92.0%) | 22,572 (89.8%) |
| 65 to 74 Years | 17,472 (94.0%) | 18,755 (91.9%) |
| 75 Years and over | 11,708 (91.9%) | 15,668 (88.6%) |
| Total | 186,847 (87.9%) | 180,707 (85.0%) |
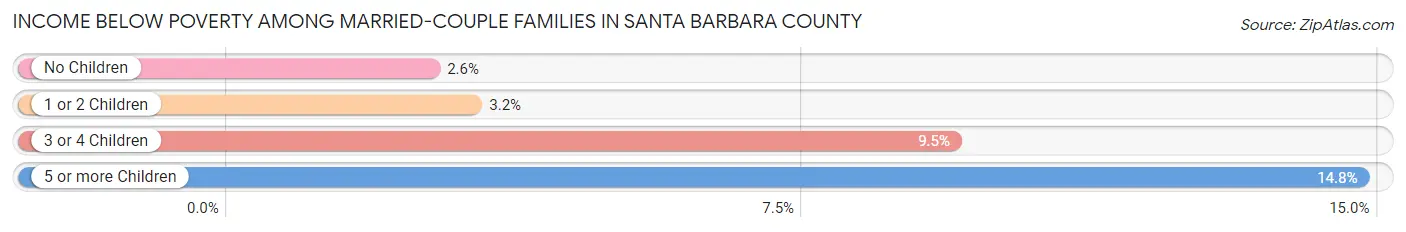
Income Below Poverty Among Married-Couple Families in Santa Barbara County
The poverty statistics for married-couple families in Santa Barbara County show that 3.5% or 2,505 of the total 70,569 families live below the poverty line. Families with 5 or more children have the highest poverty rate of 14.8%, comprising of 92 families. On the other hand, families with no children have the lowest poverty rate of 2.6%, which includes 1,073 families.
| Children | Above Poverty | Below Poverty |
| No Children | 39,518 (97.4%) | 1,073 (2.6%) |
| 1 or 2 Children | 22,157 (96.8%) | 729 (3.2%) |
| 3 or 4 Children | 5,858 (90.5%) | 611 (9.5%) |
| 5 or more Children | 531 (85.2%) | 92 (14.8%) |
| Total | 68,064 (96.5%) | 2,505 (3.5%) |
Income Below Poverty Among Single-Parent Households in Santa Barbara County
According to the poverty data in Santa Barbara County, 10.8% or 1,029 single-father households and 21.1% or 3,559 single-mother households are living below the poverty line. Among single-father households, those with 5 or more children have the highest poverty rate, with 83 households (100.0%) experiencing poverty. Likewise, among single-mother households, those with 5 or more children have the highest poverty rate, with 115 households (73.3%) falling below the poverty line.
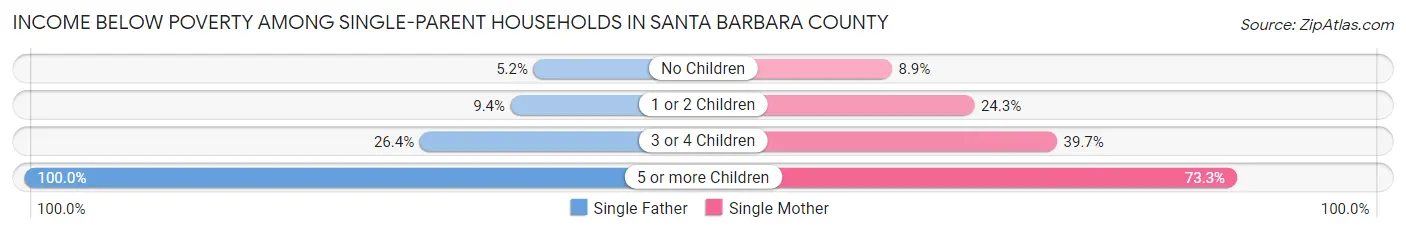
| Children | Single Father | Single Mother |
| No Children | 194 (5.2%) | 563 (8.9%) |
| 1 or 2 Children | 410 (9.4%) | 1,972 (24.3%) |
| 3 or 4 Children | 342 (26.4%) | 909 (39.7%) |
| 5 or more Children | 83 (100.0%) | 115 (73.3%) |
| Total | 1,029 (10.8%) | 3,559 (21.1%) |
Income Below Poverty Among Married-Couple vs Single-Parent Households in Santa Barbara County
The poverty data for Santa Barbara County shows that 2,505 of the married-couple family households (3.5%) and 4,588 of the single-parent households (17.4%) are living below the poverty level. Within the married-couple family households, those with 5 or more children have the highest poverty rate, with 92 households (14.8%) falling below the poverty line. Among the single-parent households, those with 5 or more children have the highest poverty rate, with 198 household (82.5%) living below poverty.
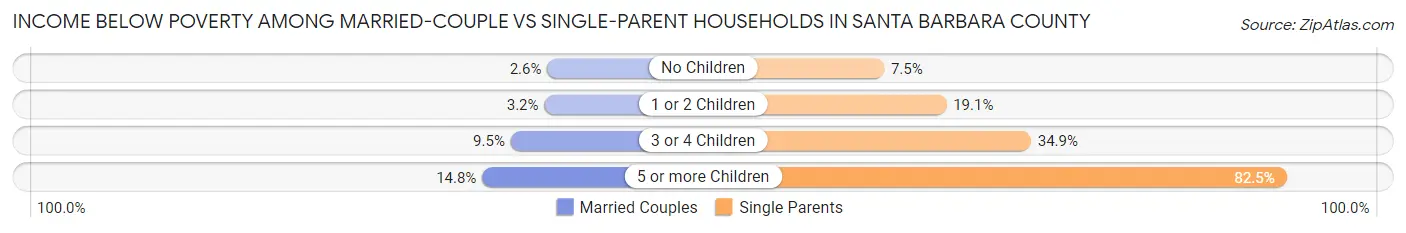
| Children | Married-Couple Families | Single-Parent Households |
| No Children | 1,073 (2.6%) | 757 (7.5%) |
| 1 or 2 Children | 729 (3.2%) | 2,382 (19.1%) |
| 3 or 4 Children | 611 (9.5%) | 1,251 (34.8%) |
| 5 or more Children | 92 (14.8%) | 198 (82.5%) |
| Total | 2,505 (3.5%) | 4,588 (17.4%) |
Race in Santa Barbara County
The most populous races in Santa Barbara County are White / Caucasian (270,657 | 60.8%), Hispanic or Latino (207,576 | 46.6%), and Two or more Races (80,129 | 18.0%).
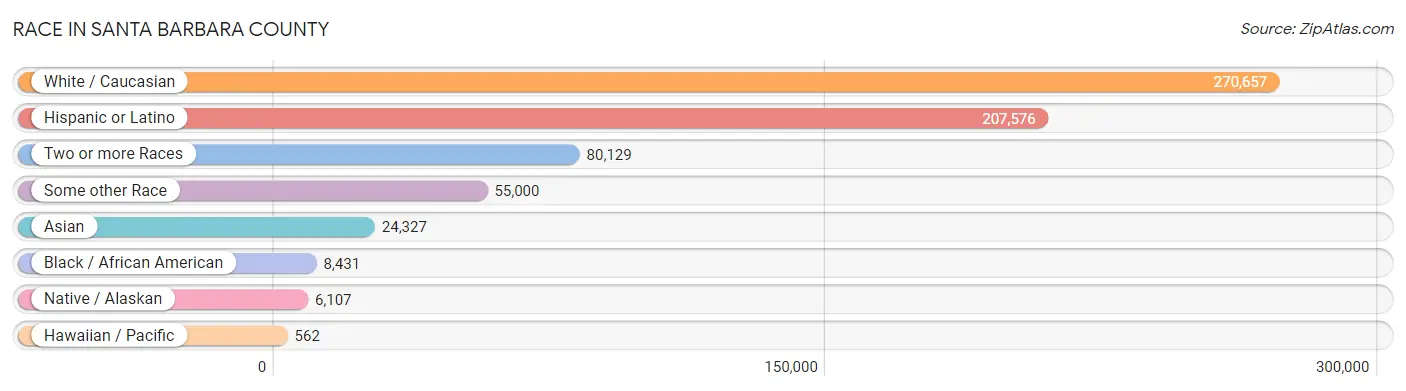
| Race | # Population | % Population |
| Asian | 24,327 | 5.5% |
| Black / African American | 8,431 | 1.9% |
| Hawaiian / Pacific | 562 | 0.1% |
| Hispanic or Latino | 207,576 | 46.6% |
| Native / Alaskan | 6,107 | 1.4% |
| White / Caucasian | 270,657 | 60.8% |
| Two or more Races | 80,129 | 18.0% |
| Some other Race | 55,000 | 12.3% |
| Total | 445,213 | 100.0% |
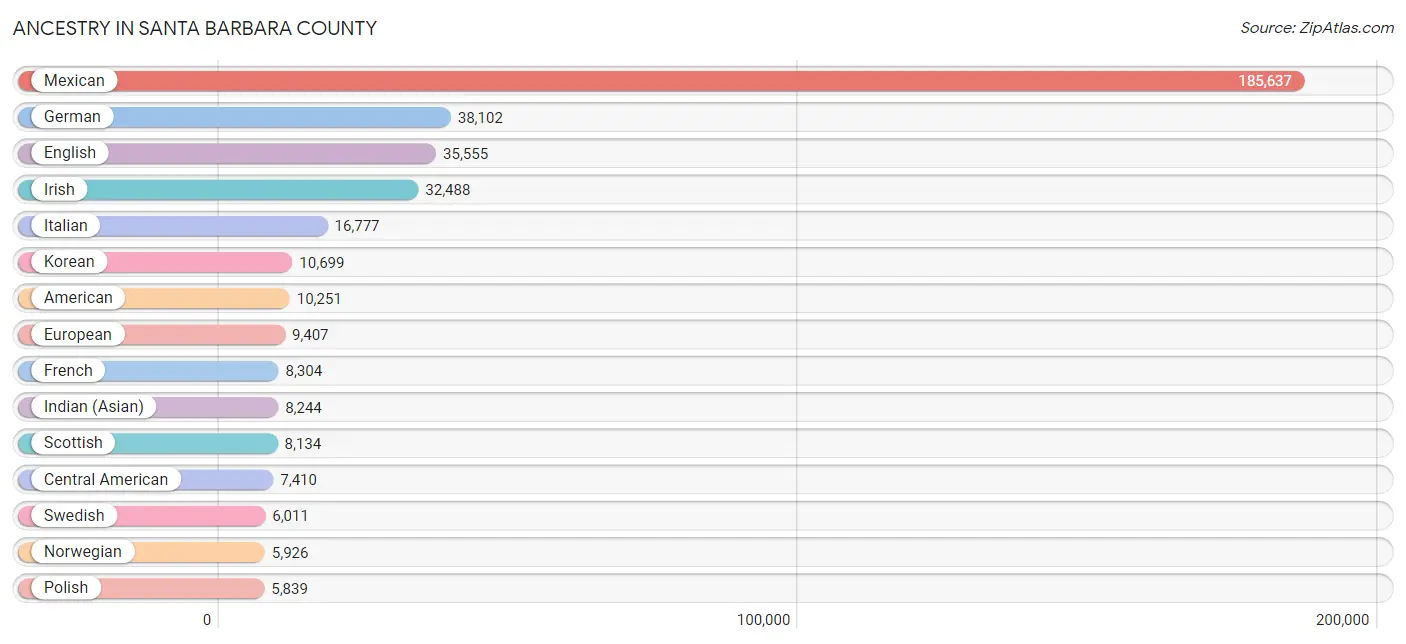
Ancestry in Santa Barbara County
The most populous ancestries reported in Santa Barbara County are Mexican (185,637 | 41.7%), German (38,102 | 8.6%), English (35,555 | 8.0%), Irish (32,488 | 7.3%), and Italian (16,777 | 3.8%), together accounting for 69.3% of all Santa Barbara County residents.
| Ancestry | # Population | % Population |
| Afghan | 183 | 0.0% |
| African | 904 | 0.2% |
| Alaska Native | 22 | 0.0% |
| Albanian | 75 | 0.0% |
| Alsatian | 21 | 0.0% |
| American | 10,251 | 2.3% |
| Apache | 813 | 0.2% |
| Arab | 2,562 | 0.6% |
| Arapaho | 15 | 0.0% |
| Argentinean | 563 | 0.1% |
| Armenian | 585 | 0.1% |
| Australian | 278 | 0.1% |
| Austrian | 924 | 0.2% |
| Bahamian | 5 | 0.0% |
| Bangladeshi | 397 | 0.1% |
| Basque | 234 | 0.1% |
| Belgian | 426 | 0.1% |
| Belizean | 36 | 0.0% |
| Bhutanese | 4,002 | 0.9% |
| Blackfeet | 83 | 0.0% |
| Bolivian | 187 | 0.0% |
| Brazilian | 504 | 0.1% |
| British | 4,047 | 0.9% |
| Bulgarian | 297 | 0.1% |
| Burmese | 2,375 | 0.5% |
| Cajun | 14 | 0.0% |
| Cambodian | 25 | 0.0% |
| Canadian | 1,435 | 0.3% |
| Carpatho Rusyn | 16 | 0.0% |
| Celtic | 79 | 0.0% |
| Central American | 7,410 | 1.7% |
| Central American Indian | 967 | 0.2% |
| Cherokee | 1,083 | 0.2% |
| Cheyenne | 19 | 0.0% |
| Chickasaw | 105 | 0.0% |
| Chilean | 328 | 0.1% |
| Chippewa | 263 | 0.1% |
| Choctaw | 263 | 0.1% |
| Colombian | 1,373 | 0.3% |
| Comanche | 8 | 0.0% |
| Costa Rican | 161 | 0.0% |
| Creek | 105 | 0.0% |
| Croatian | 581 | 0.1% |
| Crow | 10 | 0.0% |
| Cuban | 555 | 0.1% |
| Cypriot | 11 | 0.0% |
| Czech | 878 | 0.2% |
| Czechoslovakian | 487 | 0.1% |
| Danish | 3,226 | 0.7% |
| Delaware | 6 | 0.0% |
| Dominican | 47 | 0.0% |
| Dutch | 3,908 | 0.9% |
| Eastern European | 1,869 | 0.4% |
| Ecuadorian | 197 | 0.0% |
| Egyptian | 587 | 0.1% |
| English | 35,555 | 8.0% |
| Estonian | 56 | 0.0% |
| Ethiopian | 476 | 0.1% |
| European | 9,407 | 2.1% |
| Filipino | 727 | 0.2% |
| Finnish | 827 | 0.2% |
| French | 8,304 | 1.9% |
| French American Indian | 102 | 0.0% |
| French Canadian | 1,104 | 0.3% |
| German | 38,102 | 8.6% |
| Ghanaian | 27 | 0.0% |
| Greek | 1,431 | 0.3% |
| Guamanian / Chamorro | 164 | 0.0% |
| Guatemalan | 2,936 | 0.7% |
| Haitian | 242 | 0.1% |
| Honduran | 899 | 0.2% |
| Hopi | 45 | 0.0% |
| Hungarian | 1,651 | 0.4% |
| Icelander | 33 | 0.0% |
| Indian (Asian) | 8,244 | 1.8% |
| Indonesian | 120 | 0.0% |
| Inupiat | 28 | 0.0% |
| Iranian | 1,378 | 0.3% |
| Iraqi | 86 | 0.0% |
| Irish | 32,488 | 7.3% |
| Iroquois | 51 | 0.0% |
| Israeli | 331 | 0.1% |
| Italian | 16,777 | 3.8% |
| Jamaican | 117 | 0.0% |
| Japanese | 562 | 0.1% |
| Jordanian | 14 | 0.0% |
| Korean | 10,699 | 2.4% |
| Laotian | 388 | 0.1% |
| Latvian | 69 | 0.0% |
| Lebanese | 503 | 0.1% |
| Lithuanian | 499 | 0.1% |
| Luxembourger | 20 | 0.0% |
| Macedonian | 34 | 0.0% |
| Malaysian | 234 | 0.1% |
| Maltese | 19 | 0.0% |
| Menominee | 8 | 0.0% |
| Mexican | 185,637 | 41.7% |
| Mexican American Indian | 3,525 | 0.8% |
| Moroccan | 22 | 0.0% |
| Native Hawaiian | 981 | 0.2% |
| Navajo | 145 | 0.0% |
| New Zealander | 59 | 0.0% |
| Nicaraguan | 270 | 0.1% |
| Nigerian | 124 | 0.0% |
| Northern European | 945 | 0.2% |
| Norwegian | 5,926 | 1.3% |
| Okinawan | 35 | 0.0% |
| Osage | 38 | 0.0% |
| Paiute | 29 | 0.0% |
| Pakistani | 543 | 0.1% |
| Palestinian | 139 | 0.0% |
| Panamanian | 37 | 0.0% |
| Pennsylvania German | 24 | 0.0% |
| Peruvian | 622 | 0.1% |
| Pima | 1 | 0.0% |
| Polish | 5,839 | 1.3% |
| Portuguese | 3,332 | 0.7% |
| Potawatomi | 41 | 0.0% |
| Pueblo | 8 | 0.0% |
| Puerto Rican | 1,847 | 0.4% |
| Puget Sound Salish | 4 | 0.0% |
| Romanian | 435 | 0.1% |
| Russian | 3,332 | 0.7% |
| Salvadoran | 3,082 | 0.7% |
| Samoan | 386 | 0.1% |
| Scandinavian | 1,692 | 0.4% |
| Scotch-Irish | 3,176 | 0.7% |
| Scottish | 8,134 | 1.8% |
| Seminole | 20 | 0.0% |
| Serbian | 162 | 0.0% |
| Sioux | 244 | 0.1% |
| Slavic | 76 | 0.0% |
| Slovak | 182 | 0.0% |
| Slovene | 117 | 0.0% |
| Somali | 3 | 0.0% |
| South African | 149 | 0.0% |
| South American | 4,013 | 0.9% |
| South American Indian | 103 | 0.0% |
| Spaniard | 1,885 | 0.4% |
| Spanish | 1,825 | 0.4% |
| Spanish American | 93 | 0.0% |
| Spanish American Indian | 28 | 0.0% |
| Sri Lankan | 2,347 | 0.5% |
| Subsaharan African | 1,734 | 0.4% |
| Swedish | 6,011 | 1.3% |
| Swiss | 1,968 | 0.4% |
| Syrian | 364 | 0.1% |
| Taiwanese | 43 | 0.0% |
| Thai | 2,709 | 0.6% |
| Tlingit-Haida | 20 | 0.0% |
| Tongan | 116 | 0.0% |
| Trinidadian and Tobagonian | 122 | 0.0% |
| Turkish | 349 | 0.1% |
| Ukrainian | 1,263 | 0.3% |
| Uruguayan | 9 | 0.0% |
| Ute | 13 | 0.0% |
| Venezuelan | 634 | 0.1% |
| Vietnamese | 43 | 0.0% |
| Welsh | 2,522 | 0.6% |
| West Indian | 59 | 0.0% |
| Yaqui | 430 | 0.1% |
| Yugoslavian | 198 | 0.0% |
| Zimbabwean | 13 | 0.0% | View All 163 Rows |
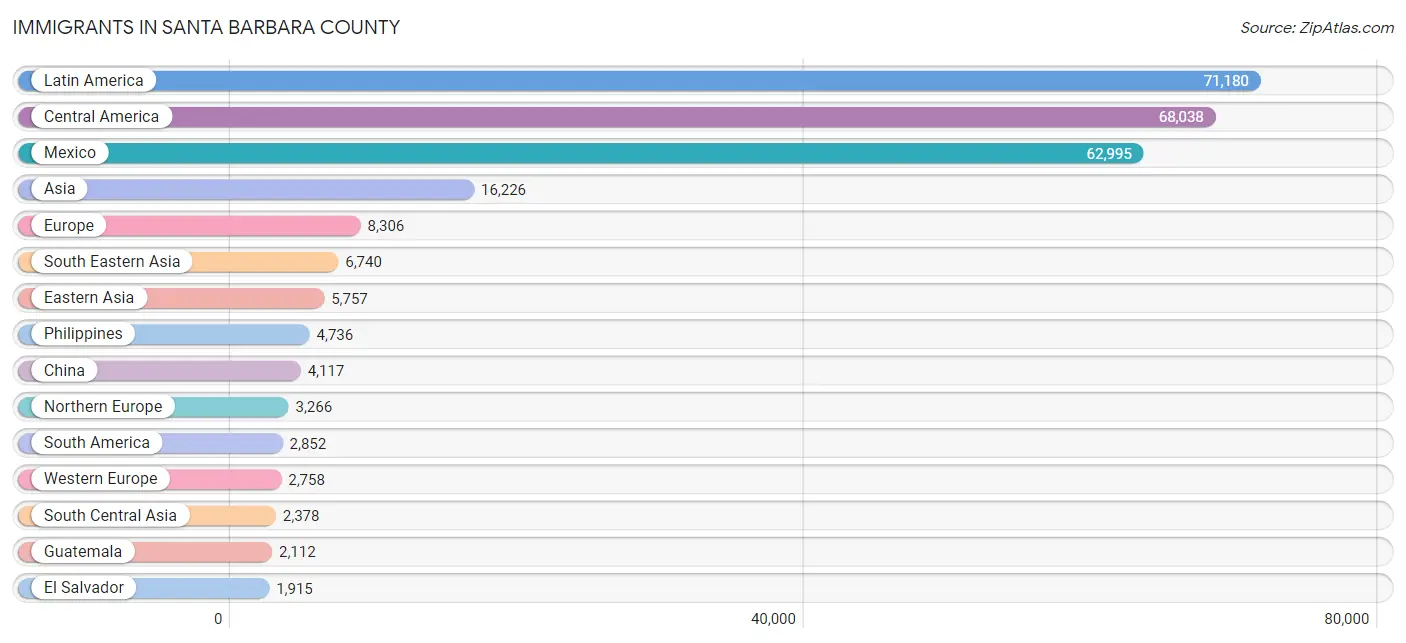
Immigrants in Santa Barbara County
The most numerous immigrant groups reported in Santa Barbara County came from Latin America (71,180 | 16.0%), Central America (68,038 | 15.3%), Mexico (62,995 | 14.1%), Asia (16,226 | 3.6%), and Europe (8,306 | 1.9%), together accounting for 50.9% of all Santa Barbara County residents.
| Immigration Origin | # Population | % Population |
| Afghanistan | 26 | 0.0% |
| Africa | 1,047 | 0.2% |
| Argentina | 437 | 0.1% |
| Armenia | 88 | 0.0% |
| Asia | 16,226 | 3.6% |
| Australia | 320 | 0.1% |
| Austria | 158 | 0.0% |
| Azores | 15 | 0.0% |
| Bangladesh | 101 | 0.0% |
| Belarus | 9 | 0.0% |
| Belgium | 120 | 0.0% |
| Belize | 9 | 0.0% |
| Bolivia | 53 | 0.0% |
| Bosnia and Herzegovina | 76 | 0.0% |
| Brazil | 545 | 0.1% |
| Bulgaria | 70 | 0.0% |
| Cambodia | 187 | 0.0% |
| Canada | 1,622 | 0.4% |
| Caribbean | 290 | 0.1% |
| Central America | 68,038 | 15.3% |
| Chile | 208 | 0.1% |
| China | 4,117 | 0.9% |
| Colombia | 657 | 0.2% |
| Costa Rica | 60 | 0.0% |
| Croatia | 89 | 0.0% |
| Cuba | 119 | 0.0% |
| Czechoslovakia | 63 | 0.0% |
| Denmark | 246 | 0.1% |
| Dominican Republic | 30 | 0.0% |
| Eastern Africa | 425 | 0.1% |
| Eastern Asia | 5,757 | 1.3% |
| Eastern Europe | 1,389 | 0.3% |
| Ecuador | 87 | 0.0% |
| Egypt | 189 | 0.0% |
| El Salvador | 1,915 | 0.4% |
| England | 1,108 | 0.3% |
| Eritrea | 90 | 0.0% |
| Ethiopia | 197 | 0.0% |
| Europe | 8,306 | 1.9% |
| Fiji | 15 | 0.0% |
| France | 802 | 0.2% |
| Germany | 1,200 | 0.3% |
| Ghana | 15 | 0.0% |
| Greece | 52 | 0.0% |
| Guatemala | 2,112 | 0.5% |
| Haiti | 55 | 0.0% |
| Honduras | 765 | 0.2% |
| Hong Kong | 257 | 0.1% |
| Hungary | 78 | 0.0% |
| India | 1,166 | 0.3% |
| Indonesia | 149 | 0.0% |
| Iran | 819 | 0.2% |
| Iraq | 126 | 0.0% |
| Ireland | 121 | 0.0% |
| Israel | 271 | 0.1% |
| Italy | 591 | 0.1% |
| Jamaica | 50 | 0.0% |
| Japan | 748 | 0.2% |
| Jordan | 22 | 0.0% |
| Kazakhstan | 34 | 0.0% |
| Kenya | 35 | 0.0% |
| Korea | 892 | 0.2% |
| Kuwait | 29 | 0.0% |
| Laos | 284 | 0.1% |
| Latin America | 71,180 | 16.0% |
| Latvia | 20 | 0.0% |
| Lebanon | 38 | 0.0% |
| Liberia | 1 | 0.0% |
| Malaysia | 36 | 0.0% |
| Mexico | 62,995 | 14.1% |
| Middle Africa | 9 | 0.0% |
| Moldova | 26 | 0.0% |
| Morocco | 15 | 0.0% |
| Nepal | 21 | 0.0% |
| Netherlands | 327 | 0.1% |
| Nicaragua | 96 | 0.0% |
| Nigeria | 123 | 0.0% |
| North Macedonia | 5 | 0.0% |
| Northern Africa | 224 | 0.1% |
| Northern Europe | 3,266 | 0.7% |
| Norway | 220 | 0.1% |
| Oceania | 430 | 0.1% |
| Pakistan | 51 | 0.0% |
| Panama | 9 | 0.0% |
| Peru | 313 | 0.1% |
| Philippines | 4,736 | 1.1% |
| Poland | 215 | 0.1% |
| Portugal | 92 | 0.0% |
| Romania | 44 | 0.0% |
| Russia | 298 | 0.1% |
| Saudi Arabia | 95 | 0.0% |
| Scotland | 32 | 0.0% |
| Serbia | 35 | 0.0% |
| Singapore | 87 | 0.0% |
| South Africa | 192 | 0.0% |
| South America | 2,852 | 0.6% |
| South Central Asia | 2,378 | 0.5% |
| South Eastern Asia | 6,740 | 1.5% |
| Southern Europe | 849 | 0.2% |
| Spain | 111 | 0.0% |
| Sri Lanka | 101 | 0.0% |
| Sweden | 493 | 0.1% |
| Switzerland | 151 | 0.0% |
| Syria | 447 | 0.1% |
| Taiwan | 570 | 0.1% |
| Thailand | 232 | 0.1% |
| Trinidad and Tobago | 33 | 0.0% |
| Turkey | 121 | 0.0% |
| Ukraine | 243 | 0.1% |
| Venezuela | 526 | 0.1% |
| Vietnam | 951 | 0.2% |
| Western Africa | 139 | 0.0% |
| Western Asia | 1,304 | 0.3% |
| Western Europe | 2,758 | 0.6% |
| Yemen | 28 | 0.0% |
| Zaire | 9 | 0.0% |
| Zimbabwe | 34 | 0.0% | View All 117 Rows |
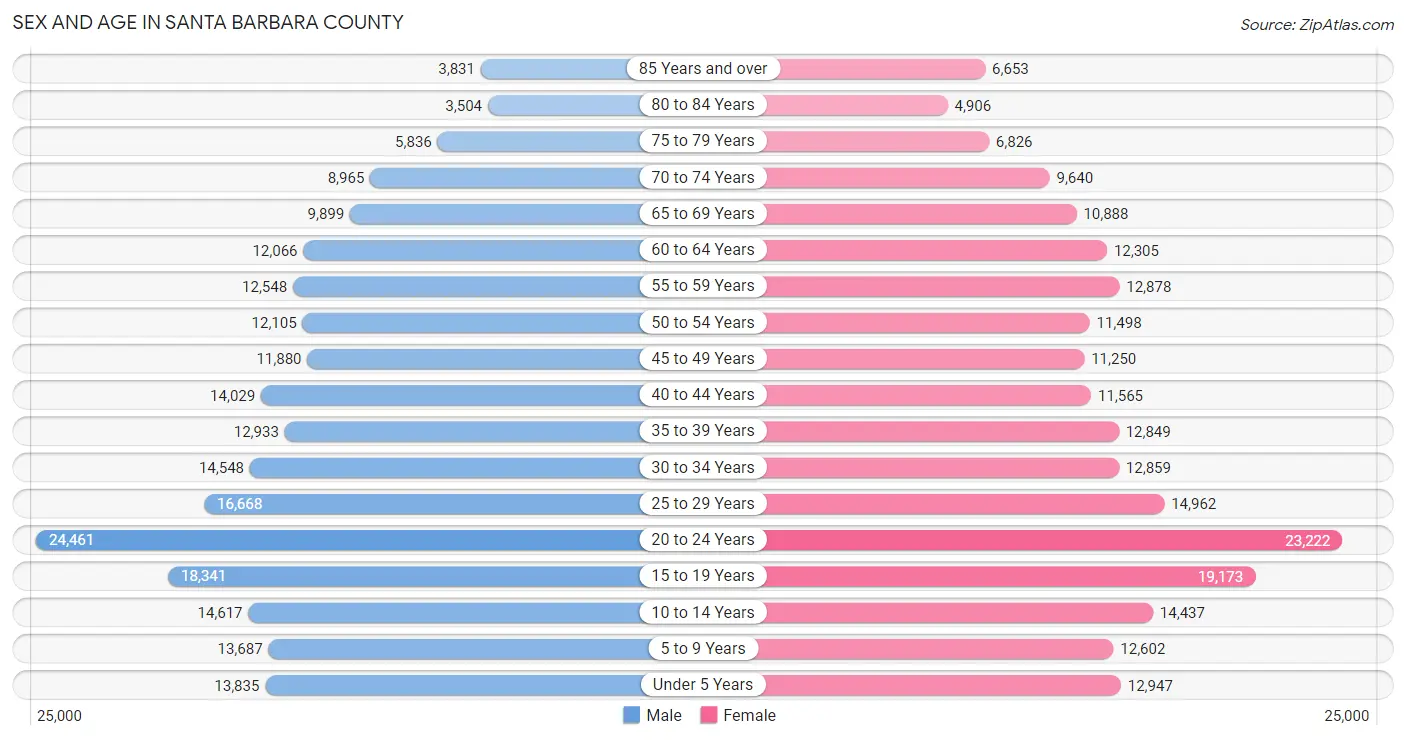
Sex and Age in Santa Barbara County
Sex and Age in Santa Barbara County
The most populous age groups in Santa Barbara County are 20 to 24 Years (24,461 | 10.9%) for men and 20 to 24 Years (23,222 | 10.5%) for women.
| Age Bracket | Male | Female |
| Under 5 Years | 13,835 (6.2%) | 12,947 (5.9%) |
| 5 to 9 Years | 13,687 (6.1%) | 12,602 (5.7%) |
| 10 to 14 Years | 14,617 (6.5%) | 14,437 (6.5%) |
| 15 to 19 Years | 18,341 (8.2%) | 19,173 (8.7%) |
| 20 to 24 Years | 24,461 (10.9%) | 23,222 (10.5%) |
| 25 to 29 Years | 16,668 (7.4%) | 14,962 (6.8%) |
| 30 to 34 Years | 14,548 (6.5%) | 12,859 (5.8%) |
| 35 to 39 Years | 12,933 (5.8%) | 12,849 (5.8%) |
| 40 to 44 Years | 14,029 (6.3%) | 11,565 (5.2%) |
| 45 to 49 Years | 11,880 (5.3%) | 11,250 (5.1%) |
| 50 to 54 Years | 12,105 (5.4%) | 11,498 (5.2%) |
| 55 to 59 Years | 12,548 (5.6%) | 12,878 (5.8%) |
| 60 to 64 Years | 12,066 (5.4%) | 12,305 (5.6%) |
| 65 to 69 Years | 9,899 (4.4%) | 10,888 (4.9%) |
| 70 to 74 Years | 8,965 (4.0%) | 9,640 (4.3%) |
| 75 to 79 Years | 5,836 (2.6%) | 6,826 (3.1%) |
| 80 to 84 Years | 3,504 (1.6%) | 4,906 (2.2%) |
| 85 Years and over | 3,831 (1.7%) | 6,653 (3.0%) |
| Total | 223,753 (100.0%) | 221,460 (100.0%) |
Families and Households in Santa Barbara County
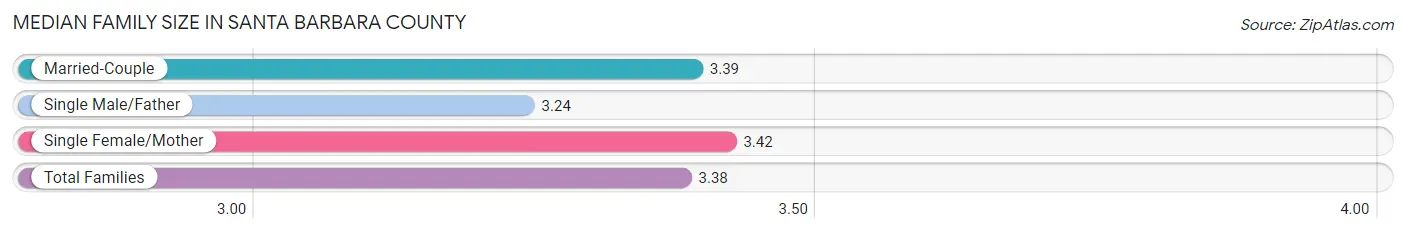
Median Family Size in Santa Barbara County
The median family size in Santa Barbara County is 3.38 persons per family, with single female/mother families (16,891 | 17.4%) accounting for the largest median family size of 3.42 persons per family. On the other hand, single male/father families (9,487 | 9.8%) represent the smallest median family size with 3.24 persons per family.
| Family Type | # Families | Family Size |
| Married-Couple | 70,569 (72.8%) | 3.39 |
| Single Male/Father | 9,487 (9.8%) | 3.24 |
| Single Female/Mother | 16,891 (17.4%) | 3.42 |
| Total Families | 96,947 (100.0%) | 3.38 |
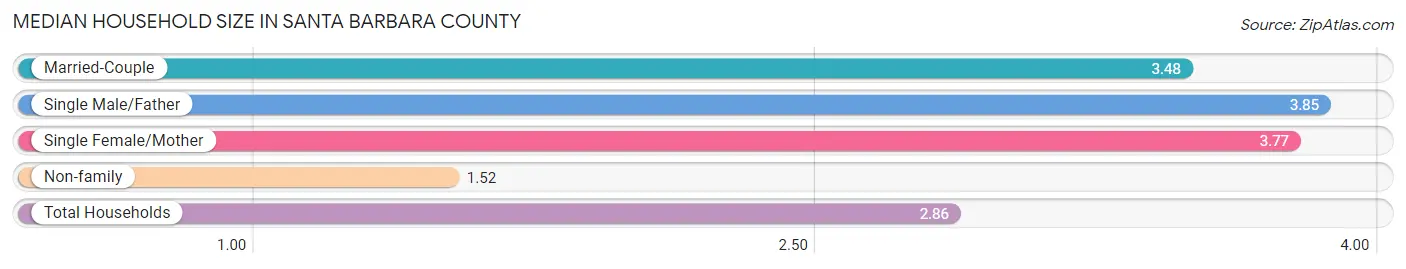
Median Household Size in Santa Barbara County
The median household size in Santa Barbara County is 2.86 persons per household, with single male/father households (9,487 | 6.4%) accounting for the largest median household size of 3.85 persons per household. non-family households (51,085 | 34.5%) represent the smallest median household size with 1.52 persons per household.
| Household Type | # Households | Household Size |
| Married-Couple | 70,569 (47.7%) | 3.48 |
| Single Male/Father | 9,487 (6.4%) | 3.85 |
| Single Female/Mother | 16,891 (11.4%) | 3.77 |
| Non-family | 51,085 (34.5%) | 1.52 |
| Total Households | 148,032 (100.0%) | 2.86 |
Household Size by Marriage Status in Santa Barbara County
Out of a total of 148,032 households in Santa Barbara County, 96,947 (65.5%) are family households, while 51,085 (34.5%) are nonfamily households. The most numerous type of family households are 2-person households, comprising 36,997, and the most common type of nonfamily households are 1-person households, comprising 36,026.
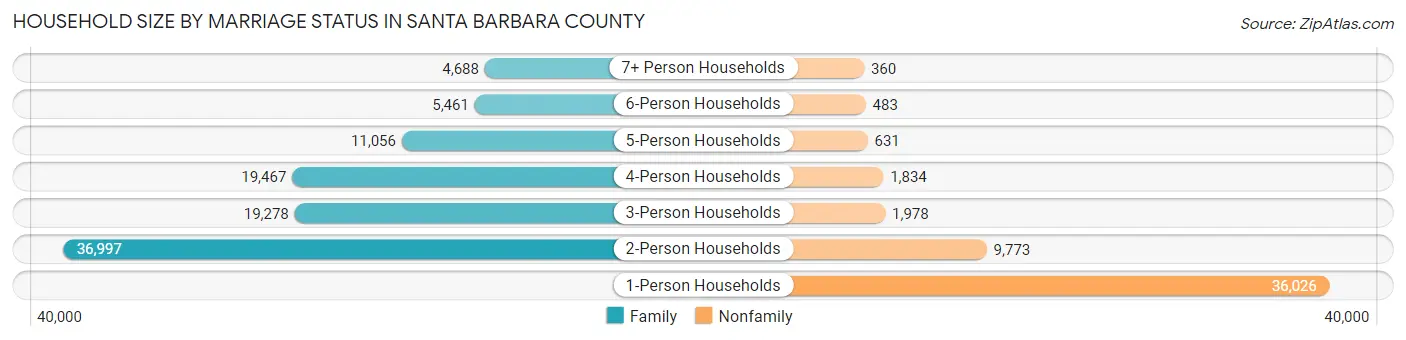
| Household Size | Family Households | Nonfamily Households |
| 1-Person Households | - | 36,026 (24.3%) |
| 2-Person Households | 36,997 (25.0%) | 9,773 (6.6%) |
| 3-Person Households | 19,278 (13.0%) | 1,978 (1.3%) |
| 4-Person Households | 19,467 (13.2%) | 1,834 (1.2%) |
| 5-Person Households | 11,056 (7.5%) | 631 (0.4%) |
| 6-Person Households | 5,461 (3.7%) | 483 (0.3%) |
| 7+ Person Households | 4,688 (3.2%) | 360 (0.2%) |
| Total | 96,947 (65.5%) | 51,085 (34.5%) |
Female Fertility in Santa Barbara County
Fertility by Age in Santa Barbara County
Average fertility rate in Santa Barbara County is 47.0 births per 1,000 women. Women in the age bracket of 20 to 34 years have the highest fertility rate with 66.0 births per 1,000 women. Women in the age bracket of 20 to 34 years acount for 66.3% of all women with births.
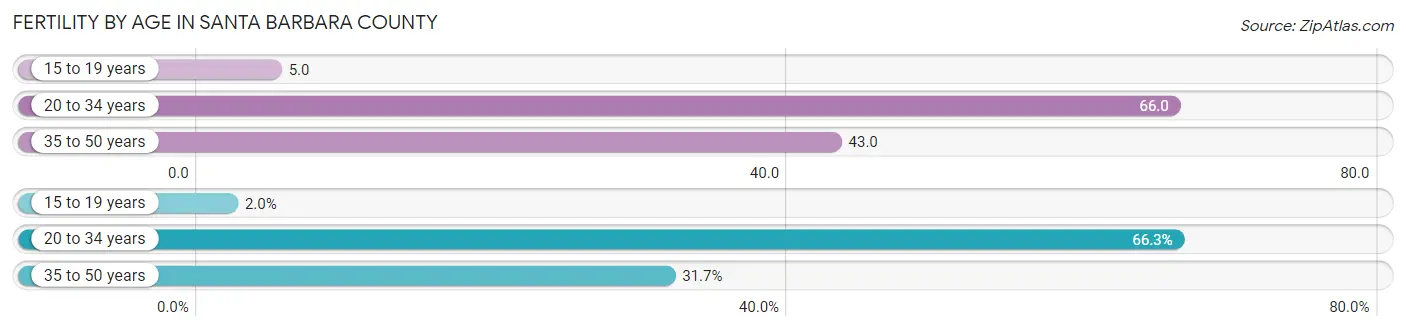
| Age Bracket | Women with Births | Births / 1,000 Women |
| 15 to 19 years | 104 (2.0%) | 5.0 |
| 20 to 34 years | 3,389 (66.3%) | 66.0 |
| 35 to 50 years | 1,622 (31.7%) | 43.0 |
| Total | 5,115 (100.0%) | 47.0 |
Fertility by Age by Marriage Status in Santa Barbara County
67.4% of women with births (5,115) in Santa Barbara County are married. The highest percentage of unmarried women with births falls into 15 to 19 years age bracket with 100.0% of them unmarried at the time of birth, while the lowest percentage of unmarried women with births belong to 35 to 50 years age bracket with 23.5% of them unmarried.
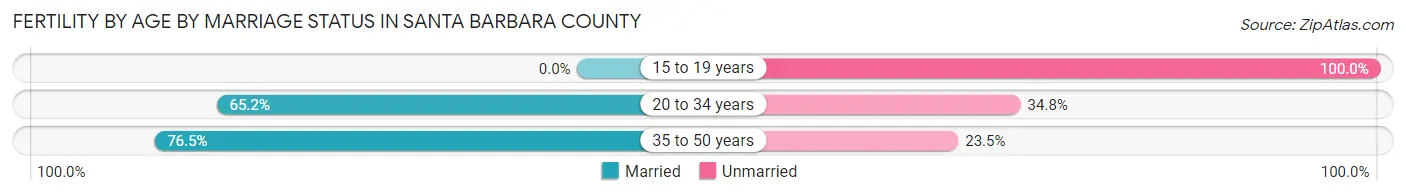
| Age Bracket | Married | Unmarried |
| 15 to 19 years | 0 (0.0%) | 104 (100.0%) |
| 20 to 34 years | 2,210 (65.2%) | 1,179 (34.8%) |
| 35 to 50 years | 1,241 (76.5%) | 381 (23.5%) |
| Total | 3,448 (67.4%) | 1,667 (32.6%) |
Fertility by Education in Santa Barbara County
Average fertility rate in Santa Barbara County is 47.0 births per 1,000 women. Women with the education attainment of bachelor's degree have the highest fertility rate of 63.0 births per 1,000 women, while women with the education attainment of high school diploma have the lowest fertility at 40.0 births per 1,000 women. Women with the education attainment of college or associate's degree represent 33.3% of all women with births.
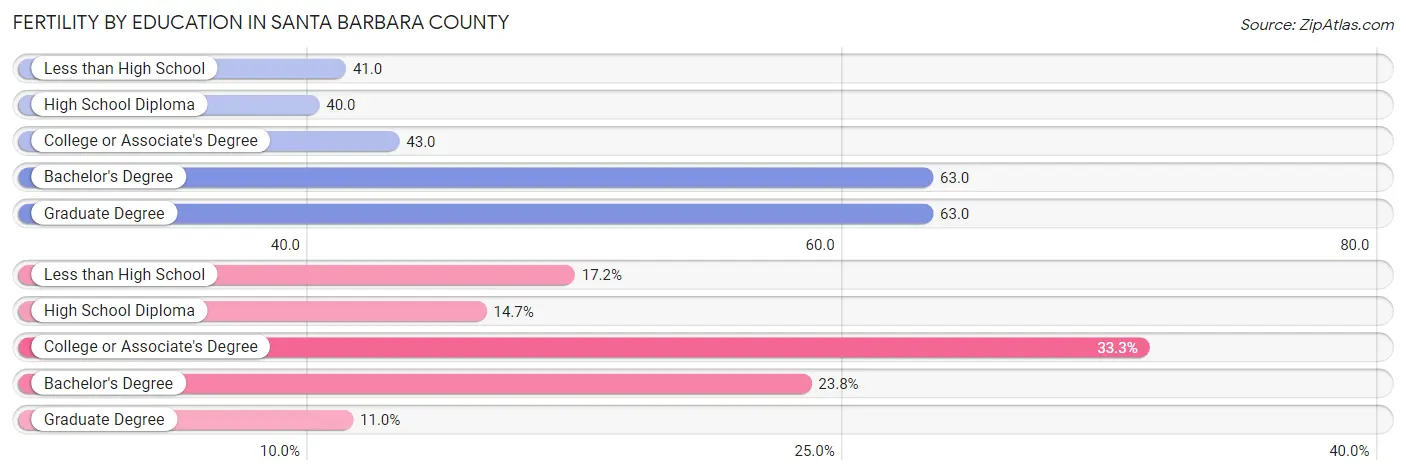
| Educational Attainment | Women with Births | Births / 1,000 Women |
| Less than High School | 879 (17.2%) | 41.0 |
| High School Diploma | 752 (14.7%) | 40.0 |
| College or Associate's Degree | 1,705 (33.3%) | 43.0 |
| Bachelor's Degree | 1,219 (23.8%) | 63.0 |
| Graduate Degree | 560 (11.0%) | 63.0 |
| Total | 5,115 (100.0%) | 47.0 |
Fertility by Education by Marriage Status in Santa Barbara County
32.6% of women with births in Santa Barbara County are unmarried. Women with the educational attainment of graduate degree are most likely to be married with 95.9% of them married at childbirth, while women with the educational attainment of less than high school are least likely to be married with 60.5% of them unmarried at childbirth.
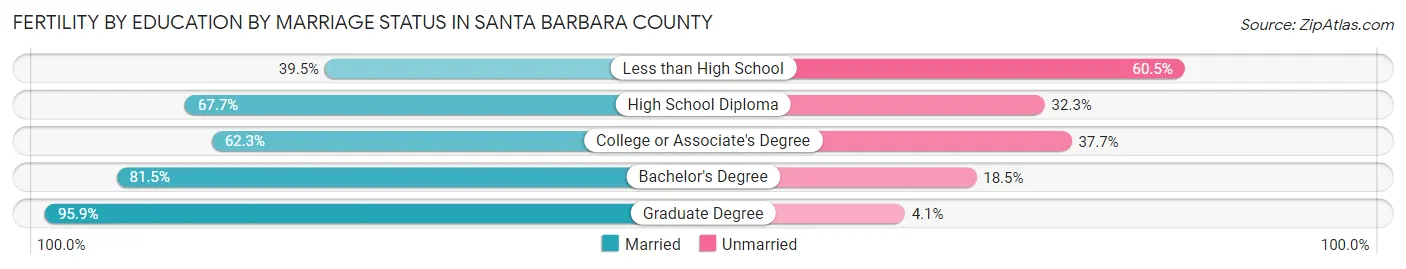
| Educational Attainment | Married | Unmarried |
| Less than High School | 347 (39.5%) | 532 (60.5%) |
| High School Diploma | 509 (67.7%) | 243 (32.3%) |
| College or Associate's Degree | 1,062 (62.3%) | 643 (37.7%) |
| Bachelor's Degree | 993 (81.5%) | 226 (18.5%) |
| Graduate Degree | 537 (95.9%) | 23 (4.1%) |
| Total | 3,448 (67.4%) | 1,667 (32.6%) |
Employment Characteristics in Santa Barbara County
Employment by Class of Employer in Santa Barbara County
Among the 204,766 employed individuals in Santa Barbara County, private company employees (126,911 | 62.0%), not-for-profit organizations (17,548 | 8.6%), and local government employees (16,979 | 8.3%) make up the most common classes of employment.
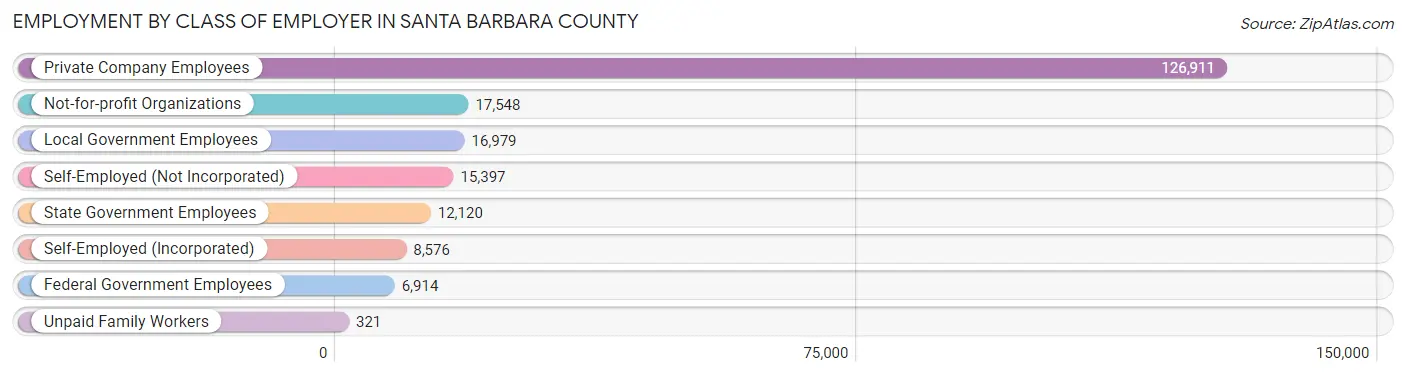
| Employer Class | # Employees | % Employees |
| Private Company Employees | 126,911 | 62.0% |
| Self-Employed (Incorporated) | 8,576 | 4.2% |
| Self-Employed (Not Incorporated) | 15,397 | 7.5% |
| Not-for-profit Organizations | 17,548 | 8.6% |
| Local Government Employees | 16,979 | 8.3% |
| State Government Employees | 12,120 | 5.9% |
| Federal Government Employees | 6,914 | 3.4% |
| Unpaid Family Workers | 321 | 0.2% |
| Total | 204,766 | 100.0% |
Employment Status by Age in Santa Barbara County
According to the labor force statistics for Santa Barbara County, out of the total population over 16 years of age (357,739), 62.7% or 224,302 individuals are in the labor force, with 6.0% or 13,458 of them unemployed. The age group with the highest labor force participation rate is 30 to 34 years, with 85.7% or 23,488 individuals in the labor force. Within the labor force, the 16 to 19 years age range has the highest percentage of unemployed individuals, with 17.1% or 2,123 of them being unemployed.
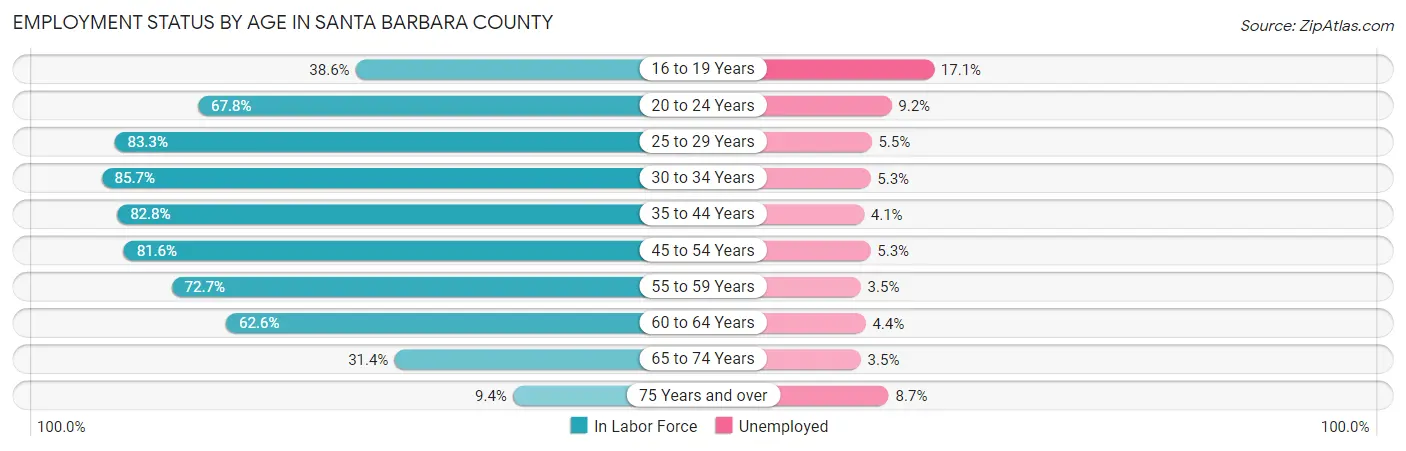
| Age Bracket | In Labor Force | Unemployed |
| 16 to 19 Years | 12,416 (38.6%) | 2,123 (17.1%) |
| 20 to 24 Years | 32,329 (67.8%) | 2,974 (9.2%) |
| 25 to 29 Years | 26,348 (83.3%) | 1,449 (5.5%) |
| 30 to 34 Years | 23,488 (85.7%) | 1,245 (5.3%) |
| 35 to 44 Years | 42,539 (82.8%) | 1,744 (4.1%) |
| 45 to 54 Years | 38,134 (81.6%) | 2,021 (5.3%) |
| 55 to 59 Years | 18,485 (72.7%) | 647 (3.5%) |
| 60 to 64 Years | 15,256 (62.6%) | 671 (4.4%) |
| 65 to 74 Years | 12,369 (31.4%) | 433 (3.5%) |
| 75 Years and over | 2,966 (9.4%) | 258 (8.7%) |
| Total | 224,302 (62.7%) | 13,458 (6.0%) |
Employment Status by Educational Attainment in Santa Barbara County
According to labor force statistics for Santa Barbara County, 79.4% of individuals (164,313) out of the total population between 25 and 64 years of age (206,943) are in the labor force, with 4.7% or 7,723 of them being unemployed. The group with the highest labor force participation rate are those with the educational attainment of bachelor's degree or higher, with 84.8% or 59,502 individuals in the labor force. Within the labor force, individuals with less than high school education have the highest percentage of unemployment, with 6.7% or 2,006 of them being unemployed.
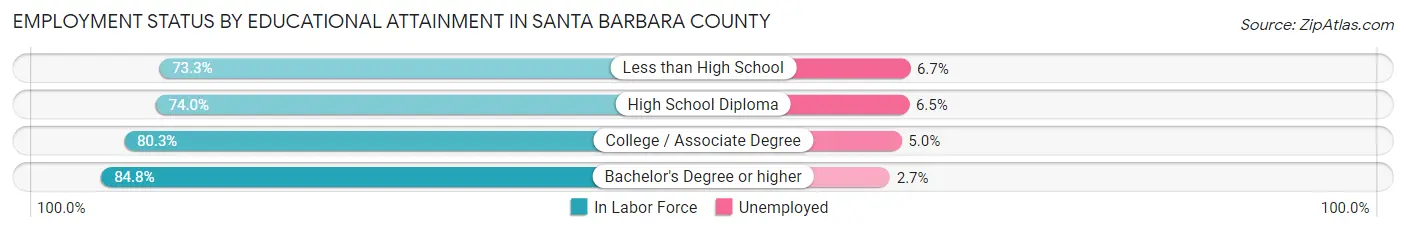
| Educational Attainment | In Labor Force | Unemployed |
| Less than High School | 29,938 (73.3%) | 2,736 (6.7%) |
| High School Diploma | 26,571 (74.0%) | 2,334 (6.5%) |
| College / Associate Degree | 48,200 (80.3%) | 3,001 (5.0%) |
| Bachelor's Degree or higher | 59,502 (84.8%) | 1,895 (2.7%) |
| Total | 164,313 (79.4%) | 9,726 (4.7%) |
Employment Occupations by Sex in Santa Barbara County
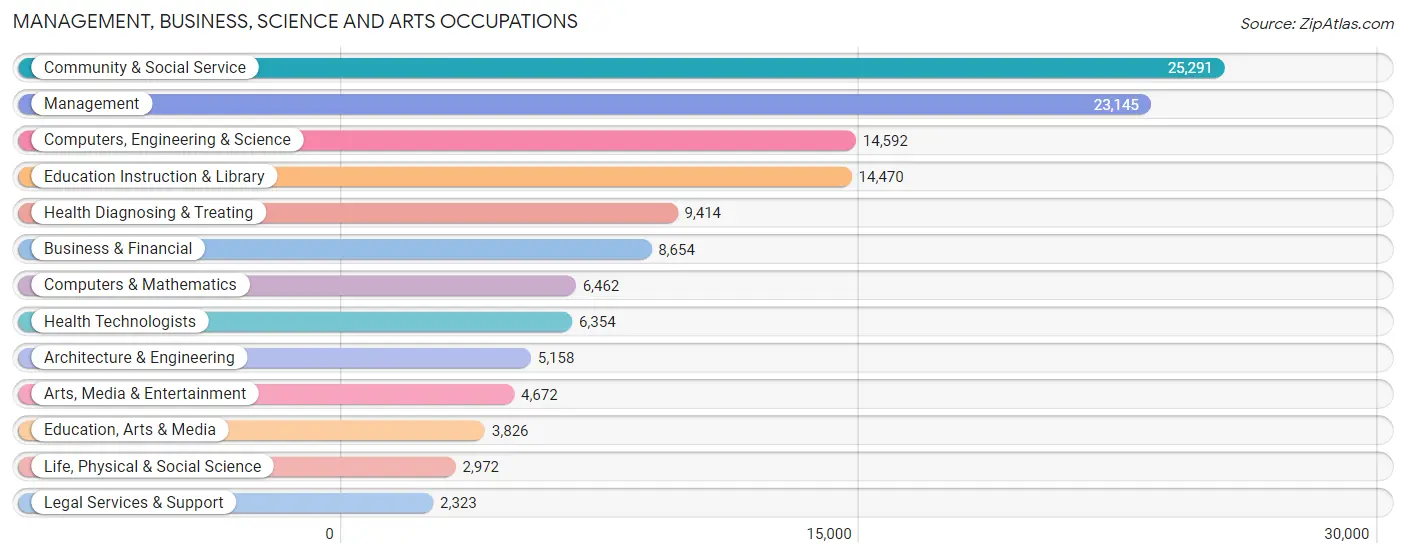
Management, Business, Science and Arts Occupations
The most common Management, Business, Science and Arts occupations in Santa Barbara County are Community & Social Service (25,291 | 12.1%), Management (23,145 | 11.1%), Computers, Engineering & Science (14,592 | 7.0%), Education Instruction & Library (14,470 | 6.9%), and Health Diagnosing & Treating (9,414 | 4.5%).
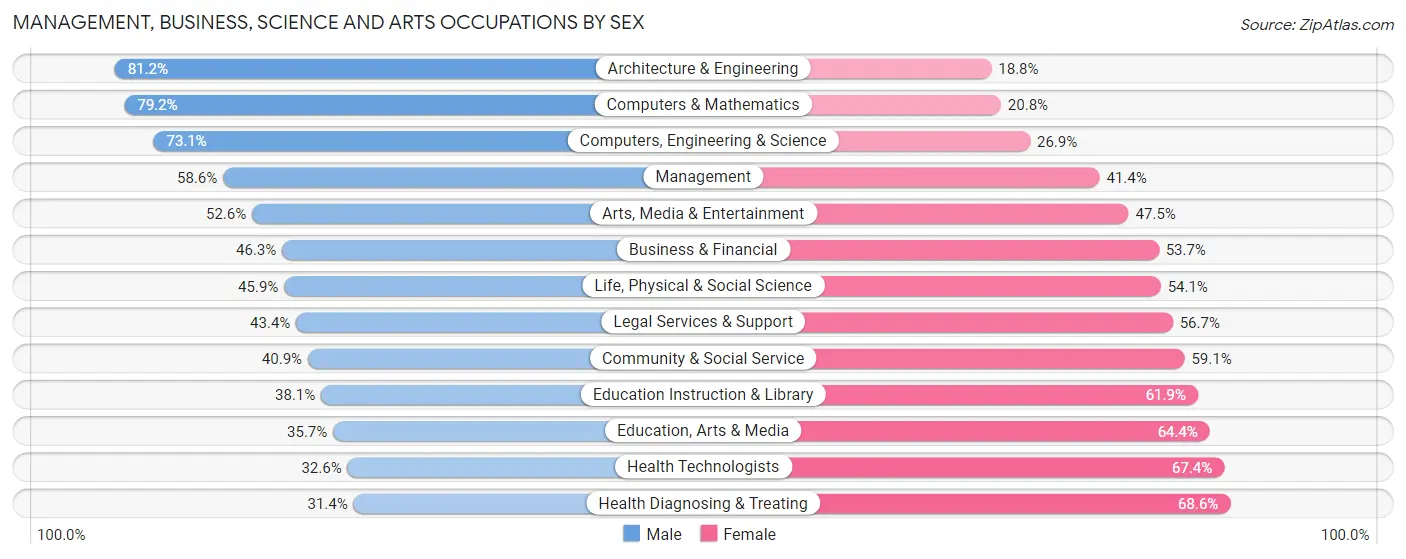
Management, Business, Science and Arts Occupations by Sex
Within the Management, Business, Science and Arts occupations in Santa Barbara County, the most male-oriented occupations are Architecture & Engineering (81.2%), Computers & Mathematics (79.2%), and Computers, Engineering & Science (73.1%), while the most female-oriented occupations are Health Diagnosing & Treating (68.6%), Health Technologists (67.4%), and Education, Arts & Media (64.3%).
| Occupation | Male | Female |
| Management | 13,566 (58.6%) | 9,579 (41.4%) |
| Business & Financial | 4,005 (46.3%) | 4,649 (53.7%) |
| Computers, Engineering & Science | 10,669 (73.1%) | 3,923 (26.9%) |
| Computers & Mathematics | 5,118 (79.2%) | 1,344 (20.8%) |
| Architecture & Engineering | 4,188 (81.2%) | 970 (18.8%) |
| Life, Physical & Social Science | 1,363 (45.9%) | 1,609 (54.1%) |
| Community & Social Service | 10,345 (40.9%) | 14,946 (59.1%) |
| Education, Arts & Media | 1,364 (35.6%) | 2,462 (64.3%) |
| Legal Services & Support | 1,007 (43.3%) | 1,316 (56.7%) |
| Education Instruction & Library | 5,519 (38.1%) | 8,951 (61.9%) |
| Arts, Media & Entertainment | 2,455 (52.5%) | 2,217 (47.4%) |
| Health Diagnosing & Treating | 2,954 (31.4%) | 6,460 (68.6%) |
| Health Technologists | 2,074 (32.6%) | 4,280 (67.4%) |
| Total (Category) | 41,539 (51.2%) | 39,557 (48.8%) |
| Total (Overall) | 113,095 (54.2%) | 95,493 (45.8%) |
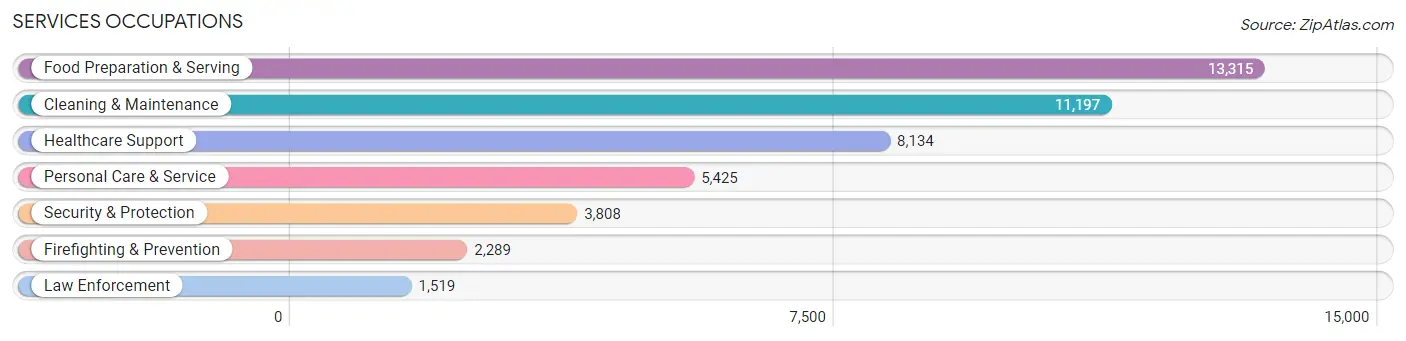
Services Occupations
The most common Services occupations in Santa Barbara County are Food Preparation & Serving (13,315 | 6.4%), Cleaning & Maintenance (11,197 | 5.4%), Healthcare Support (8,134 | 3.9%), Personal Care & Service (5,425 | 2.6%), and Security & Protection (3,808 | 1.8%).
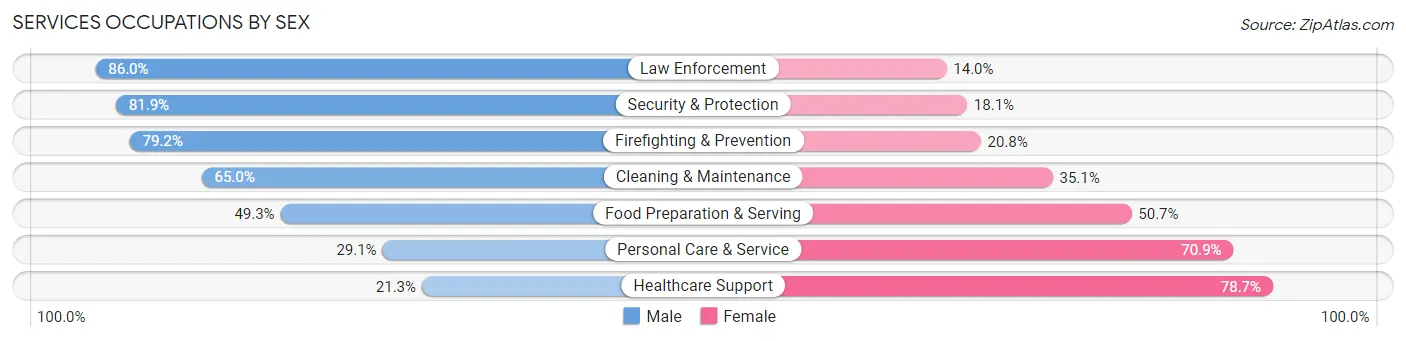
Services Occupations by Sex
Within the Services occupations in Santa Barbara County, the most male-oriented occupations are Law Enforcement (86.0%), Security & Protection (81.9%), and Firefighting & Prevention (79.2%), while the most female-oriented occupations are Healthcare Support (78.7%), Personal Care & Service (70.9%), and Food Preparation & Serving (50.7%).
| Occupation | Male | Female |
| Healthcare Support | 1,735 (21.3%) | 6,399 (78.7%) |
| Security & Protection | 3,119 (81.9%) | 689 (18.1%) |
| Firefighting & Prevention | 1,813 (79.2%) | 476 (20.8%) |
| Law Enforcement | 1,306 (86.0%) | 213 (14.0%) |
| Food Preparation & Serving | 6,569 (49.3%) | 6,746 (50.7%) |
| Cleaning & Maintenance | 7,273 (64.9%) | 3,924 (35.0%) |
| Personal Care & Service | 1,581 (29.1%) | 3,844 (70.9%) |
| Total (Category) | 20,277 (48.4%) | 21,602 (51.6%) |
| Total (Overall) | 113,095 (54.2%) | 95,493 (45.8%) |
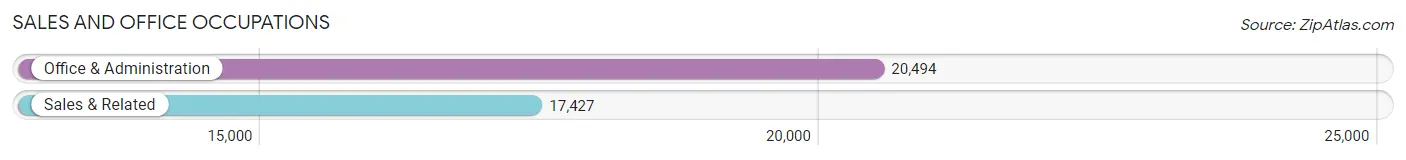
Sales and Office Occupations
The most common Sales and Office occupations in Santa Barbara County are Office & Administration (20,494 | 9.8%), and Sales & Related (17,427 | 8.4%).
Sales and Office Occupations by Sex
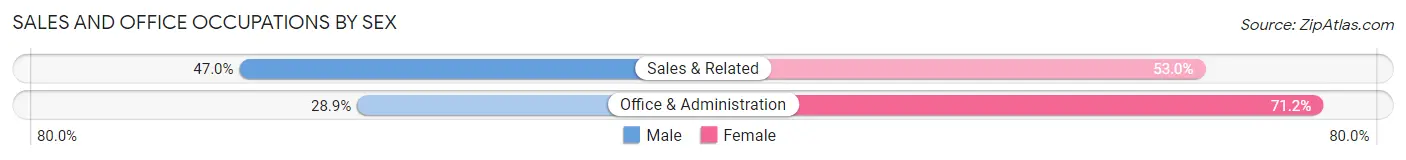
| Occupation | Male | Female |
| Sales & Related | 8,183 (47.0%) | 9,244 (53.0%) |
| Office & Administration | 5,913 (28.8%) | 14,581 (71.2%) |
| Total (Category) | 14,096 (37.2%) | 23,825 (62.8%) |
| Total (Overall) | 113,095 (54.2%) | 95,493 (45.8%) |
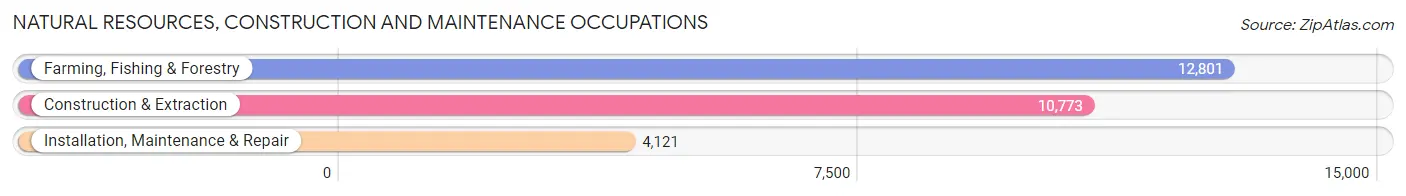
Natural Resources, Construction and Maintenance Occupations
The most common Natural Resources, Construction and Maintenance occupations in Santa Barbara County are Farming, Fishing & Forestry (12,801 | 6.1%), Construction & Extraction (10,773 | 5.2%), and Installation, Maintenance & Repair (4,121 | 2.0%).
Natural Resources, Construction and Maintenance Occupations by Sex

| Occupation | Male | Female |
| Farming, Fishing & Forestry | 7,888 (61.6%) | 4,913 (38.4%) |
| Construction & Extraction | 10,575 (98.2%) | 198 (1.8%) |
| Installation, Maintenance & Repair | 3,857 (93.6%) | 264 (6.4%) |
| Total (Category) | 22,320 (80.6%) | 5,375 (19.4%) |
| Total (Overall) | 113,095 (54.2%) | 95,493 (45.8%) |
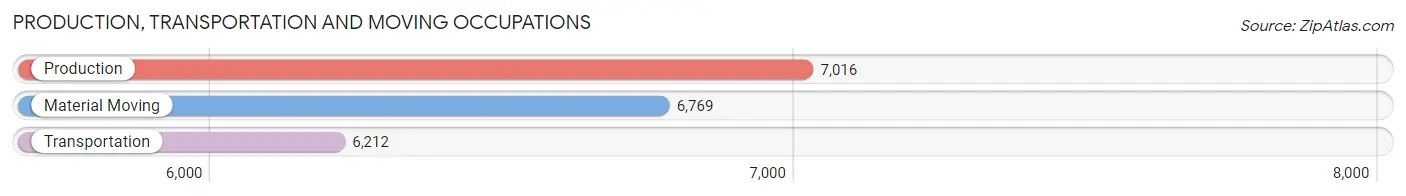
Production, Transportation and Moving Occupations
The most common Production, Transportation and Moving occupations in Santa Barbara County are Production (7,016 | 3.4%), Material Moving (6,769 | 3.3%), and Transportation (6,212 | 3.0%).
Production, Transportation and Moving Occupations by Sex
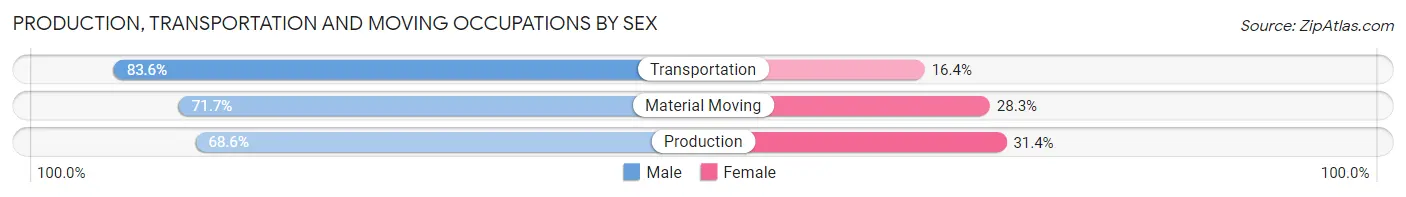
| Occupation | Male | Female |
| Production | 4,816 (68.6%) | 2,200 (31.4%) |
| Transportation | 5,195 (83.6%) | 1,017 (16.4%) |
| Material Moving | 4,852 (71.7%) | 1,917 (28.3%) |
| Total (Category) | 14,863 (74.3%) | 5,134 (25.7%) |
| Total (Overall) | 113,095 (54.2%) | 95,493 (45.8%) |
Employment Industries by Sex in Santa Barbara County
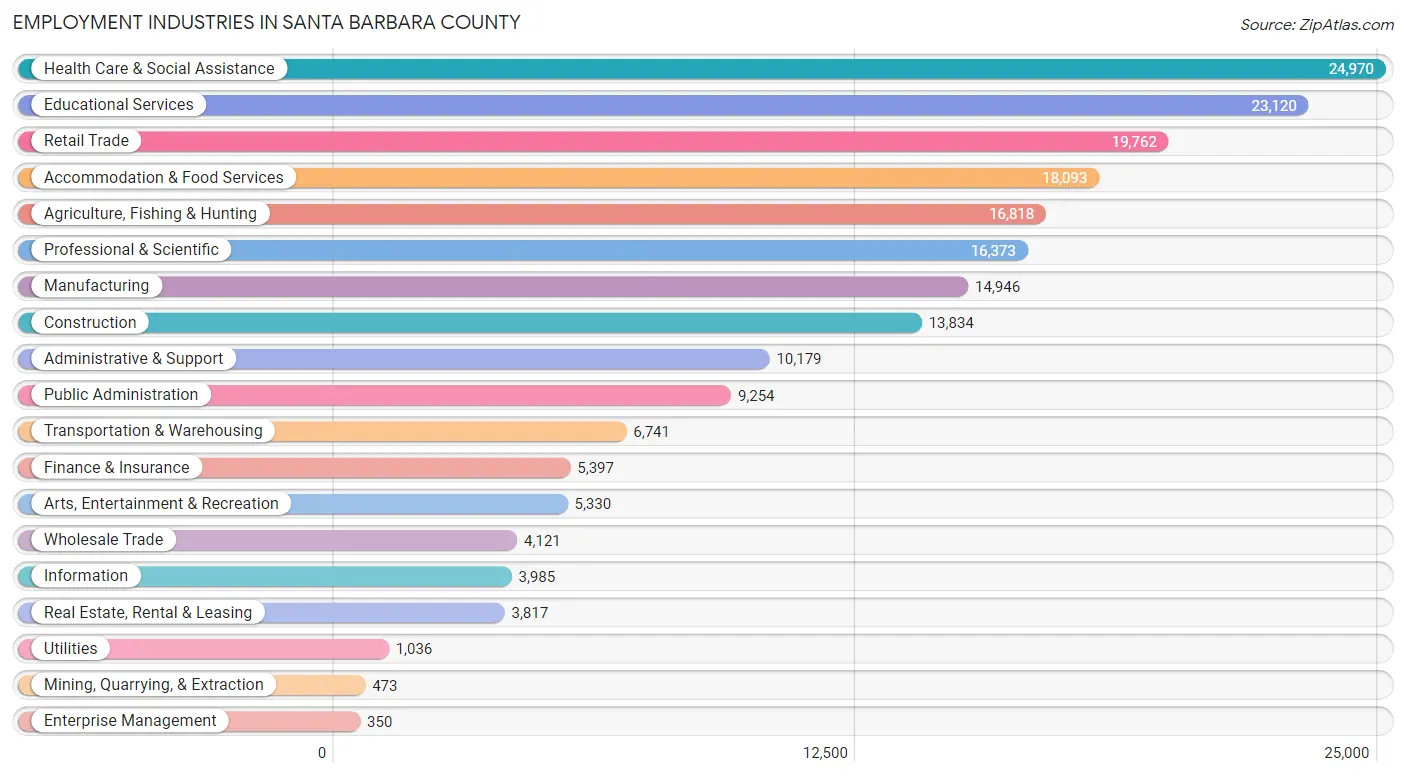
Employment Industries in Santa Barbara County
The major employment industries in Santa Barbara County include Health Care & Social Assistance (24,970 | 12.0%), Educational Services (23,120 | 11.1%), Retail Trade (19,762 | 9.5%), Accommodation & Food Services (18,093 | 8.7%), and Agriculture, Fishing & Hunting (16,818 | 8.1%).
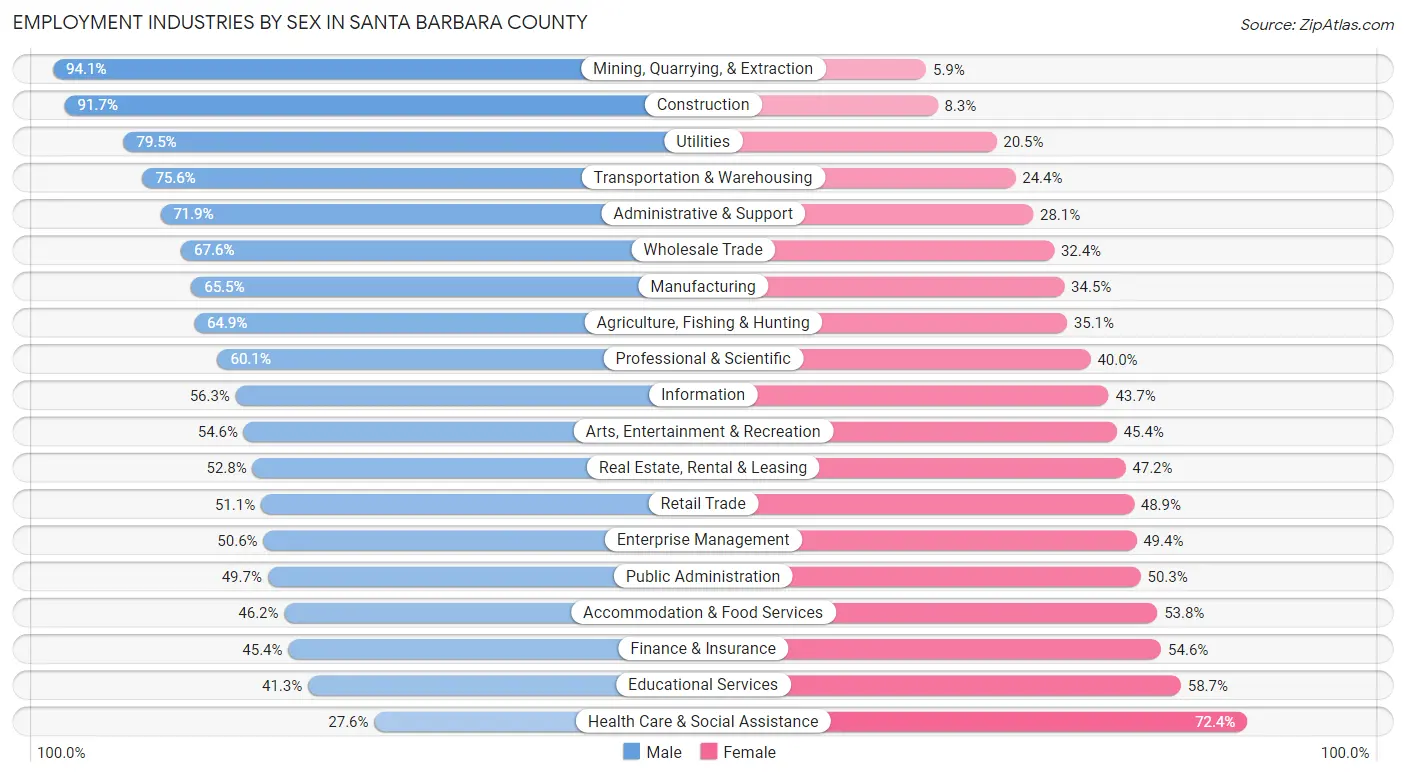
Employment Industries by Sex in Santa Barbara County
The Santa Barbara County industries that see more men than women are Mining, Quarrying, & Extraction (94.1%), Construction (91.7%), and Utilities (79.5%), whereas the industries that tend to have a higher number of women are Health Care & Social Assistance (72.4%), Educational Services (58.7%), and Finance & Insurance (54.6%).
| Industry | Male | Female |
| Agriculture, Fishing & Hunting | 10,920 (64.9%) | 5,898 (35.1%) |
| Mining, Quarrying, & Extraction | 445 (94.1%) | 28 (5.9%) |
| Construction | 12,689 (91.7%) | 1,145 (8.3%) |
| Manufacturing | 9,788 (65.5%) | 5,158 (34.5%) |
| Wholesale Trade | 2,786 (67.6%) | 1,335 (32.4%) |
| Retail Trade | 10,092 (51.1%) | 9,670 (48.9%) |
| Transportation & Warehousing | 5,096 (75.6%) | 1,645 (24.4%) |
| Utilities | 824 (79.5%) | 212 (20.5%) |
| Information | 2,244 (56.3%) | 1,741 (43.7%) |
| Finance & Insurance | 2,451 (45.4%) | 2,946 (54.6%) |
| Real Estate, Rental & Leasing | 2,016 (52.8%) | 1,801 (47.2%) |
| Professional & Scientific | 9,832 (60.1%) | 6,541 (40.0%) |
| Enterprise Management | 177 (50.6%) | 173 (49.4%) |
| Administrative & Support | 7,321 (71.9%) | 2,858 (28.1%) |
| Educational Services | 9,557 (41.3%) | 13,563 (58.7%) |
| Health Care & Social Assistance | 6,893 (27.6%) | 18,077 (72.4%) |
| Arts, Entertainment & Recreation | 2,911 (54.6%) | 2,419 (45.4%) |
| Accommodation & Food Services | 8,364 (46.2%) | 9,729 (53.8%) |
| Public Administration | 4,596 (49.7%) | 4,658 (50.3%) |
| Total | 113,095 (54.2%) | 95,493 (45.8%) |
Education in Santa Barbara County
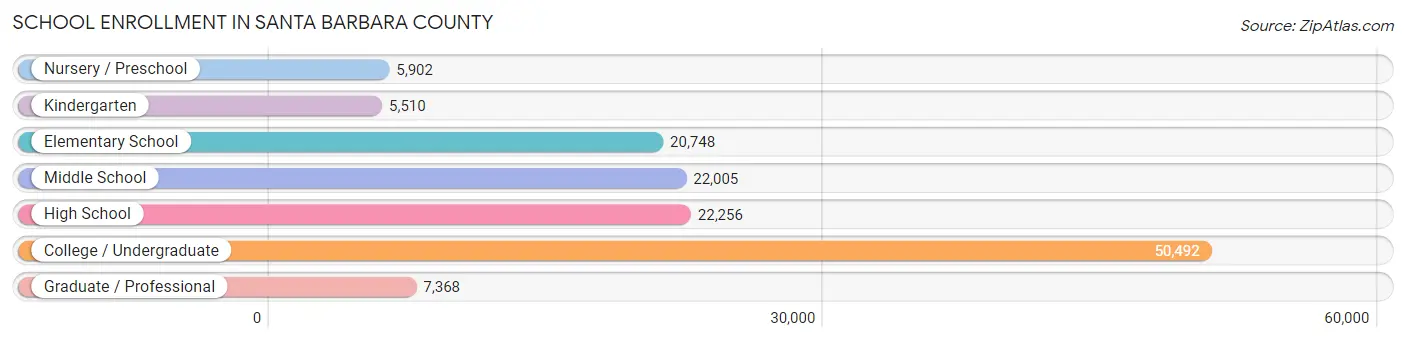
School Enrollment in Santa Barbara County
The most common levels of schooling among the 134,281 students in Santa Barbara County are college / undergraduate (50,492 | 37.6%), high school (22,256 | 16.6%), and middle school (22,005 | 16.4%).
| School Level | # Students | % Students |
| Nursery / Preschool | 5,902 | 4.4% |
| Kindergarten | 5,510 | 4.1% |
| Elementary School | 20,748 | 15.4% |
| Middle School | 22,005 | 16.4% |
| High School | 22,256 | 16.6% |
| College / Undergraduate | 50,492 | 37.6% |
| Graduate / Professional | 7,368 | 5.5% |
| Total | 134,281 | 100.0% |
School Enrollment by Age by Funding Source in Santa Barbara County
Out of a total of 134,281 students who are enrolled in schools in Santa Barbara County, 13,831 (10.3%) attend a private institution, while the remaining 120,450 (89.7%) are enrolled in public schools. The age group of 3 to 4 year olds has the highest likelihood of being enrolled in private schools, with 1,797 (37.9% in the age bracket) enrolled. Conversely, the age group of 18 to 19 year olds has the lowest likelihood of being enrolled in a private school, with 16,935 (94.4% in the age bracket) attending a public institution.
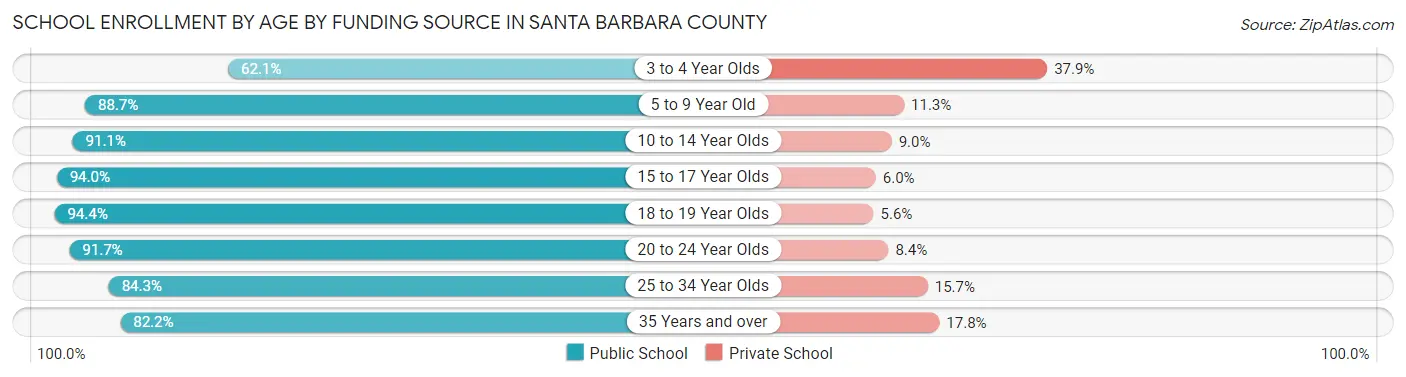
| Age Bracket | Public School | Private School |
| 3 to 4 Year Olds | 2,943 (62.1%) | 1,797 (37.9%) |
| 5 to 9 Year Old | 21,803 (88.7%) | 2,766 (11.3%) |
| 10 to 14 Year Olds | 25,880 (91.0%) | 2,544 (8.9%) |
| 15 to 17 Year Olds | 14,972 (94.0%) | 954 (6.0%) |
| 18 to 19 Year Olds | 16,935 (94.4%) | 999 (5.6%) |
| 20 to 24 Year Olds | 25,118 (91.6%) | 2,288 (8.4%) |
| 25 to 34 Year Olds | 8,161 (84.3%) | 1,517 (15.7%) |
| 35 Years and over | 4,605 (82.2%) | 999 (17.8%) |
| Total | 120,450 (89.7%) | 13,831 (10.3%) |
Educational Attainment by Field of Study in Santa Barbara County
Business (14,417 | 13.4%), social sciences (14,179 | 13.2%), engineering (8,622 | 8.0%), bio, nature & agricultural (8,616 | 8.0%), and liberal arts & history (7,985 | 7.4%) are the most common fields of study among 107,720 individuals in Santa Barbara County who have obtained a bachelor's degree or higher.
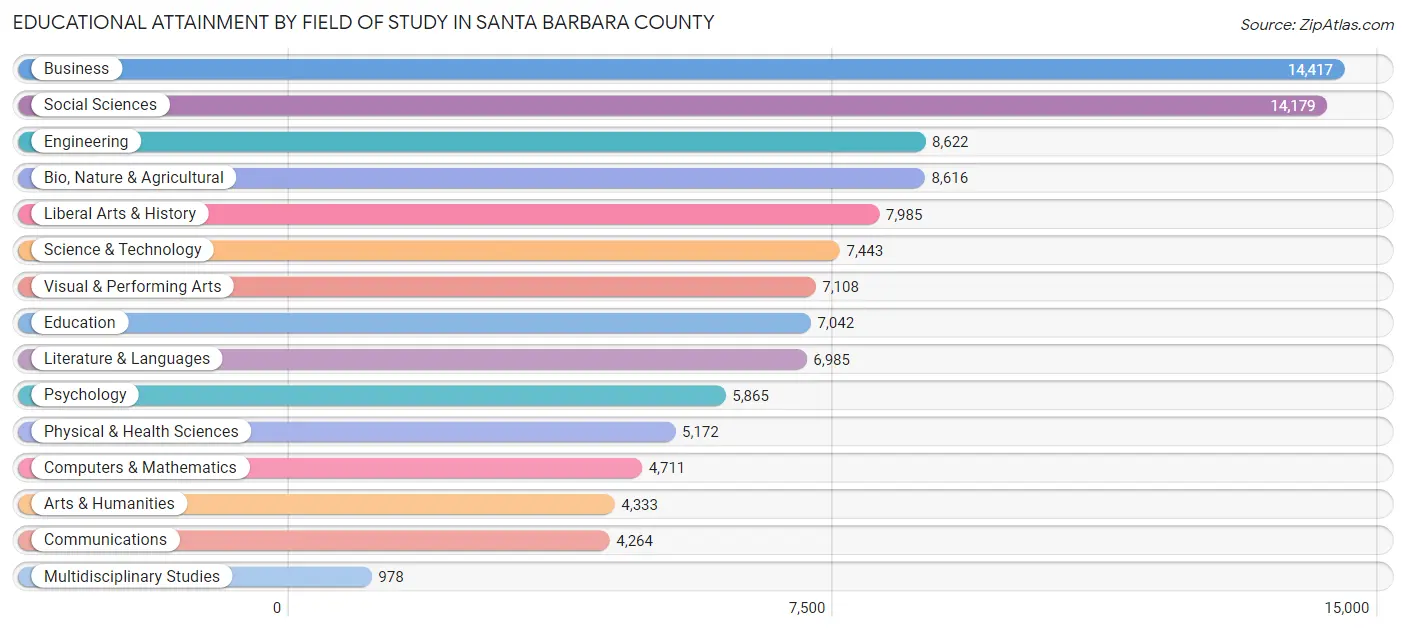
| Field of Study | # Graduates | % Graduates |
| Computers & Mathematics | 4,711 | 4.4% |
| Bio, Nature & Agricultural | 8,616 | 8.0% |
| Physical & Health Sciences | 5,172 | 4.8% |
| Psychology | 5,865 | 5.4% |
| Social Sciences | 14,179 | 13.2% |
| Engineering | 8,622 | 8.0% |
| Multidisciplinary Studies | 978 | 0.9% |
| Science & Technology | 7,443 | 6.9% |
| Business | 14,417 | 13.4% |
| Education | 7,042 | 6.5% |
| Literature & Languages | 6,985 | 6.5% |
| Liberal Arts & History | 7,985 | 7.4% |
| Visual & Performing Arts | 7,108 | 6.6% |
| Communications | 4,264 | 4.0% |
| Arts & Humanities | 4,333 | 4.0% |
| Total | 107,720 | 100.0% |
Transportation & Commute in Santa Barbara County
Vehicle Availability by Sex in Santa Barbara County
The most prevalent vehicle ownership categories in Santa Barbara County are males with 2 vehicles (41,395, accounting for 37.7%) and females with 2 vehicles (32,546, making up 45.9%).
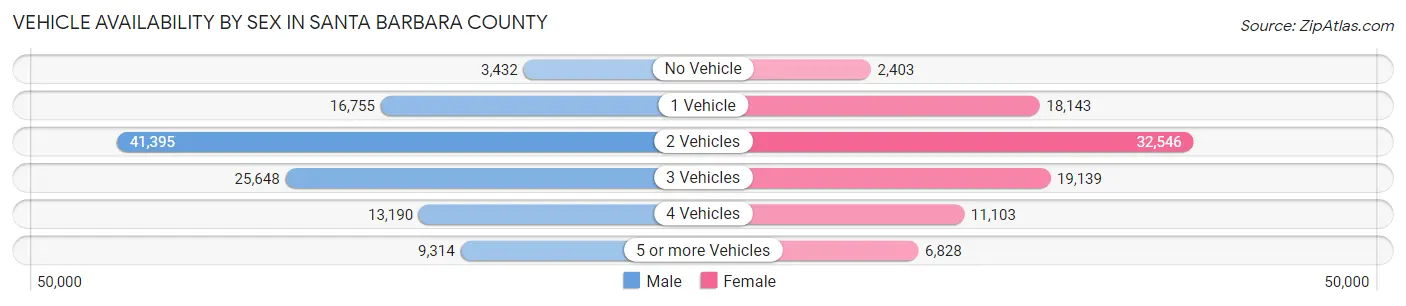
| Vehicles Available | Male | Female |
| No Vehicle | 3,432 (3.1%) | 2,403 (2.7%) |
| 1 Vehicle | 16,755 (15.3%) | 18,143 (20.1%) |
| 2 Vehicles | 41,395 (37.7%) | 32,546 (36.1%) |
| 3 Vehicles | 25,648 (23.4%) | 19,139 (21.2%) |
| 4 Vehicles | 13,190 (12.0%) | 11,103 (12.3%) |
| 5 or more Vehicles | 9,314 (8.5%) | 6,828 (7.6%) |
| Total | 109,734 (100.0%) | 90,162 (100.0%) |
Commute Time in Santa Barbara County
The most frequently occuring commute durations in Santa Barbara County are 10 to 14 minutes (40,013 commuters, 22.0%), 15 to 19 minutes (33,017 commuters, 18.2%), and 5 to 9 minutes (27,501 commuters, 15.1%).
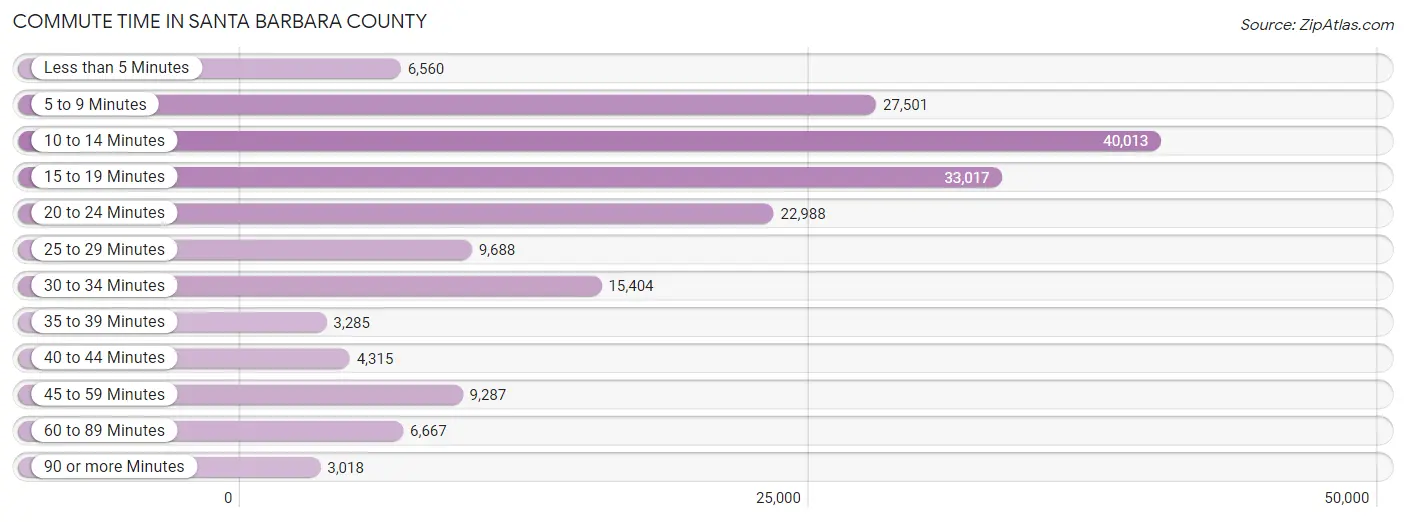
| Commute Time | # Commuters | % Commuters |
| Less than 5 Minutes | 6,560 | 3.6% |
| 5 to 9 Minutes | 27,501 | 15.1% |
| 10 to 14 Minutes | 40,013 | 22.0% |
| 15 to 19 Minutes | 33,017 | 18.2% |
| 20 to 24 Minutes | 22,988 | 12.7% |
| 25 to 29 Minutes | 9,688 | 5.3% |
| 30 to 34 Minutes | 15,404 | 8.5% |
| 35 to 39 Minutes | 3,285 | 1.8% |
| 40 to 44 Minutes | 4,315 | 2.4% |
| 45 to 59 Minutes | 9,287 | 5.1% |
| 60 to 89 Minutes | 6,667 | 3.7% |
| 90 or more Minutes | 3,018 | 1.7% |
Commute Time by Sex in Santa Barbara County
The most common commute times in Santa Barbara County are 10 to 14 minutes (20,213 commuters, 20.0%) for males and 10 to 14 minutes (19,800 commuters, 24.5%) for females.
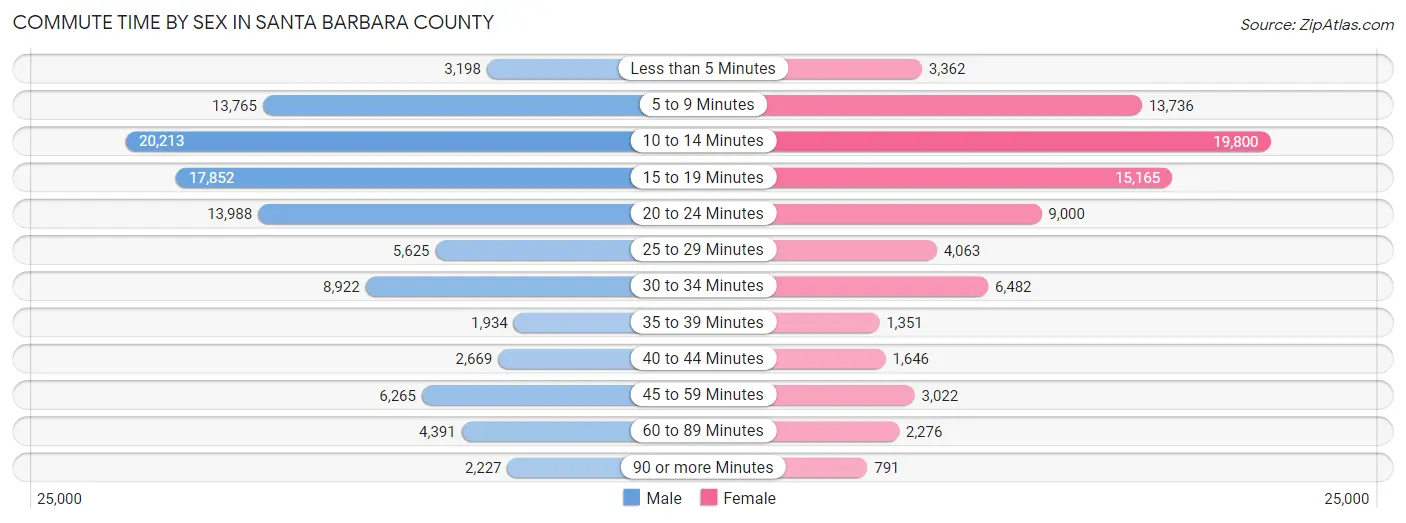
| Commute Time | Male | Female |
| Less than 5 Minutes | 3,198 (3.2%) | 3,362 (4.2%) |
| 5 to 9 Minutes | 13,765 (13.6%) | 13,736 (17.0%) |
| 10 to 14 Minutes | 20,213 (20.0%) | 19,800 (24.5%) |
| 15 to 19 Minutes | 17,852 (17.7%) | 15,165 (18.8%) |
| 20 to 24 Minutes | 13,988 (13.8%) | 9,000 (11.2%) |
| 25 to 29 Minutes | 5,625 (5.6%) | 4,063 (5.0%) |
| 30 to 34 Minutes | 8,922 (8.8%) | 6,482 (8.0%) |
| 35 to 39 Minutes | 1,934 (1.9%) | 1,351 (1.7%) |
| 40 to 44 Minutes | 2,669 (2.6%) | 1,646 (2.0%) |
| 45 to 59 Minutes | 6,265 (6.2%) | 3,022 (3.7%) |
| 60 to 89 Minutes | 4,391 (4.3%) | 2,276 (2.8%) |
| 90 or more Minutes | 2,227 (2.2%) | 791 (1.0%) |
Time of Departure to Work by Sex in Santa Barbara County
The most frequent times of departure to work in Santa Barbara County are 7:00 AM to 7:29 AM (13,781, 13.6%) for males and 7:30 AM to 7:59 AM (12,292, 15.2%) for females.
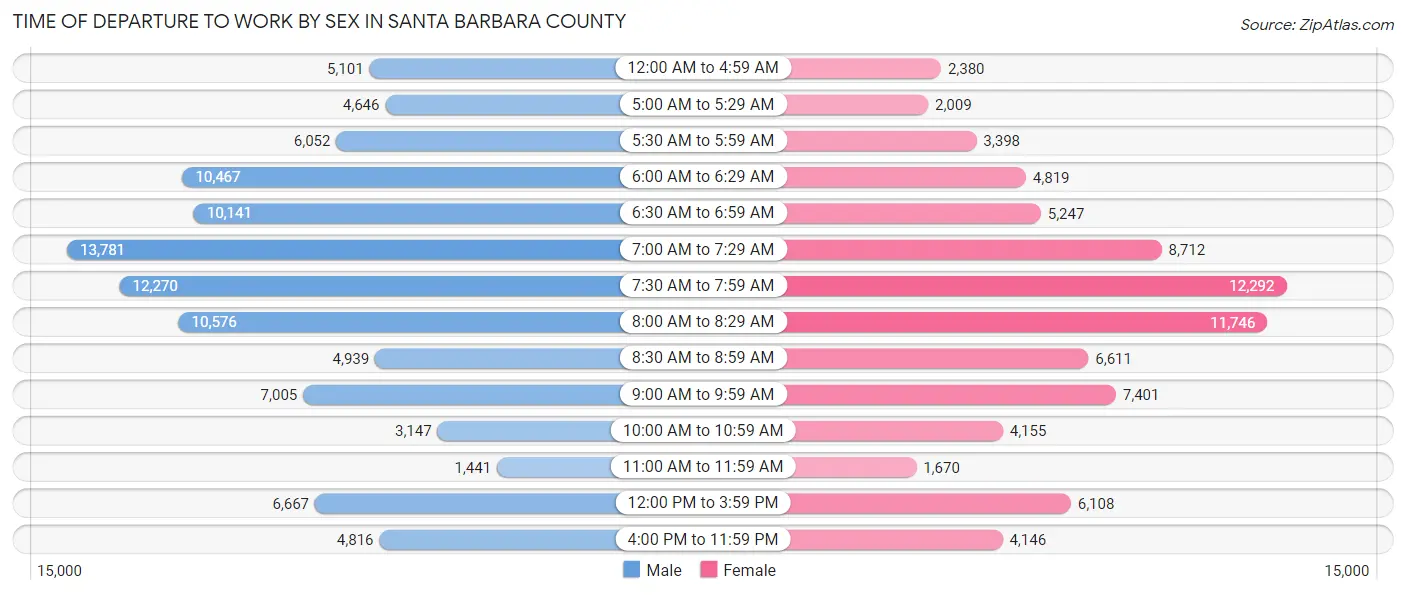
| Time of Departure | Male | Female |
| 12:00 AM to 4:59 AM | 5,101 (5.1%) | 2,380 (2.9%) |
| 5:00 AM to 5:29 AM | 4,646 (4.6%) | 2,009 (2.5%) |
| 5:30 AM to 5:59 AM | 6,052 (6.0%) | 3,398 (4.2%) |
| 6:00 AM to 6:29 AM | 10,467 (10.4%) | 4,819 (6.0%) |
| 6:30 AM to 6:59 AM | 10,141 (10.0%) | 5,247 (6.5%) |
| 7:00 AM to 7:29 AM | 13,781 (13.6%) | 8,712 (10.8%) |
| 7:30 AM to 7:59 AM | 12,270 (12.1%) | 12,292 (15.2%) |
| 8:00 AM to 8:29 AM | 10,576 (10.5%) | 11,746 (14.6%) |
| 8:30 AM to 8:59 AM | 4,939 (4.9%) | 6,611 (8.2%) |
| 9:00 AM to 9:59 AM | 7,005 (6.9%) | 7,401 (9.2%) |
| 10:00 AM to 10:59 AM | 3,147 (3.1%) | 4,155 (5.1%) |
| 11:00 AM to 11:59 AM | 1,441 (1.4%) | 1,670 (2.1%) |
| 12:00 PM to 3:59 PM | 6,667 (6.6%) | 6,108 (7.6%) |
| 4:00 PM to 11:59 PM | 4,816 (4.8%) | 4,146 (5.1%) |
| Total | 101,049 (100.0%) | 80,694 (100.0%) |
Housing Occupancy in Santa Barbara County
Occupancy by Ownership in Santa Barbara County
Of the total 148,032 dwellings in Santa Barbara County, owner-occupied units account for 78,168 (52.8%), while renter-occupied units make up 69,864 (47.2%).
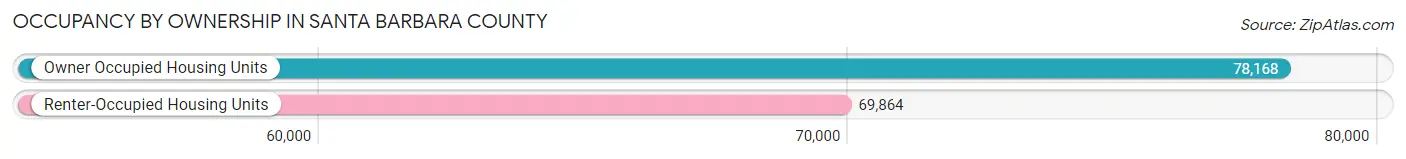
| Occupancy | # Housing Units | % Housing Units |
| Owner Occupied Housing Units | 78,168 | 52.8% |
| Renter-Occupied Housing Units | 69,864 | 47.2% |
| Total Occupied Housing Units | 148,032 | 100.0% |
Occupancy by Household Size in Santa Barbara County
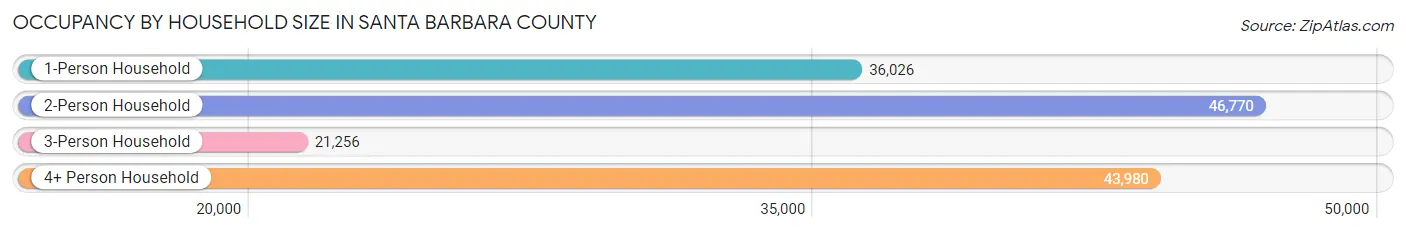
| Household Size | # Housing Units | % Housing Units |
| 1-Person Household | 36,026 | 24.3% |
| 2-Person Household | 46,770 | 31.6% |
| 3-Person Household | 21,256 | 14.4% |
| 4+ Person Household | 43,980 | 29.7% |
| Total Housing Units | 148,032 | 100.0% |
Occupancy by Ownership by Household Size in Santa Barbara County
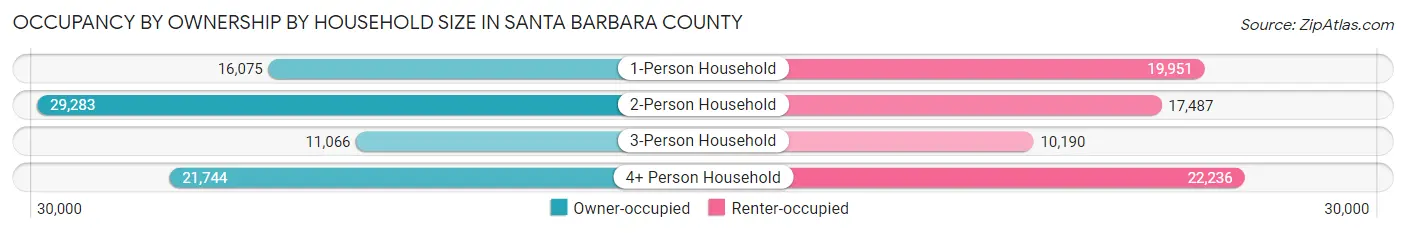
| Household Size | Owner-occupied | Renter-occupied |
| 1-Person Household | 16,075 (44.6%) | 19,951 (55.4%) |
| 2-Person Household | 29,283 (62.6%) | 17,487 (37.4%) |
| 3-Person Household | 11,066 (52.1%) | 10,190 (47.9%) |
| 4+ Person Household | 21,744 (49.4%) | 22,236 (50.6%) |
| Total Housing Units | 78,168 (52.8%) | 69,864 (47.2%) |
Occupancy by Educational Attainment in Santa Barbara County
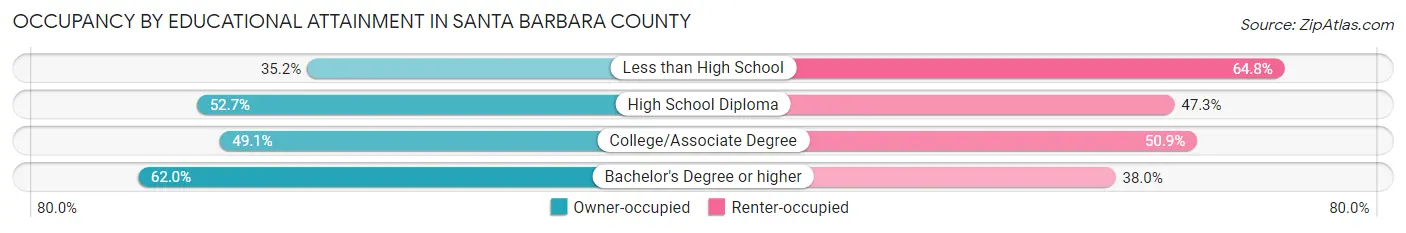
| Household Size | Owner-occupied | Renter-occupied |
| Less than High School | 7,050 (35.2%) | 12,971 (64.8%) |
| High School Diploma | 10,987 (52.7%) | 9,863 (47.3%) |
| College/Associate Degree | 24,069 (49.1%) | 24,955 (50.9%) |
| Bachelor's Degree or higher | 36,062 (62.0%) | 22,075 (38.0%) |
Occupancy by Age of Householder in Santa Barbara County
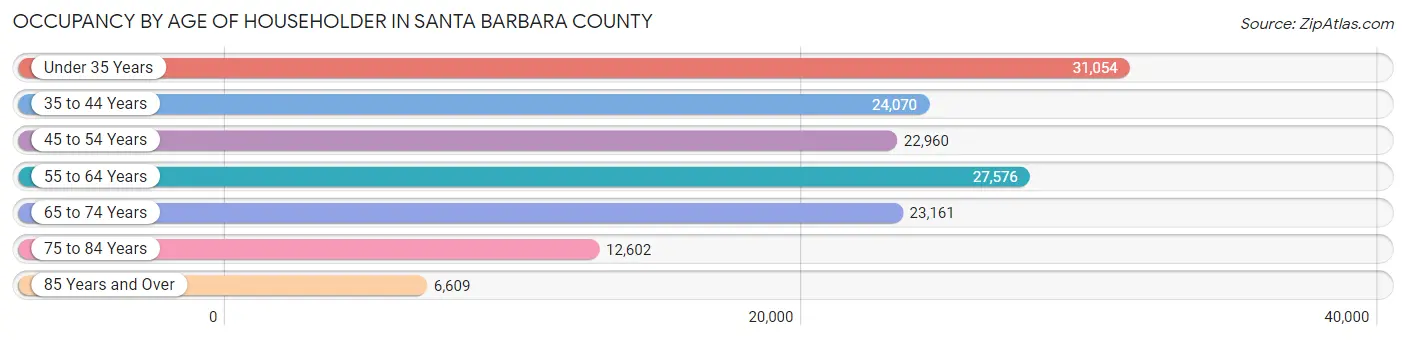
| Age Bracket | # Households | % Households |
| Under 35 Years | 31,054 | 21.0% |
| 35 to 44 Years | 24,070 | 16.3% |
| 45 to 54 Years | 22,960 | 15.5% |
| 55 to 64 Years | 27,576 | 18.6% |
| 65 to 74 Years | 23,161 | 15.7% |
| 75 to 84 Years | 12,602 | 8.5% |
| 85 Years and Over | 6,609 | 4.5% |
| Total | 148,032 | 100.0% |
Housing Finances in Santa Barbara County
Median Income by Occupancy in Santa Barbara County
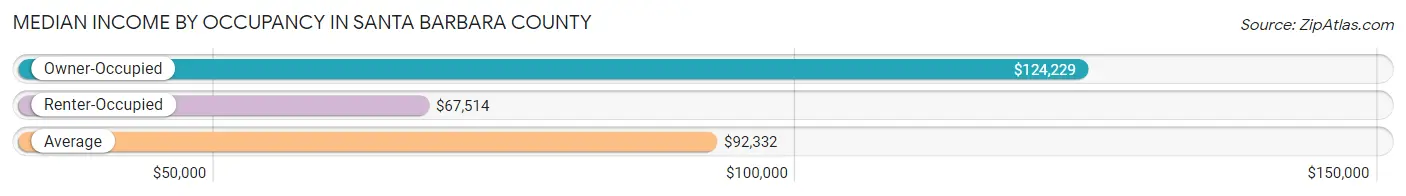
| Occupancy Type | # Households | Median Income |
| Owner-Occupied | 78,168 (52.8%) | $124,229 |
| Renter-Occupied | 69,864 (47.2%) | $67,514 |
| Average | 148,032 (100.0%) | $92,332 |
Occupancy by Householder Income Bracket in Santa Barbara County
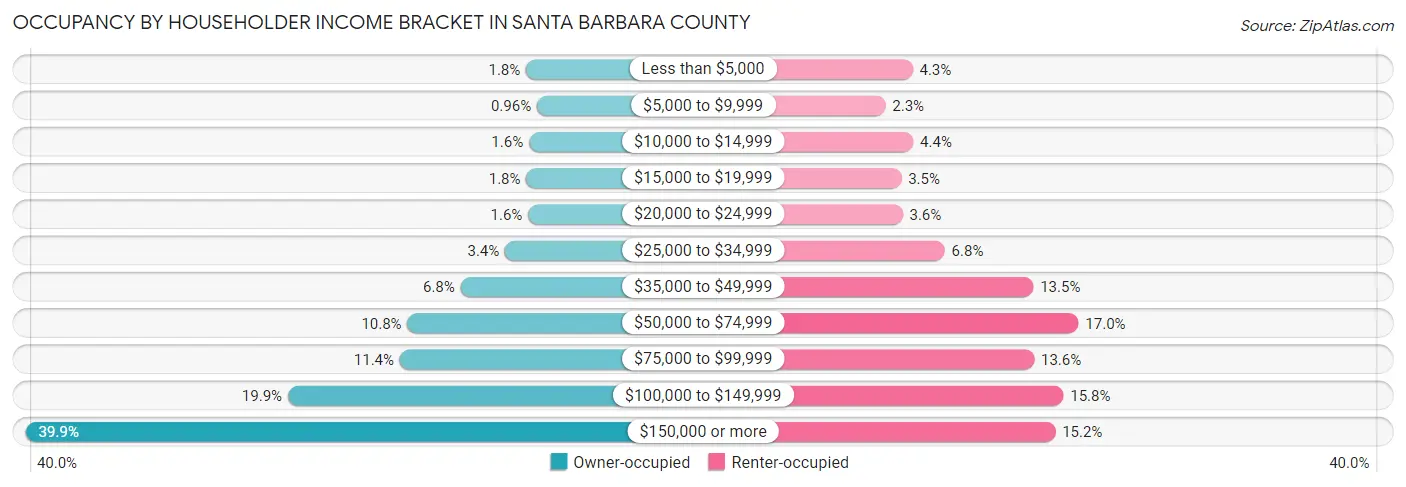
| Income Bracket | Owner-occupied | Renter-occupied |
| Less than $5,000 | 1,397 (1.8%) | 3,030 (4.3%) |
| $5,000 to $9,999 | 752 (1.0%) | 1,583 (2.3%) |
| $10,000 to $14,999 | 1,227 (1.6%) | 3,070 (4.4%) |
| $15,000 to $19,999 | 1,384 (1.8%) | 2,428 (3.5%) |
| $20,000 to $24,999 | 1,275 (1.6%) | 2,500 (3.6%) |
| $25,000 to $34,999 | 2,651 (3.4%) | 4,745 (6.8%) |
| $35,000 to $49,999 | 5,301 (6.8%) | 9,463 (13.5%) |
| $50,000 to $74,999 | 8,463 (10.8%) | 11,861 (17.0%) |
| $75,000 to $99,999 | 8,917 (11.4%) | 9,501 (13.6%) |
| $100,000 to $149,999 | 15,587 (19.9%) | 11,060 (15.8%) |
| $150,000 or more | 31,214 (39.9%) | 10,623 (15.2%) |
| Total | 78,168 (100.0%) | 69,864 (100.0%) |
Monthly Housing Cost Tiers in Santa Barbara County
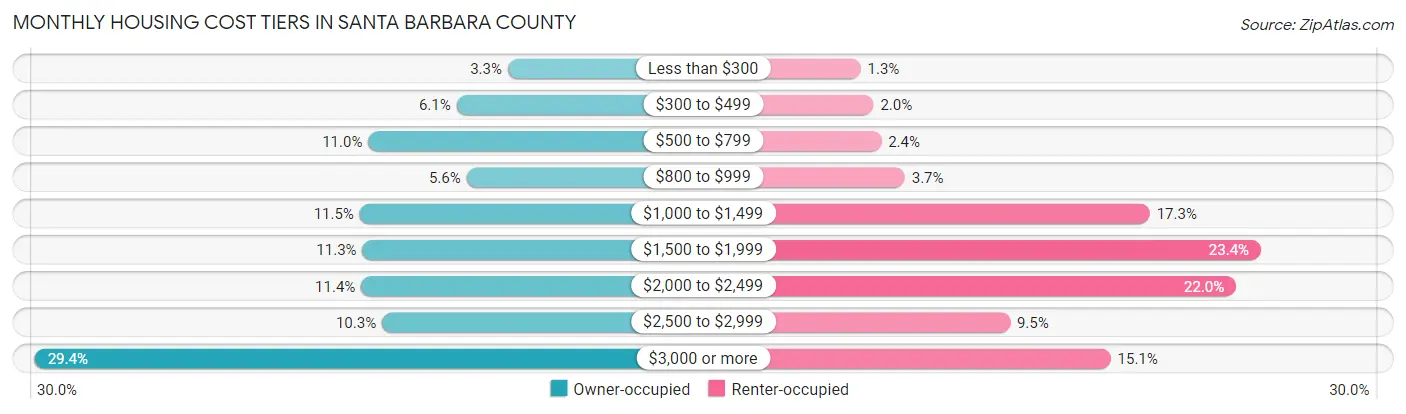
| Monthly Cost | Owner-occupied | Renter-occupied |
| Less than $300 | 2,587 (3.3%) | 892 (1.3%) |
| $300 to $499 | 4,799 (6.1%) | 1,392 (2.0%) |
| $500 to $799 | 8,616 (11.0%) | 1,690 (2.4%) |
| $800 to $999 | 4,368 (5.6%) | 2,596 (3.7%) |
| $1,000 to $1,499 | 8,985 (11.5%) | 12,054 (17.2%) |
| $1,500 to $1,999 | 8,868 (11.3%) | 16,344 (23.4%) |
| $2,000 to $2,499 | 8,917 (11.4%) | 15,387 (22.0%) |
| $2,500 to $2,999 | 8,018 (10.3%) | 6,655 (9.5%) |
| $3,000 or more | 23,010 (29.4%) | 10,542 (15.1%) |
| Total | 78,168 (100.0%) | 69,864 (100.0%) |
Physical Housing Characteristics in Santa Barbara County
Housing Structures in Santa Barbara County
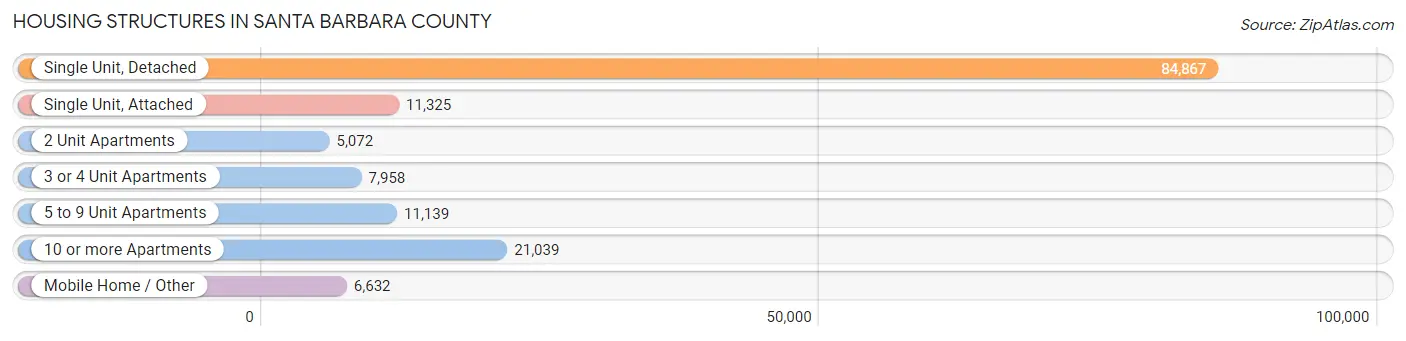
| Structure Type | # Housing Units | % Housing Units |
| Single Unit, Detached | 84,867 | 57.3% |
| Single Unit, Attached | 11,325 | 7.6% |
| 2 Unit Apartments | 5,072 | 3.4% |
| 3 or 4 Unit Apartments | 7,958 | 5.4% |
| 5 to 9 Unit Apartments | 11,139 | 7.5% |
| 10 or more Apartments | 21,039 | 14.2% |
| Mobile Home / Other | 6,632 | 4.5% |
| Total | 148,032 | 100.0% |
Housing Structures by Occupancy in Santa Barbara County
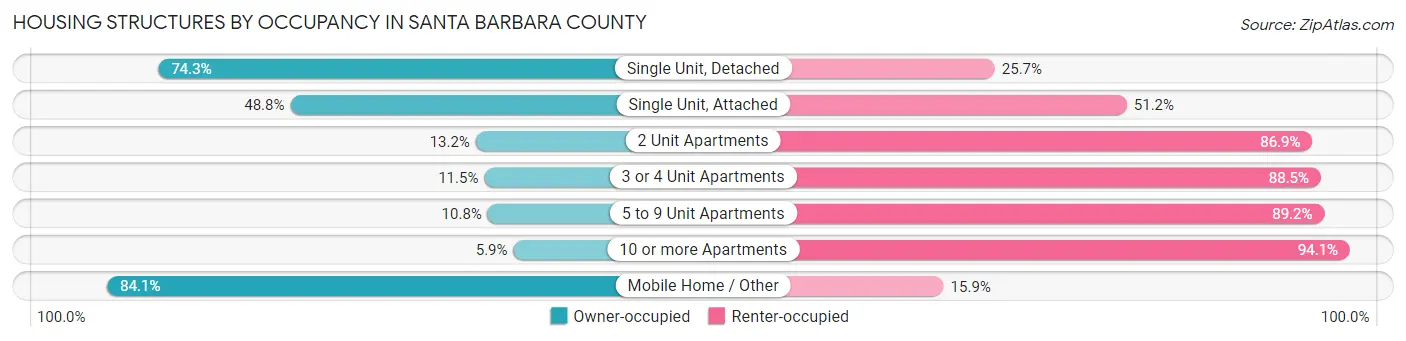
| Structure Type | Owner-occupied | Renter-occupied |
| Single Unit, Detached | 63,026 (74.3%) | 21,841 (25.7%) |
| Single Unit, Attached | 5,531 (48.8%) | 5,794 (51.2%) |
| 2 Unit Apartments | 667 (13.2%) | 4,405 (86.9%) |
| 3 or 4 Unit Apartments | 915 (11.5%) | 7,043 (88.5%) |
| 5 to 9 Unit Apartments | 1,208 (10.8%) | 9,931 (89.2%) |
| 10 or more Apartments | 1,242 (5.9%) | 19,797 (94.1%) |
| Mobile Home / Other | 5,579 (84.1%) | 1,053 (15.9%) |
| Total | 78,168 (52.8%) | 69,864 (47.2%) |
Housing Structures by Number of Rooms in Santa Barbara County
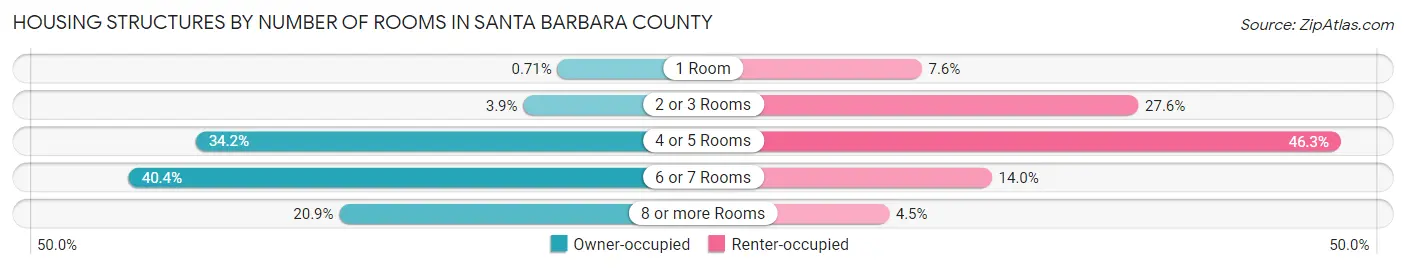
| Number of Rooms | Owner-occupied | Renter-occupied |
| 1 Room | 556 (0.7%) | 5,276 (7.5%) |
| 2 or 3 Rooms | 3,029 (3.9%) | 19,266 (27.6%) |
| 4 or 5 Rooms | 26,710 (34.2%) | 32,363 (46.3%) |
| 6 or 7 Rooms | 31,545 (40.4%) | 9,801 (14.0%) |
| 8 or more Rooms | 16,328 (20.9%) | 3,158 (4.5%) |
| Total | 78,168 (100.0%) | 69,864 (100.0%) |
Housing Structure by Heating Type in Santa Barbara County
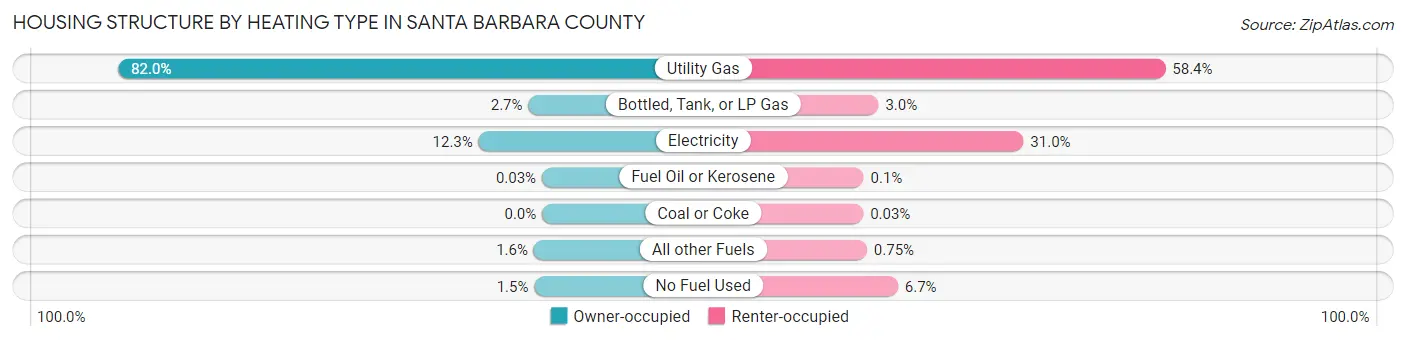
| Heating Type | Owner-occupied | Renter-occupied |
| Utility Gas | 64,057 (82.0%) | 40,818 (58.4%) |
| Bottled, Tank, or LP Gas | 2,072 (2.6%) | 2,085 (3.0%) |
| Electricity | 9,589 (12.3%) | 21,653 (31.0%) |
| Fuel Oil or Kerosene | 24 (0.0%) | 72 (0.1%) |
| Coal or Coke | 0 (0.0%) | 18 (0.0%) |
| All other Fuels | 1,249 (1.6%) | 525 (0.7%) |
| No Fuel Used | 1,177 (1.5%) | 4,693 (6.7%) |
| Total | 78,168 (100.0%) | 69,864 (100.0%) |
Household Vehicle Usage in Santa Barbara County
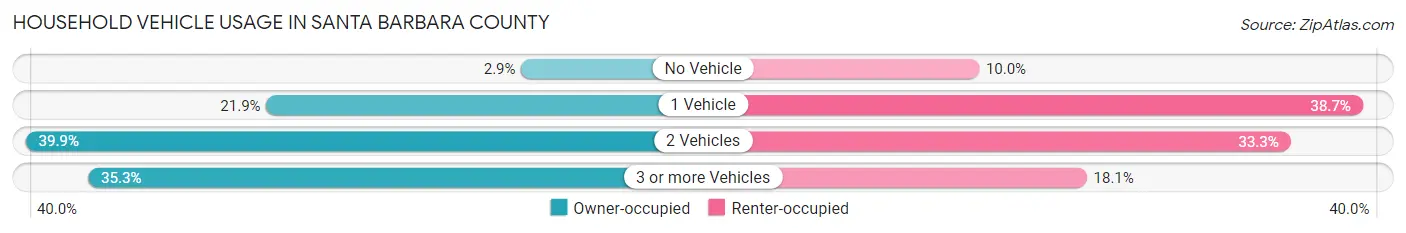
| Vehicles per Household | Owner-occupied | Renter-occupied |
| No Vehicle | 2,263 (2.9%) | 6,993 (10.0%) |
| 1 Vehicle | 17,148 (21.9%) | 27,010 (38.7%) |
| 2 Vehicles | 31,202 (39.9%) | 23,249 (33.3%) |
| 3 or more Vehicles | 27,555 (35.2%) | 12,612 (18.0%) |
| Total | 78,168 (100.0%) | 69,864 (100.0%) |
Real Estate & Mortgages in Santa Barbara County
Real Estate and Mortgage Overview in Santa Barbara County
| Characteristic | Without Mortgage | With Mortgage |
| Housing Units | 28,039 | 50,129 |
| Median Property Value | $722,300 | $711,700 |
| Median Household Income | $88,582 | $22,755 |
| Monthly Housing Costs | $754 | $21,754 |
| Real Estate Taxes | $3,763 | $1,272 |
Property Value by Mortgage Status in Santa Barbara County
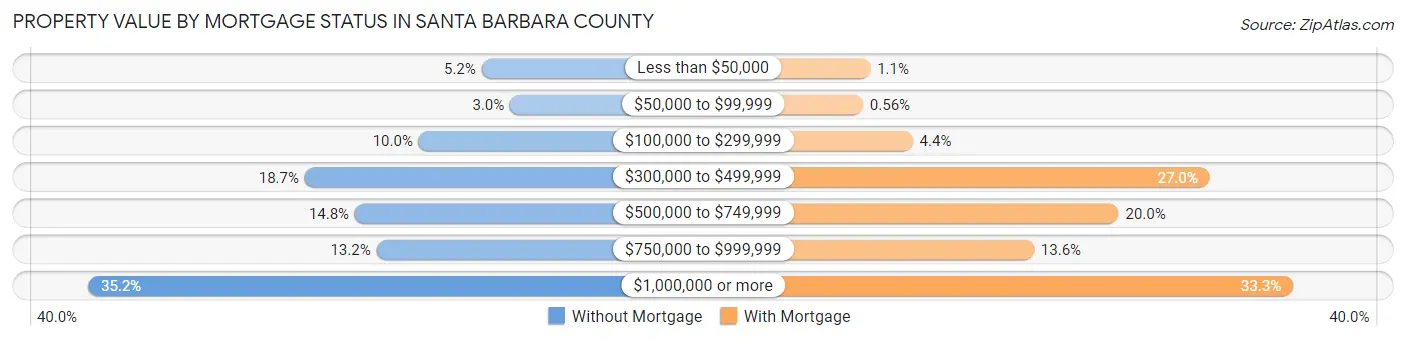
| Property Value | Without Mortgage | With Mortgage |
| Less than $50,000 | 1,453 (5.2%) | 560 (1.1%) |
| $50,000 to $99,999 | 844 (3.0%) | 283 (0.6%) |
| $100,000 to $299,999 | 2,796 (10.0%) | 2,182 (4.3%) |
| $300,000 to $499,999 | 5,228 (18.6%) | 13,532 (27.0%) |
| $500,000 to $749,999 | 4,159 (14.8%) | 10,045 (20.0%) |
| $750,000 to $999,999 | 3,699 (13.2%) | 6,815 (13.6%) |
| $1,000,000 or more | 9,860 (35.2%) | 16,712 (33.3%) |
| Total | 28,039 (100.0%) | 50,129 (100.0%) |
Household Income by Mortgage Status in Santa Barbara County
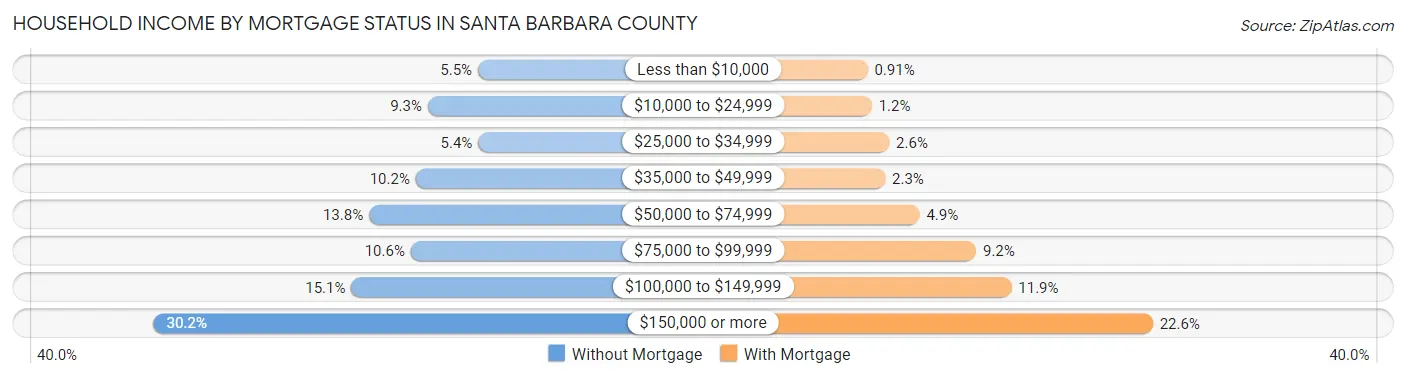
| Household Income | Without Mortgage | With Mortgage |
| Less than $10,000 | 1,531 (5.5%) | 455 (0.9%) |
| $10,000 to $24,999 | 2,603 (9.3%) | 618 (1.2%) |
| $25,000 to $34,999 | 1,524 (5.4%) | 1,283 (2.6%) |
| $35,000 to $49,999 | 2,860 (10.2%) | 1,127 (2.2%) |
| $50,000 to $74,999 | 3,859 (13.8%) | 2,441 (4.9%) |
| $75,000 to $99,999 | 2,967 (10.6%) | 4,604 (9.2%) |
| $100,000 to $149,999 | 4,236 (15.1%) | 5,950 (11.9%) |
| $150,000 or more | 8,459 (30.2%) | 11,351 (22.6%) |
| Total | 28,039 (100.0%) | 50,129 (100.0%) |
Property Value to Household Income Ratio in Santa Barbara County
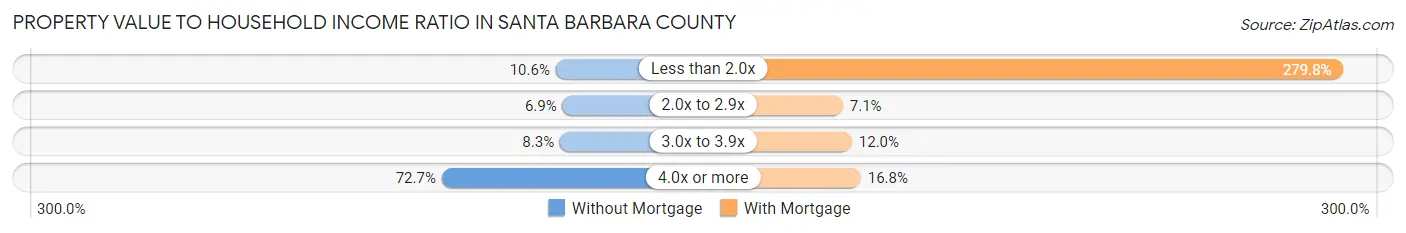
| Value-to-Income Ratio | Without Mortgage | With Mortgage |
| Less than 2.0x | 2,974 (10.6%) | 140,238 (279.7%) |
| 2.0x to 2.9x | 1,932 (6.9%) | 3,541 (7.1%) |
| 3.0x to 3.9x | 2,326 (8.3%) | 5,998 (12.0%) |
| 4.0x or more | 20,396 (72.7%) | 8,425 (16.8%) |
| Total | 28,039 (100.0%) | 50,129 (100.0%) |
Real Estate Taxes by Mortgage Status in Santa Barbara County
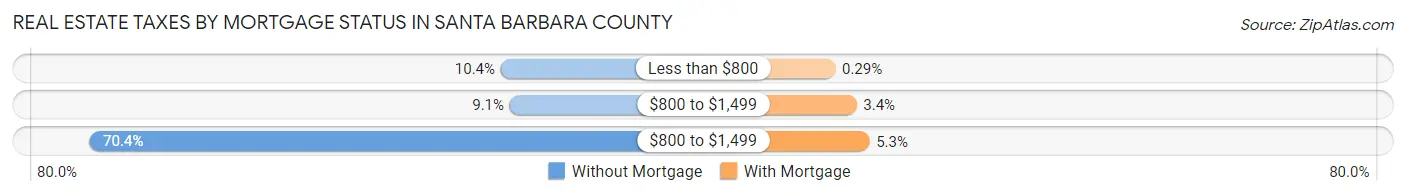
| Property Taxes | Without Mortgage | With Mortgage |
| Less than $800 | 2,919 (10.4%) | 147 (0.3%) |
| $800 to $1,499 | 2,550 (9.1%) | 1,709 (3.4%) |
| $800 to $1,499 | 19,749 (70.4%) | 2,654 (5.3%) |
| Total | 28,039 (100.0%) | 50,129 (100.0%) |
Health & Disability in Santa Barbara County
Health Insurance Coverage by Age in Santa Barbara County
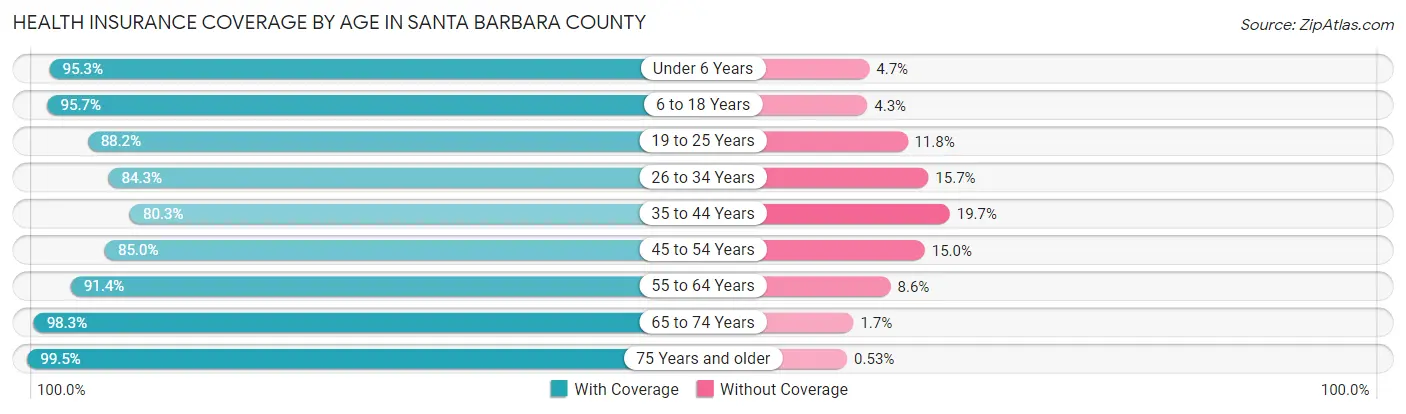
| Age Bracket | With Coverage | Without Coverage |
| Under 6 Years | 30,461 (95.3%) | 1,491 (4.7%) |
| 6 to 18 Years | 73,205 (95.7%) | 3,286 (4.3%) |
| 19 to 25 Years | 56,001 (88.2%) | 7,478 (11.8%) |
| 26 to 34 Years | 43,278 (84.3%) | 8,050 (15.7%) |
| 35 to 44 Years | 40,075 (80.3%) | 9,811 (19.7%) |
| 45 to 54 Years | 39,096 (85.0%) | 6,906 (15.0%) |
| 55 to 64 Years | 45,111 (91.4%) | 4,266 (8.6%) |
| 65 to 74 Years | 38,352 (98.3%) | 669 (1.7%) |
| 75 Years and older | 30,261 (99.5%) | 160 (0.5%) |
| Total | 395,840 (90.4%) | 42,117 (9.6%) |
Health Insurance Coverage by Citizenship Status in Santa Barbara County
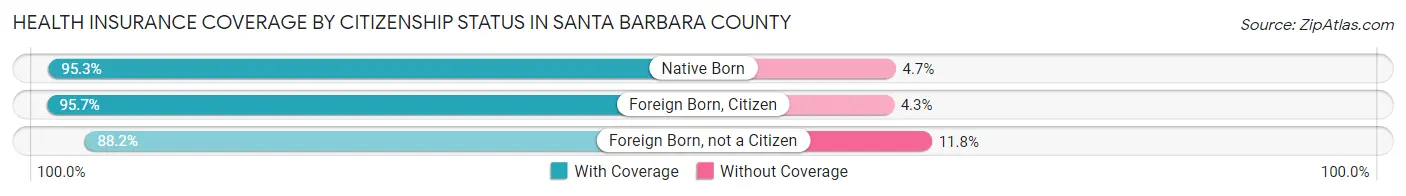
| Citizenship Status | With Coverage | Without Coverage |
| Native Born | 30,461 (95.3%) | 1,491 (4.7%) |
| Foreign Born, Citizen | 73,205 (95.7%) | 3,286 (4.3%) |
| Foreign Born, not a Citizen | 56,001 (88.2%) | 7,478 (11.8%) |
Health Insurance Coverage by Household Income in Santa Barbara County
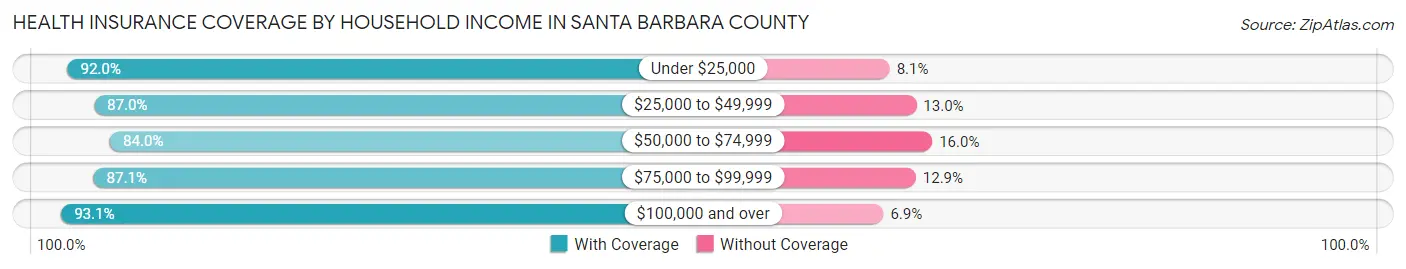
| Household Income | With Coverage | Without Coverage |
| Under $25,000 | 32,728 (91.9%) | 2,865 (8.1%) |
| $25,000 to $49,999 | 49,090 (87.0%) | 7,361 (13.0%) |
| $50,000 to $74,999 | 47,289 (84.0%) | 9,012 (16.0%) |
| $75,000 to $99,999 | 49,029 (87.1%) | 7,286 (12.9%) |
| $100,000 and over | 202,077 (93.1%) | 14,914 (6.9%) |
Public vs Private Health Insurance Coverage by Age in Santa Barbara County
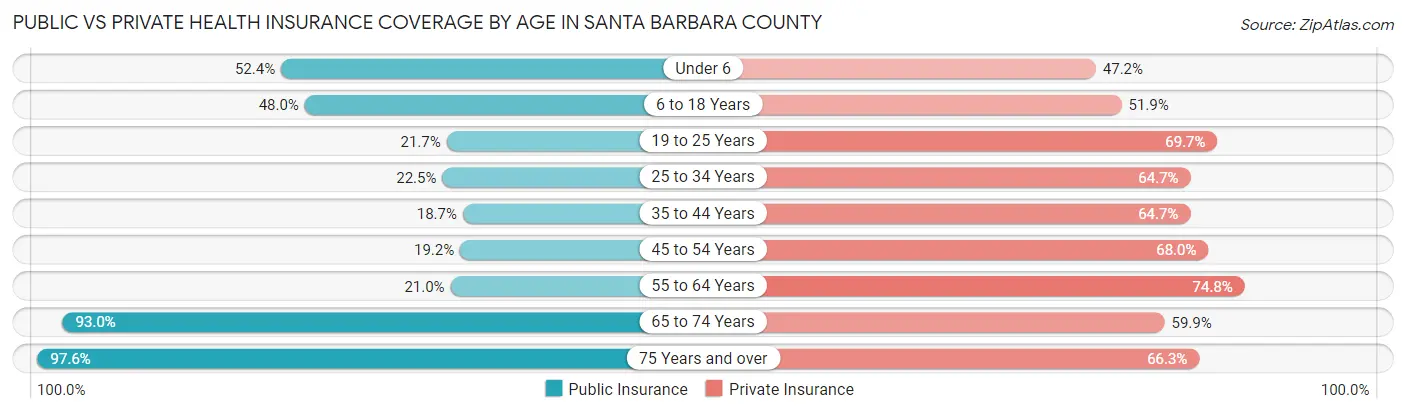
| Age Bracket | Public Insurance | Private Insurance |
| Under 6 | 16,747 (52.4%) | 15,069 (47.2%) |
| 6 to 18 Years | 36,720 (48.0%) | 39,716 (51.9%) |
| 19 to 25 Years | 13,761 (21.7%) | 44,245 (69.7%) |
| 25 to 34 Years | 11,531 (22.5%) | 33,209 (64.7%) |
| 35 to 44 Years | 9,310 (18.7%) | 32,256 (64.7%) |
| 45 to 54 Years | 8,823 (19.2%) | 31,290 (68.0%) |
| 55 to 64 Years | 10,350 (21.0%) | 36,921 (74.8%) |
| 65 to 74 Years | 36,276 (93.0%) | 23,376 (59.9%) |
| 75 Years and over | 29,697 (97.6%) | 20,177 (66.3%) |
| Total | 173,215 (39.6%) | 276,259 (63.1%) |
Disability Status by Sex by Age in Santa Barbara County
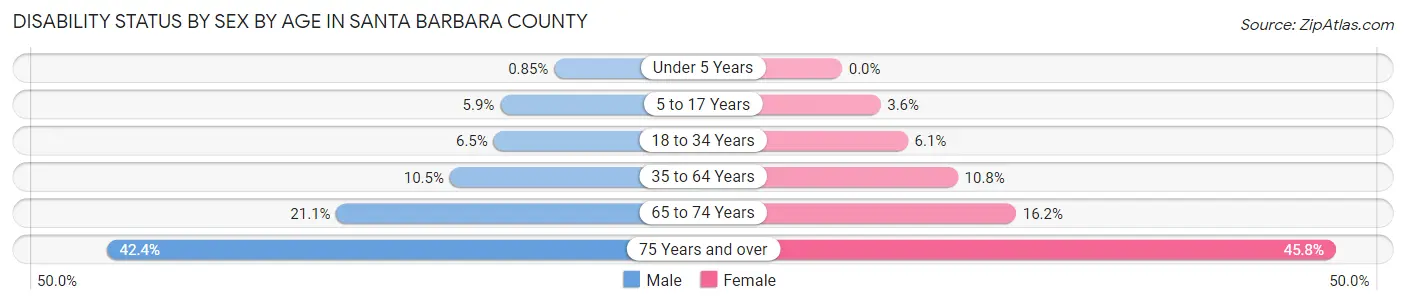
| Age Bracket | Male | Female |
| Under 5 Years | 117 (0.9%) | 0 (0.0%) |
| 5 to 17 Years | 2,145 (5.9%) | 1,256 (3.6%) |
| 18 to 34 Years | 4,078 (6.5%) | 3,771 (6.1%) |
| 35 to 64 Years | 7,709 (10.5%) | 7,751 (10.7%) |
| 65 to 74 Years | 3,916 (21.1%) | 3,299 (16.2%) |
| 75 Years and over | 5,402 (42.4%) | 8,103 (45.8%) |
Disability Class by Sex by Age in Santa Barbara County
Disability Class: Hearing Difficulty
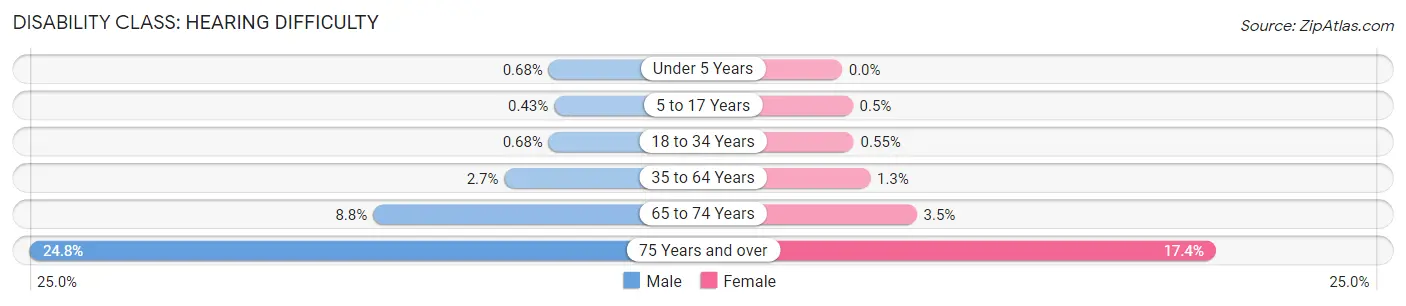
| Age Bracket | Male | Female |
| Under 5 Years | 94 (0.7%) | 0 (0.0%) |
| 5 to 17 Years | 156 (0.4%) | 177 (0.5%) |
| 18 to 34 Years | 428 (0.7%) | 338 (0.5%) |
| 35 to 64 Years | 2,004 (2.7%) | 947 (1.3%) |
| 65 to 74 Years | 1,641 (8.8%) | 709 (3.5%) |
| 75 Years and over | 3,155 (24.7%) | 3,067 (17.3%) |
Disability Class: Vision Difficulty
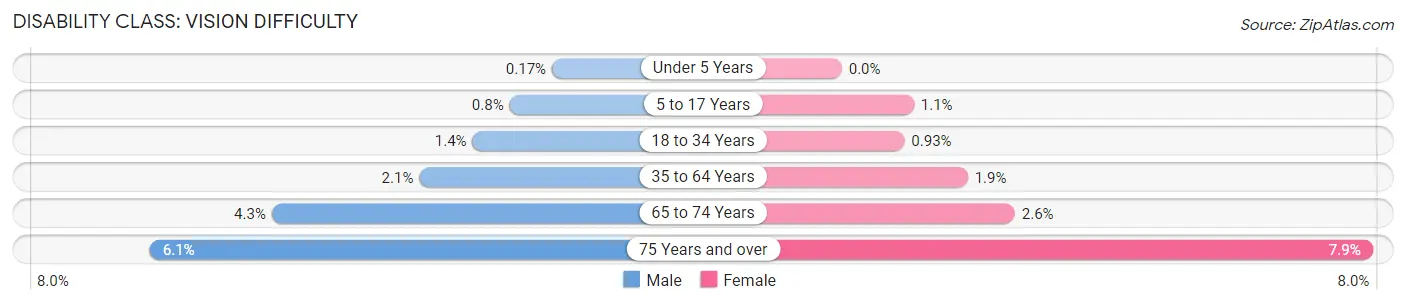
| Age Bracket | Male | Female |
| Under 5 Years | 23 (0.2%) | 0 (0.0%) |
| 5 to 17 Years | 294 (0.8%) | 377 (1.1%) |
| 18 to 34 Years | 849 (1.3%) | 574 (0.9%) |
| 35 to 64 Years | 1,566 (2.1%) | 1,349 (1.9%) |
| 65 to 74 Years | 806 (4.3%) | 526 (2.6%) |
| 75 Years and over | 782 (6.1%) | 1,392 (7.9%) |
Disability Class: Cognitive Difficulty
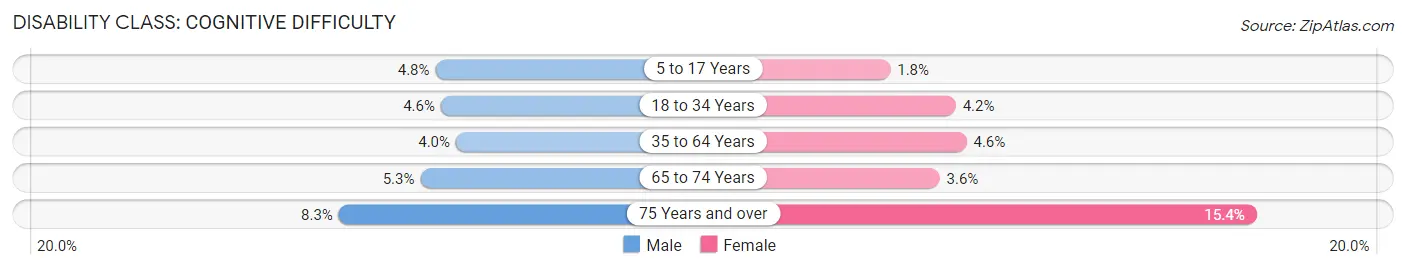
| Age Bracket | Male | Female |
| 5 to 17 Years | 1,738 (4.8%) | 633 (1.8%) |
| 18 to 34 Years | 2,866 (4.5%) | 2,612 (4.2%) |
| 35 to 64 Years | 2,917 (4.0%) | 3,339 (4.6%) |
| 65 to 74 Years | 988 (5.3%) | 741 (3.6%) |
| 75 Years and over | 1,063 (8.3%) | 2,722 (15.4%) |
Disability Class: Ambulatory Difficulty
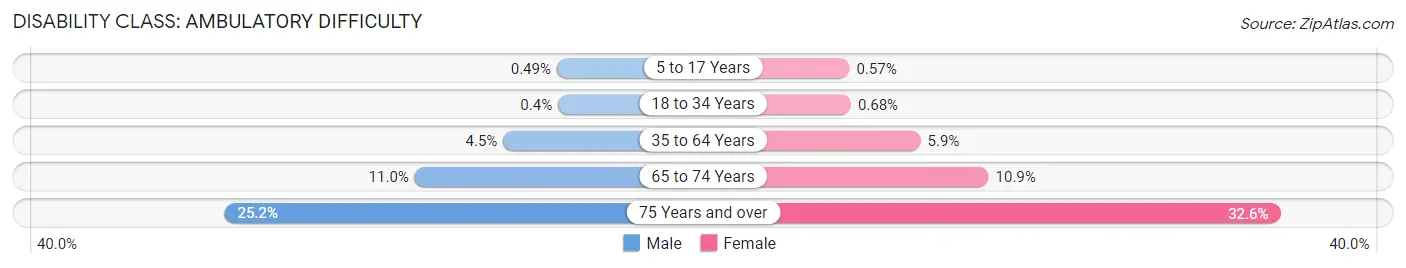
| Age Bracket | Male | Female |
| 5 to 17 Years | 179 (0.5%) | 199 (0.6%) |
| 18 to 34 Years | 250 (0.4%) | 418 (0.7%) |
| 35 to 64 Years | 3,270 (4.5%) | 4,219 (5.9%) |
| 65 to 74 Years | 2,052 (11.0%) | 2,226 (10.9%) |
| 75 Years and over | 3,206 (25.2%) | 5,753 (32.6%) |
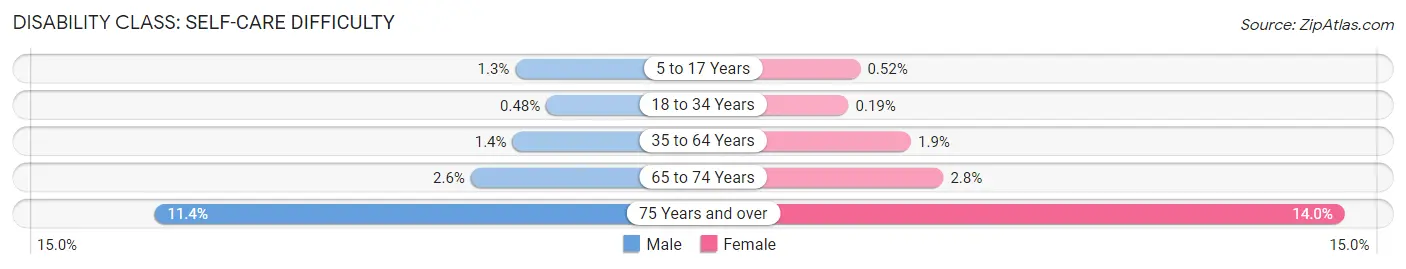
Disability Class: Self-Care Difficulty
| Age Bracket | Male | Female |
| 5 to 17 Years | 490 (1.3%) | 184 (0.5%) |
| 18 to 34 Years | 305 (0.5%) | 118 (0.2%) |
| 35 to 64 Years | 1,037 (1.4%) | 1,391 (1.9%) |
| 65 to 74 Years | 479 (2.6%) | 578 (2.8%) |
| 75 Years and over | 1,450 (11.4%) | 2,474 (14.0%) |
Technology Access in Santa Barbara County
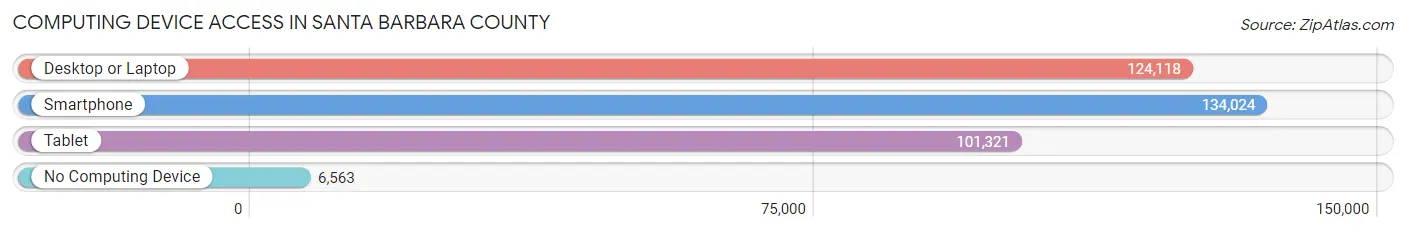
Computing Device Access in Santa Barbara County
| Device Type | # Households | % Households |
| Desktop or Laptop | 124,118 | 83.9% |
| Smartphone | 134,024 | 90.5% |
| Tablet | 101,321 | 68.4% |
| No Computing Device | 6,563 | 4.4% |
| Total | 148,032 | 100.0% |
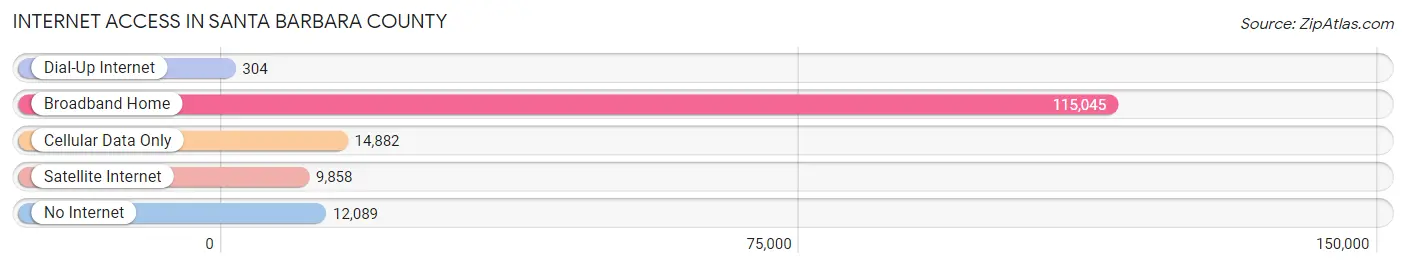
Internet Access in Santa Barbara County
| Internet Type | # Households | % Households |
| Dial-Up Internet | 304 | 0.2% |
| Broadband Home | 115,045 | 77.7% |
| Cellular Data Only | 14,882 | 10.1% |
| Satellite Internet | 9,858 | 6.7% |
| No Internet | 12,089 | 8.2% |
| Total | 148,032 | 100.0% |
Santa Barbara County Summary
Santa Barbara County is located in the southern part of California, along the Pacific Ocean. It is bordered by Ventura County to the north, Los Angeles County to the east, and San Luis Obispo County to the south. The county covers an area of 2,743 square miles and has a population of 446,499 as of 2019.
History
Santa Barbara County was first inhabited by the Chumash people, who lived in the area for thousands of years before the arrival of Europeans. The first Europeans to explore the area were Spanish explorers, who arrived in the late 18th century. The area was then claimed by the Spanish Empire, and the first mission was established in 1786. The area was then ceded to Mexico in 1821, and the Mexican government granted large land grants to settlers. After the Mexican-American War, the area was annexed by the United States in 1848.
The county was officially established in 1850, and the city of Santa Barbara was incorporated in 1856. The county experienced rapid growth in the late 19th and early 20th centuries, as the area became a popular tourist destination. The county was also home to several large ranches, which were used for cattle and sheep grazing.
Geography
Santa Barbara County is located in the southern part of California, along the Pacific Ocean. It is bordered by Ventura County to the north, Los Angeles County to the east, and San Luis Obispo County to the south. The county covers an area of 2,743 square miles and has a population of 446,499 as of 2019.
The county is divided into five regions: the Santa Ynez Valley, the Santa Maria Valley, the Santa Barbara Coast, the Santa Ynez Mountains, and the Santa Lucia Range. The Santa Ynez Valley is located in the northern part of the county and is home to the cities of Santa Ynez and Solvang. The Santa Maria Valley is located in the central part of the county and is home to the cities of Santa Maria and Lompoc. The Santa Barbara Coast is located in the southern part of the county and is home to the cities of Santa Barbara and Goleta. The Santa Ynez Mountains are located in the eastern part of the county and are home to the cities of Los Olivos and Buellton. The Santa Lucia Range is located in the western part of the county and is home to the cities of Santa Margarita and San Luis Obispo.
Economy
Santa Barbara County has a diverse economy, with a mix of industries including agriculture, tourism, manufacturing, and technology. Agriculture is the largest industry in the county, with the main crops being grapes, strawberries, and lemons. Tourism is also a major industry, with the county being home to several popular tourist destinations, including the Santa Barbara Mission, the Santa Ynez Valley, and the Santa Barbara Zoo. Manufacturing is also an important industry, with the county being home to several large companies, including Raytheon, Deckers Outdoor Corporation, and Santa Barbara Aerospace. Technology is also a growing industry in the county, with several tech companies, such as AppFolio, being based in the area.
Demographics
As of 2019, Santa Barbara County had a population of 446,499. The population is made up of a diverse mix of ethnicities, with the largest groups being White (63.2%), Hispanic or Latino (25.3%), and Asian (4.2%). The median household income in the county is $76,845, and the median home value is $717,400. The county also has a high rate of educational attainment, with 87.2% of adults having at least a high school diploma and 44.2% having a bachelor's degree or higher.
Common Questions
What is Per Capita Income in Santa Barbara County?
Per Capita income in Santa Barbara County is $44,635.
What is the Median Family Income in Santa Barbara County?
Median Family Income in Santa Barbara County is $105,067.
What is the Median Household income in Santa Barbara County?
Median Household Income in Santa Barbara County is $92,332.
What is Income or Wage Gap in Santa Barbara County?
Income or Wage Gap in Santa Barbara County is 30.5%.
Women in Santa Barbara County earn 69.5 cents for every dollar earned by a man.
What is Family Income Deficit in Santa Barbara County?
Family Income Deficit in Santa Barbara County is $10,969.
Families that are below poverty line in Santa Barbara County earn $10,969 less on average than the poverty threshold level.
What is Inequality or Gini Index in Santa Barbara County?
Inequality or Gini Index in Santa Barbara County is 0.49.
What is the Total Population of Santa Barbara County?
Total Population of Santa Barbara County is 445,213.
What is the Total Male Population of Santa Barbara County?
Total Male Population of Santa Barbara County is 223,753.
What is the Total Female Population of Santa Barbara County?
Total Female Population of Santa Barbara County is 221,460.
What is the Ratio of Males per 100 Females in Santa Barbara County?
There are 101.04 Males per 100 Females in Santa Barbara County.
What is the Ratio of Females per 100 Males in Santa Barbara County?
There are 98.98 Females per 100 Males in Santa Barbara County.
What is the Median Population Age in Santa Barbara County?
Median Population Age in Santa Barbara County is 34.3 Years.
What is the Average Family Size in Santa Barbara County
Average Family Size in Santa Barbara County is 3.4 People.
What is the Average Household Size in Santa Barbara County
Average Household Size in Santa Barbara County is 2.9 People.
How Large is the Labor Force in Santa Barbara County?
There are 224,302 People in the Labor Forcein in Santa Barbara County.
What is the Percentage of People in the Labor Force in Santa Barbara County?
62.7% of People are in the Labor Force in Santa Barbara County.
What is the Unemployment Rate in Santa Barbara County?
Unemployment Rate in Santa Barbara County is 6.0%.