San Luis Obispo County, CA Map & Demographics
San Luis Obispo County Overview
$47,390
PER CAPITA INCOME
$114,196
AVG FAMILY INCOME
$90,158
AVG HOUSEHOLD INCOME
28.3%
WAGE / INCOME GAP [ % ]
71.7¢/ $1
WAGE / INCOME GAP [ $ ]
$10,479
FAMILY INCOME DEFICIT
0.47
INEQUALITY / GINI INDEX
281,712
TOTAL POPULATION
142,477
MALE POPULATION
139,235
FEMALE POPULATION
102.33
MALES / 100 FEMALES
97.72
FEMALES / 100 MALES
40.0
MEDIAN AGE
3.0
AVG FAMILY SIZE
2.5
AVG HOUSEHOLD SIZE
139,744
LABOR FORCE [ PEOPLE ]
58.6%
PERCENT IN LABOR FORCE
5.0%
UNEMPLOYMENT RATE
San Luis Obispo County Area Codes
Income in San Luis Obispo County
Income Overview in San Luis Obispo County
Per Capita Income in San Luis Obispo County is $47,390, while median incomes of families and households are $114,196 and $90,158 respectively.
| Characteristic | Number | Measure |
| Per Capita Income | 281,712 | $47,390 |
| Median Family Income | 67,907 | $114,196 |
| Mean Family Income | 67,907 | $146,557 |
| Median Household Income | 108,099 | $90,158 |
| Mean Household Income | 108,099 | $121,160 |
| Income Deficit | 67,907 | $10,479 |
| Wage / Income Gap (%) | 281,712 | 28.31% |
| Wage / Income Gap ($) | 281,712 | 71.69¢ per $1 |
| Gini / Inequality Index | 281,712 | 0.47 |
Earnings by Sex in San Luis Obispo County
Average Earnings in San Luis Obispo County are $37,744, $44,790 for men and $32,110 for women, a difference of 28.3%.
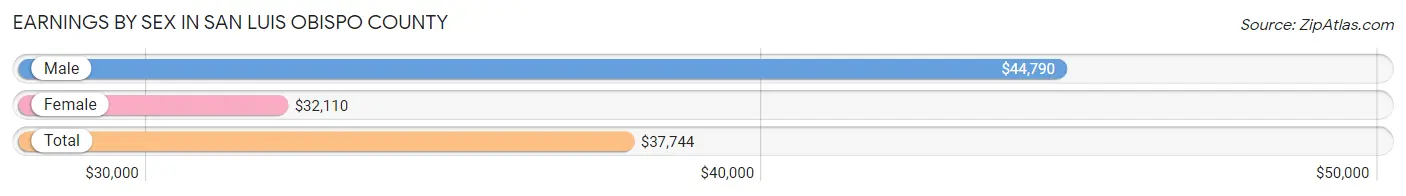
| Sex | Number | Average Earnings |
| Male | 83,900 (54.2%) | $44,790 |
| Female | 71,018 (45.8%) | $32,110 |
| Total | 154,918 (100.0%) | $37,744 |
Earnings by Sex by Income Bracket in San Luis Obispo County
The most common earnings brackets in San Luis Obispo County are $100,000+ for men (18,828 | 22.4%) and $100,000+ for women (7,266 | 10.2%).
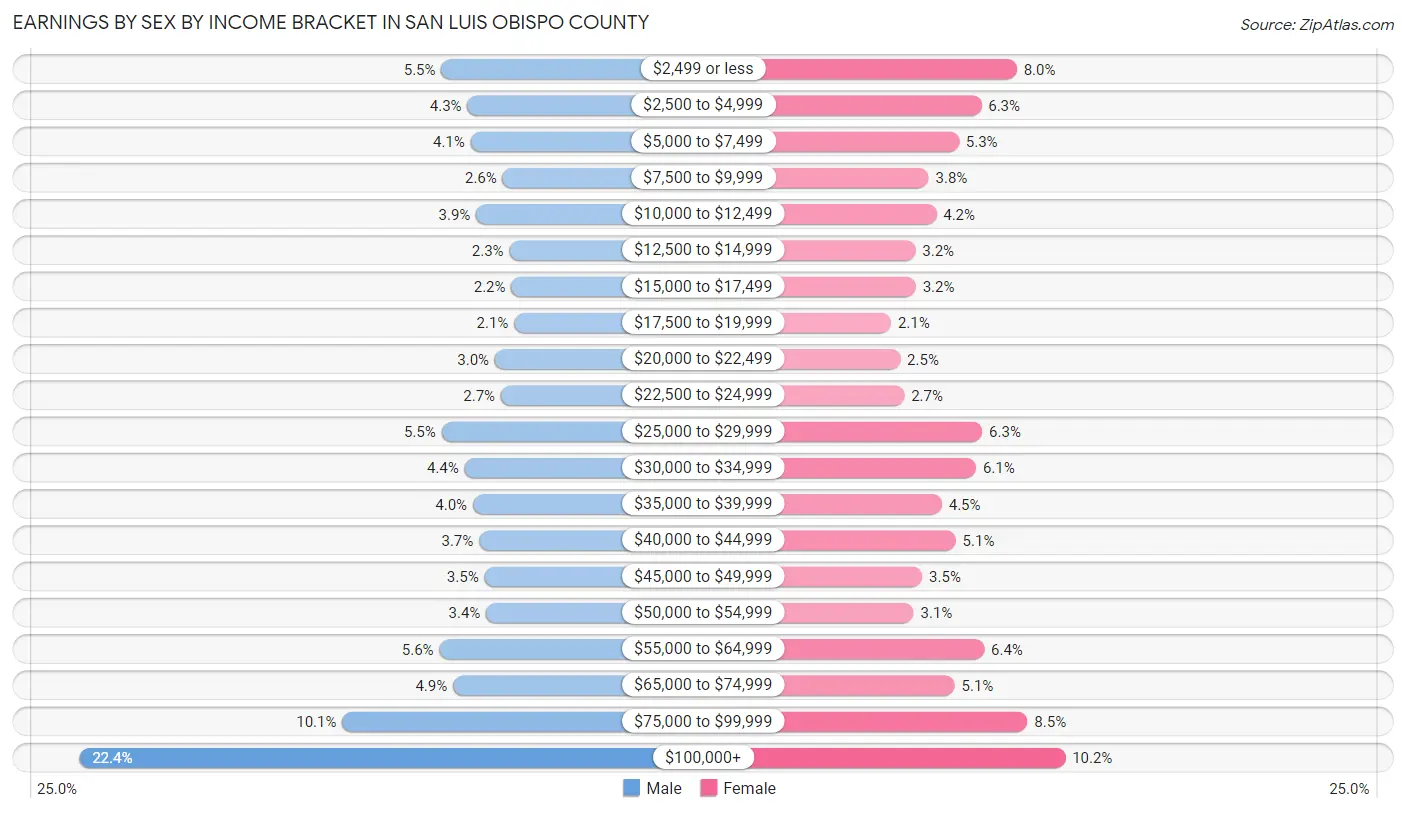
| Income | Male | Female |
| $2,499 or less | 4,595 (5.5%) | 5,656 (8.0%) |
| $2,500 to $4,999 | 3,576 (4.3%) | 4,471 (6.3%) |
| $5,000 to $7,499 | 3,452 (4.1%) | 3,726 (5.2%) |
| $7,500 to $9,999 | 2,192 (2.6%) | 2,722 (3.8%) |
| $10,000 to $12,499 | 3,227 (3.8%) | 2,979 (4.2%) |
| $12,500 to $14,999 | 1,923 (2.3%) | 2,279 (3.2%) |
| $15,000 to $17,499 | 1,846 (2.2%) | 2,291 (3.2%) |
| $17,500 to $19,999 | 1,738 (2.1%) | 1,472 (2.1%) |
| $20,000 to $22,499 | 2,489 (3.0%) | 1,779 (2.5%) |
| $22,500 to $24,999 | 2,253 (2.7%) | 1,909 (2.7%) |
| $25,000 to $29,999 | 4,590 (5.5%) | 4,499 (6.3%) |
| $30,000 to $34,999 | 3,682 (4.4%) | 4,297 (6.0%) |
| $35,000 to $39,999 | 3,353 (4.0%) | 3,160 (4.4%) |
| $40,000 to $44,999 | 3,116 (3.7%) | 3,625 (5.1%) |
| $45,000 to $49,999 | 2,900 (3.5%) | 2,508 (3.5%) |
| $50,000 to $54,999 | 2,836 (3.4%) | 2,220 (3.1%) |
| $55,000 to $64,999 | 4,672 (5.6%) | 4,567 (6.4%) |
| $65,000 to $74,999 | 4,138 (4.9%) | 3,584 (5.1%) |
| $75,000 to $99,999 | 8,494 (10.1%) | 6,008 (8.5%) |
| $100,000+ | 18,828 (22.4%) | 7,266 (10.2%) |
| Total | 83,900 (100.0%) | 71,018 (100.0%) |
Earnings by Sex by Educational Attainment in San Luis Obispo County
Average earnings in San Luis Obispo County are $61,547 for men and $42,631 for women, a difference of 30.7%. Men with an educational attainment of graduate degree enjoy the highest average annual earnings of $115,226, while those with less than high school education earn the least with $33,379. Women with an educational attainment of graduate degree earn the most with the average annual earnings of $71,907, while those with less than high school education have the smallest earnings of $23,291.
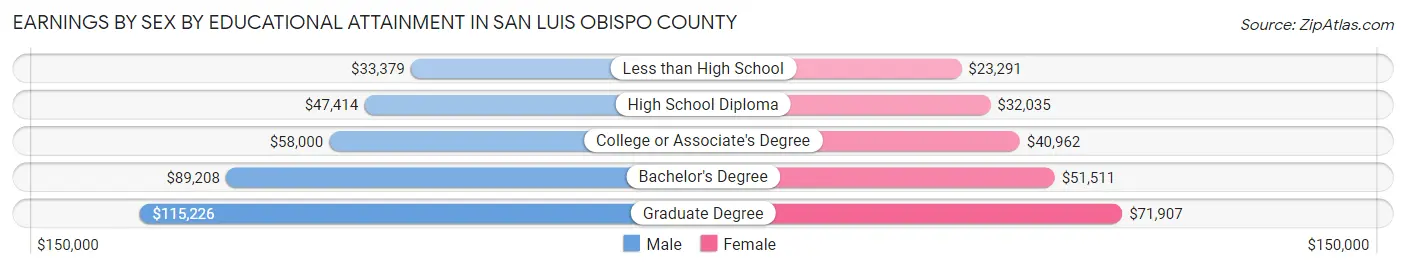
| Educational Attainment | Male Income | Female Income |
| Less than High School | $33,379 | $23,291 |
| High School Diploma | $47,414 | $32,035 |
| College or Associate's Degree | $58,000 | $40,962 |
| Bachelor's Degree | $89,208 | $51,511 |
| Graduate Degree | $115,226 | $71,907 |
| Total | $61,547 | $42,631 |
Family Income in San Luis Obispo County
Family Income Brackets in San Luis Obispo County
According to the San Luis Obispo County family income data, there are 15,619 families falling into the $100,000 to $149,999 income range, which is the most common income bracket and makes up 23.0% of all families. Conversely, the $10,000 to $14,999 income bracket is the least frequent group with only 1,087 families (1.6%) belonging to this category.
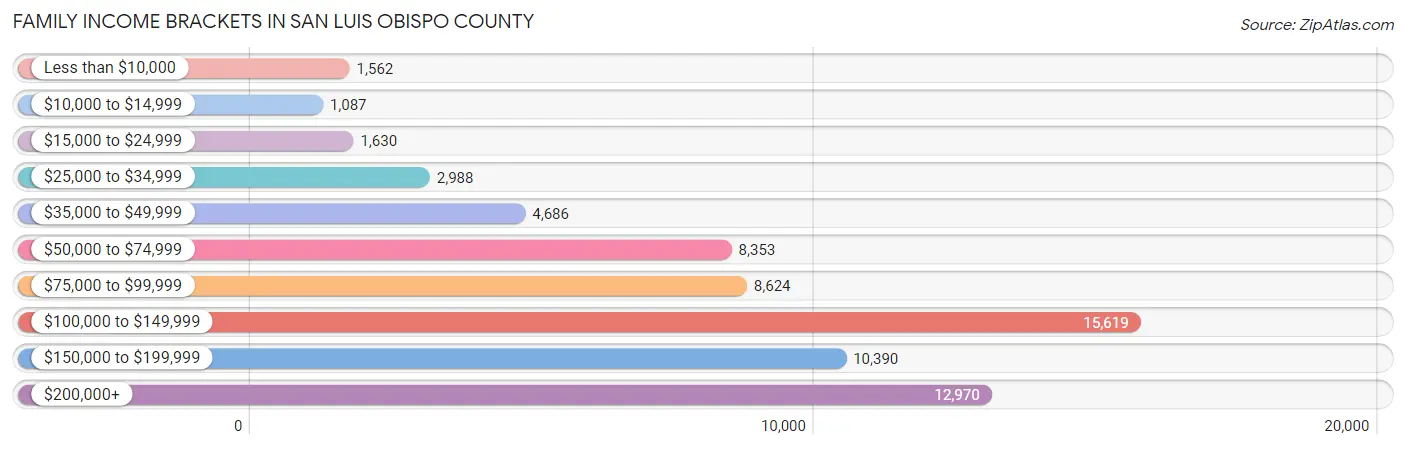
| Income Bracket | # Families | % Families |
| Less than $10,000 | 1,562 | 2.3% |
| $10,000 to $14,999 | 1,087 | 1.6% |
| $15,000 to $24,999 | 1,630 | 2.4% |
| $25,000 to $34,999 | 2,988 | 4.4% |
| $35,000 to $49,999 | 4,686 | 6.9% |
| $50,000 to $74,999 | 8,353 | 12.3% |
| $75,000 to $99,999 | 8,624 | 12.7% |
| $100,000 to $149,999 | 15,619 | 23.0% |
| $150,000 to $199,999 | 10,390 | 15.3% |
| $200,000+ | 12,970 | 19.1% |
Family Income by Famaliy Size in San Luis Obispo County
7+ person families (716 | 1.1%) account for the highest median family income in San Luis Obispo County with $148,298 per family, while 2-person families (37,189 | 54.8%) have the highest median income of $51,405 per family member.
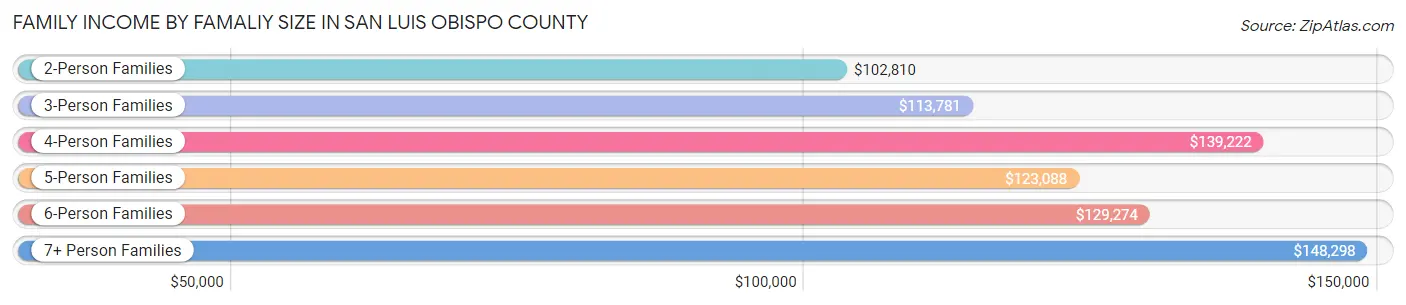
| Income Bracket | # Families | Median Income |
| 2-Person Families | 37,189 (54.8%) | $102,810 |
| 3-Person Families | 13,291 (19.6%) | $113,781 |
| 4-Person Families | 10,703 (15.8%) | $139,222 |
| 5-Person Families | 4,072 (6.0%) | $123,088 |
| 6-Person Families | 1,936 (2.9%) | $129,274 |
| 7+ Person Families | 716 (1.1%) | $148,298 |
| Total | 67,907 (100.0%) | $114,196 |
Family Income by Number of Earners in San Luis Obispo County
The median family income in San Luis Obispo County is $114,196, with families comprising 3+ earners (6,663) having the highest median family income of $163,325, while families with no earners (13,161) have the lowest median family income of $77,874, accounting for 9.8% and 19.4% of families, respectively.
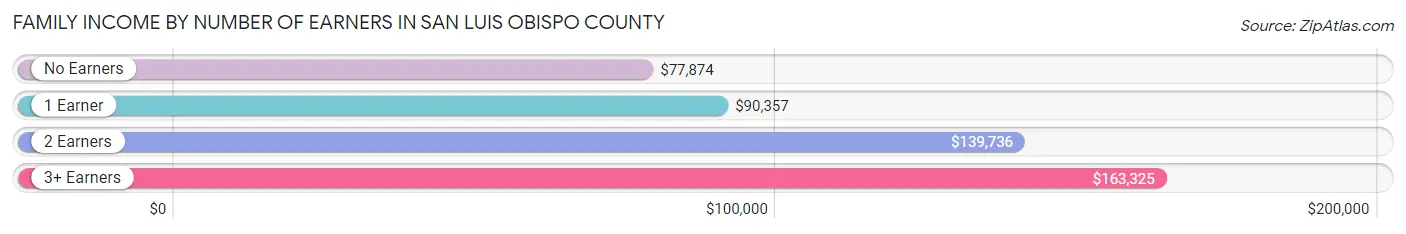
| Number of Earners | # Families | Median Income |
| No Earners | 13,161 (19.4%) | $77,874 |
| 1 Earner | 20,919 (30.8%) | $90,357 |
| 2 Earners | 27,164 (40.0%) | $139,736 |
| 3+ Earners | 6,663 (9.8%) | $163,325 |
| Total | 67,907 (100.0%) | $114,196 |
Household Income in San Luis Obispo County
Household Income Brackets in San Luis Obispo County
With 20,971 households falling in the category, the $100,000 to $149,999 income range is the most frequent in San Luis Obispo County, accounting for 19.4% of all households. In contrast, only 3,135 households (2.9%) fall into the $10,000 to $14,999 income bracket, making it the least populous group.
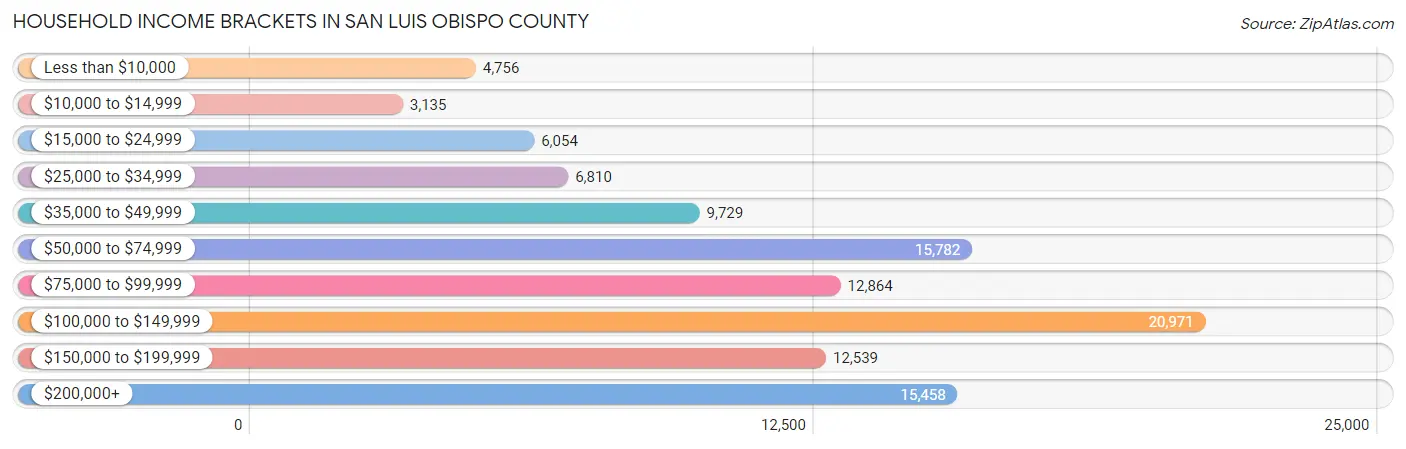
| Income Bracket | # Households | % Households |
| Less than $10,000 | 4,756 | 4.4% |
| $10,000 to $14,999 | 3,135 | 2.9% |
| $15,000 to $24,999 | 6,054 | 5.6% |
| $25,000 to $34,999 | 6,810 | 6.3% |
| $35,000 to $49,999 | 9,729 | 9.0% |
| $50,000 to $74,999 | 15,782 | 14.6% |
| $75,000 to $99,999 | 12,864 | 11.9% |
| $100,000 to $149,999 | 20,971 | 19.4% |
| $150,000 to $199,999 | 12,539 | 11.6% |
| $200,000+ | 15,458 | 14.3% |
Household Income by Householder Age in San Luis Obispo County
The median household income in San Luis Obispo County is $90,158, with the highest median household income of $115,242 found in the 45 to 64 years age bracket for the primary householder. A total of 35,102 households (32.5%) fall into this category. Meanwhile, the 15 to 24 years age bracket for the primary householder has the lowest median household income of $30,896, with 7,720 households (7.1%) in this group.
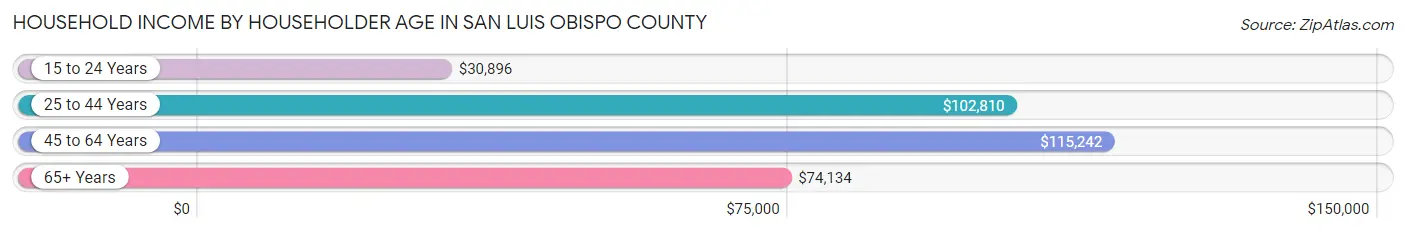
| Income Bracket | # Households | Median Income |
| 15 to 24 Years | 7,720 (7.1%) | $30,896 |
| 25 to 44 Years | 27,941 (25.9%) | $102,810 |
| 45 to 64 Years | 35,102 (32.5%) | $115,242 |
| 65+ Years | 37,336 (34.5%) | $74,134 |
| Total | 108,099 (100.0%) | $90,158 |
Poverty in San Luis Obispo County
Income Below Poverty by Sex and Age in San Luis Obispo County
With 12.2% poverty level for males and 12.9% for females among the residents of San Luis Obispo County, 18 to 24 year old males and 18 to 24 year old females are the most vulnerable to poverty, with 7,325 males (41.0%) and 6,746 females (40.9%) in their respective age groups living below the poverty level.
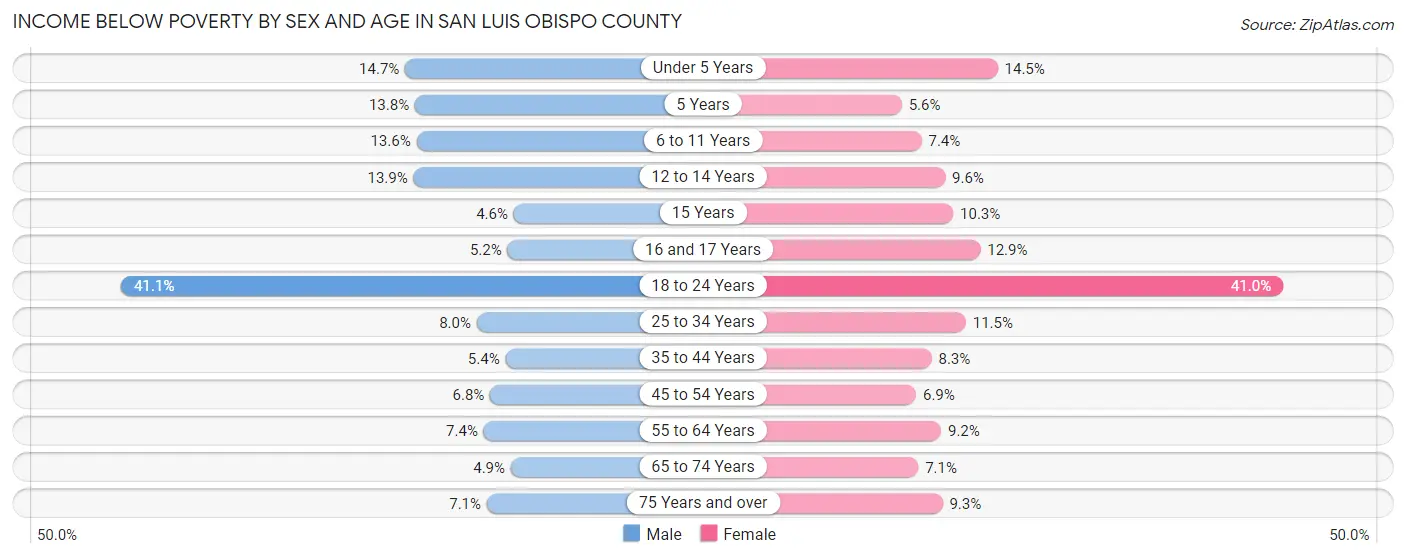
| Age Bracket | Male | Female |
| Under 5 Years | 877 (14.7%) | 877 (14.5%) |
| 5 Years | 213 (13.8%) | 77 (5.6%) |
| 6 to 11 Years | 1,012 (13.6%) | 574 (7.4%) |
| 12 to 14 Years | 717 (13.9%) | 411 (9.6%) |
| 15 Years | 67 (4.6%) | 146 (10.3%) |
| 16 and 17 Years | 148 (5.2%) | 358 (12.9%) |
| 18 to 24 Years | 7,325 (41.0%) | 6,746 (40.9%) |
| 25 to 34 Years | 1,297 (8.0%) | 1,681 (11.5%) |
| 35 to 44 Years | 855 (5.4%) | 1,263 (8.3%) |
| 45 to 54 Years | 999 (6.8%) | 976 (6.9%) |
| 55 to 64 Years | 1,286 (7.4%) | 1,763 (9.2%) |
| 65 to 74 Years | 809 (4.9%) | 1,307 (7.1%) |
| 75 Years and over | 733 (7.1%) | 1,211 (9.3%) |
| Total | 16,338 (12.2%) | 17,390 (12.9%) |
Income Above Poverty by Sex and Age in San Luis Obispo County
According to the poverty statistics in San Luis Obispo County, males aged 15 years and females aged 5 years are the age groups that are most secure financially, with 95.4% of males and 94.4% of females in these age groups living above the poverty line.
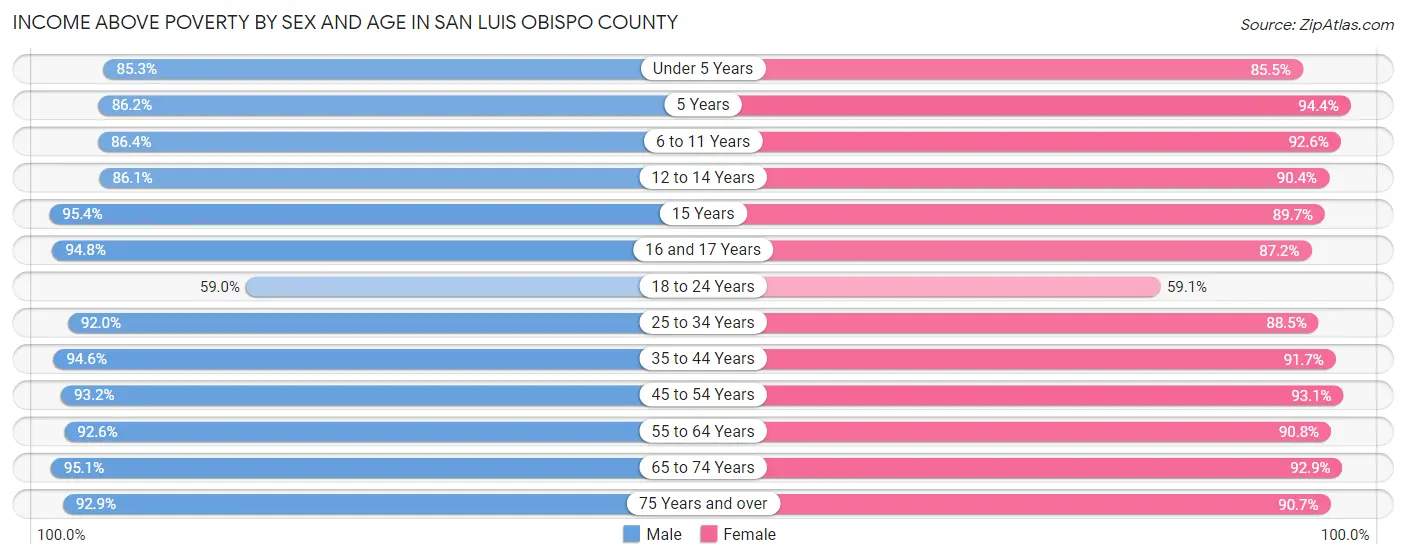
| Age Bracket | Male | Female |
| Under 5 Years | 5,096 (85.3%) | 5,186 (85.5%) |
| 5 Years | 1,334 (86.2%) | 1,308 (94.4%) |
| 6 to 11 Years | 6,413 (86.4%) | 7,187 (92.6%) |
| 12 to 14 Years | 4,440 (86.1%) | 3,873 (90.4%) |
| 15 Years | 1,391 (95.4%) | 1,268 (89.7%) |
| 16 and 17 Years | 2,710 (94.8%) | 2,427 (87.2%) |
| 18 to 24 Years | 10,517 (59.0%) | 9,729 (59.1%) |
| 25 to 34 Years | 14,849 (92.0%) | 12,927 (88.5%) |
| 35 to 44 Years | 15,067 (94.6%) | 13,897 (91.7%) |
| 45 to 54 Years | 13,708 (93.2%) | 13,180 (93.1%) |
| 55 to 64 Years | 16,120 (92.6%) | 17,387 (90.8%) |
| 65 to 74 Years | 15,812 (95.1%) | 17,119 (92.9%) |
| 75 Years and over | 9,597 (92.9%) | 11,758 (90.7%) |
| Total | 117,054 (87.7%) | 117,246 (87.1%) |
Income Below Poverty Among Married-Couple Families in San Luis Obispo County
The poverty statistics for married-couple families in San Luis Obispo County show that 3.3% or 1,791 of the total 53,577 families live below the poverty line. Families with 3 or 4 children have the highest poverty rate of 11.1%, comprising of 372 families. On the other hand, families with 5 or more children have the lowest poverty rate of 0.0%, which includes 0 families.
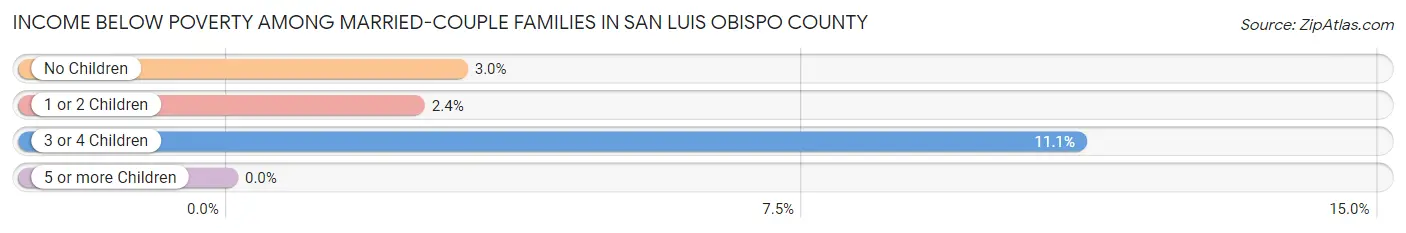
| Children | Above Poverty | Below Poverty |
| No Children | 34,260 (97.0%) | 1,059 (3.0%) |
| 1 or 2 Children | 14,370 (97.6%) | 360 (2.4%) |
| 3 or 4 Children | 2,984 (88.9%) | 372 (11.1%) |
| 5 or more Children | 172 (100.0%) | 0 (0.0%) |
| Total | 51,786 (96.7%) | 1,791 (3.3%) |
Income Below Poverty Among Single-Parent Households in San Luis Obispo County
According to the poverty data in San Luis Obispo County, 12.7% or 624 single-father households and 18.2% or 1,715 single-mother households are living below the poverty line. Among single-father households, those with 3 or 4 children have the highest poverty rate, with 47 households (21.8%) experiencing poverty. Likewise, among single-mother households, those with 5 or more children have the highest poverty rate, with 50 households (100.0%) falling below the poverty line.
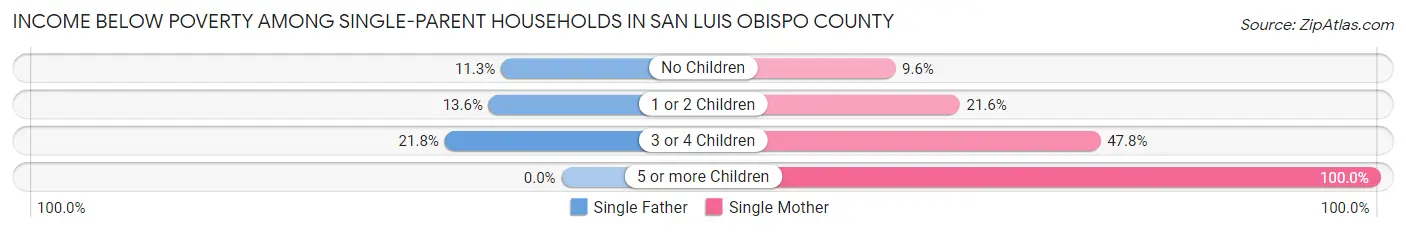
| Children | Single Father | Single Mother |
| No Children | 284 (11.3%) | 401 (9.6%) |
| 1 or 2 Children | 293 (13.6%) | 1,005 (21.6%) |
| 3 or 4 Children | 47 (21.8%) | 259 (47.8%) |
| 5 or more Children | 0 (0.0%) | 50 (100.0%) |
| Total | 624 (12.7%) | 1,715 (18.2%) |
Income Below Poverty Among Married-Couple vs Single-Parent Households in San Luis Obispo County
The poverty data for San Luis Obispo County shows that 1,791 of the married-couple family households (3.3%) and 2,339 of the single-parent households (16.3%) are living below the poverty level. Within the married-couple family households, those with 3 or 4 children have the highest poverty rate, with 372 households (11.1%) falling below the poverty line. Among the single-parent households, those with 5 or more children have the highest poverty rate, with 50 household (100.0%) living below poverty.
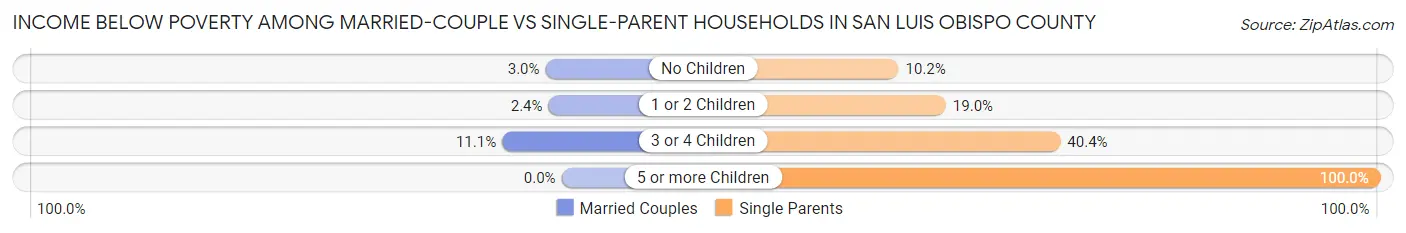
| Children | Married-Couple Families | Single-Parent Households |
| No Children | 1,059 (3.0%) | 685 (10.2%) |
| 1 or 2 Children | 360 (2.4%) | 1,298 (19.0%) |
| 3 or 4 Children | 372 (11.1%) | 306 (40.4%) |
| 5 or more Children | 0 (0.0%) | 50 (100.0%) |
| Total | 1,791 (3.3%) | 2,339 (16.3%) |
Race in San Luis Obispo County
The most populous races in San Luis Obispo County are White / Caucasian (216,354 | 76.8%), Hispanic or Latino (65,946 | 23.4%), and Two or more Races (33,478 | 11.9%).
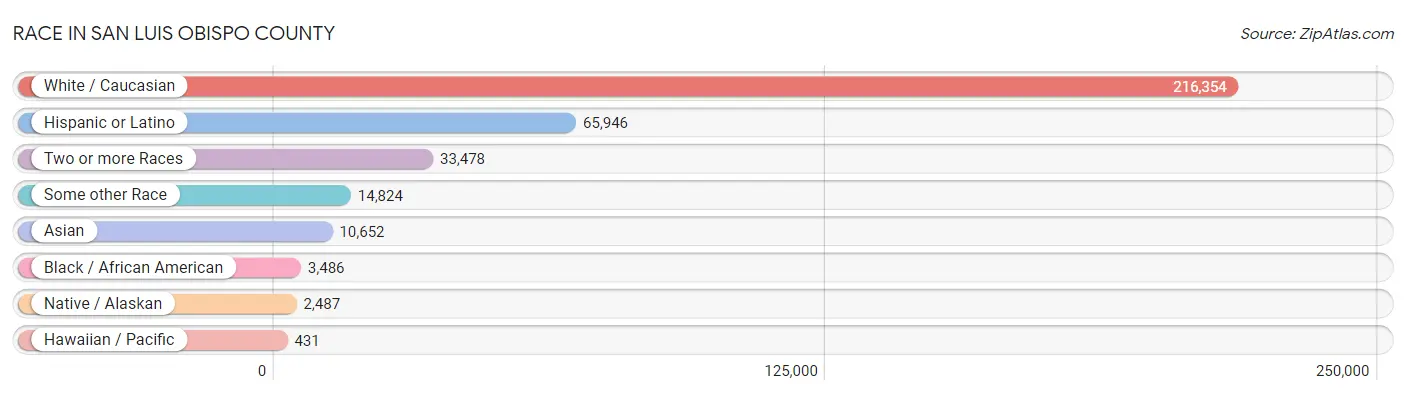
| Race | # Population | % Population |
| Asian | 10,652 | 3.8% |
| Black / African American | 3,486 | 1.2% |
| Hawaiian / Pacific | 431 | 0.2% |
| Hispanic or Latino | 65,946 | 23.4% |
| Native / Alaskan | 2,487 | 0.9% |
| White / Caucasian | 216,354 | 76.8% |
| Two or more Races | 33,478 | 11.9% |
| Some other Race | 14,824 | 5.3% |
| Total | 281,712 | 100.0% |
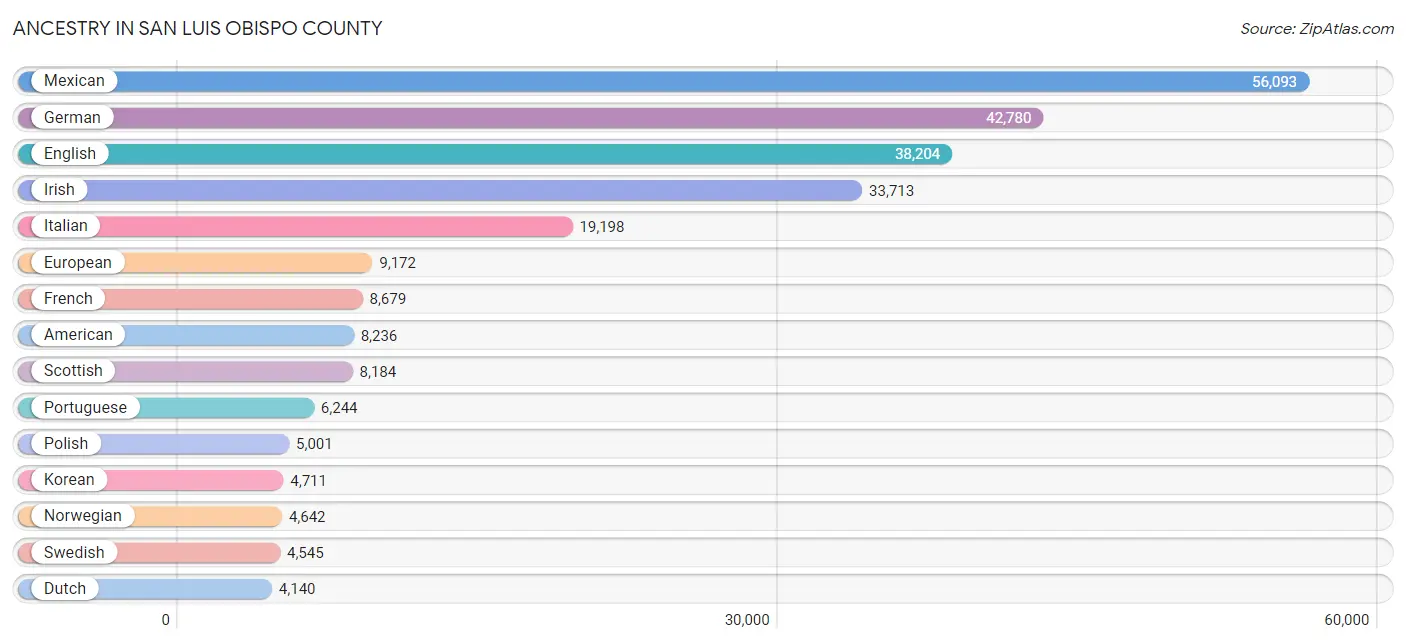
Ancestry in San Luis Obispo County
The most populous ancestries reported in San Luis Obispo County are Mexican (56,093 | 19.9%), German (42,780 | 15.2%), English (38,204 | 13.6%), Irish (33,713 | 12.0%), and Italian (19,198 | 6.8%), together accounting for 67.4% of all San Luis Obispo County residents.
| Ancestry | # Population | % Population |
| African | 492 | 0.2% |
| Albanian | 15 | 0.0% |
| Alsatian | 8 | 0.0% |
| American | 8,236 | 2.9% |
| Apache | 232 | 0.1% |
| Arab | 2,194 | 0.8% |
| Argentinean | 264 | 0.1% |
| Armenian | 715 | 0.3% |
| Assyrian / Chaldean / Syriac | 50 | 0.0% |
| Australian | 324 | 0.1% |
| Austrian | 861 | 0.3% |
| Bangladeshi | 4 | 0.0% |
| Barbadian | 8 | 0.0% |
| Basque | 282 | 0.1% |
| Belgian | 427 | 0.2% |
| Belizean | 69 | 0.0% |
| Bhutanese | 3,011 | 1.1% |
| Blackfeet | 132 | 0.1% |
| Brazilian | 273 | 0.1% |
| British | 2,302 | 0.8% |
| British West Indian | 28 | 0.0% |
| Bulgarian | 149 | 0.1% |
| Burmese | 1,495 | 0.5% |
| Canadian | 730 | 0.3% |
| Cape Verdean | 2 | 0.0% |
| Celtic | 90 | 0.0% |
| Central American | 1,851 | 0.7% |
| Central American Indian | 322 | 0.1% |
| Cherokee | 1,180 | 0.4% |
| Chickasaw | 47 | 0.0% |
| Chilean | 47 | 0.0% |
| Chippewa | 54 | 0.0% |
| Choctaw | 284 | 0.1% |
| Colombian | 468 | 0.2% |
| Comanche | 19 | 0.0% |
| Costa Rican | 70 | 0.0% |
| Cree | 2 | 0.0% |
| Creek | 16 | 0.0% |
| Croatian | 836 | 0.3% |
| Cuban | 411 | 0.2% |
| Czech | 1,097 | 0.4% |
| Czechoslovakian | 203 | 0.1% |
| Danish | 2,390 | 0.9% |
| Delaware | 50 | 0.0% |
| Dominican | 23 | 0.0% |
| Dutch | 4,140 | 1.5% |
| Eastern European | 904 | 0.3% |
| Ecuadorian | 106 | 0.0% |
| Egyptian | 397 | 0.1% |
| English | 38,204 | 13.6% |
| Estonian | 54 | 0.0% |
| Ethiopian | 15 | 0.0% |
| European | 9,172 | 3.3% |
| Filipino | 429 | 0.2% |
| Finnish | 695 | 0.3% |
| French | 8,679 | 3.1% |
| French Canadian | 921 | 0.3% |
| German | 42,780 | 15.2% |
| German Russian | 8 | 0.0% |
| Greek | 1,161 | 0.4% |
| Guamanian / Chamorro | 112 | 0.0% |
| Guatemalan | 724 | 0.3% |
| Guyanese | 28 | 0.0% |
| Haitian | 7 | 0.0% |
| Honduran | 253 | 0.1% |
| Hopi | 3 | 0.0% |
| Houma | 11 | 0.0% |
| Hungarian | 1,212 | 0.4% |
| Icelander | 11 | 0.0% |
| Indian (Asian) | 3,630 | 1.3% |
| Indonesian | 26 | 0.0% |
| Inupiat | 24 | 0.0% |
| Iranian | 651 | 0.2% |
| Iraqi | 118 | 0.0% |
| Irish | 33,713 | 12.0% |
| Iroquois | 8 | 0.0% |
| Israeli | 35 | 0.0% |
| Italian | 19,198 | 6.8% |
| Jamaican | 69 | 0.0% |
| Japanese | 155 | 0.1% |
| Jordanian | 47 | 0.0% |
| Kenyan | 27 | 0.0% |
| Korean | 4,711 | 1.7% |
| Laotian | 241 | 0.1% |
| Latvian | 43 | 0.0% |
| Lebanese | 627 | 0.2% |
| Lithuanian | 509 | 0.2% |
| Luxembourger | 14 | 0.0% |
| Malaysian | 39 | 0.0% |
| Mexican | 56,093 | 19.9% |
| Mexican American Indian | 1,198 | 0.4% |
| Mongolian | 30 | 0.0% |
| Moroccan | 65 | 0.0% |
| Native Hawaiian | 432 | 0.2% |
| Navajo | 135 | 0.1% |
| New Zealander | 107 | 0.0% |
| Nicaraguan | 178 | 0.1% |
| Nigerian | 209 | 0.1% |
| Northern European | 1,286 | 0.5% |
| Norwegian | 4,642 | 1.7% |
| Okinawan | 11 | 0.0% |
| Osage | 20 | 0.0% |
| Ottawa | 20 | 0.0% |
| Paiute | 11 | 0.0% |
| Pakistani | 144 | 0.1% |
| Palestinian | 211 | 0.1% |
| Panamanian | 44 | 0.0% |
| Pennsylvania German | 52 | 0.0% |
| Peruvian | 286 | 0.1% |
| Pima | 79 | 0.0% |
| Polish | 5,001 | 1.8% |
| Portuguese | 6,244 | 2.2% |
| Potawatomi | 21 | 0.0% |
| Pueblo | 47 | 0.0% |
| Puerto Rican | 1,236 | 0.4% |
| Romanian | 311 | 0.1% |
| Russian | 2,945 | 1.1% |
| Salvadoran | 582 | 0.2% |
| Samoan | 350 | 0.1% |
| Scandinavian | 1,836 | 0.6% |
| Scotch-Irish | 2,586 | 0.9% |
| Scottish | 8,184 | 2.9% |
| Serbian | 344 | 0.1% |
| Shoshone | 12 | 0.0% |
| Sioux | 56 | 0.0% |
| Slavic | 123 | 0.0% |
| Slovak | 306 | 0.1% |
| Slovene | 186 | 0.1% |
| South African | 224 | 0.1% |
| South American | 1,316 | 0.5% |
| South American Indian | 52 | 0.0% |
| Spaniard | 1,774 | 0.6% |
| Spanish | 1,636 | 0.6% |
| Sri Lankan | 1,664 | 0.6% |
| Subsaharan African | 1,048 | 0.4% |
| Swedish | 4,545 | 1.6% |
| Swiss | 1,726 | 0.6% |
| Syrian | 457 | 0.2% |
| Thai | 1,319 | 0.5% |
| Tlingit-Haida | 27 | 0.0% |
| Tongan | 9 | 0.0% |
| Tsimshian | 27 | 0.0% |
| Turkish | 447 | 0.2% |
| Ugandan | 22 | 0.0% |
| Ukrainian | 457 | 0.2% |
| Ute | 23 | 0.0% |
| Venezuelan | 46 | 0.0% |
| Welsh | 2,485 | 0.9% |
| West Indian | 28 | 0.0% |
| Yaqui | 156 | 0.1% |
| Yugoslavian | 249 | 0.1% |
| Zimbabwean | 4 | 0.0% | View All 152 Rows |
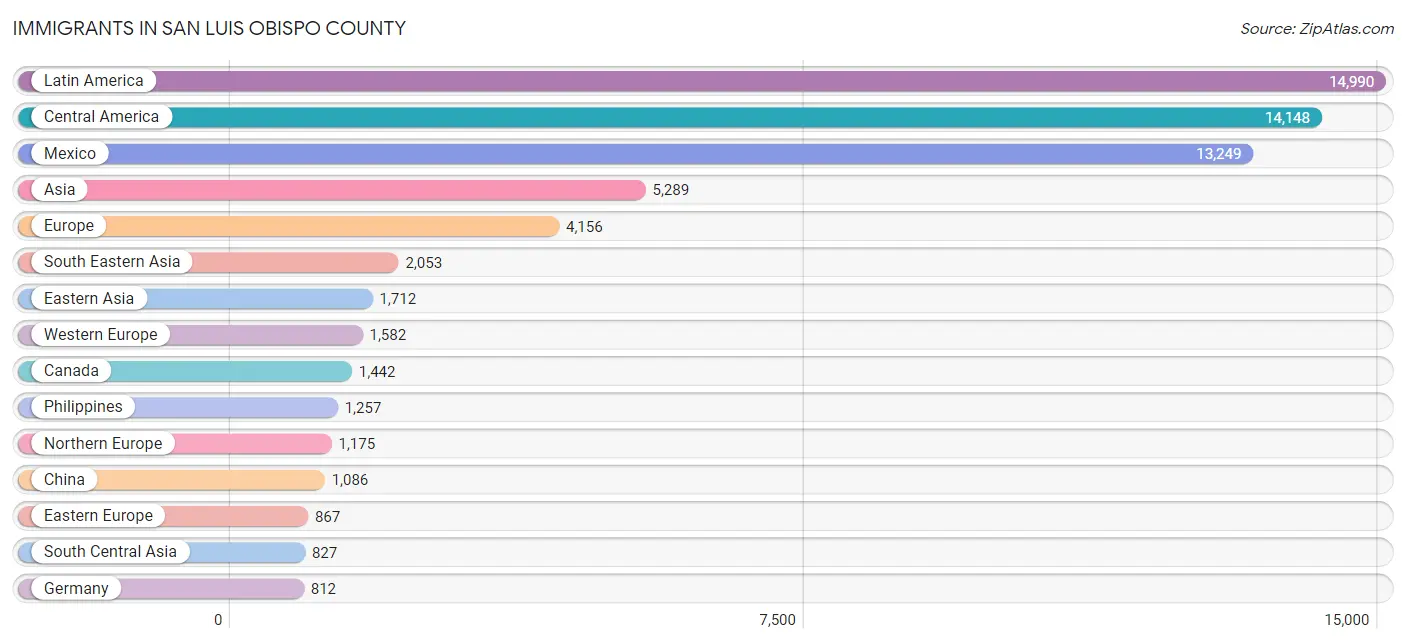
Immigrants in San Luis Obispo County
The most numerous immigrant groups reported in San Luis Obispo County came from Latin America (14,990 | 5.3%), Central America (14,148 | 5.0%), Mexico (13,249 | 4.7%), Asia (5,289 | 1.9%), and Europe (4,156 | 1.5%), together accounting for 18.4% of all San Luis Obispo County residents.
| Immigration Origin | # Population | % Population |
| Africa | 646 | 0.2% |
| Argentina | 184 | 0.1% |
| Armenia | 10 | 0.0% |
| Asia | 5,289 | 1.9% |
| Australia | 135 | 0.1% |
| Austria | 59 | 0.0% |
| Azores | 194 | 0.1% |
| Barbados | 8 | 0.0% |
| Belgium | 100 | 0.0% |
| Belize | 55 | 0.0% |
| Bosnia and Herzegovina | 21 | 0.0% |
| Brazil | 88 | 0.0% |
| Bulgaria | 101 | 0.0% |
| Cambodia | 72 | 0.0% |
| Canada | 1,442 | 0.5% |
| Caribbean | 106 | 0.0% |
| Central America | 14,148 | 5.0% |
| China | 1,086 | 0.4% |
| Colombia | 110 | 0.0% |
| Costa Rica | 42 | 0.0% |
| Croatia | 36 | 0.0% |
| Cuba | 73 | 0.0% |
| Czechoslovakia | 37 | 0.0% |
| Denmark | 68 | 0.0% |
| Eastern Africa | 72 | 0.0% |
| Eastern Asia | 1,712 | 0.6% |
| Eastern Europe | 867 | 0.3% |
| Ecuador | 95 | 0.0% |
| Egypt | 117 | 0.0% |
| El Salvador | 311 | 0.1% |
| England | 473 | 0.2% |
| Eritrea | 20 | 0.0% |
| Ethiopia | 9 | 0.0% |
| Europe | 4,156 | 1.5% |
| France | 178 | 0.1% |
| Germany | 812 | 0.3% |
| Guatemala | 345 | 0.1% |
| Honduras | 39 | 0.0% |
| Hong Kong | 80 | 0.0% |
| Hungary | 150 | 0.1% |
| India | 457 | 0.2% |
| Indonesia | 106 | 0.0% |
| Iran | 259 | 0.1% |
| Iraq | 163 | 0.1% |
| Ireland | 139 | 0.1% |
| Israel | 61 | 0.0% |
| Italy | 214 | 0.1% |
| Jamaica | 18 | 0.0% |
| Japan | 225 | 0.1% |
| Jordan | 103 | 0.0% |
| Kazakhstan | 37 | 0.0% |
| Kenya | 15 | 0.0% |
| Korea | 401 | 0.1% |
| Kuwait | 29 | 0.0% |
| Latin America | 14,990 | 5.3% |
| Lebanon | 72 | 0.0% |
| Lithuania | 61 | 0.0% |
| Malaysia | 29 | 0.0% |
| Mexico | 13,249 | 4.7% |
| Moldova | 1 | 0.0% |
| Morocco | 94 | 0.0% |
| Nepal | 15 | 0.0% |
| Netherlands | 354 | 0.1% |
| Nicaragua | 94 | 0.0% |
| Nigeria | 68 | 0.0% |
| Northern Africa | 211 | 0.1% |
| Northern Europe | 1,175 | 0.4% |
| Norway | 24 | 0.0% |
| Oceania | 198 | 0.1% |
| Pakistan | 37 | 0.0% |
| Panama | 13 | 0.0% |
| Peru | 238 | 0.1% |
| Philippines | 1,257 | 0.4% |
| Poland | 37 | 0.0% |
| Portugal | 238 | 0.1% |
| Romania | 24 | 0.0% |
| Russia | 253 | 0.1% |
| Scotland | 130 | 0.1% |
| Serbia | 32 | 0.0% |
| Singapore | 7 | 0.0% |
| South Africa | 275 | 0.1% |
| South America | 736 | 0.3% |
| South Central Asia | 827 | 0.3% |
| South Eastern Asia | 2,053 | 0.7% |
| Southern Europe | 509 | 0.2% |
| Spain | 57 | 0.0% |
| Sri Lanka | 22 | 0.0% |
| Sweden | 88 | 0.0% |
| Switzerland | 79 | 0.0% |
| Syria | 134 | 0.1% |
| Taiwan | 205 | 0.1% |
| Thailand | 168 | 0.1% |
| Trinidad and Tobago | 7 | 0.0% |
| Turkey | 79 | 0.0% |
| Uganda | 8 | 0.0% |
| Ukraine | 106 | 0.0% |
| Vietnam | 397 | 0.1% |
| Western Africa | 68 | 0.0% |
| Western Asia | 697 | 0.3% |
| Western Europe | 1,582 | 0.6% |
| Yemen | 5 | 0.0% |
| Zimbabwe | 4 | 0.0% | View All 102 Rows |
Sex and Age in San Luis Obispo County
Sex and Age in San Luis Obispo County
The most populous age groups in San Luis Obispo County are 20 to 24 Years (16,350 | 11.5%) for men and 20 to 24 Years (13,339 | 9.6%) for women.
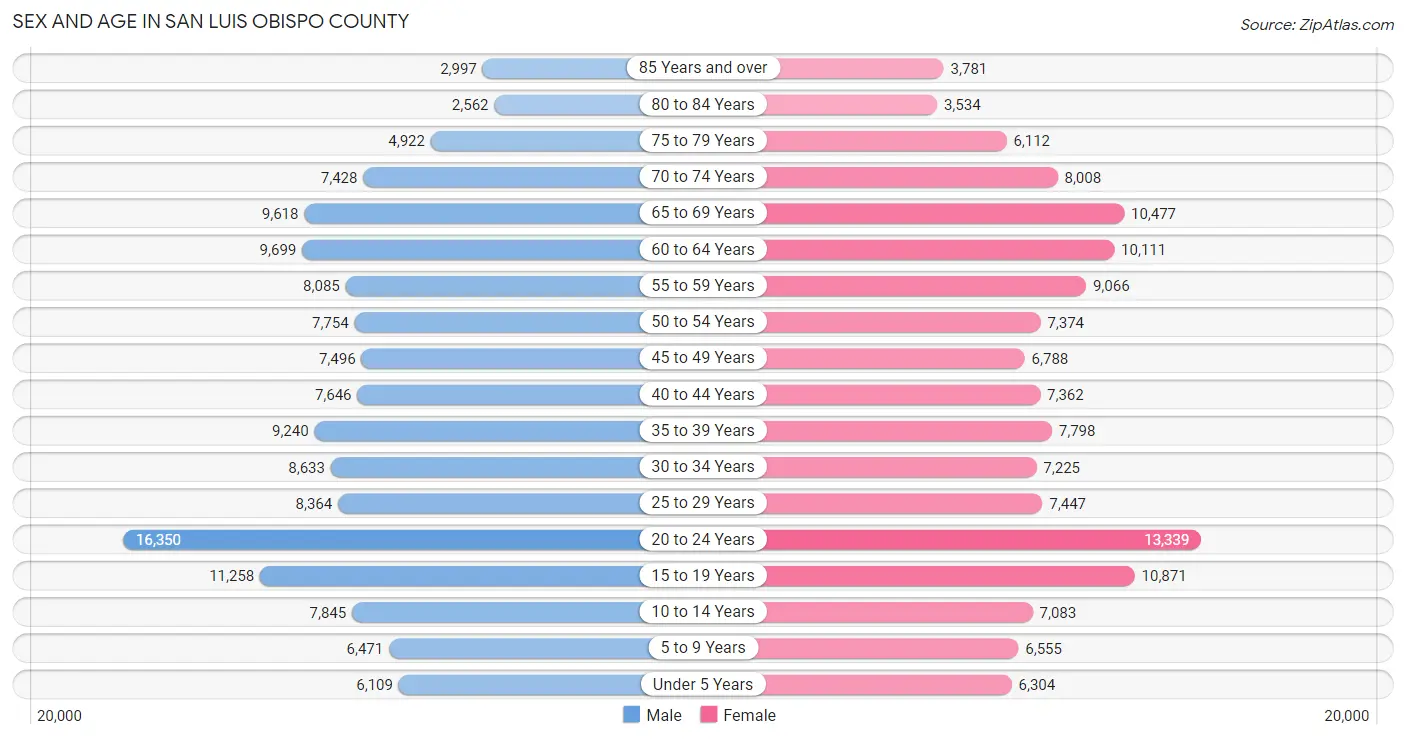
| Age Bracket | Male | Female |
| Under 5 Years | 6,109 (4.3%) | 6,304 (4.5%) |
| 5 to 9 Years | 6,471 (4.5%) | 6,555 (4.7%) |
| 10 to 14 Years | 7,845 (5.5%) | 7,083 (5.1%) |
| 15 to 19 Years | 11,258 (7.9%) | 10,871 (7.8%) |
| 20 to 24 Years | 16,350 (11.5%) | 13,339 (9.6%) |
| 25 to 29 Years | 8,364 (5.9%) | 7,447 (5.3%) |
| 30 to 34 Years | 8,633 (6.1%) | 7,225 (5.2%) |
| 35 to 39 Years | 9,240 (6.5%) | 7,798 (5.6%) |
| 40 to 44 Years | 7,646 (5.4%) | 7,362 (5.3%) |
| 45 to 49 Years | 7,496 (5.3%) | 6,788 (4.9%) |
| 50 to 54 Years | 7,754 (5.4%) | 7,374 (5.3%) |
| 55 to 59 Years | 8,085 (5.7%) | 9,066 (6.5%) |
| 60 to 64 Years | 9,699 (6.8%) | 10,111 (7.3%) |
| 65 to 69 Years | 9,618 (6.8%) | 10,477 (7.5%) |
| 70 to 74 Years | 7,428 (5.2%) | 8,008 (5.8%) |
| 75 to 79 Years | 4,922 (3.5%) | 6,112 (4.4%) |
| 80 to 84 Years | 2,562 (1.8%) | 3,534 (2.5%) |
| 85 Years and over | 2,997 (2.1%) | 3,781 (2.7%) |
| Total | 142,477 (100.0%) | 139,235 (100.0%) |
Families and Households in San Luis Obispo County
Median Family Size in San Luis Obispo County
The median family size in San Luis Obispo County is 2.95 persons per family, with married-couple families (53,577 | 78.9%) accounting for the largest median family size of 3.01 persons per family. On the other hand, single male/father families (4,898 | 7.2%) represent the smallest median family size with 2.47 persons per family.
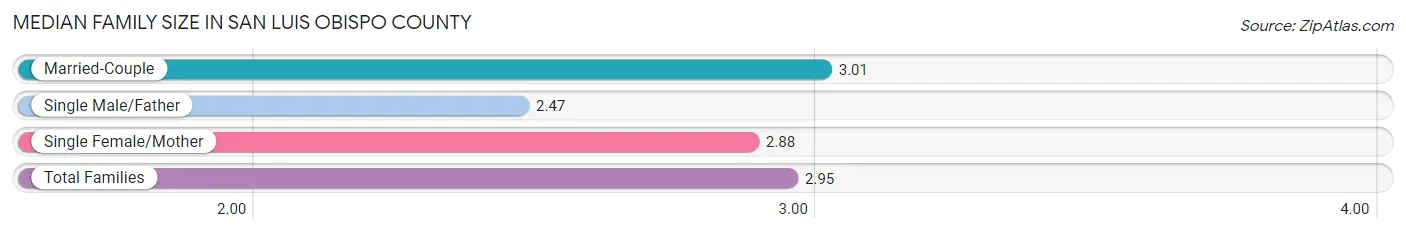
| Family Type | # Families | Family Size |
| Married-Couple | 53,577 (78.9%) | 3.01 |
| Single Male/Father | 4,898 (7.2%) | 2.47 |
| Single Female/Mother | 9,432 (13.9%) | 2.88 |
| Total Families | 67,907 (100.0%) | 2.95 |
Median Household Size in San Luis Obispo County
The median household size in San Luis Obispo County is 2.47 persons per household, with single female/mother households (9,432 | 8.7%) accounting for the largest median household size of 3.16 persons per household. non-family households (40,192 | 37.2%) represent the smallest median household size with 1.47 persons per household.
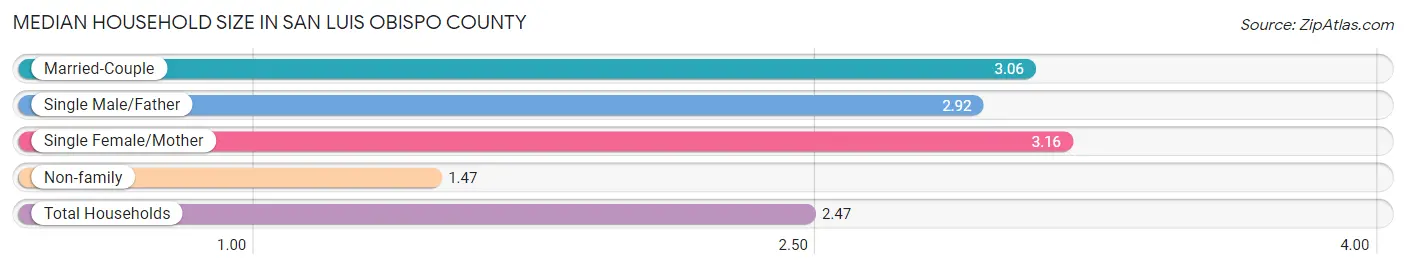
| Household Type | # Households | Household Size |
| Married-Couple | 53,577 (49.6%) | 3.06 |
| Single Male/Father | 4,898 (4.5%) | 2.92 |
| Single Female/Mother | 9,432 (8.7%) | 3.16 |
| Non-family | 40,192 (37.2%) | 1.47 |
| Total Households | 108,099 (100.0%) | 2.47 |
Household Size by Marriage Status in San Luis Obispo County
Out of a total of 108,099 households in San Luis Obispo County, 67,907 (62.8%) are family households, while 40,192 (37.2%) are nonfamily households. The most numerous type of family households are 2-person households, comprising 33,695, and the most common type of nonfamily households are 1-person households, comprising 28,802.
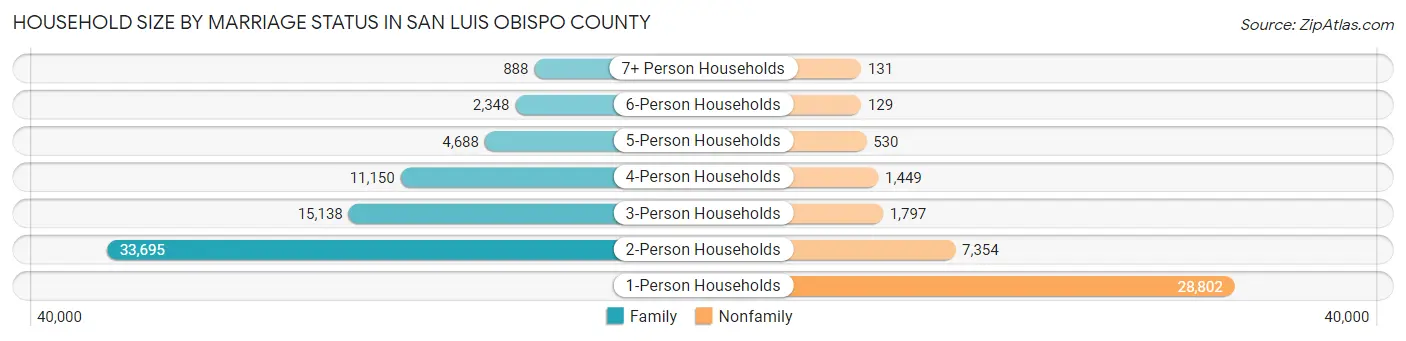
| Household Size | Family Households | Nonfamily Households |
| 1-Person Households | - | 28,802 (26.6%) |
| 2-Person Households | 33,695 (31.2%) | 7,354 (6.8%) |
| 3-Person Households | 15,138 (14.0%) | 1,797 (1.7%) |
| 4-Person Households | 11,150 (10.3%) | 1,449 (1.3%) |
| 5-Person Households | 4,688 (4.3%) | 530 (0.5%) |
| 6-Person Households | 2,348 (2.2%) | 129 (0.1%) |
| 7+ Person Households | 888 (0.8%) | 131 (0.1%) |
| Total | 67,907 (62.8%) | 40,192 (37.2%) |
Female Fertility in San Luis Obispo County
Fertility by Age in San Luis Obispo County
Average fertility rate in San Luis Obispo County is 41.0 births per 1,000 women. Women in the age bracket of 20 to 34 years have the highest fertility rate with 61.0 births per 1,000 women. Women in the age bracket of 20 to 34 years acount for 67.6% of all women with births.
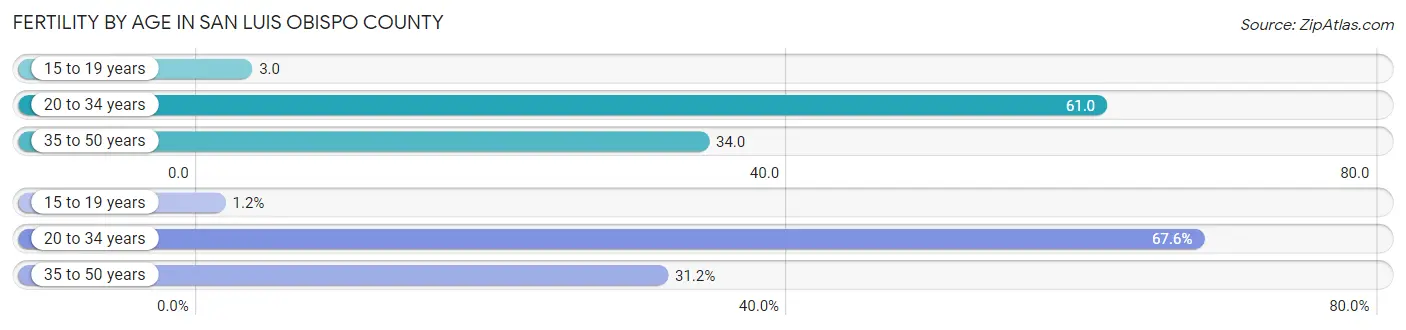
| Age Bracket | Women with Births | Births / 1,000 Women |
| 15 to 19 years | 30 (1.2%) | 3.0 |
| 20 to 34 years | 1,702 (67.6%) | 61.0 |
| 35 to 50 years | 786 (31.2%) | 34.0 |
| Total | 2,518 (100.0%) | 41.0 |
Fertility by Age by Marriage Status in San Luis Obispo County
69.0% of women with births (2,518) in San Luis Obispo County are married. The highest percentage of unmarried women with births falls into 15 to 19 years age bracket with 100.0% of them unmarried at the time of birth, while the lowest percentage of unmarried women with births belong to 35 to 50 years age bracket with 16.2% of them unmarried.
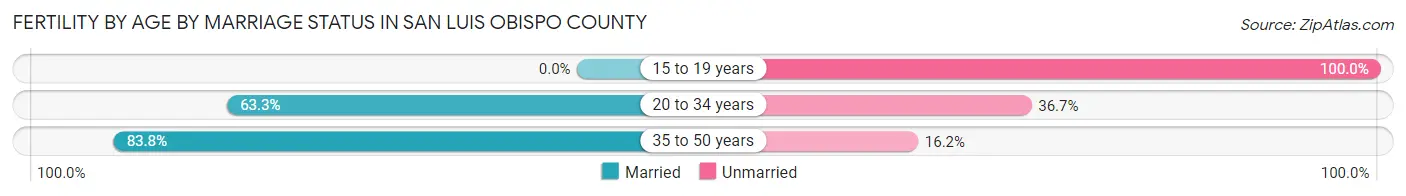
| Age Bracket | Married | Unmarried |
| 15 to 19 years | 0 (0.0%) | 30 (100.0%) |
| 20 to 34 years | 1,077 (63.3%) | 625 (36.7%) |
| 35 to 50 years | 659 (83.8%) | 127 (16.2%) |
| Total | 1,737 (69.0%) | 781 (31.0%) |
Fertility by Education in San Luis Obispo County
Average fertility rate in San Luis Obispo County is 41.0 births per 1,000 women. Women with the education attainment of graduate degree have the highest fertility rate of 51.0 births per 1,000 women, while women with the education attainment of less than high school have the lowest fertility at 10.0 births per 1,000 women. Women with the education attainment of college or associate's degree represent 44.9% of all women with births.
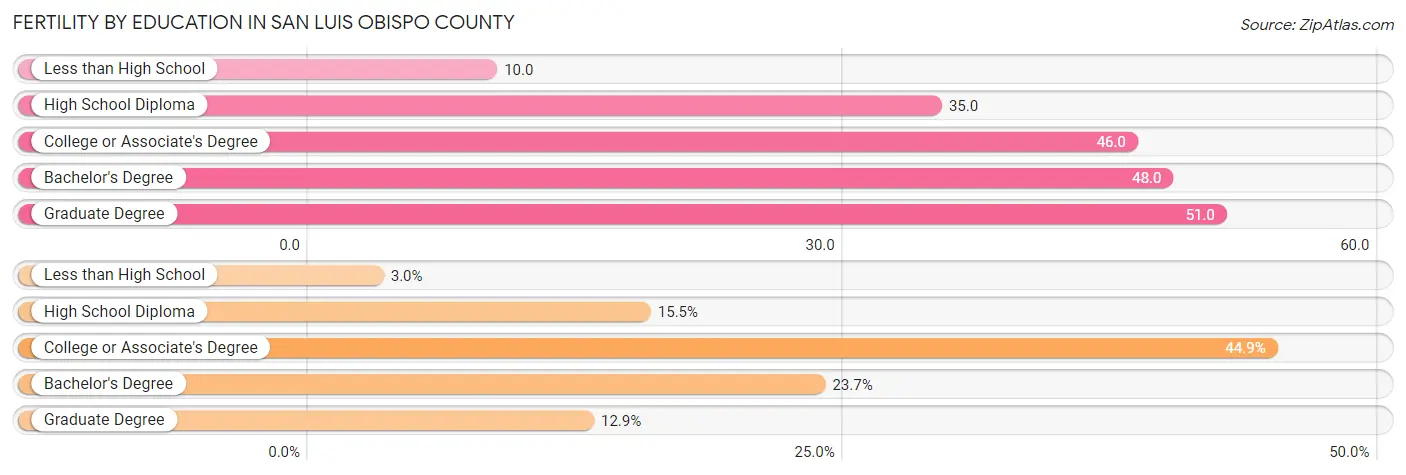
| Educational Attainment | Women with Births | Births / 1,000 Women |
| Less than High School | 76 (3.0%) | 10.0 |
| High School Diploma | 391 (15.5%) | 35.0 |
| College or Associate's Degree | 1,130 (44.9%) | 46.0 |
| Bachelor's Degree | 597 (23.7%) | 48.0 |
| Graduate Degree | 324 (12.9%) | 51.0 |
| Total | 2,518 (100.0%) | 41.0 |
Fertility by Education by Marriage Status in San Luis Obispo County
31.0% of women with births in San Luis Obispo County are unmarried. Women with the educational attainment of college or associate's degree are most likely to be married with 79.7% of them married at childbirth, while women with the educational attainment of high school diploma are least likely to be married with 70.6% of them unmarried at childbirth.
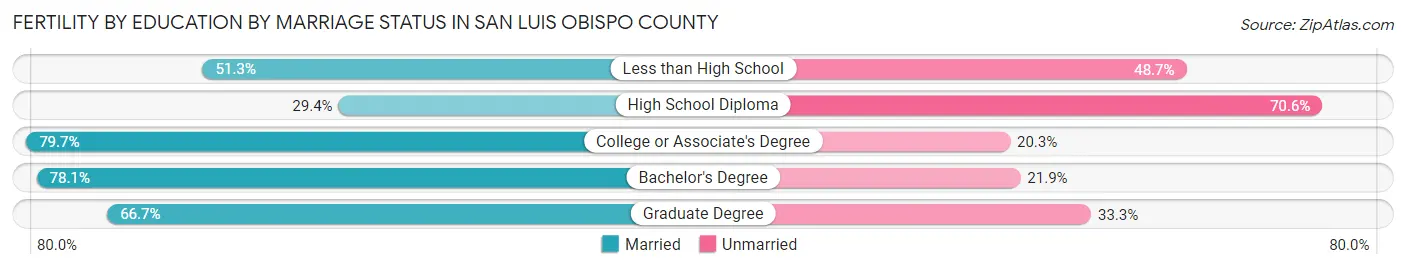
| Educational Attainment | Married | Unmarried |
| Less than High School | 39 (51.3%) | 37 (48.7%) |
| High School Diploma | 115 (29.4%) | 276 (70.6%) |
| College or Associate's Degree | 901 (79.7%) | 229 (20.3%) |
| Bachelor's Degree | 466 (78.1%) | 131 (21.9%) |
| Graduate Degree | 216 (66.7%) | 108 (33.3%) |
| Total | 1,737 (69.0%) | 781 (31.0%) |
Employment Characteristics in San Luis Obispo County
Employment by Class of Employer in San Luis Obispo County
Among the 129,192 employed individuals in San Luis Obispo County, private company employees (80,276 | 62.1%), self-employed (not incorporated) (11,143 | 8.6%), and local government employees (10,796 | 8.4%) make up the most common classes of employment.
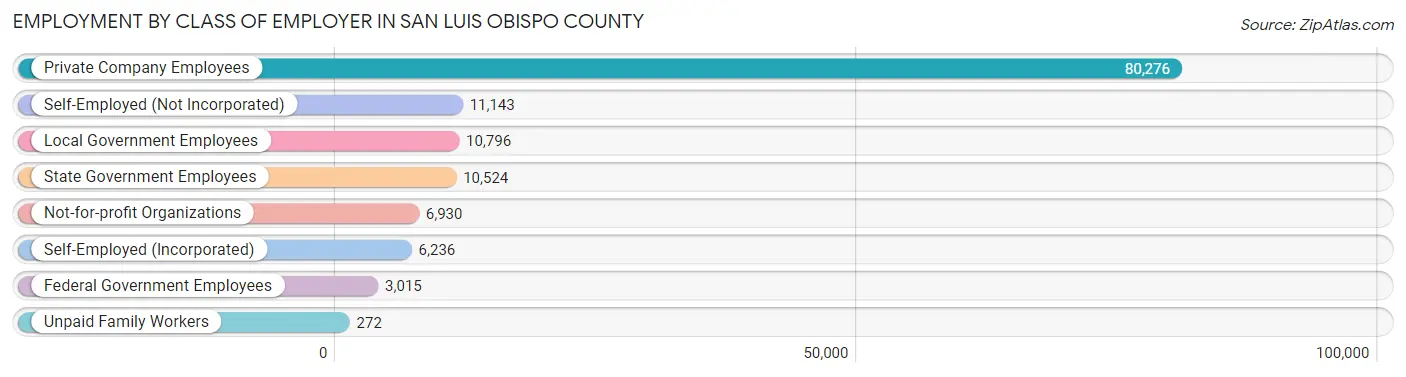
| Employer Class | # Employees | % Employees |
| Private Company Employees | 80,276 | 62.1% |
| Self-Employed (Incorporated) | 6,236 | 4.8% |
| Self-Employed (Not Incorporated) | 11,143 | 8.6% |
| Not-for-profit Organizations | 6,930 | 5.4% |
| Local Government Employees | 10,796 | 8.4% |
| State Government Employees | 10,524 | 8.2% |
| Federal Government Employees | 3,015 | 2.3% |
| Unpaid Family Workers | 272 | 0.2% |
| Total | 129,192 | 100.0% |
Employment Status by Age in San Luis Obispo County
According to the labor force statistics for San Luis Obispo County, out of the total population over 16 years of age (238,471), 58.6% or 139,744 individuals are in the labor force, with 5.0% or 6,987 of them unemployed. The age group with the highest labor force participation rate is 35 to 44 years, with 84.2% or 26,983 individuals in the labor force. Within the labor force, the 16 to 19 years age range has the highest percentage of unemployed individuals, with 9.1% or 706 of them being unemployed.
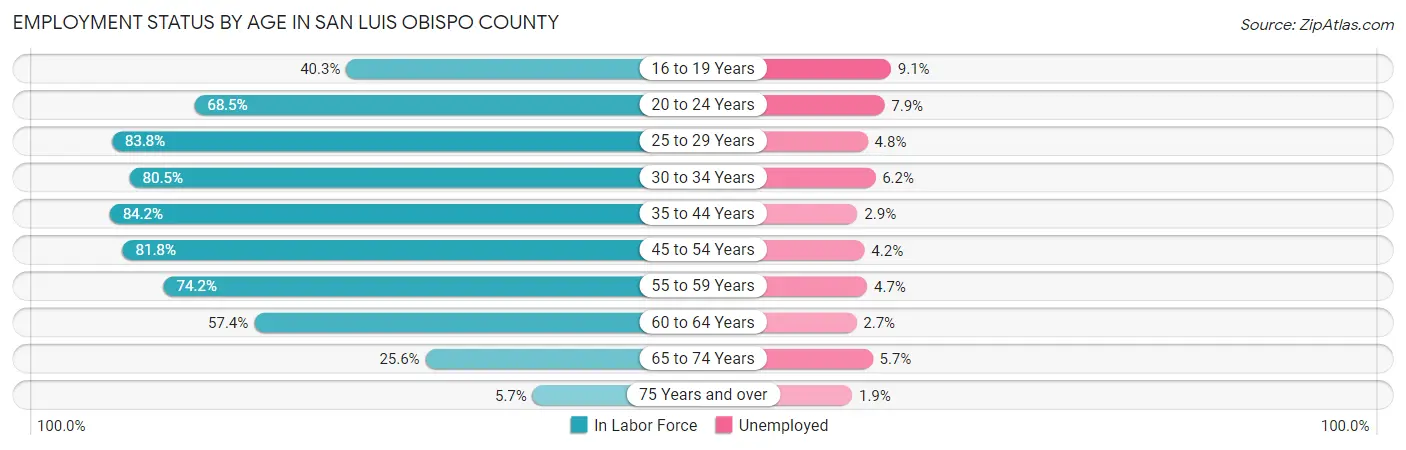
| Age Bracket | In Labor Force | Unemployed |
| 16 to 19 Years | 7,760 (40.3%) | 706 (9.1%) |
| 20 to 24 Years | 20,337 (68.5%) | 1,607 (7.9%) |
| 25 to 29 Years | 13,250 (83.8%) | 636 (4.8%) |
| 30 to 34 Years | 12,766 (80.5%) | 791 (6.2%) |
| 35 to 44 Years | 26,983 (84.2%) | 783 (2.9%) |
| 45 to 54 Years | 24,059 (81.8%) | 1,010 (4.2%) |
| 55 to 59 Years | 12,726 (74.2%) | 598 (4.7%) |
| 60 to 64 Years | 11,371 (57.4%) | 307 (2.7%) |
| 65 to 74 Years | 9,096 (25.6%) | 518 (5.7%) |
| 75 Years and over | 1,363 (5.7%) | 26 (1.9%) |
| Total | 139,744 (58.6%) | 6,987 (5.0%) |
Employment Status by Educational Attainment in San Luis Obispo County
According to labor force statistics for San Luis Obispo County, 77.7% of individuals (101,078) out of the total population between 25 and 64 years of age (130,088) are in the labor force, with 4.1% or 4,144 of them being unemployed. The group with the highest labor force participation rate are those with the educational attainment of bachelor's degree or higher, with 83.3% or 40,068 individuals in the labor force. Within the labor force, individuals with less than high school education have the highest percentage of unemployment, with 5.5% or 403 of them being unemployed.
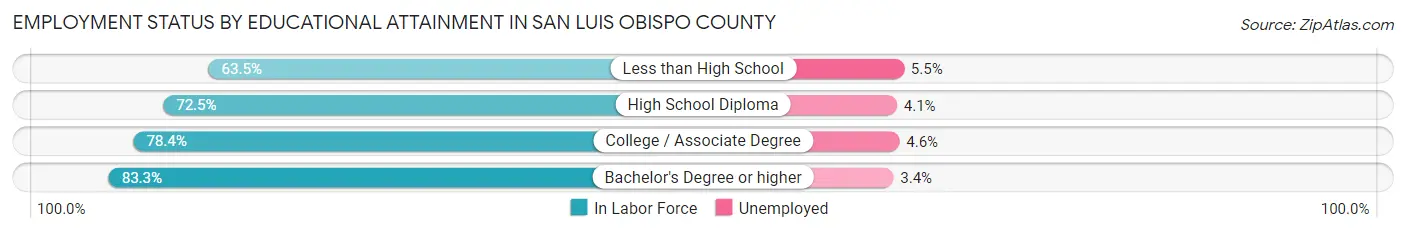
| Educational Attainment | In Labor Force | Unemployed |
| Less than High School | 7,328 (63.5%) | 635 (5.5%) |
| High School Diploma | 18,252 (72.5%) | 1,032 (4.1%) |
| College / Associate Degree | 35,493 (78.4%) | 2,083 (4.6%) |
| Bachelor's Degree or higher | 40,068 (83.3%) | 1,635 (3.4%) |
| Total | 101,078 (77.7%) | 5,334 (4.1%) |
Employment Occupations by Sex in San Luis Obispo County
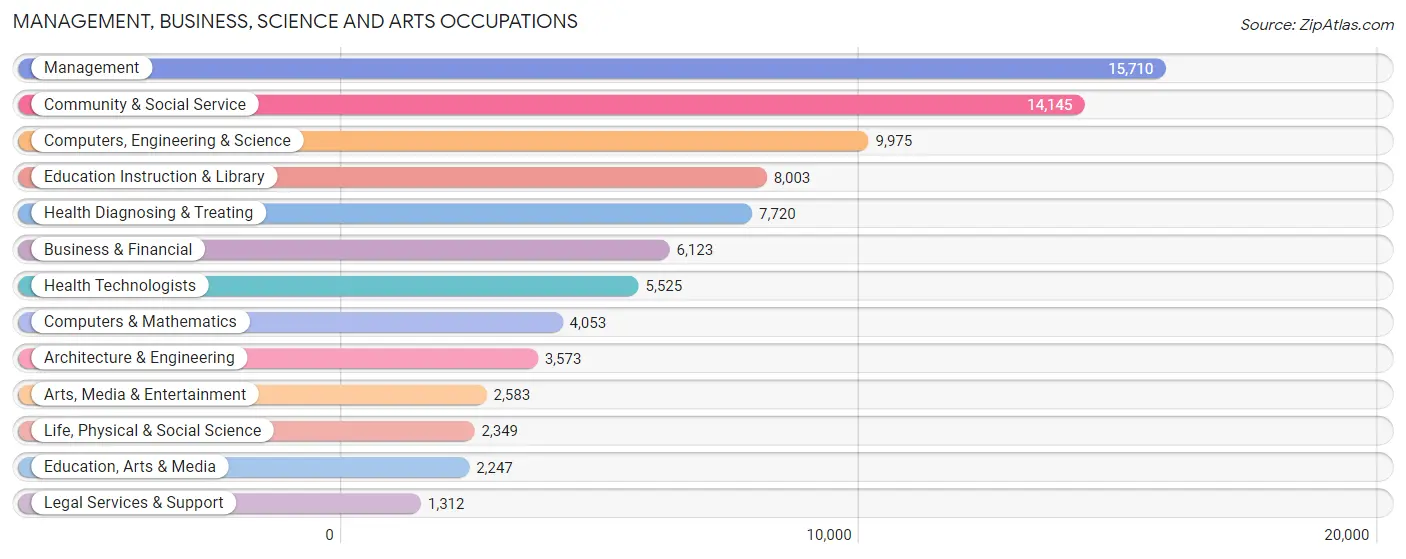
Management, Business, Science and Arts Occupations
The most common Management, Business, Science and Arts occupations in San Luis Obispo County are Management (15,710 | 11.9%), Community & Social Service (14,145 | 10.8%), Computers, Engineering & Science (9,975 | 7.6%), Education Instruction & Library (8,003 | 6.1%), and Health Diagnosing & Treating (7,720 | 5.9%).
Management, Business, Science and Arts Occupations by Sex
Within the Management, Business, Science and Arts occupations in San Luis Obispo County, the most male-oriented occupations are Computers & Mathematics (79.5%), Architecture & Engineering (79.4%), and Computers, Engineering & Science (73.8%), while the most female-oriented occupations are Education, Arts & Media (77.6%), Health Technologists (72.2%), and Health Diagnosing & Treating (71.2%).
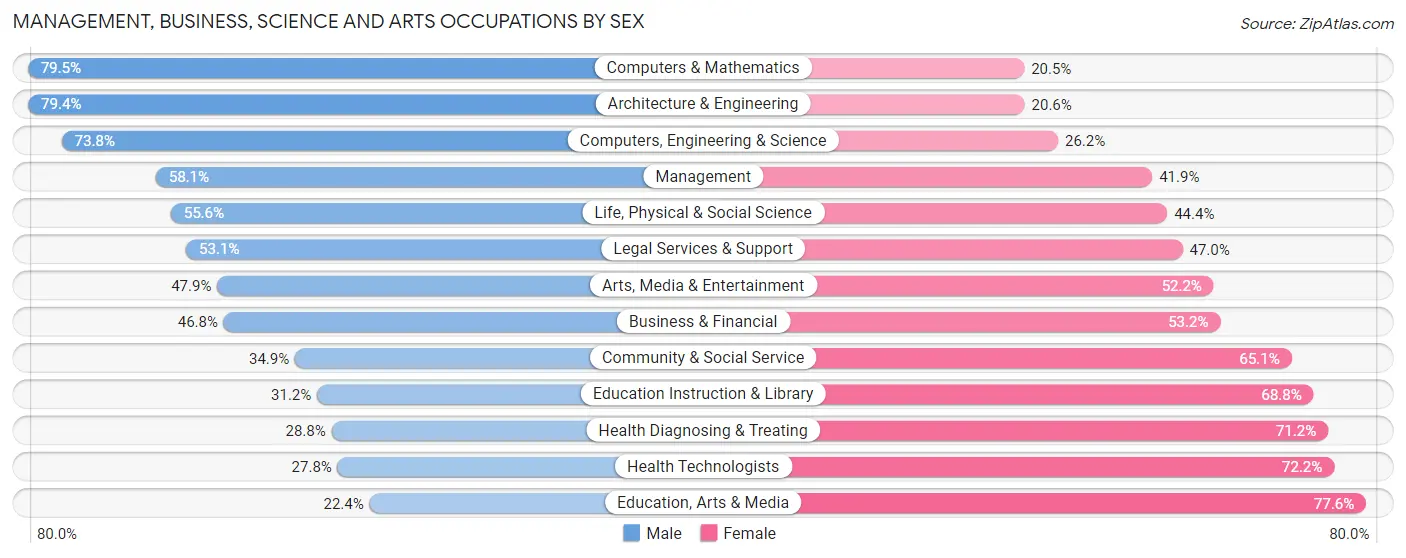
| Occupation | Male | Female |
| Management | 9,128 (58.1%) | 6,582 (41.9%) |
| Business & Financial | 2,863 (46.8%) | 3,260 (53.2%) |
| Computers, Engineering & Science | 7,364 (73.8%) | 2,611 (26.2%) |
| Computers & Mathematics | 3,221 (79.5%) | 832 (20.5%) |
| Architecture & Engineering | 2,837 (79.4%) | 736 (20.6%) |
| Life, Physical & Social Science | 1,306 (55.6%) | 1,043 (44.4%) |
| Community & Social Service | 4,931 (34.9%) | 9,214 (65.1%) |
| Education, Arts & Media | 504 (22.4%) | 1,743 (77.6%) |
| Legal Services & Support | 696 (53.0%) | 616 (46.9%) |
| Education Instruction & Library | 2,495 (31.2%) | 5,508 (68.8%) |
| Arts, Media & Entertainment | 1,236 (47.8%) | 1,347 (52.1%) |
| Health Diagnosing & Treating | 2,221 (28.8%) | 5,499 (71.2%) |
| Health Technologists | 1,534 (27.8%) | 3,991 (72.2%) |
| Total (Category) | 26,507 (49.4%) | 27,166 (50.6%) |
| Total (Overall) | 70,840 (53.9%) | 60,666 (46.1%) |
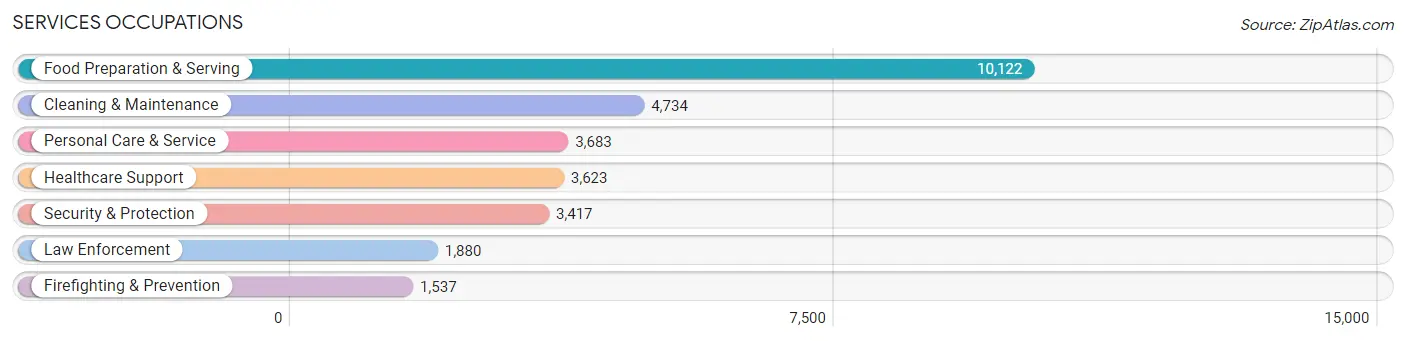
Services Occupations
The most common Services occupations in San Luis Obispo County are Food Preparation & Serving (10,122 | 7.7%), Cleaning & Maintenance (4,734 | 3.6%), Personal Care & Service (3,683 | 2.8%), Healthcare Support (3,623 | 2.8%), and Security & Protection (3,417 | 2.6%).
Services Occupations by Sex
Within the Services occupations in San Luis Obispo County, the most male-oriented occupations are Firefighting & Prevention (83.6%), Security & Protection (77.9%), and Law Enforcement (73.2%), while the most female-oriented occupations are Healthcare Support (79.5%), Personal Care & Service (72.3%), and Food Preparation & Serving (51.1%).
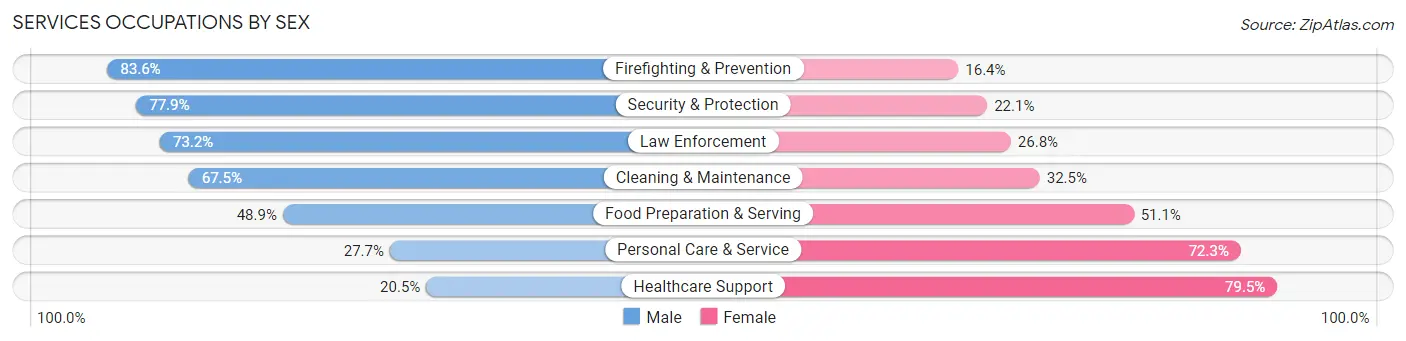
| Occupation | Male | Female |
| Healthcare Support | 742 (20.5%) | 2,881 (79.5%) |
| Security & Protection | 2,661 (77.9%) | 756 (22.1%) |
| Firefighting & Prevention | 1,285 (83.6%) | 252 (16.4%) |
| Law Enforcement | 1,376 (73.2%) | 504 (26.8%) |
| Food Preparation & Serving | 4,948 (48.9%) | 5,174 (51.1%) |
| Cleaning & Maintenance | 3,194 (67.5%) | 1,540 (32.5%) |
| Personal Care & Service | 1,020 (27.7%) | 2,663 (72.3%) |
| Total (Category) | 12,565 (49.1%) | 13,014 (50.9%) |
| Total (Overall) | 70,840 (53.9%) | 60,666 (46.1%) |
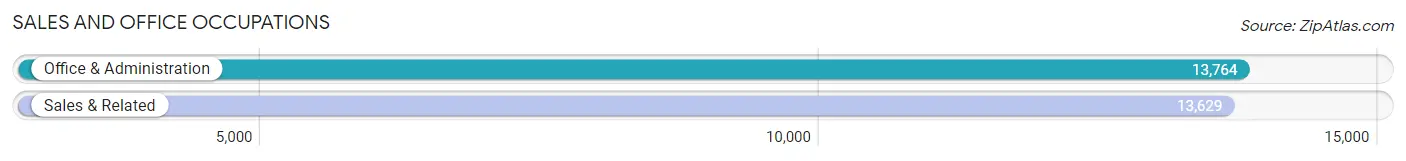
Sales and Office Occupations
The most common Sales and Office occupations in San Luis Obispo County are Office & Administration (13,764 | 10.5%), and Sales & Related (13,629 | 10.4%).
Sales and Office Occupations by Sex
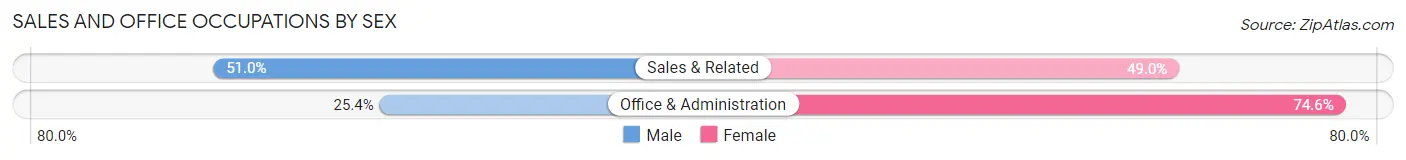
| Occupation | Male | Female |
| Sales & Related | 6,948 (51.0%) | 6,681 (49.0%) |
| Office & Administration | 3,494 (25.4%) | 10,270 (74.6%) |
| Total (Category) | 10,442 (38.1%) | 16,951 (61.9%) |
| Total (Overall) | 70,840 (53.9%) | 60,666 (46.1%) |
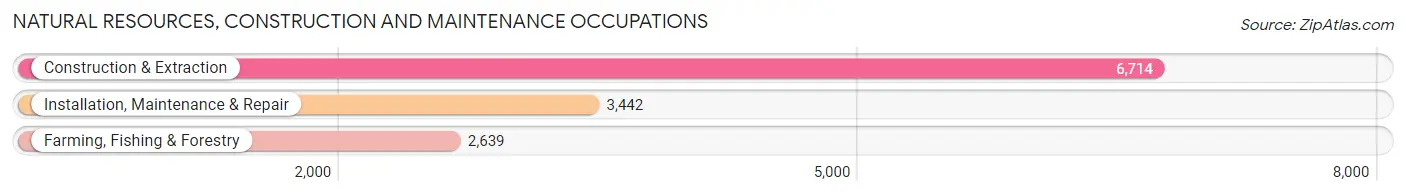
Natural Resources, Construction and Maintenance Occupations
The most common Natural Resources, Construction and Maintenance occupations in San Luis Obispo County are Construction & Extraction (6,714 | 5.1%), Installation, Maintenance & Repair (3,442 | 2.6%), and Farming, Fishing & Forestry (2,639 | 2.0%).
Natural Resources, Construction and Maintenance Occupations by Sex
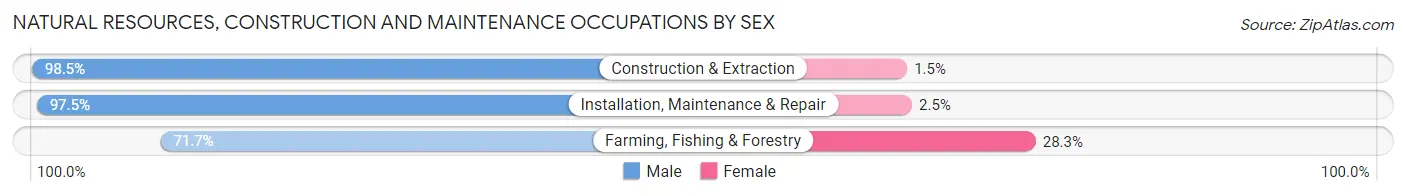
| Occupation | Male | Female |
| Farming, Fishing & Forestry | 1,893 (71.7%) | 746 (28.3%) |
| Construction & Extraction | 6,612 (98.5%) | 102 (1.5%) |
| Installation, Maintenance & Repair | 3,355 (97.5%) | 87 (2.5%) |
| Total (Category) | 11,860 (92.7%) | 935 (7.3%) |
| Total (Overall) | 70,840 (53.9%) | 60,666 (46.1%) |
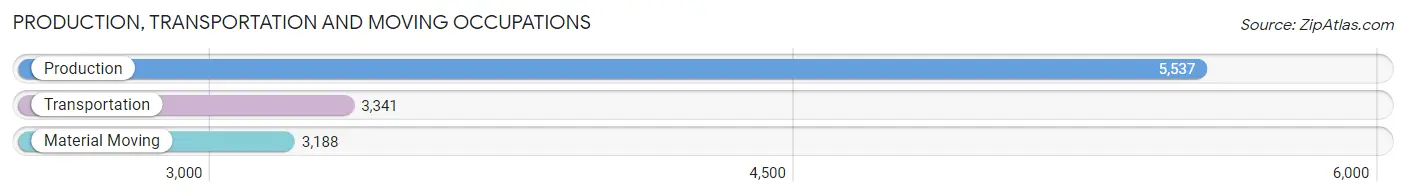
Production, Transportation and Moving Occupations
The most common Production, Transportation and Moving occupations in San Luis Obispo County are Production (5,537 | 4.2%), Transportation (3,341 | 2.5%), and Material Moving (3,188 | 2.4%).
Production, Transportation and Moving Occupations by Sex
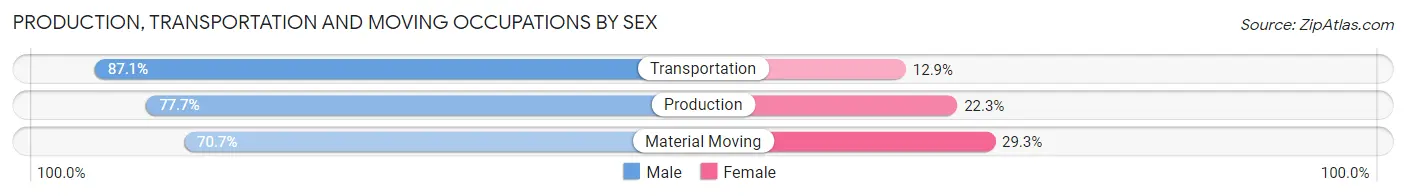
| Occupation | Male | Female |
| Production | 4,301 (77.7%) | 1,236 (22.3%) |
| Transportation | 2,910 (87.1%) | 431 (12.9%) |
| Material Moving | 2,255 (70.7%) | 933 (29.3%) |
| Total (Category) | 9,466 (78.4%) | 2,600 (21.5%) |
| Total (Overall) | 70,840 (53.9%) | 60,666 (46.1%) |
Employment Industries by Sex in San Luis Obispo County
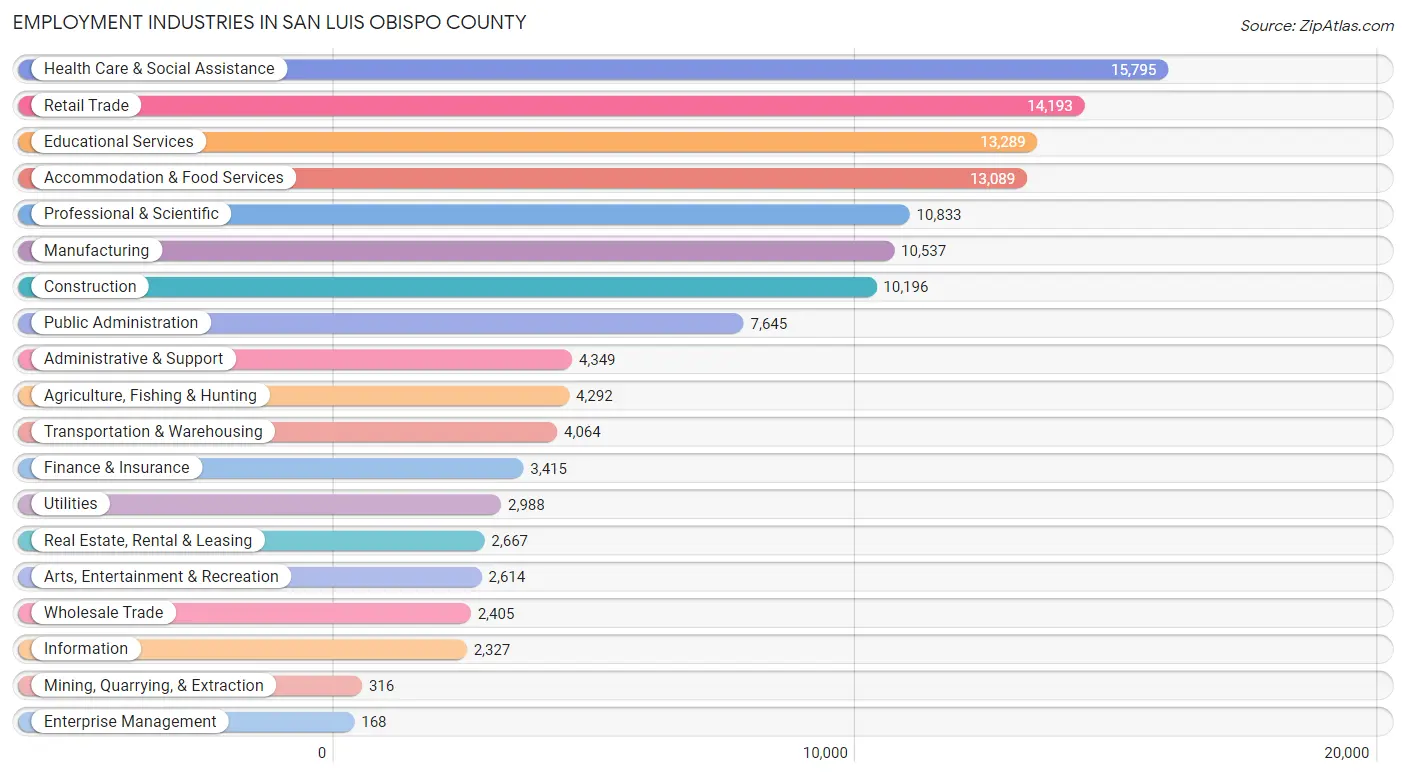
Employment Industries in San Luis Obispo County
The major employment industries in San Luis Obispo County include Health Care & Social Assistance (15,795 | 12.0%), Retail Trade (14,193 | 10.8%), Educational Services (13,289 | 10.1%), Accommodation & Food Services (13,089 | 10.0%), and Professional & Scientific (10,833 | 8.2%).
Employment Industries by Sex in San Luis Obispo County
The San Luis Obispo County industries that see more men than women are Utilities (90.8%), Construction (87.9%), and Mining, Quarrying, & Extraction (85.4%), whereas the industries that tend to have a higher number of women are Health Care & Social Assistance (74.4%), Educational Services (64.5%), and Finance & Insurance (62.6%).
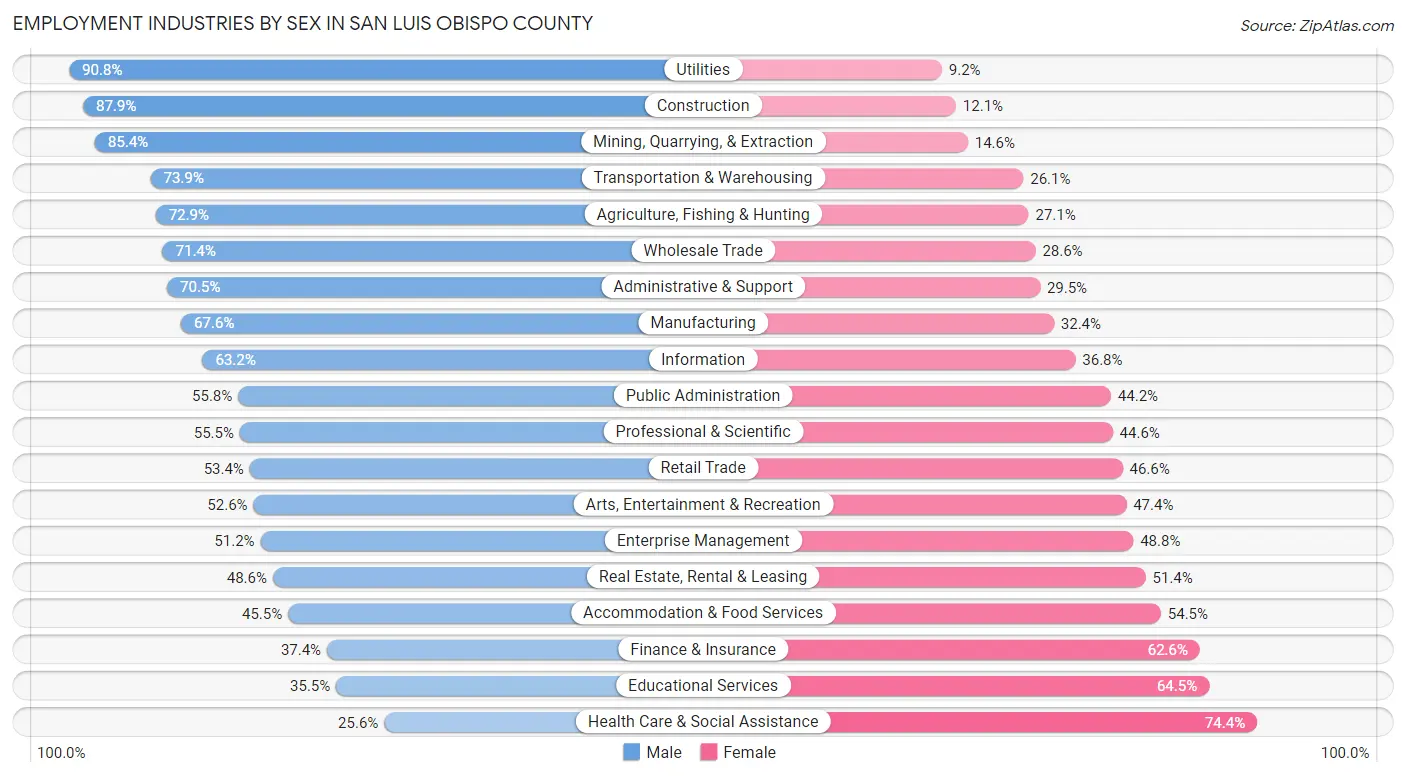
| Industry | Male | Female |
| Agriculture, Fishing & Hunting | 3,127 (72.9%) | 1,165 (27.1%) |
| Mining, Quarrying, & Extraction | 270 (85.4%) | 46 (14.6%) |
| Construction | 8,961 (87.9%) | 1,235 (12.1%) |
| Manufacturing | 7,125 (67.6%) | 3,412 (32.4%) |
| Wholesale Trade | 1,718 (71.4%) | 687 (28.6%) |
| Retail Trade | 7,581 (53.4%) | 6,612 (46.6%) |
| Transportation & Warehousing | 3,005 (73.9%) | 1,059 (26.1%) |
| Utilities | 2,713 (90.8%) | 275 (9.2%) |
| Information | 1,470 (63.2%) | 857 (36.8%) |
| Finance & Insurance | 1,278 (37.4%) | 2,137 (62.6%) |
| Real Estate, Rental & Leasing | 1,297 (48.6%) | 1,370 (51.4%) |
| Professional & Scientific | 6,007 (55.4%) | 4,826 (44.6%) |
| Enterprise Management | 86 (51.2%) | 82 (48.8%) |
| Administrative & Support | 3,066 (70.5%) | 1,283 (29.5%) |
| Educational Services | 4,720 (35.5%) | 8,569 (64.5%) |
| Health Care & Social Assistance | 4,041 (25.6%) | 11,754 (74.4%) |
| Arts, Entertainment & Recreation | 1,376 (52.6%) | 1,238 (47.4%) |
| Accommodation & Food Services | 5,952 (45.5%) | 7,137 (54.5%) |
| Public Administration | 4,267 (55.8%) | 3,378 (44.2%) |
| Total | 70,840 (53.9%) | 60,666 (46.1%) |
Education in San Luis Obispo County
School Enrollment in San Luis Obispo County
The most common levels of schooling among the 76,895 students in San Luis Obispo County are college / undergraduate (34,109 | 44.4%), high school (12,831 | 16.7%), and middle school (11,584 | 15.1%).
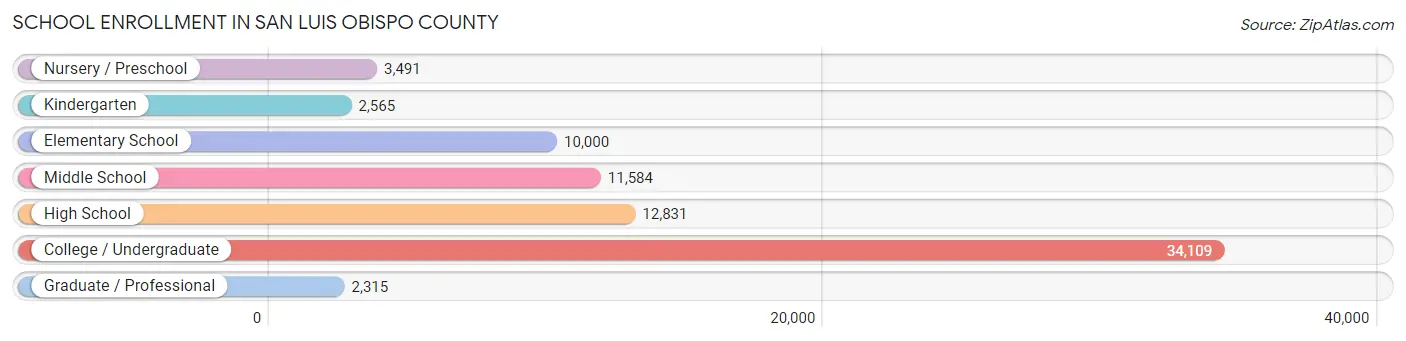
| School Level | # Students | % Students |
| Nursery / Preschool | 3,491 | 4.5% |
| Kindergarten | 2,565 | 3.3% |
| Elementary School | 10,000 | 13.0% |
| Middle School | 11,584 | 15.1% |
| High School | 12,831 | 16.7% |
| College / Undergraduate | 34,109 | 44.4% |
| Graduate / Professional | 2,315 | 3.0% |
| Total | 76,895 | 100.0% |
School Enrollment by Age by Funding Source in San Luis Obispo County
Out of a total of 76,895 students who are enrolled in schools in San Luis Obispo County, 6,228 (8.1%) attend a private institution, while the remaining 70,667 (91.9%) are enrolled in public schools. The age group of 3 to 4 year olds has the highest likelihood of being enrolled in private schools, with 1,229 (46.9% in the age bracket) enrolled. Conversely, the age group of 18 to 19 year olds has the lowest likelihood of being enrolled in a private school, with 11,830 (98.8% in the age bracket) attending a public institution.
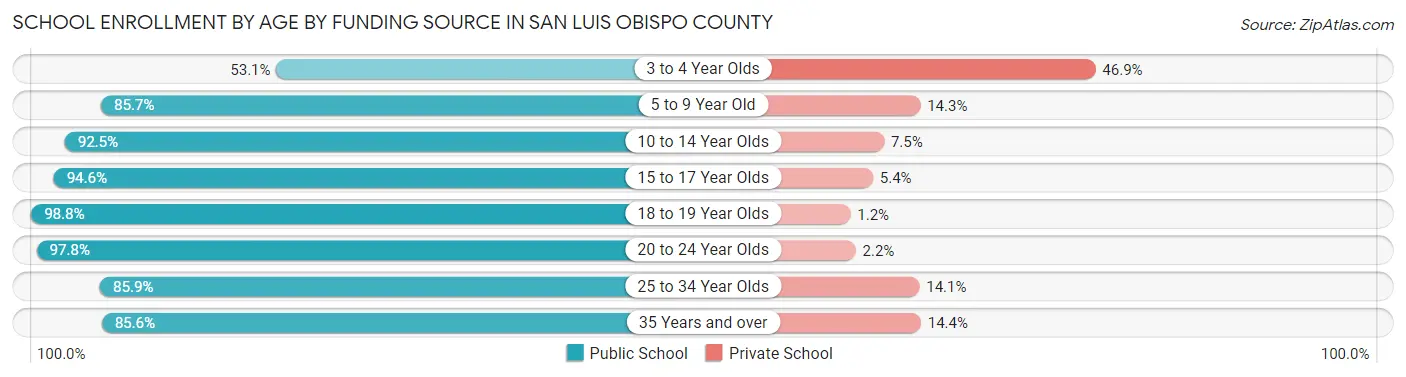
| Age Bracket | Public School | Private School |
| 3 to 4 Year Olds | 1,392 (53.1%) | 1,229 (46.9%) |
| 5 to 9 Year Old | 10,626 (85.7%) | 1,768 (14.3%) |
| 10 to 14 Year Olds | 13,691 (92.5%) | 1,110 (7.5%) |
| 15 to 17 Year Olds | 8,148 (94.6%) | 468 (5.4%) |
| 18 to 19 Year Olds | 11,830 (98.8%) | 149 (1.2%) |
| 20 to 24 Year Olds | 18,300 (97.8%) | 417 (2.2%) |
| 25 to 34 Year Olds | 3,223 (85.9%) | 528 (14.1%) |
| 35 Years and over | 3,439 (85.6%) | 577 (14.4%) |
| Total | 70,667 (91.9%) | 6,228 (8.1%) |
Educational Attainment by Field of Study in San Luis Obispo County
Business (10,593 | 13.8%), bio, nature & agricultural (9,220 | 12.0%), science & technology (6,973 | 9.1%), social sciences (6,806 | 8.8%), and education (6,245 | 8.1%) are the most common fields of study among 76,972 individuals in San Luis Obispo County who have obtained a bachelor's degree or higher.
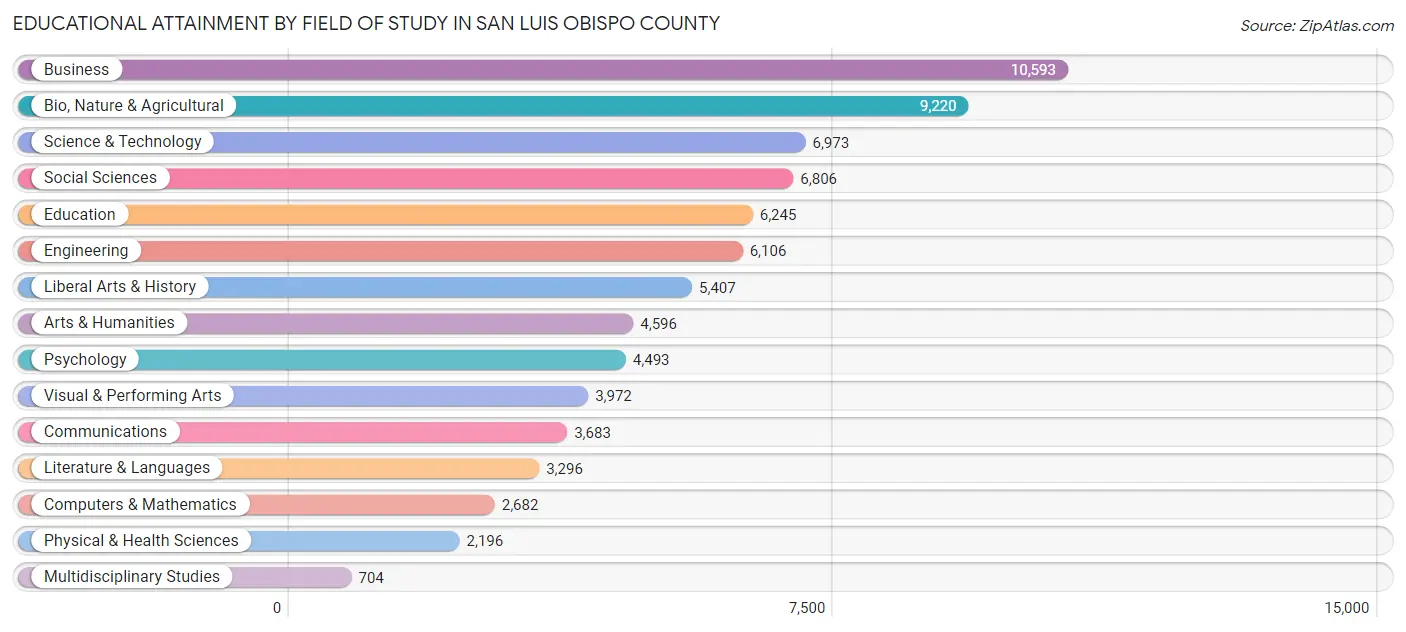
| Field of Study | # Graduates | % Graduates |
| Computers & Mathematics | 2,682 | 3.5% |
| Bio, Nature & Agricultural | 9,220 | 12.0% |
| Physical & Health Sciences | 2,196 | 2.9% |
| Psychology | 4,493 | 5.8% |
| Social Sciences | 6,806 | 8.8% |
| Engineering | 6,106 | 7.9% |
| Multidisciplinary Studies | 704 | 0.9% |
| Science & Technology | 6,973 | 9.1% |
| Business | 10,593 | 13.8% |
| Education | 6,245 | 8.1% |
| Literature & Languages | 3,296 | 4.3% |
| Liberal Arts & History | 5,407 | 7.0% |
| Visual & Performing Arts | 3,972 | 5.2% |
| Communications | 3,683 | 4.8% |
| Arts & Humanities | 4,596 | 6.0% |
| Total | 76,972 | 100.0% |
Transportation & Commute in San Luis Obispo County
Vehicle Availability by Sex in San Luis Obispo County
The most prevalent vehicle ownership categories in San Luis Obispo County are males with 2 vehicles (24,149, accounting for 35.2%) and females with 2 vehicles (20,445, making up 41.9%).
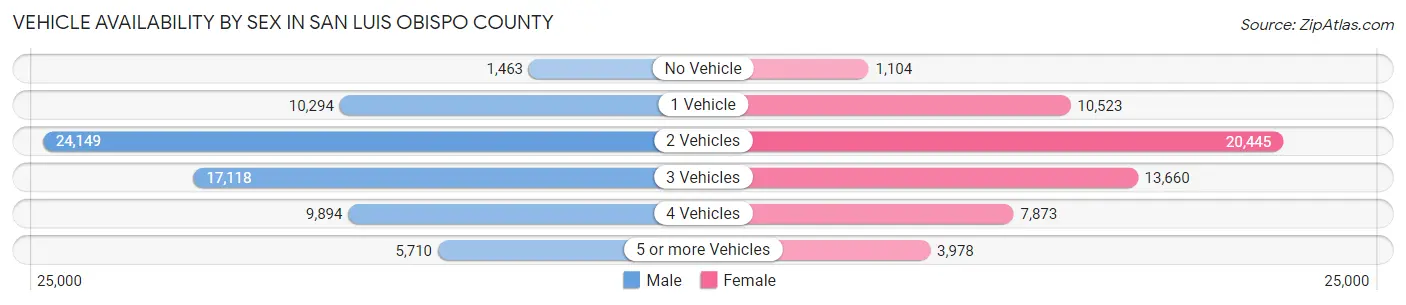
| Vehicles Available | Male | Female |
| No Vehicle | 1,463 (2.1%) | 1,104 (1.9%) |
| 1 Vehicle | 10,294 (15.0%) | 10,523 (18.3%) |
| 2 Vehicles | 24,149 (35.2%) | 20,445 (35.5%) |
| 3 Vehicles | 17,118 (24.9%) | 13,660 (23.7%) |
| 4 Vehicles | 9,894 (14.4%) | 7,873 (13.7%) |
| 5 or more Vehicles | 5,710 (8.3%) | 3,978 (6.9%) |
| Total | 68,628 (100.0%) | 57,583 (100.0%) |
Commute Time in San Luis Obispo County
The most frequently occuring commute durations in San Luis Obispo County are 5 to 9 minutes (19,689 commuters, 17.5%), 15 to 19 minutes (18,195 commuters, 16.2%), and 10 to 14 minutes (17,895 commuters, 15.9%).
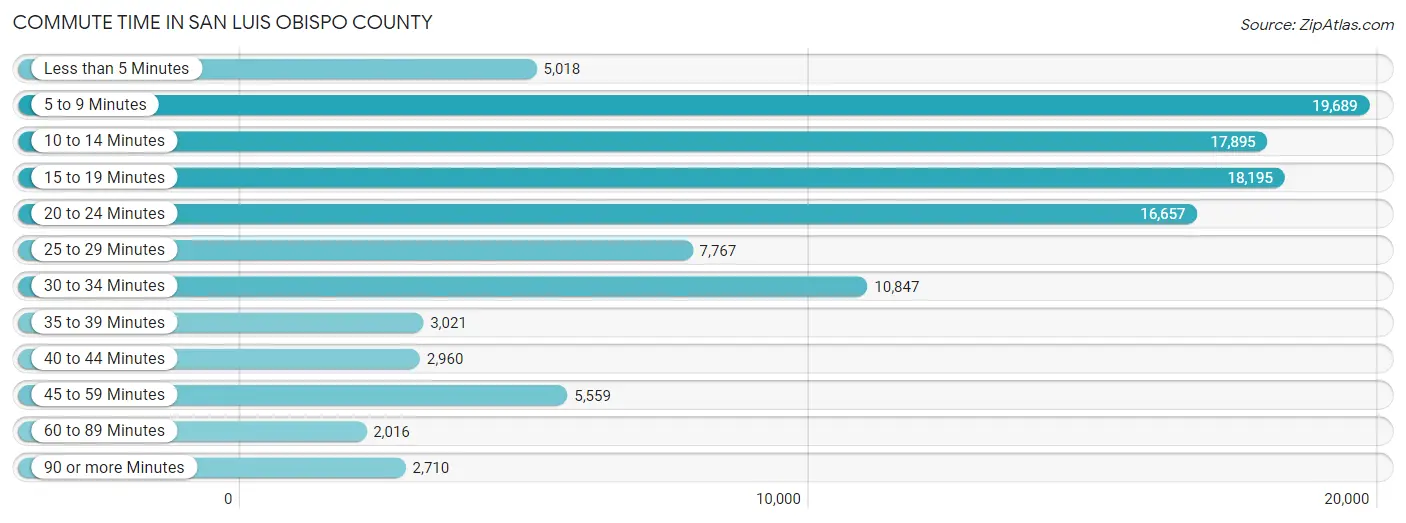
| Commute Time | # Commuters | % Commuters |
| Less than 5 Minutes | 5,018 | 4.5% |
| 5 to 9 Minutes | 19,689 | 17.5% |
| 10 to 14 Minutes | 17,895 | 15.9% |
| 15 to 19 Minutes | 18,195 | 16.2% |
| 20 to 24 Minutes | 16,657 | 14.8% |
| 25 to 29 Minutes | 7,767 | 6.9% |
| 30 to 34 Minutes | 10,847 | 9.7% |
| 35 to 39 Minutes | 3,021 | 2.7% |
| 40 to 44 Minutes | 2,960 | 2.6% |
| 45 to 59 Minutes | 5,559 | 5.0% |
| 60 to 89 Minutes | 2,016 | 1.8% |
| 90 or more Minutes | 2,710 | 2.4% |
Commute Time by Sex in San Luis Obispo County
The most common commute times in San Luis Obispo County are 10 to 14 minutes (9,933 commuters, 16.3%) for males and 5 to 9 minutes (10,373 commuters, 20.2%) for females.
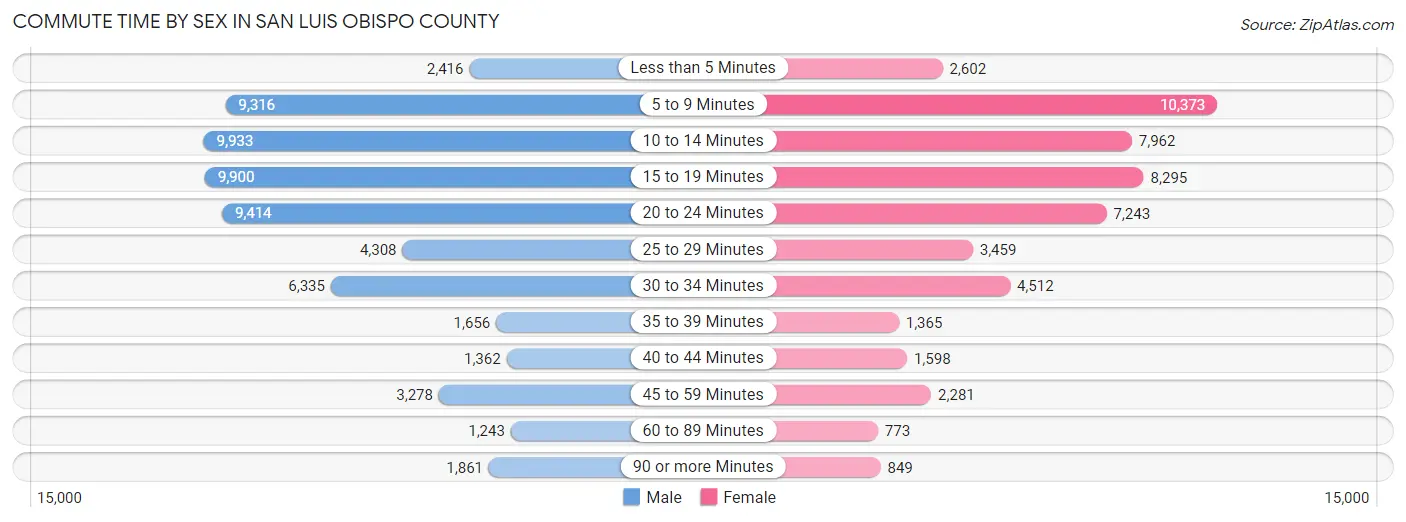
| Commute Time | Male | Female |
| Less than 5 Minutes | 2,416 (4.0%) | 2,602 (5.1%) |
| 5 to 9 Minutes | 9,316 (15.3%) | 10,373 (20.2%) |
| 10 to 14 Minutes | 9,933 (16.3%) | 7,962 (15.5%) |
| 15 to 19 Minutes | 9,900 (16.2%) | 8,295 (16.2%) |
| 20 to 24 Minutes | 9,414 (15.4%) | 7,243 (14.1%) |
| 25 to 29 Minutes | 4,308 (7.1%) | 3,459 (6.7%) |
| 30 to 34 Minutes | 6,335 (10.4%) | 4,512 (8.8%) |
| 35 to 39 Minutes | 1,656 (2.7%) | 1,365 (2.7%) |
| 40 to 44 Minutes | 1,362 (2.2%) | 1,598 (3.1%) |
| 45 to 59 Minutes | 3,278 (5.4%) | 2,281 (4.4%) |
| 60 to 89 Minutes | 1,243 (2.0%) | 773 (1.5%) |
| 90 or more Minutes | 1,861 (3.0%) | 849 (1.7%) |
Time of Departure to Work by Sex in San Luis Obispo County
The most frequent times of departure to work in San Luis Obispo County are 7:00 AM to 7:29 AM (8,730, 14.3%) for males and 7:30 AM to 7:59 AM (7,363, 14.3%) for females.
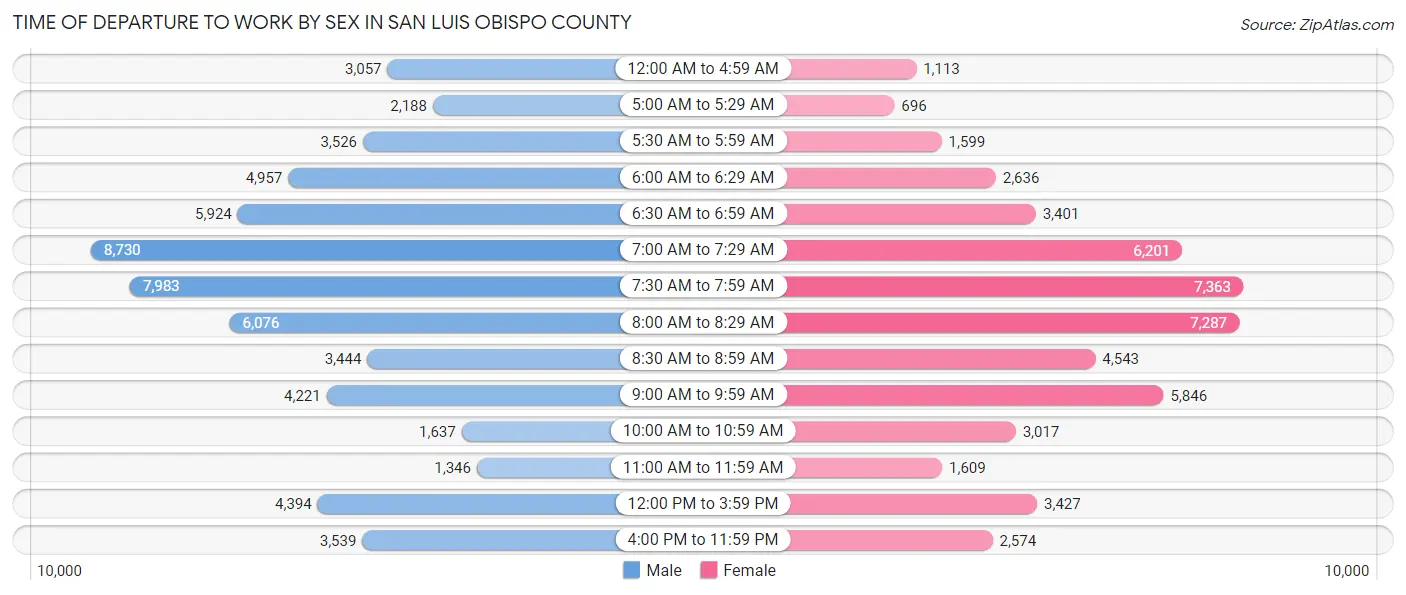
| Time of Departure | Male | Female |
| 12:00 AM to 4:59 AM | 3,057 (5.0%) | 1,113 (2.2%) |
| 5:00 AM to 5:29 AM | 2,188 (3.6%) | 696 (1.4%) |
| 5:30 AM to 5:59 AM | 3,526 (5.8%) | 1,599 (3.1%) |
| 6:00 AM to 6:29 AM | 4,957 (8.1%) | 2,636 (5.1%) |
| 6:30 AM to 6:59 AM | 5,924 (9.7%) | 3,401 (6.6%) |
| 7:00 AM to 7:29 AM | 8,730 (14.3%) | 6,201 (12.1%) |
| 7:30 AM to 7:59 AM | 7,983 (13.1%) | 7,363 (14.3%) |
| 8:00 AM to 8:29 AM | 6,076 (10.0%) | 7,287 (14.2%) |
| 8:30 AM to 8:59 AM | 3,444 (5.6%) | 4,543 (8.8%) |
| 9:00 AM to 9:59 AM | 4,221 (6.9%) | 5,846 (11.4%) |
| 10:00 AM to 10:59 AM | 1,637 (2.7%) | 3,017 (5.9%) |
| 11:00 AM to 11:59 AM | 1,346 (2.2%) | 1,609 (3.1%) |
| 12:00 PM to 3:59 PM | 4,394 (7.2%) | 3,427 (6.7%) |
| 4:00 PM to 11:59 PM | 3,539 (5.8%) | 2,574 (5.0%) |
| Total | 61,022 (100.0%) | 51,312 (100.0%) |
Housing Occupancy in San Luis Obispo County
Occupancy by Ownership in San Luis Obispo County
Of the total 108,099 dwellings in San Luis Obispo County, owner-occupied units account for 67,031 (62.0%), while renter-occupied units make up 41,068 (38.0%).
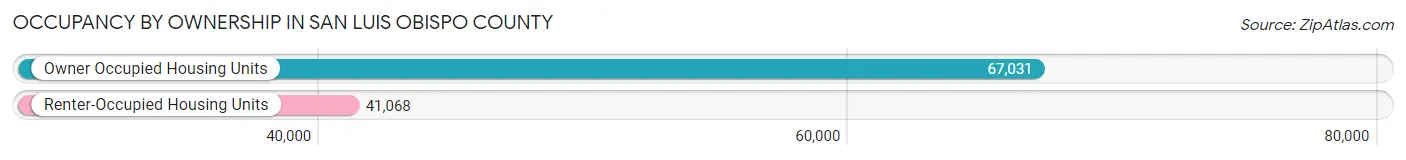
| Occupancy | # Housing Units | % Housing Units |
| Owner Occupied Housing Units | 67,031 | 62.0% |
| Renter-Occupied Housing Units | 41,068 | 38.0% |
| Total Occupied Housing Units | 108,099 | 100.0% |
Occupancy by Household Size in San Luis Obispo County
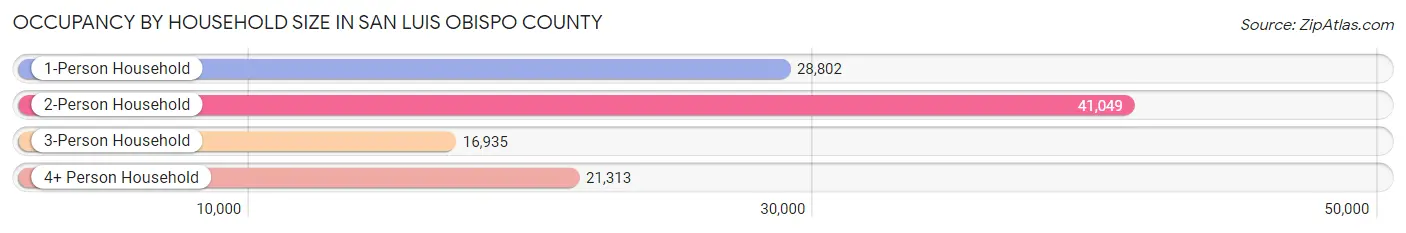
| Household Size | # Housing Units | % Housing Units |
| 1-Person Household | 28,802 | 26.6% |
| 2-Person Household | 41,049 | 38.0% |
| 3-Person Household | 16,935 | 15.7% |
| 4+ Person Household | 21,313 | 19.7% |
| Total Housing Units | 108,099 | 100.0% |
Occupancy by Ownership by Household Size in San Luis Obispo County
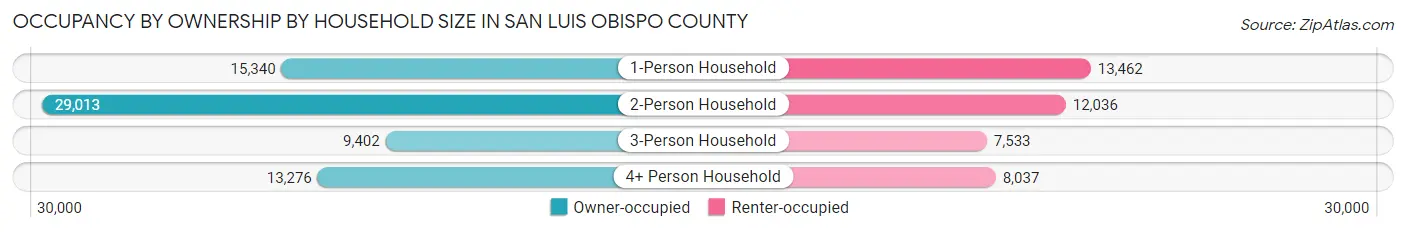
| Household Size | Owner-occupied | Renter-occupied |
| 1-Person Household | 15,340 (53.3%) | 13,462 (46.7%) |
| 2-Person Household | 29,013 (70.7%) | 12,036 (29.3%) |
| 3-Person Household | 9,402 (55.5%) | 7,533 (44.5%) |
| 4+ Person Household | 13,276 (62.3%) | 8,037 (37.7%) |
| Total Housing Units | 67,031 (62.0%) | 41,068 (38.0%) |
Occupancy by Educational Attainment in San Luis Obispo County
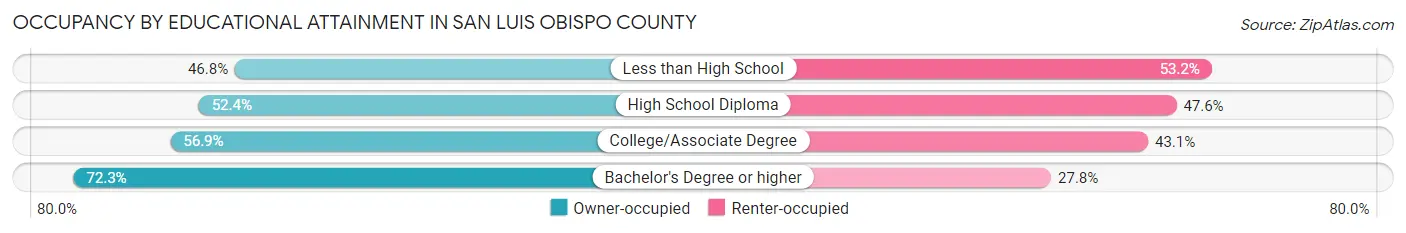
| Household Size | Owner-occupied | Renter-occupied |
| Less than High School | 2,593 (46.8%) | 2,949 (53.2%) |
| High School Diploma | 8,679 (52.4%) | 7,894 (47.6%) |
| College/Associate Degree | 23,549 (56.9%) | 17,852 (43.1%) |
| Bachelor's Degree or higher | 32,210 (72.3%) | 12,373 (27.8%) |
Occupancy by Age of Householder in San Luis Obispo County
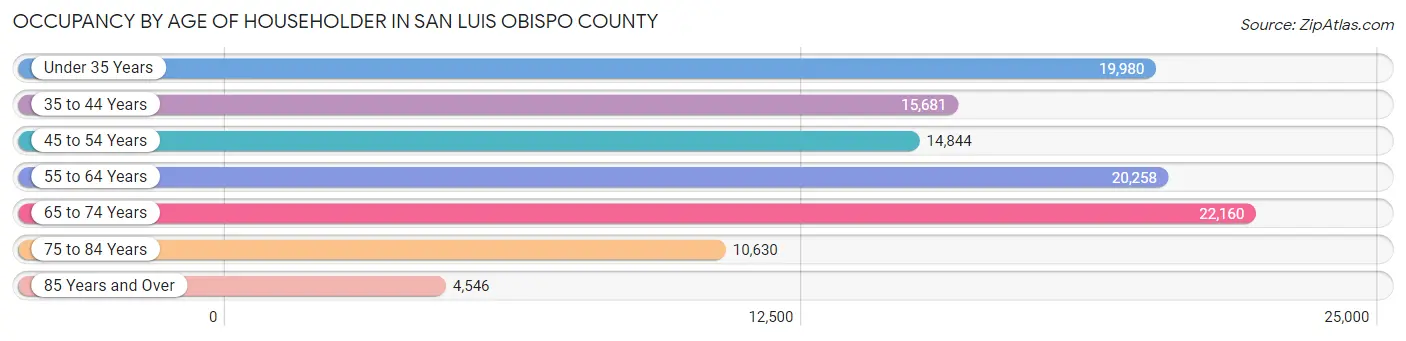
| Age Bracket | # Households | % Households |
| Under 35 Years | 19,980 | 18.5% |
| 35 to 44 Years | 15,681 | 14.5% |
| 45 to 54 Years | 14,844 | 13.7% |
| 55 to 64 Years | 20,258 | 18.7% |
| 65 to 74 Years | 22,160 | 20.5% |
| 75 to 84 Years | 10,630 | 9.8% |
| 85 Years and Over | 4,546 | 4.2% |
| Total | 108,099 | 100.0% |
Housing Finances in San Luis Obispo County
Median Income by Occupancy in San Luis Obispo County
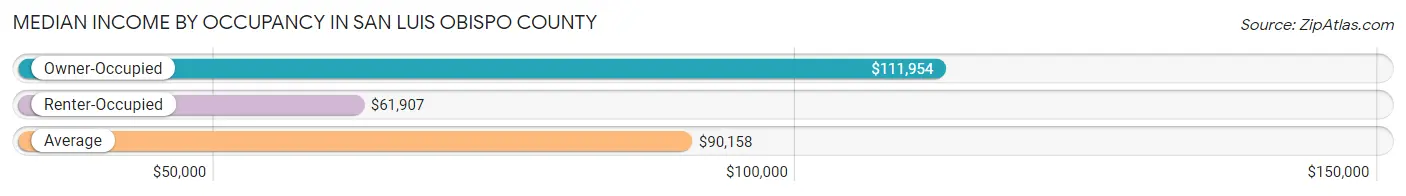
| Occupancy Type | # Households | Median Income |
| Owner-Occupied | 67,031 (62.0%) | $111,954 |
| Renter-Occupied | 41,068 (38.0%) | $61,907 |
| Average | 108,099 (100.0%) | $90,158 |
Occupancy by Householder Income Bracket in San Luis Obispo County
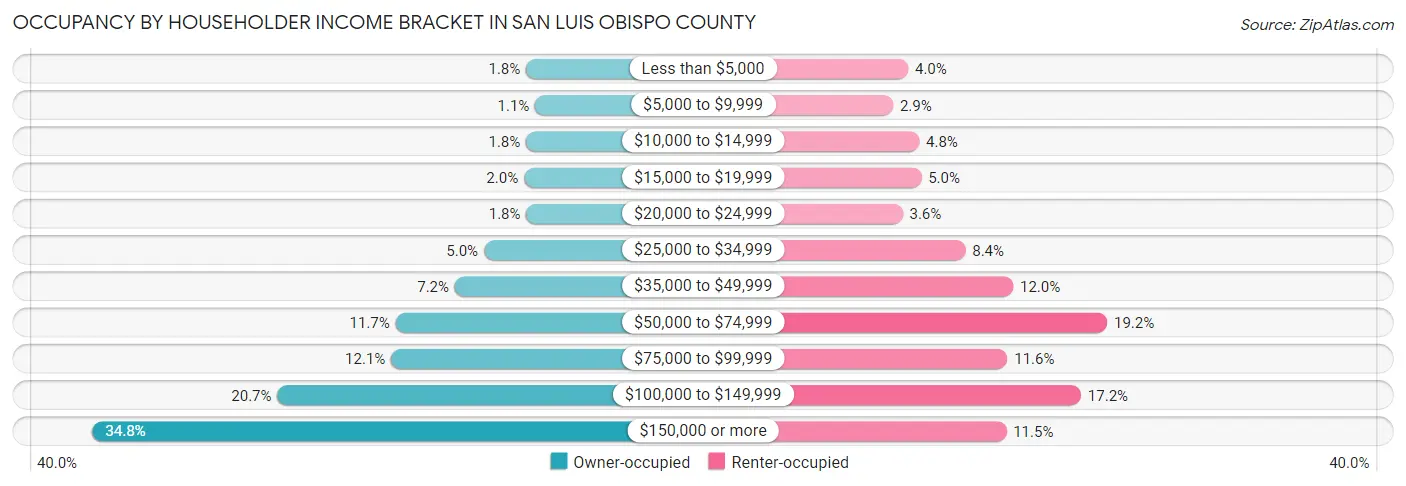
| Income Bracket | Owner-occupied | Renter-occupied |
| Less than $5,000 | 1,200 (1.8%) | 1,641 (4.0%) |
| $5,000 to $9,999 | 737 (1.1%) | 1,171 (2.9%) |
| $10,000 to $14,999 | 1,199 (1.8%) | 1,987 (4.8%) |
| $15,000 to $19,999 | 1,309 (1.9%) | 2,052 (5.0%) |
| $20,000 to $24,999 | 1,187 (1.8%) | 1,472 (3.6%) |
| $25,000 to $34,999 | 3,349 (5.0%) | 3,435 (8.4%) |
| $35,000 to $49,999 | 4,840 (7.2%) | 4,927 (12.0%) |
| $50,000 to $74,999 | 7,871 (11.7%) | 7,870 (19.2%) |
| $75,000 to $99,999 | 8,092 (12.1%) | 4,746 (11.6%) |
| $100,000 to $149,999 | 13,902 (20.7%) | 7,052 (17.2%) |
| $150,000 or more | 23,345 (34.8%) | 4,715 (11.5%) |
| Total | 67,031 (100.0%) | 41,068 (100.0%) |
Monthly Housing Cost Tiers in San Luis Obispo County
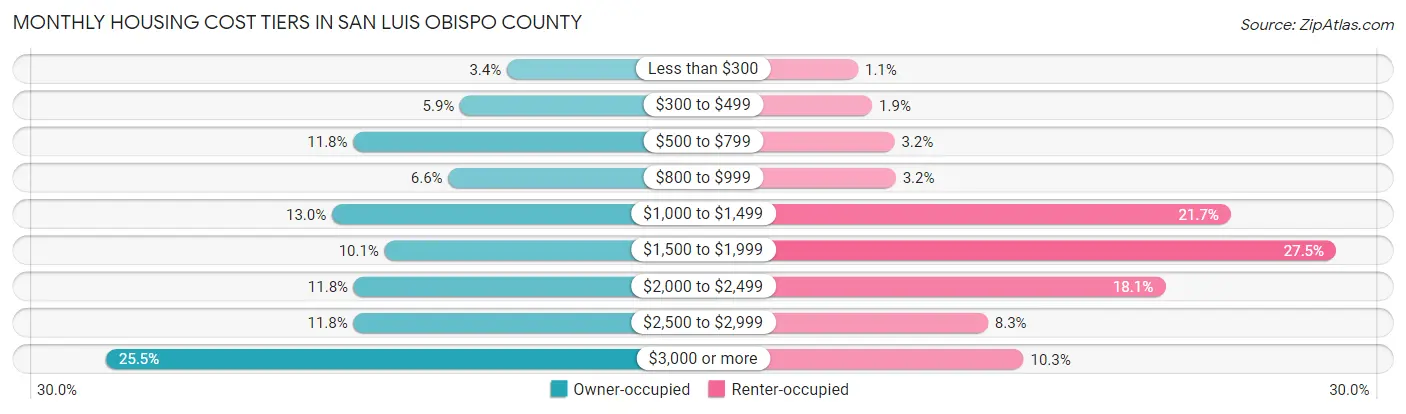
| Monthly Cost | Owner-occupied | Renter-occupied |
| Less than $300 | 2,243 (3.4%) | 469 (1.1%) |
| $300 to $499 | 3,983 (5.9%) | 788 (1.9%) |
| $500 to $799 | 7,939 (11.8%) | 1,294 (3.2%) |
| $800 to $999 | 4,417 (6.6%) | 1,323 (3.2%) |
| $1,000 to $1,499 | 8,729 (13.0%) | 8,920 (21.7%) |
| $1,500 to $1,999 | 6,777 (10.1%) | 11,304 (27.5%) |
| $2,000 to $2,499 | 7,919 (11.8%) | 7,431 (18.1%) |
| $2,500 to $2,999 | 7,927 (11.8%) | 3,412 (8.3%) |
| $3,000 or more | 17,097 (25.5%) | 4,220 (10.3%) |
| Total | 67,031 (100.0%) | 41,068 (100.0%) |
Physical Housing Characteristics in San Luis Obispo County
Housing Structures in San Luis Obispo County
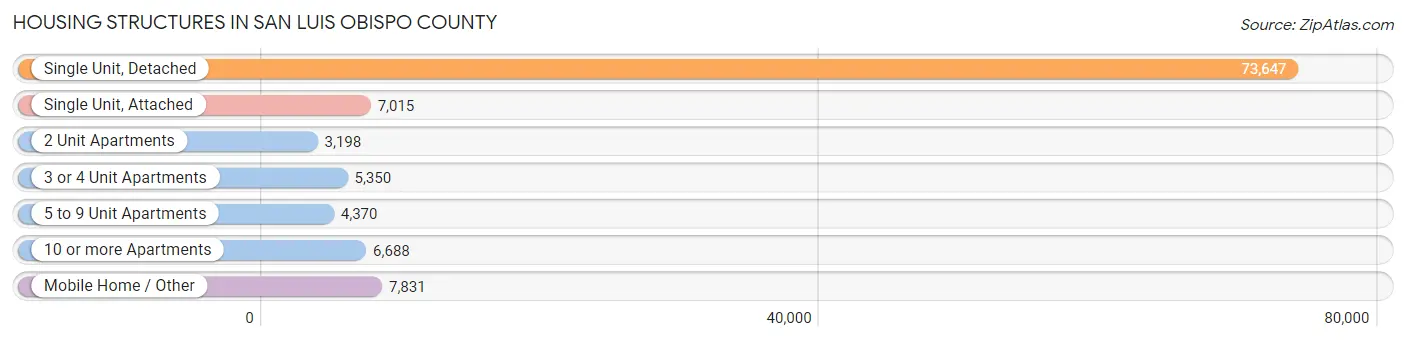
| Structure Type | # Housing Units | % Housing Units |
| Single Unit, Detached | 73,647 | 68.1% |
| Single Unit, Attached | 7,015 | 6.5% |
| 2 Unit Apartments | 3,198 | 3.0% |
| 3 or 4 Unit Apartments | 5,350 | 5.0% |
| 5 to 9 Unit Apartments | 4,370 | 4.0% |
| 10 or more Apartments | 6,688 | 6.2% |
| Mobile Home / Other | 7,831 | 7.2% |
| Total | 108,099 | 100.0% |
Housing Structures by Occupancy in San Luis Obispo County
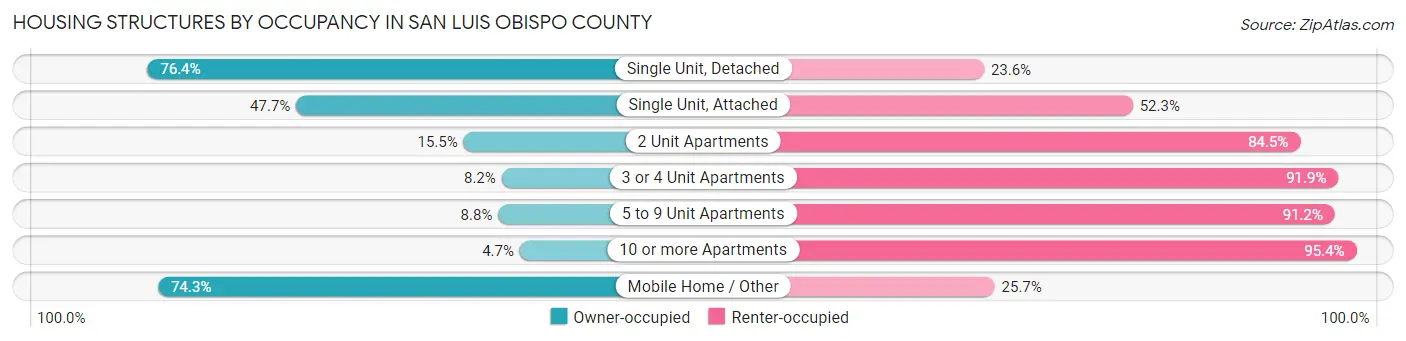
| Structure Type | Owner-occupied | Renter-occupied |
| Single Unit, Detached | 56,238 (76.4%) | 17,409 (23.6%) |
| Single Unit, Attached | 3,347 (47.7%) | 3,668 (52.3%) |
| 2 Unit Apartments | 495 (15.5%) | 2,703 (84.5%) |
| 3 or 4 Unit Apartments | 436 (8.2%) | 4,914 (91.8%) |
| 5 to 9 Unit Apartments | 385 (8.8%) | 3,985 (91.2%) |
| 10 or more Apartments | 311 (4.6%) | 6,377 (95.4%) |
| Mobile Home / Other | 5,819 (74.3%) | 2,012 (25.7%) |
| Total | 67,031 (62.0%) | 41,068 (38.0%) |
Housing Structures by Number of Rooms in San Luis Obispo County
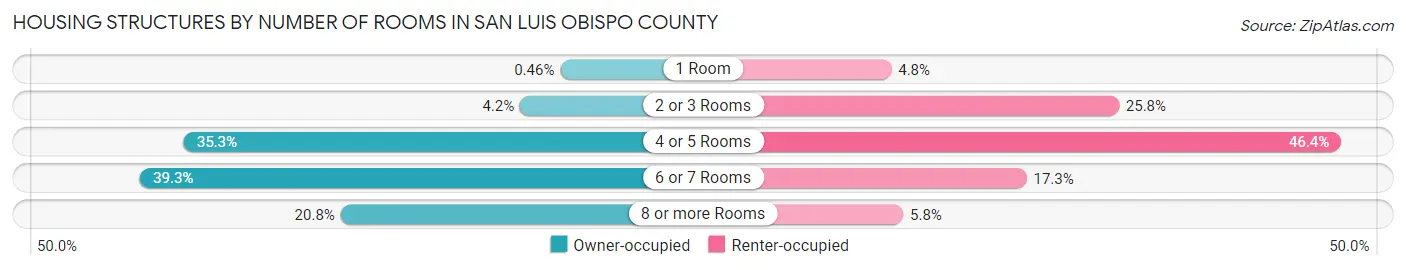
| Number of Rooms | Owner-occupied | Renter-occupied |
| 1 Room | 311 (0.5%) | 1,952 (4.8%) |
| 2 or 3 Rooms | 2,804 (4.2%) | 10,596 (25.8%) |
| 4 or 5 Rooms | 23,643 (35.3%) | 19,035 (46.4%) |
| 6 or 7 Rooms | 26,353 (39.3%) | 7,087 (17.3%) |
| 8 or more Rooms | 13,920 (20.8%) | 2,398 (5.8%) |
| Total | 67,031 (100.0%) | 41,068 (100.0%) |
Housing Structure by Heating Type in San Luis Obispo County
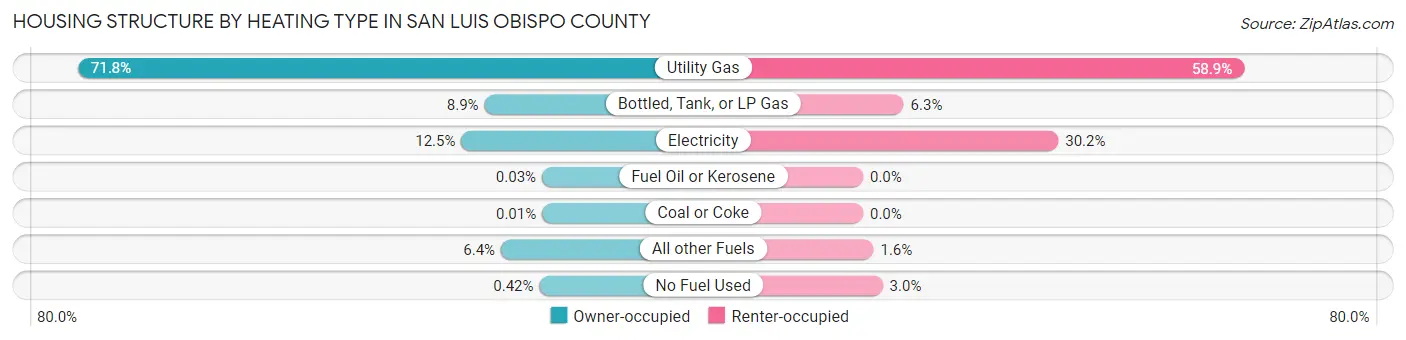
| Heating Type | Owner-occupied | Renter-occupied |
| Utility Gas | 48,104 (71.8%) | 24,182 (58.9%) |
| Bottled, Tank, or LP Gas | 5,981 (8.9%) | 2,580 (6.3%) |
| Electricity | 8,375 (12.5%) | 12,394 (30.2%) |
| Fuel Oil or Kerosene | 22 (0.0%) | 0 (0.0%) |
| Coal or Coke | 5 (0.0%) | 0 (0.0%) |
| All other Fuels | 4,263 (6.4%) | 666 (1.6%) |
| No Fuel Used | 281 (0.4%) | 1,246 (3.0%) |
| Total | 67,031 (100.0%) | 41,068 (100.0%) |
Household Vehicle Usage in San Luis Obispo County
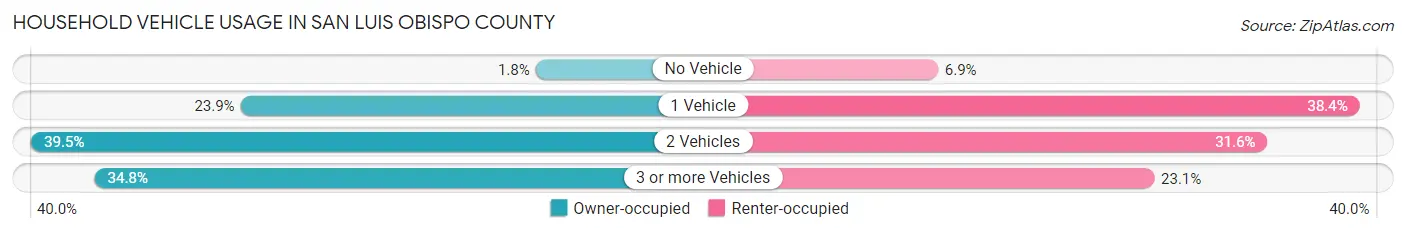
| Vehicles per Household | Owner-occupied | Renter-occupied |
| No Vehicle | 1,235 (1.8%) | 2,849 (6.9%) |
| 1 Vehicle | 16,007 (23.9%) | 15,783 (38.4%) |
| 2 Vehicles | 26,484 (39.5%) | 12,955 (31.6%) |
| 3 or more Vehicles | 23,305 (34.8%) | 9,481 (23.1%) |
| Total | 67,031 (100.0%) | 41,068 (100.0%) |
Real Estate & Mortgages in San Luis Obispo County
Real Estate and Mortgage Overview in San Luis Obispo County
| Characteristic | Without Mortgage | With Mortgage |
| Housing Units | 24,377 | 42,654 |
| Median Property Value | $724,000 | $727,700 |
| Median Household Income | $79,126 | $17,706 |
| Monthly Housing Costs | $751 | $16,999 |
| Real Estate Taxes | $4,179 | $829 |
Property Value by Mortgage Status in San Luis Obispo County
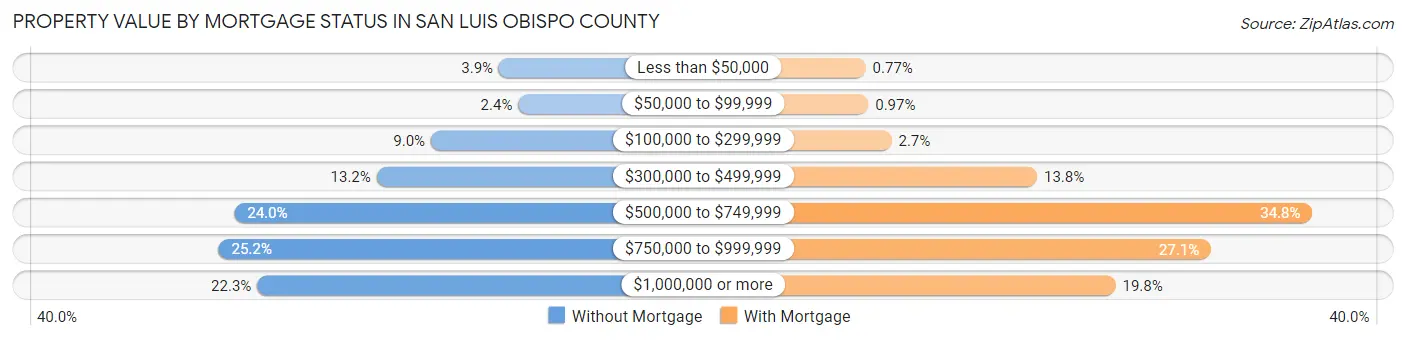
| Property Value | Without Mortgage | With Mortgage |
| Less than $50,000 | 942 (3.9%) | 327 (0.8%) |
| $50,000 to $99,999 | 583 (2.4%) | 415 (1.0%) |
| $100,000 to $299,999 | 2,204 (9.0%) | 1,167 (2.7%) |
| $300,000 to $499,999 | 3,213 (13.2%) | 5,898 (13.8%) |
| $500,000 to $749,999 | 5,856 (24.0%) | 14,842 (34.8%) |
| $750,000 to $999,999 | 6,147 (25.2%) | 11,557 (27.1%) |
| $1,000,000 or more | 5,432 (22.3%) | 8,448 (19.8%) |
| Total | 24,377 (100.0%) | 42,654 (100.0%) |
Household Income by Mortgage Status in San Luis Obispo County
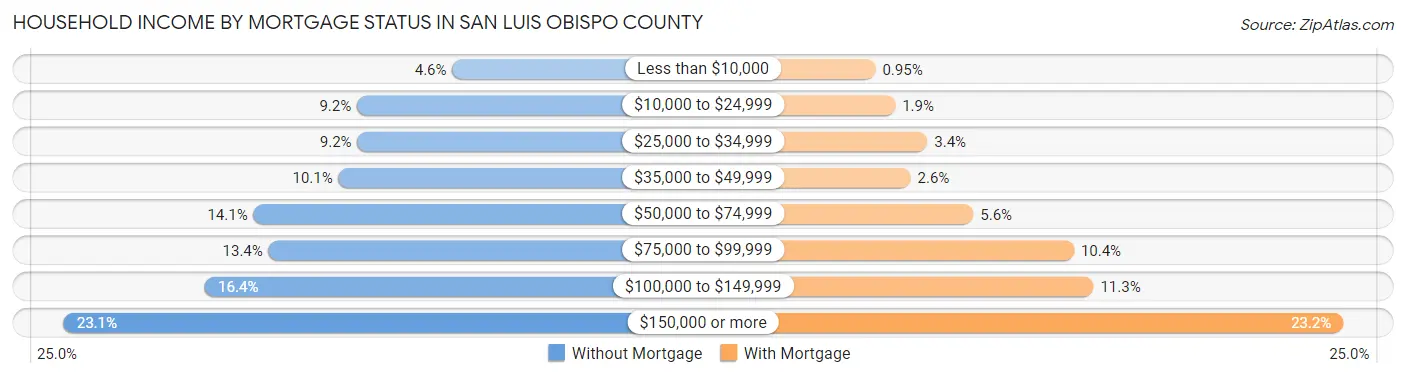
| Household Income | Without Mortgage | With Mortgage |
| Less than $10,000 | 1,129 (4.6%) | 406 (0.9%) |
| $10,000 to $24,999 | 2,236 (9.2%) | 808 (1.9%) |
| $25,000 to $34,999 | 2,230 (9.1%) | 1,459 (3.4%) |
| $35,000 to $49,999 | 2,449 (10.1%) | 1,119 (2.6%) |
| $50,000 to $74,999 | 3,436 (14.1%) | 2,391 (5.6%) |
| $75,000 to $99,999 | 3,261 (13.4%) | 4,435 (10.4%) |
| $100,000 to $149,999 | 3,997 (16.4%) | 4,831 (11.3%) |
| $150,000 or more | 5,639 (23.1%) | 9,905 (23.2%) |
| Total | 24,377 (100.0%) | 42,654 (100.0%) |
Property Value to Household Income Ratio in San Luis Obispo County
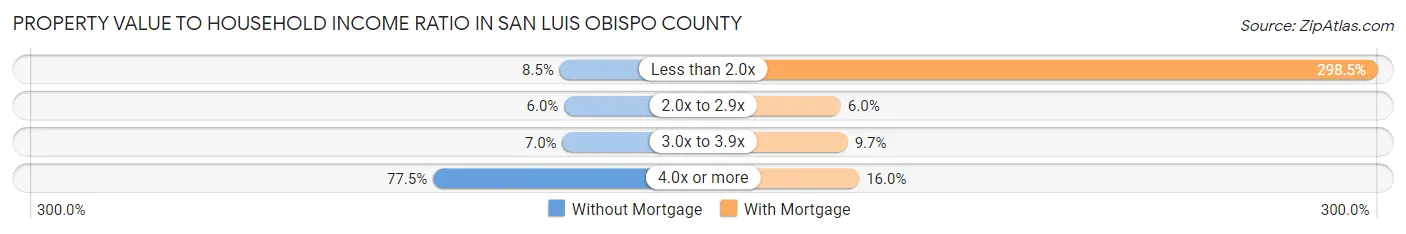
| Value-to-Income Ratio | Without Mortgage | With Mortgage |
| Less than 2.0x | 2,060 (8.5%) | 127,322 (298.5%) |
| 2.0x to 2.9x | 1,464 (6.0%) | 2,551 (6.0%) |
| 3.0x to 3.9x | 1,694 (7.0%) | 4,129 (9.7%) |
| 4.0x or more | 18,882 (77.5%) | 6,817 (16.0%) |
| Total | 24,377 (100.0%) | 42,654 (100.0%) |
Real Estate Taxes by Mortgage Status in San Luis Obispo County
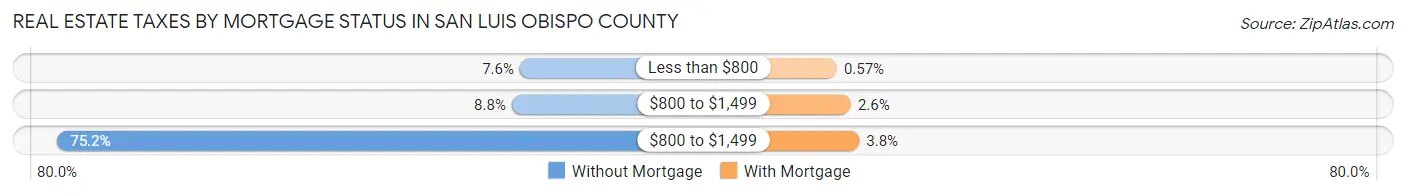
| Property Taxes | Without Mortgage | With Mortgage |
| Less than $800 | 1,863 (7.6%) | 242 (0.6%) |
| $800 to $1,499 | 2,151 (8.8%) | 1,119 (2.6%) |
| $800 to $1,499 | 18,336 (75.2%) | 1,639 (3.8%) |
| Total | 24,377 (100.0%) | 42,654 (100.0%) |
Health & Disability in San Luis Obispo County
Health Insurance Coverage by Age in San Luis Obispo County
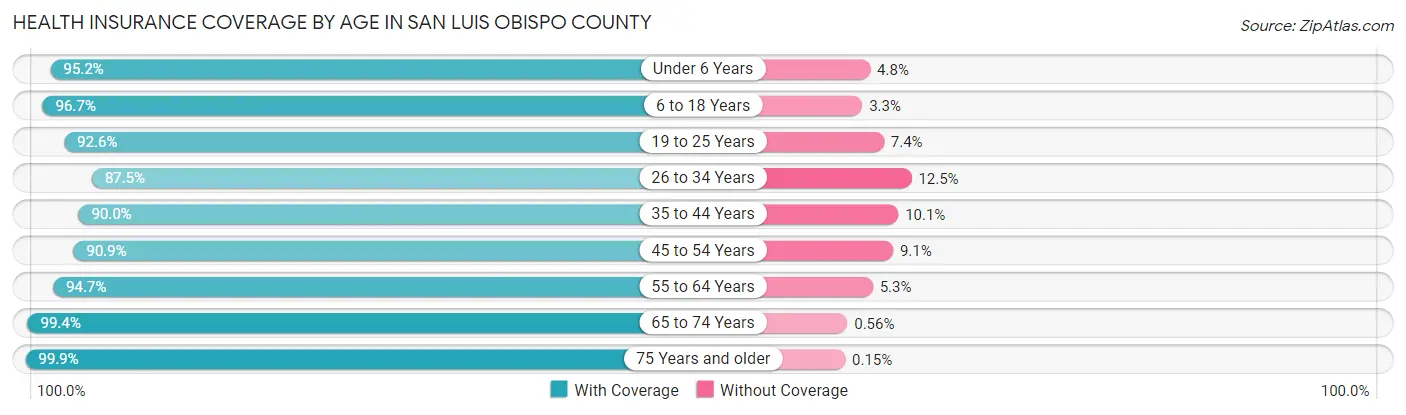
| Age Bracket | With Coverage | Without Coverage |
| Under 6 Years | 14,626 (95.2%) | 741 (4.8%) |
| 6 to 18 Years | 38,649 (96.7%) | 1,335 (3.3%) |
| 19 to 25 Years | 36,031 (92.6%) | 2,865 (7.4%) |
| 26 to 34 Years | 24,055 (87.5%) | 3,443 (12.5%) |
| 35 to 44 Years | 27,834 (89.9%) | 3,109 (10.1%) |
| 45 to 54 Years | 26,191 (90.9%) | 2,617 (9.1%) |
| 55 to 64 Years | 34,618 (94.7%) | 1,938 (5.3%) |
| 65 to 74 Years | 34,852 (99.4%) | 195 (0.6%) |
| 75 Years and older | 23,263 (99.9%) | 36 (0.2%) |
| Total | 260,119 (94.1%) | 16,279 (5.9%) |
Health Insurance Coverage by Citizenship Status in San Luis Obispo County
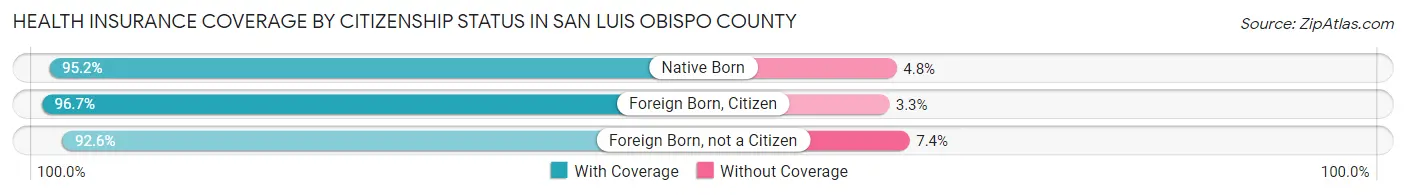
| Citizenship Status | With Coverage | Without Coverage |
| Native Born | 14,626 (95.2%) | 741 (4.8%) |
| Foreign Born, Citizen | 38,649 (96.7%) | 1,335 (3.3%) |
| Foreign Born, not a Citizen | 36,031 (92.6%) | 2,865 (7.4%) |
Health Insurance Coverage by Household Income in San Luis Obispo County
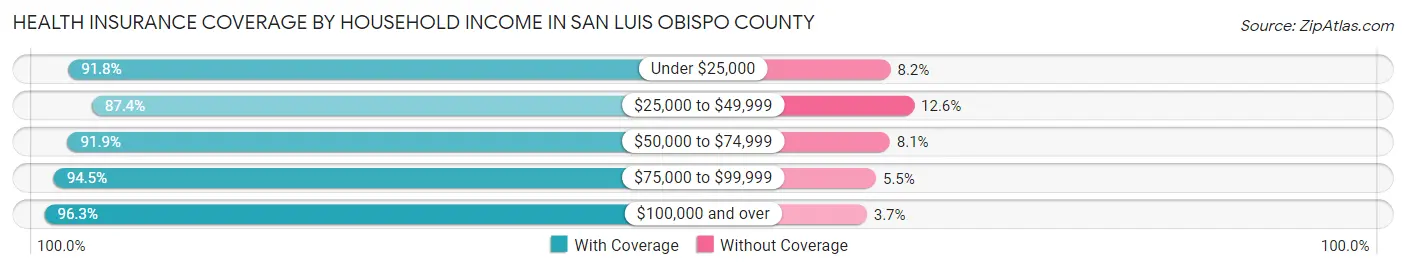
| Household Income | With Coverage | Without Coverage |
| Under $25,000 | 21,911 (91.8%) | 1,957 (8.2%) |
| $25,000 to $49,999 | 29,702 (87.4%) | 4,286 (12.6%) |
| $50,000 to $74,999 | 31,939 (91.9%) | 2,802 (8.1%) |
| $75,000 to $99,999 | 28,831 (94.5%) | 1,671 (5.5%) |
| $100,000 and over | 138,365 (96.3%) | 5,374 (3.7%) |
Public vs Private Health Insurance Coverage by Age in San Luis Obispo County
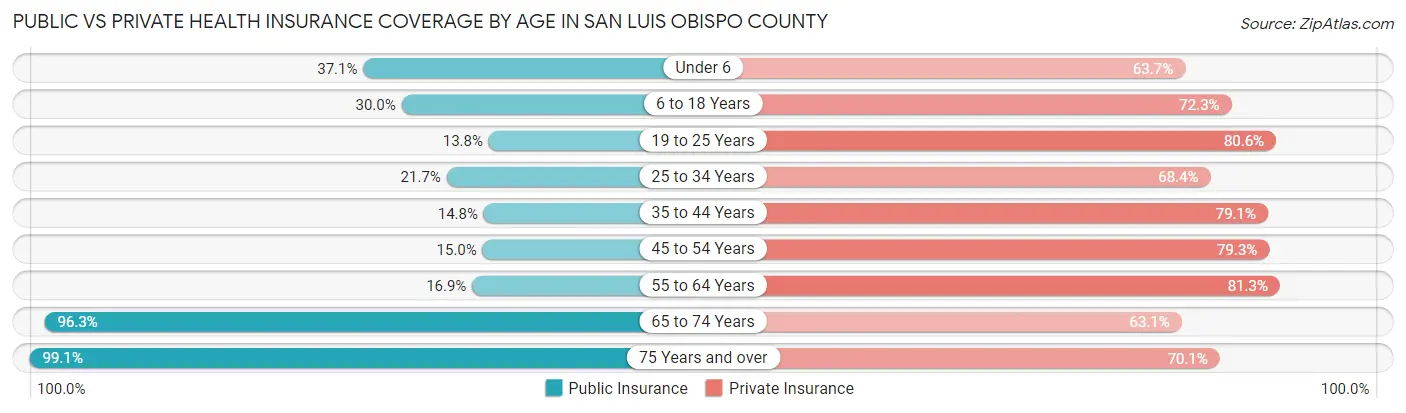
| Age Bracket | Public Insurance | Private Insurance |
| Under 6 | 5,705 (37.1%) | 9,788 (63.7%) |
| 6 to 18 Years | 12,008 (30.0%) | 28,911 (72.3%) |
| 19 to 25 Years | 5,382 (13.8%) | 31,343 (80.6%) |
| 25 to 34 Years | 5,956 (21.7%) | 18,812 (68.4%) |
| 35 to 44 Years | 4,569 (14.8%) | 24,467 (79.1%) |
| 45 to 54 Years | 4,319 (15.0%) | 22,851 (79.3%) |
| 55 to 64 Years | 6,186 (16.9%) | 29,713 (81.3%) |
| 65 to 74 Years | 33,754 (96.3%) | 22,106 (63.1%) |
| 75 Years and over | 23,086 (99.1%) | 16,343 (70.1%) |
| Total | 100,965 (36.5%) | 204,334 (73.9%) |
Disability Status by Sex by Age in San Luis Obispo County
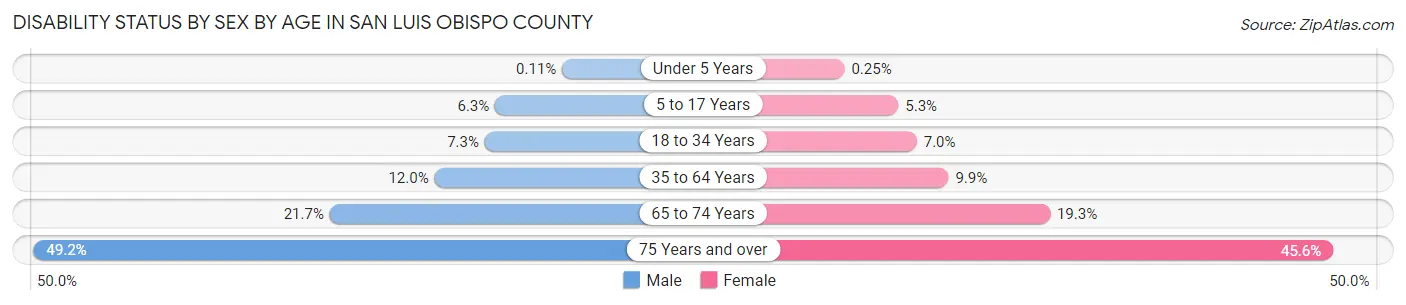
| Age Bracket | Male | Female |
| Under 5 Years | 7 (0.1%) | 16 (0.3%) |
| 5 to 17 Years | 1,184 (6.3%) | 939 (5.2%) |
| 18 to 34 Years | 2,788 (7.3%) | 2,404 (7.0%) |
| 35 to 64 Years | 5,723 (12.0%) | 4,795 (9.9%) |
| 65 to 74 Years | 3,604 (21.7%) | 3,560 (19.3%) |
| 75 Years and over | 5,080 (49.2%) | 5,913 (45.6%) |
Disability Class by Sex by Age in San Luis Obispo County
Disability Class: Hearing Difficulty
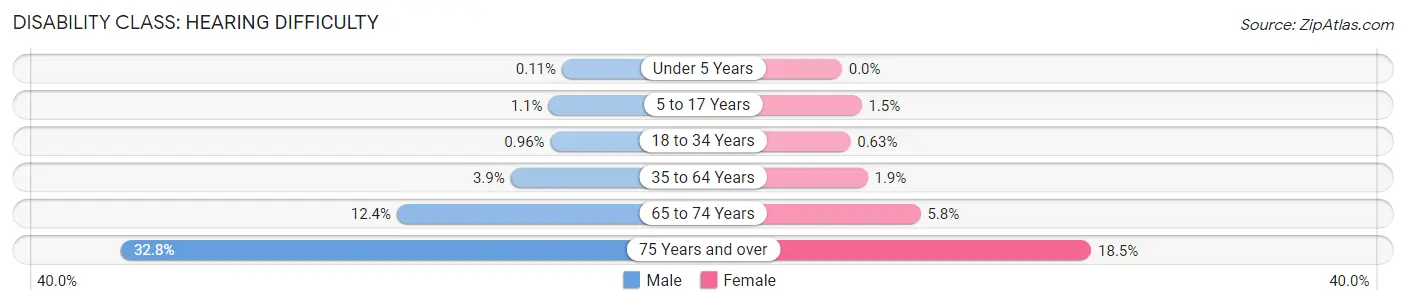
| Age Bracket | Male | Female |
| Under 5 Years | 7 (0.1%) | 0 (0.0%) |
| 5 to 17 Years | 210 (1.1%) | 261 (1.5%) |
| 18 to 34 Years | 367 (1.0%) | 216 (0.6%) |
| 35 to 64 Years | 1,875 (3.9%) | 927 (1.9%) |
| 65 to 74 Years | 2,054 (12.4%) | 1,076 (5.8%) |
| 75 Years and over | 3,392 (32.8%) | 2,400 (18.5%) |
Disability Class: Vision Difficulty
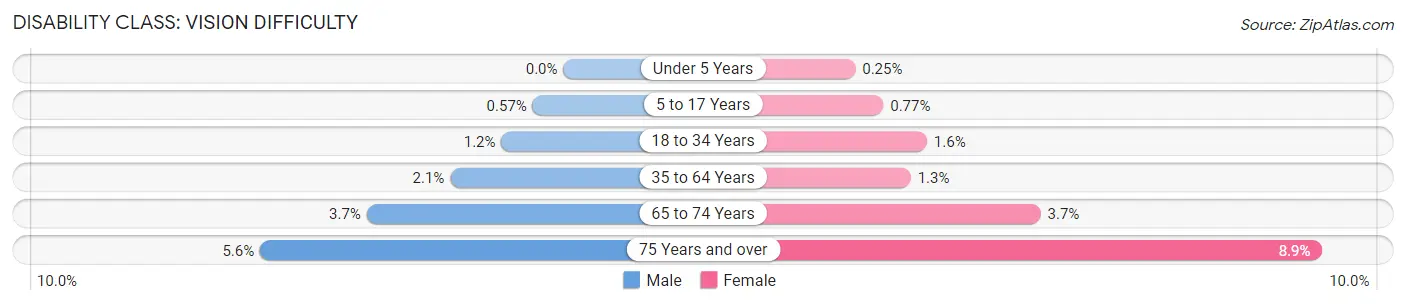
| Age Bracket | Male | Female |
| Under 5 Years | 0 (0.0%) | 16 (0.3%) |
| 5 to 17 Years | 107 (0.6%) | 138 (0.8%) |
| 18 to 34 Years | 441 (1.1%) | 547 (1.6%) |
| 35 to 64 Years | 1,004 (2.1%) | 620 (1.3%) |
| 65 to 74 Years | 607 (3.6%) | 679 (3.7%) |
| 75 Years and over | 582 (5.6%) | 1,157 (8.9%) |
Disability Class: Cognitive Difficulty
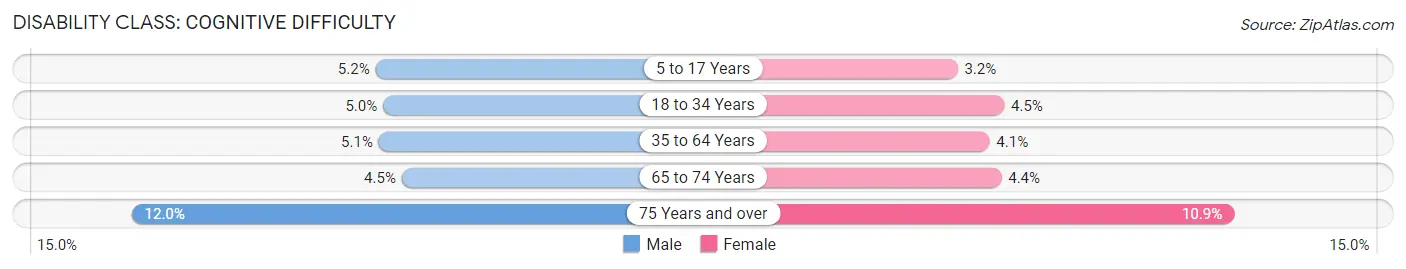
| Age Bracket | Male | Female |
| 5 to 17 Years | 978 (5.2%) | 575 (3.2%) |
| 18 to 34 Years | 1,918 (5.0%) | 1,561 (4.5%) |
| 35 to 64 Years | 2,459 (5.1%) | 1,990 (4.1%) |
| 65 to 74 Years | 748 (4.5%) | 818 (4.4%) |
| 75 Years and over | 1,242 (12.0%) | 1,416 (10.9%) |
Disability Class: Ambulatory Difficulty
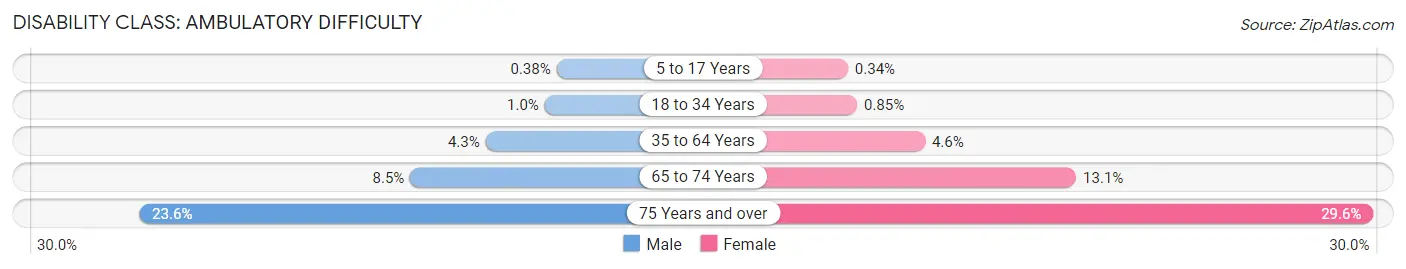
| Age Bracket | Male | Female |
| 5 to 17 Years | 71 (0.4%) | 61 (0.3%) |
| 18 to 34 Years | 399 (1.0%) | 295 (0.9%) |
| 35 to 64 Years | 2,072 (4.3%) | 2,245 (4.6%) |
| 65 to 74 Years | 1,417 (8.5%) | 2,404 (13.1%) |
| 75 Years and over | 2,440 (23.6%) | 3,838 (29.6%) |
Disability Class: Self-Care Difficulty
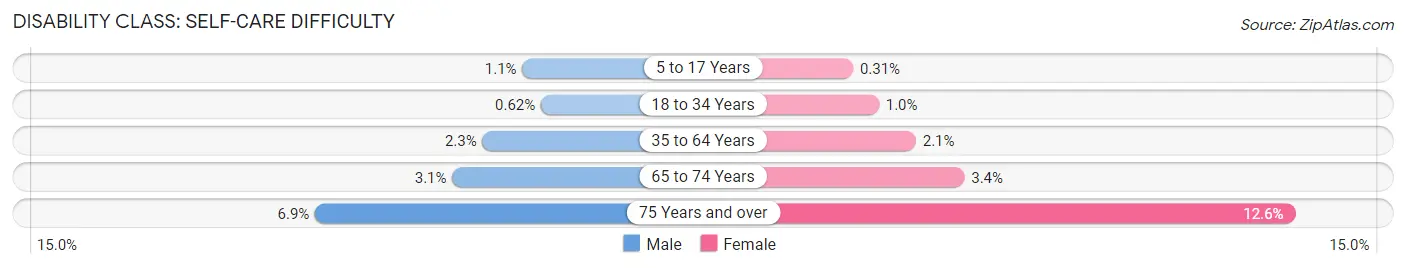
| Age Bracket | Male | Female |
| 5 to 17 Years | 214 (1.1%) | 55 (0.3%) |
| 18 to 34 Years | 236 (0.6%) | 356 (1.0%) |
| 35 to 64 Years | 1,076 (2.2%) | 997 (2.1%) |
| 65 to 74 Years | 514 (3.1%) | 629 (3.4%) |
| 75 Years and over | 714 (6.9%) | 1,638 (12.6%) |
Technology Access in San Luis Obispo County
Computing Device Access in San Luis Obispo County
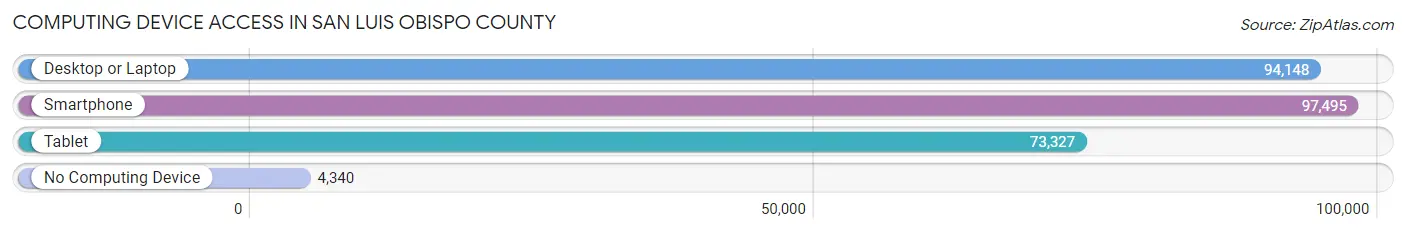
| Device Type | # Households | % Households |
| Desktop or Laptop | 94,148 | 87.1% |
| Smartphone | 97,495 | 90.2% |
| Tablet | 73,327 | 67.8% |
| No Computing Device | 4,340 | 4.0% |
| Total | 108,099 | 100.0% |
Internet Access in San Luis Obispo County
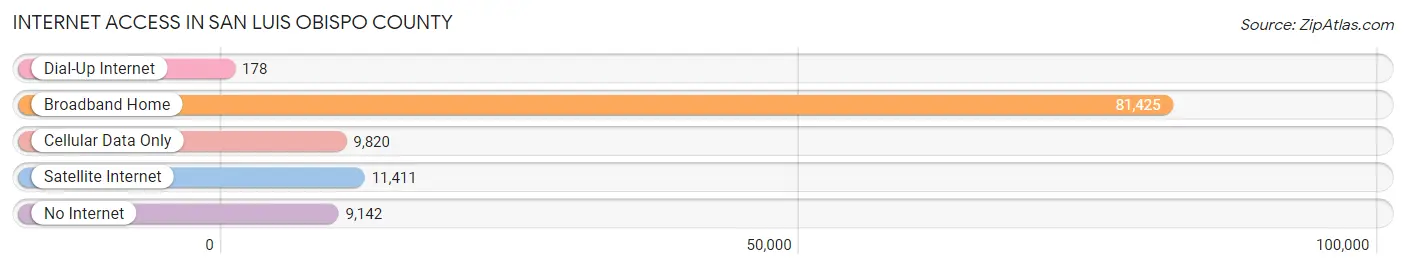
| Internet Type | # Households | % Households |
| Dial-Up Internet | 178 | 0.2% |
| Broadband Home | 81,425 | 75.3% |
| Cellular Data Only | 9,820 | 9.1% |
| Satellite Internet | 11,411 | 10.6% |
| No Internet | 9,142 | 8.5% |
| Total | 108,099 | 100.0% |
San Luis Obispo County Summary
San Luis Obispo County is located on the Central Coast of California, between Los Angeles and San Francisco. It is bordered by Santa Barbara County to the south, Monterey County to the north, and Kern County to the east. The county seat is San Luis Obispo, and the largest city is Paso Robles. The county covers an area of 3,304 square miles and has a population of 282,238 as of the 2020 census.
History
San Luis Obispo County was originally inhabited by the Chumash people, who lived in the area for thousands of years before the arrival of Europeans. The first Europeans to explore the area were Spanish missionaries, who arrived in 1769. The area was named after Saint Louis of Toulouse, and the county was officially established in 1850.
The county was largely rural until the 20th century, when the population began to grow rapidly due to the development of the oil industry and the growth of the military presence in the area. The county experienced a population boom in the 1950s and 1960s, and the population has continued to grow since then.
Geography
San Luis Obispo County is located on the Central Coast of California, between Los Angeles and San Francisco. It is bordered by Santa Barbara County to the south, Monterey County to the north, and Kern County to the east. The county covers an area of 3,304 square miles and has a population of 282,238 as of the 2020 census.
The county is divided into two distinct regions: the coastal region and the inland region. The coastal region is characterized by rolling hills, sandy beaches, and a mild climate. The inland region is more mountainous and has a more varied climate, with hot summers and cold winters.
Economy
San Luis Obispo County has a diverse economy, with a mix of agriculture, tourism, manufacturing, and technology. Agriculture is the largest sector of the economy, with the county producing a variety of crops, including grapes, strawberries, lettuce, and broccoli. Tourism is also a major industry, with the county attracting millions of visitors each year. Manufacturing is also an important part of the economy, with the county home to several large companies, including Cal Poly Corporation and Pacific Coast Producers. Technology is also a growing sector, with the county home to several tech companies, including MindBody and iFixit.
Demographics
As of the 2020 census, San Luis Obispo County had a population of 282,238. The population is predominantly white (77.3%), with smaller percentages of Hispanic or Latino (14.2%), Asian (4.2%), and African American (2.2%) residents. The median household income is $71,845, and the median age is 38.7. The county is also home to a large number of college students, with California Polytechnic State University located in San Luis Obispo.
Conclusion
San Luis Obispo County is a diverse and vibrant county located on the Central Coast of California. It has a rich history, a varied geography, and a diverse economy. The population is predominantly white, but there is a significant Hispanic or Latino population as well. The county is home to a large number of college students, and it is a popular tourist destination. San Luis Obispo County is an attractive place to live, work, and visit.
Common Questions
What is Per Capita Income in San Luis Obispo County?
Per Capita income in San Luis Obispo County is $47,390.
What is the Median Family Income in San Luis Obispo County?
Median Family Income in San Luis Obispo County is $114,196.
What is the Median Household income in San Luis Obispo County?
Median Household Income in San Luis Obispo County is $90,158.
What is Income or Wage Gap in San Luis Obispo County?
Income or Wage Gap in San Luis Obispo County is 28.3%.
Women in San Luis Obispo County earn 71.7 cents for every dollar earned by a man.
What is Family Income Deficit in San Luis Obispo County?
Family Income Deficit in San Luis Obispo County is $10,479.
Families that are below poverty line in San Luis Obispo County earn $10,479 less on average than the poverty threshold level.
What is Inequality or Gini Index in San Luis Obispo County?
Inequality or Gini Index in San Luis Obispo County is 0.47.
What is the Total Population of San Luis Obispo County?
Total Population of San Luis Obispo County is 281,712.
What is the Total Male Population of San Luis Obispo County?
Total Male Population of San Luis Obispo County is 142,477.
What is the Total Female Population of San Luis Obispo County?
Total Female Population of San Luis Obispo County is 139,235.
What is the Ratio of Males per 100 Females in San Luis Obispo County?
There are 102.33 Males per 100 Females in San Luis Obispo County.
What is the Ratio of Females per 100 Males in San Luis Obispo County?
There are 97.72 Females per 100 Males in San Luis Obispo County.
What is the Median Population Age in San Luis Obispo County?
Median Population Age in San Luis Obispo County is 40.0 Years.
What is the Average Family Size in San Luis Obispo County
Average Family Size in San Luis Obispo County is 3.0 People.
What is the Average Household Size in San Luis Obispo County
Average Household Size in San Luis Obispo County is 2.5 People.
How Large is the Labor Force in San Luis Obispo County?
There are 139,744 People in the Labor Forcein in San Luis Obispo County.
What is the Percentage of People in the Labor Force in San Luis Obispo County?
58.6% of People are in the Labor Force in San Luis Obispo County.
What is the Unemployment Rate in San Luis Obispo County?
Unemployment Rate in San Luis Obispo County is 5.0%.