Plumas County, CA Map & Demographics
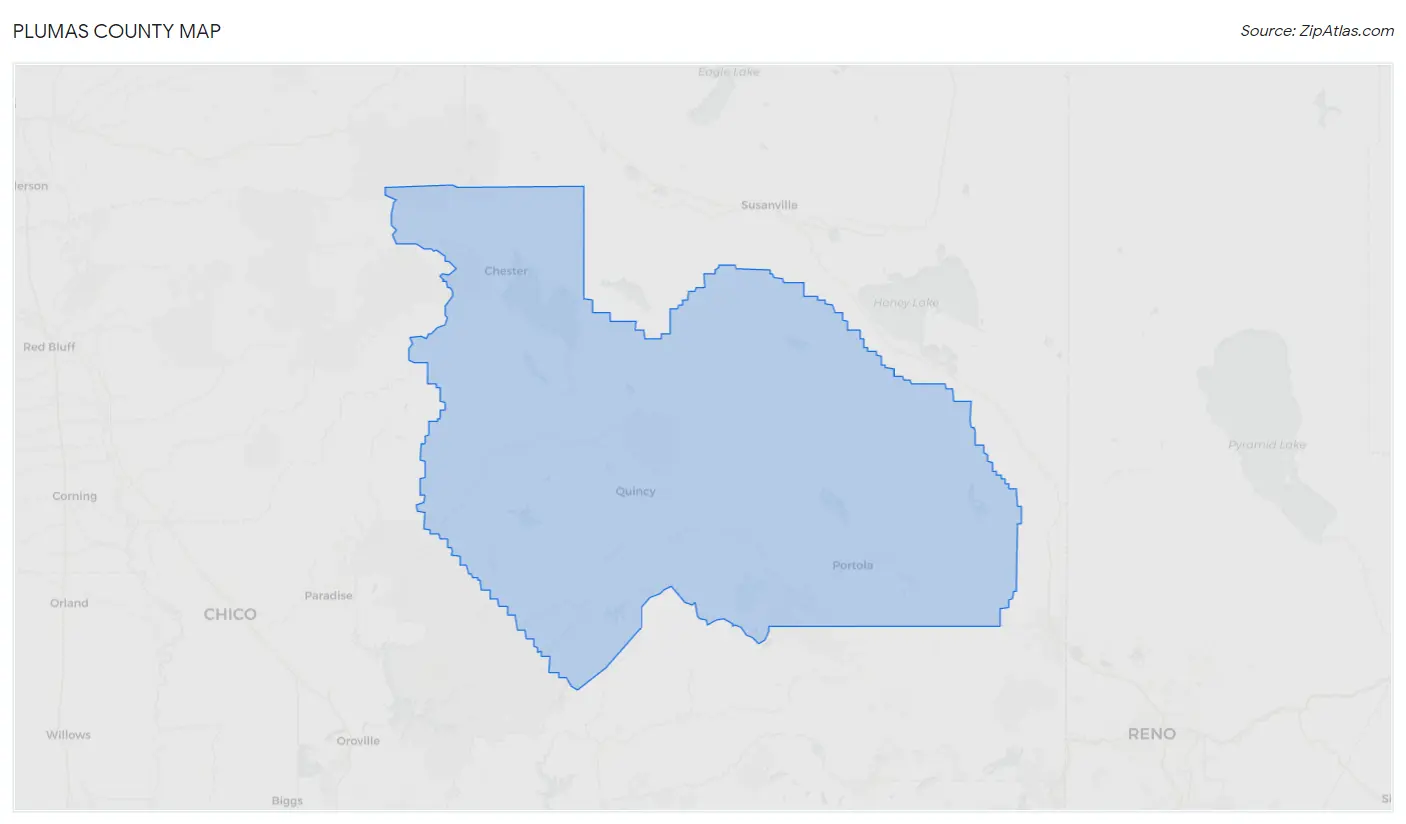
Plumas County Map
Plumas County Overview
$41,701
PER CAPITA INCOME
$86,990
AVG FAMILY INCOME
$67,885
AVG HOUSEHOLD INCOME
25.5%
WAGE / INCOME GAP [ % ]
74.5¢/ $1
WAGE / INCOME GAP [ $ ]
0.47
INEQUALITY / GINI INDEX
19,650
TOTAL POPULATION
10,167
MALE POPULATION
9,483
FEMALE POPULATION
107.21
MALES / 100 FEMALES
93.27
FEMALES / 100 MALES
52.3
MEDIAN AGE
2.9
AVG FAMILY SIZE
2.4
AVG HOUSEHOLD SIZE
8,342
LABOR FORCE [ PEOPLE ]
50.0%
PERCENT IN LABOR FORCE
8.0%
UNEMPLOYMENT RATE
Plumas County Area Codes
Income in Plumas County
Income Overview in Plumas County
Per Capita Income in Plumas County is $41,701, while median incomes of families and households are $86,990 and $67,885 respectively.
| Characteristic | Number | Measure |
| Per Capita Income | 19,650 | $41,701 |
| Median Family Income | 5,153 | $86,990 |
| Mean Family Income | 5,153 | $116,388 |
| Median Household Income | 8,104 | $67,885 |
| Mean Household Income | 8,104 | $95,940 |
| Income Deficit | 5,153 | $0 |
| Wage / Income Gap (%) | 19,650 | 25.53% |
| Wage / Income Gap ($) | 19,650 | 74.47¢ per $1 |
| Gini / Inequality Index | 19,650 | 0.47 |
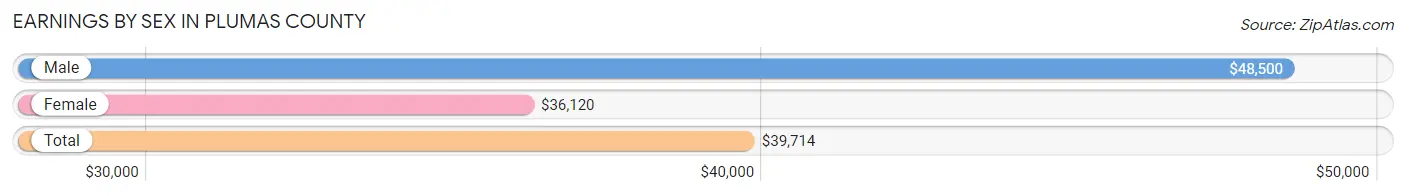
Earnings by Sex in Plumas County
Average Earnings in Plumas County are $39,714, $48,500 for men and $36,120 for women, a difference of 25.5%.
| Sex | Number | Average Earnings |
| Male | 4,608 (52.1%) | $48,500 |
| Female | 4,228 (47.8%) | $36,120 |
| Total | 8,836 (100.0%) | $39,714 |
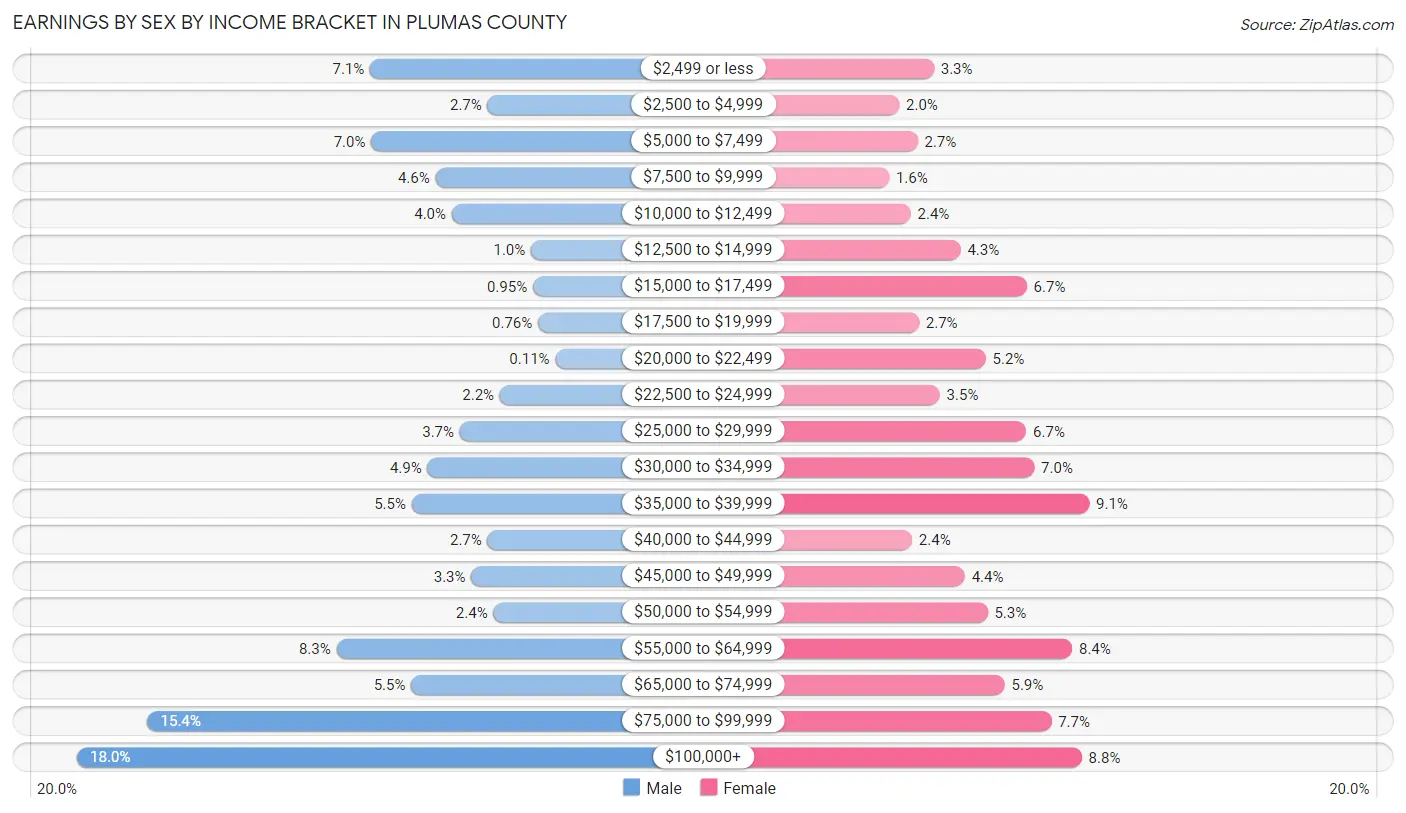
Earnings by Sex by Income Bracket in Plumas County
The most common earnings brackets in Plumas County are $100,000+ for men (831 | 18.0%) and $35,000 to $39,999 for women (384 | 9.1%).
| Income | Male | Female |
| $2,499 or less | 325 (7.0%) | 138 (3.3%) |
| $2,500 to $4,999 | 122 (2.6%) | 83 (2.0%) |
| $5,000 to $7,499 | 323 (7.0%) | 112 (2.6%) |
| $7,500 to $9,999 | 212 (4.6%) | 67 (1.6%) |
| $10,000 to $12,499 | 184 (4.0%) | 101 (2.4%) |
| $12,500 to $14,999 | 47 (1.0%) | 180 (4.3%) |
| $15,000 to $17,499 | 44 (0.9%) | 285 (6.7%) |
| $17,500 to $19,999 | 35 (0.8%) | 114 (2.7%) |
| $20,000 to $22,499 | 5 (0.1%) | 220 (5.2%) |
| $22,500 to $24,999 | 101 (2.2%) | 147 (3.5%) |
| $25,000 to $29,999 | 170 (3.7%) | 284 (6.7%) |
| $30,000 to $34,999 | 226 (4.9%) | 297 (7.0%) |
| $35,000 to $39,999 | 253 (5.5%) | 384 (9.1%) |
| $40,000 to $44,999 | 122 (2.6%) | 103 (2.4%) |
| $45,000 to $49,999 | 150 (3.3%) | 187 (4.4%) |
| $50,000 to $54,999 | 112 (2.4%) | 223 (5.3%) |
| $55,000 to $64,999 | 383 (8.3%) | 357 (8.4%) |
| $65,000 to $74,999 | 254 (5.5%) | 250 (5.9%) |
| $75,000 to $99,999 | 709 (15.4%) | 324 (7.7%) |
| $100,000+ | 831 (18.0%) | 372 (8.8%) |
| Total | 4,608 (100.0%) | 4,228 (100.0%) |
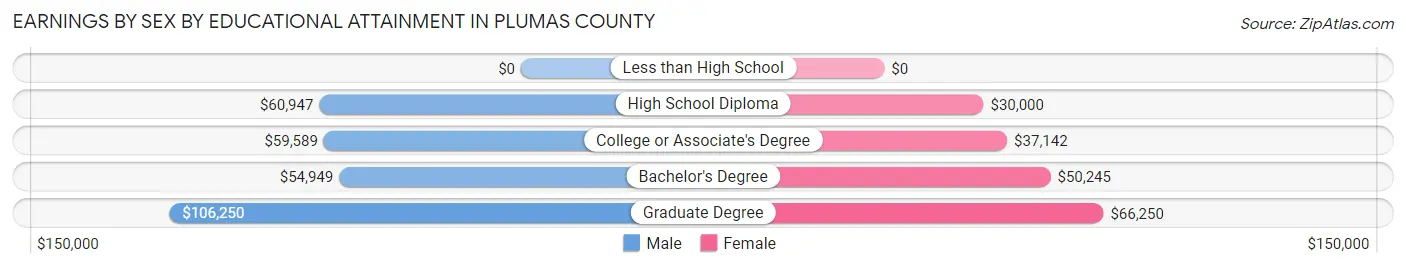
Earnings by Sex by Educational Attainment in Plumas County
Average earnings in Plumas County are $58,260 for men and $37,656 for women, a difference of 35.4%. Men with an educational attainment of graduate degree enjoy the highest average annual earnings of $106,250, while those with bachelor's degree education earn the least with $54,949. Women with an educational attainment of graduate degree earn the most with the average annual earnings of $66,250, while those with high school diploma education have the smallest earnings of $30,000.
| Educational Attainment | Male Income | Female Income |
| Less than High School | - | - |
| High School Diploma | $60,947 | $30,000 |
| College or Associate's Degree | $59,589 | $37,142 |
| Bachelor's Degree | $54,949 | $50,245 |
| Graduate Degree | $106,250 | $66,250 |
| Total | $58,260 | $37,656 |
Family Income in Plumas County
Family Income Brackets in Plumas County
According to the Plumas County family income data, there are 1,108 families falling into the $100,000 to $149,999 income range, which is the most common income bracket and makes up 21.5% of all families. Conversely, the $10,000 to $14,999 income bracket is the least frequent group with only 46 families (0.9%) belonging to this category.
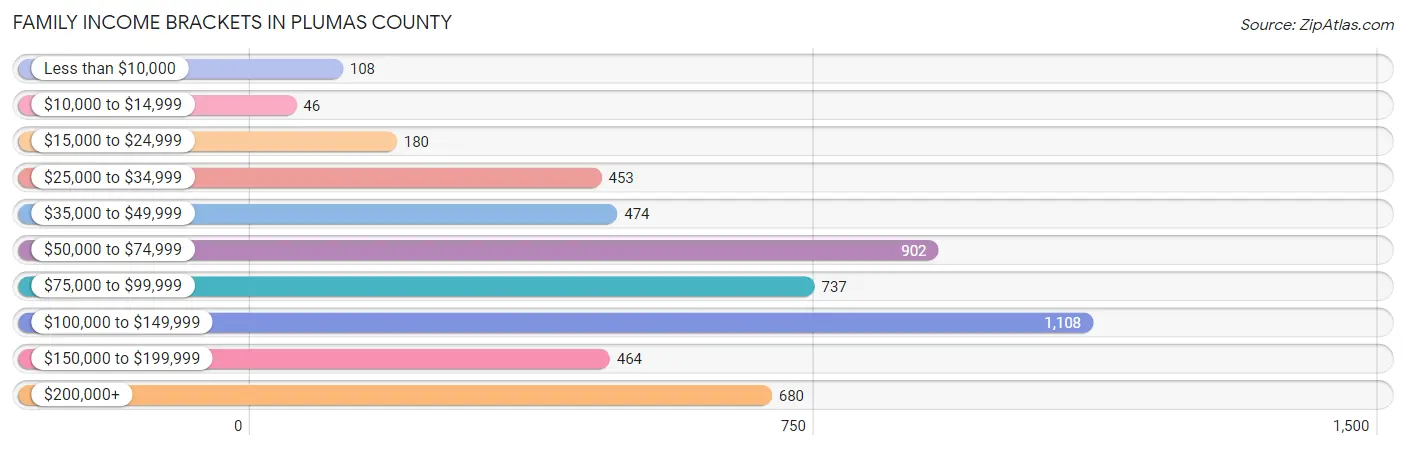
| Income Bracket | # Families | % Families |
| Less than $10,000 | 108 | 2.1% |
| $10,000 to $14,999 | 46 | 0.9% |
| $15,000 to $24,999 | 180 | 3.5% |
| $25,000 to $34,999 | 453 | 8.8% |
| $35,000 to $49,999 | 474 | 9.2% |
| $50,000 to $74,999 | 902 | 17.5% |
| $75,000 to $99,999 | 737 | 14.3% |
| $100,000 to $149,999 | 1,108 | 21.5% |
| $150,000 to $199,999 | 464 | 9.0% |
| $200,000+ | 680 | 13.2% |
Family Income by Famaliy Size in Plumas County
4-person families (569 | 11.0%) account for the highest median family income in Plumas County with $113,027 per family, while 2-person families (2,953 | 57.3%) have the highest median income of $40,955 per family member.
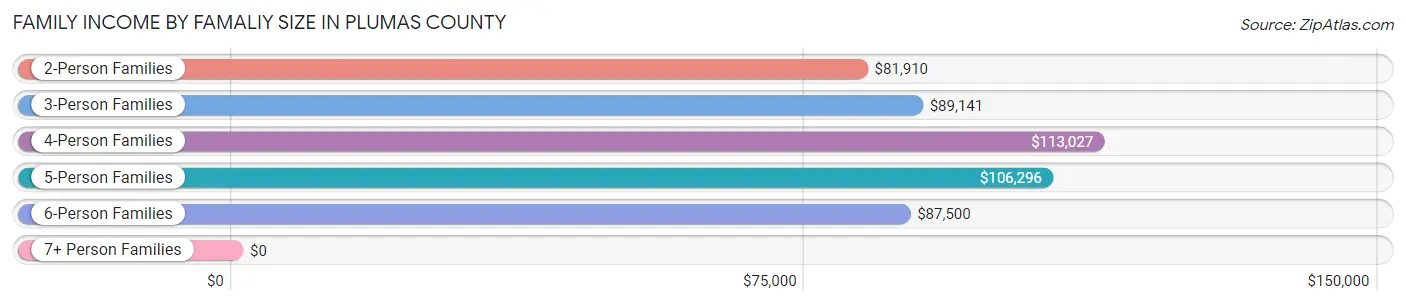
| Income Bracket | # Families | Median Income |
| 2-Person Families | 2,953 (57.3%) | $81,910 |
| 3-Person Families | 1,325 (25.7%) | $89,141 |
| 4-Person Families | 569 (11.0%) | $113,027 |
| 5-Person Families | 214 (4.2%) | $106,296 |
| 6-Person Families | 72 (1.4%) | $87,500 |
| 7+ Person Families | 20 (0.4%) | $0 |
| Total | 5,153 (100.0%) | $86,990 |
Family Income by Number of Earners in Plumas County
The median family income in Plumas County is $86,990, with families comprising 3+ earners (314) having the highest median family income of $168,421, while families with no earners (1,459) have the lowest median family income of $56,250, accounting for 6.1% and 28.3% of families, respectively.
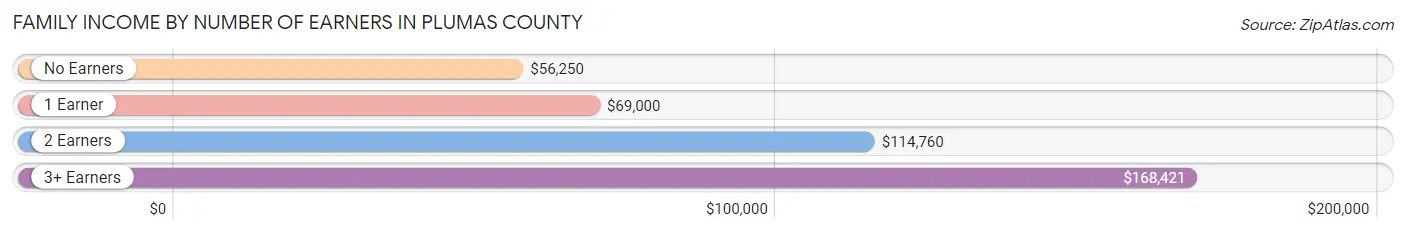
| Number of Earners | # Families | Median Income |
| No Earners | 1,459 (28.3%) | $56,250 |
| 1 Earner | 1,598 (31.0%) | $69,000 |
| 2 Earners | 1,782 (34.6%) | $114,760 |
| 3+ Earners | 314 (6.1%) | $168,421 |
| Total | 5,153 (100.0%) | $86,990 |
Household Income in Plumas County
Household Income Brackets in Plumas County
With 1,378 households falling in the category, the $50,000 to $74,999 income range is the most frequent in Plumas County, accounting for 17.0% of all households. In contrast, only 203 households (2.5%) fall into the $10,000 to $14,999 income bracket, making it the least populous group.
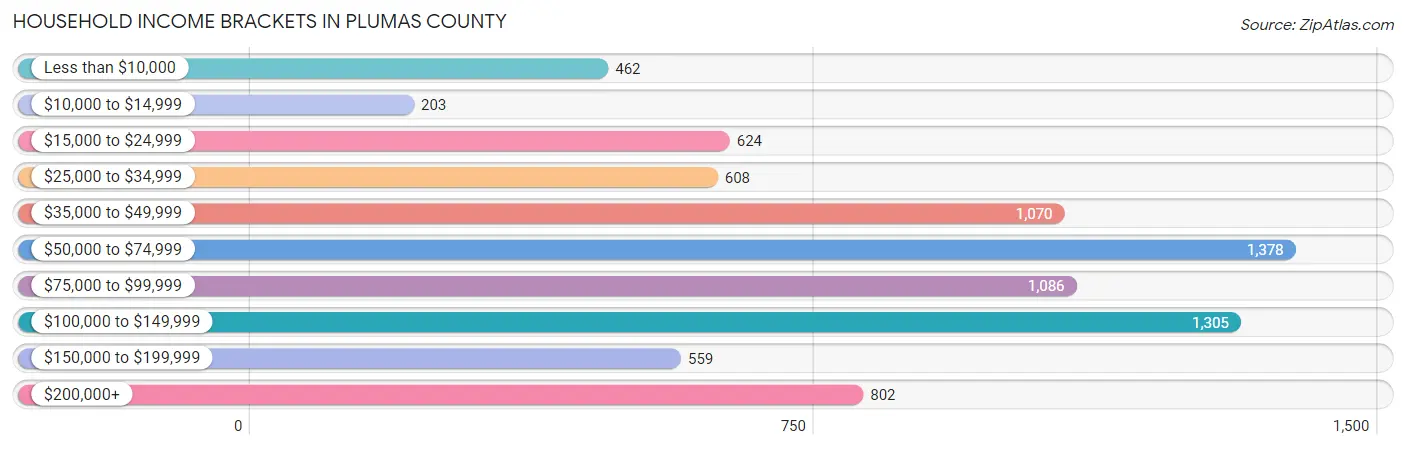
| Income Bracket | # Households | % Households |
| Less than $10,000 | 462 | 5.7% |
| $10,000 to $14,999 | 203 | 2.5% |
| $15,000 to $24,999 | 624 | 7.7% |
| $25,000 to $34,999 | 608 | 7.5% |
| $35,000 to $49,999 | 1,070 | 13.2% |
| $50,000 to $74,999 | 1,378 | 17.0% |
| $75,000 to $99,999 | 1,086 | 13.4% |
| $100,000 to $149,999 | 1,305 | 16.1% |
| $150,000 to $199,999 | 559 | 6.9% |
| $200,000+ | 802 | 9.9% |
Household Income by Householder Age in Plumas County
The median household income in Plumas County is $67,885, with the highest median household income of $88,468 found in the 45 to 64 years age bracket for the primary householder. A total of 2,812 households (34.7%) fall into this category. Meanwhile, the 15 to 24 years age bracket for the primary householder has the lowest median household income of $32,669, with 135 households (1.7%) in this group.
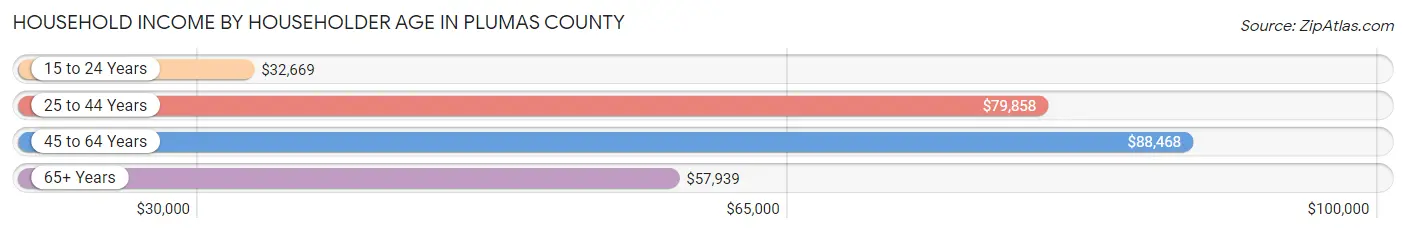
| Income Bracket | # Households | Median Income |
| 15 to 24 Years | 135 (1.7%) | $32,669 |
| 25 to 44 Years | 1,649 (20.3%) | $79,858 |
| 45 to 64 Years | 2,812 (34.7%) | $88,468 |
| 65+ Years | 3,508 (43.3%) | $57,939 |
| Total | 8,104 (100.0%) | $67,885 |
Poverty in Plumas County
Income Below Poverty by Sex and Age in Plumas County
With 9.5% poverty level for males and 12.3% for females among the residents of Plumas County, 5 year old males and 5 year old females are the most vulnerable to poverty, with 42 males (80.8%) and 24 females (66.7%) in their respective age groups living below the poverty level.
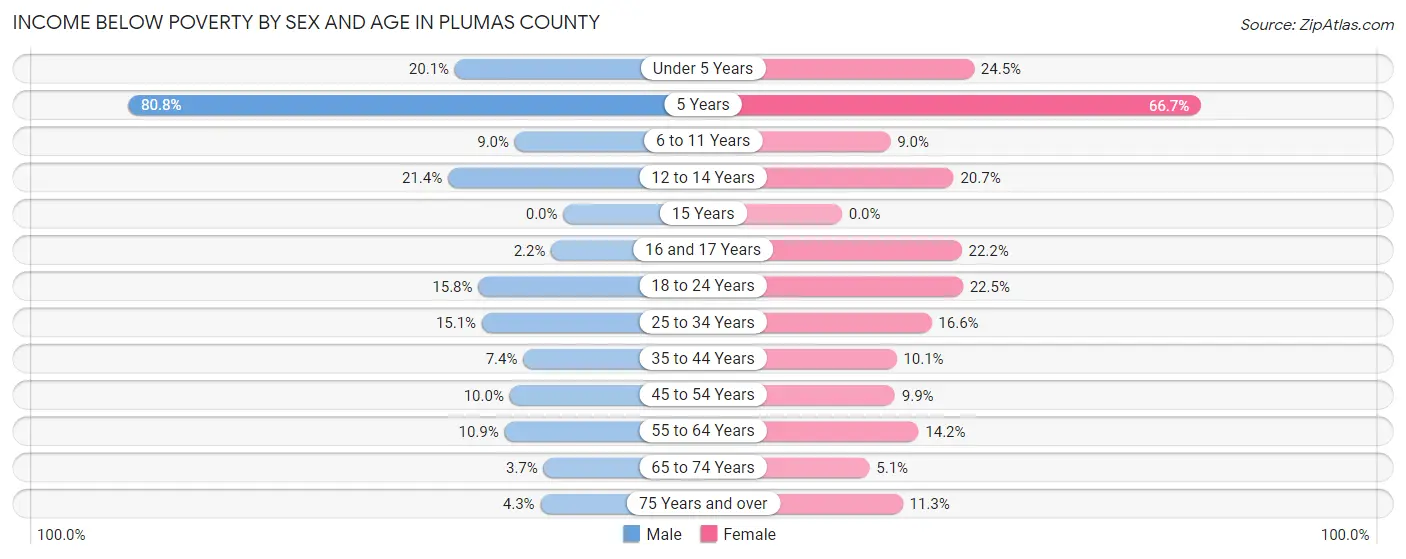
| Age Bracket | Male | Female |
| Under 5 Years | 93 (20.1%) | 102 (24.5%) |
| 5 Years | 42 (80.8%) | 24 (66.7%) |
| 6 to 11 Years | 63 (9.0%) | 59 (9.0%) |
| 12 to 14 Years | 49 (21.4%) | 34 (20.7%) |
| 15 Years | 0 (0.0%) | 0 (0.0%) |
| 16 and 17 Years | 7 (2.2%) | 30 (22.2%) |
| 18 to 24 Years | 74 (15.8%) | 88 (22.5%) |
| 25 to 34 Years | 152 (15.1%) | 161 (16.6%) |
| 35 to 44 Years | 67 (7.4%) | 110 (10.1%) |
| 45 to 54 Years | 97 (10.0%) | 94 (9.9%) |
| 55 to 64 Years | 184 (10.9%) | 254 (14.2%) |
| 65 to 74 Years | 72 (3.7%) | 88 (5.1%) |
| 75 Years and over | 44 (4.3%) | 113 (11.3%) |
| Total | 944 (9.5%) | 1,157 (12.3%) |
Income Above Poverty by Sex and Age in Plumas County
According to the poverty statistics in Plumas County, males aged 15 years and females aged 15 years are the age groups that are most secure financially, with 100.0% of males and 100.0% of females in these age groups living above the poverty line.
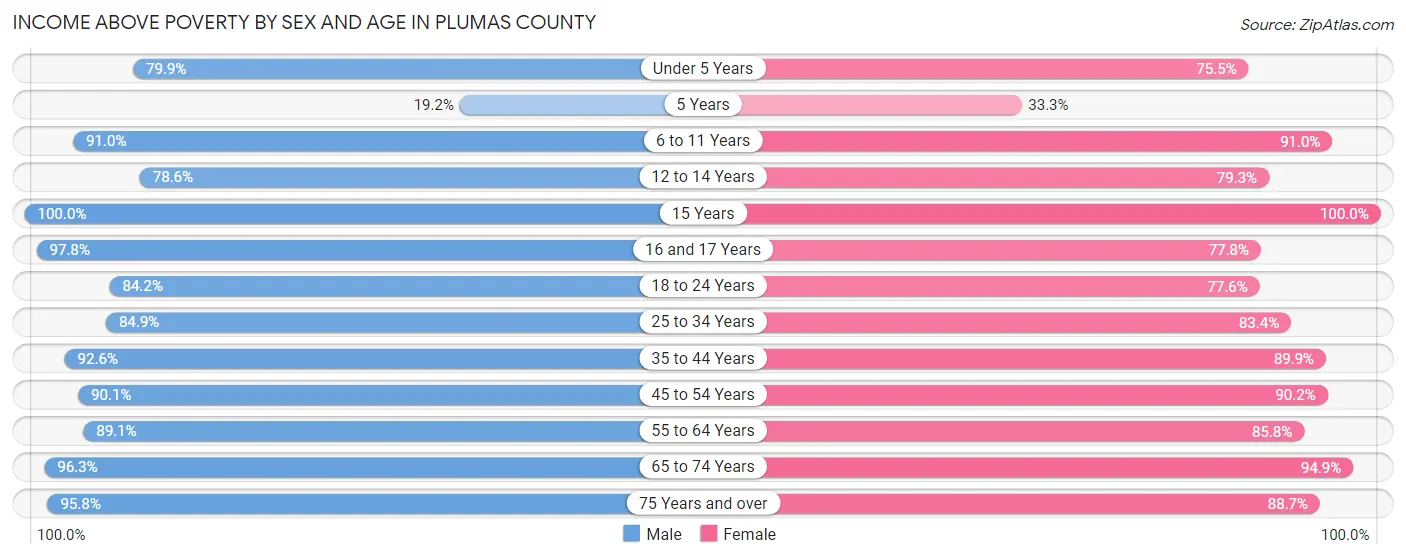
| Age Bracket | Male | Female |
| Under 5 Years | 369 (79.9%) | 314 (75.5%) |
| 5 Years | 10 (19.2%) | 12 (33.3%) |
| 6 to 11 Years | 637 (91.0%) | 598 (91.0%) |
| 12 to 14 Years | 180 (78.6%) | 130 (79.3%) |
| 15 Years | 164 (100.0%) | 49 (100.0%) |
| 16 and 17 Years | 305 (97.8%) | 105 (77.8%) |
| 18 to 24 Years | 395 (84.2%) | 304 (77.5%) |
| 25 to 34 Years | 854 (84.9%) | 807 (83.4%) |
| 35 to 44 Years | 834 (92.6%) | 975 (89.9%) |
| 45 to 54 Years | 878 (90.0%) | 860 (90.1%) |
| 55 to 64 Years | 1,503 (89.1%) | 1,534 (85.8%) |
| 65 to 74 Years | 1,896 (96.3%) | 1,635 (94.9%) |
| 75 Years and over | 992 (95.8%) | 890 (88.7%) |
| Total | 9,017 (90.5%) | 8,213 (87.6%) |
Income Below Poverty Among Married-Couple Families in Plumas County
The poverty statistics for married-couple families in Plumas County show that 2.7% or 105 of the total 3,945 families live below the poverty line. Families with 1 or 2 children have the highest poverty rate of 8.4%, comprising of 68 families. On the other hand, families with 3 or 4 children have the lowest poverty rate of 0.0%, which includes 0 families.
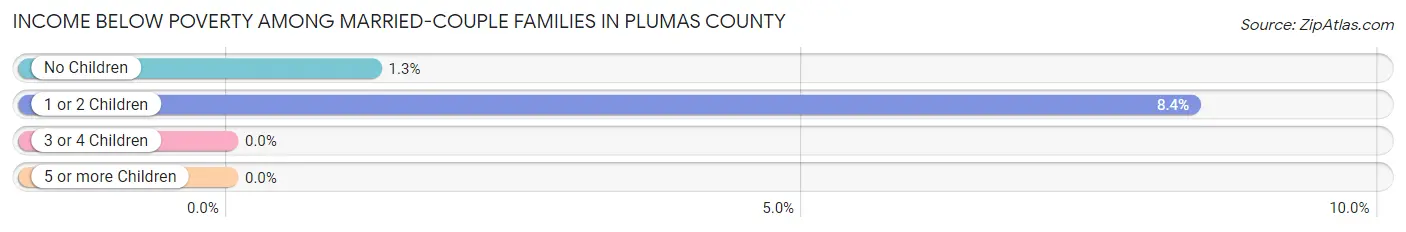
| Children | Above Poverty | Below Poverty |
| No Children | 2,922 (98.8%) | 37 (1.3%) |
| 1 or 2 Children | 743 (91.6%) | 68 (8.4%) |
| 3 or 4 Children | 155 (100.0%) | 0 (0.0%) |
| 5 or more Children | 20 (100.0%) | 0 (0.0%) |
| Total | 3,840 (97.3%) | 105 (2.7%) |
Income Below Poverty Among Single-Parent Households in Plumas County
According to the poverty data in Plumas County, 14.4% or 66 single-father households and 19.9% or 149 single-mother households are living below the poverty line. Among single-father households, those with 1 or 2 children have the highest poverty rate, with 66 households (25.0%) experiencing poverty. Likewise, among single-mother households, those with 3 or 4 children have the highest poverty rate, with 35 households (56.5%) falling below the poverty line.
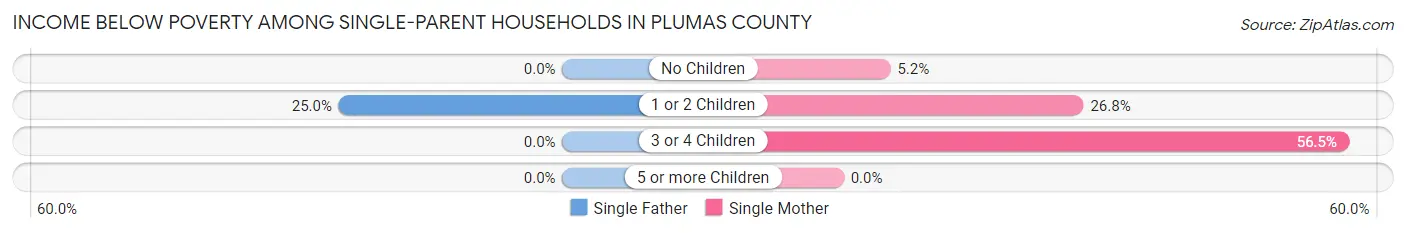
| Children | Single Father | Single Mother |
| No Children | 0 (0.0%) | 17 (5.2%) |
| 1 or 2 Children | 66 (25.0%) | 97 (26.8%) |
| 3 or 4 Children | 0 (0.0%) | 35 (56.5%) |
| 5 or more Children | 0 (0.0%) | 0 (0.0%) |
| Total | 66 (14.4%) | 149 (19.9%) |
Income Below Poverty Among Married-Couple vs Single-Parent Households in Plumas County
The poverty data for Plumas County shows that 105 of the married-couple family households (2.7%) and 215 of the single-parent households (17.8%) are living below the poverty level. Within the married-couple family households, those with 1 or 2 children have the highest poverty rate, with 68 households (8.4%) falling below the poverty line. Among the single-parent households, those with 1 or 2 children have the highest poverty rate, with 163 household (26.0%) living below poverty.
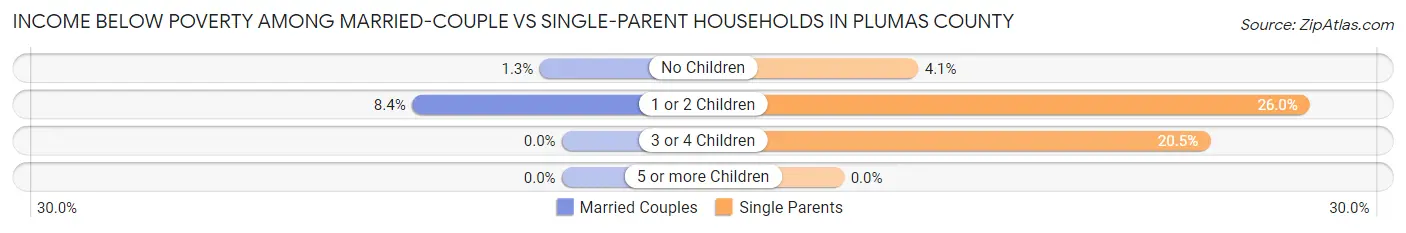
| Children | Married-Couple Families | Single-Parent Households |
| No Children | 37 (1.3%) | 17 (4.1%) |
| 1 or 2 Children | 68 (8.4%) | 163 (26.0%) |
| 3 or 4 Children | 0 (0.0%) | 35 (20.5%) |
| 5 or more Children | 0 (0.0%) | 0 (0.0%) |
| Total | 105 (2.7%) | 215 (17.8%) |
Race in Plumas County
The most populous races in Plumas County are White / Caucasian (17,247 | 87.8%), Hispanic or Latino (1,959 | 10.0%), and Two or more Races (1,422 | 7.2%).
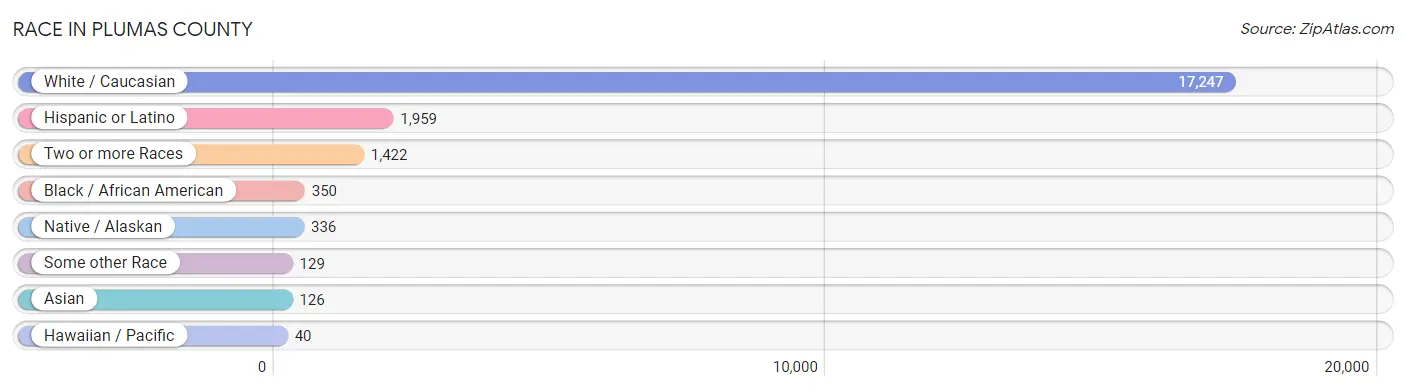
| Race | # Population | % Population |
| Asian | 126 | 0.6% |
| Black / African American | 350 | 1.8% |
| Hawaiian / Pacific | 40 | 0.2% |
| Hispanic or Latino | 1,959 | 10.0% |
| Native / Alaskan | 336 | 1.7% |
| White / Caucasian | 17,247 | 87.8% |
| Two or more Races | 1,422 | 7.2% |
| Some other Race | 129 | 0.7% |
| Total | 19,650 | 100.0% |
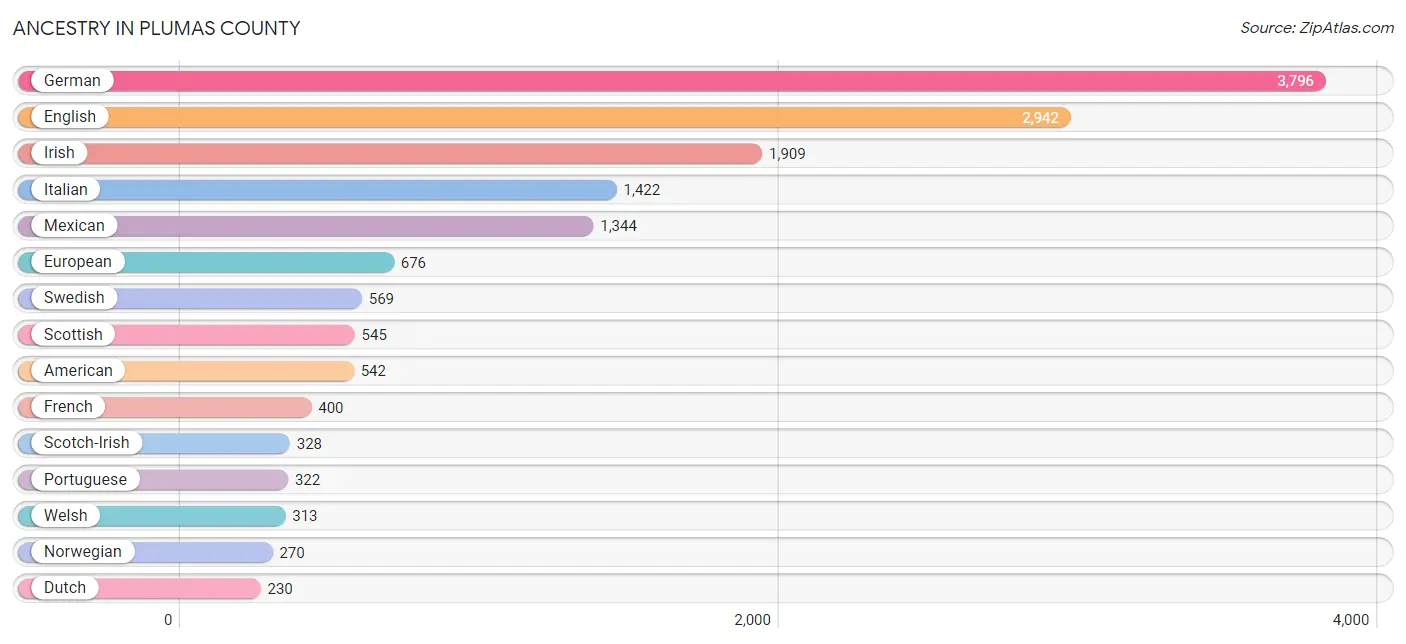
Ancestry in Plumas County
The most populous ancestries reported in Plumas County are German (3,796 | 19.3%), English (2,942 | 15.0%), Irish (1,909 | 9.7%), Italian (1,422 | 7.2%), and Mexican (1,344 | 6.8%), together accounting for 58.1% of all Plumas County residents.
| Ancestry | # Population | % Population |
| African | 46 | 0.2% |
| American | 542 | 2.8% |
| Arab | 16 | 0.1% |
| Armenian | 4 | 0.0% |
| Austrian | 42 | 0.2% |
| Basque | 11 | 0.1% |
| British | 76 | 0.4% |
| Burmese | 1 | 0.0% |
| Canadian | 203 | 1.0% |
| Central American | 124 | 0.6% |
| Cherokee | 180 | 0.9% |
| Choctaw | 84 | 0.4% |
| Czech | 177 | 0.9% |
| Czechoslovakian | 13 | 0.1% |
| Danish | 97 | 0.5% |
| Dutch | 230 | 1.2% |
| Eastern European | 111 | 0.6% |
| Ecuadorian | 24 | 0.1% |
| English | 2,942 | 15.0% |
| Estonian | 20 | 0.1% |
| European | 676 | 3.4% |
| Finnish | 32 | 0.2% |
| French | 400 | 2.0% |
| French Canadian | 122 | 0.6% |
| German | 3,796 | 19.3% |
| Greek | 59 | 0.3% |
| Guyanese | 9 | 0.1% |
| Hungarian | 125 | 0.6% |
| Indian (Asian) | 72 | 0.4% |
| Iranian | 4 | 0.0% |
| Irish | 1,909 | 9.7% |
| Italian | 1,422 | 7.2% |
| Jordanian | 1 | 0.0% |
| Korean | 68 | 0.4% |
| Latvian | 12 | 0.1% |
| Mexican | 1,344 | 6.8% |
| New Zealander | 50 | 0.3% |
| Northern European | 121 | 0.6% |
| Norwegian | 270 | 1.4% |
| Osage | 5 | 0.0% |
| Paiute | 1 | 0.0% |
| Pakistani | 3 | 0.0% |
| Palestinian | 11 | 0.1% |
| Peruvian | 4 | 0.0% |
| Pima | 115 | 0.6% |
| Polish | 200 | 1.0% |
| Portuguese | 322 | 1.6% |
| Potawatomi | 32 | 0.2% |
| Puerto Rican | 104 | 0.5% |
| Russian | 101 | 0.5% |
| Salvadoran | 124 | 0.6% |
| Samoan | 8 | 0.0% |
| Scandinavian | 207 | 1.1% |
| Scotch-Irish | 328 | 1.7% |
| Scottish | 545 | 2.8% |
| Sioux | 7 | 0.0% |
| Slovene | 3 | 0.0% |
| South American | 46 | 0.2% |
| Spaniard | 138 | 0.7% |
| Spanish | 101 | 0.5% |
| Subsaharan African | 46 | 0.2% |
| Swedish | 569 | 2.9% |
| Swiss | 82 | 0.4% |
| Syrian | 4 | 0.0% |
| Thai | 29 | 0.2% |
| Ukrainian | 8 | 0.0% |
| Venezuelan | 18 | 0.1% |
| Welsh | 313 | 1.6% |
| Yugoslavian | 11 | 0.1% | View All 69 Rows |
Immigrants in Plumas County
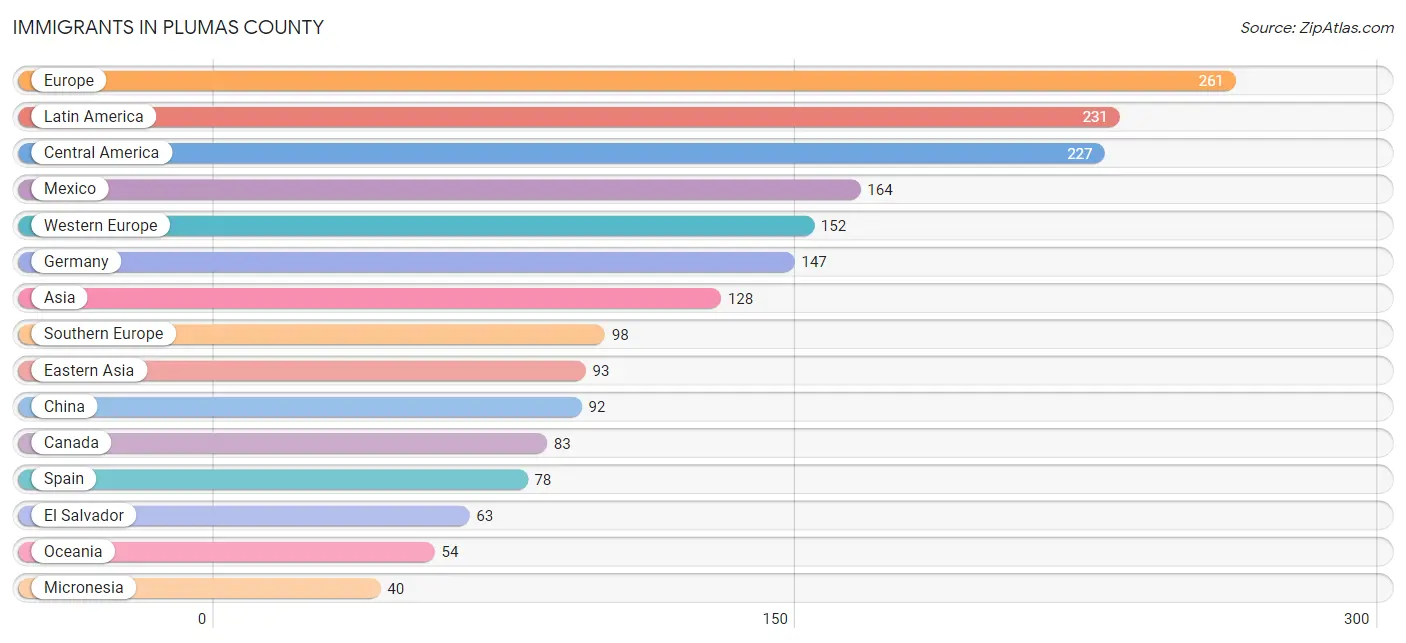
The most numerous immigrant groups reported in Plumas County came from Europe (261 | 1.3%), Latin America (231 | 1.2%), Central America (227 | 1.2%), Mexico (164 | 0.8%), and Western Europe (152 | 0.8%), together accounting for 5.3% of all Plumas County residents.
| Immigration Origin | # Population | % Population |
| Asia | 128 | 0.6% |
| Canada | 83 | 0.4% |
| Central America | 227 | 1.2% |
| China | 92 | 0.5% |
| Eastern Asia | 93 | 0.5% |
| Eastern Europe | 11 | 0.1% |
| El Salvador | 63 | 0.3% |
| Europe | 261 | 1.3% |
| Germany | 147 | 0.7% |
| Greece | 6 | 0.0% |
| India | 11 | 0.1% |
| Indonesia | 6 | 0.0% |
| Iran | 4 | 0.0% |
| Italy | 14 | 0.1% |
| Jordan | 1 | 0.0% |
| Korea | 1 | 0.0% |
| Latin America | 231 | 1.2% |
| Mexico | 164 | 0.8% |
| Micronesia | 40 | 0.2% |
| Netherlands | 5 | 0.0% |
| Oceania | 54 | 0.3% |
| Peru | 4 | 0.0% |
| Philippines | 8 | 0.0% |
| Russia | 11 | 0.1% |
| South America | 4 | 0.0% |
| South Central Asia | 15 | 0.1% |
| South Eastern Asia | 14 | 0.1% |
| Southern Europe | 98 | 0.5% |
| Spain | 78 | 0.4% |
| Taiwan | 39 | 0.2% |
| Western Asia | 1 | 0.0% |
| Western Europe | 152 | 0.8% | View All 32 Rows |
Sex and Age in Plumas County
Sex and Age in Plumas County
The most populous age groups in Plumas County are 70 to 74 Years (998 | 9.8%) for men and 60 to 64 Years (1,048 | 11.1%) for women.
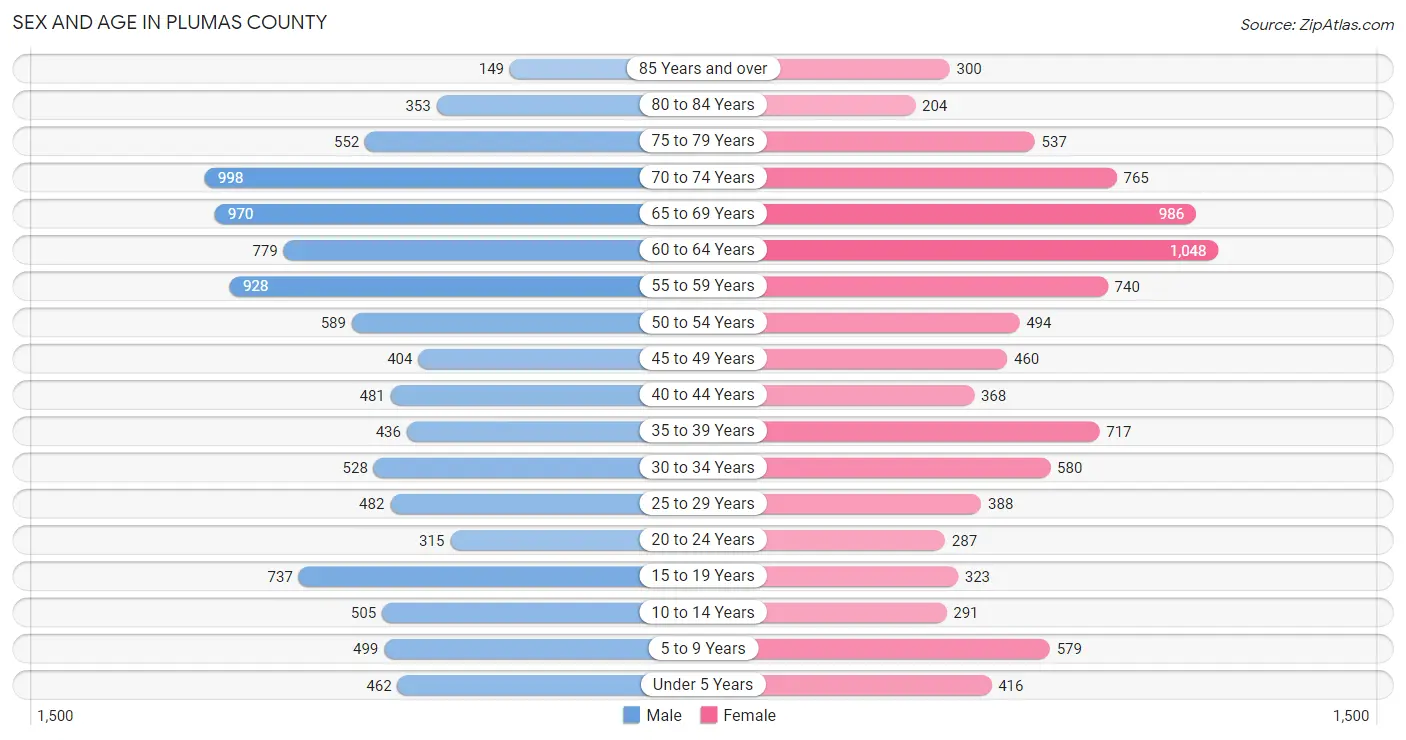
| Age Bracket | Male | Female |
| Under 5 Years | 462 (4.5%) | 416 (4.4%) |
| 5 to 9 Years | 499 (4.9%) | 579 (6.1%) |
| 10 to 14 Years | 505 (5.0%) | 291 (3.1%) |
| 15 to 19 Years | 737 (7.2%) | 323 (3.4%) |
| 20 to 24 Years | 315 (3.1%) | 287 (3.0%) |
| 25 to 29 Years | 482 (4.7%) | 388 (4.1%) |
| 30 to 34 Years | 528 (5.2%) | 580 (6.1%) |
| 35 to 39 Years | 436 (4.3%) | 717 (7.6%) |
| 40 to 44 Years | 481 (4.7%) | 368 (3.9%) |
| 45 to 49 Years | 404 (4.0%) | 460 (4.9%) |
| 50 to 54 Years | 589 (5.8%) | 494 (5.2%) |
| 55 to 59 Years | 928 (9.1%) | 740 (7.8%) |
| 60 to 64 Years | 779 (7.7%) | 1,048 (11.1%) |
| 65 to 69 Years | 970 (9.5%) | 986 (10.4%) |
| 70 to 74 Years | 998 (9.8%) | 765 (8.1%) |
| 75 to 79 Years | 552 (5.4%) | 537 (5.7%) |
| 80 to 84 Years | 353 (3.5%) | 204 (2.1%) |
| 85 Years and over | 149 (1.5%) | 300 (3.2%) |
| Total | 10,167 (100.0%) | 9,483 (100.0%) |
Families and Households in Plumas County
Median Family Size in Plumas County
The median family size in Plumas County is 2.93 persons per family, with single male/father families (459 | 8.9%) accounting for the largest median family size of 3.83 persons per family. On the other hand, married-couple families (3,945 | 76.6%) represent the smallest median family size with 2.75 persons per family.
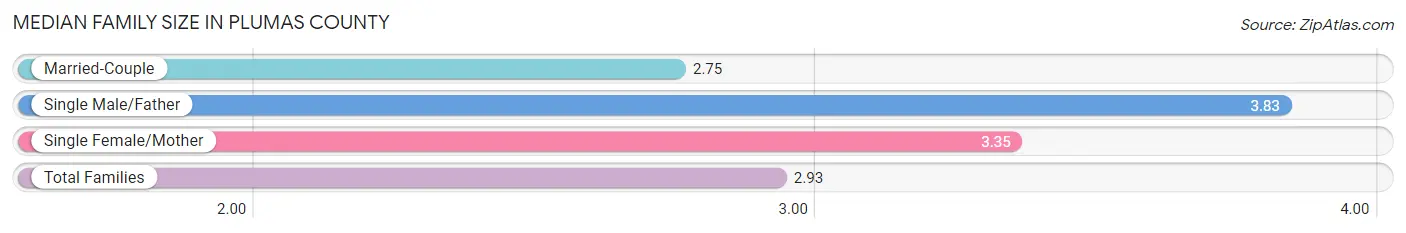
| Family Type | # Families | Family Size |
| Married-Couple | 3,945 (76.6%) | 2.75 |
| Single Male/Father | 459 (8.9%) | 3.83 |
| Single Female/Mother | 749 (14.5%) | 3.35 |
| Total Families | 5,153 (100.0%) | 2.93 |
Median Household Size in Plumas County
The median household size in Plumas County is 2.37 persons per household, with single male/father households (459 | 5.7%) accounting for the largest median household size of 4.03 persons per household. non-family households (2,951 | 36.4%) represent the smallest median household size with 1.24 persons per household.
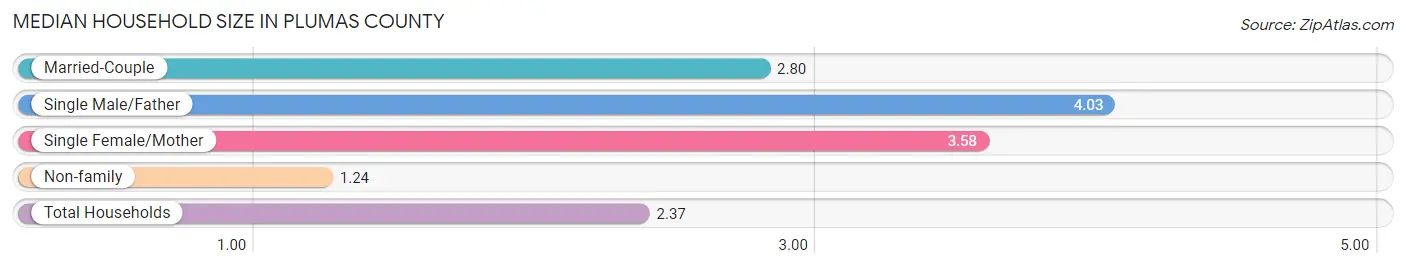
| Household Type | # Households | Household Size |
| Married-Couple | 3,945 (48.7%) | 2.80 |
| Single Male/Father | 459 (5.7%) | 4.03 |
| Single Female/Mother | 749 (9.2%) | 3.58 |
| Non-family | 2,951 (36.4%) | 1.24 |
| Total Households | 8,104 (100.0%) | 2.37 |
Household Size by Marriage Status in Plumas County
Out of a total of 8,104 households in Plumas County, 5,153 (63.6%) are family households, while 2,951 (36.4%) are nonfamily households. The most numerous type of family households are 2-person households, comprising 2,875, and the most common type of nonfamily households are 1-person households, comprising 2,395.
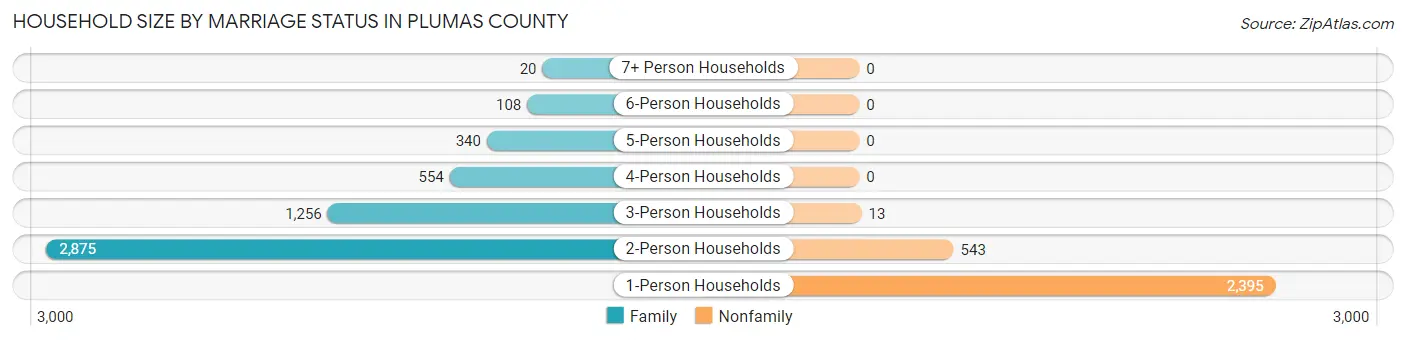
| Household Size | Family Households | Nonfamily Households |
| 1-Person Households | - | 2,395 (29.5%) |
| 2-Person Households | 2,875 (35.5%) | 543 (6.7%) |
| 3-Person Households | 1,256 (15.5%) | 13 (0.2%) |
| 4-Person Households | 554 (6.8%) | 0 (0.0%) |
| 5-Person Households | 340 (4.2%) | 0 (0.0%) |
| 6-Person Households | 108 (1.3%) | 0 (0.0%) |
| 7+ Person Households | 20 (0.3%) | 0 (0.0%) |
| Total | 5,153 (63.6%) | 2,951 (36.4%) |
Female Fertility in Plumas County
Fertility by Age in Plumas County
Average fertility rate in Plumas County is 74.0 births per 1,000 women. Women in the age bracket of 15 to 19 years have the highest fertility rate with 108.0 births per 1,000 women. Women in the age bracket of 20 to 34 years acount for 49.8% of all women with births.
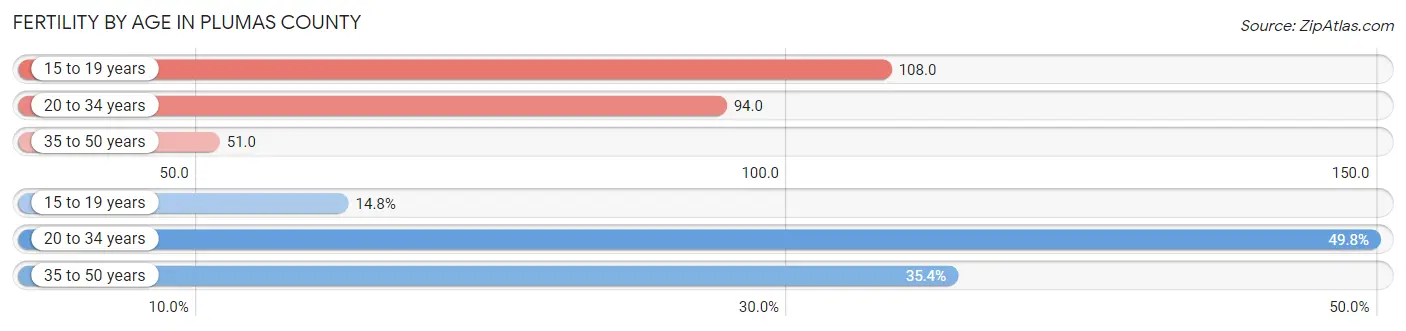
| Age Bracket | Women with Births | Births / 1,000 Women |
| 15 to 19 years | 35 (14.8%) | 108.0 |
| 20 to 34 years | 118 (49.8%) | 94.0 |
| 35 to 50 years | 84 (35.4%) | 51.0 |
| Total | 237 (100.0%) | 74.0 |
Fertility by Age by Marriage Status in Plumas County
48.9% of women with births (237) in Plumas County are married. The highest percentage of unmarried women with births falls into 15 to 19 years age bracket with 100.0% of them unmarried at the time of birth, while the lowest percentage of unmarried women with births belong to 20 to 34 years age bracket with 22.0% of them unmarried.
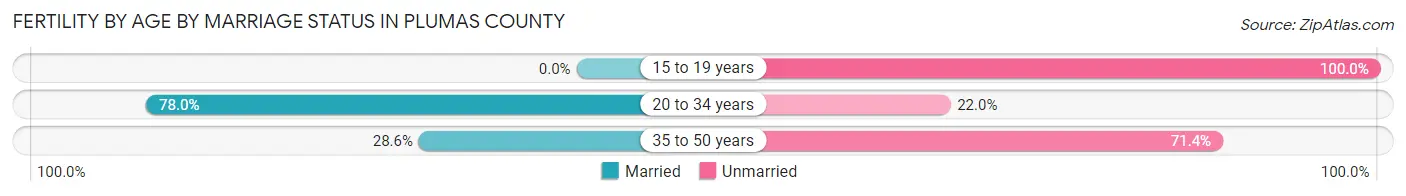
| Age Bracket | Married | Unmarried |
| 15 to 19 years | 0 (0.0%) | 35 (100.0%) |
| 20 to 34 years | 92 (78.0%) | 26 (22.0%) |
| 35 to 50 years | 24 (28.6%) | 60 (71.4%) |
| Total | 116 (48.9%) | 121 (51.0%) |
Fertility by Education in Plumas County
Average fertility rate in Plumas County is 74.0 births per 1,000 women. Women with the education attainment of graduate degree have the highest fertility rate of 126.0 births per 1,000 women, while women with the education attainment of college or associate's degree have the lowest fertility at 50.0 births per 1,000 women. Women with the education attainment of college or associate's degree represent 33.8% of all women with births.
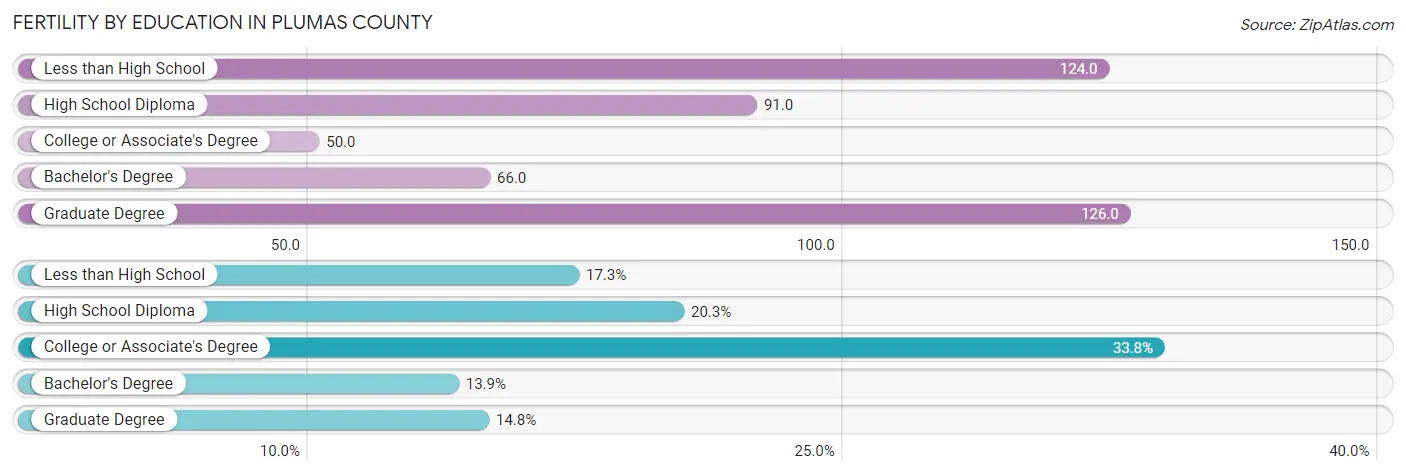
| Educational Attainment | Women with Births | Births / 1,000 Women |
| Less than High School | 41 (17.3%) | 124.0 |
| High School Diploma | 48 (20.3%) | 91.0 |
| College or Associate's Degree | 80 (33.8%) | 50.0 |
| Bachelor's Degree | 33 (13.9%) | 66.0 |
| Graduate Degree | 35 (14.8%) | 126.0 |
| Total | 237 (100.0%) | 74.0 |
Fertility by Education by Marriage Status in Plumas County
51.0% of women with births in Plumas County are unmarried. Women with the educational attainment of graduate degree are most likely to be married with 100.0% of them married at childbirth, while women with the educational attainment of high school diploma are least likely to be married with 72.9% of them unmarried at childbirth.
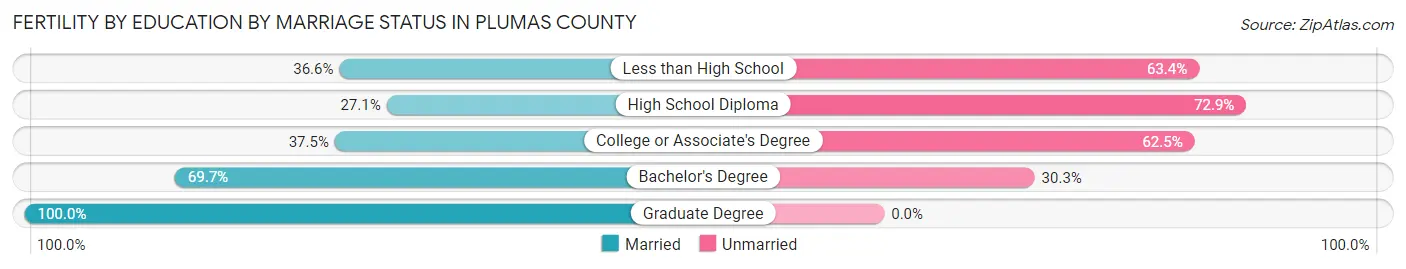
| Educational Attainment | Married | Unmarried |
| Less than High School | 15 (36.6%) | 26 (63.4%) |
| High School Diploma | 13 (27.1%) | 35 (72.9%) |
| College or Associate's Degree | 30 (37.5%) | 50 (62.5%) |
| Bachelor's Degree | 23 (69.7%) | 10 (30.3%) |
| Graduate Degree | 35 (100.0%) | 0 (0.0%) |
| Total | 116 (48.9%) | 121 (51.0%) |
Employment Characteristics in Plumas County
Employment by Class of Employer in Plumas County
Among the 7,380 employed individuals in Plumas County, private company employees (3,272 | 44.3%), local government employees (1,092 | 14.8%), and self-employed (not incorporated) (906 | 12.3%) make up the most common classes of employment.
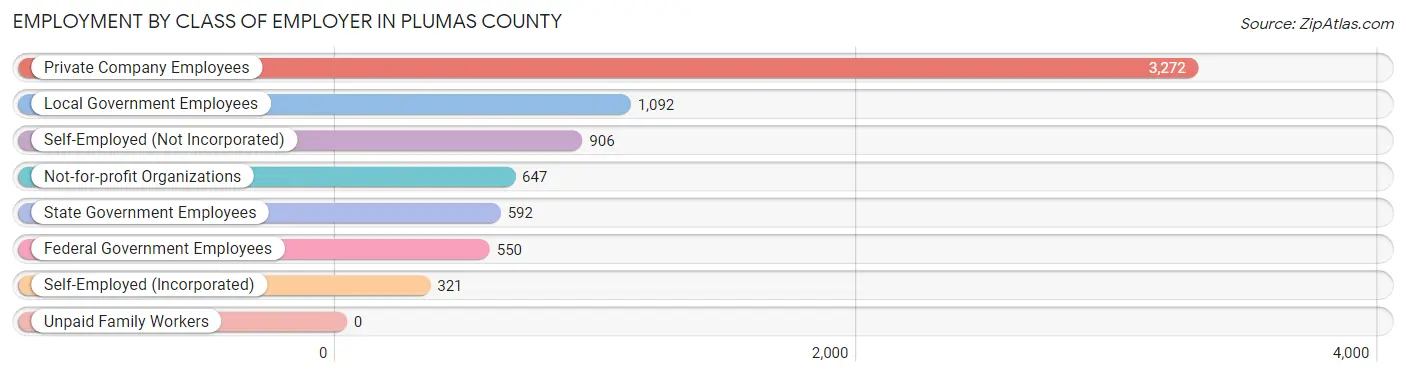
| Employer Class | # Employees | % Employees |
| Private Company Employees | 3,272 | 44.3% |
| Self-Employed (Incorporated) | 321 | 4.3% |
| Self-Employed (Not Incorporated) | 906 | 12.3% |
| Not-for-profit Organizations | 647 | 8.8% |
| Local Government Employees | 1,092 | 14.8% |
| State Government Employees | 592 | 8.0% |
| Federal Government Employees | 550 | 7.4% |
| Unpaid Family Workers | 0 | 0.0% |
| Total | 7,380 | 100.0% |
Employment Status by Age in Plumas County
According to the labor force statistics for Plumas County, out of the total population over 16 years of age (16,685), 50.0% or 8,342 individuals are in the labor force, with 8.0% or 667 of them unemployed. The age group with the highest labor force participation rate is 20 to 24 years, with 81.4% or 490 individuals in the labor force. Within the labor force, the 25 to 29 years age range has the highest percentage of unemployed individuals, with 19.0% or 124 of them being unemployed.
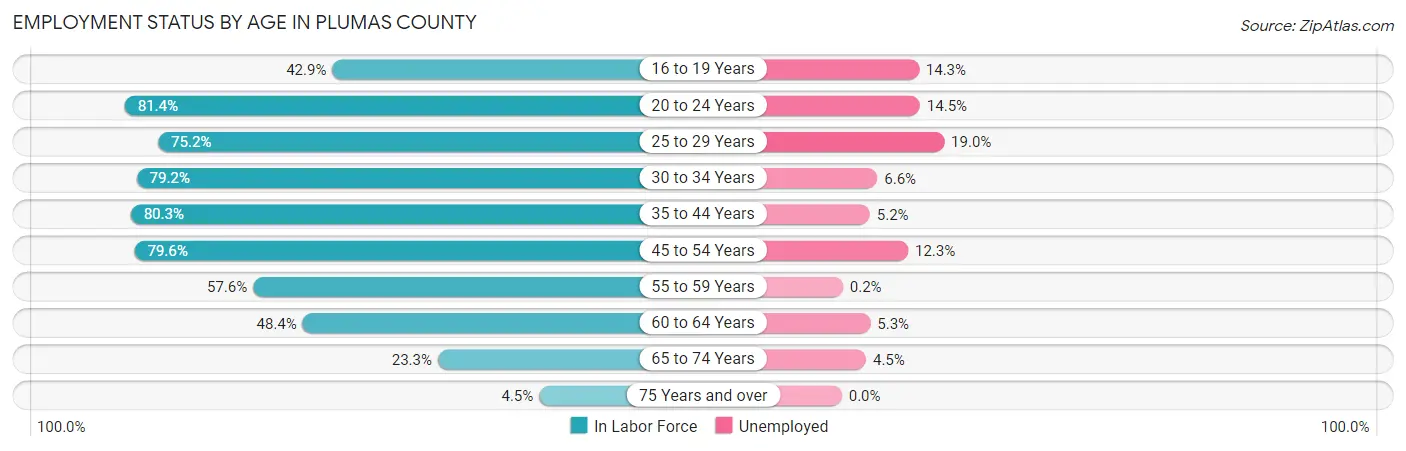
| Age Bracket | In Labor Force | Unemployed |
| 16 to 19 Years | 363 (42.9%) | 52 (14.3%) |
| 20 to 24 Years | 490 (81.4%) | 71 (14.5%) |
| 25 to 29 Years | 654 (75.2%) | 124 (19.0%) |
| 30 to 34 Years | 878 (79.2%) | 58 (6.6%) |
| 35 to 44 Years | 1,608 (80.3%) | 84 (5.2%) |
| 45 to 54 Years | 1,550 (79.6%) | 191 (12.3%) |
| 55 to 59 Years | 961 (57.6%) | 2 (0.2%) |
| 60 to 64 Years | 884 (48.4%) | 47 (5.3%) |
| 65 to 74 Years | 867 (23.3%) | 39 (4.5%) |
| 75 Years and over | 94 (4.5%) | 0 (0.0%) |
| Total | 8,342 (50.0%) | 667 (8.0%) |
Employment Status by Educational Attainment in Plumas County
According to labor force statistics for Plumas County, 69.3% of individuals (6,529) out of the total population between 25 and 64 years of age (9,422) are in the labor force, with 7.8% or 509 of them being unemployed. The group with the highest labor force participation rate are those with the educational attainment of bachelor's degree or higher, with 80.7% or 1,615 individuals in the labor force. Within the labor force, individuals with college / associate degree education have the highest percentage of unemployment, with 8.5% or 261 of them being unemployed.
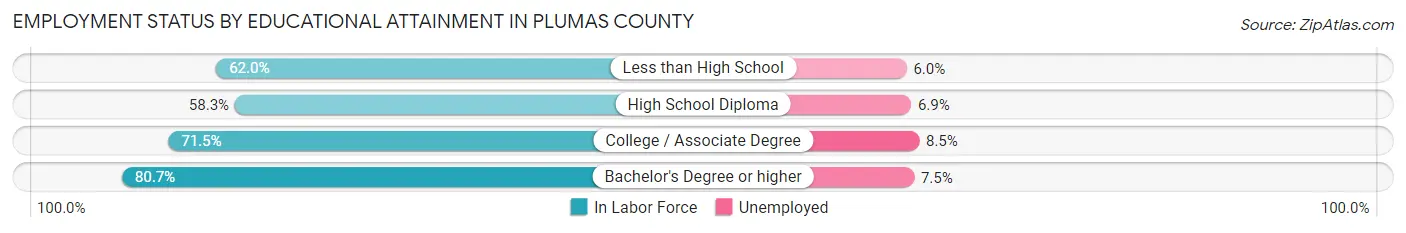
| Educational Attainment | In Labor Force | Unemployed |
| Less than High School | 348 (62.0%) | 34 (6.0%) |
| High School Diploma | 1,491 (58.3%) | 177 (6.9%) |
| College / Associate Degree | 3,076 (71.5%) | 366 (8.5%) |
| Bachelor's Degree or higher | 1,615 (80.7%) | 150 (7.5%) |
| Total | 6,529 (69.3%) | 735 (7.8%) |
Employment Occupations by Sex in Plumas County
Management, Business, Science and Arts Occupations
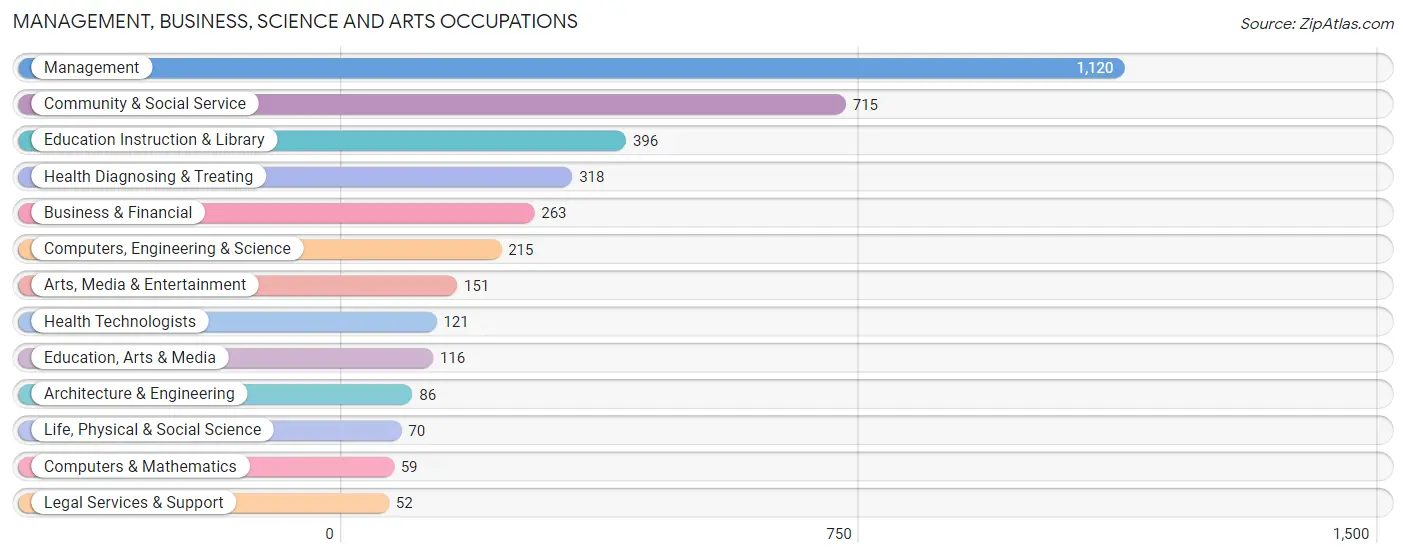
The most common Management, Business, Science and Arts occupations in Plumas County are Management (1,120 | 14.6%), Community & Social Service (715 | 9.3%), Education Instruction & Library (396 | 5.2%), Health Diagnosing & Treating (318 | 4.2%), and Business & Financial (263 | 3.4%).
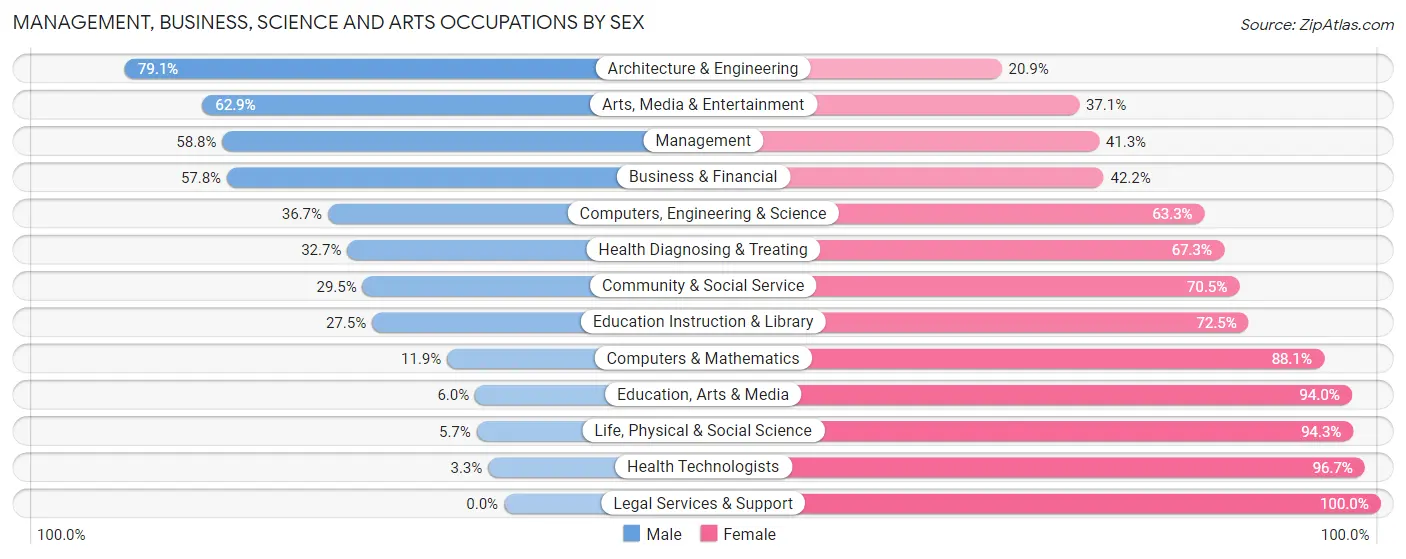
Management, Business, Science and Arts Occupations by Sex
Within the Management, Business, Science and Arts occupations in Plumas County, the most male-oriented occupations are Architecture & Engineering (79.1%), Arts, Media & Entertainment (62.9%), and Management (58.8%), while the most female-oriented occupations are Legal Services & Support (100.0%), Health Technologists (96.7%), and Life, Physical & Social Science (94.3%).
| Occupation | Male | Female |
| Management | 658 (58.8%) | 462 (41.2%) |
| Business & Financial | 152 (57.8%) | 111 (42.2%) |
| Computers, Engineering & Science | 79 (36.7%) | 136 (63.3%) |
| Computers & Mathematics | 7 (11.9%) | 52 (88.1%) |
| Architecture & Engineering | 68 (79.1%) | 18 (20.9%) |
| Life, Physical & Social Science | 4 (5.7%) | 66 (94.3%) |
| Community & Social Service | 211 (29.5%) | 504 (70.5%) |
| Education, Arts & Media | 7 (6.0%) | 109 (94.0%) |
| Legal Services & Support | 0 (0.0%) | 52 (100.0%) |
| Education Instruction & Library | 109 (27.5%) | 287 (72.5%) |
| Arts, Media & Entertainment | 95 (62.9%) | 56 (37.1%) |
| Health Diagnosing & Treating | 104 (32.7%) | 214 (67.3%) |
| Health Technologists | 4 (3.3%) | 117 (96.7%) |
| Total (Category) | 1,204 (45.8%) | 1,427 (54.2%) |
| Total (Overall) | 3,994 (52.2%) | 3,660 (47.8%) |
Services Occupations
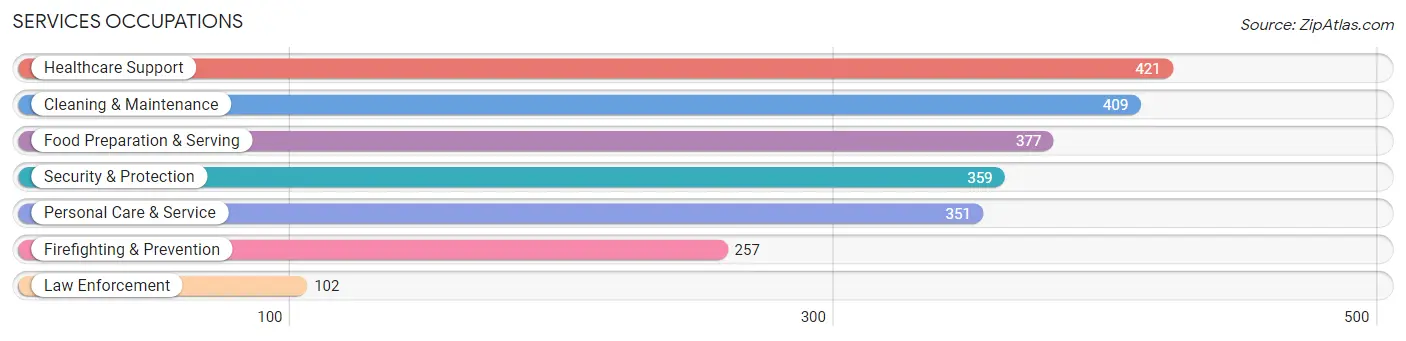
The most common Services occupations in Plumas County are Healthcare Support (421 | 5.5%), Cleaning & Maintenance (409 | 5.3%), Food Preparation & Serving (377 | 4.9%), Security & Protection (359 | 4.7%), and Personal Care & Service (351 | 4.6%).
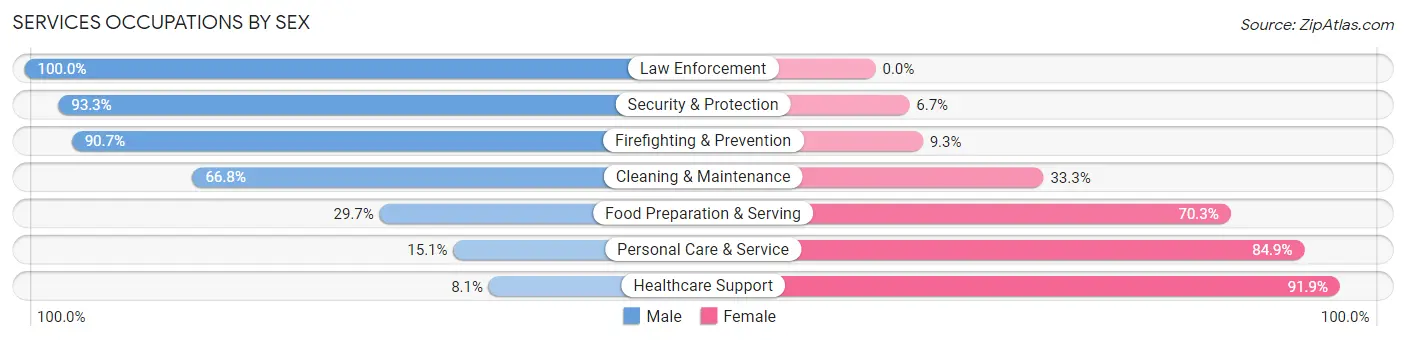
Services Occupations by Sex
Within the Services occupations in Plumas County, the most male-oriented occupations are Law Enforcement (100.0%), Security & Protection (93.3%), and Firefighting & Prevention (90.7%), while the most female-oriented occupations are Healthcare Support (91.9%), Personal Care & Service (84.9%), and Food Preparation & Serving (70.3%).
| Occupation | Male | Female |
| Healthcare Support | 34 (8.1%) | 387 (91.9%) |
| Security & Protection | 335 (93.3%) | 24 (6.7%) |
| Firefighting & Prevention | 233 (90.7%) | 24 (9.3%) |
| Law Enforcement | 102 (100.0%) | 0 (0.0%) |
| Food Preparation & Serving | 112 (29.7%) | 265 (70.3%) |
| Cleaning & Maintenance | 273 (66.7%) | 136 (33.3%) |
| Personal Care & Service | 53 (15.1%) | 298 (84.9%) |
| Total (Category) | 807 (42.1%) | 1,110 (57.9%) |
| Total (Overall) | 3,994 (52.2%) | 3,660 (47.8%) |
Sales and Office Occupations
The most common Sales and Office occupations in Plumas County are Office & Administration (766 | 10.0%), and Sales & Related (566 | 7.4%).
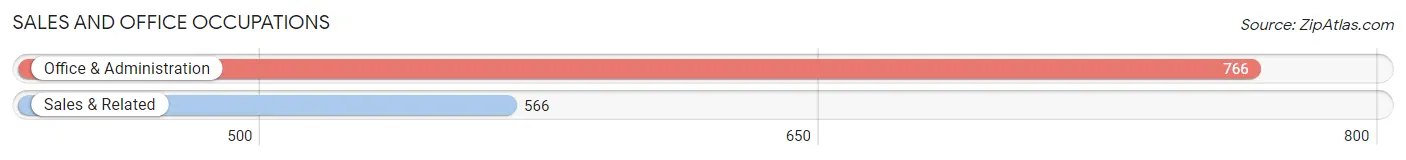
Sales and Office Occupations by Sex
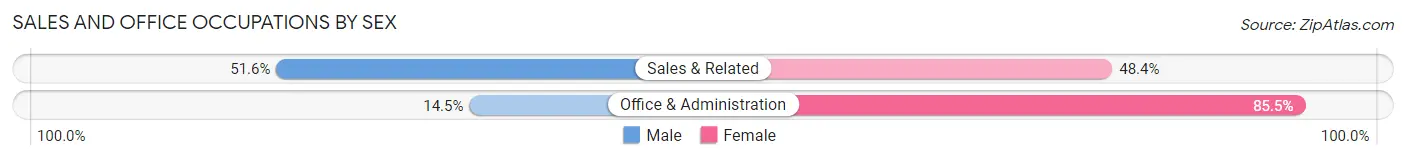
| Occupation | Male | Female |
| Sales & Related | 292 (51.6%) | 274 (48.4%) |
| Office & Administration | 111 (14.5%) | 655 (85.5%) |
| Total (Category) | 403 (30.3%) | 929 (69.7%) |
| Total (Overall) | 3,994 (52.2%) | 3,660 (47.8%) |
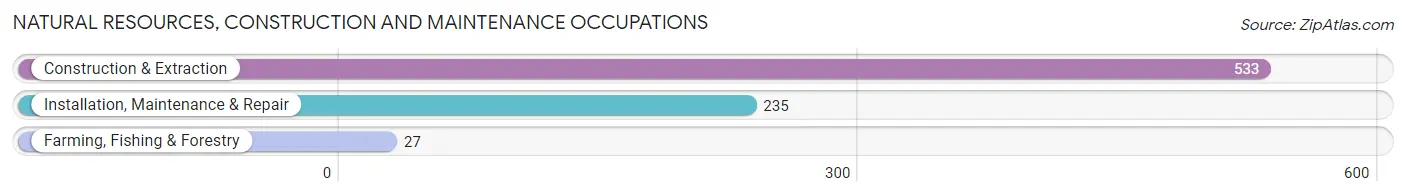
Natural Resources, Construction and Maintenance Occupations
The most common Natural Resources, Construction and Maintenance occupations in Plumas County are Construction & Extraction (533 | 7.0%), Installation, Maintenance & Repair (235 | 3.1%), and Farming, Fishing & Forestry (27 | 0.4%).
Natural Resources, Construction and Maintenance Occupations by Sex
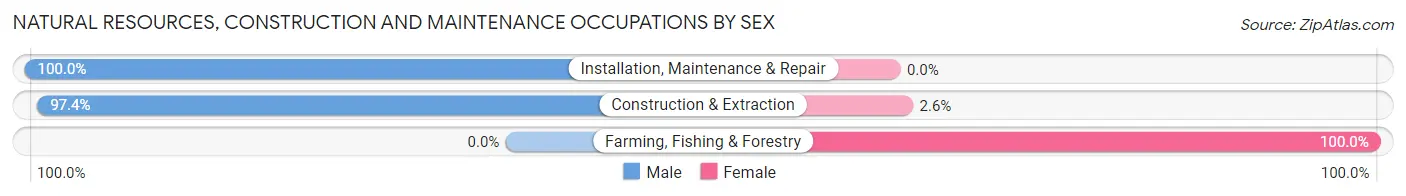
| Occupation | Male | Female |
| Farming, Fishing & Forestry | 0 (0.0%) | 27 (100.0%) |
| Construction & Extraction | 519 (97.4%) | 14 (2.6%) |
| Installation, Maintenance & Repair | 235 (100.0%) | 0 (0.0%) |
| Total (Category) | 754 (94.8%) | 41 (5.2%) |
| Total (Overall) | 3,994 (52.2%) | 3,660 (47.8%) |
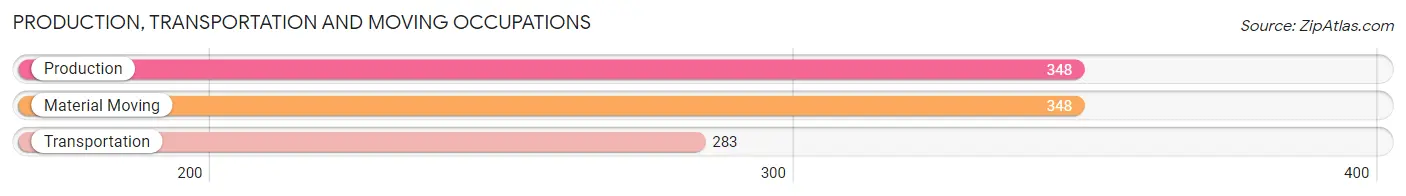
Production, Transportation and Moving Occupations
The most common Production, Transportation and Moving occupations in Plumas County are Production (348 | 4.5%), Material Moving (348 | 4.5%), and Transportation (283 | 3.7%).
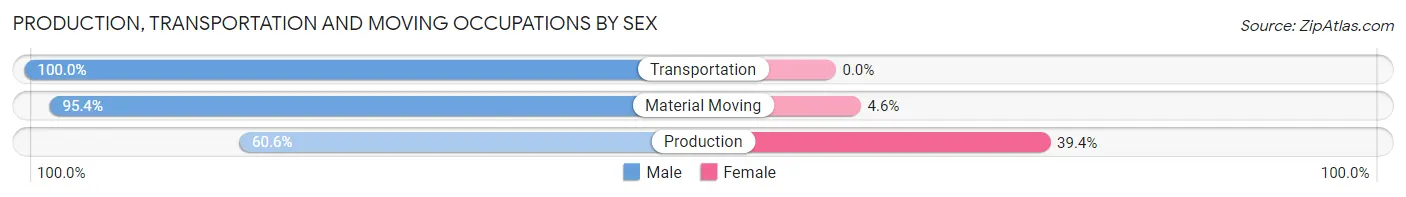
Production, Transportation and Moving Occupations by Sex
| Occupation | Male | Female |
| Production | 211 (60.6%) | 137 (39.4%) |
| Transportation | 283 (100.0%) | 0 (0.0%) |
| Material Moving | 332 (95.4%) | 16 (4.6%) |
| Total (Category) | 826 (84.4%) | 153 (15.6%) |
| Total (Overall) | 3,994 (52.2%) | 3,660 (47.8%) |
Employment Industries by Sex in Plumas County
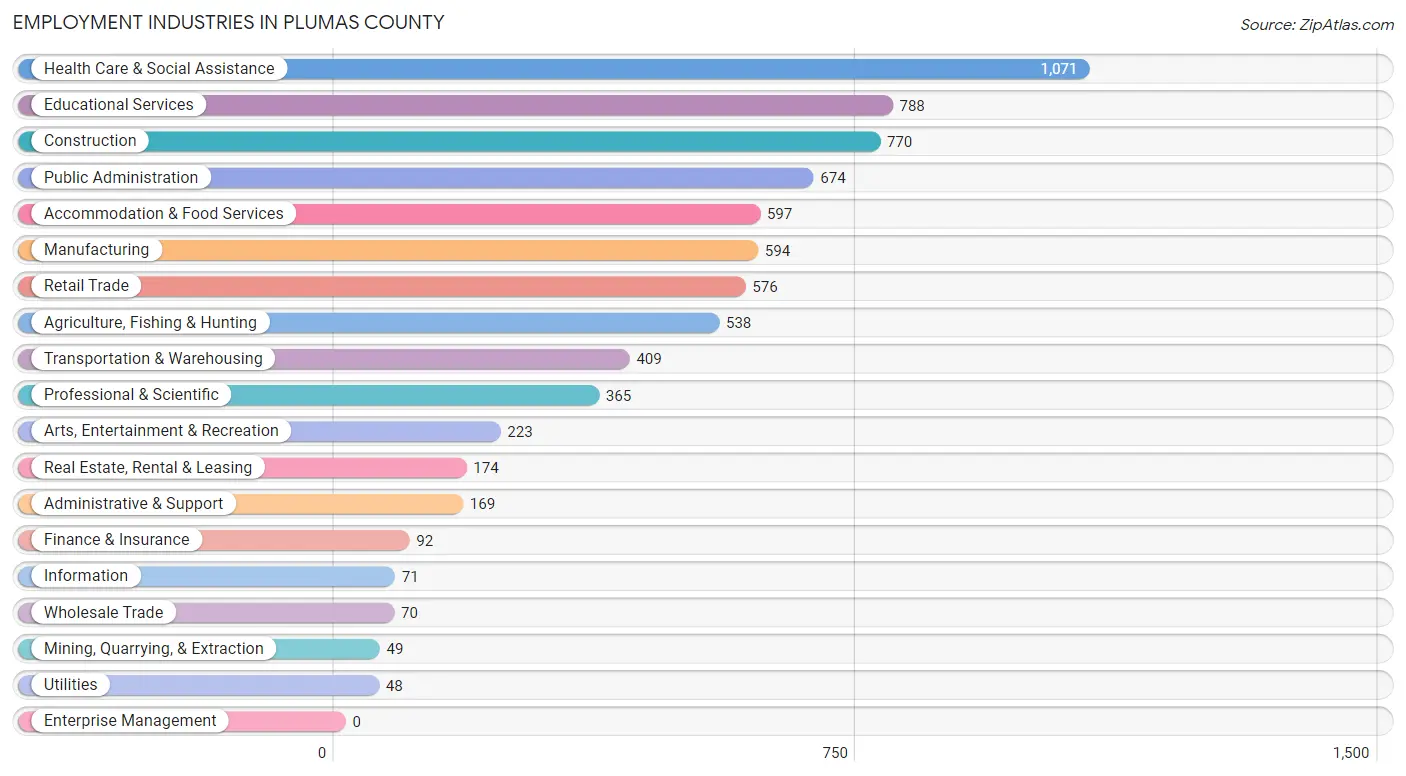
Employment Industries in Plumas County
The major employment industries in Plumas County include Health Care & Social Assistance (1,071 | 14.0%), Educational Services (788 | 10.3%), Construction (770 | 10.1%), Public Administration (674 | 8.8%), and Accommodation & Food Services (597 | 7.8%).
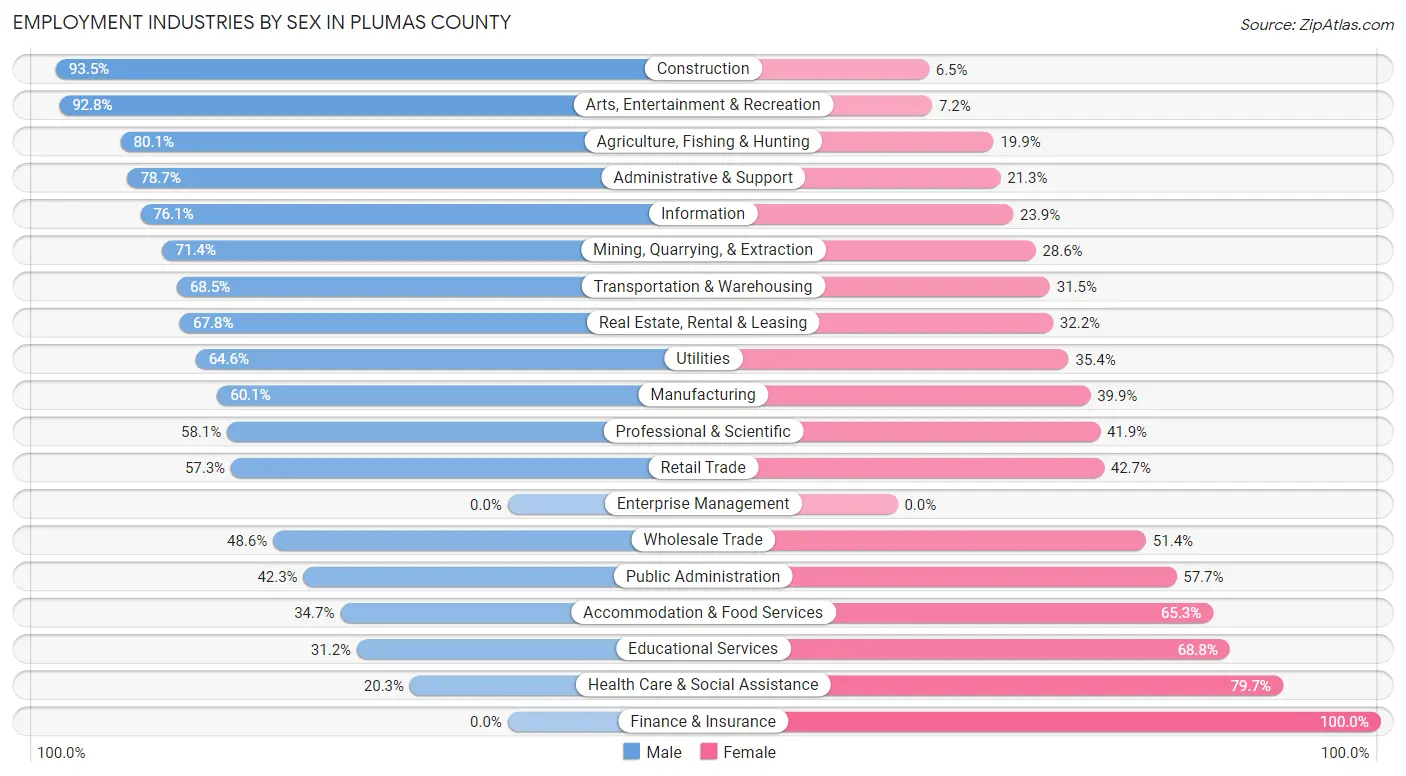
Employment Industries by Sex in Plumas County
The Plumas County industries that see more men than women are Construction (93.5%), Arts, Entertainment & Recreation (92.8%), and Agriculture, Fishing & Hunting (80.1%), whereas the industries that tend to have a higher number of women are Finance & Insurance (100.0%), Health Care & Social Assistance (79.7%), and Educational Services (68.8%).
| Industry | Male | Female |
| Agriculture, Fishing & Hunting | 431 (80.1%) | 107 (19.9%) |
| Mining, Quarrying, & Extraction | 35 (71.4%) | 14 (28.6%) |
| Construction | 720 (93.5%) | 50 (6.5%) |
| Manufacturing | 357 (60.1%) | 237 (39.9%) |
| Wholesale Trade | 34 (48.6%) | 36 (51.4%) |
| Retail Trade | 330 (57.3%) | 246 (42.7%) |
| Transportation & Warehousing | 280 (68.5%) | 129 (31.5%) |
| Utilities | 31 (64.6%) | 17 (35.4%) |
| Information | 54 (76.1%) | 17 (23.9%) |
| Finance & Insurance | 0 (0.0%) | 92 (100.0%) |
| Real Estate, Rental & Leasing | 118 (67.8%) | 56 (32.2%) |
| Professional & Scientific | 212 (58.1%) | 153 (41.9%) |
| Enterprise Management | 0 (0.0%) | 0 (0.0%) |
| Administrative & Support | 133 (78.7%) | 36 (21.3%) |
| Educational Services | 246 (31.2%) | 542 (68.8%) |
| Health Care & Social Assistance | 217 (20.3%) | 854 (79.7%) |
| Arts, Entertainment & Recreation | 207 (92.8%) | 16 (7.2%) |
| Accommodation & Food Services | 207 (34.7%) | 390 (65.3%) |
| Public Administration | 285 (42.3%) | 389 (57.7%) |
| Total | 3,994 (52.2%) | 3,660 (47.8%) |
Education in Plumas County
School Enrollment in Plumas County
The most common levels of schooling among the 3,375 students in Plumas County are middle school (891 | 26.4%), elementary school (728 | 21.6%), and college / undergraduate (726 | 21.5%).
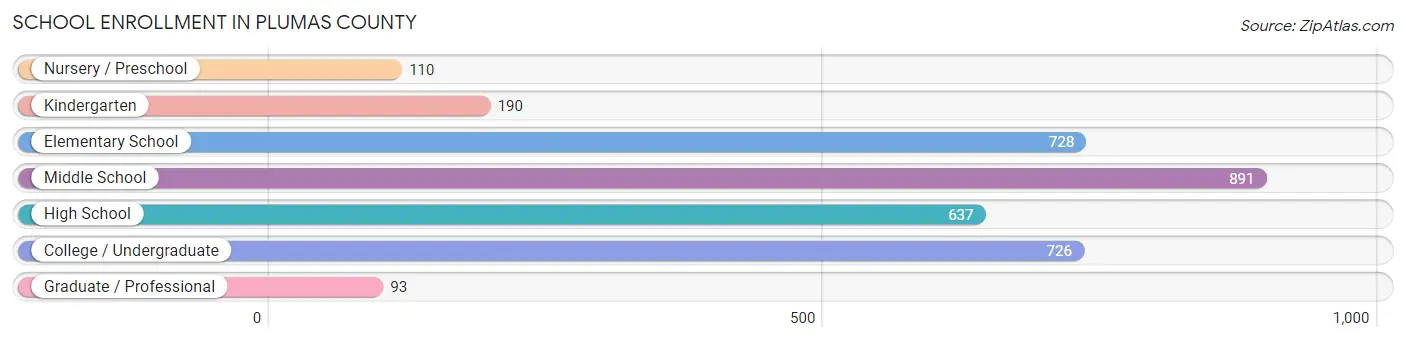
| School Level | # Students | % Students |
| Nursery / Preschool | 110 | 3.3% |
| Kindergarten | 190 | 5.6% |
| Elementary School | 728 | 21.6% |
| Middle School | 891 | 26.4% |
| High School | 637 | 18.9% |
| College / Undergraduate | 726 | 21.5% |
| Graduate / Professional | 93 | 2.8% |
| Total | 3,375 | 100.0% |
School Enrollment by Age by Funding Source in Plumas County
Out of a total of 3,375 students who are enrolled in schools in Plumas County, 418 (12.4%) attend a private institution, while the remaining 2,956 (87.6%) are enrolled in public schools. The age group of 3 to 4 year olds has the highest likelihood of being enrolled in private schools, with 58 (61.7% in the age bracket) enrolled. Conversely, the age group of 35 years and over has the lowest likelihood of being enrolled in a private school, with 144 (100.0% in the age bracket) attending a public institution.
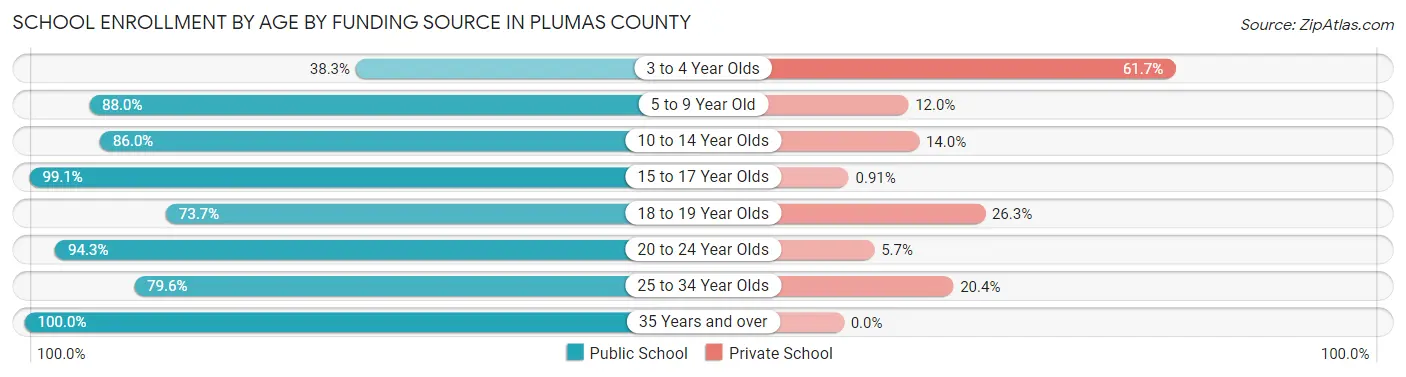
| Age Bracket | Public School | Private School |
| 3 to 4 Year Olds | 36 (38.3%) | 58 (61.7%) |
| 5 to 9 Year Old | 856 (88.0%) | 117 (12.0%) |
| 10 to 14 Year Olds | 668 (86.0%) | 109 (14.0%) |
| 15 to 17 Year Olds | 654 (99.1%) | 6 (0.9%) |
| 18 to 19 Year Olds | 210 (73.7%) | 75 (26.3%) |
| 20 to 24 Year Olds | 232 (94.3%) | 14 (5.7%) |
| 25 to 34 Year Olds | 156 (79.6%) | 40 (20.4%) |
| 35 Years and over | 144 (100.0%) | 0 (0.0%) |
| Total | 2,956 (87.6%) | 418 (12.4%) |
Educational Attainment by Field of Study in Plumas County
Business (620 | 17.8%), bio, nature & agricultural (552 | 15.8%), education (364 | 10.4%), science & technology (254 | 7.3%), and arts & humanities (251 | 7.2%) are the most common fields of study among 3,490 individuals in Plumas County who have obtained a bachelor's degree or higher.
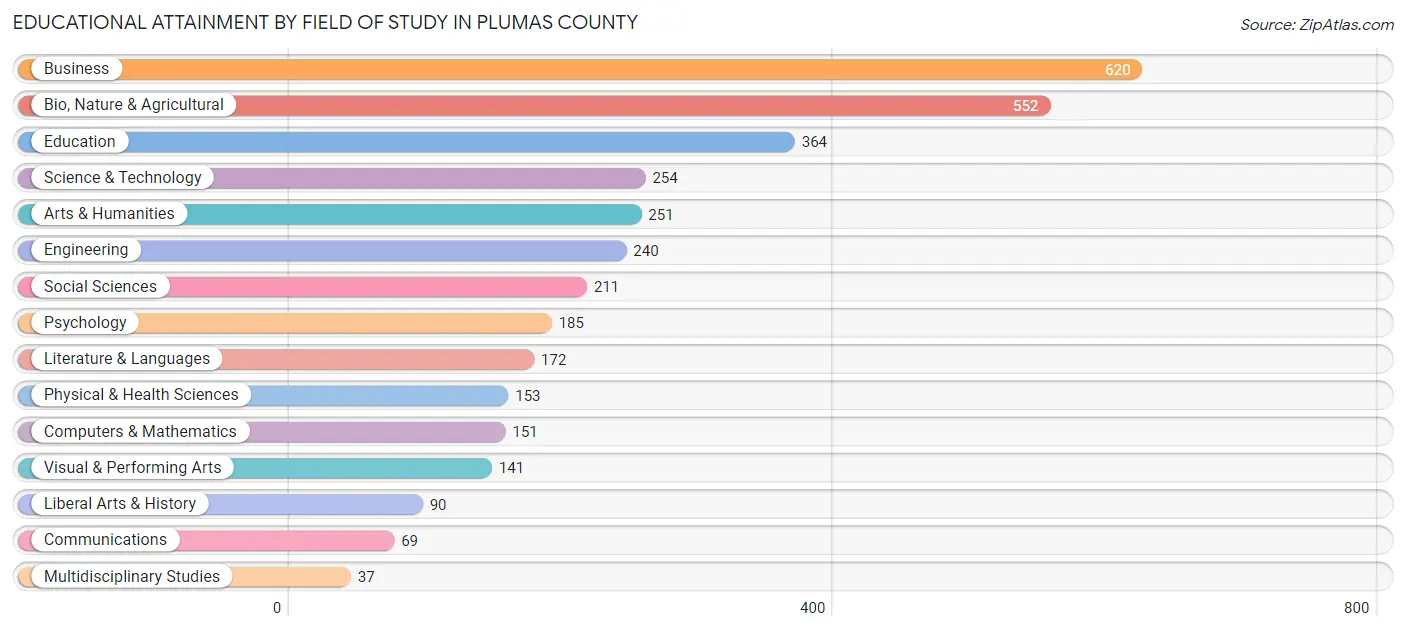
| Field of Study | # Graduates | % Graduates |
| Computers & Mathematics | 151 | 4.3% |
| Bio, Nature & Agricultural | 552 | 15.8% |
| Physical & Health Sciences | 153 | 4.4% |
| Psychology | 185 | 5.3% |
| Social Sciences | 211 | 6.0% |
| Engineering | 240 | 6.9% |
| Multidisciplinary Studies | 37 | 1.1% |
| Science & Technology | 254 | 7.3% |
| Business | 620 | 17.8% |
| Education | 364 | 10.4% |
| Literature & Languages | 172 | 4.9% |
| Liberal Arts & History | 90 | 2.6% |
| Visual & Performing Arts | 141 | 4.0% |
| Communications | 69 | 2.0% |
| Arts & Humanities | 251 | 7.2% |
| Total | 3,490 | 100.0% |
Transportation & Commute in Plumas County
Vehicle Availability by Sex in Plumas County
The most prevalent vehicle ownership categories in Plumas County are males with 2 vehicles (1,662, accounting for 42.8%) and females with 2 vehicles (1,326, making up 48.7%).
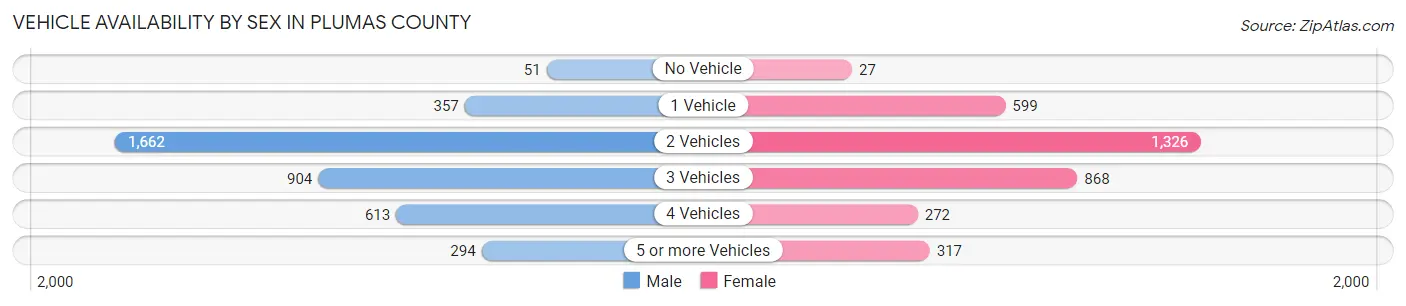
| Vehicles Available | Male | Female |
| No Vehicle | 51 (1.3%) | 27 (0.8%) |
| 1 Vehicle | 357 (9.2%) | 599 (17.6%) |
| 2 Vehicles | 1,662 (42.8%) | 1,326 (38.9%) |
| 3 Vehicles | 904 (23.3%) | 868 (25.5%) |
| 4 Vehicles | 613 (15.8%) | 272 (8.0%) |
| 5 or more Vehicles | 294 (7.6%) | 317 (9.3%) |
| Total | 3,881 (100.0%) | 3,409 (100.0%) |
Commute Time in Plumas County
The most frequently occuring commute durations in Plumas County are 5 to 9 minutes (1,920 commuters, 28.2%), less than 5 minutes (1,079 commuters, 15.8%), and 10 to 14 minutes (975 commuters, 14.3%).
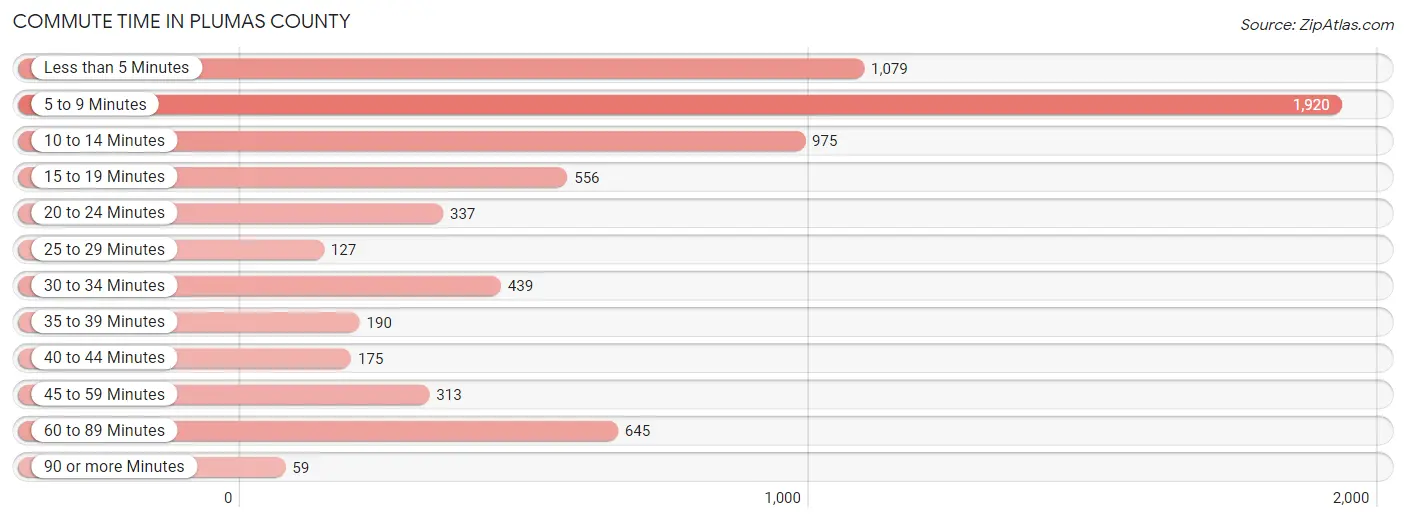
| Commute Time | # Commuters | % Commuters |
| Less than 5 Minutes | 1,079 | 15.8% |
| 5 to 9 Minutes | 1,920 | 28.2% |
| 10 to 14 Minutes | 975 | 14.3% |
| 15 to 19 Minutes | 556 | 8.2% |
| 20 to 24 Minutes | 337 | 4.9% |
| 25 to 29 Minutes | 127 | 1.9% |
| 30 to 34 Minutes | 439 | 6.4% |
| 35 to 39 Minutes | 190 | 2.8% |
| 40 to 44 Minutes | 175 | 2.6% |
| 45 to 59 Minutes | 313 | 4.6% |
| 60 to 89 Minutes | 645 | 9.5% |
| 90 or more Minutes | 59 | 0.9% |
Commute Time by Sex in Plumas County
The most common commute times in Plumas County are 5 to 9 minutes (886 commuters, 24.0%) for males and 5 to 9 minutes (1,034 commuters, 33.2%) for females.
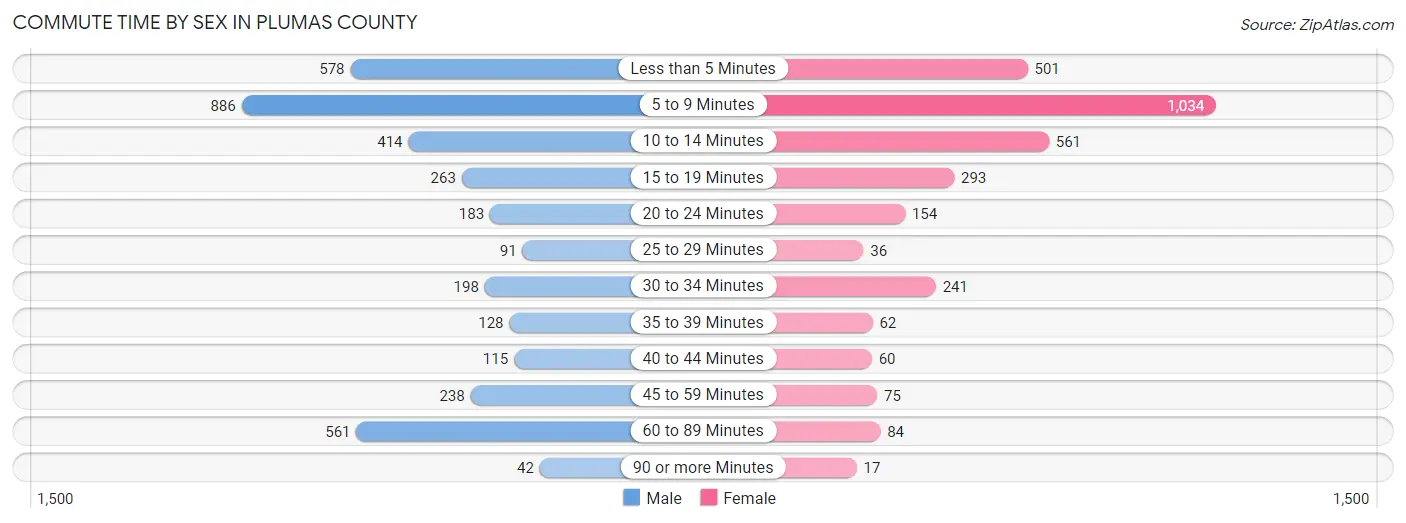
| Commute Time | Male | Female |
| Less than 5 Minutes | 578 (15.6%) | 501 (16.1%) |
| 5 to 9 Minutes | 886 (24.0%) | 1,034 (33.2%) |
| 10 to 14 Minutes | 414 (11.2%) | 561 (18.0%) |
| 15 to 19 Minutes | 263 (7.1%) | 293 (9.4%) |
| 20 to 24 Minutes | 183 (5.0%) | 154 (4.9%) |
| 25 to 29 Minutes | 91 (2.5%) | 36 (1.1%) |
| 30 to 34 Minutes | 198 (5.4%) | 241 (7.7%) |
| 35 to 39 Minutes | 128 (3.5%) | 62 (2.0%) |
| 40 to 44 Minutes | 115 (3.1%) | 60 (1.9%) |
| 45 to 59 Minutes | 238 (6.4%) | 75 (2.4%) |
| 60 to 89 Minutes | 561 (15.2%) | 84 (2.7%) |
| 90 or more Minutes | 42 (1.1%) | 17 (0.5%) |
Time of Departure to Work by Sex in Plumas County
The most frequent times of departure to work in Plumas County are 6:30 AM to 6:59 AM (531, 14.4%) for males and 7:30 AM to 7:59 AM (988, 31.7%) for females.
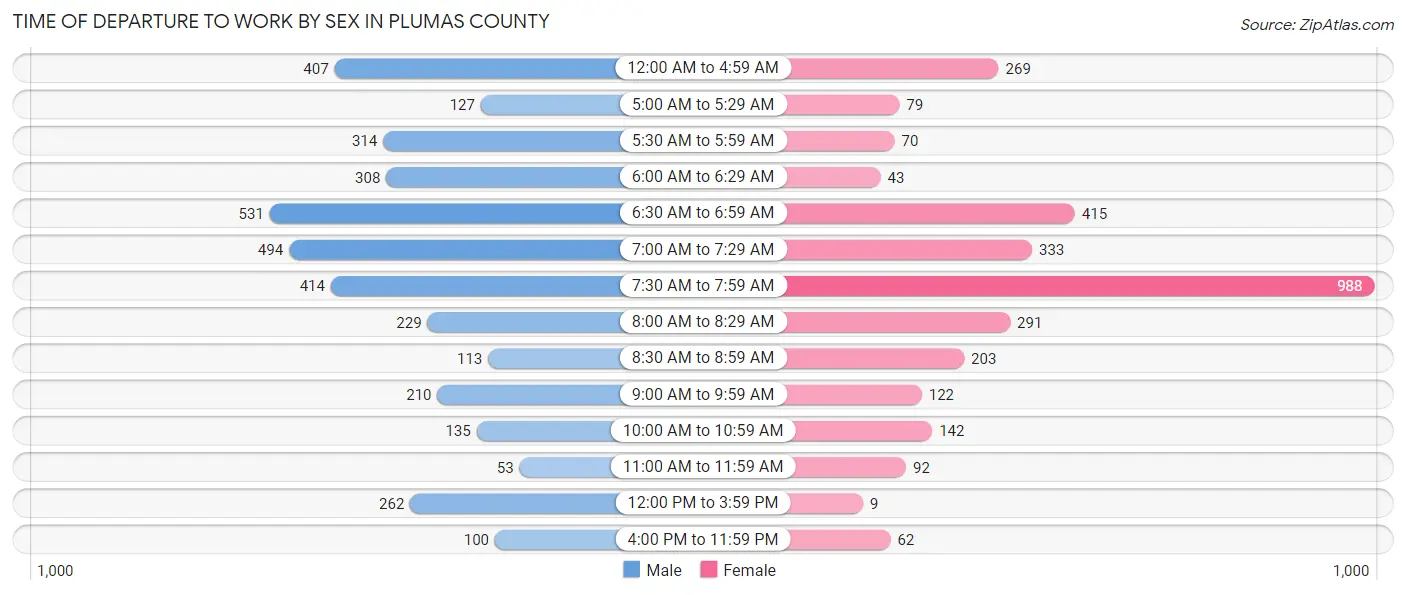
| Time of Departure | Male | Female |
| 12:00 AM to 4:59 AM | 407 (11.0%) | 269 (8.6%) |
| 5:00 AM to 5:29 AM | 127 (3.4%) | 79 (2.5%) |
| 5:30 AM to 5:59 AM | 314 (8.5%) | 70 (2.2%) |
| 6:00 AM to 6:29 AM | 308 (8.3%) | 43 (1.4%) |
| 6:30 AM to 6:59 AM | 531 (14.4%) | 415 (13.3%) |
| 7:00 AM to 7:29 AM | 494 (13.4%) | 333 (10.7%) |
| 7:30 AM to 7:59 AM | 414 (11.2%) | 988 (31.7%) |
| 8:00 AM to 8:29 AM | 229 (6.2%) | 291 (9.3%) |
| 8:30 AM to 8:59 AM | 113 (3.1%) | 203 (6.5%) |
| 9:00 AM to 9:59 AM | 210 (5.7%) | 122 (3.9%) |
| 10:00 AM to 10:59 AM | 135 (3.6%) | 142 (4.5%) |
| 11:00 AM to 11:59 AM | 53 (1.4%) | 92 (2.9%) |
| 12:00 PM to 3:59 PM | 262 (7.1%) | 9 (0.3%) |
| 4:00 PM to 11:59 PM | 100 (2.7%) | 62 (2.0%) |
| Total | 3,697 (100.0%) | 3,118 (100.0%) |
Housing Occupancy in Plumas County
Occupancy by Ownership in Plumas County
Of the total 8,104 dwellings in Plumas County, owner-occupied units account for 6,023 (74.3%), while renter-occupied units make up 2,081 (25.7%).
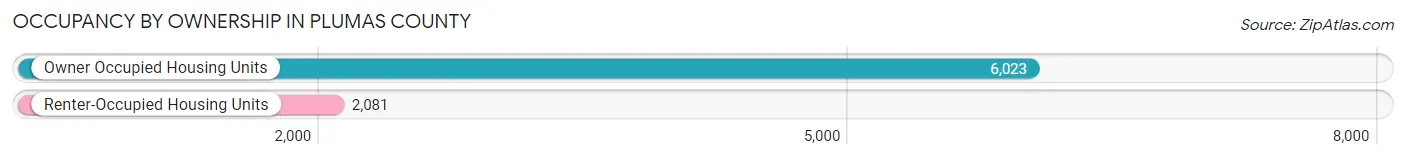
| Occupancy | # Housing Units | % Housing Units |
| Owner Occupied Housing Units | 6,023 | 74.3% |
| Renter-Occupied Housing Units | 2,081 | 25.7% |
| Total Occupied Housing Units | 8,104 | 100.0% |
Occupancy by Household Size in Plumas County
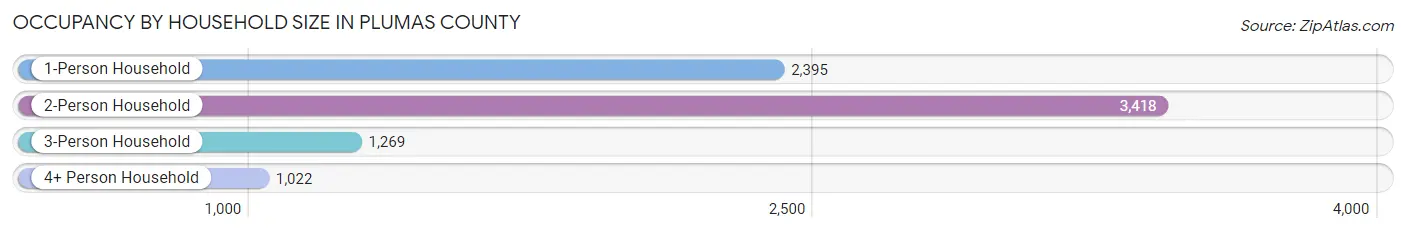
| Household Size | # Housing Units | % Housing Units |
| 1-Person Household | 2,395 | 29.5% |
| 2-Person Household | 3,418 | 42.2% |
| 3-Person Household | 1,269 | 15.7% |
| 4+ Person Household | 1,022 | 12.6% |
| Total Housing Units | 8,104 | 100.0% |
Occupancy by Ownership by Household Size in Plumas County
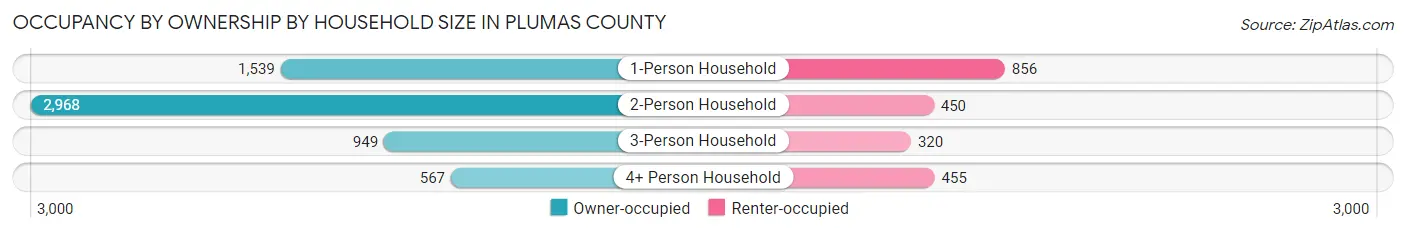
| Household Size | Owner-occupied | Renter-occupied |
| 1-Person Household | 1,539 (64.3%) | 856 (35.7%) |
| 2-Person Household | 2,968 (86.8%) | 450 (13.2%) |
| 3-Person Household | 949 (74.8%) | 320 (25.2%) |
| 4+ Person Household | 567 (55.5%) | 455 (44.5%) |
| Total Housing Units | 6,023 (74.3%) | 2,081 (25.7%) |
Occupancy by Educational Attainment in Plumas County
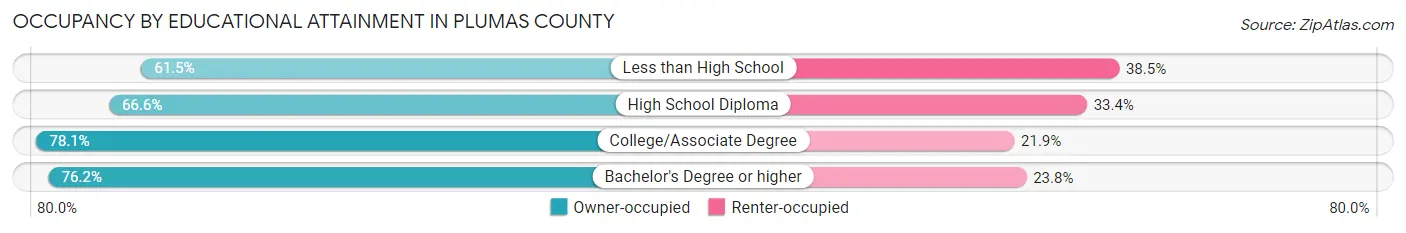
| Household Size | Owner-occupied | Renter-occupied |
| Less than High School | 273 (61.5%) | 171 (38.5%) |
| High School Diploma | 1,143 (66.6%) | 573 (33.4%) |
| College/Associate Degree | 3,150 (78.1%) | 882 (21.9%) |
| Bachelor's Degree or higher | 1,457 (76.2%) | 455 (23.8%) |
Occupancy by Age of Householder in Plumas County
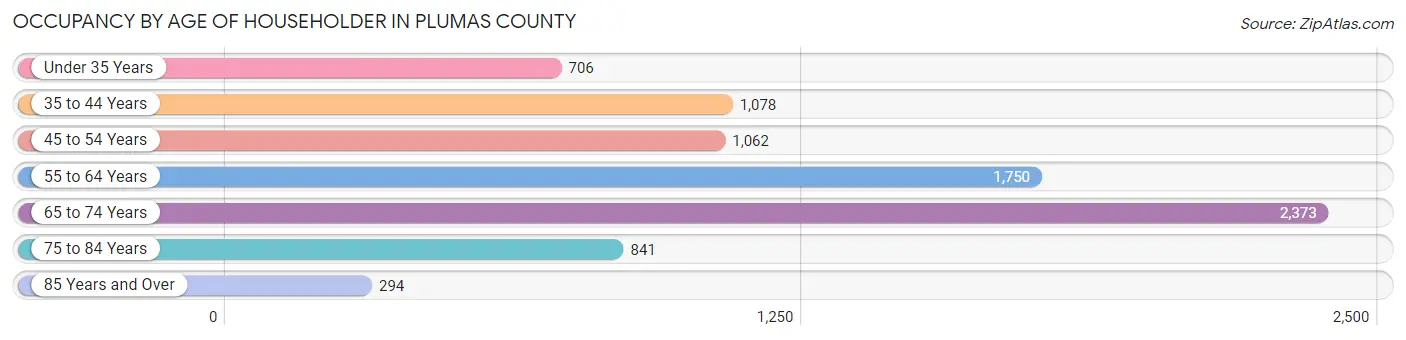
| Age Bracket | # Households | % Households |
| Under 35 Years | 706 | 8.7% |
| 35 to 44 Years | 1,078 | 13.3% |
| 45 to 54 Years | 1,062 | 13.1% |
| 55 to 64 Years | 1,750 | 21.6% |
| 65 to 74 Years | 2,373 | 29.3% |
| 75 to 84 Years | 841 | 10.4% |
| 85 Years and Over | 294 | 3.6% |
| Total | 8,104 | 100.0% |
Housing Finances in Plumas County
Median Income by Occupancy in Plumas County
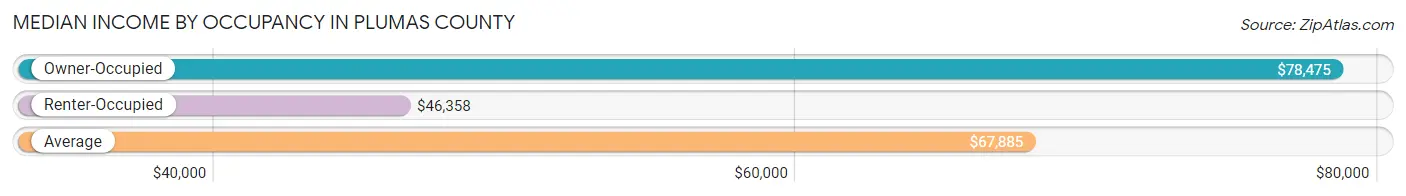
| Occupancy Type | # Households | Median Income |
| Owner-Occupied | 6,023 (74.3%) | $78,475 |
| Renter-Occupied | 2,081 (25.7%) | $46,358 |
| Average | 8,104 (100.0%) | $67,885 |
Occupancy by Householder Income Bracket in Plumas County
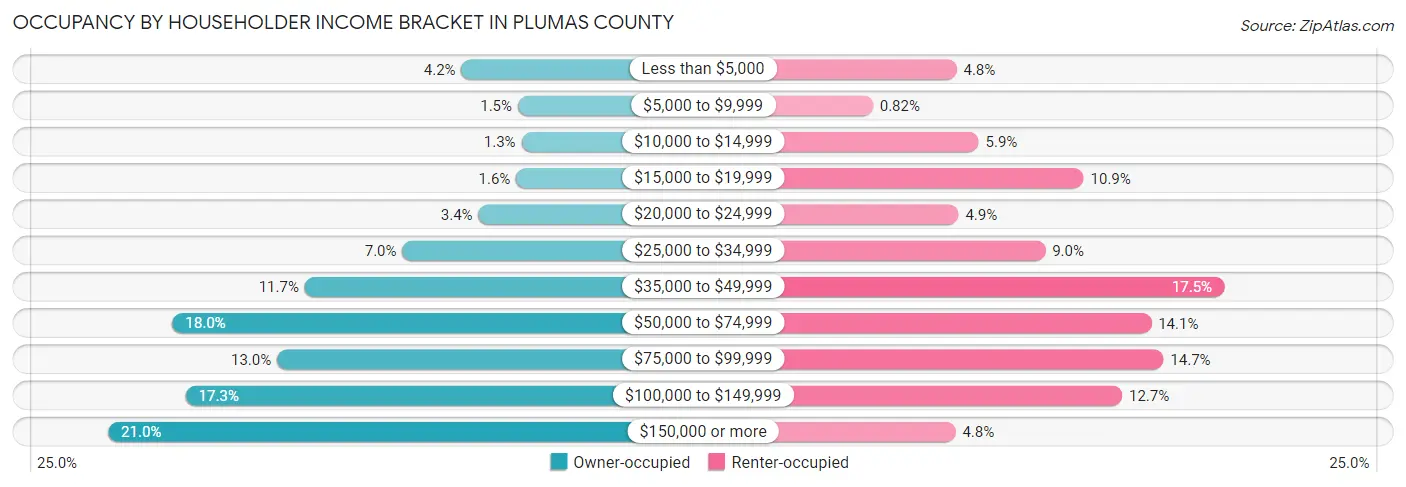
| Income Bracket | Owner-occupied | Renter-occupied |
| Less than $5,000 | 253 (4.2%) | 100 (4.8%) |
| $5,000 to $9,999 | 91 (1.5%) | 17 (0.8%) |
| $10,000 to $14,999 | 81 (1.3%) | 122 (5.9%) |
| $15,000 to $19,999 | 96 (1.6%) | 226 (10.9%) |
| $20,000 to $24,999 | 204 (3.4%) | 102 (4.9%) |
| $25,000 to $34,999 | 422 (7.0%) | 188 (9.0%) |
| $35,000 to $49,999 | 702 (11.7%) | 365 (17.5%) |
| $50,000 to $74,999 | 1,082 (18.0%) | 293 (14.1%) |
| $75,000 to $99,999 | 782 (13.0%) | 305 (14.7%) |
| $100,000 to $149,999 | 1,044 (17.3%) | 264 (12.7%) |
| $150,000 or more | 1,266 (21.0%) | 99 (4.8%) |
| Total | 6,023 (100.0%) | 2,081 (100.0%) |
Monthly Housing Cost Tiers in Plumas County
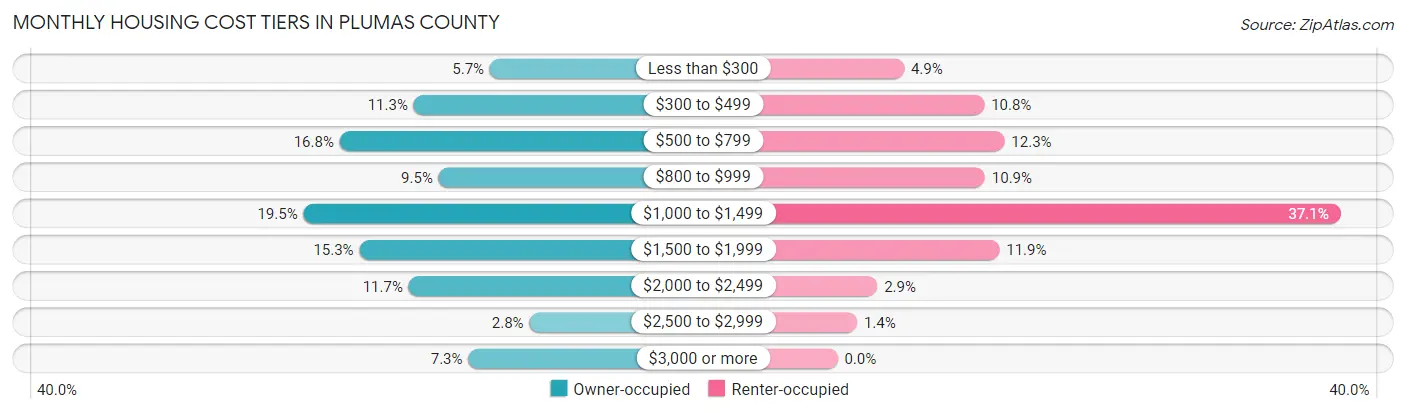
| Monthly Cost | Owner-occupied | Renter-occupied |
| Less than $300 | 345 (5.7%) | 102 (4.9%) |
| $300 to $499 | 683 (11.3%) | 225 (10.8%) |
| $500 to $799 | 1,011 (16.8%) | 256 (12.3%) |
| $800 to $999 | 572 (9.5%) | 226 (10.9%) |
| $1,000 to $1,499 | 1,172 (19.5%) | 771 (37.0%) |
| $1,500 to $1,999 | 924 (15.3%) | 248 (11.9%) |
| $2,000 to $2,499 | 705 (11.7%) | 61 (2.9%) |
| $2,500 to $2,999 | 170 (2.8%) | 30 (1.4%) |
| $3,000 or more | 441 (7.3%) | 0 (0.0%) |
| Total | 6,023 (100.0%) | 2,081 (100.0%) |
Physical Housing Characteristics in Plumas County
Housing Structures in Plumas County
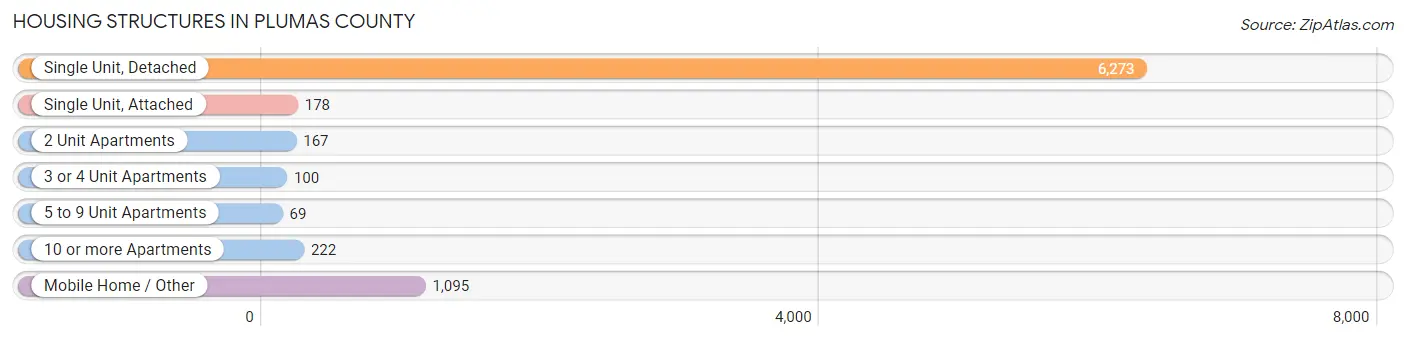
| Structure Type | # Housing Units | % Housing Units |
| Single Unit, Detached | 6,273 | 77.4% |
| Single Unit, Attached | 178 | 2.2% |
| 2 Unit Apartments | 167 | 2.1% |
| 3 or 4 Unit Apartments | 100 | 1.2% |
| 5 to 9 Unit Apartments | 69 | 0.9% |
| 10 or more Apartments | 222 | 2.7% |
| Mobile Home / Other | 1,095 | 13.5% |
| Total | 8,104 | 100.0% |
Housing Structures by Occupancy in Plumas County
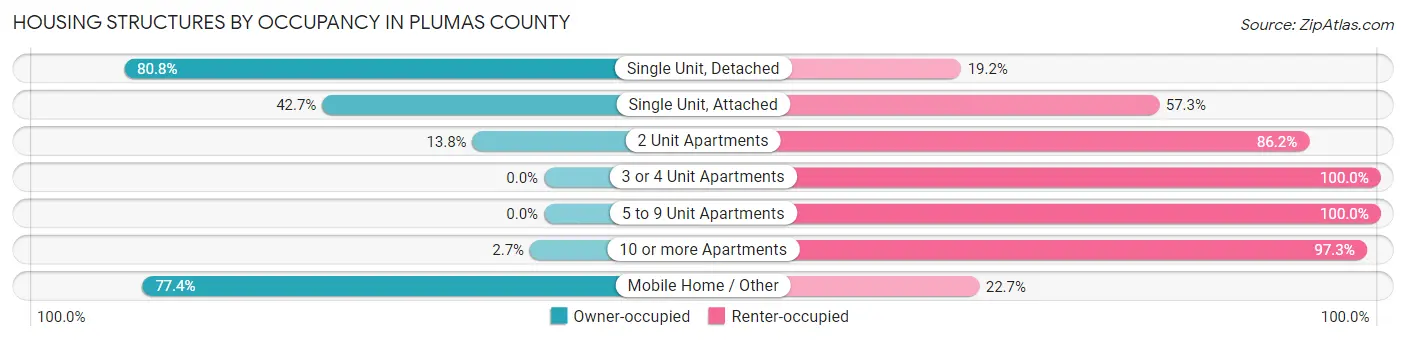
| Structure Type | Owner-occupied | Renter-occupied |
| Single Unit, Detached | 5,071 (80.8%) | 1,202 (19.2%) |
| Single Unit, Attached | 76 (42.7%) | 102 (57.3%) |
| 2 Unit Apartments | 23 (13.8%) | 144 (86.2%) |
| 3 or 4 Unit Apartments | 0 (0.0%) | 100 (100.0%) |
| 5 to 9 Unit Apartments | 0 (0.0%) | 69 (100.0%) |
| 10 or more Apartments | 6 (2.7%) | 216 (97.3%) |
| Mobile Home / Other | 847 (77.3%) | 248 (22.7%) |
| Total | 6,023 (74.3%) | 2,081 (25.7%) |
Housing Structures by Number of Rooms in Plumas County
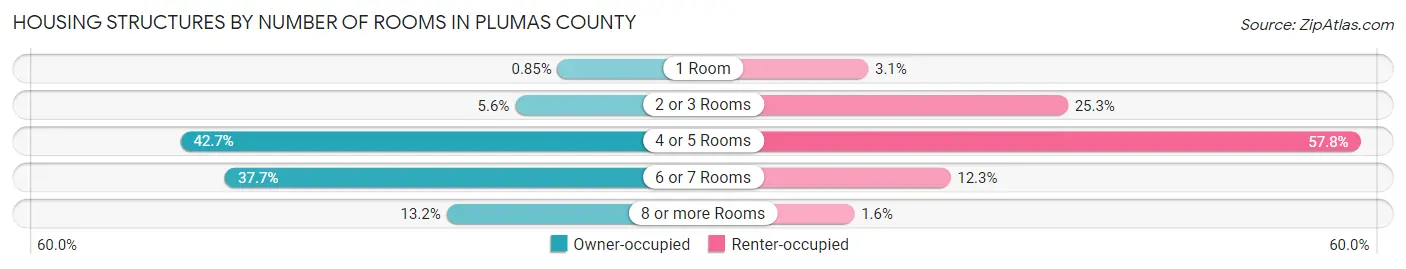
| Number of Rooms | Owner-occupied | Renter-occupied |
| 1 Room | 51 (0.9%) | 65 (3.1%) |
| 2 or 3 Rooms | 334 (5.6%) | 526 (25.3%) |
| 4 or 5 Rooms | 2,572 (42.7%) | 1,202 (57.8%) |
| 6 or 7 Rooms | 2,273 (37.7%) | 255 (12.2%) |
| 8 or more Rooms | 793 (13.2%) | 33 (1.6%) |
| Total | 6,023 (100.0%) | 2,081 (100.0%) |
Housing Structure by Heating Type in Plumas County
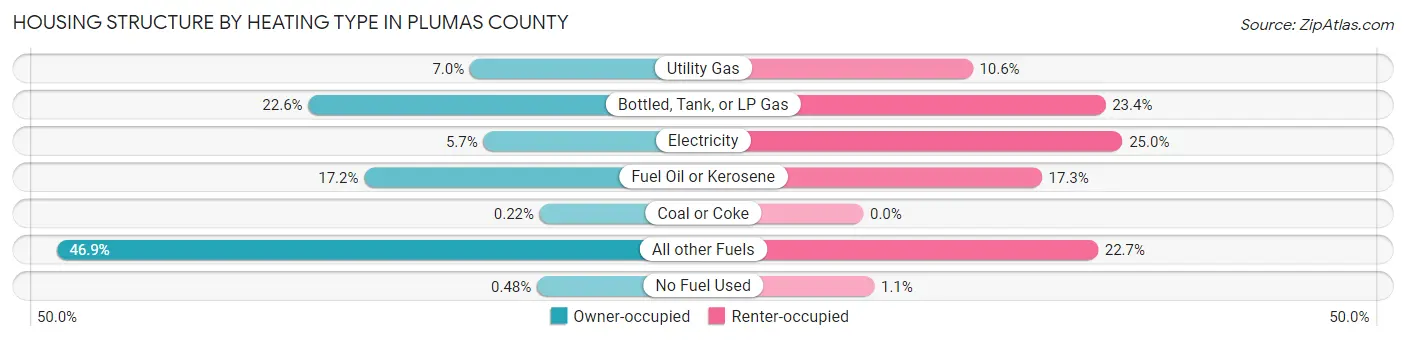
| Heating Type | Owner-occupied | Renter-occupied |
| Utility Gas | 419 (7.0%) | 220 (10.6%) |
| Bottled, Tank, or LP Gas | 1,360 (22.6%) | 487 (23.4%) |
| Electricity | 341 (5.7%) | 521 (25.0%) |
| Fuel Oil or Kerosene | 1,035 (17.2%) | 359 (17.2%) |
| Coal or Coke | 13 (0.2%) | 0 (0.0%) |
| All other Fuels | 2,826 (46.9%) | 472 (22.7%) |
| No Fuel Used | 29 (0.5%) | 22 (1.1%) |
| Total | 6,023 (100.0%) | 2,081 (100.0%) |
Household Vehicle Usage in Plumas County
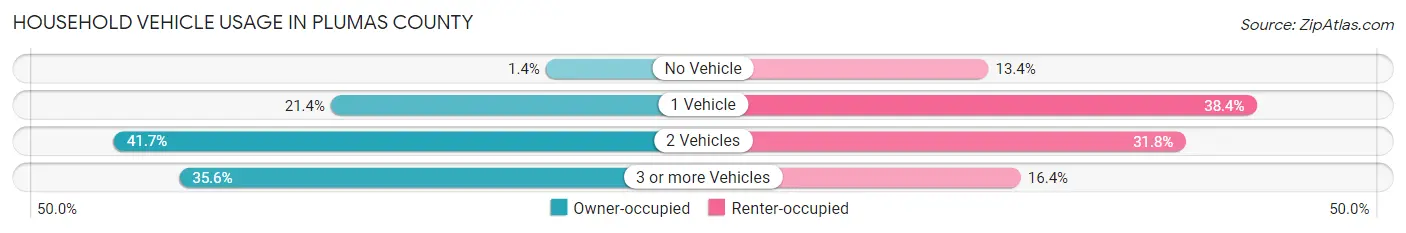
| Vehicles per Household | Owner-occupied | Renter-occupied |
| No Vehicle | 82 (1.4%) | 279 (13.4%) |
| 1 Vehicle | 1,290 (21.4%) | 799 (38.4%) |
| 2 Vehicles | 2,509 (41.7%) | 661 (31.8%) |
| 3 or more Vehicles | 2,142 (35.6%) | 342 (16.4%) |
| Total | 6,023 (100.0%) | 2,081 (100.0%) |
Real Estate & Mortgages in Plumas County
Real Estate and Mortgage Overview in Plumas County
| Characteristic | Without Mortgage | With Mortgage |
| Housing Units | 2,568 | 3,455 |
| Median Property Value | $283,600 | $327,200 |
| Median Household Income | $46,653 | $1,017 |
| Monthly Housing Costs | $575 | $419 |
| Real Estate Taxes | $1,725 | $50 |
Property Value by Mortgage Status in Plumas County
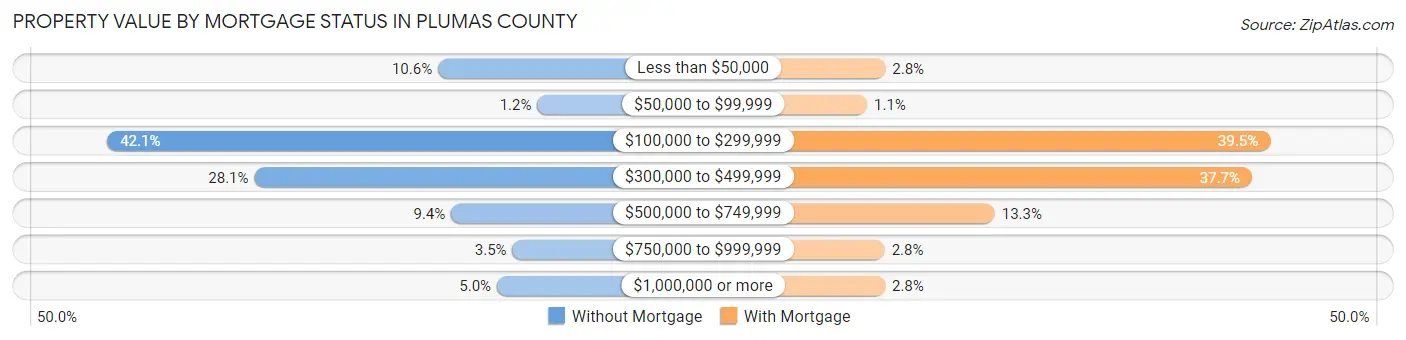
| Property Value | Without Mortgage | With Mortgage |
| Less than $50,000 | 273 (10.6%) | 98 (2.8%) |
| $50,000 to $99,999 | 30 (1.2%) | 38 (1.1%) |
| $100,000 to $299,999 | 1,082 (42.1%) | 1,364 (39.5%) |
| $300,000 to $499,999 | 722 (28.1%) | 1,304 (37.7%) |
| $500,000 to $749,999 | 241 (9.4%) | 458 (13.3%) |
| $750,000 to $999,999 | 91 (3.5%) | 96 (2.8%) |
| $1,000,000 or more | 129 (5.0%) | 97 (2.8%) |
| Total | 2,568 (100.0%) | 3,455 (100.0%) |
Household Income by Mortgage Status in Plumas County
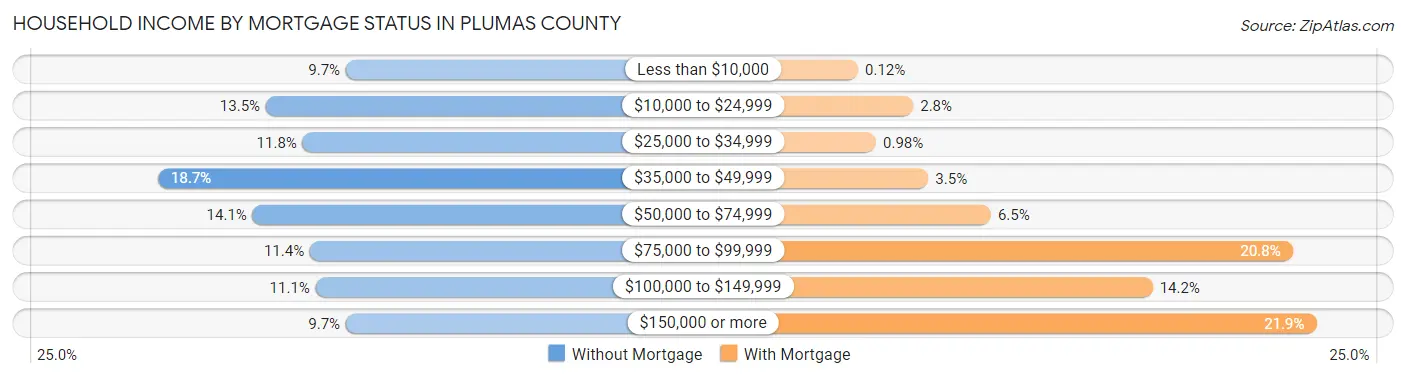
| Household Income | Without Mortgage | With Mortgage |
| Less than $10,000 | 249 (9.7%) | 4 (0.1%) |
| $10,000 to $24,999 | 347 (13.5%) | 95 (2.8%) |
| $25,000 to $34,999 | 302 (11.8%) | 34 (1.0%) |
| $35,000 to $49,999 | 479 (18.6%) | 120 (3.5%) |
| $50,000 to $74,999 | 363 (14.1%) | 223 (6.5%) |
| $75,000 to $99,999 | 293 (11.4%) | 719 (20.8%) |
| $100,000 to $149,999 | 286 (11.1%) | 489 (14.1%) |
| $150,000 or more | 249 (9.7%) | 758 (21.9%) |
| Total | 2,568 (100.0%) | 3,455 (100.0%) |
Property Value to Household Income Ratio in Plumas County
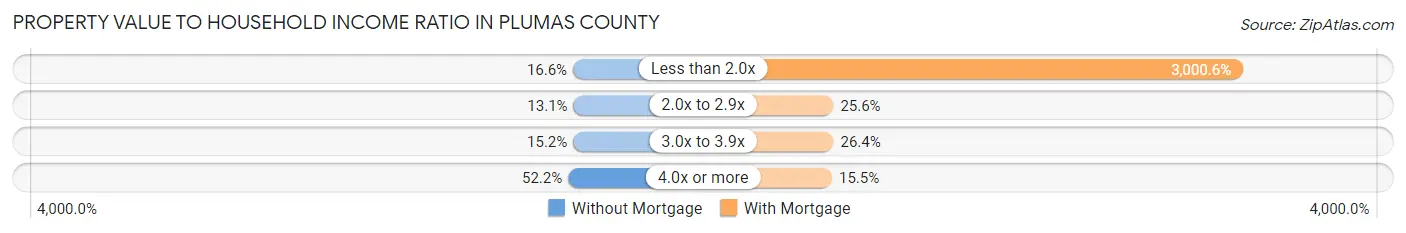
| Value-to-Income Ratio | Without Mortgage | With Mortgage |
| Less than 2.0x | 427 (16.6%) | 103,672 (3,000.6%) |
| 2.0x to 2.9x | 336 (13.1%) | 886 (25.6%) |
| 3.0x to 3.9x | 391 (15.2%) | 912 (26.4%) |
| 4.0x or more | 1,340 (52.2%) | 537 (15.5%) |
| Total | 2,568 (100.0%) | 3,455 (100.0%) |
Real Estate Taxes by Mortgage Status in Plumas County
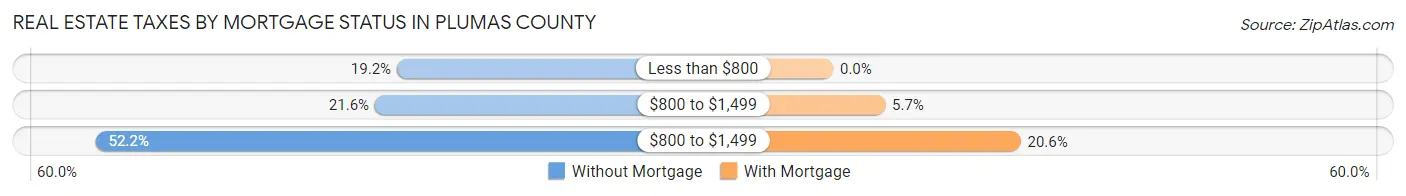
| Property Taxes | Without Mortgage | With Mortgage |
| Less than $800 | 493 (19.2%) | 0 (0.0%) |
| $800 to $1,499 | 555 (21.6%) | 197 (5.7%) |
| $800 to $1,499 | 1,341 (52.2%) | 710 (20.5%) |
| Total | 2,568 (100.0%) | 3,455 (100.0%) |
Health & Disability in Plumas County
Health Insurance Coverage by Age in Plumas County
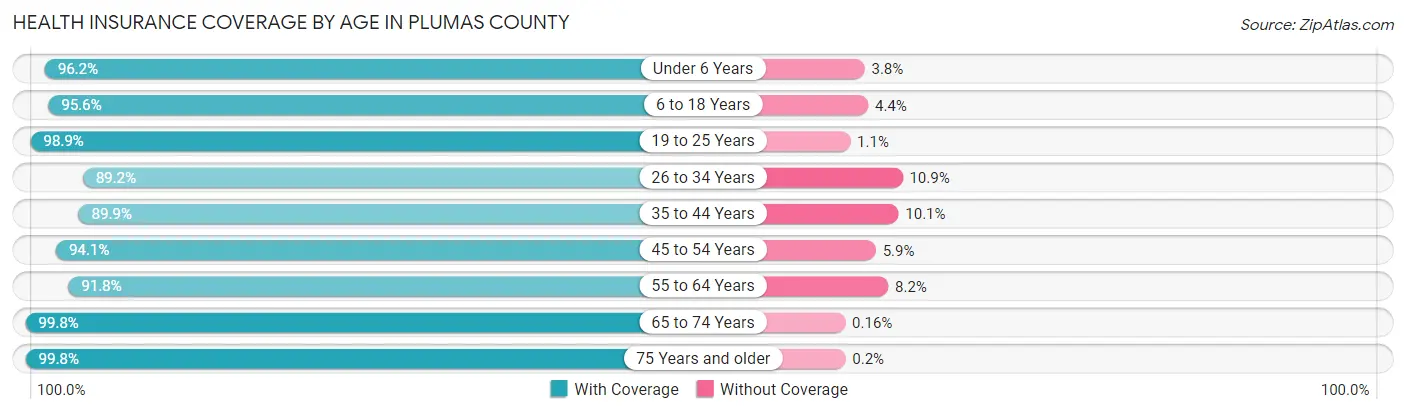
| Age Bracket | With Coverage | Without Coverage |
| Under 6 Years | 942 (96.2%) | 37 (3.8%) |
| 6 to 18 Years | 2,459 (95.6%) | 114 (4.4%) |
| 19 to 25 Years | 999 (98.9%) | 11 (1.1%) |
| 26 to 34 Years | 1,627 (89.1%) | 198 (10.8%) |
| 35 to 44 Years | 1,766 (89.9%) | 198 (10.1%) |
| 45 to 54 Years | 1,816 (94.1%) | 113 (5.9%) |
| 55 to 64 Years | 3,191 (91.8%) | 284 (8.2%) |
| 65 to 74 Years | 3,685 (99.8%) | 6 (0.2%) |
| 75 Years and older | 2,035 (99.8%) | 4 (0.2%) |
| Total | 18,520 (95.1%) | 965 (5.0%) |
Health Insurance Coverage by Citizenship Status in Plumas County
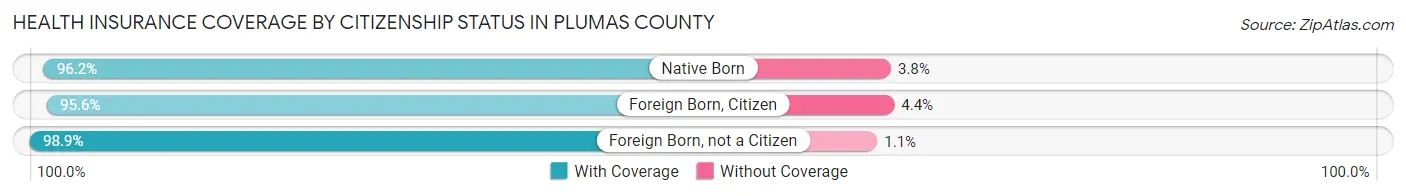
| Citizenship Status | With Coverage | Without Coverage |
| Native Born | 942 (96.2%) | 37 (3.8%) |
| Foreign Born, Citizen | 2,459 (95.6%) | 114 (4.4%) |
| Foreign Born, not a Citizen | 999 (98.9%) | 11 (1.1%) |
Health Insurance Coverage by Household Income in Plumas County
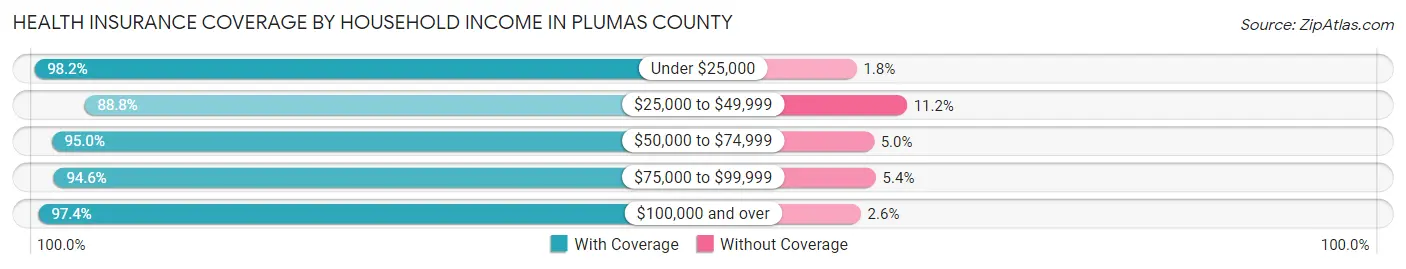
| Household Income | With Coverage | Without Coverage |
| Under $25,000 | 1,840 (98.2%) | 34 (1.8%) |
| $25,000 to $49,999 | 3,253 (88.8%) | 411 (11.2%) |
| $50,000 to $74,999 | 2,922 (95.0%) | 155 (5.0%) |
| $75,000 to $99,999 | 2,517 (94.6%) | 144 (5.4%) |
| $100,000 and over | 7,716 (97.4%) | 206 (2.6%) |
Public vs Private Health Insurance Coverage by Age in Plumas County
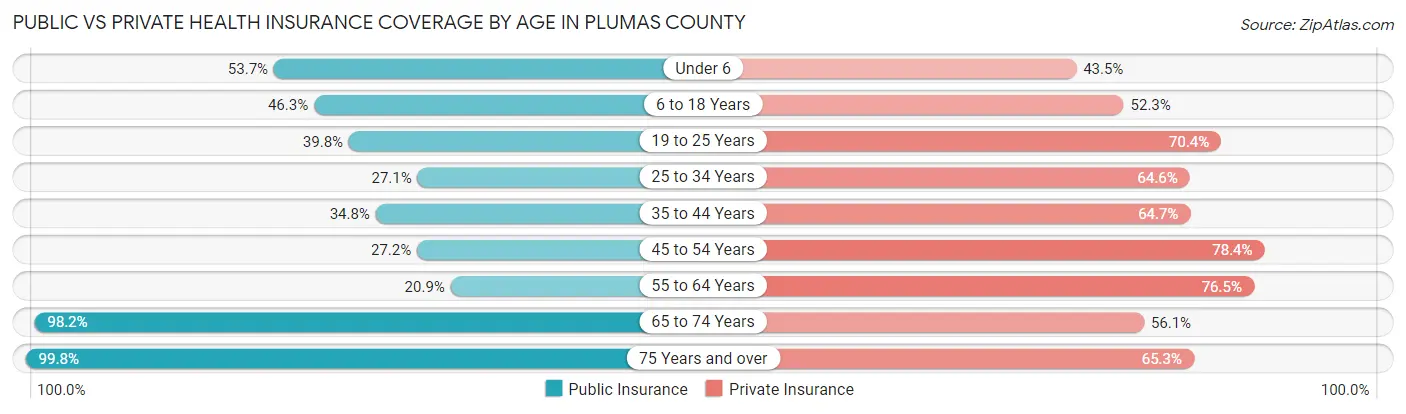
| Age Bracket | Public Insurance | Private Insurance |
| Under 6 | 526 (53.7%) | 426 (43.5%) |
| 6 to 18 Years | 1,191 (46.3%) | 1,346 (52.3%) |
| 19 to 25 Years | 402 (39.8%) | 711 (70.4%) |
| 25 to 34 Years | 494 (27.1%) | 1,178 (64.5%) |
| 35 to 44 Years | 684 (34.8%) | 1,270 (64.7%) |
| 45 to 54 Years | 524 (27.2%) | 1,513 (78.4%) |
| 55 to 64 Years | 727 (20.9%) | 2,657 (76.5%) |
| 65 to 74 Years | 3,624 (98.2%) | 2,070 (56.1%) |
| 75 Years and over | 2,035 (99.8%) | 1,332 (65.3%) |
| Total | 10,207 (52.4%) | 12,503 (64.2%) |
Disability Status by Sex by Age in Plumas County
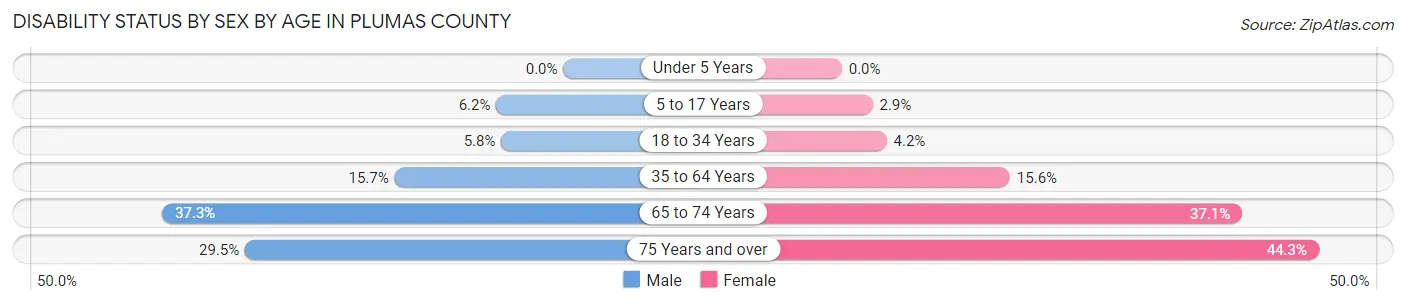
| Age Bracket | Male | Female |
| Under 5 Years | 0 (0.0%) | 0 (0.0%) |
| 5 to 17 Years | 92 (6.2%) | 30 (2.9%) |
| 18 to 34 Years | 91 (5.8%) | 58 (4.2%) |
| 35 to 64 Years | 555 (15.7%) | 597 (15.6%) |
| 65 to 74 Years | 733 (37.2%) | 640 (37.1%) |
| 75 Years and over | 306 (29.5%) | 444 (44.3%) |
Disability Class by Sex by Age in Plumas County
Disability Class: Hearing Difficulty
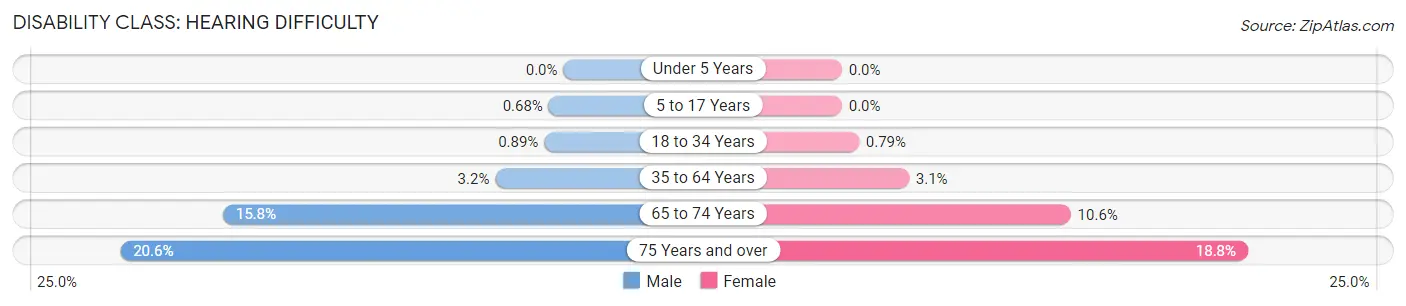
| Age Bracket | Male | Female |
| Under 5 Years | 0 (0.0%) | 0 (0.0%) |
| 5 to 17 Years | 10 (0.7%) | 0 (0.0%) |
| 18 to 34 Years | 14 (0.9%) | 11 (0.8%) |
| 35 to 64 Years | 112 (3.2%) | 119 (3.1%) |
| 65 to 74 Years | 311 (15.8%) | 183 (10.6%) |
| 75 Years and over | 213 (20.6%) | 189 (18.8%) |
Disability Class: Vision Difficulty
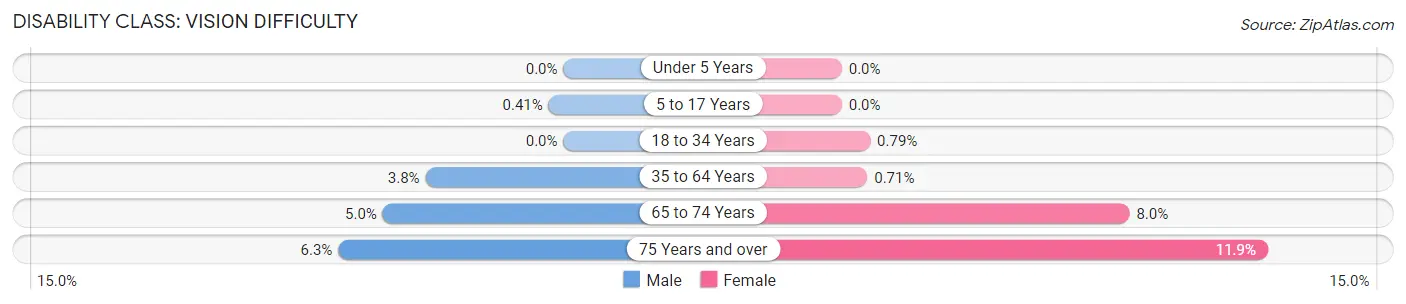
| Age Bracket | Male | Female |
| Under 5 Years | 0 (0.0%) | 0 (0.0%) |
| 5 to 17 Years | 6 (0.4%) | 0 (0.0%) |
| 18 to 34 Years | 0 (0.0%) | 11 (0.8%) |
| 35 to 64 Years | 136 (3.8%) | 27 (0.7%) |
| 65 to 74 Years | 99 (5.0%) | 138 (8.0%) |
| 75 Years and over | 65 (6.3%) | 119 (11.9%) |
Disability Class: Cognitive Difficulty
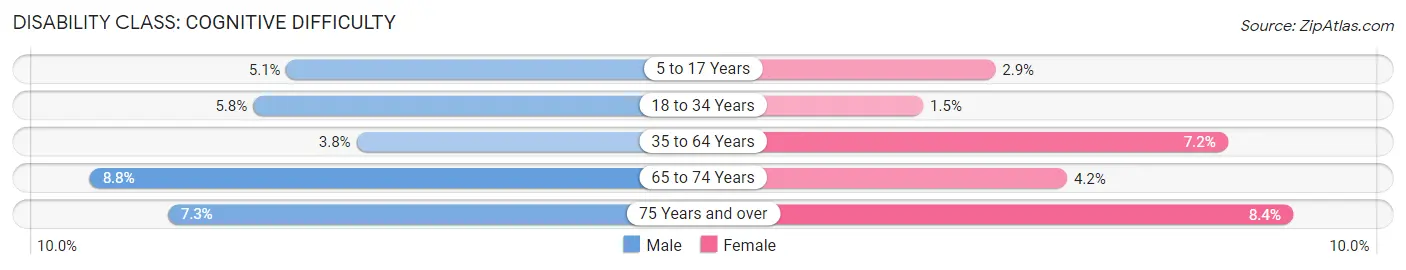
| Age Bracket | Male | Female |
| 5 to 17 Years | 76 (5.1%) | 30 (2.9%) |
| 18 to 34 Years | 91 (5.8%) | 21 (1.5%) |
| 35 to 64 Years | 136 (3.8%) | 274 (7.2%) |
| 65 to 74 Years | 173 (8.8%) | 72 (4.2%) |
| 75 Years and over | 76 (7.3%) | 84 (8.4%) |
Disability Class: Ambulatory Difficulty
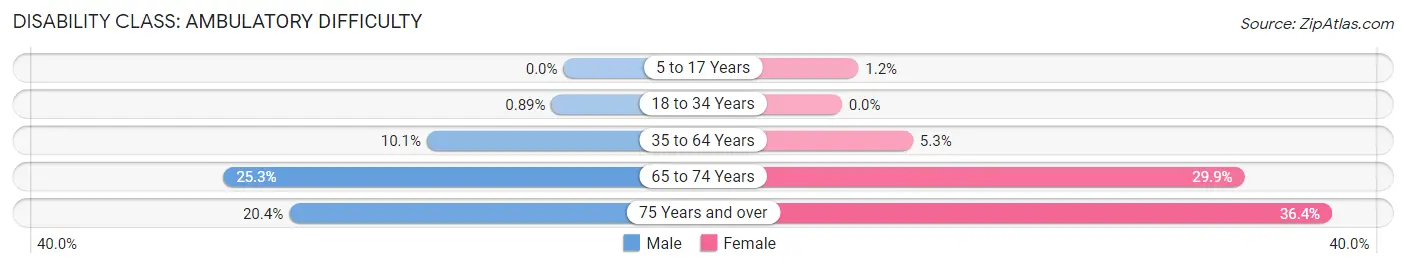
| Age Bracket | Male | Female |
| 5 to 17 Years | 0 (0.0%) | 13 (1.2%) |
| 18 to 34 Years | 14 (0.9%) | 0 (0.0%) |
| 35 to 64 Years | 359 (10.1%) | 202 (5.3%) |
| 65 to 74 Years | 497 (25.3%) | 515 (29.9%) |
| 75 Years and over | 211 (20.4%) | 365 (36.4%) |
Disability Class: Self-Care Difficulty
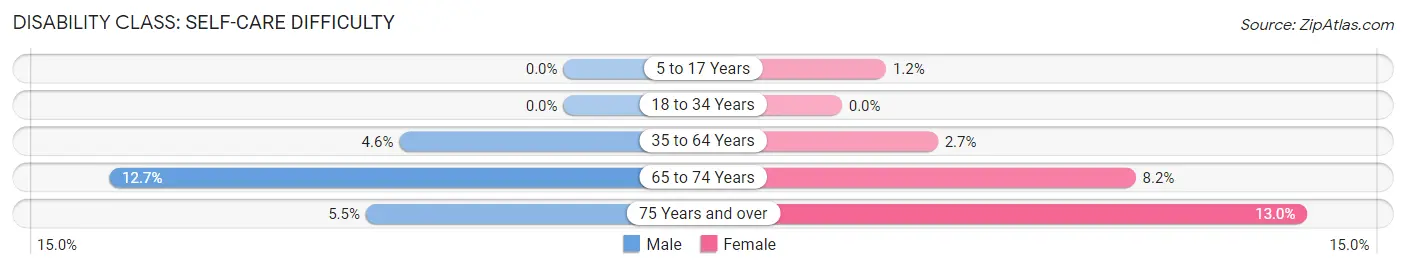
| Age Bracket | Male | Female |
| 5 to 17 Years | 0 (0.0%) | 13 (1.2%) |
| 18 to 34 Years | 0 (0.0%) | 0 (0.0%) |
| 35 to 64 Years | 162 (4.6%) | 102 (2.7%) |
| 65 to 74 Years | 249 (12.7%) | 141 (8.2%) |
| 75 Years and over | 57 (5.5%) | 130 (13.0%) |
Technology Access in Plumas County
Computing Device Access in Plumas County
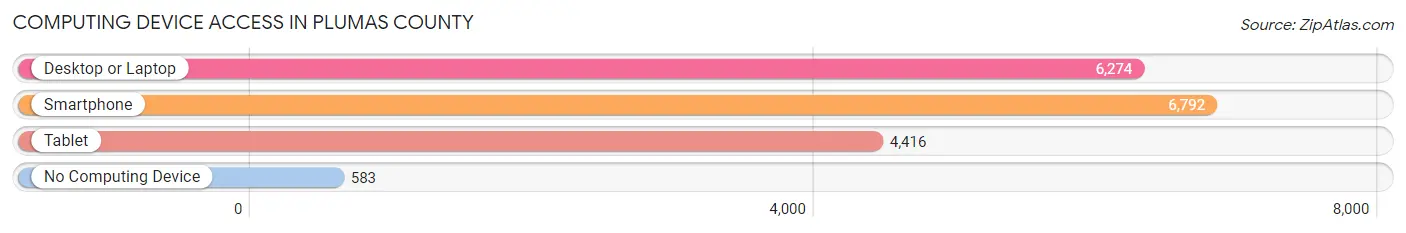
| Device Type | # Households | % Households |
| Desktop or Laptop | 6,274 | 77.4% |
| Smartphone | 6,792 | 83.8% |
| Tablet | 4,416 | 54.5% |
| No Computing Device | 583 | 7.2% |
| Total | 8,104 | 100.0% |
Internet Access in Plumas County
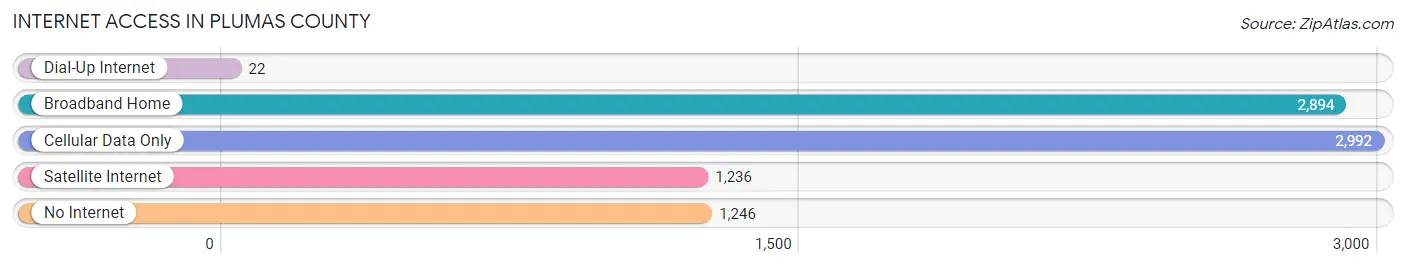
| Internet Type | # Households | % Households |
| Dial-Up Internet | 22 | 0.3% |
| Broadband Home | 2,894 | 35.7% |
| Cellular Data Only | 2,992 | 36.9% |
| Satellite Internet | 1,236 | 15.2% |
| No Internet | 1,246 | 15.4% |
| Total | 8,104 | 100.0% |
Plumas County Summary
Plumas County is a county located in the Sierra Nevada region of California. It is bordered by Lassen County to the north, Sierra County to the east, Nevada County to the south, and Butte County to the west. The county seat is Quincy. The county has a total area of 2,613 square miles, of which 2,590 square miles is land and 23 square miles is water.
History
Plumas County was formed in 1854 from parts of Butte, Yuba, and Sierra counties. It was named after the Spanish word for the Feather River, which flows through the county. The county was originally home to the Maidu, Washoe, and Paiute Native American tribes.
In the late 19th century, the county was a major producer of gold and silver. The county was also home to several lumber mills, which provided lumber for the construction of the transcontinental railroad.
In the early 20th century, Plumas County was a popular destination for tourists, who came to enjoy the area's natural beauty and outdoor activities. The county was also home to several resorts, including the famous Sierra Nevada House in Graeagle.
Geography
Plumas County is located in the Sierra Nevada region of California. It is bordered by Lassen County to the north, Sierra County to the east, Nevada County to the south, and Butte County to the west. The county has a total area of 2,613 square miles, of which 2,590 square miles is land and 23 square miles is water.
The county is home to several mountain ranges, including the Sierra Nevada, the Cascades, and the Plumas National Forest. The highest point in the county is Spanish Peak, which has an elevation of 8,717 feet.
The county is home to several rivers, including the Feather River, the Yuba River, and the American River. The county also contains several lakes, including Lake Almanor, Lake Davis, and Lake Oroville.
Economy
The economy of Plumas County is largely based on agriculture, forestry, and tourism. The county is home to several large agricultural operations, including cattle ranches, fruit orchards, and vineyards. The county is also home to several lumber mills, which provide lumber for the construction of homes and other buildings.
The county is also a popular destination for tourists, who come to enjoy the area's natural beauty and outdoor activities. The county is home to several resorts, including the famous Sierra Nevada House in Graeagle.
Demographics
As of the 2010 census, the population of Plumas County was 20,007. The racial makeup of the county was 87.3% White, 0.7% African American, 3.2% Native American, 0.7% Asian, 0.1% Pacific Islander, 4.3% from other races, and 3.7% from two or more races. Hispanic or Latino of any race were 10.2% of the population.
The median income for a household in the county was $37,813, and the median income for a family was $45,890. The per capita income for the county was $20,945. About 11.2% of families and 15.2% of the population were below the poverty line, including 19.2% of those under age 18 and 6.7% of those age 65 or over.
Common Questions
What is Per Capita Income in Plumas County?
Per Capita income in Plumas County is $41,701.
What is the Median Family Income in Plumas County?
Median Family Income in Plumas County is $86,990.
What is the Median Household income in Plumas County?
Median Household Income in Plumas County is $67,885.
What is Income or Wage Gap in Plumas County?
Income or Wage Gap in Plumas County is 25.5%.
Women in Plumas County earn 74.5 cents for every dollar earned by a man.
What is Inequality or Gini Index in Plumas County?
Inequality or Gini Index in Plumas County is 0.47.
What is the Total Population of Plumas County?
Total Population of Plumas County is 19,650.
What is the Total Male Population of Plumas County?
Total Male Population of Plumas County is 10,167.
What is the Total Female Population of Plumas County?
Total Female Population of Plumas County is 9,483.
What is the Ratio of Males per 100 Females in Plumas County?
There are 107.21 Males per 100 Females in Plumas County.
What is the Ratio of Females per 100 Males in Plumas County?
There are 93.27 Females per 100 Males in Plumas County.
What is the Median Population Age in Plumas County?
Median Population Age in Plumas County is 52.3 Years.
What is the Average Family Size in Plumas County
Average Family Size in Plumas County is 2.9 People.
What is the Average Household Size in Plumas County
Average Household Size in Plumas County is 2.4 People.
How Large is the Labor Force in Plumas County?
There are 8,342 People in the Labor Forcein in Plumas County.
What is the Percentage of People in the Labor Force in Plumas County?
50.0% of People are in the Labor Force in Plumas County.
What is the Unemployment Rate in Plumas County?
Unemployment Rate in Plumas County is 8.0%.