Placer County, CA Map & Demographics
Placer County Map
Placer County Overview
$54,004
PER CAPITA INCOME
$131,178
AVG FAMILY INCOME
$109,375
AVG HOUSEHOLD INCOME
35.0%
WAGE / INCOME GAP [ % ]
65.0¢/ $1
WAGE / INCOME GAP [ $ ]
$10,931
FAMILY INCOME DEFICIT
0.44
INEQUALITY / GINI INDEX
406,608
TOTAL POPULATION
200,326
MALE POPULATION
206,282
FEMALE POPULATION
97.11
MALES / 100 FEMALES
102.97
FEMALES / 100 MALES
42.3
MEDIAN AGE
3.1
AVG FAMILY SIZE
2.6
AVG HOUSEHOLD SIZE
199,679
LABOR FORCE [ PEOPLE ]
60.8%
PERCENT IN LABOR FORCE
4.3%
UNEMPLOYMENT RATE
Income in Placer County
Income Overview in Placer County
Per Capita Income in Placer County is $54,004, while median incomes of families and households are $131,178 and $109,375 respectively.
| Characteristic | Number | Measure |
| Per Capita Income | 406,608 | $54,004 |
| Median Family Income | 107,604 | $131,178 |
| Mean Family Income | 107,604 | $162,846 |
| Median Household Income | 152,537 | $109,375 |
| Mean Household Income | 152,537 | $140,703 |
| Income Deficit | 107,604 | $10,931 |
| Wage / Income Gap (%) | 406,608 | 35.03% |
| Wage / Income Gap ($) | 406,608 | 64.97¢ per $1 |
| Gini / Inequality Index | 406,608 | 0.44 |
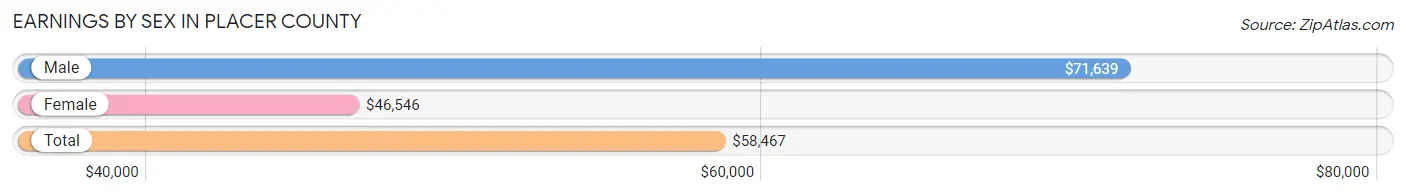
Earnings by Sex in Placer County
Average Earnings in Placer County are $58,467, $71,639 for men and $46,546 for women, a difference of 35.0%.
| Sex | Number | Average Earnings |
| Male | 110,015 (53.1%) | $71,639 |
| Female | 96,965 (46.9%) | $46,546 |
| Total | 206,980 (100.0%) | $58,467 |
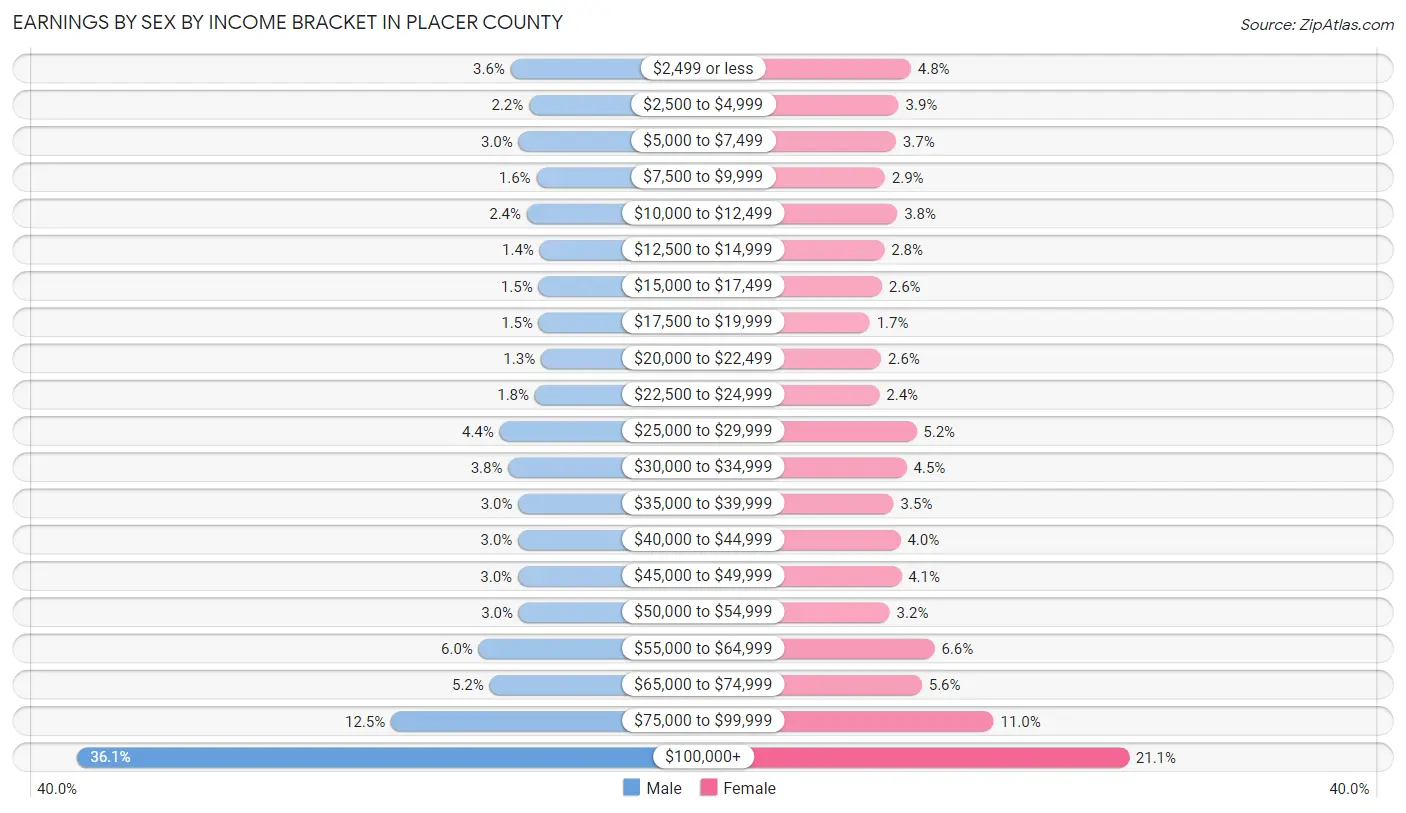
Earnings by Sex by Income Bracket in Placer County
The most common earnings brackets in Placer County are $100,000+ for men (39,665 | 36.0%) and $100,000+ for women (20,503 | 21.1%).
| Income | Male | Female |
| $2,499 or less | 3,923 (3.6%) | 4,652 (4.8%) |
| $2,500 to $4,999 | 2,405 (2.2%) | 3,761 (3.9%) |
| $5,000 to $7,499 | 3,274 (3.0%) | 3,564 (3.7%) |
| $7,500 to $9,999 | 1,808 (1.6%) | 2,760 (2.9%) |
| $10,000 to $12,499 | 2,595 (2.4%) | 3,670 (3.8%) |
| $12,500 to $14,999 | 1,545 (1.4%) | 2,727 (2.8%) |
| $15,000 to $17,499 | 1,637 (1.5%) | 2,550 (2.6%) |
| $17,500 to $19,999 | 1,604 (1.5%) | 1,672 (1.7%) |
| $20,000 to $22,499 | 1,425 (1.3%) | 2,491 (2.6%) |
| $22,500 to $24,999 | 1,931 (1.8%) | 2,366 (2.4%) |
| $25,000 to $29,999 | 4,843 (4.4%) | 5,049 (5.2%) |
| $30,000 to $34,999 | 4,121 (3.7%) | 4,346 (4.5%) |
| $35,000 to $39,999 | 3,303 (3.0%) | 3,399 (3.5%) |
| $40,000 to $44,999 | 3,311 (3.0%) | 3,899 (4.0%) |
| $45,000 to $49,999 | 3,336 (3.0%) | 3,957 (4.1%) |
| $50,000 to $54,999 | 3,259 (3.0%) | 3,114 (3.2%) |
| $55,000 to $64,999 | 6,570 (6.0%) | 6,367 (6.6%) |
| $65,000 to $74,999 | 5,669 (5.1%) | 5,449 (5.6%) |
| $75,000 to $99,999 | 13,791 (12.5%) | 10,669 (11.0%) |
| $100,000+ | 39,665 (36.0%) | 20,503 (21.1%) |
| Total | 110,015 (100.0%) | 96,965 (100.0%) |
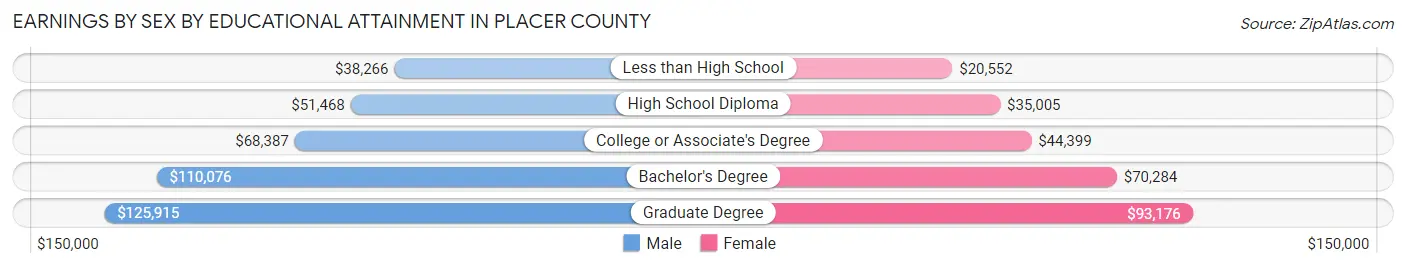
Earnings by Sex by Educational Attainment in Placer County
Average earnings in Placer County are $82,362 for men and $55,480 for women, a difference of 32.6%. Men with an educational attainment of graduate degree enjoy the highest average annual earnings of $125,915, while those with less than high school education earn the least with $38,266. Women with an educational attainment of graduate degree earn the most with the average annual earnings of $93,176, while those with less than high school education have the smallest earnings of $20,552.
| Educational Attainment | Male Income | Female Income |
| Less than High School | $38,266 | $20,552 |
| High School Diploma | $51,468 | $35,005 |
| College or Associate's Degree | $68,387 | $44,399 |
| Bachelor's Degree | $110,076 | $70,284 |
| Graduate Degree | $125,915 | $93,176 |
| Total | $82,362 | $55,480 |
Family Income in Placer County
Family Income Brackets in Placer County
According to the Placer County family income data, there are 29,053 families falling into the $200,000+ income range, which is the most common income bracket and makes up 27.0% of all families. Conversely, the $10,000 to $14,999 income bracket is the least frequent group with only 968 families (0.9%) belonging to this category.
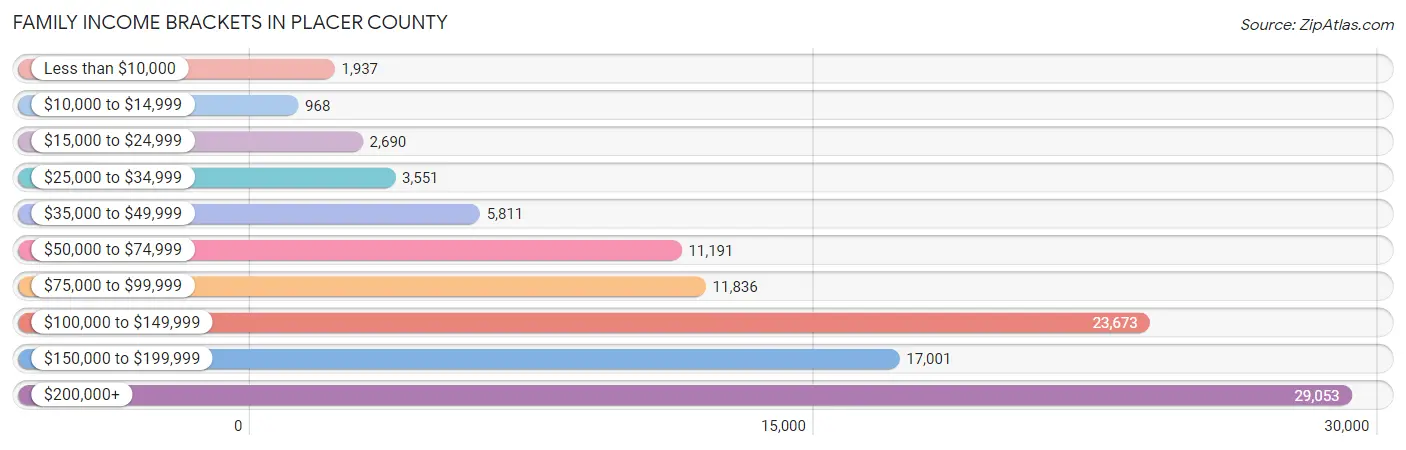
| Income Bracket | # Families | % Families |
| Less than $10,000 | 1,937 | 1.8% |
| $10,000 to $14,999 | 968 | 0.9% |
| $15,000 to $24,999 | 2,690 | 2.5% |
| $25,000 to $34,999 | 3,551 | 3.3% |
| $35,000 to $49,999 | 5,811 | 5.4% |
| $50,000 to $74,999 | 11,191 | 10.4% |
| $75,000 to $99,999 | 11,836 | 11.0% |
| $100,000 to $149,999 | 23,673 | 22.0% |
| $150,000 to $199,999 | 17,001 | 15.8% |
| $200,000+ | 29,053 | 27.0% |
Family Income by Famaliy Size in Placer County
4-person families (21,794 | 20.3%) account for the highest median family income in Placer County with $172,835 per family, while 2-person families (50,091 | 46.6%) have the highest median income of $54,656 per family member.
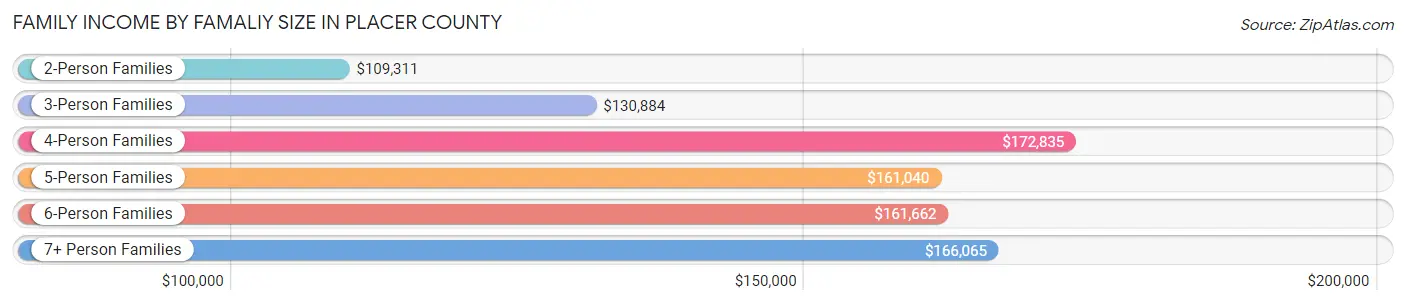
| Income Bracket | # Families | Median Income |
| 2-Person Families | 50,091 (46.6%) | $109,311 |
| 3-Person Families | 22,365 (20.8%) | $130,884 |
| 4-Person Families | 21,794 (20.3%) | $172,835 |
| 5-Person Families | 9,444 (8.8%) | $161,040 |
| 6-Person Families | 2,821 (2.6%) | $161,662 |
| 7+ Person Families | 1,089 (1.0%) | $166,065 |
| Total | 107,604 (100.0%) | $131,178 |
Family Income by Number of Earners in Placer County
The median family income in Placer County is $131,178, with families comprising 3+ earners (12,096) having the highest median family income of $198,834, while families with no earners (18,311) have the lowest median family income of $76,572, accounting for 11.2% and 17.0% of families, respectively.
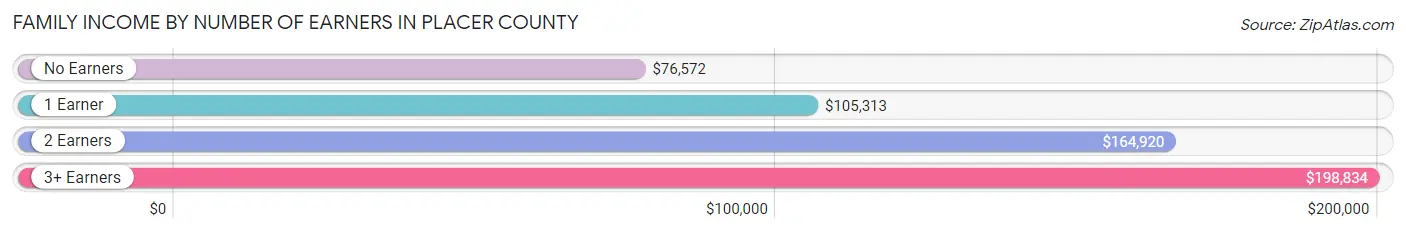
| Number of Earners | # Families | Median Income |
| No Earners | 18,311 (17.0%) | $76,572 |
| 1 Earner | 33,587 (31.2%) | $105,313 |
| 2 Earners | 43,610 (40.5%) | $164,920 |
| 3+ Earners | 12,096 (11.2%) | $198,834 |
| Total | 107,604 (100.0%) | $131,178 |
Household Income in Placer County
Household Income Brackets in Placer County
With 32,795 households falling in the category, the $200,000+ income range is the most frequent in Placer County, accounting for 21.5% of all households. In contrast, only 3,051 households (2.0%) fall into the $10,000 to $14,999 income bracket, making it the least populous group.
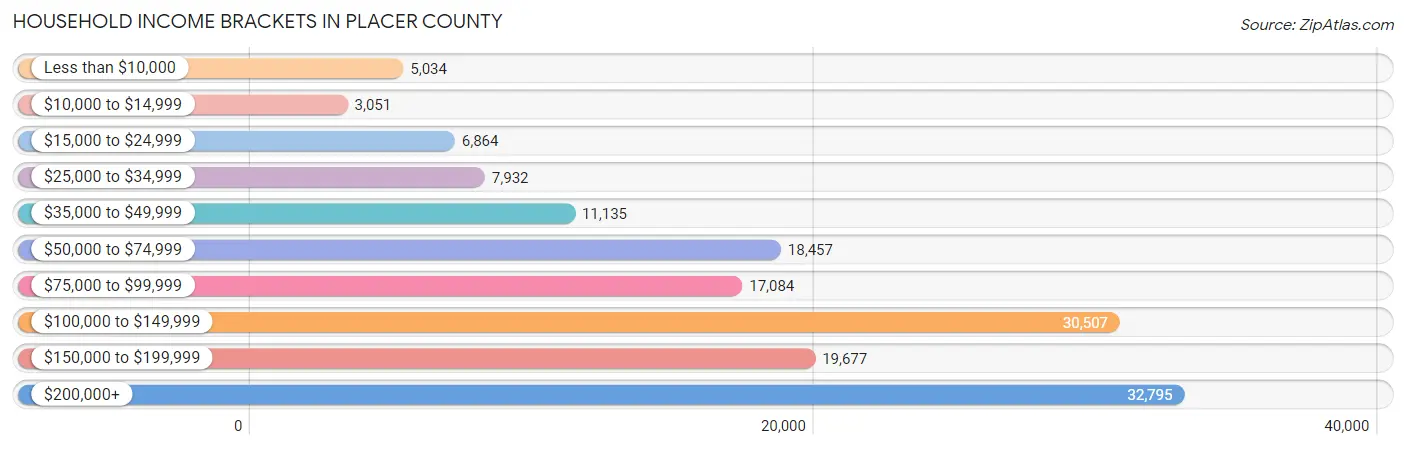
| Income Bracket | # Households | % Households |
| Less than $10,000 | 5,034 | 3.3% |
| $10,000 to $14,999 | 3,051 | 2.0% |
| $15,000 to $24,999 | 6,864 | 4.5% |
| $25,000 to $34,999 | 7,932 | 5.2% |
| $35,000 to $49,999 | 11,135 | 7.3% |
| $50,000 to $74,999 | 18,457 | 12.1% |
| $75,000 to $99,999 | 17,084 | 11.2% |
| $100,000 to $149,999 | 30,507 | 20.0% |
| $150,000 to $199,999 | 19,677 | 12.9% |
| $200,000+ | 32,795 | 21.5% |
Household Income by Householder Age in Placer County
The median household income in Placer County is $109,375, with the highest median household income of $136,087 found in the 45 to 64 years age bracket for the primary householder. A total of 58,056 households (38.1%) fall into this category. Meanwhile, the 15 to 24 years age bracket for the primary householder has the lowest median household income of $58,906, with 2,677 households (1.8%) in this group.
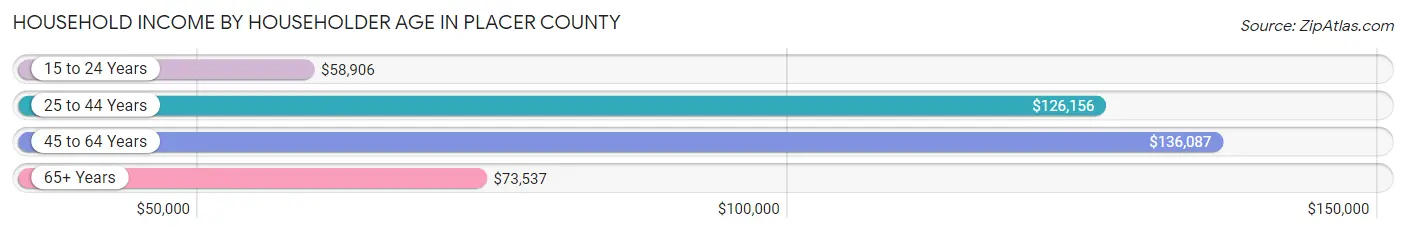
| Income Bracket | # Households | Median Income |
| 15 to 24 Years | 2,677 (1.8%) | $58,906 |
| 25 to 44 Years | 43,324 (28.4%) | $126,156 |
| 45 to 64 Years | 58,056 (38.1%) | $136,087 |
| 65+ Years | 48,480 (31.8%) | $73,537 |
| Total | 152,537 (100.0%) | $109,375 |
Poverty in Placer County
Income Below Poverty by Sex and Age in Placer County
With 6.2% poverty level for males and 7.3% for females among the residents of Placer County, 18 to 24 year old males and 75 year old and over females are the most vulnerable to poverty, with 1,392 males (9.0%) and 2,123 females (10.6%) in their respective age groups living below the poverty level.
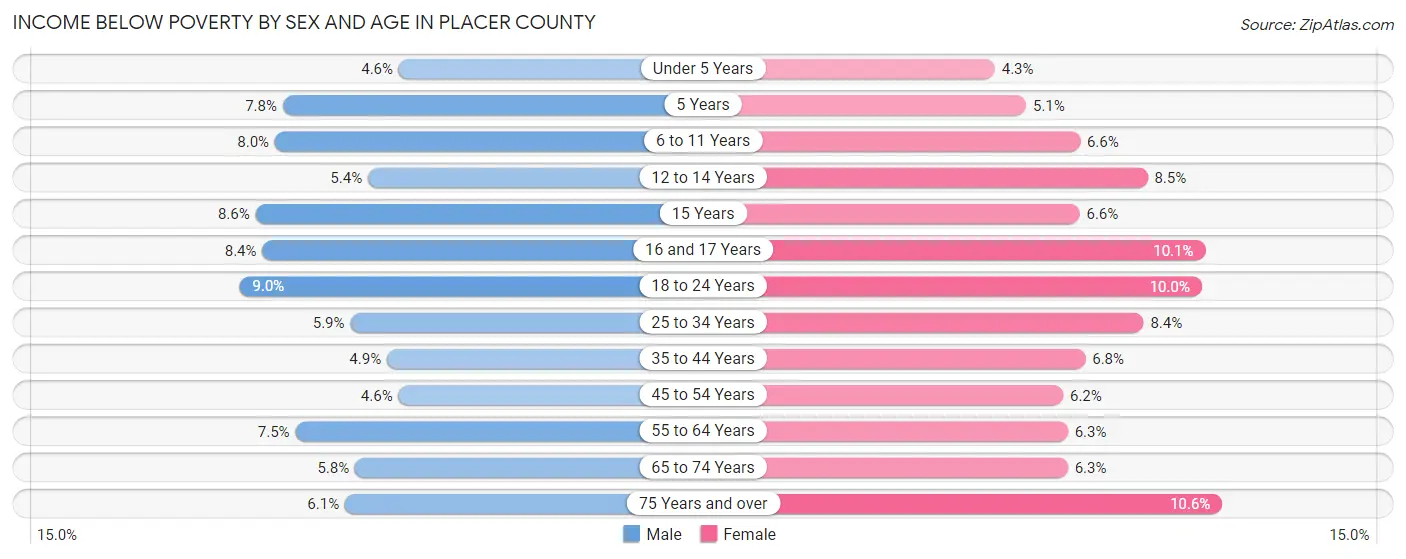
| Age Bracket | Male | Female |
| Under 5 Years | 482 (4.6%) | 413 (4.3%) |
| 5 Years | 192 (7.8%) | 106 (5.1%) |
| 6 to 11 Years | 1,257 (8.0%) | 997 (6.6%) |
| 12 to 14 Years | 454 (5.4%) | 684 (8.5%) |
| 15 Years | 236 (8.6%) | 187 (6.6%) |
| 16 and 17 Years | 490 (8.4%) | 515 (10.1%) |
| 18 to 24 Years | 1,392 (9.0%) | 1,430 (10.0%) |
| 25 to 34 Years | 1,300 (5.9%) | 1,816 (8.4%) |
| 35 to 44 Years | 1,349 (4.9%) | 1,846 (6.8%) |
| 45 to 54 Years | 1,213 (4.6%) | 1,640 (6.2%) |
| 55 to 64 Years | 1,950 (7.5%) | 1,740 (6.3%) |
| 65 to 74 Years | 1,216 (5.8%) | 1,527 (6.3%) |
| 75 Years and over | 891 (6.1%) | 2,123 (10.6%) |
| Total | 12,422 (6.2%) | 15,024 (7.3%) |
Income Above Poverty by Sex and Age in Placer County
According to the poverty statistics in Placer County, males aged under 5 years and females aged under 5 years are the age groups that are most secure financially, with 95.4% of males and 95.7% of females in these age groups living above the poverty line.
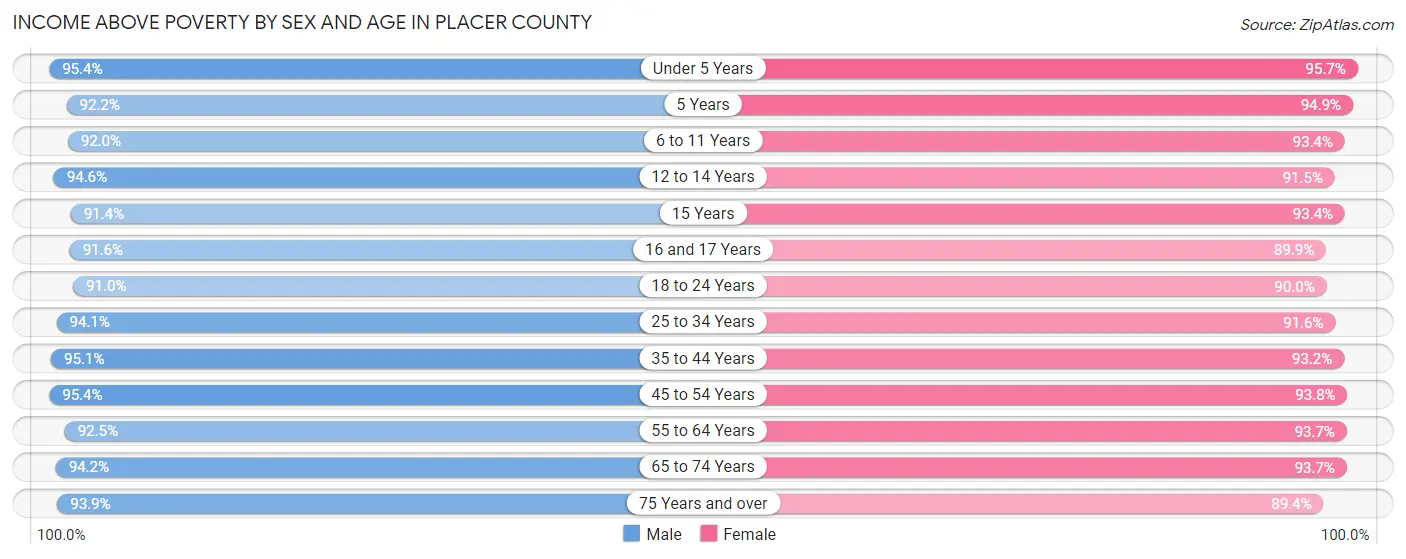
| Age Bracket | Male | Female |
| Under 5 Years | 10,050 (95.4%) | 9,274 (95.7%) |
| 5 Years | 2,266 (92.2%) | 1,961 (94.9%) |
| 6 to 11 Years | 14,400 (92.0%) | 14,032 (93.4%) |
| 12 to 14 Years | 7,897 (94.6%) | 7,357 (91.5%) |
| 15 Years | 2,519 (91.4%) | 2,637 (93.4%) |
| 16 and 17 Years | 5,360 (91.6%) | 4,576 (89.9%) |
| 18 to 24 Years | 14,036 (91.0%) | 12,838 (90.0%) |
| 25 to 34 Years | 20,616 (94.1%) | 19,811 (91.6%) |
| 35 to 44 Years | 26,144 (95.1%) | 25,365 (93.2%) |
| 45 to 54 Years | 25,189 (95.4%) | 25,002 (93.8%) |
| 55 to 64 Years | 24,183 (92.5%) | 25,914 (93.7%) |
| 65 to 74 Years | 19,747 (94.2%) | 22,767 (93.7%) |
| 75 Years and over | 13,771 (93.9%) | 17,925 (89.4%) |
| Total | 186,178 (93.8%) | 189,459 (92.6%) |
Income Below Poverty Among Married-Couple Families in Placer County
The poverty statistics for married-couple families in Placer County show that 2.9% or 2,514 of the total 87,503 families live below the poverty line. Families with 5 or more children have the highest poverty rate of 6.2%, comprising of 26 families. On the other hand, families with no children have the lowest poverty rate of 2.5%, which includes 1,282 families.
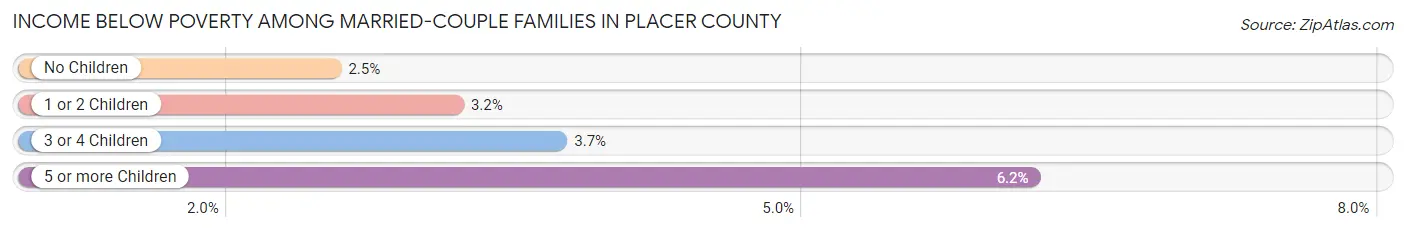
| Children | Above Poverty | Below Poverty |
| No Children | 49,128 (97.5%) | 1,282 (2.5%) |
| 1 or 2 Children | 28,613 (96.8%) | 941 (3.2%) |
| 3 or 4 Children | 6,854 (96.3%) | 265 (3.7%) |
| 5 or more Children | 394 (93.8%) | 26 (6.2%) |
| Total | 84,989 (97.1%) | 2,514 (2.9%) |
Income Below Poverty Among Single-Parent Households in Placer County
According to the poverty data in Placer County, 8.8% or 600 single-father households and 13.7% or 1,826 single-mother households are living below the poverty line. Among single-father households, those with 1 or 2 children have the highest poverty rate, with 410 households (14.4%) experiencing poverty. Likewise, among single-mother households, those with 3 or 4 children have the highest poverty rate, with 358 households (38.6%) falling below the poverty line.
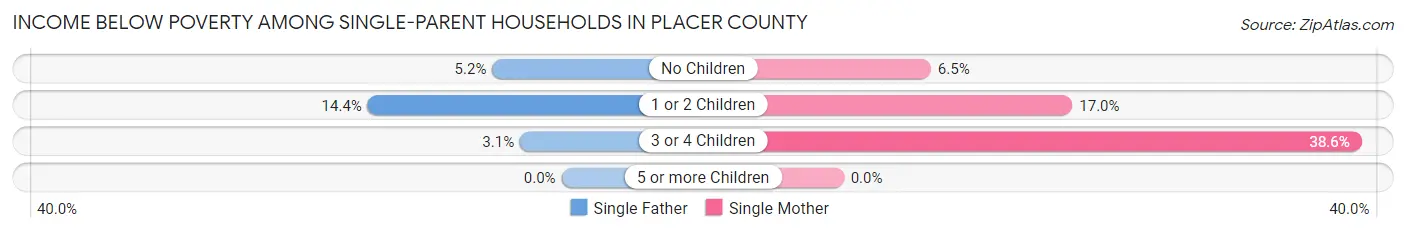
| Children | Single Father | Single Mother |
| No Children | 171 (5.2%) | 392 (6.5%) |
| 1 or 2 Children | 410 (14.4%) | 1,076 (17.0%) |
| 3 or 4 Children | 19 (3.1%) | 358 (38.6%) |
| 5 or more Children | 0 (0.0%) | 0 (0.0%) |
| Total | 600 (8.8%) | 1,826 (13.7%) |
Income Below Poverty Among Married-Couple vs Single-Parent Households in Placer County
The poverty data for Placer County shows that 2,514 of the married-couple family households (2.9%) and 2,426 of the single-parent households (12.1%) are living below the poverty level. Within the married-couple family households, those with 5 or more children have the highest poverty rate, with 26 households (6.2%) falling below the poverty line. Among the single-parent households, those with 3 or 4 children have the highest poverty rate, with 377 household (24.4%) living below poverty.
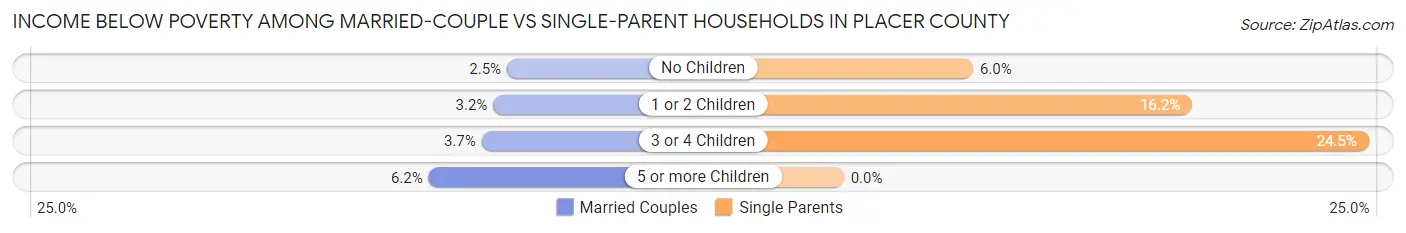
| Children | Married-Couple Families | Single-Parent Households |
| No Children | 1,282 (2.5%) | 563 (6.0%) |
| 1 or 2 Children | 941 (3.2%) | 1,486 (16.2%) |
| 3 or 4 Children | 265 (3.7%) | 377 (24.4%) |
| 5 or more Children | 26 (6.2%) | 0 (0.0%) |
| Total | 2,514 (2.9%) | 2,426 (12.1%) |
Race in Placer County
The most populous races in Placer County are White / Caucasian (306,615 | 75.4%), Hispanic or Latino (60,469 | 14.9%), and Two or more Races (41,096 | 10.1%).
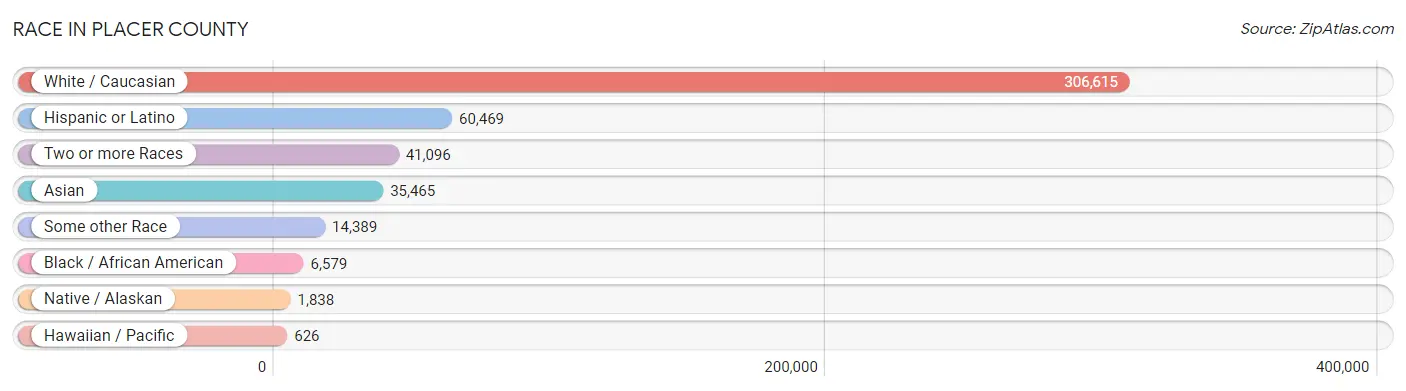
| Race | # Population | % Population |
| Asian | 35,465 | 8.7% |
| Black / African American | 6,579 | 1.6% |
| Hawaiian / Pacific | 626 | 0.2% |
| Hispanic or Latino | 60,469 | 14.9% |
| Native / Alaskan | 1,838 | 0.4% |
| White / Caucasian | 306,615 | 75.4% |
| Two or more Races | 41,096 | 10.1% |
| Some other Race | 14,389 | 3.5% |
| Total | 406,608 | 100.0% |
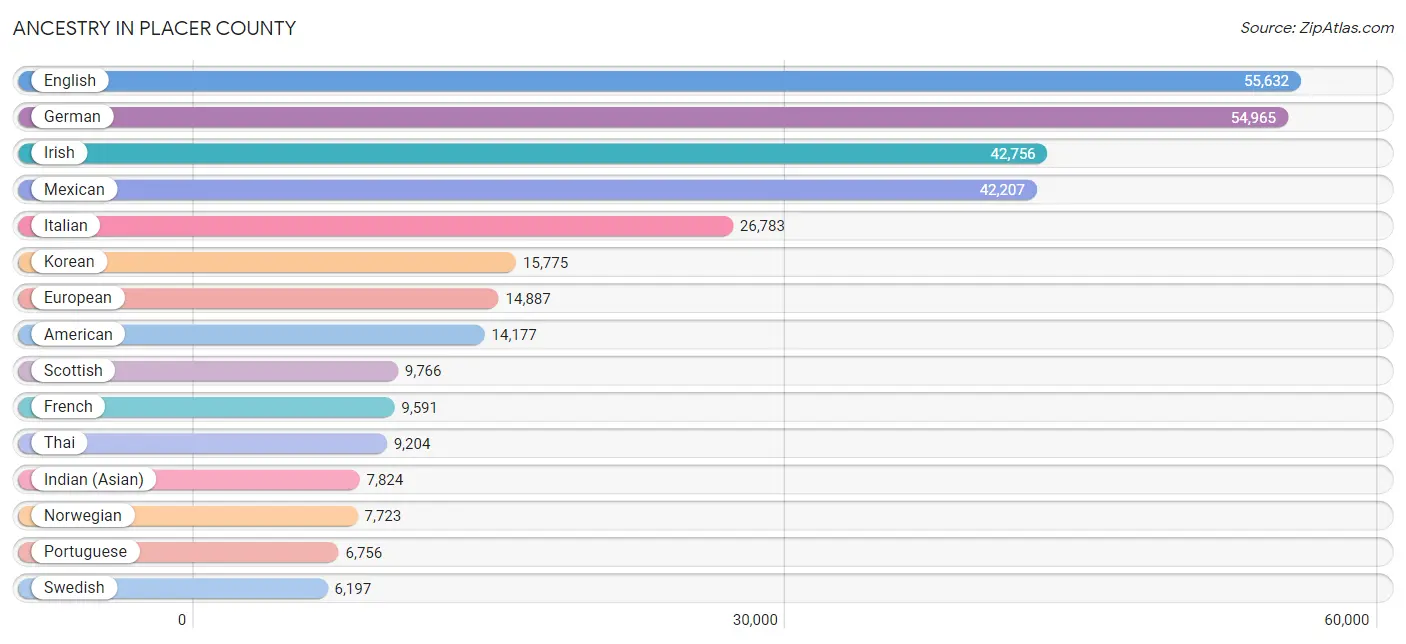
Ancestry in Placer County
The most populous ancestries reported in Placer County are English (55,632 | 13.7%), German (54,965 | 13.5%), Irish (42,756 | 10.5%), Mexican (42,207 | 10.4%), and Italian (26,783 | 6.6%), together accounting for 54.7% of all Placer County residents.
| Ancestry | # Population | % Population |
| Afghan | 1,207 | 0.3% |
| African | 494 | 0.1% |
| Alaska Native | 13 | 0.0% |
| Aleut | 34 | 0.0% |
| Alsatian | 8 | 0.0% |
| American | 14,177 | 3.5% |
| Apache | 324 | 0.1% |
| Arab | 2,006 | 0.5% |
| Arapaho | 18 | 0.0% |
| Argentinean | 228 | 0.1% |
| Armenian | 841 | 0.2% |
| Assyrian / Chaldean / Syriac | 174 | 0.0% |
| Australian | 163 | 0.0% |
| Austrian | 1,015 | 0.3% |
| Bangladeshi | 233 | 0.1% |
| Basque | 187 | 0.1% |
| Belgian | 584 | 0.1% |
| Belizean | 311 | 0.1% |
| Bhutanese | 4,624 | 1.1% |
| Blackfeet | 415 | 0.1% |
| Bolivian | 195 | 0.1% |
| Brazilian | 200 | 0.1% |
| British | 4,094 | 1.0% |
| British West Indian | 5 | 0.0% |
| Bulgarian | 253 | 0.1% |
| Burmese | 2,518 | 0.6% |
| Cajun | 52 | 0.0% |
| Cambodian | 421 | 0.1% |
| Canadian | 1,384 | 0.3% |
| Cape Verdean | 39 | 0.0% |
| Celtic | 29 | 0.0% |
| Central American | 3,992 | 1.0% |
| Central American Indian | 281 | 0.1% |
| Cherokee | 2,170 | 0.5% |
| Chickasaw | 87 | 0.0% |
| Chilean | 202 | 0.1% |
| Chinese | 116 | 0.0% |
| Chippewa | 163 | 0.0% |
| Choctaw | 427 | 0.1% |
| Colombian | 1,039 | 0.3% |
| Costa Rican | 277 | 0.1% |
| Cree | 21 | 0.0% |
| Creek | 193 | 0.1% |
| Croatian | 971 | 0.2% |
| Cuban | 1,151 | 0.3% |
| Cypriot | 11 | 0.0% |
| Czech | 1,184 | 0.3% |
| Czechoslovakian | 311 | 0.1% |
| Danish | 4,258 | 1.1% |
| Dominican | 86 | 0.0% |
| Dutch | 5,079 | 1.3% |
| Eastern European | 822 | 0.2% |
| Ecuadorian | 176 | 0.0% |
| Egyptian | 250 | 0.1% |
| English | 55,632 | 13.7% |
| Estonian | 10 | 0.0% |
| Ethiopian | 158 | 0.0% |
| European | 14,887 | 3.7% |
| Filipino | 319 | 0.1% |
| Finnish | 990 | 0.2% |
| French | 9,591 | 2.4% |
| French American Indian | 6 | 0.0% |
| French Canadian | 1,807 | 0.4% |
| German | 54,965 | 13.5% |
| German Russian | 21 | 0.0% |
| Greek | 1,842 | 0.4% |
| Guamanian / Chamorro | 406 | 0.1% |
| Guatemalan | 674 | 0.2% |
| Guyanese | 15 | 0.0% |
| Haitian | 20 | 0.0% |
| Honduran | 439 | 0.1% |
| Hopi | 20 | 0.0% |
| Hungarian | 1,040 | 0.3% |
| Icelander | 35 | 0.0% |
| Indian (Asian) | 7,824 | 1.9% |
| Indonesian | 71 | 0.0% |
| Inupiat | 38 | 0.0% |
| Iranian | 2,413 | 0.6% |
| Iraqi | 13 | 0.0% |
| Irish | 42,756 | 10.5% |
| Iroquois | 64 | 0.0% |
| Israeli | 128 | 0.0% |
| Italian | 26,783 | 6.6% |
| Jamaican | 268 | 0.1% |
| Japanese | 285 | 0.1% |
| Jordanian | 156 | 0.0% |
| Kenyan | 28 | 0.0% |
| Korean | 15,775 | 3.9% |
| Laotian | 355 | 0.1% |
| Latvian | 113 | 0.0% |
| Lebanese | 334 | 0.1% |
| Lithuanian | 825 | 0.2% |
| Luxembourger | 101 | 0.0% |
| Malaysian | 187 | 0.1% |
| Maltese | 126 | 0.0% |
| Menominee | 9 | 0.0% |
| Mexican | 42,207 | 10.4% |
| Mexican American Indian | 723 | 0.2% |
| Mongolian | 82 | 0.0% |
| Moroccan | 23 | 0.0% |
| Native Hawaiian | 1,479 | 0.4% |
| Navajo | 400 | 0.1% |
| Nepalese | 419 | 0.1% |
| New Zealander | 24 | 0.0% |
| Nicaraguan | 552 | 0.1% |
| Nigerian | 164 | 0.0% |
| Northern European | 1,306 | 0.3% |
| Norwegian | 7,723 | 1.9% |
| Okinawan | 76 | 0.0% |
| Osage | 59 | 0.0% |
| Ottawa | 14 | 0.0% |
| Paiute | 34 | 0.0% |
| Pakistani | 457 | 0.1% |
| Palestinian | 453 | 0.1% |
| Panamanian | 192 | 0.1% |
| Paraguayan | 33 | 0.0% |
| Pennsylvania German | 195 | 0.1% |
| Peruvian | 1,020 | 0.3% |
| Polish | 5,634 | 1.4% |
| Portuguese | 6,756 | 1.7% |
| Potawatomi | 44 | 0.0% |
| Pueblo | 154 | 0.0% |
| Puerto Rican | 2,729 | 0.7% |
| Romanian | 1,999 | 0.5% |
| Russian | 4,240 | 1.0% |
| Salvadoran | 1,718 | 0.4% |
| Samoan | 384 | 0.1% |
| Scandinavian | 2,497 | 0.6% |
| Scotch-Irish | 3,787 | 0.9% |
| Scottish | 9,766 | 2.4% |
| Serbian | 277 | 0.1% |
| Shoshone | 21 | 0.0% |
| Sioux | 179 | 0.0% |
| Slavic | 404 | 0.1% |
| Slovak | 399 | 0.1% |
| Slovene | 114 | 0.0% |
| South African | 233 | 0.1% |
| South American | 3,291 | 0.8% |
| South American Indian | 18 | 0.0% |
| Spaniard | 2,665 | 0.7% |
| Spanish | 2,626 | 0.6% |
| Spanish American | 57 | 0.0% |
| Sri Lankan | 3,150 | 0.8% |
| Subsaharan African | 1,494 | 0.4% |
| Swedish | 6,197 | 1.5% |
| Swiss | 1,928 | 0.5% |
| Syrian | 198 | 0.1% |
| Taiwanese | 22 | 0.0% |
| Thai | 9,204 | 2.3% |
| Tlingit-Haida | 49 | 0.0% |
| Tongan | 163 | 0.0% |
| Turkish | 138 | 0.0% |
| U.S. Virgin Islander | 36 | 0.0% |
| Ukrainian | 2,662 | 0.6% |
| Uruguayan | 13 | 0.0% |
| Ute | 101 | 0.0% |
| Venezuelan | 349 | 0.1% |
| Vietnamese | 203 | 0.1% |
| Welsh | 3,353 | 0.8% |
| West Indian | 30 | 0.0% |
| Yakama | 9 | 0.0% |
| Yaqui | 54 | 0.0% |
| Yugoslavian | 600 | 0.2% | View All 163 Rows |
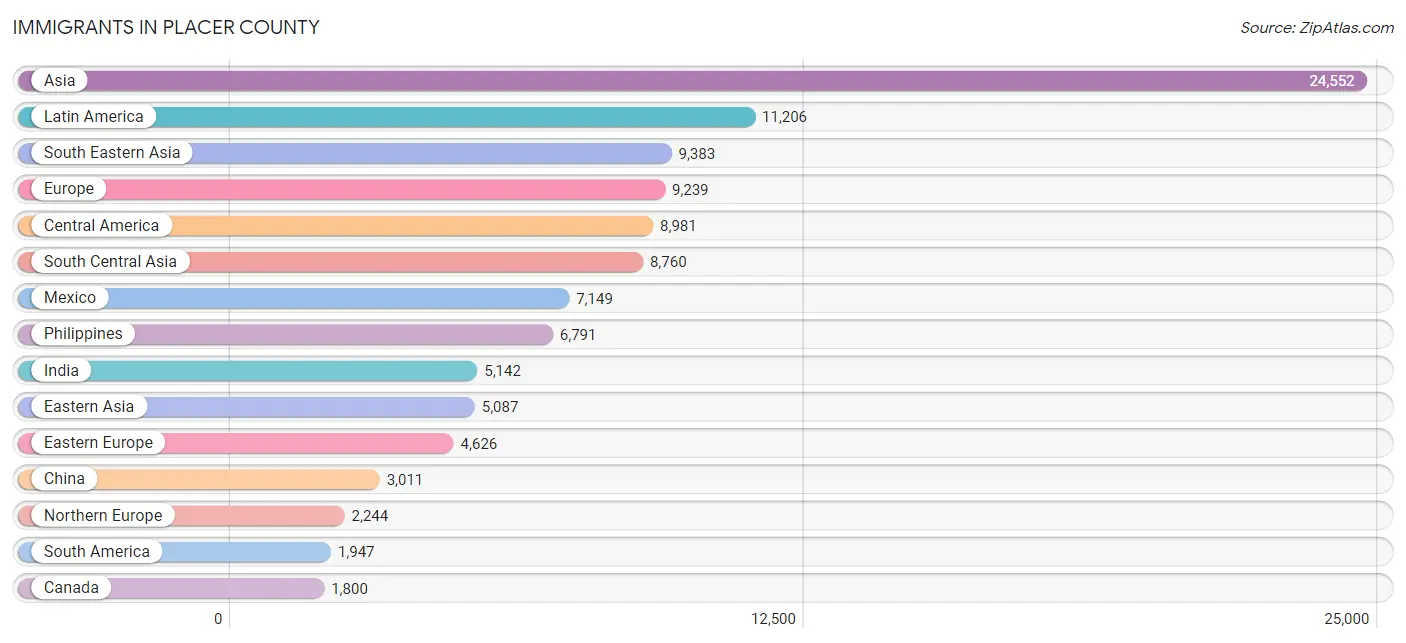
Immigrants in Placer County
The most numerous immigrant groups reported in Placer County came from Asia (24,552 | 6.0%), Latin America (11,206 | 2.8%), South Eastern Asia (9,383 | 2.3%), Europe (9,239 | 2.3%), and Central America (8,981 | 2.2%), together accounting for 15.6% of all Placer County residents.
| Immigration Origin | # Population | % Population |
| Afghanistan | 1,011 | 0.3% |
| Africa | 1,300 | 0.3% |
| Argentina | 146 | 0.0% |
| Armenia | 86 | 0.0% |
| Asia | 24,552 | 6.0% |
| Australia | 150 | 0.0% |
| Austria | 73 | 0.0% |
| Azores | 32 | 0.0% |
| Bangladesh | 99 | 0.0% |
| Belarus | 204 | 0.1% |
| Belgium | 20 | 0.0% |
| Belize | 176 | 0.0% |
| Bolivia | 56 | 0.0% |
| Bosnia and Herzegovina | 40 | 0.0% |
| Brazil | 251 | 0.1% |
| Bulgaria | 81 | 0.0% |
| Cambodia | 132 | 0.0% |
| Canada | 1,800 | 0.4% |
| Caribbean | 278 | 0.1% |
| Central America | 8,981 | 2.2% |
| Chile | 66 | 0.0% |
| China | 3,011 | 0.7% |
| Colombia | 485 | 0.1% |
| Costa Rica | 148 | 0.0% |
| Croatia | 55 | 0.0% |
| Cuba | 183 | 0.1% |
| Czechoslovakia | 212 | 0.1% |
| Denmark | 50 | 0.0% |
| Dominica | 7 | 0.0% |
| Eastern Africa | 448 | 0.1% |
| Eastern Asia | 5,087 | 1.3% |
| Eastern Europe | 4,626 | 1.1% |
| Ecuador | 146 | 0.0% |
| Egypt | 220 | 0.1% |
| El Salvador | 626 | 0.2% |
| England | 1,076 | 0.3% |
| Ethiopia | 76 | 0.0% |
| Europe | 9,239 | 2.3% |
| Fiji | 524 | 0.1% |
| France | 204 | 0.1% |
| Germany | 849 | 0.2% |
| Ghana | 90 | 0.0% |
| Greece | 98 | 0.0% |
| Guatemala | 245 | 0.1% |
| Guyana | 32 | 0.0% |
| Haiti | 13 | 0.0% |
| Honduras | 309 | 0.1% |
| Hong Kong | 387 | 0.1% |
| Hungary | 107 | 0.0% |
| India | 5,142 | 1.3% |
| Indonesia | 65 | 0.0% |
| Iran | 1,651 | 0.4% |
| Iraq | 76 | 0.0% |
| Ireland | 133 | 0.0% |
| Israel | 103 | 0.0% |
| Italy | 360 | 0.1% |
| Jamaica | 58 | 0.0% |
| Japan | 639 | 0.2% |
| Jordan | 306 | 0.1% |
| Kazakhstan | 144 | 0.0% |
| Kenya | 182 | 0.0% |
| Korea | 1,147 | 0.3% |
| Kuwait | 12 | 0.0% |
| Laos | 262 | 0.1% |
| Latin America | 11,206 | 2.8% |
| Latvia | 7 | 0.0% |
| Lebanon | 47 | 0.0% |
| Lithuania | 97 | 0.0% |
| Malaysia | 29 | 0.0% |
| Mexico | 7,149 | 1.8% |
| Middle Africa | 105 | 0.0% |
| Moldova | 504 | 0.1% |
| Morocco | 27 | 0.0% |
| Nepal | 115 | 0.0% |
| Netherlands | 263 | 0.1% |
| Nicaragua | 268 | 0.1% |
| Nigeria | 71 | 0.0% |
| Northern Africa | 247 | 0.1% |
| Northern Europe | 2,244 | 0.5% |
| Norway | 76 | 0.0% |
| Oceania | 739 | 0.2% |
| Pakistan | 336 | 0.1% |
| Panama | 60 | 0.0% |
| Peru | 558 | 0.1% |
| Philippines | 6,791 | 1.7% |
| Poland | 135 | 0.0% |
| Portugal | 195 | 0.1% |
| Romania | 742 | 0.2% |
| Russia | 916 | 0.2% |
| Saudi Arabia | 75 | 0.0% |
| Scotland | 138 | 0.0% |
| Serbia | 36 | 0.0% |
| Singapore | 97 | 0.0% |
| Somalia | 9 | 0.0% |
| South Africa | 261 | 0.1% |
| South America | 1,947 | 0.5% |
| South Central Asia | 8,760 | 2.1% |
| South Eastern Asia | 9,383 | 2.3% |
| Southern Europe | 864 | 0.2% |
| Spain | 186 | 0.1% |
| Sri Lanka | 147 | 0.0% |
| Sweden | 70 | 0.0% |
| Switzerland | 83 | 0.0% |
| Syria | 169 | 0.0% |
| Taiwan | 503 | 0.1% |
| Thailand | 385 | 0.1% |
| Trinidad and Tobago | 17 | 0.0% |
| Turkey | 38 | 0.0% |
| Uganda | 54 | 0.0% |
| Ukraine | 1,424 | 0.4% |
| Uruguay | 28 | 0.0% |
| Uzbekistan | 56 | 0.0% |
| Venezuela | 179 | 0.0% |
| Vietnam | 1,499 | 0.4% |
| Western Africa | 166 | 0.0% |
| Western Asia | 1,103 | 0.3% |
| Western Europe | 1,492 | 0.4% |
| Yemen | 8 | 0.0% |
| Zaire | 105 | 0.0% | View All 119 Rows |
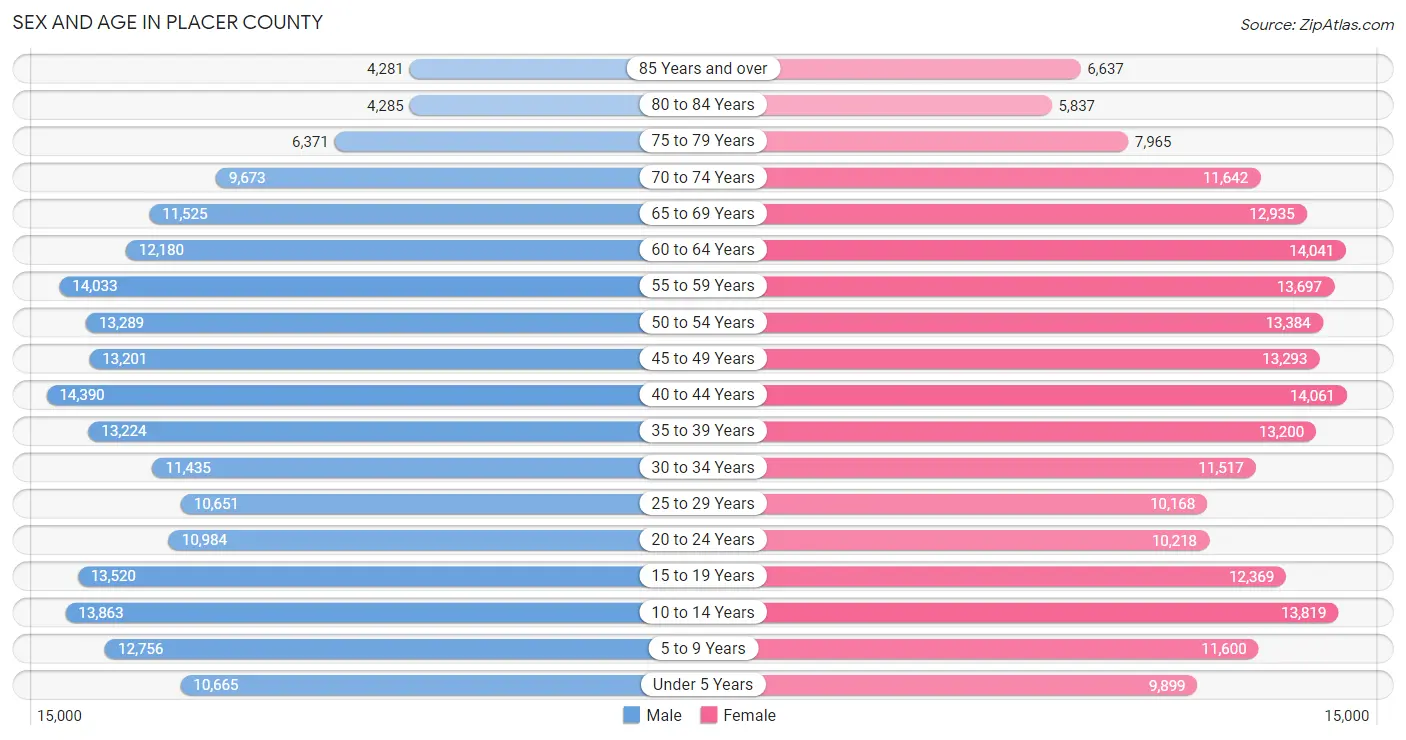
Sex and Age in Placer County
Sex and Age in Placer County
The most populous age groups in Placer County are 40 to 44 Years (14,390 | 7.2%) for men and 40 to 44 Years (14,061 | 6.8%) for women.
| Age Bracket | Male | Female |
| Under 5 Years | 10,665 (5.3%) | 9,899 (4.8%) |
| 5 to 9 Years | 12,756 (6.4%) | 11,600 (5.6%) |
| 10 to 14 Years | 13,863 (6.9%) | 13,819 (6.7%) |
| 15 to 19 Years | 13,520 (6.8%) | 12,369 (6.0%) |
| 20 to 24 Years | 10,984 (5.5%) | 10,218 (5.0%) |
| 25 to 29 Years | 10,651 (5.3%) | 10,168 (4.9%) |
| 30 to 34 Years | 11,435 (5.7%) | 11,517 (5.6%) |
| 35 to 39 Years | 13,224 (6.6%) | 13,200 (6.4%) |
| 40 to 44 Years | 14,390 (7.2%) | 14,061 (6.8%) |
| 45 to 49 Years | 13,201 (6.6%) | 13,293 (6.4%) |
| 50 to 54 Years | 13,289 (6.6%) | 13,384 (6.5%) |
| 55 to 59 Years | 14,033 (7.0%) | 13,697 (6.6%) |
| 60 to 64 Years | 12,180 (6.1%) | 14,041 (6.8%) |
| 65 to 69 Years | 11,525 (5.8%) | 12,935 (6.3%) |
| 70 to 74 Years | 9,673 (4.8%) | 11,642 (5.6%) |
| 75 to 79 Years | 6,371 (3.2%) | 7,965 (3.9%) |
| 80 to 84 Years | 4,285 (2.1%) | 5,837 (2.8%) |
| 85 Years and over | 4,281 (2.1%) | 6,637 (3.2%) |
| Total | 200,326 (100.0%) | 206,282 (100.0%) |
Families and Households in Placer County
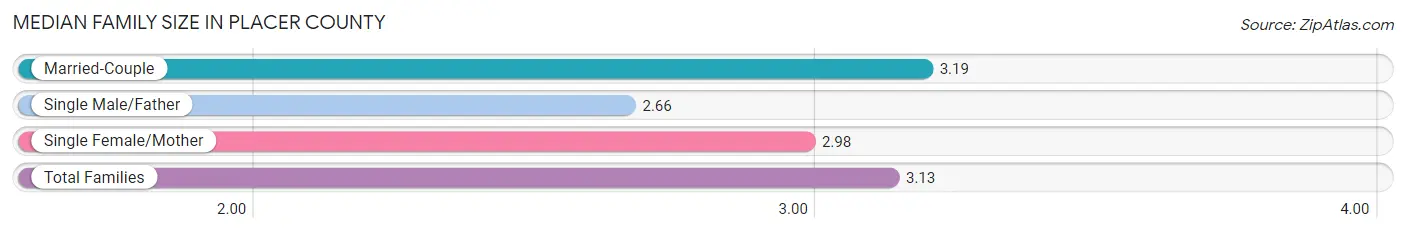
Median Family Size in Placer County
The median family size in Placer County is 3.13 persons per family, with married-couple families (87,503 | 81.3%) accounting for the largest median family size of 3.19 persons per family. On the other hand, single male/father families (6,777 | 6.3%) represent the smallest median family size with 2.66 persons per family.
| Family Type | # Families | Family Size |
| Married-Couple | 87,503 (81.3%) | 3.19 |
| Single Male/Father | 6,777 (6.3%) | 2.66 |
| Single Female/Mother | 13,324 (12.4%) | 2.98 |
| Total Families | 107,604 (100.0%) | 3.13 |
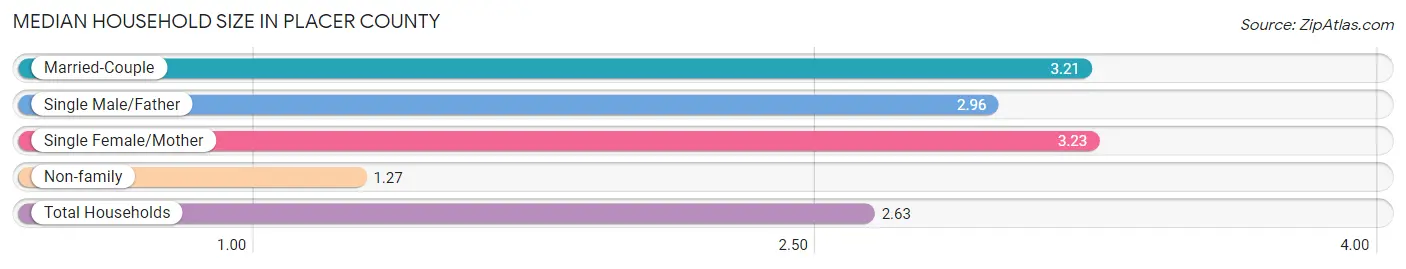
Median Household Size in Placer County
The median household size in Placer County is 2.63 persons per household, with single female/mother households (13,324 | 8.7%) accounting for the largest median household size of 3.23 persons per household. non-family households (44,933 | 29.5%) represent the smallest median household size with 1.27 persons per household.
| Household Type | # Households | Household Size |
| Married-Couple | 87,503 (57.4%) | 3.21 |
| Single Male/Father | 6,777 (4.4%) | 2.96 |
| Single Female/Mother | 13,324 (8.7%) | 3.23 |
| Non-family | 44,933 (29.5%) | 1.27 |
| Total Households | 152,537 (100.0%) | 2.63 |
Household Size by Marriage Status in Placer County
Out of a total of 152,537 households in Placer County, 107,604 (70.5%) are family households, while 44,933 (29.5%) are nonfamily households. The most numerous type of family households are 2-person households, comprising 47,571, and the most common type of nonfamily households are 1-person households, comprising 35,964.
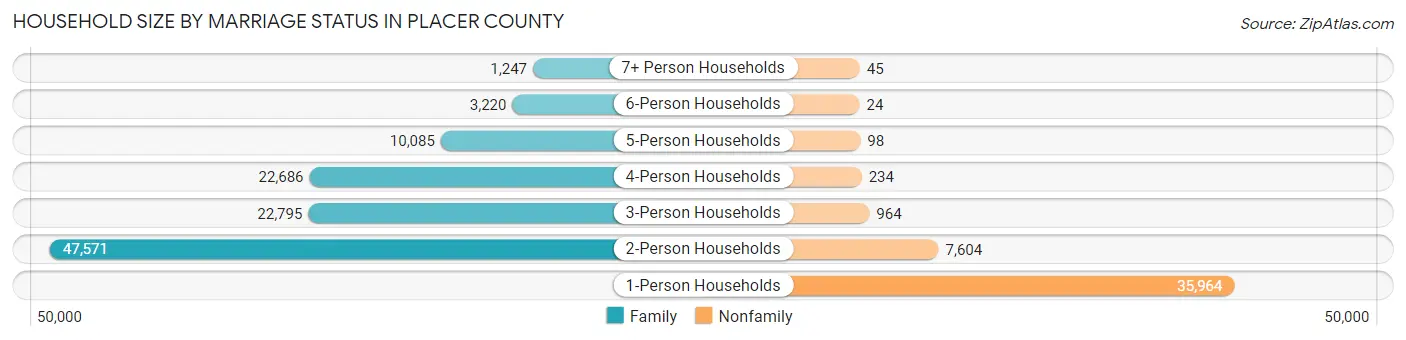
| Household Size | Family Households | Nonfamily Households |
| 1-Person Households | - | 35,964 (23.6%) |
| 2-Person Households | 47,571 (31.2%) | 7,604 (5.0%) |
| 3-Person Households | 22,795 (14.9%) | 964 (0.6%) |
| 4-Person Households | 22,686 (14.9%) | 234 (0.2%) |
| 5-Person Households | 10,085 (6.6%) | 98 (0.1%) |
| 6-Person Households | 3,220 (2.1%) | 24 (0.0%) |
| 7+ Person Households | 1,247 (0.8%) | 45 (0.0%) |
| Total | 107,604 (70.5%) | 44,933 (29.5%) |
Female Fertility in Placer County
Fertility by Age in Placer County
Average fertility rate in Placer County is 47.0 births per 1,000 women. Women in the age bracket of 20 to 34 years have the highest fertility rate with 87.0 births per 1,000 women. Women in the age bracket of 20 to 34 years acount for 67.1% of all women with births.
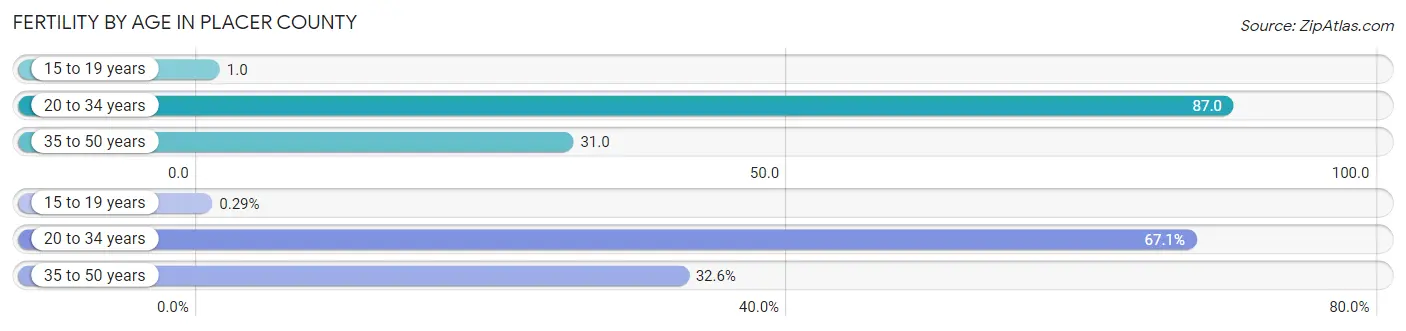
| Age Bracket | Women with Births | Births / 1,000 Women |
| 15 to 19 years | 12 (0.3%) | 1.0 |
| 20 to 34 years | 2,764 (67.1%) | 87.0 |
| 35 to 50 years | 1,344 (32.6%) | 31.0 |
| Total | 4,120 (100.0%) | 47.0 |
Fertility by Age by Marriage Status in Placer County
82.0% of women with births (4,120) in Placer County are married. The highest percentage of unmarried women with births falls into 15 to 19 years age bracket with 100.0% of them unmarried at the time of birth, while the lowest percentage of unmarried women with births belong to 35 to 50 years age bracket with 13.5% of them unmarried.
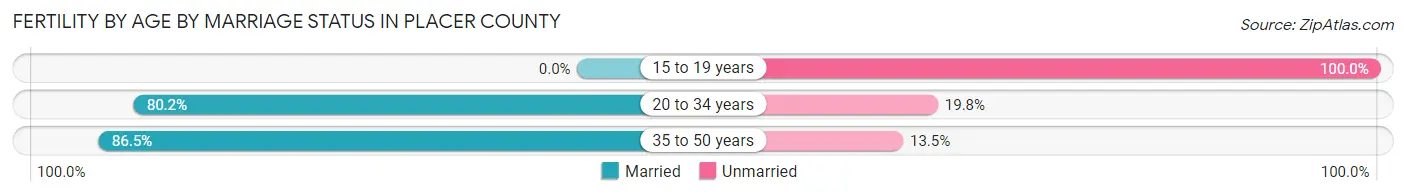
| Age Bracket | Married | Unmarried |
| 15 to 19 years | 0 (0.0%) | 12 (100.0%) |
| 20 to 34 years | 2,217 (80.2%) | 547 (19.8%) |
| 35 to 50 years | 1,163 (86.5%) | 181 (13.5%) |
| Total | 3,378 (82.0%) | 742 (18.0%) |
Fertility by Education in Placer County
Average fertility rate in Placer County is 47.0 births per 1,000 women. Women with the education attainment of graduate degree have the highest fertility rate of 64.0 births per 1,000 women, while women with the education attainment of less than high school have the lowest fertility at 7.0 births per 1,000 women. Women with the education attainment of college or associate's degree represent 38.8% of all women with births.
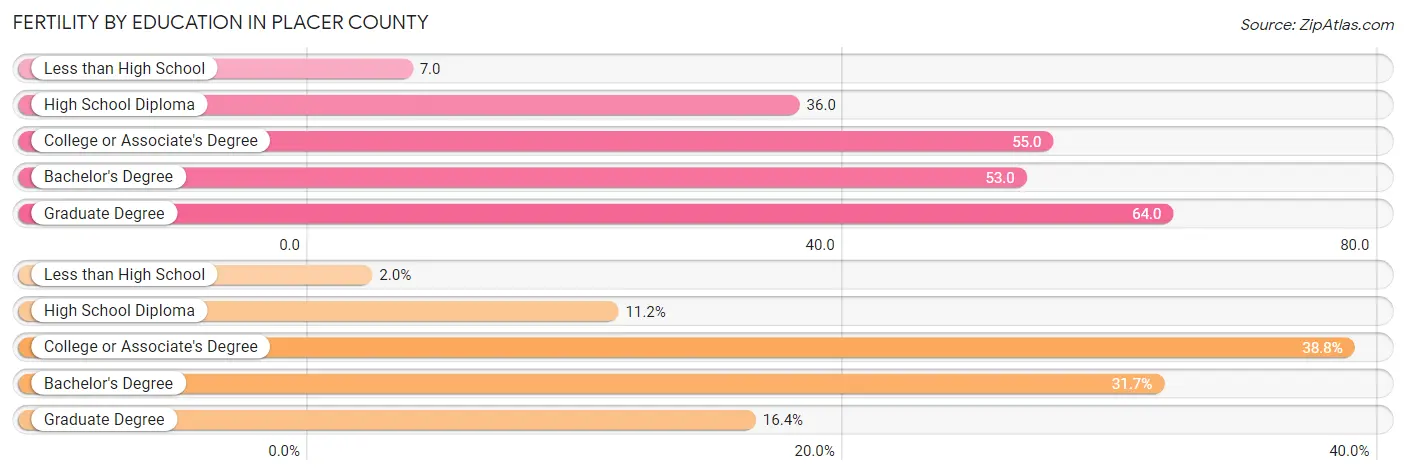
| Educational Attainment | Women with Births | Births / 1,000 Women |
| Less than High School | 82 (2.0%) | 7.0 |
| High School Diploma | 462 (11.2%) | 36.0 |
| College or Associate's Degree | 1,598 (38.8%) | 55.0 |
| Bachelor's Degree | 1,304 (31.7%) | 53.0 |
| Graduate Degree | 674 (16.4%) | 64.0 |
| Total | 4,120 (100.0%) | 47.0 |
Fertility by Education by Marriage Status in Placer County
18.0% of women with births in Placer County are unmarried. Women with the educational attainment of bachelor's degree are most likely to be married with 95.0% of them married at childbirth, while women with the educational attainment of less than high school are least likely to be married with 50.0% of them unmarried at childbirth.
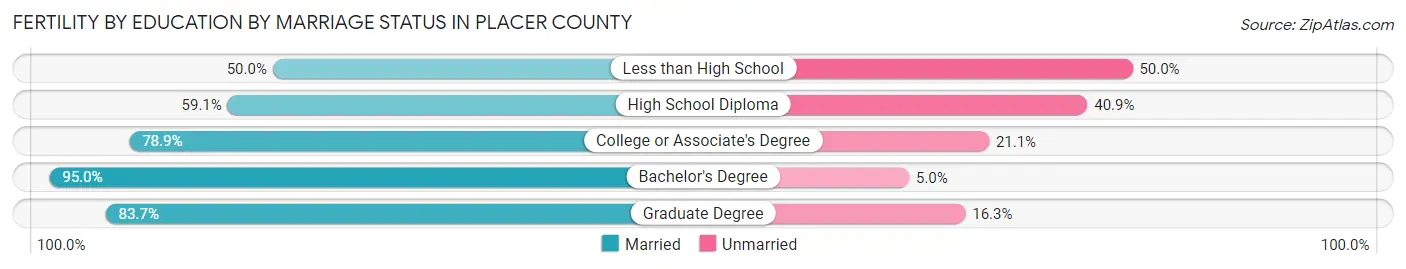
| Educational Attainment | Married | Unmarried |
| Less than High School | 41 (50.0%) | 41 (50.0%) |
| High School Diploma | 273 (59.1%) | 189 (40.9%) |
| College or Associate's Degree | 1,261 (78.9%) | 337 (21.1%) |
| Bachelor's Degree | 1,239 (95.0%) | 65 (5.0%) |
| Graduate Degree | 564 (83.7%) | 110 (16.3%) |
| Total | 3,378 (82.0%) | 742 (18.0%) |
Employment Characteristics in Placer County
Employment by Class of Employer in Placer County
Among the 187,335 employed individuals in Placer County, private company employees (115,758 | 61.8%), local government employees (17,073 | 9.1%), and not-for-profit organizations (14,781 | 7.9%) make up the most common classes of employment.
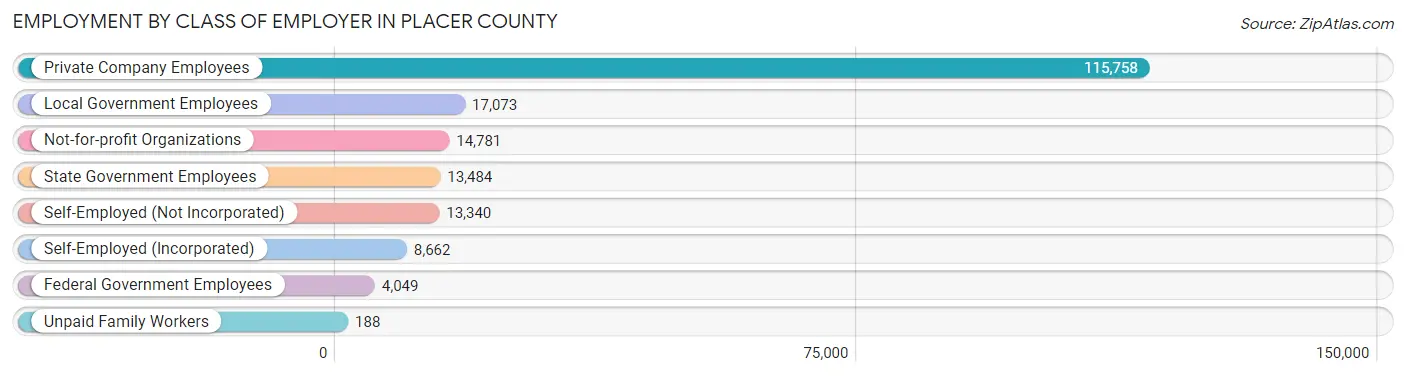
| Employer Class | # Employees | % Employees |
| Private Company Employees | 115,758 | 61.8% |
| Self-Employed (Incorporated) | 8,662 | 4.6% |
| Self-Employed (Not Incorporated) | 13,340 | 7.1% |
| Not-for-profit Organizations | 14,781 | 7.9% |
| Local Government Employees | 17,073 | 9.1% |
| State Government Employees | 13,484 | 7.2% |
| Federal Government Employees | 4,049 | 2.2% |
| Unpaid Family Workers | 188 | 0.1% |
| Total | 187,335 | 100.0% |
Employment Status by Age in Placer County
According to the labor force statistics for Placer County, out of the total population over 16 years of age (328,419), 60.8% or 199,679 individuals are in the labor force, with 4.3% or 8,586 of them unemployed. The age group with the highest labor force participation rate is 30 to 34 years, with 84.0% or 19,280 individuals in the labor force. Within the labor force, the 16 to 19 years age range has the highest percentage of unemployed individuals, with 13.2% or 1,010 of them being unemployed.
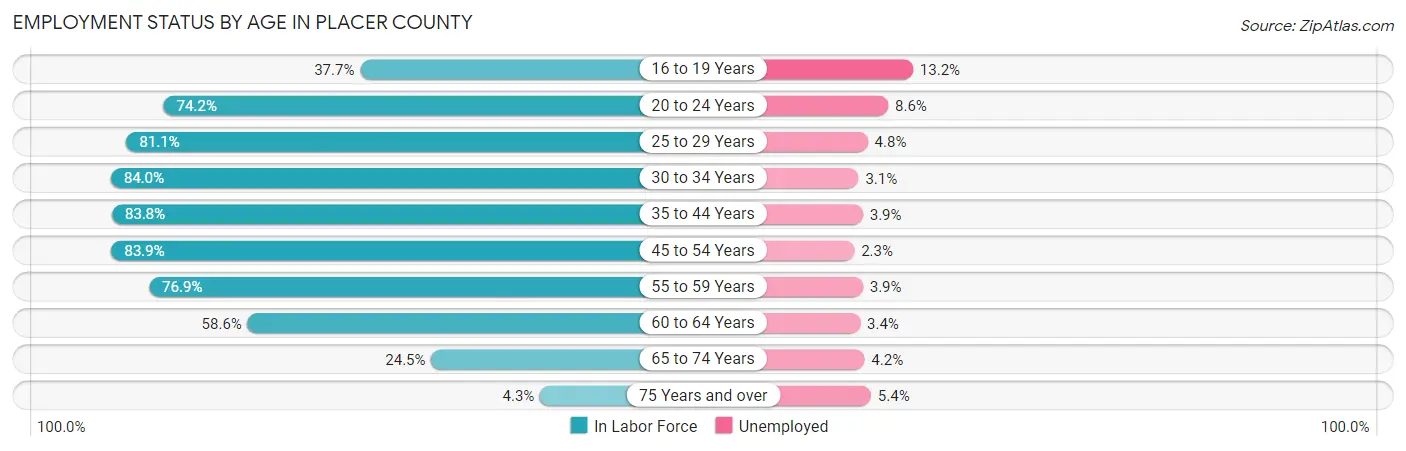
| Age Bracket | In Labor Force | Unemployed |
| 16 to 19 Years | 7,654 (37.7%) | 1,010 (13.2%) |
| 20 to 24 Years | 15,732 (74.2%) | 1,353 (8.6%) |
| 25 to 29 Years | 16,884 (81.1%) | 810 (4.8%) |
| 30 to 34 Years | 19,280 (84.0%) | 598 (3.1%) |
| 35 to 44 Years | 45,985 (83.8%) | 1,793 (3.9%) |
| 45 to 54 Years | 44,607 (83.9%) | 1,026 (2.3%) |
| 55 to 59 Years | 21,324 (76.9%) | 832 (3.9%) |
| 60 to 64 Years | 15,366 (58.6%) | 522 (3.4%) |
| 65 to 74 Years | 11,215 (24.5%) | 471 (4.2%) |
| 75 Years and over | 1,521 (4.3%) | 82 (5.4%) |
| Total | 199,679 (60.8%) | 8,586 (4.3%) |
Employment Status by Educational Attainment in Placer County
According to labor force statistics for Placer County, 79.4% of individuals (163,377) out of the total population between 25 and 64 years of age (205,764) are in the labor force, with 3.4% or 5,555 of them being unemployed. The group with the highest labor force participation rate are those with the educational attainment of bachelor's degree or higher, with 85.6% or 78,447 individuals in the labor force. Within the labor force, individuals with less than high school education have the highest percentage of unemployment, with 6.4% or 369 of them being unemployed.
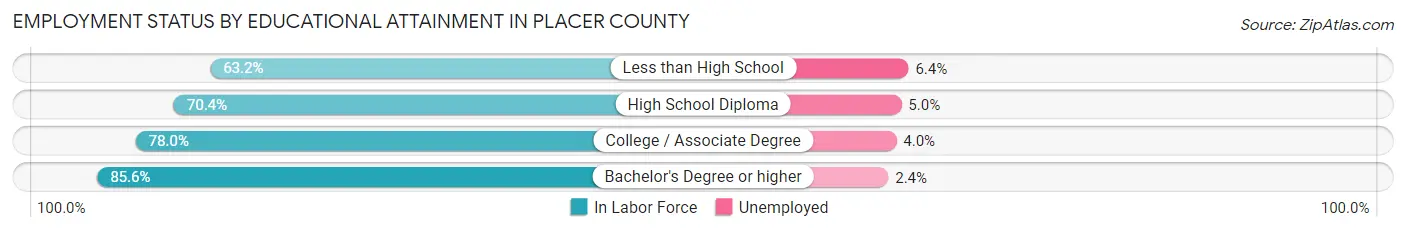
| Educational Attainment | In Labor Force | Unemployed |
| Less than High School | 5,773 (63.2%) | 585 (6.4%) |
| High School Diploma | 23,897 (70.4%) | 1,697 (5.0%) |
| College / Associate Degree | 55,411 (78.0%) | 2,842 (4.0%) |
| Bachelor's Degree or higher | 78,447 (85.6%) | 2,199 (2.4%) |
| Total | 163,377 (79.4%) | 6,996 (3.4%) |
Employment Occupations by Sex in Placer County
Management, Business, Science and Arts Occupations
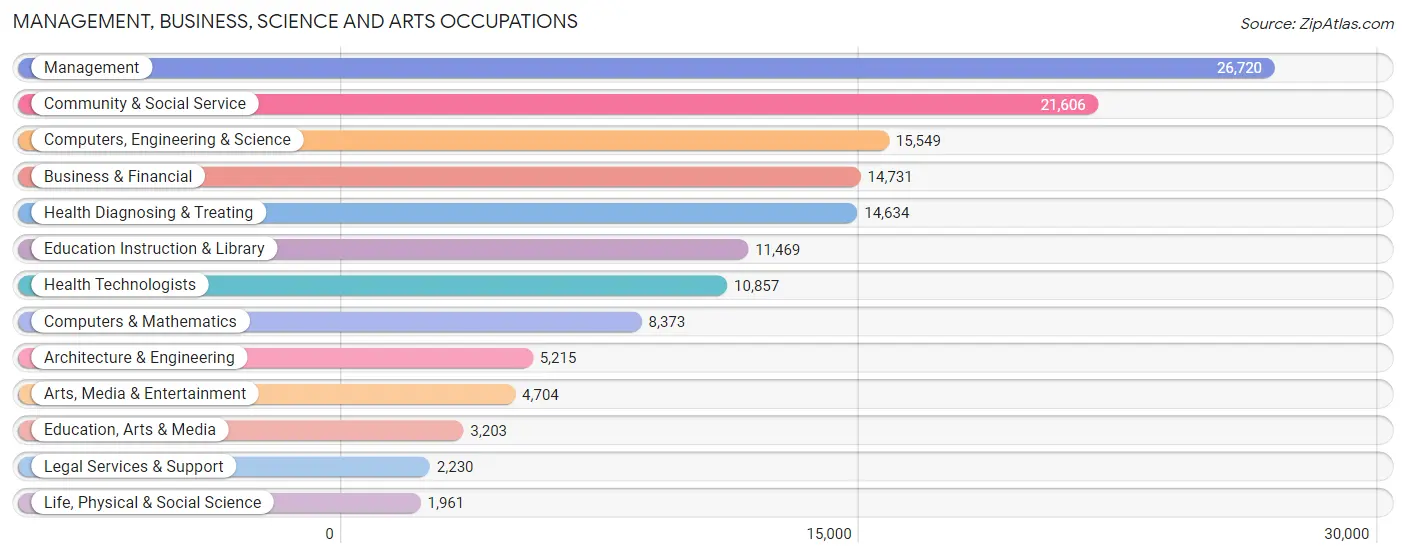
The most common Management, Business, Science and Arts occupations in Placer County are Management (26,720 | 14.1%), Community & Social Service (21,606 | 11.4%), Computers, Engineering & Science (15,549 | 8.2%), Business & Financial (14,731 | 7.7%), and Health Diagnosing & Treating (14,634 | 7.7%).
Management, Business, Science and Arts Occupations by Sex
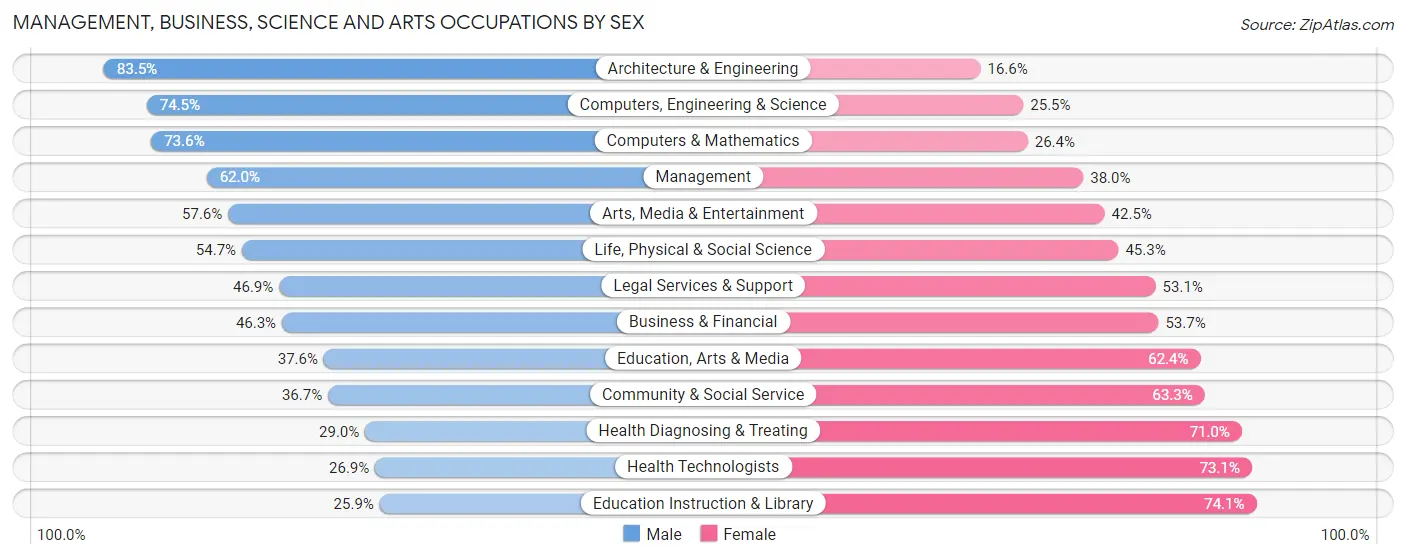
Within the Management, Business, Science and Arts occupations in Placer County, the most male-oriented occupations are Architecture & Engineering (83.5%), Computers, Engineering & Science (74.5%), and Computers & Mathematics (73.6%), while the most female-oriented occupations are Education Instruction & Library (74.1%), Health Technologists (73.1%), and Health Diagnosing & Treating (71.0%).
| Occupation | Male | Female |
| Management | 16,568 (62.0%) | 10,152 (38.0%) |
| Business & Financial | 6,823 (46.3%) | 7,908 (53.7%) |
| Computers, Engineering & Science | 11,585 (74.5%) | 3,964 (25.5%) |
| Computers & Mathematics | 6,161 (73.6%) | 2,212 (26.4%) |
| Architecture & Engineering | 4,352 (83.5%) | 863 (16.6%) |
| Life, Physical & Social Science | 1,072 (54.7%) | 889 (45.3%) |
| Community & Social Service | 7,931 (36.7%) | 13,675 (63.3%) |
| Education, Arts & Media | 1,204 (37.6%) | 1,999 (62.4%) |
| Legal Services & Support | 1,046 (46.9%) | 1,184 (53.1%) |
| Education Instruction & Library | 2,974 (25.9%) | 8,495 (74.1%) |
| Arts, Media & Entertainment | 2,707 (57.6%) | 1,997 (42.4%) |
| Health Diagnosing & Treating | 4,239 (29.0%) | 10,395 (71.0%) |
| Health Technologists | 2,918 (26.9%) | 7,939 (73.1%) |
| Total (Category) | 47,146 (50.6%) | 46,094 (49.4%) |
| Total (Overall) | 100,933 (53.1%) | 89,160 (46.9%) |
Services Occupations
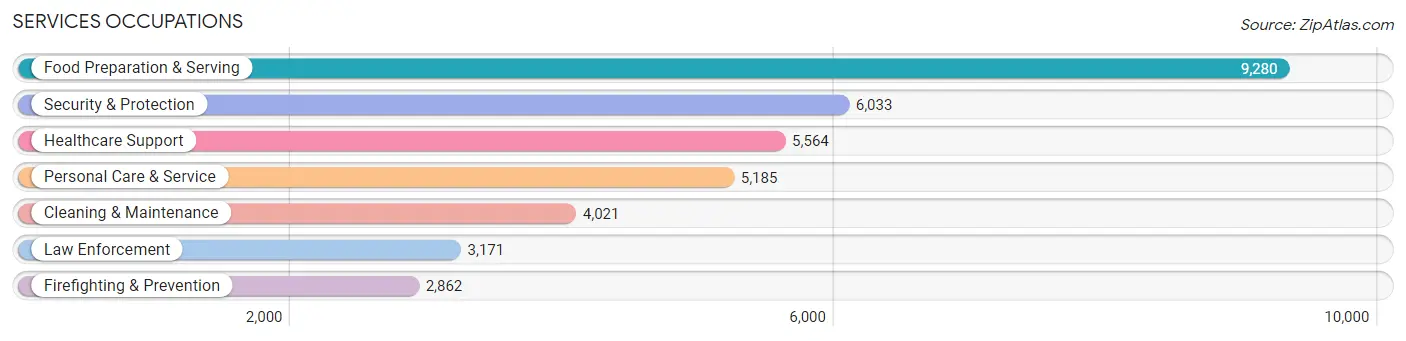
The most common Services occupations in Placer County are Food Preparation & Serving (9,280 | 4.9%), Security & Protection (6,033 | 3.2%), Healthcare Support (5,564 | 2.9%), Personal Care & Service (5,185 | 2.7%), and Cleaning & Maintenance (4,021 | 2.1%).
Services Occupations by Sex
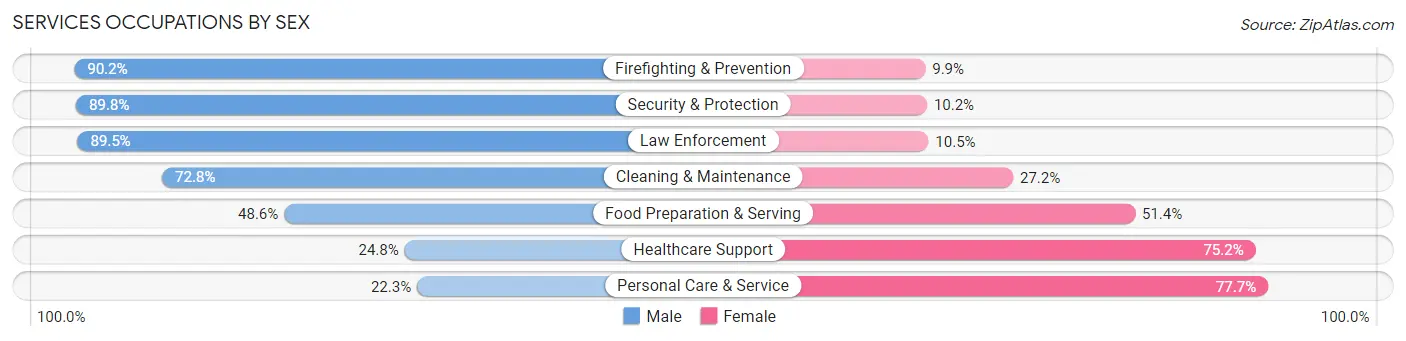
Within the Services occupations in Placer County, the most male-oriented occupations are Firefighting & Prevention (90.1%), Security & Protection (89.8%), and Law Enforcement (89.5%), while the most female-oriented occupations are Personal Care & Service (77.7%), Healthcare Support (75.2%), and Food Preparation & Serving (51.4%).
| Occupation | Male | Female |
| Healthcare Support | 1,378 (24.8%) | 4,186 (75.2%) |
| Security & Protection | 5,419 (89.8%) | 614 (10.2%) |
| Firefighting & Prevention | 2,580 (90.1%) | 282 (9.9%) |
| Law Enforcement | 2,839 (89.5%) | 332 (10.5%) |
| Food Preparation & Serving | 4,511 (48.6%) | 4,769 (51.4%) |
| Cleaning & Maintenance | 2,926 (72.8%) | 1,095 (27.2%) |
| Personal Care & Service | 1,156 (22.3%) | 4,029 (77.7%) |
| Total (Category) | 15,390 (51.2%) | 14,693 (48.8%) |
| Total (Overall) | 100,933 (53.1%) | 89,160 (46.9%) |
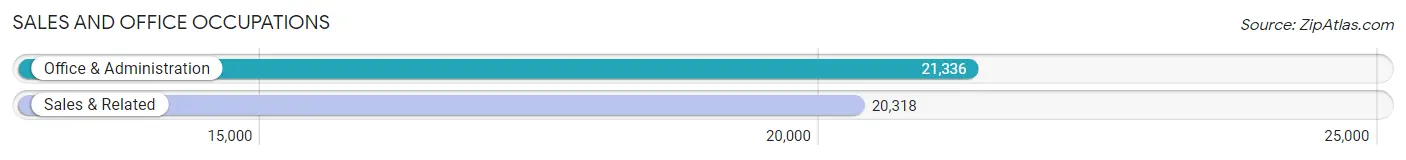
Sales and Office Occupations
The most common Sales and Office occupations in Placer County are Office & Administration (21,336 | 11.2%), and Sales & Related (20,318 | 10.7%).
Sales and Office Occupations by Sex
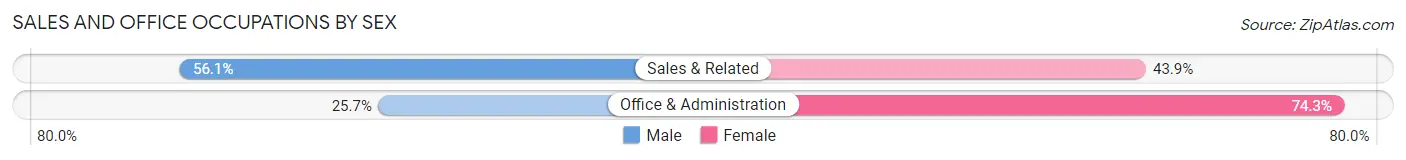
| Occupation | Male | Female |
| Sales & Related | 11,395 (56.1%) | 8,923 (43.9%) |
| Office & Administration | 5,478 (25.7%) | 15,858 (74.3%) |
| Total (Category) | 16,873 (40.5%) | 24,781 (59.5%) |
| Total (Overall) | 100,933 (53.1%) | 89,160 (46.9%) |
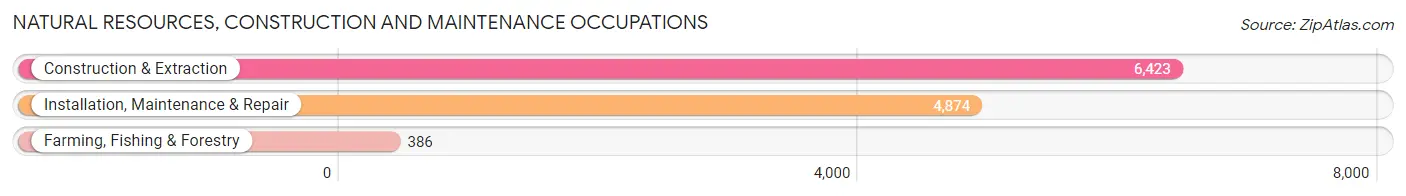
Natural Resources, Construction and Maintenance Occupations
The most common Natural Resources, Construction and Maintenance occupations in Placer County are Construction & Extraction (6,423 | 3.4%), Installation, Maintenance & Repair (4,874 | 2.6%), and Farming, Fishing & Forestry (386 | 0.2%).
Natural Resources, Construction and Maintenance Occupations by Sex
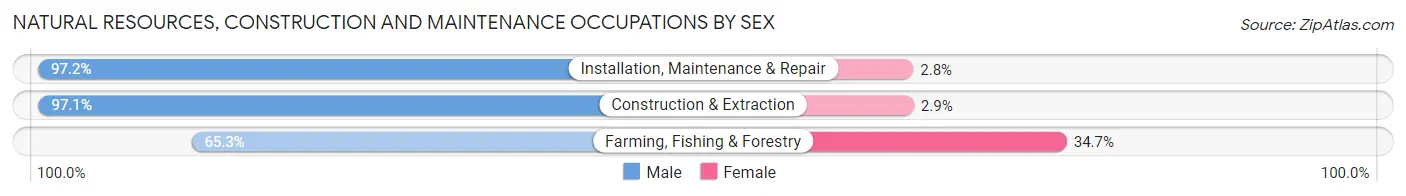
| Occupation | Male | Female |
| Farming, Fishing & Forestry | 252 (65.3%) | 134 (34.7%) |
| Construction & Extraction | 6,236 (97.1%) | 187 (2.9%) |
| Installation, Maintenance & Repair | 4,738 (97.2%) | 136 (2.8%) |
| Total (Category) | 11,226 (96.1%) | 457 (3.9%) |
| Total (Overall) | 100,933 (53.1%) | 89,160 (46.9%) |
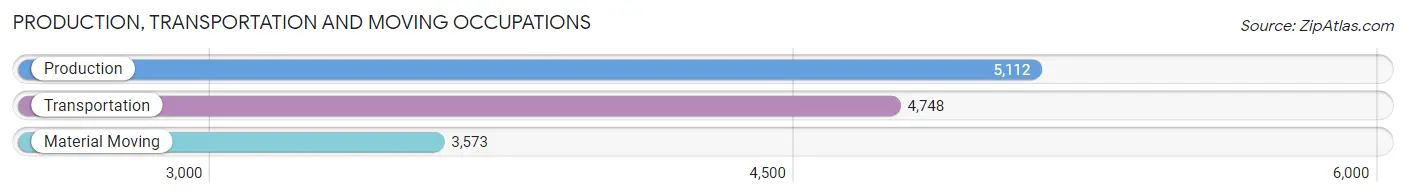
Production, Transportation and Moving Occupations
The most common Production, Transportation and Moving occupations in Placer County are Production (5,112 | 2.7%), Transportation (4,748 | 2.5%), and Material Moving (3,573 | 1.9%).
Production, Transportation and Moving Occupations by Sex
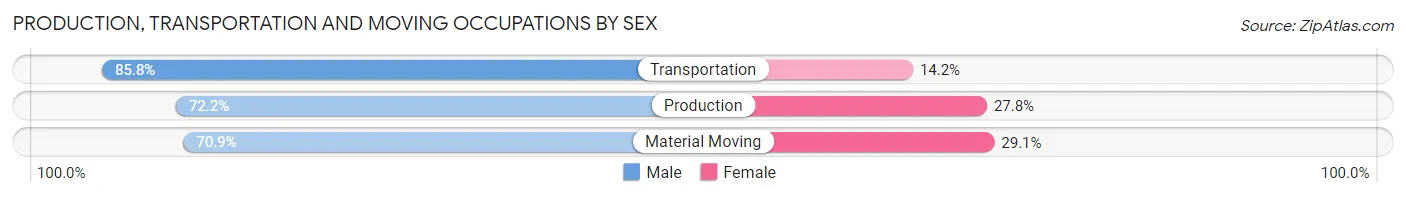
| Occupation | Male | Female |
| Production | 3,692 (72.2%) | 1,420 (27.8%) |
| Transportation | 4,074 (85.8%) | 674 (14.2%) |
| Material Moving | 2,532 (70.9%) | 1,041 (29.1%) |
| Total (Category) | 10,298 (76.7%) | 3,135 (23.3%) |
| Total (Overall) | 100,933 (53.1%) | 89,160 (46.9%) |
Employment Industries by Sex in Placer County
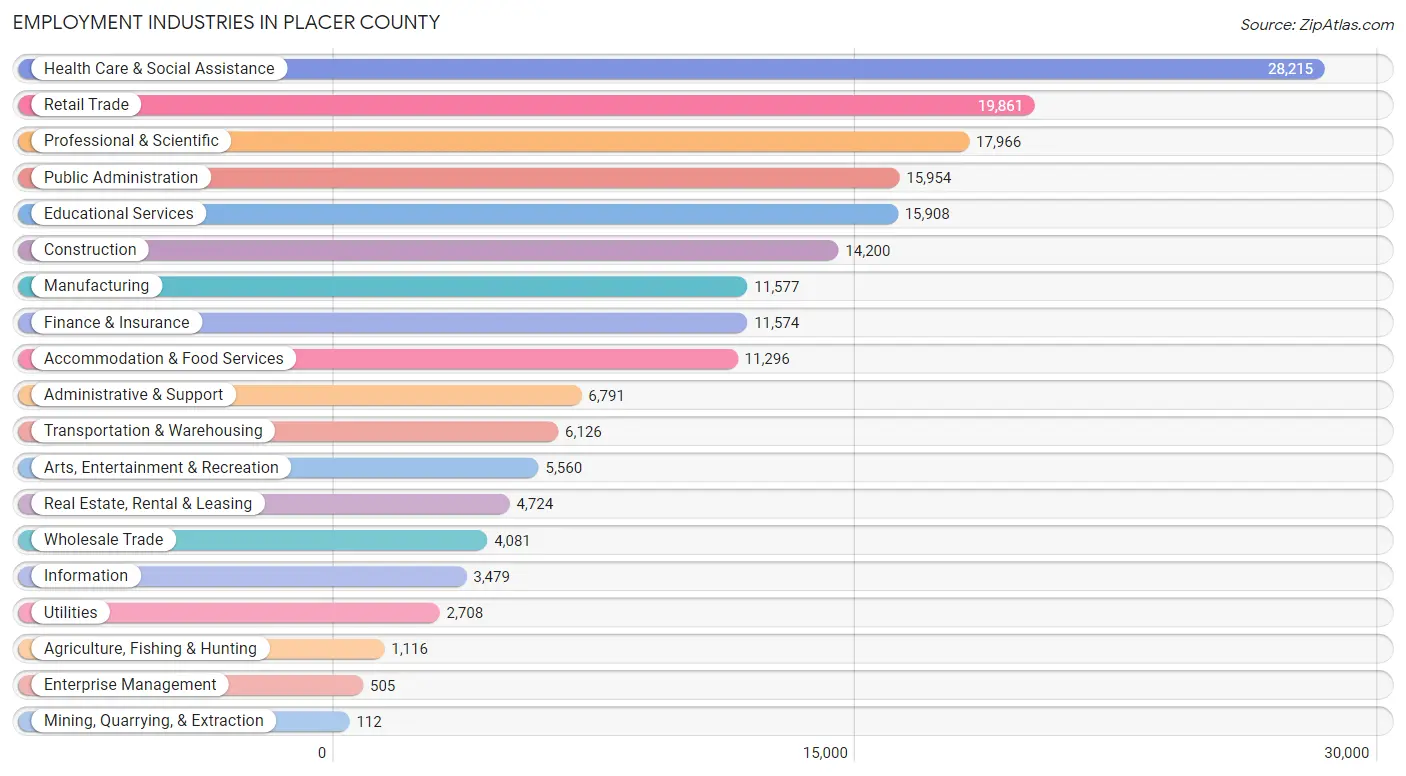
Employment Industries in Placer County
The major employment industries in Placer County include Health Care & Social Assistance (28,215 | 14.8%), Retail Trade (19,861 | 10.4%), Professional & Scientific (17,966 | 9.5%), Public Administration (15,954 | 8.4%), and Educational Services (15,908 | 8.4%).
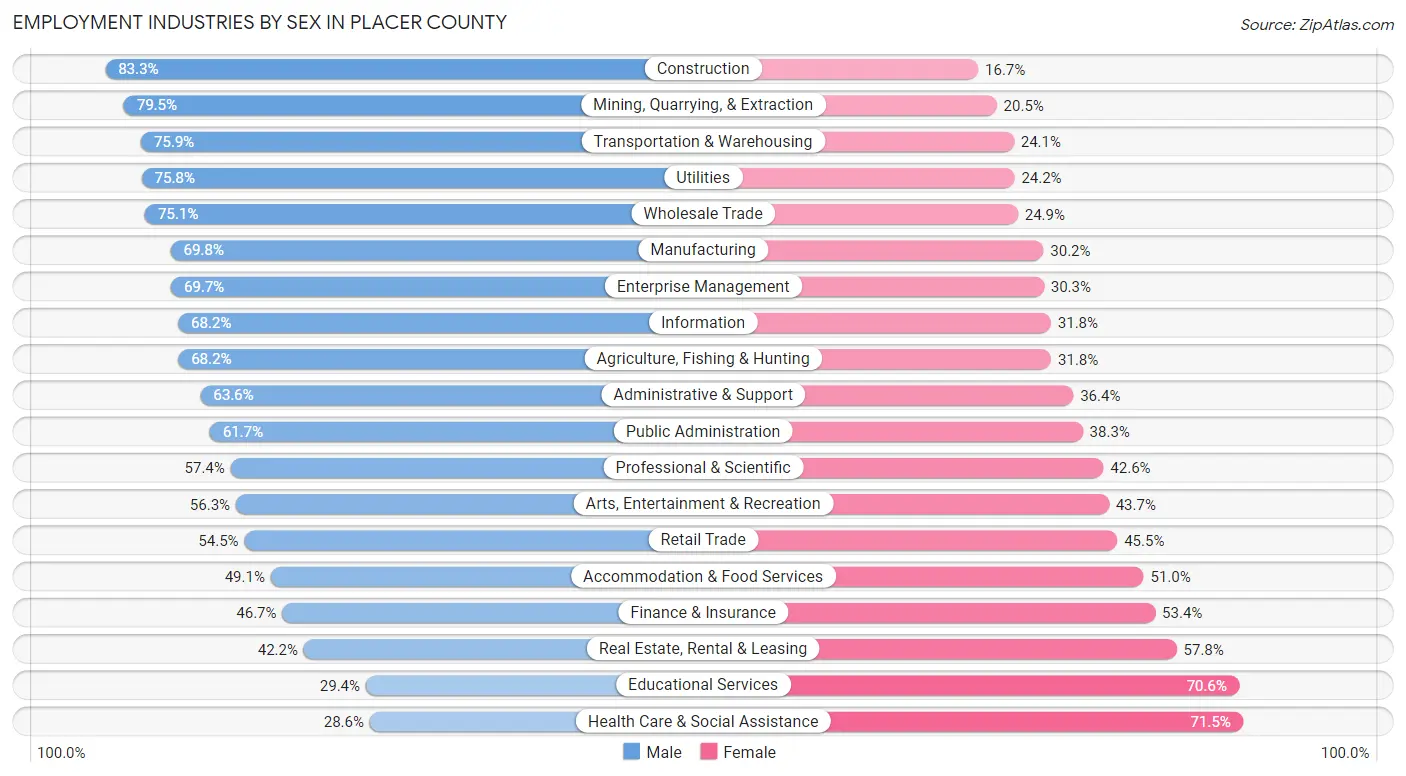
Employment Industries by Sex in Placer County
The Placer County industries that see more men than women are Construction (83.3%), Mining, Quarrying, & Extraction (79.5%), and Transportation & Warehousing (75.9%), whereas the industries that tend to have a higher number of women are Health Care & Social Assistance (71.5%), Educational Services (70.6%), and Real Estate, Rental & Leasing (57.8%).
| Industry | Male | Female |
| Agriculture, Fishing & Hunting | 761 (68.2%) | 355 (31.8%) |
| Mining, Quarrying, & Extraction | 89 (79.5%) | 23 (20.5%) |
| Construction | 11,829 (83.3%) | 2,371 (16.7%) |
| Manufacturing | 8,080 (69.8%) | 3,497 (30.2%) |
| Wholesale Trade | 3,064 (75.1%) | 1,017 (24.9%) |
| Retail Trade | 10,824 (54.5%) | 9,037 (45.5%) |
| Transportation & Warehousing | 4,650 (75.9%) | 1,476 (24.1%) |
| Utilities | 2,052 (75.8%) | 656 (24.2%) |
| Information | 2,374 (68.2%) | 1,105 (31.8%) |
| Finance & Insurance | 5,399 (46.7%) | 6,175 (53.3%) |
| Real Estate, Rental & Leasing | 1,994 (42.2%) | 2,730 (57.8%) |
| Professional & Scientific | 10,306 (57.4%) | 7,660 (42.6%) |
| Enterprise Management | 352 (69.7%) | 153 (30.3%) |
| Administrative & Support | 4,320 (63.6%) | 2,471 (36.4%) |
| Educational Services | 4,671 (29.4%) | 11,237 (70.6%) |
| Health Care & Social Assistance | 8,056 (28.5%) | 20,159 (71.5%) |
| Arts, Entertainment & Recreation | 3,128 (56.3%) | 2,432 (43.7%) |
| Accommodation & Food Services | 5,541 (49.0%) | 5,755 (50.9%) |
| Public Administration | 9,837 (61.7%) | 6,117 (38.3%) |
| Total | 100,933 (53.1%) | 89,160 (46.9%) |
Education in Placer County
School Enrollment in Placer County
The most common levels of schooling among the 97,072 students in Placer County are high school (22,003 | 22.7%), middle school (21,105 | 21.7%), and college / undergraduate (19,647 | 20.2%).
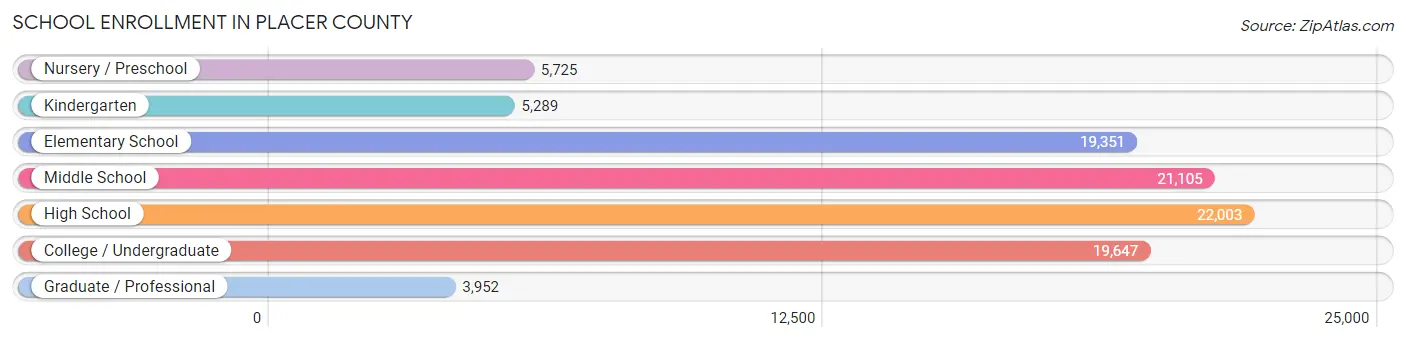
| School Level | # Students | % Students |
| Nursery / Preschool | 5,725 | 5.9% |
| Kindergarten | 5,289 | 5.4% |
| Elementary School | 19,351 | 19.9% |
| Middle School | 21,105 | 21.7% |
| High School | 22,003 | 22.7% |
| College / Undergraduate | 19,647 | 20.2% |
| Graduate / Professional | 3,952 | 4.1% |
| Total | 97,072 | 100.0% |
School Enrollment by Age by Funding Source in Placer County
Out of a total of 97,072 students who are enrolled in schools in Placer County, 13,590 (14.0%) attend a private institution, while the remaining 83,482 (86.0%) are enrolled in public schools. The age group of 3 to 4 year olds has the highest likelihood of being enrolled in private schools, with 2,457 (53.9% in the age bracket) enrolled. Conversely, the age group of 15 to 17 year olds has the lowest likelihood of being enrolled in a private school, with 14,805 (92.3% in the age bracket) attending a public institution.
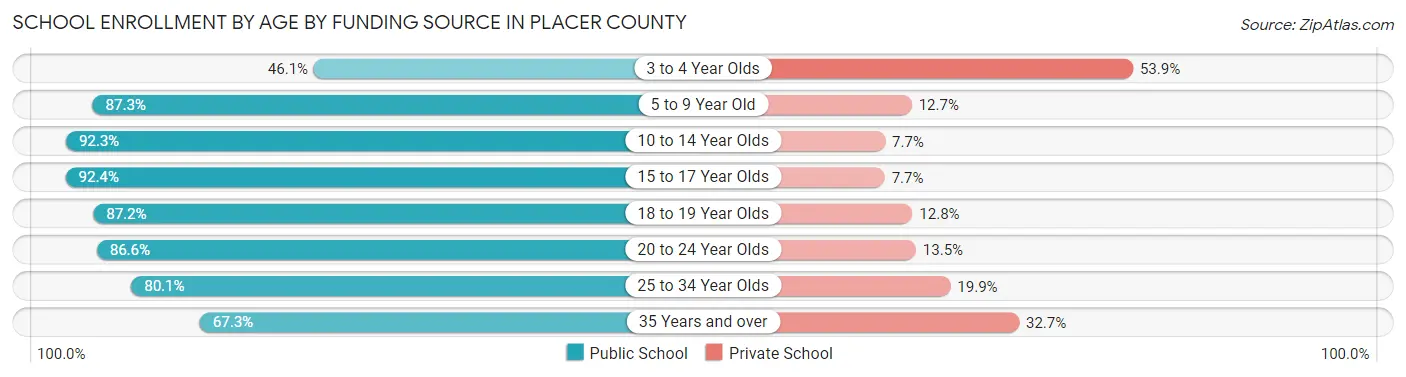
| Age Bracket | Public School | Private School |
| 3 to 4 Year Olds | 2,102 (46.1%) | 2,457 (53.9%) |
| 5 to 9 Year Old | 20,457 (87.3%) | 2,971 (12.7%) |
| 10 to 14 Year Olds | 24,853 (92.3%) | 2,075 (7.7%) |
| 15 to 17 Year Olds | 14,805 (92.3%) | 1,227 (7.6%) |
| 18 to 19 Year Olds | 5,805 (87.2%) | 852 (12.8%) |
| 20 to 24 Year Olds | 7,491 (86.6%) | 1,164 (13.5%) |
| 25 to 34 Year Olds | 4,268 (80.1%) | 1,059 (19.9%) |
| 35 Years and over | 3,694 (67.3%) | 1,792 (32.7%) |
| Total | 83,482 (86.0%) | 13,590 (14.0%) |
Educational Attainment by Field of Study in Placer County
Business (24,907 | 19.3%), social sciences (12,559 | 9.7%), science & technology (12,012 | 9.3%), engineering (11,432 | 8.8%), and arts & humanities (10,186 | 7.9%) are the most common fields of study among 129,374 individuals in Placer County who have obtained a bachelor's degree or higher.
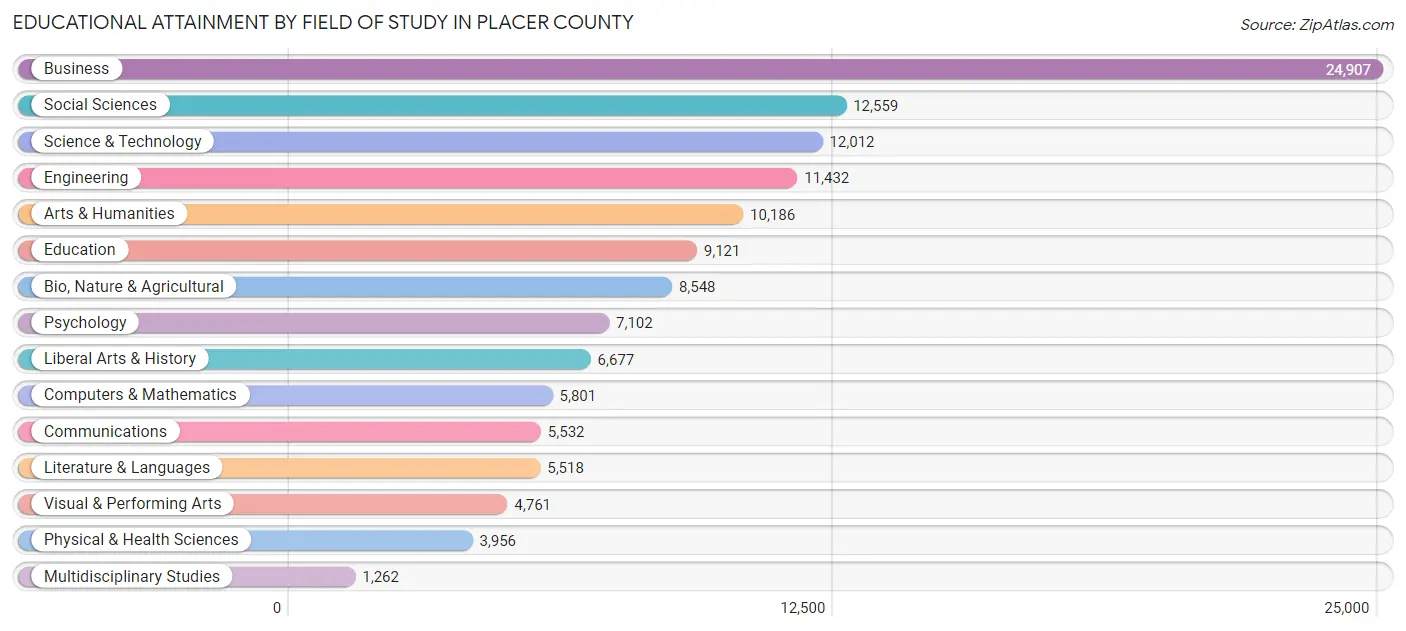
| Field of Study | # Graduates | % Graduates |
| Computers & Mathematics | 5,801 | 4.5% |
| Bio, Nature & Agricultural | 8,548 | 6.6% |
| Physical & Health Sciences | 3,956 | 3.1% |
| Psychology | 7,102 | 5.5% |
| Social Sciences | 12,559 | 9.7% |
| Engineering | 11,432 | 8.8% |
| Multidisciplinary Studies | 1,262 | 1.0% |
| Science & Technology | 12,012 | 9.3% |
| Business | 24,907 | 19.3% |
| Education | 9,121 | 7.0% |
| Literature & Languages | 5,518 | 4.3% |
| Liberal Arts & History | 6,677 | 5.2% |
| Visual & Performing Arts | 4,761 | 3.7% |
| Communications | 5,532 | 4.3% |
| Arts & Humanities | 10,186 | 7.9% |
| Total | 129,374 | 100.0% |
Transportation & Commute in Placer County
Vehicle Availability by Sex in Placer County
The most prevalent vehicle ownership categories in Placer County are males with 2 vehicles (42,703, accounting for 42.8%) and females with 2 vehicles (35,707, making up 49.3%).
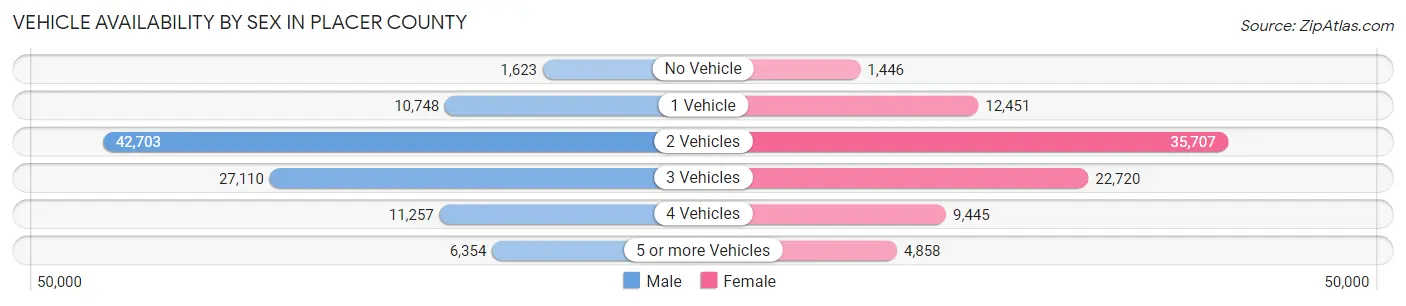
| Vehicles Available | Male | Female |
| No Vehicle | 1,623 (1.6%) | 1,446 (1.7%) |
| 1 Vehicle | 10,748 (10.8%) | 12,451 (14.4%) |
| 2 Vehicles | 42,703 (42.8%) | 35,707 (41.2%) |
| 3 Vehicles | 27,110 (27.2%) | 22,720 (26.2%) |
| 4 Vehicles | 11,257 (11.3%) | 9,445 (10.9%) |
| 5 or more Vehicles | 6,354 (6.4%) | 4,858 (5.6%) |
| Total | 99,795 (100.0%) | 86,627 (100.0%) |
Commute Time in Placer County
The most frequently occuring commute durations in Placer County are 15 to 19 minutes (23,725 commuters, 15.6%), 10 to 14 minutes (21,464 commuters, 14.1%), and 30 to 34 minutes (20,617 commuters, 13.5%).
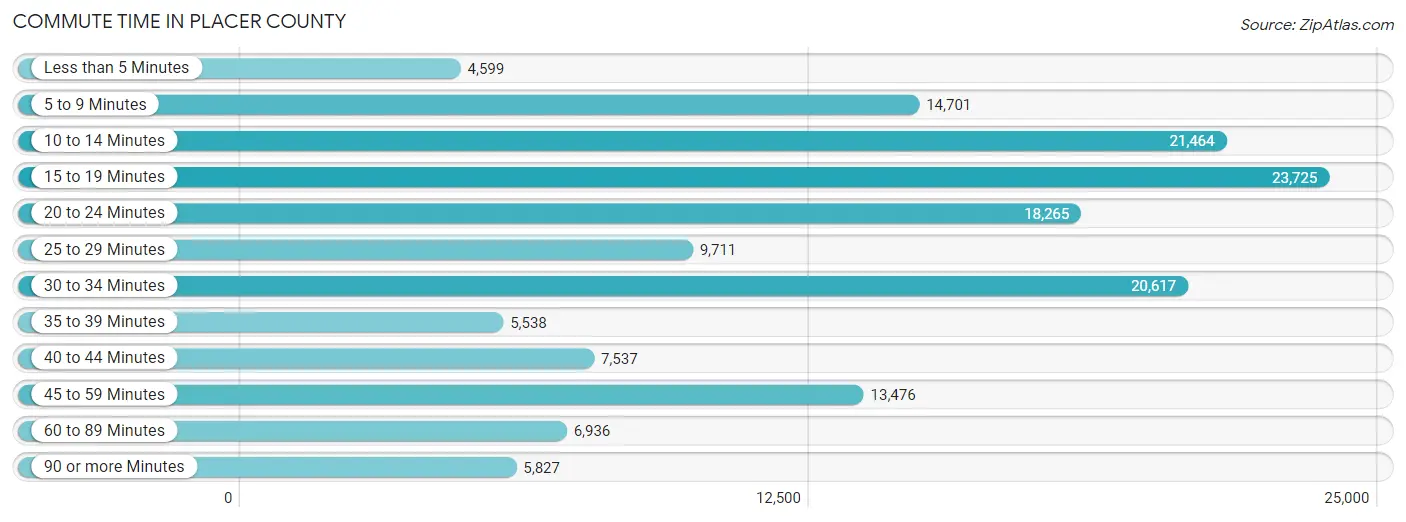
| Commute Time | # Commuters | % Commuters |
| Less than 5 Minutes | 4,599 | 3.0% |
| 5 to 9 Minutes | 14,701 | 9.7% |
| 10 to 14 Minutes | 21,464 | 14.1% |
| 15 to 19 Minutes | 23,725 | 15.6% |
| 20 to 24 Minutes | 18,265 | 12.0% |
| 25 to 29 Minutes | 9,711 | 6.4% |
| 30 to 34 Minutes | 20,617 | 13.5% |
| 35 to 39 Minutes | 5,538 | 3.6% |
| 40 to 44 Minutes | 7,537 | 5.0% |
| 45 to 59 Minutes | 13,476 | 8.8% |
| 60 to 89 Minutes | 6,936 | 4.5% |
| 90 or more Minutes | 5,827 | 3.8% |
Commute Time by Sex in Placer County
The most common commute times in Placer County are 15 to 19 minutes (12,090 commuters, 14.8%) for males and 15 to 19 minutes (11,635 commuters, 16.5%) for females.
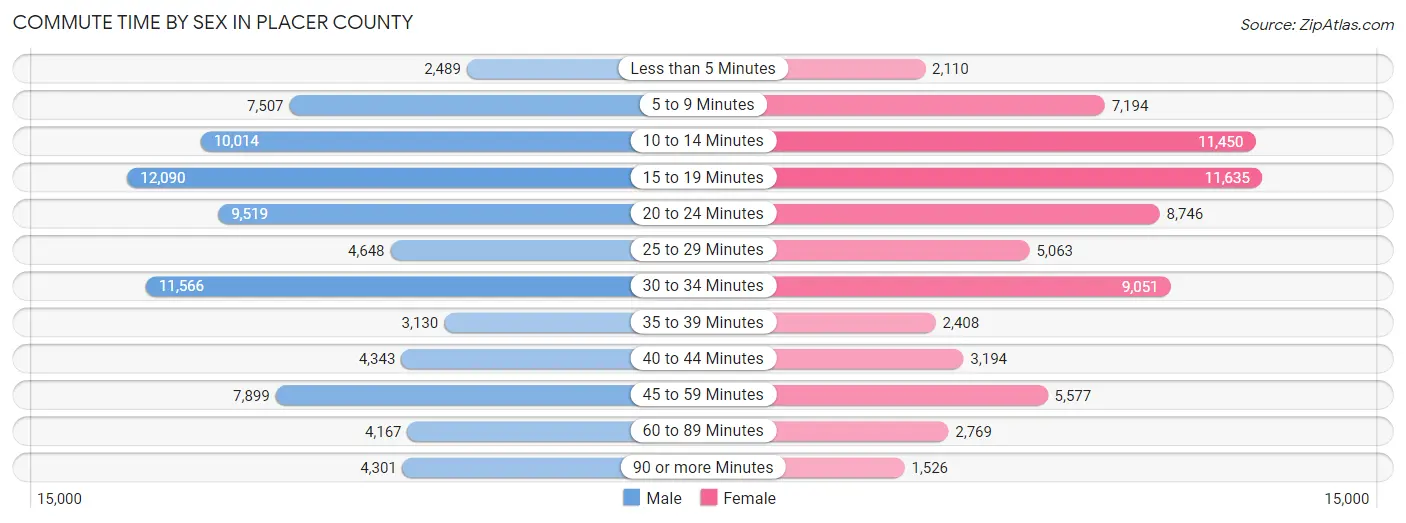
| Commute Time | Male | Female |
| Less than 5 Minutes | 2,489 (3.0%) | 2,110 (3.0%) |
| 5 to 9 Minutes | 7,507 (9.2%) | 7,194 (10.2%) |
| 10 to 14 Minutes | 10,014 (12.3%) | 11,450 (16.2%) |
| 15 to 19 Minutes | 12,090 (14.8%) | 11,635 (16.5%) |
| 20 to 24 Minutes | 9,519 (11.7%) | 8,746 (12.4%) |
| 25 to 29 Minutes | 4,648 (5.7%) | 5,063 (7.2%) |
| 30 to 34 Minutes | 11,566 (14.2%) | 9,051 (12.8%) |
| 35 to 39 Minutes | 3,130 (3.8%) | 2,408 (3.4%) |
| 40 to 44 Minutes | 4,343 (5.3%) | 3,194 (4.5%) |
| 45 to 59 Minutes | 7,899 (9.7%) | 5,577 (7.9%) |
| 60 to 89 Minutes | 4,167 (5.1%) | 2,769 (3.9%) |
| 90 or more Minutes | 4,301 (5.3%) | 1,526 (2.2%) |
Time of Departure to Work by Sex in Placer County
The most frequent times of departure to work in Placer County are 7:00 AM to 7:29 AM (11,418, 14.0%) for males and 7:00 AM to 7:29 AM (10,675, 15.1%) for females.
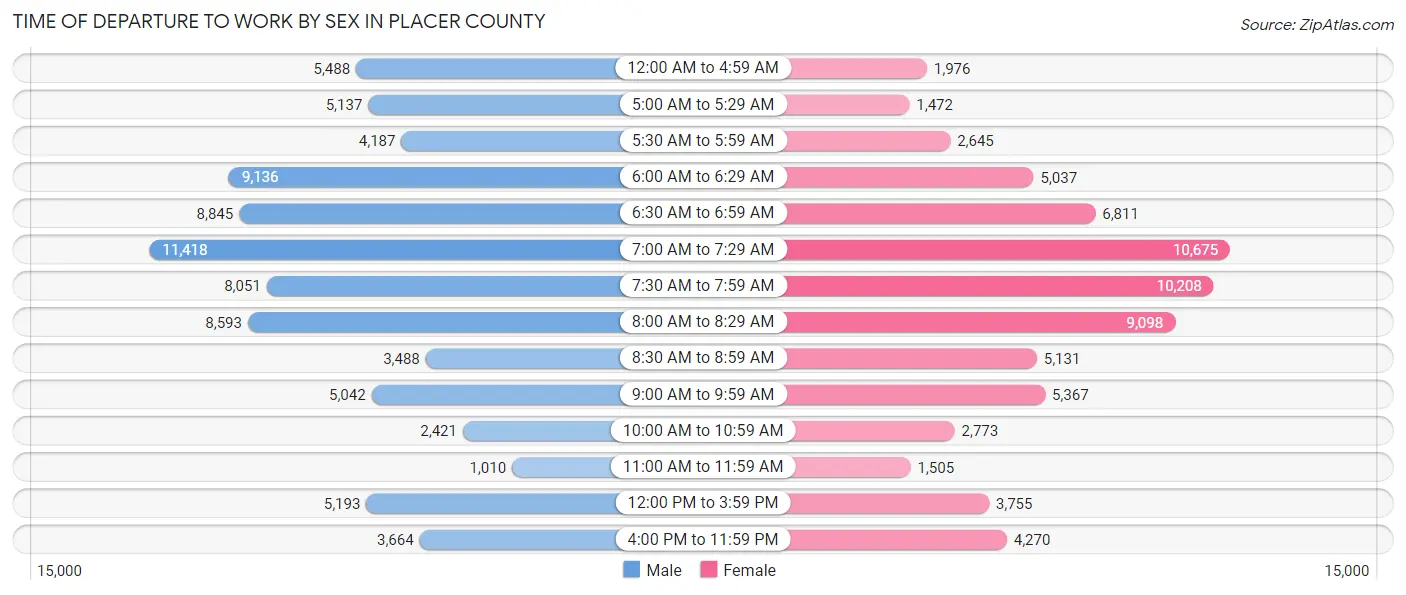
| Time of Departure | Male | Female |
| 12:00 AM to 4:59 AM | 5,488 (6.7%) | 1,976 (2.8%) |
| 5:00 AM to 5:29 AM | 5,137 (6.3%) | 1,472 (2.1%) |
| 5:30 AM to 5:59 AM | 4,187 (5.1%) | 2,645 (3.7%) |
| 6:00 AM to 6:29 AM | 9,136 (11.2%) | 5,037 (7.1%) |
| 6:30 AM to 6:59 AM | 8,845 (10.8%) | 6,811 (9.6%) |
| 7:00 AM to 7:29 AM | 11,418 (14.0%) | 10,675 (15.1%) |
| 7:30 AM to 7:59 AM | 8,051 (9.9%) | 10,208 (14.4%) |
| 8:00 AM to 8:29 AM | 8,593 (10.5%) | 9,098 (12.9%) |
| 8:30 AM to 8:59 AM | 3,488 (4.3%) | 5,131 (7.3%) |
| 9:00 AM to 9:59 AM | 5,042 (6.2%) | 5,367 (7.6%) |
| 10:00 AM to 10:59 AM | 2,421 (3.0%) | 2,773 (3.9%) |
| 11:00 AM to 11:59 AM | 1,010 (1.2%) | 1,505 (2.1%) |
| 12:00 PM to 3:59 PM | 5,193 (6.4%) | 3,755 (5.3%) |
| 4:00 PM to 11:59 PM | 3,664 (4.5%) | 4,270 (6.0%) |
| Total | 81,673 (100.0%) | 70,723 (100.0%) |
Housing Occupancy in Placer County
Occupancy by Ownership in Placer County
Of the total 152,537 dwellings in Placer County, owner-occupied units account for 112,597 (73.8%), while renter-occupied units make up 39,940 (26.2%).
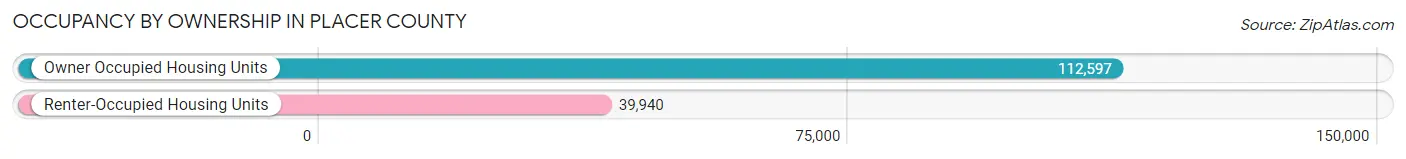
| Occupancy | # Housing Units | % Housing Units |
| Owner Occupied Housing Units | 112,597 | 73.8% |
| Renter-Occupied Housing Units | 39,940 | 26.2% |
| Total Occupied Housing Units | 152,537 | 100.0% |
Occupancy by Household Size in Placer County
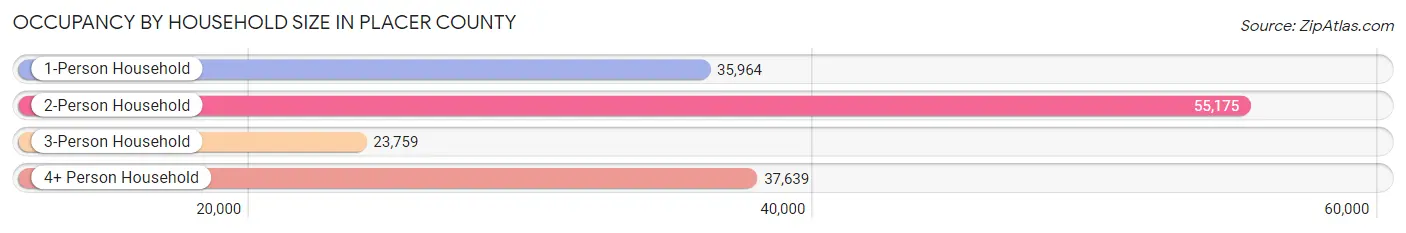
| Household Size | # Housing Units | % Housing Units |
| 1-Person Household | 35,964 | 23.6% |
| 2-Person Household | 55,175 | 36.2% |
| 3-Person Household | 23,759 | 15.6% |
| 4+ Person Household | 37,639 | 24.7% |
| Total Housing Units | 152,537 | 100.0% |
Occupancy by Ownership by Household Size in Placer County
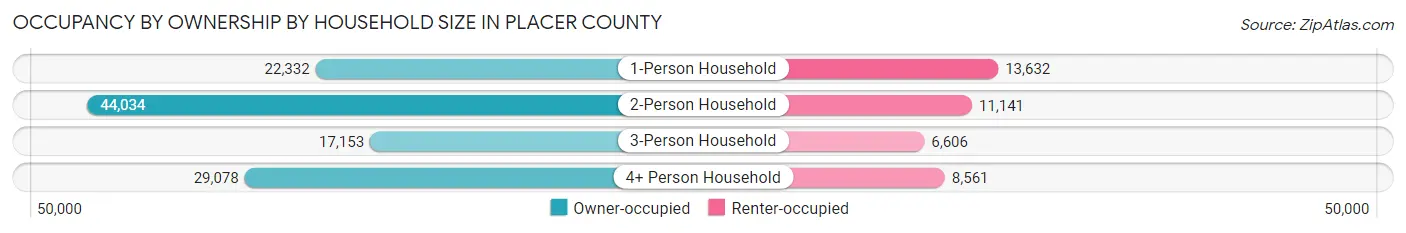
| Household Size | Owner-occupied | Renter-occupied |
| 1-Person Household | 22,332 (62.1%) | 13,632 (37.9%) |
| 2-Person Household | 44,034 (79.8%) | 11,141 (20.2%) |
| 3-Person Household | 17,153 (72.2%) | 6,606 (27.8%) |
| 4+ Person Household | 29,078 (77.2%) | 8,561 (22.8%) |
| Total Housing Units | 112,597 (73.8%) | 39,940 (26.2%) |
Occupancy by Educational Attainment in Placer County
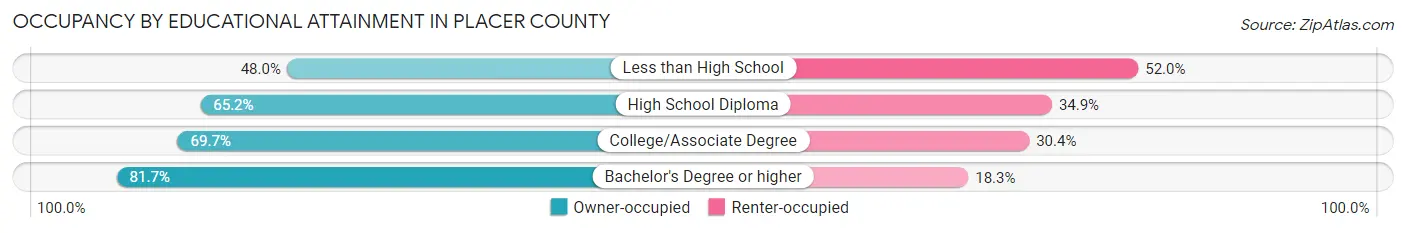
| Household Size | Owner-occupied | Renter-occupied |
| Less than High School | 2,635 (48.0%) | 2,851 (52.0%) |
| High School Diploma | 14,151 (65.1%) | 7,571 (34.8%) |
| College/Associate Degree | 38,201 (69.7%) | 16,645 (30.3%) |
| Bachelor's Degree or higher | 57,610 (81.7%) | 12,873 (18.3%) |
Occupancy by Age of Householder in Placer County
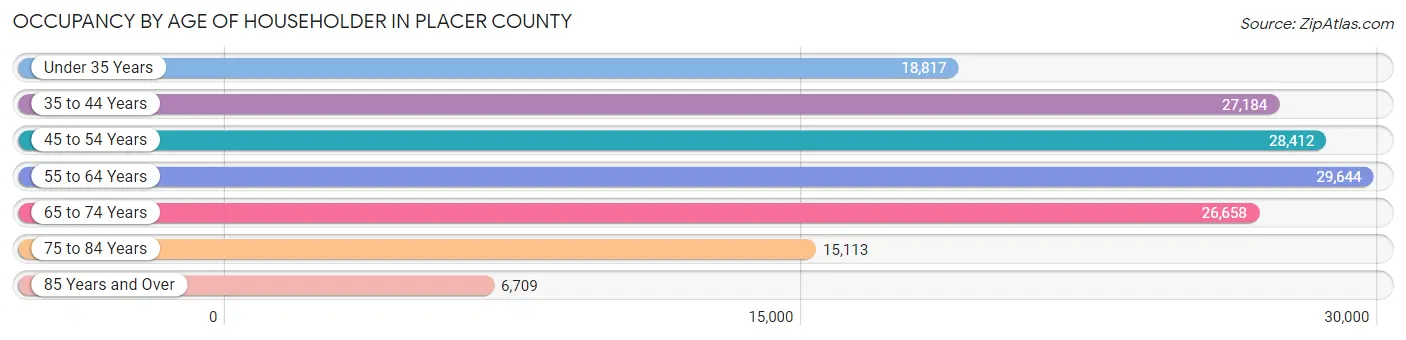
| Age Bracket | # Households | % Households |
| Under 35 Years | 18,817 | 12.3% |
| 35 to 44 Years | 27,184 | 17.8% |
| 45 to 54 Years | 28,412 | 18.6% |
| 55 to 64 Years | 29,644 | 19.4% |
| 65 to 74 Years | 26,658 | 17.5% |
| 75 to 84 Years | 15,113 | 9.9% |
| 85 Years and Over | 6,709 | 4.4% |
| Total | 152,537 | 100.0% |
Housing Finances in Placer County
Median Income by Occupancy in Placer County
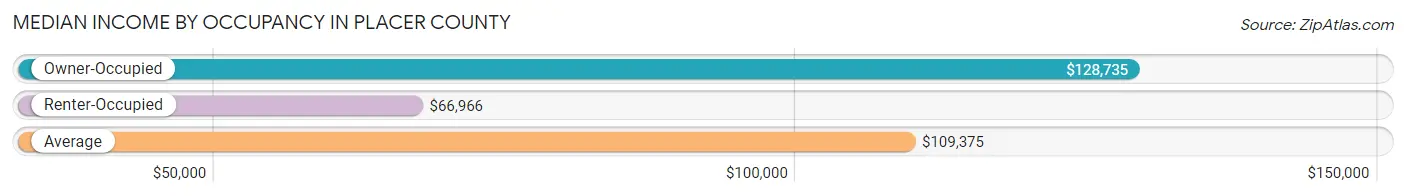
| Occupancy Type | # Households | Median Income |
| Owner-Occupied | 112,597 (73.8%) | $128,735 |
| Renter-Occupied | 39,940 (26.2%) | $66,966 |
| Average | 152,537 (100.0%) | $109,375 |
Occupancy by Householder Income Bracket in Placer County
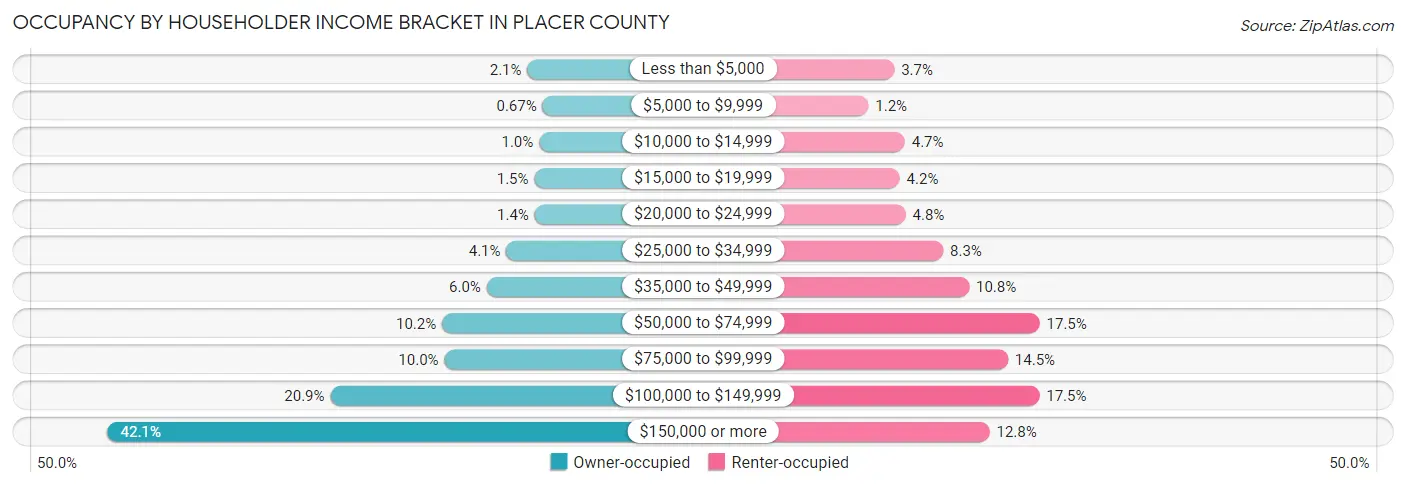
| Income Bracket | Owner-occupied | Renter-occupied |
| Less than $5,000 | 2,388 (2.1%) | 1,468 (3.7%) |
| $5,000 to $9,999 | 757 (0.7%) | 488 (1.2%) |
| $10,000 to $14,999 | 1,126 (1.0%) | 1,872 (4.7%) |
| $15,000 to $19,999 | 1,628 (1.5%) | 1,676 (4.2%) |
| $20,000 to $24,999 | 1,603 (1.4%) | 1,907 (4.8%) |
| $25,000 to $34,999 | 4,643 (4.1%) | 3,332 (8.3%) |
| $35,000 to $49,999 | 6,744 (6.0%) | 4,316 (10.8%) |
| $50,000 to $74,999 | 11,528 (10.2%) | 7,002 (17.5%) |
| $75,000 to $99,999 | 11,281 (10.0%) | 5,795 (14.5%) |
| $100,000 to $149,999 | 23,510 (20.9%) | 6,988 (17.5%) |
| $150,000 or more | 47,389 (42.1%) | 5,096 (12.8%) |
| Total | 112,597 (100.0%) | 39,940 (100.0%) |
Monthly Housing Cost Tiers in Placer County
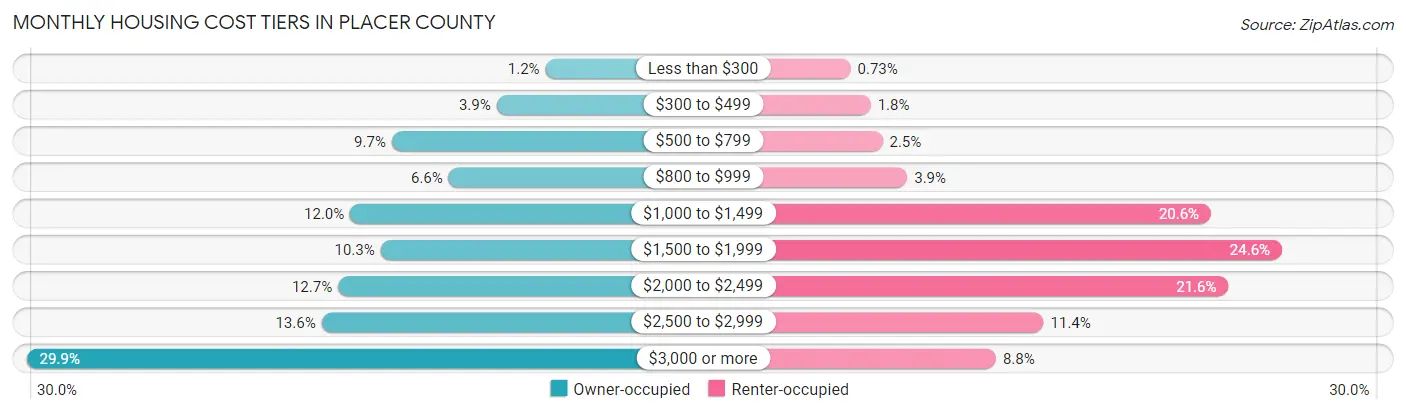
| Monthly Cost | Owner-occupied | Renter-occupied |
| Less than $300 | 1,384 (1.2%) | 292 (0.7%) |
| $300 to $499 | 4,430 (3.9%) | 735 (1.8%) |
| $500 to $799 | 10,940 (9.7%) | 993 (2.5%) |
| $800 to $999 | 7,410 (6.6%) | 1,541 (3.9%) |
| $1,000 to $1,499 | 13,532 (12.0%) | 8,239 (20.6%) |
| $1,500 to $1,999 | 11,637 (10.3%) | 9,807 (24.5%) |
| $2,000 to $2,499 | 14,291 (12.7%) | 8,624 (21.6%) |
| $2,500 to $2,999 | 15,317 (13.6%) | 4,548 (11.4%) |
| $3,000 or more | 33,656 (29.9%) | 3,498 (8.8%) |
| Total | 112,597 (100.0%) | 39,940 (100.0%) |
Physical Housing Characteristics in Placer County
Housing Structures in Placer County
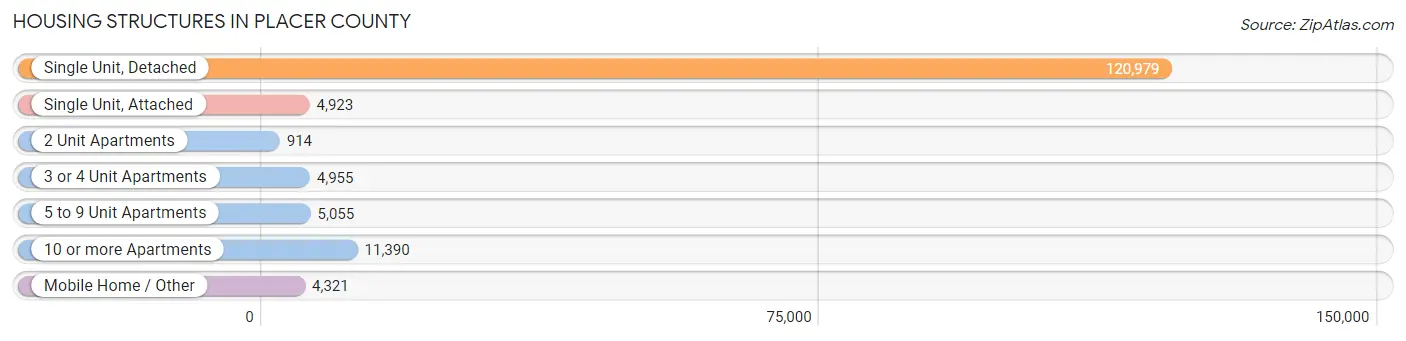
| Structure Type | # Housing Units | % Housing Units |
| Single Unit, Detached | 120,979 | 79.3% |
| Single Unit, Attached | 4,923 | 3.2% |
| 2 Unit Apartments | 914 | 0.6% |
| 3 or 4 Unit Apartments | 4,955 | 3.3% |
| 5 to 9 Unit Apartments | 5,055 | 3.3% |
| 10 or more Apartments | 11,390 | 7.5% |
| Mobile Home / Other | 4,321 | 2.8% |
| Total | 152,537 | 100.0% |
Housing Structures by Occupancy in Placer County
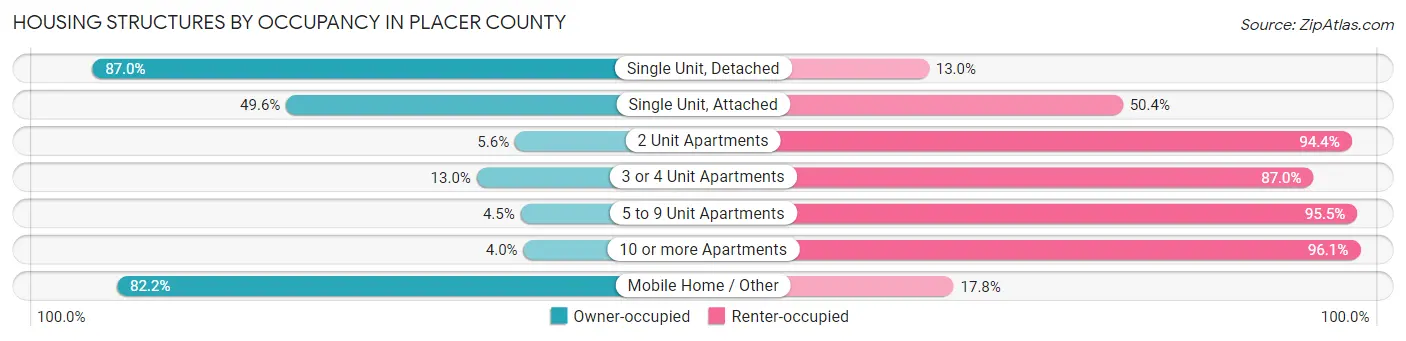
| Structure Type | Owner-occupied | Renter-occupied |
| Single Unit, Detached | 105,230 (87.0%) | 15,749 (13.0%) |
| Single Unit, Attached | 2,444 (49.6%) | 2,479 (50.4%) |
| 2 Unit Apartments | 51 (5.6%) | 863 (94.4%) |
| 3 or 4 Unit Apartments | 642 (13.0%) | 4,313 (87.0%) |
| 5 to 9 Unit Apartments | 228 (4.5%) | 4,827 (95.5%) |
| 10 or more Apartments | 450 (4.0%) | 10,940 (96.1%) |
| Mobile Home / Other | 3,552 (82.2%) | 769 (17.8%) |
| Total | 112,597 (73.8%) | 39,940 (26.2%) |
Housing Structures by Number of Rooms in Placer County
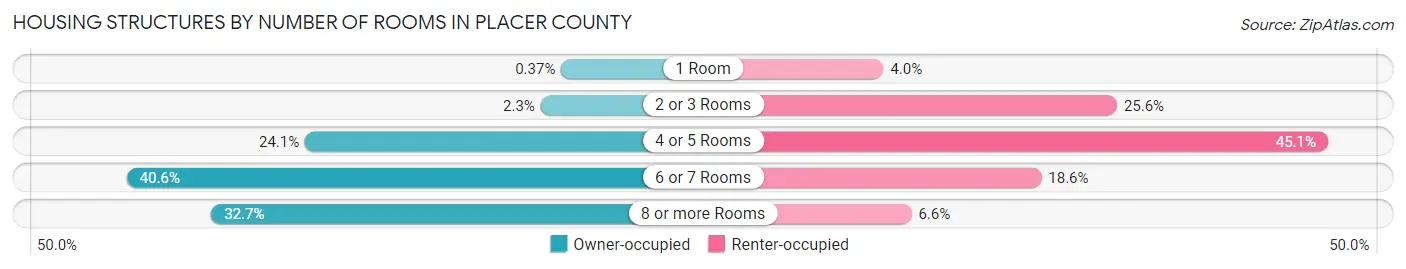
| Number of Rooms | Owner-occupied | Renter-occupied |
| 1 Room | 415 (0.4%) | 1,604 (4.0%) |
| 2 or 3 Rooms | 2,553 (2.3%) | 10,231 (25.6%) |
| 4 or 5 Rooms | 27,095 (24.1%) | 18,020 (45.1%) |
| 6 or 7 Rooms | 45,666 (40.6%) | 7,441 (18.6%) |
| 8 or more Rooms | 36,868 (32.7%) | 2,644 (6.6%) |
| Total | 112,597 (100.0%) | 39,940 (100.0%) |
Housing Structure by Heating Type in Placer County
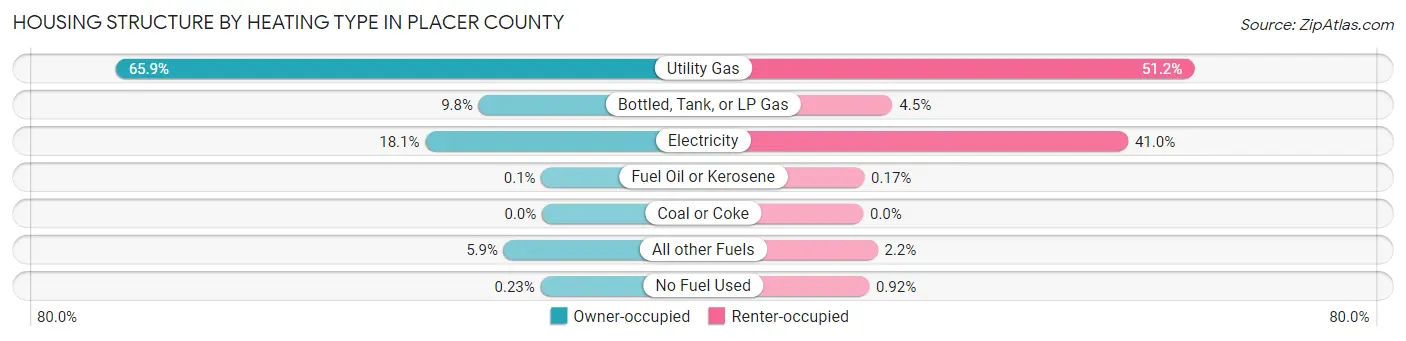
| Heating Type | Owner-occupied | Renter-occupied |
| Utility Gas | 74,215 (65.9%) | 20,437 (51.2%) |
| Bottled, Tank, or LP Gas | 11,016 (9.8%) | 1,814 (4.5%) |
| Electricity | 20,322 (18.0%) | 16,360 (41.0%) |
| Fuel Oil or Kerosene | 112 (0.1%) | 68 (0.2%) |
| Coal or Coke | 0 (0.0%) | 0 (0.0%) |
| All other Fuels | 6,670 (5.9%) | 895 (2.2%) |
| No Fuel Used | 262 (0.2%) | 366 (0.9%) |
| Total | 112,597 (100.0%) | 39,940 (100.0%) |
Household Vehicle Usage in Placer County
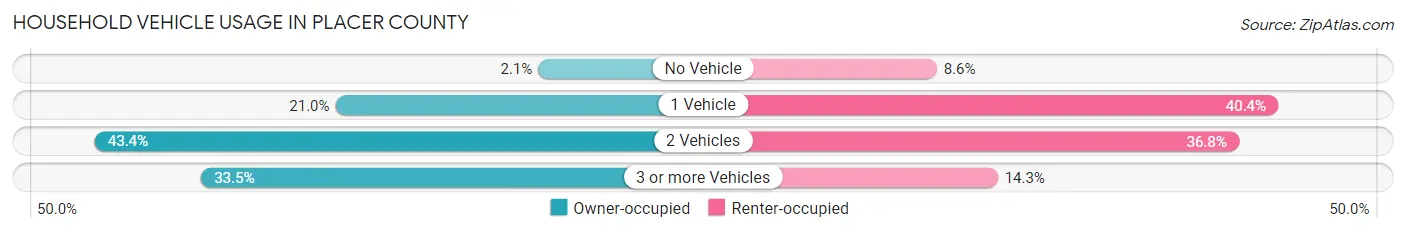
| Vehicles per Household | Owner-occupied | Renter-occupied |
| No Vehicle | 2,318 (2.1%) | 3,422 (8.6%) |
| 1 Vehicle | 23,637 (21.0%) | 16,141 (40.4%) |
| 2 Vehicles | 48,911 (43.4%) | 14,683 (36.8%) |
| 3 or more Vehicles | 37,731 (33.5%) | 5,694 (14.3%) |
| Total | 112,597 (100.0%) | 39,940 (100.0%) |
Real Estate & Mortgages in Placer County
Real Estate and Mortgage Overview in Placer County
| Characteristic | Without Mortgage | With Mortgage |
| Housing Units | 33,920 | 78,677 |
| Median Property Value | $599,200 | $637,300 |
| Median Household Income | $86,083 | $38,666 |
| Monthly Housing Costs | $832 | $33,428 |
| Real Estate Taxes | $4,485 | $1,151 |
Property Value by Mortgage Status in Placer County
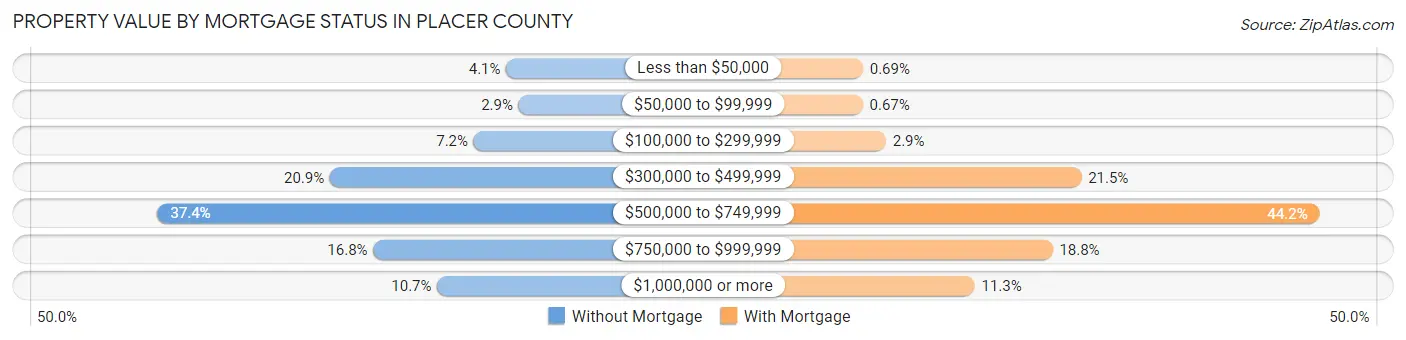
| Property Value | Without Mortgage | With Mortgage |
| Less than $50,000 | 1,399 (4.1%) | 544 (0.7%) |
| $50,000 to $99,999 | 993 (2.9%) | 524 (0.7%) |
| $100,000 to $299,999 | 2,446 (7.2%) | 2,269 (2.9%) |
| $300,000 to $499,999 | 7,094 (20.9%) | 16,905 (21.5%) |
| $500,000 to $749,999 | 12,670 (37.3%) | 34,768 (44.2%) |
| $750,000 to $999,999 | 5,692 (16.8%) | 14,750 (18.8%) |
| $1,000,000 or more | 3,626 (10.7%) | 8,917 (11.3%) |
| Total | 33,920 (100.0%) | 78,677 (100.0%) |
Household Income by Mortgage Status in Placer County
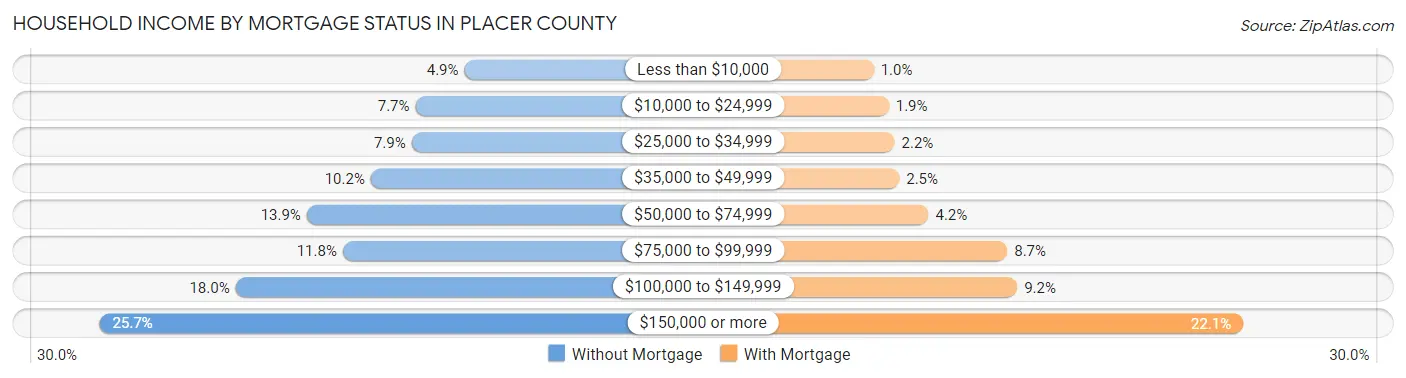
| Household Income | Without Mortgage | With Mortgage |
| Less than $10,000 | 1,651 (4.9%) | 822 (1.0%) |
| $10,000 to $24,999 | 2,601 (7.7%) | 1,494 (1.9%) |
| $25,000 to $34,999 | 2,675 (7.9%) | 1,756 (2.2%) |
| $35,000 to $49,999 | 3,465 (10.2%) | 1,968 (2.5%) |
| $50,000 to $74,999 | 4,708 (13.9%) | 3,279 (4.2%) |
| $75,000 to $99,999 | 4,009 (11.8%) | 6,820 (8.7%) |
| $100,000 to $149,999 | 6,088 (17.9%) | 7,272 (9.2%) |
| $150,000 or more | 8,723 (25.7%) | 17,422 (22.1%) |
| Total | 33,920 (100.0%) | 78,677 (100.0%) |
Property Value to Household Income Ratio in Placer County
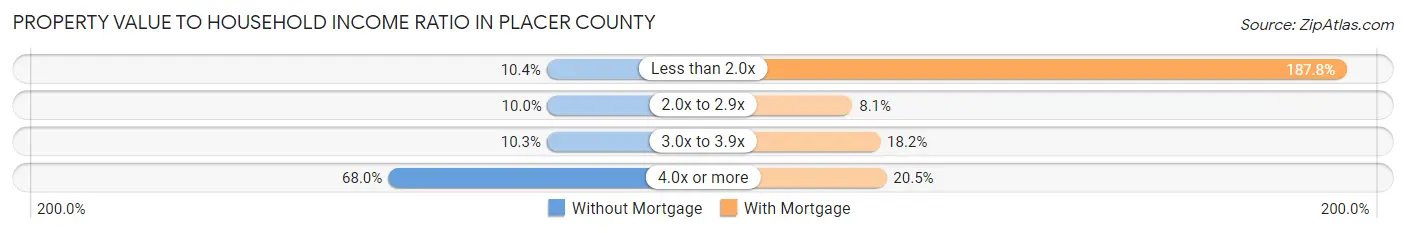
| Value-to-Income Ratio | Without Mortgage | With Mortgage |
| Less than 2.0x | 3,515 (10.4%) | 147,758 (187.8%) |
| 2.0x to 2.9x | 3,399 (10.0%) | 6,389 (8.1%) |
| 3.0x to 3.9x | 3,506 (10.3%) | 14,343 (18.2%) |
| 4.0x or more | 23,051 (68.0%) | 16,139 (20.5%) |
| Total | 33,920 (100.0%) | 78,677 (100.0%) |
Real Estate Taxes by Mortgage Status in Placer County
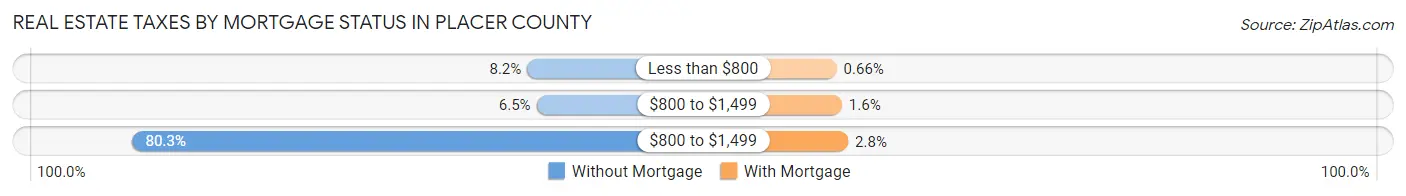
| Property Taxes | Without Mortgage | With Mortgage |
| Less than $800 | 2,787 (8.2%) | 519 (0.7%) |
| $800 to $1,499 | 2,207 (6.5%) | 1,272 (1.6%) |
| $800 to $1,499 | 27,226 (80.3%) | 2,172 (2.8%) |
| Total | 33,920 (100.0%) | 78,677 (100.0%) |
Health & Disability in Placer County
Health Insurance Coverage by Age in Placer County
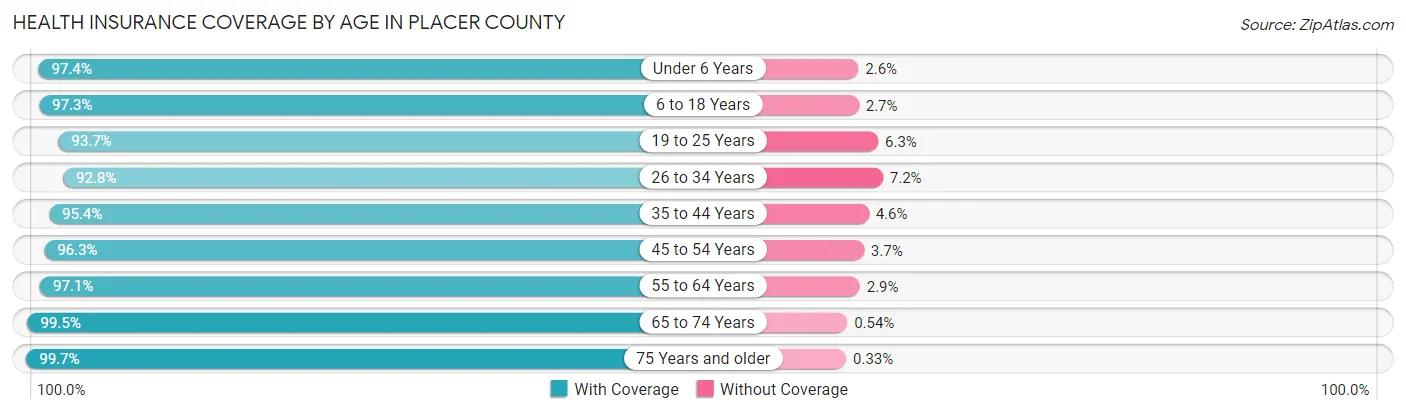
| Age Bracket | With Coverage | Without Coverage |
| Under 6 Years | 24,475 (97.4%) | 659 (2.6%) |
| 6 to 18 Years | 67,398 (97.3%) | 1,873 (2.7%) |
| 19 to 25 Years | 27,286 (93.7%) | 1,837 (6.3%) |
| 26 to 34 Years | 36,161 (92.8%) | 2,801 (7.2%) |
| 35 to 44 Years | 51,962 (95.4%) | 2,485 (4.6%) |
| 45 to 54 Years | 51,044 (96.3%) | 1,941 (3.7%) |
| 55 to 64 Years | 52,231 (97.1%) | 1,556 (2.9%) |
| 65 to 74 Years | 45,013 (99.5%) | 244 (0.5%) |
| 75 Years and older | 34,597 (99.7%) | 113 (0.3%) |
| Total | 390,167 (96.7%) | 13,509 (3.4%) |
Health Insurance Coverage by Citizenship Status in Placer County
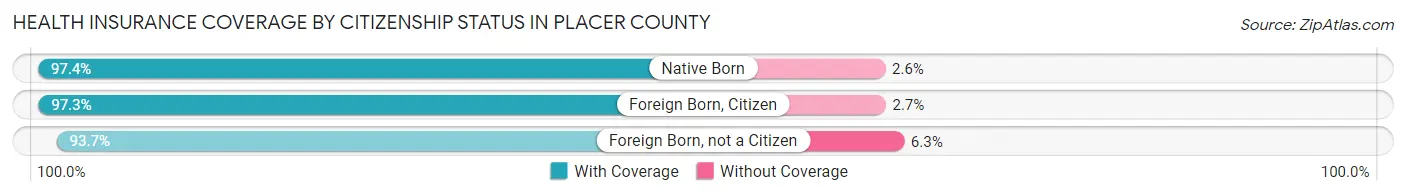
| Citizenship Status | With Coverage | Without Coverage |
| Native Born | 24,475 (97.4%) | 659 (2.6%) |
| Foreign Born, Citizen | 67,398 (97.3%) | 1,873 (2.7%) |
| Foreign Born, not a Citizen | 27,286 (93.7%) | 1,837 (6.3%) |
Health Insurance Coverage by Household Income in Placer County
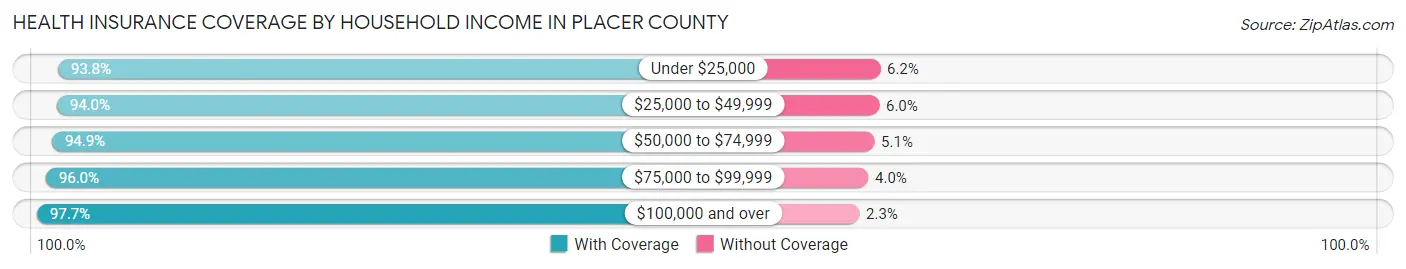
| Household Income | With Coverage | Without Coverage |
| Under $25,000 | 22,536 (93.8%) | 1,496 (6.2%) |
| $25,000 to $49,999 | 33,839 (94.0%) | 2,174 (6.0%) |
| $50,000 to $74,999 | 39,626 (94.9%) | 2,143 (5.1%) |
| $75,000 to $99,999 | 39,897 (96.0%) | 1,659 (4.0%) |
| $100,000 and over | 251,097 (97.7%) | 5,946 (2.3%) |
Public vs Private Health Insurance Coverage by Age in Placer County
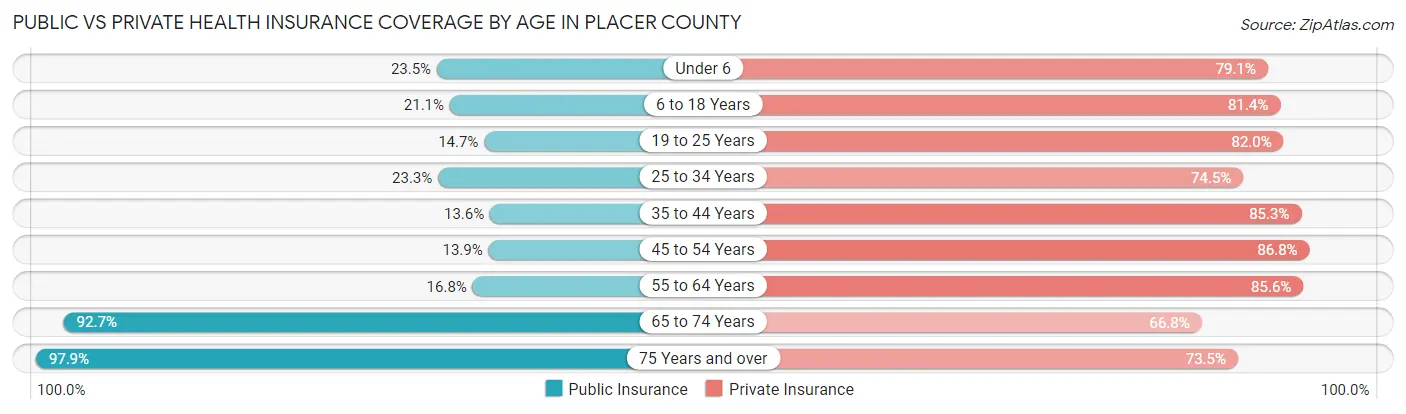
| Age Bracket | Public Insurance | Private Insurance |
| Under 6 | 5,897 (23.5%) | 19,868 (79.0%) |
| 6 to 18 Years | 14,587 (21.1%) | 56,356 (81.4%) |
| 19 to 25 Years | 4,277 (14.7%) | 23,878 (82.0%) |
| 25 to 34 Years | 9,060 (23.3%) | 29,021 (74.5%) |
| 35 to 44 Years | 7,408 (13.6%) | 46,425 (85.3%) |
| 45 to 54 Years | 7,353 (13.9%) | 45,990 (86.8%) |
| 55 to 64 Years | 9,054 (16.8%) | 46,056 (85.6%) |
| 65 to 74 Years | 41,973 (92.7%) | 30,213 (66.8%) |
| 75 Years and over | 33,982 (97.9%) | 25,513 (73.5%) |
| Total | 133,591 (33.1%) | 323,320 (80.1%) |
Disability Status by Sex by Age in Placer County
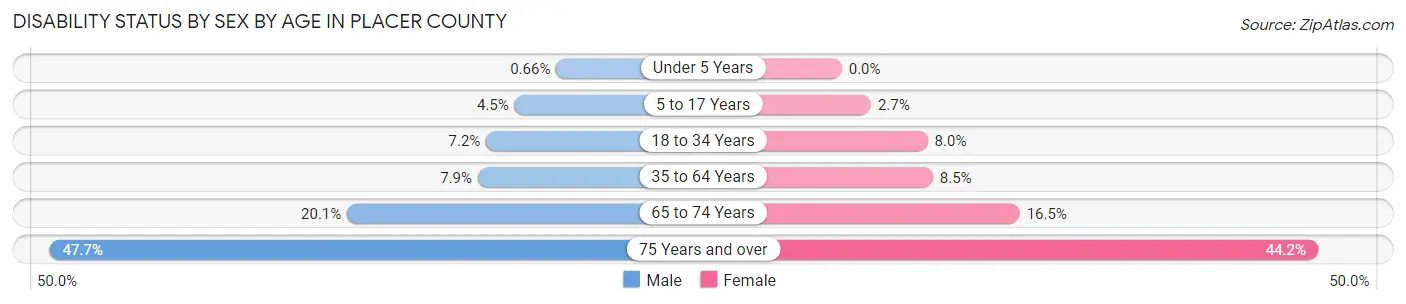
| Age Bracket | Male | Female |
| Under 5 Years | 70 (0.7%) | 0 (0.0%) |
| 5 to 17 Years | 1,594 (4.5%) | 903 (2.7%) |
| 18 to 34 Years | 2,660 (7.2%) | 2,884 (8.0%) |
| 35 to 64 Years | 6,330 (7.9%) | 6,887 (8.5%) |
| 65 to 74 Years | 4,208 (20.1%) | 4,010 (16.5%) |
| 75 Years and over | 6,991 (47.7%) | 8,856 (44.2%) |
Disability Class by Sex by Age in Placer County
Disability Class: Hearing Difficulty
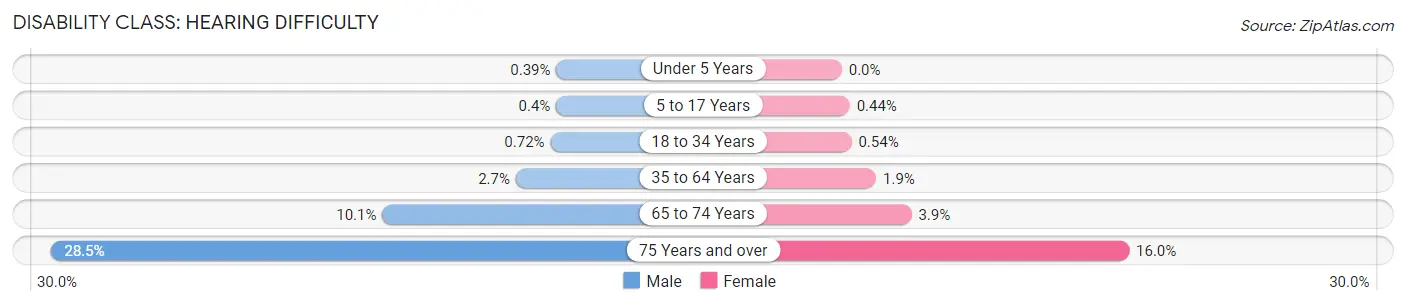
| Age Bracket | Male | Female |
| Under 5 Years | 42 (0.4%) | 0 (0.0%) |
| 5 to 17 Years | 141 (0.4%) | 146 (0.4%) |
| 18 to 34 Years | 269 (0.7%) | 196 (0.5%) |
| 35 to 64 Years | 2,112 (2.6%) | 1,553 (1.9%) |
| 65 to 74 Years | 2,113 (10.1%) | 942 (3.9%) |
| 75 Years and over | 4,180 (28.5%) | 3,208 (16.0%) |
Disability Class: Vision Difficulty
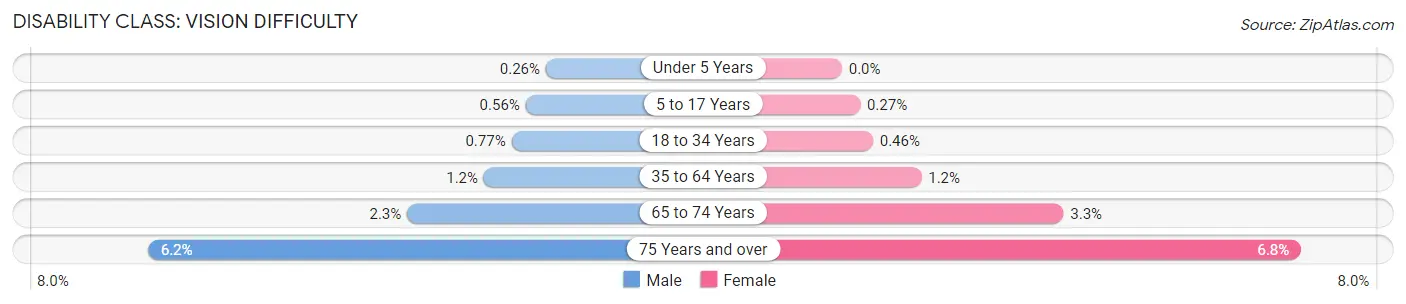
| Age Bracket | Male | Female |
| Under 5 Years | 28 (0.3%) | 0 (0.0%) |
| 5 to 17 Years | 198 (0.6%) | 89 (0.3%) |
| 18 to 34 Years | 285 (0.8%) | 166 (0.5%) |
| 35 to 64 Years | 941 (1.2%) | 958 (1.2%) |
| 65 to 74 Years | 487 (2.3%) | 800 (3.3%) |
| 75 Years and over | 905 (6.2%) | 1,368 (6.8%) |
Disability Class: Cognitive Difficulty
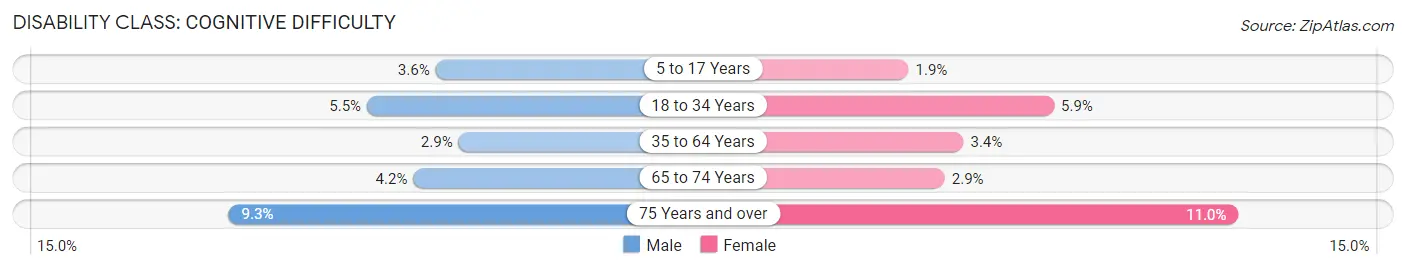
| Age Bracket | Male | Female |
| 5 to 17 Years | 1,254 (3.6%) | 620 (1.9%) |
| 18 to 34 Years | 2,033 (5.5%) | 2,138 (5.9%) |
| 35 to 64 Years | 2,326 (2.9%) | 2,760 (3.4%) |
| 65 to 74 Years | 877 (4.2%) | 698 (2.9%) |
| 75 Years and over | 1,367 (9.3%) | 2,213 (11.0%) |
Disability Class: Ambulatory Difficulty
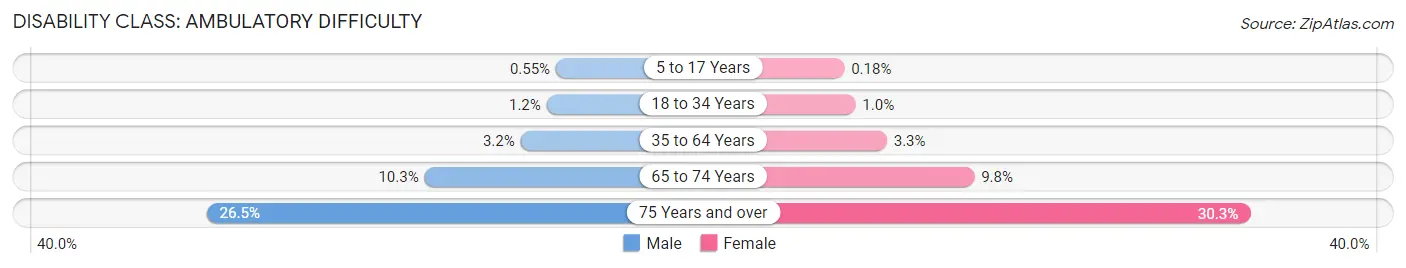
| Age Bracket | Male | Female |
| 5 to 17 Years | 194 (0.5%) | 60 (0.2%) |
| 18 to 34 Years | 462 (1.2%) | 366 (1.0%) |
| 35 to 64 Years | 2,532 (3.2%) | 2,721 (3.3%) |
| 65 to 74 Years | 2,161 (10.3%) | 2,387 (9.8%) |
| 75 Years and over | 3,882 (26.5%) | 6,077 (30.3%) |
Disability Class: Self-Care Difficulty
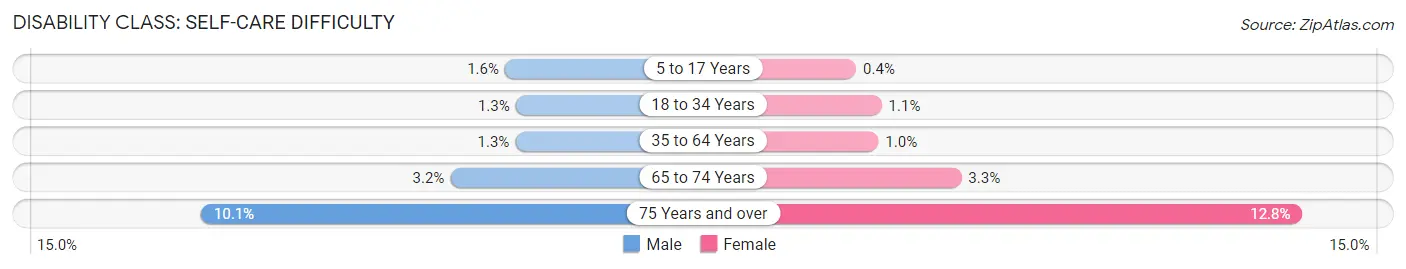
| Age Bracket | Male | Female |
| 5 to 17 Years | 575 (1.6%) | 132 (0.4%) |
| 18 to 34 Years | 494 (1.3%) | 402 (1.1%) |
| 35 to 64 Years | 1,066 (1.3%) | 835 (1.0%) |
| 65 to 74 Years | 660 (3.2%) | 810 (3.3%) |
| 75 Years and over | 1,480 (10.1%) | 2,571 (12.8%) |
Technology Access in Placer County
Computing Device Access in Placer County
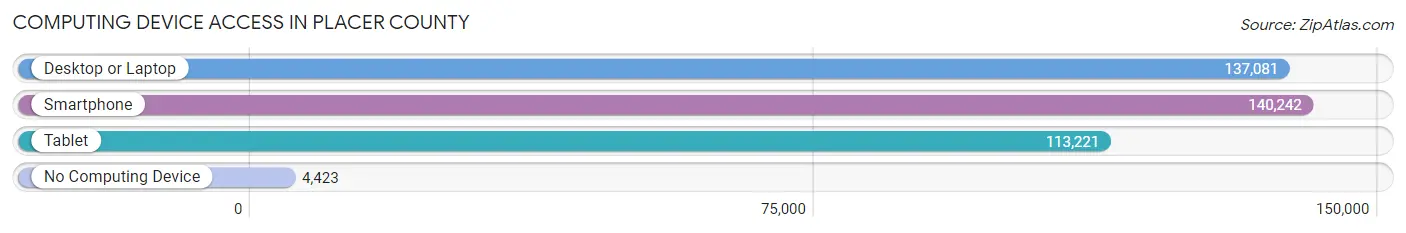
| Device Type | # Households | % Households |
| Desktop or Laptop | 137,081 | 89.9% |
| Smartphone | 140,242 | 91.9% |
| Tablet | 113,221 | 74.2% |
| No Computing Device | 4,423 | 2.9% |
| Total | 152,537 | 100.0% |
Internet Access in Placer County
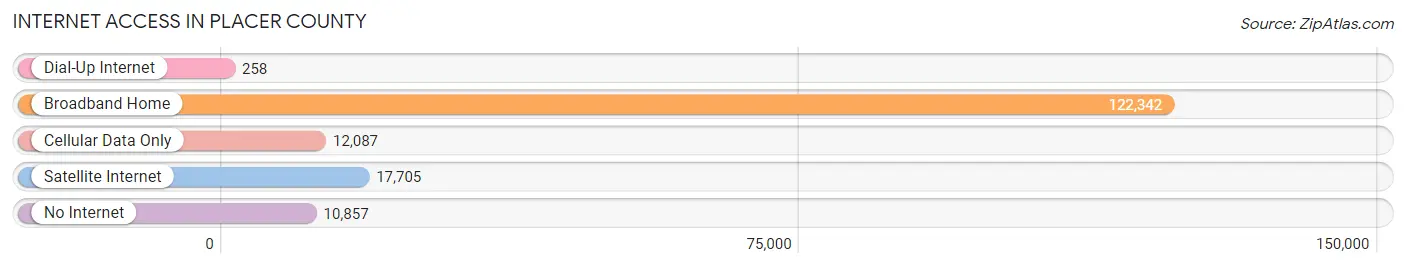
| Internet Type | # Households | % Households |
| Dial-Up Internet | 258 | 0.2% |
| Broadband Home | 122,342 | 80.2% |
| Cellular Data Only | 12,087 | 7.9% |
| Satellite Internet | 17,705 | 11.6% |
| No Internet | 10,857 | 7.1% |
| Total | 152,537 | 100.0% |
Placer County Summary
Placer County is a county located in the U.S. state of California. It is located in the Sierra Nevada region of the state, and is bordered by Nevada County to the north, El Dorado County to the east, Sacramento County to the south, and Yuba County to the west. The county seat is Auburn, and the largest city is Roseville. As of the 2010 census, the population was 348,432.
History
Placer County was one of the original counties of California, created in 1851. It was named after the Spanish word for “sand” or “gravel”, as the county was rich in gold deposits. The county was originally part of Sutter County, but was split off in 1851.
The county was home to many of the early gold miners in California, and was the site of the first discovery of gold in the state in 1848. The gold rush of 1849 brought thousands of miners to the area, and the county quickly grew in population. The county was also home to many of the early Chinese immigrants to California, who worked in the gold mines and on the railroads.
Geography
Placer County covers an area of 1,502 square miles, making it the fifth-largest county in California. It is located in the Sierra Nevada region of the state, and is bordered by Nevada County to the north, El Dorado County to the east, Sacramento County to the south, and Yuba County to the west.
The county is divided into two distinct regions: the western foothills and the eastern Sierra Nevada. The western foothills are characterized by rolling hills and oak woodlands, while the eastern Sierra Nevada is characterized by rugged mountains and deep canyons.
The highest point in the county is Granite Chief Peak, at 9,094 feet. The lowest point is the confluence of the Bear and American Rivers, at an elevation of just over 500 feet.
Economy
Placer County has a diverse economy, with a mix of agriculture, manufacturing, and services. The county is home to a number of technology companies, including Intel, Hewlett-Packard, and Oracle.
Agriculture is an important part of the county’s economy, with crops such as apples, pears, walnuts, and almonds being grown in the area. Livestock production is also important, with cattle, sheep, and goats being raised in the county.
Manufacturing is also an important part of the economy, with companies such as Sierra Nevada Brewing Company, Sierra Pacific Industries, and Placer County Winery located in the county.
Demographics
As of the 2010 census, the population of Placer County was 348,432. The racial makeup of the county was 79.2% White, 4.2% African American, 0.7% Native American, 8.2% Asian, 0.3% Pacific Islander, 4.2% from other races, and 3.2% from two or more races. Hispanic or Latino of any race were 11.2% of the population.
The median household income in the county was $71,845, and the median family income was $83,837. The per capita income was $35,945. About 8.2% of the population was below the poverty line.
Common Questions
What is Per Capita Income in Placer County?
Per Capita income in Placer County is $54,004.
What is the Median Family Income in Placer County?
Median Family Income in Placer County is $131,178.
What is the Median Household income in Placer County?
Median Household Income in Placer County is $109,375.
What is Income or Wage Gap in Placer County?
Income or Wage Gap in Placer County is 35.0%.
Women in Placer County earn 65.0 cents for every dollar earned by a man.
What is Family Income Deficit in Placer County?
Family Income Deficit in Placer County is $10,931.
Families that are below poverty line in Placer County earn $10,931 less on average than the poverty threshold level.
What is Inequality or Gini Index in Placer County?
Inequality or Gini Index in Placer County is 0.44.
What is the Total Population of Placer County?
Total Population of Placer County is 406,608.
What is the Total Male Population of Placer County?
Total Male Population of Placer County is 200,326.
What is the Total Female Population of Placer County?
Total Female Population of Placer County is 206,282.
What is the Ratio of Males per 100 Females in Placer County?
There are 97.11 Males per 100 Females in Placer County.
What is the Ratio of Females per 100 Males in Placer County?
There are 102.97 Females per 100 Males in Placer County.
What is the Median Population Age in Placer County?
Median Population Age in Placer County is 42.3 Years.
What is the Average Family Size in Placer County
Average Family Size in Placer County is 3.1 People.
What is the Average Household Size in Placer County
Average Household Size in Placer County is 2.6 People.
How Large is the Labor Force in Placer County?
There are 199,679 People in the Labor Forcein in Placer County.
What is the Percentage of People in the Labor Force in Placer County?
60.8% of People are in the Labor Force in Placer County.
What is the Unemployment Rate in Placer County?
Unemployment Rate in Placer County is 4.3%.