Nevada County, CA Map & Demographics
Nevada County Map
Nevada County Overview
$46,706
PER CAPITA INCOME
$100,889
AVG FAMILY INCOME
$79,395
AVG HOUSEHOLD INCOME
29.3%
WAGE / INCOME GAP [ % ]
70.7¢/ $1
WAGE / INCOME GAP [ $ ]
$9,542
FAMILY INCOME DEFICIT
0.47
INEQUALITY / GINI INDEX
102,322
TOTAL POPULATION
50,630
MALE POPULATION
51,692
FEMALE POPULATION
97.95
MALES / 100 FEMALES
102.10
FEMALES / 100 MALES
50.2
MEDIAN AGE
2.9
AVG FAMILY SIZE
2.4
AVG HOUSEHOLD SIZE
47,312
LABOR FORCE [ PEOPLE ]
54.4%
PERCENT IN LABOR FORCE
4.4%
UNEMPLOYMENT RATE
Nevada County Area Codes
Income in Nevada County
Income Overview in Nevada County
Per Capita Income in Nevada County is $46,706, while median incomes of families and households are $100,889 and $79,395 respectively.
| Characteristic | Number | Measure |
| Per Capita Income | 102,322 | $46,706 |
| Median Family Income | 26,283 | $100,889 |
| Mean Family Income | 26,283 | $129,342 |
| Median Household Income | 41,415 | $79,395 |
| Mean Household Income | 41,415 | $110,539 |
| Income Deficit | 26,283 | $9,542 |
| Wage / Income Gap (%) | 102,322 | 29.33% |
| Wage / Income Gap ($) | 102,322 | 70.67¢ per $1 |
| Gini / Inequality Index | 102,322 | 0.47 |
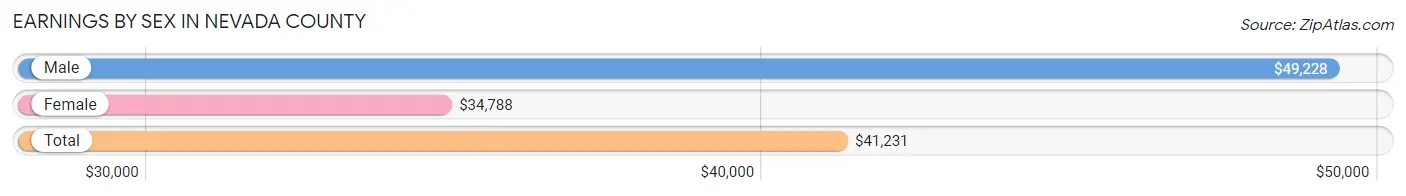
Earnings by Sex in Nevada County
Average Earnings in Nevada County are $41,231, $49,228 for men and $34,788 for women, a difference of 29.3%.
| Sex | Number | Average Earnings |
| Male | 26,219 (51.9%) | $49,228 |
| Female | 24,295 (48.1%) | $34,788 |
| Total | 50,514 (100.0%) | $41,231 |
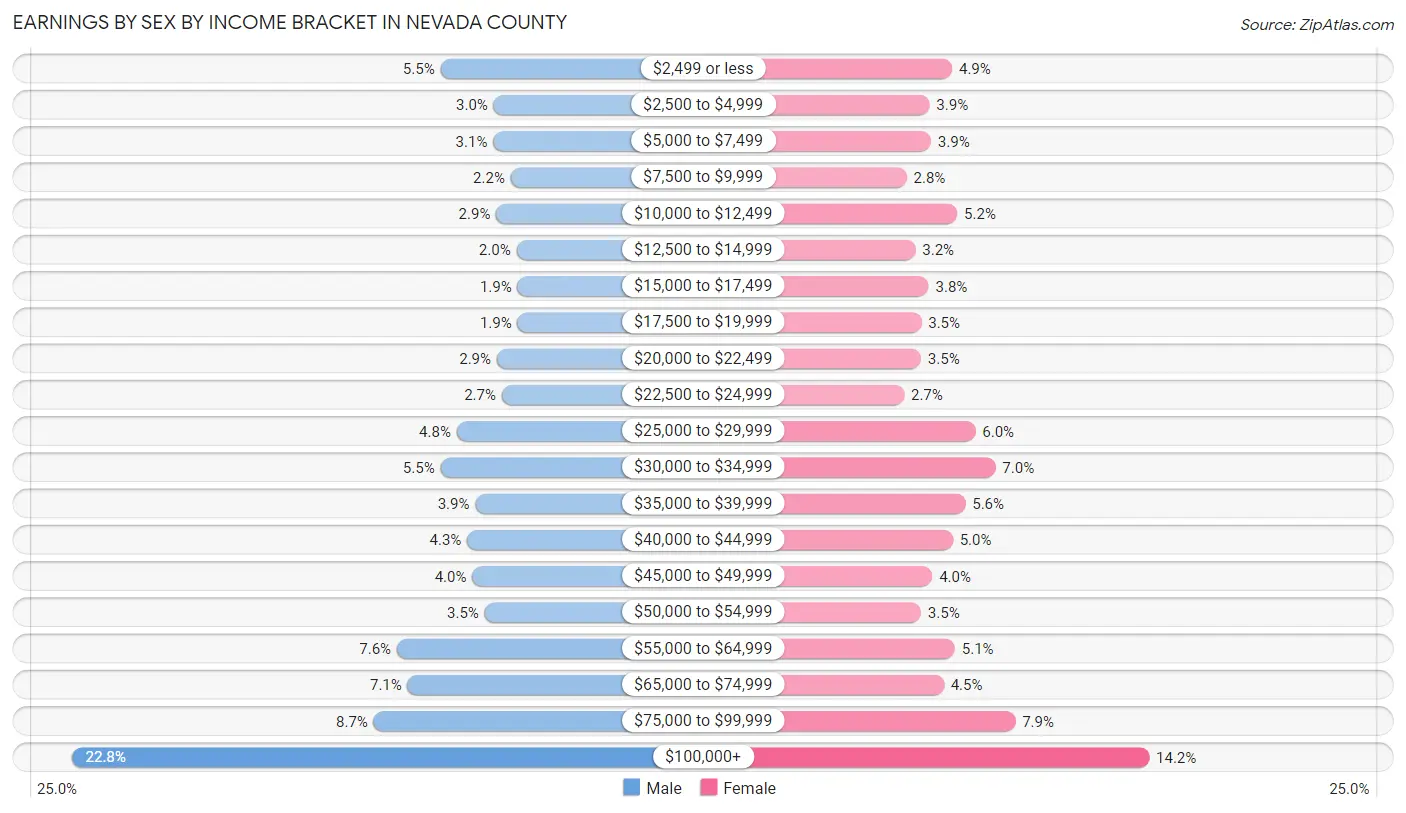
Earnings by Sex by Income Bracket in Nevada County
The most common earnings brackets in Nevada County are $100,000+ for men (5,966 | 22.8%) and $100,000+ for women (3,441 | 14.2%).
| Income | Male | Female |
| $2,499 or less | 1,446 (5.5%) | 1,197 (4.9%) |
| $2,500 to $4,999 | 794 (3.0%) | 940 (3.9%) |
| $5,000 to $7,499 | 800 (3.0%) | 957 (3.9%) |
| $7,500 to $9,999 | 585 (2.2%) | 680 (2.8%) |
| $10,000 to $12,499 | 763 (2.9%) | 1,257 (5.2%) |
| $12,500 to $14,999 | 513 (2.0%) | 780 (3.2%) |
| $15,000 to $17,499 | 501 (1.9%) | 931 (3.8%) |
| $17,500 to $19,999 | 502 (1.9%) | 849 (3.5%) |
| $20,000 to $22,499 | 755 (2.9%) | 842 (3.5%) |
| $22,500 to $24,999 | 694 (2.6%) | 651 (2.7%) |
| $25,000 to $29,999 | 1,249 (4.8%) | 1,463 (6.0%) |
| $30,000 to $34,999 | 1,447 (5.5%) | 1,690 (7.0%) |
| $35,000 to $39,999 | 1,021 (3.9%) | 1,349 (5.6%) |
| $40,000 to $44,999 | 1,120 (4.3%) | 1,204 (5.0%) |
| $45,000 to $49,999 | 1,057 (4.0%) | 971 (4.0%) |
| $50,000 to $54,999 | 905 (3.5%) | 843 (3.5%) |
| $55,000 to $64,999 | 1,982 (7.6%) | 1,230 (5.1%) |
| $65,000 to $74,999 | 1,850 (7.1%) | 1,104 (4.5%) |
| $75,000 to $99,999 | 2,269 (8.6%) | 1,916 (7.9%) |
| $100,000+ | 5,966 (22.8%) | 3,441 (14.2%) |
| Total | 26,219 (100.0%) | 24,295 (100.0%) |
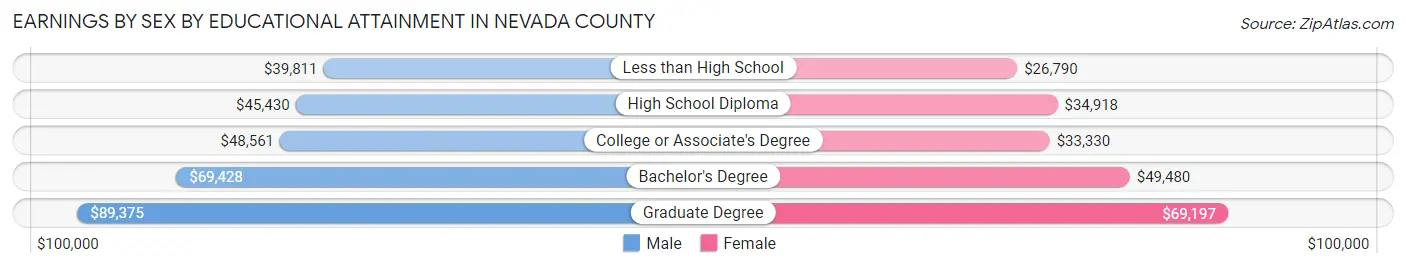
Earnings by Sex by Educational Attainment in Nevada County
Average earnings in Nevada County are $56,253 for men and $37,807 for women, a difference of 32.8%. Men with an educational attainment of graduate degree enjoy the highest average annual earnings of $89,375, while those with less than high school education earn the least with $39,811. Women with an educational attainment of graduate degree earn the most with the average annual earnings of $69,197, while those with less than high school education have the smallest earnings of $26,790.
| Educational Attainment | Male Income | Female Income |
| Less than High School | $39,811 | $26,790 |
| High School Diploma | $45,430 | $34,918 |
| College or Associate's Degree | $48,561 | $33,330 |
| Bachelor's Degree | $69,428 | $49,480 |
| Graduate Degree | $89,375 | $69,197 |
| Total | $56,253 | $37,807 |
Family Income in Nevada County
Family Income Brackets in Nevada County
According to the Nevada County family income data, there are 5,546 families falling into the $100,000 to $149,999 income range, which is the most common income bracket and makes up 21.1% of all families. Conversely, the $10,000 to $14,999 income bracket is the least frequent group with only 394 families (1.5%) belonging to this category.
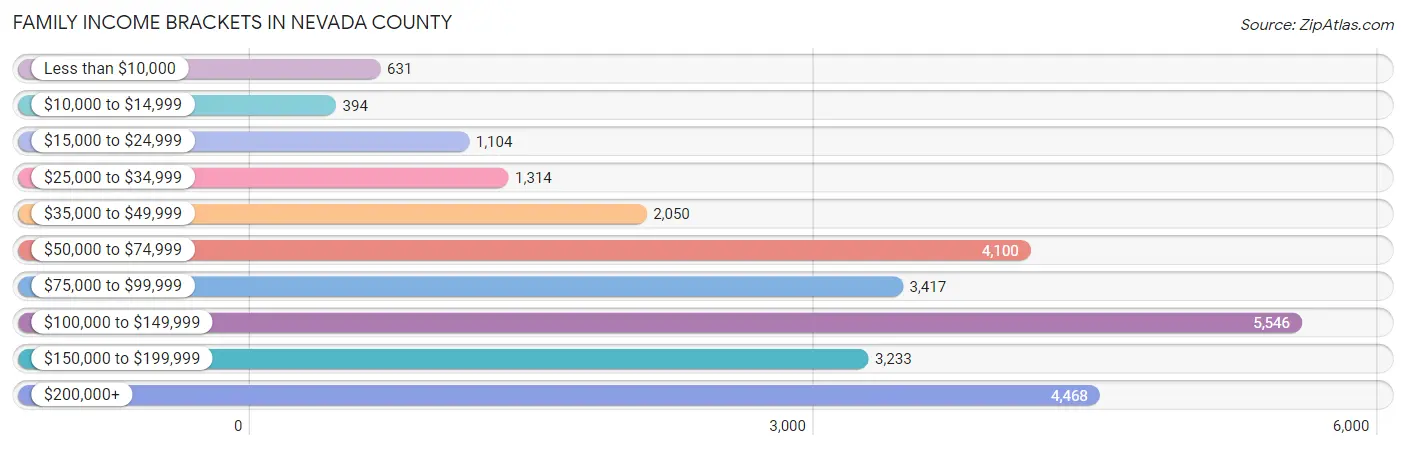
| Income Bracket | # Families | % Families |
| Less than $10,000 | 631 | 2.4% |
| $10,000 to $14,999 | 394 | 1.5% |
| $15,000 to $24,999 | 1,104 | 4.2% |
| $25,000 to $34,999 | 1,314 | 5.0% |
| $35,000 to $49,999 | 2,050 | 7.8% |
| $50,000 to $74,999 | 4,100 | 15.6% |
| $75,000 to $99,999 | 3,417 | 13.0% |
| $100,000 to $149,999 | 5,546 | 21.1% |
| $150,000 to $199,999 | 3,233 | 12.3% |
| $200,000+ | 4,468 | 17.0% |
Family Income by Famaliy Size in Nevada County
6-person families (443 | 1.7%) account for the highest median family income in Nevada County with $145,099 per family, while 2-person families (15,409 | 58.6%) have the highest median income of $44,877 per family member.
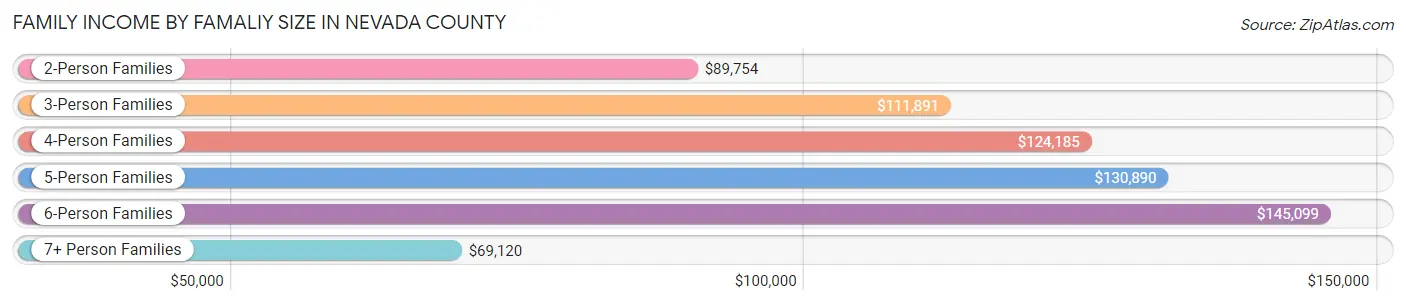
| Income Bracket | # Families | Median Income |
| 2-Person Families | 15,409 (58.6%) | $89,754 |
| 3-Person Families | 5,298 (20.2%) | $111,891 |
| 4-Person Families | 3,659 (13.9%) | $124,185 |
| 5-Person Families | 1,294 (4.9%) | $130,890 |
| 6-Person Families | 443 (1.7%) | $145,099 |
| 7+ Person Families | 180 (0.7%) | $69,120 |
| Total | 26,283 (100.0%) | $100,889 |
Family Income by Number of Earners in Nevada County
The median family income in Nevada County is $100,889, with families comprising 3+ earners (2,034) having the highest median family income of $150,868, while families with no earners (6,558) have the lowest median family income of $72,859, accounting for 7.7% and 24.9% of families, respectively.
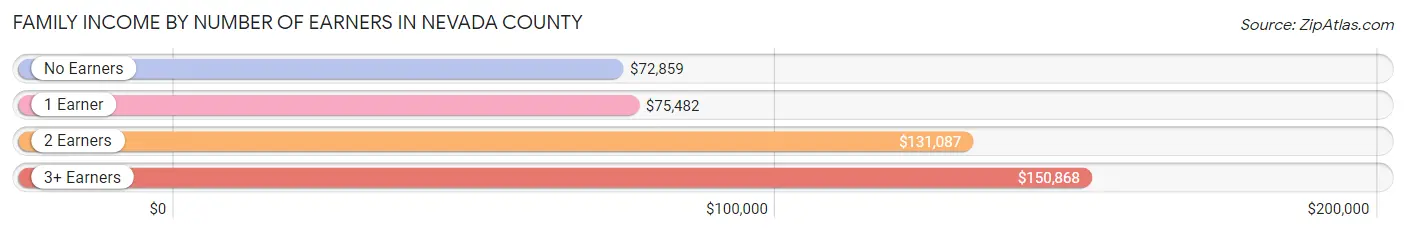
| Number of Earners | # Families | Median Income |
| No Earners | 6,558 (24.9%) | $72,859 |
| 1 Earner | 7,787 (29.6%) | $75,482 |
| 2 Earners | 9,904 (37.7%) | $131,087 |
| 3+ Earners | 2,034 (7.7%) | $150,868 |
| Total | 26,283 (100.0%) | $100,889 |
Household Income in Nevada County
Household Income Brackets in Nevada County
With 7,123 households falling in the category, the $100,000 to $149,999 income range is the most frequent in Nevada County, accounting for 17.2% of all households. In contrast, only 1,367 households (3.3%) fall into the $10,000 to $14,999 income bracket, making it the least populous group.
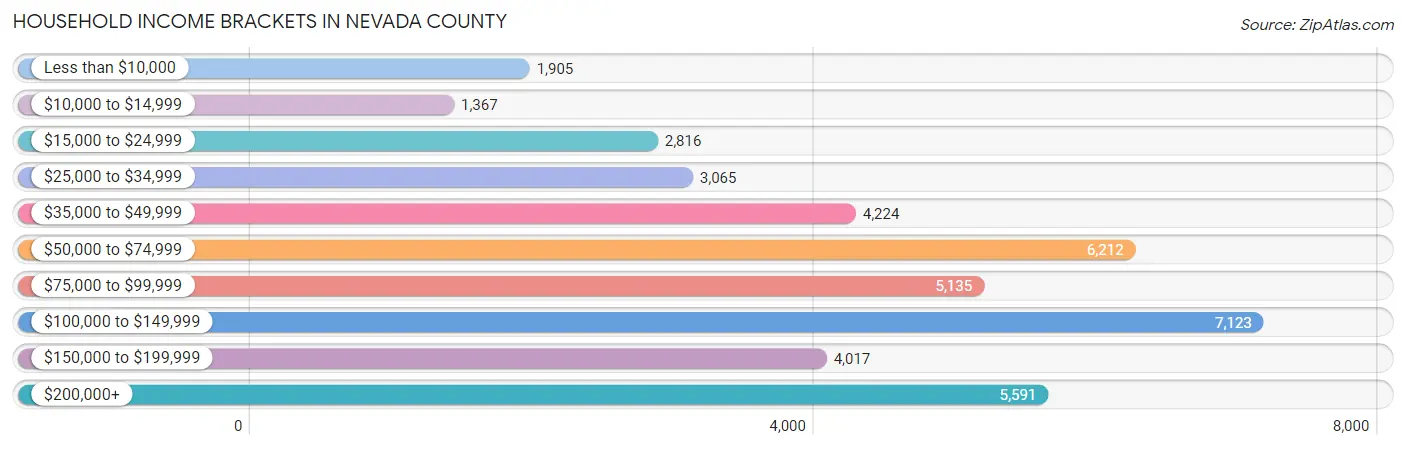
| Income Bracket | # Households | % Households |
| Less than $10,000 | 1,905 | 4.6% |
| $10,000 to $14,999 | 1,367 | 3.3% |
| $15,000 to $24,999 | 2,816 | 6.8% |
| $25,000 to $34,999 | 3,065 | 7.4% |
| $35,000 to $49,999 | 4,224 | 10.2% |
| $50,000 to $74,999 | 6,212 | 15.0% |
| $75,000 to $99,999 | 5,135 | 12.4% |
| $100,000 to $149,999 | 7,123 | 17.2% |
| $150,000 to $199,999 | 4,017 | 9.7% |
| $200,000+ | 5,591 | 13.5% |
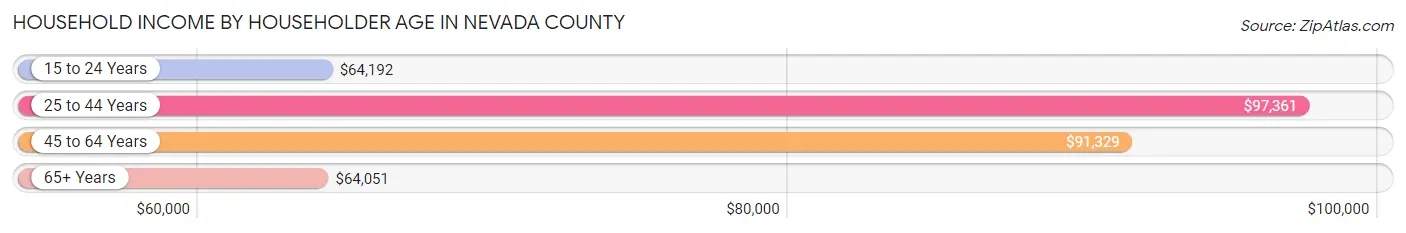
Household Income by Householder Age in Nevada County
The median household income in Nevada County is $79,395, with the highest median household income of $97,361 found in the 25 to 44 years age bracket for the primary householder. A total of 9,077 households (21.9%) fall into this category. Meanwhile, the 65+ years age bracket for the primary householder has the lowest median household income of $64,051, with 16,720 households (40.4%) in this group.
| Income Bracket | # Households | Median Income |
| 15 to 24 Years | 482 (1.2%) | $64,192 |
| 25 to 44 Years | 9,077 (21.9%) | $97,361 |
| 45 to 64 Years | 15,136 (36.5%) | $91,329 |
| 65+ Years | 16,720 (40.4%) | $64,051 |
| Total | 41,415 (100.0%) | $79,395 |
Poverty in Nevada County
Income Below Poverty by Sex and Age in Nevada County
With 9.8% poverty level for males and 11.0% for females among the residents of Nevada County, 5 year old males and 12 to 14 year old females are the most vulnerable to poverty, with 50 males (18.2%) and 263 females (16.9%) in their respective age groups living below the poverty level.
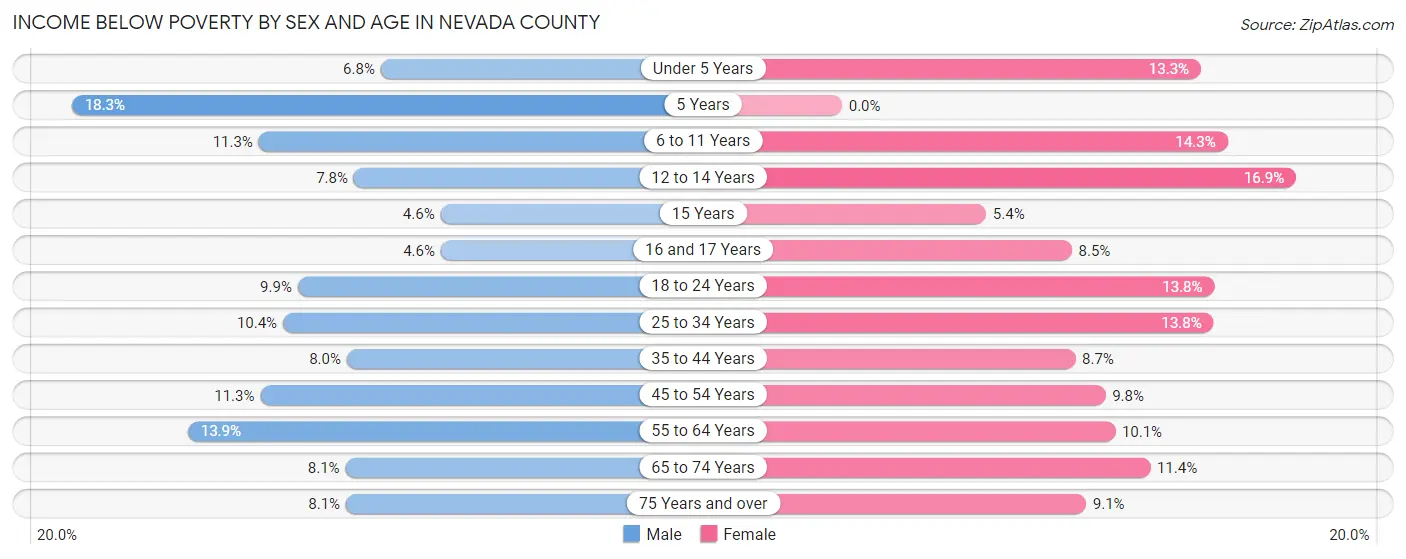
| Age Bracket | Male | Female |
| Under 5 Years | 149 (6.8%) | 264 (13.3%) |
| 5 Years | 50 (18.2%) | 0 (0.0%) |
| 6 to 11 Years | 347 (11.3%) | 394 (14.3%) |
| 12 to 14 Years | 137 (7.8%) | 263 (16.9%) |
| 15 Years | 26 (4.6%) | 34 (5.3%) |
| 16 and 17 Years | 46 (4.5%) | 82 (8.5%) |
| 18 to 24 Years | 317 (9.9%) | 376 (13.8%) |
| 25 to 34 Years | 509 (10.4%) | 678 (13.8%) |
| 35 to 44 Years | 487 (8.0%) | 507 (8.7%) |
| 45 to 54 Years | 663 (11.3%) | 553 (9.8%) |
| 55 to 64 Years | 1,077 (13.9%) | 883 (10.1%) |
| 65 to 74 Years | 689 (8.1%) | 1,029 (11.4%) |
| 75 Years and over | 398 (8.1%) | 547 (9.1%) |
| Total | 4,895 (9.8%) | 5,610 (11.0%) |
Income Above Poverty by Sex and Age in Nevada County
According to the poverty statistics in Nevada County, males aged 16 and 17 years and females aged 5 years are the age groups that are most secure financially, with 95.5% of males and 100.0% of females in these age groups living above the poverty line.
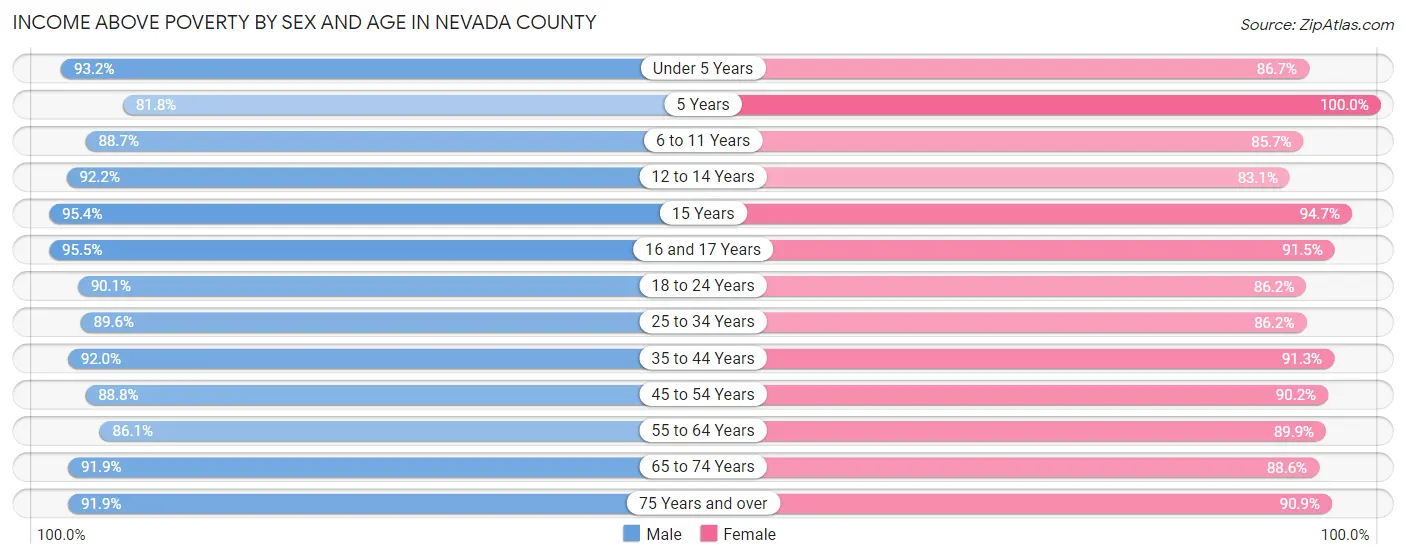
| Age Bracket | Male | Female |
| Under 5 Years | 2,050 (93.2%) | 1,717 (86.7%) |
| 5 Years | 224 (81.8%) | 409 (100.0%) |
| 6 to 11 Years | 2,721 (88.7%) | 2,357 (85.7%) |
| 12 to 14 Years | 1,625 (92.2%) | 1,297 (83.1%) |
| 15 Years | 544 (95.4%) | 602 (94.7%) |
| 16 and 17 Years | 964 (95.5%) | 879 (91.5%) |
| 18 to 24 Years | 2,899 (90.1%) | 2,342 (86.2%) |
| 25 to 34 Years | 4,381 (89.6%) | 4,236 (86.2%) |
| 35 to 44 Years | 5,573 (92.0%) | 5,348 (91.3%) |
| 45 to 54 Years | 5,232 (88.7%) | 5,101 (90.2%) |
| 55 to 64 Years | 6,649 (86.1%) | 7,824 (89.9%) |
| 65 to 74 Years | 7,827 (91.9%) | 7,963 (88.6%) |
| 75 Years and over | 4,533 (91.9%) | 5,489 (90.9%) |
| Total | 45,222 (90.2%) | 45,564 (89.0%) |
Income Below Poverty Among Married-Couple Families in Nevada County
The poverty statistics for married-couple families in Nevada County show that 4.0% or 841 of the total 21,208 families live below the poverty line. Families with 5 or more children have the highest poverty rate of 26.0%, comprising of 20 families. On the other hand, families with 1 or 2 children have the lowest poverty rate of 2.6%, which includes 144 families.
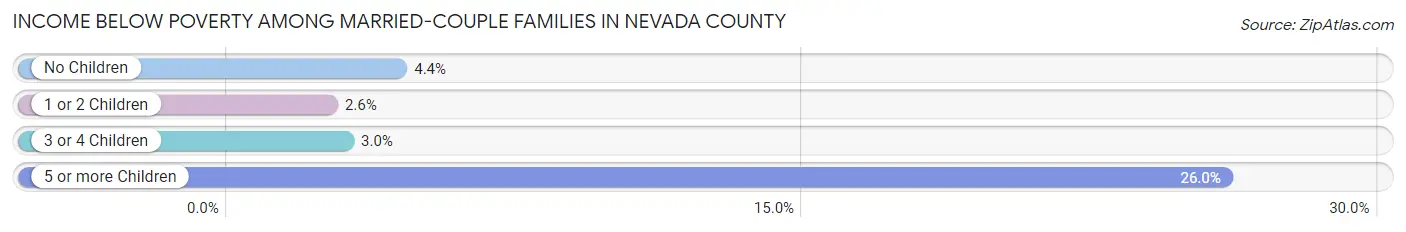
| Children | Above Poverty | Below Poverty |
| No Children | 14,049 (95.6%) | 649 (4.4%) |
| 1 or 2 Children | 5,365 (97.4%) | 144 (2.6%) |
| 3 or 4 Children | 896 (97.0%) | 28 (3.0%) |
| 5 or more Children | 57 (74.0%) | 20 (26.0%) |
| Total | 20,367 (96.0%) | 841 (4.0%) |
Income Below Poverty Among Single-Parent Households in Nevada County
According to the poverty data in Nevada County, 16.7% or 260 single-father households and 16.2% or 568 single-mother households are living below the poverty line. Among single-father households, those with 3 or 4 children have the highest poverty rate, with 22 households (30.6%) experiencing poverty. Likewise, among single-mother households, those with 3 or 4 children have the highest poverty rate, with 56 households (36.4%) falling below the poverty line.
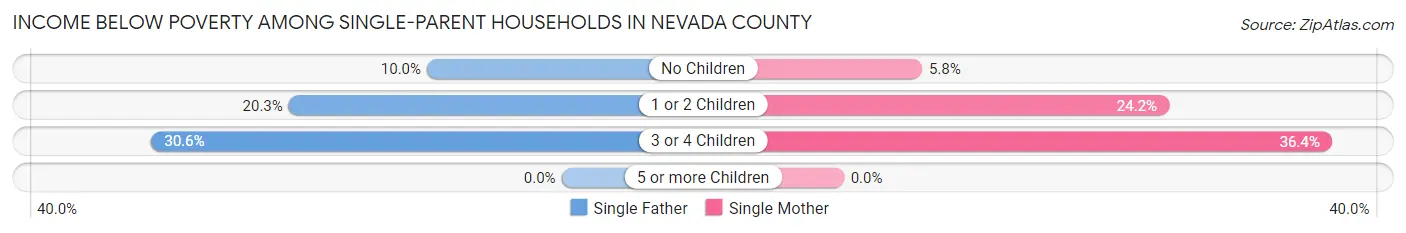
| Children | Single Father | Single Mother |
| No Children | 63 (10.0%) | 96 (5.8%) |
| 1 or 2 Children | 175 (20.3%) | 416 (24.2%) |
| 3 or 4 Children | 22 (30.6%) | 56 (36.4%) |
| 5 or more Children | 0 (0.0%) | 0 (0.0%) |
| Total | 260 (16.7%) | 568 (16.2%) |
Income Below Poverty Among Married-Couple vs Single-Parent Households in Nevada County
The poverty data for Nevada County shows that 841 of the married-couple family households (4.0%) and 828 of the single-parent households (16.3%) are living below the poverty level. Within the married-couple family households, those with 5 or more children have the highest poverty rate, with 20 households (26.0%) falling below the poverty line. Among the single-parent households, those with 3 or 4 children have the highest poverty rate, with 78 household (34.5%) living below poverty.
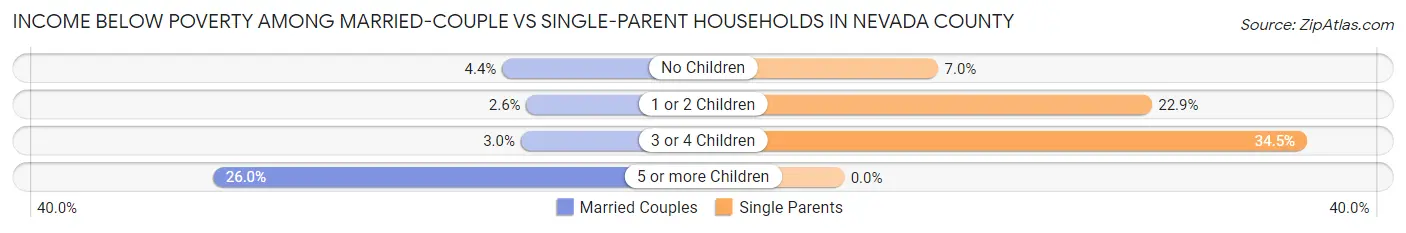
| Children | Married-Couple Families | Single-Parent Households |
| No Children | 649 (4.4%) | 159 (7.0%) |
| 1 or 2 Children | 144 (2.6%) | 591 (22.9%) |
| 3 or 4 Children | 28 (3.0%) | 78 (34.5%) |
| 5 or more Children | 20 (26.0%) | 0 (0.0%) |
| Total | 841 (4.0%) | 828 (16.3%) |
Race in Nevada County
The most populous races in Nevada County are White / Caucasian (90,082 | 88.0%), Hispanic or Latino (10,202 | 10.0%), and Two or more Races (8,082 | 7.9%).
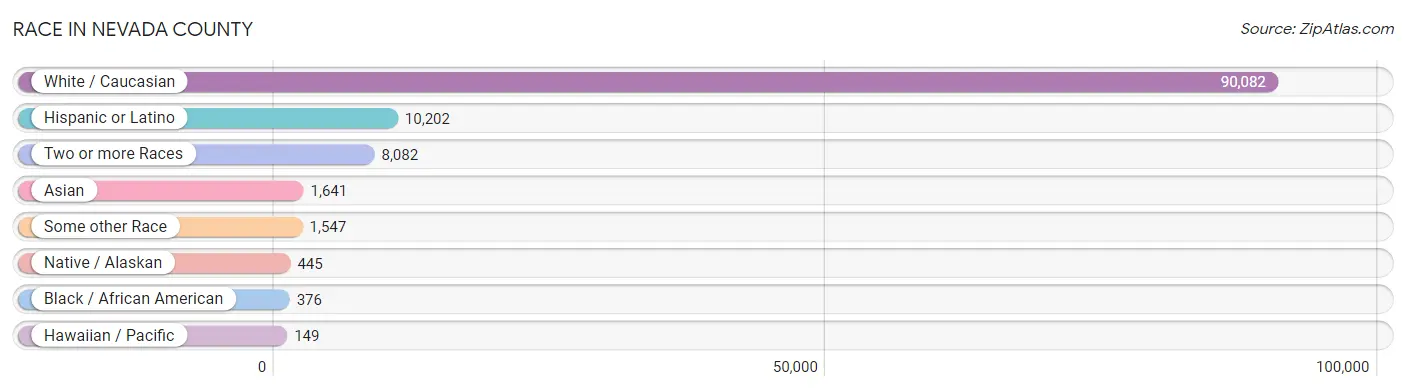
| Race | # Population | % Population |
| Asian | 1,641 | 1.6% |
| Black / African American | 376 | 0.4% |
| Hawaiian / Pacific | 149 | 0.2% |
| Hispanic or Latino | 10,202 | 10.0% |
| Native / Alaskan | 445 | 0.4% |
| White / Caucasian | 90,082 | 88.0% |
| Two or more Races | 8,082 | 7.9% |
| Some other Race | 1,547 | 1.5% |
| Total | 102,322 | 100.0% |
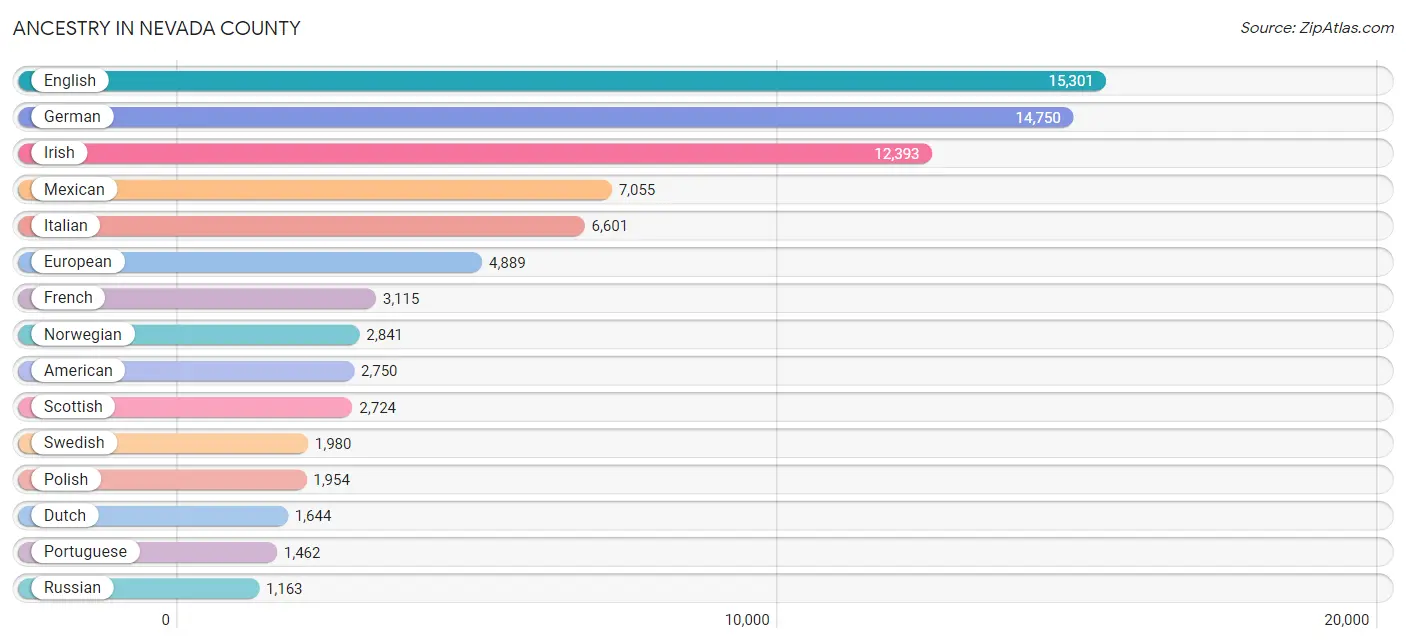
Ancestry in Nevada County
The most populous ancestries reported in Nevada County are English (15,301 | 14.9%), German (14,750 | 14.4%), Irish (12,393 | 12.1%), Mexican (7,055 | 6.9%), and Italian (6,601 | 6.5%), together accounting for 54.8% of all Nevada County residents.
| Ancestry | # Population | % Population |
| African | 51 | 0.1% |
| Albanian | 9 | 0.0% |
| American | 2,750 | 2.7% |
| Apache | 33 | 0.0% |
| Arab | 725 | 0.7% |
| Argentinean | 60 | 0.1% |
| Armenian | 129 | 0.1% |
| Assyrian / Chaldean / Syriac | 26 | 0.0% |
| Australian | 136 | 0.1% |
| Austrian | 407 | 0.4% |
| Basque | 38 | 0.0% |
| Belgian | 28 | 0.0% |
| Bhutanese | 628 | 0.6% |
| Blackfeet | 101 | 0.1% |
| Brazilian | 72 | 0.1% |
| British | 1,006 | 1.0% |
| Bulgarian | 20 | 0.0% |
| Burmese | 96 | 0.1% |
| Cajun | 80 | 0.1% |
| Canadian | 339 | 0.3% |
| Celtic | 19 | 0.0% |
| Central American | 415 | 0.4% |
| Central American Indian | 34 | 0.0% |
| Cherokee | 707 | 0.7% |
| Chickasaw | 59 | 0.1% |
| Chilean | 88 | 0.1% |
| Chippewa | 4 | 0.0% |
| Choctaw | 49 | 0.1% |
| Colombian | 166 | 0.2% |
| Comanche | 6 | 0.0% |
| Cree | 11 | 0.0% |
| Creek | 34 | 0.0% |
| Croatian | 221 | 0.2% |
| Cuban | 160 | 0.2% |
| Czech | 313 | 0.3% |
| Czechoslovakian | 42 | 0.0% |
| Danish | 815 | 0.8% |
| Delaware | 19 | 0.0% |
| Dominican | 60 | 0.1% |
| Dutch | 1,644 | 1.6% |
| Eastern European | 217 | 0.2% |
| Egyptian | 3 | 0.0% |
| English | 15,301 | 14.9% |
| Estonian | 5 | 0.0% |
| European | 4,889 | 4.8% |
| Filipino | 63 | 0.1% |
| Finnish | 350 | 0.3% |
| French | 3,115 | 3.0% |
| French Canadian | 840 | 0.8% |
| German | 14,750 | 14.4% |
| Greek | 289 | 0.3% |
| Guamanian / Chamorro | 168 | 0.2% |
| Guatemalan | 209 | 0.2% |
| Honduran | 1 | 0.0% |
| Houma | 10 | 0.0% |
| Hungarian | 354 | 0.4% |
| Icelander | 44 | 0.0% |
| Indian (Asian) | 743 | 0.7% |
| Iranian | 69 | 0.1% |
| Iraqi | 31 | 0.0% |
| Irish | 12,393 | 12.1% |
| Iroquois | 124 | 0.1% |
| Israeli | 9 | 0.0% |
| Italian | 6,601 | 6.5% |
| Jamaican | 3 | 0.0% |
| Japanese | 157 | 0.2% |
| Korean | 770 | 0.7% |
| Laotian | 124 | 0.1% |
| Latvian | 48 | 0.1% |
| Lebanese | 87 | 0.1% |
| Lithuanian | 98 | 0.1% |
| Luxembourger | 3 | 0.0% |
| Malaysian | 60 | 0.1% |
| Maltese | 34 | 0.0% |
| Mexican | 7,055 | 6.9% |
| Mexican American Indian | 33 | 0.0% |
| Native Hawaiian | 209 | 0.2% |
| Navajo | 100 | 0.1% |
| Nigerian | 15 | 0.0% |
| Northern European | 268 | 0.3% |
| Norwegian | 2,841 | 2.8% |
| Paiute | 11 | 0.0% |
| Pakistani | 205 | 0.2% |
| Pennsylvania German | 88 | 0.1% |
| Peruvian | 89 | 0.1% |
| Polish | 1,954 | 1.9% |
| Portuguese | 1,462 | 1.4% |
| Pueblo | 57 | 0.1% |
| Puerto Rican | 454 | 0.4% |
| Romanian | 91 | 0.1% |
| Russian | 1,163 | 1.1% |
| Salvadoran | 205 | 0.2% |
| Samoan | 1 | 0.0% |
| Scandinavian | 918 | 0.9% |
| Scotch-Irish | 1,099 | 1.1% |
| Scottish | 2,724 | 2.7% |
| Serbian | 191 | 0.2% |
| Sioux | 12 | 0.0% |
| Slavic | 22 | 0.0% |
| Slovak | 113 | 0.1% |
| Slovene | 49 | 0.1% |
| South American | 403 | 0.4% |
| Spaniard | 566 | 0.5% |
| Spanish | 662 | 0.6% |
| Spanish American | 5 | 0.0% |
| Spanish American Indian | 12 | 0.0% |
| Sri Lankan | 207 | 0.2% |
| Subsaharan African | 68 | 0.1% |
| Swedish | 1,980 | 1.9% |
| Swiss | 387 | 0.4% |
| Syrian | 592 | 0.6% |
| Thai | 266 | 0.3% |
| Turkish | 61 | 0.1% |
| Ukrainian | 287 | 0.3% |
| Welsh | 670 | 0.6% |
| Yugoslavian | 23 | 0.0% | View All 116 Rows |
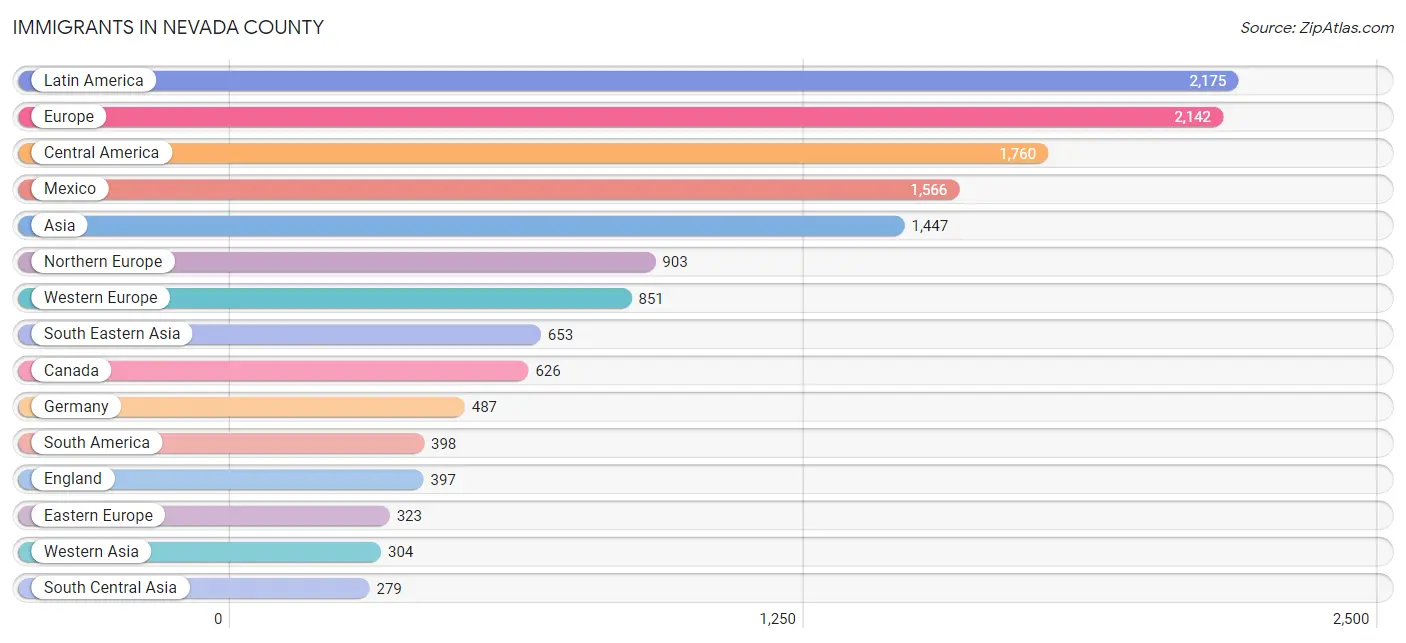
Immigrants in Nevada County
The most numerous immigrant groups reported in Nevada County came from Latin America (2,175 | 2.1%), Europe (2,142 | 2.1%), Central America (1,760 | 1.7%), Mexico (1,566 | 1.5%), and Asia (1,447 | 1.4%), together accounting for 8.9% of all Nevada County residents.
| Immigration Origin | # Population | % Population |
| Africa | 2 | 0.0% |
| Argentina | 68 | 0.1% |
| Asia | 1,447 | 1.4% |
| Australia | 113 | 0.1% |
| Austria | 93 | 0.1% |
| Belarus | 20 | 0.0% |
| Brazil | 78 | 0.1% |
| Cambodia | 122 | 0.1% |
| Canada | 626 | 0.6% |
| Caribbean | 17 | 0.0% |
| Central America | 1,760 | 1.7% |
| Chile | 94 | 0.1% |
| China | 34 | 0.0% |
| Colombia | 145 | 0.1% |
| Cuba | 17 | 0.0% |
| Czechoslovakia | 25 | 0.0% |
| Denmark | 44 | 0.0% |
| Eastern Africa | 2 | 0.0% |
| Eastern Asia | 211 | 0.2% |
| Eastern Europe | 323 | 0.3% |
| El Salvador | 33 | 0.0% |
| England | 397 | 0.4% |
| Europe | 2,142 | 2.1% |
| France | 37 | 0.0% |
| Germany | 487 | 0.5% |
| Guatemala | 161 | 0.2% |
| Hungary | 38 | 0.0% |
| India | 119 | 0.1% |
| Indonesia | 124 | 0.1% |
| Iran | 63 | 0.1% |
| Iraq | 31 | 0.0% |
| Ireland | 54 | 0.1% |
| Israel | 9 | 0.0% |
| Italy | 44 | 0.0% |
| Japan | 132 | 0.1% |
| Korea | 45 | 0.0% |
| Latin America | 2,175 | 2.1% |
| Latvia | 17 | 0.0% |
| Malaysia | 12 | 0.0% |
| Mexico | 1,566 | 1.5% |
| Nepal | 97 | 0.1% |
| Netherlands | 147 | 0.1% |
| Northern Europe | 903 | 0.9% |
| Norway | 46 | 0.0% |
| Oceania | 126 | 0.1% |
| Peru | 13 | 0.0% |
| Philippines | 117 | 0.1% |
| Poland | 71 | 0.1% |
| Portugal | 2 | 0.0% |
| Romania | 37 | 0.0% |
| Russia | 21 | 0.0% |
| Scotland | 28 | 0.0% |
| Serbia | 9 | 0.0% |
| Singapore | 54 | 0.1% |
| South America | 398 | 0.4% |
| South Central Asia | 279 | 0.3% |
| South Eastern Asia | 653 | 0.6% |
| Southern Europe | 65 | 0.1% |
| Spain | 19 | 0.0% |
| Sweden | 75 | 0.1% |
| Switzerland | 87 | 0.1% |
| Syria | 264 | 0.3% |
| Thailand | 132 | 0.1% |
| Ukraine | 38 | 0.0% |
| Vietnam | 92 | 0.1% |
| Western Asia | 304 | 0.3% |
| Western Europe | 851 | 0.8% | View All 67 Rows |
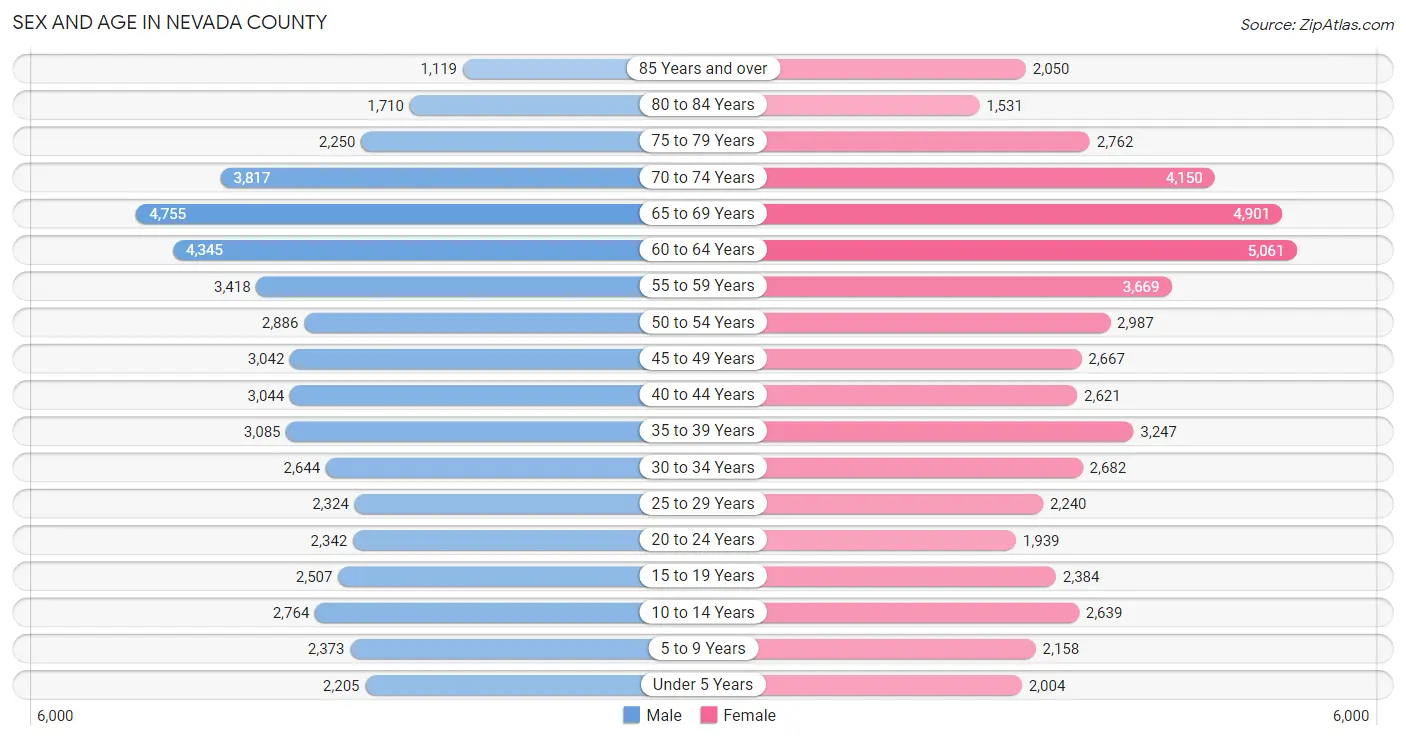
Sex and Age in Nevada County
Sex and Age in Nevada County
The most populous age groups in Nevada County are 65 to 69 Years (4,755 | 9.4%) for men and 60 to 64 Years (5,061 | 9.8%) for women.
| Age Bracket | Male | Female |
| Under 5 Years | 2,205 (4.4%) | 2,004 (3.9%) |
| 5 to 9 Years | 2,373 (4.7%) | 2,158 (4.2%) |
| 10 to 14 Years | 2,764 (5.5%) | 2,639 (5.1%) |
| 15 to 19 Years | 2,507 (5.0%) | 2,384 (4.6%) |
| 20 to 24 Years | 2,342 (4.6%) | 1,939 (3.7%) |
| 25 to 29 Years | 2,324 (4.6%) | 2,240 (4.3%) |
| 30 to 34 Years | 2,644 (5.2%) | 2,682 (5.2%) |
| 35 to 39 Years | 3,085 (6.1%) | 3,247 (6.3%) |
| 40 to 44 Years | 3,044 (6.0%) | 2,621 (5.1%) |
| 45 to 49 Years | 3,042 (6.0%) | 2,667 (5.2%) |
| 50 to 54 Years | 2,886 (5.7%) | 2,987 (5.8%) |
| 55 to 59 Years | 3,418 (6.8%) | 3,669 (7.1%) |
| 60 to 64 Years | 4,345 (8.6%) | 5,061 (9.8%) |
| 65 to 69 Years | 4,755 (9.4%) | 4,901 (9.5%) |
| 70 to 74 Years | 3,817 (7.5%) | 4,150 (8.0%) |
| 75 to 79 Years | 2,250 (4.4%) | 2,762 (5.3%) |
| 80 to 84 Years | 1,710 (3.4%) | 1,531 (3.0%) |
| 85 Years and over | 1,119 (2.2%) | 2,050 (4.0%) |
| Total | 50,630 (100.0%) | 51,692 (100.0%) |
Families and Households in Nevada County
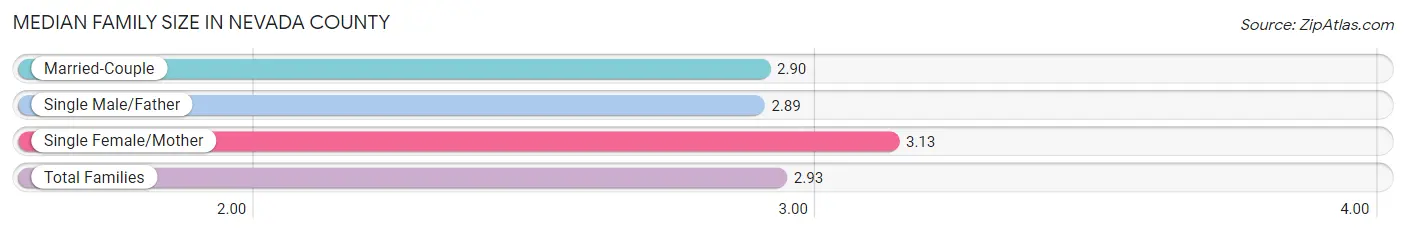
Median Family Size in Nevada County
The median family size in Nevada County is 2.93 persons per family, with single female/mother families (3,514 | 13.4%) accounting for the largest median family size of 3.13 persons per family. On the other hand, single male/father families (1,561 | 5.9%) represent the smallest median family size with 2.89 persons per family.
| Family Type | # Families | Family Size |
| Married-Couple | 21,208 (80.7%) | 2.90 |
| Single Male/Father | 1,561 (5.9%) | 2.89 |
| Single Female/Mother | 3,514 (13.4%) | 3.13 |
| Total Families | 26,283 (100.0%) | 2.93 |
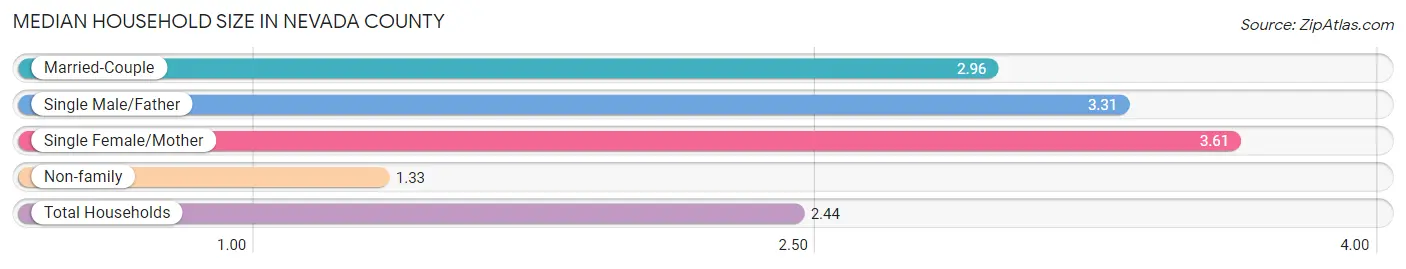
Median Household Size in Nevada County
The median household size in Nevada County is 2.44 persons per household, with single female/mother households (3,514 | 8.5%) accounting for the largest median household size of 3.61 persons per household. non-family households (15,132 | 36.5%) represent the smallest median household size with 1.33 persons per household.
| Household Type | # Households | Household Size |
| Married-Couple | 21,208 (51.2%) | 2.96 |
| Single Male/Father | 1,561 (3.8%) | 3.31 |
| Single Female/Mother | 3,514 (8.5%) | 3.61 |
| Non-family | 15,132 (36.5%) | 1.33 |
| Total Households | 41,415 (100.0%) | 2.44 |
Household Size by Marriage Status in Nevada County
Out of a total of 41,415 households in Nevada County, 26,283 (63.5%) are family households, while 15,132 (36.5%) are nonfamily households. The most numerous type of family households are 2-person households, comprising 14,358, and the most common type of nonfamily households are 1-person households, comprising 11,747.
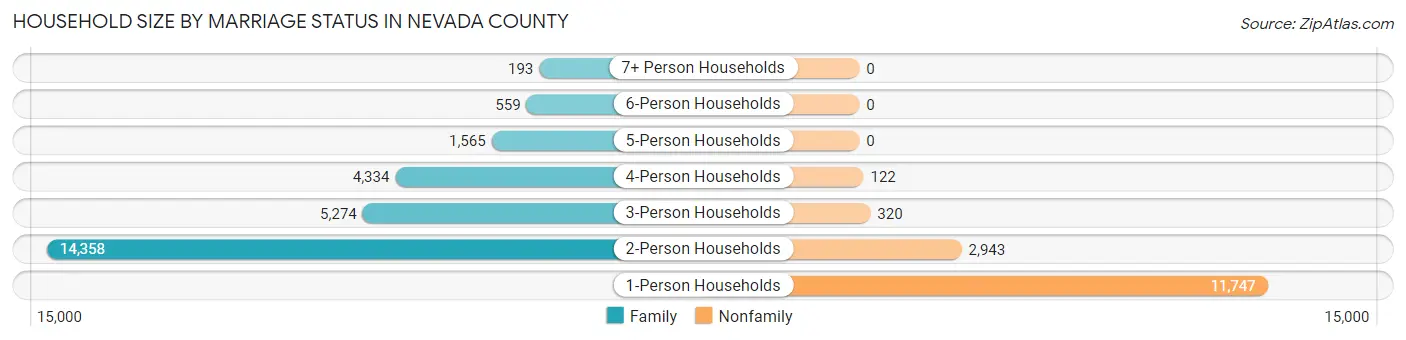
| Household Size | Family Households | Nonfamily Households |
| 1-Person Households | - | 11,747 (28.4%) |
| 2-Person Households | 14,358 (34.7%) | 2,943 (7.1%) |
| 3-Person Households | 5,274 (12.7%) | 320 (0.8%) |
| 4-Person Households | 4,334 (10.5%) | 122 (0.3%) |
| 5-Person Households | 1,565 (3.8%) | 0 (0.0%) |
| 6-Person Households | 559 (1.3%) | 0 (0.0%) |
| 7+ Person Households | 193 (0.5%) | 0 (0.0%) |
| Total | 26,283 (63.5%) | 15,132 (36.5%) |
Female Fertility in Nevada County
Fertility by Age in Nevada County
Average fertility rate in Nevada County is 53.0 births per 1,000 women. Women in the age bracket of 20 to 34 years have the highest fertility rate with 109.0 births per 1,000 women. Women in the age bracket of 20 to 34 years acount for 76.5% of all women with births.
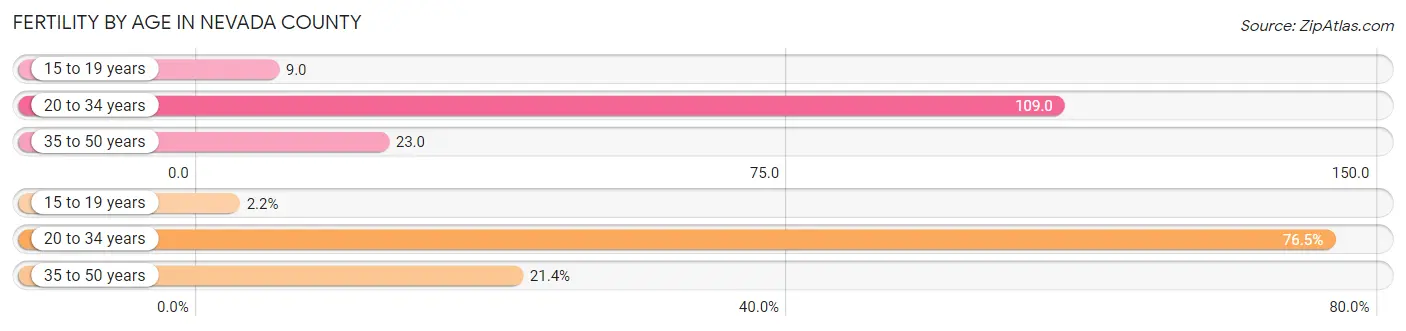
| Age Bracket | Women with Births | Births / 1,000 Women |
| 15 to 19 years | 21 (2.1%) | 9.0 |
| 20 to 34 years | 748 (76.5%) | 109.0 |
| 35 to 50 years | 209 (21.4%) | 23.0 |
| Total | 978 (100.0%) | 53.0 |
Fertility by Age by Marriage Status in Nevada County
69.7% of women with births (978) in Nevada County are married. The highest percentage of unmarried women with births falls into 15 to 19 years age bracket with 100.0% of them unmarried at the time of birth, while the lowest percentage of unmarried women with births belong to 35 to 50 years age bracket with 12.4% of them unmarried.
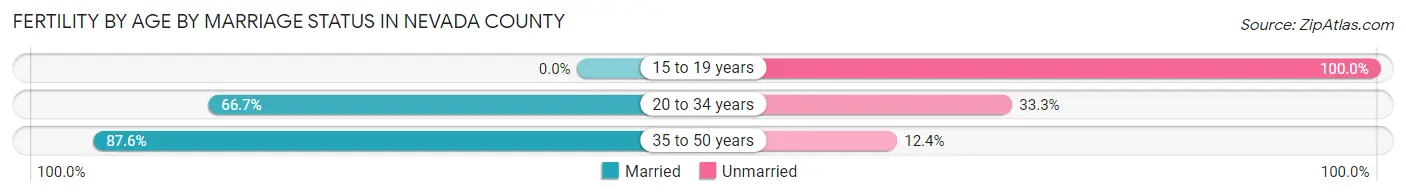
| Age Bracket | Married | Unmarried |
| 15 to 19 years | 0 (0.0%) | 21 (100.0%) |
| 20 to 34 years | 499 (66.7%) | 249 (33.3%) |
| 35 to 50 years | 183 (87.6%) | 26 (12.4%) |
| Total | 682 (69.7%) | 296 (30.3%) |
Fertility by Education in Nevada County
Average fertility rate in Nevada County is 53.0 births per 1,000 women. Women with the education attainment of bachelor's degree have the highest fertility rate of 78.0 births per 1,000 women, while women with the education attainment of less than high school have the lowest fertility at 25.0 births per 1,000 women. Women with the education attainment of bachelor's degree represent 34.8% of all women with births.
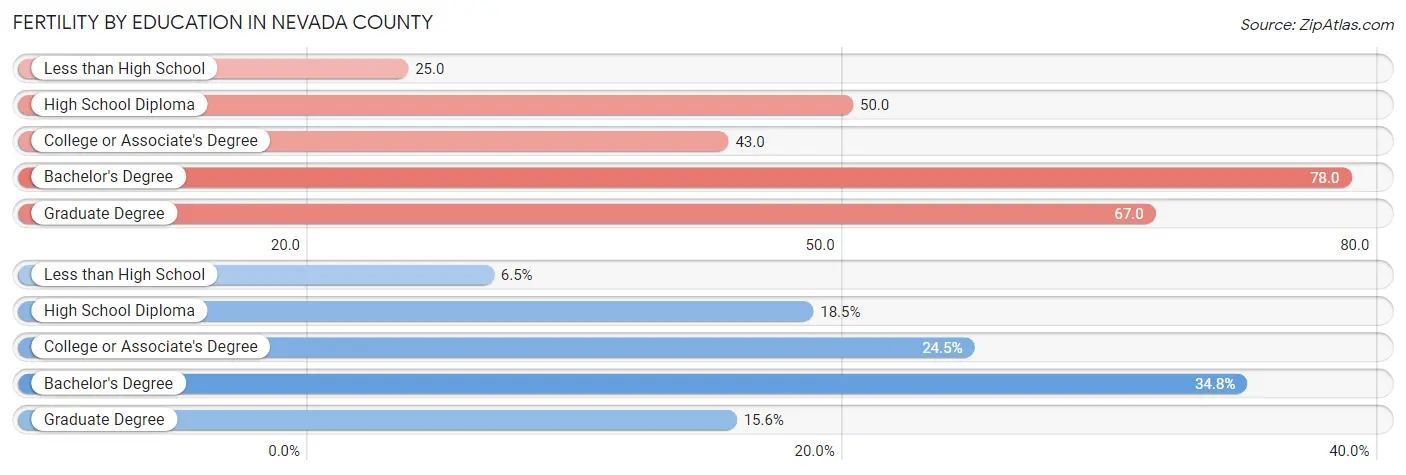
| Educational Attainment | Women with Births | Births / 1,000 Women |
| Less than High School | 64 (6.5%) | 25.0 |
| High School Diploma | 181 (18.5%) | 50.0 |
| College or Associate's Degree | 240 (24.5%) | 43.0 |
| Bachelor's Degree | 340 (34.8%) | 78.0 |
| Graduate Degree | 153 (15.6%) | 67.0 |
| Total | 978 (100.0%) | 53.0 |
Fertility by Education by Marriage Status in Nevada County
30.3% of women with births in Nevada County are unmarried. Women with the educational attainment of less than high school are most likely to be married with 100.0% of them married at childbirth, while women with the educational attainment of high school diploma are least likely to be married with 61.9% of them unmarried at childbirth.
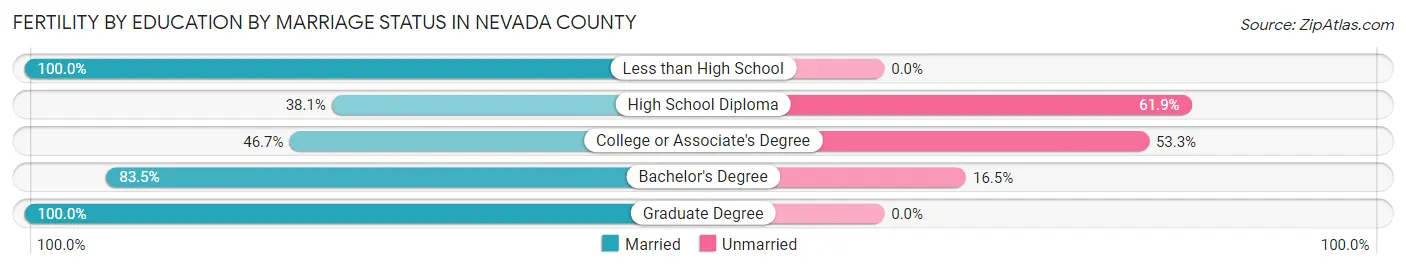
| Educational Attainment | Married | Unmarried |
| Less than High School | 64 (100.0%) | 0 (0.0%) |
| High School Diploma | 69 (38.1%) | 112 (61.9%) |
| College or Associate's Degree | 112 (46.7%) | 128 (53.3%) |
| Bachelor's Degree | 284 (83.5%) | 56 (16.5%) |
| Graduate Degree | 153 (100.0%) | 0 (0.0%) |
| Total | 682 (69.7%) | 296 (30.3%) |
Employment Characteristics in Nevada County
Employment by Class of Employer in Nevada County
Among the 44,318 employed individuals in Nevada County, private company employees (25,534 | 57.6%), self-employed (not incorporated) (6,556 | 14.8%), and not-for-profit organizations (3,439 | 7.8%) make up the most common classes of employment.
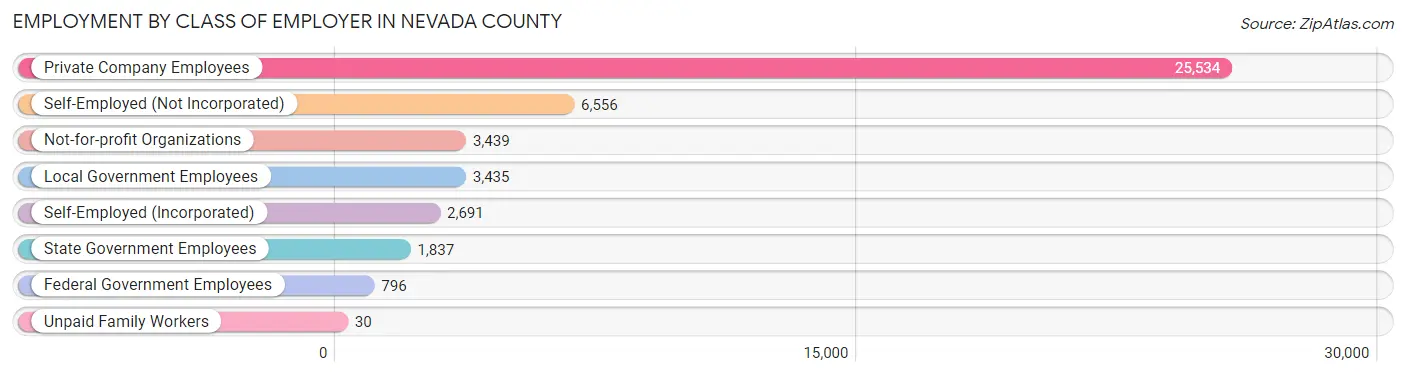
| Employer Class | # Employees | % Employees |
| Private Company Employees | 25,534 | 57.6% |
| Self-Employed (Incorporated) | 2,691 | 6.1% |
| Self-Employed (Not Incorporated) | 6,556 | 14.8% |
| Not-for-profit Organizations | 3,439 | 7.8% |
| Local Government Employees | 3,435 | 7.7% |
| State Government Employees | 1,837 | 4.2% |
| Federal Government Employees | 796 | 1.8% |
| Unpaid Family Workers | 30 | 0.1% |
| Total | 44,318 | 100.0% |
Employment Status by Age in Nevada County
According to the labor force statistics for Nevada County, out of the total population over 16 years of age (86,971), 54.4% or 47,312 individuals are in the labor force, with 4.4% or 2,082 of them unemployed. The age group with the highest labor force participation rate is 45 to 54 years, with 82.7% or 9,578 individuals in the labor force. Within the labor force, the 20 to 24 years age range has the highest percentage of unemployed individuals, with 8.5% or 280 of them being unemployed.
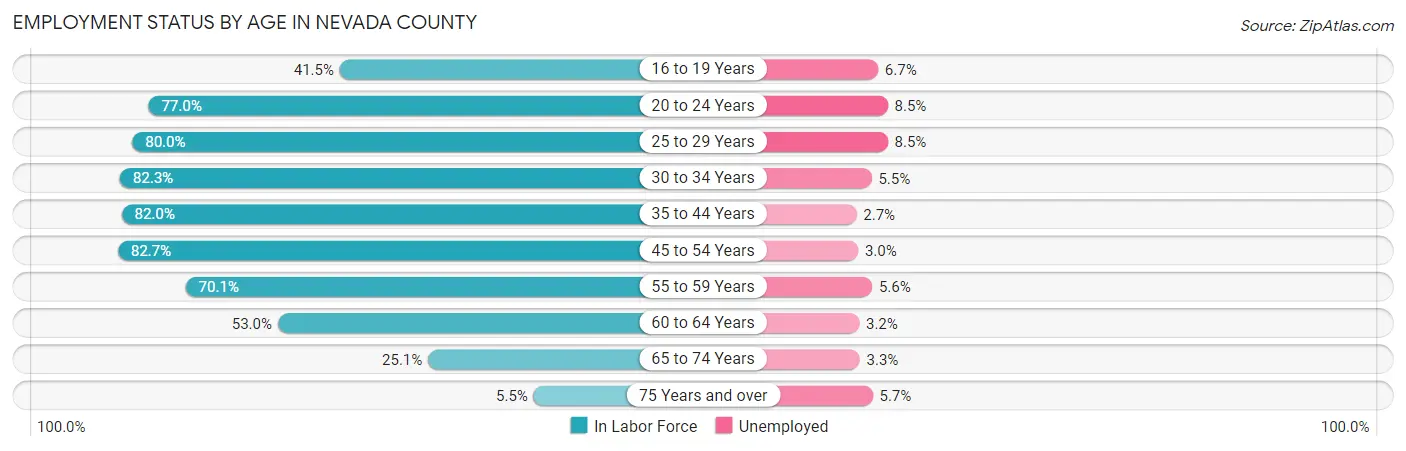
| Age Bracket | In Labor Force | Unemployed |
| 16 to 19 Years | 1,528 (41.5%) | 102 (6.7%) |
| 20 to 24 Years | 3,296 (77.0%) | 280 (8.5%) |
| 25 to 29 Years | 3,651 (80.0%) | 310 (8.5%) |
| 30 to 34 Years | 4,383 (82.3%) | 241 (5.5%) |
| 35 to 44 Years | 9,838 (82.0%) | 266 (2.7%) |
| 45 to 54 Years | 9,578 (82.7%) | 287 (3.0%) |
| 55 to 59 Years | 4,968 (70.1%) | 278 (5.6%) |
| 60 to 64 Years | 4,985 (53.0%) | 160 (3.2%) |
| 65 to 74 Years | 4,423 (25.1%) | 146 (3.3%) |
| 75 Years and over | 628 (5.5%) | 36 (5.7%) |
| Total | 47,312 (54.4%) | 2,082 (4.4%) |
Employment Status by Educational Attainment in Nevada County
According to labor force statistics for Nevada County, 74.9% of individuals (37,422) out of the total population between 25 and 64 years of age (49,962) are in the labor force, with 4.1% or 1,534 of them being unemployed. The group with the highest labor force participation rate are those with the educational attainment of bachelor's degree or higher, with 79.8% or 15,355 individuals in the labor force. Within the labor force, individuals with less than high school education have the highest percentage of unemployment, with 8.2% or 147 of them being unemployed.
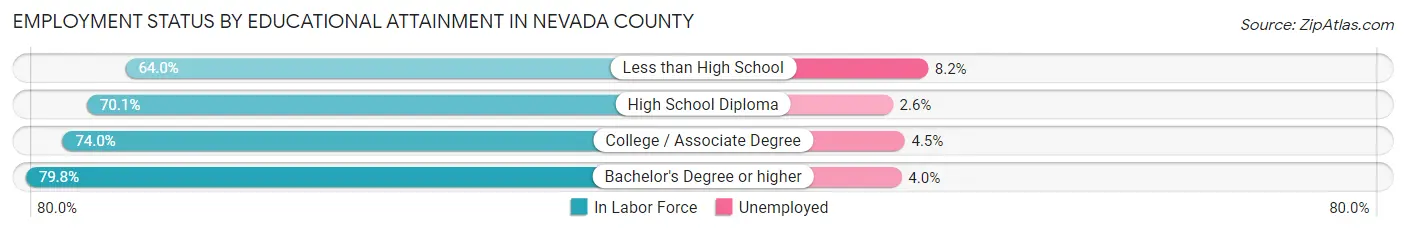
| Educational Attainment | In Labor Force | Unemployed |
| Less than High School | 1,793 (64.0%) | 230 (8.2%) |
| High School Diploma | 7,327 (70.1%) | 272 (2.6%) |
| College / Associate Degree | 12,925 (74.0%) | 786 (4.5%) |
| Bachelor's Degree or higher | 15,355 (79.8%) | 770 (4.0%) |
| Total | 37,422 (74.9%) | 2,048 (4.1%) |
Employment Occupations by Sex in Nevada County
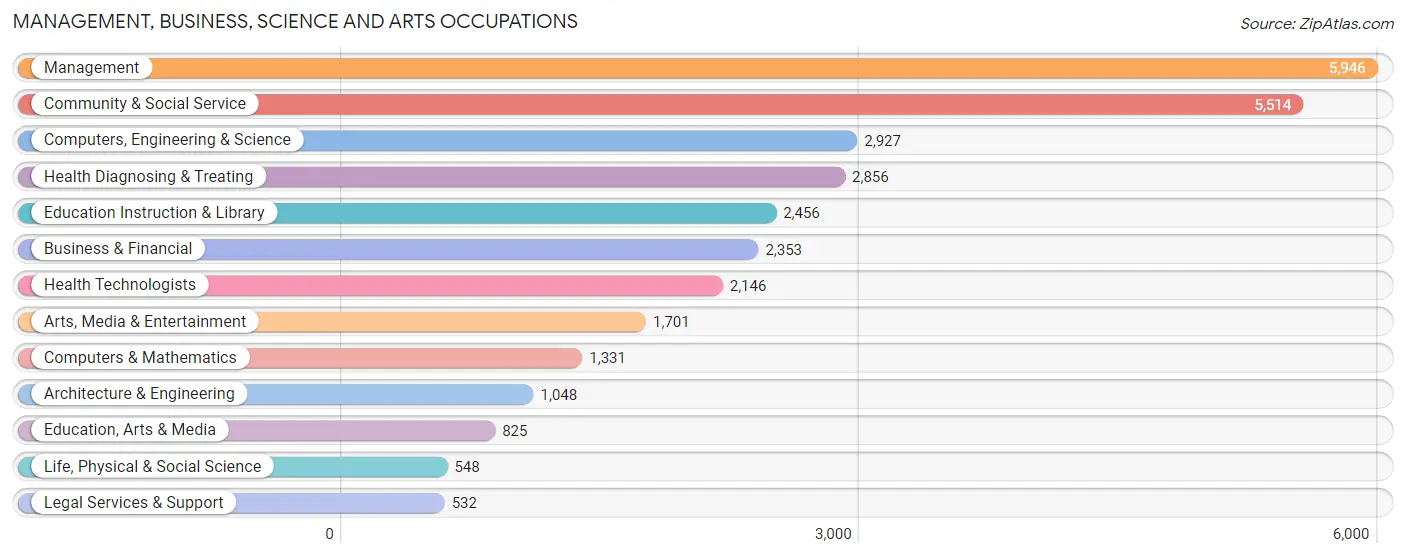
Management, Business, Science and Arts Occupations
The most common Management, Business, Science and Arts occupations in Nevada County are Management (5,946 | 13.2%), Community & Social Service (5,514 | 12.2%), Computers, Engineering & Science (2,927 | 6.5%), Health Diagnosing & Treating (2,856 | 6.3%), and Education Instruction & Library (2,456 | 5.4%).
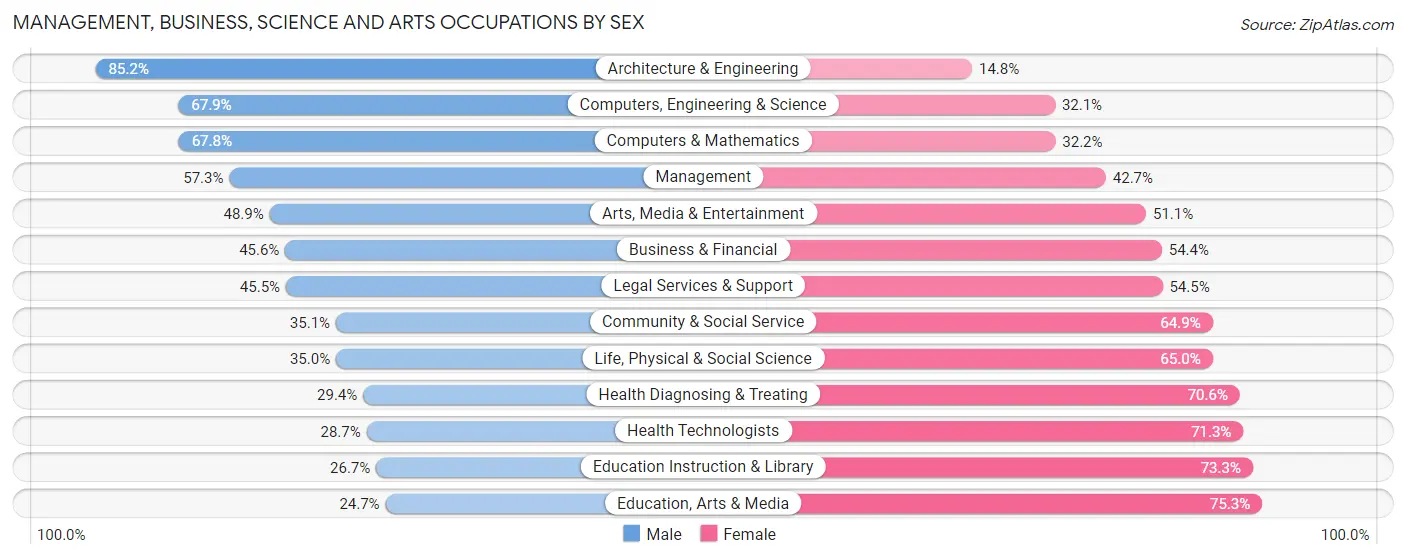
Management, Business, Science and Arts Occupations by Sex
Within the Management, Business, Science and Arts occupations in Nevada County, the most male-oriented occupations are Architecture & Engineering (85.2%), Computers, Engineering & Science (67.9%), and Computers & Mathematics (67.8%), while the most female-oriented occupations are Education, Arts & Media (75.3%), Education Instruction & Library (73.3%), and Health Technologists (71.3%).
| Occupation | Male | Female |
| Management | 3,407 (57.3%) | 2,539 (42.7%) |
| Business & Financial | 1,074 (45.6%) | 1,279 (54.4%) |
| Computers, Engineering & Science | 1,988 (67.9%) | 939 (32.1%) |
| Computers & Mathematics | 903 (67.8%) | 428 (32.2%) |
| Architecture & Engineering | 893 (85.2%) | 155 (14.8%) |
| Life, Physical & Social Science | 192 (35.0%) | 356 (65.0%) |
| Community & Social Service | 1,933 (35.1%) | 3,581 (64.9%) |
| Education, Arts & Media | 204 (24.7%) | 621 (75.3%) |
| Legal Services & Support | 242 (45.5%) | 290 (54.5%) |
| Education Instruction & Library | 655 (26.7%) | 1,801 (73.3%) |
| Arts, Media & Entertainment | 832 (48.9%) | 869 (51.1%) |
| Health Diagnosing & Treating | 839 (29.4%) | 2,017 (70.6%) |
| Health Technologists | 615 (28.7%) | 1,531 (71.3%) |
| Total (Category) | 9,241 (47.2%) | 10,355 (52.8%) |
| Total (Overall) | 23,309 (51.7%) | 21,755 (48.3%) |
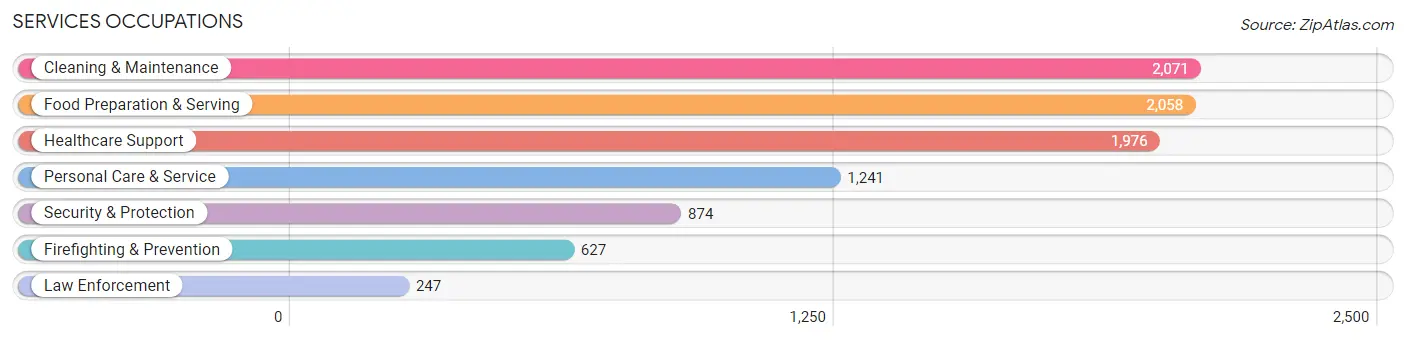
Services Occupations
The most common Services occupations in Nevada County are Cleaning & Maintenance (2,071 | 4.6%), Food Preparation & Serving (2,058 | 4.6%), Healthcare Support (1,976 | 4.4%), Personal Care & Service (1,241 | 2.8%), and Security & Protection (874 | 1.9%).
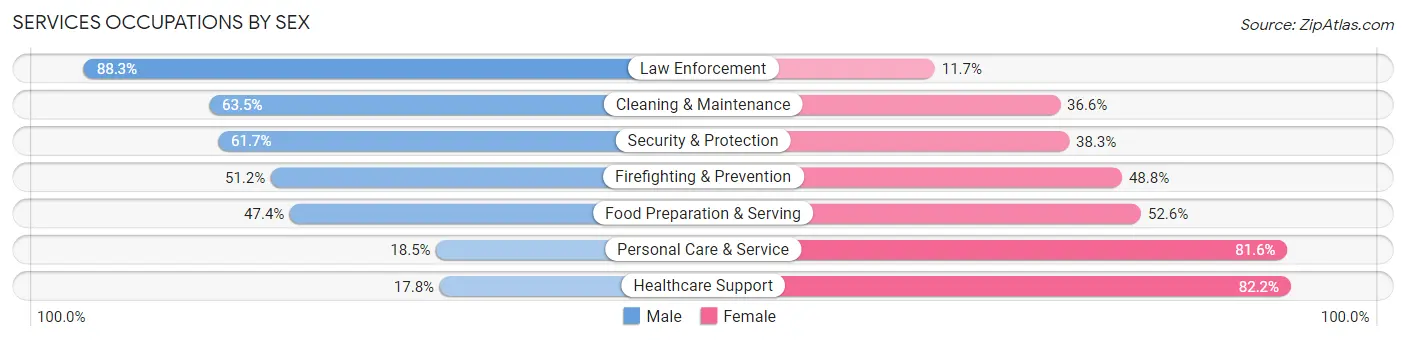
Services Occupations by Sex
Within the Services occupations in Nevada County, the most male-oriented occupations are Law Enforcement (88.3%), Cleaning & Maintenance (63.4%), and Security & Protection (61.7%), while the most female-oriented occupations are Healthcare Support (82.2%), Personal Care & Service (81.6%), and Food Preparation & Serving (52.6%).
| Occupation | Male | Female |
| Healthcare Support | 351 (17.8%) | 1,625 (82.2%) |
| Security & Protection | 539 (61.7%) | 335 (38.3%) |
| Firefighting & Prevention | 321 (51.2%) | 306 (48.8%) |
| Law Enforcement | 218 (88.3%) | 29 (11.7%) |
| Food Preparation & Serving | 976 (47.4%) | 1,082 (52.6%) |
| Cleaning & Maintenance | 1,314 (63.4%) | 757 (36.5%) |
| Personal Care & Service | 229 (18.4%) | 1,012 (81.6%) |
| Total (Category) | 3,409 (41.5%) | 4,811 (58.5%) |
| Total (Overall) | 23,309 (51.7%) | 21,755 (48.3%) |
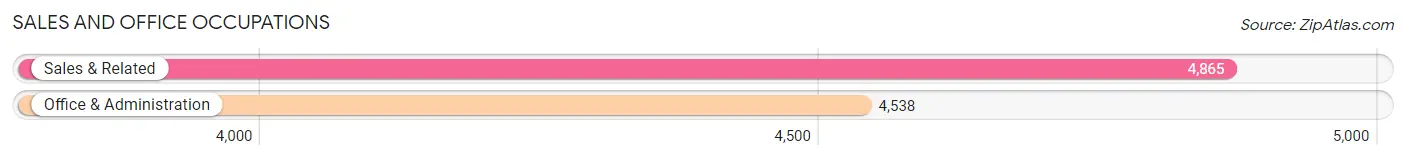
Sales and Office Occupations
The most common Sales and Office occupations in Nevada County are Sales & Related (4,865 | 10.8%), and Office & Administration (4,538 | 10.1%).
Sales and Office Occupations by Sex
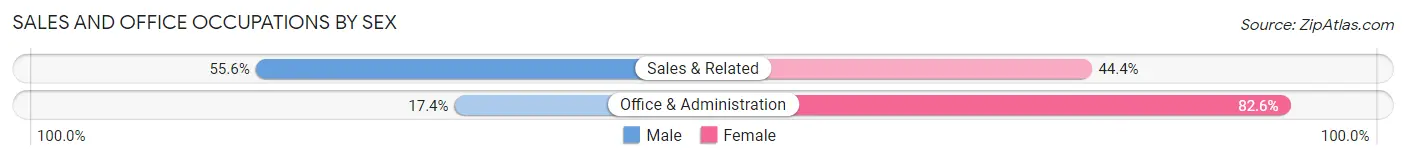
| Occupation | Male | Female |
| Sales & Related | 2,705 (55.6%) | 2,160 (44.4%) |
| Office & Administration | 788 (17.4%) | 3,750 (82.6%) |
| Total (Category) | 3,493 (37.1%) | 5,910 (62.8%) |
| Total (Overall) | 23,309 (51.7%) | 21,755 (48.3%) |
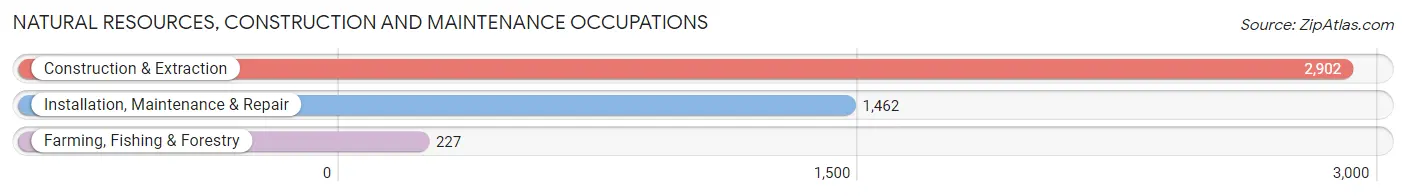
Natural Resources, Construction and Maintenance Occupations
The most common Natural Resources, Construction and Maintenance occupations in Nevada County are Construction & Extraction (2,902 | 6.4%), Installation, Maintenance & Repair (1,462 | 3.2%), and Farming, Fishing & Forestry (227 | 0.5%).
Natural Resources, Construction and Maintenance Occupations by Sex
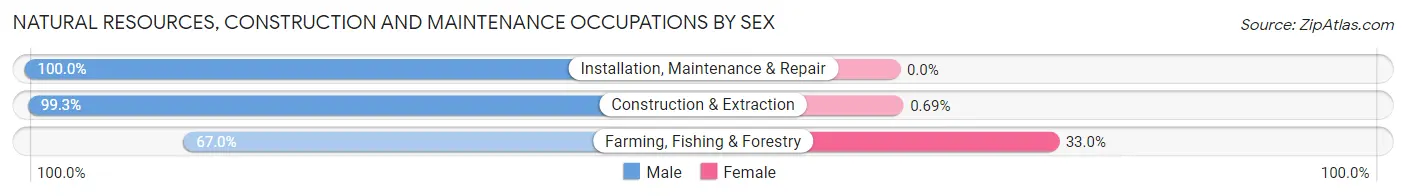
| Occupation | Male | Female |
| Farming, Fishing & Forestry | 152 (67.0%) | 75 (33.0%) |
| Construction & Extraction | 2,882 (99.3%) | 20 (0.7%) |
| Installation, Maintenance & Repair | 1,462 (100.0%) | 0 (0.0%) |
| Total (Category) | 4,496 (97.9%) | 95 (2.1%) |
| Total (Overall) | 23,309 (51.7%) | 21,755 (48.3%) |
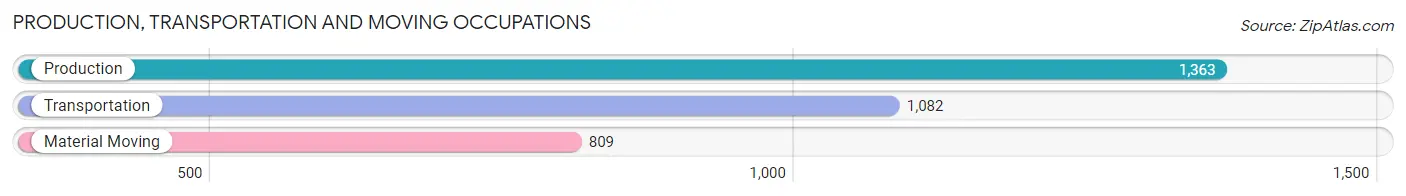
Production, Transportation and Moving Occupations
The most common Production, Transportation and Moving occupations in Nevada County are Production (1,363 | 3.0%), Transportation (1,082 | 2.4%), and Material Moving (809 | 1.8%).
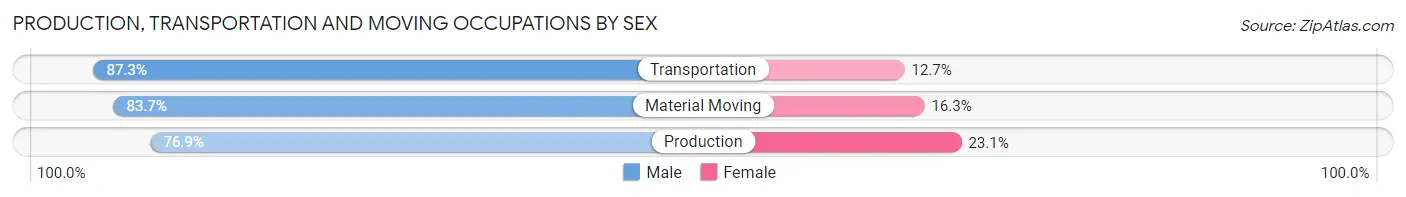
Production, Transportation and Moving Occupations by Sex
| Occupation | Male | Female |
| Production | 1,048 (76.9%) | 315 (23.1%) |
| Transportation | 945 (87.3%) | 137 (12.7%) |
| Material Moving | 677 (83.7%) | 132 (16.3%) |
| Total (Category) | 2,670 (82.1%) | 584 (17.9%) |
| Total (Overall) | 23,309 (51.7%) | 21,755 (48.3%) |
Employment Industries by Sex in Nevada County
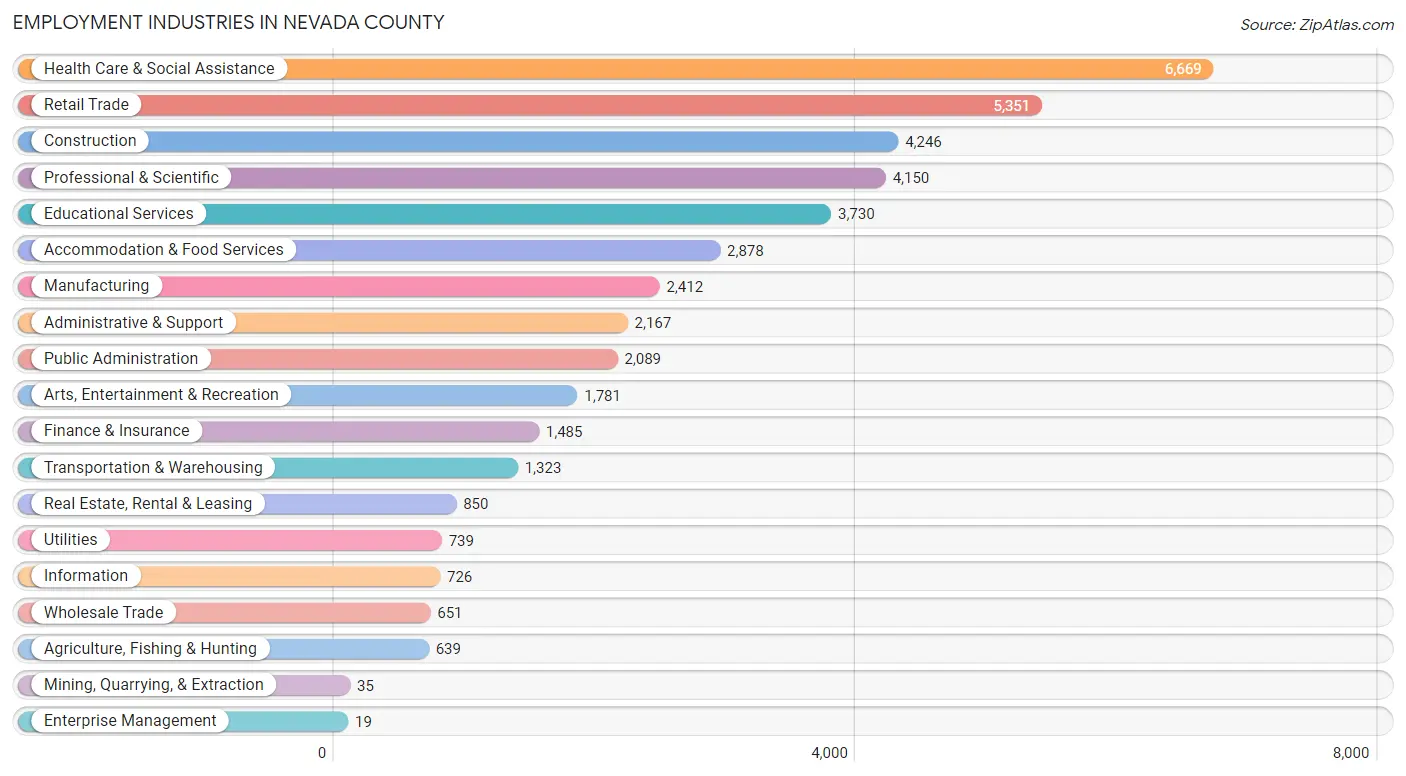
Employment Industries in Nevada County
The major employment industries in Nevada County include Health Care & Social Assistance (6,669 | 14.8%), Retail Trade (5,351 | 11.9%), Construction (4,246 | 9.4%), Professional & Scientific (4,150 | 9.2%), and Educational Services (3,730 | 8.3%).
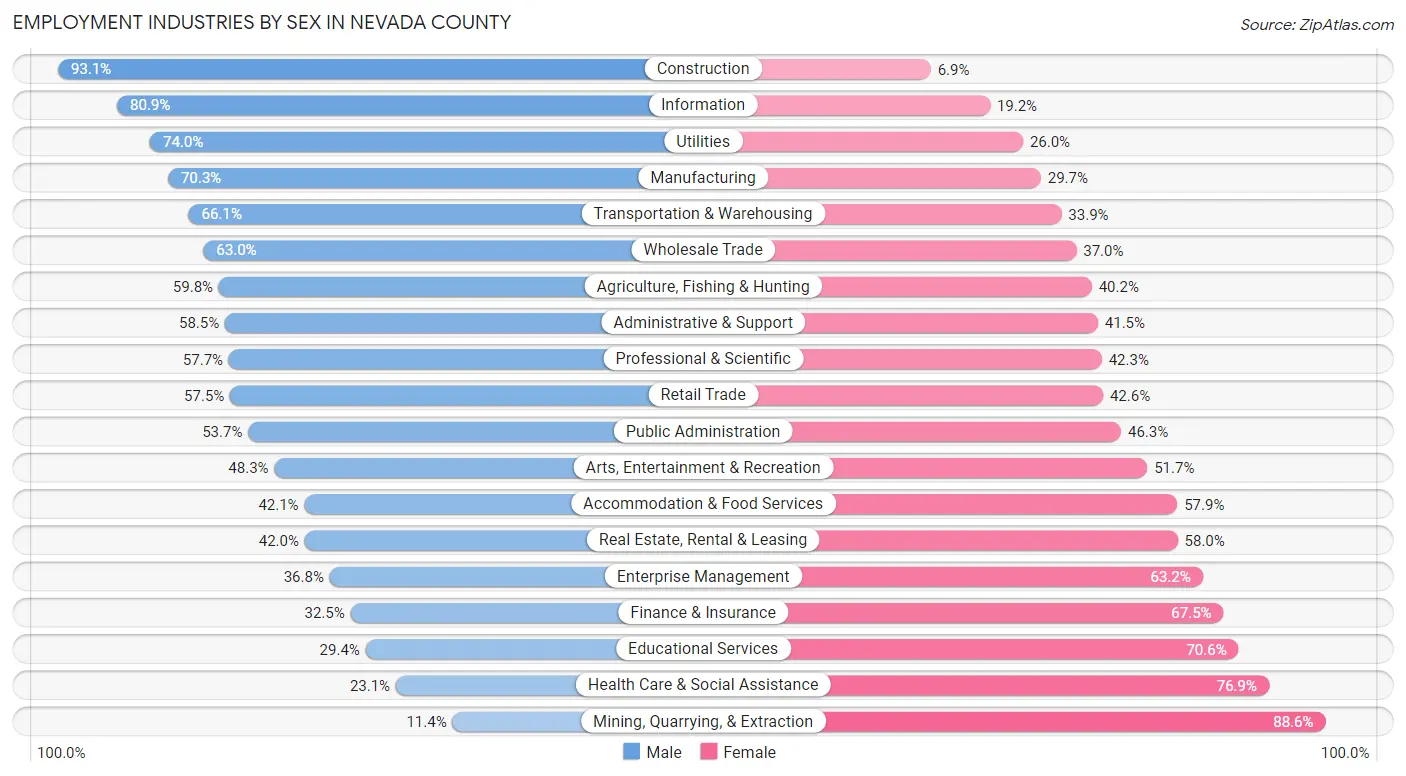
Employment Industries by Sex in Nevada County
The Nevada County industries that see more men than women are Construction (93.1%), Information (80.8%), and Utilities (74.0%), whereas the industries that tend to have a higher number of women are Mining, Quarrying, & Extraction (88.6%), Health Care & Social Assistance (76.9%), and Educational Services (70.6%).
| Industry | Male | Female |
| Agriculture, Fishing & Hunting | 382 (59.8%) | 257 (40.2%) |
| Mining, Quarrying, & Extraction | 4 (11.4%) | 31 (88.6%) |
| Construction | 3,953 (93.1%) | 293 (6.9%) |
| Manufacturing | 1,696 (70.3%) | 716 (29.7%) |
| Wholesale Trade | 410 (63.0%) | 241 (37.0%) |
| Retail Trade | 3,074 (57.5%) | 2,277 (42.5%) |
| Transportation & Warehousing | 874 (66.1%) | 449 (33.9%) |
| Utilities | 547 (74.0%) | 192 (26.0%) |
| Information | 587 (80.8%) | 139 (19.2%) |
| Finance & Insurance | 483 (32.5%) | 1,002 (67.5%) |
| Real Estate, Rental & Leasing | 357 (42.0%) | 493 (58.0%) |
| Professional & Scientific | 2,395 (57.7%) | 1,755 (42.3%) |
| Enterprise Management | 7 (36.8%) | 12 (63.2%) |
| Administrative & Support | 1,268 (58.5%) | 899 (41.5%) |
| Educational Services | 1,097 (29.4%) | 2,633 (70.6%) |
| Health Care & Social Assistance | 1,543 (23.1%) | 5,126 (76.9%) |
| Arts, Entertainment & Recreation | 860 (48.3%) | 921 (51.7%) |
| Accommodation & Food Services | 1,211 (42.1%) | 1,667 (57.9%) |
| Public Administration | 1,122 (53.7%) | 967 (46.3%) |
| Total | 23,309 (51.7%) | 21,755 (48.3%) |
Education in Nevada County
School Enrollment in Nevada County
The most common levels of schooling among the 17,867 students in Nevada County are high school (4,382 | 24.5%), middle school (4,364 | 24.4%), and elementary school (3,311 | 18.5%).
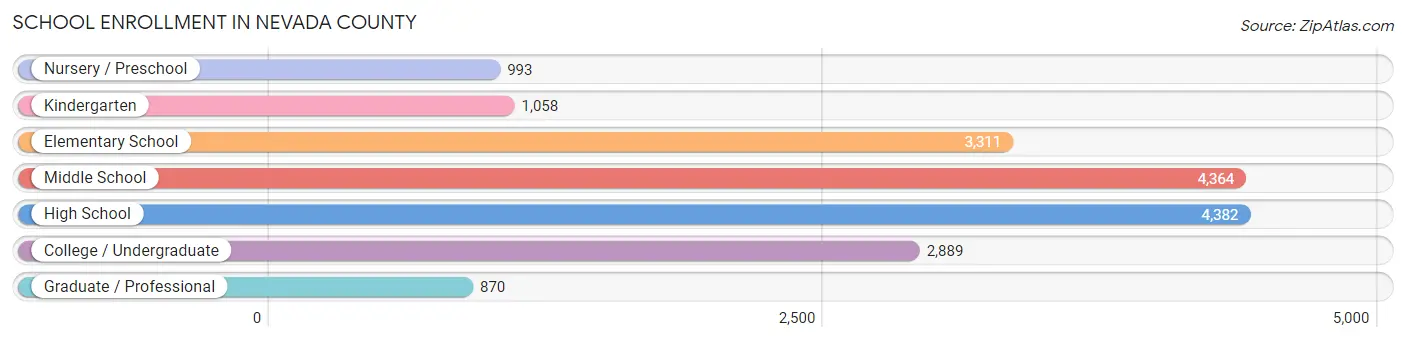
| School Level | # Students | % Students |
| Nursery / Preschool | 993 | 5.6% |
| Kindergarten | 1,058 | 5.9% |
| Elementary School | 3,311 | 18.5% |
| Middle School | 4,364 | 24.4% |
| High School | 4,382 | 24.5% |
| College / Undergraduate | 2,889 | 16.2% |
| Graduate / Professional | 870 | 4.9% |
| Total | 17,867 | 100.0% |
School Enrollment by Age by Funding Source in Nevada County
Out of a total of 17,867 students who are enrolled in schools in Nevada County, 3,002 (16.8%) attend a private institution, while the remaining 14,865 (83.2%) are enrolled in public schools. The age group of 35 years and over has the highest likelihood of being enrolled in private schools, with 599 (36.2% in the age bracket) enrolled. Conversely, the age group of 18 to 19 year olds has the lowest likelihood of being enrolled in a private school, with 985 (91.7% in the age bracket) attending a public institution.
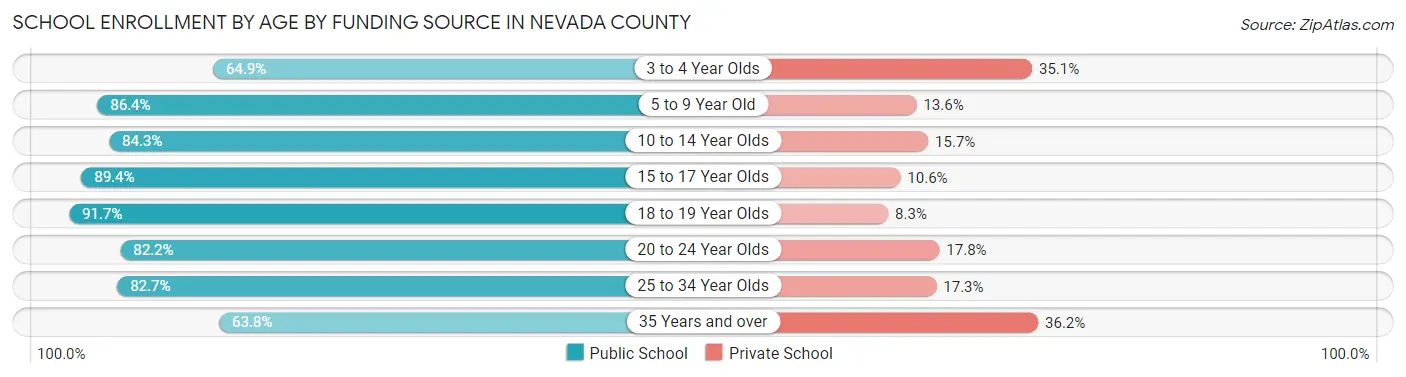
| Age Bracket | Public School | Private School |
| 3 to 4 Year Olds | 531 (64.9%) | 287 (35.1%) |
| 5 to 9 Year Old | 3,686 (86.4%) | 578 (13.6%) |
| 10 to 14 Year Olds | 4,400 (84.3%) | 822 (15.7%) |
| 15 to 17 Year Olds | 2,827 (89.4%) | 334 (10.6%) |
| 18 to 19 Year Olds | 985 (91.7%) | 89 (8.3%) |
| 20 to 24 Year Olds | 728 (82.2%) | 158 (17.8%) |
| 25 to 34 Year Olds | 652 (82.7%) | 136 (17.3%) |
| 35 Years and over | 1,055 (63.8%) | 599 (36.2%) |
| Total | 14,865 (83.2%) | 3,002 (16.8%) |
Educational Attainment by Field of Study in Nevada County
Business (4,591 | 13.8%), social sciences (3,562 | 10.7%), bio, nature & agricultural (2,867 | 8.6%), visual & performing arts (2,865 | 8.6%), and science & technology (2,563 | 7.7%) are the most common fields of study among 33,198 individuals in Nevada County who have obtained a bachelor's degree or higher.
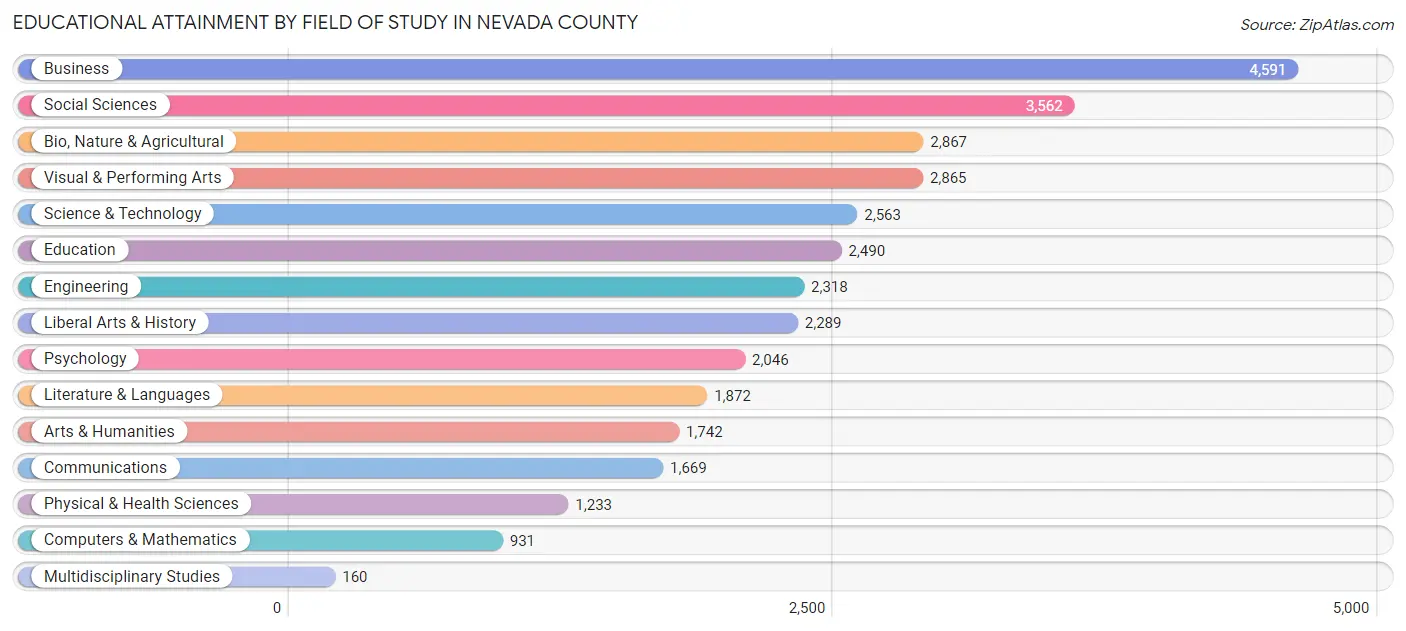
| Field of Study | # Graduates | % Graduates |
| Computers & Mathematics | 931 | 2.8% |
| Bio, Nature & Agricultural | 2,867 | 8.6% |
| Physical & Health Sciences | 1,233 | 3.7% |
| Psychology | 2,046 | 6.2% |
| Social Sciences | 3,562 | 10.7% |
| Engineering | 2,318 | 7.0% |
| Multidisciplinary Studies | 160 | 0.5% |
| Science & Technology | 2,563 | 7.7% |
| Business | 4,591 | 13.8% |
| Education | 2,490 | 7.5% |
| Literature & Languages | 1,872 | 5.6% |
| Liberal Arts & History | 2,289 | 6.9% |
| Visual & Performing Arts | 2,865 | 8.6% |
| Communications | 1,669 | 5.0% |
| Arts & Humanities | 1,742 | 5.2% |
| Total | 33,198 | 100.0% |
Transportation & Commute in Nevada County
Vehicle Availability by Sex in Nevada County
The most prevalent vehicle ownership categories in Nevada County are males with 2 vehicles (9,259, accounting for 40.4%) and females with 2 vehicles (8,107, making up 43.6%).
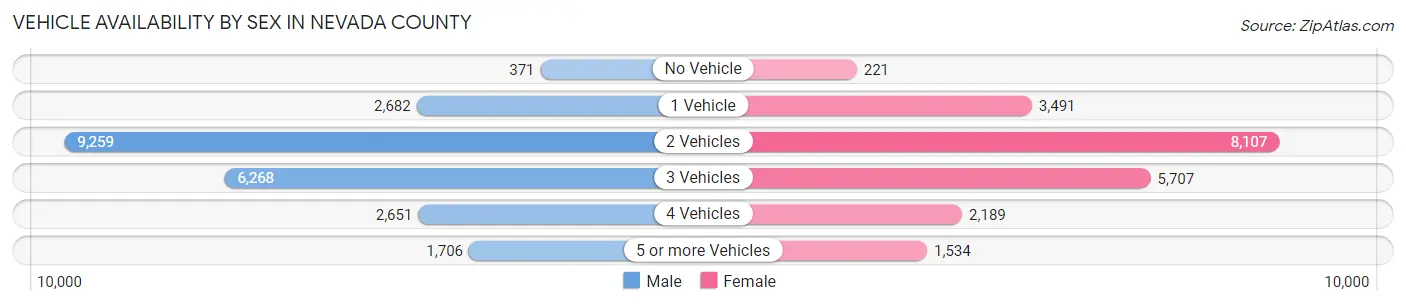
| Vehicles Available | Male | Female |
| No Vehicle | 371 (1.6%) | 221 (1.0%) |
| 1 Vehicle | 2,682 (11.7%) | 3,491 (16.4%) |
| 2 Vehicles | 9,259 (40.4%) | 8,107 (38.2%) |
| 3 Vehicles | 6,268 (27.3%) | 5,707 (26.9%) |
| 4 Vehicles | 2,651 (11.6%) | 2,189 (10.3%) |
| 5 or more Vehicles | 1,706 (7.4%) | 1,534 (7.2%) |
| Total | 22,937 (100.0%) | 21,249 (100.0%) |
Commute Time in Nevada County
The most frequently occuring commute durations in Nevada County are 10 to 14 minutes (6,427 commuters, 18.5%), 15 to 19 minutes (5,718 commuters, 16.5%), and 5 to 9 minutes (5,351 commuters, 15.4%).
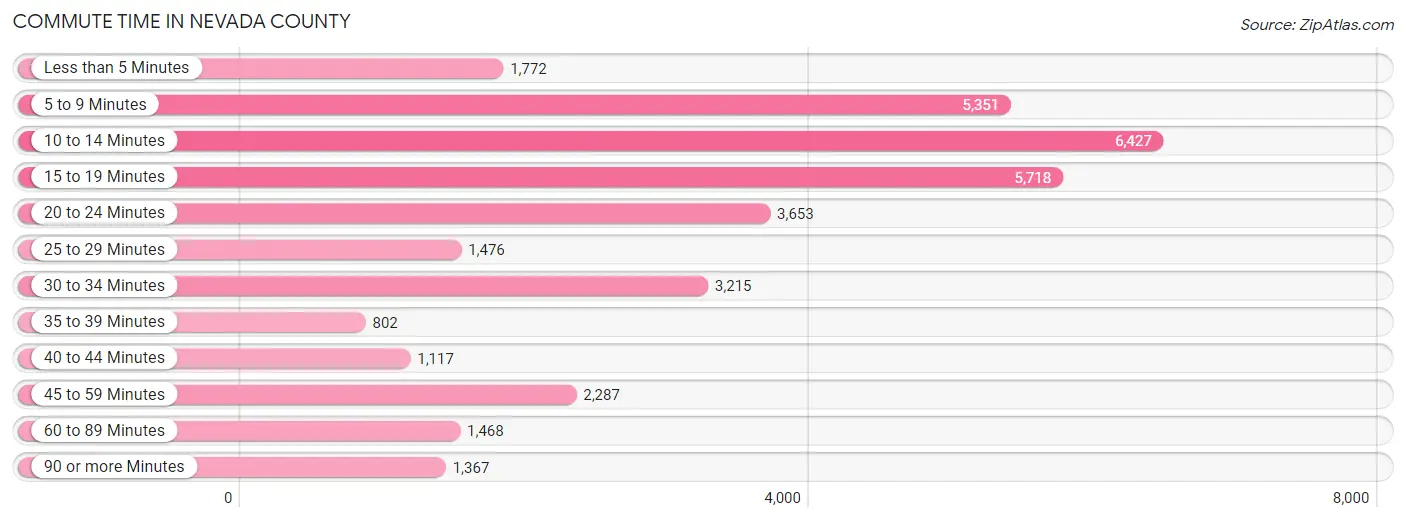
| Commute Time | # Commuters | % Commuters |
| Less than 5 Minutes | 1,772 | 5.1% |
| 5 to 9 Minutes | 5,351 | 15.4% |
| 10 to 14 Minutes | 6,427 | 18.5% |
| 15 to 19 Minutes | 5,718 | 16.5% |
| 20 to 24 Minutes | 3,653 | 10.5% |
| 25 to 29 Minutes | 1,476 | 4.3% |
| 30 to 34 Minutes | 3,215 | 9.3% |
| 35 to 39 Minutes | 802 | 2.3% |
| 40 to 44 Minutes | 1,117 | 3.2% |
| 45 to 59 Minutes | 2,287 | 6.6% |
| 60 to 89 Minutes | 1,468 | 4.2% |
| 90 or more Minutes | 1,367 | 3.9% |
Commute Time by Sex in Nevada County
The most common commute times in Nevada County are 5 to 9 minutes (2,875 commuters, 15.9%) for males and 10 to 14 minutes (3,691 commuters, 22.3%) for females.
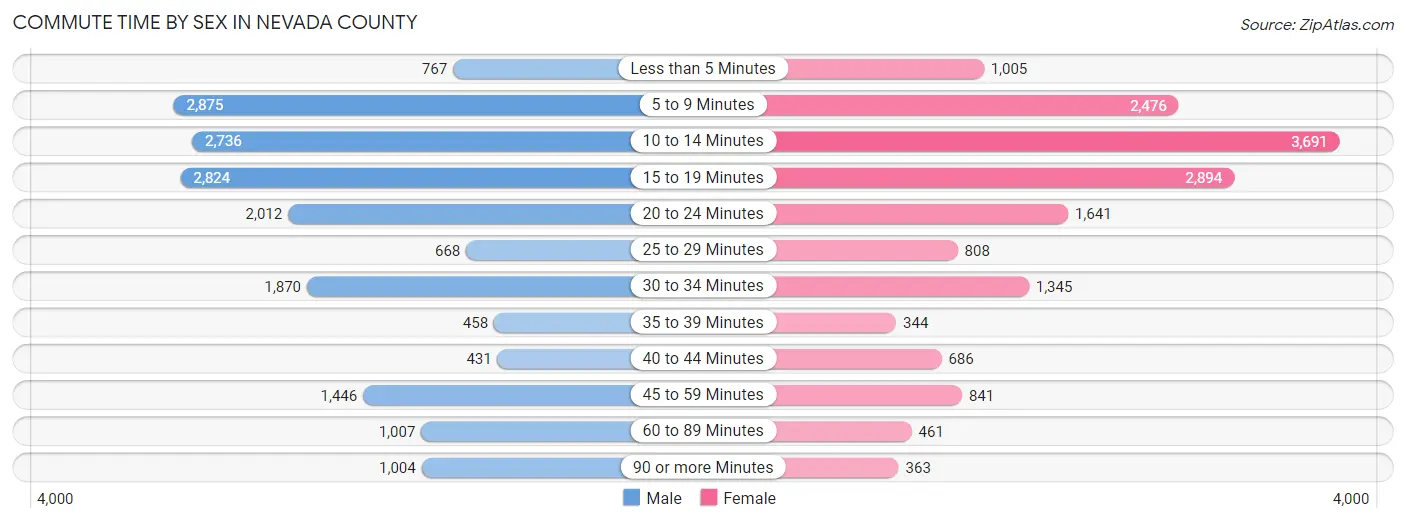
| Commute Time | Male | Female |
| Less than 5 Minutes | 767 (4.2%) | 1,005 (6.1%) |
| 5 to 9 Minutes | 2,875 (15.9%) | 2,476 (15.0%) |
| 10 to 14 Minutes | 2,736 (15.1%) | 3,691 (22.3%) |
| 15 to 19 Minutes | 2,824 (15.6%) | 2,894 (17.5%) |
| 20 to 24 Minutes | 2,012 (11.1%) | 1,641 (9.9%) |
| 25 to 29 Minutes | 668 (3.7%) | 808 (4.9%) |
| 30 to 34 Minutes | 1,870 (10.3%) | 1,345 (8.1%) |
| 35 to 39 Minutes | 458 (2.5%) | 344 (2.1%) |
| 40 to 44 Minutes | 431 (2.4%) | 686 (4.1%) |
| 45 to 59 Minutes | 1,446 (8.0%) | 841 (5.1%) |
| 60 to 89 Minutes | 1,007 (5.6%) | 461 (2.8%) |
| 90 or more Minutes | 1,004 (5.6%) | 363 (2.2%) |
Time of Departure to Work by Sex in Nevada County
The most frequent times of departure to work in Nevada County are 7:00 AM to 7:29 AM (2,329, 12.9%) for males and 7:30 AM to 7:59 AM (2,792, 16.9%) for females.
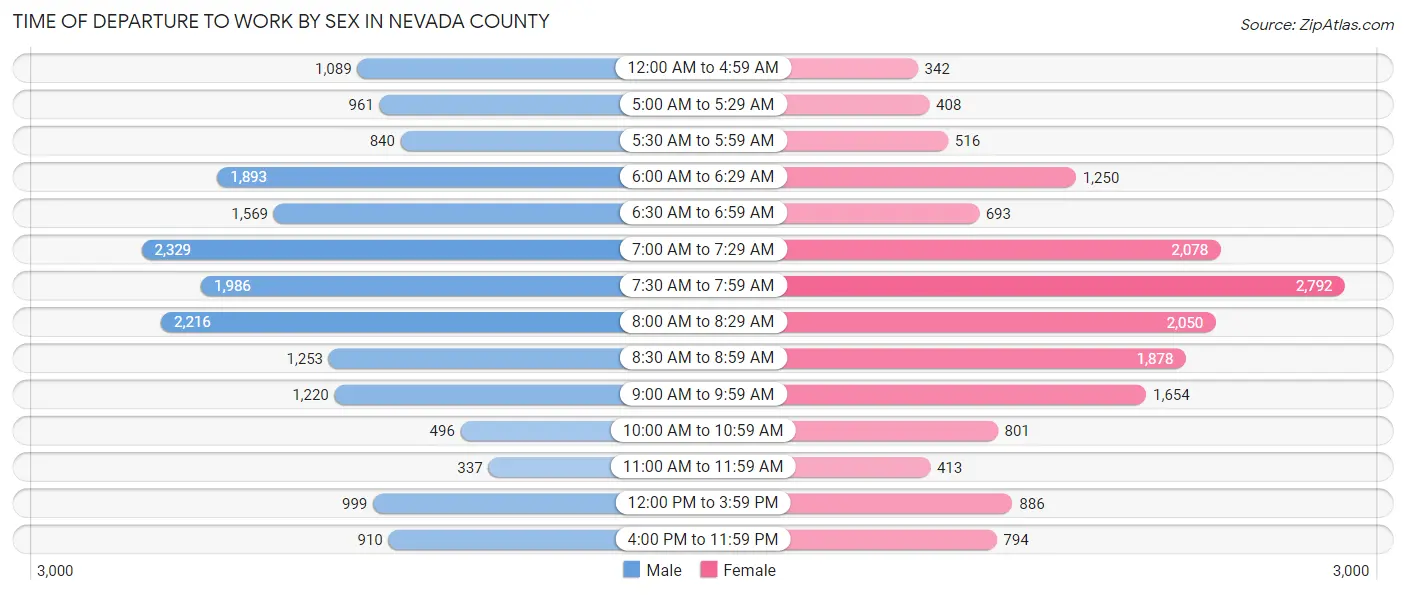
| Time of Departure | Male | Female |
| 12:00 AM to 4:59 AM | 1,089 (6.0%) | 342 (2.1%) |
| 5:00 AM to 5:29 AM | 961 (5.3%) | 408 (2.5%) |
| 5:30 AM to 5:59 AM | 840 (4.6%) | 516 (3.1%) |
| 6:00 AM to 6:29 AM | 1,893 (10.5%) | 1,250 (7.5%) |
| 6:30 AM to 6:59 AM | 1,569 (8.7%) | 693 (4.2%) |
| 7:00 AM to 7:29 AM | 2,329 (12.9%) | 2,078 (12.6%) |
| 7:30 AM to 7:59 AM | 1,986 (11.0%) | 2,792 (16.9%) |
| 8:00 AM to 8:29 AM | 2,216 (12.2%) | 2,050 (12.4%) |
| 8:30 AM to 8:59 AM | 1,253 (6.9%) | 1,878 (11.3%) |
| 9:00 AM to 9:59 AM | 1,220 (6.7%) | 1,654 (10.0%) |
| 10:00 AM to 10:59 AM | 496 (2.7%) | 801 (4.8%) |
| 11:00 AM to 11:59 AM | 337 (1.9%) | 413 (2.5%) |
| 12:00 PM to 3:59 PM | 999 (5.5%) | 886 (5.3%) |
| 4:00 PM to 11:59 PM | 910 (5.0%) | 794 (4.8%) |
| Total | 18,098 (100.0%) | 16,555 (100.0%) |
Housing Occupancy in Nevada County
Occupancy by Ownership in Nevada County
Of the total 41,415 dwellings in Nevada County, owner-occupied units account for 31,000 (74.9%), while renter-occupied units make up 10,415 (25.2%).
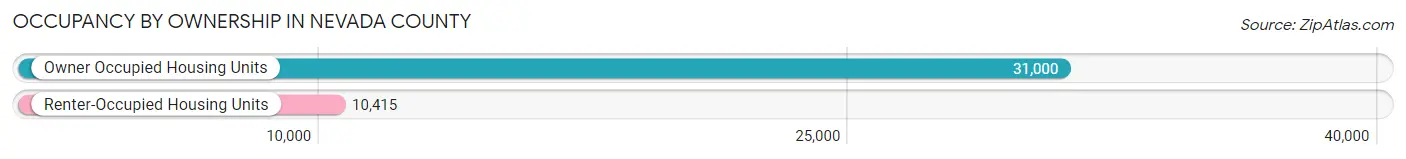
| Occupancy | # Housing Units | % Housing Units |
| Owner Occupied Housing Units | 31,000 | 74.9% |
| Renter-Occupied Housing Units | 10,415 | 25.2% |
| Total Occupied Housing Units | 41,415 | 100.0% |
Occupancy by Household Size in Nevada County
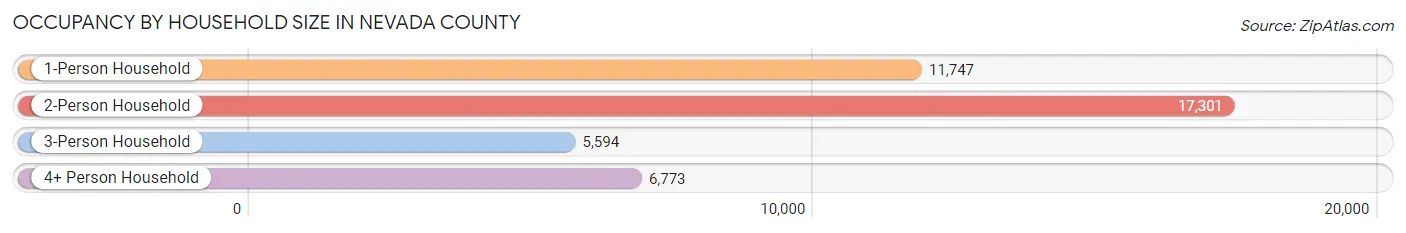
| Household Size | # Housing Units | % Housing Units |
| 1-Person Household | 11,747 | 28.4% |
| 2-Person Household | 17,301 | 41.8% |
| 3-Person Household | 5,594 | 13.5% |
| 4+ Person Household | 6,773 | 16.4% |
| Total Housing Units | 41,415 | 100.0% |
Occupancy by Ownership by Household Size in Nevada County
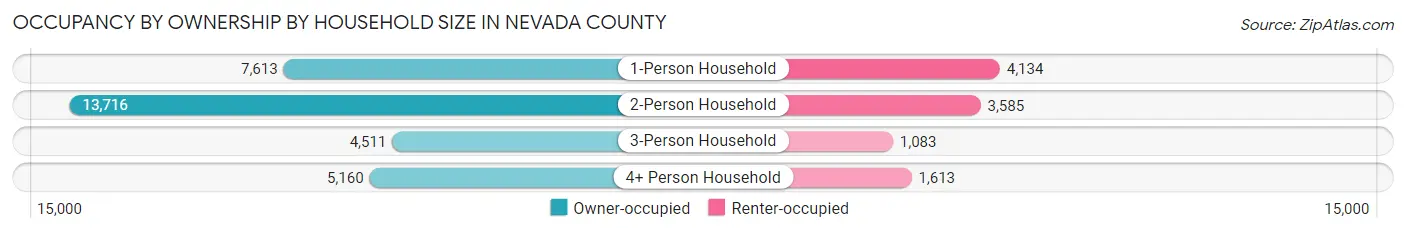
| Household Size | Owner-occupied | Renter-occupied |
| 1-Person Household | 7,613 (64.8%) | 4,134 (35.2%) |
| 2-Person Household | 13,716 (79.3%) | 3,585 (20.7%) |
| 3-Person Household | 4,511 (80.6%) | 1,083 (19.4%) |
| 4+ Person Household | 5,160 (76.2%) | 1,613 (23.8%) |
| Total Housing Units | 31,000 (74.9%) | 10,415 (25.2%) |
Occupancy by Educational Attainment in Nevada County
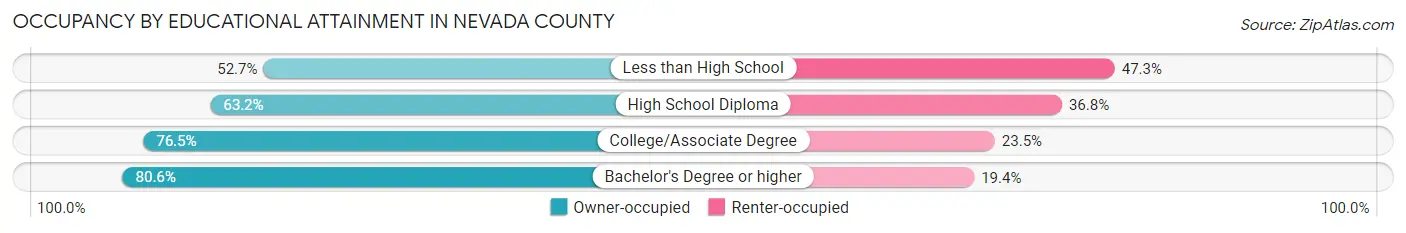
| Household Size | Owner-occupied | Renter-occupied |
| Less than High School | 1,011 (52.7%) | 908 (47.3%) |
| High School Diploma | 4,447 (63.2%) | 2,594 (36.8%) |
| College/Associate Degree | 11,254 (76.5%) | 3,465 (23.5%) |
| Bachelor's Degree or higher | 14,288 (80.6%) | 3,448 (19.4%) |
Occupancy by Age of Householder in Nevada County
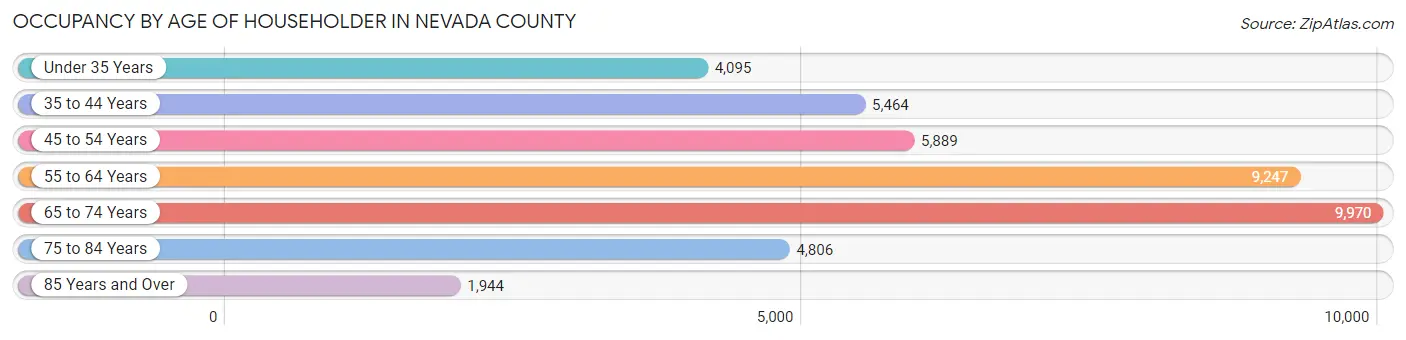
| Age Bracket | # Households | % Households |
| Under 35 Years | 4,095 | 9.9% |
| 35 to 44 Years | 5,464 | 13.2% |
| 45 to 54 Years | 5,889 | 14.2% |
| 55 to 64 Years | 9,247 | 22.3% |
| 65 to 74 Years | 9,970 | 24.1% |
| 75 to 84 Years | 4,806 | 11.6% |
| 85 Years and Over | 1,944 | 4.7% |
| Total | 41,415 | 100.0% |
Housing Finances in Nevada County
Median Income by Occupancy in Nevada County
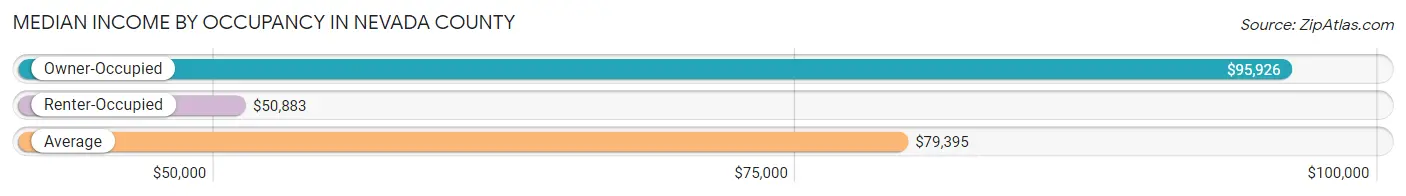
| Occupancy Type | # Households | Median Income |
| Owner-Occupied | 31,000 (74.9%) | $95,926 |
| Renter-Occupied | 10,415 (25.2%) | $50,883 |
| Average | 41,415 (100.0%) | $79,395 |
Occupancy by Householder Income Bracket in Nevada County
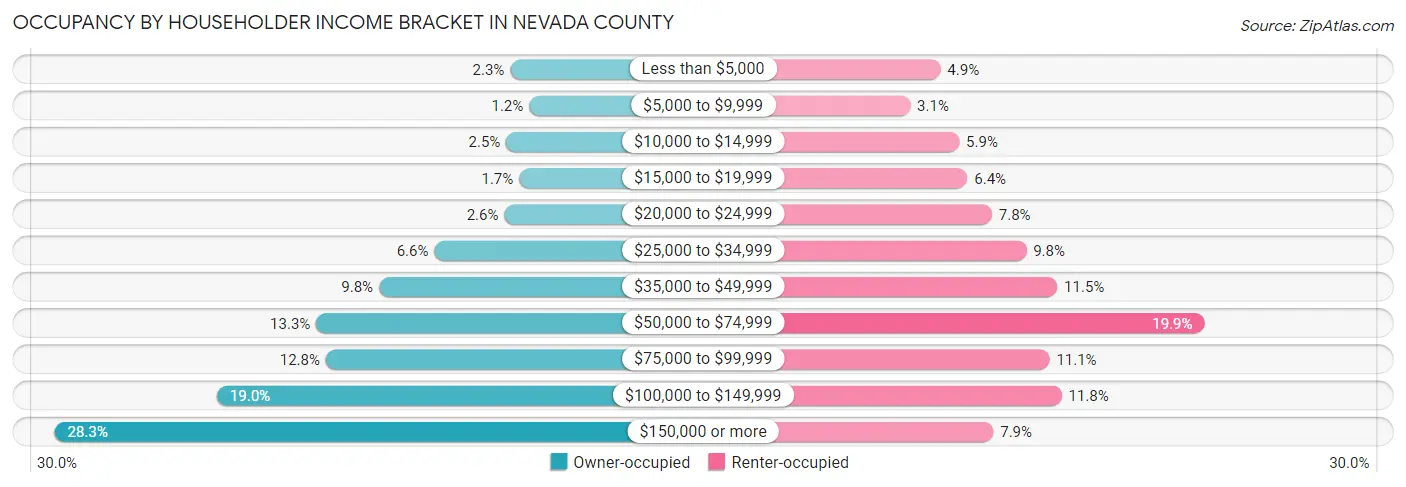
| Income Bracket | Owner-occupied | Renter-occupied |
| Less than $5,000 | 696 (2.2%) | 505 (4.9%) |
| $5,000 to $9,999 | 362 (1.2%) | 325 (3.1%) |
| $10,000 to $14,999 | 770 (2.5%) | 617 (5.9%) |
| $15,000 to $19,999 | 538 (1.7%) | 666 (6.4%) |
| $20,000 to $24,999 | 803 (2.6%) | 811 (7.8%) |
| $25,000 to $34,999 | 2,044 (6.6%) | 1,015 (9.8%) |
| $35,000 to $49,999 | 3,021 (9.8%) | 1,200 (11.5%) |
| $50,000 to $74,999 | 4,136 (13.3%) | 2,076 (19.9%) |
| $75,000 to $99,999 | 3,966 (12.8%) | 1,154 (11.1%) |
| $100,000 to $149,999 | 5,893 (19.0%) | 1,226 (11.8%) |
| $150,000 or more | 8,771 (28.3%) | 820 (7.9%) |
| Total | 31,000 (100.0%) | 10,415 (100.0%) |
Monthly Housing Cost Tiers in Nevada County
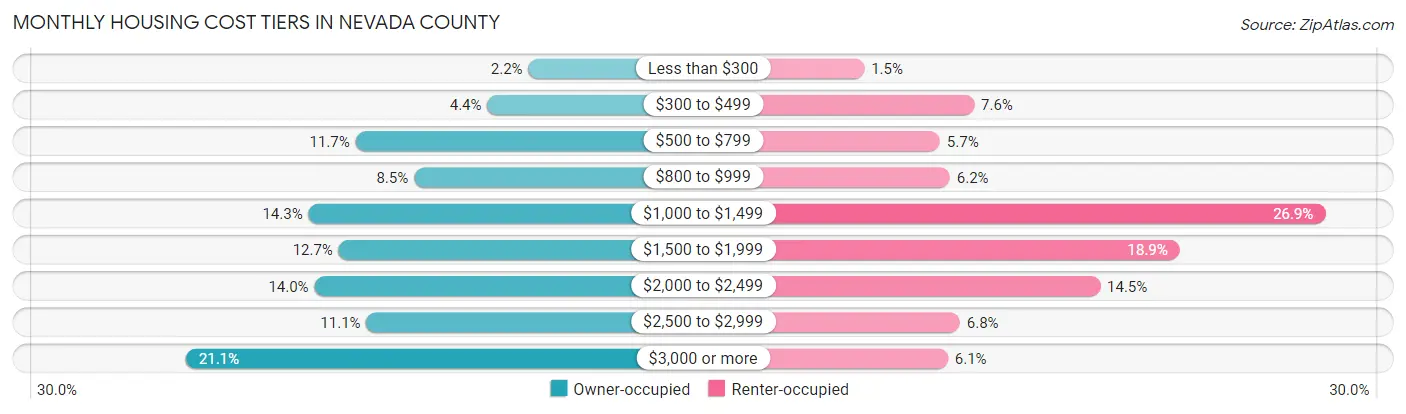
| Monthly Cost | Owner-occupied | Renter-occupied |
| Less than $300 | 672 (2.2%) | 154 (1.5%) |
| $300 to $499 | 1,375 (4.4%) | 786 (7.5%) |
| $500 to $799 | 3,634 (11.7%) | 589 (5.7%) |
| $800 to $999 | 2,633 (8.5%) | 647 (6.2%) |
| $1,000 to $1,499 | 4,440 (14.3%) | 2,806 (26.9%) |
| $1,500 to $1,999 | 3,923 (12.7%) | 1,968 (18.9%) |
| $2,000 to $2,499 | 4,336 (14.0%) | 1,511 (14.5%) |
| $2,500 to $2,999 | 3,448 (11.1%) | 704 (6.8%) |
| $3,000 or more | 6,539 (21.1%) | 635 (6.1%) |
| Total | 31,000 (100.0%) | 10,415 (100.0%) |
Physical Housing Characteristics in Nevada County
Housing Structures in Nevada County
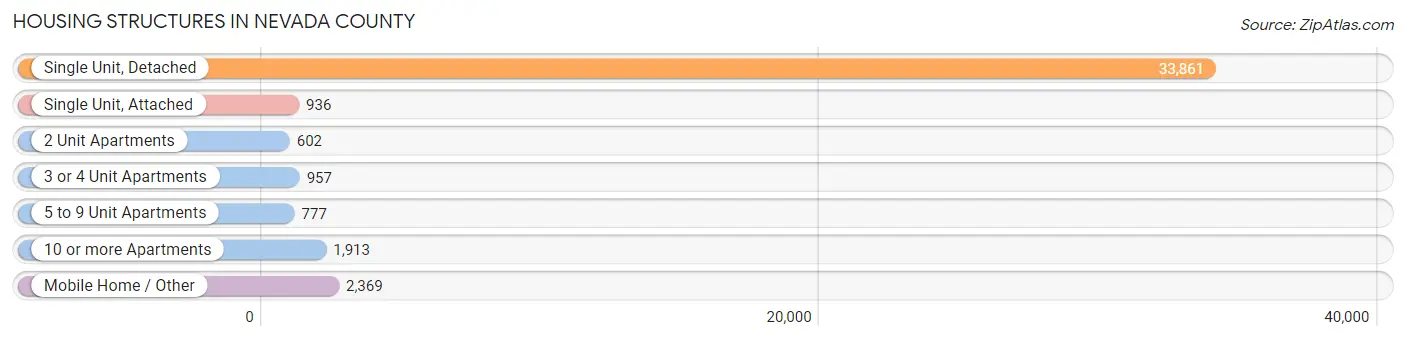
| Structure Type | # Housing Units | % Housing Units |
| Single Unit, Detached | 33,861 | 81.8% |
| Single Unit, Attached | 936 | 2.3% |
| 2 Unit Apartments | 602 | 1.5% |
| 3 or 4 Unit Apartments | 957 | 2.3% |
| 5 to 9 Unit Apartments | 777 | 1.9% |
| 10 or more Apartments | 1,913 | 4.6% |
| Mobile Home / Other | 2,369 | 5.7% |
| Total | 41,415 | 100.0% |
Housing Structures by Occupancy in Nevada County
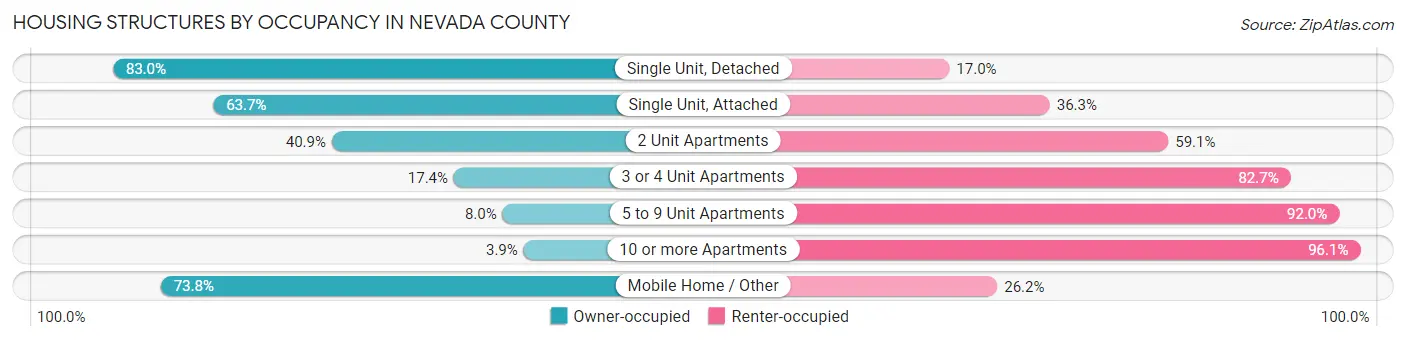
| Structure Type | Owner-occupied | Renter-occupied |
| Single Unit, Detached | 28,107 (83.0%) | 5,754 (17.0%) |
| Single Unit, Attached | 596 (63.7%) | 340 (36.3%) |
| 2 Unit Apartments | 246 (40.9%) | 356 (59.1%) |
| 3 or 4 Unit Apartments | 166 (17.3%) | 791 (82.7%) |
| 5 to 9 Unit Apartments | 62 (8.0%) | 715 (92.0%) |
| 10 or more Apartments | 75 (3.9%) | 1,838 (96.1%) |
| Mobile Home / Other | 1,748 (73.8%) | 621 (26.2%) |
| Total | 31,000 (74.9%) | 10,415 (25.2%) |
Housing Structures by Number of Rooms in Nevada County
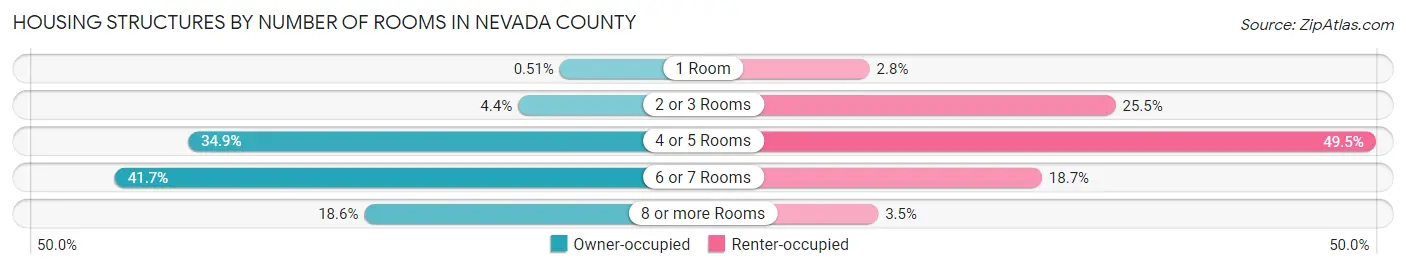
| Number of Rooms | Owner-occupied | Renter-occupied |
| 1 Room | 157 (0.5%) | 286 (2.8%) |
| 2 or 3 Rooms | 1,356 (4.4%) | 2,655 (25.5%) |
| 4 or 5 Rooms | 10,814 (34.9%) | 5,159 (49.5%) |
| 6 or 7 Rooms | 12,911 (41.6%) | 1,946 (18.7%) |
| 8 or more Rooms | 5,762 (18.6%) | 369 (3.5%) |
| Total | 31,000 (100.0%) | 10,415 (100.0%) |
Housing Structure by Heating Type in Nevada County
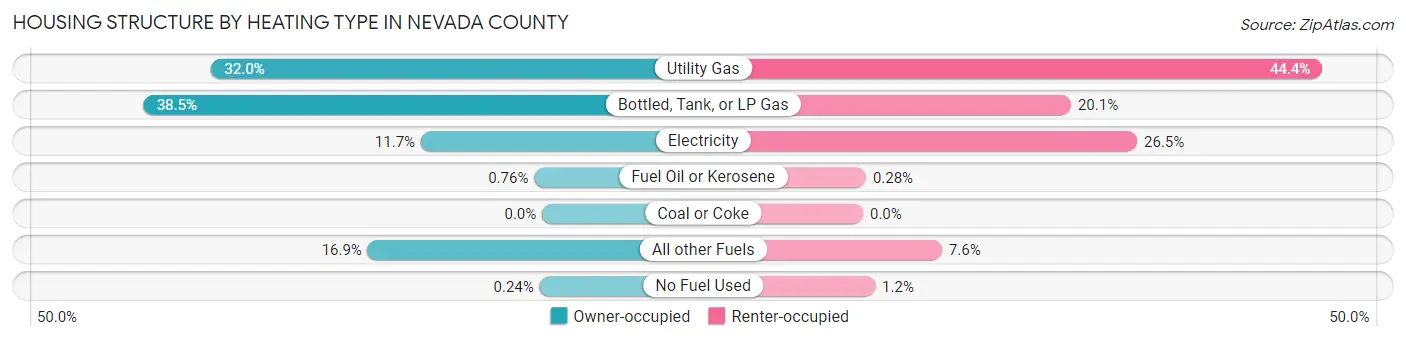
| Heating Type | Owner-occupied | Renter-occupied |
| Utility Gas | 9,904 (32.0%) | 4,620 (44.4%) |
| Bottled, Tank, or LP Gas | 11,932 (38.5%) | 2,092 (20.1%) |
| Electricity | 3,629 (11.7%) | 2,758 (26.5%) |
| Fuel Oil or Kerosene | 235 (0.8%) | 29 (0.3%) |
| Coal or Coke | 0 (0.0%) | 0 (0.0%) |
| All other Fuels | 5,225 (16.9%) | 794 (7.6%) |
| No Fuel Used | 75 (0.2%) | 122 (1.2%) |
| Total | 31,000 (100.0%) | 10,415 (100.0%) |
Household Vehicle Usage in Nevada County
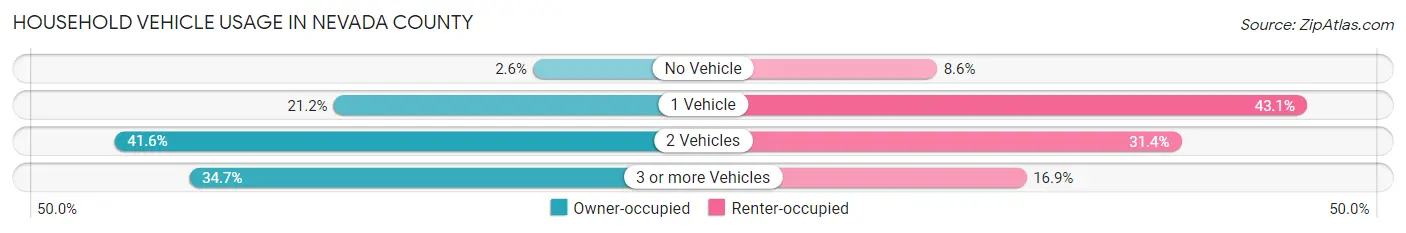
| Vehicles per Household | Owner-occupied | Renter-occupied |
| No Vehicle | 794 (2.6%) | 893 (8.6%) |
| 1 Vehicle | 6,563 (21.2%) | 4,490 (43.1%) |
| 2 Vehicles | 12,903 (41.6%) | 3,270 (31.4%) |
| 3 or more Vehicles | 10,740 (34.6%) | 1,762 (16.9%) |
| Total | 31,000 (100.0%) | 10,415 (100.0%) |
Real Estate & Mortgages in Nevada County
Real Estate and Mortgage Overview in Nevada County
| Characteristic | Without Mortgage | With Mortgage |
| Housing Units | 12,035 | 18,965 |
| Median Property Value | $529,300 | $578,500 |
| Median Household Income | $65,062 | $6,918 |
| Monthly Housing Costs | $839 | $6,482 |
| Real Estate Taxes | $3,711 | $284 |
Property Value by Mortgage Status in Nevada County
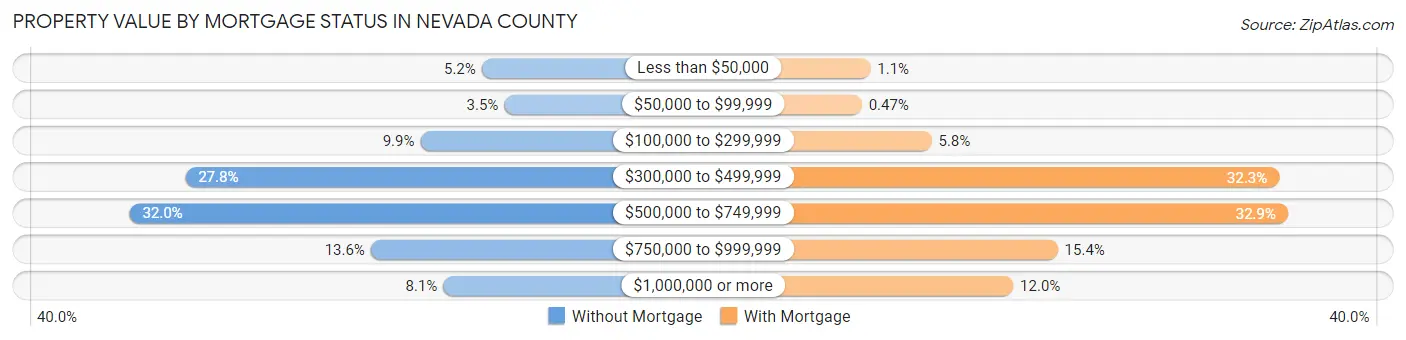
| Property Value | Without Mortgage | With Mortgage |
| Less than $50,000 | 623 (5.2%) | 214 (1.1%) |
| $50,000 to $99,999 | 417 (3.5%) | 89 (0.5%) |
| $100,000 to $299,999 | 1,185 (9.9%) | 1,099 (5.8%) |
| $300,000 to $499,999 | 3,341 (27.8%) | 6,120 (32.3%) |
| $500,000 to $749,999 | 3,853 (32.0%) | 6,246 (32.9%) |
| $750,000 to $999,999 | 1,640 (13.6%) | 2,920 (15.4%) |
| $1,000,000 or more | 976 (8.1%) | 2,277 (12.0%) |
| Total | 12,035 (100.0%) | 18,965 (100.0%) |
Household Income by Mortgage Status in Nevada County
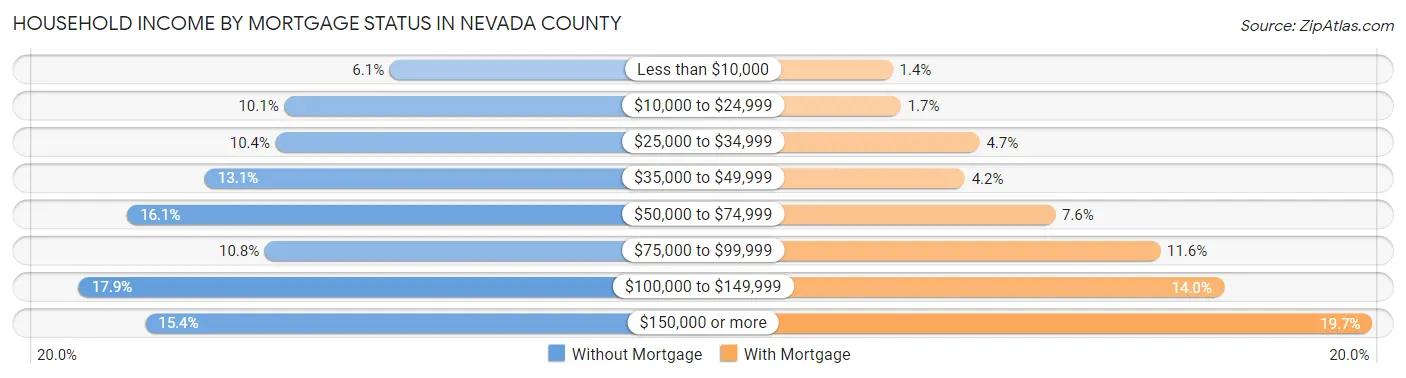
| Household Income | Without Mortgage | With Mortgage |
| Less than $10,000 | 732 (6.1%) | 267 (1.4%) |
| $10,000 to $24,999 | 1,215 (10.1%) | 326 (1.7%) |
| $25,000 to $34,999 | 1,255 (10.4%) | 896 (4.7%) |
| $35,000 to $49,999 | 1,580 (13.1%) | 789 (4.2%) |
| $50,000 to $74,999 | 1,937 (16.1%) | 1,441 (7.6%) |
| $75,000 to $99,999 | 1,305 (10.8%) | 2,199 (11.6%) |
| $100,000 to $149,999 | 2,158 (17.9%) | 2,661 (14.0%) |
| $150,000 or more | 1,853 (15.4%) | 3,735 (19.7%) |
| Total | 12,035 (100.0%) | 18,965 (100.0%) |
Property Value to Household Income Ratio in Nevada County
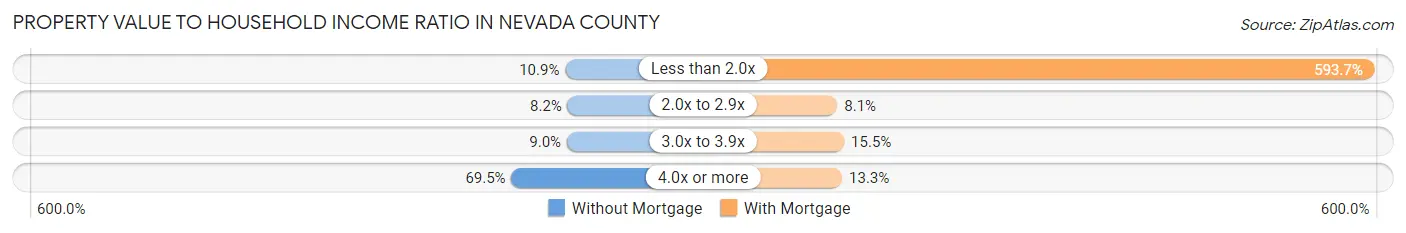
| Value-to-Income Ratio | Without Mortgage | With Mortgage |
| Less than 2.0x | 1,308 (10.9%) | 112,586 (593.6%) |
| 2.0x to 2.9x | 991 (8.2%) | 1,538 (8.1%) |
| 3.0x to 3.9x | 1,084 (9.0%) | 2,941 (15.5%) |
| 4.0x or more | 8,364 (69.5%) | 2,515 (13.3%) |
| Total | 12,035 (100.0%) | 18,965 (100.0%) |
Real Estate Taxes by Mortgage Status in Nevada County
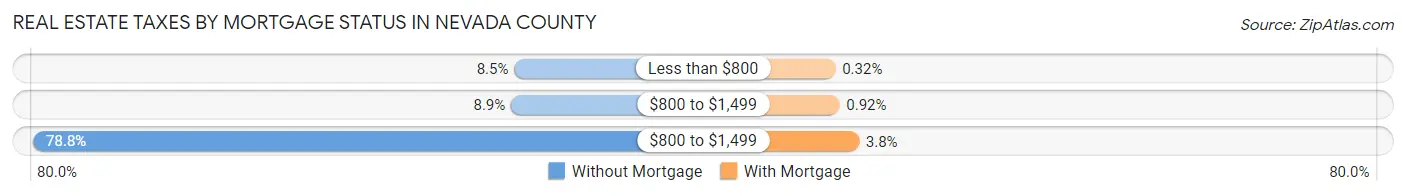
| Property Taxes | Without Mortgage | With Mortgage |
| Less than $800 | 1,017 (8.5%) | 61 (0.3%) |
| $800 to $1,499 | 1,072 (8.9%) | 175 (0.9%) |
| $800 to $1,499 | 9,481 (78.8%) | 715 (3.8%) |
| Total | 12,035 (100.0%) | 18,965 (100.0%) |
Health & Disability in Nevada County
Health Insurance Coverage by Age in Nevada County
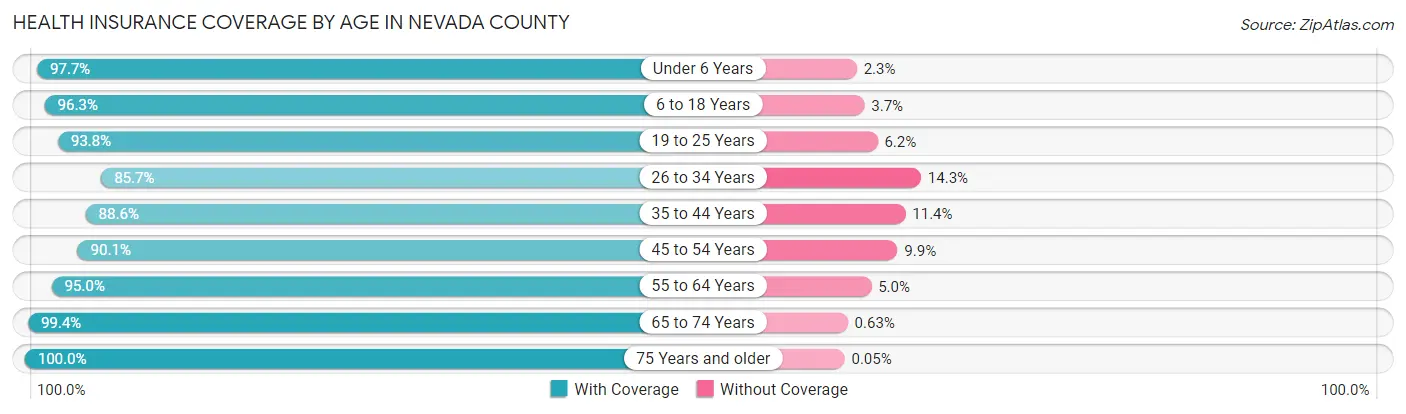
| Age Bracket | With Coverage | Without Coverage |
| Under 6 Years | 4,781 (97.7%) | 113 (2.3%) |
| 6 to 18 Years | 12,885 (96.3%) | 500 (3.7%) |
| 19 to 25 Years | 5,030 (93.8%) | 332 (6.2%) |
| 26 to 34 Years | 7,974 (85.7%) | 1,330 (14.3%) |
| 35 to 44 Years | 10,546 (88.6%) | 1,355 (11.4%) |
| 45 to 54 Years | 10,406 (90.1%) | 1,143 (9.9%) |
| 55 to 64 Years | 15,608 (95.0%) | 825 (5.0%) |
| 65 to 74 Years | 17,398 (99.4%) | 110 (0.6%) |
| 75 Years and older | 10,962 (100.0%) | 5 (0.1%) |
| Total | 95,590 (94.4%) | 5,713 (5.6%) |
Health Insurance Coverage by Citizenship Status in Nevada County
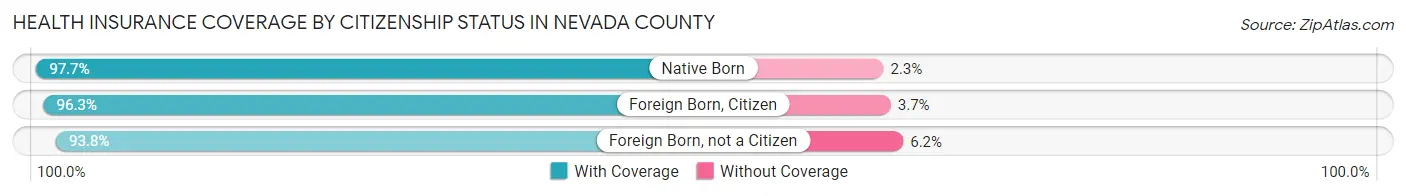
| Citizenship Status | With Coverage | Without Coverage |
| Native Born | 4,781 (97.7%) | 113 (2.3%) |
| Foreign Born, Citizen | 12,885 (96.3%) | 500 (3.7%) |
| Foreign Born, not a Citizen | 5,030 (93.8%) | 332 (6.2%) |
Health Insurance Coverage by Household Income in Nevada County
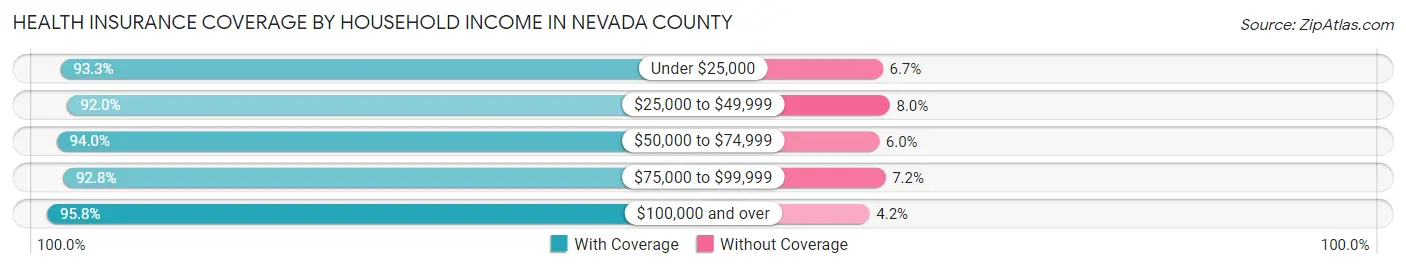
| Household Income | With Coverage | Without Coverage |
| Under $25,000 | 8,621 (93.3%) | 618 (6.7%) |
| $25,000 to $49,999 | 12,643 (92.0%) | 1,101 (8.0%) |
| $50,000 to $74,999 | 13,876 (94.0%) | 885 (6.0%) |
| $75,000 to $99,999 | 12,999 (92.8%) | 1,009 (7.2%) |
| $100,000 and over | 46,908 (95.8%) | 2,068 (4.2%) |
Public vs Private Health Insurance Coverage by Age in Nevada County
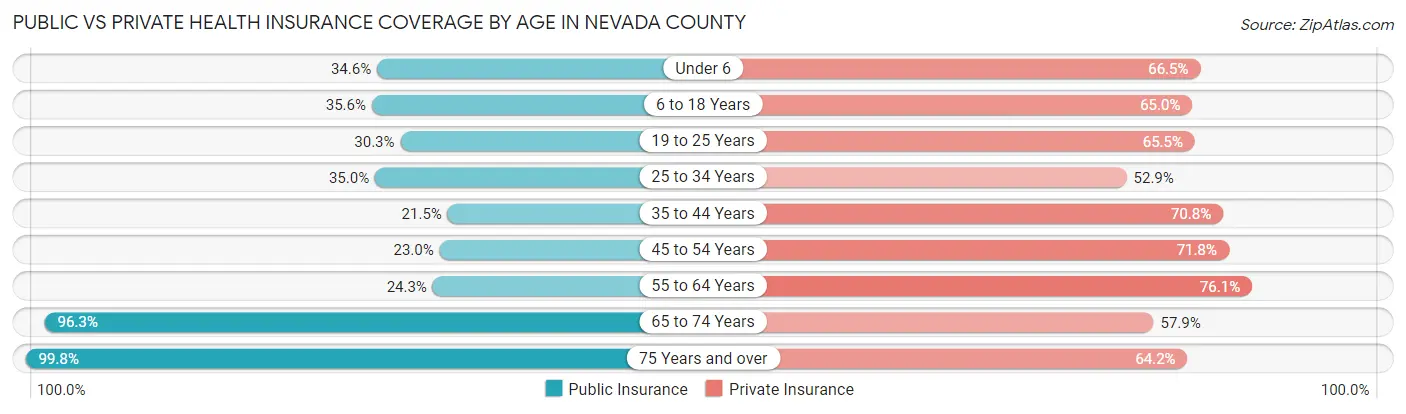
| Age Bracket | Public Insurance | Private Insurance |
| Under 6 | 1,693 (34.6%) | 3,256 (66.5%) |
| 6 to 18 Years | 4,758 (35.5%) | 8,705 (65.0%) |
| 19 to 25 Years | 1,622 (30.2%) | 3,513 (65.5%) |
| 25 to 34 Years | 3,253 (35.0%) | 4,919 (52.9%) |
| 35 to 44 Years | 2,555 (21.5%) | 8,421 (70.8%) |
| 45 to 54 Years | 2,654 (23.0%) | 8,294 (71.8%) |
| 55 to 64 Years | 3,985 (24.2%) | 12,511 (76.1%) |
| 65 to 74 Years | 16,859 (96.3%) | 10,131 (57.9%) |
| 75 Years and over | 10,948 (99.8%) | 7,035 (64.1%) |
| Total | 48,327 (47.7%) | 66,785 (65.9%) |
Disability Status by Sex by Age in Nevada County
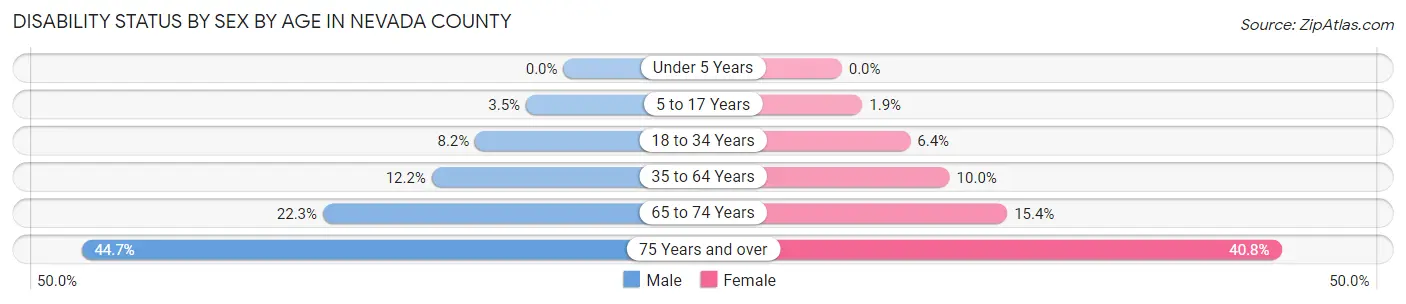
| Age Bracket | Male | Female |
| Under 5 Years | 0 (0.0%) | 0 (0.0%) |
| 5 to 17 Years | 233 (3.5%) | 122 (1.9%) |
| 18 to 34 Years | 656 (8.2%) | 485 (6.4%) |
| 35 to 64 Years | 2,403 (12.2%) | 2,024 (10.0%) |
| 65 to 74 Years | 1,901 (22.3%) | 1,380 (15.3%) |
| 75 Years and over | 2,205 (44.7%) | 2,462 (40.8%) |
Disability Class by Sex by Age in Nevada County
Disability Class: Hearing Difficulty
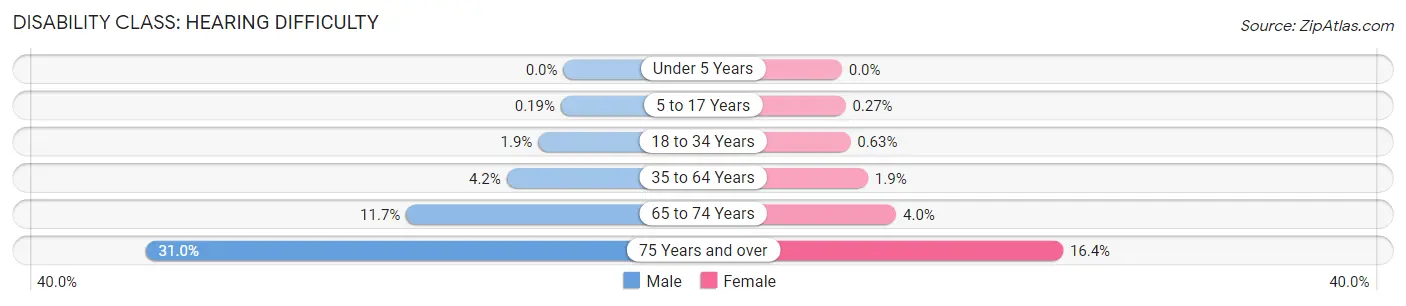
| Age Bracket | Male | Female |
| Under 5 Years | 0 (0.0%) | 0 (0.0%) |
| 5 to 17 Years | 13 (0.2%) | 17 (0.3%) |
| 18 to 34 Years | 150 (1.9%) | 48 (0.6%) |
| 35 to 64 Years | 828 (4.2%) | 393 (1.9%) |
| 65 to 74 Years | 994 (11.7%) | 362 (4.0%) |
| 75 Years and over | 1,529 (31.0%) | 991 (16.4%) |
Disability Class: Vision Difficulty
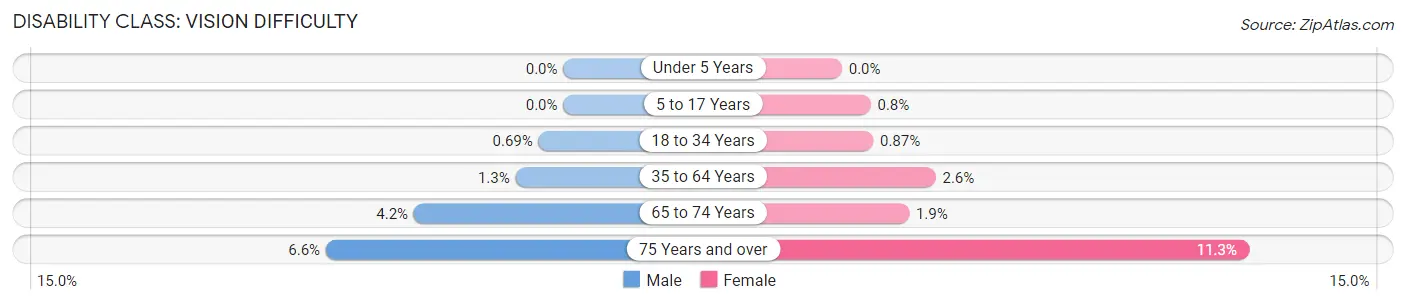
| Age Bracket | Male | Female |
| Under 5 Years | 0 (0.0%) | 0 (0.0%) |
| 5 to 17 Years | 0 (0.0%) | 51 (0.8%) |
| 18 to 34 Years | 55 (0.7%) | 66 (0.9%) |
| 35 to 64 Years | 261 (1.3%) | 528 (2.6%) |
| 65 to 74 Years | 354 (4.2%) | 168 (1.9%) |
| 75 Years and over | 326 (6.6%) | 684 (11.3%) |
Disability Class: Cognitive Difficulty
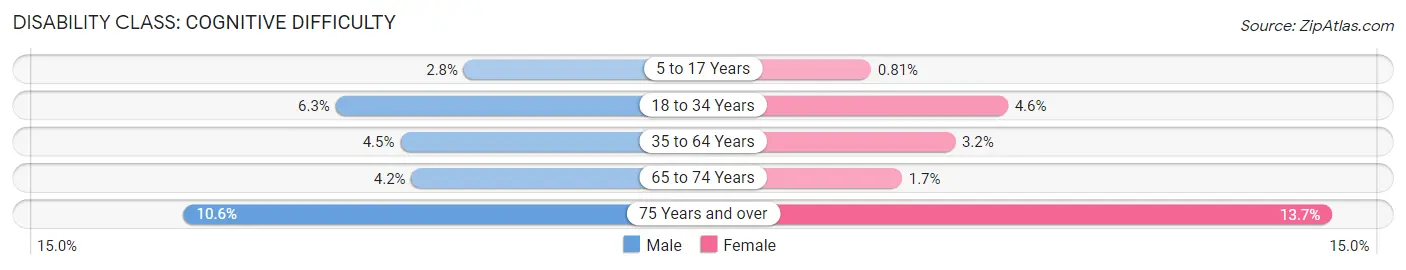
| Age Bracket | Male | Female |
| 5 to 17 Years | 186 (2.8%) | 52 (0.8%) |
| 18 to 34 Years | 508 (6.3%) | 352 (4.6%) |
| 35 to 64 Years | 892 (4.5%) | 637 (3.2%) |
| 65 to 74 Years | 360 (4.2%) | 150 (1.7%) |
| 75 Years and over | 521 (10.6%) | 824 (13.7%) |
Disability Class: Ambulatory Difficulty
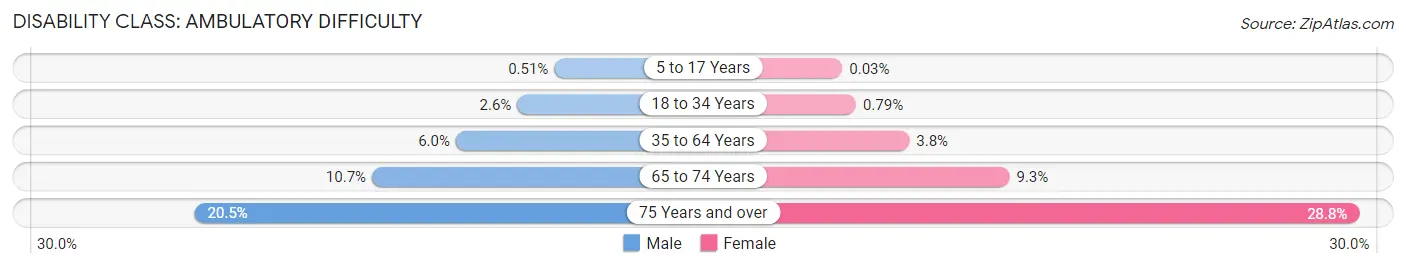
| Age Bracket | Male | Female |
| 5 to 17 Years | 34 (0.5%) | 2 (0.0%) |
| 18 to 34 Years | 206 (2.6%) | 60 (0.8%) |
| 35 to 64 Years | 1,179 (6.0%) | 761 (3.8%) |
| 65 to 74 Years | 908 (10.7%) | 840 (9.3%) |
| 75 Years and over | 1,013 (20.5%) | 1,739 (28.8%) |
Disability Class: Self-Care Difficulty
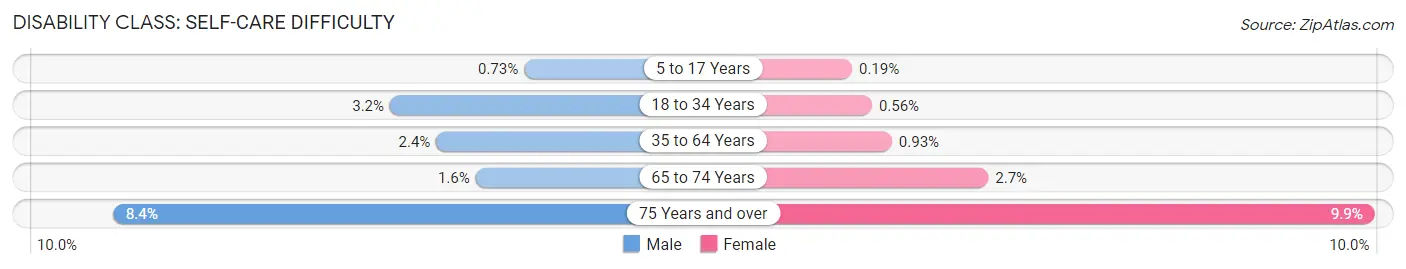
| Age Bracket | Male | Female |
| 5 to 17 Years | 49 (0.7%) | 12 (0.2%) |
| 18 to 34 Years | 258 (3.2%) | 43 (0.6%) |
| 35 to 64 Years | 464 (2.4%) | 188 (0.9%) |
| 65 to 74 Years | 139 (1.6%) | 245 (2.7%) |
| 75 Years and over | 412 (8.4%) | 597 (9.9%) |
Technology Access in Nevada County
Computing Device Access in Nevada County
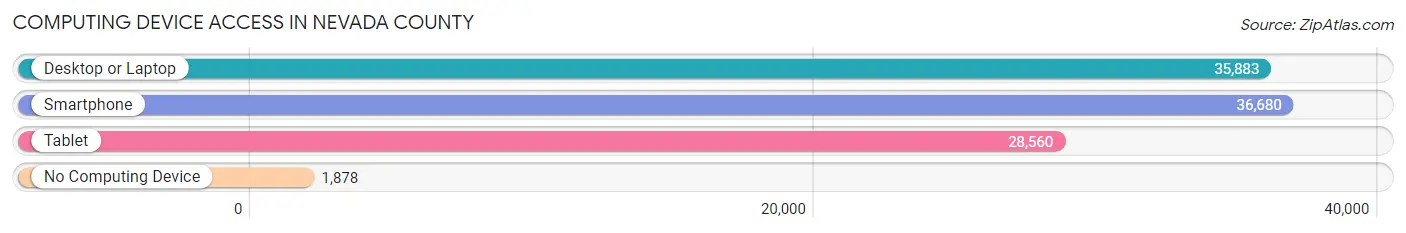
| Device Type | # Households | % Households |
| Desktop or Laptop | 35,883 | 86.6% |
| Smartphone | 36,680 | 88.6% |
| Tablet | 28,560 | 69.0% |
| No Computing Device | 1,878 | 4.5% |
| Total | 41,415 | 100.0% |
Internet Access in Nevada County
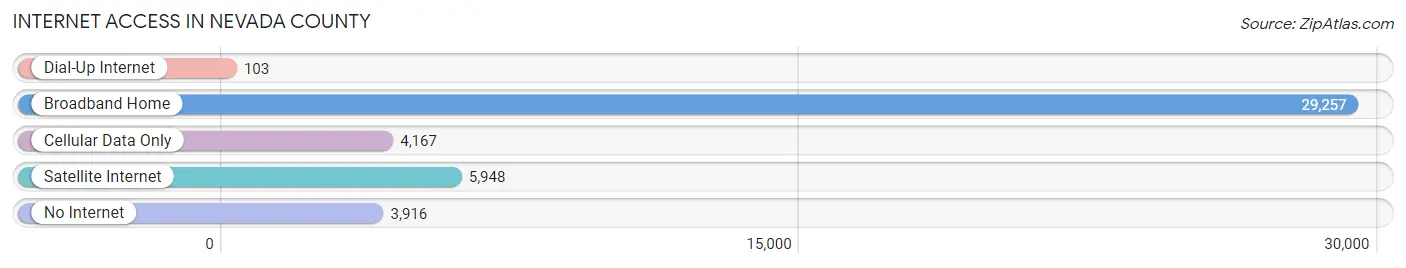
| Internet Type | # Households | % Households |
| Dial-Up Internet | 103 | 0.3% |
| Broadband Home | 29,257 | 70.6% |
| Cellular Data Only | 4,167 | 10.1% |
| Satellite Internet | 5,948 | 14.4% |
| No Internet | 3,916 | 9.5% |
| Total | 41,415 | 100.0% |
Nevada County Summary
Nevada County is located in the Sierra Nevada foothills of California, and is part of the greater Sacramento metropolitan area. It is bordered by Placer County to the north, Yuba County to the east, and Sierra County to the south. The county seat is Nevada City, and the largest city is Grass Valley. The population of Nevada County was 98,764 in the 2010 census, making it the fourth most populous county in California.
History
The area that is now Nevada County was originally inhabited by the Maidu and Nisenan Native American tribes. The first European settlers arrived in the area in the early 1850s, and the county was officially established in 1851. The county was named after the Nevada City Mining District, which was named after the Sierra Nevada mountain range.
The county experienced a gold rush in the mid-1800s, and many of the towns in the county were established during this time. The county was also home to several stagecoach lines, which connected the towns to the rest of the state.
Geography
Nevada County is located in the Sierra Nevada foothills of California, and is part of the greater Sacramento metropolitan area. It is bordered by Placer County to the north, Yuba County to the east, and Sierra County to the south. The county covers an area of 1,502 square miles, and is home to several mountain ranges, including the Sierra Nevada, the Sutter Buttes, and the Yuba-Sutter Hills. The highest point in the county is White Rock Peak, which has an elevation of 8,721 feet.
The county is home to several rivers and streams, including the Bear River, the Yuba River, and the South Yuba River. The county also contains several reservoirs, including Rollins Reservoir, Scotts Flat Reservoir, and Englebright Lake.
Economy
The economy of Nevada County is largely based on agriculture, tourism, and the service industry. The county is home to several wineries, and is a popular destination for wine tasting. The county is also home to several ski resorts, which attract visitors from all over the state.
The county is home to several large employers, including Sierra Nevada Brewing Company, Sierra Pacific Industries, and the Nevada County Fairgrounds. The county is also home to several technology companies, including Grass Valley Group, which produces video and audio equipment.
Demographics
As of the 2010 census, the population of Nevada County was 98,764. The racial makeup of the county was 87.3% White, 0.7% African American, 1.2% Native American, 1.7% Asian, 0.2% Pacific Islander, 6.2% from other races, and 3.0% from two or more races. Hispanic or Latino of any race were 13.3% of the population.
The median income for a household in the county was $50,845, and the median income for a family was $60,845. The per capita income for the county was $27,845. About 11.2% of the population was below the poverty line.
Common Questions
What is Per Capita Income in Nevada County?
Per Capita income in Nevada County is $46,706.
What is the Median Family Income in Nevada County?
Median Family Income in Nevada County is $100,889.
What is the Median Household income in Nevada County?
Median Household Income in Nevada County is $79,395.
What is Income or Wage Gap in Nevada County?
Income or Wage Gap in Nevada County is 29.3%.
Women in Nevada County earn 70.7 cents for every dollar earned by a man.
What is Family Income Deficit in Nevada County?
Family Income Deficit in Nevada County is $9,542.
Families that are below poverty line in Nevada County earn $9,542 less on average than the poverty threshold level.
What is Inequality or Gini Index in Nevada County?
Inequality or Gini Index in Nevada County is 0.47.
What is the Total Population of Nevada County?
Total Population of Nevada County is 102,322.
What is the Total Male Population of Nevada County?
Total Male Population of Nevada County is 50,630.
What is the Total Female Population of Nevada County?
Total Female Population of Nevada County is 51,692.
What is the Ratio of Males per 100 Females in Nevada County?
There are 97.95 Males per 100 Females in Nevada County.
What is the Ratio of Females per 100 Males in Nevada County?
There are 102.10 Females per 100 Males in Nevada County.
What is the Median Population Age in Nevada County?
Median Population Age in Nevada County is 50.2 Years.
What is the Average Family Size in Nevada County
Average Family Size in Nevada County is 2.9 People.
What is the Average Household Size in Nevada County
Average Household Size in Nevada County is 2.4 People.
How Large is the Labor Force in Nevada County?
There are 47,312 People in the Labor Forcein in Nevada County.
What is the Percentage of People in the Labor Force in Nevada County?
54.4% of People are in the Labor Force in Nevada County.
What is the Unemployment Rate in Nevada County?
Unemployment Rate in Nevada County is 4.4%.