Napa County, CA Map & Demographics
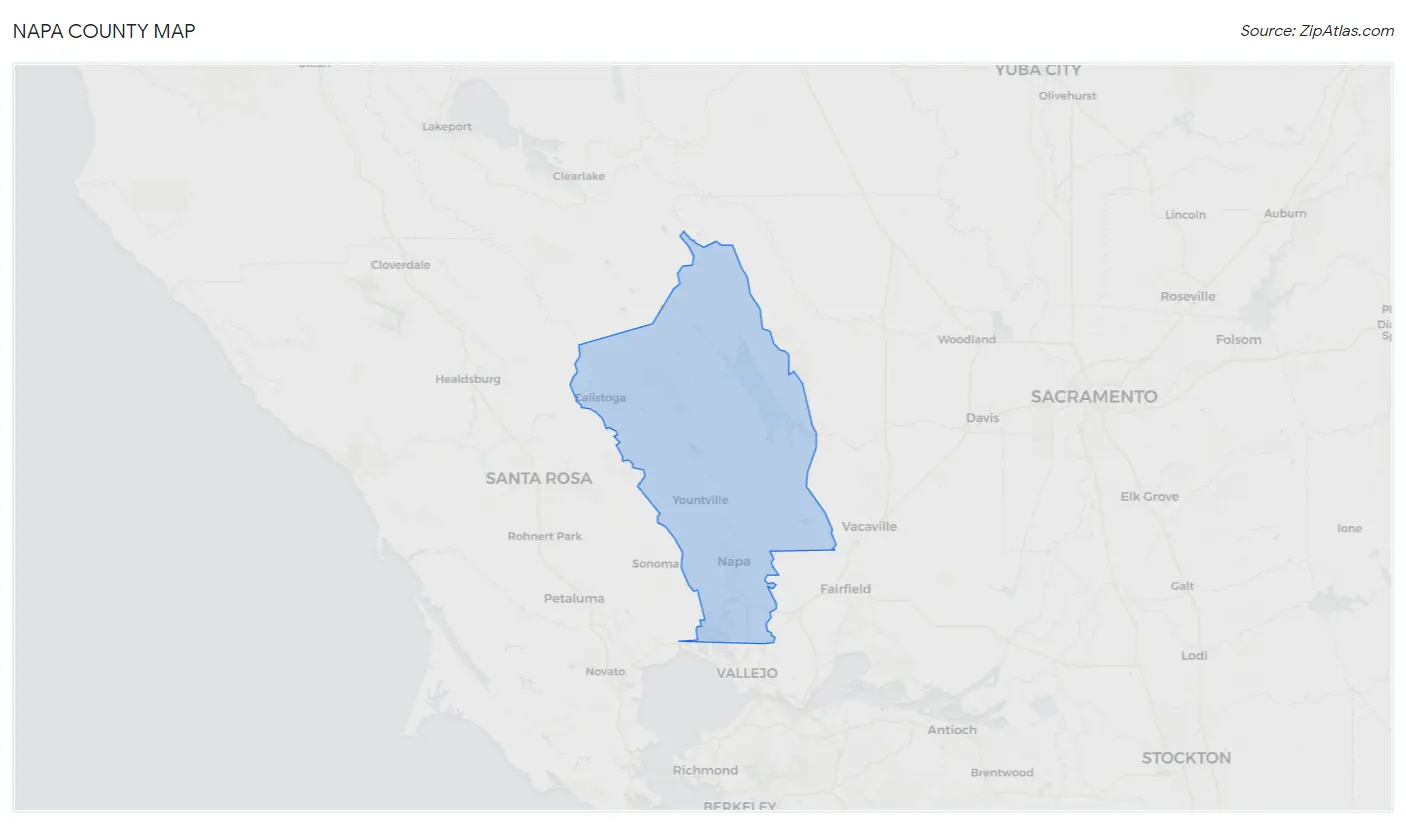
Napa County Map
Napa County Overview
$54,306
PER CAPITA INCOME
$122,540
AVG FAMILY INCOME
$105,809
AVG HOUSEHOLD INCOME
17.4%
WAGE / INCOME GAP [ % ]
82.6¢/ $1
WAGE / INCOME GAP [ $ ]
$9,565
FAMILY INCOME DEFICIT
0.48
INEQUALITY / GINI INDEX
137,384
TOTAL POPULATION
68,760
MALE POPULATION
68,624
FEMALE POPULATION
100.20
MALES / 100 FEMALES
99.80
FEMALES / 100 MALES
42.5
MEDIAN AGE
3.3
AVG FAMILY SIZE
2.7
AVG HOUSEHOLD SIZE
72,160
LABOR FORCE [ PEOPLE ]
63.4%
PERCENT IN LABOR FORCE
5.2%
UNEMPLOYMENT RATE
Napa County Area Codes
Income in Napa County
Income Overview in Napa County
Per Capita Income in Napa County is $54,306, while median incomes of families and households are $122,540 and $105,809 respectively.
| Characteristic | Number | Measure |
| Per Capita Income | 137,384 | $54,306 |
| Median Family Income | 33,163 | $122,540 |
| Mean Family Income | 33,163 | $166,723 |
| Median Household Income | 49,218 | $105,809 |
| Mean Household Income | 49,218 | $146,888 |
| Income Deficit | 33,163 | $9,565 |
| Wage / Income Gap (%) | 137,384 | 17.44% |
| Wage / Income Gap ($) | 137,384 | 82.56¢ per $1 |
| Gini / Inequality Index | 137,384 | 0.48 |
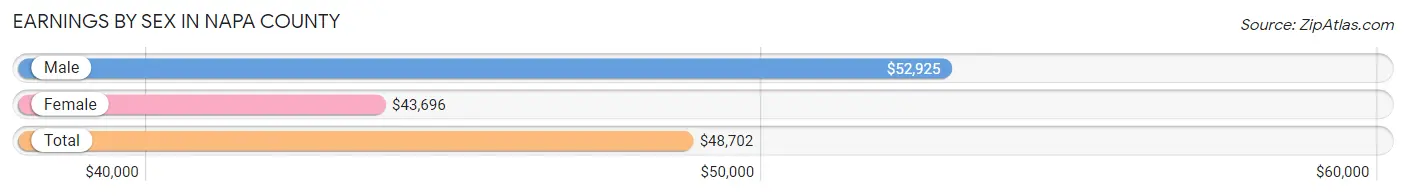
Earnings by Sex in Napa County
Average Earnings in Napa County are $48,702, $52,925 for men and $43,696 for women, a difference of 17.4%.
| Sex | Number | Average Earnings |
| Male | 40,038 (53.5%) | $52,925 |
| Female | 34,782 (46.5%) | $43,696 |
| Total | 74,820 (100.0%) | $48,702 |
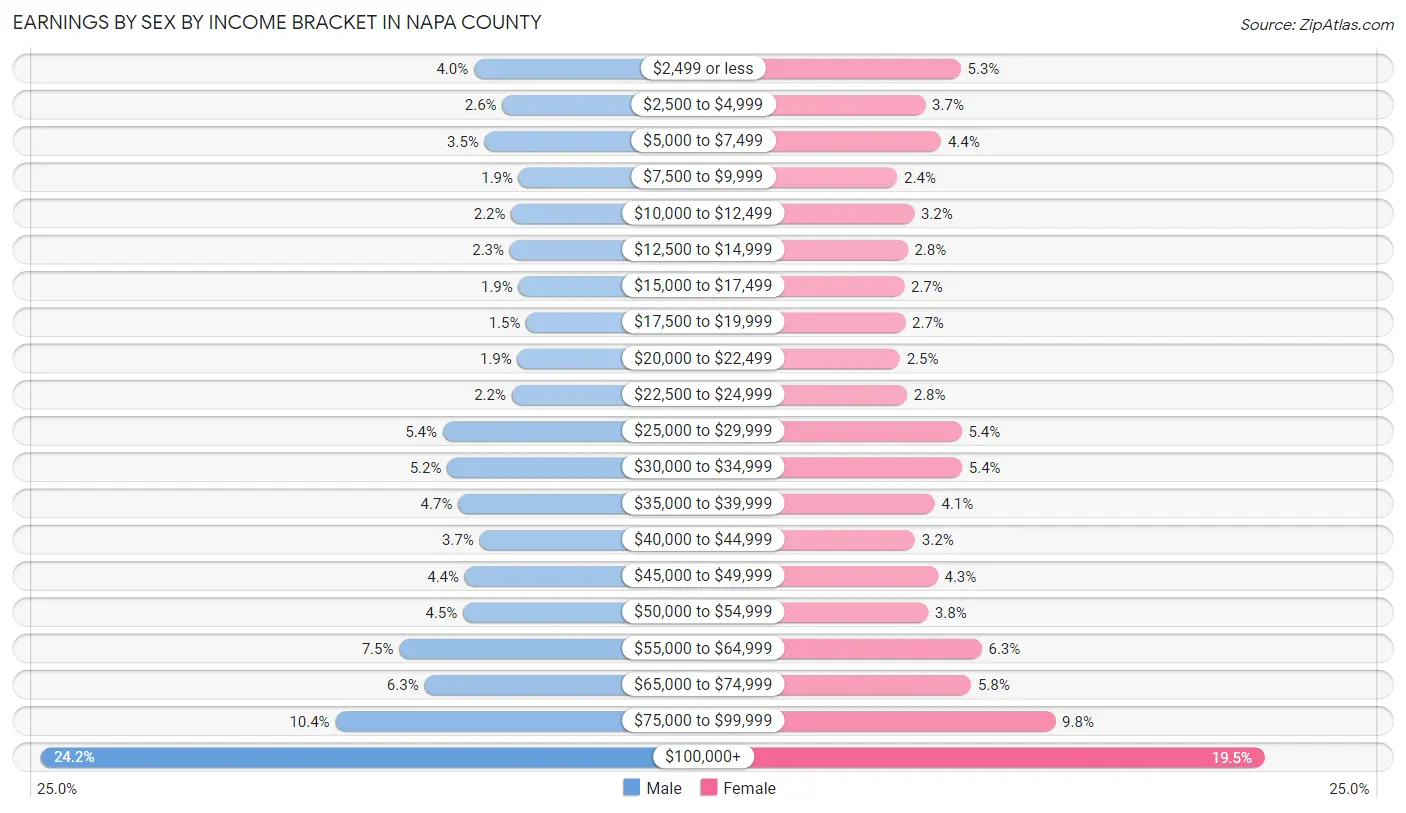
Earnings by Sex by Income Bracket in Napa County
The most common earnings brackets in Napa County are $100,000+ for men (9,701 | 24.2%) and $100,000+ for women (6,793 | 19.5%).
| Income | Male | Female |
| $2,499 or less | 1,583 (4.0%) | 1,854 (5.3%) |
| $2,500 to $4,999 | 1,048 (2.6%) | 1,277 (3.7%) |
| $5,000 to $7,499 | 1,381 (3.5%) | 1,533 (4.4%) |
| $7,500 to $9,999 | 739 (1.8%) | 822 (2.4%) |
| $10,000 to $12,499 | 881 (2.2%) | 1,097 (3.2%) |
| $12,500 to $14,999 | 909 (2.3%) | 987 (2.8%) |
| $15,000 to $17,499 | 745 (1.9%) | 932 (2.7%) |
| $17,500 to $19,999 | 602 (1.5%) | 948 (2.7%) |
| $20,000 to $22,499 | 766 (1.9%) | 861 (2.5%) |
| $22,500 to $24,999 | 874 (2.2%) | 978 (2.8%) |
| $25,000 to $29,999 | 2,165 (5.4%) | 1,868 (5.4%) |
| $30,000 to $34,999 | 2,081 (5.2%) | 1,875 (5.4%) |
| $35,000 to $39,999 | 1,879 (4.7%) | 1,431 (4.1%) |
| $40,000 to $44,999 | 1,477 (3.7%) | 1,110 (3.2%) |
| $45,000 to $49,999 | 1,752 (4.4%) | 1,478 (4.3%) |
| $50,000 to $54,999 | 1,786 (4.5%) | 1,323 (3.8%) |
| $55,000 to $64,999 | 2,981 (7.4%) | 2,195 (6.3%) |
| $65,000 to $74,999 | 2,510 (6.3%) | 2,025 (5.8%) |
| $75,000 to $99,999 | 4,178 (10.4%) | 3,395 (9.8%) |
| $100,000+ | 9,701 (24.2%) | 6,793 (19.5%) |
| Total | 40,038 (100.0%) | 34,782 (100.0%) |
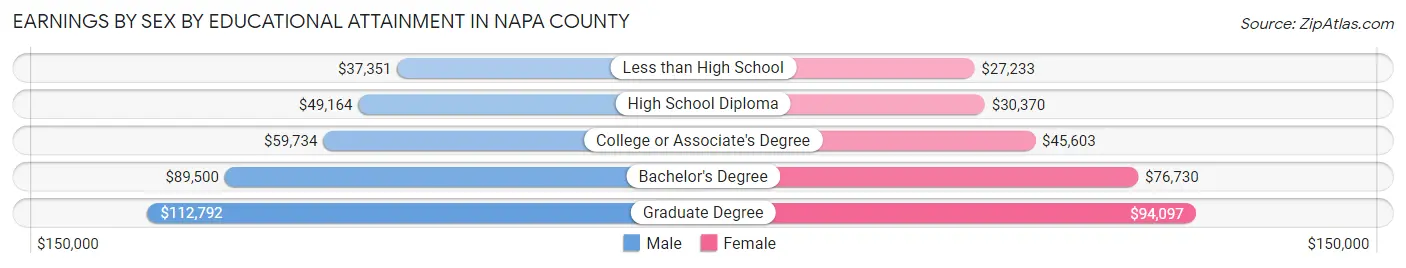
Earnings by Sex by Educational Attainment in Napa County
Average earnings in Napa County are $58,983 for men and $52,363 for women, a difference of 11.2%. Men with an educational attainment of graduate degree enjoy the highest average annual earnings of $112,792, while those with less than high school education earn the least with $37,351. Women with an educational attainment of graduate degree earn the most with the average annual earnings of $94,097, while those with less than high school education have the smallest earnings of $27,233.
| Educational Attainment | Male Income | Female Income |
| Less than High School | $37,351 | $27,233 |
| High School Diploma | $49,164 | $30,370 |
| College or Associate's Degree | $59,734 | $45,603 |
| Bachelor's Degree | $89,500 | $76,730 |
| Graduate Degree | $112,792 | $94,097 |
| Total | $58,983 | $52,363 |
Family Income in Napa County
Family Income Brackets in Napa County
According to the Napa County family income data, there are 8,092 families falling into the $200,000+ income range, which is the most common income bracket and makes up 24.4% of all families. Conversely, the $10,000 to $14,999 income bracket is the least frequent group with only 398 families (1.2%) belonging to this category.
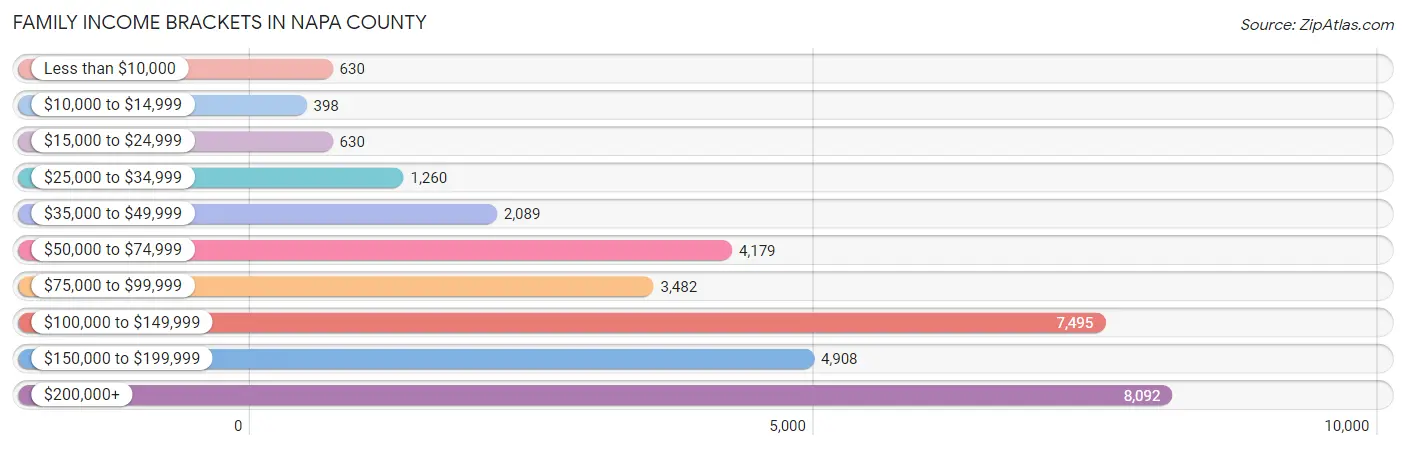
| Income Bracket | # Families | % Families |
| Less than $10,000 | 630 | 1.9% |
| $10,000 to $14,999 | 398 | 1.2% |
| $15,000 to $24,999 | 630 | 1.9% |
| $25,000 to $34,999 | 1,260 | 3.8% |
| $35,000 to $49,999 | 2,089 | 6.3% |
| $50,000 to $74,999 | 4,179 | 12.6% |
| $75,000 to $99,999 | 3,482 | 10.5% |
| $100,000 to $149,999 | 7,495 | 22.6% |
| $150,000 to $199,999 | 4,908 | 14.8% |
| $200,000+ | 8,092 | 24.4% |
Family Income by Famaliy Size in Napa County
7+ person families (853 | 2.6%) account for the highest median family income in Napa County with $177,750 per family, while 2-person families (15,522 | 46.8%) have the highest median income of $57,613 per family member.
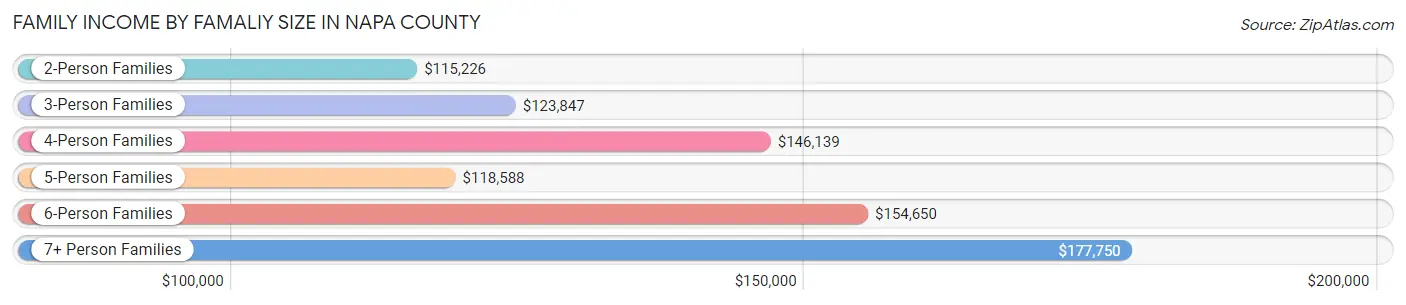
| Income Bracket | # Families | Median Income |
| 2-Person Families | 15,522 (46.8%) | $115,226 |
| 3-Person Families | 6,409 (19.3%) | $123,847 |
| 4-Person Families | 6,072 (18.3%) | $146,139 |
| 5-Person Families | 3,208 (9.7%) | $118,588 |
| 6-Person Families | 1,099 (3.3%) | $154,650 |
| 7+ Person Families | 853 (2.6%) | $177,750 |
| Total | 33,163 (100.0%) | $122,540 |
Family Income by Number of Earners in Napa County
The median family income in Napa County is $122,540, with families comprising 3+ earners (5,054) having the highest median family income of $156,354, while families with no earners (4,556) have the lowest median family income of $87,170, accounting for 15.2% and 13.7% of families, respectively.
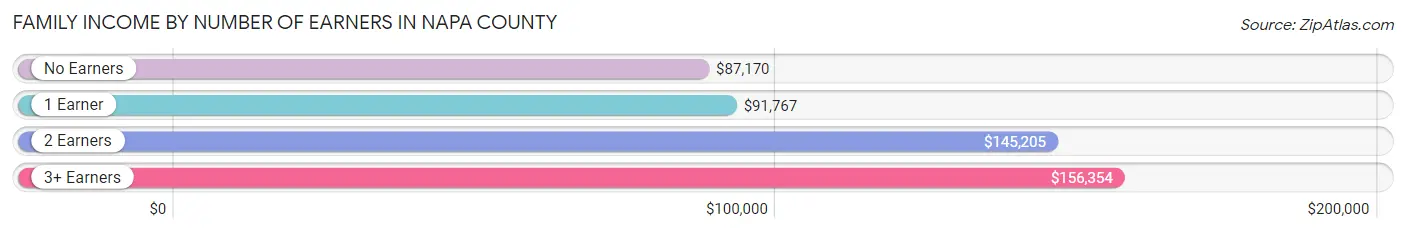
| Number of Earners | # Families | Median Income |
| No Earners | 4,556 (13.7%) | $87,170 |
| 1 Earner | 9,991 (30.1%) | $91,767 |
| 2 Earners | 13,562 (40.9%) | $145,205 |
| 3+ Earners | 5,054 (15.2%) | $156,354 |
| Total | 33,163 (100.0%) | $122,540 |
Household Income in Napa County
Household Income Brackets in Napa County
With 10,139 households falling in the category, the $200,000+ income range is the most frequent in Napa County, accounting for 20.6% of all households. In contrast, only 1,132 households (2.3%) fall into the $10,000 to $14,999 income bracket, making it the least populous group.
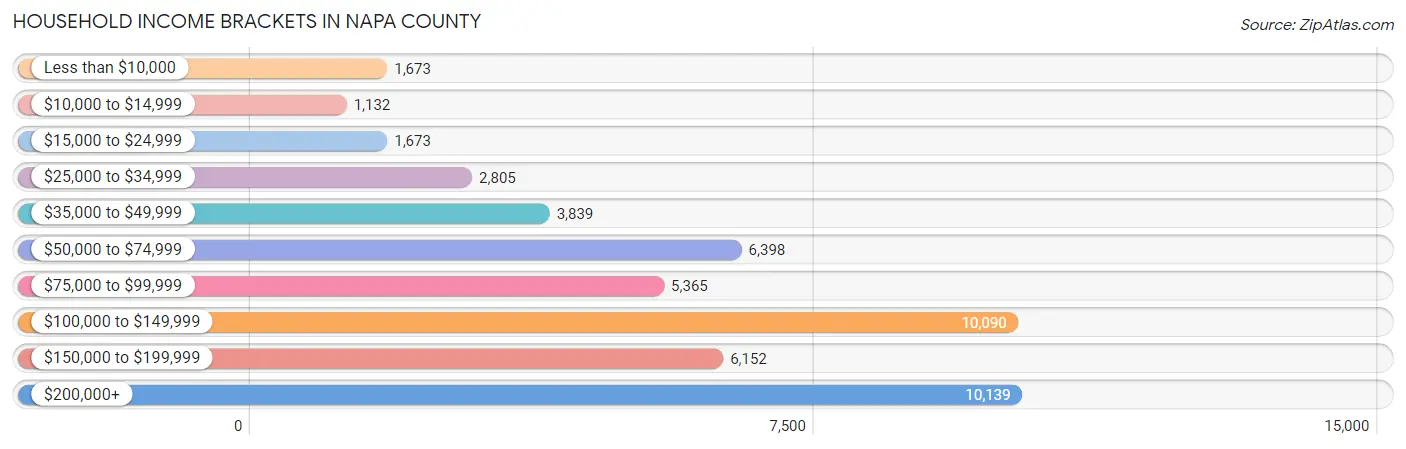
| Income Bracket | # Households | % Households |
| Less than $10,000 | 1,673 | 3.4% |
| $10,000 to $14,999 | 1,132 | 2.3% |
| $15,000 to $24,999 | 1,673 | 3.4% |
| $25,000 to $34,999 | 2,805 | 5.7% |
| $35,000 to $49,999 | 3,839 | 7.8% |
| $50,000 to $74,999 | 6,398 | 13.0% |
| $75,000 to $99,999 | 5,365 | 10.9% |
| $100,000 to $149,999 | 10,090 | 20.5% |
| $150,000 to $199,999 | 6,152 | 12.5% |
| $200,000+ | 10,139 | 20.6% |
Household Income by Householder Age in Napa County
The median household income in Napa County is $105,809, with the highest median household income of $125,816 found in the 45 to 64 years age bracket for the primary householder. A total of 18,496 households (37.6%) fall into this category. Meanwhile, the 15 to 24 years age bracket for the primary householder has the lowest median household income of $60,362, with 777 households (1.6%) in this group.
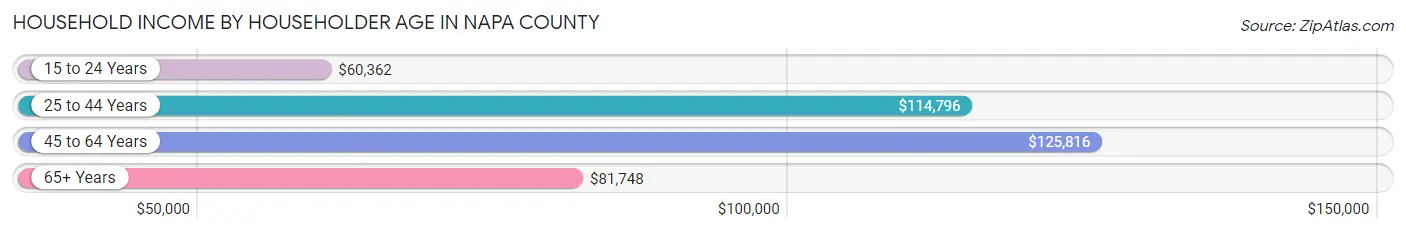
| Income Bracket | # Households | Median Income |
| 15 to 24 Years | 777 (1.6%) | $60,362 |
| 25 to 44 Years | 13,773 (28.0%) | $114,796 |
| 45 to 64 Years | 18,496 (37.6%) | $125,816 |
| 65+ Years | 16,172 (32.9%) | $81,748 |
| Total | 49,218 (100.0%) | $105,809 |
Poverty in Napa County
Income Below Poverty by Sex and Age in Napa County
With 7.4% poverty level for males and 8.3% for females among the residents of Napa County, 5 year old males and 15 year old females are the most vulnerable to poverty, with 101 males (13.7%) and 107 females (13.8%) in their respective age groups living below the poverty level.
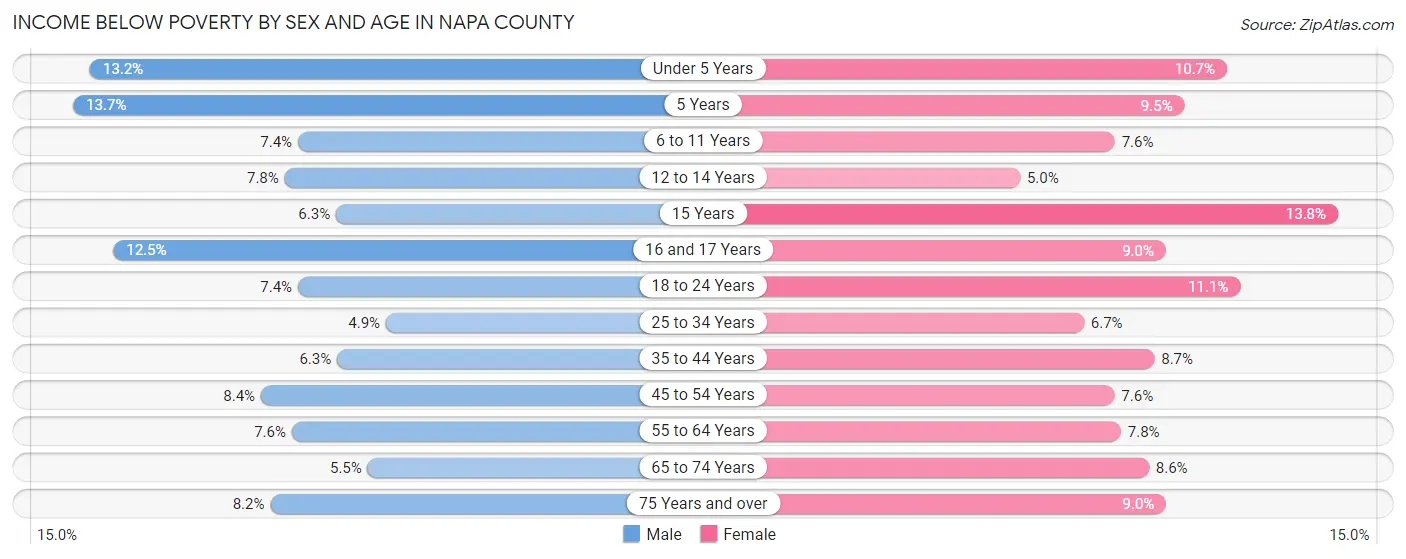
| Age Bracket | Male | Female |
| Under 5 Years | 423 (13.2%) | 330 (10.7%) |
| 5 Years | 101 (13.7%) | 54 (9.5%) |
| 6 to 11 Years | 337 (7.4%) | 293 (7.6%) |
| 12 to 14 Years | 206 (7.8%) | 150 (5.0%) |
| 15 Years | 49 (6.3%) | 107 (13.8%) |
| 16 and 17 Years | 252 (12.5%) | 164 (9.0%) |
| 18 to 24 Years | 405 (7.4%) | 582 (11.1%) |
| 25 to 34 Years | 414 (4.9%) | 550 (6.7%) |
| 35 to 44 Years | 567 (6.3%) | 742 (8.7%) |
| 45 to 54 Years | 746 (8.4%) | 662 (7.6%) |
| 55 to 64 Years | 694 (7.6%) | 715 (7.8%) |
| 65 to 74 Years | 398 (5.4%) | 677 (8.6%) |
| 75 Years and over | 430 (8.2%) | 572 (9.0%) |
| Total | 5,022 (7.4%) | 5,598 (8.3%) |
Income Above Poverty by Sex and Age in Napa County
According to the poverty statistics in Napa County, males aged 25 to 34 years and females aged 12 to 14 years are the age groups that are most secure financially, with 95.1% of males and 95.0% of females in these age groups living above the poverty line.
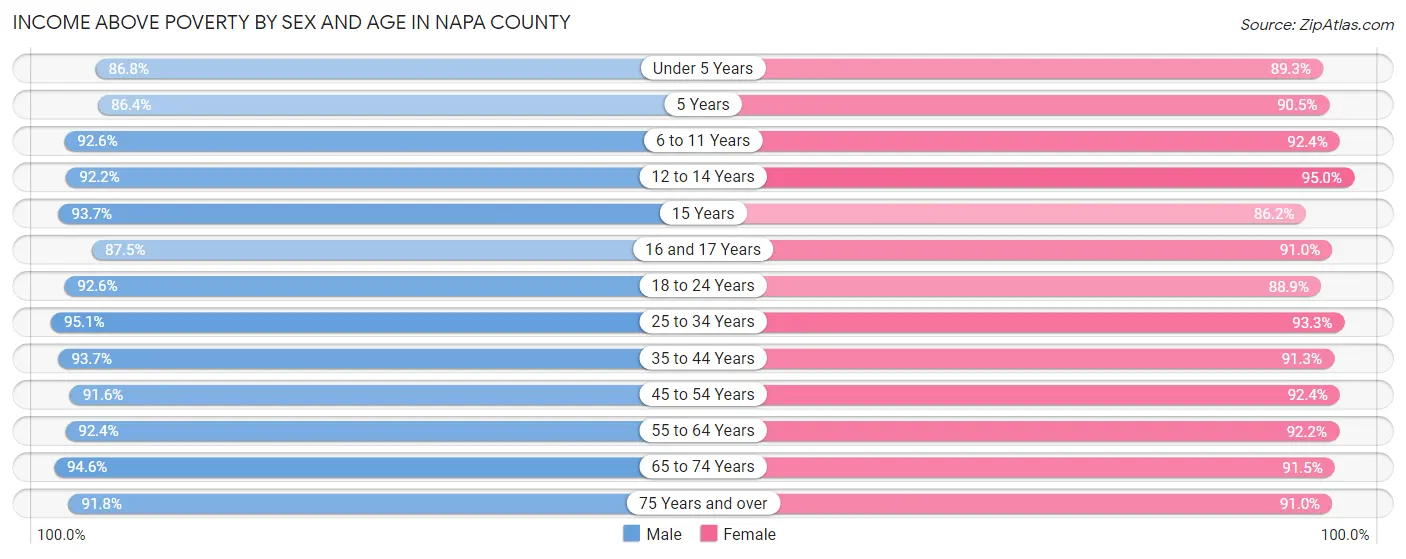
| Age Bracket | Male | Female |
| Under 5 Years | 2,787 (86.8%) | 2,747 (89.3%) |
| 5 Years | 639 (86.4%) | 512 (90.5%) |
| 6 to 11 Years | 4,223 (92.6%) | 3,560 (92.4%) |
| 12 to 14 Years | 2,450 (92.2%) | 2,877 (95.0%) |
| 15 Years | 725 (93.7%) | 668 (86.2%) |
| 16 and 17 Years | 1,759 (87.5%) | 1,654 (91.0%) |
| 18 to 24 Years | 5,078 (92.6%) | 4,668 (88.9%) |
| 25 to 34 Years | 7,966 (95.1%) | 7,614 (93.3%) |
| 35 to 44 Years | 8,440 (93.7%) | 7,782 (91.3%) |
| 45 to 54 Years | 8,109 (91.6%) | 8,056 (92.4%) |
| 55 to 64 Years | 8,490 (92.4%) | 8,486 (92.2%) |
| 65 to 74 Years | 6,900 (94.6%) | 7,239 (91.4%) |
| 75 Years and over | 4,841 (91.8%) | 5,759 (91.0%) |
| Total | 62,407 (92.5%) | 61,622 (91.7%) |
Income Below Poverty Among Married-Couple Families in Napa County
The poverty statistics for married-couple families in Napa County show that 3.5% or 894 of the total 25,796 families live below the poverty line. Families with 5 or more children have the highest poverty rate of 12.4%, comprising of 12 families. On the other hand, families with 1 or 2 children have the lowest poverty rate of 3.2%, which includes 279 families.
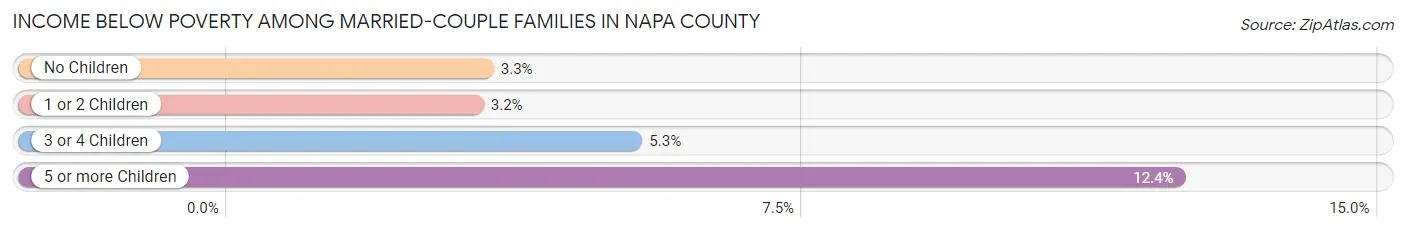
| Children | Above Poverty | Below Poverty |
| No Children | 14,659 (96.7%) | 506 (3.3%) |
| 1 or 2 Children | 8,419 (96.8%) | 279 (3.2%) |
| 3 or 4 Children | 1,739 (94.7%) | 97 (5.3%) |
| 5 or more Children | 85 (87.6%) | 12 (12.4%) |
| Total | 24,902 (96.5%) | 894 (3.5%) |
Income Below Poverty Among Single-Parent Households in Napa County
According to the poverty data in Napa County, 8.2% or 205 single-father households and 13.7% or 664 single-mother households are living below the poverty line. Among single-father households, those with 3 or 4 children have the highest poverty rate, with 32 households (20.8%) experiencing poverty. Likewise, among single-mother households, those with 3 or 4 children have the highest poverty rate, with 102 households (26.6%) falling below the poverty line.
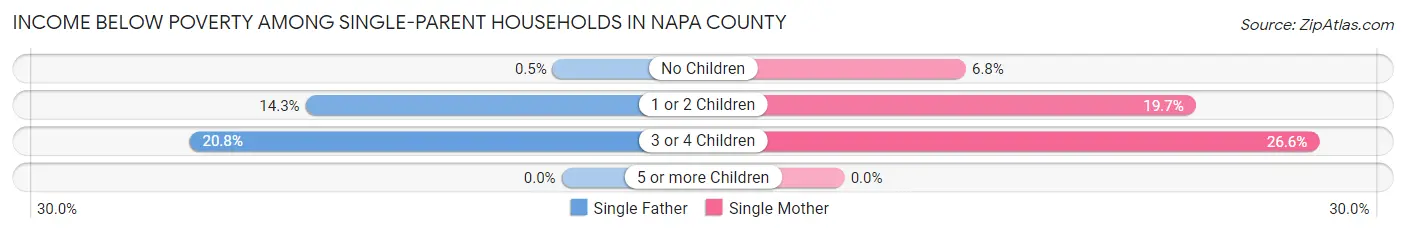
| Children | Single Father | Single Mother |
| No Children | 6 (0.5%) | 159 (6.8%) |
| 1 or 2 Children | 167 (14.3%) | 403 (19.7%) |
| 3 or 4 Children | 32 (20.8%) | 102 (26.6%) |
| 5 or more Children | 0 (0.0%) | 0 (0.0%) |
| Total | 205 (8.2%) | 664 (13.7%) |
Income Below Poverty Among Married-Couple vs Single-Parent Households in Napa County
The poverty data for Napa County shows that 894 of the married-couple family households (3.5%) and 869 of the single-parent households (11.8%) are living below the poverty level. Within the married-couple family households, those with 5 or more children have the highest poverty rate, with 12 households (12.4%) falling below the poverty line. Among the single-parent households, those with 3 or 4 children have the highest poverty rate, with 134 household (24.9%) living below poverty.
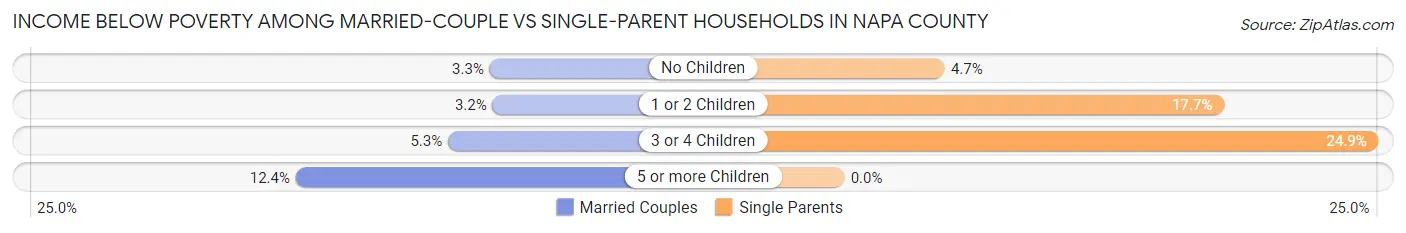
| Children | Married-Couple Families | Single-Parent Households |
| No Children | 506 (3.3%) | 165 (4.7%) |
| 1 or 2 Children | 279 (3.2%) | 570 (17.7%) |
| 3 or 4 Children | 97 (5.3%) | 134 (24.9%) |
| 5 or more Children | 12 (12.4%) | 0 (0.0%) |
| Total | 894 (3.5%) | 869 (11.8%) |
Race in Napa County
The most populous races in Napa County are White / Caucasian (87,333 | 63.6%), Hispanic or Latino (48,182 | 35.1%), and Some other Race (18,725 | 13.6%).
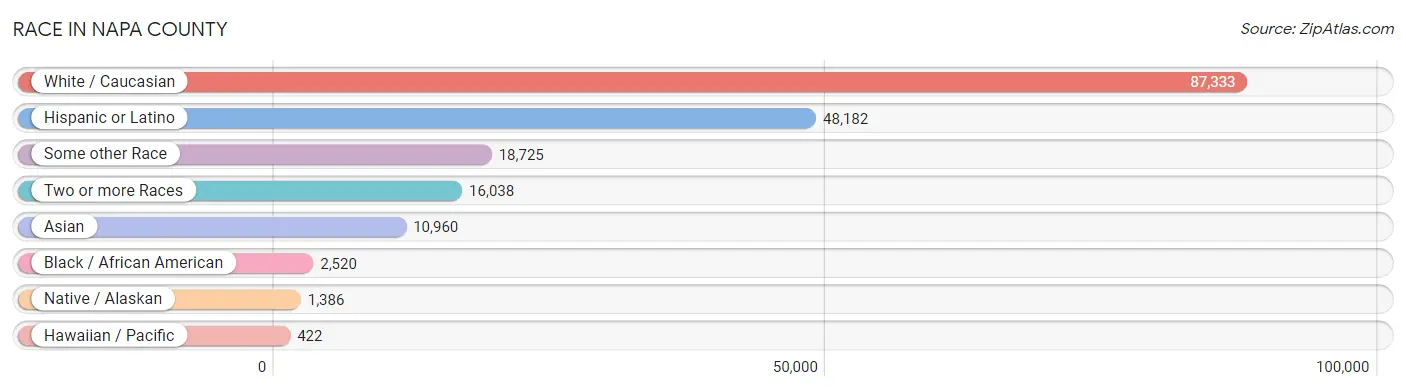
| Race | # Population | % Population |
| Asian | 10,960 | 8.0% |
| Black / African American | 2,520 | 1.8% |
| Hawaiian / Pacific | 422 | 0.3% |
| Hispanic or Latino | 48,182 | 35.1% |
| Native / Alaskan | 1,386 | 1.0% |
| White / Caucasian | 87,333 | 63.6% |
| Two or more Races | 16,038 | 11.7% |
| Some other Race | 18,725 | 13.6% |
| Total | 137,384 | 100.0% |
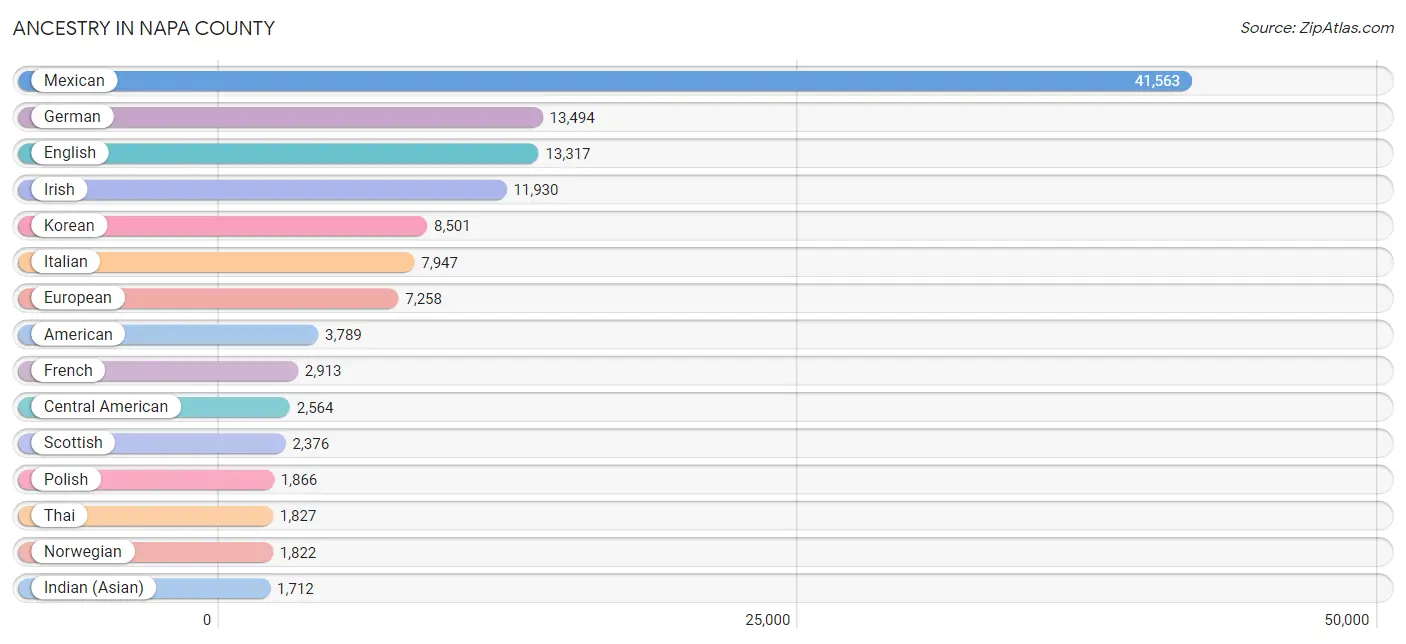
Ancestry in Napa County
The most populous ancestries reported in Napa County are Mexican (41,563 | 30.2%), German (13,494 | 9.8%), English (13,317 | 9.7%), Irish (11,930 | 8.7%), and Korean (8,501 | 6.2%), together accounting for 64.6% of all Napa County residents.
| Ancestry | # Population | % Population |
| African | 131 | 0.1% |
| Alaska Native | 27 | 0.0% |
| Alaskan Athabascan | 6 | 0.0% |
| Alsatian | 14 | 0.0% |
| American | 3,789 | 2.8% |
| Apache | 221 | 0.2% |
| Arab | 442 | 0.3% |
| Argentinean | 75 | 0.1% |
| Armenian | 221 | 0.2% |
| Assyrian / Chaldean / Syriac | 126 | 0.1% |
| Australian | 117 | 0.1% |
| Austrian | 211 | 0.2% |
| Bangladeshi | 67 | 0.1% |
| Basque | 117 | 0.1% |
| Belgian | 74 | 0.1% |
| Bermudan | 20 | 0.0% |
| Bhutanese | 1,063 | 0.8% |
| Blackfeet | 87 | 0.1% |
| Brazilian | 45 | 0.0% |
| British | 1,051 | 0.8% |
| British West Indian | 3 | 0.0% |
| Burmese | 488 | 0.4% |
| Canadian | 596 | 0.4% |
| Cape Verdean | 103 | 0.1% |
| Celtic | 34 | 0.0% |
| Central American | 2,564 | 1.9% |
| Central American Indian | 306 | 0.2% |
| Cherokee | 392 | 0.3% |
| Cheyenne | 10 | 0.0% |
| Chickasaw | 28 | 0.0% |
| Chilean | 82 | 0.1% |
| Choctaw | 374 | 0.3% |
| Colombian | 164 | 0.1% |
| Costa Rican | 16 | 0.0% |
| Cree | 16 | 0.0% |
| Croatian | 96 | 0.1% |
| Cuban | 223 | 0.2% |
| Czech | 470 | 0.3% |
| Czechoslovakian | 73 | 0.1% |
| Danish | 1,038 | 0.8% |
| Dominican | 27 | 0.0% |
| Dutch | 1,100 | 0.8% |
| Eastern European | 472 | 0.3% |
| Ecuadorian | 12 | 0.0% |
| Egyptian | 11 | 0.0% |
| English | 13,317 | 9.7% |
| Estonian | 27 | 0.0% |
| Ethiopian | 24 | 0.0% |
| European | 7,258 | 5.3% |
| Filipino | 69 | 0.1% |
| Finnish | 271 | 0.2% |
| French | 2,913 | 2.1% |
| French Canadian | 628 | 0.5% |
| German | 13,494 | 9.8% |
| Ghanaian | 14 | 0.0% |
| Greek | 439 | 0.3% |
| Guamanian / Chamorro | 65 | 0.1% |
| Guatemalan | 1,327 | 1.0% |
| Guyanese | 15 | 0.0% |
| Honduran | 13 | 0.0% |
| Hungarian | 337 | 0.3% |
| Indian (Asian) | 1,712 | 1.3% |
| Indonesian | 18 | 0.0% |
| Iranian | 234 | 0.2% |
| Iraqi | 5 | 0.0% |
| Irish | 11,930 | 8.7% |
| Iroquois | 14 | 0.0% |
| Israeli | 56 | 0.0% |
| Italian | 7,947 | 5.8% |
| Jamaican | 223 | 0.2% |
| Japanese | 11 | 0.0% |
| Jordanian | 34 | 0.0% |
| Korean | 8,501 | 6.2% |
| Laotian | 135 | 0.1% |
| Latvian | 14 | 0.0% |
| Lebanese | 163 | 0.1% |
| Lithuanian | 185 | 0.1% |
| Macedonian | 28 | 0.0% |
| Malaysian | 6 | 0.0% |
| Maltese | 32 | 0.0% |
| Mexican | 41,563 | 30.2% |
| Mexican American Indian | 982 | 0.7% |
| Mongolian | 8 | 0.0% |
| Moroccan | 8 | 0.0% |
| Native Hawaiian | 444 | 0.3% |
| Navajo | 31 | 0.0% |
| New Zealander | 14 | 0.0% |
| Nicaraguan | 122 | 0.1% |
| Nigerian | 56 | 0.0% |
| Northern European | 575 | 0.4% |
| Norwegian | 1,822 | 1.3% |
| Pakistani | 76 | 0.1% |
| Palestinian | 35 | 0.0% |
| Panamanian | 118 | 0.1% |
| Pennsylvania German | 12 | 0.0% |
| Peruvian | 356 | 0.3% |
| Polish | 1,866 | 1.4% |
| Portuguese | 1,428 | 1.0% |
| Potawatomi | 48 | 0.0% |
| Puerto Rican | 671 | 0.5% |
| Romanian | 101 | 0.1% |
| Russian | 935 | 0.7% |
| Salvadoran | 968 | 0.7% |
| Samoan | 181 | 0.1% |
| Scandinavian | 423 | 0.3% |
| Scotch-Irish | 818 | 0.6% |
| Scottish | 2,376 | 1.7% |
| Serbian | 40 | 0.0% |
| Sioux | 51 | 0.0% |
| Slavic | 21 | 0.0% |
| Slovak | 74 | 0.1% |
| Slovene | 72 | 0.1% |
| South African | 227 | 0.2% |
| South American | 783 | 0.6% |
| South American Indian | 6 | 0.0% |
| Spaniard | 605 | 0.4% |
| Spanish | 841 | 0.6% |
| Sri Lankan | 437 | 0.3% |
| Subsaharan African | 555 | 0.4% |
| Swedish | 1,479 | 1.1% |
| Swiss | 847 | 0.6% |
| Syrian | 43 | 0.0% |
| Thai | 1,827 | 1.3% |
| Tlingit-Haida | 3 | 0.0% |
| Tongan | 28 | 0.0% |
| Turkish | 64 | 0.1% |
| Ukrainian | 218 | 0.2% |
| Uruguayan | 7 | 0.0% |
| Ute | 6 | 0.0% |
| Venezuelan | 69 | 0.1% |
| Welsh | 782 | 0.6% |
| West Indian | 25 | 0.0% |
| Yaqui | 116 | 0.1% |
| Yugoslavian | 41 | 0.0% | View All 134 Rows |
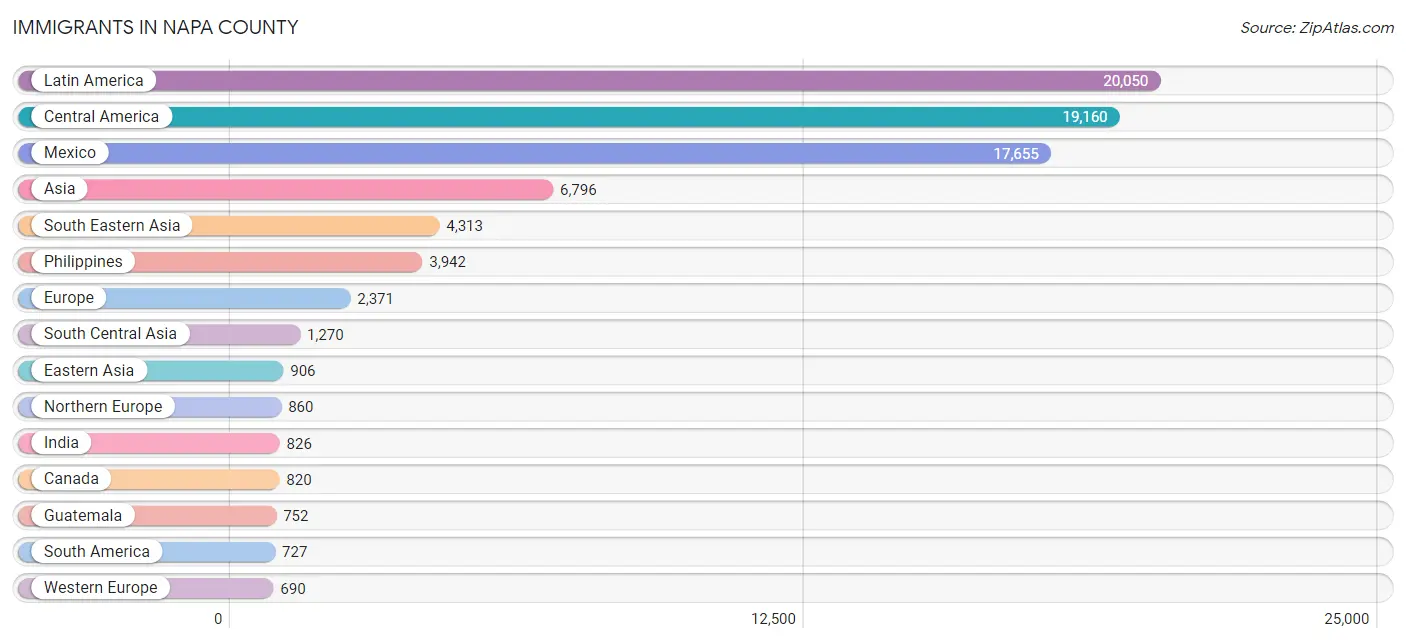
Immigrants in Napa County
The most numerous immigrant groups reported in Napa County came from Latin America (20,050 | 14.6%), Central America (19,160 | 14.0%), Mexico (17,655 | 12.9%), Asia (6,796 | 5.0%), and South Eastern Asia (4,313 | 3.1%), together accounting for 49.5% of all Napa County residents.
| Immigration Origin | # Population | % Population |
| Africa | 223 | 0.2% |
| Argentina | 101 | 0.1% |
| Armenia | 6 | 0.0% |
| Asia | 6,796 | 5.0% |
| Australia | 76 | 0.1% |
| Austria | 8 | 0.0% |
| Azores | 5 | 0.0% |
| Bangladesh | 3 | 0.0% |
| Belarus | 5 | 0.0% |
| Belgium | 9 | 0.0% |
| Bosnia and Herzegovina | 9 | 0.0% |
| Brazil | 208 | 0.2% |
| Bulgaria | 6 | 0.0% |
| Cabo Verde | 25 | 0.0% |
| Cambodia | 11 | 0.0% |
| Cameroon | 15 | 0.0% |
| Canada | 820 | 0.6% |
| Caribbean | 163 | 0.1% |
| Central America | 19,160 | 14.0% |
| Chile | 49 | 0.0% |
| China | 604 | 0.4% |
| Colombia | 84 | 0.1% |
| Costa Rica | 7 | 0.0% |
| Cuba | 27 | 0.0% |
| Czechoslovakia | 30 | 0.0% |
| Denmark | 72 | 0.1% |
| Eastern Africa | 66 | 0.1% |
| Eastern Asia | 906 | 0.7% |
| Eastern Europe | 516 | 0.4% |
| Ecuador | 29 | 0.0% |
| Egypt | 7 | 0.0% |
| El Salvador | 644 | 0.5% |
| England | 353 | 0.3% |
| Eritrea | 7 | 0.0% |
| Europe | 2,371 | 1.7% |
| Fiji | 117 | 0.1% |
| France | 299 | 0.2% |
| Germany | 266 | 0.2% |
| Ghana | 17 | 0.0% |
| Greece | 60 | 0.0% |
| Guatemala | 752 | 0.5% |
| Haiti | 20 | 0.0% |
| Honduras | 22 | 0.0% |
| Hong Kong | 51 | 0.0% |
| Hungary | 125 | 0.1% |
| India | 826 | 0.6% |
| Indonesia | 73 | 0.1% |
| Iran | 213 | 0.2% |
| Iraq | 55 | 0.0% |
| Ireland | 48 | 0.0% |
| Israel | 31 | 0.0% |
| Italy | 103 | 0.1% |
| Jamaica | 116 | 0.1% |
| Japan | 65 | 0.1% |
| Jordan | 34 | 0.0% |
| Kenya | 15 | 0.0% |
| Korea | 237 | 0.2% |
| Latin America | 20,050 | 14.6% |
| Lebanon | 56 | 0.0% |
| Malaysia | 19 | 0.0% |
| Mexico | 17,655 | 12.9% |
| Middle Africa | 18 | 0.0% |
| Moldova | 10 | 0.0% |
| Morocco | 14 | 0.0% |
| Nepal | 181 | 0.1% |
| Netherlands | 9 | 0.0% |
| Nicaragua | 16 | 0.0% |
| Northern Africa | 21 | 0.0% |
| Northern Europe | 860 | 0.6% |
| Oceania | 239 | 0.2% |
| Pakistan | 43 | 0.0% |
| Panama | 64 | 0.1% |
| Peru | 233 | 0.2% |
| Philippines | 3,942 | 2.9% |
| Poland | 79 | 0.1% |
| Portugal | 27 | 0.0% |
| Romania | 76 | 0.1% |
| Russia | 42 | 0.0% |
| Scotland | 31 | 0.0% |
| Serbia | 5 | 0.0% |
| Sierra Leone | 17 | 0.0% |
| Singapore | 9 | 0.0% |
| South Africa | 59 | 0.0% |
| South America | 727 | 0.5% |
| South Central Asia | 1,270 | 0.9% |
| South Eastern Asia | 4,313 | 3.1% |
| Southern Europe | 301 | 0.2% |
| Spain | 111 | 0.1% |
| Sweden | 70 | 0.1% |
| Switzerland | 99 | 0.1% |
| Syria | 17 | 0.0% |
| Taiwan | 200 | 0.2% |
| Thailand | 46 | 0.0% |
| Turkey | 7 | 0.0% |
| Ukraine | 76 | 0.1% |
| Uzbekistan | 4 | 0.0% |
| Venezuela | 18 | 0.0% |
| Vietnam | 184 | 0.1% |
| Western Africa | 59 | 0.0% |
| Western Asia | 288 | 0.2% |
| Western Europe | 690 | 0.5% |
| Yemen | 82 | 0.1% |
| Zimbabwe | 6 | 0.0% | View All 103 Rows |
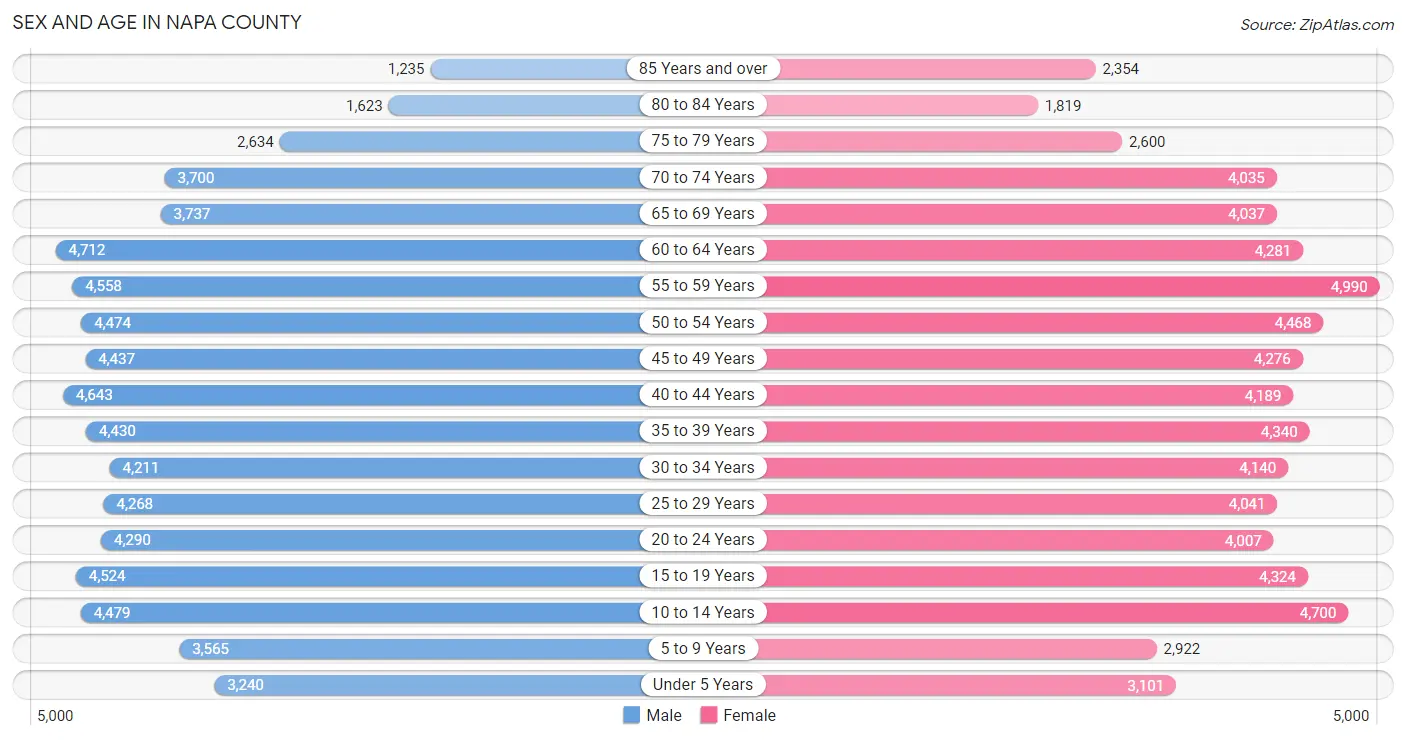
Sex and Age in Napa County
Sex and Age in Napa County
The most populous age groups in Napa County are 60 to 64 Years (4,712 | 6.9%) for men and 55 to 59 Years (4,990 | 7.3%) for women.
| Age Bracket | Male | Female |
| Under 5 Years | 3,240 (4.7%) | 3,101 (4.5%) |
| 5 to 9 Years | 3,565 (5.2%) | 2,922 (4.3%) |
| 10 to 14 Years | 4,479 (6.5%) | 4,700 (6.9%) |
| 15 to 19 Years | 4,524 (6.6%) | 4,324 (6.3%) |
| 20 to 24 Years | 4,290 (6.2%) | 4,007 (5.8%) |
| 25 to 29 Years | 4,268 (6.2%) | 4,041 (5.9%) |
| 30 to 34 Years | 4,211 (6.1%) | 4,140 (6.0%) |
| 35 to 39 Years | 4,430 (6.4%) | 4,340 (6.3%) |
| 40 to 44 Years | 4,643 (6.8%) | 4,189 (6.1%) |
| 45 to 49 Years | 4,437 (6.5%) | 4,276 (6.2%) |
| 50 to 54 Years | 4,474 (6.5%) | 4,468 (6.5%) |
| 55 to 59 Years | 4,558 (6.6%) | 4,990 (7.3%) |
| 60 to 64 Years | 4,712 (6.9%) | 4,281 (6.2%) |
| 65 to 69 Years | 3,737 (5.4%) | 4,037 (5.9%) |
| 70 to 74 Years | 3,700 (5.4%) | 4,035 (5.9%) |
| 75 to 79 Years | 2,634 (3.8%) | 2,600 (3.8%) |
| 80 to 84 Years | 1,623 (2.4%) | 1,819 (2.6%) |
| 85 Years and over | 1,235 (1.8%) | 2,354 (3.4%) |
| Total | 68,760 (100.0%) | 68,624 (100.0%) |
Families and Households in Napa County
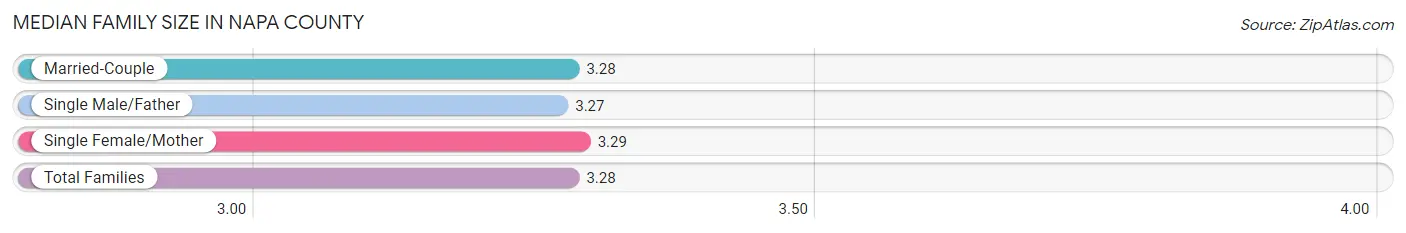
Median Family Size in Napa County
The median family size in Napa County is 3.28 persons per family, with single female/mother families (4,856 | 14.6%) accounting for the largest median family size of 3.29 persons per family. On the other hand, single male/father families (2,511 | 7.6%) represent the smallest median family size with 3.27 persons per family.
| Family Type | # Families | Family Size |
| Married-Couple | 25,796 (77.8%) | 3.28 |
| Single Male/Father | 2,511 (7.6%) | 3.27 |
| Single Female/Mother | 4,856 (14.6%) | 3.29 |
| Total Families | 33,163 (100.0%) | 3.28 |
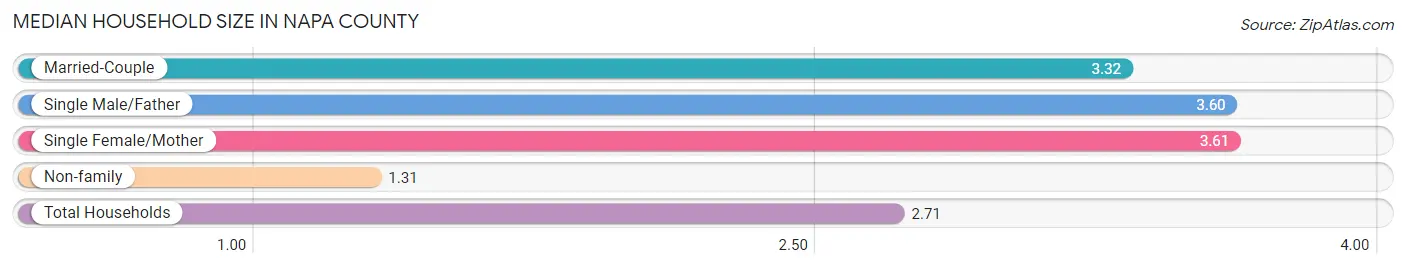
Median Household Size in Napa County
The median household size in Napa County is 2.71 persons per household, with single female/mother households (4,856 | 9.9%) accounting for the largest median household size of 3.61 persons per household. non-family households (16,055 | 32.6%) represent the smallest median household size with 1.31 persons per household.
| Household Type | # Households | Household Size |
| Married-Couple | 25,796 (52.4%) | 3.32 |
| Single Male/Father | 2,511 (5.1%) | 3.60 |
| Single Female/Mother | 4,856 (9.9%) | 3.61 |
| Non-family | 16,055 (32.6%) | 1.31 |
| Total Households | 49,218 (100.0%) | 2.71 |
Household Size by Marriage Status in Napa County
Out of a total of 49,218 households in Napa County, 33,163 (67.4%) are family households, while 16,055 (32.6%) are nonfamily households. The most numerous type of family households are 2-person households, comprising 14,445, and the most common type of nonfamily households are 1-person households, comprising 12,494.
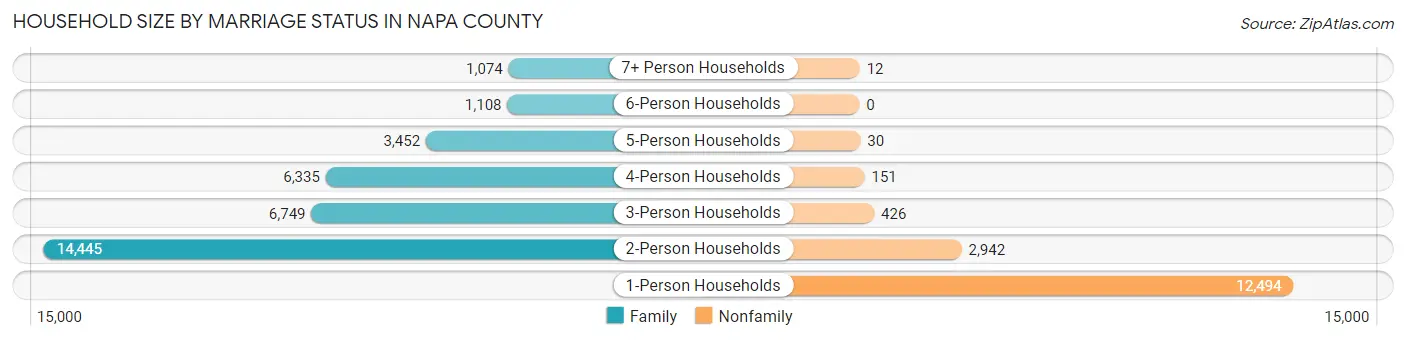
| Household Size | Family Households | Nonfamily Households |
| 1-Person Households | - | 12,494 (25.4%) |
| 2-Person Households | 14,445 (29.3%) | 2,942 (6.0%) |
| 3-Person Households | 6,749 (13.7%) | 426 (0.9%) |
| 4-Person Households | 6,335 (12.9%) | 151 (0.3%) |
| 5-Person Households | 3,452 (7.0%) | 30 (0.1%) |
| 6-Person Households | 1,108 (2.2%) | 0 (0.0%) |
| 7+ Person Households | 1,074 (2.2%) | 12 (0.0%) |
| Total | 33,163 (67.4%) | 16,055 (32.6%) |
Female Fertility in Napa County
Fertility by Age in Napa County
Average fertility rate in Napa County is 47.0 births per 1,000 women. Women in the age bracket of 20 to 34 years have the highest fertility rate with 55.0 births per 1,000 women. Women in the age bracket of 35 to 50 years acount for 52.9% of all women with births.
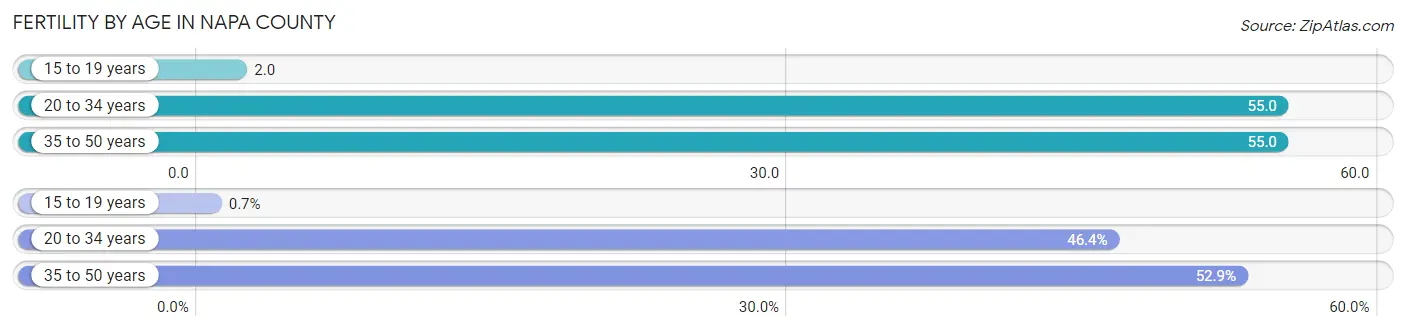
| Age Bracket | Women with Births | Births / 1,000 Women |
| 15 to 19 years | 10 (0.7%) | 2.0 |
| 20 to 34 years | 666 (46.4%) | 55.0 |
| 35 to 50 years | 760 (52.9%) | 55.0 |
| Total | 1,436 (100.0%) | 47.0 |
Fertility by Age by Marriage Status in Napa County
70.1% of women with births (1,436) in Napa County are married. The highest percentage of unmarried women with births falls into 15 to 19 years age bracket with 100.0% of them unmarried at the time of birth, while the lowest percentage of unmarried women with births belong to 35 to 50 years age bracket with 25.0% of them unmarried.
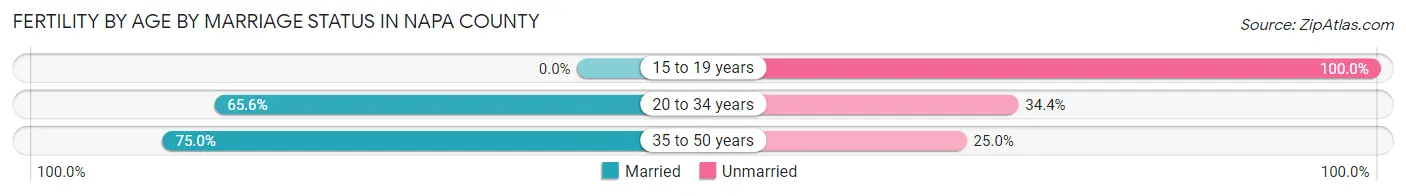
| Age Bracket | Married | Unmarried |
| 15 to 19 years | 0 (0.0%) | 10 (100.0%) |
| 20 to 34 years | 437 (65.6%) | 229 (34.4%) |
| 35 to 50 years | 570 (75.0%) | 190 (25.0%) |
| Total | 1,007 (70.1%) | 429 (29.9%) |
Fertility by Education in Napa County
Average fertility rate in Napa County is 47.0 births per 1,000 women. Women with the education attainment of graduate degree have the highest fertility rate of 89.0 births per 1,000 women, while women with the education attainment of less than high school have the lowest fertility at 25.0 births per 1,000 women. Women with the education attainment of bachelor's degree represent 36.9% of all women with births.
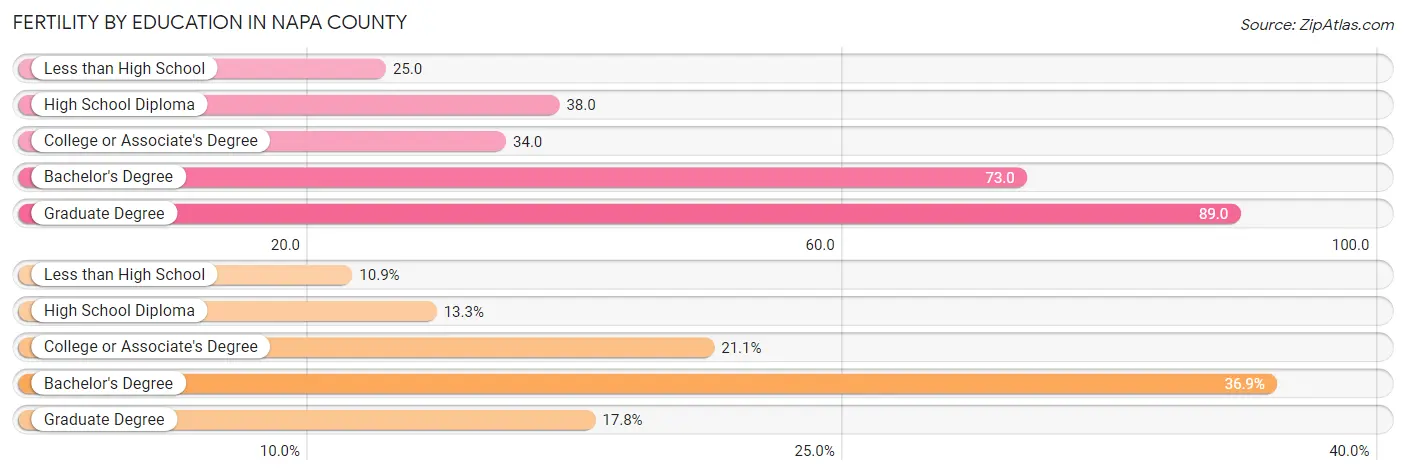
| Educational Attainment | Women with Births | Births / 1,000 Women |
| Less than High School | 157 (10.9%) | 25.0 |
| High School Diploma | 191 (13.3%) | 38.0 |
| College or Associate's Degree | 303 (21.1%) | 34.0 |
| Bachelor's Degree | 530 (36.9%) | 73.0 |
| Graduate Degree | 255 (17.8%) | 89.0 |
| Total | 1,436 (100.0%) | 47.0 |
Fertility by Education by Marriage Status in Napa County
29.9% of women with births in Napa County are unmarried. Women with the educational attainment of bachelor's degree are most likely to be married with 91.1% of them married at childbirth, while women with the educational attainment of college or associate's degree are least likely to be married with 48.5% of them unmarried at childbirth.
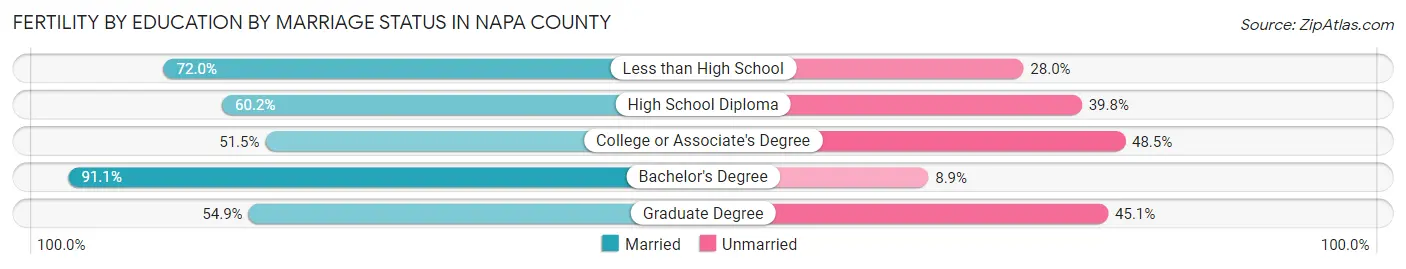
| Educational Attainment | Married | Unmarried |
| Less than High School | 113 (72.0%) | 44 (28.0%) |
| High School Diploma | 115 (60.2%) | 76 (39.8%) |
| College or Associate's Degree | 156 (51.5%) | 147 (48.5%) |
| Bachelor's Degree | 483 (91.1%) | 47 (8.9%) |
| Graduate Degree | 140 (54.9%) | 115 (45.1%) |
| Total | 1,007 (70.1%) | 429 (29.9%) |
Employment Characteristics in Napa County
Employment by Class of Employer in Napa County
Among the 66,906 employed individuals in Napa County, private company employees (43,760 | 65.4%), local government employees (5,396 | 8.1%), and not-for-profit organizations (5,323 | 8.0%) make up the most common classes of employment.
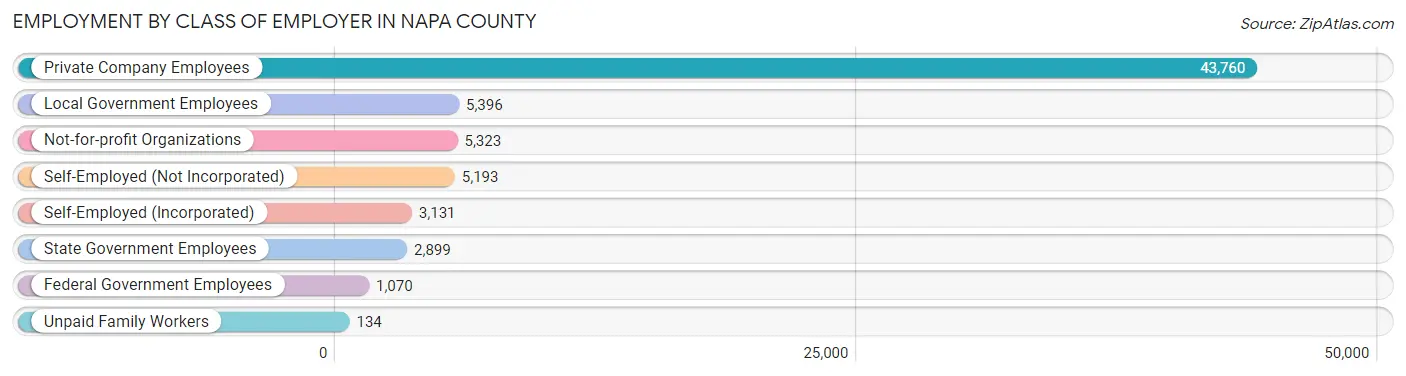
| Employer Class | # Employees | % Employees |
| Private Company Employees | 43,760 | 65.4% |
| Self-Employed (Incorporated) | 3,131 | 4.7% |
| Self-Employed (Not Incorporated) | 5,193 | 7.8% |
| Not-for-profit Organizations | 5,323 | 8.0% |
| Local Government Employees | 5,396 | 8.1% |
| State Government Employees | 2,899 | 4.3% |
| Federal Government Employees | 1,070 | 1.6% |
| Unpaid Family Workers | 134 | 0.2% |
| Total | 66,906 | 100.0% |
Employment Status by Age in Napa County
According to the labor force statistics for Napa County, out of the total population over 16 years of age (113,817), 63.4% or 72,160 individuals are in the labor force, with 5.2% or 3,752 of them unemployed. The age group with the highest labor force participation rate is 30 to 34 years, with 89.7% or 7,491 individuals in the labor force. Within the labor force, the 16 to 19 years age range has the highest percentage of unemployed individuals, with 11.9% or 354 of them being unemployed.
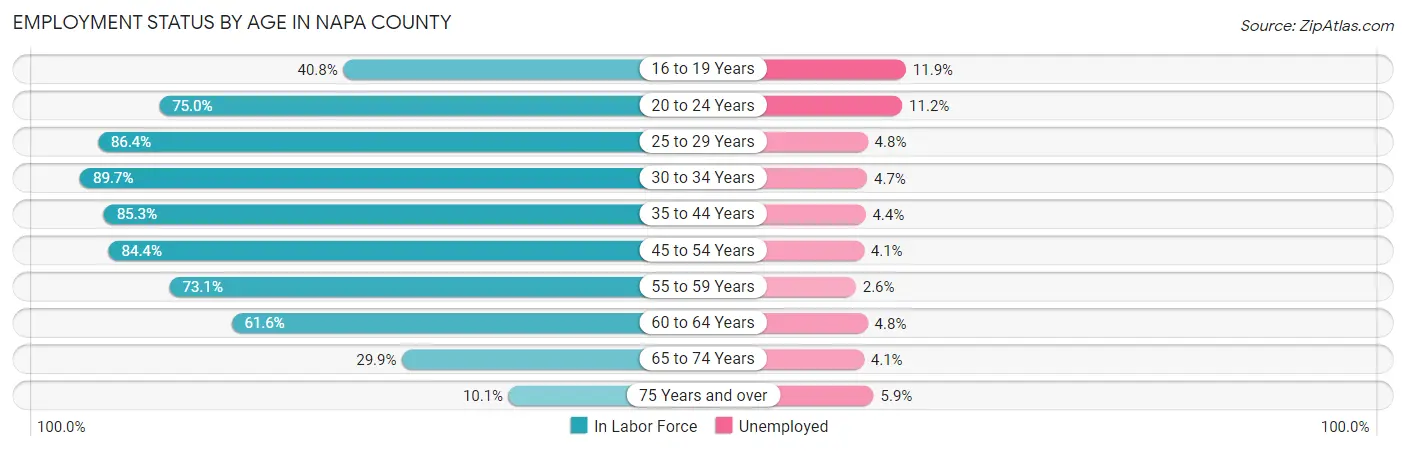
| Age Bracket | In Labor Force | Unemployed |
| 16 to 19 Years | 2,974 (40.8%) | 354 (11.9%) |
| 20 to 24 Years | 6,223 (75.0%) | 697 (11.2%) |
| 25 to 29 Years | 7,179 (86.4%) | 345 (4.8%) |
| 30 to 34 Years | 7,491 (89.7%) | 352 (4.7%) |
| 35 to 44 Years | 15,015 (85.3%) | 661 (4.4%) |
| 45 to 54 Years | 14,901 (84.4%) | 611 (4.1%) |
| 55 to 59 Years | 6,980 (73.1%) | 181 (2.6%) |
| 60 to 64 Years | 5,540 (61.6%) | 266 (4.8%) |
| 65 to 74 Years | 4,637 (29.9%) | 190 (4.1%) |
| 75 Years and over | 1,239 (10.1%) | 73 (5.9%) |
| Total | 72,160 (63.4%) | 3,752 (5.2%) |
Employment Status by Educational Attainment in Napa County
According to labor force statistics for Napa County, 81.0% of individuals (57,071) out of the total population between 25 and 64 years of age (70,458) are in the labor force, with 4.2% or 2,397 of them being unemployed. The group with the highest labor force participation rate are those with the educational attainment of bachelor's degree or higher, with 85.8% or 22,671 individuals in the labor force. Within the labor force, individuals with less than high school education have the highest percentage of unemployment, with 5.6% or 480 of them being unemployed.
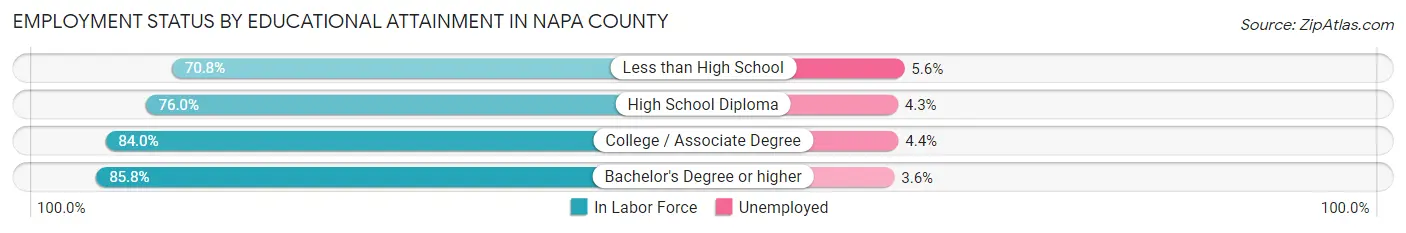
| Educational Attainment | In Labor Force | Unemployed |
| Less than High School | 8,573 (70.8%) | 678 (5.6%) |
| High School Diploma | 9,229 (76.0%) | 522 (4.3%) |
| College / Associate Degree | 16,618 (84.0%) | 870 (4.4%) |
| Bachelor's Degree or higher | 22,671 (85.8%) | 951 (3.6%) |
| Total | 57,071 (81.0%) | 2,959 (4.2%) |
Employment Occupations by Sex in Napa County
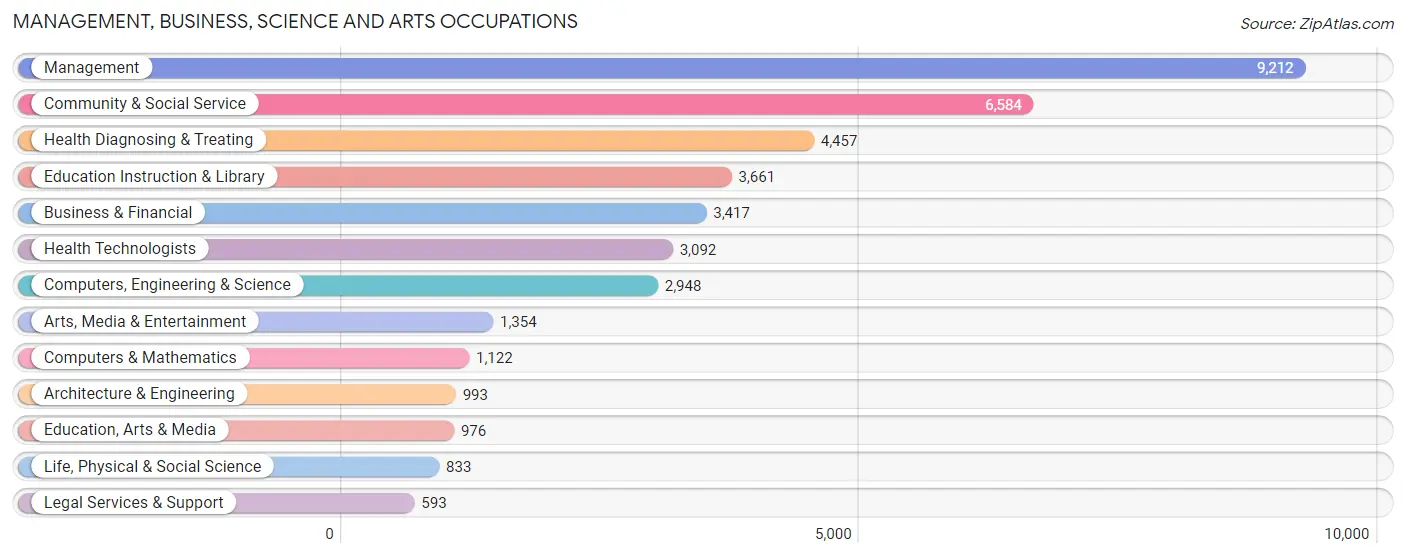
Management, Business, Science and Arts Occupations
The most common Management, Business, Science and Arts occupations in Napa County are Management (9,212 | 13.5%), Community & Social Service (6,584 | 9.6%), Health Diagnosing & Treating (4,457 | 6.5%), Education Instruction & Library (3,661 | 5.3%), and Business & Financial (3,417 | 5.0%).
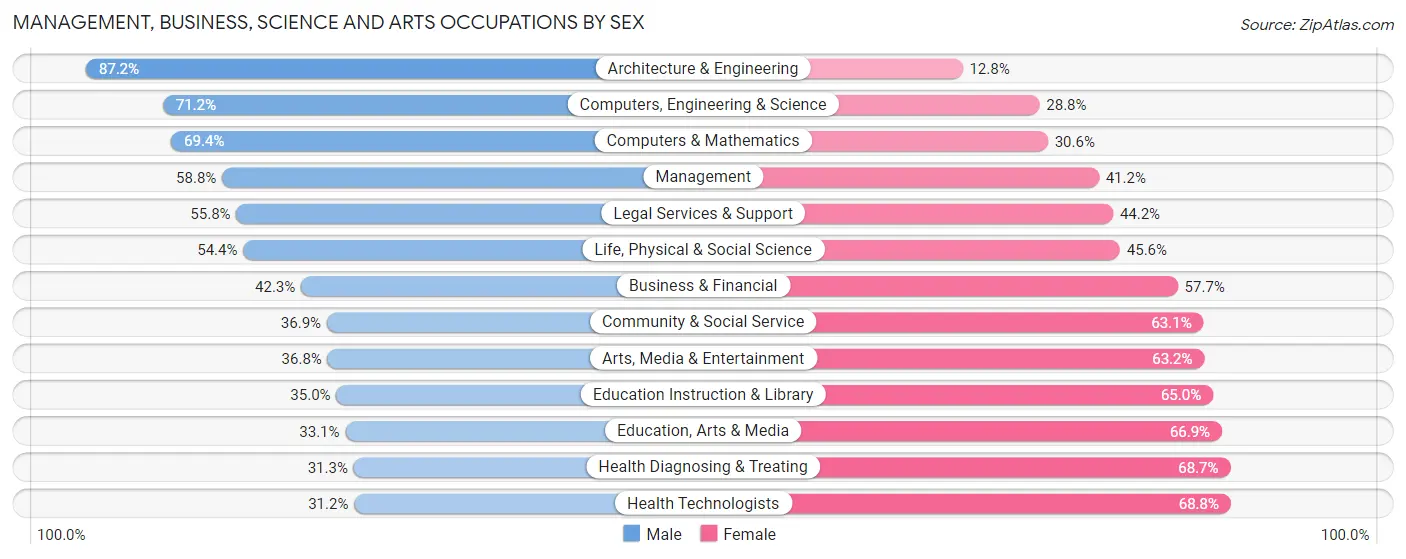
Management, Business, Science and Arts Occupations by Sex
Within the Management, Business, Science and Arts occupations in Napa County, the most male-oriented occupations are Architecture & Engineering (87.2%), Computers, Engineering & Science (71.2%), and Computers & Mathematics (69.4%), while the most female-oriented occupations are Health Technologists (68.8%), Health Diagnosing & Treating (68.7%), and Education, Arts & Media (66.9%).
| Occupation | Male | Female |
| Management | 5,416 (58.8%) | 3,796 (41.2%) |
| Business & Financial | 1,446 (42.3%) | 1,971 (57.7%) |
| Computers, Engineering & Science | 2,098 (71.2%) | 850 (28.8%) |
| Computers & Mathematics | 779 (69.4%) | 343 (30.6%) |
| Architecture & Engineering | 866 (87.2%) | 127 (12.8%) |
| Life, Physical & Social Science | 453 (54.4%) | 380 (45.6%) |
| Community & Social Service | 2,432 (36.9%) | 4,152 (63.1%) |
| Education, Arts & Media | 323 (33.1%) | 653 (66.9%) |
| Legal Services & Support | 331 (55.8%) | 262 (44.2%) |
| Education Instruction & Library | 1,280 (35.0%) | 2,381 (65.0%) |
| Arts, Media & Entertainment | 498 (36.8%) | 856 (63.2%) |
| Health Diagnosing & Treating | 1,397 (31.3%) | 3,060 (68.7%) |
| Health Technologists | 966 (31.2%) | 2,126 (68.8%) |
| Total (Category) | 12,789 (48.0%) | 13,829 (51.9%) |
| Total (Overall) | 36,618 (53.5%) | 31,781 (46.5%) |
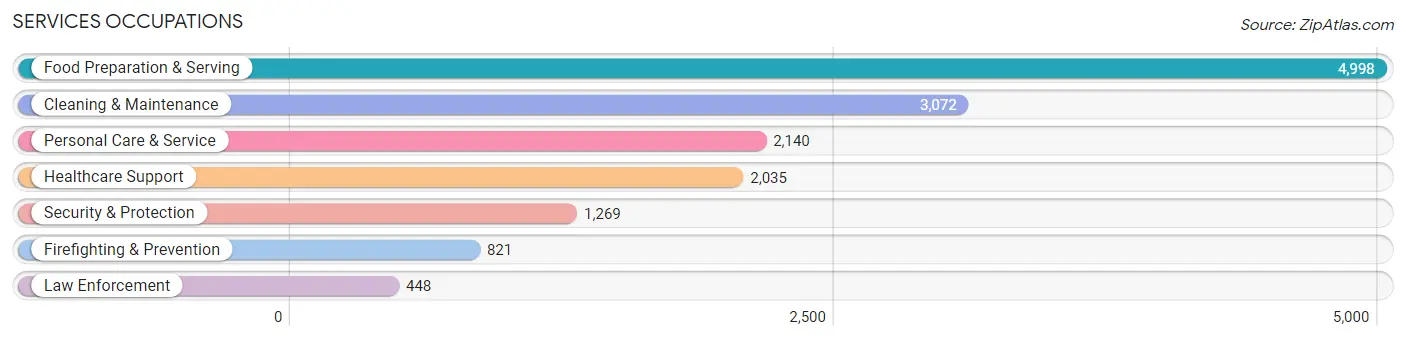
Services Occupations
The most common Services occupations in Napa County are Food Preparation & Serving (4,998 | 7.3%), Cleaning & Maintenance (3,072 | 4.5%), Personal Care & Service (2,140 | 3.1%), Healthcare Support (2,035 | 3.0%), and Security & Protection (1,269 | 1.9%).
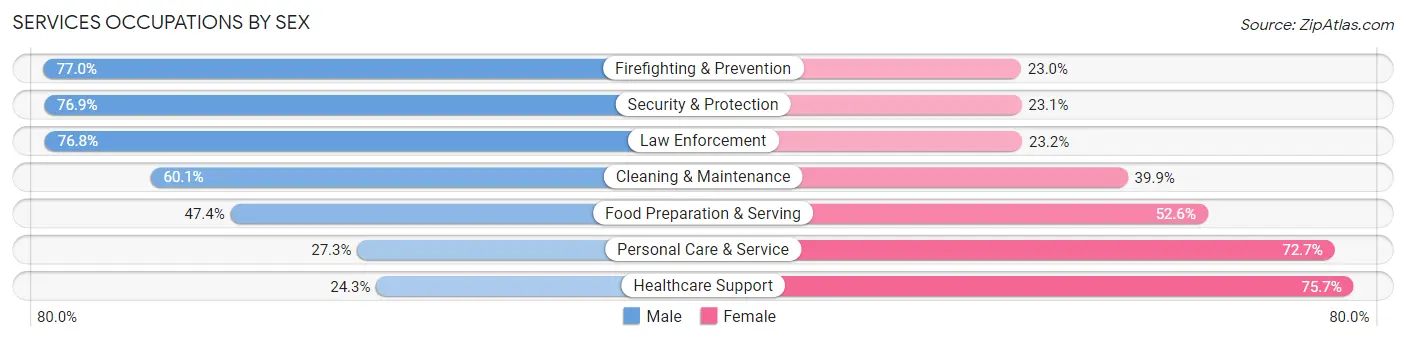
Services Occupations by Sex
Within the Services occupations in Napa County, the most male-oriented occupations are Firefighting & Prevention (77.0%), Security & Protection (76.9%), and Law Enforcement (76.8%), while the most female-oriented occupations are Healthcare Support (75.7%), Personal Care & Service (72.7%), and Food Preparation & Serving (52.6%).
| Occupation | Male | Female |
| Healthcare Support | 494 (24.3%) | 1,541 (75.7%) |
| Security & Protection | 976 (76.9%) | 293 (23.1%) |
| Firefighting & Prevention | 632 (77.0%) | 189 (23.0%) |
| Law Enforcement | 344 (76.8%) | 104 (23.2%) |
| Food Preparation & Serving | 2,368 (47.4%) | 2,630 (52.6%) |
| Cleaning & Maintenance | 1,845 (60.1%) | 1,227 (39.9%) |
| Personal Care & Service | 584 (27.3%) | 1,556 (72.7%) |
| Total (Category) | 6,267 (46.4%) | 7,247 (53.6%) |
| Total (Overall) | 36,618 (53.5%) | 31,781 (46.5%) |
Sales and Office Occupations
The most common Sales and Office occupations in Napa County are Sales & Related (6,829 | 10.0%), and Office & Administration (6,601 | 9.7%).

Sales and Office Occupations by Sex

| Occupation | Male | Female |
| Sales & Related | 3,381 (49.5%) | 3,448 (50.5%) |
| Office & Administration | 1,665 (25.2%) | 4,936 (74.8%) |
| Total (Category) | 5,046 (37.6%) | 8,384 (62.4%) |
| Total (Overall) | 36,618 (53.5%) | 31,781 (46.5%) |
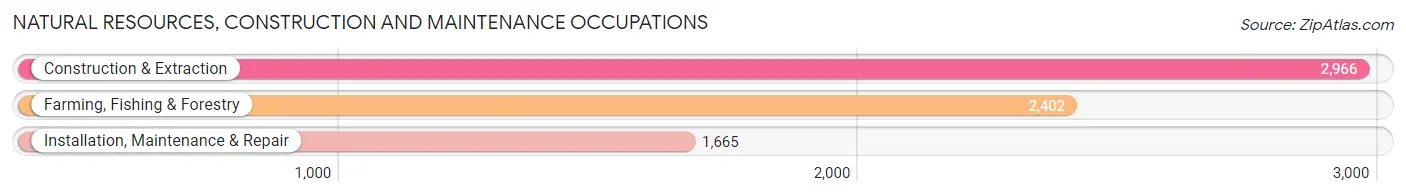
Natural Resources, Construction and Maintenance Occupations
The most common Natural Resources, Construction and Maintenance occupations in Napa County are Construction & Extraction (2,966 | 4.3%), Farming, Fishing & Forestry (2,402 | 3.5%), and Installation, Maintenance & Repair (1,665 | 2.4%).
Natural Resources, Construction and Maintenance Occupations by Sex
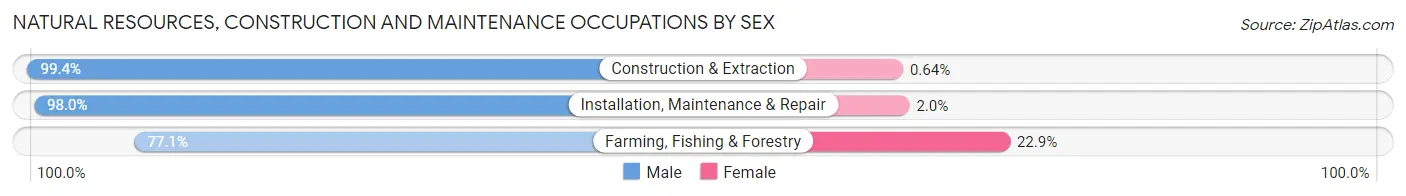
| Occupation | Male | Female |
| Farming, Fishing & Forestry | 1,852 (77.1%) | 550 (22.9%) |
| Construction & Extraction | 2,947 (99.4%) | 19 (0.6%) |
| Installation, Maintenance & Repair | 1,632 (98.0%) | 33 (2.0%) |
| Total (Category) | 6,431 (91.4%) | 602 (8.6%) |
| Total (Overall) | 36,618 (53.5%) | 31,781 (46.5%) |
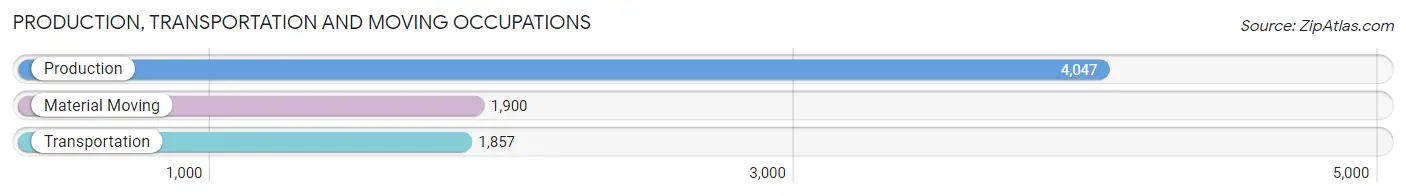
Production, Transportation and Moving Occupations
The most common Production, Transportation and Moving occupations in Napa County are Production (4,047 | 5.9%), Material Moving (1,900 | 2.8%), and Transportation (1,857 | 2.7%).
Production, Transportation and Moving Occupations by Sex
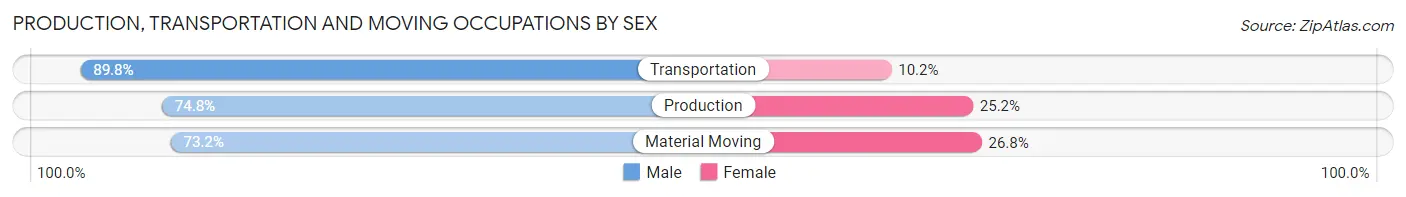
| Occupation | Male | Female |
| Production | 3,027 (74.8%) | 1,020 (25.2%) |
| Transportation | 1,667 (89.8%) | 190 (10.2%) |
| Material Moving | 1,391 (73.2%) | 509 (26.8%) |
| Total (Category) | 6,085 (78.0%) | 1,719 (22.0%) |
| Total (Overall) | 36,618 (53.5%) | 31,781 (46.5%) |
Employment Industries by Sex in Napa County
Employment Industries in Napa County
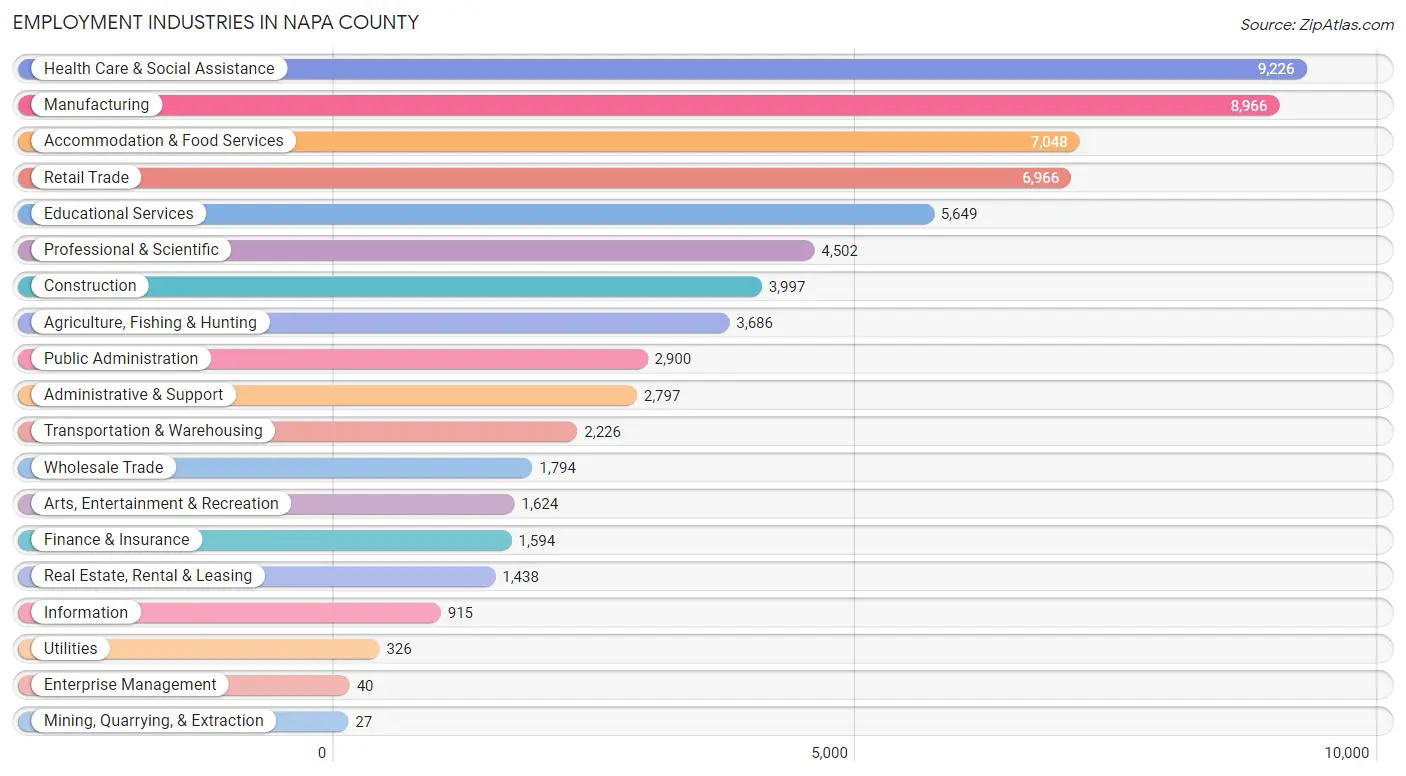
The major employment industries in Napa County include Health Care & Social Assistance (9,226 | 13.5%), Manufacturing (8,966 | 13.1%), Accommodation & Food Services (7,048 | 10.3%), Retail Trade (6,966 | 10.2%), and Educational Services (5,649 | 8.3%).
Employment Industries by Sex in Napa County
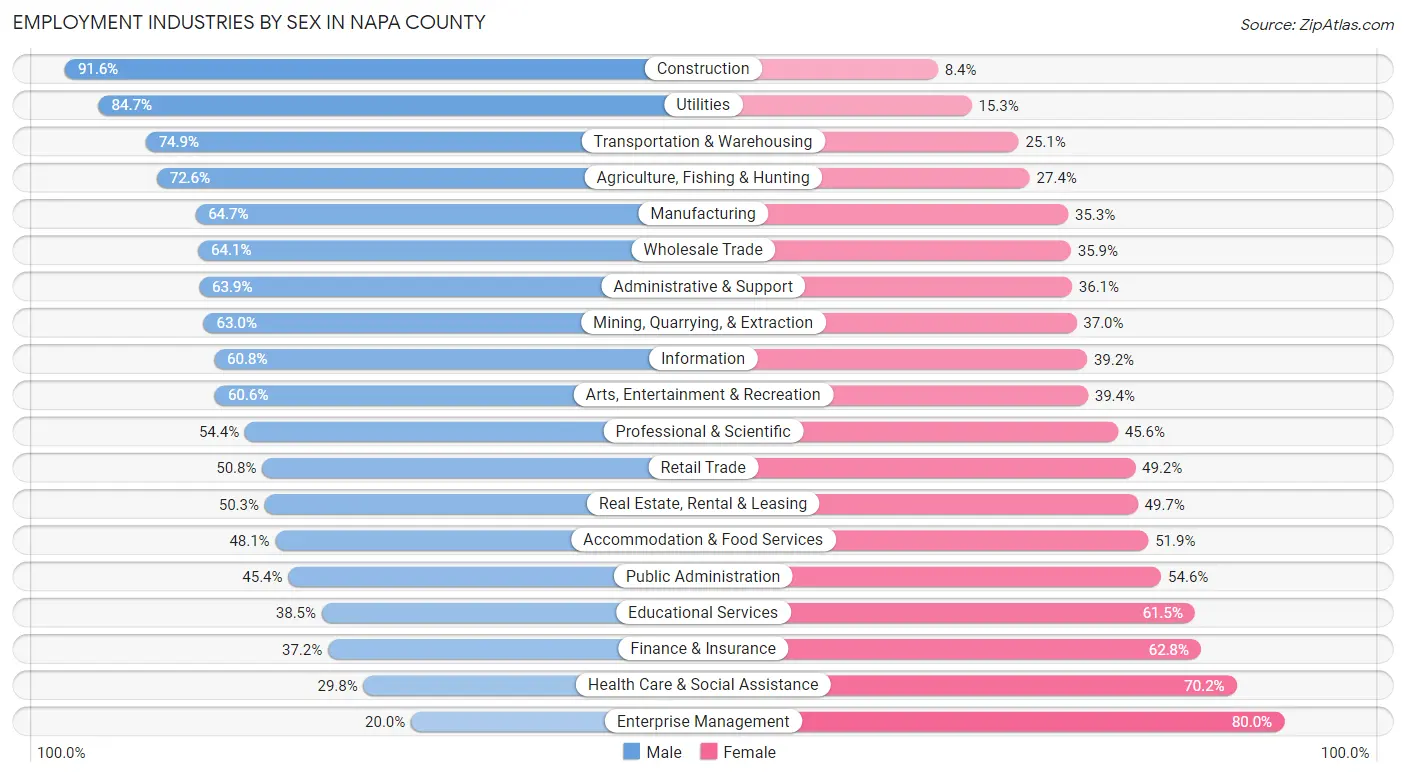
The Napa County industries that see more men than women are Construction (91.6%), Utilities (84.7%), and Transportation & Warehousing (74.9%), whereas the industries that tend to have a higher number of women are Enterprise Management (80.0%), Health Care & Social Assistance (70.2%), and Finance & Insurance (62.8%).
| Industry | Male | Female |
| Agriculture, Fishing & Hunting | 2,677 (72.6%) | 1,009 (27.4%) |
| Mining, Quarrying, & Extraction | 17 (63.0%) | 10 (37.0%) |
| Construction | 3,663 (91.6%) | 334 (8.4%) |
| Manufacturing | 5,799 (64.7%) | 3,167 (35.3%) |
| Wholesale Trade | 1,150 (64.1%) | 644 (35.9%) |
| Retail Trade | 3,539 (50.8%) | 3,427 (49.2%) |
| Transportation & Warehousing | 1,668 (74.9%) | 558 (25.1%) |
| Utilities | 276 (84.7%) | 50 (15.3%) |
| Information | 556 (60.8%) | 359 (39.2%) |
| Finance & Insurance | 593 (37.2%) | 1,001 (62.8%) |
| Real Estate, Rental & Leasing | 723 (50.3%) | 715 (49.7%) |
| Professional & Scientific | 2,448 (54.4%) | 2,054 (45.6%) |
| Enterprise Management | 8 (20.0%) | 32 (80.0%) |
| Administrative & Support | 1,787 (63.9%) | 1,010 (36.1%) |
| Educational Services | 2,173 (38.5%) | 3,476 (61.5%) |
| Health Care & Social Assistance | 2,753 (29.8%) | 6,473 (70.2%) |
| Arts, Entertainment & Recreation | 984 (60.6%) | 640 (39.4%) |
| Accommodation & Food Services | 3,389 (48.1%) | 3,659 (51.9%) |
| Public Administration | 1,317 (45.4%) | 1,583 (54.6%) |
| Total | 36,618 (53.5%) | 31,781 (46.5%) |
Education in Napa County
School Enrollment in Napa County
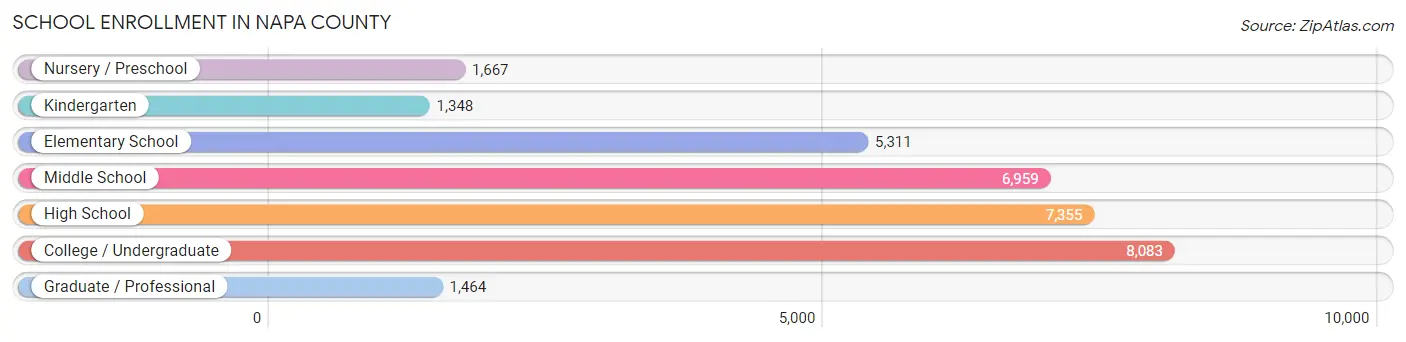
The most common levels of schooling among the 32,187 students in Napa County are college / undergraduate (8,083 | 25.1%), high school (7,355 | 22.9%), and middle school (6,959 | 21.6%).
| School Level | # Students | % Students |
| Nursery / Preschool | 1,667 | 5.2% |
| Kindergarten | 1,348 | 4.2% |
| Elementary School | 5,311 | 16.5% |
| Middle School | 6,959 | 21.6% |
| High School | 7,355 | 22.9% |
| College / Undergraduate | 8,083 | 25.1% |
| Graduate / Professional | 1,464 | 4.5% |
| Total | 32,187 | 100.0% |
School Enrollment by Age by Funding Source in Napa County
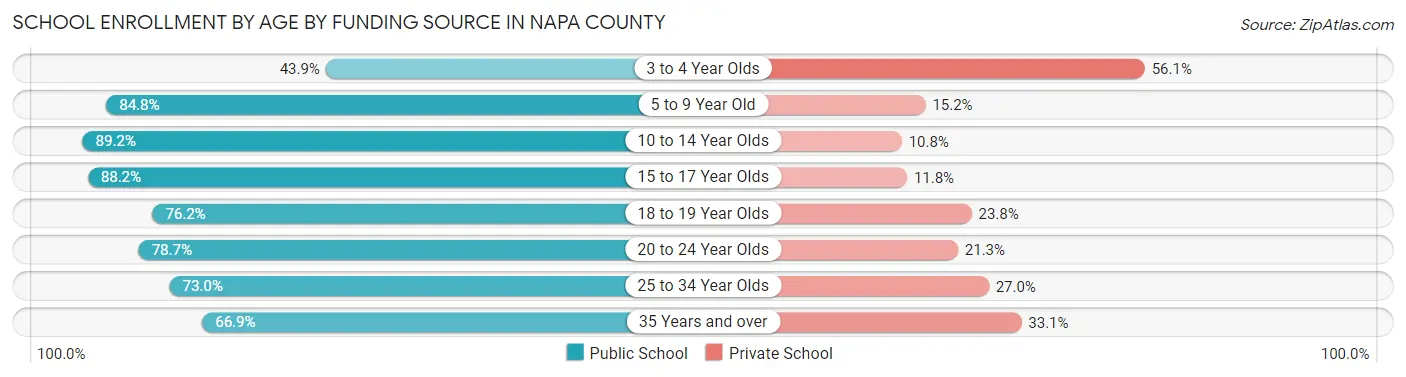
Out of a total of 32,187 students who are enrolled in schools in Napa County, 5,890 (18.3%) attend a private institution, while the remaining 26,297 (81.7%) are enrolled in public schools. The age group of 3 to 4 year olds has the highest likelihood of being enrolled in private schools, with 752 (56.1% in the age bracket) enrolled. Conversely, the age group of 10 to 14 year olds has the lowest likelihood of being enrolled in a private school, with 8,032 (89.2% in the age bracket) attending a public institution.
| Age Bracket | Public School | Private School |
| 3 to 4 Year Olds | 589 (43.9%) | 752 (56.1%) |
| 5 to 9 Year Old | 5,303 (84.8%) | 953 (15.2%) |
| 10 to 14 Year Olds | 8,032 (89.2%) | 973 (10.8%) |
| 15 to 17 Year Olds | 4,690 (88.2%) | 627 (11.8%) |
| 18 to 19 Year Olds | 1,970 (76.2%) | 616 (23.8%) |
| 20 to 24 Year Olds | 3,201 (78.7%) | 865 (21.3%) |
| 25 to 34 Year Olds | 1,292 (73.0%) | 478 (27.0%) |
| 35 Years and over | 1,235 (66.9%) | 611 (33.1%) |
| Total | 26,297 (81.7%) | 5,890 (18.3%) |
Educational Attainment by Field of Study in Napa County
Business (7,470 | 18.7%), social sciences (4,302 | 10.7%), bio, nature & agricultural (4,123 | 10.3%), science & technology (3,315 | 8.3%), and education (2,681 | 6.7%) are the most common fields of study among 40,013 individuals in Napa County who have obtained a bachelor's degree or higher.
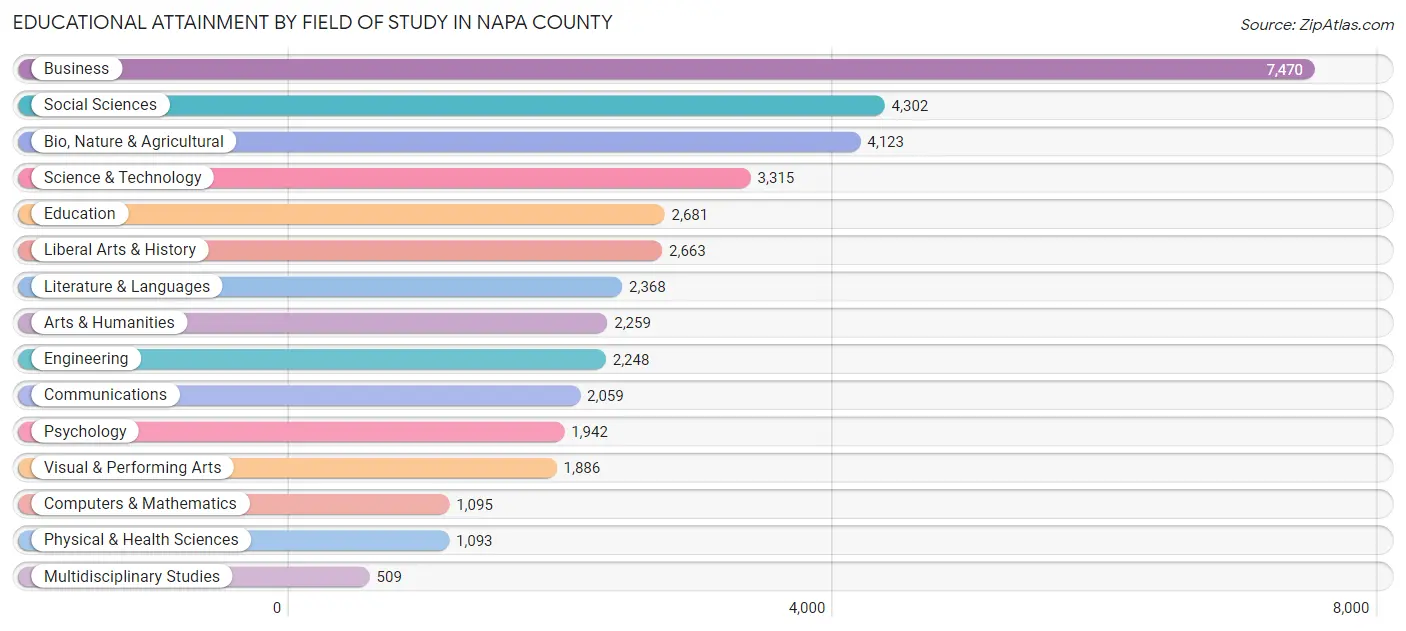
| Field of Study | # Graduates | % Graduates |
| Computers & Mathematics | 1,095 | 2.7% |
| Bio, Nature & Agricultural | 4,123 | 10.3% |
| Physical & Health Sciences | 1,093 | 2.7% |
| Psychology | 1,942 | 4.9% |
| Social Sciences | 4,302 | 10.7% |
| Engineering | 2,248 | 5.6% |
| Multidisciplinary Studies | 509 | 1.3% |
| Science & Technology | 3,315 | 8.3% |
| Business | 7,470 | 18.7% |
| Education | 2,681 | 6.7% |
| Literature & Languages | 2,368 | 5.9% |
| Liberal Arts & History | 2,663 | 6.7% |
| Visual & Performing Arts | 1,886 | 4.7% |
| Communications | 2,059 | 5.1% |
| Arts & Humanities | 2,259 | 5.7% |
| Total | 40,013 | 100.0% |
Transportation & Commute in Napa County
Vehicle Availability by Sex in Napa County
The most prevalent vehicle ownership categories in Napa County are males with 2 vehicles (13,194, accounting for 37.3%) and females with 2 vehicles (11,355, making up 43.0%).
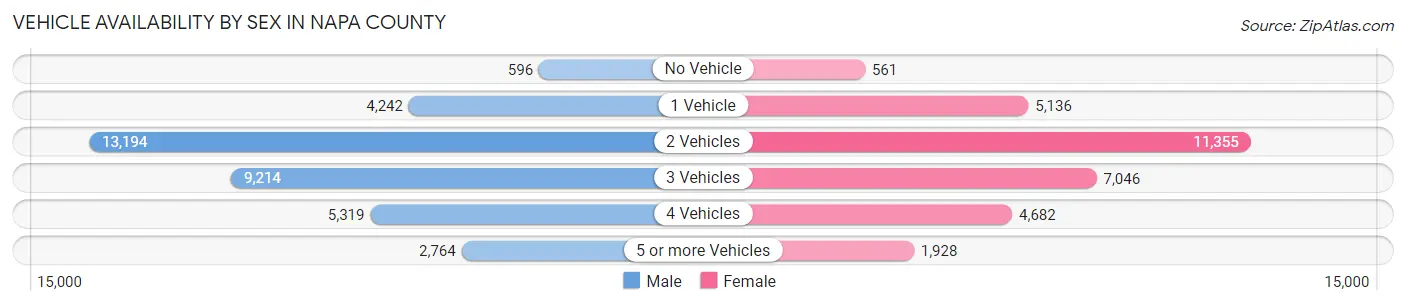
| Vehicles Available | Male | Female |
| No Vehicle | 596 (1.7%) | 561 (1.8%) |
| 1 Vehicle | 4,242 (12.0%) | 5,136 (16.7%) |
| 2 Vehicles | 13,194 (37.3%) | 11,355 (37.0%) |
| 3 Vehicles | 9,214 (26.1%) | 7,046 (23.0%) |
| 4 Vehicles | 5,319 (15.1%) | 4,682 (15.2%) |
| 5 or more Vehicles | 2,764 (7.8%) | 1,928 (6.3%) |
| Total | 35,329 (100.0%) | 30,708 (100.0%) |
Commute Time in Napa County
The most frequently occuring commute durations in Napa County are 10 to 14 minutes (9,483 commuters, 15.9%), 15 to 19 minutes (9,361 commuters, 15.7%), and 5 to 9 minutes (8,158 commuters, 13.7%).
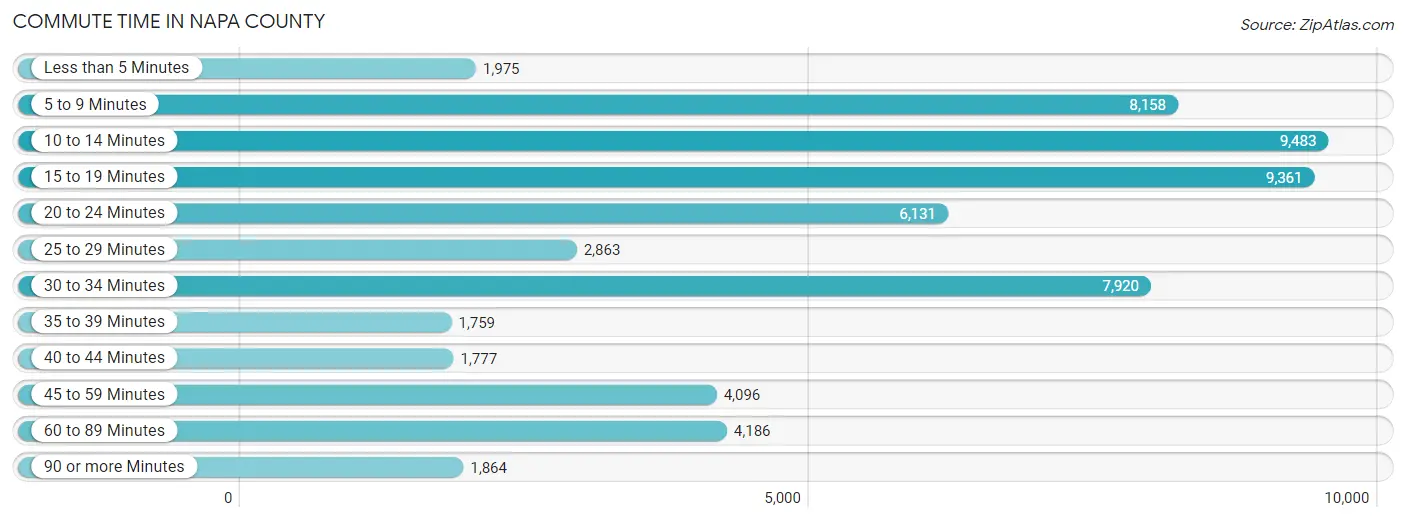
| Commute Time | # Commuters | % Commuters |
| Less than 5 Minutes | 1,975 | 3.3% |
| 5 to 9 Minutes | 8,158 | 13.7% |
| 10 to 14 Minutes | 9,483 | 15.9% |
| 15 to 19 Minutes | 9,361 | 15.7% |
| 20 to 24 Minutes | 6,131 | 10.3% |
| 25 to 29 Minutes | 2,863 | 4.8% |
| 30 to 34 Minutes | 7,920 | 13.3% |
| 35 to 39 Minutes | 1,759 | 2.9% |
| 40 to 44 Minutes | 1,777 | 3.0% |
| 45 to 59 Minutes | 4,096 | 6.9% |
| 60 to 89 Minutes | 4,186 | 7.0% |
| 90 or more Minutes | 1,864 | 3.1% |
Commute Time by Sex in Napa County
The most common commute times in Napa County are 15 to 19 minutes (5,386 commuters, 16.6%) for males and 10 to 14 minutes (4,794 commuters, 17.6%) for females.
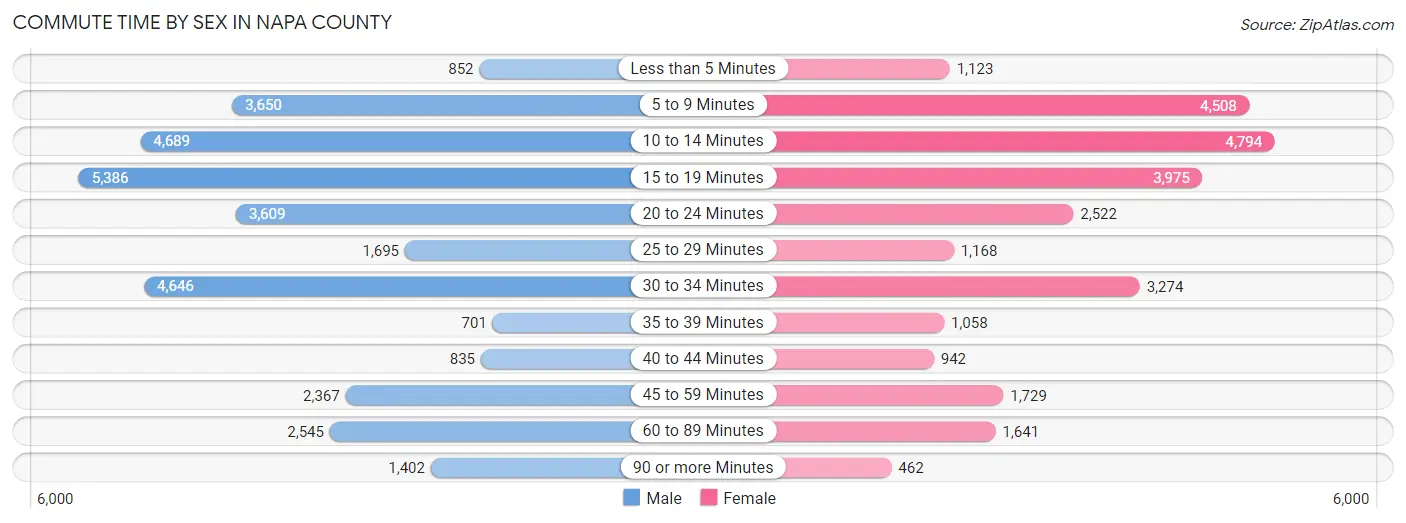
| Commute Time | Male | Female |
| Less than 5 Minutes | 852 (2.6%) | 1,123 (4.1%) |
| 5 to 9 Minutes | 3,650 (11.3%) | 4,508 (16.6%) |
| 10 to 14 Minutes | 4,689 (14.5%) | 4,794 (17.6%) |
| 15 to 19 Minutes | 5,386 (16.6%) | 3,975 (14.6%) |
| 20 to 24 Minutes | 3,609 (11.2%) | 2,522 (9.3%) |
| 25 to 29 Minutes | 1,695 (5.2%) | 1,168 (4.3%) |
| 30 to 34 Minutes | 4,646 (14.3%) | 3,274 (12.0%) |
| 35 to 39 Minutes | 701 (2.2%) | 1,058 (3.9%) |
| 40 to 44 Minutes | 835 (2.6%) | 942 (3.5%) |
| 45 to 59 Minutes | 2,367 (7.3%) | 1,729 (6.4%) |
| 60 to 89 Minutes | 2,545 (7.9%) | 1,641 (6.0%) |
| 90 or more Minutes | 1,402 (4.3%) | 462 (1.7%) |
Time of Departure to Work by Sex in Napa County
The most frequent times of departure to work in Napa County are 8:00 AM to 8:29 AM (4,386, 13.6%) for males and 8:00 AM to 8:29 AM (4,716, 17.3%) for females.
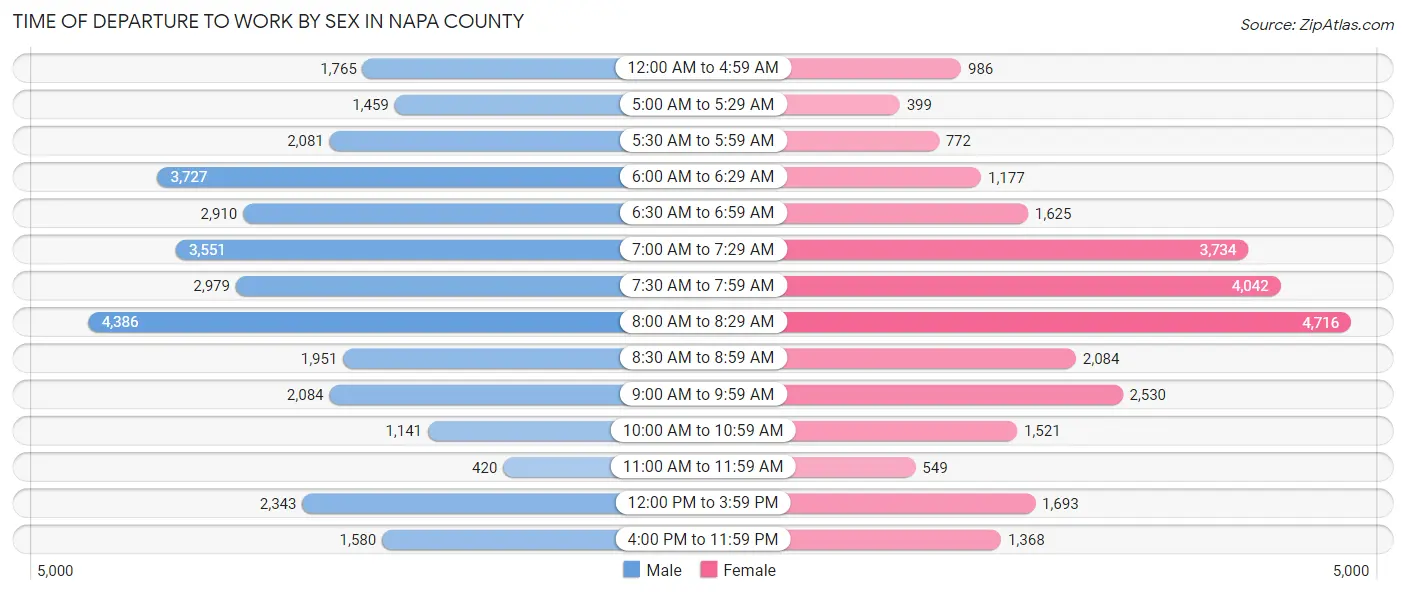
| Time of Departure | Male | Female |
| 12:00 AM to 4:59 AM | 1,765 (5.4%) | 986 (3.6%) |
| 5:00 AM to 5:29 AM | 1,459 (4.5%) | 399 (1.5%) |
| 5:30 AM to 5:59 AM | 2,081 (6.4%) | 772 (2.8%) |
| 6:00 AM to 6:29 AM | 3,727 (11.5%) | 1,177 (4.3%) |
| 6:30 AM to 6:59 AM | 2,910 (9.0%) | 1,625 (6.0%) |
| 7:00 AM to 7:29 AM | 3,551 (11.0%) | 3,734 (13.7%) |
| 7:30 AM to 7:59 AM | 2,979 (9.2%) | 4,042 (14.9%) |
| 8:00 AM to 8:29 AM | 4,386 (13.6%) | 4,716 (17.3%) |
| 8:30 AM to 8:59 AM | 1,951 (6.0%) | 2,084 (7.7%) |
| 9:00 AM to 9:59 AM | 2,084 (6.4%) | 2,530 (9.3%) |
| 10:00 AM to 10:59 AM | 1,141 (3.5%) | 1,521 (5.6%) |
| 11:00 AM to 11:59 AM | 420 (1.3%) | 549 (2.0%) |
| 12:00 PM to 3:59 PM | 2,343 (7.2%) | 1,693 (6.2%) |
| 4:00 PM to 11:59 PM | 1,580 (4.9%) | 1,368 (5.0%) |
| Total | 32,377 (100.0%) | 27,196 (100.0%) |
Housing Occupancy in Napa County
Occupancy by Ownership in Napa County
Of the total 49,218 dwellings in Napa County, owner-occupied units account for 32,076 (65.2%), while renter-occupied units make up 17,142 (34.8%).
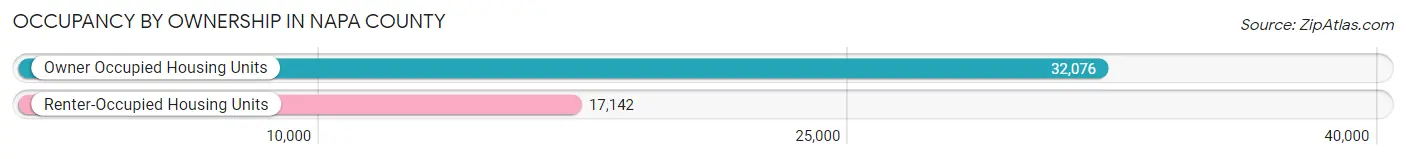
| Occupancy | # Housing Units | % Housing Units |
| Owner Occupied Housing Units | 32,076 | 65.2% |
| Renter-Occupied Housing Units | 17,142 | 34.8% |
| Total Occupied Housing Units | 49,218 | 100.0% |
Occupancy by Household Size in Napa County
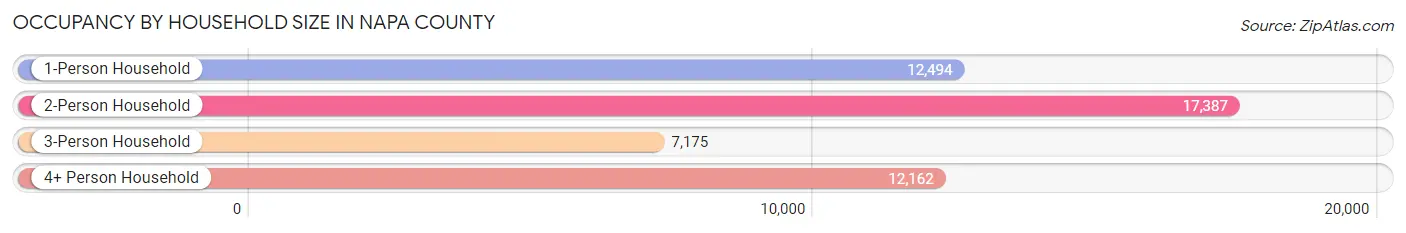
| Household Size | # Housing Units | % Housing Units |
| 1-Person Household | 12,494 | 25.4% |
| 2-Person Household | 17,387 | 35.3% |
| 3-Person Household | 7,175 | 14.6% |
| 4+ Person Household | 12,162 | 24.7% |
| Total Housing Units | 49,218 | 100.0% |
Occupancy by Ownership by Household Size in Napa County
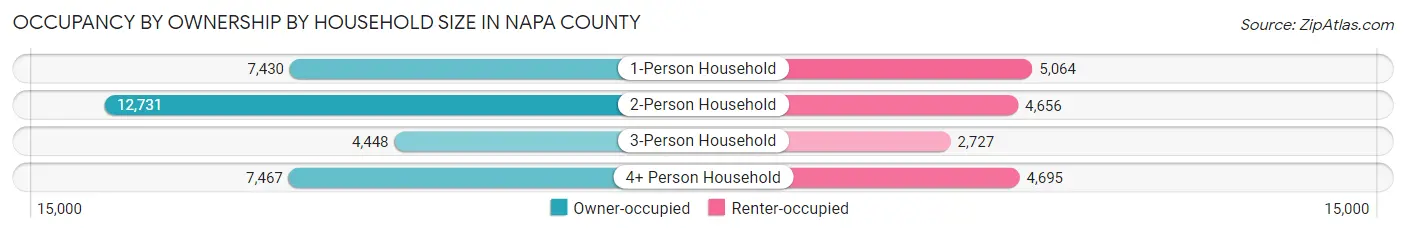
| Household Size | Owner-occupied | Renter-occupied |
| 1-Person Household | 7,430 (59.5%) | 5,064 (40.5%) |
| 2-Person Household | 12,731 (73.2%) | 4,656 (26.8%) |
| 3-Person Household | 4,448 (62.0%) | 2,727 (38.0%) |
| 4+ Person Household | 7,467 (61.4%) | 4,695 (38.6%) |
| Total Housing Units | 32,076 (65.2%) | 17,142 (34.8%) |
Occupancy by Educational Attainment in Napa County
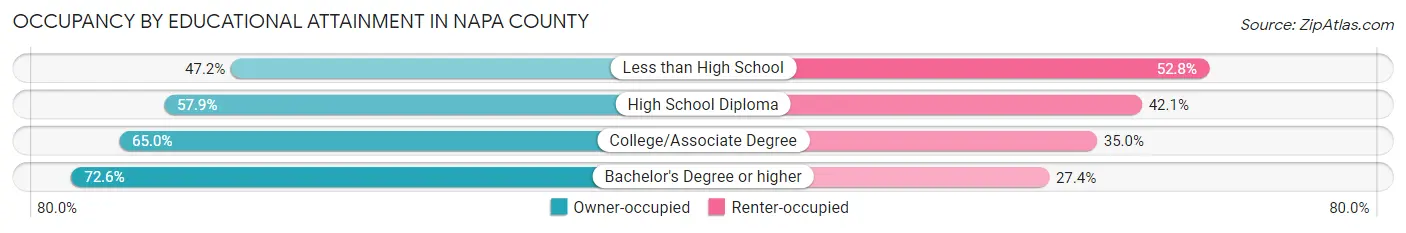
| Household Size | Owner-occupied | Renter-occupied |
| Less than High School | 2,706 (47.2%) | 3,022 (52.8%) |
| High School Diploma | 4,108 (57.9%) | 2,990 (42.1%) |
| College/Associate Degree | 9,916 (65.0%) | 5,336 (35.0%) |
| Bachelor's Degree or higher | 15,346 (72.6%) | 5,794 (27.4%) |
Occupancy by Age of Householder in Napa County
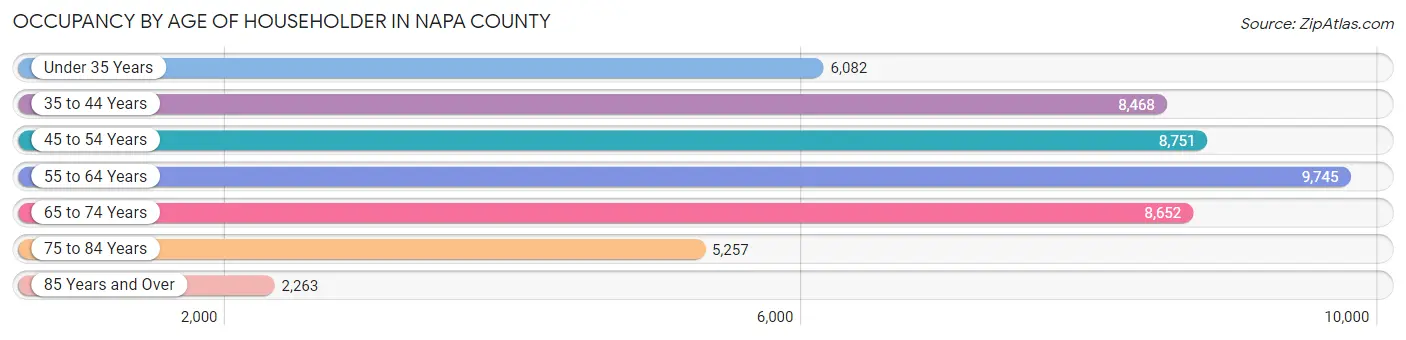
| Age Bracket | # Households | % Households |
| Under 35 Years | 6,082 | 12.4% |
| 35 to 44 Years | 8,468 | 17.2% |
| 45 to 54 Years | 8,751 | 17.8% |
| 55 to 64 Years | 9,745 | 19.8% |
| 65 to 74 Years | 8,652 | 17.6% |
| 75 to 84 Years | 5,257 | 10.7% |
| 85 Years and Over | 2,263 | 4.6% |
| Total | 49,218 | 100.0% |
Housing Finances in Napa County
Median Income by Occupancy in Napa County
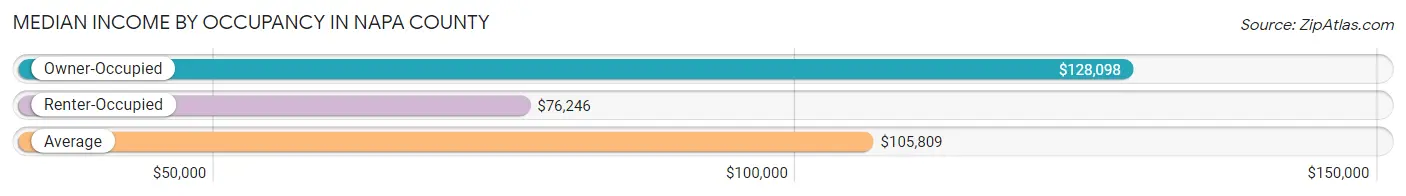
| Occupancy Type | # Households | Median Income |
| Owner-Occupied | 32,076 (65.2%) | $128,098 |
| Renter-Occupied | 17,142 (34.8%) | $76,246 |
| Average | 49,218 (100.0%) | $105,809 |
Occupancy by Householder Income Bracket in Napa County
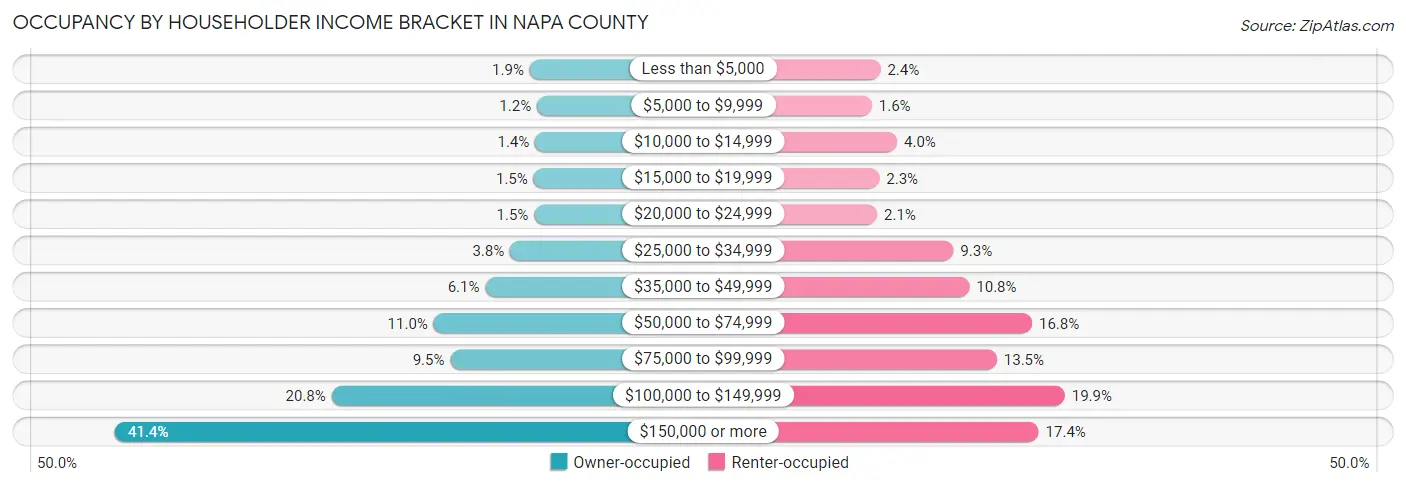
| Income Bracket | Owner-occupied | Renter-occupied |
| Less than $5,000 | 607 (1.9%) | 407 (2.4%) |
| $5,000 to $9,999 | 385 (1.2%) | 265 (1.5%) |
| $10,000 to $14,999 | 444 (1.4%) | 678 (4.0%) |
| $15,000 to $19,999 | 487 (1.5%) | 389 (2.3%) |
| $20,000 to $24,999 | 470 (1.5%) | 351 (2.1%) |
| $25,000 to $34,999 | 1,210 (3.8%) | 1,598 (9.3%) |
| $35,000 to $49,999 | 1,964 (6.1%) | 1,859 (10.8%) |
| $50,000 to $74,999 | 3,540 (11.0%) | 2,881 (16.8%) |
| $75,000 to $99,999 | 3,035 (9.5%) | 2,308 (13.5%) |
| $100,000 to $149,999 | 6,660 (20.8%) | 3,416 (19.9%) |
| $150,000 or more | 13,274 (41.4%) | 2,990 (17.4%) |
| Total | 32,076 (100.0%) | 17,142 (100.0%) |
Monthly Housing Cost Tiers in Napa County
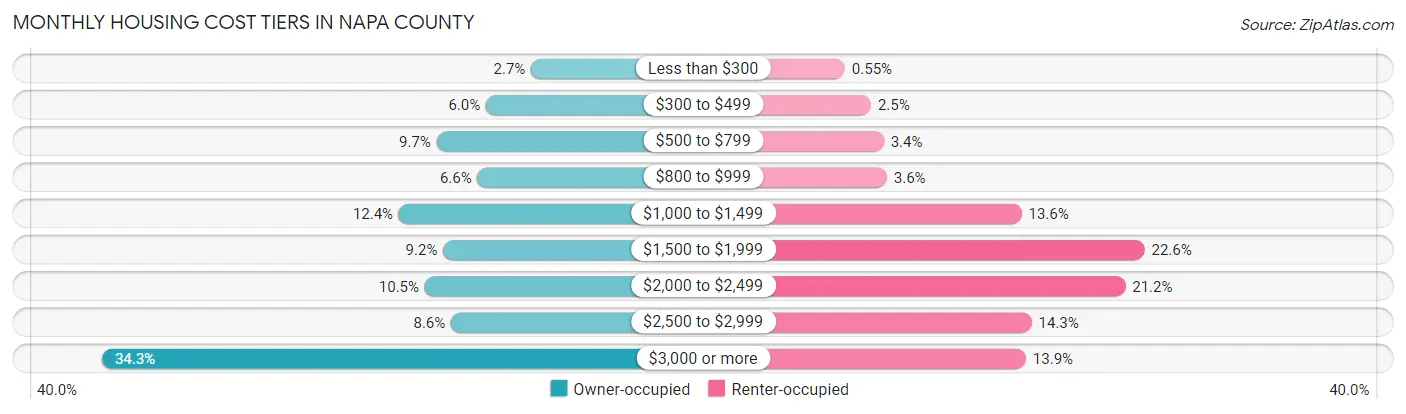
| Monthly Cost | Owner-occupied | Renter-occupied |
| Less than $300 | 863 (2.7%) | 94 (0.5%) |
| $300 to $499 | 1,928 (6.0%) | 423 (2.5%) |
| $500 to $799 | 3,094 (9.7%) | 585 (3.4%) |
| $800 to $999 | 2,131 (6.6%) | 624 (3.6%) |
| $1,000 to $1,499 | 3,987 (12.4%) | 2,324 (13.6%) |
| $1,500 to $1,999 | 2,941 (9.2%) | 3,877 (22.6%) |
| $2,000 to $2,499 | 3,374 (10.5%) | 3,634 (21.2%) |
| $2,500 to $2,999 | 2,755 (8.6%) | 2,451 (14.3%) |
| $3,000 or more | 11,003 (34.3%) | 2,380 (13.9%) |
| Total | 32,076 (100.0%) | 17,142 (100.0%) |
Physical Housing Characteristics in Napa County
Housing Structures in Napa County
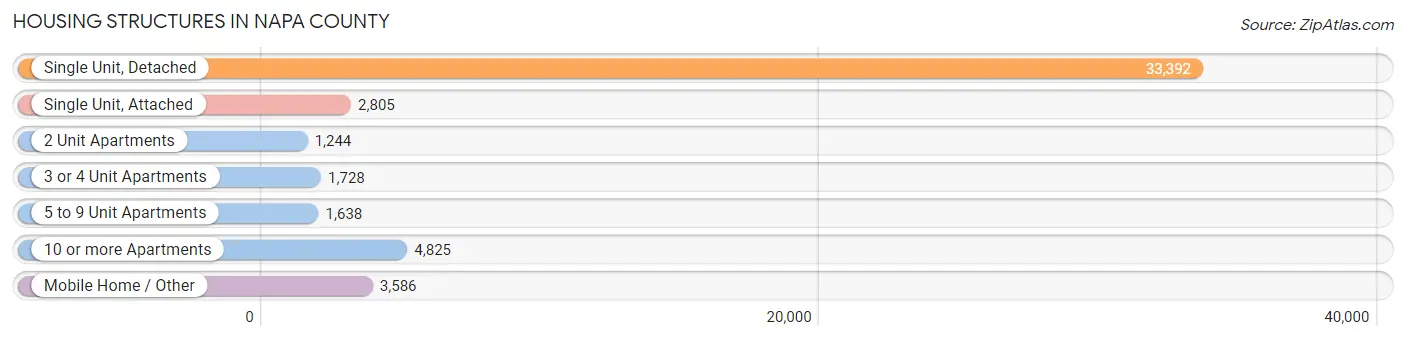
| Structure Type | # Housing Units | % Housing Units |
| Single Unit, Detached | 33,392 | 67.8% |
| Single Unit, Attached | 2,805 | 5.7% |
| 2 Unit Apartments | 1,244 | 2.5% |
| 3 or 4 Unit Apartments | 1,728 | 3.5% |
| 5 to 9 Unit Apartments | 1,638 | 3.3% |
| 10 or more Apartments | 4,825 | 9.8% |
| Mobile Home / Other | 3,586 | 7.3% |
| Total | 49,218 | 100.0% |
Housing Structures by Occupancy in Napa County
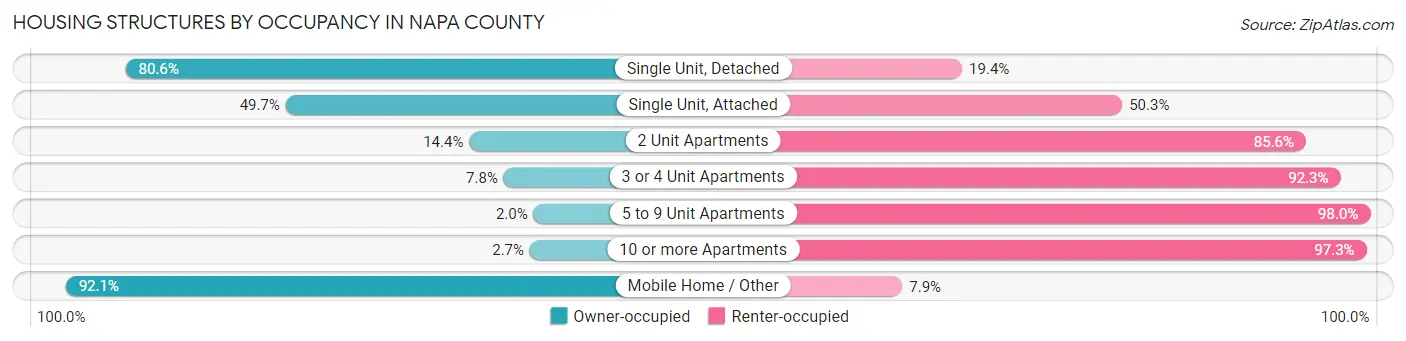
| Structure Type | Owner-occupied | Renter-occupied |
| Single Unit, Detached | 26,902 (80.6%) | 6,490 (19.4%) |
| Single Unit, Attached | 1,395 (49.7%) | 1,410 (50.3%) |
| 2 Unit Apartments | 179 (14.4%) | 1,065 (85.6%) |
| 3 or 4 Unit Apartments | 134 (7.7%) | 1,594 (92.2%) |
| 5 to 9 Unit Apartments | 33 (2.0%) | 1,605 (98.0%) |
| 10 or more Apartments | 131 (2.7%) | 4,694 (97.3%) |
| Mobile Home / Other | 3,302 (92.1%) | 284 (7.9%) |
| Total | 32,076 (65.2%) | 17,142 (34.8%) |
Housing Structures by Number of Rooms in Napa County
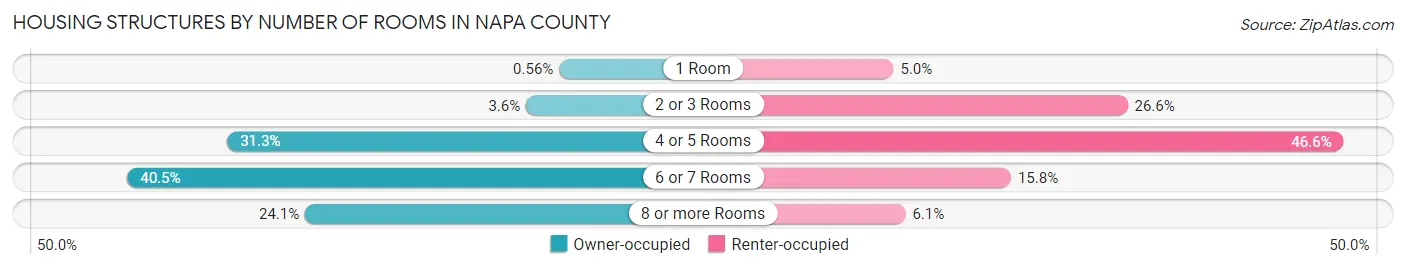
| Number of Rooms | Owner-occupied | Renter-occupied |
| 1 Room | 180 (0.6%) | 850 (5.0%) |
| 2 or 3 Rooms | 1,161 (3.6%) | 4,559 (26.6%) |
| 4 or 5 Rooms | 10,027 (31.3%) | 7,983 (46.6%) |
| 6 or 7 Rooms | 12,992 (40.5%) | 2,712 (15.8%) |
| 8 or more Rooms | 7,716 (24.1%) | 1,038 (6.1%) |
| Total | 32,076 (100.0%) | 17,142 (100.0%) |
Housing Structure by Heating Type in Napa County
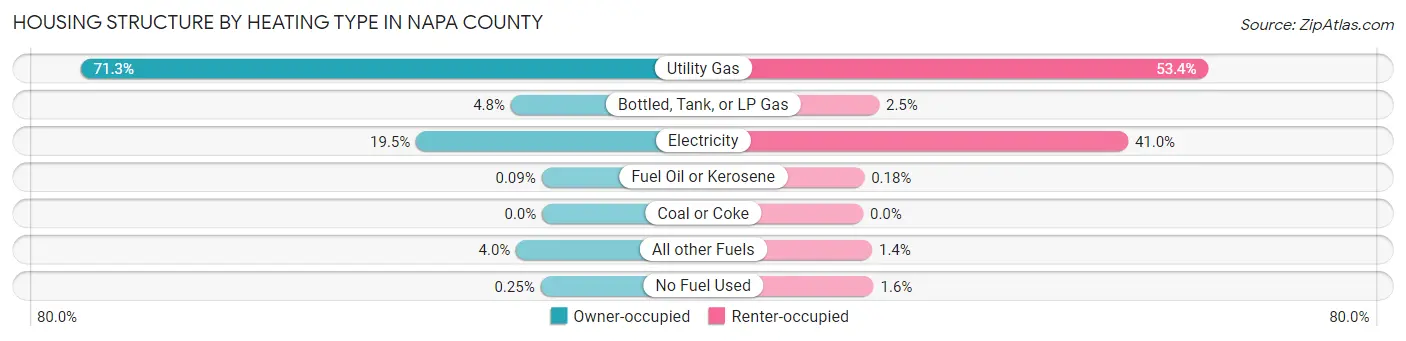
| Heating Type | Owner-occupied | Renter-occupied |
| Utility Gas | 22,882 (71.3%) | 9,150 (53.4%) |
| Bottled, Tank, or LP Gas | 1,551 (4.8%) | 424 (2.5%) |
| Electricity | 6,249 (19.5%) | 7,020 (40.9%) |
| Fuel Oil or Kerosene | 30 (0.1%) | 30 (0.2%) |
| Coal or Coke | 0 (0.0%) | 0 (0.0%) |
| All other Fuels | 1,285 (4.0%) | 238 (1.4%) |
| No Fuel Used | 79 (0.3%) | 280 (1.6%) |
| Total | 32,076 (100.0%) | 17,142 (100.0%) |
Household Vehicle Usage in Napa County
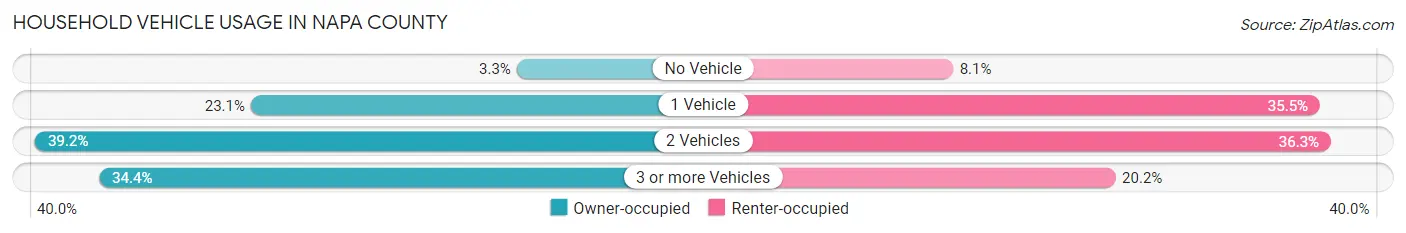
| Vehicles per Household | Owner-occupied | Renter-occupied |
| No Vehicle | 1,041 (3.3%) | 1,380 (8.1%) |
| 1 Vehicle | 7,412 (23.1%) | 6,081 (35.5%) |
| 2 Vehicles | 12,579 (39.2%) | 6,221 (36.3%) |
| 3 or more Vehicles | 11,044 (34.4%) | 3,460 (20.2%) |
| Total | 32,076 (100.0%) | 17,142 (100.0%) |
Real Estate & Mortgages in Napa County
Real Estate and Mortgage Overview in Napa County
| Characteristic | Without Mortgage | With Mortgage |
| Housing Units | 11,803 | 20,273 |
| Median Property Value | $728,800 | $819,800 |
| Median Household Income | $92,232 | $9,897 |
| Monthly Housing Costs | $832 | $10,705 |
| Real Estate Taxes | $3,641 | $453 |
Property Value by Mortgage Status in Napa County
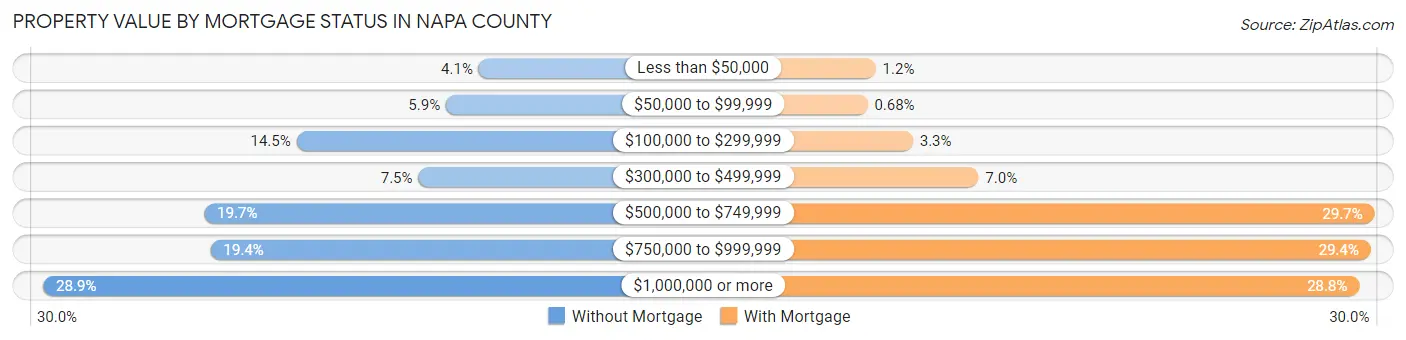
| Property Value | Without Mortgage | With Mortgage |
| Less than $50,000 | 478 (4.1%) | 234 (1.1%) |
| $50,000 to $99,999 | 699 (5.9%) | 138 (0.7%) |
| $100,000 to $299,999 | 1,707 (14.5%) | 662 (3.3%) |
| $300,000 to $499,999 | 885 (7.5%) | 1,424 (7.0%) |
| $500,000 to $749,999 | 2,330 (19.7%) | 6,013 (29.7%) |
| $750,000 to $999,999 | 2,288 (19.4%) | 5,968 (29.4%) |
| $1,000,000 or more | 3,416 (28.9%) | 5,834 (28.8%) |
| Total | 11,803 (100.0%) | 20,273 (100.0%) |
Household Income by Mortgage Status in Napa County
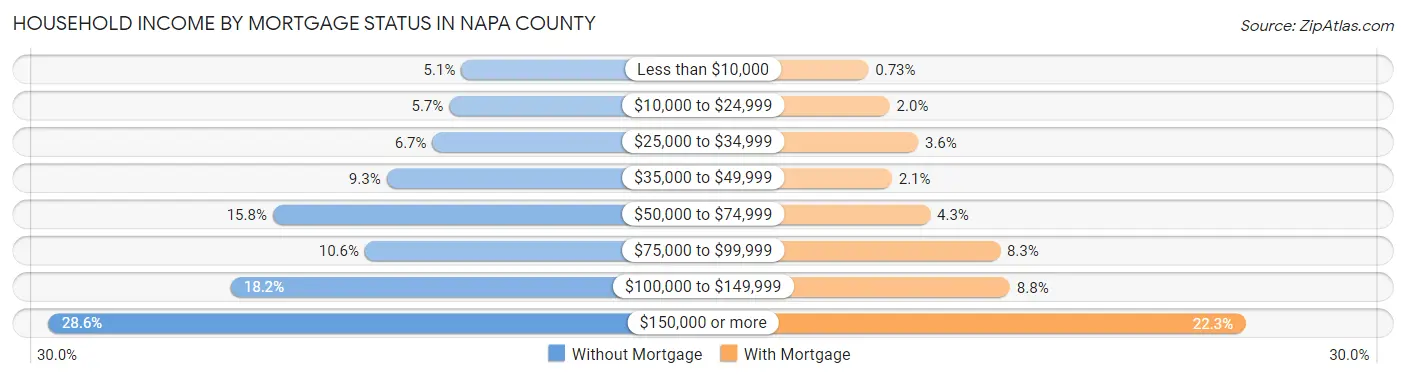
| Household Income | Without Mortgage | With Mortgage |
| Less than $10,000 | 596 (5.1%) | 148 (0.7%) |
| $10,000 to $24,999 | 677 (5.7%) | 396 (1.9%) |
| $25,000 to $34,999 | 791 (6.7%) | 724 (3.6%) |
| $35,000 to $49,999 | 1,100 (9.3%) | 419 (2.1%) |
| $50,000 to $74,999 | 1,867 (15.8%) | 864 (4.3%) |
| $75,000 to $99,999 | 1,246 (10.6%) | 1,673 (8.3%) |
| $100,000 to $149,999 | 2,149 (18.2%) | 1,789 (8.8%) |
| $150,000 or more | 3,377 (28.6%) | 4,511 (22.3%) |
| Total | 11,803 (100.0%) | 20,273 (100.0%) |
Property Value to Household Income Ratio in Napa County
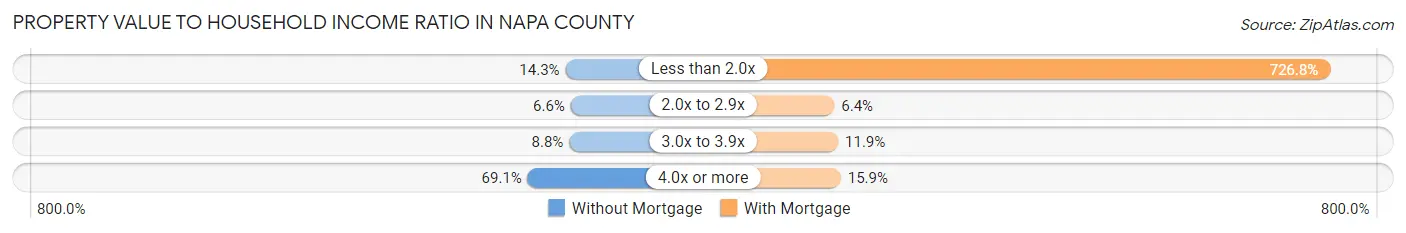
| Value-to-Income Ratio | Without Mortgage | With Mortgage |
| Less than 2.0x | 1,682 (14.2%) | 147,336 (726.8%) |
| 2.0x to 2.9x | 784 (6.6%) | 1,299 (6.4%) |
| 3.0x to 3.9x | 1,036 (8.8%) | 2,418 (11.9%) |
| 4.0x or more | 8,158 (69.1%) | 3,216 (15.9%) |
| Total | 11,803 (100.0%) | 20,273 (100.0%) |
Real Estate Taxes by Mortgage Status in Napa County
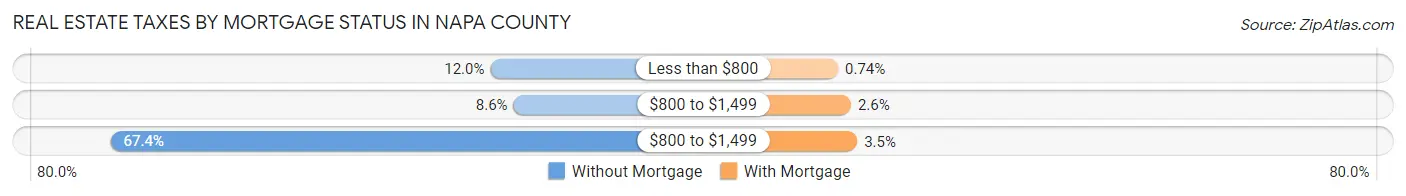
| Property Taxes | Without Mortgage | With Mortgage |
| Less than $800 | 1,411 (11.9%) | 150 (0.7%) |
| $800 to $1,499 | 1,012 (8.6%) | 531 (2.6%) |
| $800 to $1,499 | 7,958 (67.4%) | 715 (3.5%) |
| Total | 11,803 (100.0%) | 20,273 (100.0%) |
Health & Disability in Napa County
Health Insurance Coverage by Age in Napa County
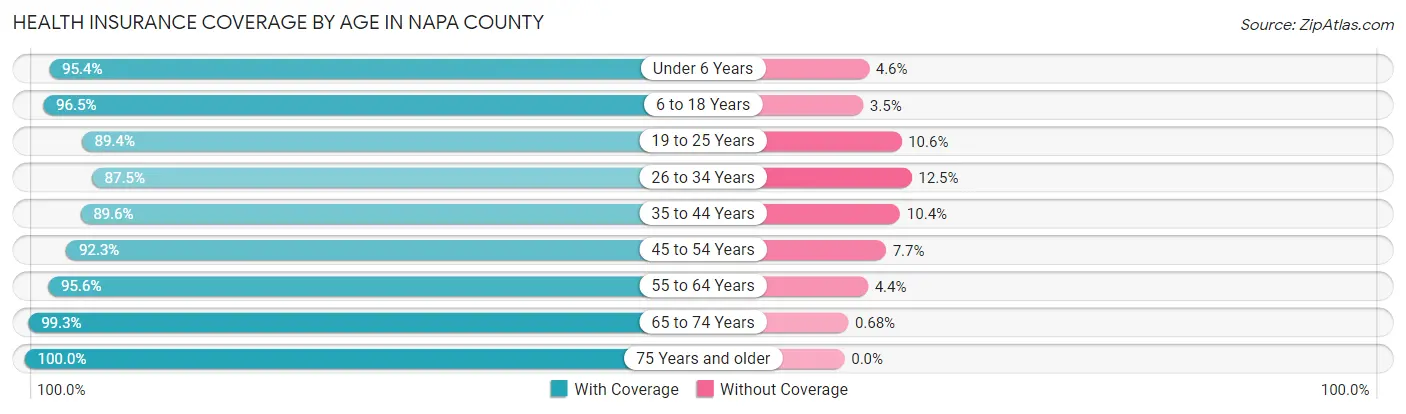
| Age Bracket | With Coverage | Without Coverage |
| Under 6 Years | 7,293 (95.4%) | 349 (4.6%) |
| 6 to 18 Years | 20,807 (96.5%) | 749 (3.5%) |
| 19 to 25 Years | 10,045 (89.4%) | 1,193 (10.6%) |
| 26 to 34 Years | 13,255 (87.5%) | 1,894 (12.5%) |
| 35 to 44 Years | 15,709 (89.6%) | 1,817 (10.4%) |
| 45 to 54 Years | 16,203 (92.3%) | 1,355 (7.7%) |
| 55 to 64 Years | 17,582 (95.6%) | 803 (4.4%) |
| 65 to 74 Years | 15,110 (99.3%) | 104 (0.7%) |
| 75 Years and older | 11,602 (100.0%) | 0 (0.0%) |
| Total | 127,606 (93.9%) | 8,264 (6.1%) |
Health Insurance Coverage by Citizenship Status in Napa County

| Citizenship Status | With Coverage | Without Coverage |
| Native Born | 7,293 (95.4%) | 349 (4.6%) |
| Foreign Born, Citizen | 20,807 (96.5%) | 749 (3.5%) |
| Foreign Born, not a Citizen | 10,045 (89.4%) | 1,193 (10.6%) |
Health Insurance Coverage by Household Income in Napa County
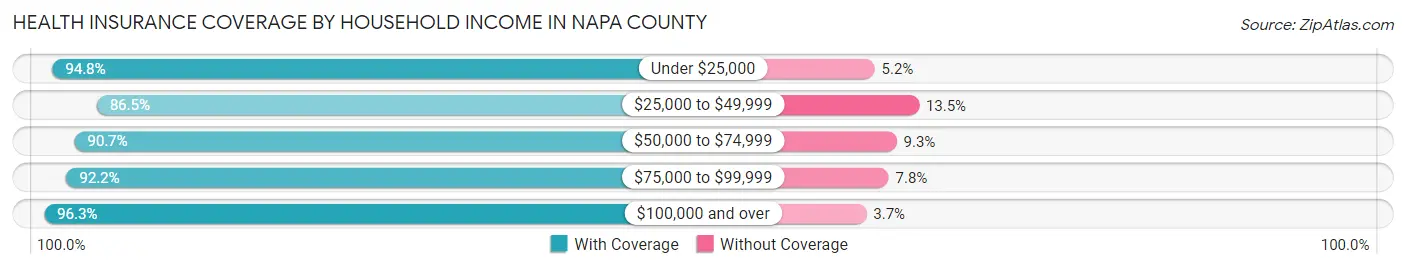
| Household Income | With Coverage | Without Coverage |
| Under $25,000 | 6,727 (94.8%) | 370 (5.2%) |
| $25,000 to $49,999 | 11,754 (86.5%) | 1,837 (13.5%) |
| $50,000 to $74,999 | 15,421 (90.7%) | 1,587 (9.3%) |
| $75,000 to $99,999 | 13,408 (92.2%) | 1,139 (7.8%) |
| $100,000 and over | 78,043 (96.3%) | 2,975 (3.7%) |
Public vs Private Health Insurance Coverage by Age in Napa County
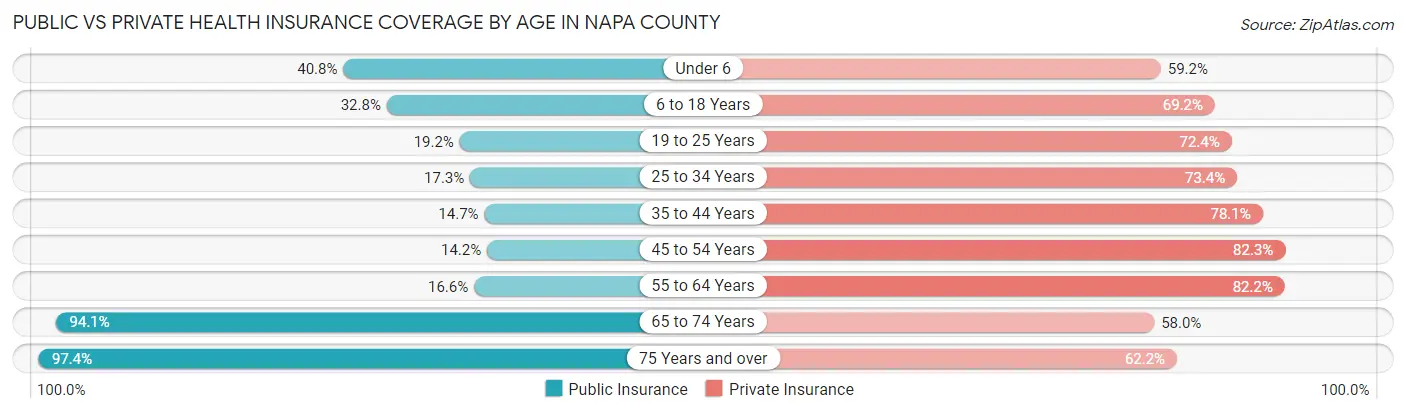
| Age Bracket | Public Insurance | Private Insurance |
| Under 6 | 3,121 (40.8%) | 4,525 (59.2%) |
| 6 to 18 Years | 7,065 (32.8%) | 14,925 (69.2%) |
| 19 to 25 Years | 2,162 (19.2%) | 8,132 (72.4%) |
| 25 to 34 Years | 2,623 (17.3%) | 11,113 (73.4%) |
| 35 to 44 Years | 2,568 (14.6%) | 13,686 (78.1%) |
| 45 to 54 Years | 2,486 (14.2%) | 14,449 (82.3%) |
| 55 to 64 Years | 3,047 (16.6%) | 15,114 (82.2%) |
| 65 to 74 Years | 14,316 (94.1%) | 8,823 (58.0%) |
| 75 Years and over | 11,294 (97.4%) | 7,216 (62.2%) |
| Total | 48,682 (35.8%) | 97,983 (72.1%) |
Disability Status by Sex by Age in Napa County
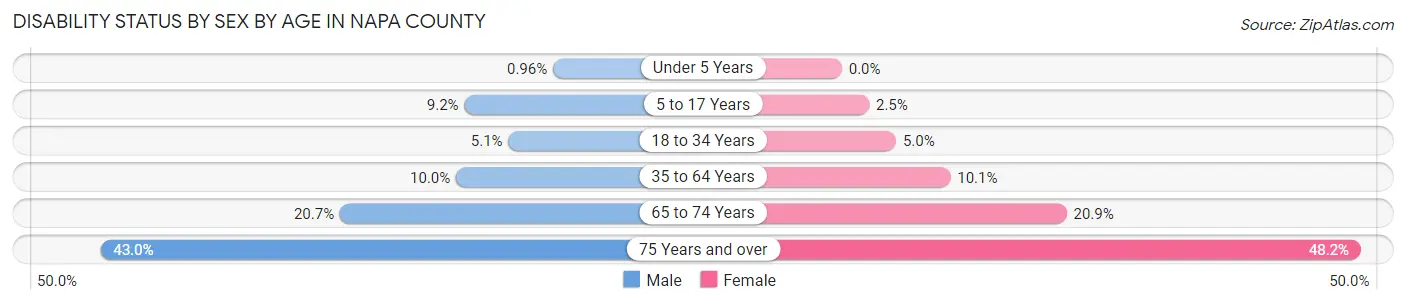
| Age Bracket | Male | Female |
| Under 5 Years | 31 (1.0%) | 0 (0.0%) |
| 5 to 17 Years | 997 (9.2%) | 259 (2.5%) |
| 18 to 34 Years | 730 (5.1%) | 697 (5.0%) |
| 35 to 64 Years | 2,690 (10.0%) | 2,661 (10.1%) |
| 65 to 74 Years | 1,513 (20.7%) | 1,651 (20.9%) |
| 75 Years and over | 2,265 (43.0%) | 3,050 (48.2%) |
Disability Class by Sex by Age in Napa County
Disability Class: Hearing Difficulty
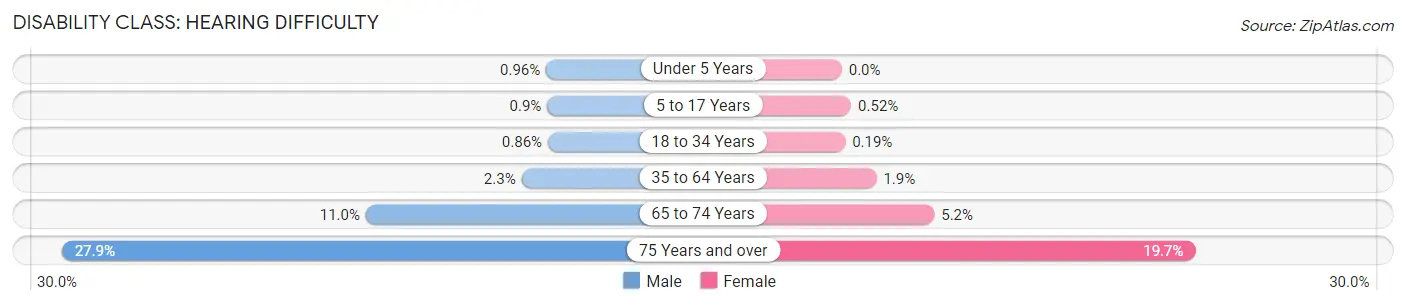
| Age Bracket | Male | Female |
| Under 5 Years | 31 (1.0%) | 0 (0.0%) |
| 5 to 17 Years | 98 (0.9%) | 53 (0.5%) |
| 18 to 34 Years | 123 (0.9%) | 27 (0.2%) |
| 35 to 64 Years | 631 (2.3%) | 511 (1.9%) |
| 65 to 74 Years | 803 (11.0%) | 408 (5.1%) |
| 75 Years and over | 1,472 (27.9%) | 1,246 (19.7%) |
Disability Class: Vision Difficulty
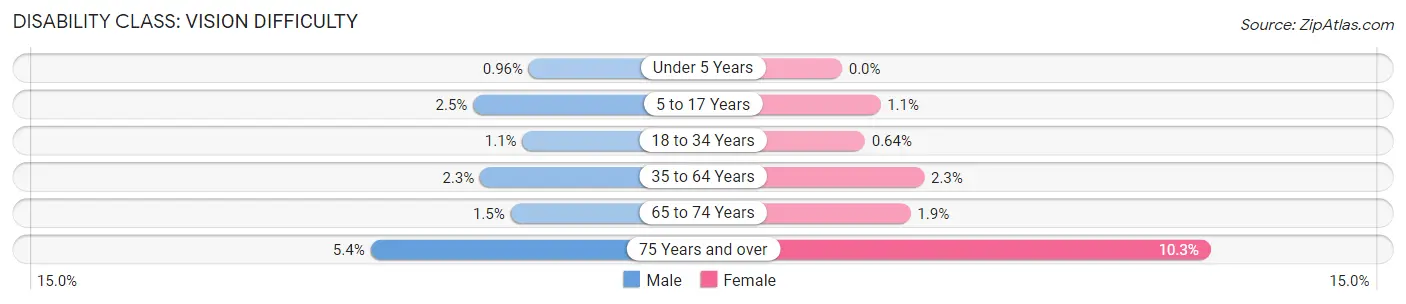
| Age Bracket | Male | Female |
| Under 5 Years | 31 (1.0%) | 0 (0.0%) |
| 5 to 17 Years | 272 (2.5%) | 109 (1.1%) |
| 18 to 34 Years | 163 (1.1%) | 89 (0.6%) |
| 35 to 64 Years | 628 (2.3%) | 605 (2.3%) |
| 65 to 74 Years | 107 (1.5%) | 151 (1.9%) |
| 75 Years and over | 283 (5.4%) | 650 (10.3%) |
Disability Class: Cognitive Difficulty
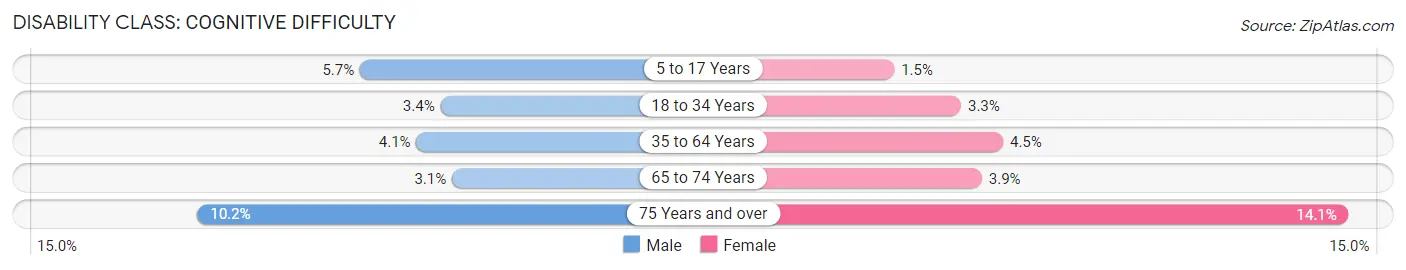
| Age Bracket | Male | Female |
| 5 to 17 Years | 614 (5.7%) | 149 (1.5%) |
| 18 to 34 Years | 490 (3.4%) | 461 (3.3%) |
| 35 to 64 Years | 1,105 (4.1%) | 1,188 (4.5%) |
| 65 to 74 Years | 226 (3.1%) | 309 (3.9%) |
| 75 Years and over | 537 (10.2%) | 893 (14.1%) |
Disability Class: Ambulatory Difficulty
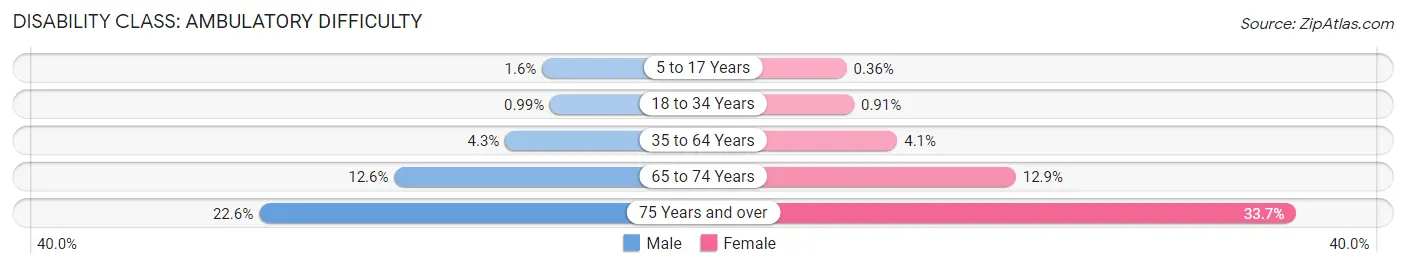
| Age Bracket | Male | Female |
| 5 to 17 Years | 170 (1.6%) | 37 (0.4%) |
| 18 to 34 Years | 142 (1.0%) | 126 (0.9%) |
| 35 to 64 Years | 1,169 (4.3%) | 1,090 (4.1%) |
| 65 to 74 Years | 916 (12.6%) | 1,023 (12.9%) |
| 75 Years and over | 1,191 (22.6%) | 2,135 (33.7%) |
Disability Class: Self-Care Difficulty
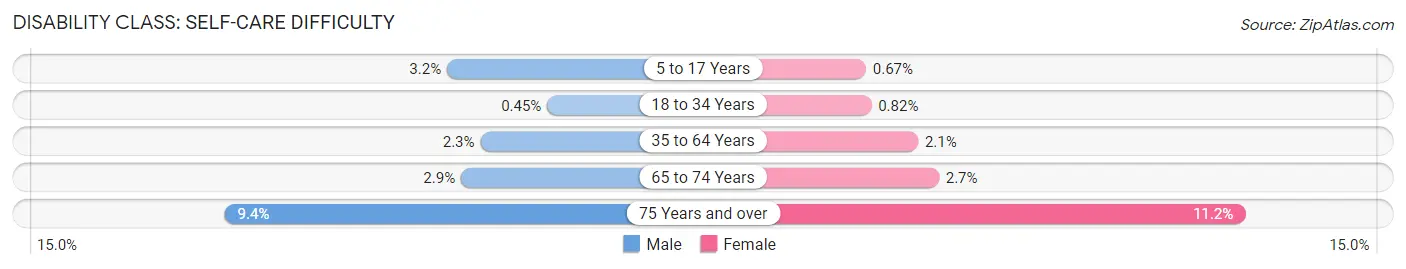
| Age Bracket | Male | Female |
| 5 to 17 Years | 352 (3.2%) | 68 (0.7%) |
| 18 to 34 Years | 64 (0.4%) | 114 (0.8%) |
| 35 to 64 Years | 624 (2.3%) | 561 (2.1%) |
| 65 to 74 Years | 208 (2.9%) | 214 (2.7%) |
| 75 Years and over | 497 (9.4%) | 711 (11.2%) |
Technology Access in Napa County
Computing Device Access in Napa County
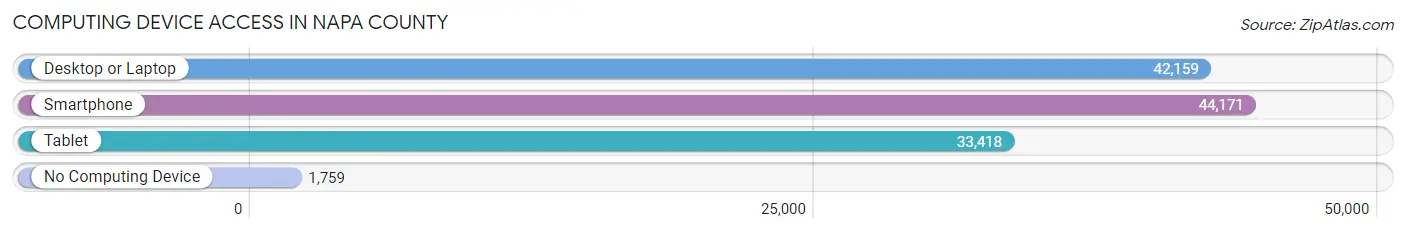
| Device Type | # Households | % Households |
| Desktop or Laptop | 42,159 | 85.7% |
| Smartphone | 44,171 | 89.7% |
| Tablet | 33,418 | 67.9% |
| No Computing Device | 1,759 | 3.6% |
| Total | 49,218 | 100.0% |
Internet Access in Napa County
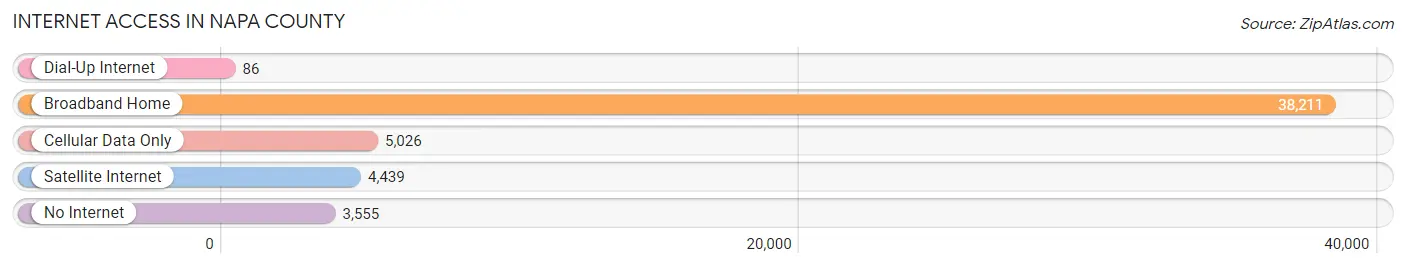
| Internet Type | # Households | % Households |
| Dial-Up Internet | 86 | 0.2% |
| Broadband Home | 38,211 | 77.6% |
| Cellular Data Only | 5,026 | 10.2% |
| Satellite Internet | 4,439 | 9.0% |
| No Internet | 3,555 | 7.2% |
| Total | 49,218 | 100.0% |
Napa County Summary
Napa County is a county located in the northern part of the U.S. state of California. It is part of the San Francisco Bay Area and is one of the nine counties that make up the Bay Area. The county seat is the city of Napa. As of the 2010 census, the population was 136,484. The county is known for its wine production, and is home to the Napa Valley AVA, one of the world’s premier wine regions.
History
The area that is now Napa County was originally inhabited by the Wappo and Patwin Native American tribes. The first European settlers arrived in the area in the late 18th century, and the county was officially established in 1850. The county was named after the Napa Valley, which was named by early Spanish explorers after the Native American village of Napa.
The county experienced rapid growth in the late 19th and early 20th centuries, as the area became a popular destination for tourists and wine enthusiasts. The county’s population peaked in the 1950s, and has since declined due to the rise of suburbanization in the Bay Area.
Geography
Napa County is located in the northern part of California, in the San Francisco Bay Area. It is bordered by Sonoma County to the north, Lake County to the east, Solano County to the south, and Marin County to the west. The county covers an area of 828 square miles, and is home to several mountain ranges, including the Mayacamas Mountains, Vaca Mountains, and the Sonoma Mountains.
The county is home to several rivers, including the Napa River, which flows through the county from north to south. The county also contains several lakes, including Lake Berryessa, which is the largest lake in the county.
Economy
Napa County’s economy is largely based on agriculture and tourism. The county is home to several wineries, and is one of the world’s premier wine regions. The county is also home to several other agricultural products, including olives, walnuts, and almonds.
Tourism is also a major part of the county’s economy. The county is home to several popular tourist attractions, including the Napa Valley Wine Train, the Napa Valley Opera House, and the Napa Valley Balloon Ride.
Demographics
As of the 2010 census, the population of Napa County was 136,484. The racial makeup of the county was 79.2% White, 5.3% African American, 0.7% Native American, 5.2% Asian, 0.2% Pacific Islander, and 8.2% from other races. The median household income was $68,845, and the median family income was $77,845.
Conclusion
Napa County is a county located in the northern part of the U.S. state of California. It is part of the San Francisco Bay Area and is one of the nine counties that make up the Bay Area. The county is known for its wine production, and is home to the Napa Valley AVA, one of the world’s premier wine regions. The county’s economy is largely based on agriculture and tourism, and the population of the county was 136,484 as of the 2010 census.
Common Questions
What is Per Capita Income in Napa County?
Per Capita income in Napa County is $54,306.
What is the Median Family Income in Napa County?
Median Family Income in Napa County is $122,540.
What is the Median Household income in Napa County?
Median Household Income in Napa County is $105,809.
What is Income or Wage Gap in Napa County?
Income or Wage Gap in Napa County is 17.4%.
Women in Napa County earn 82.6 cents for every dollar earned by a man.
What is Family Income Deficit in Napa County?
Family Income Deficit in Napa County is $9,565.
Families that are below poverty line in Napa County earn $9,565 less on average than the poverty threshold level.
What is Inequality or Gini Index in Napa County?
Inequality or Gini Index in Napa County is 0.48.
What is the Total Population of Napa County?
Total Population of Napa County is 137,384.
What is the Total Male Population of Napa County?
Total Male Population of Napa County is 68,760.
What is the Total Female Population of Napa County?
Total Female Population of Napa County is 68,624.
What is the Ratio of Males per 100 Females in Napa County?
There are 100.20 Males per 100 Females in Napa County.
What is the Ratio of Females per 100 Males in Napa County?
There are 99.80 Females per 100 Males in Napa County.
What is the Median Population Age in Napa County?
Median Population Age in Napa County is 42.5 Years.
What is the Average Family Size in Napa County
Average Family Size in Napa County is 3.3 People.
What is the Average Household Size in Napa County
Average Household Size in Napa County is 2.7 People.
How Large is the Labor Force in Napa County?
There are 72,160 People in the Labor Forcein in Napa County.
What is the Percentage of People in the Labor Force in Napa County?
63.4% of People are in the Labor Force in Napa County.
What is the Unemployment Rate in Napa County?
Unemployment Rate in Napa County is 5.2%.