Modoc County, CA Map & Demographics
Modoc County Map
Modoc County Overview
$28,860
PER CAPITA INCOME
$61,250
AVG FAMILY INCOME
$54,962
AVG HOUSEHOLD INCOME
45.2%
WAGE / INCOME GAP [ % ]
54.8¢/ $1
WAGE / INCOME GAP [ $ ]
$8,758
FAMILY INCOME DEFICIT
0.41
INEQUALITY / GINI INDEX
8,651
TOTAL POPULATION
4,205
MALE POPULATION
4,446
FEMALE POPULATION
94.58
MALES / 100 FEMALES
105.73
FEMALES / 100 MALES
47.5
MEDIAN AGE
2.9
AVG FAMILY SIZE
2.4
AVG HOUSEHOLD SIZE
3,469
LABOR FORCE [ PEOPLE ]
48.3%
PERCENT IN LABOR FORCE
7.6%
UNEMPLOYMENT RATE
Modoc County Area Codes
Income in Modoc County
Income Overview in Modoc County
Per Capita Income in Modoc County is $28,860, while median incomes of families and households are $61,250 and $54,962 respectively.
| Characteristic | Number | Measure |
| Per Capita Income | 8,651 | $28,860 |
| Median Family Income | 2,264 | $61,250 |
| Mean Family Income | 2,264 | $76,729 |
| Median Household Income | 3,403 | $54,962 |
| Mean Household Income | 3,403 | $68,080 |
| Income Deficit | 2,264 | $8,758 |
| Wage / Income Gap (%) | 8,651 | 45.18% |
| Wage / Income Gap ($) | 8,651 | 54.82¢ per $1 |
| Gini / Inequality Index | 8,651 | 0.41 |
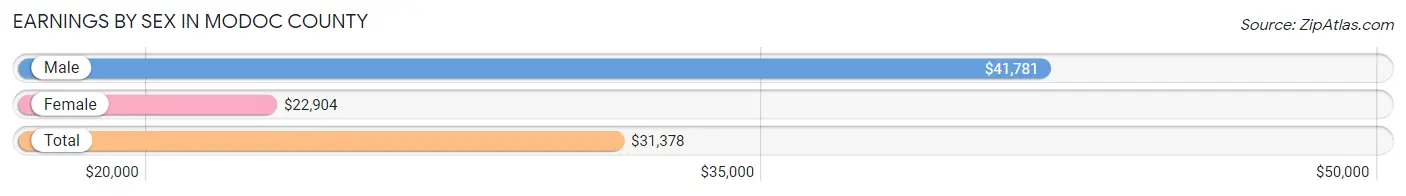
Earnings by Sex in Modoc County
Average Earnings in Modoc County are $31,378, $41,781 for men and $22,904 for women, a difference of 45.2%.
| Sex | Number | Average Earnings |
| Male | 1,755 (48.0%) | $41,781 |
| Female | 1,898 (52.0%) | $22,904 |
| Total | 3,653 (100.0%) | $31,378 |
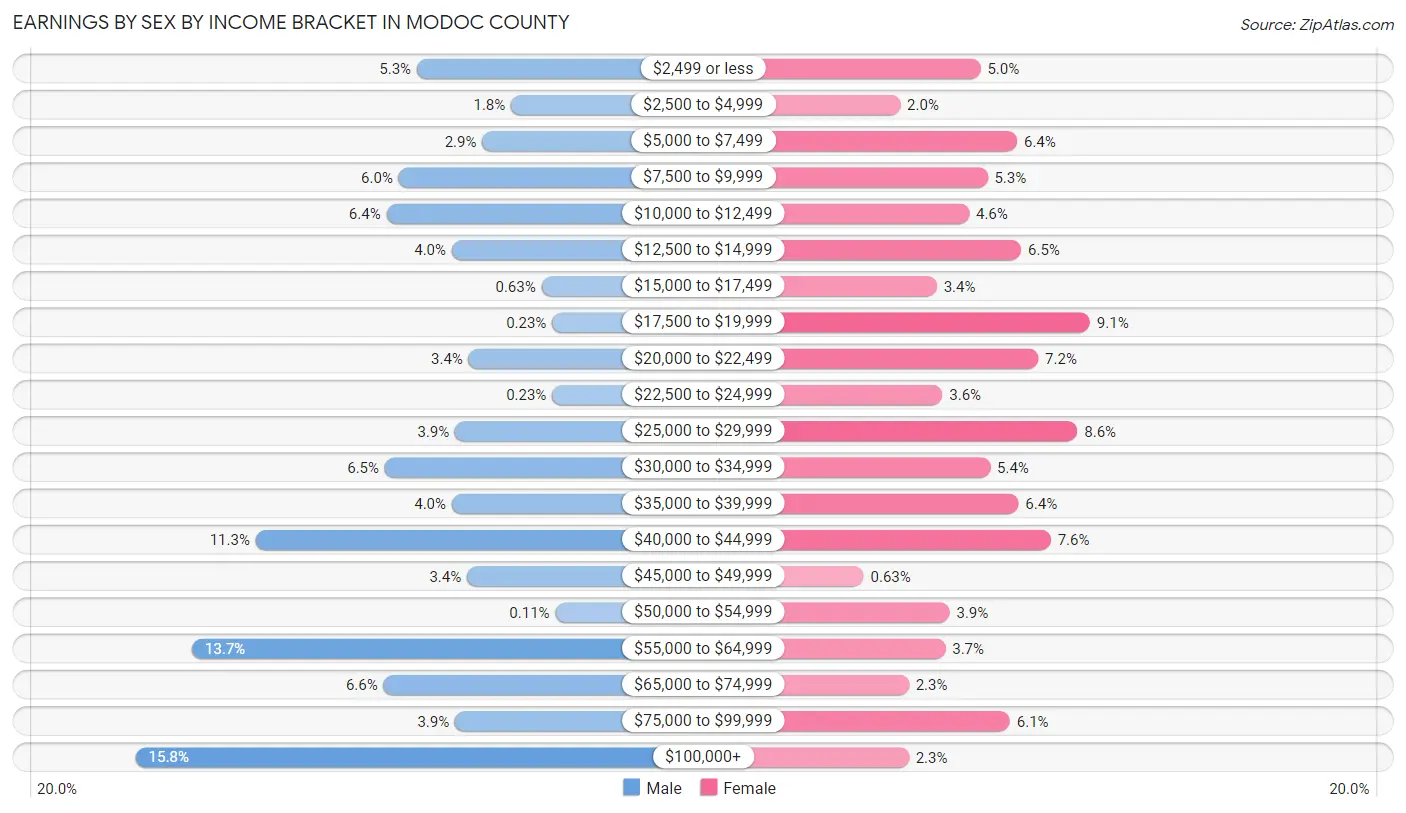
Earnings by Sex by Income Bracket in Modoc County
The most common earnings brackets in Modoc County are $100,000+ for men (278 | 15.8%) and $17,500 to $19,999 for women (173 | 9.1%).
| Income | Male | Female |
| $2,499 or less | 93 (5.3%) | 95 (5.0%) |
| $2,500 to $4,999 | 31 (1.8%) | 38 (2.0%) |
| $5,000 to $7,499 | 50 (2.9%) | 121 (6.4%) |
| $7,500 to $9,999 | 105 (6.0%) | 100 (5.3%) |
| $10,000 to $12,499 | 113 (6.4%) | 87 (4.6%) |
| $12,500 to $14,999 | 70 (4.0%) | 124 (6.5%) |
| $15,000 to $17,499 | 11 (0.6%) | 64 (3.4%) |
| $17,500 to $19,999 | 4 (0.2%) | 173 (9.1%) |
| $20,000 to $22,499 | 59 (3.4%) | 136 (7.2%) |
| $22,500 to $24,999 | 4 (0.2%) | 68 (3.6%) |
| $25,000 to $29,999 | 68 (3.9%) | 164 (8.6%) |
| $30,000 to $34,999 | 114 (6.5%) | 102 (5.4%) |
| $35,000 to $39,999 | 70 (4.0%) | 122 (6.4%) |
| $40,000 to $44,999 | 199 (11.3%) | 145 (7.6%) |
| $45,000 to $49,999 | 60 (3.4%) | 12 (0.6%) |
| $50,000 to $54,999 | 2 (0.1%) | 73 (3.8%) |
| $55,000 to $64,999 | 241 (13.7%) | 70 (3.7%) |
| $65,000 to $74,999 | 115 (6.6%) | 44 (2.3%) |
| $75,000 to $99,999 | 68 (3.9%) | 116 (6.1%) |
| $100,000+ | 278 (15.8%) | 44 (2.3%) |
| Total | 1,755 (100.0%) | 1,898 (100.0%) |
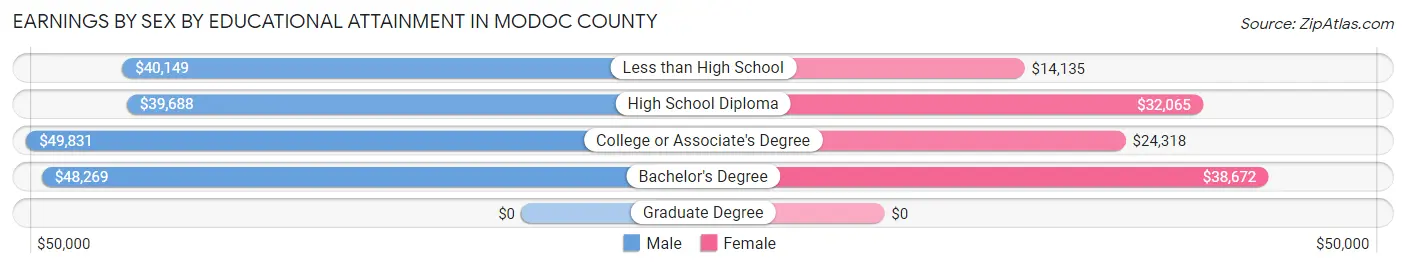
Earnings by Sex by Educational Attainment in Modoc County
Average earnings in Modoc County are $43,576 for men and $26,029 for women, a difference of 40.3%. Men with an educational attainment of college or associate's degree enjoy the highest average annual earnings of $49,831, while those with high school diploma education earn the least with $39,688. Women with an educational attainment of bachelor's degree earn the most with the average annual earnings of $38,672, while those with less than high school education have the smallest earnings of $14,135.
| Educational Attainment | Male Income | Female Income |
| Less than High School | $40,149 | $14,135 |
| High School Diploma | $39,688 | $32,065 |
| College or Associate's Degree | $49,831 | $24,318 |
| Bachelor's Degree | $48,269 | $38,672 |
| Graduate Degree | - | - |
| Total | $43,576 | $26,029 |
Family Income in Modoc County
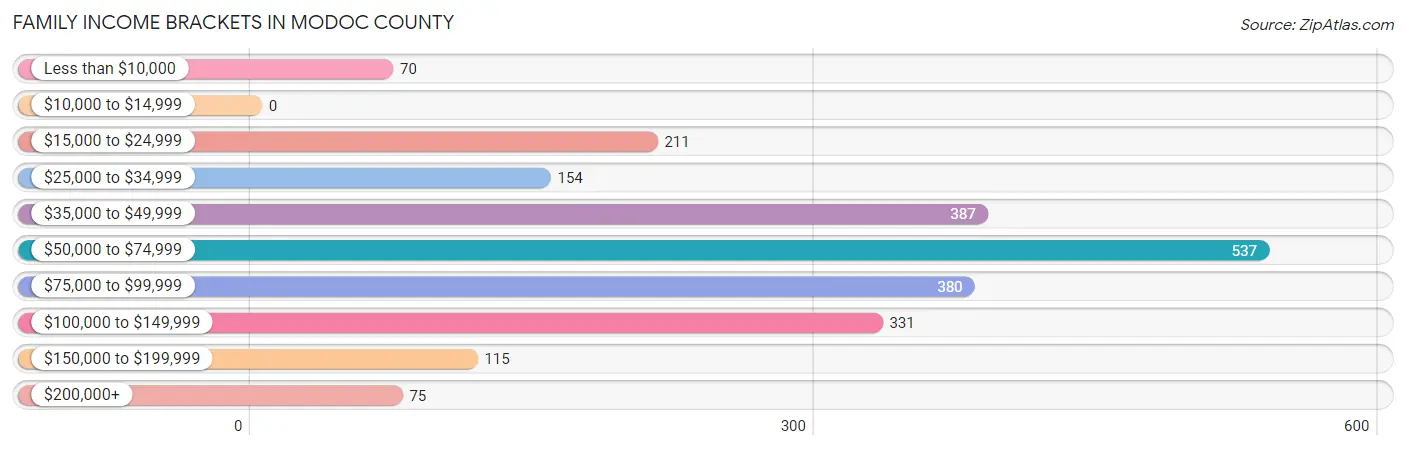
Family Income Brackets in Modoc County
According to the Modoc County family income data, there are 537 families falling into the $50,000 to $74,999 income range, which is the most common income bracket and makes up 23.7% of all families.
| Income Bracket | # Families | % Families |
| Less than $10,000 | 70 | 3.1% |
| $10,000 to $14,999 | 0 | 0.0% |
| $15,000 to $24,999 | 211 | 9.3% |
| $25,000 to $34,999 | 154 | 6.8% |
| $35,000 to $49,999 | 387 | 17.1% |
| $50,000 to $74,999 | 537 | 23.7% |
| $75,000 to $99,999 | 380 | 16.8% |
| $100,000 to $149,999 | 331 | 14.6% |
| $150,000 to $199,999 | 115 | 5.1% |
| $200,000+ | 75 | 3.3% |
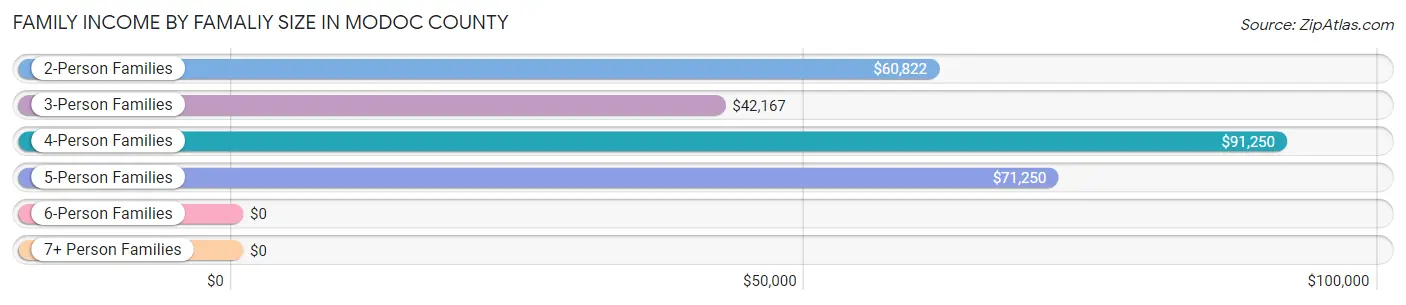
Family Income by Famaliy Size in Modoc County
4-person families (260 | 11.5%) account for the highest median family income in Modoc County with $91,250 per family, while 2-person families (1,493 | 65.9%) have the highest median income of $30,411 per family member.
| Income Bracket | # Families | Median Income |
| 2-Person Families | 1,493 (65.9%) | $60,822 |
| 3-Person Families | 274 (12.1%) | $42,167 |
| 4-Person Families | 260 (11.5%) | $91,250 |
| 5-Person Families | 167 (7.4%) | $71,250 |
| 6-Person Families | 53 (2.3%) | $0 |
| 7+ Person Families | 17 (0.7%) | $0 |
| Total | 2,264 (100.0%) | $61,250 |
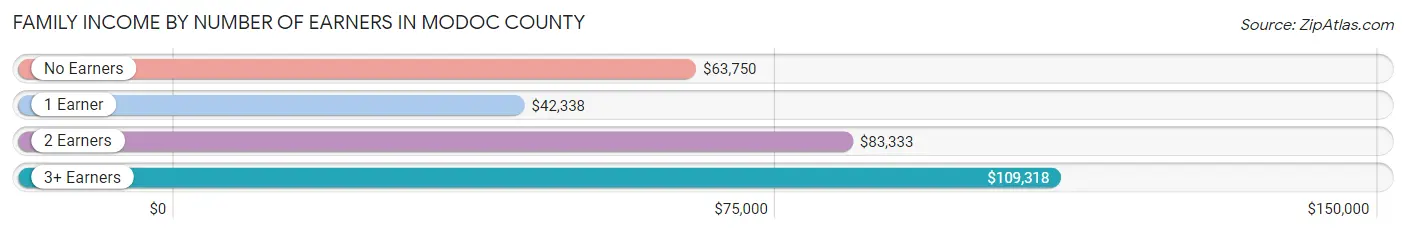
Family Income by Number of Earners in Modoc County
The median family income in Modoc County is $61,250, with families comprising 3+ earners (84) having the highest median family income of $109,318, while families with 1 earner (816) have the lowest median family income of $42,338, accounting for 3.7% and 36.0% of families, respectively.
| Number of Earners | # Families | Median Income |
| No Earners | 616 (27.2%) | $63,750 |
| 1 Earner | 816 (36.0%) | $42,338 |
| 2 Earners | 748 (33.0%) | $83,333 |
| 3+ Earners | 84 (3.7%) | $109,318 |
| Total | 2,264 (100.0%) | $61,250 |
Household Income in Modoc County
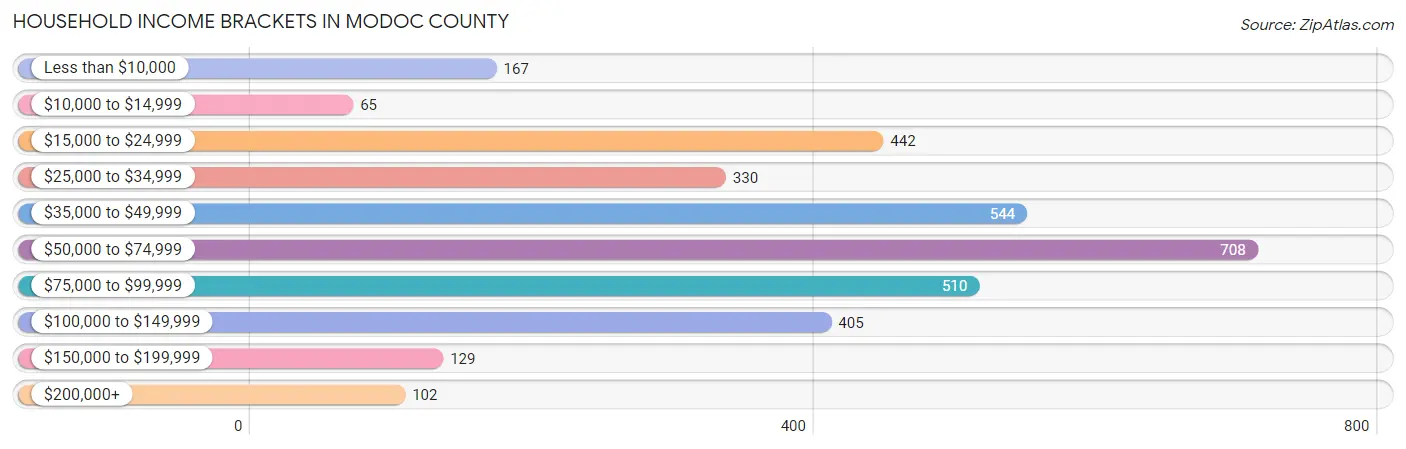
Household Income Brackets in Modoc County
With 708 households falling in the category, the $50,000 to $74,999 income range is the most frequent in Modoc County, accounting for 20.8% of all households. In contrast, only 65 households (1.9%) fall into the $10,000 to $14,999 income bracket, making it the least populous group.
| Income Bracket | # Households | % Households |
| Less than $10,000 | 167 | 4.9% |
| $10,000 to $14,999 | 65 | 1.9% |
| $15,000 to $24,999 | 442 | 13.0% |
| $25,000 to $34,999 | 330 | 9.7% |
| $35,000 to $49,999 | 544 | 16.0% |
| $50,000 to $74,999 | 708 | 20.8% |
| $75,000 to $99,999 | 510 | 15.0% |
| $100,000 to $149,999 | 405 | 11.9% |
| $150,000 to $199,999 | 129 | 3.8% |
| $200,000+ | 102 | 3.0% |
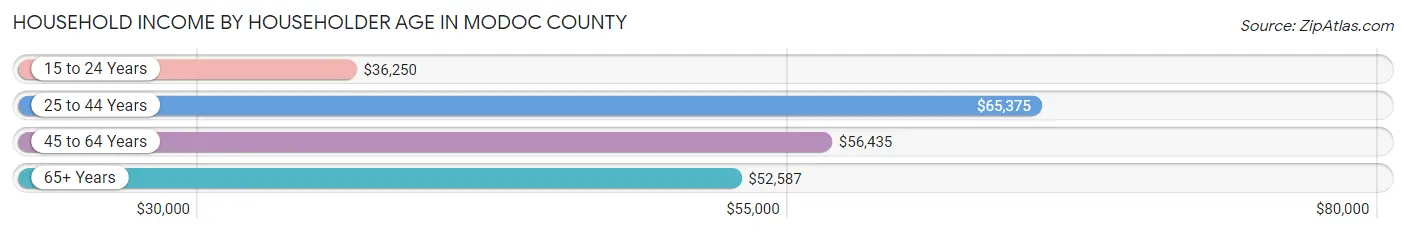
Household Income by Householder Age in Modoc County
The median household income in Modoc County is $54,962, with the highest median household income of $65,375 found in the 25 to 44 years age bracket for the primary householder. A total of 819 households (24.1%) fall into this category. Meanwhile, the 15 to 24 years age bracket for the primary householder has the lowest median household income of $36,250, with 60 households (1.8%) in this group.
| Income Bracket | # Households | Median Income |
| 15 to 24 Years | 60 (1.8%) | $36,250 |
| 25 to 44 Years | 819 (24.1%) | $65,375 |
| 45 to 64 Years | 1,091 (32.1%) | $56,435 |
| 65+ Years | 1,433 (42.1%) | $52,587 |
| Total | 3,403 (100.0%) | $54,962 |
Poverty in Modoc County
Income Below Poverty by Sex and Age in Modoc County
With 15.3% poverty level for males and 18.3% for females among the residents of Modoc County, 15 year old males and 5 year old females are the most vulnerable to poverty, with 12 males (48.0%) and 38 females (37.6%) in their respective age groups living below the poverty level.
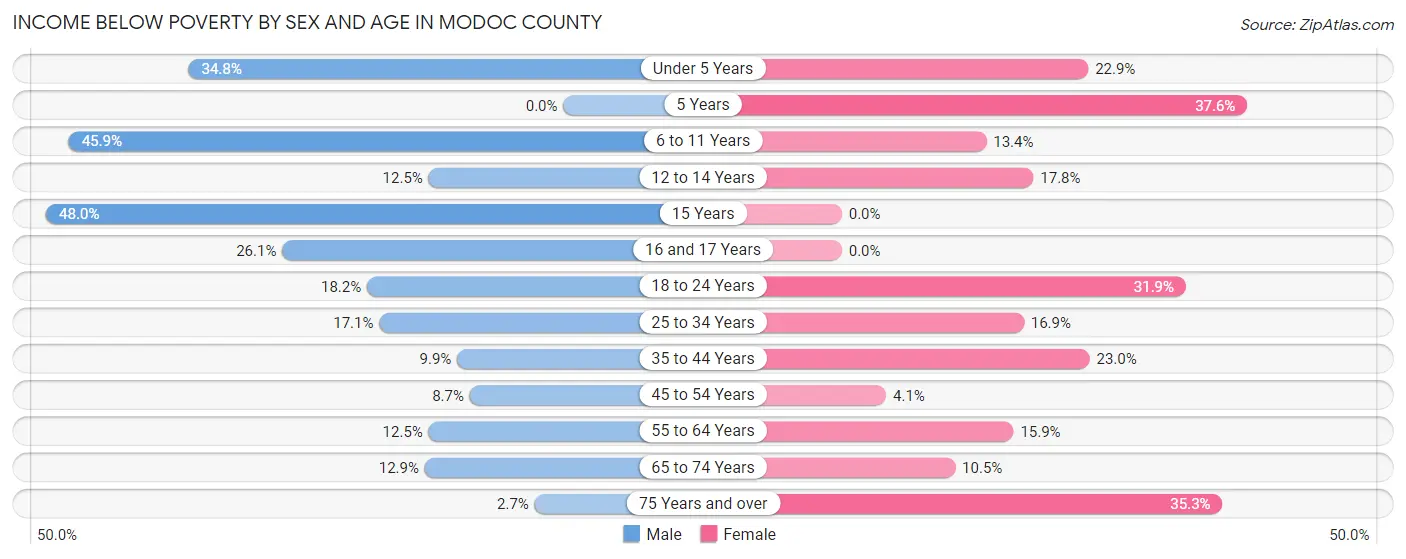
| Age Bracket | Male | Female |
| Under 5 Years | 80 (34.8%) | 43 (22.9%) |
| 5 Years | 0 (0.0%) | 38 (37.6%) |
| 6 to 11 Years | 123 (45.9%) | 35 (13.4%) |
| 12 to 14 Years | 19 (12.5%) | 24 (17.8%) |
| 15 Years | 12 (48.0%) | 0 (0.0%) |
| 16 and 17 Years | 6 (26.1%) | 0 (0.0%) |
| 18 to 24 Years | 45 (18.2%) | 76 (31.9%) |
| 25 to 34 Years | 89 (17.1%) | 87 (16.9%) |
| 35 to 44 Years | 39 (9.9%) | 103 (23.0%) |
| 45 to 54 Years | 35 (8.7%) | 16 (4.1%) |
| 55 to 64 Years | 69 (12.5%) | 101 (15.9%) |
| 65 to 74 Years | 97 (12.9%) | 73 (10.5%) |
| 75 Years and over | 13 (2.7%) | 207 (35.3%) |
| Total | 627 (15.3%) | 803 (18.3%) |
Income Above Poverty by Sex and Age in Modoc County
According to the poverty statistics in Modoc County, males aged 5 years and females aged 15 years are the age groups that are most secure financially, with 100.0% of males and 100.0% of females in these age groups living above the poverty line.
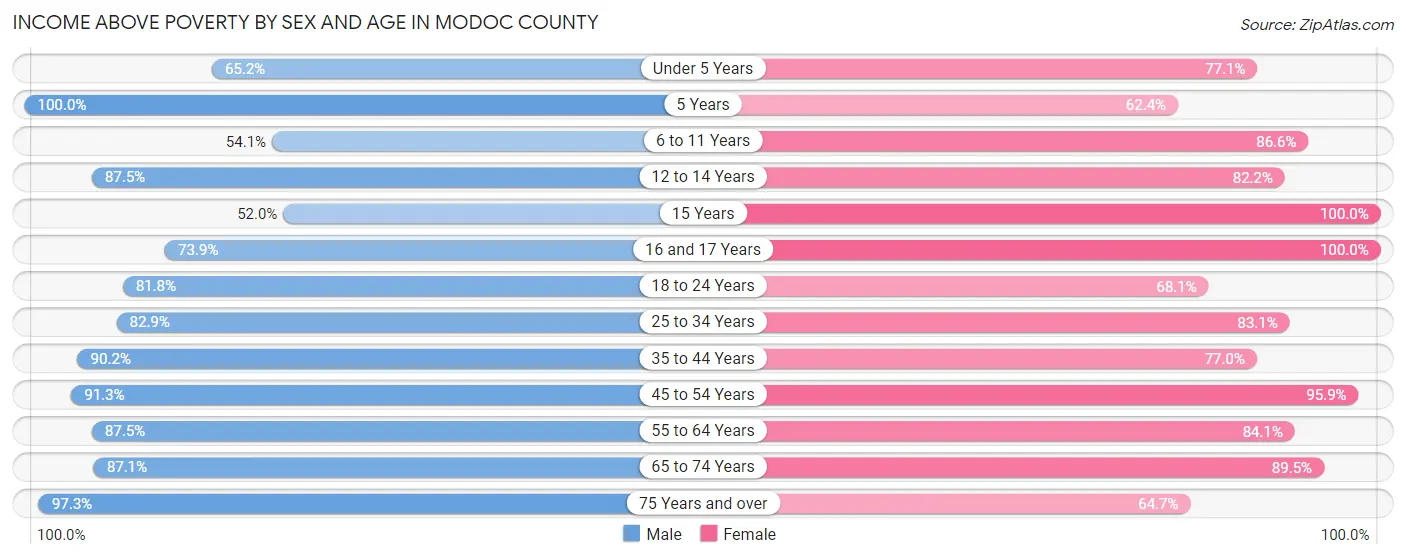
| Age Bracket | Male | Female |
| Under 5 Years | 150 (65.2%) | 145 (77.1%) |
| 5 Years | 28 (100.0%) | 63 (62.4%) |
| 6 to 11 Years | 145 (54.1%) | 226 (86.6%) |
| 12 to 14 Years | 133 (87.5%) | 111 (82.2%) |
| 15 Years | 13 (52.0%) | 50 (100.0%) |
| 16 and 17 Years | 17 (73.9%) | 138 (100.0%) |
| 18 to 24 Years | 202 (81.8%) | 162 (68.1%) |
| 25 to 34 Years | 432 (82.9%) | 428 (83.1%) |
| 35 to 44 Years | 357 (90.1%) | 345 (77.0%) |
| 45 to 54 Years | 368 (91.3%) | 373 (95.9%) |
| 55 to 64 Years | 483 (87.5%) | 533 (84.1%) |
| 65 to 74 Years | 657 (87.1%) | 621 (89.5%) |
| 75 Years and over | 475 (97.3%) | 379 (64.7%) |
| Total | 3,460 (84.7%) | 3,574 (81.7%) |
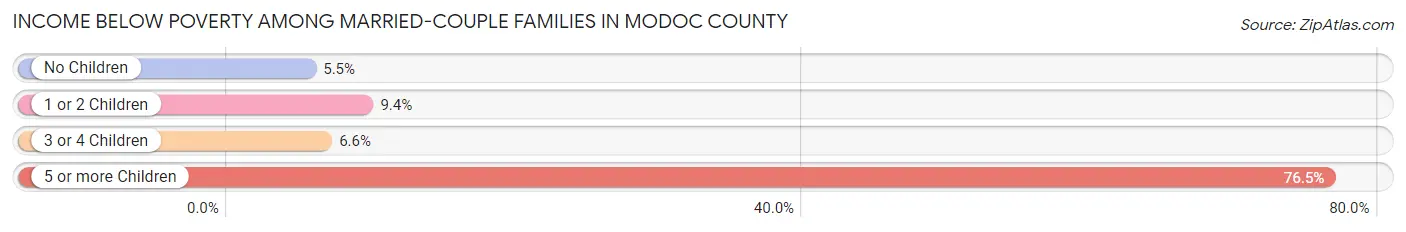
Income Below Poverty Among Married-Couple Families in Modoc County
The poverty statistics for married-couple families in Modoc County show that 7.0% or 124 of the total 1,773 families live below the poverty line. Families with 5 or more children have the highest poverty rate of 76.5%, comprising of 13 families. On the other hand, families with no children have the lowest poverty rate of 5.4%, which includes 70 families.
| Children | Above Poverty | Below Poverty |
| No Children | 1,214 (94.6%) | 70 (5.4%) |
| 1 or 2 Children | 317 (90.6%) | 33 (9.4%) |
| 3 or 4 Children | 114 (93.4%) | 8 (6.6%) |
| 5 or more Children | 4 (23.5%) | 13 (76.5%) |
| Total | 1,649 (93.0%) | 124 (7.0%) |
Income Below Poverty Among Single-Parent Households in Modoc County
According to the poverty data in Modoc County, 25.5% or 40 single-father households and 20.1% or 67 single-mother households are living below the poverty line. Among single-father households, those with 3 or 4 children have the highest poverty rate, with 6 households (85.7%) experiencing poverty. Likewise, among single-mother households, those with 1 or 2 children have the highest poverty rate, with 47 households (33.3%) falling below the poverty line.
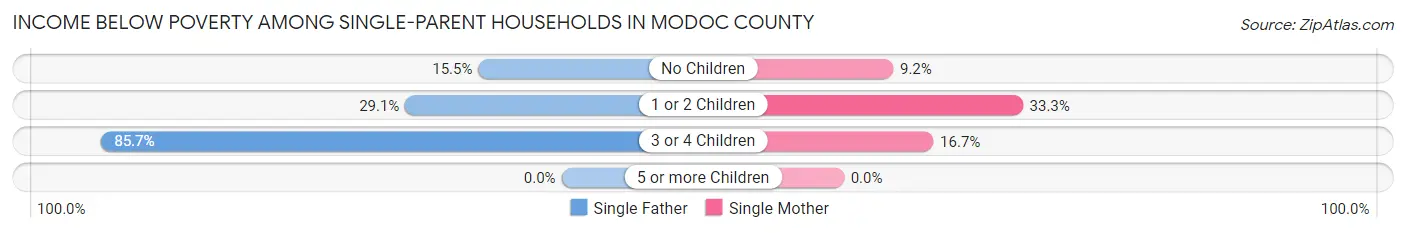
| Children | Single Father | Single Mother |
| No Children | 11 (15.5%) | 15 (9.2%) |
| 1 or 2 Children | 23 (29.1%) | 47 (33.3%) |
| 3 or 4 Children | 6 (85.7%) | 5 (16.7%) |
| 5 or more Children | 0 (0.0%) | 0 (0.0%) |
| Total | 40 (25.5%) | 67 (20.1%) |
Income Below Poverty Among Married-Couple vs Single-Parent Households in Modoc County
The poverty data for Modoc County shows that 124 of the married-couple family households (7.0%) and 107 of the single-parent households (21.8%) are living below the poverty level. Within the married-couple family households, those with 5 or more children have the highest poverty rate, with 13 households (76.5%) falling below the poverty line. Among the single-parent households, those with 1 or 2 children have the highest poverty rate, with 70 household (31.8%) living below poverty.
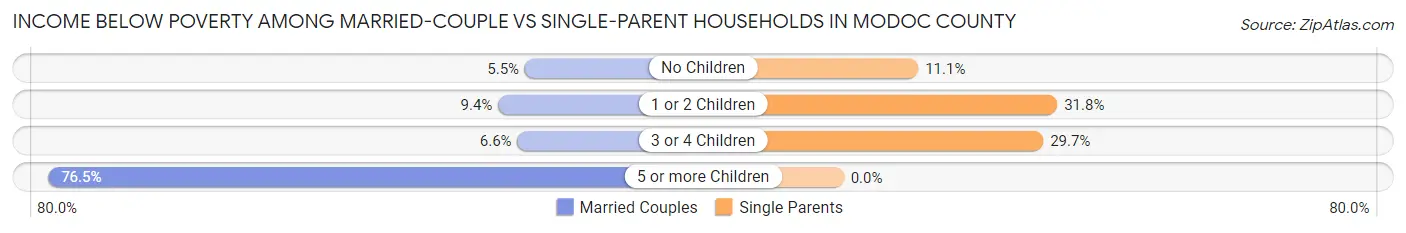
| Children | Married-Couple Families | Single-Parent Households |
| No Children | 70 (5.4%) | 26 (11.1%) |
| 1 or 2 Children | 33 (9.4%) | 70 (31.8%) |
| 3 or 4 Children | 8 (6.6%) | 11 (29.7%) |
| 5 or more Children | 13 (76.5%) | 0 (0.0%) |
| Total | 124 (7.0%) | 107 (21.8%) |
Race in Modoc County
The most populous races in Modoc County are White / Caucasian (7,196 | 83.2%), Hispanic or Latino (1,325 | 15.3%), and Two or more Races (463 | 5.3%).
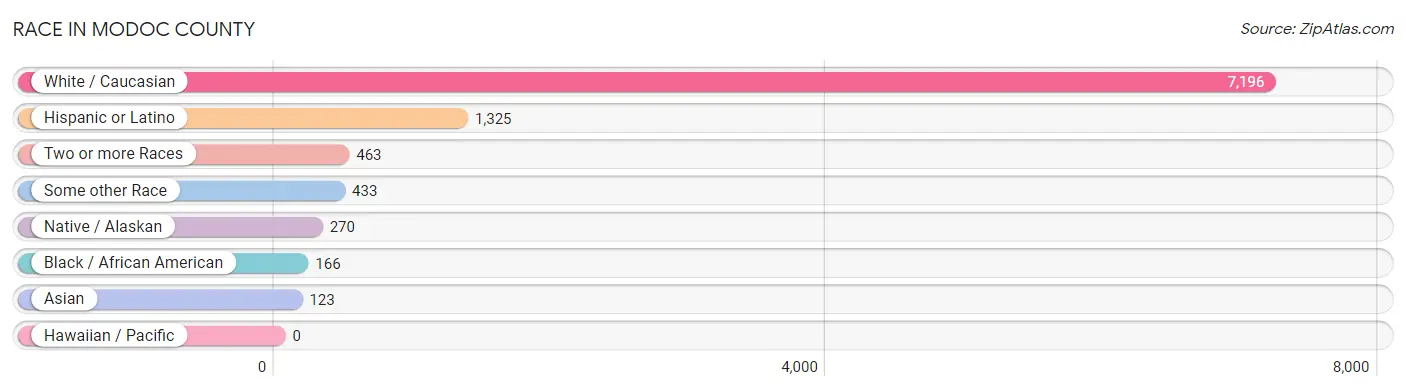
| Race | # Population | % Population |
| Asian | 123 | 1.4% |
| Black / African American | 166 | 1.9% |
| Hawaiian / Pacific | 0 | 0.0% |
| Hispanic or Latino | 1,325 | 15.3% |
| Native / Alaskan | 270 | 3.1% |
| White / Caucasian | 7,196 | 83.2% |
| Two or more Races | 463 | 5.3% |
| Some other Race | 433 | 5.0% |
| Total | 8,651 | 100.0% |
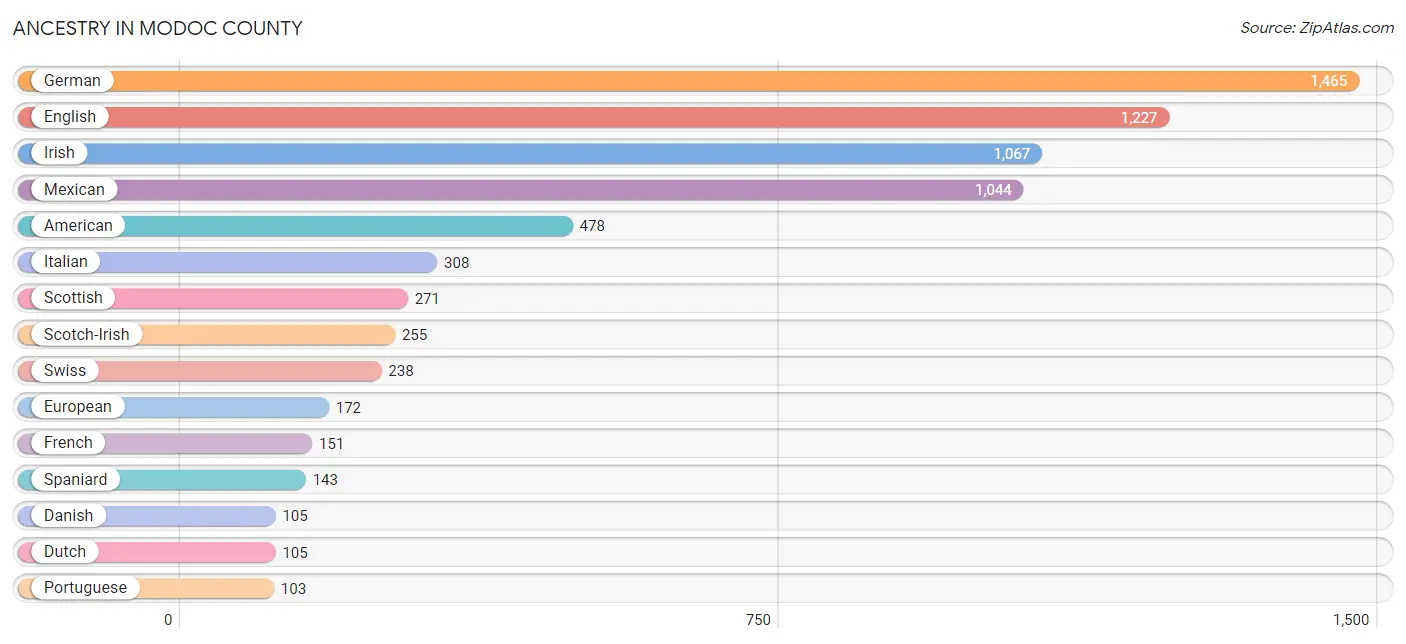
Ancestry in Modoc County
The most populous ancestries reported in Modoc County are German (1,465 | 16.9%), English (1,227 | 14.2%), Irish (1,067 | 12.3%), Mexican (1,044 | 12.1%), and American (478 | 5.5%), together accounting for 61.0% of all Modoc County residents.
| Ancestry | # Population | % Population |
| African | 4 | 0.1% |
| American | 478 | 5.5% |
| Australian | 2 | 0.0% |
| Austrian | 11 | 0.1% |
| Barbadian | 1 | 0.0% |
| Basque | 46 | 0.5% |
| Bhutanese | 9 | 0.1% |
| Blackfeet | 18 | 0.2% |
| Bolivian | 23 | 0.3% |
| British | 84 | 1.0% |
| Burmese | 10 | 0.1% |
| Canadian | 38 | 0.4% |
| Celtic | 20 | 0.2% |
| Central American | 22 | 0.3% |
| Cherokee | 80 | 0.9% |
| Chilean | 13 | 0.2% |
| Choctaw | 7 | 0.1% |
| Comanche | 16 | 0.2% |
| Creek | 9 | 0.1% |
| Czech | 9 | 0.1% |
| Danish | 105 | 1.2% |
| Dutch | 105 | 1.2% |
| Eastern European | 16 | 0.2% |
| Ecuadorian | 12 | 0.1% |
| English | 1,227 | 14.2% |
| European | 172 | 2.0% |
| French | 151 | 1.8% |
| French Canadian | 25 | 0.3% |
| German | 1,465 | 16.9% |
| Indian (Asian) | 65 | 0.7% |
| Irish | 1,067 | 12.3% |
| Iroquois | 21 | 0.2% |
| Italian | 308 | 3.6% |
| Japanese | 49 | 0.6% |
| Kenyan | 1 | 0.0% |
| Korean | 53 | 0.6% |
| Mexican | 1,044 | 12.1% |
| Mexican American Indian | 32 | 0.4% |
| Native Hawaiian | 11 | 0.1% |
| Northern European | 9 | 0.1% |
| Norwegian | 100 | 1.2% |
| Paiute | 86 | 1.0% |
| Peruvian | 23 | 0.3% |
| Polish | 78 | 0.9% |
| Portuguese | 103 | 1.2% |
| Russian | 4 | 0.1% |
| Salvadoran | 22 | 0.3% |
| Scandinavian | 40 | 0.5% |
| Scotch-Irish | 255 | 2.9% |
| Scottish | 271 | 3.1% |
| Shoshone | 1 | 0.0% |
| Sioux | 62 | 0.7% |
| South American | 71 | 0.8% |
| South American Indian | 12 | 0.1% |
| Spaniard | 143 | 1.7% |
| Spanish | 15 | 0.2% |
| Sri Lankan | 3 | 0.0% |
| Subsaharan African | 5 | 0.1% |
| Swedish | 36 | 0.4% |
| Swiss | 238 | 2.8% |
| Welsh | 56 | 0.6% | View All 61 Rows |
Immigrants in Modoc County
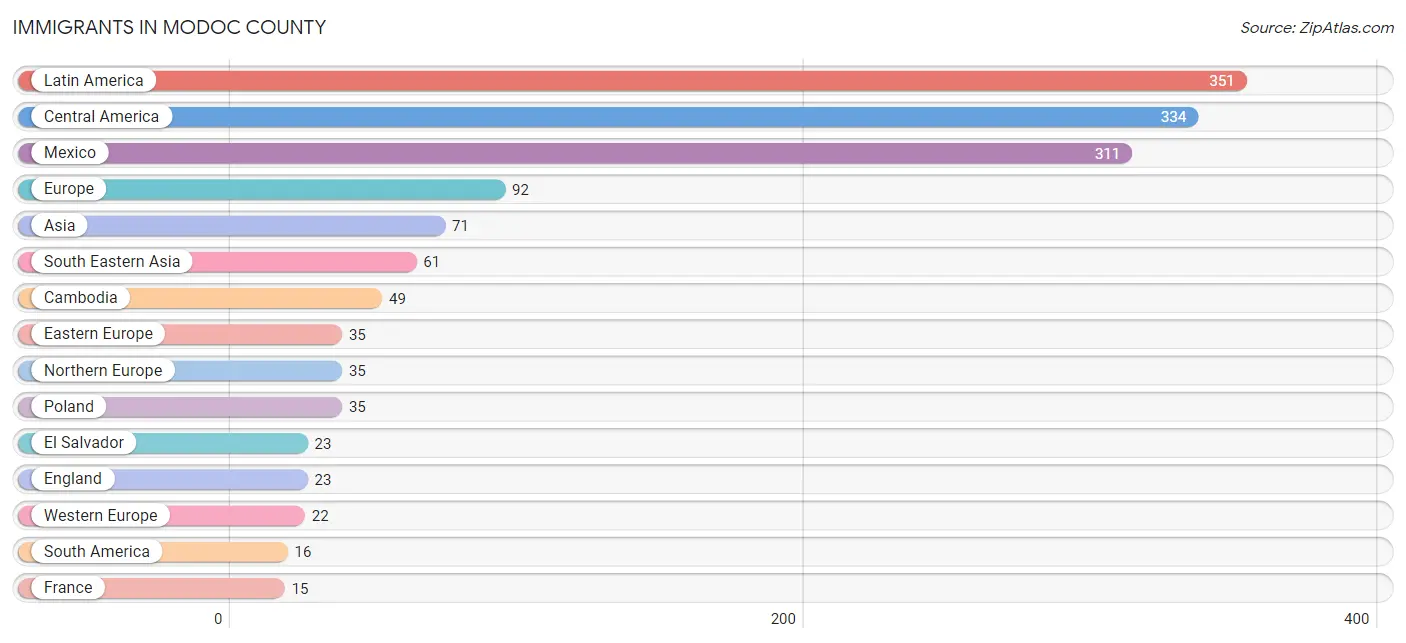
The most numerous immigrant groups reported in Modoc County came from Latin America (351 | 4.1%), Central America (334 | 3.9%), Mexico (311 | 3.6%), Europe (92 | 1.1%), and Asia (71 | 0.8%), together accounting for 13.4% of all Modoc County residents.
| Immigration Origin | # Population | % Population |
| Africa | 1 | 0.0% |
| Asia | 71 | 0.8% |
| Barbados | 1 | 0.0% |
| Cambodia | 49 | 0.6% |
| Canada | 13 | 0.2% |
| Caribbean | 1 | 0.0% |
| Central America | 334 | 3.9% |
| Chile | 4 | 0.1% |
| Eastern Africa | 1 | 0.0% |
| Eastern Asia | 1 | 0.0% |
| Eastern Europe | 35 | 0.4% |
| Ecuador | 12 | 0.1% |
| El Salvador | 23 | 0.3% |
| England | 23 | 0.3% |
| Europe | 92 | 1.1% |
| France | 15 | 0.2% |
| Germany | 7 | 0.1% |
| Iran | 9 | 0.1% |
| Kenya | 1 | 0.0% |
| Korea | 1 | 0.0% |
| Latin America | 351 | 4.1% |
| Mexico | 311 | 3.6% |
| Northern Europe | 35 | 0.4% |
| Philippines | 9 | 0.1% |
| Poland | 35 | 0.4% |
| South America | 16 | 0.2% |
| South Central Asia | 9 | 0.1% |
| South Eastern Asia | 61 | 0.7% |
| Vietnam | 3 | 0.0% |
| Western Europe | 22 | 0.3% | View All 30 Rows |
Sex and Age in Modoc County
Sex and Age in Modoc County
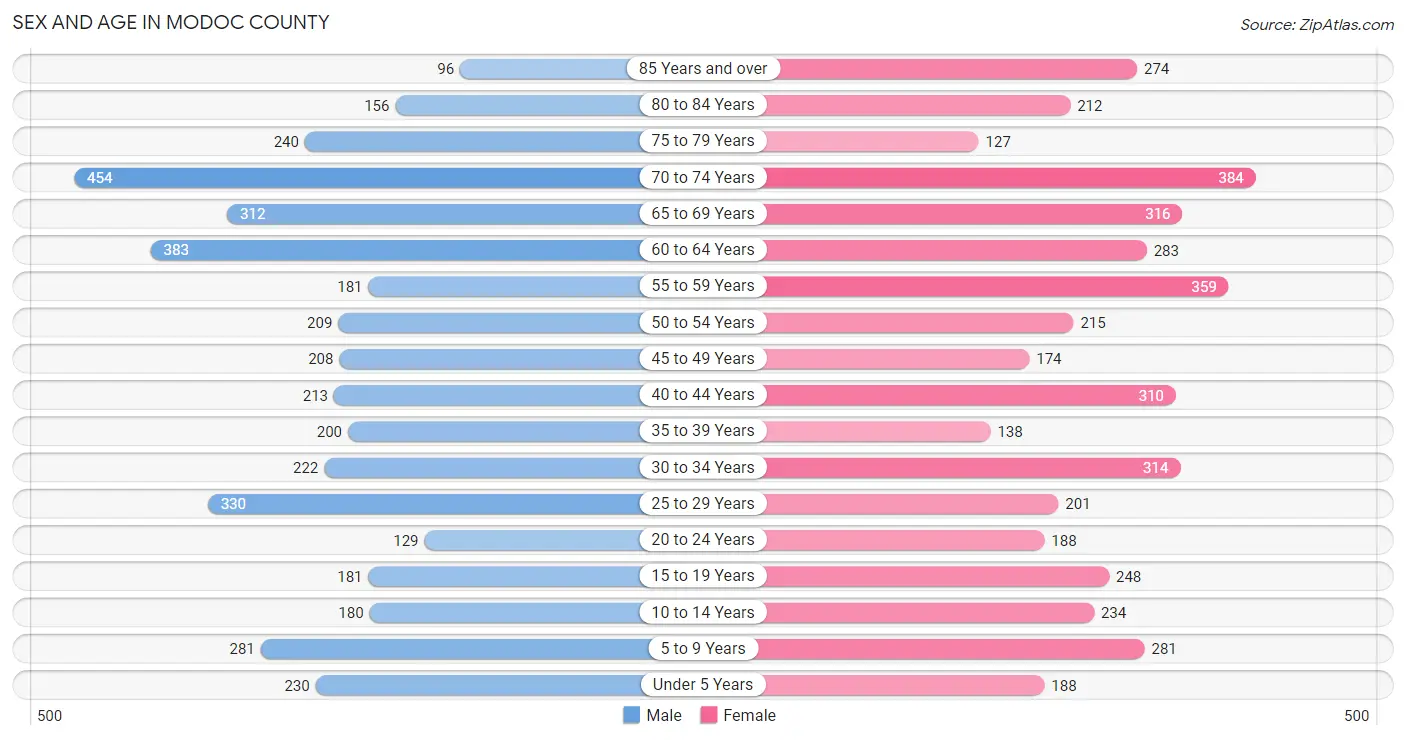
The most populous age groups in Modoc County are 70 to 74 Years (454 | 10.8%) for men and 70 to 74 Years (384 | 8.6%) for women.
| Age Bracket | Male | Female |
| Under 5 Years | 230 (5.5%) | 188 (4.2%) |
| 5 to 9 Years | 281 (6.7%) | 281 (6.3%) |
| 10 to 14 Years | 180 (4.3%) | 234 (5.3%) |
| 15 to 19 Years | 181 (4.3%) | 248 (5.6%) |
| 20 to 24 Years | 129 (3.1%) | 188 (4.2%) |
| 25 to 29 Years | 330 (7.9%) | 201 (4.5%) |
| 30 to 34 Years | 222 (5.3%) | 314 (7.1%) |
| 35 to 39 Years | 200 (4.8%) | 138 (3.1%) |
| 40 to 44 Years | 213 (5.1%) | 310 (7.0%) |
| 45 to 49 Years | 208 (5.0%) | 174 (3.9%) |
| 50 to 54 Years | 209 (5.0%) | 215 (4.8%) |
| 55 to 59 Years | 181 (4.3%) | 359 (8.1%) |
| 60 to 64 Years | 383 (9.1%) | 283 (6.4%) |
| 65 to 69 Years | 312 (7.4%) | 316 (7.1%) |
| 70 to 74 Years | 454 (10.8%) | 384 (8.6%) |
| 75 to 79 Years | 240 (5.7%) | 127 (2.9%) |
| 80 to 84 Years | 156 (3.7%) | 212 (4.8%) |
| 85 Years and over | 96 (2.3%) | 274 (6.2%) |
| Total | 4,205 (100.0%) | 4,446 (100.0%) |
Families and Households in Modoc County
Median Family Size in Modoc County
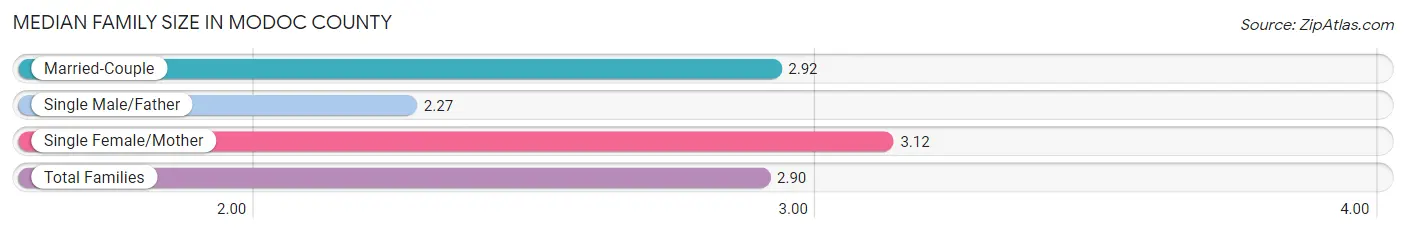
The median family size in Modoc County is 2.90 persons per family, with single female/mother families (334 | 14.7%) accounting for the largest median family size of 3.12 persons per family. On the other hand, single male/father families (157 | 6.9%) represent the smallest median family size with 2.27 persons per family.
| Family Type | # Families | Family Size |
| Married-Couple | 1,773 (78.3%) | 2.92 |
| Single Male/Father | 157 (6.9%) | 2.27 |
| Single Female/Mother | 334 (14.7%) | 3.12 |
| Total Families | 2,264 (100.0%) | 2.90 |
Median Household Size in Modoc County
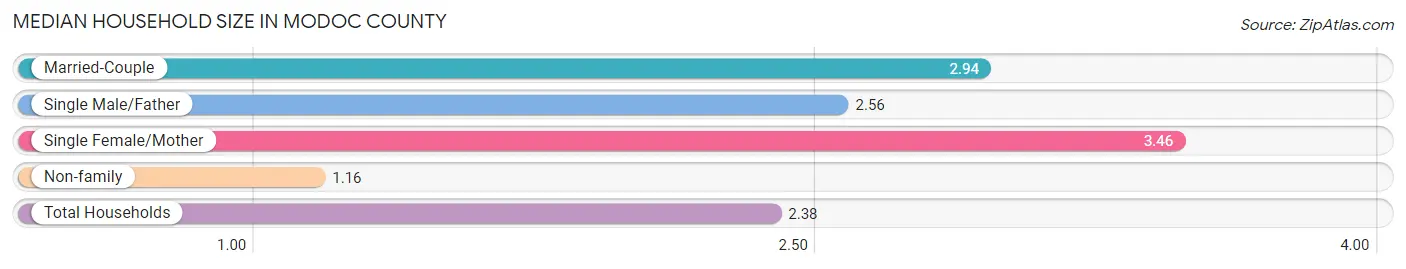
The median household size in Modoc County is 2.38 persons per household, with single female/mother households (334 | 9.8%) accounting for the largest median household size of 3.46 persons per household. non-family households (1,139 | 33.5%) represent the smallest median household size with 1.16 persons per household.
| Household Type | # Households | Household Size |
| Married-Couple | 1,773 (52.1%) | 2.94 |
| Single Male/Father | 157 (4.6%) | 2.56 |
| Single Female/Mother | 334 (9.8%) | 3.46 |
| Non-family | 1,139 (33.5%) | 1.16 |
| Total Households | 3,403 (100.0%) | 2.38 |
Household Size by Marriage Status in Modoc County
Out of a total of 3,403 households in Modoc County, 2,264 (66.5%) are family households, while 1,139 (33.5%) are nonfamily households. The most numerous type of family households are 2-person households, comprising 1,424, and the most common type of nonfamily households are 1-person households, comprising 997.
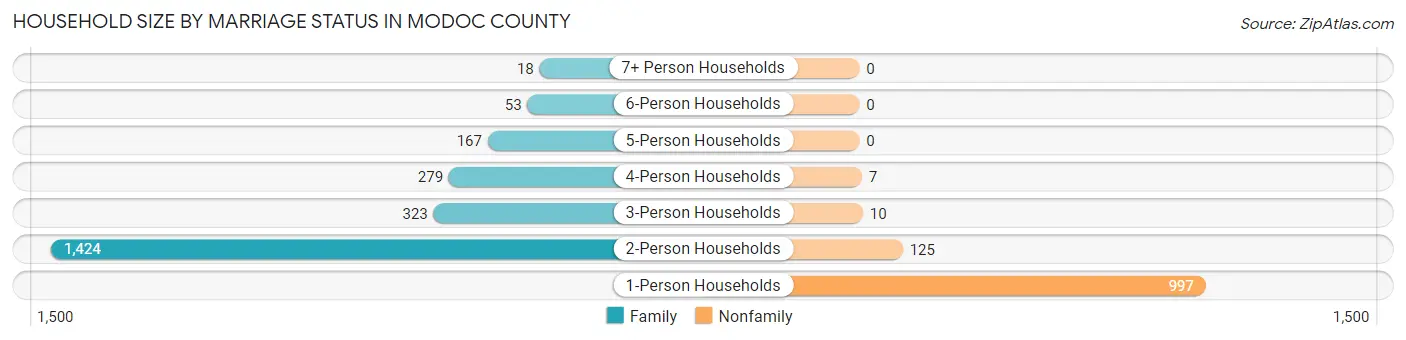
| Household Size | Family Households | Nonfamily Households |
| 1-Person Households | - | 997 (29.3%) |
| 2-Person Households | 1,424 (41.8%) | 125 (3.7%) |
| 3-Person Households | 323 (9.5%) | 10 (0.3%) |
| 4-Person Households | 279 (8.2%) | 7 (0.2%) |
| 5-Person Households | 167 (4.9%) | 0 (0.0%) |
| 6-Person Households | 53 (1.6%) | 0 (0.0%) |
| 7+ Person Households | 18 (0.5%) | 0 (0.0%) |
| Total | 2,264 (66.5%) | 1,139 (33.5%) |
Female Fertility in Modoc County
Fertility by Age in Modoc County
Average fertility rate in Modoc County is 61.0 births per 1,000 women. Women in the age bracket of 20 to 34 years have the highest fertility rate with 137.0 births per 1,000 women. Women in the age bracket of 20 to 34 years acount for 99.0% of all women with births.
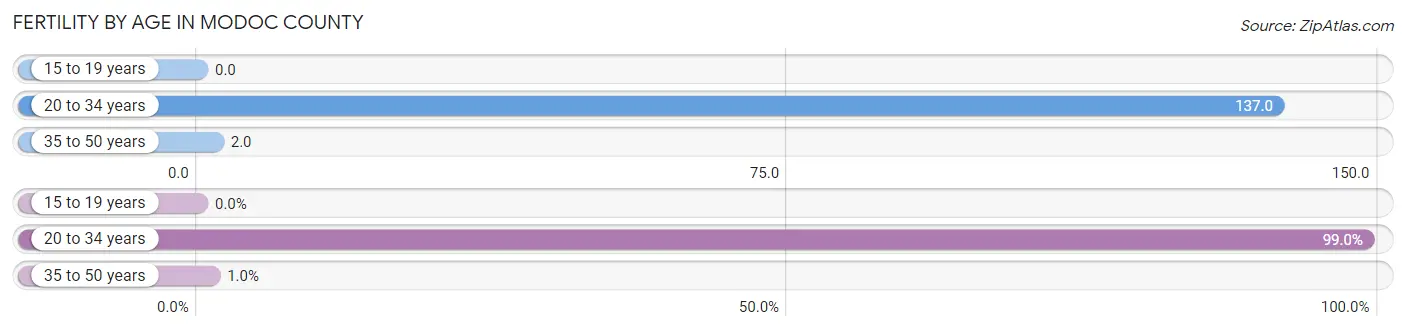
| Age Bracket | Women with Births | Births / 1,000 Women |
| 15 to 19 years | 0 (0.0%) | 0.0 |
| 20 to 34 years | 96 (99.0%) | 137.0 |
| 35 to 50 years | 1 (1.0%) | 2.0 |
| Total | 97 (100.0%) | 61.0 |
Fertility by Age by Marriage Status in Modoc County
69.1% of women with births (97) in Modoc County are married. The highest percentage of unmarried women with births falls into 35 to 50 years age bracket with 100.0% of them unmarried at the time of birth, while the lowest percentage of unmarried women with births belong to 20 to 34 years age bracket with 30.2% of them unmarried.
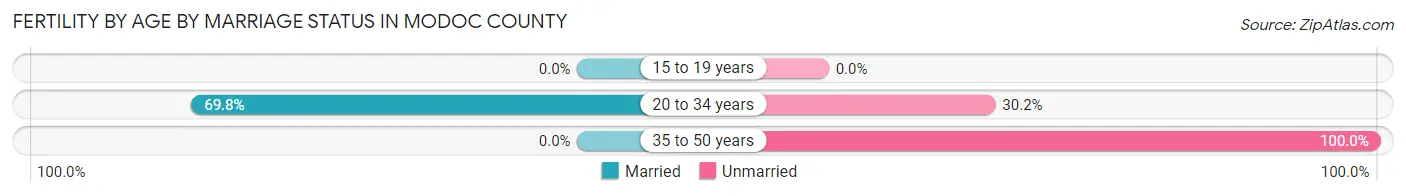
| Age Bracket | Married | Unmarried |
| 15 to 19 years | 0 (0.0%) | 0 (0.0%) |
| 20 to 34 years | 67 (69.8%) | 29 (30.2%) |
| 35 to 50 years | 0 (0.0%) | 1 (100.0%) |
| Total | 67 (69.1%) | 30 (30.9%) |
Fertility by Education in Modoc County
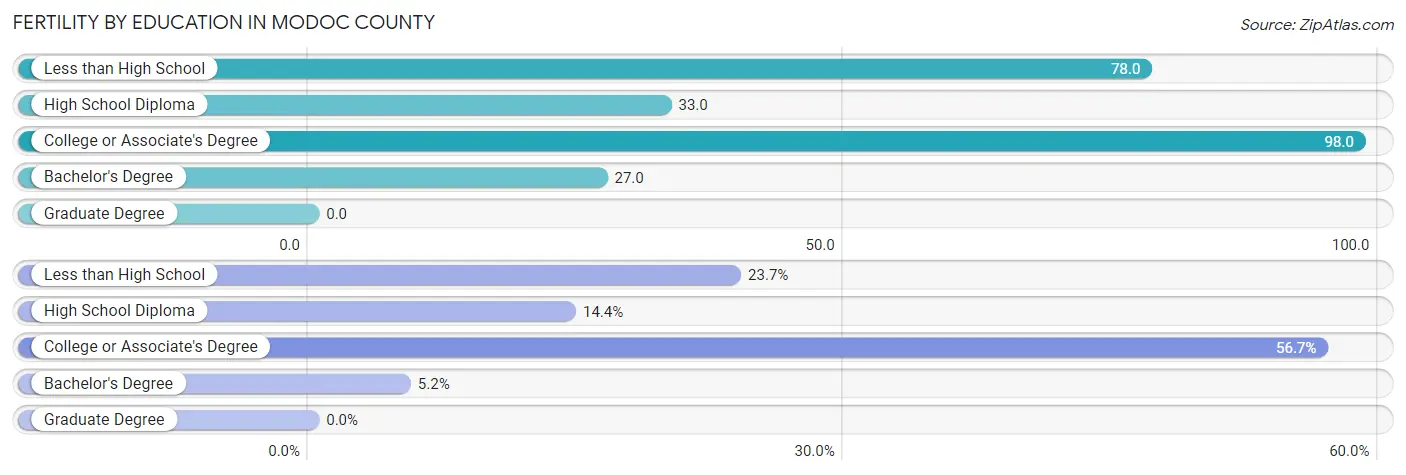
| Educational Attainment | Women with Births | Births / 1,000 Women |
| Less than High School | 23 (23.7%) | 78.0 |
| High School Diploma | 14 (14.4%) | 33.0 |
| College or Associate's Degree | 55 (56.7%) | 98.0 |
| Bachelor's Degree | 5 (5.1%) | 27.0 |
| Graduate Degree | 0 (0.0%) | 0.0 |
| Total | 97 (100.0%) | 61.0 |
Fertility by Education by Marriage Status in Modoc County
30.9% of women with births in Modoc County are unmarried. Women with the educational attainment of less than high school are most likely to be married with 100.0% of them married at childbirth, while women with the educational attainment of high school diploma are least likely to be married with 57.1% of them unmarried at childbirth.
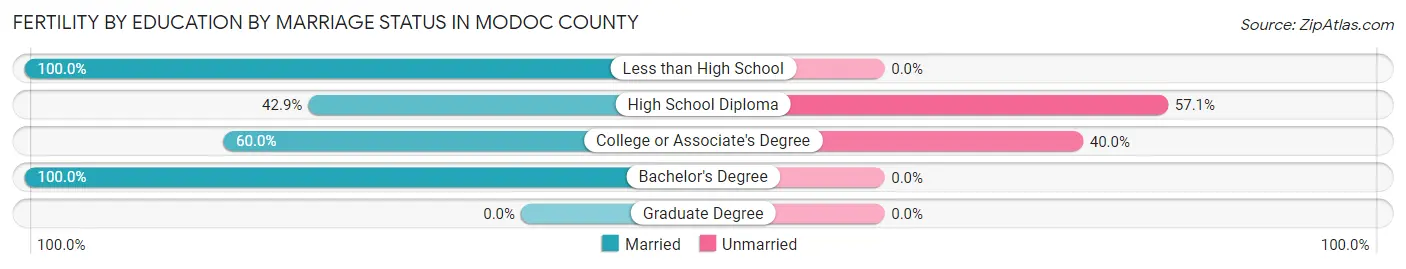
| Educational Attainment | Married | Unmarried |
| Less than High School | 23 (100.0%) | 0 (0.0%) |
| High School Diploma | 6 (42.9%) | 8 (57.1%) |
| College or Associate's Degree | 33 (60.0%) | 22 (40.0%) |
| Bachelor's Degree | 5 (100.0%) | 0 (0.0%) |
| Graduate Degree | 0 (0.0%) | 0 (0.0%) |
| Total | 67 (69.1%) | 30 (30.9%) |
Employment Characteristics in Modoc County
Employment by Class of Employer in Modoc County
Among the 3,184 employed individuals in Modoc County, private company employees (1,303 | 40.9%), local government employees (460 | 14.4%), and self-employed (not incorporated) (432 | 13.6%) make up the most common classes of employment.
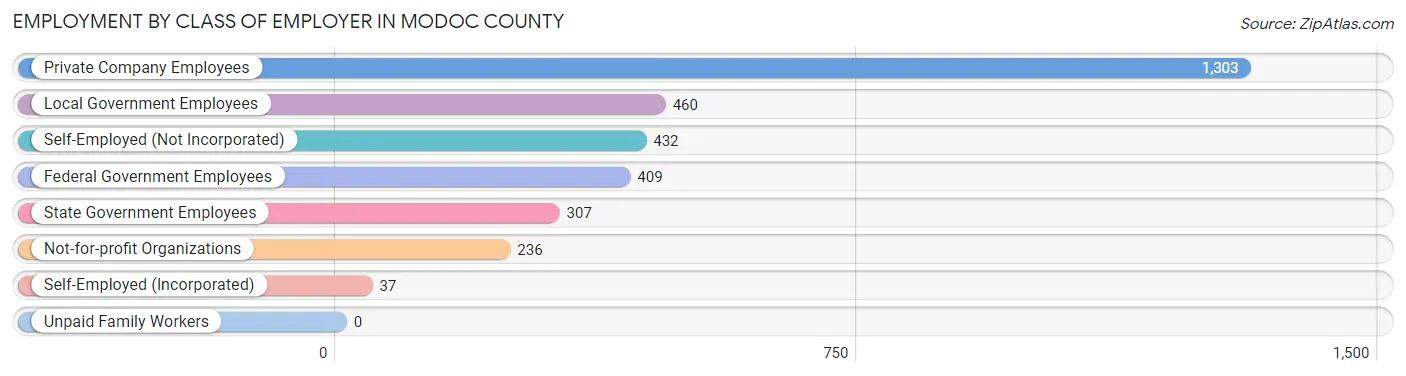
| Employer Class | # Employees | % Employees |
| Private Company Employees | 1,303 | 40.9% |
| Self-Employed (Incorporated) | 37 | 1.2% |
| Self-Employed (Not Incorporated) | 432 | 13.6% |
| Not-for-profit Organizations | 236 | 7.4% |
| Local Government Employees | 460 | 14.4% |
| State Government Employees | 307 | 9.6% |
| Federal Government Employees | 409 | 12.9% |
| Unpaid Family Workers | 0 | 0.0% |
| Total | 3,184 | 100.0% |
Employment Status by Age in Modoc County
According to the labor force statistics for Modoc County, out of the total population over 16 years of age (7,182), 48.3% or 3,469 individuals are in the labor force, with 7.6% or 264 of them unemployed. The age group with the highest labor force participation rate is 25 to 29 years, with 83.4% or 443 individuals in the labor force. Within the labor force, the 16 to 19 years age range has the highest percentage of unemployed individuals, with 39.4% or 56 of them being unemployed.
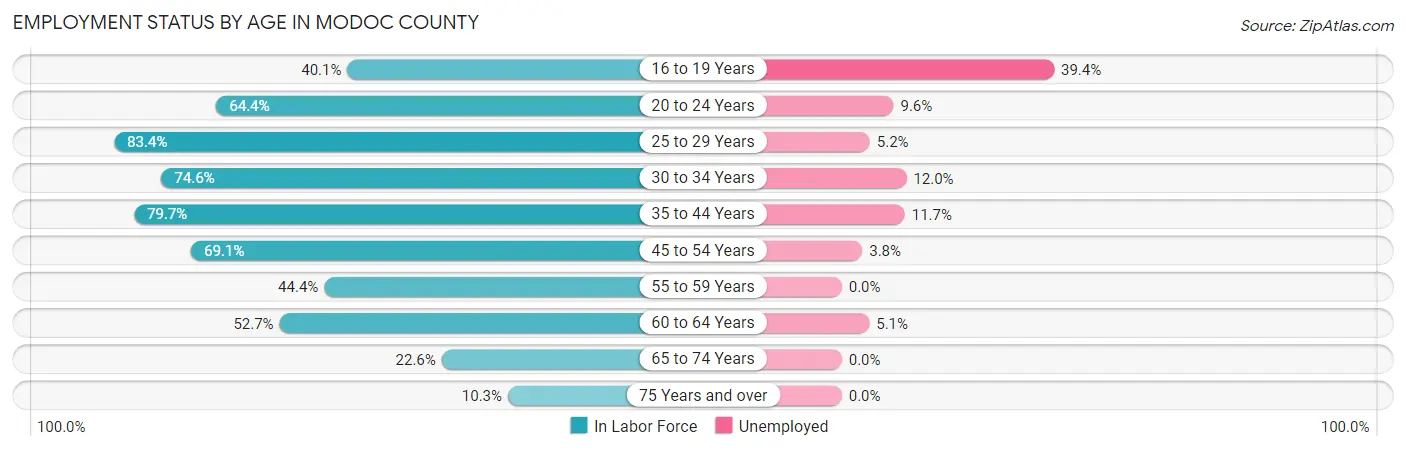
| Age Bracket | In Labor Force | Unemployed |
| 16 to 19 Years | 142 (40.1%) | 56 (39.4%) |
| 20 to 24 Years | 204 (64.4%) | 20 (9.6%) |
| 25 to 29 Years | 443 (83.4%) | 23 (5.2%) |
| 30 to 34 Years | 400 (74.6%) | 48 (12.0%) |
| 35 to 44 Years | 686 (79.7%) | 80 (11.7%) |
| 45 to 54 Years | 557 (69.1%) | 21 (3.8%) |
| 55 to 59 Years | 240 (44.4%) | 0 (0.0%) |
| 60 to 64 Years | 351 (52.7%) | 18 (5.1%) |
| 65 to 74 Years | 331 (22.6%) | 0 (0.0%) |
| 75 Years and over | 114 (10.3%) | 0 (0.0%) |
| Total | 3,469 (48.3%) | 264 (7.6%) |
Employment Status by Educational Attainment in Modoc County
According to labor force statistics for Modoc County, 67.9% of individuals (2,675) out of the total population between 25 and 64 years of age (3,940) are in the labor force, with 7.1% or 190 of them being unemployed. The group with the highest labor force participation rate are those with the educational attainment of bachelor's degree or higher, with 85.9% or 722 individuals in the labor force. Within the labor force, individuals with high school diploma education have the highest percentage of unemployment, with 17.5% or 130 of them being unemployed.
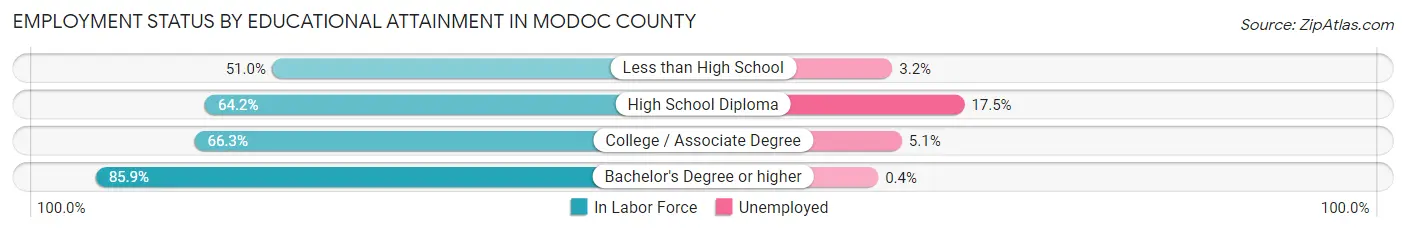
| Educational Attainment | In Labor Force | Unemployed |
| Less than High School | 249 (51.0%) | 16 (3.2%) |
| High School Diploma | 742 (64.2%) | 202 (17.5%) |
| College / Associate Degree | 965 (66.3%) | 74 (5.1%) |
| Bachelor's Degree or higher | 722 (85.9%) | 3 (0.4%) |
| Total | 2,675 (67.9%) | 280 (7.1%) |
Employment Occupations by Sex in Modoc County
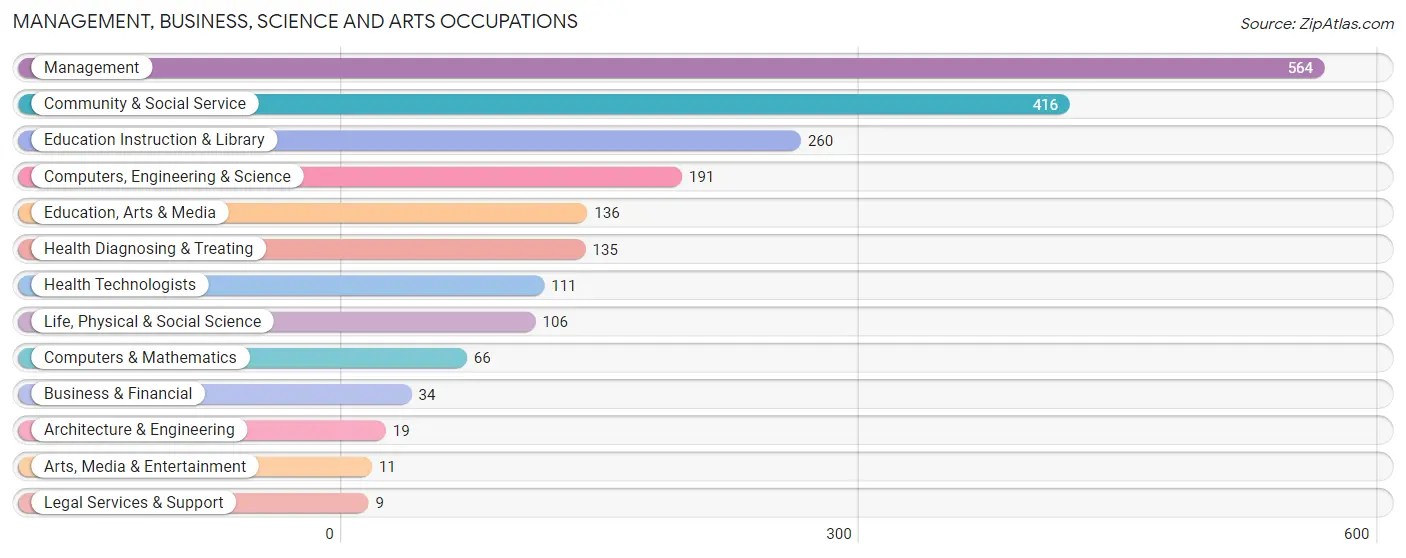
Management, Business, Science and Arts Occupations
The most common Management, Business, Science and Arts occupations in Modoc County are Management (564 | 17.7%), Community & Social Service (416 | 13.1%), Education Instruction & Library (260 | 8.2%), Computers, Engineering & Science (191 | 6.0%), and Education, Arts & Media (136 | 4.3%).
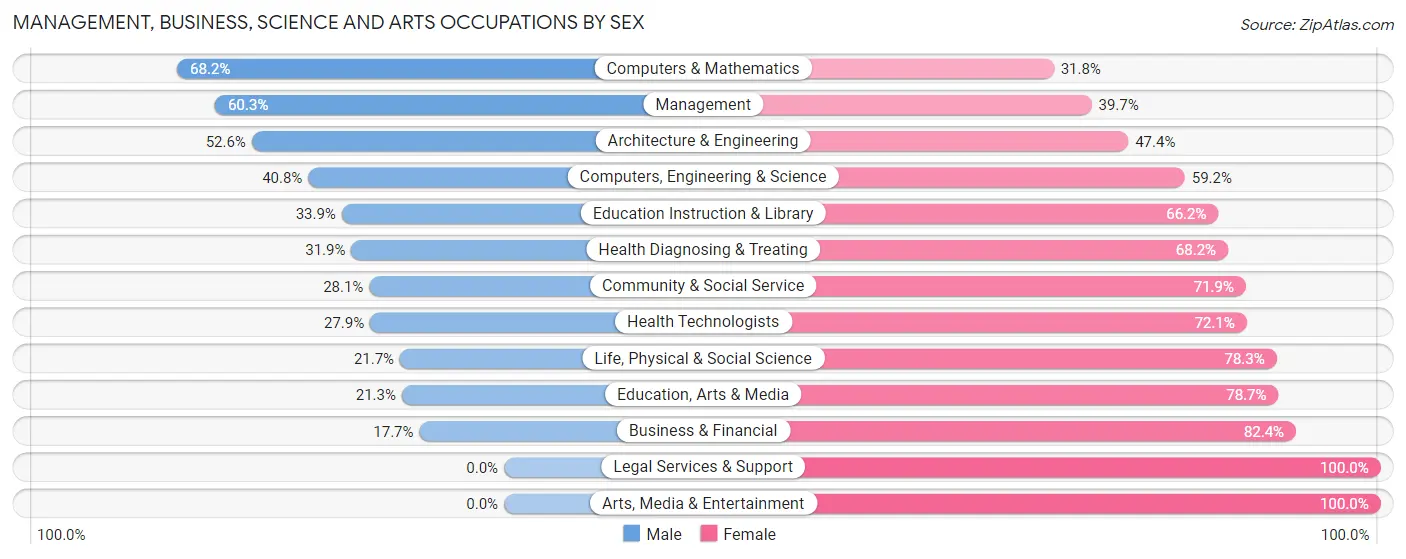
Management, Business, Science and Arts Occupations by Sex
Within the Management, Business, Science and Arts occupations in Modoc County, the most male-oriented occupations are Computers & Mathematics (68.2%), Management (60.3%), and Architecture & Engineering (52.6%), while the most female-oriented occupations are Legal Services & Support (100.0%), Arts, Media & Entertainment (100.0%), and Business & Financial (82.4%).
| Occupation | Male | Female |
| Management | 340 (60.3%) | 224 (39.7%) |
| Business & Financial | 6 (17.6%) | 28 (82.4%) |
| Computers, Engineering & Science | 78 (40.8%) | 113 (59.2%) |
| Computers & Mathematics | 45 (68.2%) | 21 (31.8%) |
| Architecture & Engineering | 10 (52.6%) | 9 (47.4%) |
| Life, Physical & Social Science | 23 (21.7%) | 83 (78.3%) |
| Community & Social Service | 117 (28.1%) | 299 (71.9%) |
| Education, Arts & Media | 29 (21.3%) | 107 (78.7%) |
| Legal Services & Support | 0 (0.0%) | 9 (100.0%) |
| Education Instruction & Library | 88 (33.9%) | 172 (66.1%) |
| Arts, Media & Entertainment | 0 (0.0%) | 11 (100.0%) |
| Health Diagnosing & Treating | 43 (31.9%) | 92 (68.1%) |
| Health Technologists | 31 (27.9%) | 80 (72.1%) |
| Total (Category) | 584 (43.6%) | 756 (56.4%) |
| Total (Overall) | 1,480 (46.4%) | 1,708 (53.6%) |
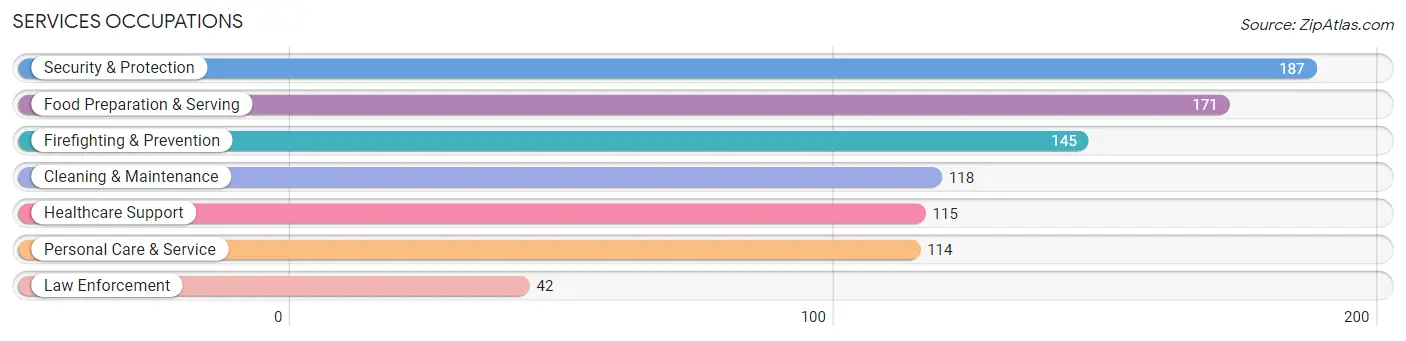
Services Occupations
The most common Services occupations in Modoc County are Security & Protection (187 | 5.9%), Food Preparation & Serving (171 | 5.4%), Firefighting & Prevention (145 | 4.5%), Cleaning & Maintenance (118 | 3.7%), and Healthcare Support (115 | 3.6%).
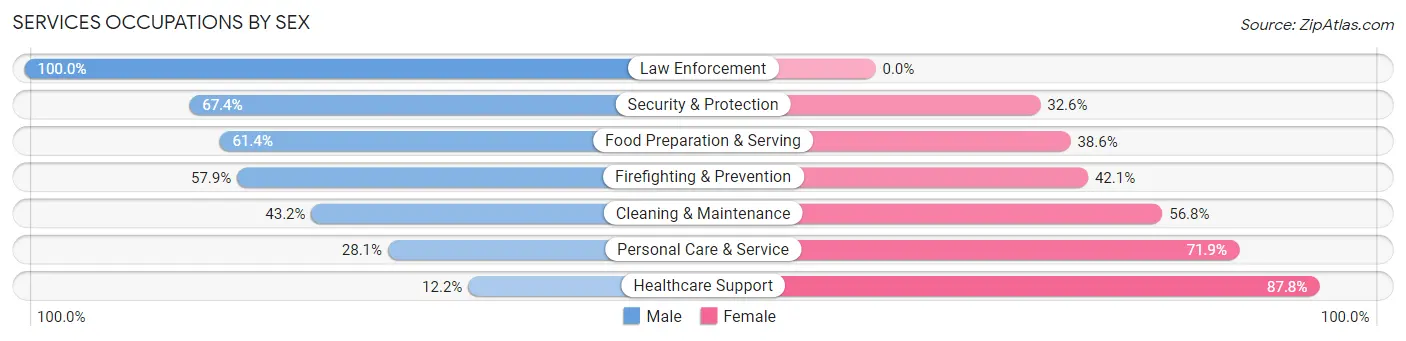
Services Occupations by Sex
Within the Services occupations in Modoc County, the most male-oriented occupations are Law Enforcement (100.0%), Security & Protection (67.4%), and Food Preparation & Serving (61.4%), while the most female-oriented occupations are Healthcare Support (87.8%), Personal Care & Service (71.9%), and Cleaning & Maintenance (56.8%).
| Occupation | Male | Female |
| Healthcare Support | 14 (12.2%) | 101 (87.8%) |
| Security & Protection | 126 (67.4%) | 61 (32.6%) |
| Firefighting & Prevention | 84 (57.9%) | 61 (42.1%) |
| Law Enforcement | 42 (100.0%) | 0 (0.0%) |
| Food Preparation & Serving | 105 (61.4%) | 66 (38.6%) |
| Cleaning & Maintenance | 51 (43.2%) | 67 (56.8%) |
| Personal Care & Service | 32 (28.1%) | 82 (71.9%) |
| Total (Category) | 328 (46.5%) | 377 (53.5%) |
| Total (Overall) | 1,480 (46.4%) | 1,708 (53.6%) |
Sales and Office Occupations
The most common Sales and Office occupations in Modoc County are Office & Administration (356 | 11.2%), and Sales & Related (211 | 6.6%).

Sales and Office Occupations by Sex

| Occupation | Male | Female |
| Sales & Related | 94 (44.6%) | 117 (55.4%) |
| Office & Administration | 20 (5.6%) | 336 (94.4%) |
| Total (Category) | 114 (20.1%) | 453 (79.9%) |
| Total (Overall) | 1,480 (46.4%) | 1,708 (53.6%) |
Natural Resources, Construction and Maintenance Occupations
The most common Natural Resources, Construction and Maintenance occupations in Modoc County are Farming, Fishing & Forestry (253 | 7.9%), Construction & Extraction (87 | 2.7%), and Installation, Maintenance & Repair (56 | 1.8%).

Natural Resources, Construction and Maintenance Occupations by Sex

| Occupation | Male | Female |
| Farming, Fishing & Forestry | 193 (76.3%) | 60 (23.7%) |
| Construction & Extraction | 87 (100.0%) | 0 (0.0%) |
| Installation, Maintenance & Repair | 56 (100.0%) | 0 (0.0%) |
| Total (Category) | 336 (84.9%) | 60 (15.1%) |
| Total (Overall) | 1,480 (46.4%) | 1,708 (53.6%) |
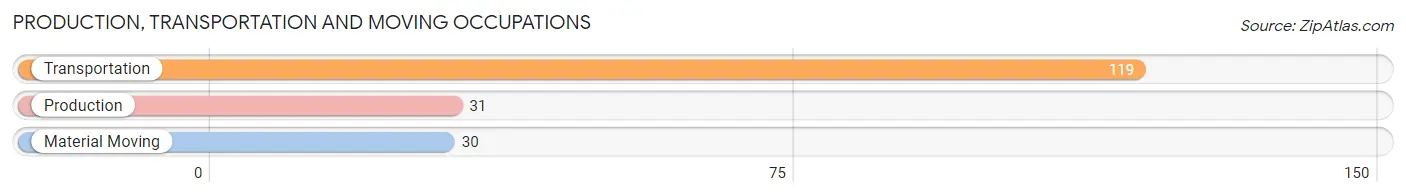
Production, Transportation and Moving Occupations
The most common Production, Transportation and Moving occupations in Modoc County are Transportation (119 | 3.7%), Production (31 | 1.0%), and Material Moving (30 | 0.9%).
Production, Transportation and Moving Occupations by Sex
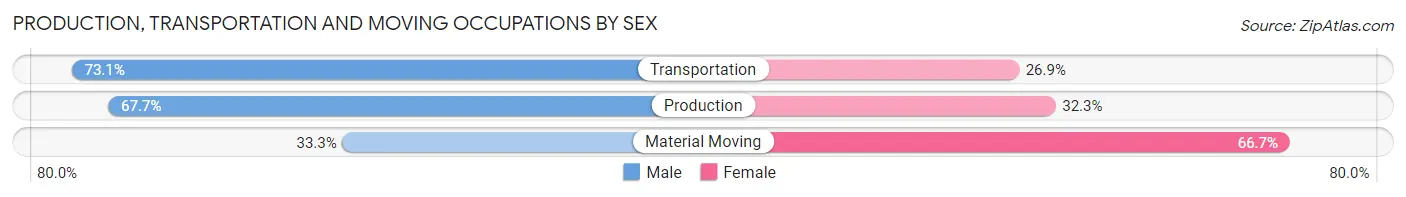
| Occupation | Male | Female |
| Production | 21 (67.7%) | 10 (32.3%) |
| Transportation | 87 (73.1%) | 32 (26.9%) |
| Material Moving | 10 (33.3%) | 20 (66.7%) |
| Total (Category) | 118 (65.6%) | 62 (34.4%) |
| Total (Overall) | 1,480 (46.4%) | 1,708 (53.6%) |
Employment Industries by Sex in Modoc County
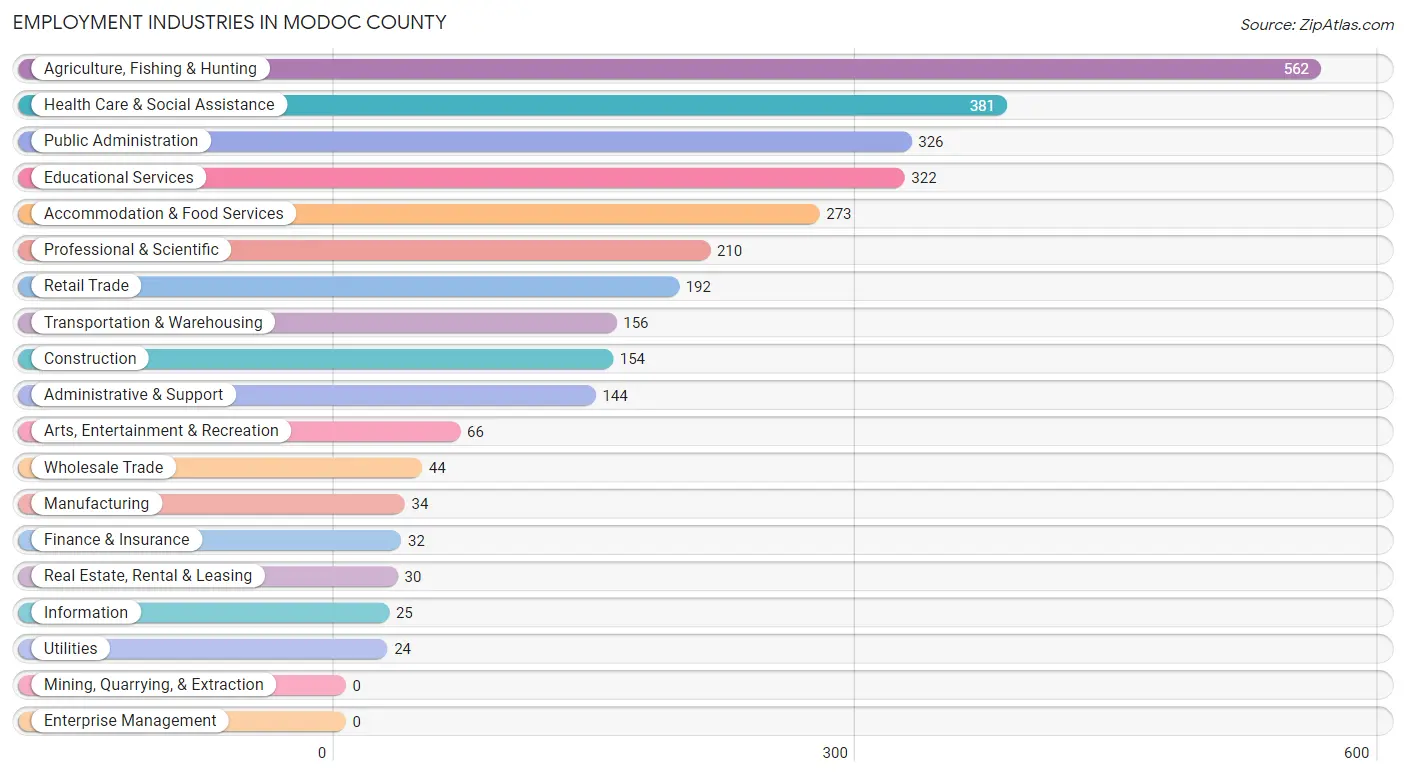
Employment Industries in Modoc County
The major employment industries in Modoc County include Agriculture, Fishing & Hunting (562 | 17.6%), Health Care & Social Assistance (381 | 11.9%), Public Administration (326 | 10.2%), Educational Services (322 | 10.1%), and Accommodation & Food Services (273 | 8.6%).
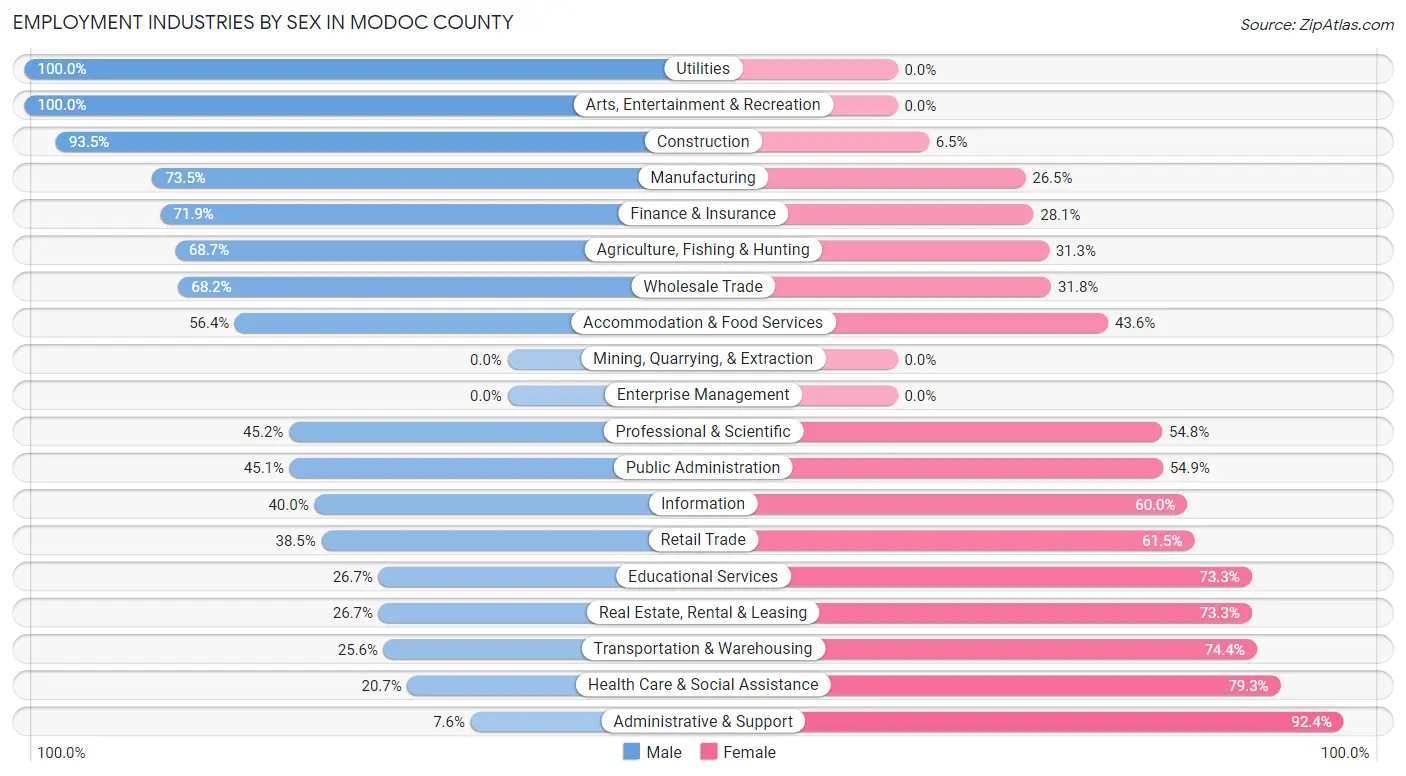
Employment Industries by Sex in Modoc County
The Modoc County industries that see more men than women are Utilities (100.0%), Arts, Entertainment & Recreation (100.0%), and Construction (93.5%), whereas the industries that tend to have a higher number of women are Administrative & Support (92.4%), Health Care & Social Assistance (79.3%), and Transportation & Warehousing (74.4%).
| Industry | Male | Female |
| Agriculture, Fishing & Hunting | 386 (68.7%) | 176 (31.3%) |
| Mining, Quarrying, & Extraction | 0 (0.0%) | 0 (0.0%) |
| Construction | 144 (93.5%) | 10 (6.5%) |
| Manufacturing | 25 (73.5%) | 9 (26.5%) |
| Wholesale Trade | 30 (68.2%) | 14 (31.8%) |
| Retail Trade | 74 (38.5%) | 118 (61.5%) |
| Transportation & Warehousing | 40 (25.6%) | 116 (74.4%) |
| Utilities | 24 (100.0%) | 0 (0.0%) |
| Information | 10 (40.0%) | 15 (60.0%) |
| Finance & Insurance | 23 (71.9%) | 9 (28.1%) |
| Real Estate, Rental & Leasing | 8 (26.7%) | 22 (73.3%) |
| Professional & Scientific | 95 (45.2%) | 115 (54.8%) |
| Enterprise Management | 0 (0.0%) | 0 (0.0%) |
| Administrative & Support | 11 (7.6%) | 133 (92.4%) |
| Educational Services | 86 (26.7%) | 236 (73.3%) |
| Health Care & Social Assistance | 79 (20.7%) | 302 (79.3%) |
| Arts, Entertainment & Recreation | 66 (100.0%) | 0 (0.0%) |
| Accommodation & Food Services | 154 (56.4%) | 119 (43.6%) |
| Public Administration | 147 (45.1%) | 179 (54.9%) |
| Total | 1,480 (46.4%) | 1,708 (53.6%) |
Education in Modoc County
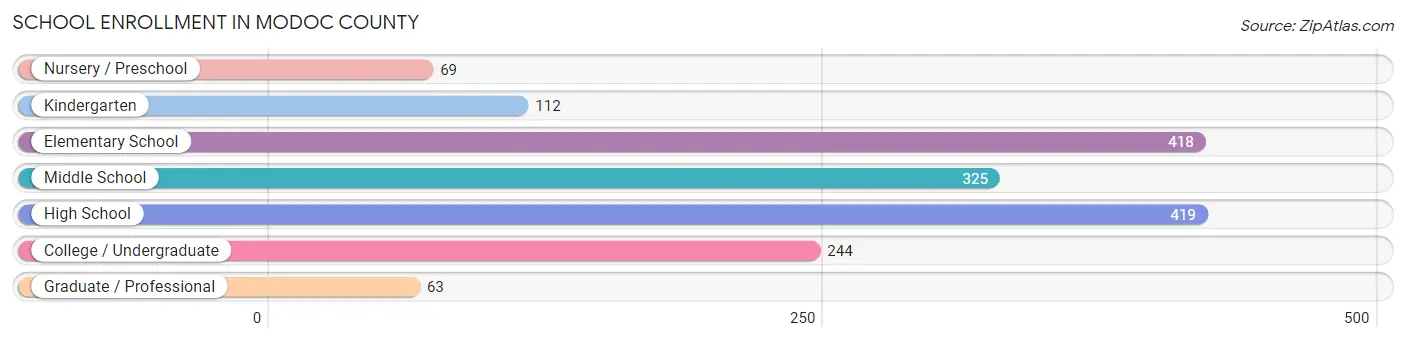
School Enrollment in Modoc County
The most common levels of schooling among the 1,650 students in Modoc County are high school (419 | 25.4%), elementary school (418 | 25.3%), and middle school (325 | 19.7%).
| School Level | # Students | % Students |
| Nursery / Preschool | 69 | 4.2% |
| Kindergarten | 112 | 6.8% |
| Elementary School | 418 | 25.3% |
| Middle School | 325 | 19.7% |
| High School | 419 | 25.4% |
| College / Undergraduate | 244 | 14.8% |
| Graduate / Professional | 63 | 3.8% |
| Total | 1,650 | 100.0% |
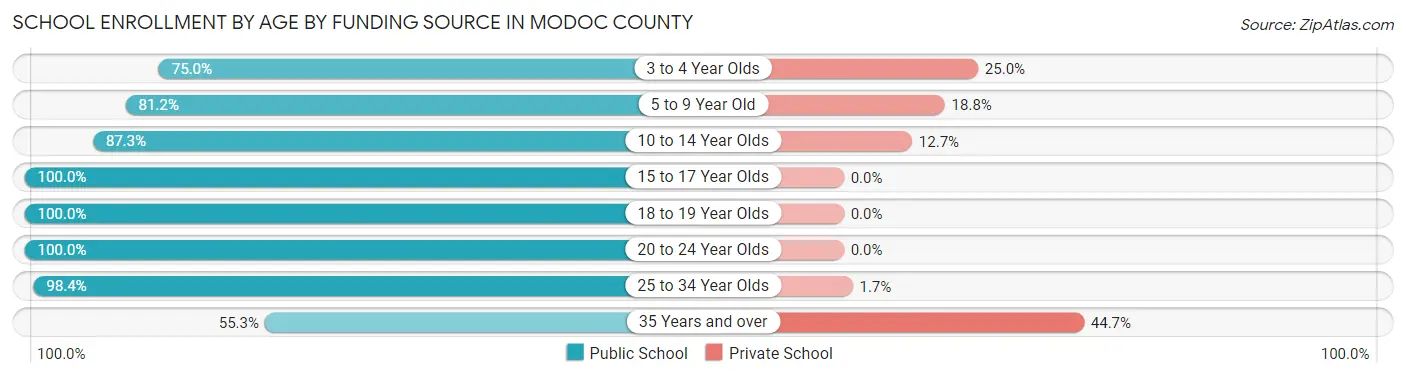
School Enrollment by Age by Funding Source in Modoc County
Out of a total of 1,650 students who are enrolled in schools in Modoc County, 203 (12.3%) attend a private institution, while the remaining 1,447 (87.7%) are enrolled in public schools. The age group of 35 years and over has the highest likelihood of being enrolled in private schools, with 34 (44.7% in the age bracket) enrolled. Conversely, the age group of 15 to 17 year olds has the lowest likelihood of being enrolled in a private school, with 242 (100.0% in the age bracket) attending a public institution.
| Age Bracket | Public School | Private School |
| 3 to 4 Year Olds | 69 (75.0%) | 23 (25.0%) |
| 5 to 9 Year Old | 397 (81.2%) | 92 (18.8%) |
| 10 to 14 Year Olds | 357 (87.3%) | 52 (12.7%) |
| 15 to 17 Year Olds | 242 (100.0%) | 0 (0.0%) |
| 18 to 19 Year Olds | 169 (100.0%) | 0 (0.0%) |
| 20 to 24 Year Olds | 52 (100.0%) | 0 (0.0%) |
| 25 to 34 Year Olds | 119 (98.4%) | 2 (1.7%) |
| 35 Years and over | 42 (55.3%) | 34 (44.7%) |
| Total | 1,447 (87.7%) | 203 (12.3%) |
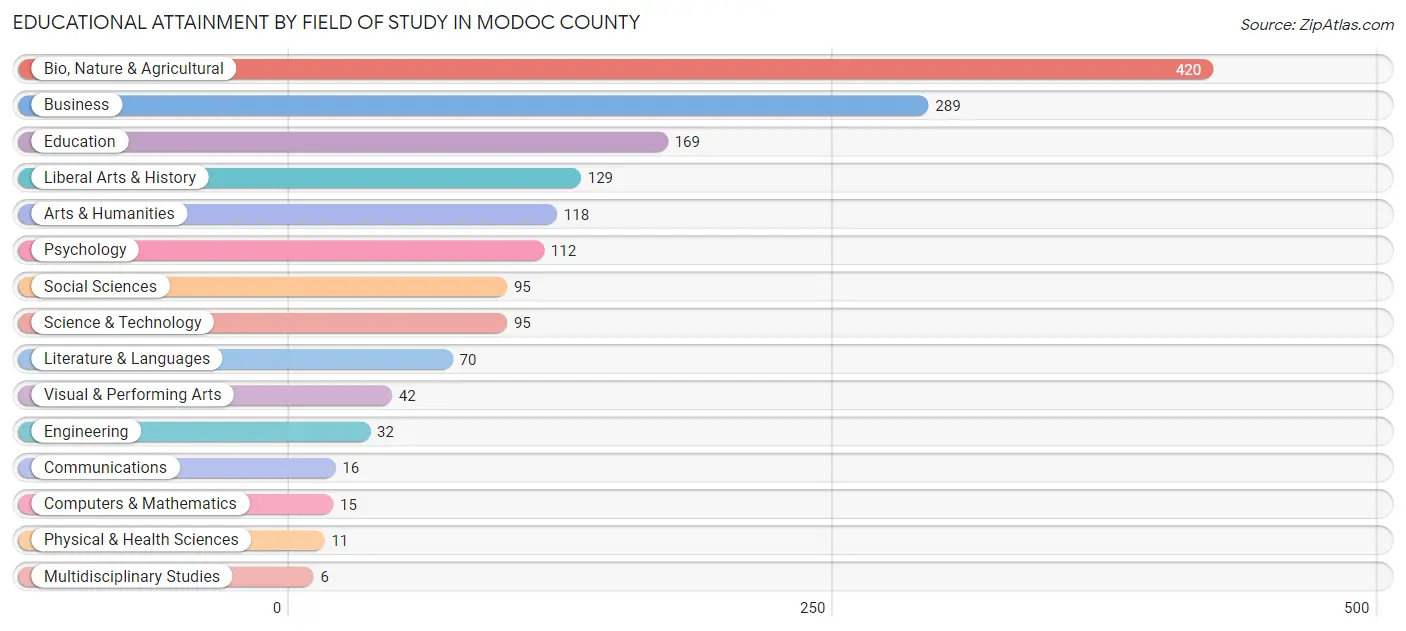
Educational Attainment by Field of Study in Modoc County
Bio, nature & agricultural (420 | 25.9%), business (289 | 17.8%), education (169 | 10.4%), liberal arts & history (129 | 8.0%), and arts & humanities (118 | 7.3%) are the most common fields of study among 1,619 individuals in Modoc County who have obtained a bachelor's degree or higher.
| Field of Study | # Graduates | % Graduates |
| Computers & Mathematics | 15 | 0.9% |
| Bio, Nature & Agricultural | 420 | 25.9% |
| Physical & Health Sciences | 11 | 0.7% |
| Psychology | 112 | 6.9% |
| Social Sciences | 95 | 5.9% |
| Engineering | 32 | 2.0% |
| Multidisciplinary Studies | 6 | 0.4% |
| Science & Technology | 95 | 5.9% |
| Business | 289 | 17.8% |
| Education | 169 | 10.4% |
| Literature & Languages | 70 | 4.3% |
| Liberal Arts & History | 129 | 8.0% |
| Visual & Performing Arts | 42 | 2.6% |
| Communications | 16 | 1.0% |
| Arts & Humanities | 118 | 7.3% |
| Total | 1,619 | 100.0% |
Transportation & Commute in Modoc County
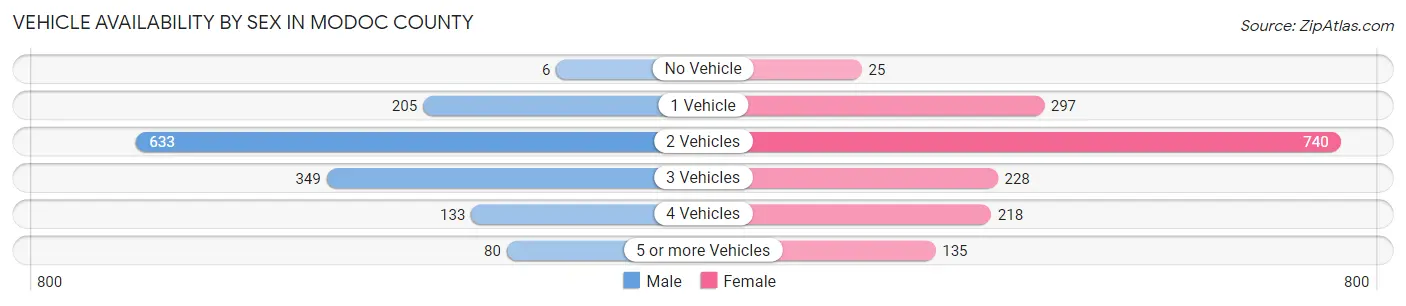
Vehicle Availability by Sex in Modoc County
The most prevalent vehicle ownership categories in Modoc County are males with 2 vehicles (633, accounting for 45.0%) and females with 2 vehicles (740, making up 38.5%).
| Vehicles Available | Male | Female |
| No Vehicle | 6 (0.4%) | 25 (1.5%) |
| 1 Vehicle | 205 (14.6%) | 297 (18.1%) |
| 2 Vehicles | 633 (45.0%) | 740 (45.0%) |
| 3 Vehicles | 349 (24.8%) | 228 (13.9%) |
| 4 Vehicles | 133 (9.5%) | 218 (13.3%) |
| 5 or more Vehicles | 80 (5.7%) | 135 (8.2%) |
| Total | 1,406 (100.0%) | 1,643 (100.0%) |
Commute Time in Modoc County
The most frequently occuring commute durations in Modoc County are 5 to 9 minutes (760 commuters, 26.7%), 10 to 14 minutes (554 commuters, 19.5%), and less than 5 minutes (511 commuters, 17.9%).
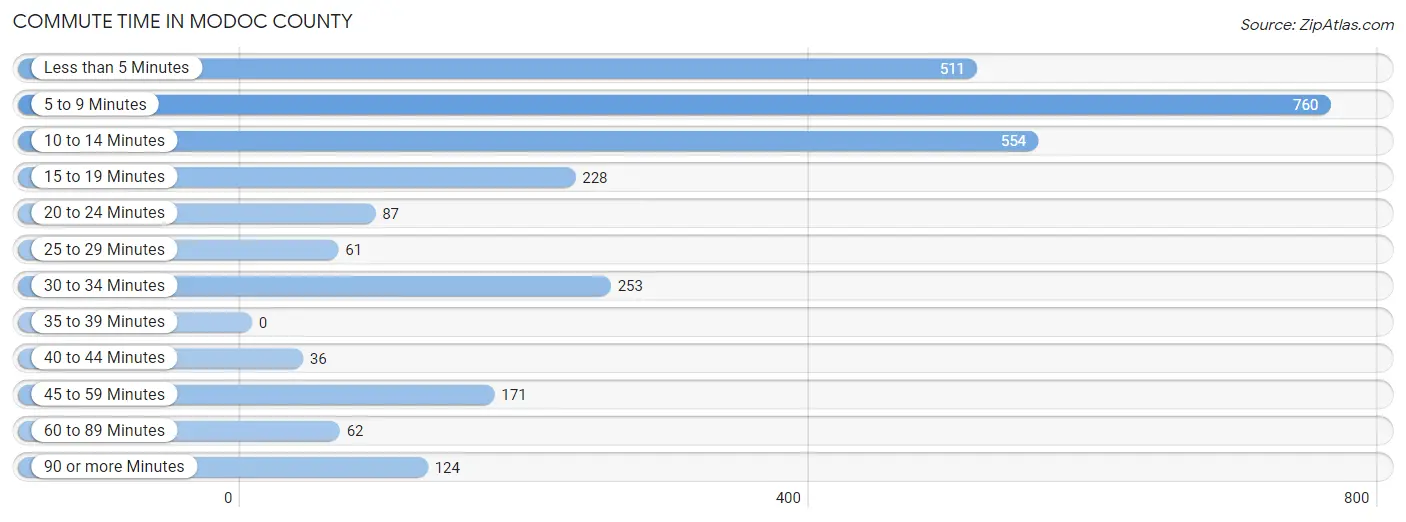
| Commute Time | # Commuters | % Commuters |
| Less than 5 Minutes | 511 | 17.9% |
| 5 to 9 Minutes | 760 | 26.7% |
| 10 to 14 Minutes | 554 | 19.5% |
| 15 to 19 Minutes | 228 | 8.0% |
| 20 to 24 Minutes | 87 | 3.1% |
| 25 to 29 Minutes | 61 | 2.1% |
| 30 to 34 Minutes | 253 | 8.9% |
| 35 to 39 Minutes | 0 | 0.0% |
| 40 to 44 Minutes | 36 | 1.3% |
| 45 to 59 Minutes | 171 | 6.0% |
| 60 to 89 Minutes | 62 | 2.2% |
| 90 or more Minutes | 124 | 4.4% |
Commute Time by Sex in Modoc County
The most common commute times in Modoc County are 10 to 14 minutes (251 commuters, 19.4%) for males and 5 to 9 minutes (559 commuters, 36.0%) for females.
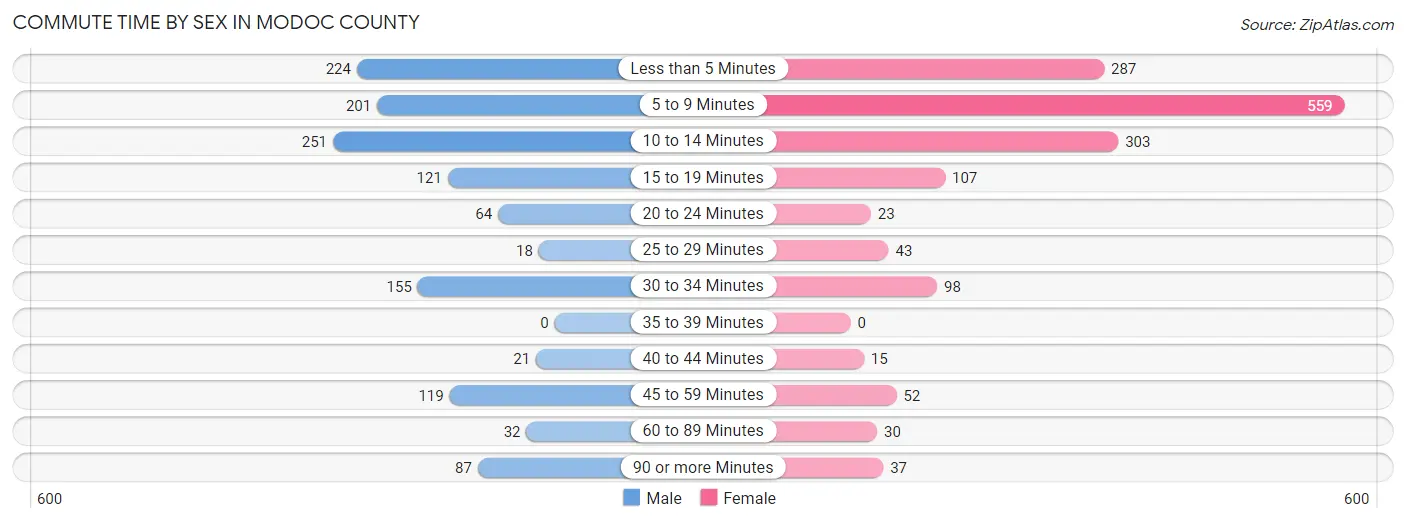
| Commute Time | Male | Female |
| Less than 5 Minutes | 224 (17.3%) | 287 (18.5%) |
| 5 to 9 Minutes | 201 (15.5%) | 559 (36.0%) |
| 10 to 14 Minutes | 251 (19.4%) | 303 (19.5%) |
| 15 to 19 Minutes | 121 (9.4%) | 107 (6.9%) |
| 20 to 24 Minutes | 64 (5.0%) | 23 (1.5%) |
| 25 to 29 Minutes | 18 (1.4%) | 43 (2.8%) |
| 30 to 34 Minutes | 155 (12.0%) | 98 (6.3%) |
| 35 to 39 Minutes | 0 (0.0%) | 0 (0.0%) |
| 40 to 44 Minutes | 21 (1.6%) | 15 (1.0%) |
| 45 to 59 Minutes | 119 (9.2%) | 52 (3.4%) |
| 60 to 89 Minutes | 32 (2.5%) | 30 (1.9%) |
| 90 or more Minutes | 87 (6.7%) | 37 (2.4%) |
Time of Departure to Work by Sex in Modoc County
The most frequent times of departure to work in Modoc County are 7:00 AM to 7:29 AM (320, 24.7%) for males and 8:00 AM to 8:29 AM (320, 20.6%) for females.
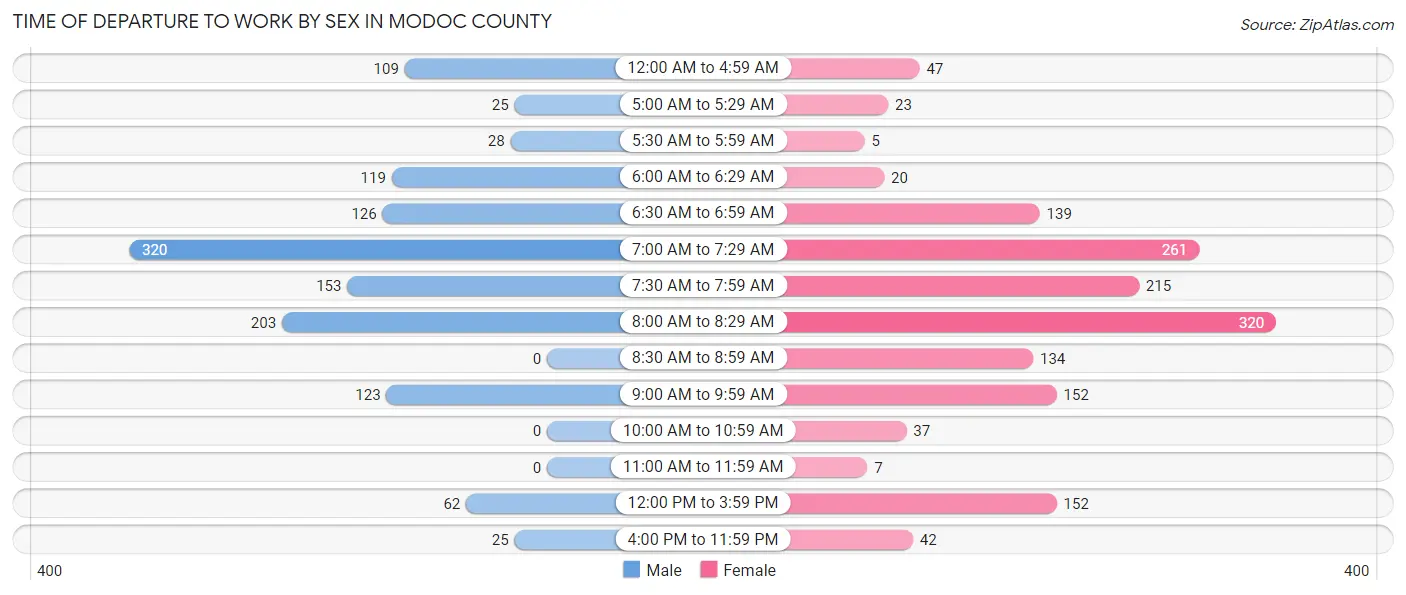
| Time of Departure | Male | Female |
| 12:00 AM to 4:59 AM | 109 (8.4%) | 47 (3.0%) |
| 5:00 AM to 5:29 AM | 25 (1.9%) | 23 (1.5%) |
| 5:30 AM to 5:59 AM | 28 (2.2%) | 5 (0.3%) |
| 6:00 AM to 6:29 AM | 119 (9.2%) | 20 (1.3%) |
| 6:30 AM to 6:59 AM | 126 (9.7%) | 139 (8.9%) |
| 7:00 AM to 7:29 AM | 320 (24.7%) | 261 (16.8%) |
| 7:30 AM to 7:59 AM | 153 (11.8%) | 215 (13.8%) |
| 8:00 AM to 8:29 AM | 203 (15.7%) | 320 (20.6%) |
| 8:30 AM to 8:59 AM | 0 (0.0%) | 134 (8.6%) |
| 9:00 AM to 9:59 AM | 123 (9.5%) | 152 (9.8%) |
| 10:00 AM to 10:59 AM | 0 (0.0%) | 37 (2.4%) |
| 11:00 AM to 11:59 AM | 0 (0.0%) | 7 (0.4%) |
| 12:00 PM to 3:59 PM | 62 (4.8%) | 152 (9.8%) |
| 4:00 PM to 11:59 PM | 25 (1.9%) | 42 (2.7%) |
| Total | 1,293 (100.0%) | 1,554 (100.0%) |
Housing Occupancy in Modoc County
Occupancy by Ownership in Modoc County
Of the total 3,403 dwellings in Modoc County, owner-occupied units account for 2,557 (75.1%), while renter-occupied units make up 846 (24.9%).
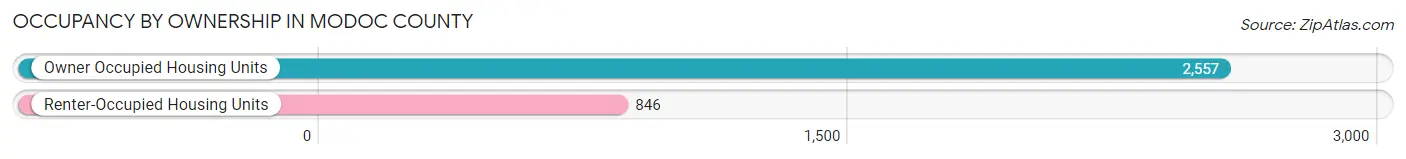
| Occupancy | # Housing Units | % Housing Units |
| Owner Occupied Housing Units | 2,557 | 75.1% |
| Renter-Occupied Housing Units | 846 | 24.9% |
| Total Occupied Housing Units | 3,403 | 100.0% |
Occupancy by Household Size in Modoc County
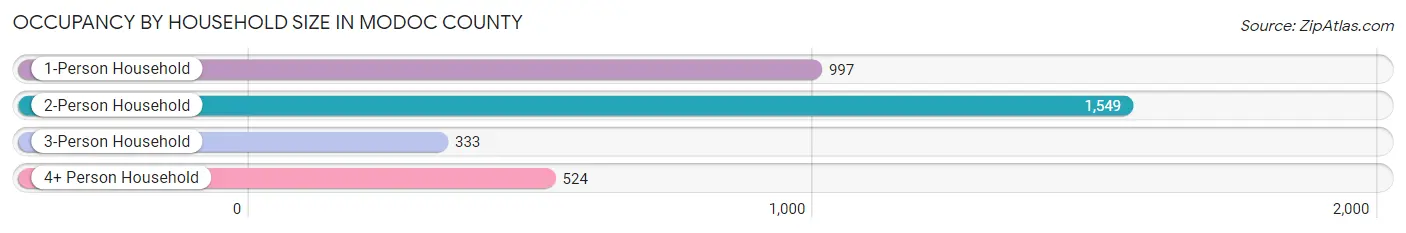
| Household Size | # Housing Units | % Housing Units |
| 1-Person Household | 997 | 29.3% |
| 2-Person Household | 1,549 | 45.5% |
| 3-Person Household | 333 | 9.8% |
| 4+ Person Household | 524 | 15.4% |
| Total Housing Units | 3,403 | 100.0% |
Occupancy by Ownership by Household Size in Modoc County
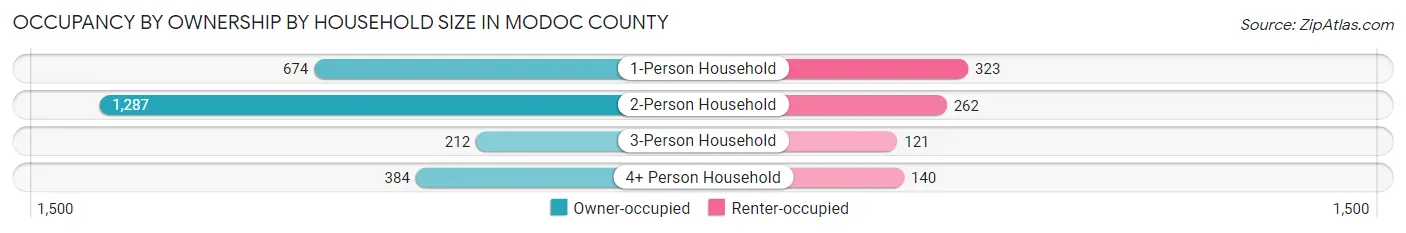
| Household Size | Owner-occupied | Renter-occupied |
| 1-Person Household | 674 (67.6%) | 323 (32.4%) |
| 2-Person Household | 1,287 (83.1%) | 262 (16.9%) |
| 3-Person Household | 212 (63.7%) | 121 (36.3%) |
| 4+ Person Household | 384 (73.3%) | 140 (26.7%) |
| Total Housing Units | 2,557 (75.1%) | 846 (24.9%) |
Occupancy by Educational Attainment in Modoc County
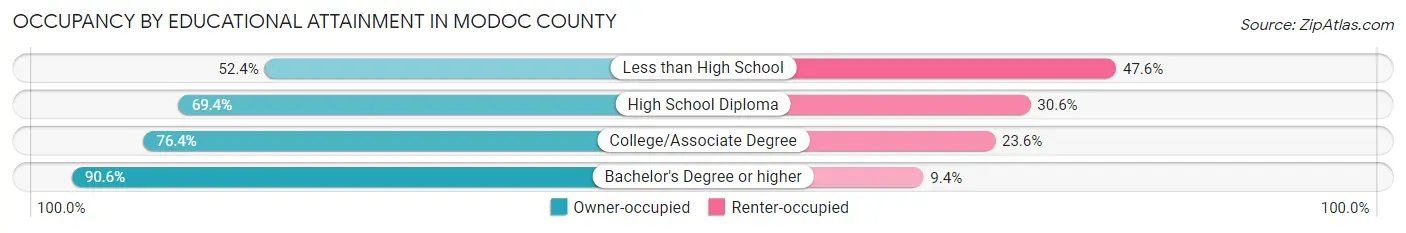
| Household Size | Owner-occupied | Renter-occupied |
| Less than High School | 172 (52.4%) | 156 (47.6%) |
| High School Diploma | 663 (69.4%) | 292 (30.6%) |
| College/Associate Degree | 1,074 (76.4%) | 331 (23.6%) |
| Bachelor's Degree or higher | 648 (90.6%) | 67 (9.4%) |
Occupancy by Age of Householder in Modoc County
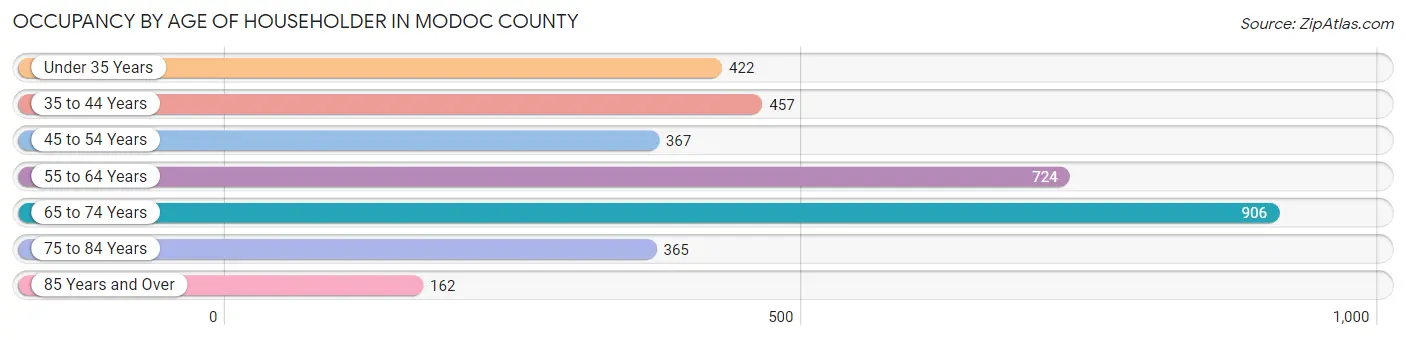
| Age Bracket | # Households | % Households |
| Under 35 Years | 422 | 12.4% |
| 35 to 44 Years | 457 | 13.4% |
| 45 to 54 Years | 367 | 10.8% |
| 55 to 64 Years | 724 | 21.3% |
| 65 to 74 Years | 906 | 26.6% |
| 75 to 84 Years | 365 | 10.7% |
| 85 Years and Over | 162 | 4.8% |
| Total | 3,403 | 100.0% |
Housing Finances in Modoc County
Median Income by Occupancy in Modoc County
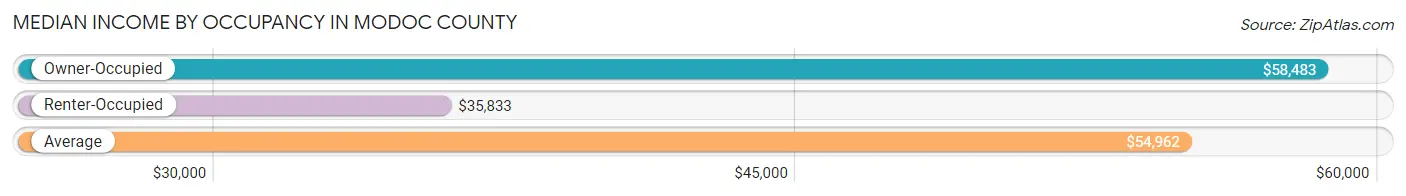
| Occupancy Type | # Households | Median Income |
| Owner-Occupied | 2,557 (75.1%) | $58,483 |
| Renter-Occupied | 846 (24.9%) | $35,833 |
| Average | 3,403 (100.0%) | $54,962 |
Occupancy by Householder Income Bracket in Modoc County
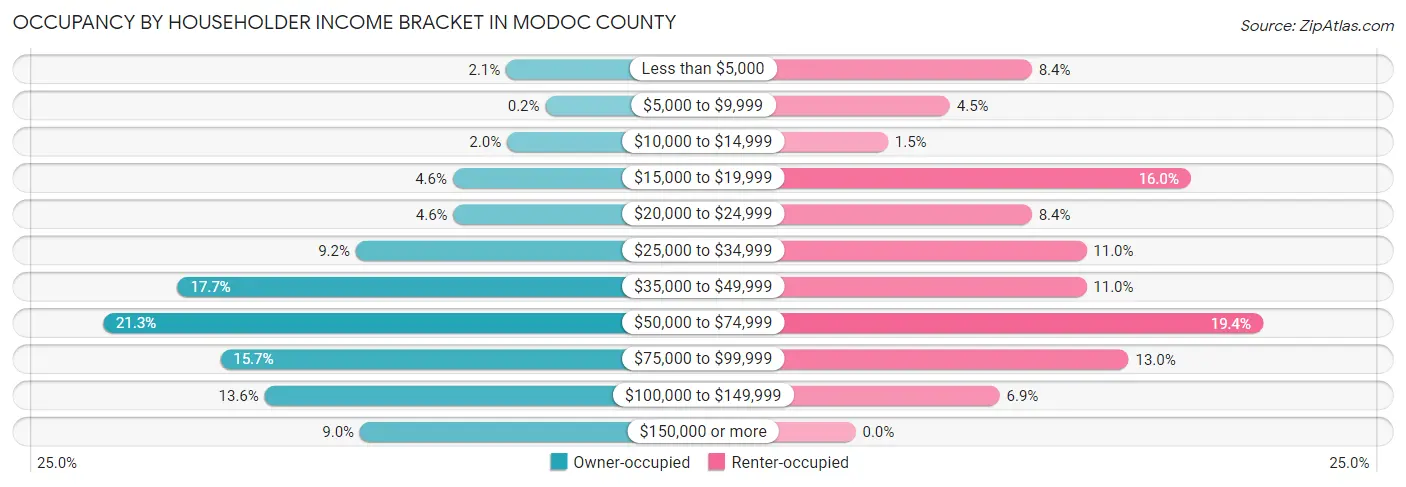
| Income Bracket | Owner-occupied | Renter-occupied |
| Less than $5,000 | 53 (2.1%) | 71 (8.4%) |
| $5,000 to $9,999 | 5 (0.2%) | 38 (4.5%) |
| $10,000 to $14,999 | 52 (2.0%) | 13 (1.5%) |
| $15,000 to $19,999 | 118 (4.6%) | 135 (16.0%) |
| $20,000 to $24,999 | 117 (4.6%) | 71 (8.4%) |
| $25,000 to $34,999 | 236 (9.2%) | 93 (11.0%) |
| $35,000 to $49,999 | 453 (17.7%) | 93 (11.0%) |
| $50,000 to $74,999 | 544 (21.3%) | 164 (19.4%) |
| $75,000 to $99,999 | 401 (15.7%) | 110 (13.0%) |
| $100,000 to $149,999 | 347 (13.6%) | 58 (6.9%) |
| $150,000 or more | 231 (9.0%) | 0 (0.0%) |
| Total | 2,557 (100.0%) | 846 (100.0%) |
Monthly Housing Cost Tiers in Modoc County
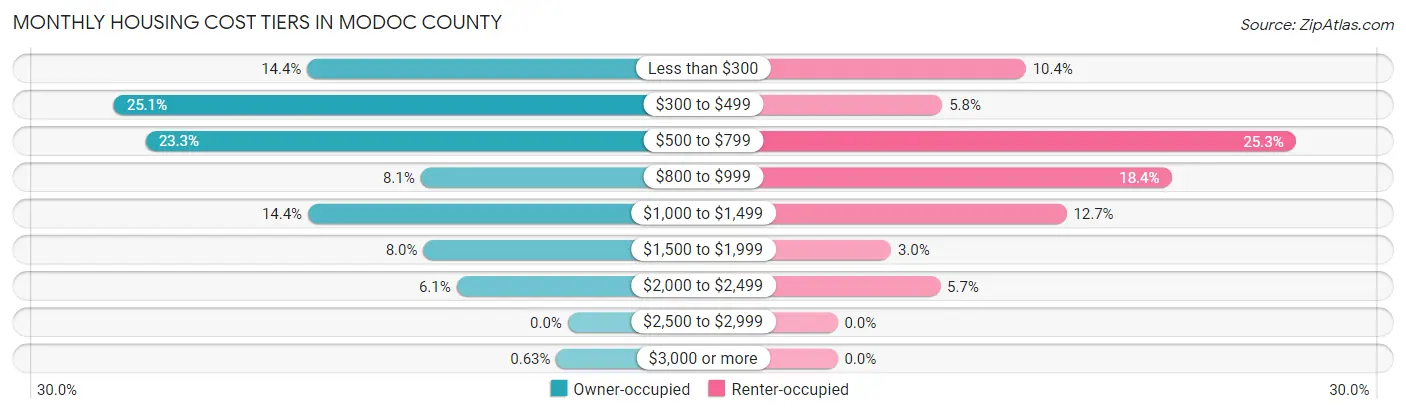
| Monthly Cost | Owner-occupied | Renter-occupied |
| Less than $300 | 368 (14.4%) | 88 (10.4%) |
| $300 to $499 | 641 (25.1%) | 49 (5.8%) |
| $500 to $799 | 596 (23.3%) | 214 (25.3%) |
| $800 to $999 | 208 (8.1%) | 156 (18.4%) |
| $1,000 to $1,499 | 367 (14.3%) | 107 (12.7%) |
| $1,500 to $1,999 | 204 (8.0%) | 25 (3.0%) |
| $2,000 to $2,499 | 157 (6.1%) | 48 (5.7%) |
| $2,500 to $2,999 | 0 (0.0%) | 0 (0.0%) |
| $3,000 or more | 16 (0.6%) | 0 (0.0%) |
| Total | 2,557 (100.0%) | 846 (100.0%) |
Physical Housing Characteristics in Modoc County
Housing Structures in Modoc County
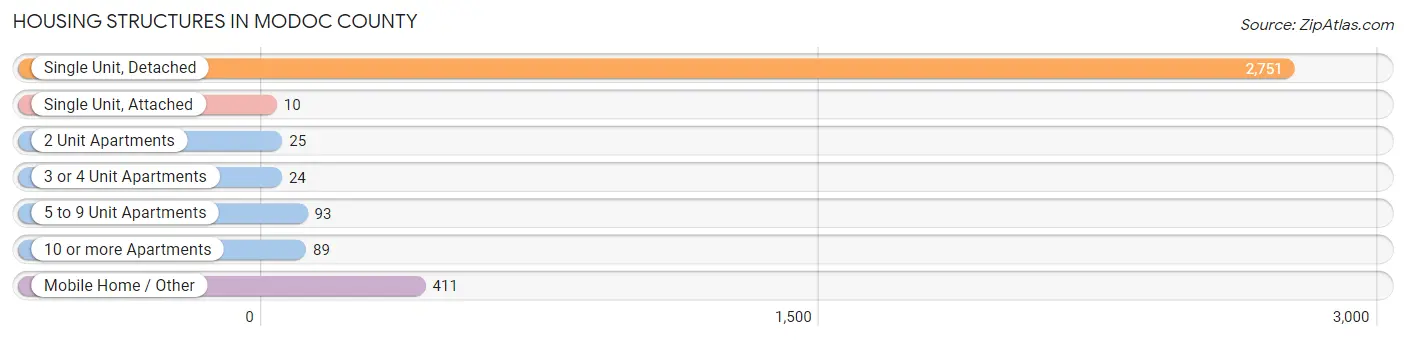
| Structure Type | # Housing Units | % Housing Units |
| Single Unit, Detached | 2,751 | 80.8% |
| Single Unit, Attached | 10 | 0.3% |
| 2 Unit Apartments | 25 | 0.7% |
| 3 or 4 Unit Apartments | 24 | 0.7% |
| 5 to 9 Unit Apartments | 93 | 2.7% |
| 10 or more Apartments | 89 | 2.6% |
| Mobile Home / Other | 411 | 12.1% |
| Total | 3,403 | 100.0% |
Housing Structures by Occupancy in Modoc County
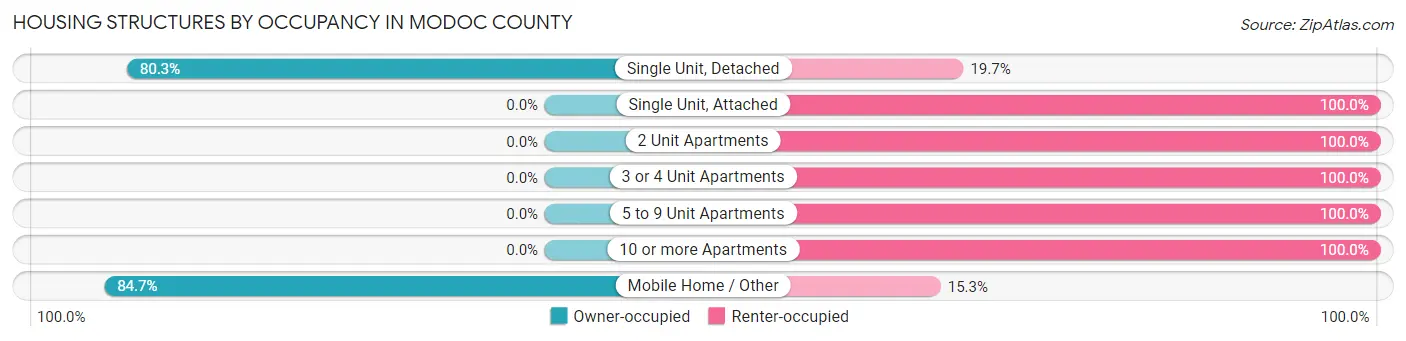
| Structure Type | Owner-occupied | Renter-occupied |
| Single Unit, Detached | 2,209 (80.3%) | 542 (19.7%) |
| Single Unit, Attached | 0 (0.0%) | 10 (100.0%) |
| 2 Unit Apartments | 0 (0.0%) | 25 (100.0%) |
| 3 or 4 Unit Apartments | 0 (0.0%) | 24 (100.0%) |
| 5 to 9 Unit Apartments | 0 (0.0%) | 93 (100.0%) |
| 10 or more Apartments | 0 (0.0%) | 89 (100.0%) |
| Mobile Home / Other | 348 (84.7%) | 63 (15.3%) |
| Total | 2,557 (75.1%) | 846 (24.9%) |
Housing Structures by Number of Rooms in Modoc County
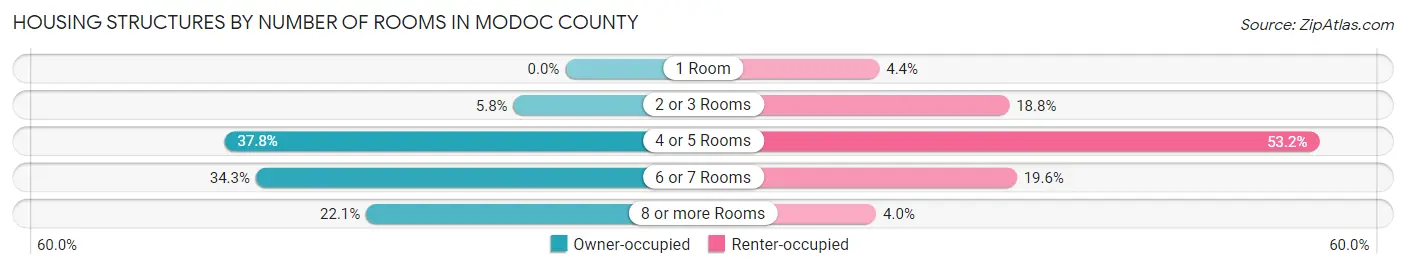
| Number of Rooms | Owner-occupied | Renter-occupied |
| 1 Room | 0 (0.0%) | 37 (4.4%) |
| 2 or 3 Rooms | 147 (5.8%) | 159 (18.8%) |
| 4 or 5 Rooms | 967 (37.8%) | 450 (53.2%) |
| 6 or 7 Rooms | 878 (34.3%) | 166 (19.6%) |
| 8 or more Rooms | 565 (22.1%) | 34 (4.0%) |
| Total | 2,557 (100.0%) | 846 (100.0%) |
Housing Structure by Heating Type in Modoc County
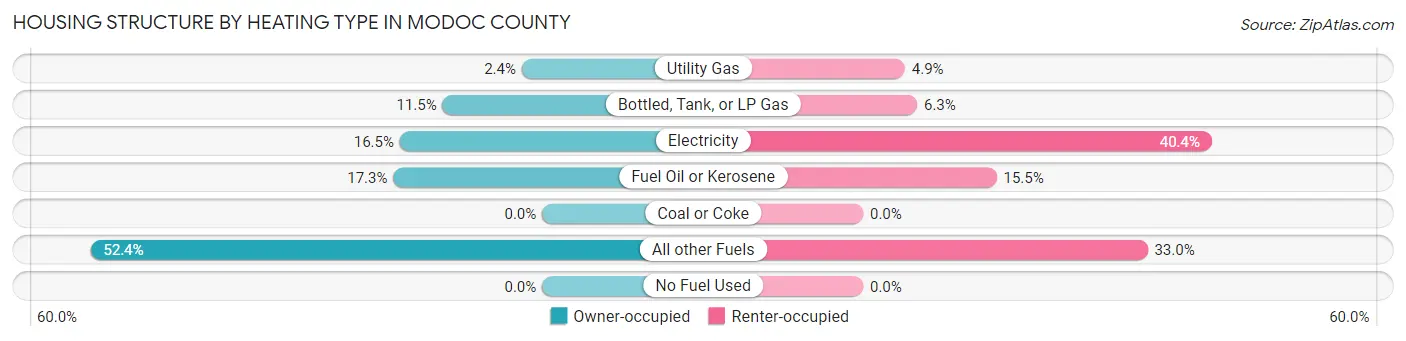
| Heating Type | Owner-occupied | Renter-occupied |
| Utility Gas | 60 (2.4%) | 41 (4.9%) |
| Bottled, Tank, or LP Gas | 295 (11.5%) | 53 (6.3%) |
| Electricity | 422 (16.5%) | 342 (40.4%) |
| Fuel Oil or Kerosene | 441 (17.2%) | 131 (15.5%) |
| Coal or Coke | 0 (0.0%) | 0 (0.0%) |
| All other Fuels | 1,339 (52.4%) | 279 (33.0%) |
| No Fuel Used | 0 (0.0%) | 0 (0.0%) |
| Total | 2,557 (100.0%) | 846 (100.0%) |
Household Vehicle Usage in Modoc County
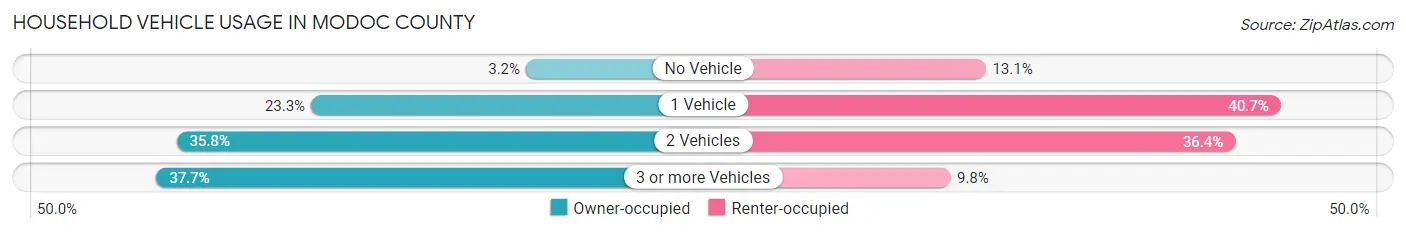
| Vehicles per Household | Owner-occupied | Renter-occupied |
| No Vehicle | 82 (3.2%) | 111 (13.1%) |
| 1 Vehicle | 595 (23.3%) | 344 (40.7%) |
| 2 Vehicles | 916 (35.8%) | 308 (36.4%) |
| 3 or more Vehicles | 964 (37.7%) | 83 (9.8%) |
| Total | 2,557 (100.0%) | 846 (100.0%) |
Real Estate & Mortgages in Modoc County
Real Estate and Mortgage Overview in Modoc County
| Characteristic | Without Mortgage | With Mortgage |
| Housing Units | 1,582 | 975 |
| Median Property Value | $190,000 | $170,600 |
| Median Household Income | $52,537 | $91 |
| Monthly Housing Costs | $440 | $13 |
| Real Estate Taxes | $1,270 | $21 |
Property Value by Mortgage Status in Modoc County
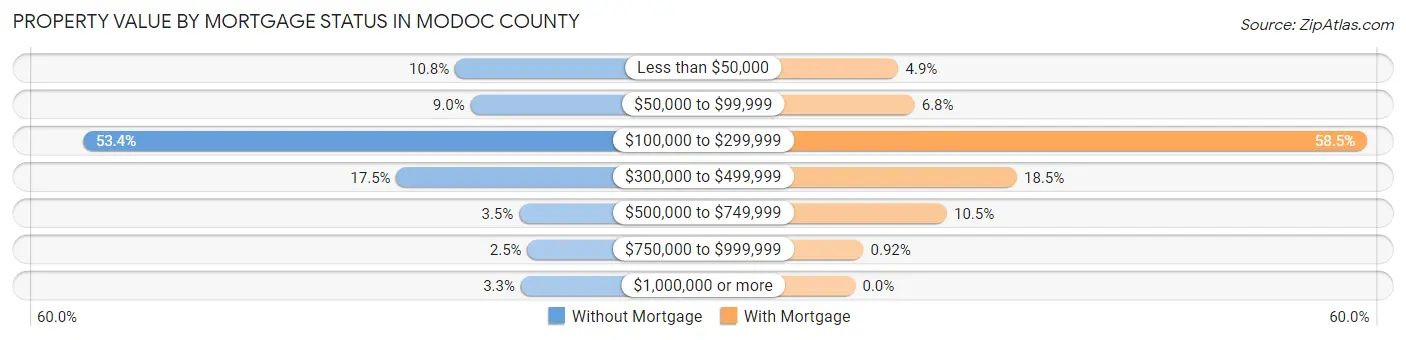
| Property Value | Without Mortgage | With Mortgage |
| Less than $50,000 | 171 (10.8%) | 48 (4.9%) |
| $50,000 to $99,999 | 143 (9.0%) | 66 (6.8%) |
| $100,000 to $299,999 | 844 (53.3%) | 570 (58.5%) |
| $300,000 to $499,999 | 277 (17.5%) | 180 (18.5%) |
| $500,000 to $749,999 | 55 (3.5%) | 102 (10.5%) |
| $750,000 to $999,999 | 40 (2.5%) | 9 (0.9%) |
| $1,000,000 or more | 52 (3.3%) | 0 (0.0%) |
| Total | 1,582 (100.0%) | 975 (100.0%) |
Household Income by Mortgage Status in Modoc County
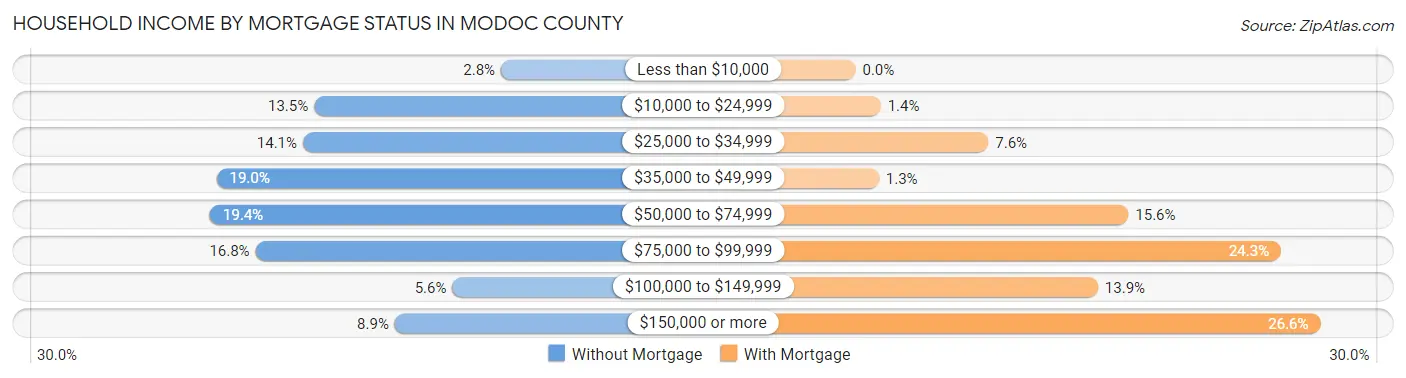
| Household Income | Without Mortgage | With Mortgage |
| Less than $10,000 | 44 (2.8%) | 0 (0.0%) |
| $10,000 to $24,999 | 213 (13.5%) | 14 (1.4%) |
| $25,000 to $34,999 | 223 (14.1%) | 74 (7.6%) |
| $35,000 to $49,999 | 301 (19.0%) | 13 (1.3%) |
| $50,000 to $74,999 | 307 (19.4%) | 152 (15.6%) |
| $75,000 to $99,999 | 266 (16.8%) | 237 (24.3%) |
| $100,000 to $149,999 | 88 (5.6%) | 135 (13.9%) |
| $150,000 or more | 140 (8.8%) | 259 (26.6%) |
| Total | 1,582 (100.0%) | 975 (100.0%) |
Property Value to Household Income Ratio in Modoc County
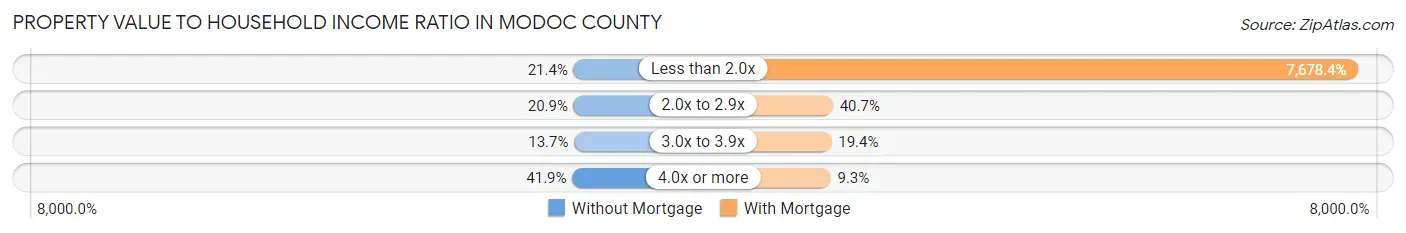
| Value-to-Income Ratio | Without Mortgage | With Mortgage |
| Less than 2.0x | 338 (21.4%) | 74,864 (7,678.4%) |
| 2.0x to 2.9x | 331 (20.9%) | 397 (40.7%) |
| 3.0x to 3.9x | 217 (13.7%) | 189 (19.4%) |
| 4.0x or more | 663 (41.9%) | 91 (9.3%) |
| Total | 1,582 (100.0%) | 975 (100.0%) |
Real Estate Taxes by Mortgage Status in Modoc County
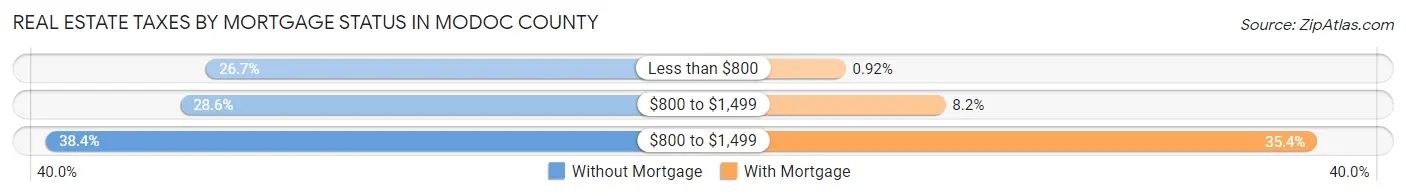
| Property Taxes | Without Mortgage | With Mortgage |
| Less than $800 | 423 (26.7%) | 9 (0.9%) |
| $800 to $1,499 | 453 (28.6%) | 80 (8.2%) |
| $800 to $1,499 | 608 (38.4%) | 345 (35.4%) |
| Total | 1,582 (100.0%) | 975 (100.0%) |
Health & Disability in Modoc County
Health Insurance Coverage by Age in Modoc County
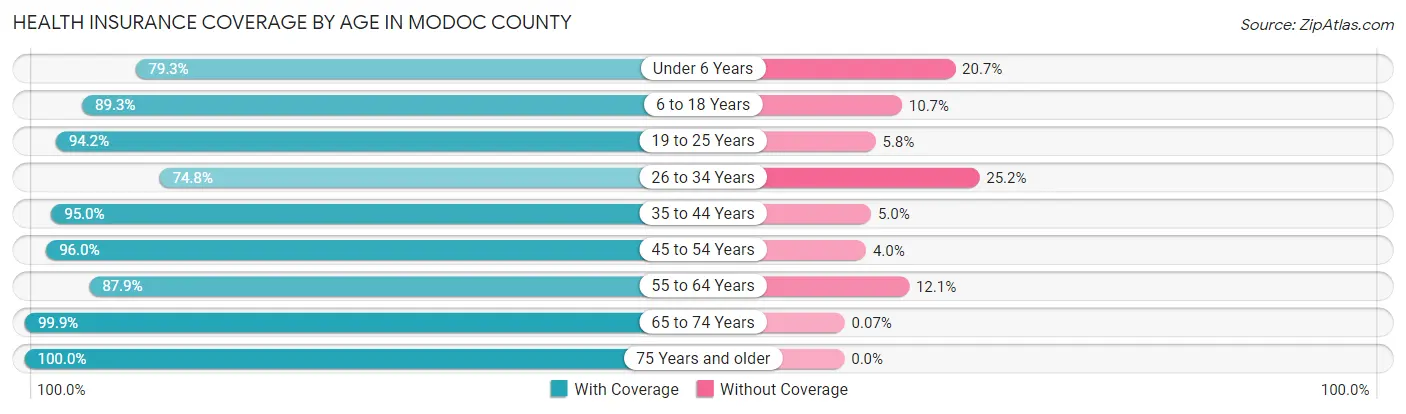
| Age Bracket | With Coverage | Without Coverage |
| Under 6 Years | 434 (79.3%) | 113 (20.7%) |
| 6 to 18 Years | 1,107 (89.3%) | 133 (10.7%) |
| 19 to 25 Years | 323 (94.2%) | 20 (5.8%) |
| 26 to 34 Years | 752 (74.8%) | 253 (25.2%) |
| 35 to 44 Years | 802 (95.0%) | 42 (5.0%) |
| 45 to 54 Years | 760 (96.0%) | 32 (4.0%) |
| 55 to 64 Years | 1,043 (87.9%) | 143 (12.1%) |
| 65 to 74 Years | 1,447 (99.9%) | 1 (0.1%) |
| 75 Years and older | 1,074 (100.0%) | 0 (0.0%) |
| Total | 7,742 (91.3%) | 737 (8.7%) |
Health Insurance Coverage by Citizenship Status in Modoc County

| Citizenship Status | With Coverage | Without Coverage |
| Native Born | 434 (79.3%) | 113 (20.7%) |
| Foreign Born, Citizen | 1,107 (89.3%) | 133 (10.7%) |
| Foreign Born, not a Citizen | 323 (94.2%) | 20 (5.8%) |
Health Insurance Coverage by Household Income in Modoc County

| Household Income | With Coverage | Without Coverage |
| Under $25,000 | 1,092 (78.3%) | 303 (21.7%) |
| $25,000 to $49,999 | 1,645 (92.0%) | 143 (8.0%) |
| $50,000 to $74,999 | 1,734 (95.4%) | 83 (4.6%) |
| $75,000 to $99,999 | 1,003 (96.5%) | 36 (3.5%) |
| $100,000 and over | 1,865 (91.8%) | 166 (8.2%) |
Public vs Private Health Insurance Coverage by Age in Modoc County
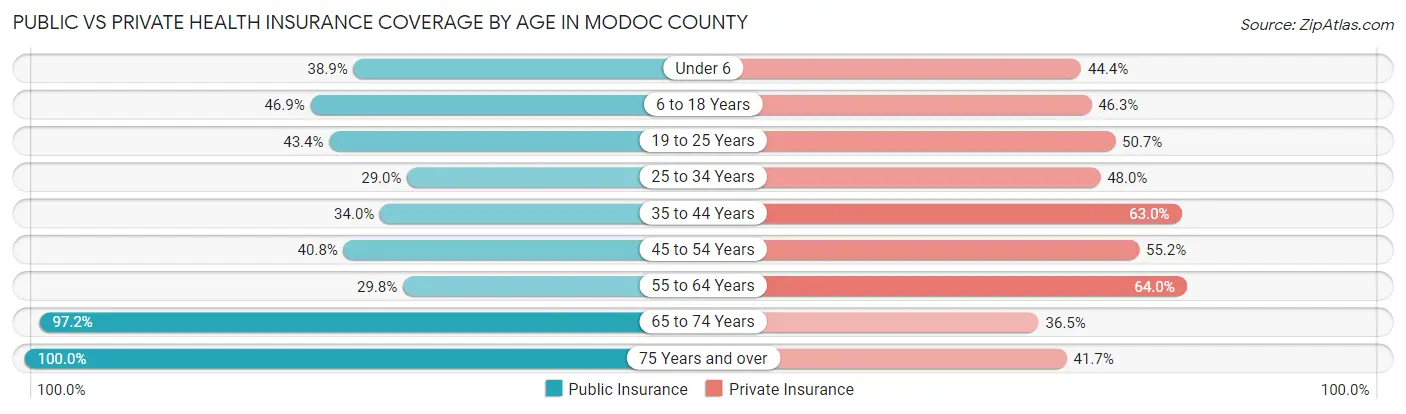
| Age Bracket | Public Insurance | Private Insurance |
| Under 6 | 213 (38.9%) | 243 (44.4%) |
| 6 to 18 Years | 582 (46.9%) | 574 (46.3%) |
| 19 to 25 Years | 149 (43.4%) | 174 (50.7%) |
| 25 to 34 Years | 291 (29.0%) | 482 (48.0%) |
| 35 to 44 Years | 287 (34.0%) | 532 (63.0%) |
| 45 to 54 Years | 323 (40.8%) | 437 (55.2%) |
| 55 to 64 Years | 353 (29.8%) | 759 (64.0%) |
| 65 to 74 Years | 1,408 (97.2%) | 529 (36.5%) |
| 75 Years and over | 1,074 (100.0%) | 448 (41.7%) |
| Total | 4,680 (55.2%) | 4,178 (49.3%) |
Disability Status by Sex by Age in Modoc County
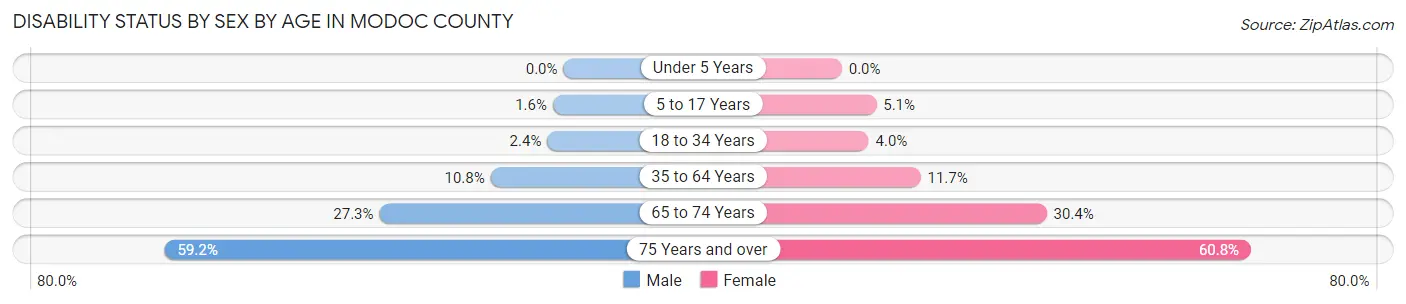
| Age Bracket | Male | Female |
| Under 5 Years | 0 (0.0%) | 0 (0.0%) |
| 5 to 17 Years | 8 (1.6%) | 36 (5.1%) |
| 18 to 34 Years | 18 (2.4%) | 30 (4.0%) |
| 35 to 64 Years | 146 (10.8%) | 172 (11.7%) |
| 65 to 74 Years | 206 (27.3%) | 211 (30.4%) |
| 75 Years and over | 289 (59.2%) | 356 (60.8%) |
Disability Class by Sex by Age in Modoc County
Disability Class: Hearing Difficulty
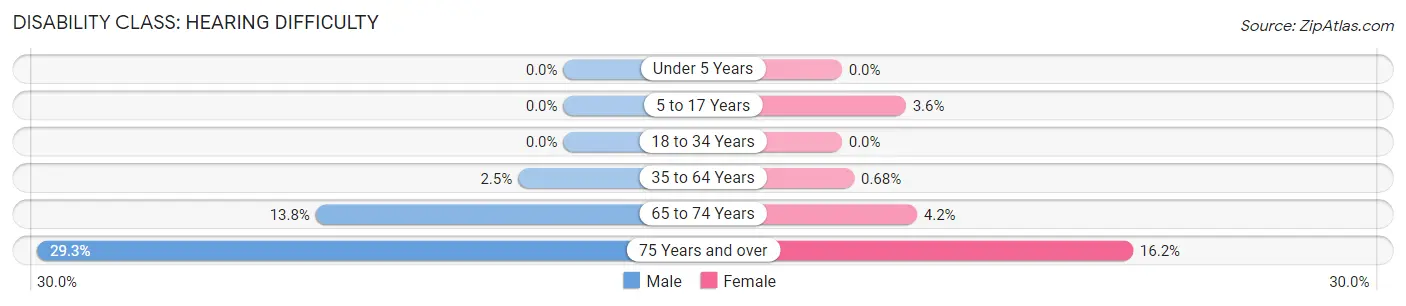
| Age Bracket | Male | Female |
| Under 5 Years | 0 (0.0%) | 0 (0.0%) |
| 5 to 17 Years | 0 (0.0%) | 25 (3.6%) |
| 18 to 34 Years | 0 (0.0%) | 0 (0.0%) |
| 35 to 64 Years | 34 (2.5%) | 10 (0.7%) |
| 65 to 74 Years | 104 (13.8%) | 29 (4.2%) |
| 75 Years and over | 143 (29.3%) | 95 (16.2%) |
Disability Class: Vision Difficulty
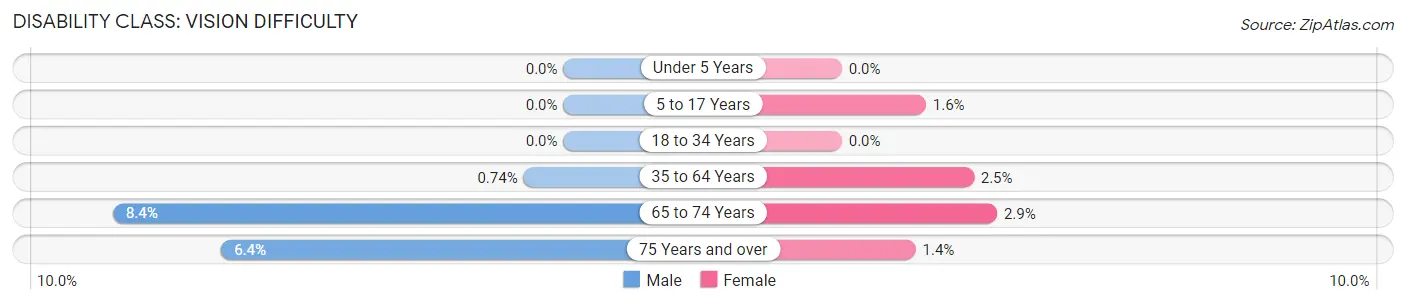
| Age Bracket | Male | Female |
| Under 5 Years | 0 (0.0%) | 0 (0.0%) |
| 5 to 17 Years | 0 (0.0%) | 11 (1.6%) |
| 18 to 34 Years | 0 (0.0%) | 0 (0.0%) |
| 35 to 64 Years | 10 (0.7%) | 36 (2.5%) |
| 65 to 74 Years | 63 (8.4%) | 20 (2.9%) |
| 75 Years and over | 31 (6.4%) | 8 (1.4%) |
Disability Class: Cognitive Difficulty
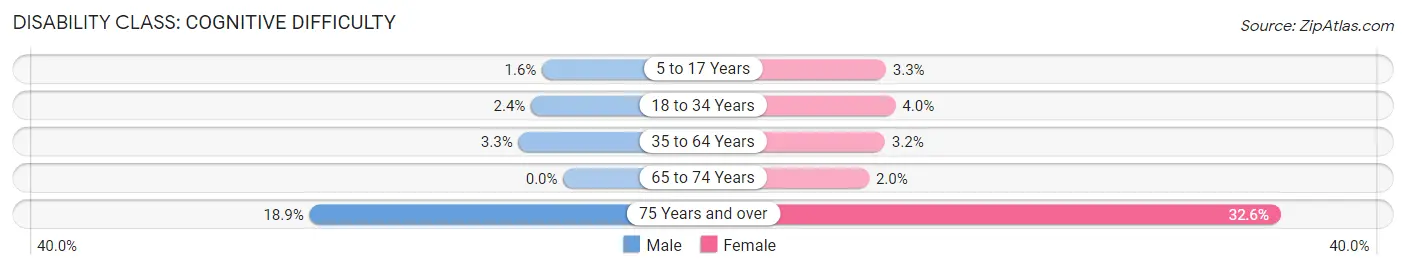
| Age Bracket | Male | Female |
| 5 to 17 Years | 8 (1.6%) | 23 (3.3%) |
| 18 to 34 Years | 18 (2.4%) | 30 (4.0%) |
| 35 to 64 Years | 45 (3.3%) | 47 (3.2%) |
| 65 to 74 Years | 0 (0.0%) | 14 (2.0%) |
| 75 Years and over | 92 (18.9%) | 191 (32.6%) |
Disability Class: Ambulatory Difficulty
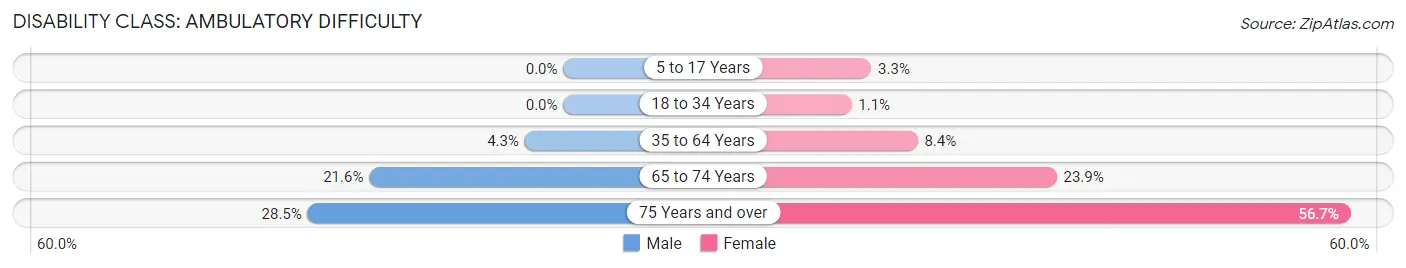
| Age Bracket | Male | Female |
| 5 to 17 Years | 0 (0.0%) | 23 (3.3%) |
| 18 to 34 Years | 0 (0.0%) | 8 (1.1%) |
| 35 to 64 Years | 58 (4.3%) | 124 (8.4%) |
| 65 to 74 Years | 163 (21.6%) | 166 (23.9%) |
| 75 Years and over | 139 (28.5%) | 332 (56.7%) |
Disability Class: Self-Care Difficulty
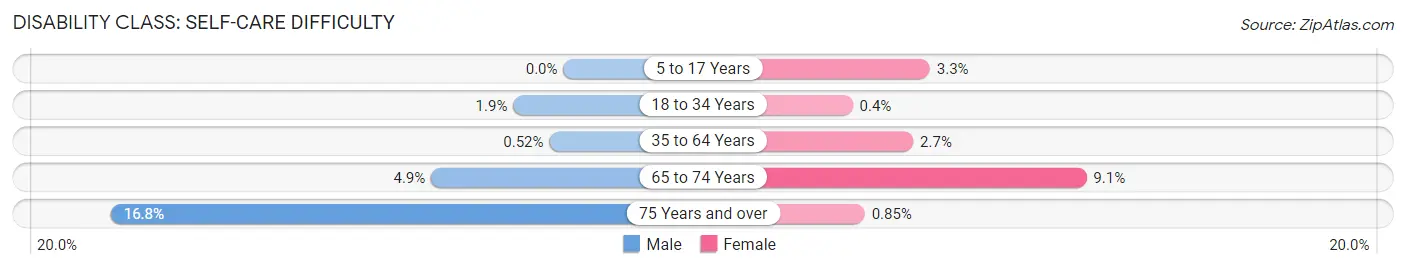
| Age Bracket | Male | Female |
| 5 to 17 Years | 0 (0.0%) | 23 (3.3%) |
| 18 to 34 Years | 14 (1.9%) | 3 (0.4%) |
| 35 to 64 Years | 7 (0.5%) | 39 (2.6%) |
| 65 to 74 Years | 37 (4.9%) | 63 (9.1%) |
| 75 Years and over | 82 (16.8%) | 5 (0.9%) |
Technology Access in Modoc County
Computing Device Access in Modoc County
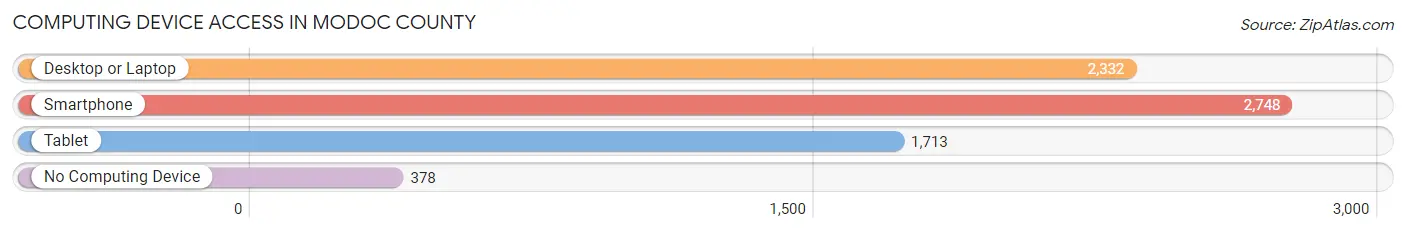
| Device Type | # Households | % Households |
| Desktop or Laptop | 2,332 | 68.5% |
| Smartphone | 2,748 | 80.7% |
| Tablet | 1,713 | 50.3% |
| No Computing Device | 378 | 11.1% |
| Total | 3,403 | 100.0% |
Internet Access in Modoc County
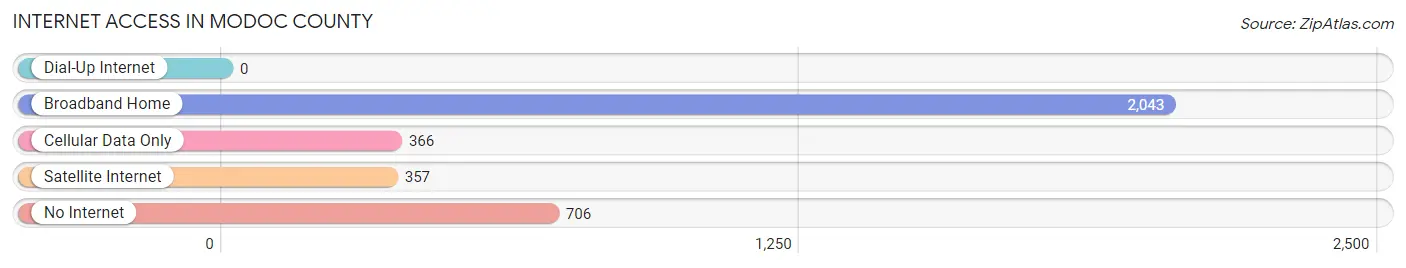
| Internet Type | # Households | % Households |
| Dial-Up Internet | 0 | 0.0% |
| Broadband Home | 2,043 | 60.0% |
| Cellular Data Only | 366 | 10.8% |
| Satellite Internet | 357 | 10.5% |
| No Internet | 706 | 20.7% |
| Total | 3,403 | 100.0% |
Modoc County Summary
Modoc County is located in the northeastern corner of California, bordering Oregon to the north and Nevada to the east. It is the second least populous county in the state, with a population of just over 9,000 people. The county seat is Alturas, and the largest city is Cedarville.
History
The area that is now Modoc County was originally inhabited by the Modoc people, who were part of the larger Klamath tribe. The Modoc people lived in the area for thousands of years before the arrival of European settlers in the mid-1800s. The first non-Native American settlers arrived in the area in 1846, and the county was officially established in 1874.
The county was named after the Modoc people, and the county seat was established in Alturas, which is derived from the Spanish word for “highlands.” The county was initially populated by ranchers and farmers, and the economy was largely based on agriculture and livestock.
In the late 1800s, the county experienced a population boom due to the discovery of gold in the area. This led to an influx of miners and prospectors, and the county’s population grew to over 10,000 people. However, the gold rush was short-lived, and the population declined after the gold ran out.
Geography
Modoc County covers an area of 4,203 square miles, making it the fourth largest county in California. The county is located in the northeastern corner of the state, and is bordered by Oregon to the north and Nevada to the east. The county is mostly mountainous, with the Warner Mountains running through the center of the county. The county also contains several lakes, including Goose Lake, Clear Lake, and Lake City.
The county is divided into two distinct regions: the Modoc Plateau and the Great Basin. The Modoc Plateau is a high desert region, with elevations ranging from 4,000 to 8,000 feet. The Great Basin is a low-lying region, with elevations ranging from 4,000 to 6,000 feet.
Economy
The economy of Modoc County is largely based on agriculture and livestock. The county is home to several large cattle ranches, and the county’s agricultural products include hay, wheat, barley, and alfalfa. The county also has a thriving timber industry, and the county’s forests are home to several species of trees, including ponderosa pine, white fir, and Douglas fir.
The county also has a growing tourism industry, and the county is home to several popular attractions, including the Lava Beds National Monument, the Modoc National Wildlife Refuge, and the Medicine Lake National Wildlife Refuge.
Demographics
As of the 2010 census, Modoc County had a population of 9,686 people. The population is spread out across the county, with the largest population centers being Alturas (population 2,827) and Cedarville (population 1,077). The county is predominantly white (87.3%), with smaller percentages of Native American (7.2%), Hispanic (2.7%), and African American (1.2%) populations. The median household income in the county is $37,941, and the median age is 44.7 years.
Modoc County is a rural county with a small population and a largely agricultural economy. The county is home to several popular attractions, and the county’s forests and lakes provide a variety of recreational opportunities. The county is also home to a diverse population, with a mix of Native American, Hispanic, and African American residents.
Common Questions
What is Per Capita Income in Modoc County?
Per Capita income in Modoc County is $28,860.
What is the Median Family Income in Modoc County?
Median Family Income in Modoc County is $61,250.
What is the Median Household income in Modoc County?
Median Household Income in Modoc County is $54,962.
What is Income or Wage Gap in Modoc County?
Income or Wage Gap in Modoc County is 45.2%.
Women in Modoc County earn 54.8 cents for every dollar earned by a man.
What is Family Income Deficit in Modoc County?
Family Income Deficit in Modoc County is $8,758.
Families that are below poverty line in Modoc County earn $8,758 less on average than the poverty threshold level.
What is Inequality or Gini Index in Modoc County?
Inequality or Gini Index in Modoc County is 0.41.
What is the Total Population of Modoc County?
Total Population of Modoc County is 8,651.
What is the Total Male Population of Modoc County?
Total Male Population of Modoc County is 4,205.
What is the Total Female Population of Modoc County?
Total Female Population of Modoc County is 4,446.
What is the Ratio of Males per 100 Females in Modoc County?
There are 94.58 Males per 100 Females in Modoc County.
What is the Ratio of Females per 100 Males in Modoc County?
There are 105.73 Females per 100 Males in Modoc County.
What is the Median Population Age in Modoc County?
Median Population Age in Modoc County is 47.5 Years.
What is the Average Family Size in Modoc County
Average Family Size in Modoc County is 2.9 People.
What is the Average Household Size in Modoc County
Average Household Size in Modoc County is 2.4 People.
How Large is the Labor Force in Modoc County?
There are 3,469 People in the Labor Forcein in Modoc County.
What is the Percentage of People in the Labor Force in Modoc County?
48.3% of People are in the Labor Force in Modoc County.
What is the Unemployment Rate in Modoc County?
Unemployment Rate in Modoc County is 7.6%.