Mendocino County, CA Map & Demographics
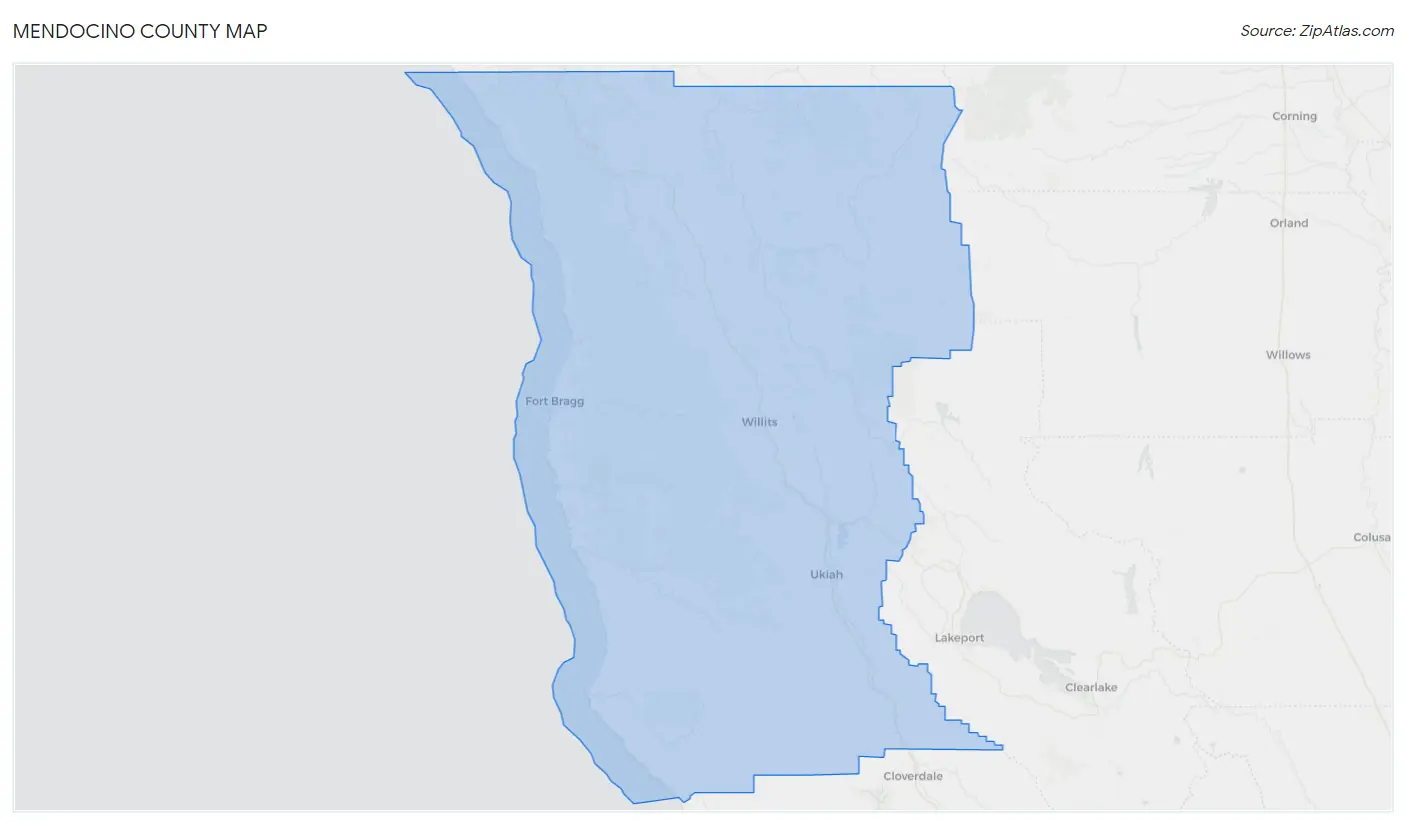
Mendocino County Map
Mendocino County Overview
$34,977
PER CAPITA INCOME
$79,466
AVG FAMILY INCOME
$61,335
AVG HOUSEHOLD INCOME
29.3%
WAGE / INCOME GAP [ % ]
70.7¢/ $1
WAGE / INCOME GAP [ $ ]
$9,855
FAMILY INCOME DEFICIT
0.48
INEQUALITY / GINI INDEX
91,145
TOTAL POPULATION
45,110
MALE POPULATION
46,035
FEMALE POPULATION
97.99
MALES / 100 FEMALES
102.05
FEMALES / 100 MALES
43.7
MEDIAN AGE
3.3
AVG FAMILY SIZE
2.6
AVG HOUSEHOLD SIZE
41,932
LABOR FORCE [ PEOPLE ]
56.5%
PERCENT IN LABOR FORCE
9.1%
UNEMPLOYMENT RATE
Mendocino County Area Codes
Income in Mendocino County
Income Overview in Mendocino County
Per Capita Income in Mendocino County is $34,977, while median incomes of families and households are $79,466 and $61,335 respectively.
| Characteristic | Number | Measure |
| Per Capita Income | 91,145 | $34,977 |
| Median Family Income | 20,761 | $79,466 |
| Mean Family Income | 20,761 | $104,125 |
| Median Household Income | 34,557 | $61,335 |
| Mean Household Income | 34,557 | $86,870 |
| Income Deficit | 20,761 | $9,855 |
| Wage / Income Gap (%) | 91,145 | 29.31% |
| Wage / Income Gap ($) | 91,145 | 70.69¢ per $1 |
| Gini / Inequality Index | 91,145 | 0.48 |
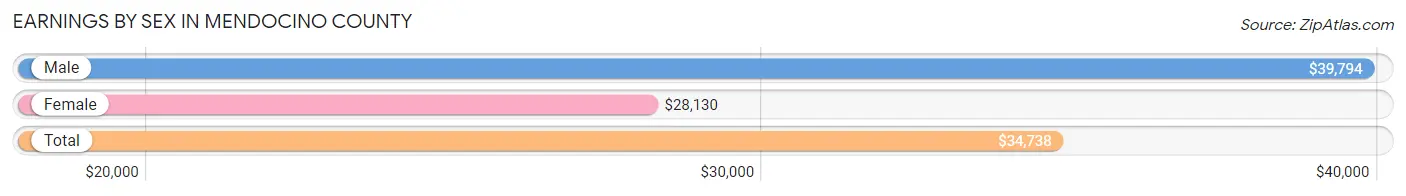
Earnings by Sex in Mendocino County
Average Earnings in Mendocino County are $34,738, $39,794 for men and $28,130 for women, a difference of 29.3%.
| Sex | Number | Average Earnings |
| Male | 22,901 (52.5%) | $39,794 |
| Female | 20,730 (47.5%) | $28,130 |
| Total | 43,631 (100.0%) | $34,738 |
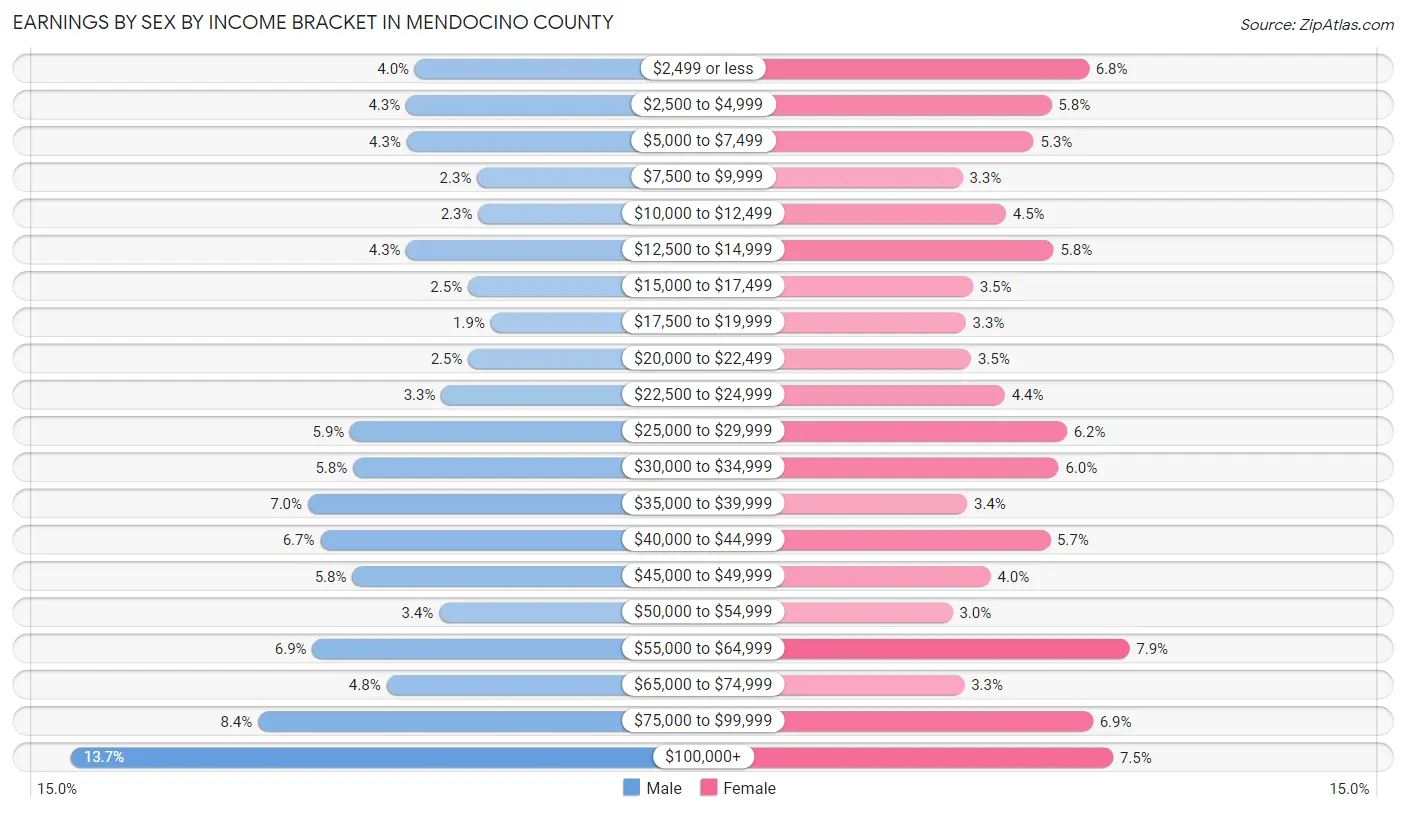
Earnings by Sex by Income Bracket in Mendocino County
The most common earnings brackets in Mendocino County are $100,000+ for men (3,138 | 13.7%) and $55,000 to $64,999 for women (1,645 | 7.9%).
| Income | Male | Female |
| $2,499 or less | 923 (4.0%) | 1,410 (6.8%) |
| $2,500 to $4,999 | 980 (4.3%) | 1,192 (5.8%) |
| $5,000 to $7,499 | 975 (4.3%) | 1,088 (5.2%) |
| $7,500 to $9,999 | 521 (2.3%) | 673 (3.3%) |
| $10,000 to $12,499 | 515 (2.2%) | 927 (4.5%) |
| $12,500 to $14,999 | 979 (4.3%) | 1,204 (5.8%) |
| $15,000 to $17,499 | 582 (2.5%) | 734 (3.5%) |
| $17,500 to $19,999 | 434 (1.9%) | 693 (3.3%) |
| $20,000 to $22,499 | 580 (2.5%) | 723 (3.5%) |
| $22,500 to $24,999 | 753 (3.3%) | 920 (4.4%) |
| $25,000 to $29,999 | 1,340 (5.9%) | 1,282 (6.2%) |
| $30,000 to $34,999 | 1,321 (5.8%) | 1,233 (5.9%) |
| $35,000 to $39,999 | 1,612 (7.0%) | 700 (3.4%) |
| $40,000 to $44,999 | 1,532 (6.7%) | 1,184 (5.7%) |
| $45,000 to $49,999 | 1,325 (5.8%) | 837 (4.0%) |
| $50,000 to $54,999 | 768 (3.4%) | 616 (3.0%) |
| $55,000 to $64,999 | 1,583 (6.9%) | 1,645 (7.9%) |
| $65,000 to $74,999 | 1,107 (4.8%) | 685 (3.3%) |
| $75,000 to $99,999 | 1,933 (8.4%) | 1,433 (6.9%) |
| $100,000+ | 3,138 (13.7%) | 1,551 (7.5%) |
| Total | 22,901 (100.0%) | 20,730 (100.0%) |
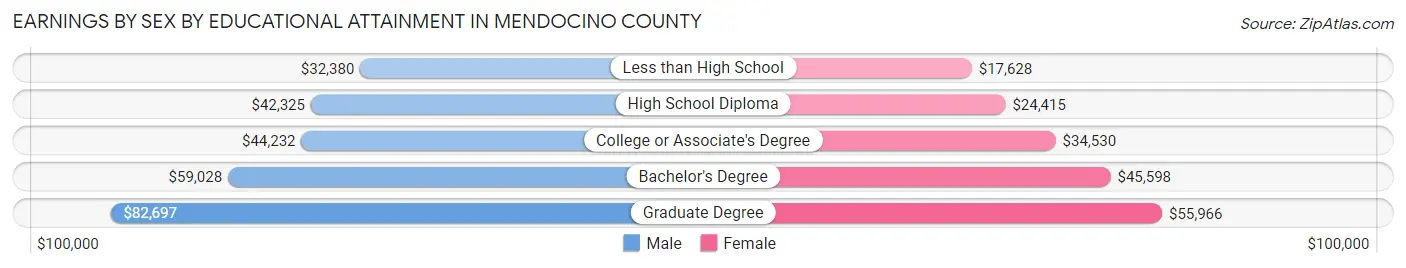
Earnings by Sex by Educational Attainment in Mendocino County
Average earnings in Mendocino County are $43,037 for men and $33,198 for women, a difference of 22.9%. Men with an educational attainment of graduate degree enjoy the highest average annual earnings of $82,697, while those with less than high school education earn the least with $32,380. Women with an educational attainment of graduate degree earn the most with the average annual earnings of $55,966, while those with less than high school education have the smallest earnings of $17,628.
| Educational Attainment | Male Income | Female Income |
| Less than High School | $32,380 | $17,628 |
| High School Diploma | $42,325 | $24,415 |
| College or Associate's Degree | $44,232 | $34,530 |
| Bachelor's Degree | $59,028 | $45,598 |
| Graduate Degree | $82,697 | $55,966 |
| Total | $43,037 | $33,198 |
Family Income in Mendocino County
Family Income Brackets in Mendocino County
According to the Mendocino County family income data, there are 3,903 families falling into the $100,000 to $149,999 income range, which is the most common income bracket and makes up 18.8% of all families. Conversely, the $10,000 to $14,999 income bracket is the least frequent group with only 561 families (2.7%) belonging to this category.
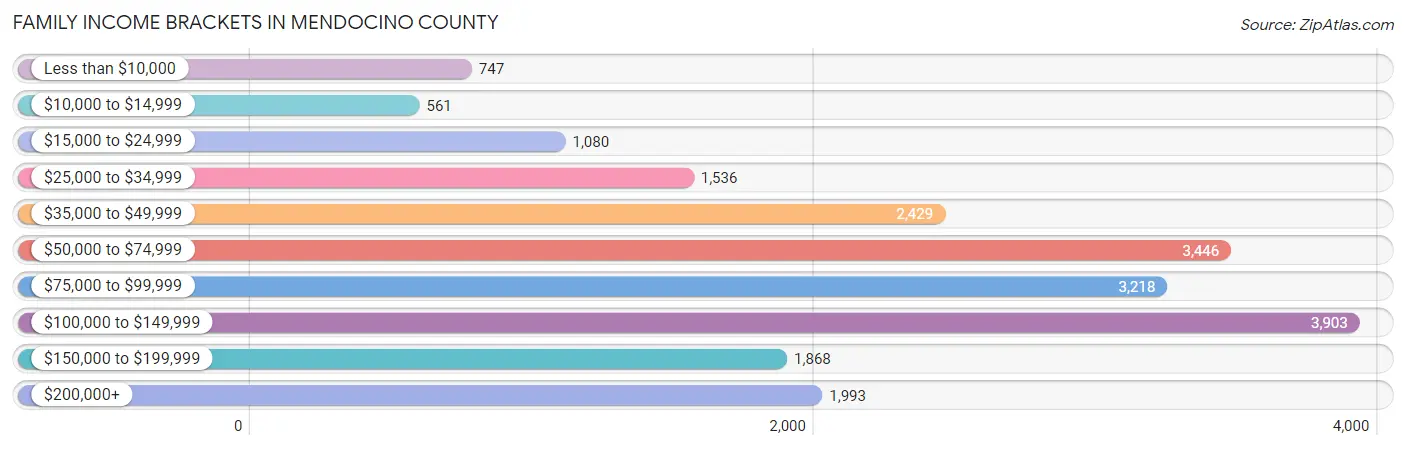
| Income Bracket | # Families | % Families |
| Less than $10,000 | 747 | 3.6% |
| $10,000 to $14,999 | 561 | 2.7% |
| $15,000 to $24,999 | 1,080 | 5.2% |
| $25,000 to $34,999 | 1,536 | 7.4% |
| $35,000 to $49,999 | 2,429 | 11.7% |
| $50,000 to $74,999 | 3,446 | 16.6% |
| $75,000 to $99,999 | 3,218 | 15.5% |
| $100,000 to $149,999 | 3,903 | 18.8% |
| $150,000 to $199,999 | 1,868 | 9.0% |
| $200,000+ | 1,993 | 9.6% |
Family Income by Famaliy Size in Mendocino County
7+ person families (233 | 1.1%) account for the highest median family income in Mendocino County with $96,813 per family, while 2-person families (10,675 | 51.4%) have the highest median income of $36,913 per family member.
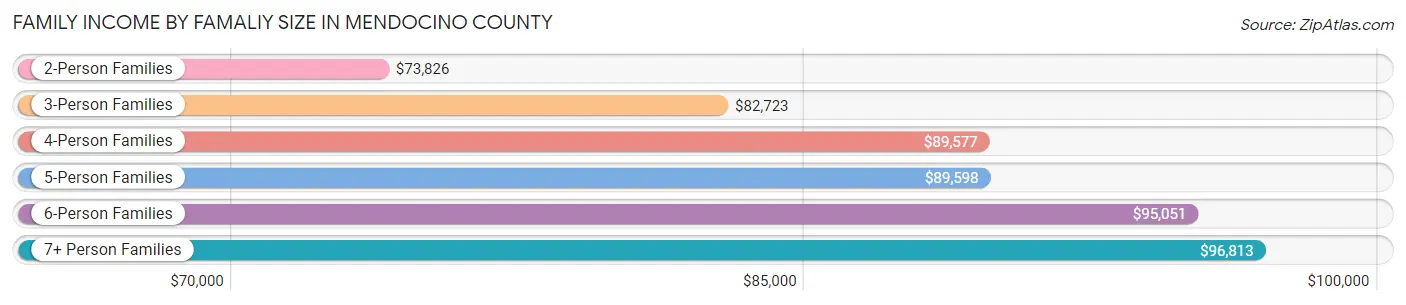
| Income Bracket | # Families | Median Income |
| 2-Person Families | 10,675 (51.4%) | $73,826 |
| 3-Person Families | 4,034 (19.4%) | $82,723 |
| 4-Person Families | 3,727 (17.9%) | $89,577 |
| 5-Person Families | 1,522 (7.3%) | $89,598 |
| 6-Person Families | 570 (2.8%) | $95,051 |
| 7+ Person Families | 233 (1.1%) | $96,813 |
| Total | 20,761 (100.0%) | $79,466 |
Family Income by Number of Earners in Mendocino County
The median family income in Mendocino County is $79,466, with families comprising 3+ earners (2,032) having the highest median family income of $125,972, while families with no earners (4,033) have the lowest median family income of $46,862, accounting for 9.8% and 19.4% of families, respectively.
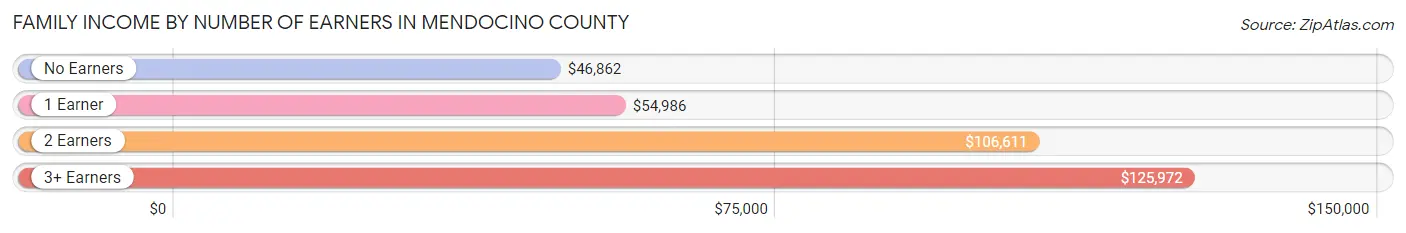
| Number of Earners | # Families | Median Income |
| No Earners | 4,033 (19.4%) | $46,862 |
| 1 Earner | 6,904 (33.3%) | $54,986 |
| 2 Earners | 7,792 (37.5%) | $106,611 |
| 3+ Earners | 2,032 (9.8%) | $125,972 |
| Total | 20,761 (100.0%) | $79,466 |
Household Income in Mendocino County
Household Income Brackets in Mendocino County
With 6,013 households falling in the category, the $50,000 to $74,999 income range is the most frequent in Mendocino County, accounting for 17.4% of all households. In contrast, only 1,762 households (5.1%) fall into the less than $10,000 income bracket, making it the least populous group.
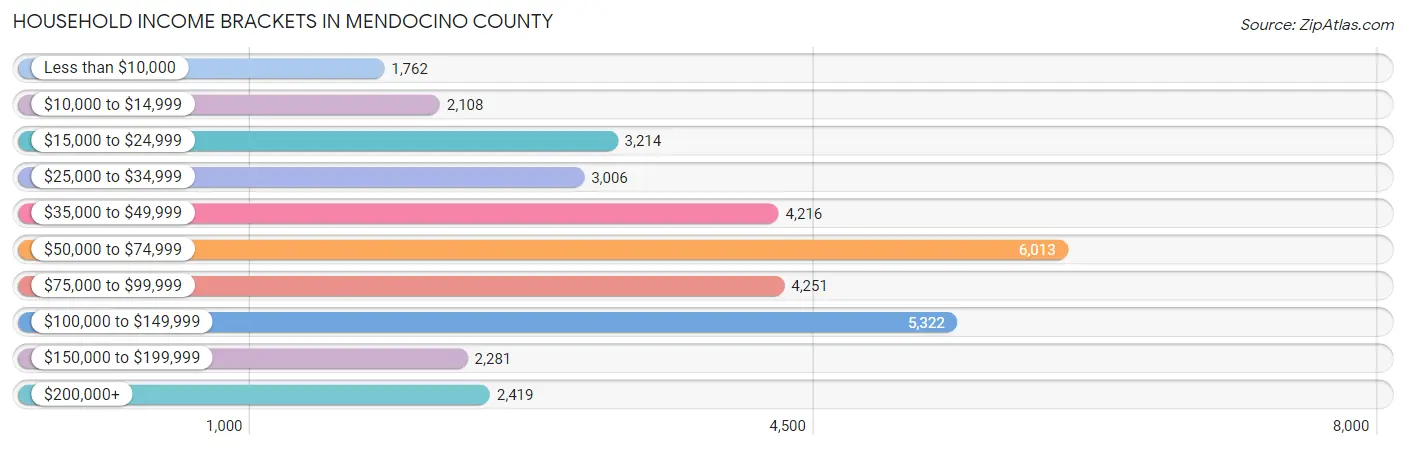
| Income Bracket | # Households | % Households |
| Less than $10,000 | 1,762 | 5.1% |
| $10,000 to $14,999 | 2,108 | 6.1% |
| $15,000 to $24,999 | 3,214 | 9.3% |
| $25,000 to $34,999 | 3,006 | 8.7% |
| $35,000 to $49,999 | 4,216 | 12.2% |
| $50,000 to $74,999 | 6,013 | 17.4% |
| $75,000 to $99,999 | 4,251 | 12.3% |
| $100,000 to $149,999 | 5,322 | 15.4% |
| $150,000 to $199,999 | 2,281 | 6.6% |
| $200,000+ | 2,419 | 7.0% |
Household Income by Householder Age in Mendocino County
The median household income in Mendocino County is $61,335, with the highest median household income of $67,000 found in the 45 to 64 years age bracket for the primary householder. A total of 12,372 households (35.8%) fall into this category. Meanwhile, the 15 to 24 years age bracket for the primary householder has the lowest median household income of $39,097, with 591 households (1.7%) in this group.
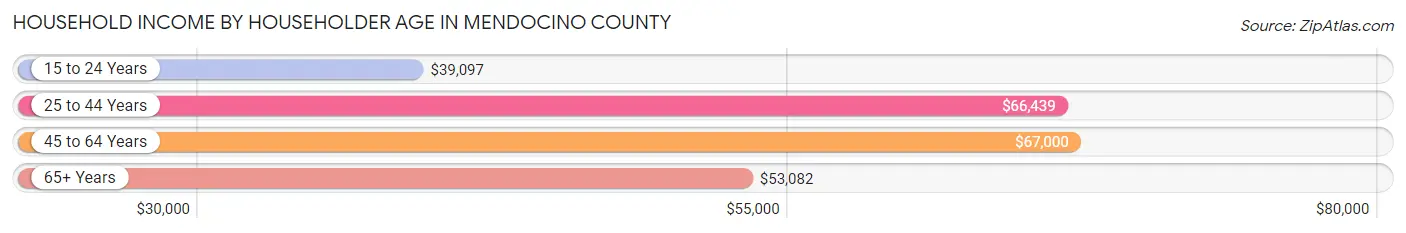
| Income Bracket | # Households | Median Income |
| 15 to 24 Years | 591 (1.7%) | $39,097 |
| 25 to 44 Years | 8,426 (24.4%) | $66,439 |
| 45 to 64 Years | 12,372 (35.8%) | $67,000 |
| 65+ Years | 13,168 (38.1%) | $53,082 |
| Total | 34,557 (100.0%) | $61,335 |
Poverty in Mendocino County
Income Below Poverty by Sex and Age in Mendocino County
With 15.7% poverty level for males and 16.6% for females among the residents of Mendocino County, 16 and 17 year old males and 5 year old females are the most vulnerable to poverty, with 307 males (25.4%) and 165 females (41.6%) in their respective age groups living below the poverty level.
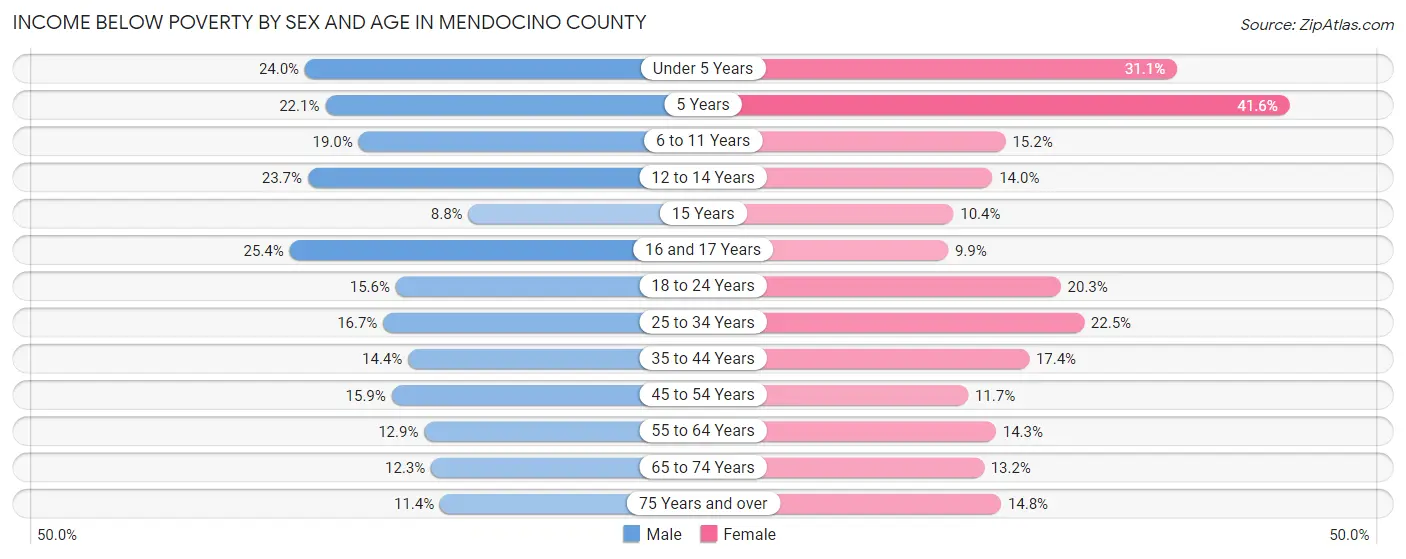
| Age Bracket | Male | Female |
| Under 5 Years | 559 (24.0%) | 780 (31.1%) |
| 5 Years | 118 (22.1%) | 165 (41.6%) |
| 6 to 11 Years | 606 (19.0%) | 544 (15.2%) |
| 12 to 14 Years | 409 (23.7%) | 203 (14.0%) |
| 15 Years | 34 (8.8%) | 50 (10.3%) |
| 16 and 17 Years | 307 (25.4%) | 109 (9.9%) |
| 18 to 24 Years | 506 (15.5%) | 610 (20.3%) |
| 25 to 34 Years | 828 (16.7%) | 1,080 (22.5%) |
| 35 to 44 Years | 791 (14.4%) | 919 (17.4%) |
| 45 to 54 Years | 832 (15.9%) | 609 (11.7%) |
| 55 to 64 Years | 787 (12.9%) | 935 (14.3%) |
| 65 to 74 Years | 791 (12.3%) | 915 (13.2%) |
| 75 Years and over | 385 (11.4%) | 611 (14.8%) |
| Total | 6,953 (15.7%) | 7,530 (16.6%) |
Income Above Poverty by Sex and Age in Mendocino County
According to the poverty statistics in Mendocino County, males aged 15 years and females aged 16 and 17 years are the age groups that are most secure financially, with 91.2% of males and 90.1% of females in these age groups living above the poverty line.
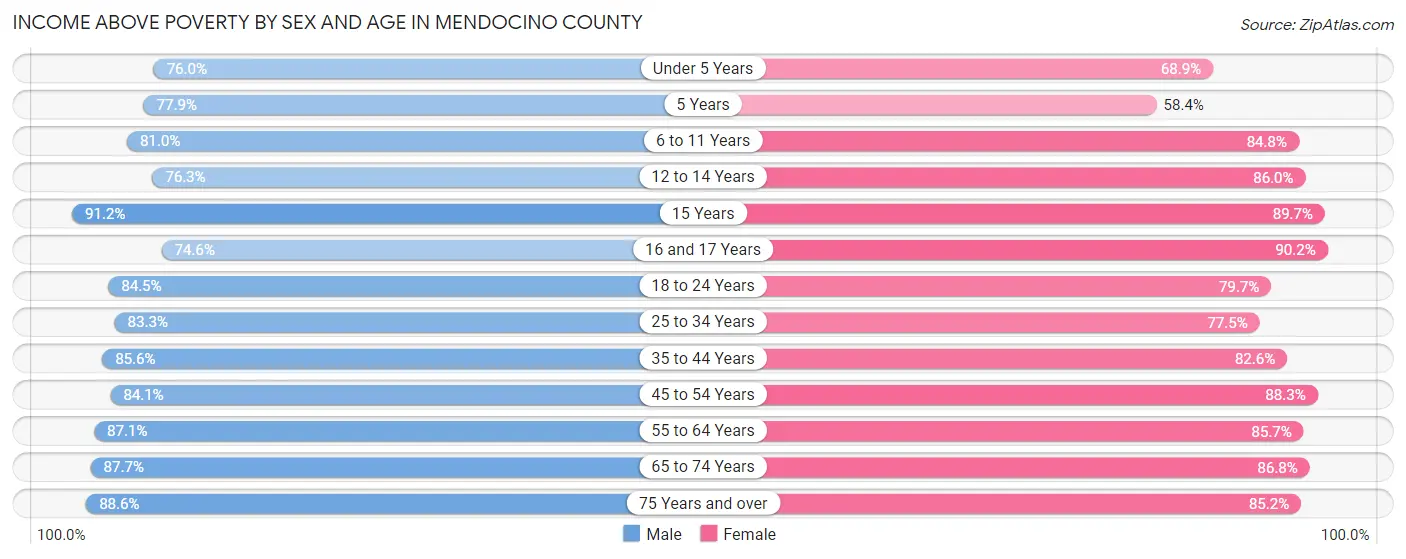
| Age Bracket | Male | Female |
| Under 5 Years | 1,772 (76.0%) | 1,727 (68.9%) |
| 5 Years | 416 (77.9%) | 232 (58.4%) |
| 6 to 11 Years | 2,581 (81.0%) | 3,037 (84.8%) |
| 12 to 14 Years | 1,315 (76.3%) | 1,251 (86.0%) |
| 15 Years | 352 (91.2%) | 433 (89.6%) |
| 16 and 17 Years | 901 (74.6%) | 998 (90.1%) |
| 18 to 24 Years | 2,749 (84.5%) | 2,394 (79.7%) |
| 25 to 34 Years | 4,123 (83.3%) | 3,727 (77.5%) |
| 35 to 44 Years | 4,697 (85.6%) | 4,372 (82.6%) |
| 45 to 54 Years | 4,387 (84.1%) | 4,590 (88.3%) |
| 55 to 64 Years | 5,308 (87.1%) | 5,606 (85.7%) |
| 65 to 74 Years | 5,655 (87.7%) | 6,035 (86.8%) |
| 75 Years and over | 2,981 (88.6%) | 3,527 (85.2%) |
| Total | 37,237 (84.3%) | 37,929 (83.4%) |
Income Below Poverty Among Married-Couple Families in Mendocino County
The poverty statistics for married-couple families in Mendocino County show that 6.2% or 903 of the total 14,576 families live below the poverty line. Families with 5 or more children have the highest poverty rate of 22.5%, comprising of 20 families. On the other hand, families with no children have the lowest poverty rate of 4.6%, which includes 427 families.
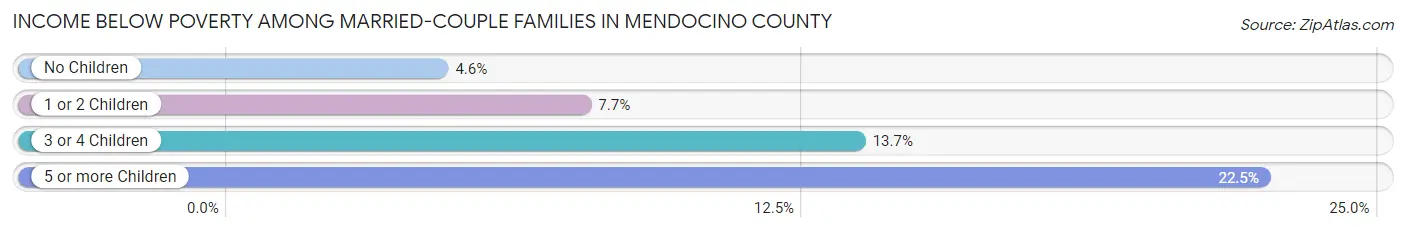
| Children | Above Poverty | Below Poverty |
| No Children | 8,886 (95.4%) | 427 (4.6%) |
| 1 or 2 Children | 3,877 (92.3%) | 323 (7.7%) |
| 3 or 4 Children | 841 (86.3%) | 133 (13.7%) |
| 5 or more Children | 69 (77.5%) | 20 (22.5%) |
| Total | 13,673 (93.8%) | 903 (6.2%) |
Income Below Poverty Among Single-Parent Households in Mendocino County
According to the poverty data in Mendocino County, 22.2% or 391 single-father households and 24.8% or 1,096 single-mother households are living below the poverty line. Among single-father households, those with 5 or more children have the highest poverty rate, with 5 households (100.0%) experiencing poverty. Likewise, among single-mother households, those with 5 or more children have the highest poverty rate, with 9 households (100.0%) falling below the poverty line.
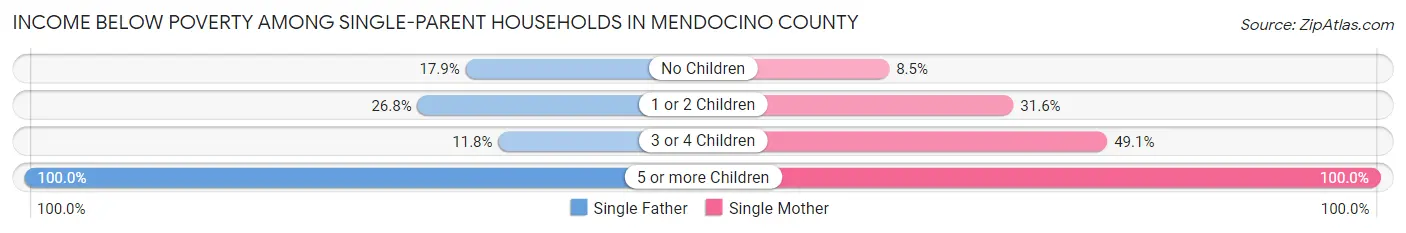
| Children | Single Father | Single Mother |
| No Children | 130 (17.9%) | 152 (8.5%) |
| 1 or 2 Children | 240 (26.8%) | 638 (31.6%) |
| 3 or 4 Children | 16 (11.8%) | 297 (49.1%) |
| 5 or more Children | 5 (100.0%) | 9 (100.0%) |
| Total | 391 (22.2%) | 1,096 (24.8%) |
Income Below Poverty Among Married-Couple vs Single-Parent Households in Mendocino County
The poverty data for Mendocino County shows that 903 of the married-couple family households (6.2%) and 1,487 of the single-parent households (24.0%) are living below the poverty level. Within the married-couple family households, those with 5 or more children have the highest poverty rate, with 20 households (22.5%) falling below the poverty line. Among the single-parent households, those with 5 or more children have the highest poverty rate, with 14 household (100.0%) living below poverty.
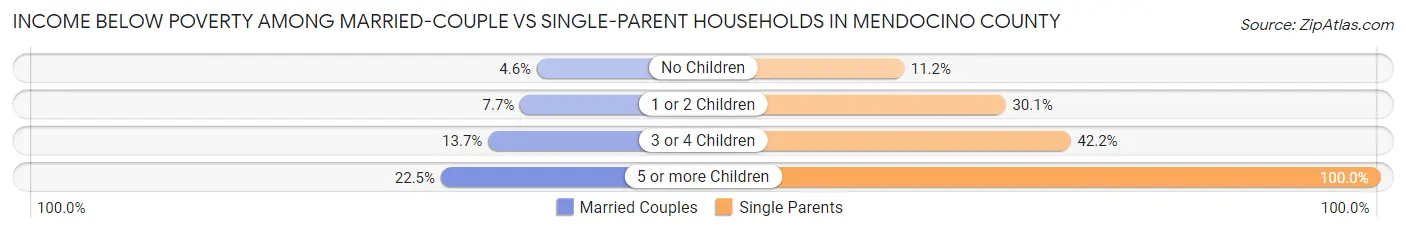
| Children | Married-Couple Families | Single-Parent Households |
| No Children | 427 (4.6%) | 282 (11.2%) |
| 1 or 2 Children | 323 (7.7%) | 878 (30.1%) |
| 3 or 4 Children | 133 (13.7%) | 313 (42.2%) |
| 5 or more Children | 20 (22.5%) | 14 (100.0%) |
| Total | 903 (6.2%) | 1,487 (24.0%) |
Race in Mendocino County
The most populous races in Mendocino County are White / Caucasian (67,114 | 73.6%), Hispanic or Latino (24,414 | 26.8%), and Two or more Races (11,226 | 12.3%).
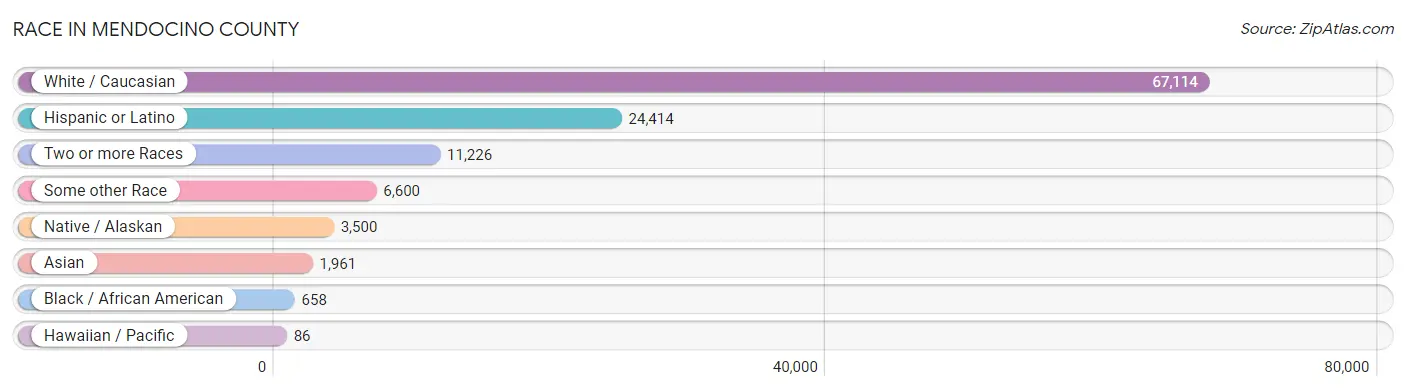
| Race | # Population | % Population |
| Asian | 1,961 | 2.1% |
| Black / African American | 658 | 0.7% |
| Hawaiian / Pacific | 86 | 0.1% |
| Hispanic or Latino | 24,414 | 26.8% |
| Native / Alaskan | 3,500 | 3.8% |
| White / Caucasian | 67,114 | 73.6% |
| Two or more Races | 11,226 | 12.3% |
| Some other Race | 6,600 | 7.2% |
| Total | 91,145 | 100.0% |
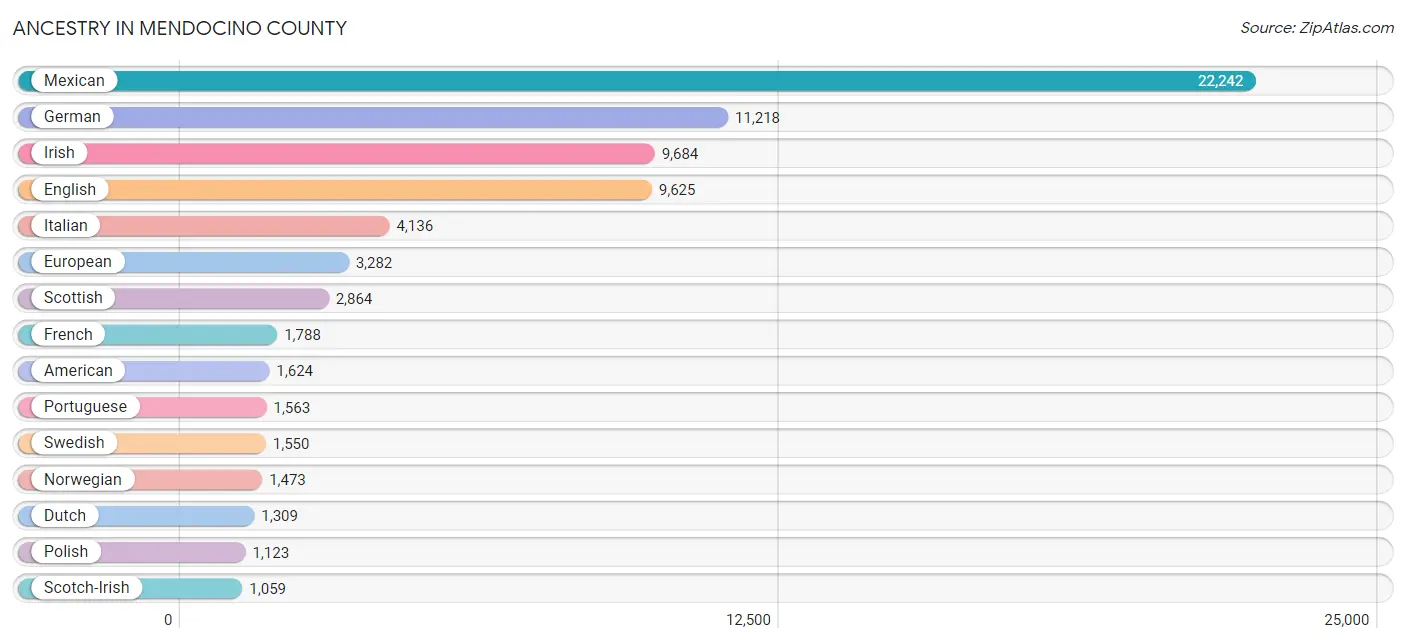
Ancestry in Mendocino County
The most populous ancestries reported in Mendocino County are Mexican (22,242 | 24.4%), German (11,218 | 12.3%), Irish (9,684 | 10.6%), English (9,625 | 10.6%), and Italian (4,136 | 4.5%), together accounting for 62.4% of all Mendocino County residents.
| Ancestry | # Population | % Population |
| African | 89 | 0.1% |
| American | 1,624 | 1.8% |
| Apache | 200 | 0.2% |
| Arab | 364 | 0.4% |
| Armenian | 81 | 0.1% |
| Australian | 18 | 0.0% |
| Austrian | 121 | 0.1% |
| Bangladeshi | 3 | 0.0% |
| Basque | 8 | 0.0% |
| Belgian | 12 | 0.0% |
| Bhutanese | 183 | 0.2% |
| Blackfeet | 9 | 0.0% |
| Brazilian | 70 | 0.1% |
| British | 415 | 0.5% |
| Burmese | 330 | 0.4% |
| Cambodian | 50 | 0.1% |
| Canadian | 198 | 0.2% |
| Celtic | 11 | 0.0% |
| Central American | 304 | 0.3% |
| Central American Indian | 215 | 0.2% |
| Cherokee | 312 | 0.3% |
| Chickasaw | 20 | 0.0% |
| Chilean | 115 | 0.1% |
| Chippewa | 15 | 0.0% |
| Choctaw | 139 | 0.2% |
| Colombian | 25 | 0.0% |
| Costa Rican | 10 | 0.0% |
| Creek | 19 | 0.0% |
| Croatian | 74 | 0.1% |
| Cuban | 23 | 0.0% |
| Czech | 295 | 0.3% |
| Czechoslovakian | 66 | 0.1% |
| Danish | 827 | 0.9% |
| Delaware | 37 | 0.0% |
| Dutch | 1,309 | 1.4% |
| Eastern European | 470 | 0.5% |
| Ecuadorian | 10 | 0.0% |
| English | 9,625 | 10.6% |
| Estonian | 7 | 0.0% |
| Ethiopian | 8 | 0.0% |
| European | 3,282 | 3.6% |
| Filipino | 22 | 0.0% |
| Finnish | 980 | 1.1% |
| French | 1,788 | 2.0% |
| French American Indian | 6 | 0.0% |
| French Canadian | 121 | 0.1% |
| German | 11,218 | 12.3% |
| German Russian | 35 | 0.0% |
| Greek | 146 | 0.2% |
| Guatemalan | 17 | 0.0% |
| Honduran | 20 | 0.0% |
| Hungarian | 116 | 0.1% |
| Icelander | 85 | 0.1% |
| Indian (Asian) | 943 | 1.0% |
| Iranian | 21 | 0.0% |
| Iraqi | 5 | 0.0% |
| Irish | 9,684 | 10.6% |
| Iroquois | 57 | 0.1% |
| Israeli | 48 | 0.1% |
| Italian | 4,136 | 4.5% |
| Jamaican | 2 | 0.0% |
| Korean | 640 | 0.7% |
| Laotian | 72 | 0.1% |
| Latvian | 39 | 0.0% |
| Lebanese | 97 | 0.1% |
| Lithuanian | 92 | 0.1% |
| Lumbee | 14 | 0.0% |
| Malaysian | 43 | 0.1% |
| Maltese | 99 | 0.1% |
| Mexican | 22,242 | 24.4% |
| Mexican American Indian | 429 | 0.5% |
| Mongolian | 46 | 0.1% |
| Native Hawaiian | 101 | 0.1% |
| Navajo | 20 | 0.0% |
| Nicaraguan | 132 | 0.1% |
| Northern European | 587 | 0.6% |
| Norwegian | 1,473 | 1.6% |
| Osage | 8 | 0.0% |
| Paiute | 24 | 0.0% |
| Pakistani | 95 | 0.1% |
| Palestinian | 202 | 0.2% |
| Pennsylvania German | 64 | 0.1% |
| Peruvian | 33 | 0.0% |
| Polish | 1,123 | 1.2% |
| Portuguese | 1,563 | 1.7% |
| Pueblo | 87 | 0.1% |
| Puerto Rican | 259 | 0.3% |
| Romanian | 161 | 0.2% |
| Russian | 796 | 0.9% |
| Salvadoran | 125 | 0.1% |
| Samoan | 18 | 0.0% |
| Scandinavian | 417 | 0.5% |
| Scotch-Irish | 1,059 | 1.2% |
| Scottish | 2,864 | 3.1% |
| Seminole | 8 | 0.0% |
| Sioux | 29 | 0.0% |
| Slavic | 78 | 0.1% |
| Slovak | 47 | 0.1% |
| South American | 246 | 0.3% |
| Spaniard | 649 | 0.7% |
| Spanish | 249 | 0.3% |
| Sri Lankan | 183 | 0.2% |
| Subsaharan African | 129 | 0.1% |
| Swedish | 1,550 | 1.7% |
| Swiss | 371 | 0.4% |
| Syrian | 22 | 0.0% |
| Thai | 45 | 0.1% |
| Ugandan | 6 | 0.0% |
| Ukrainian | 238 | 0.3% |
| Venezuelan | 34 | 0.0% |
| Welsh | 693 | 0.8% |
| Yaqui | 51 | 0.1% |
| Yugoslavian | 49 | 0.1% | View All 113 Rows |
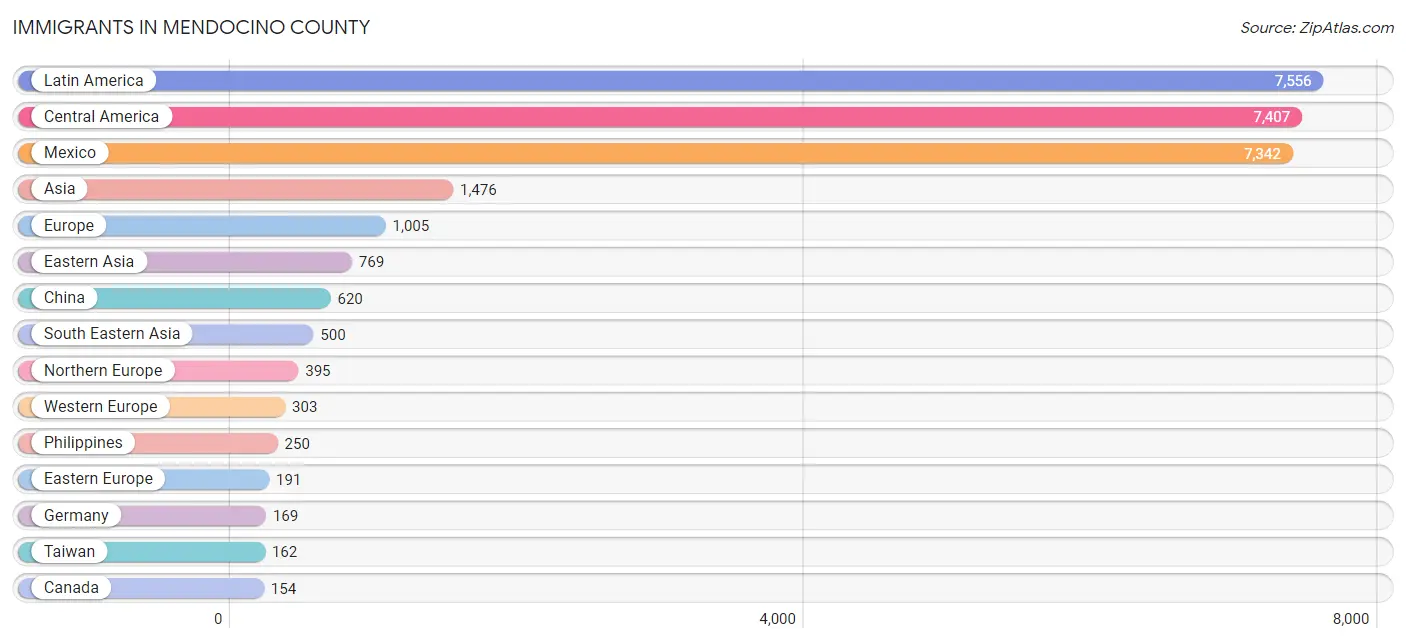
Immigrants in Mendocino County
The most numerous immigrant groups reported in Mendocino County came from Latin America (7,556 | 8.3%), Central America (7,407 | 8.1%), Mexico (7,342 | 8.1%), Asia (1,476 | 1.6%), and Europe (1,005 | 1.1%), together accounting for 27.2% of all Mendocino County residents.
| Immigration Origin | # Population | % Population |
| Africa | 23 | 0.0% |
| Asia | 1,476 | 1.6% |
| Australia | 10 | 0.0% |
| Austria | 37 | 0.0% |
| Azores | 55 | 0.1% |
| Bangladesh | 7 | 0.0% |
| Brazil | 98 | 0.1% |
| Canada | 154 | 0.2% |
| Caribbean | 7 | 0.0% |
| Central America | 7,407 | 8.1% |
| Chile | 14 | 0.0% |
| China | 620 | 0.7% |
| Colombia | 18 | 0.0% |
| Cuba | 7 | 0.0% |
| Denmark | 12 | 0.0% |
| Eastern Asia | 769 | 0.8% |
| Eastern Europe | 191 | 0.2% |
| El Salvador | 15 | 0.0% |
| England | 122 | 0.1% |
| Europe | 1,005 | 1.1% |
| Fiji | 15 | 0.0% |
| France | 79 | 0.1% |
| Germany | 169 | 0.2% |
| Guatemala | 18 | 0.0% |
| Honduras | 20 | 0.0% |
| Hong Kong | 44 | 0.1% |
| Hungary | 24 | 0.0% |
| India | 38 | 0.0% |
| Indonesia | 12 | 0.0% |
| Iran | 13 | 0.0% |
| Iraq | 4 | 0.0% |
| Ireland | 12 | 0.0% |
| Italy | 10 | 0.0% |
| Japan | 25 | 0.0% |
| Jordan | 15 | 0.0% |
| Korea | 114 | 0.1% |
| Laos | 3 | 0.0% |
| Latin America | 7,556 | 8.3% |
| Malaysia | 46 | 0.1% |
| Mexico | 7,342 | 8.1% |
| Micronesia | 13 | 0.0% |
| Morocco | 5 | 0.0% |
| Nepal | 19 | 0.0% |
| Netherlands | 12 | 0.0% |
| Nicaragua | 12 | 0.0% |
| Northern Africa | 5 | 0.0% |
| Northern Europe | 395 | 0.4% |
| Oceania | 38 | 0.0% |
| Pakistan | 73 | 0.1% |
| Philippines | 250 | 0.3% |
| Poland | 18 | 0.0% |
| Portugal | 100 | 0.1% |
| Romania | 86 | 0.1% |
| Scotland | 96 | 0.1% |
| South Africa | 10 | 0.0% |
| South America | 142 | 0.2% |
| South Central Asia | 150 | 0.2% |
| South Eastern Asia | 500 | 0.5% |
| Southern Europe | 110 | 0.1% |
| Sweden | 16 | 0.0% |
| Switzerland | 6 | 0.0% |
| Taiwan | 162 | 0.2% |
| Thailand | 68 | 0.1% |
| Ukraine | 63 | 0.1% |
| Venezuela | 12 | 0.0% |
| Vietnam | 109 | 0.1% |
| Western Asia | 19 | 0.0% |
| Western Europe | 303 | 0.3% | View All 68 Rows |
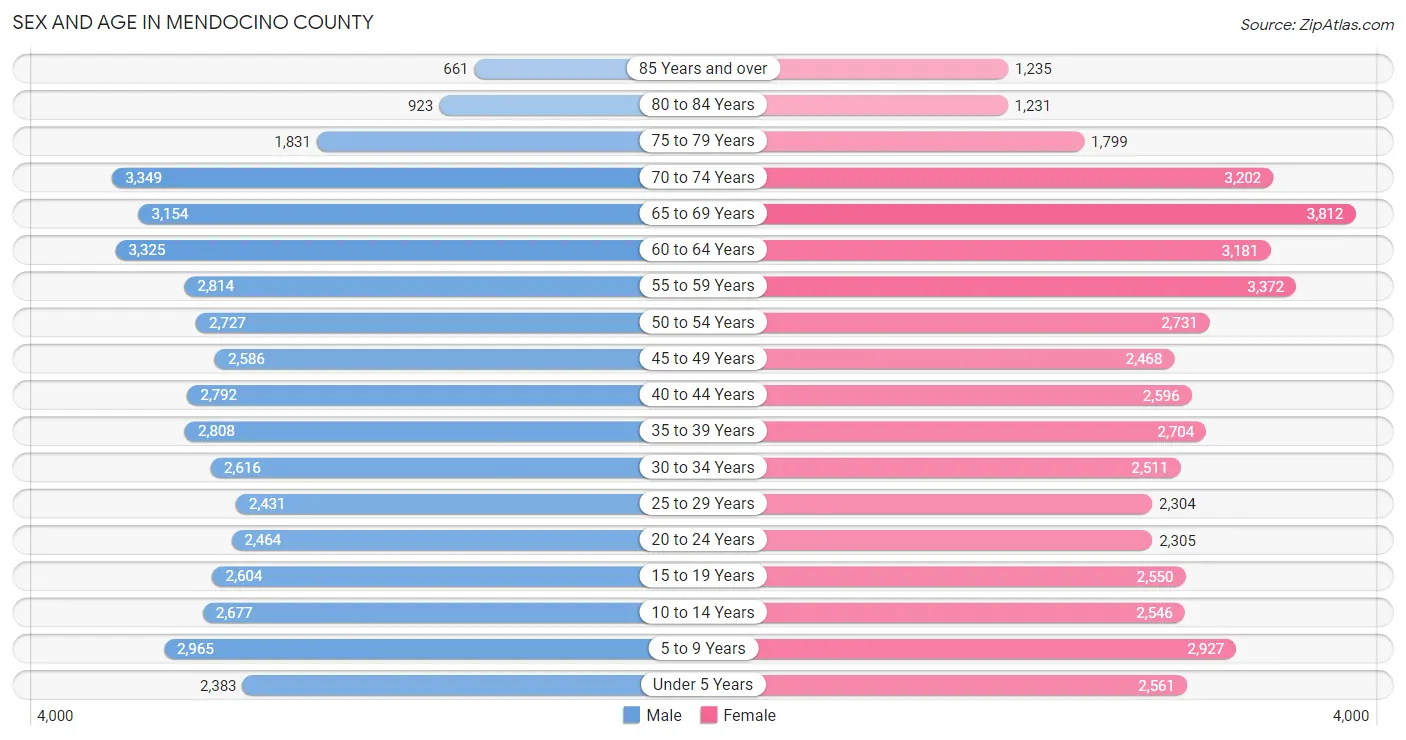
Sex and Age in Mendocino County
Sex and Age in Mendocino County
The most populous age groups in Mendocino County are 70 to 74 Years (3,349 | 7.4%) for men and 65 to 69 Years (3,812 | 8.3%) for women.
| Age Bracket | Male | Female |
| Under 5 Years | 2,383 (5.3%) | 2,561 (5.6%) |
| 5 to 9 Years | 2,965 (6.6%) | 2,927 (6.4%) |
| 10 to 14 Years | 2,677 (5.9%) | 2,546 (5.5%) |
| 15 to 19 Years | 2,604 (5.8%) | 2,550 (5.5%) |
| 20 to 24 Years | 2,464 (5.5%) | 2,305 (5.0%) |
| 25 to 29 Years | 2,431 (5.4%) | 2,304 (5.0%) |
| 30 to 34 Years | 2,616 (5.8%) | 2,511 (5.4%) |
| 35 to 39 Years | 2,808 (6.2%) | 2,704 (5.9%) |
| 40 to 44 Years | 2,792 (6.2%) | 2,596 (5.6%) |
| 45 to 49 Years | 2,586 (5.7%) | 2,468 (5.4%) |
| 50 to 54 Years | 2,727 (6.0%) | 2,731 (5.9%) |
| 55 to 59 Years | 2,814 (6.2%) | 3,372 (7.3%) |
| 60 to 64 Years | 3,325 (7.4%) | 3,181 (6.9%) |
| 65 to 69 Years | 3,154 (7.0%) | 3,812 (8.3%) |
| 70 to 74 Years | 3,349 (7.4%) | 3,202 (7.0%) |
| 75 to 79 Years | 1,831 (4.1%) | 1,799 (3.9%) |
| 80 to 84 Years | 923 (2.1%) | 1,231 (2.7%) |
| 85 Years and over | 661 (1.5%) | 1,235 (2.7%) |
| Total | 45,110 (100.0%) | 46,035 (100.0%) |
Families and Households in Mendocino County
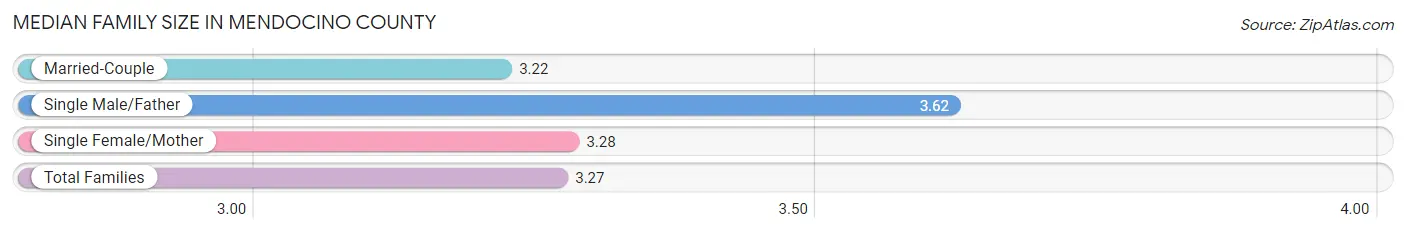
Median Family Size in Mendocino County
The median family size in Mendocino County is 3.27 persons per family, with single male/father families (1,763 | 8.5%) accounting for the largest median family size of 3.62 persons per family. On the other hand, married-couple families (14,576 | 70.2%) represent the smallest median family size with 3.22 persons per family.
| Family Type | # Families | Family Size |
| Married-Couple | 14,576 (70.2%) | 3.22 |
| Single Male/Father | 1,763 (8.5%) | 3.62 |
| Single Female/Mother | 4,422 (21.3%) | 3.28 |
| Total Families | 20,761 (100.0%) | 3.27 |
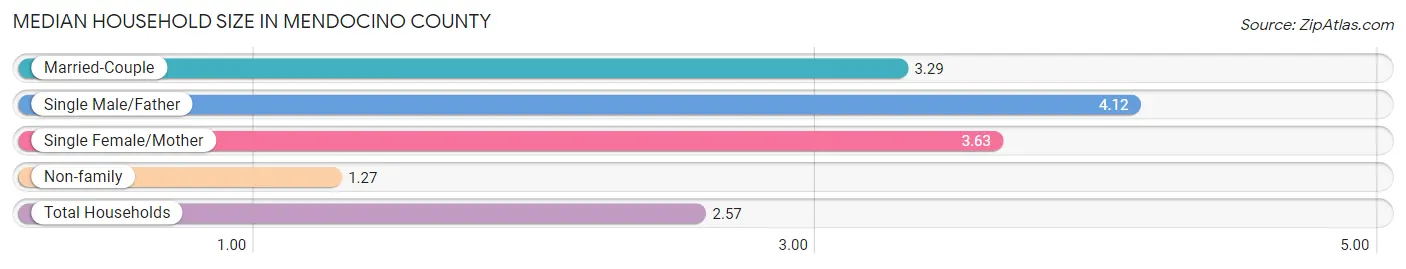
Median Household Size in Mendocino County
The median household size in Mendocino County is 2.57 persons per household, with single male/father households (1,763 | 5.1%) accounting for the largest median household size of 4.12 persons per household. non-family households (13,796 | 39.9%) represent the smallest median household size with 1.27 persons per household.
| Household Type | # Households | Household Size |
| Married-Couple | 14,576 (42.2%) | 3.29 |
| Single Male/Father | 1,763 (5.1%) | 4.12 |
| Single Female/Mother | 4,422 (12.8%) | 3.63 |
| Non-family | 13,796 (39.9%) | 1.27 |
| Total Households | 34,557 (100.0%) | 2.57 |
Household Size by Marriage Status in Mendocino County
Out of a total of 34,557 households in Mendocino County, 20,761 (60.1%) are family households, while 13,796 (39.9%) are nonfamily households. The most numerous type of family households are 2-person households, comprising 9,543, and the most common type of nonfamily households are 1-person households, comprising 11,251.
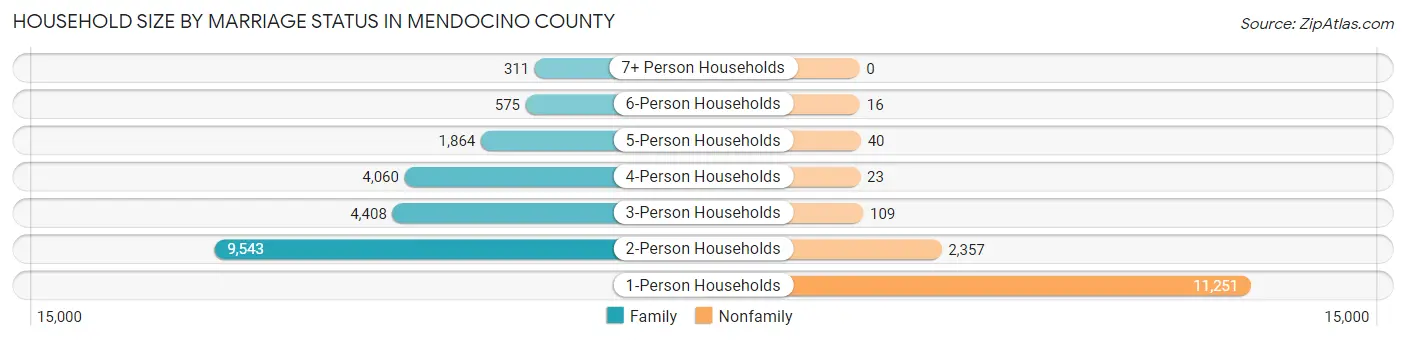
| Household Size | Family Households | Nonfamily Households |
| 1-Person Households | - | 11,251 (32.6%) |
| 2-Person Households | 9,543 (27.6%) | 2,357 (6.8%) |
| 3-Person Households | 4,408 (12.8%) | 109 (0.3%) |
| 4-Person Households | 4,060 (11.7%) | 23 (0.1%) |
| 5-Person Households | 1,864 (5.4%) | 40 (0.1%) |
| 6-Person Households | 575 (1.7%) | 16 (0.1%) |
| 7+ Person Households | 311 (0.9%) | 0 (0.0%) |
| Total | 20,761 (60.1%) | 13,796 (39.9%) |
Female Fertility in Mendocino County
Fertility by Age in Mendocino County
Average fertility rate in Mendocino County is 46.0 births per 1,000 women. Women in the age bracket of 20 to 34 years have the highest fertility rate with 82.0 births per 1,000 women. Women in the age bracket of 20 to 34 years acount for 68.9% of all women with births.
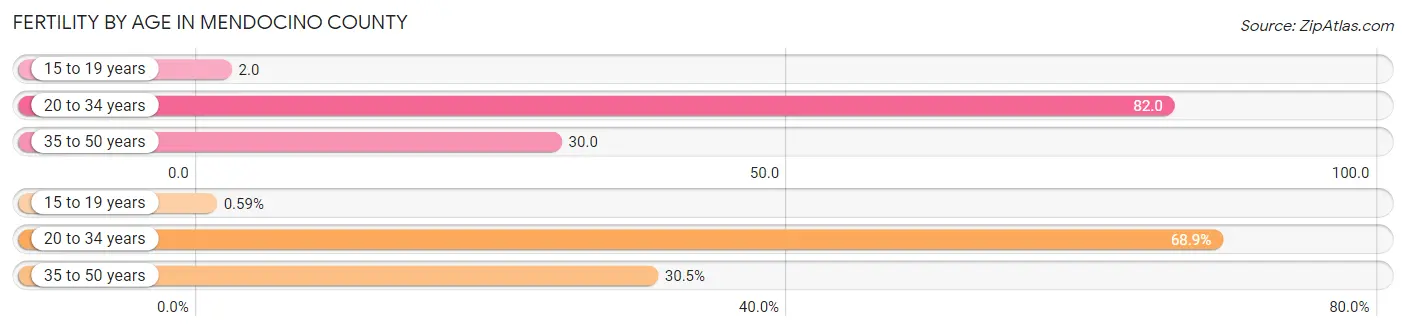
| Age Bracket | Women with Births | Births / 1,000 Women |
| 15 to 19 years | 5 (0.6%) | 2.0 |
| 20 to 34 years | 582 (68.9%) | 82.0 |
| 35 to 50 years | 258 (30.5%) | 30.0 |
| Total | 845 (100.0%) | 46.0 |
Fertility by Age by Marriage Status in Mendocino County
75.9% of women with births (845) in Mendocino County are married. The highest percentage of unmarried women with births falls into 15 to 19 years age bracket with 100.0% of them unmarried at the time of birth, while the lowest percentage of unmarried women with births belong to 35 to 50 years age bracket with 17.4% of them unmarried.
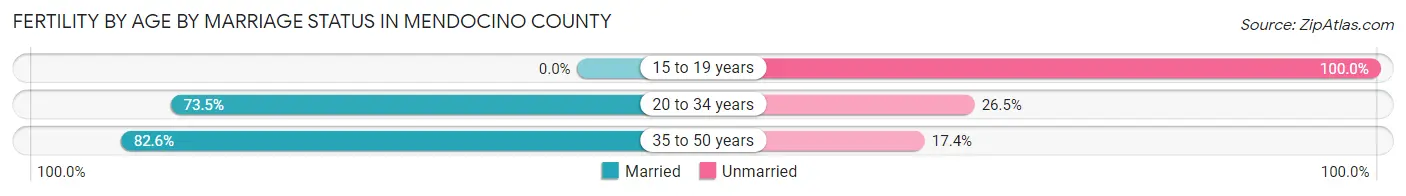
| Age Bracket | Married | Unmarried |
| 15 to 19 years | 0 (0.0%) | 5 (100.0%) |
| 20 to 34 years | 428 (73.5%) | 154 (26.5%) |
| 35 to 50 years | 213 (82.6%) | 45 (17.4%) |
| Total | 641 (75.9%) | 204 (24.1%) |
Fertility by Education in Mendocino County
Average fertility rate in Mendocino County is 46.0 births per 1,000 women. Women with the education attainment of high school diploma have the highest fertility rate of 52.0 births per 1,000 women, while women with the education attainment of bachelor's degree have the lowest fertility at 17.0 births per 1,000 women. Women with the education attainment of college or associate's degree represent 43.1% of all women with births.
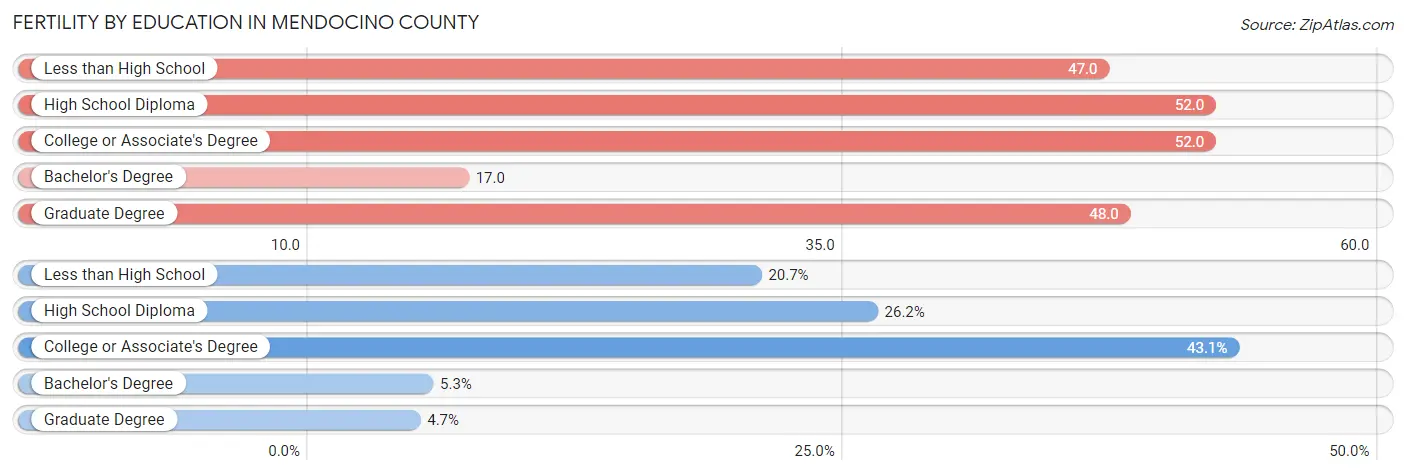
| Educational Attainment | Women with Births | Births / 1,000 Women |
| Less than High School | 175 (20.7%) | 47.0 |
| High School Diploma | 221 (26.2%) | 52.0 |
| College or Associate's Degree | 364 (43.1%) | 52.0 |
| Bachelor's Degree | 45 (5.3%) | 17.0 |
| Graduate Degree | 40 (4.7%) | 48.0 |
| Total | 845 (100.0%) | 46.0 |
Fertility by Education by Marriage Status in Mendocino County
24.1% of women with births in Mendocino County are unmarried. Women with the educational attainment of graduate degree are most likely to be married with 100.0% of them married at childbirth, while women with the educational attainment of high school diploma are least likely to be married with 50.7% of them unmarried at childbirth.
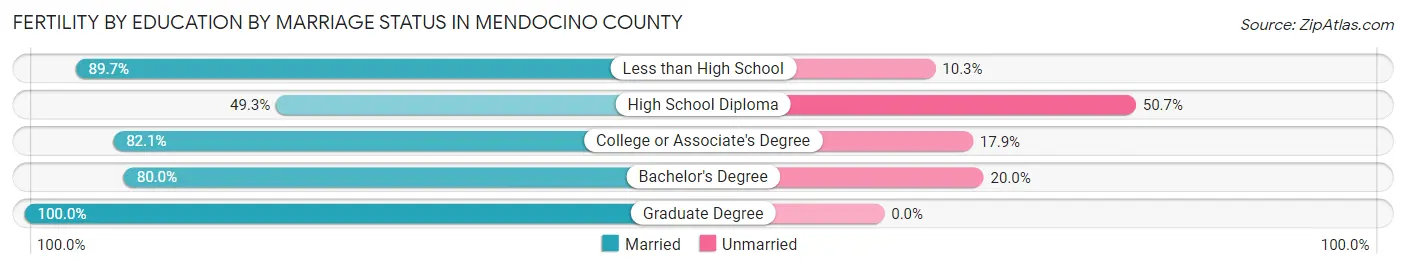
| Educational Attainment | Married | Unmarried |
| Less than High School | 157 (89.7%) | 18 (10.3%) |
| High School Diploma | 109 (49.3%) | 112 (50.7%) |
| College or Associate's Degree | 299 (82.1%) | 65 (17.9%) |
| Bachelor's Degree | 36 (80.0%) | 9 (20.0%) |
| Graduate Degree | 40 (100.0%) | 0 (0.0%) |
| Total | 641 (75.9%) | 204 (24.1%) |
Employment Characteristics in Mendocino County
Employment by Class of Employer in Mendocino County
Among the 36,841 employed individuals in Mendocino County, private company employees (20,602 | 55.9%), self-employed (not incorporated) (5,120 | 13.9%), and not-for-profit organizations (3,803 | 10.3%) make up the most common classes of employment.
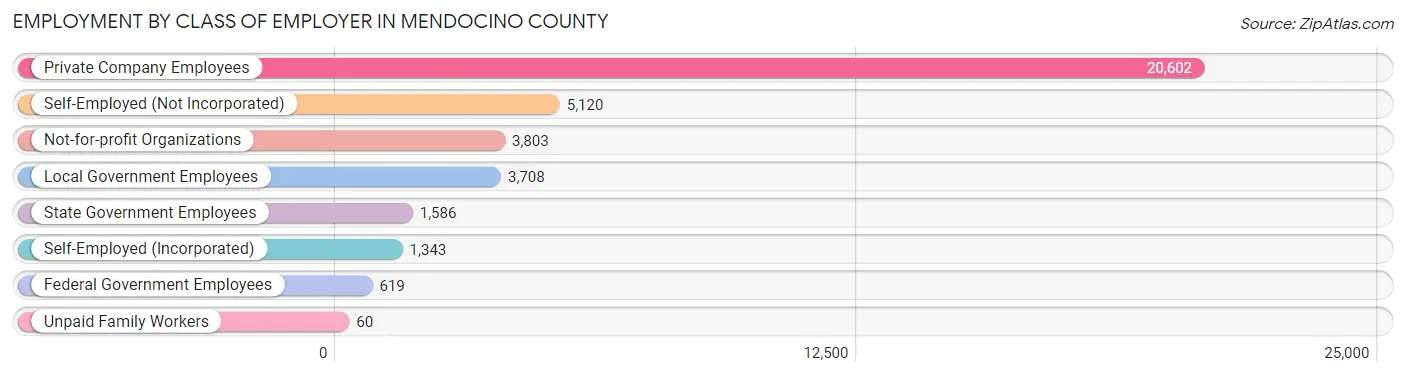
| Employer Class | # Employees | % Employees |
| Private Company Employees | 20,602 | 55.9% |
| Self-Employed (Incorporated) | 1,343 | 3.6% |
| Self-Employed (Not Incorporated) | 5,120 | 13.9% |
| Not-for-profit Organizations | 3,803 | 10.3% |
| Local Government Employees | 3,708 | 10.1% |
| State Government Employees | 1,586 | 4.3% |
| Federal Government Employees | 619 | 1.7% |
| Unpaid Family Workers | 60 | 0.2% |
| Total | 36,841 | 100.0% |
Employment Status by Age in Mendocino County
According to the labor force statistics for Mendocino County, out of the total population over 16 years of age (74,216), 56.5% or 41,932 individuals are in the labor force, with 9.1% or 3,816 of them unemployed. The age group with the highest labor force participation rate is 20 to 24 years, with 80.1% or 3,820 individuals in the labor force. Within the labor force, the 16 to 19 years age range has the highest percentage of unemployed individuals, with 18.6% or 351 of them being unemployed.
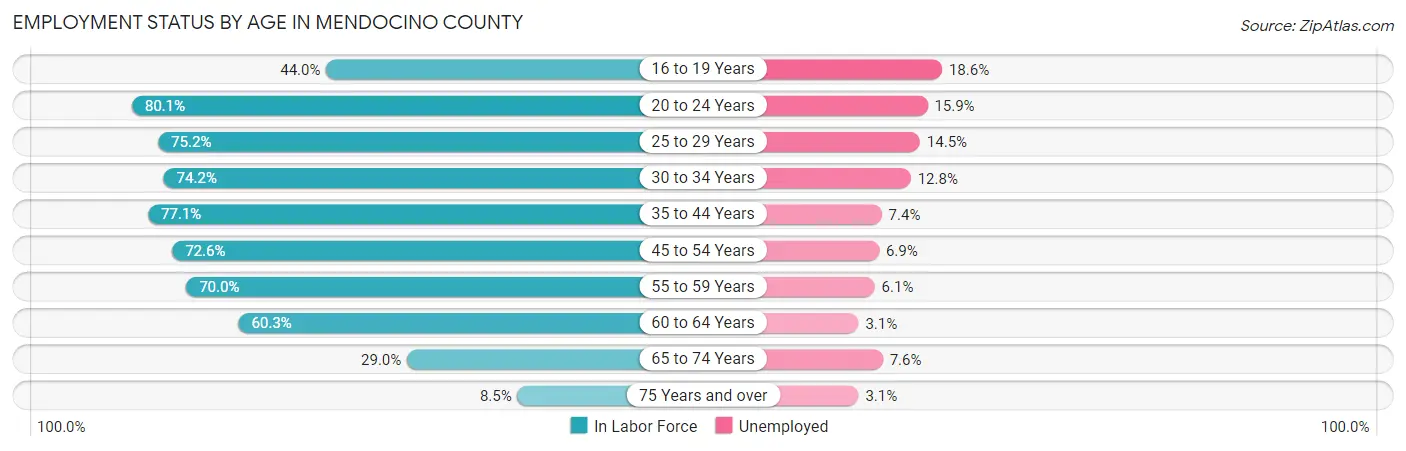
| Age Bracket | In Labor Force | Unemployed |
| 16 to 19 Years | 1,885 (44.0%) | 351 (18.6%) |
| 20 to 24 Years | 3,820 (80.1%) | 607 (15.9%) |
| 25 to 29 Years | 3,561 (75.2%) | 516 (14.5%) |
| 30 to 34 Years | 3,804 (74.2%) | 487 (12.8%) |
| 35 to 44 Years | 8,404 (77.1%) | 622 (7.4%) |
| 45 to 54 Years | 7,632 (72.6%) | 527 (6.9%) |
| 55 to 59 Years | 4,330 (70.0%) | 264 (6.1%) |
| 60 to 64 Years | 3,923 (60.3%) | 122 (3.1%) |
| 65 to 74 Years | 3,920 (29.0%) | 298 (7.6%) |
| 75 Years and over | 653 (8.5%) | 20 (3.1%) |
| Total | 41,932 (56.5%) | 3,816 (9.1%) |
Employment Status by Educational Attainment in Mendocino County
According to labor force statistics for Mendocino County, 72.0% of individuals (31,656) out of the total population between 25 and 64 years of age (43,966) are in the labor force, with 8.0% or 2,532 of them being unemployed. The group with the highest labor force participation rate are those with the educational attainment of bachelor's degree or higher, with 79.7% or 6,885 individuals in the labor force. Within the labor force, individuals with less than high school education have the highest percentage of unemployment, with 13.5% or 571 of them being unemployed.
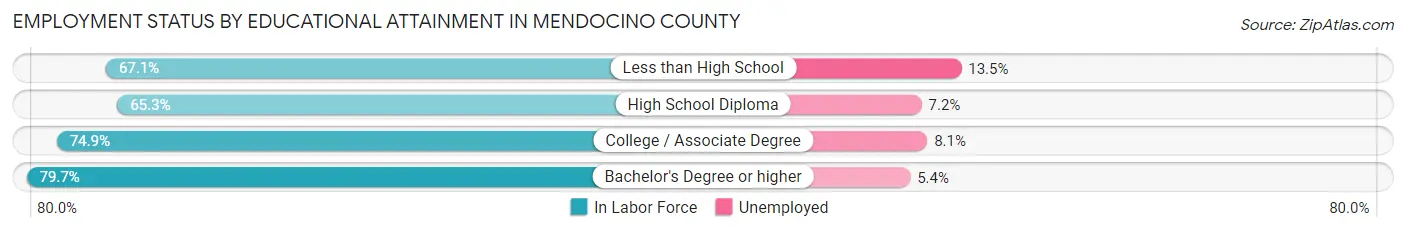
| Educational Attainment | In Labor Force | Unemployed |
| Less than High School | 4,232 (67.1%) | 851 (13.5%) |
| High School Diploma | 8,193 (65.3%) | 903 (7.2%) |
| College / Associate Degree | 12,339 (74.9%) | 1,334 (8.1%) |
| Bachelor's Degree or higher | 6,885 (79.7%) | 467 (5.4%) |
| Total | 31,656 (72.0%) | 3,517 (8.0%) |
Employment Occupations by Sex in Mendocino County
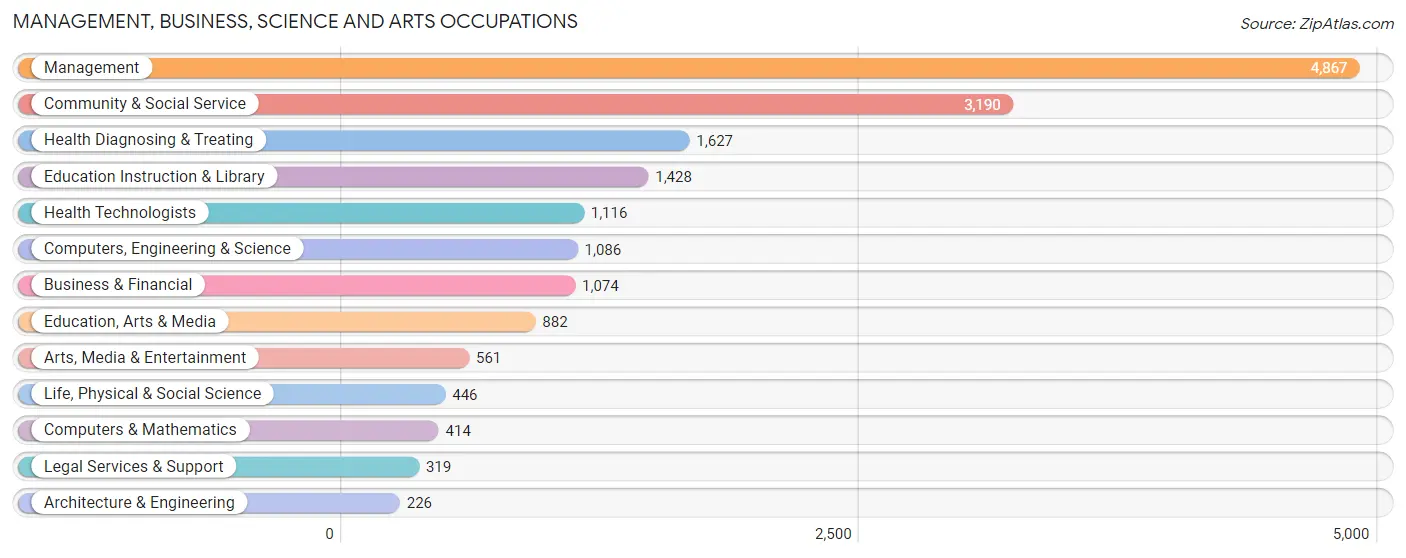
Management, Business, Science and Arts Occupations
The most common Management, Business, Science and Arts occupations in Mendocino County are Management (4,867 | 12.8%), Community & Social Service (3,190 | 8.4%), Health Diagnosing & Treating (1,627 | 4.3%), Education Instruction & Library (1,428 | 3.7%), and Health Technologists (1,116 | 2.9%).
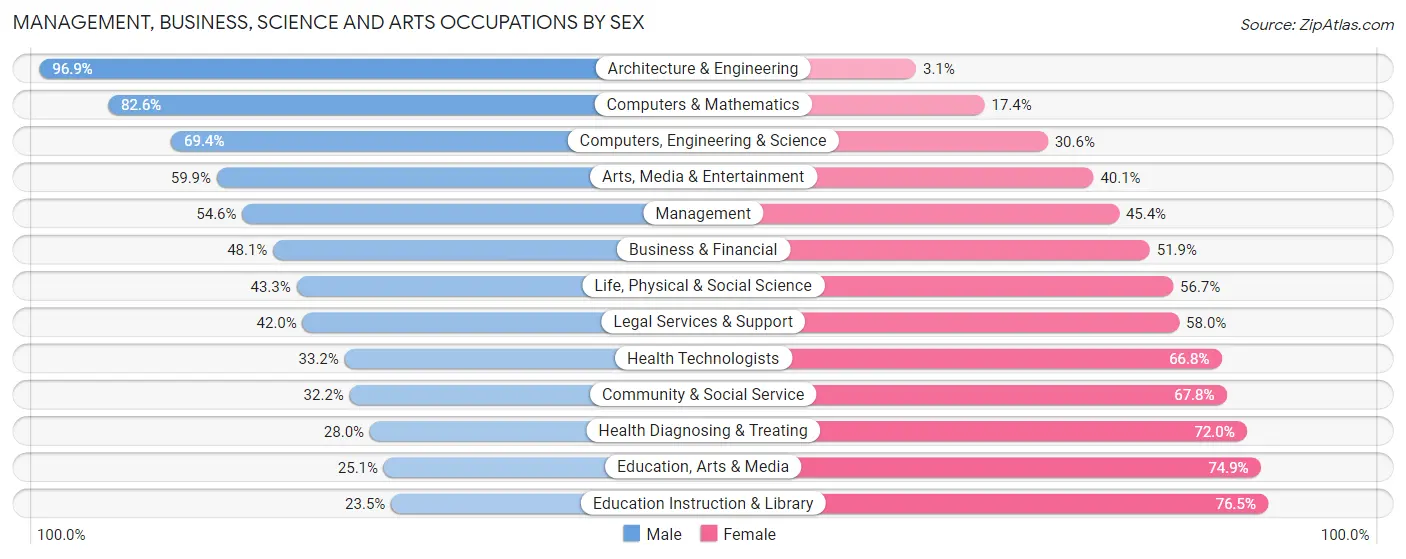
Management, Business, Science and Arts Occupations by Sex
Within the Management, Business, Science and Arts occupations in Mendocino County, the most male-oriented occupations are Architecture & Engineering (96.9%), Computers & Mathematics (82.6%), and Computers, Engineering & Science (69.4%), while the most female-oriented occupations are Education Instruction & Library (76.5%), Education, Arts & Media (74.9%), and Health Diagnosing & Treating (72.0%).
| Occupation | Male | Female |
| Management | 2,656 (54.6%) | 2,211 (45.4%) |
| Business & Financial | 517 (48.1%) | 557 (51.9%) |
| Computers, Engineering & Science | 754 (69.4%) | 332 (30.6%) |
| Computers & Mathematics | 342 (82.6%) | 72 (17.4%) |
| Architecture & Engineering | 219 (96.9%) | 7 (3.1%) |
| Life, Physical & Social Science | 193 (43.3%) | 253 (56.7%) |
| Community & Social Service | 1,027 (32.2%) | 2,163 (67.8%) |
| Education, Arts & Media | 221 (25.1%) | 661 (74.9%) |
| Legal Services & Support | 134 (42.0%) | 185 (58.0%) |
| Education Instruction & Library | 336 (23.5%) | 1,092 (76.5%) |
| Arts, Media & Entertainment | 336 (59.9%) | 225 (40.1%) |
| Health Diagnosing & Treating | 455 (28.0%) | 1,172 (72.0%) |
| Health Technologists | 371 (33.2%) | 745 (66.8%) |
| Total (Category) | 5,409 (45.7%) | 6,435 (54.3%) |
| Total (Overall) | 19,839 (52.1%) | 18,223 (47.9%) |
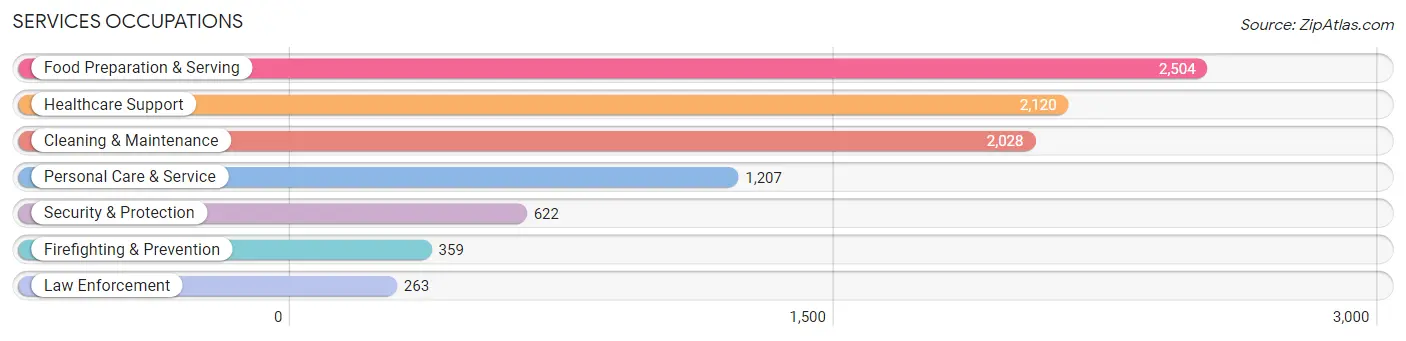
Services Occupations
The most common Services occupations in Mendocino County are Food Preparation & Serving (2,504 | 6.6%), Healthcare Support (2,120 | 5.6%), Cleaning & Maintenance (2,028 | 5.3%), Personal Care & Service (1,207 | 3.2%), and Security & Protection (622 | 1.6%).
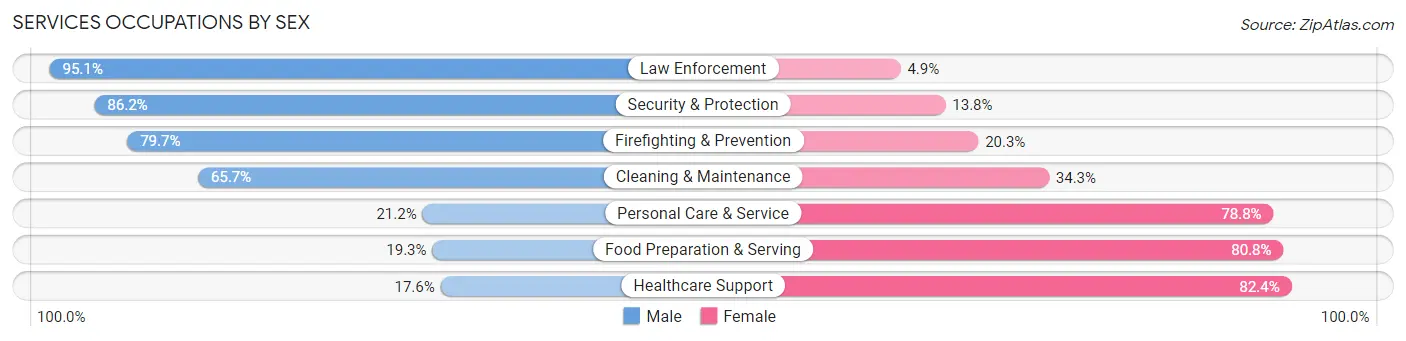
Services Occupations by Sex
Within the Services occupations in Mendocino County, the most male-oriented occupations are Law Enforcement (95.1%), Security & Protection (86.2%), and Firefighting & Prevention (79.7%), while the most female-oriented occupations are Healthcare Support (82.4%), Food Preparation & Serving (80.7%), and Personal Care & Service (78.8%).
| Occupation | Male | Female |
| Healthcare Support | 374 (17.6%) | 1,746 (82.4%) |
| Security & Protection | 536 (86.2%) | 86 (13.8%) |
| Firefighting & Prevention | 286 (79.7%) | 73 (20.3%) |
| Law Enforcement | 250 (95.1%) | 13 (4.9%) |
| Food Preparation & Serving | 482 (19.3%) | 2,022 (80.7%) |
| Cleaning & Maintenance | 1,332 (65.7%) | 696 (34.3%) |
| Personal Care & Service | 256 (21.2%) | 951 (78.8%) |
| Total (Category) | 2,980 (35.1%) | 5,501 (64.9%) |
| Total (Overall) | 19,839 (52.1%) | 18,223 (47.9%) |
Sales and Office Occupations
The most common Sales and Office occupations in Mendocino County are Sales & Related (4,268 | 11.2%), and Office & Administration (4,203 | 11.0%).

Sales and Office Occupations by Sex

| Occupation | Male | Female |
| Sales & Related | 2,209 (51.8%) | 2,059 (48.2%) |
| Office & Administration | 1,256 (29.9%) | 2,947 (70.1%) |
| Total (Category) | 3,465 (40.9%) | 5,006 (59.1%) |
| Total (Overall) | 19,839 (52.1%) | 18,223 (47.9%) |
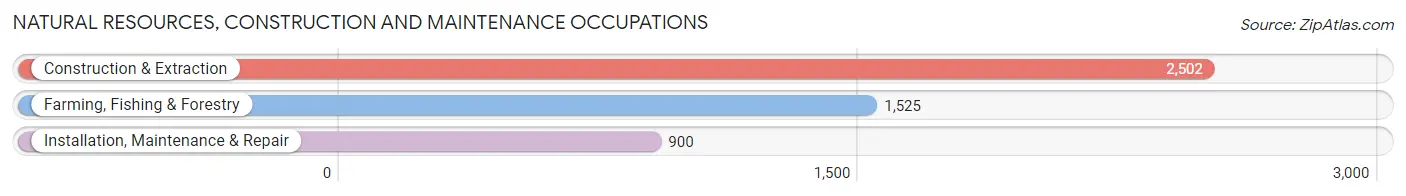
Natural Resources, Construction and Maintenance Occupations
The most common Natural Resources, Construction and Maintenance occupations in Mendocino County are Construction & Extraction (2,502 | 6.6%), Farming, Fishing & Forestry (1,525 | 4.0%), and Installation, Maintenance & Repair (900 | 2.4%).
Natural Resources, Construction and Maintenance Occupations by Sex
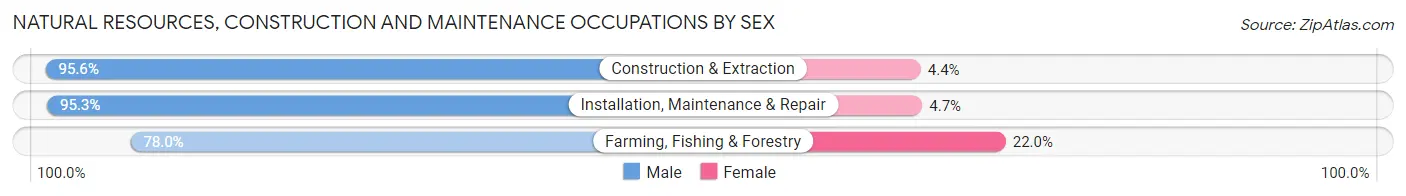
| Occupation | Male | Female |
| Farming, Fishing & Forestry | 1,189 (78.0%) | 336 (22.0%) |
| Construction & Extraction | 2,393 (95.6%) | 109 (4.4%) |
| Installation, Maintenance & Repair | 858 (95.3%) | 42 (4.7%) |
| Total (Category) | 4,440 (90.1%) | 487 (9.9%) |
| Total (Overall) | 19,839 (52.1%) | 18,223 (47.9%) |
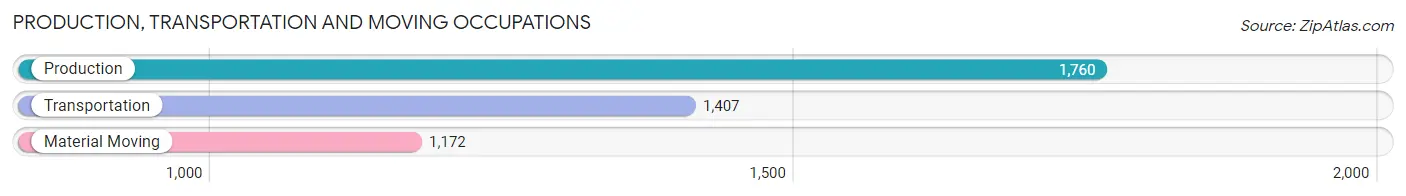
Production, Transportation and Moving Occupations
The most common Production, Transportation and Moving occupations in Mendocino County are Production (1,760 | 4.6%), Transportation (1,407 | 3.7%), and Material Moving (1,172 | 3.1%).
Production, Transportation and Moving Occupations by Sex
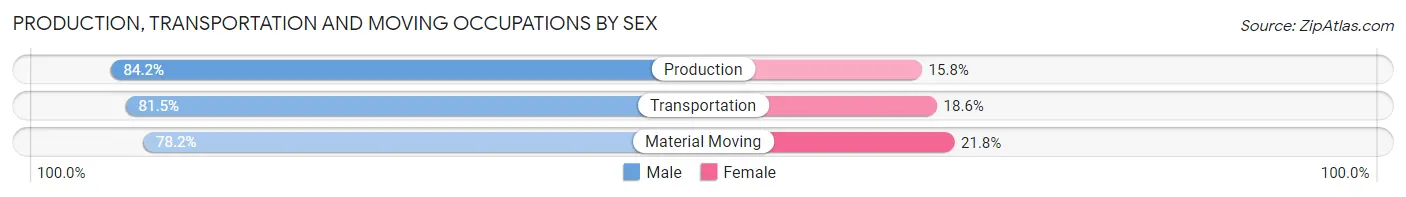
| Occupation | Male | Female |
| Production | 1,482 (84.2%) | 278 (15.8%) |
| Transportation | 1,146 (81.5%) | 261 (18.5%) |
| Material Moving | 917 (78.2%) | 255 (21.8%) |
| Total (Category) | 3,545 (81.7%) | 794 (18.3%) |
| Total (Overall) | 19,839 (52.1%) | 18,223 (47.9%) |
Employment Industries by Sex in Mendocino County
Employment Industries in Mendocino County
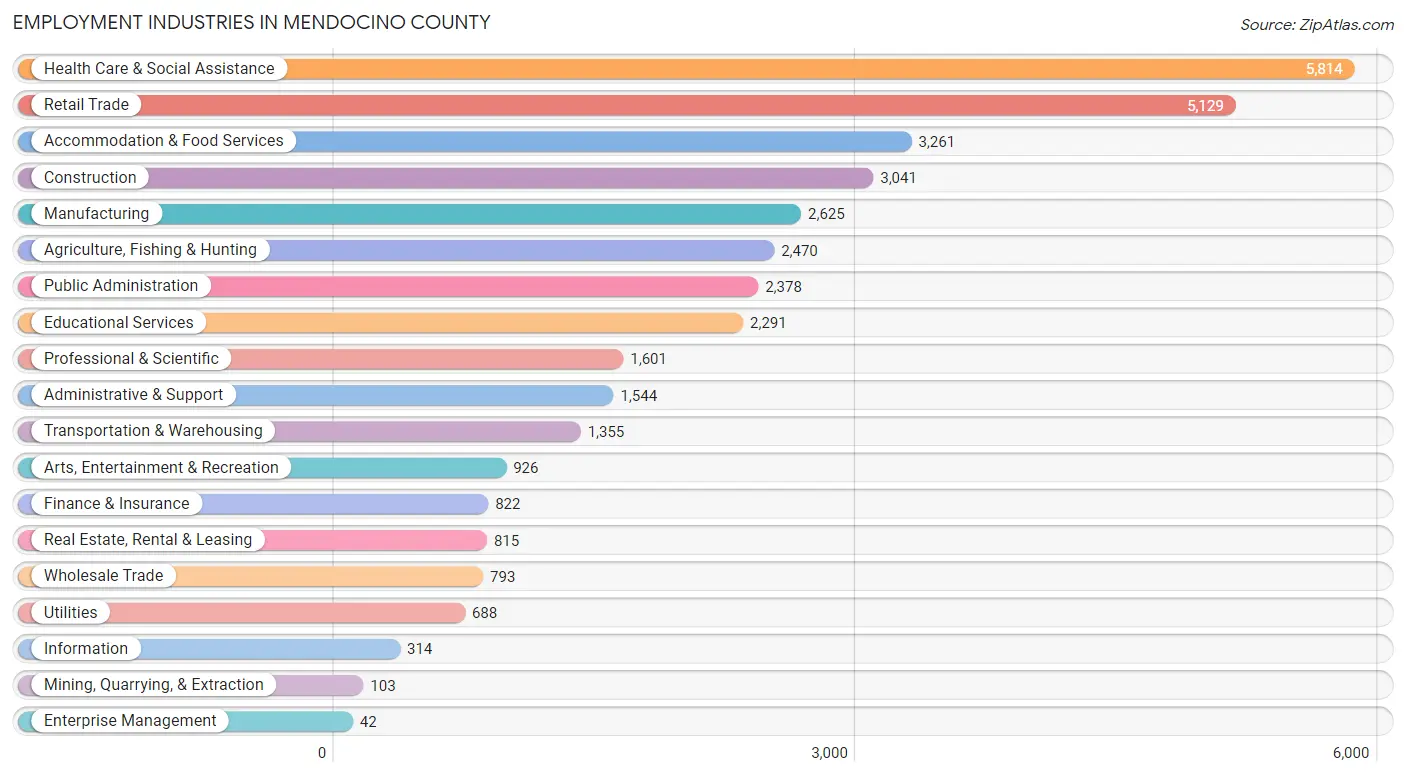
The major employment industries in Mendocino County include Health Care & Social Assistance (5,814 | 15.3%), Retail Trade (5,129 | 13.5%), Accommodation & Food Services (3,261 | 8.6%), Construction (3,041 | 8.0%), and Manufacturing (2,625 | 6.9%).
Employment Industries by Sex in Mendocino County
The Mendocino County industries that see more men than women are Construction (90.0%), Utilities (86.6%), and Agriculture, Fishing & Hunting (80.1%), whereas the industries that tend to have a higher number of women are Enterprise Management (100.0%), Health Care & Social Assistance (77.2%), and Accommodation & Food Services (76.0%).
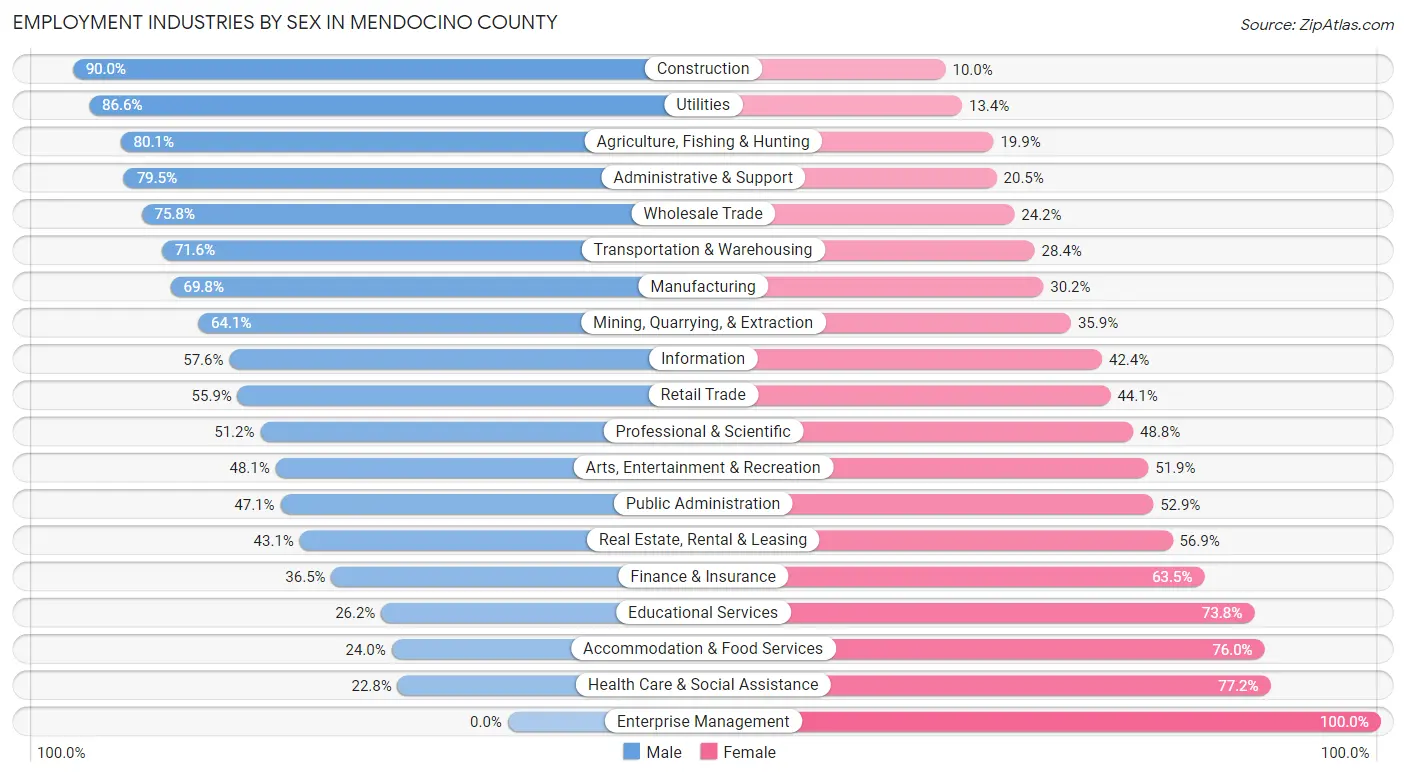
| Industry | Male | Female |
| Agriculture, Fishing & Hunting | 1,979 (80.1%) | 491 (19.9%) |
| Mining, Quarrying, & Extraction | 66 (64.1%) | 37 (35.9%) |
| Construction | 2,738 (90.0%) | 303 (10.0%) |
| Manufacturing | 1,832 (69.8%) | 793 (30.2%) |
| Wholesale Trade | 601 (75.8%) | 192 (24.2%) |
| Retail Trade | 2,867 (55.9%) | 2,262 (44.1%) |
| Transportation & Warehousing | 970 (71.6%) | 385 (28.4%) |
| Utilities | 596 (86.6%) | 92 (13.4%) |
| Information | 181 (57.6%) | 133 (42.4%) |
| Finance & Insurance | 300 (36.5%) | 522 (63.5%) |
| Real Estate, Rental & Leasing | 351 (43.1%) | 464 (56.9%) |
| Professional & Scientific | 820 (51.2%) | 781 (48.8%) |
| Enterprise Management | 0 (0.0%) | 42 (100.0%) |
| Administrative & Support | 1,227 (79.5%) | 317 (20.5%) |
| Educational Services | 600 (26.2%) | 1,691 (73.8%) |
| Health Care & Social Assistance | 1,326 (22.8%) | 4,488 (77.2%) |
| Arts, Entertainment & Recreation | 445 (48.1%) | 481 (51.9%) |
| Accommodation & Food Services | 784 (24.0%) | 2,477 (76.0%) |
| Public Administration | 1,119 (47.1%) | 1,259 (52.9%) |
| Total | 19,839 (52.1%) | 18,223 (47.9%) |
Education in Mendocino County
School Enrollment in Mendocino County
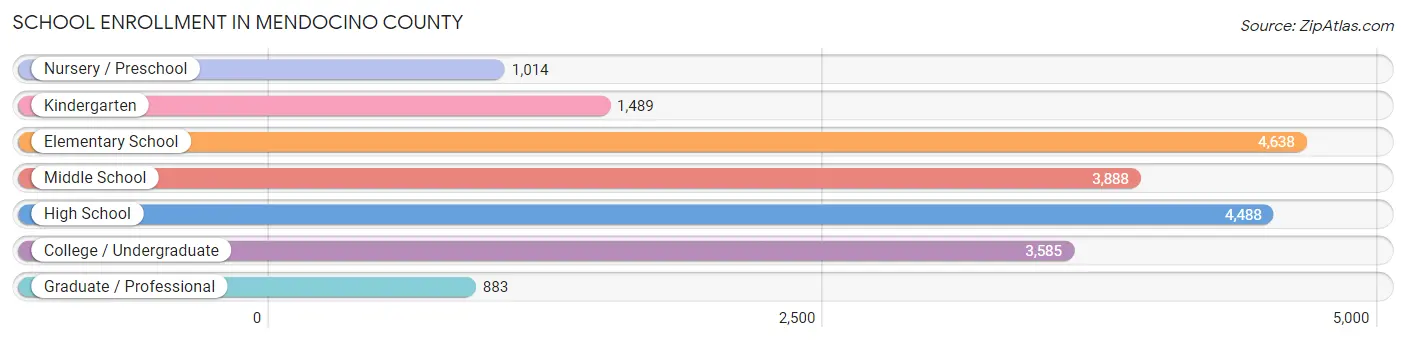
The most common levels of schooling among the 19,985 students in Mendocino County are elementary school (4,638 | 23.2%), high school (4,488 | 22.5%), and middle school (3,888 | 19.5%).
| School Level | # Students | % Students |
| Nursery / Preschool | 1,014 | 5.1% |
| Kindergarten | 1,489 | 7.4% |
| Elementary School | 4,638 | 23.2% |
| Middle School | 3,888 | 19.5% |
| High School | 4,488 | 22.5% |
| College / Undergraduate | 3,585 | 17.9% |
| Graduate / Professional | 883 | 4.4% |
| Total | 19,985 | 100.0% |
School Enrollment by Age by Funding Source in Mendocino County
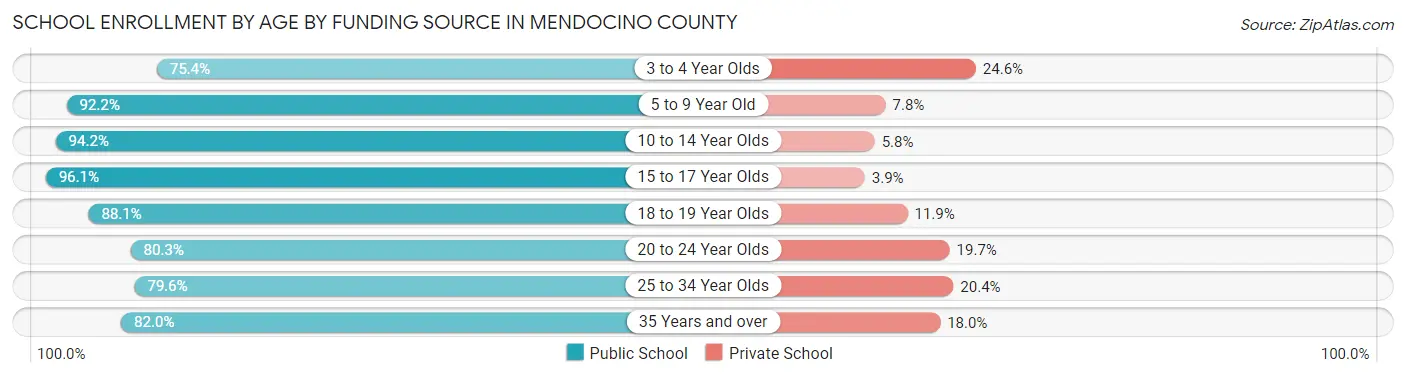
Out of a total of 19,985 students who are enrolled in schools in Mendocino County, 1,998 (10.0%) attend a private institution, while the remaining 17,986 (90.0%) are enrolled in public schools. The age group of 3 to 4 year olds has the highest likelihood of being enrolled in private schools, with 248 (24.6% in the age bracket) enrolled. Conversely, the age group of 15 to 17 year olds has the lowest likelihood of being enrolled in a private school, with 2,879 (96.1% in the age bracket) attending a public institution.
| Age Bracket | Public School | Private School |
| 3 to 4 Year Olds | 759 (75.4%) | 248 (24.6%) |
| 5 to 9 Year Old | 5,195 (92.2%) | 440 (7.8%) |
| 10 to 14 Year Olds | 4,911 (94.2%) | 302 (5.8%) |
| 15 to 17 Year Olds | 2,879 (96.1%) | 118 (3.9%) |
| 18 to 19 Year Olds | 1,073 (88.1%) | 145 (11.9%) |
| 20 to 24 Year Olds | 1,171 (80.3%) | 288 (19.7%) |
| 25 to 34 Year Olds | 755 (79.6%) | 194 (20.4%) |
| 35 Years and over | 1,236 (82.0%) | 271 (18.0%) |
| Total | 17,986 (90.0%) | 1,998 (10.0%) |
Educational Attainment by Field of Study in Mendocino County
Social sciences (2,021 | 12.0%), business (1,813 | 10.7%), liberal arts & history (1,704 | 10.1%), bio, nature & agricultural (1,585 | 9.4%), and literature & languages (1,581 | 9.4%) are the most common fields of study among 16,872 individuals in Mendocino County who have obtained a bachelor's degree or higher.
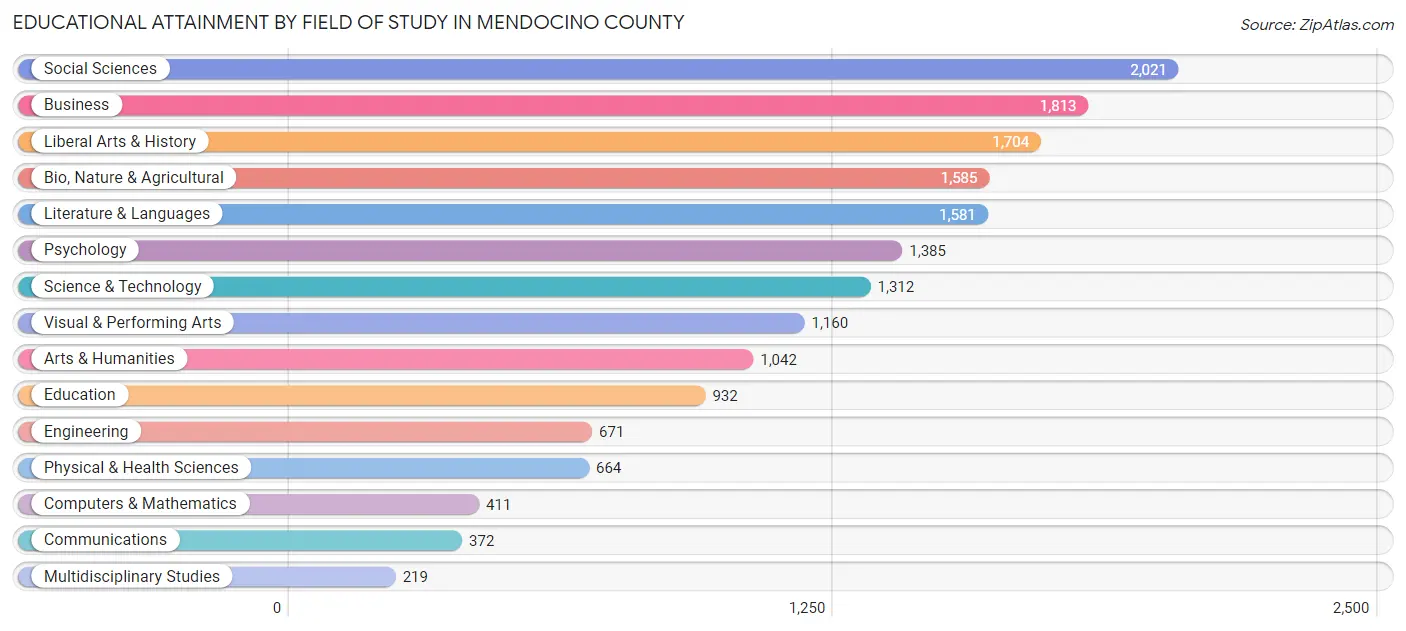
| Field of Study | # Graduates | % Graduates |
| Computers & Mathematics | 411 | 2.4% |
| Bio, Nature & Agricultural | 1,585 | 9.4% |
| Physical & Health Sciences | 664 | 3.9% |
| Psychology | 1,385 | 8.2% |
| Social Sciences | 2,021 | 12.0% |
| Engineering | 671 | 4.0% |
| Multidisciplinary Studies | 219 | 1.3% |
| Science & Technology | 1,312 | 7.8% |
| Business | 1,813 | 10.7% |
| Education | 932 | 5.5% |
| Literature & Languages | 1,581 | 9.4% |
| Liberal Arts & History | 1,704 | 10.1% |
| Visual & Performing Arts | 1,160 | 6.9% |
| Communications | 372 | 2.2% |
| Arts & Humanities | 1,042 | 6.2% |
| Total | 16,872 | 100.0% |
Transportation & Commute in Mendocino County
Vehicle Availability by Sex in Mendocino County
The most prevalent vehicle ownership categories in Mendocino County are males with 2 vehicles (6,309, accounting for 32.9%) and females with 2 vehicles (5,227, making up 36.7%).
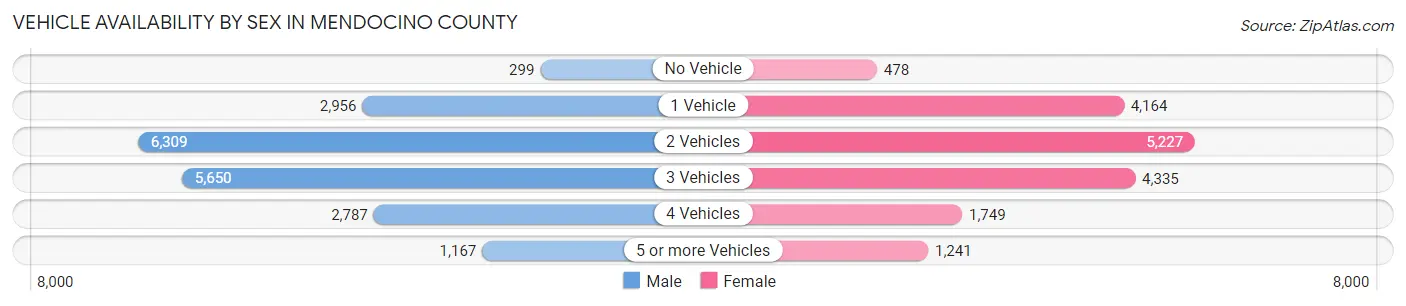
| Vehicles Available | Male | Female |
| No Vehicle | 299 (1.6%) | 478 (2.8%) |
| 1 Vehicle | 2,956 (15.4%) | 4,164 (24.2%) |
| 2 Vehicles | 6,309 (32.9%) | 5,227 (30.4%) |
| 3 Vehicles | 5,650 (29.5%) | 4,335 (25.2%) |
| 4 Vehicles | 2,787 (14.5%) | 1,749 (10.2%) |
| 5 or more Vehicles | 1,167 (6.1%) | 1,241 (7.2%) |
| Total | 19,168 (100.0%) | 17,194 (100.0%) |
Commute Time in Mendocino County
The most frequently occuring commute durations in Mendocino County are 10 to 14 minutes (7,098 commuters, 21.5%), 5 to 9 minutes (6,952 commuters, 21.0%), and 15 to 19 minutes (4,701 commuters, 14.2%).
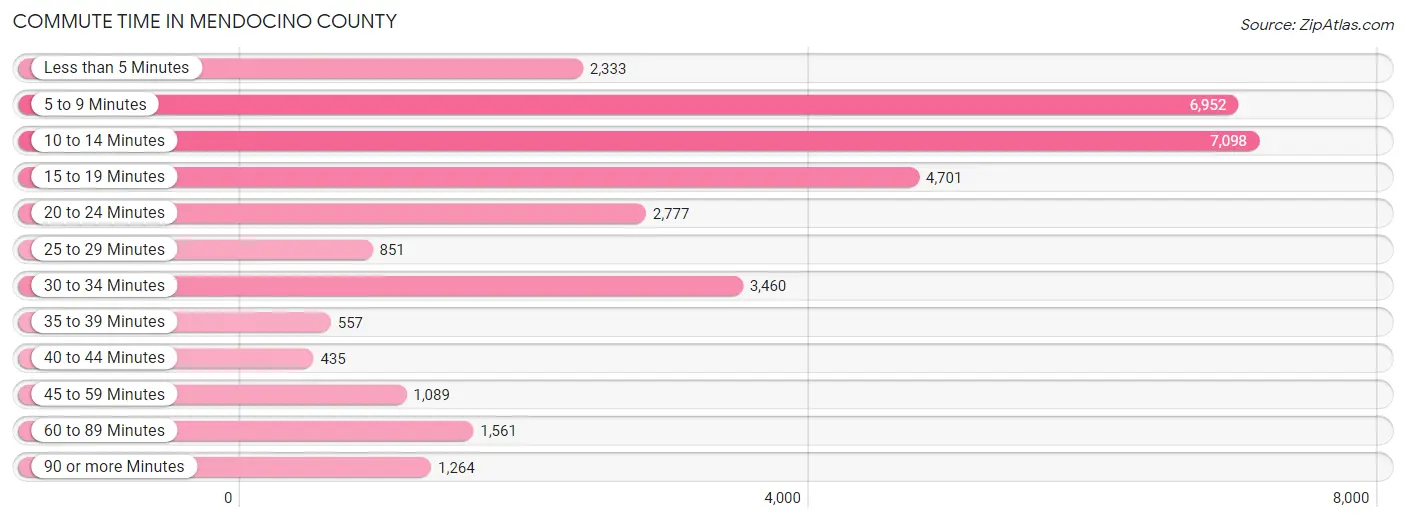
| Commute Time | # Commuters | % Commuters |
| Less than 5 Minutes | 2,333 | 7.0% |
| 5 to 9 Minutes | 6,952 | 21.0% |
| 10 to 14 Minutes | 7,098 | 21.5% |
| 15 to 19 Minutes | 4,701 | 14.2% |
| 20 to 24 Minutes | 2,777 | 8.4% |
| 25 to 29 Minutes | 851 | 2.6% |
| 30 to 34 Minutes | 3,460 | 10.5% |
| 35 to 39 Minutes | 557 | 1.7% |
| 40 to 44 Minutes | 435 | 1.3% |
| 45 to 59 Minutes | 1,089 | 3.3% |
| 60 to 89 Minutes | 1,561 | 4.7% |
| 90 or more Minutes | 1,264 | 3.8% |
Commute Time by Sex in Mendocino County
The most common commute times in Mendocino County are 5 to 9 minutes (3,115 commuters, 17.7%) for males and 10 to 14 minutes (4,031 commuters, 26.0%) for females.
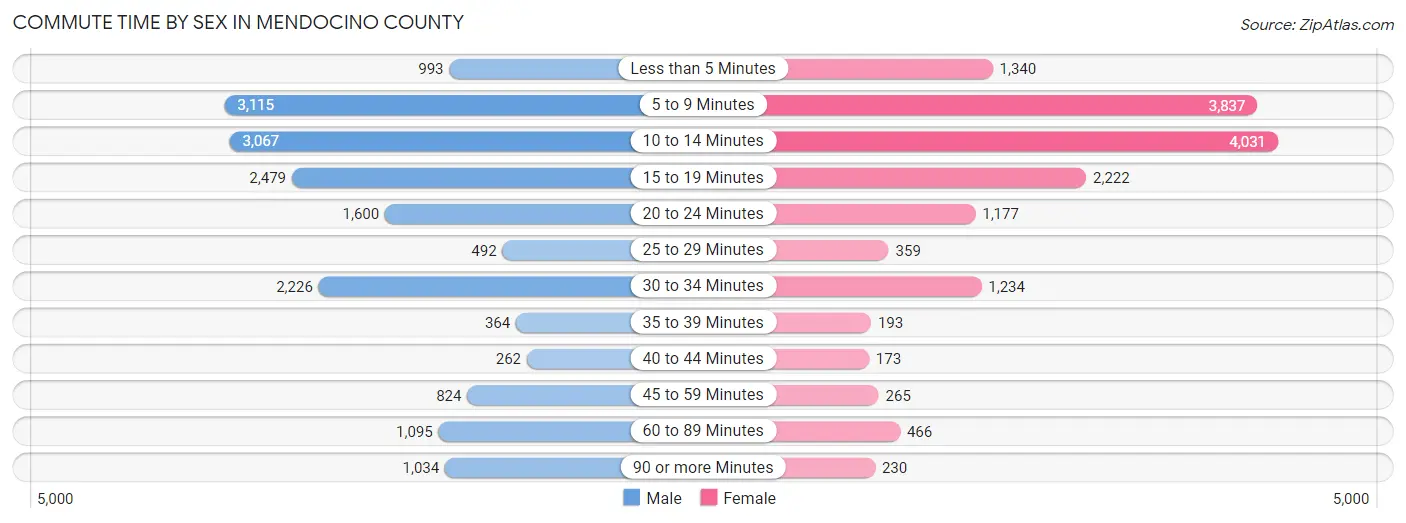
| Commute Time | Male | Female |
| Less than 5 Minutes | 993 (5.7%) | 1,340 (8.6%) |
| 5 to 9 Minutes | 3,115 (17.7%) | 3,837 (24.7%) |
| 10 to 14 Minutes | 3,067 (17.5%) | 4,031 (26.0%) |
| 15 to 19 Minutes | 2,479 (14.1%) | 2,222 (14.3%) |
| 20 to 24 Minutes | 1,600 (9.1%) | 1,177 (7.6%) |
| 25 to 29 Minutes | 492 (2.8%) | 359 (2.3%) |
| 30 to 34 Minutes | 2,226 (12.7%) | 1,234 (8.0%) |
| 35 to 39 Minutes | 364 (2.1%) | 193 (1.2%) |
| 40 to 44 Minutes | 262 (1.5%) | 173 (1.1%) |
| 45 to 59 Minutes | 824 (4.7%) | 265 (1.7%) |
| 60 to 89 Minutes | 1,095 (6.2%) | 466 (3.0%) |
| 90 or more Minutes | 1,034 (5.9%) | 230 (1.5%) |
Time of Departure to Work by Sex in Mendocino County
The most frequent times of departure to work in Mendocino County are 7:30 AM to 7:59 AM (2,225, 12.7%) for males and 8:00 AM to 8:29 AM (2,651, 17.1%) for females.
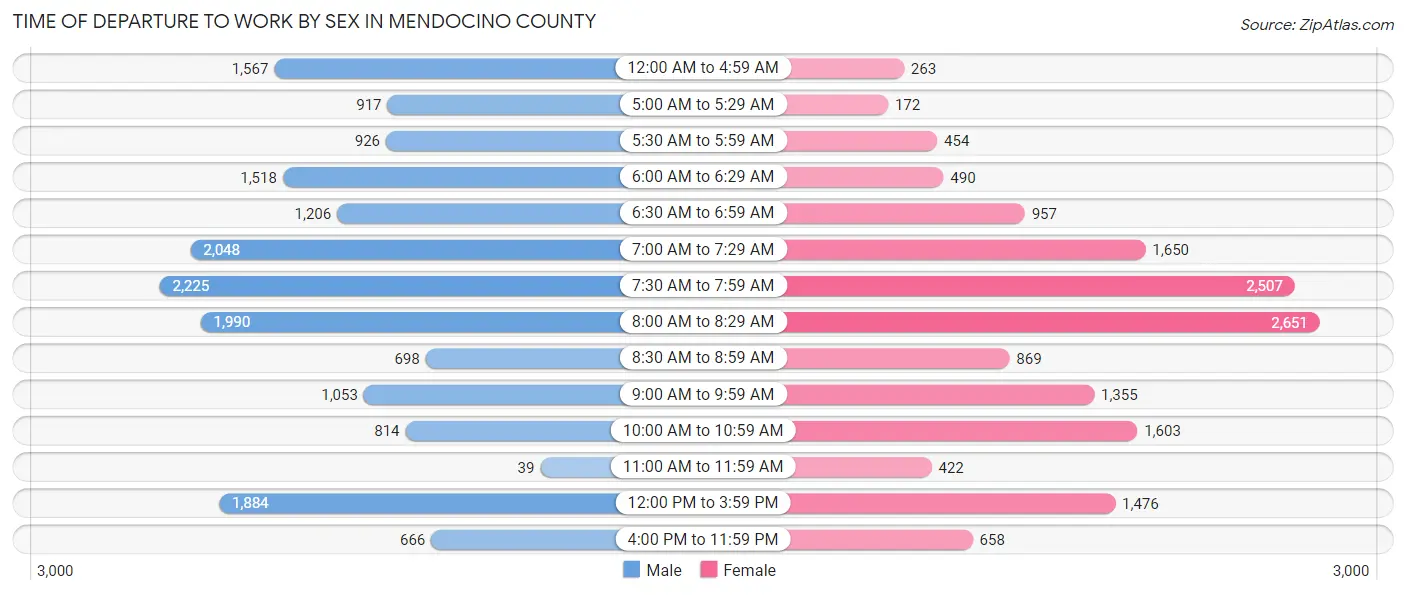
| Time of Departure | Male | Female |
| 12:00 AM to 4:59 AM | 1,567 (8.9%) | 263 (1.7%) |
| 5:00 AM to 5:29 AM | 917 (5.2%) | 172 (1.1%) |
| 5:30 AM to 5:59 AM | 926 (5.3%) | 454 (2.9%) |
| 6:00 AM to 6:29 AM | 1,518 (8.6%) | 490 (3.2%) |
| 6:30 AM to 6:59 AM | 1,206 (6.9%) | 957 (6.2%) |
| 7:00 AM to 7:29 AM | 2,048 (11.7%) | 1,650 (10.6%) |
| 7:30 AM to 7:59 AM | 2,225 (12.7%) | 2,507 (16.2%) |
| 8:00 AM to 8:29 AM | 1,990 (11.3%) | 2,651 (17.1%) |
| 8:30 AM to 8:59 AM | 698 (4.0%) | 869 (5.6%) |
| 9:00 AM to 9:59 AM | 1,053 (6.0%) | 1,355 (8.7%) |
| 10:00 AM to 10:59 AM | 814 (4.6%) | 1,603 (10.3%) |
| 11:00 AM to 11:59 AM | 39 (0.2%) | 422 (2.7%) |
| 12:00 PM to 3:59 PM | 1,884 (10.7%) | 1,476 (9.5%) |
| 4:00 PM to 11:59 PM | 666 (3.8%) | 658 (4.2%) |
| Total | 17,551 (100.0%) | 15,527 (100.0%) |
Housing Occupancy in Mendocino County
Occupancy by Ownership in Mendocino County
Of the total 34,557 dwellings in Mendocino County, owner-occupied units account for 21,044 (60.9%), while renter-occupied units make up 13,513 (39.1%).
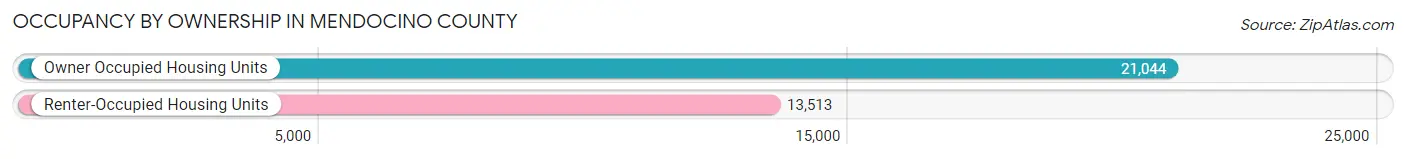
| Occupancy | # Housing Units | % Housing Units |
| Owner Occupied Housing Units | 21,044 | 60.9% |
| Renter-Occupied Housing Units | 13,513 | 39.1% |
| Total Occupied Housing Units | 34,557 | 100.0% |
Occupancy by Household Size in Mendocino County
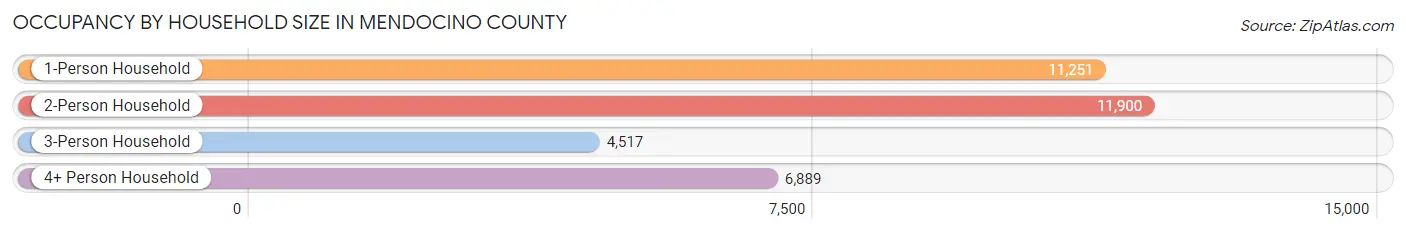
| Household Size | # Housing Units | % Housing Units |
| 1-Person Household | 11,251 | 32.6% |
| 2-Person Household | 11,900 | 34.4% |
| 3-Person Household | 4,517 | 13.1% |
| 4+ Person Household | 6,889 | 19.9% |
| Total Housing Units | 34,557 | 100.0% |
Occupancy by Ownership by Household Size in Mendocino County
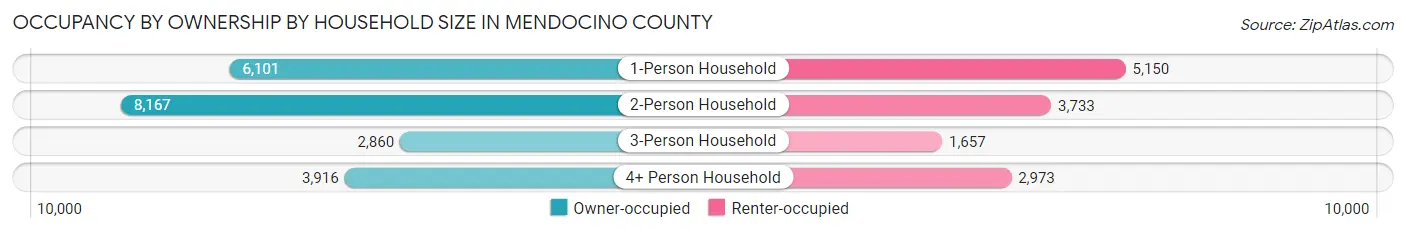
| Household Size | Owner-occupied | Renter-occupied |
| 1-Person Household | 6,101 (54.2%) | 5,150 (45.8%) |
| 2-Person Household | 8,167 (68.6%) | 3,733 (31.4%) |
| 3-Person Household | 2,860 (63.3%) | 1,657 (36.7%) |
| 4+ Person Household | 3,916 (56.8%) | 2,973 (43.2%) |
| Total Housing Units | 21,044 (60.9%) | 13,513 (39.1%) |
Occupancy by Educational Attainment in Mendocino County
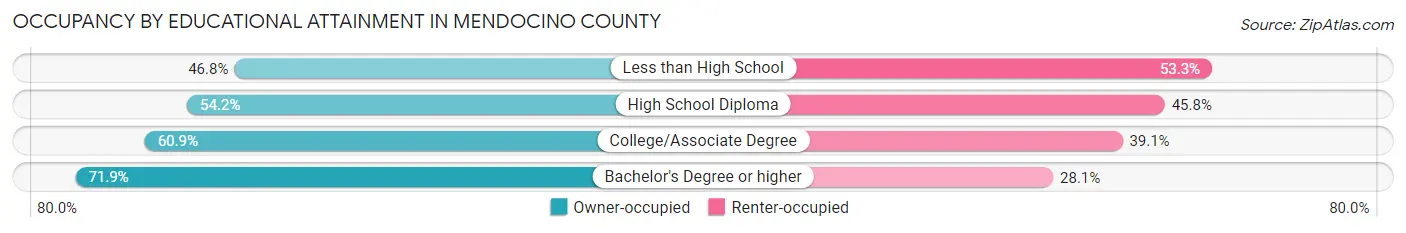
| Household Size | Owner-occupied | Renter-occupied |
| Less than High School | 1,784 (46.8%) | 2,032 (53.2%) |
| High School Diploma | 3,610 (54.2%) | 3,047 (45.8%) |
| College/Associate Degree | 9,286 (60.9%) | 5,951 (39.1%) |
| Bachelor's Degree or higher | 6,364 (71.9%) | 2,483 (28.1%) |
Occupancy by Age of Householder in Mendocino County
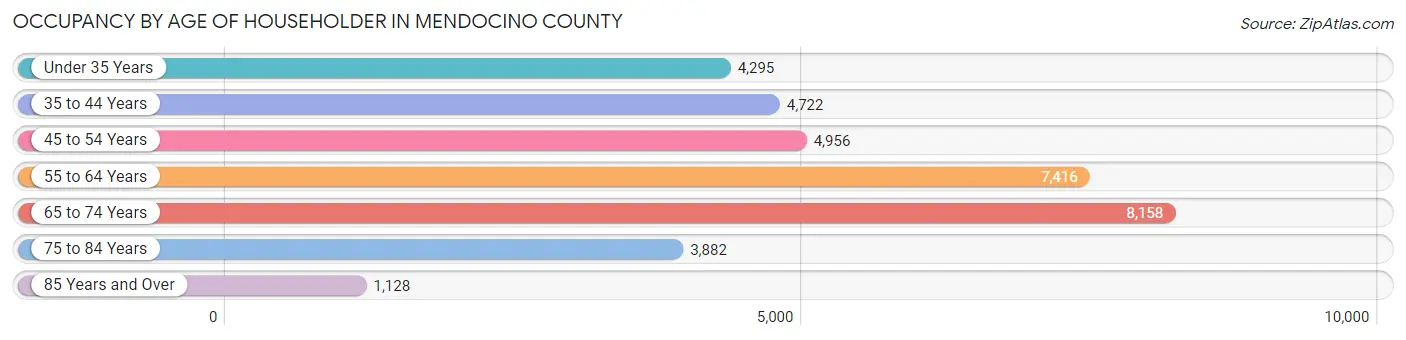
| Age Bracket | # Households | % Households |
| Under 35 Years | 4,295 | 12.4% |
| 35 to 44 Years | 4,722 | 13.7% |
| 45 to 54 Years | 4,956 | 14.3% |
| 55 to 64 Years | 7,416 | 21.5% |
| 65 to 74 Years | 8,158 | 23.6% |
| 75 to 84 Years | 3,882 | 11.2% |
| 85 Years and Over | 1,128 | 3.3% |
| Total | 34,557 | 100.0% |
Housing Finances in Mendocino County
Median Income by Occupancy in Mendocino County
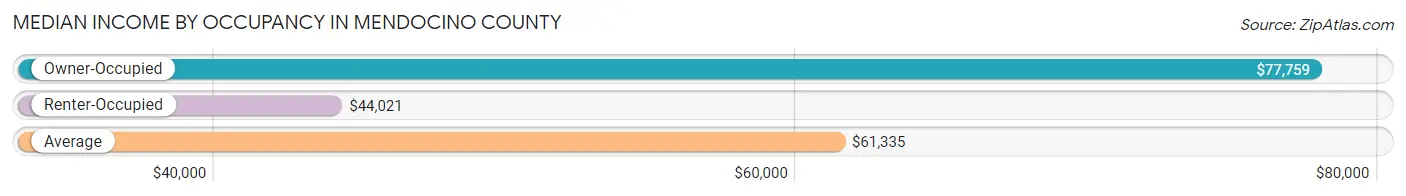
| Occupancy Type | # Households | Median Income |
| Owner-Occupied | 21,044 (60.9%) | $77,759 |
| Renter-Occupied | 13,513 (39.1%) | $44,021 |
| Average | 34,557 (100.0%) | $61,335 |
Occupancy by Householder Income Bracket in Mendocino County
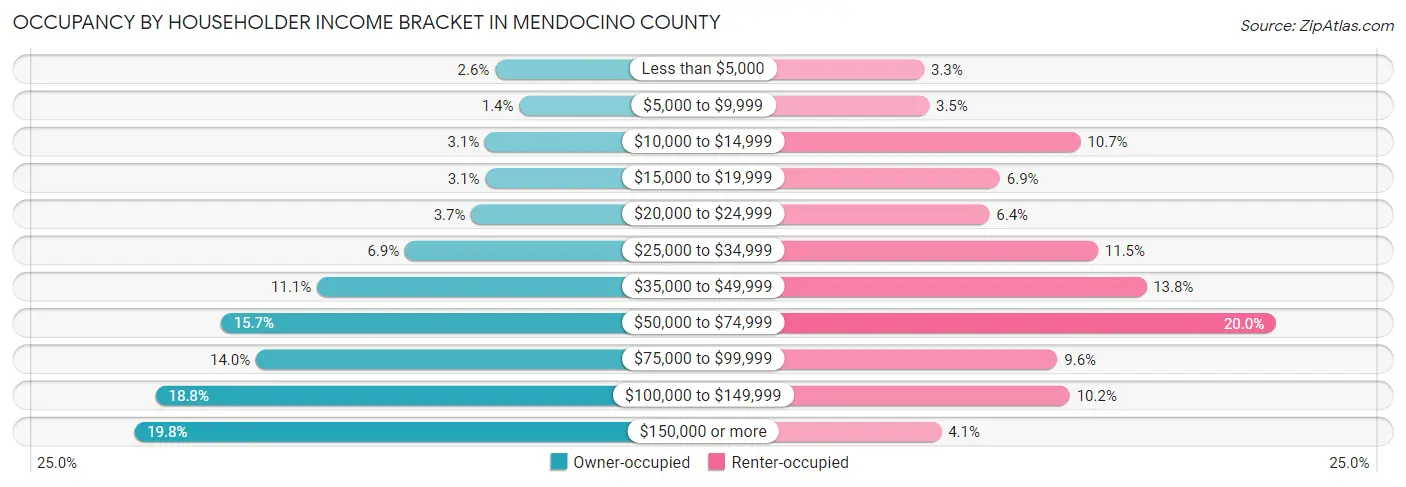
| Income Bracket | Owner-occupied | Renter-occupied |
| Less than $5,000 | 544 (2.6%) | 441 (3.3%) |
| $5,000 to $9,999 | 302 (1.4%) | 473 (3.5%) |
| $10,000 to $14,999 | 645 (3.1%) | 1,447 (10.7%) |
| $15,000 to $19,999 | 643 (3.1%) | 928 (6.9%) |
| $20,000 to $24,999 | 785 (3.7%) | 861 (6.4%) |
| $25,000 to $34,999 | 1,447 (6.9%) | 1,559 (11.5%) |
| $35,000 to $49,999 | 2,329 (11.1%) | 1,870 (13.8%) |
| $50,000 to $74,999 | 3,295 (15.7%) | 2,705 (20.0%) |
| $75,000 to $99,999 | 2,943 (14.0%) | 1,299 (9.6%) |
| $100,000 to $149,999 | 3,948 (18.8%) | 1,379 (10.2%) |
| $150,000 or more | 4,163 (19.8%) | 551 (4.1%) |
| Total | 21,044 (100.0%) | 13,513 (100.0%) |
Monthly Housing Cost Tiers in Mendocino County
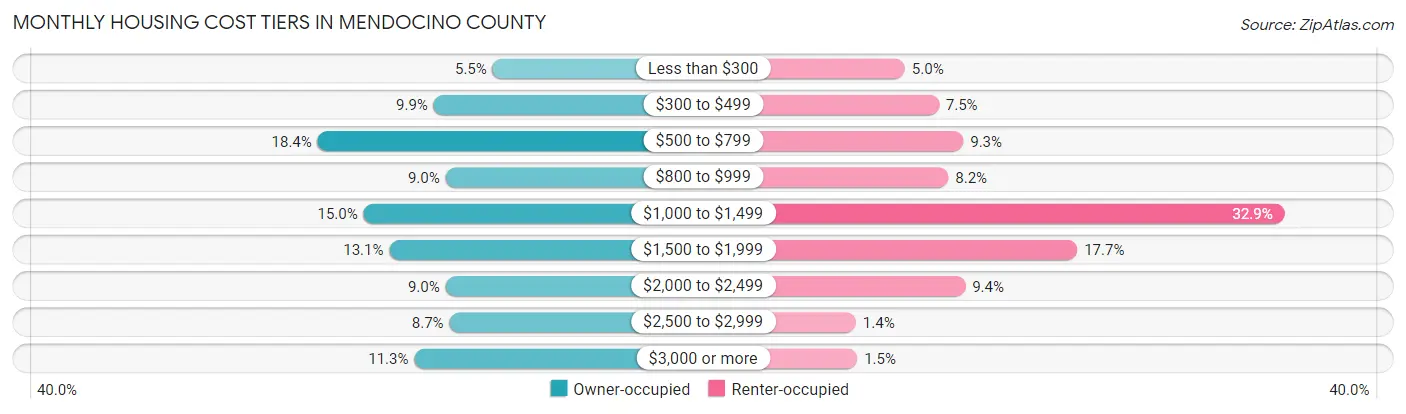
| Monthly Cost | Owner-occupied | Renter-occupied |
| Less than $300 | 1,163 (5.5%) | 671 (5.0%) |
| $300 to $499 | 2,078 (9.9%) | 1,010 (7.5%) |
| $500 to $799 | 3,877 (18.4%) | 1,252 (9.3%) |
| $800 to $999 | 1,893 (9.0%) | 1,104 (8.2%) |
| $1,000 to $1,499 | 3,164 (15.0%) | 4,450 (32.9%) |
| $1,500 to $1,999 | 2,765 (13.1%) | 2,387 (17.7%) |
| $2,000 to $2,499 | 1,893 (9.0%) | 1,271 (9.4%) |
| $2,500 to $2,999 | 1,833 (8.7%) | 184 (1.4%) |
| $3,000 or more | 2,378 (11.3%) | 197 (1.5%) |
| Total | 21,044 (100.0%) | 13,513 (100.0%) |
Physical Housing Characteristics in Mendocino County
Housing Structures in Mendocino County
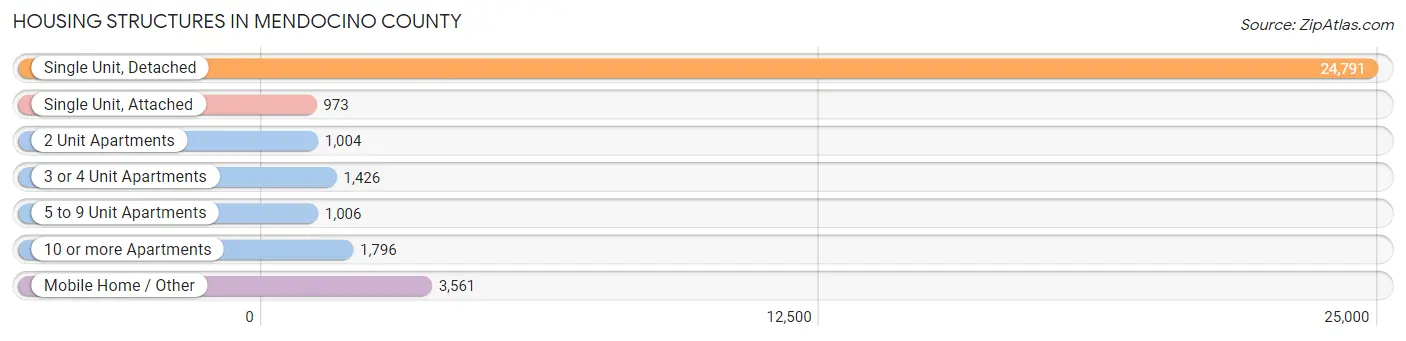
| Structure Type | # Housing Units | % Housing Units |
| Single Unit, Detached | 24,791 | 71.7% |
| Single Unit, Attached | 973 | 2.8% |
| 2 Unit Apartments | 1,004 | 2.9% |
| 3 or 4 Unit Apartments | 1,426 | 4.1% |
| 5 to 9 Unit Apartments | 1,006 | 2.9% |
| 10 or more Apartments | 1,796 | 5.2% |
| Mobile Home / Other | 3,561 | 10.3% |
| Total | 34,557 | 100.0% |
Housing Structures by Occupancy in Mendocino County
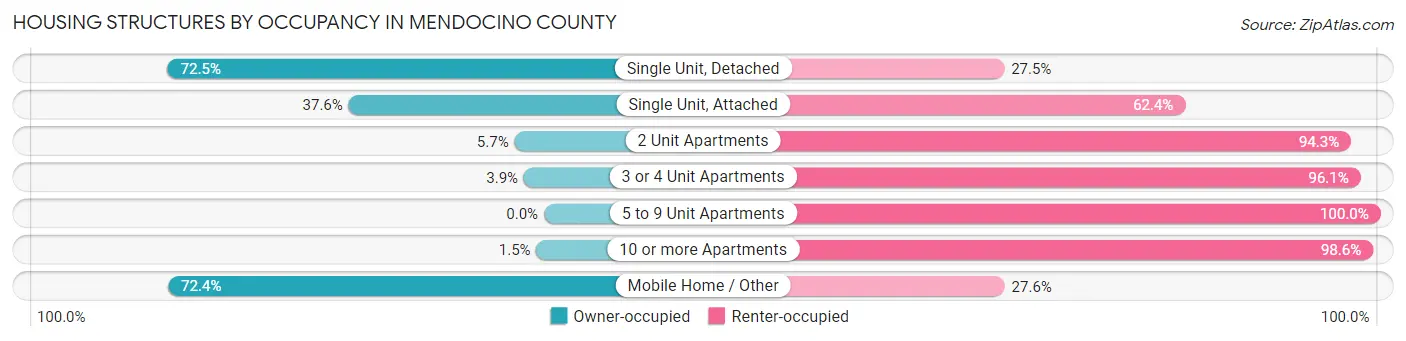
| Structure Type | Owner-occupied | Renter-occupied |
| Single Unit, Detached | 17,963 (72.5%) | 6,828 (27.5%) |
| Single Unit, Attached | 366 (37.6%) | 607 (62.4%) |
| 2 Unit Apartments | 57 (5.7%) | 947 (94.3%) |
| 3 or 4 Unit Apartments | 55 (3.9%) | 1,371 (96.1%) |
| 5 to 9 Unit Apartments | 0 (0.0%) | 1,006 (100.0%) |
| 10 or more Apartments | 26 (1.5%) | 1,770 (98.6%) |
| Mobile Home / Other | 2,577 (72.4%) | 984 (27.6%) |
| Total | 21,044 (60.9%) | 13,513 (39.1%) |
Housing Structures by Number of Rooms in Mendocino County
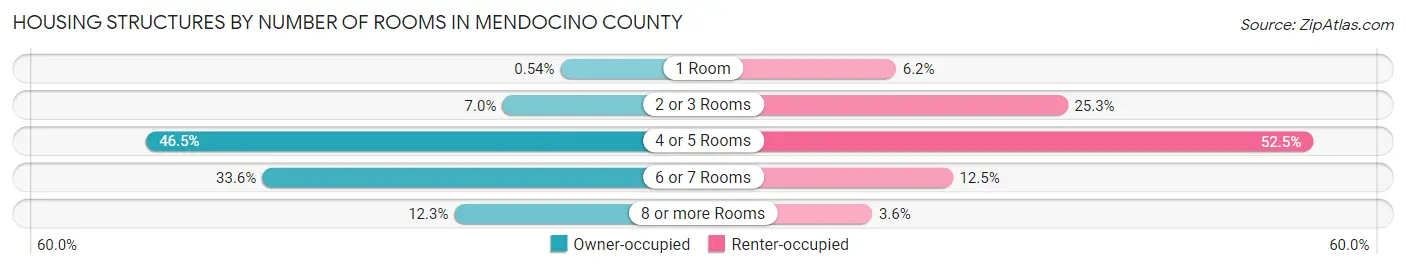
| Number of Rooms | Owner-occupied | Renter-occupied |
| 1 Room | 114 (0.5%) | 838 (6.2%) |
| 2 or 3 Rooms | 1,471 (7.0%) | 3,412 (25.3%) |
| 4 or 5 Rooms | 9,786 (46.5%) | 7,094 (52.5%) |
| 6 or 7 Rooms | 7,080 (33.6%) | 1,688 (12.5%) |
| 8 or more Rooms | 2,593 (12.3%) | 481 (3.6%) |
| Total | 21,044 (100.0%) | 13,513 (100.0%) |
Housing Structure by Heating Type in Mendocino County
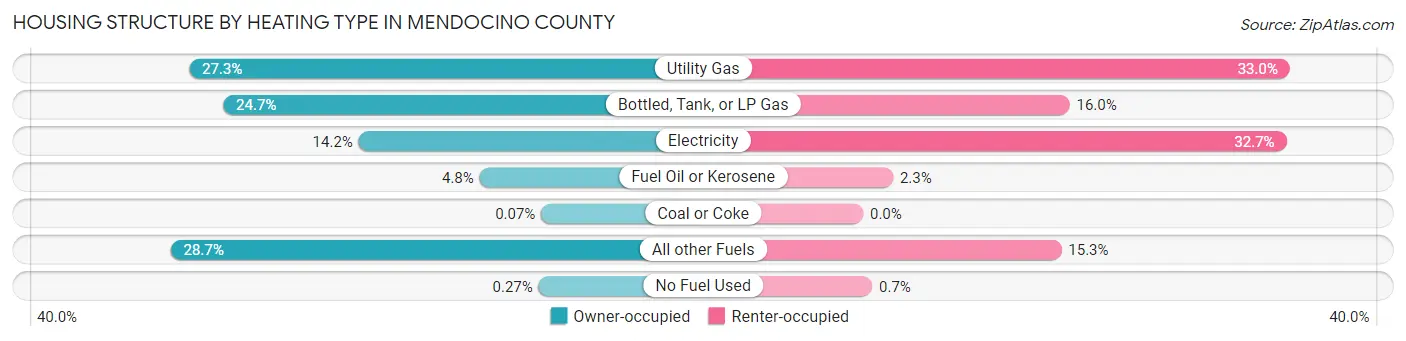
| Heating Type | Owner-occupied | Renter-occupied |
| Utility Gas | 5,742 (27.3%) | 4,457 (33.0%) |
| Bottled, Tank, or LP Gas | 5,187 (24.6%) | 2,156 (16.0%) |
| Electricity | 2,983 (14.2%) | 4,422 (32.7%) |
| Fuel Oil or Kerosene | 1,017 (4.8%) | 312 (2.3%) |
| Coal or Coke | 15 (0.1%) | 0 (0.0%) |
| All other Fuels | 6,043 (28.7%) | 2,071 (15.3%) |
| No Fuel Used | 57 (0.3%) | 95 (0.7%) |
| Total | 21,044 (100.0%) | 13,513 (100.0%) |
Household Vehicle Usage in Mendocino County
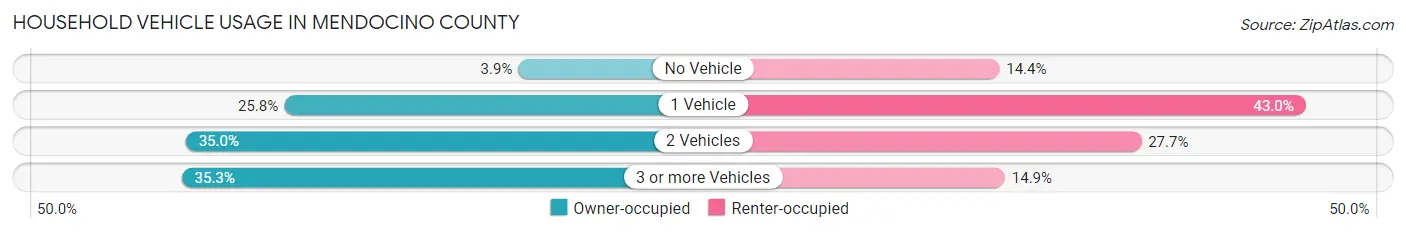
| Vehicles per Household | Owner-occupied | Renter-occupied |
| No Vehicle | 824 (3.9%) | 1,947 (14.4%) |
| 1 Vehicle | 5,426 (25.8%) | 5,810 (43.0%) |
| 2 Vehicles | 7,357 (35.0%) | 3,738 (27.7%) |
| 3 or more Vehicles | 7,437 (35.3%) | 2,018 (14.9%) |
| Total | 21,044 (100.0%) | 13,513 (100.0%) |
Real Estate & Mortgages in Mendocino County
Real Estate and Mortgage Overview in Mendocino County
| Characteristic | Without Mortgage | With Mortgage |
| Housing Units | 10,602 | 10,442 |
| Median Property Value | $436,000 | $479,600 |
| Median Household Income | $56,928 | $2,765 |
| Monthly Housing Costs | $670 | $2,368 |
| Real Estate Taxes | $2,730 | $218 |
Property Value by Mortgage Status in Mendocino County
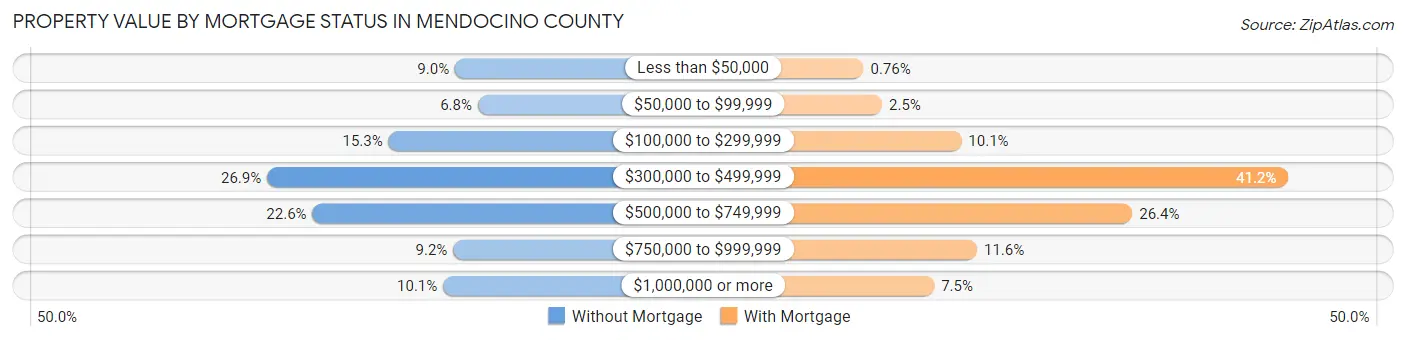
| Property Value | Without Mortgage | With Mortgage |
| Less than $50,000 | 955 (9.0%) | 79 (0.8%) |
| $50,000 to $99,999 | 725 (6.8%) | 264 (2.5%) |
| $100,000 to $299,999 | 1,626 (15.3%) | 1,053 (10.1%) |
| $300,000 to $499,999 | 2,853 (26.9%) | 4,304 (41.2%) |
| $500,000 to $749,999 | 2,395 (22.6%) | 2,752 (26.4%) |
| $750,000 to $999,999 | 973 (9.2%) | 1,208 (11.6%) |
| $1,000,000 or more | 1,075 (10.1%) | 782 (7.5%) |
| Total | 10,602 (100.0%) | 10,442 (100.0%) |
Household Income by Mortgage Status in Mendocino County
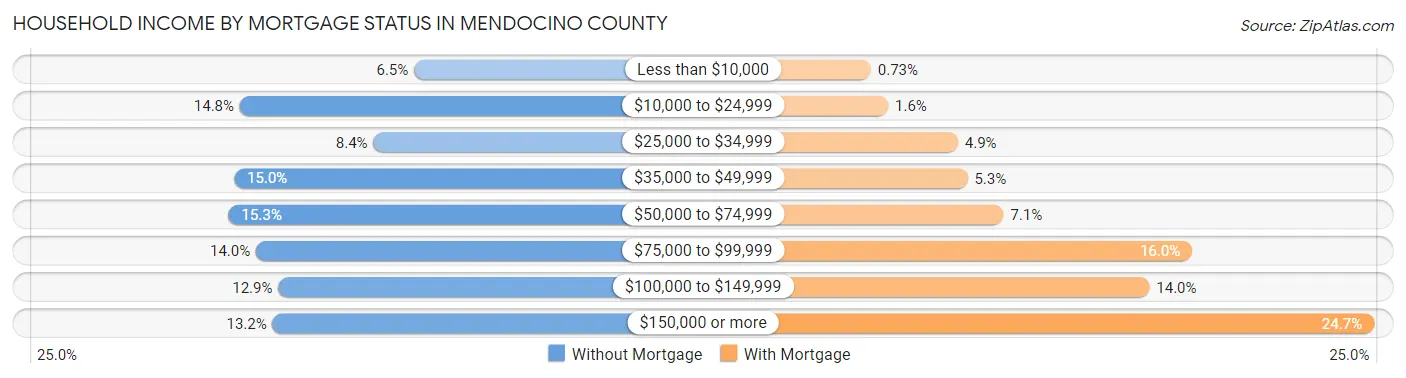
| Household Income | Without Mortgage | With Mortgage |
| Less than $10,000 | 684 (6.5%) | 76 (0.7%) |
| $10,000 to $24,999 | 1,564 (14.7%) | 162 (1.5%) |
| $25,000 to $34,999 | 890 (8.4%) | 509 (4.9%) |
| $35,000 to $49,999 | 1,593 (15.0%) | 557 (5.3%) |
| $50,000 to $74,999 | 1,621 (15.3%) | 736 (7.0%) |
| $75,000 to $99,999 | 1,482 (14.0%) | 1,674 (16.0%) |
| $100,000 to $149,999 | 1,370 (12.9%) | 1,461 (14.0%) |
| $150,000 or more | 1,398 (13.2%) | 2,578 (24.7%) |
| Total | 10,602 (100.0%) | 10,442 (100.0%) |
Property Value to Household Income Ratio in Mendocino County

| Value-to-Income Ratio | Without Mortgage | With Mortgage |
| Less than 2.0x | 1,947 (18.4%) | 103,576 (991.9%) |
| 2.0x to 2.9x | 817 (7.7%) | 1,258 (12.0%) |
| 3.0x to 3.9x | 851 (8.0%) | 1,455 (13.9%) |
| 4.0x or more | 6,701 (63.2%) | 1,527 (14.6%) |
| Total | 10,602 (100.0%) | 10,442 (100.0%) |
Real Estate Taxes by Mortgage Status in Mendocino County
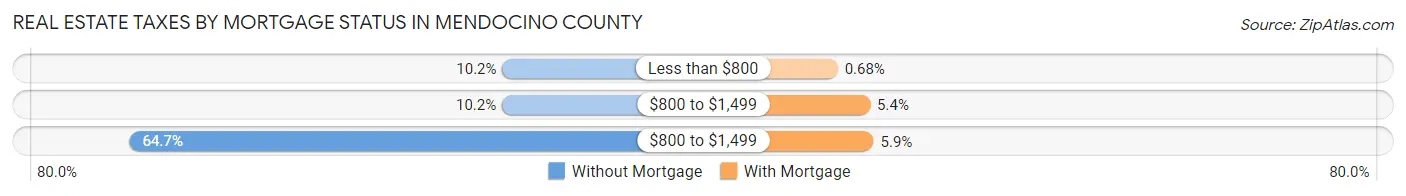
| Property Taxes | Without Mortgage | With Mortgage |
| Less than $800 | 1,080 (10.2%) | 71 (0.7%) |
| $800 to $1,499 | 1,086 (10.2%) | 566 (5.4%) |
| $800 to $1,499 | 6,856 (64.7%) | 619 (5.9%) |
| Total | 10,602 (100.0%) | 10,442 (100.0%) |
Health & Disability in Mendocino County
Health Insurance Coverage by Age in Mendocino County
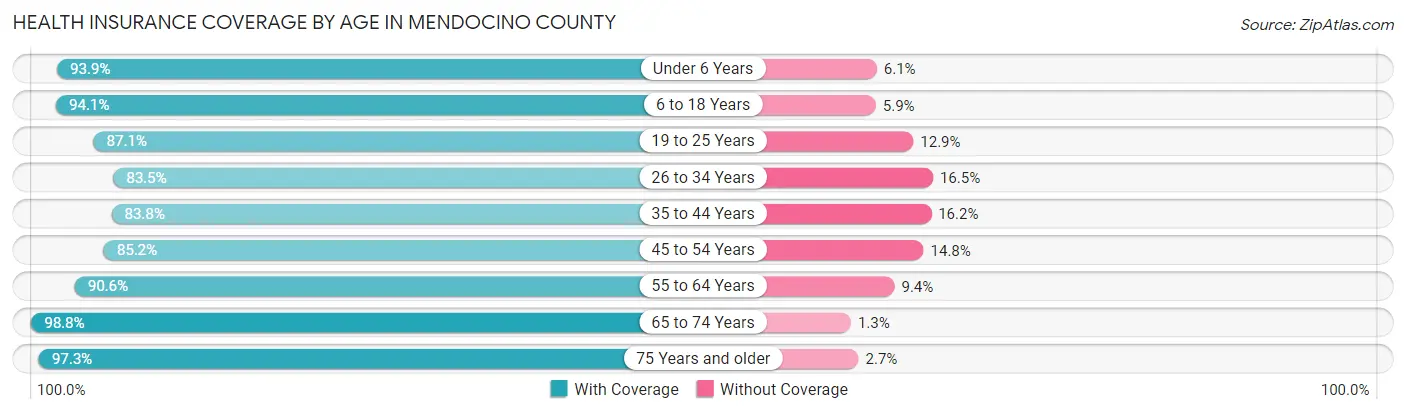
| Age Bracket | With Coverage | Without Coverage |
| Under 6 Years | 5,542 (93.9%) | 358 (6.1%) |
| 6 to 18 Years | 13,533 (94.1%) | 846 (5.9%) |
| 19 to 25 Years | 6,286 (87.1%) | 929 (12.9%) |
| 26 to 34 Years | 6,787 (83.5%) | 1,345 (16.5%) |
| 35 to 44 Years | 9,032 (83.8%) | 1,747 (16.2%) |
| 45 to 54 Years | 8,877 (85.2%) | 1,541 (14.8%) |
| 55 to 64 Years | 11,452 (90.6%) | 1,184 (9.4%) |
| 65 to 74 Years | 13,229 (98.8%) | 167 (1.3%) |
| 75 Years and older | 7,304 (97.3%) | 200 (2.7%) |
| Total | 82,042 (90.8%) | 8,317 (9.2%) |
Health Insurance Coverage by Citizenship Status in Mendocino County

| Citizenship Status | With Coverage | Without Coverage |
| Native Born | 5,542 (93.9%) | 358 (6.1%) |
| Foreign Born, Citizen | 13,533 (94.1%) | 846 (5.9%) |
| Foreign Born, not a Citizen | 6,286 (87.1%) | 929 (12.9%) |
Health Insurance Coverage by Household Income in Mendocino County

| Household Income | With Coverage | Without Coverage |
| Under $25,000 | 10,426 (91.8%) | 925 (8.2%) |
| $25,000 to $49,999 | 15,108 (89.0%) | 1,874 (11.0%) |
| $50,000 to $74,999 | 14,600 (88.9%) | 1,817 (11.1%) |
| $75,000 to $99,999 | 10,584 (87.4%) | 1,521 (12.6%) |
| $100,000 and over | 29,804 (93.7%) | 1,999 (6.3%) |
Public vs Private Health Insurance Coverage by Age in Mendocino County
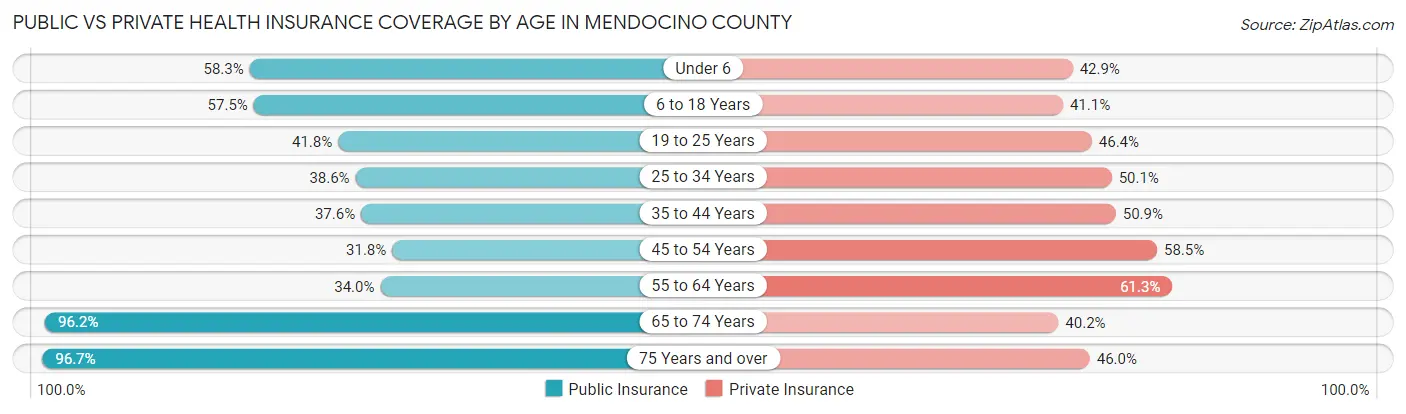
| Age Bracket | Public Insurance | Private Insurance |
| Under 6 | 3,437 (58.3%) | 2,529 (42.9%) |
| 6 to 18 Years | 8,265 (57.5%) | 5,904 (41.1%) |
| 19 to 25 Years | 3,017 (41.8%) | 3,349 (46.4%) |
| 25 to 34 Years | 3,138 (38.6%) | 4,074 (50.1%) |
| 35 to 44 Years | 4,049 (37.6%) | 5,482 (50.9%) |
| 45 to 54 Years | 3,311 (31.8%) | 6,096 (58.5%) |
| 55 to 64 Years | 4,293 (34.0%) | 7,750 (61.3%) |
| 65 to 74 Years | 12,886 (96.2%) | 5,387 (40.2%) |
| 75 Years and over | 7,256 (96.7%) | 3,454 (46.0%) |
| Total | 49,652 (54.9%) | 44,025 (48.7%) |
Disability Status by Sex by Age in Mendocino County
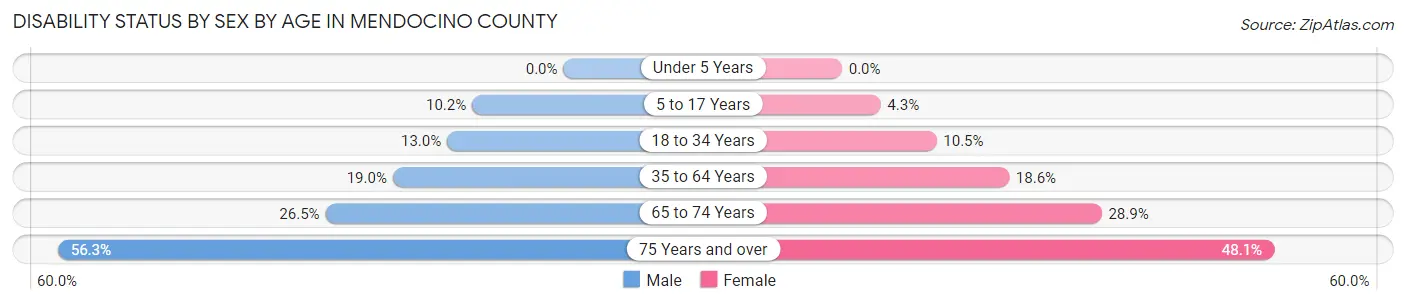
| Age Bracket | Male | Female |
| Under 5 Years | 0 (0.0%) | 0 (0.0%) |
| 5 to 17 Years | 735 (10.2%) | 304 (4.3%) |
| 18 to 34 Years | 1,076 (13.0%) | 851 (10.5%) |
| 35 to 64 Years | 3,192 (19.0%) | 3,169 (18.6%) |
| 65 to 74 Years | 1,708 (26.5%) | 2,010 (28.9%) |
| 75 Years and over | 1,895 (56.3%) | 1,991 (48.1%) |
Disability Class by Sex by Age in Mendocino County
Disability Class: Hearing Difficulty
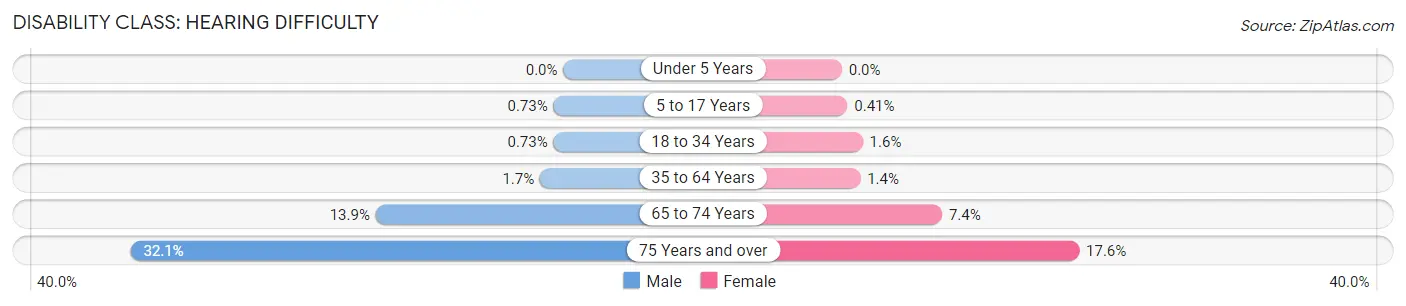
| Age Bracket | Male | Female |
| Under 5 Years | 0 (0.0%) | 0 (0.0%) |
| 5 to 17 Years | 53 (0.7%) | 29 (0.4%) |
| 18 to 34 Years | 61 (0.7%) | 125 (1.5%) |
| 35 to 64 Years | 290 (1.7%) | 234 (1.4%) |
| 65 to 74 Years | 898 (13.9%) | 517 (7.4%) |
| 75 Years and over | 1,082 (32.1%) | 729 (17.6%) |
Disability Class: Vision Difficulty
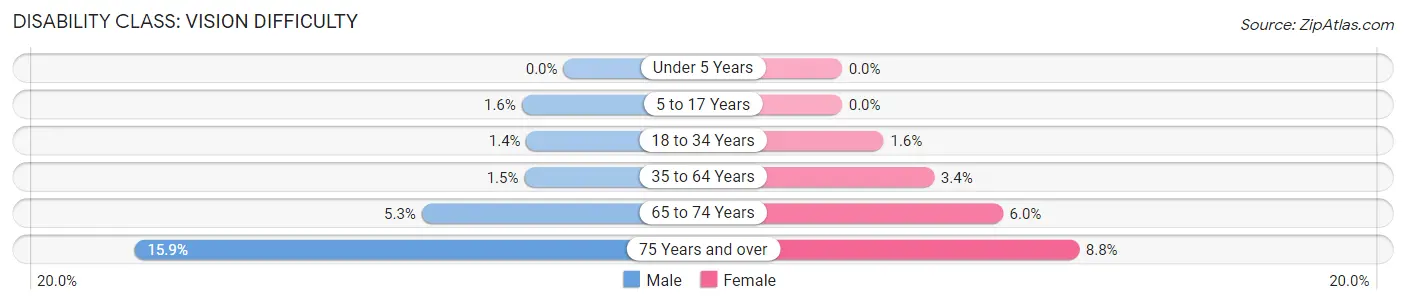
| Age Bracket | Male | Female |
| Under 5 Years | 0 (0.0%) | 0 (0.0%) |
| 5 to 17 Years | 112 (1.5%) | 0 (0.0%) |
| 18 to 34 Years | 114 (1.4%) | 125 (1.5%) |
| 35 to 64 Years | 243 (1.5%) | 583 (3.4%) |
| 65 to 74 Years | 339 (5.3%) | 415 (6.0%) |
| 75 Years and over | 536 (15.9%) | 364 (8.8%) |
Disability Class: Cognitive Difficulty
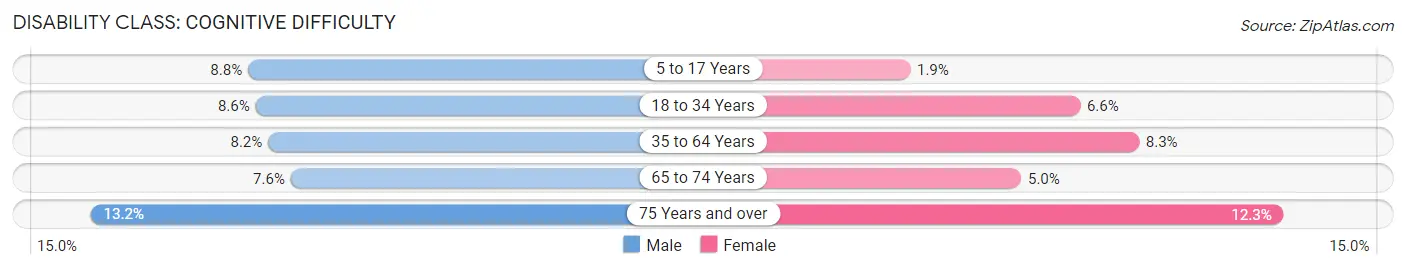
| Age Bracket | Male | Female |
| 5 to 17 Years | 635 (8.8%) | 134 (1.9%) |
| 18 to 34 Years | 712 (8.6%) | 536 (6.6%) |
| 35 to 64 Years | 1,381 (8.2%) | 1,409 (8.3%) |
| 65 to 74 Years | 489 (7.6%) | 347 (5.0%) |
| 75 Years and over | 443 (13.2%) | 509 (12.3%) |
Disability Class: Ambulatory Difficulty
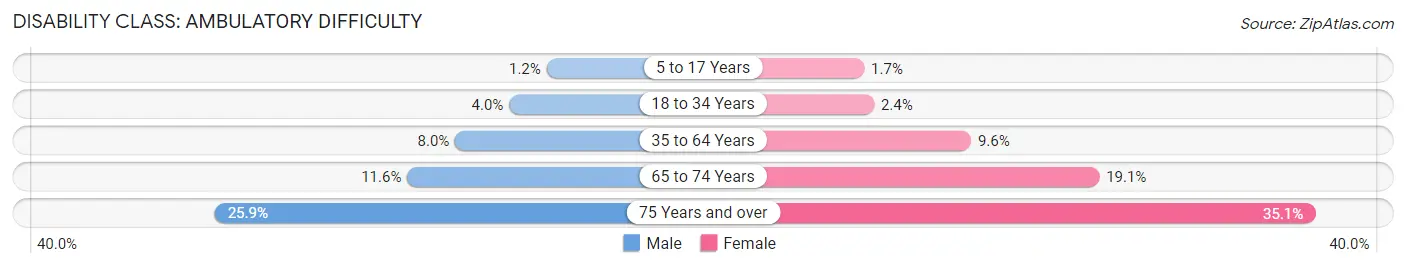
| Age Bracket | Male | Female |
| 5 to 17 Years | 90 (1.2%) | 117 (1.7%) |
| 18 to 34 Years | 334 (4.0%) | 193 (2.4%) |
| 35 to 64 Years | 1,349 (8.0%) | 1,633 (9.6%) |
| 65 to 74 Years | 747 (11.6%) | 1,328 (19.1%) |
| 75 Years and over | 871 (25.9%) | 1,454 (35.1%) |
Disability Class: Self-Care Difficulty
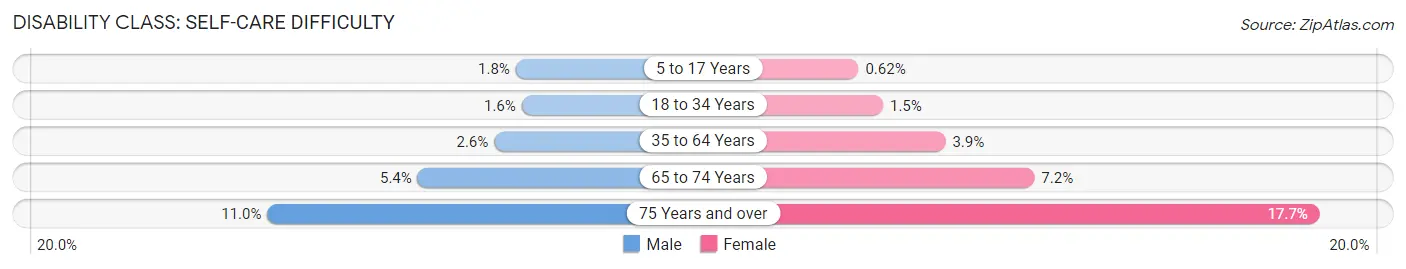
| Age Bracket | Male | Female |
| 5 to 17 Years | 128 (1.8%) | 44 (0.6%) |
| 18 to 34 Years | 129 (1.5%) | 124 (1.5%) |
| 35 to 64 Years | 432 (2.6%) | 656 (3.8%) |
| 65 to 74 Years | 349 (5.4%) | 497 (7.1%) |
| 75 Years and over | 370 (11.0%) | 734 (17.7%) |
Technology Access in Mendocino County
Computing Device Access in Mendocino County
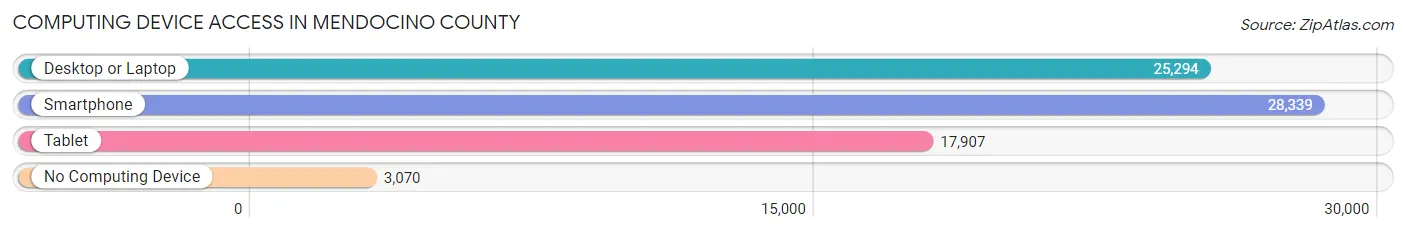
| Device Type | # Households | % Households |
| Desktop or Laptop | 25,294 | 73.2% |
| Smartphone | 28,339 | 82.0% |
| Tablet | 17,907 | 51.8% |
| No Computing Device | 3,070 | 8.9% |
| Total | 34,557 | 100.0% |
Internet Access in Mendocino County
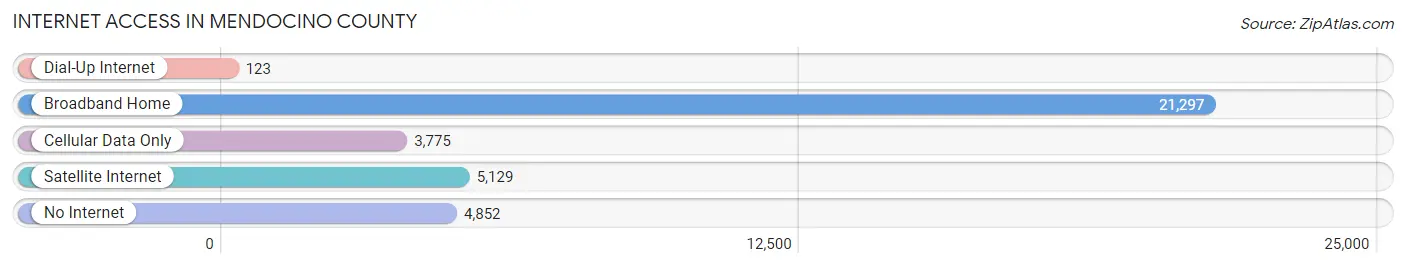
| Internet Type | # Households | % Households |
| Dial-Up Internet | 123 | 0.4% |
| Broadband Home | 21,297 | 61.6% |
| Cellular Data Only | 3,775 | 10.9% |
| Satellite Internet | 5,129 | 14.8% |
| No Internet | 4,852 | 14.0% |
| Total | 34,557 | 100.0% |
Mendocino County Summary
Mendocino County is located in the northern part of California, along the Pacific Coast. It is bordered by Sonoma County to the south, Lake County to the east, and Humboldt County to the north. The county seat is Ukiah, and the largest city is Fort Bragg. The population of Mendocino County was 88,943 in the year 2000, according to the U.S. Census Bureau.
History
The first inhabitants of Mendocino County were Native Americans, including the Pomo, Wappo, and Yuki tribes. The first Europeans to explore the area were Spanish explorers in the late 1700s. In 1821, Mexico gained independence from Spain and the area became part of Mexico. In 1846, the United States annexed the area and it became part of California.
Mendocino County was created in 1850, and was one of the original 27 counties in California. The county was named after Cape Mendocino, which was named by Spanish explorer Sebastián Vizcaíno in 1603. The county seat was originally located in Ukiah, but was moved to Mendocino in 1859. In 1874, the county seat was moved back to Ukiah.
Geography
Mendocino County covers an area of 3,878 square miles, making it the third-largest county in California. The terrain is mostly mountainous, with the highest point being the 4,094-foot Mount Sanhedrin. The county is home to several rivers, including the Eel, Russian, and Navarro. The climate is generally mild, with cool, wet winters and warm, dry summers.
Economy
The economy of Mendocino County is largely based on agriculture and tourism. The county is home to several wineries, and is known for its production of wine grapes, apples, pears, and other fruits and vegetables. The timber industry is also important to the economy, with the county producing redwood, Douglas fir, and other types of lumber.
Tourism is a major industry in Mendocino County, with visitors coming to enjoy the area’s beaches, redwood forests, and other natural attractions. The county is also home to several state parks, including Mendocino Headlands State Park and Jug Handle State Natural Reserve.
Demographics
As of the 2000 U.S. Census, the population of Mendocino County was 88,943. The racial makeup of the county was 79.2% White, 0.7% African American, 3.3% Native American, 1.2% Asian, 0.2% Pacific Islander, 11.2% from other races, and 4.2% from two or more races. Hispanic or Latino of any race were 19.2% of the population.
The median household income in Mendocino County was $37,845 in 2000, and the median family income was $45,837. The per capita income was $20,945. About 14.2% of the population was below the poverty line.
Common Questions
What is Per Capita Income in Mendocino County?
Per Capita income in Mendocino County is $34,977.
What is the Median Family Income in Mendocino County?
Median Family Income in Mendocino County is $79,466.
What is the Median Household income in Mendocino County?
Median Household Income in Mendocino County is $61,335.
What is Income or Wage Gap in Mendocino County?
Income or Wage Gap in Mendocino County is 29.3%.
Women in Mendocino County earn 70.7 cents for every dollar earned by a man.
What is Family Income Deficit in Mendocino County?
Family Income Deficit in Mendocino County is $9,855.
Families that are below poverty line in Mendocino County earn $9,855 less on average than the poverty threshold level.
What is Inequality or Gini Index in Mendocino County?
Inequality or Gini Index in Mendocino County is 0.48.
What is the Total Population of Mendocino County?
Total Population of Mendocino County is 91,145.
What is the Total Male Population of Mendocino County?
Total Male Population of Mendocino County is 45,110.
What is the Total Female Population of Mendocino County?
Total Female Population of Mendocino County is 46,035.
What is the Ratio of Males per 100 Females in Mendocino County?
There are 97.99 Males per 100 Females in Mendocino County.
What is the Ratio of Females per 100 Males in Mendocino County?
There are 102.05 Females per 100 Males in Mendocino County.
What is the Median Population Age in Mendocino County?
Median Population Age in Mendocino County is 43.7 Years.
What is the Average Family Size in Mendocino County
Average Family Size in Mendocino County is 3.3 People.
What is the Average Household Size in Mendocino County
Average Household Size in Mendocino County is 2.6 People.
How Large is the Labor Force in Mendocino County?
There are 41,932 People in the Labor Forcein in Mendocino County.
What is the Percentage of People in the Labor Force in Mendocino County?
56.5% of People are in the Labor Force in Mendocino County.
What is the Unemployment Rate in Mendocino County?
Unemployment Rate in Mendocino County is 9.1%.