Lassen County, CA Map & Demographics
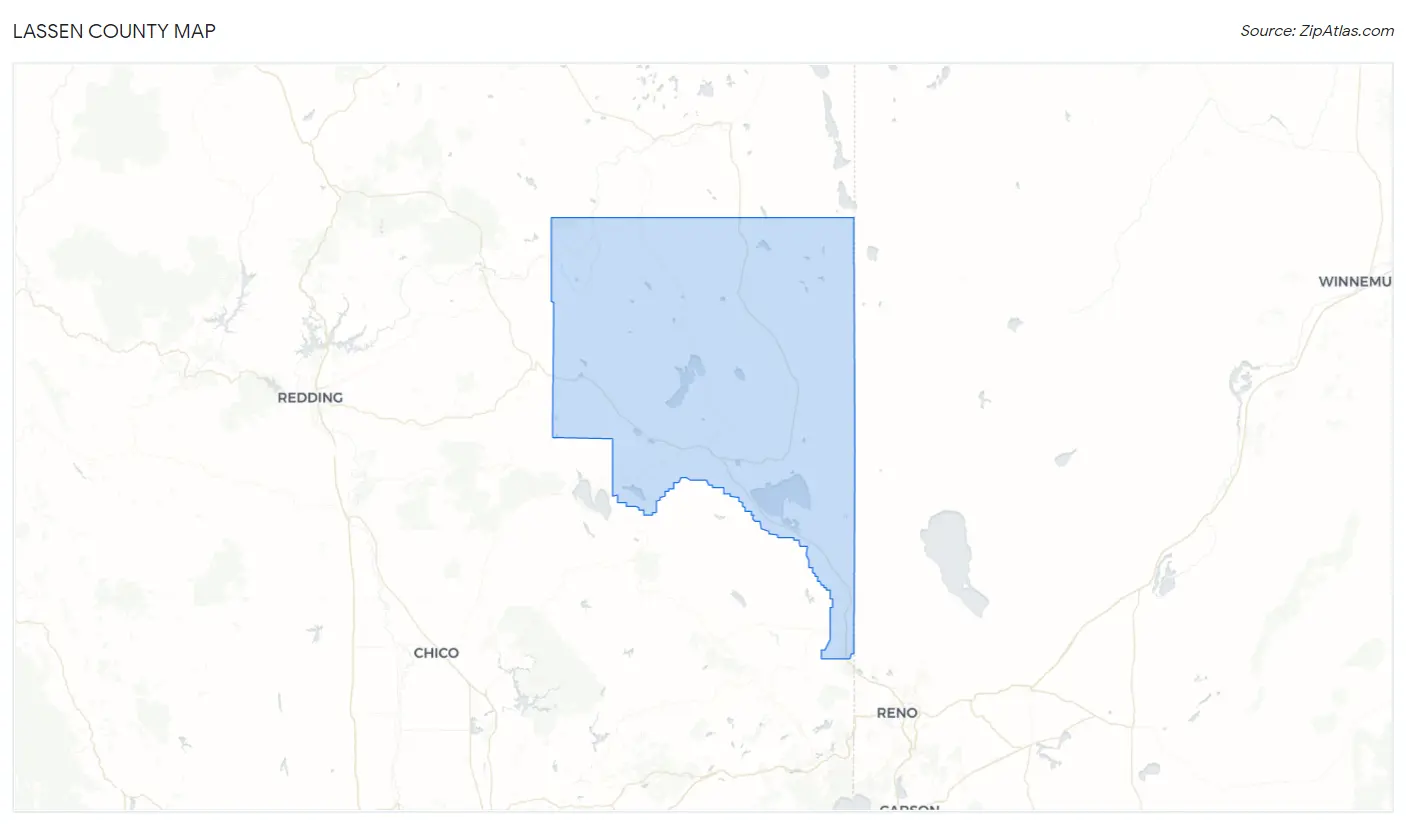
Lassen County Map
Lassen County Overview
$23,646
PER CAPITA INCOME
$69,158
AVG FAMILY INCOME
$59,515
AVG HOUSEHOLD INCOME
17.8%
WAGE / INCOME GAP [ % ]
82.2¢/ $1
WAGE / INCOME GAP [ $ ]
$9,437
FAMILY INCOME DEFICIT
0.42
INEQUALITY / GINI INDEX
31,873
TOTAL POPULATION
20,127
MALE POPULATION
11,746
FEMALE POPULATION
171.35
MALES / 100 FEMALES
58.36
FEMALES / 100 MALES
37.2
MEDIAN AGE
3.2
AVG FAMILY SIZE
2.7
AVG HOUSEHOLD SIZE
9,848
LABOR FORCE [ PEOPLE ]
36.5%
PERCENT IN LABOR FORCE
7.9%
UNEMPLOYMENT RATE
Lassen County Area Codes
Income in Lassen County
Income Overview in Lassen County
Per Capita Income in Lassen County is $23,646, while median incomes of families and households are $69,158 and $59,515 respectively.
| Characteristic | Number | Measure |
| Per Capita Income | 31,873 | $23,646 |
| Median Family Income | 5,908 | $69,158 |
| Mean Family Income | 5,908 | $86,841 |
| Median Household Income | 8,925 | $59,515 |
| Mean Household Income | 8,925 | $76,595 |
| Income Deficit | 5,908 | $9,437 |
| Wage / Income Gap (%) | 31,873 | 17.82% |
| Wage / Income Gap ($) | 31,873 | 82.18¢ per $1 |
| Gini / Inequality Index | 31,873 | 0.42 |
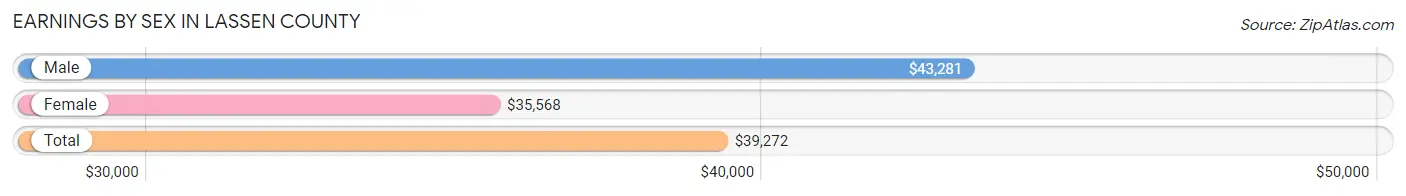
Earnings by Sex in Lassen County
Average Earnings in Lassen County are $39,272, $43,281 for men and $35,568 for women, a difference of 17.8%.
| Sex | Number | Average Earnings |
| Male | 6,028 (56.3%) | $43,281 |
| Female | 4,686 (43.7%) | $35,568 |
| Total | 10,714 (100.0%) | $39,272 |
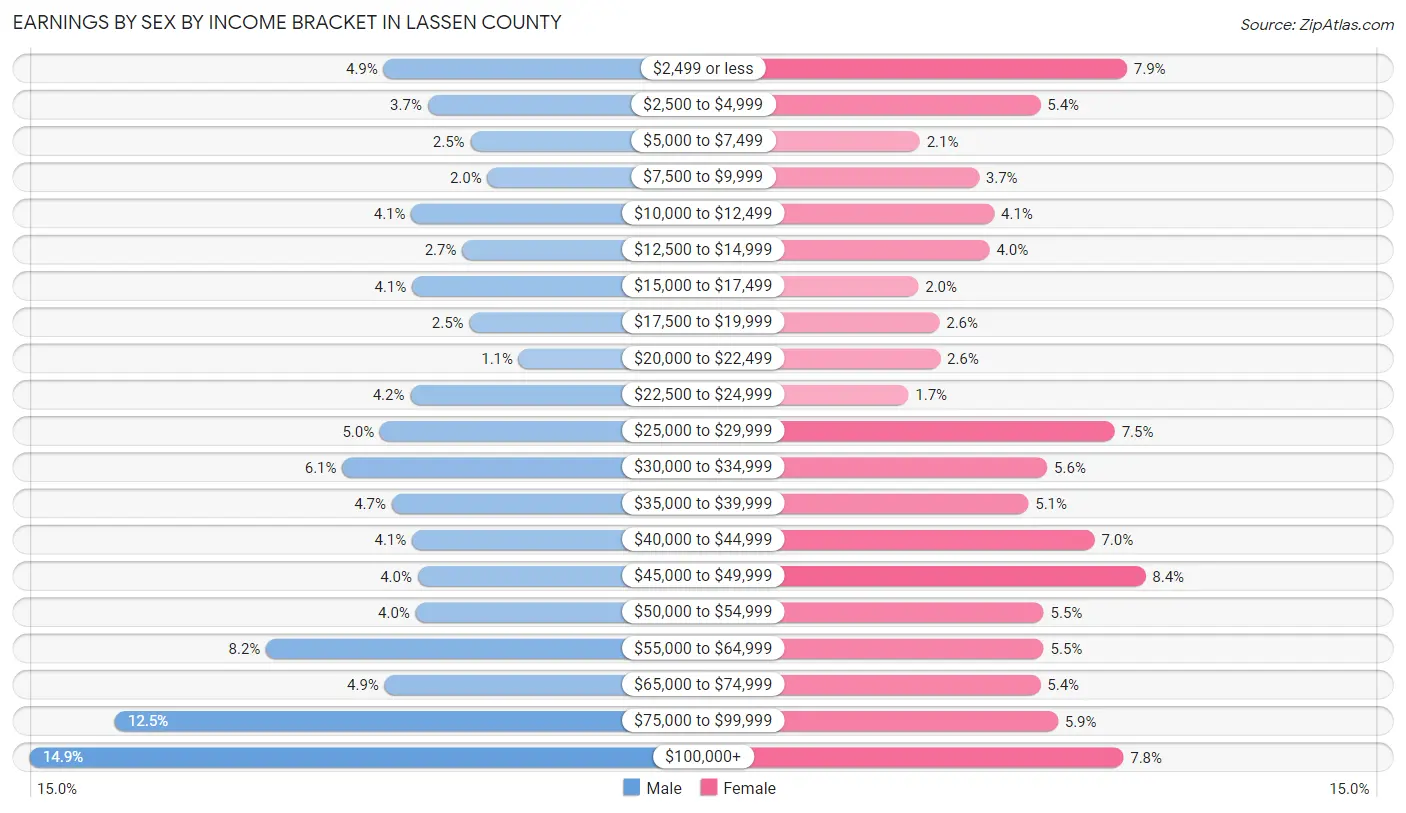
Earnings by Sex by Income Bracket in Lassen County
The most common earnings brackets in Lassen County are $100,000+ for men (895 | 14.8%) and $45,000 to $49,999 for women (393 | 8.4%).
| Income | Male | Female |
| $2,499 or less | 296 (4.9%) | 369 (7.9%) |
| $2,500 to $4,999 | 221 (3.7%) | 255 (5.4%) |
| $5,000 to $7,499 | 149 (2.5%) | 96 (2.1%) |
| $7,500 to $9,999 | 120 (2.0%) | 174 (3.7%) |
| $10,000 to $12,499 | 249 (4.1%) | 194 (4.1%) |
| $12,500 to $14,999 | 163 (2.7%) | 188 (4.0%) |
| $15,000 to $17,499 | 248 (4.1%) | 94 (2.0%) |
| $17,500 to $19,999 | 151 (2.5%) | 122 (2.6%) |
| $20,000 to $22,499 | 67 (1.1%) | 123 (2.6%) |
| $22,500 to $24,999 | 251 (4.2%) | 81 (1.7%) |
| $25,000 to $29,999 | 302 (5.0%) | 353 (7.5%) |
| $30,000 to $34,999 | 366 (6.1%) | 264 (5.6%) |
| $35,000 to $39,999 | 282 (4.7%) | 239 (5.1%) |
| $40,000 to $44,999 | 248 (4.1%) | 326 (7.0%) |
| $45,000 to $49,999 | 238 (4.0%) | 393 (8.4%) |
| $50,000 to $54,999 | 242 (4.0%) | 259 (5.5%) |
| $55,000 to $64,999 | 495 (8.2%) | 259 (5.5%) |
| $65,000 to $74,999 | 294 (4.9%) | 255 (5.4%) |
| $75,000 to $99,999 | 751 (12.5%) | 278 (5.9%) |
| $100,000+ | 895 (14.8%) | 364 (7.8%) |
| Total | 6,028 (100.0%) | 4,686 (100.0%) |
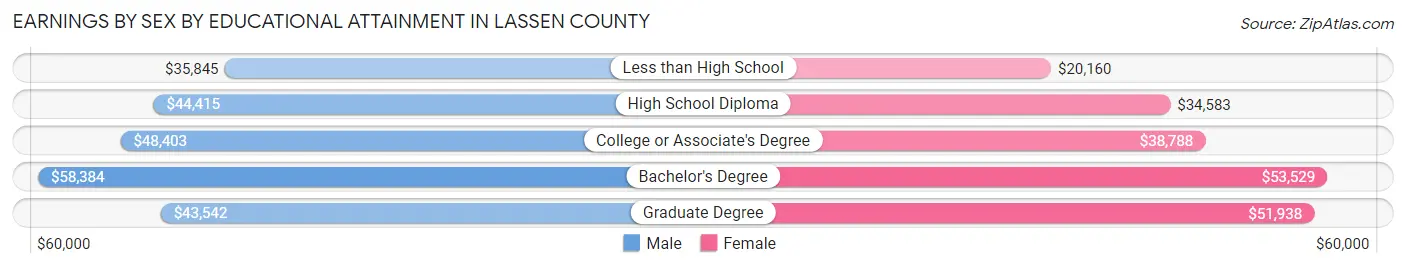
Earnings by Sex by Educational Attainment in Lassen County
Average earnings in Lassen County are $46,696 for men and $39,832 for women, a difference of 14.7%. Men with an educational attainment of bachelor's degree enjoy the highest average annual earnings of $58,384, while those with less than high school education earn the least with $35,845. Women with an educational attainment of bachelor's degree earn the most with the average annual earnings of $53,529, while those with less than high school education have the smallest earnings of $20,160.
| Educational Attainment | Male Income | Female Income |
| Less than High School | $35,845 | $20,160 |
| High School Diploma | $44,415 | $34,583 |
| College or Associate's Degree | $48,403 | $38,788 |
| Bachelor's Degree | $58,384 | $53,529 |
| Graduate Degree | $43,542 | $51,938 |
| Total | $46,696 | $39,832 |
Family Income in Lassen County
Family Income Brackets in Lassen County
According to the Lassen County family income data, there are 1,211 families falling into the $50,000 to $74,999 income range, which is the most common income bracket and makes up 20.5% of all families. Conversely, the $10,000 to $14,999 income bracket is the least frequent group with only 71 families (1.2%) belonging to this category.
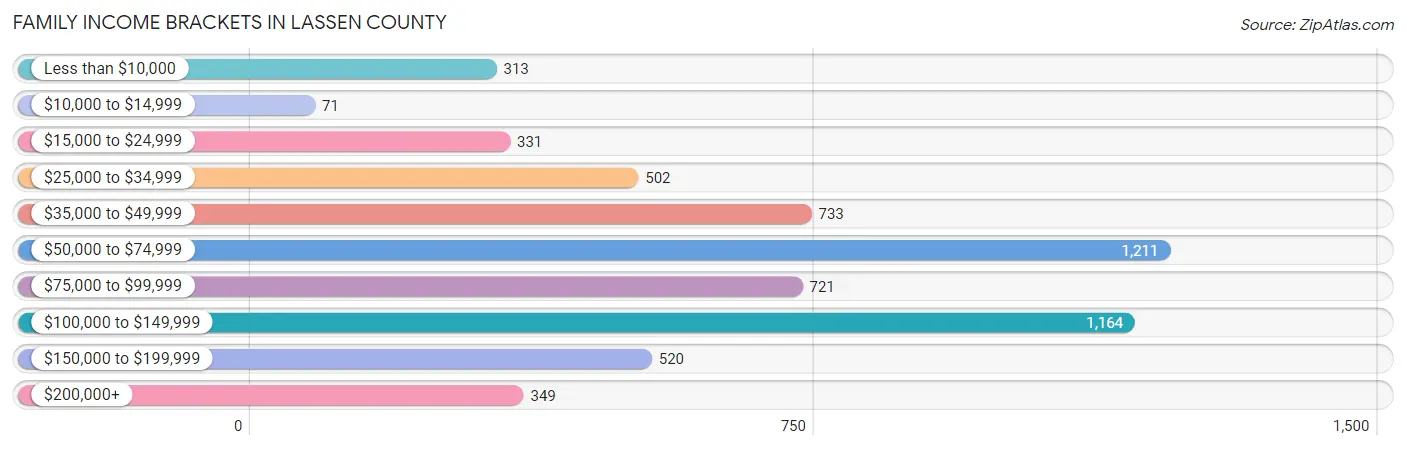
| Income Bracket | # Families | % Families |
| Less than $10,000 | 313 | 5.3% |
| $10,000 to $14,999 | 71 | 1.2% |
| $15,000 to $24,999 | 331 | 5.6% |
| $25,000 to $34,999 | 502 | 8.5% |
| $35,000 to $49,999 | 733 | 12.4% |
| $50,000 to $74,999 | 1,211 | 20.5% |
| $75,000 to $99,999 | 721 | 12.2% |
| $100,000 to $149,999 | 1,164 | 19.7% |
| $150,000 to $199,999 | 520 | 8.8% |
| $200,000+ | 349 | 5.9% |
Family Income by Famaliy Size in Lassen County
7+ person families (118 | 2.0%) account for the highest median family income in Lassen County with $130,333 per family, while 2-person families (3,457 | 58.5%) have the highest median income of $31,576 per family member.
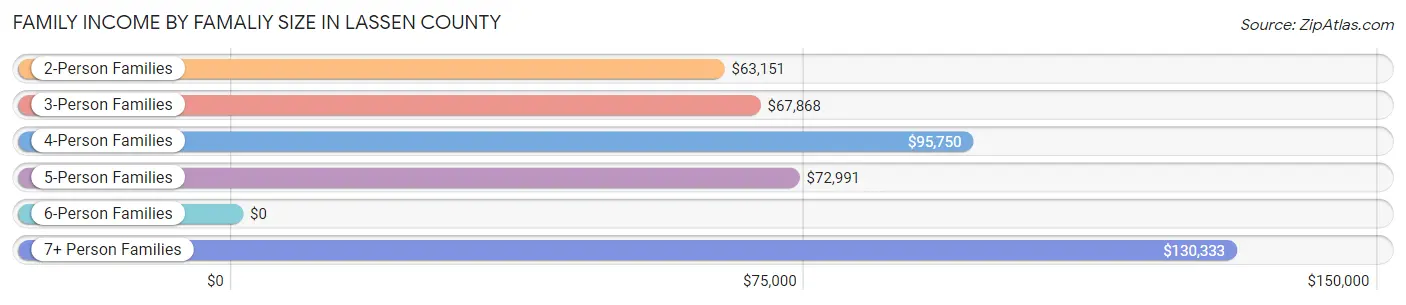
| Income Bracket | # Families | Median Income |
| 2-Person Families | 3,457 (58.5%) | $63,151 |
| 3-Person Families | 1,091 (18.5%) | $67,868 |
| 4-Person Families | 632 (10.7%) | $95,750 |
| 5-Person Families | 475 (8.0%) | $72,991 |
| 6-Person Families | 135 (2.3%) | $0 |
| 7+ Person Families | 118 (2.0%) | $130,333 |
| Total | 5,908 (100.0%) | $69,158 |
Family Income by Number of Earners in Lassen County
The median family income in Lassen County is $69,158, with families comprising 3+ earners (249) having the highest median family income of $175,046, while families with no earners (1,361) have the lowest median family income of $45,568, accounting for 4.2% and 23.0% of families, respectively.
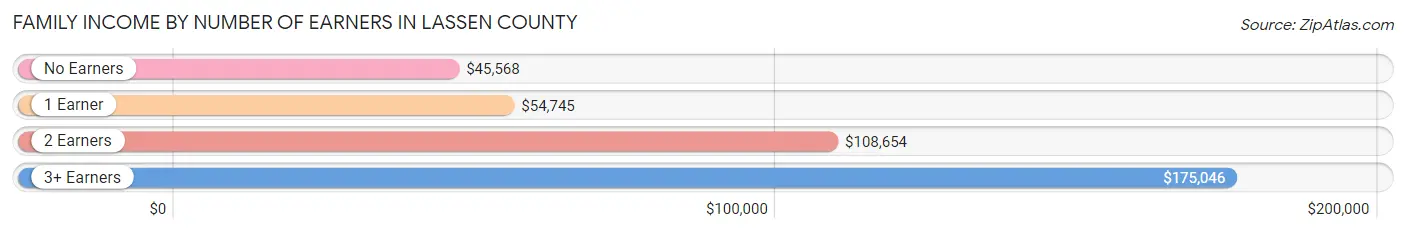
| Number of Earners | # Families | Median Income |
| No Earners | 1,361 (23.0%) | $45,568 |
| 1 Earner | 2,490 (42.1%) | $54,745 |
| 2 Earners | 1,808 (30.6%) | $108,654 |
| 3+ Earners | 249 (4.2%) | $175,046 |
| Total | 5,908 (100.0%) | $69,158 |
Household Income in Lassen County
Household Income Brackets in Lassen County
With 1,598 households falling in the category, the $50,000 to $74,999 income range is the most frequent in Lassen County, accounting for 17.9% of all households. In contrast, only 259 households (2.9%) fall into the $10,000 to $14,999 income bracket, making it the least populous group.
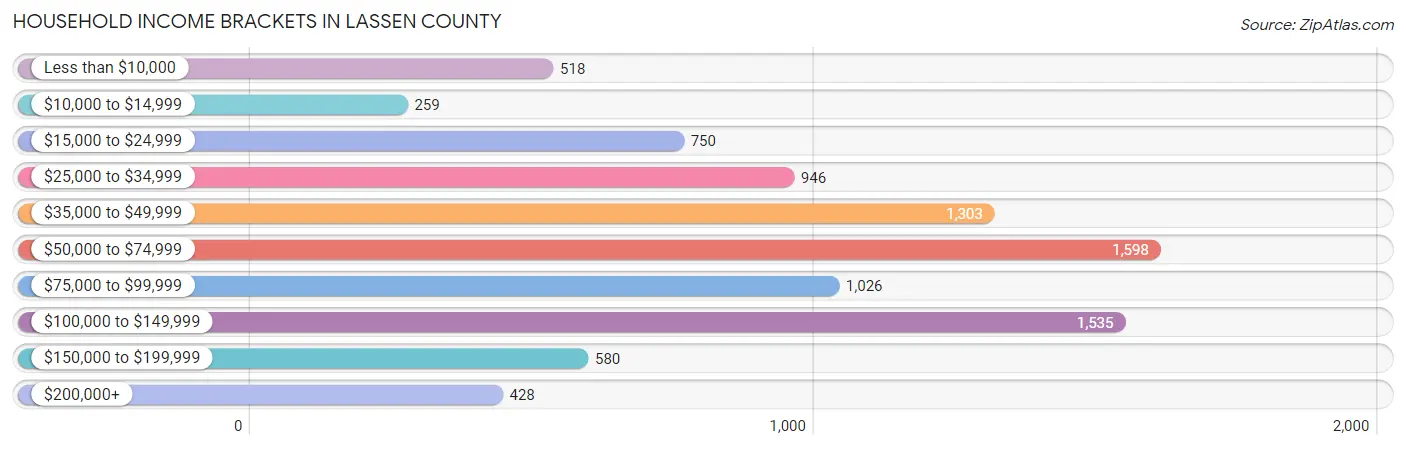
| Income Bracket | # Households | % Households |
| Less than $10,000 | 518 | 5.8% |
| $10,000 to $14,999 | 259 | 2.9% |
| $15,000 to $24,999 | 750 | 8.4% |
| $25,000 to $34,999 | 946 | 10.6% |
| $35,000 to $49,999 | 1,303 | 14.6% |
| $50,000 to $74,999 | 1,598 | 17.9% |
| $75,000 to $99,999 | 1,026 | 11.5% |
| $100,000 to $149,999 | 1,535 | 17.2% |
| $150,000 to $199,999 | 580 | 6.5% |
| $200,000+ | 428 | 4.8% |
Household Income by Householder Age in Lassen County
The median household income in Lassen County is $59,515, with the highest median household income of $80,625 found in the 25 to 44 years age bracket for the primary householder. A total of 2,378 households (26.6%) fall into this category. Meanwhile, the 15 to 24 years age bracket for the primary householder has the lowest median household income of $32,123, with 216 households (2.4%) in this group.
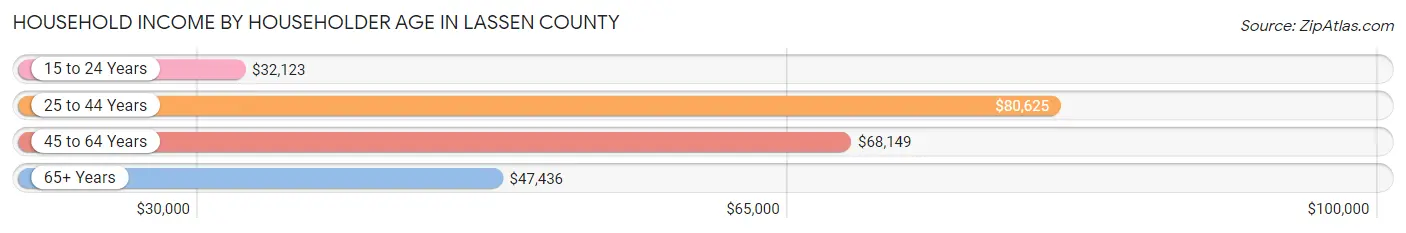
| Income Bracket | # Households | Median Income |
| 15 to 24 Years | 216 (2.4%) | $32,123 |
| 25 to 44 Years | 2,378 (26.6%) | $80,625 |
| 45 to 64 Years | 3,253 (36.4%) | $68,149 |
| 65+ Years | 3,078 (34.5%) | $47,436 |
| Total | 8,925 (100.0%) | $59,515 |
Poverty in Lassen County
Income Below Poverty by Sex and Age in Lassen County
With 16.1% poverty level for males and 14.3% for females among the residents of Lassen County, 18 to 24 year old males and 12 to 14 year old females are the most vulnerable to poverty, with 334 males (31.8%) and 167 females (35.5%) in their respective age groups living below the poverty level.
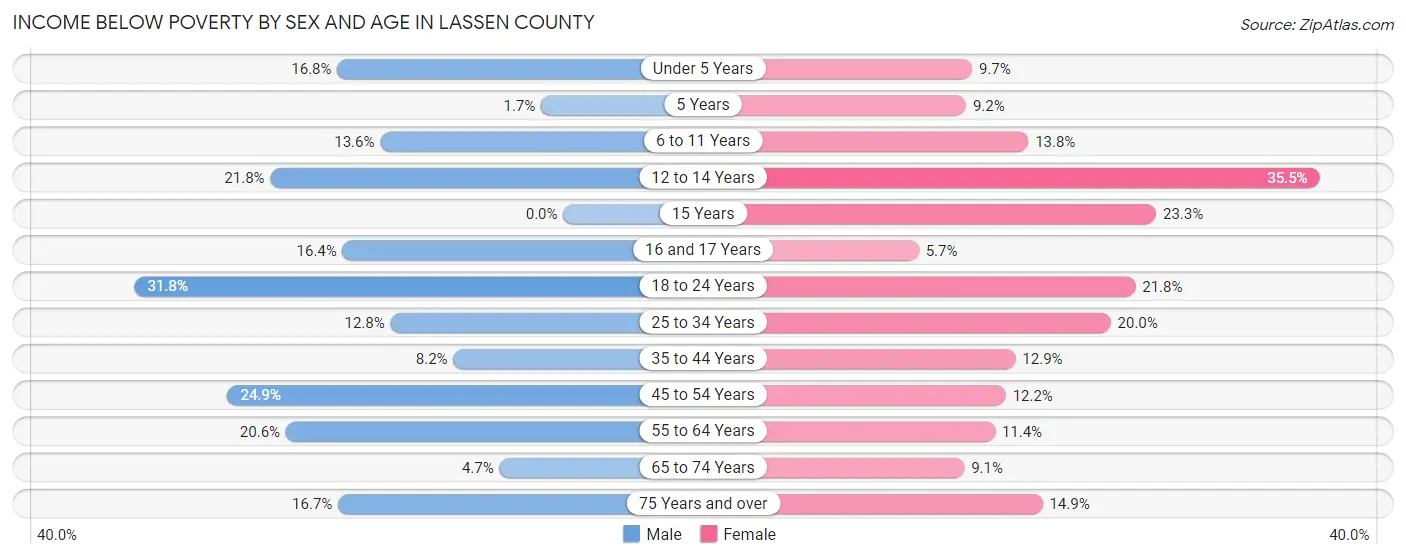
| Age Bracket | Male | Female |
| Under 5 Years | 120 (16.8%) | 74 (9.7%) |
| 5 Years | 2 (1.7%) | 13 (9.2%) |
| 6 to 11 Years | 133 (13.6%) | 115 (13.8%) |
| 12 to 14 Years | 82 (21.7%) | 167 (35.5%) |
| 15 Years | 0 (0.0%) | 28 (23.3%) |
| 16 and 17 Years | 40 (16.4%) | 18 (5.7%) |
| 18 to 24 Years | 334 (31.8%) | 144 (21.8%) |
| 25 to 34 Years | 227 (12.8%) | 281 (20.0%) |
| 35 to 44 Years | 109 (8.2%) | 183 (12.9%) |
| 45 to 54 Years | 377 (24.9%) | 172 (12.2%) |
| 55 to 64 Years | 344 (20.6%) | 186 (11.4%) |
| 65 to 74 Years | 68 (4.7%) | 126 (9.1%) |
| 75 Years and over | 147 (16.7%) | 155 (14.9%) |
| Total | 1,983 (16.1%) | 1,662 (14.3%) |
Income Above Poverty by Sex and Age in Lassen County
According to the poverty statistics in Lassen County, males aged 15 years and females aged 16 and 17 years are the age groups that are most secure financially, with 100.0% of males and 94.3% of females in these age groups living above the poverty line.
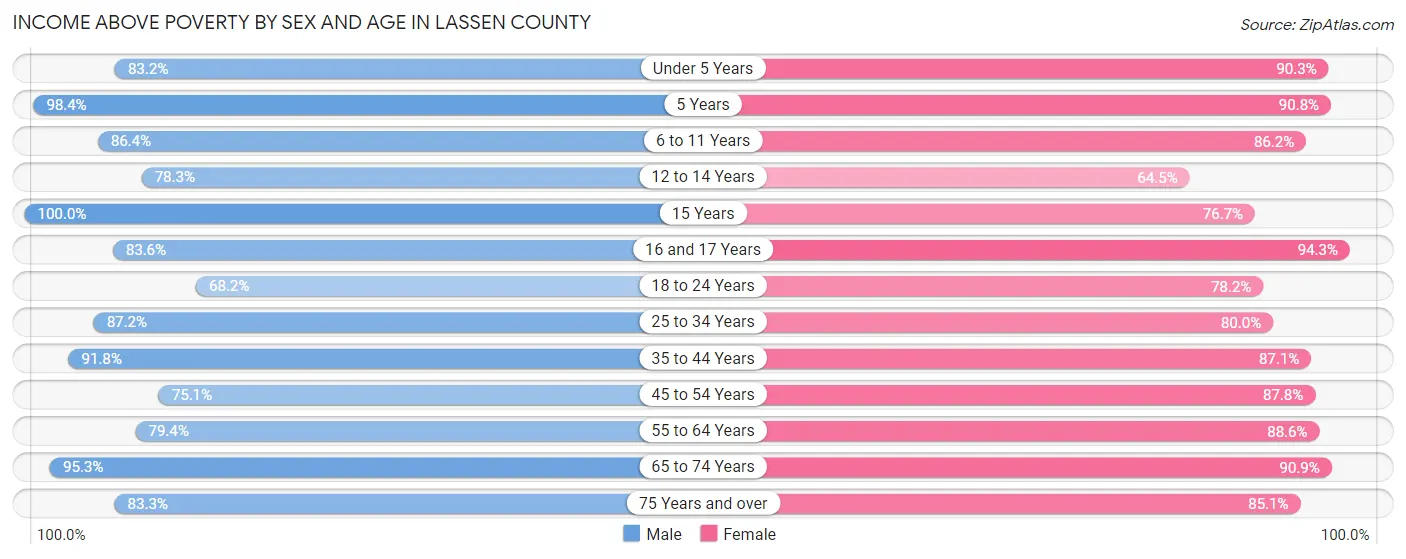
| Age Bracket | Male | Female |
| Under 5 Years | 595 (83.2%) | 691 (90.3%) |
| 5 Years | 119 (98.4%) | 128 (90.8%) |
| 6 to 11 Years | 846 (86.4%) | 716 (86.2%) |
| 12 to 14 Years | 295 (78.2%) | 304 (64.5%) |
| 15 Years | 240 (100.0%) | 92 (76.7%) |
| 16 and 17 Years | 204 (83.6%) | 297 (94.3%) |
| 18 to 24 Years | 715 (68.2%) | 517 (78.2%) |
| 25 to 34 Years | 1,542 (87.2%) | 1,127 (80.0%) |
| 35 to 44 Years | 1,226 (91.8%) | 1,237 (87.1%) |
| 45 to 54 Years | 1,135 (75.1%) | 1,241 (87.8%) |
| 55 to 64 Years | 1,326 (79.4%) | 1,450 (88.6%) |
| 65 to 74 Years | 1,366 (95.3%) | 1,260 (90.9%) |
| 75 Years and over | 732 (83.3%) | 885 (85.1%) |
| Total | 10,341 (83.9%) | 9,945 (85.7%) |
Income Below Poverty Among Married-Couple Families in Lassen County
The poverty statistics for married-couple families in Lassen County show that 7.4% or 335 of the total 4,500 families live below the poverty line. Families with 1 or 2 children have the highest poverty rate of 8.4%, comprising of 78 families. On the other hand, families with 5 or more children have the lowest poverty rate of 0.0%, which includes 0 families.
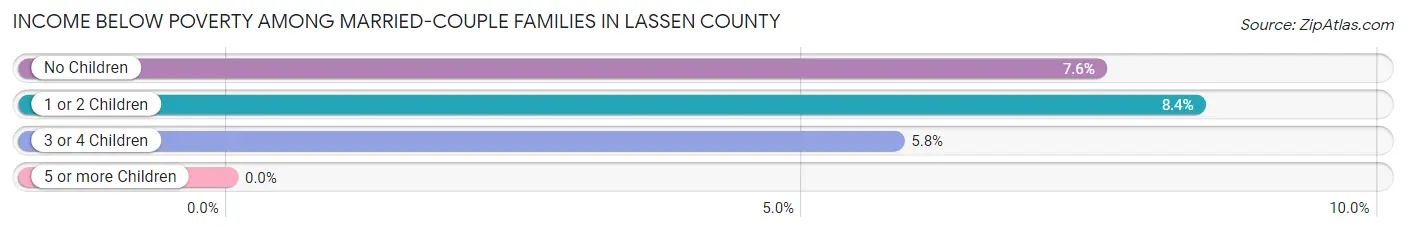
| Children | Above Poverty | Below Poverty |
| No Children | 2,800 (92.4%) | 229 (7.6%) |
| 1 or 2 Children | 848 (91.6%) | 78 (8.4%) |
| 3 or 4 Children | 455 (94.2%) | 28 (5.8%) |
| 5 or more Children | 62 (100.0%) | 0 (0.0%) |
| Total | 4,165 (92.6%) | 335 (7.4%) |
Income Below Poverty Among Single-Parent Households in Lassen County
According to the poverty data in Lassen County, 31.1% or 119 single-father households and 23.9% or 245 single-mother households are living below the poverty line. Among single-father households, those with 3 or 4 children have the highest poverty rate, with 6 households (85.7%) experiencing poverty. Likewise, among single-mother households, those with 5 or more children have the highest poverty rate, with 7 households (100.0%) falling below the poverty line.
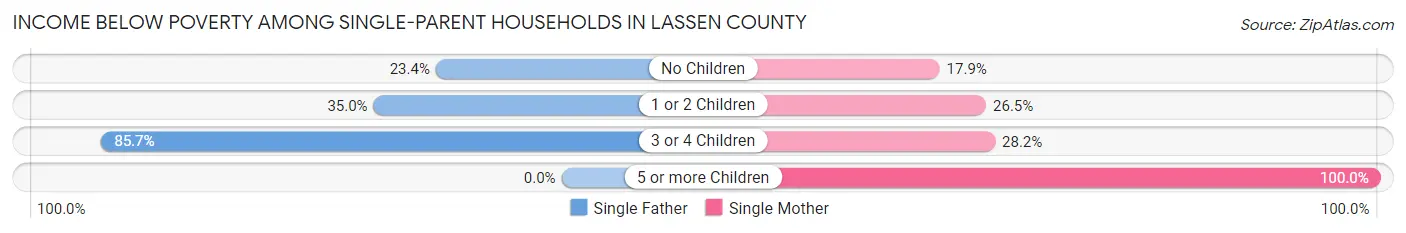
| Children | Single Father | Single Mother |
| No Children | 37 (23.4%) | 71 (17.9%) |
| 1 or 2 Children | 76 (35.0%) | 134 (26.5%) |
| 3 or 4 Children | 6 (85.7%) | 33 (28.2%) |
| 5 or more Children | 0 (0.0%) | 7 (100.0%) |
| Total | 119 (31.1%) | 245 (23.9%) |
Income Below Poverty Among Married-Couple vs Single-Parent Households in Lassen County
The poverty data for Lassen County shows that 335 of the married-couple family households (7.4%) and 364 of the single-parent households (25.9%) are living below the poverty level. Within the married-couple family households, those with 1 or 2 children have the highest poverty rate, with 78 households (8.4%) falling below the poverty line. Among the single-parent households, those with 5 or more children have the highest poverty rate, with 7 household (100.0%) living below poverty.
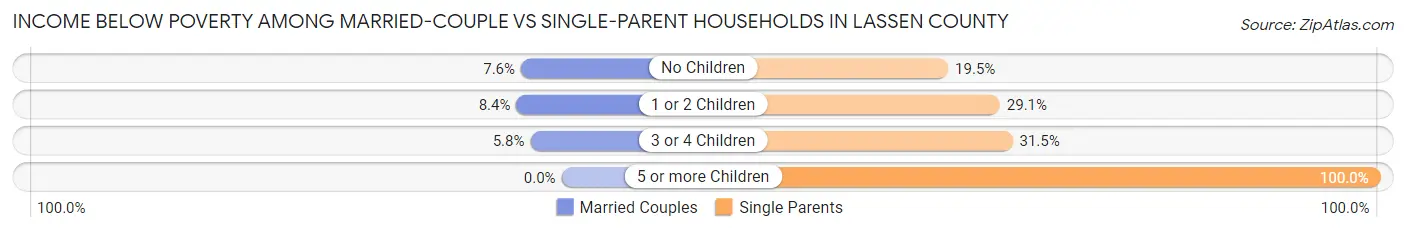
| Children | Married-Couple Families | Single-Parent Households |
| No Children | 229 (7.6%) | 108 (19.5%) |
| 1 or 2 Children | 78 (8.4%) | 210 (29.1%) |
| 3 or 4 Children | 28 (5.8%) | 39 (31.5%) |
| 5 or more Children | 0 (0.0%) | 7 (100.0%) |
| Total | 335 (7.4%) | 364 (25.9%) |
Race in Lassen County
The most populous races in Lassen County are White / Caucasian (22,816 | 71.6%), Hispanic or Latino (6,517 | 20.4%), and Two or more Races (3,857 | 12.1%).
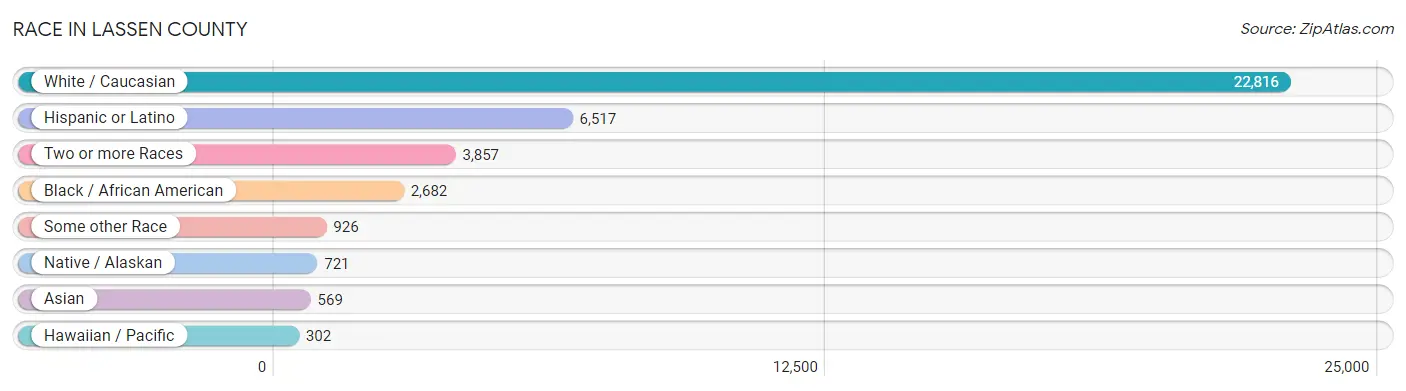
| Race | # Population | % Population |
| Asian | 569 | 1.8% |
| Black / African American | 2,682 | 8.4% |
| Hawaiian / Pacific | 302 | 0.9% |
| Hispanic or Latino | 6,517 | 20.4% |
| Native / Alaskan | 721 | 2.3% |
| White / Caucasian | 22,816 | 71.6% |
| Two or more Races | 3,857 | 12.1% |
| Some other Race | 926 | 2.9% |
| Total | 31,873 | 100.0% |
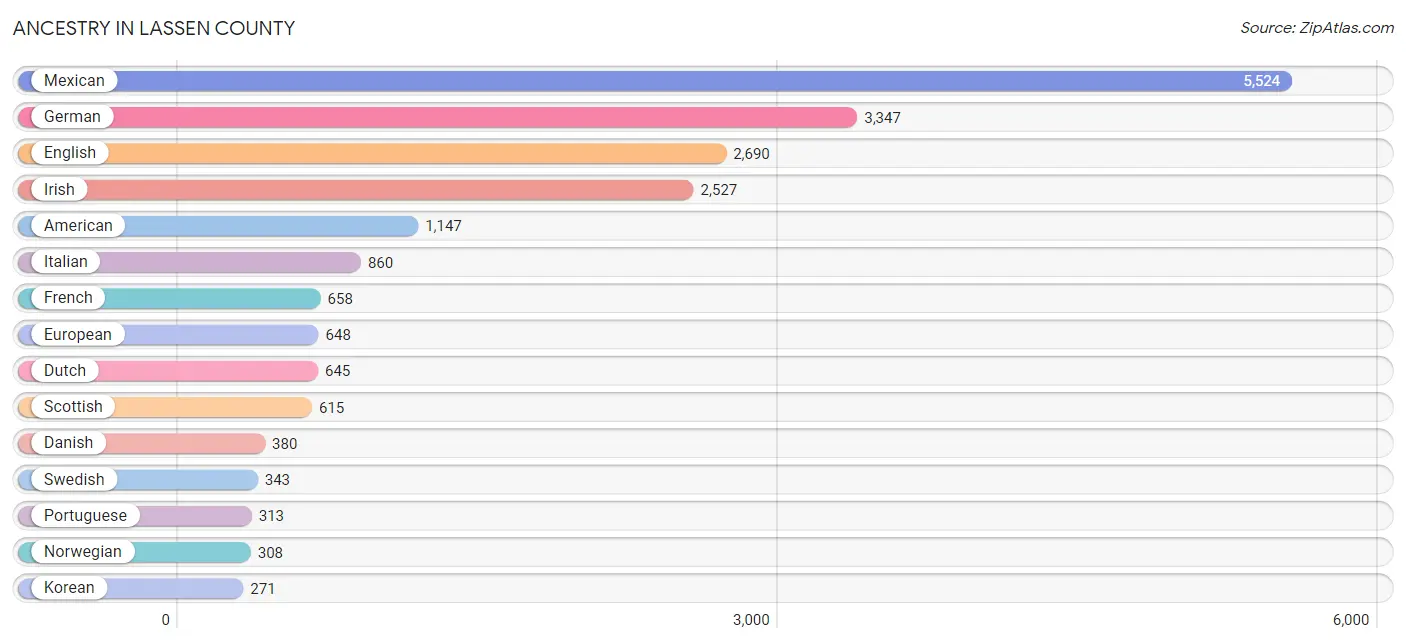
Ancestry in Lassen County
The most populous ancestries reported in Lassen County are Mexican (5,524 | 17.3%), German (3,347 | 10.5%), English (2,690 | 8.4%), Irish (2,527 | 7.9%), and American (1,147 | 3.6%), together accounting for 47.8% of all Lassen County residents.
| Ancestry | # Population | % Population |
| African | 46 | 0.1% |
| Alaska Native | 82 | 0.3% |
| American | 1,147 | 3.6% |
| Apache | 8 | 0.0% |
| Arab | 55 | 0.2% |
| Armenian | 17 | 0.1% |
| Australian | 22 | 0.1% |
| Austrian | 35 | 0.1% |
| Bangladeshi | 40 | 0.1% |
| Basque | 165 | 0.5% |
| Belgian | 18 | 0.1% |
| Bhutanese | 87 | 0.3% |
| Blackfeet | 55 | 0.2% |
| British | 125 | 0.4% |
| Burmese | 43 | 0.1% |
| Canadian | 54 | 0.2% |
| Carpatho Rusyn | 8 | 0.0% |
| Central American | 133 | 0.4% |
| Cherokee | 262 | 0.8% |
| Cheyenne | 24 | 0.1% |
| Chickasaw | 43 | 0.1% |
| Chinese | 4 | 0.0% |
| Chippewa | 5 | 0.0% |
| Choctaw | 109 | 0.3% |
| Colombian | 4 | 0.0% |
| Comanche | 3 | 0.0% |
| Costa Rican | 20 | 0.1% |
| Cree | 23 | 0.1% |
| Croatian | 3 | 0.0% |
| Czech | 23 | 0.1% |
| Czechoslovakian | 10 | 0.0% |
| Danish | 380 | 1.2% |
| Dominican | 1 | 0.0% |
| Dutch | 645 | 2.0% |
| Eastern European | 54 | 0.2% |
| English | 2,690 | 8.4% |
| European | 648 | 2.0% |
| Finnish | 53 | 0.2% |
| French | 658 | 2.1% |
| French Canadian | 49 | 0.2% |
| German | 3,347 | 10.5% |
| Greek | 5 | 0.0% |
| Guamanian / Chamorro | 22 | 0.1% |
| Guatemalan | 18 | 0.1% |
| Honduran | 3 | 0.0% |
| Hopi | 18 | 0.1% |
| Hungarian | 40 | 0.1% |
| Icelander | 36 | 0.1% |
| Indian (Asian) | 120 | 0.4% |
| Iranian | 43 | 0.1% |
| Irish | 2,527 | 7.9% |
| Iroquois | 59 | 0.2% |
| Italian | 860 | 2.7% |
| Japanese | 74 | 0.2% |
| Korean | 271 | 0.9% |
| Laotian | 18 | 0.1% |
| Latvian | 8 | 0.0% |
| Lebanese | 36 | 0.1% |
| Lithuanian | 17 | 0.1% |
| Marshallese | 163 | 0.5% |
| Mexican | 5,524 | 17.3% |
| Native Hawaiian | 31 | 0.1% |
| Navajo | 24 | 0.1% |
| Nepalese | 32 | 0.1% |
| Nicaraguan | 51 | 0.2% |
| Nigerian | 5 | 0.0% |
| Northern European | 35 | 0.1% |
| Norwegian | 308 | 1.0% |
| Paiute | 186 | 0.6% |
| Peruvian | 9 | 0.0% |
| Pima | 7 | 0.0% |
| Polish | 217 | 0.7% |
| Portuguese | 313 | 1.0% |
| Puerto Rican | 81 | 0.3% |
| Puget Sound Salish | 4 | 0.0% |
| Romanian | 11 | 0.0% |
| Russian | 68 | 0.2% |
| Salvadoran | 41 | 0.1% |
| Samoan | 8 | 0.0% |
| Scandinavian | 163 | 0.5% |
| Scotch-Irish | 194 | 0.6% |
| Scottish | 615 | 1.9% |
| Serbian | 11 | 0.0% |
| Sioux | 42 | 0.1% |
| Slovene | 44 | 0.1% |
| South American | 13 | 0.0% |
| Spaniard | 121 | 0.4% |
| Spanish | 105 | 0.3% |
| Sri Lankan | 47 | 0.2% |
| Subsaharan African | 63 | 0.2% |
| Swedish | 343 | 1.1% |
| Swiss | 149 | 0.5% |
| Syrian | 19 | 0.1% |
| Thai | 8 | 0.0% |
| Ukrainian | 4 | 0.0% |
| Welsh | 242 | 0.8% |
| Yaqui | 24 | 0.1% | View All 97 Rows |
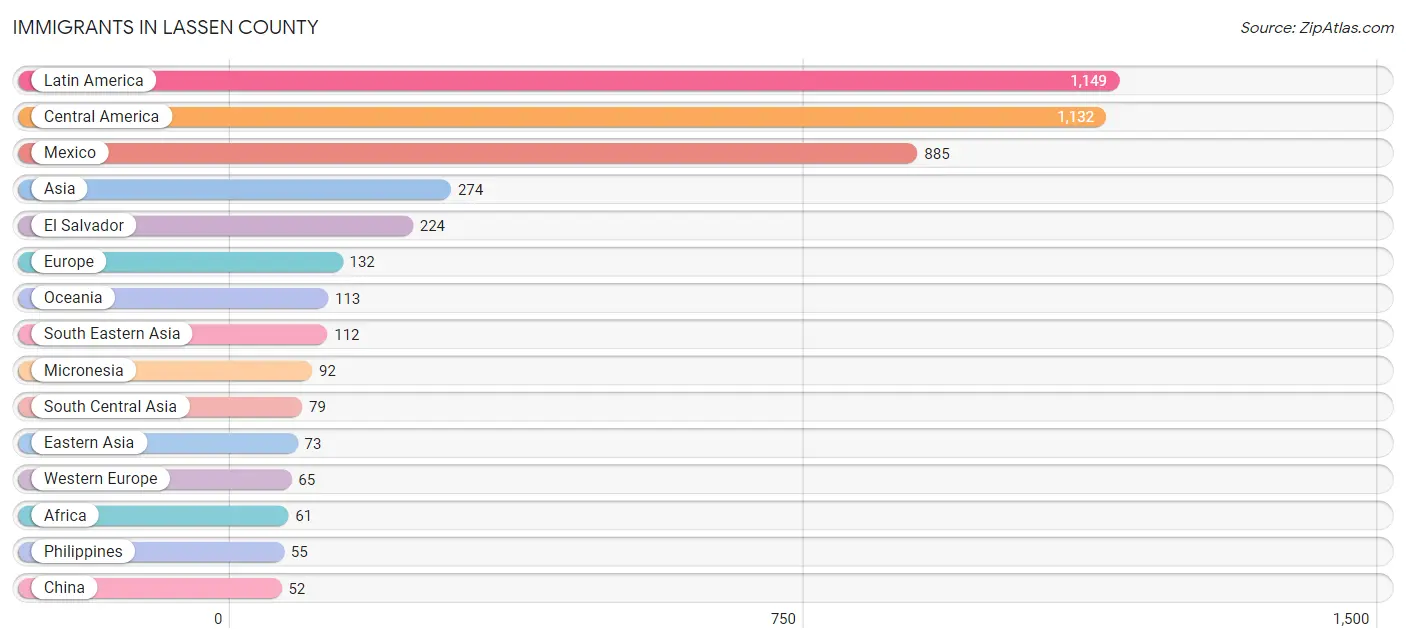
Immigrants in Lassen County
The most numerous immigrant groups reported in Lassen County came from Latin America (1,149 | 3.6%), Central America (1,132 | 3.5%), Mexico (885 | 2.8%), Asia (274 | 0.9%), and El Salvador (224 | 0.7%), together accounting for 11.5% of all Lassen County residents.
| Immigration Origin | # Population | % Population |
| Africa | 61 | 0.2% |
| Armenia | 10 | 0.0% |
| Asia | 274 | 0.9% |
| Australia | 21 | 0.1% |
| Cameroon | 4 | 0.0% |
| Canada | 13 | 0.0% |
| Central America | 1,132 | 3.5% |
| China | 52 | 0.2% |
| Colombia | 10 | 0.0% |
| Eastern Asia | 73 | 0.2% |
| El Salvador | 224 | 0.7% |
| England | 12 | 0.0% |
| Europe | 132 | 0.4% |
| France | 3 | 0.0% |
| Germany | 46 | 0.1% |
| Guatemala | 20 | 0.1% |
| Honduras | 3 | 0.0% |
| India | 36 | 0.1% |
| Indonesia | 6 | 0.0% |
| Iran | 43 | 0.1% |
| Ireland | 3 | 0.0% |
| Italy | 17 | 0.1% |
| Korea | 21 | 0.1% |
| Laos | 9 | 0.0% |
| Latin America | 1,149 | 3.6% |
| Mexico | 885 | 2.8% |
| Micronesia | 92 | 0.3% |
| Middle Africa | 4 | 0.0% |
| Nigeria | 29 | 0.1% |
| Northern Europe | 39 | 0.1% |
| Oceania | 113 | 0.4% |
| Peru | 7 | 0.0% |
| Philippines | 55 | 0.2% |
| South Africa | 28 | 0.1% |
| South America | 17 | 0.1% |
| South Central Asia | 79 | 0.3% |
| South Eastern Asia | 112 | 0.4% |
| Southern Europe | 28 | 0.1% |
| Spain | 11 | 0.0% |
| Switzerland | 16 | 0.1% |
| Taiwan | 11 | 0.0% |
| Thailand | 7 | 0.0% |
| Vietnam | 35 | 0.1% |
| Western Africa | 29 | 0.1% |
| Western Asia | 10 | 0.0% |
| Western Europe | 65 | 0.2% | View All 46 Rows |
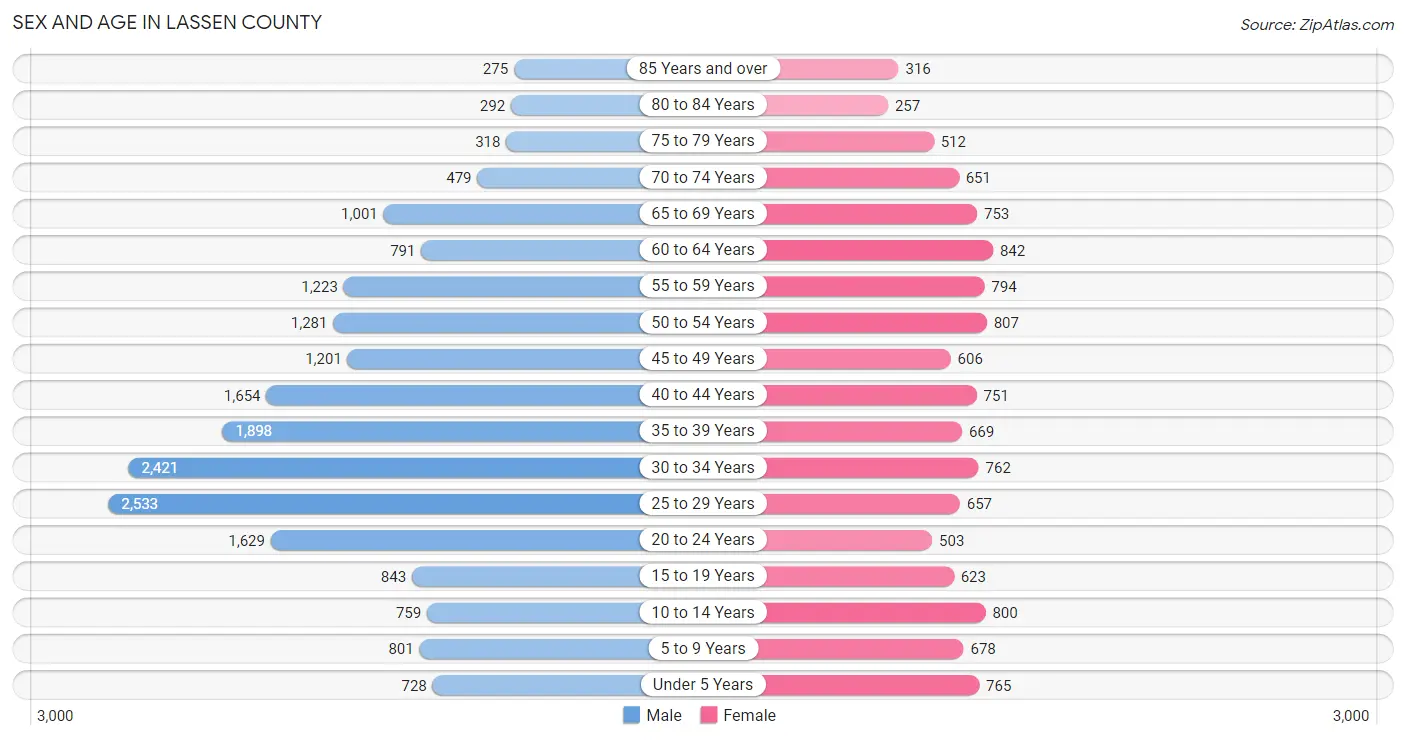
Sex and Age in Lassen County
Sex and Age in Lassen County
The most populous age groups in Lassen County are 25 to 29 Years (2,533 | 12.6%) for men and 60 to 64 Years (842 | 7.2%) for women.
| Age Bracket | Male | Female |
| Under 5 Years | 728 (3.6%) | 765 (6.5%) |
| 5 to 9 Years | 801 (4.0%) | 678 (5.8%) |
| 10 to 14 Years | 759 (3.8%) | 800 (6.8%) |
| 15 to 19 Years | 843 (4.2%) | 623 (5.3%) |
| 20 to 24 Years | 1,629 (8.1%) | 503 (4.3%) |
| 25 to 29 Years | 2,533 (12.6%) | 657 (5.6%) |
| 30 to 34 Years | 2,421 (12.0%) | 762 (6.5%) |
| 35 to 39 Years | 1,898 (9.4%) | 669 (5.7%) |
| 40 to 44 Years | 1,654 (8.2%) | 751 (6.4%) |
| 45 to 49 Years | 1,201 (6.0%) | 606 (5.2%) |
| 50 to 54 Years | 1,281 (6.4%) | 807 (6.9%) |
| 55 to 59 Years | 1,223 (6.1%) | 794 (6.8%) |
| 60 to 64 Years | 791 (3.9%) | 842 (7.2%) |
| 65 to 69 Years | 1,001 (5.0%) | 753 (6.4%) |
| 70 to 74 Years | 479 (2.4%) | 651 (5.5%) |
| 75 to 79 Years | 318 (1.6%) | 512 (4.4%) |
| 80 to 84 Years | 292 (1.5%) | 257 (2.2%) |
| 85 Years and over | 275 (1.4%) | 316 (2.7%) |
| Total | 20,127 (100.0%) | 11,746 (100.0%) |
Families and Households in Lassen County
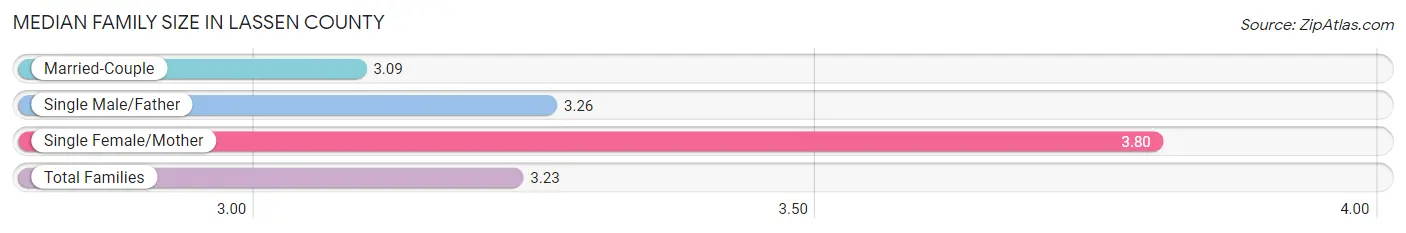
Median Family Size in Lassen County
The median family size in Lassen County is 3.23 persons per family, with single female/mother families (1,026 | 17.4%) accounting for the largest median family size of 3.8 persons per family. On the other hand, married-couple families (4,500 | 76.2%) represent the smallest median family size with 3.09 persons per family.
| Family Type | # Families | Family Size |
| Married-Couple | 4,500 (76.2%) | 3.09 |
| Single Male/Father | 382 (6.5%) | 3.26 |
| Single Female/Mother | 1,026 (17.4%) | 3.80 |
| Total Families | 5,908 (100.0%) | 3.23 |
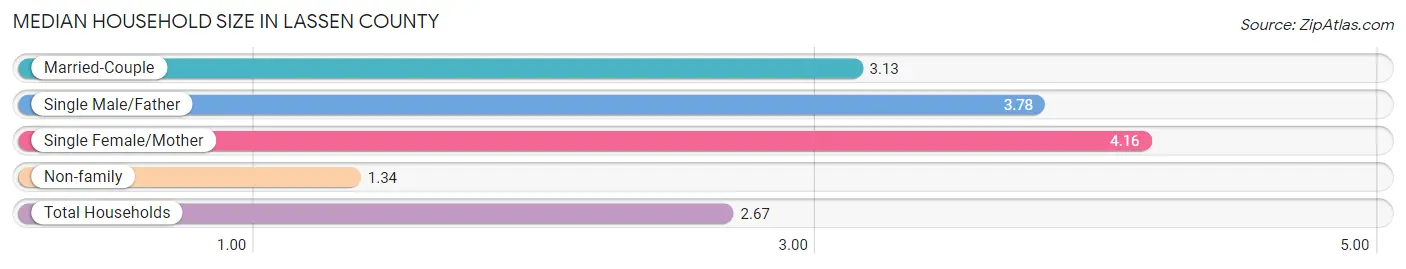
Median Household Size in Lassen County
The median household size in Lassen County is 2.67 persons per household, with single female/mother households (1,026 | 11.5%) accounting for the largest median household size of 4.16 persons per household. non-family households (3,017 | 33.8%) represent the smallest median household size with 1.34 persons per household.
| Household Type | # Households | Household Size |
| Married-Couple | 4,500 (50.4%) | 3.13 |
| Single Male/Father | 382 (4.3%) | 3.78 |
| Single Female/Mother | 1,026 (11.5%) | 4.16 |
| Non-family | 3,017 (33.8%) | 1.34 |
| Total Households | 8,925 (100.0%) | 2.67 |
Household Size by Marriage Status in Lassen County
Out of a total of 8,925 households in Lassen County, 5,908 (66.2%) are family households, while 3,017 (33.8%) are nonfamily households. The most numerous type of family households are 2-person households, comprising 3,184, and the most common type of nonfamily households are 1-person households, comprising 2,396.
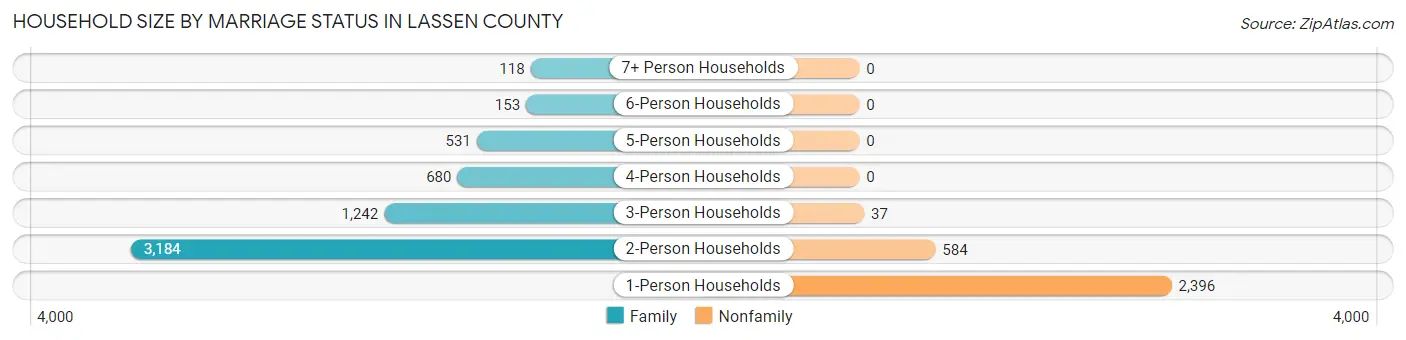
| Household Size | Family Households | Nonfamily Households |
| 1-Person Households | - | 2,396 (26.9%) |
| 2-Person Households | 3,184 (35.7%) | 584 (6.5%) |
| 3-Person Households | 1,242 (13.9%) | 37 (0.4%) |
| 4-Person Households | 680 (7.6%) | 0 (0.0%) |
| 5-Person Households | 531 (5.9%) | 0 (0.0%) |
| 6-Person Households | 153 (1.7%) | 0 (0.0%) |
| 7+ Person Households | 118 (1.3%) | 0 (0.0%) |
| Total | 5,908 (66.2%) | 3,017 (33.8%) |
Female Fertility in Lassen County
Fertility by Age in Lassen County
Average fertility rate in Lassen County is 49.0 births per 1,000 women. Women in the age bracket of 20 to 34 years have the highest fertility rate with 97.0 births per 1,000 women. Women in the age bracket of 20 to 34 years acount for 79.2% of all women with births.
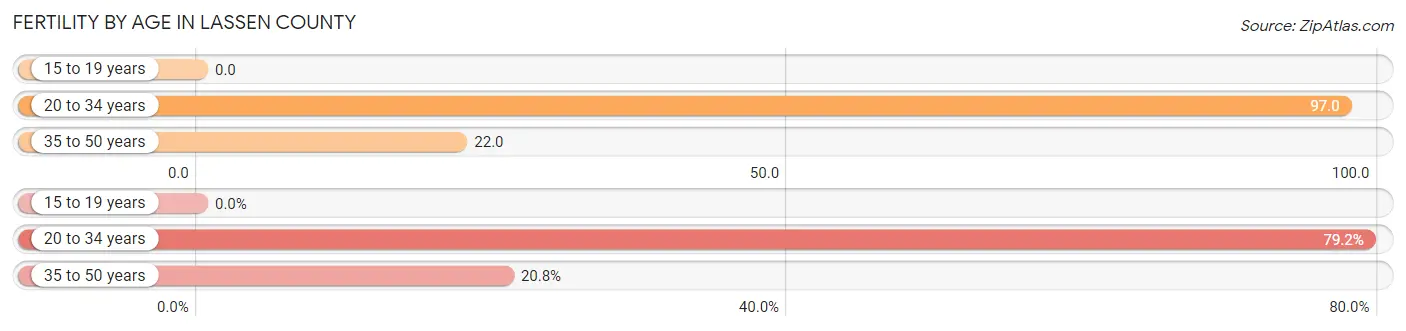
| Age Bracket | Women with Births | Births / 1,000 Women |
| 15 to 19 years | 0 (0.0%) | 0.0 |
| 20 to 34 years | 187 (79.2%) | 97.0 |
| 35 to 50 years | 49 (20.8%) | 22.0 |
| Total | 236 (100.0%) | 49.0 |
Fertility by Age by Marriage Status in Lassen County
66.9% of women with births (236) in Lassen County are married. The highest percentage of unmarried women with births falls into 20 to 34 years age bracket with 35.3% of them unmarried at the time of birth, while the lowest percentage of unmarried women with births belong to 35 to 50 years age bracket with 24.5% of them unmarried.
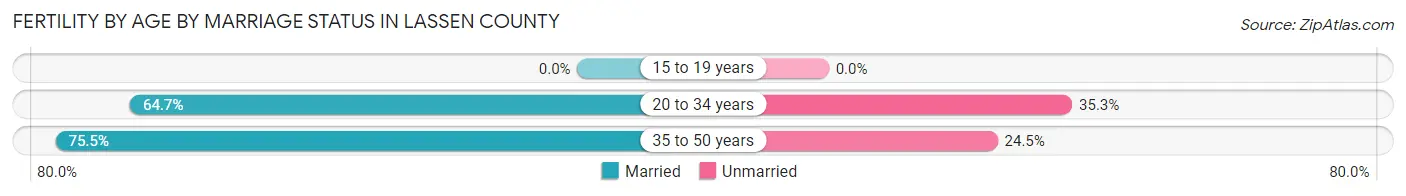
| Age Bracket | Married | Unmarried |
| 15 to 19 years | 0 (0.0%) | 0 (0.0%) |
| 20 to 34 years | 121 (64.7%) | 66 (35.3%) |
| 35 to 50 years | 37 (75.5%) | 12 (24.5%) |
| Total | 158 (66.9%) | 78 (33.1%) |
Fertility by Education in Lassen County
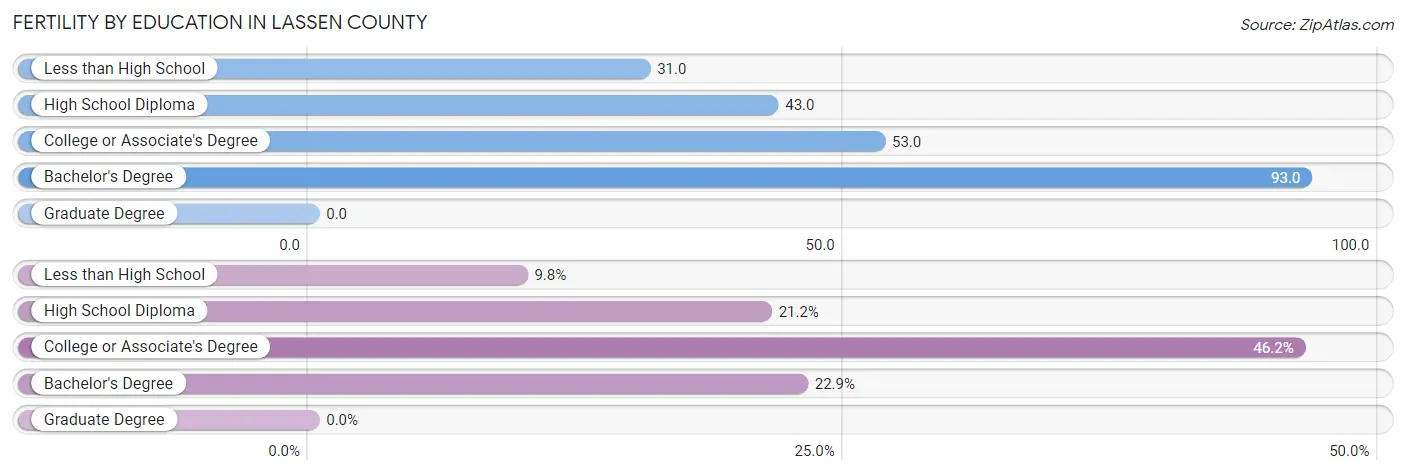
| Educational Attainment | Women with Births | Births / 1,000 Women |
| Less than High School | 23 (9.8%) | 31.0 |
| High School Diploma | 50 (21.2%) | 43.0 |
| College or Associate's Degree | 109 (46.2%) | 53.0 |
| Bachelor's Degree | 54 (22.9%) | 93.0 |
| Graduate Degree | 0 (0.0%) | 0.0 |
| Total | 236 (100.0%) | 49.0 |
Fertility by Education by Marriage Status in Lassen County
33.1% of women with births in Lassen County are unmarried. Women with the educational attainment of bachelor's degree are most likely to be married with 81.5% of them married at childbirth, while women with the educational attainment of less than high school are least likely to be married with 65.2% of them unmarried at childbirth.
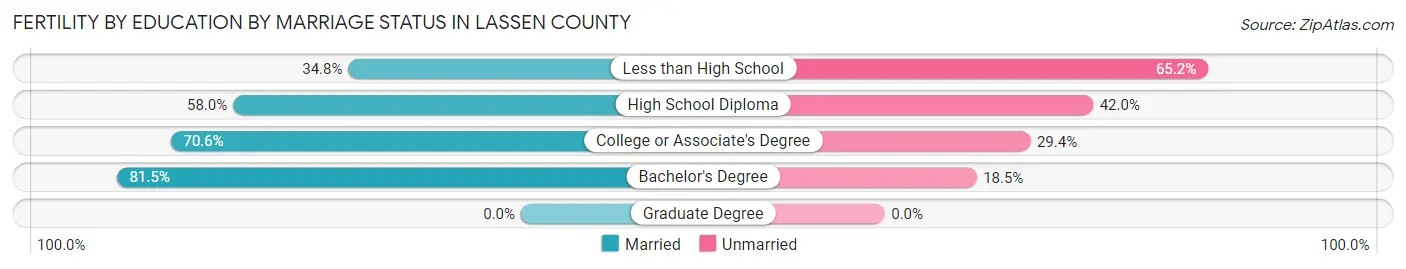
| Educational Attainment | Married | Unmarried |
| Less than High School | 8 (34.8%) | 15 (65.2%) |
| High School Diploma | 29 (58.0%) | 21 (42.0%) |
| College or Associate's Degree | 77 (70.6%) | 32 (29.4%) |
| Bachelor's Degree | 44 (81.5%) | 10 (18.5%) |
| Graduate Degree | 0 (0.0%) | 0 (0.0%) |
| Total | 158 (66.9%) | 78 (33.1%) |
Employment Characteristics in Lassen County
Employment by Class of Employer in Lassen County
Among the 8,909 employed individuals in Lassen County, private company employees (3,565 | 40.0%), state government employees (1,835 | 20.6%), and federal government employees (1,178 | 13.2%) make up the most common classes of employment.
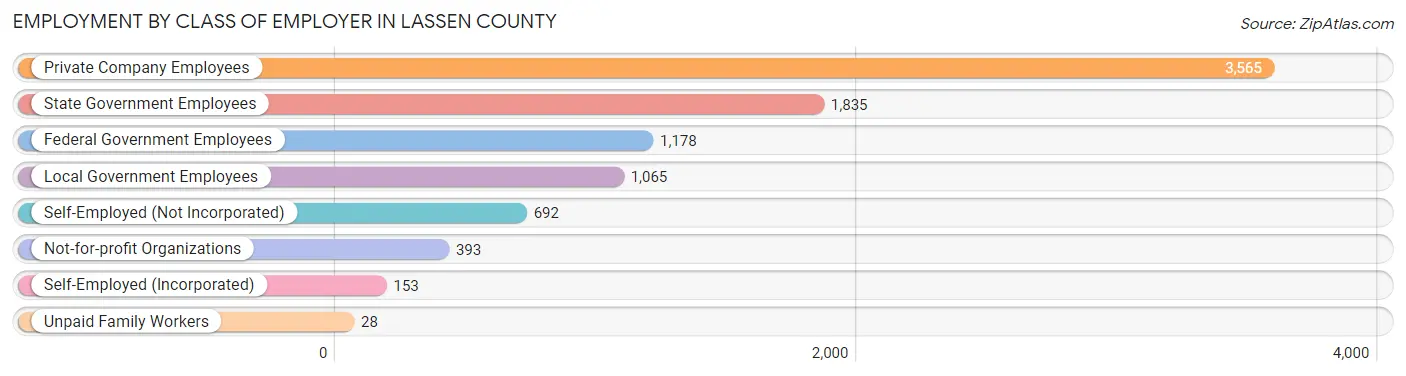
| Employer Class | # Employees | % Employees |
| Private Company Employees | 3,565 | 40.0% |
| Self-Employed (Incorporated) | 153 | 1.7% |
| Self-Employed (Not Incorporated) | 692 | 7.8% |
| Not-for-profit Organizations | 393 | 4.4% |
| Local Government Employees | 1,065 | 11.9% |
| State Government Employees | 1,835 | 20.6% |
| Federal Government Employees | 1,178 | 13.2% |
| Unpaid Family Workers | 28 | 0.3% |
| Total | 8,909 | 100.0% |
Employment Status by Age in Lassen County
According to the labor force statistics for Lassen County, out of the total population over 16 years of age (26,981), 36.5% or 9,848 individuals are in the labor force, with 7.9% or 778 of them unemployed. The age group with the highest labor force participation rate is 55 to 59 years, with 53.8% or 1,085 individuals in the labor force. Within the labor force, the 60 to 64 years age range has the highest percentage of unemployed individuals, with 15.0% or 83 of them being unemployed.
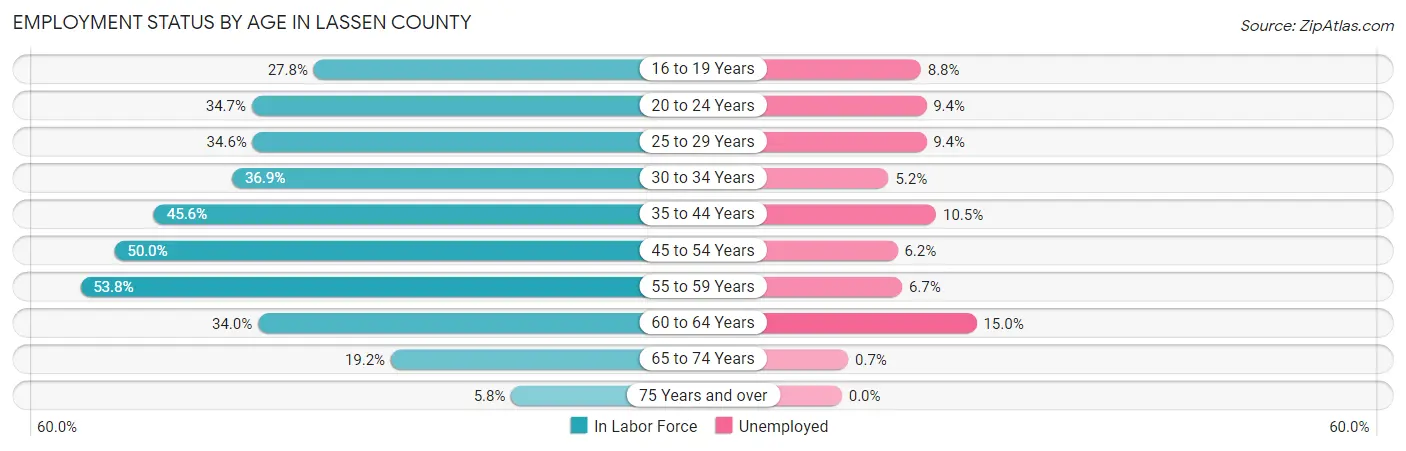
| Age Bracket | In Labor Force | Unemployed |
| 16 to 19 Years | 307 (27.8%) | 27 (8.8%) |
| 20 to 24 Years | 740 (34.7%) | 70 (9.4%) |
| 25 to 29 Years | 1,104 (34.6%) | 104 (9.4%) |
| 30 to 34 Years | 1,175 (36.9%) | 61 (5.2%) |
| 35 to 44 Years | 2,267 (45.6%) | 238 (10.5%) |
| 45 to 54 Years | 1,948 (50.0%) | 121 (6.2%) |
| 55 to 59 Years | 1,085 (53.8%) | 73 (6.7%) |
| 60 to 64 Years | 555 (34.0%) | 83 (15.0%) |
| 65 to 74 Years | 554 (19.2%) | 4 (0.7%) |
| 75 Years and over | 114 (5.8%) | 0 (0.0%) |
| Total | 9,848 (36.5%) | 778 (7.9%) |
Employment Status by Educational Attainment in Lassen County
According to labor force statistics for Lassen County, 43.1% of individuals (8,142) out of the total population between 25 and 64 years of age (18,890) are in the labor force, with 8.4% or 684 of them being unemployed. The group with the highest labor force participation rate are those with the educational attainment of bachelor's degree or higher, with 76.8% or 1,624 individuals in the labor force. Within the labor force, individuals with less than high school education have the highest percentage of unemployment, with 14.8% or 76 of them being unemployed.
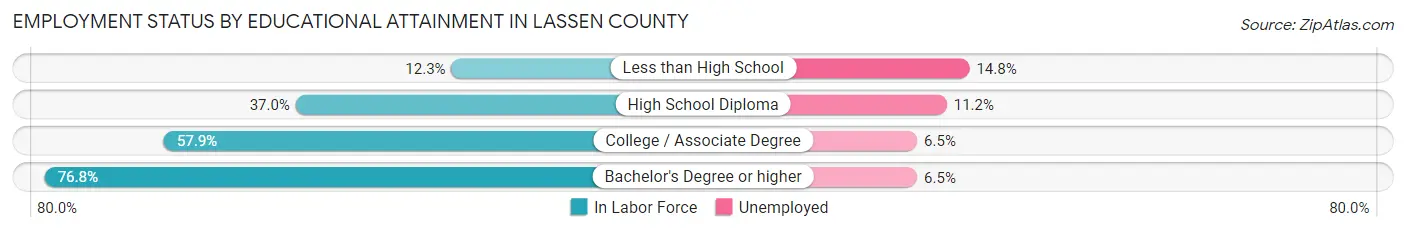
| Educational Attainment | In Labor Force | Unemployed |
| Less than High School | 514 (12.3%) | 619 (14.8%) |
| High School Diploma | 2,294 (37.0%) | 694 (11.2%) |
| College / Associate Degree | 3,702 (57.9%) | 416 (6.5%) |
| Bachelor's Degree or higher | 1,624 (76.8%) | 137 (6.5%) |
| Total | 8,142 (43.1%) | 1,587 (8.4%) |
Employment Occupations by Sex in Lassen County
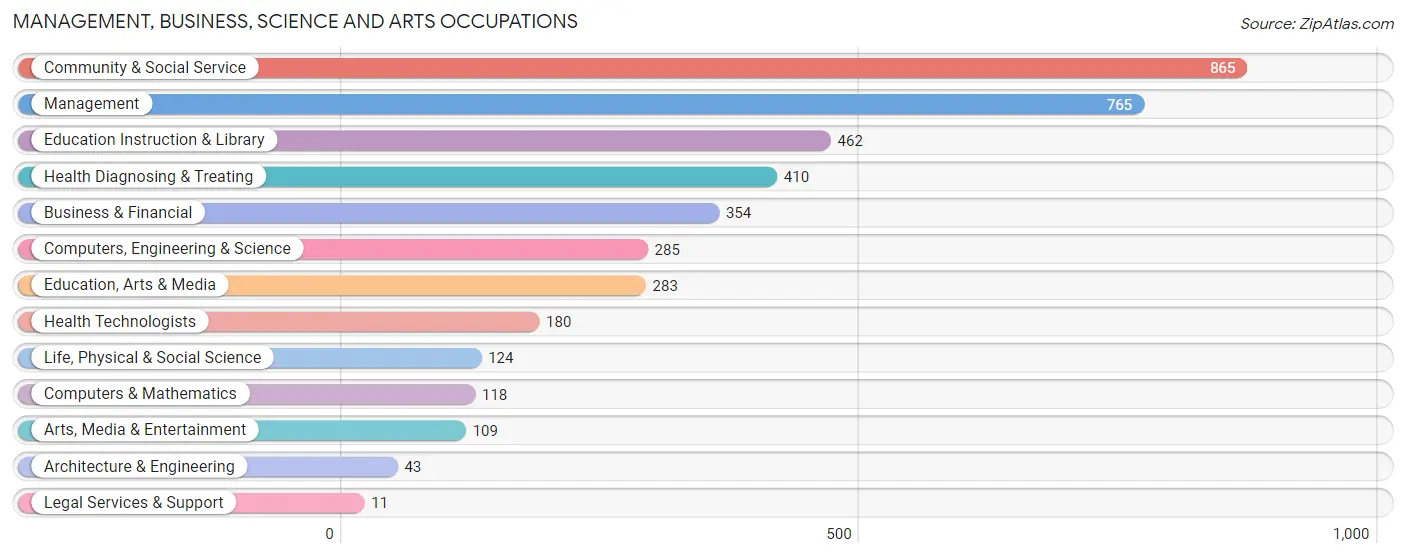
Management, Business, Science and Arts Occupations
The most common Management, Business, Science and Arts occupations in Lassen County are Community & Social Service (865 | 9.6%), Management (765 | 8.5%), Education Instruction & Library (462 | 5.1%), Health Diagnosing & Treating (410 | 4.5%), and Business & Financial (354 | 3.9%).
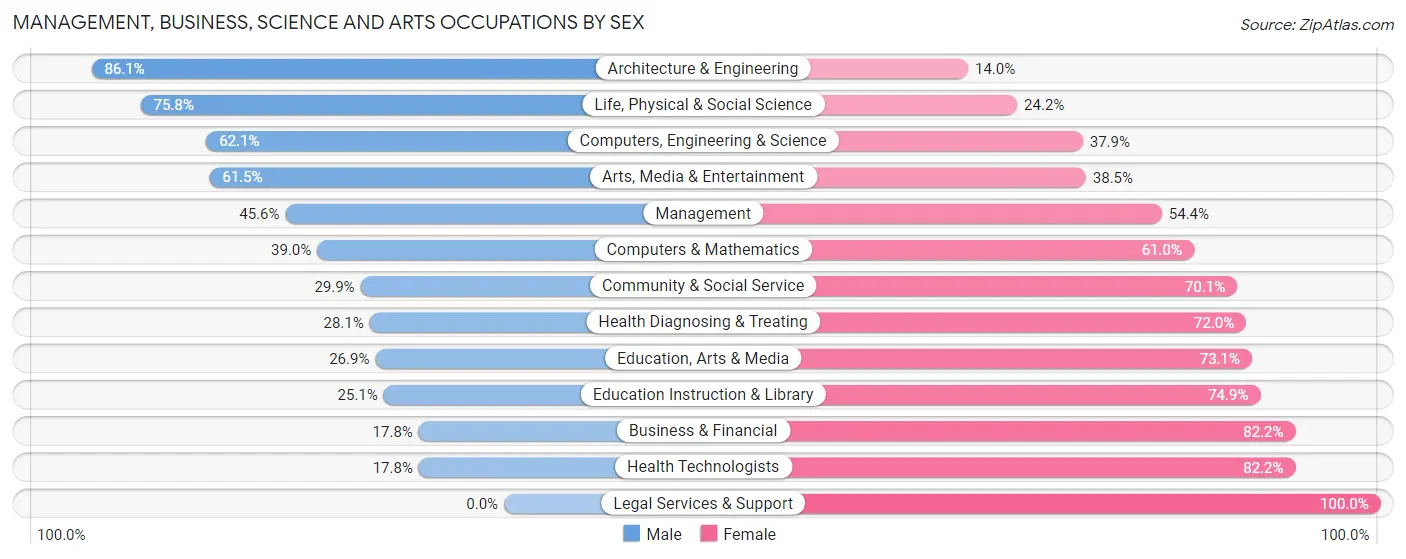
Management, Business, Science and Arts Occupations by Sex
Within the Management, Business, Science and Arts occupations in Lassen County, the most male-oriented occupations are Architecture & Engineering (86.1%), Life, Physical & Social Science (75.8%), and Computers, Engineering & Science (62.1%), while the most female-oriented occupations are Legal Services & Support (100.0%), Health Technologists (82.2%), and Business & Financial (82.2%).
| Occupation | Male | Female |
| Management | 349 (45.6%) | 416 (54.4%) |
| Business & Financial | 63 (17.8%) | 291 (82.2%) |
| Computers, Engineering & Science | 177 (62.1%) | 108 (37.9%) |
| Computers & Mathematics | 46 (39.0%) | 72 (61.0%) |
| Architecture & Engineering | 37 (86.1%) | 6 (14.0%) |
| Life, Physical & Social Science | 94 (75.8%) | 30 (24.2%) |
| Community & Social Service | 259 (29.9%) | 606 (70.1%) |
| Education, Arts & Media | 76 (26.9%) | 207 (73.1%) |
| Legal Services & Support | 0 (0.0%) | 11 (100.0%) |
| Education Instruction & Library | 116 (25.1%) | 346 (74.9%) |
| Arts, Media & Entertainment | 67 (61.5%) | 42 (38.5%) |
| Health Diagnosing & Treating | 115 (28.1%) | 295 (72.0%) |
| Health Technologists | 32 (17.8%) | 148 (82.2%) |
| Total (Category) | 963 (35.9%) | 1,716 (64.0%) |
| Total (Overall) | 4,839 (53.6%) | 4,195 (46.4%) |
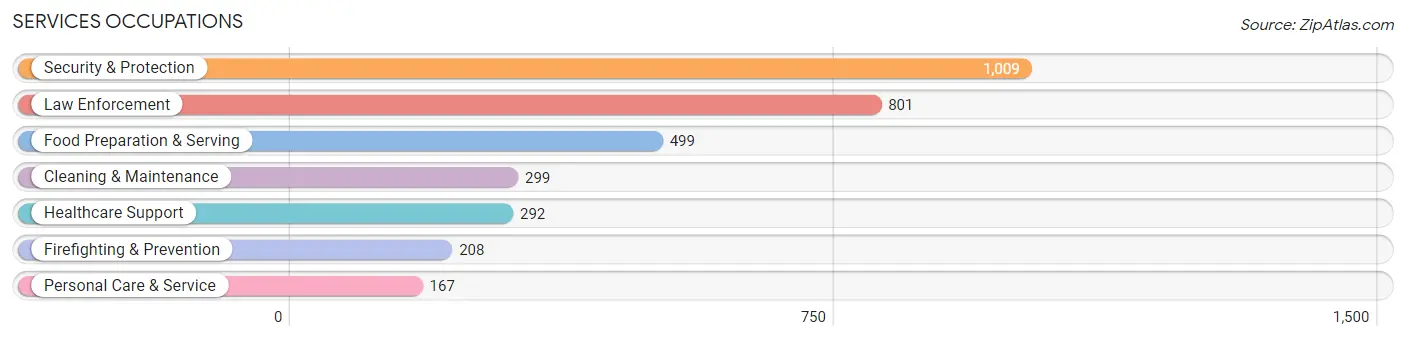
Services Occupations
The most common Services occupations in Lassen County are Security & Protection (1,009 | 11.2%), Law Enforcement (801 | 8.9%), Food Preparation & Serving (499 | 5.5%), Cleaning & Maintenance (299 | 3.3%), and Healthcare Support (292 | 3.2%).
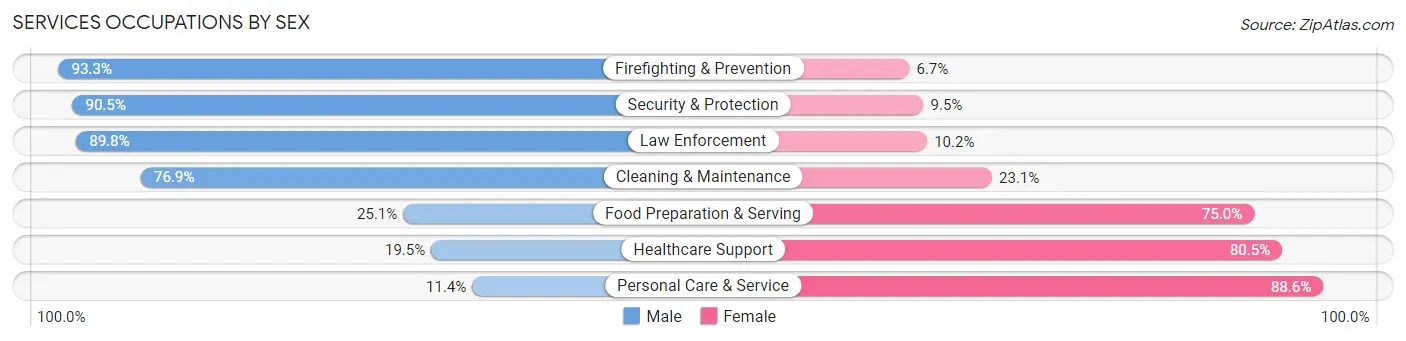
Services Occupations by Sex
Within the Services occupations in Lassen County, the most male-oriented occupations are Firefighting & Prevention (93.3%), Security & Protection (90.5%), and Law Enforcement (89.8%), while the most female-oriented occupations are Personal Care & Service (88.6%), Healthcare Support (80.5%), and Food Preparation & Serving (75.0%).
| Occupation | Male | Female |
| Healthcare Support | 57 (19.5%) | 235 (80.5%) |
| Security & Protection | 913 (90.5%) | 96 (9.5%) |
| Firefighting & Prevention | 194 (93.3%) | 14 (6.7%) |
| Law Enforcement | 719 (89.8%) | 82 (10.2%) |
| Food Preparation & Serving | 125 (25.1%) | 374 (75.0%) |
| Cleaning & Maintenance | 230 (76.9%) | 69 (23.1%) |
| Personal Care & Service | 19 (11.4%) | 148 (88.6%) |
| Total (Category) | 1,344 (59.3%) | 922 (40.7%) |
| Total (Overall) | 4,839 (53.6%) | 4,195 (46.4%) |
Sales and Office Occupations
The most common Sales and Office occupations in Lassen County are Office & Administration (1,133 | 12.5%), and Sales & Related (575 | 6.4%).
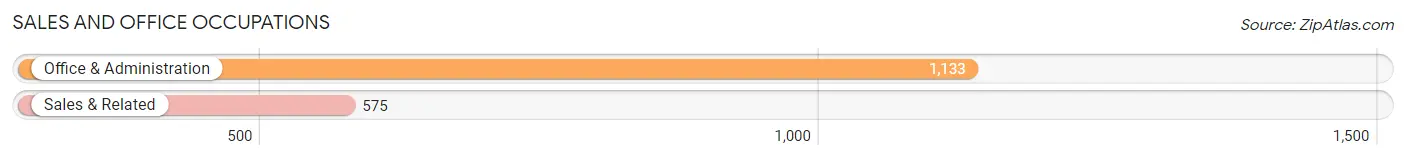
Sales and Office Occupations by Sex
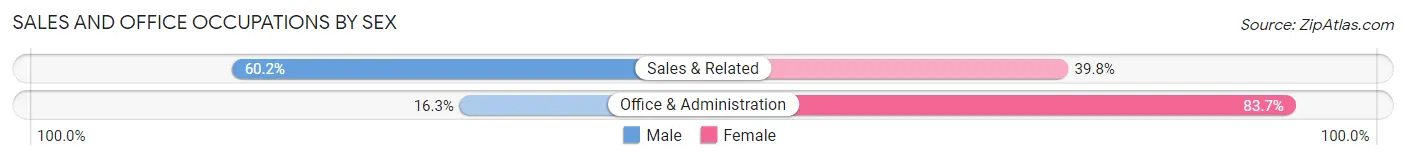
| Occupation | Male | Female |
| Sales & Related | 346 (60.2%) | 229 (39.8%) |
| Office & Administration | 185 (16.3%) | 948 (83.7%) |
| Total (Category) | 531 (31.1%) | 1,177 (68.9%) |
| Total (Overall) | 4,839 (53.6%) | 4,195 (46.4%) |
Natural Resources, Construction and Maintenance Occupations
The most common Natural Resources, Construction and Maintenance occupations in Lassen County are Construction & Extraction (466 | 5.2%), Installation, Maintenance & Repair (357 | 4.0%), and Farming, Fishing & Forestry (172 | 1.9%).
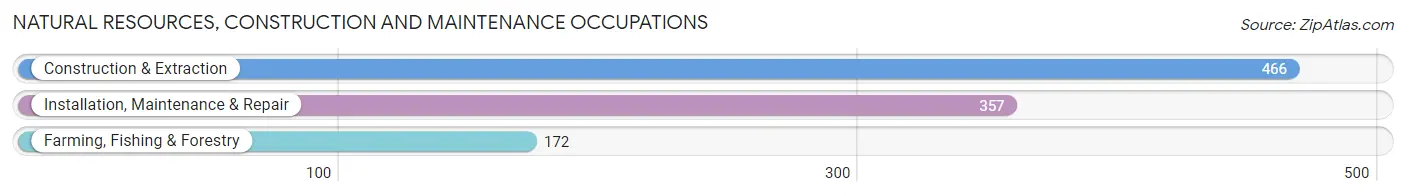
Natural Resources, Construction and Maintenance Occupations by Sex
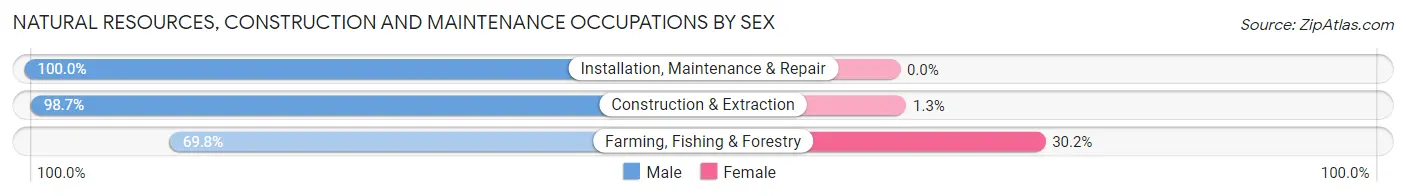
| Occupation | Male | Female |
| Farming, Fishing & Forestry | 120 (69.8%) | 52 (30.2%) |
| Construction & Extraction | 460 (98.7%) | 6 (1.3%) |
| Installation, Maintenance & Repair | 357 (100.0%) | 0 (0.0%) |
| Total (Category) | 937 (94.2%) | 58 (5.8%) |
| Total (Overall) | 4,839 (53.6%) | 4,195 (46.4%) |
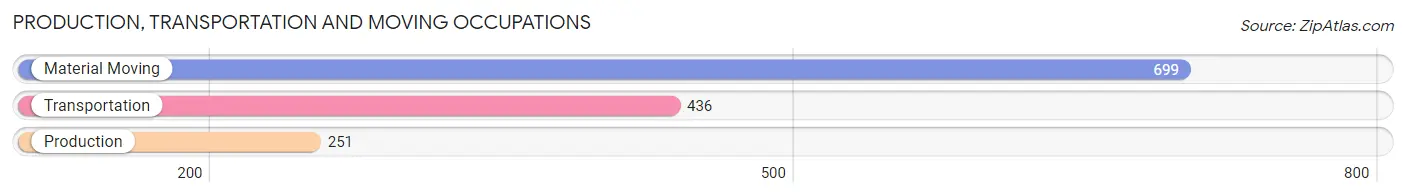
Production, Transportation and Moving Occupations
The most common Production, Transportation and Moving occupations in Lassen County are Material Moving (699 | 7.7%), Transportation (436 | 4.8%), and Production (251 | 2.8%).
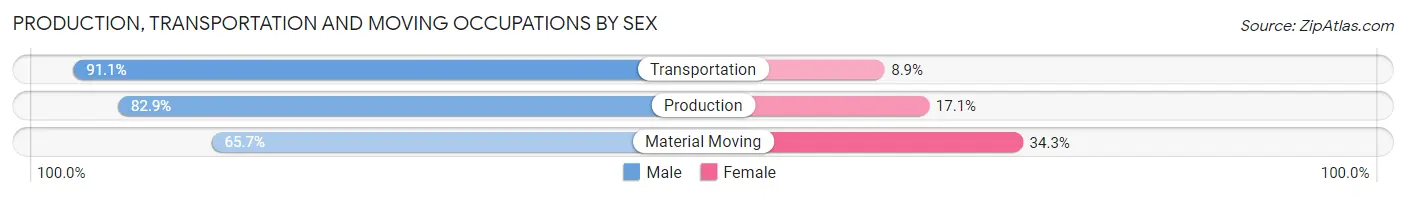
Production, Transportation and Moving Occupations by Sex
| Occupation | Male | Female |
| Production | 208 (82.9%) | 43 (17.1%) |
| Transportation | 397 (91.1%) | 39 (8.9%) |
| Material Moving | 459 (65.7%) | 240 (34.3%) |
| Total (Category) | 1,064 (76.8%) | 322 (23.2%) |
| Total (Overall) | 4,839 (53.6%) | 4,195 (46.4%) |
Employment Industries by Sex in Lassen County
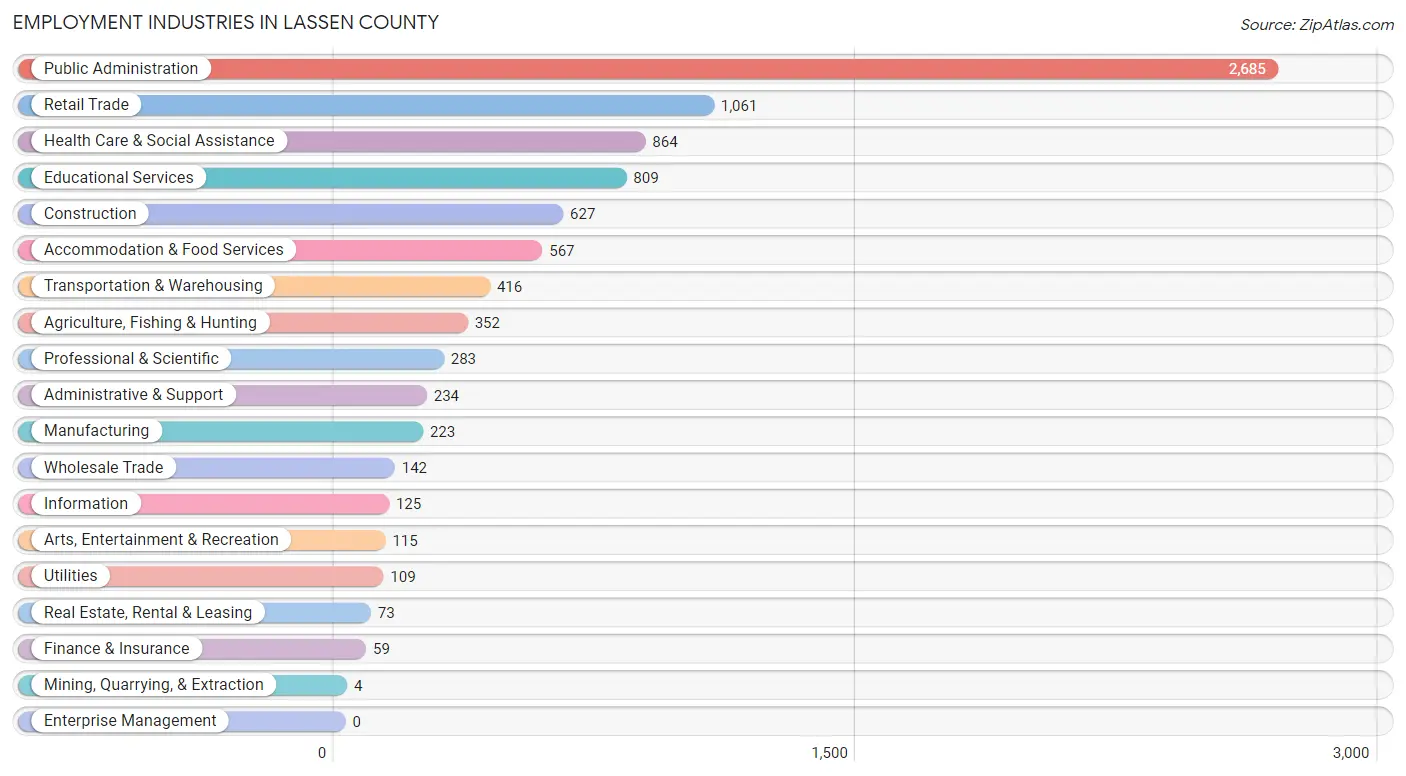
Employment Industries in Lassen County
The major employment industries in Lassen County include Public Administration (2,685 | 29.7%), Retail Trade (1,061 | 11.7%), Health Care & Social Assistance (864 | 9.6%), Educational Services (809 | 9.0%), and Construction (627 | 6.9%).
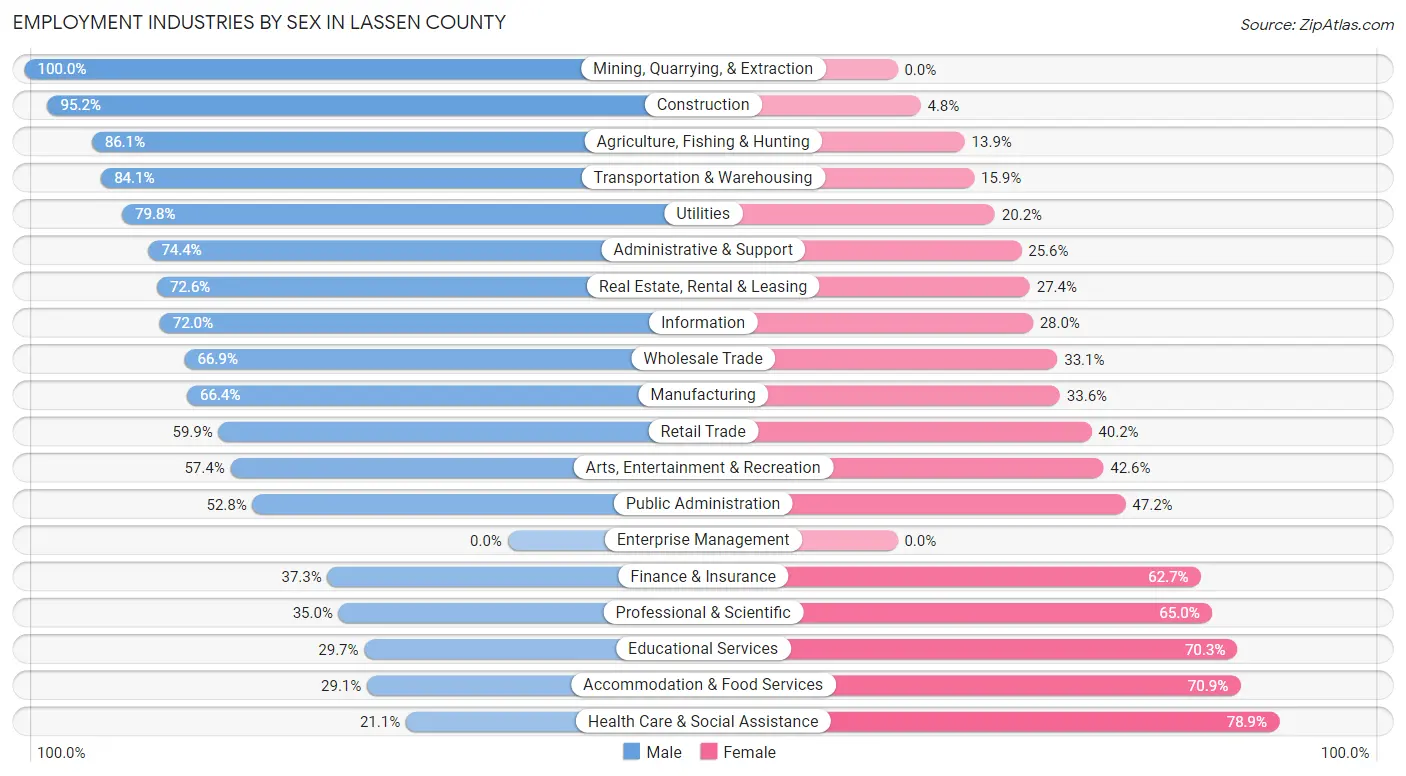
Employment Industries by Sex in Lassen County
The Lassen County industries that see more men than women are Mining, Quarrying, & Extraction (100.0%), Construction (95.2%), and Agriculture, Fishing & Hunting (86.1%), whereas the industries that tend to have a higher number of women are Health Care & Social Assistance (78.9%), Accommodation & Food Services (70.9%), and Educational Services (70.3%).
| Industry | Male | Female |
| Agriculture, Fishing & Hunting | 303 (86.1%) | 49 (13.9%) |
| Mining, Quarrying, & Extraction | 4 (100.0%) | 0 (0.0%) |
| Construction | 597 (95.2%) | 30 (4.8%) |
| Manufacturing | 148 (66.4%) | 75 (33.6%) |
| Wholesale Trade | 95 (66.9%) | 47 (33.1%) |
| Retail Trade | 635 (59.9%) | 426 (40.2%) |
| Transportation & Warehousing | 350 (84.1%) | 66 (15.9%) |
| Utilities | 87 (79.8%) | 22 (20.2%) |
| Information | 90 (72.0%) | 35 (28.0%) |
| Finance & Insurance | 22 (37.3%) | 37 (62.7%) |
| Real Estate, Rental & Leasing | 53 (72.6%) | 20 (27.4%) |
| Professional & Scientific | 99 (35.0%) | 184 (65.0%) |
| Enterprise Management | 0 (0.0%) | 0 (0.0%) |
| Administrative & Support | 174 (74.4%) | 60 (25.6%) |
| Educational Services | 240 (29.7%) | 569 (70.3%) |
| Health Care & Social Assistance | 182 (21.1%) | 682 (78.9%) |
| Arts, Entertainment & Recreation | 66 (57.4%) | 49 (42.6%) |
| Accommodation & Food Services | 165 (29.1%) | 402 (70.9%) |
| Public Administration | 1,418 (52.8%) | 1,267 (47.2%) |
| Total | 4,839 (53.6%) | 4,195 (46.4%) |
Education in Lassen County
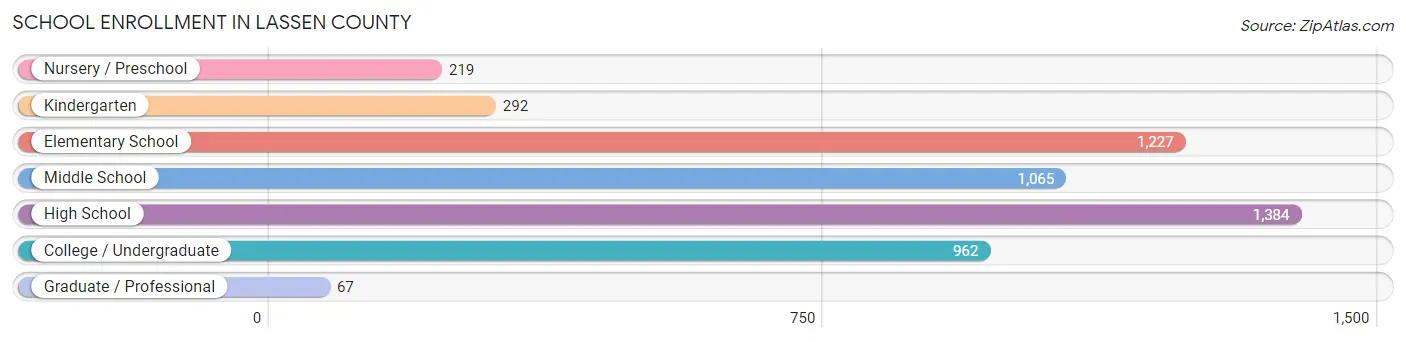
School Enrollment in Lassen County
The most common levels of schooling among the 5,216 students in Lassen County are high school (1,384 | 26.5%), elementary school (1,227 | 23.5%), and middle school (1,065 | 20.4%).
| School Level | # Students | % Students |
| Nursery / Preschool | 219 | 4.2% |
| Kindergarten | 292 | 5.6% |
| Elementary School | 1,227 | 23.5% |
| Middle School | 1,065 | 20.4% |
| High School | 1,384 | 26.5% |
| College / Undergraduate | 962 | 18.4% |
| Graduate / Professional | 67 | 1.3% |
| Total | 5,216 | 100.0% |
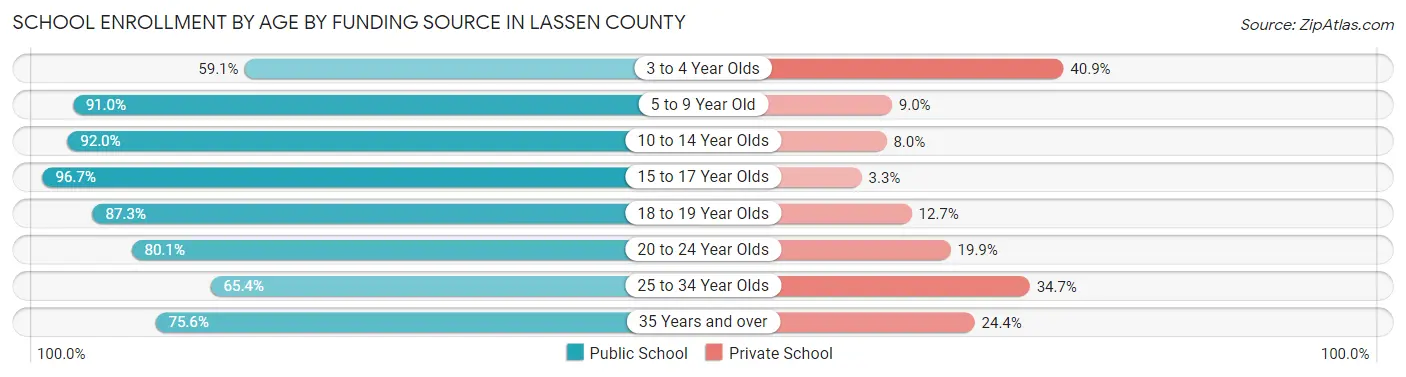
School Enrollment by Age by Funding Source in Lassen County
Out of a total of 5,216 students who are enrolled in schools in Lassen County, 657 (12.6%) attend a private institution, while the remaining 4,559 (87.4%) are enrolled in public schools. The age group of 3 to 4 year olds has the highest likelihood of being enrolled in private schools, with 79 (40.9% in the age bracket) enrolled. Conversely, the age group of 15 to 17 year olds has the lowest likelihood of being enrolled in a private school, with 898 (96.7% in the age bracket) attending a public institution.
| Age Bracket | Public School | Private School |
| 3 to 4 Year Olds | 114 (59.1%) | 79 (40.9%) |
| 5 to 9 Year Old | 1,279 (91.0%) | 126 (9.0%) |
| 10 to 14 Year Olds | 1,282 (92.0%) | 111 (8.0%) |
| 15 to 17 Year Olds | 898 (96.7%) | 31 (3.3%) |
| 18 to 19 Year Olds | 269 (87.3%) | 39 (12.7%) |
| 20 to 24 Year Olds | 205 (80.1%) | 51 (19.9%) |
| 25 to 34 Year Olds | 264 (65.3%) | 140 (34.6%) |
| 35 Years and over | 248 (75.6%) | 80 (24.4%) |
| Total | 4,559 (87.4%) | 657 (12.6%) |
Educational Attainment by Field of Study in Lassen County
Education (510 | 16.9%), bio, nature & agricultural (506 | 16.8%), business (368 | 12.2%), arts & humanities (298 | 9.9%), and liberal arts & history (294 | 9.8%) are the most common fields of study among 3,013 individuals in Lassen County who have obtained a bachelor's degree or higher.
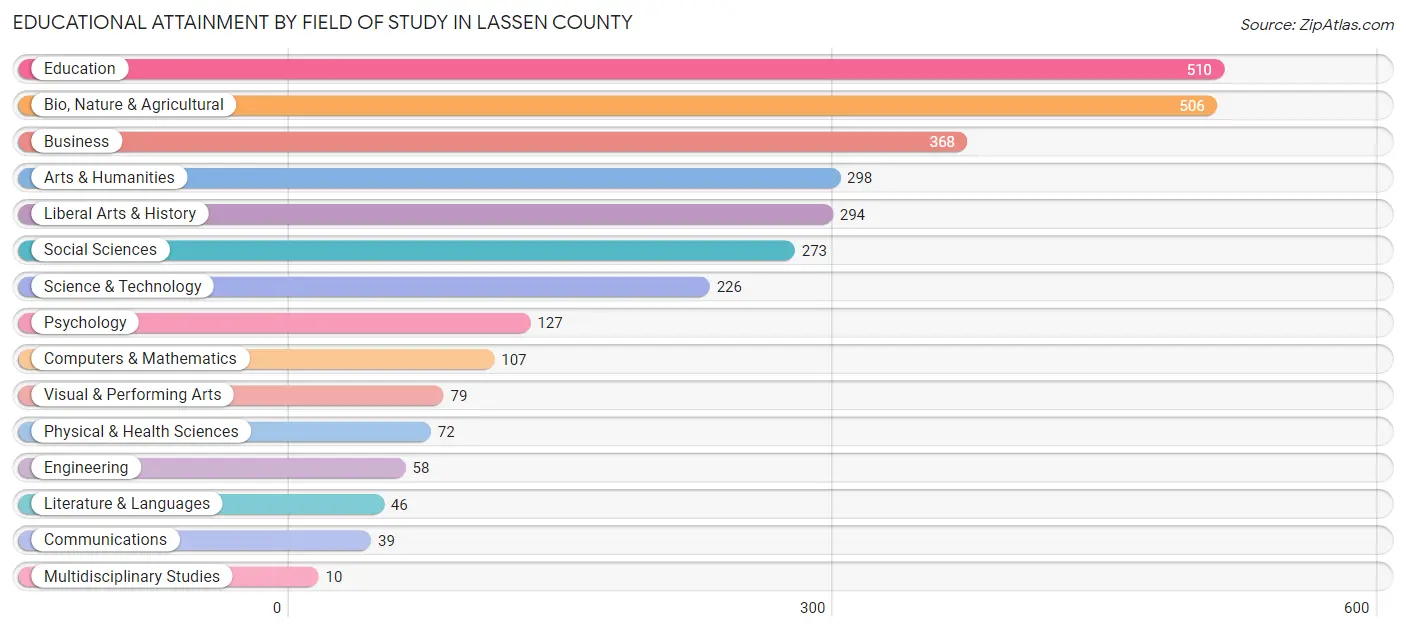
| Field of Study | # Graduates | % Graduates |
| Computers & Mathematics | 107 | 3.5% |
| Bio, Nature & Agricultural | 506 | 16.8% |
| Physical & Health Sciences | 72 | 2.4% |
| Psychology | 127 | 4.2% |
| Social Sciences | 273 | 9.1% |
| Engineering | 58 | 1.9% |
| Multidisciplinary Studies | 10 | 0.3% |
| Science & Technology | 226 | 7.5% |
| Business | 368 | 12.2% |
| Education | 510 | 16.9% |
| Literature & Languages | 46 | 1.5% |
| Liberal Arts & History | 294 | 9.8% |
| Visual & Performing Arts | 79 | 2.6% |
| Communications | 39 | 1.3% |
| Arts & Humanities | 298 | 9.9% |
| Total | 3,013 | 100.0% |
Transportation & Commute in Lassen County
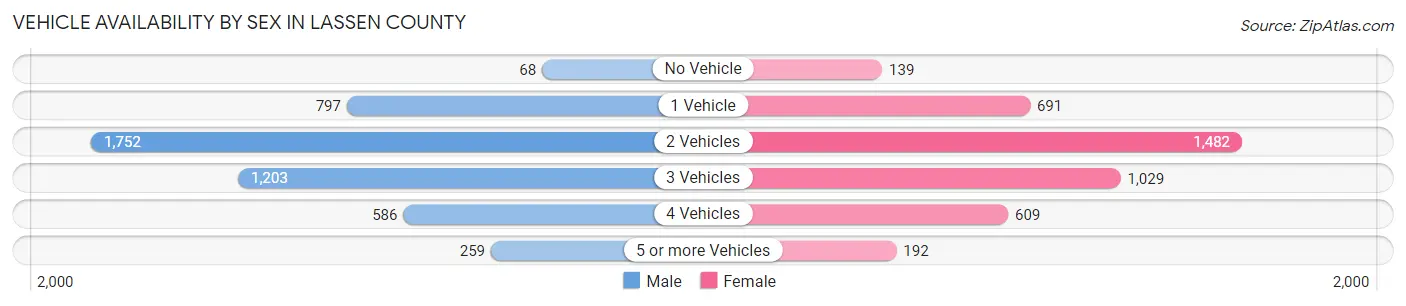
Vehicle Availability by Sex in Lassen County
The most prevalent vehicle ownership categories in Lassen County are males with 2 vehicles (1,752, accounting for 37.6%) and females with 2 vehicles (1,482, making up 42.3%).
| Vehicles Available | Male | Female |
| No Vehicle | 68 (1.5%) | 139 (3.4%) |
| 1 Vehicle | 797 (17.1%) | 691 (16.7%) |
| 2 Vehicles | 1,752 (37.6%) | 1,482 (35.8%) |
| 3 Vehicles | 1,203 (25.8%) | 1,029 (24.8%) |
| 4 Vehicles | 586 (12.6%) | 609 (14.7%) |
| 5 or more Vehicles | 259 (5.6%) | 192 (4.6%) |
| Total | 4,665 (100.0%) | 4,142 (100.0%) |
Commute Time in Lassen County
The most frequently occuring commute durations in Lassen County are 10 to 14 minutes (1,639 commuters, 19.5%), 15 to 19 minutes (1,520 commuters, 18.1%), and 20 to 24 minutes (1,495 commuters, 17.8%).
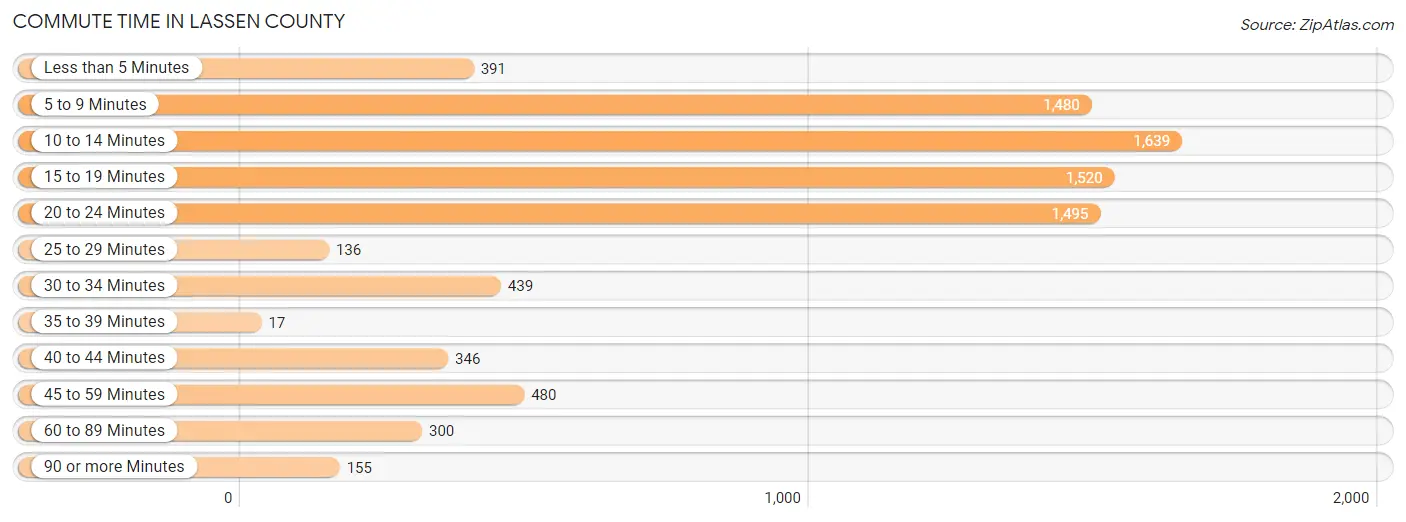
| Commute Time | # Commuters | % Commuters |
| Less than 5 Minutes | 391 | 4.7% |
| 5 to 9 Minutes | 1,480 | 17.6% |
| 10 to 14 Minutes | 1,639 | 19.5% |
| 15 to 19 Minutes | 1,520 | 18.1% |
| 20 to 24 Minutes | 1,495 | 17.8% |
| 25 to 29 Minutes | 136 | 1.6% |
| 30 to 34 Minutes | 439 | 5.2% |
| 35 to 39 Minutes | 17 | 0.2% |
| 40 to 44 Minutes | 346 | 4.1% |
| 45 to 59 Minutes | 480 | 5.7% |
| 60 to 89 Minutes | 300 | 3.6% |
| 90 or more Minutes | 155 | 1.8% |
Commute Time by Sex in Lassen County
The most common commute times in Lassen County are 15 to 19 minutes (1,019 commuters, 22.7%) for males and 10 to 14 minutes (957 commuters, 24.5%) for females.
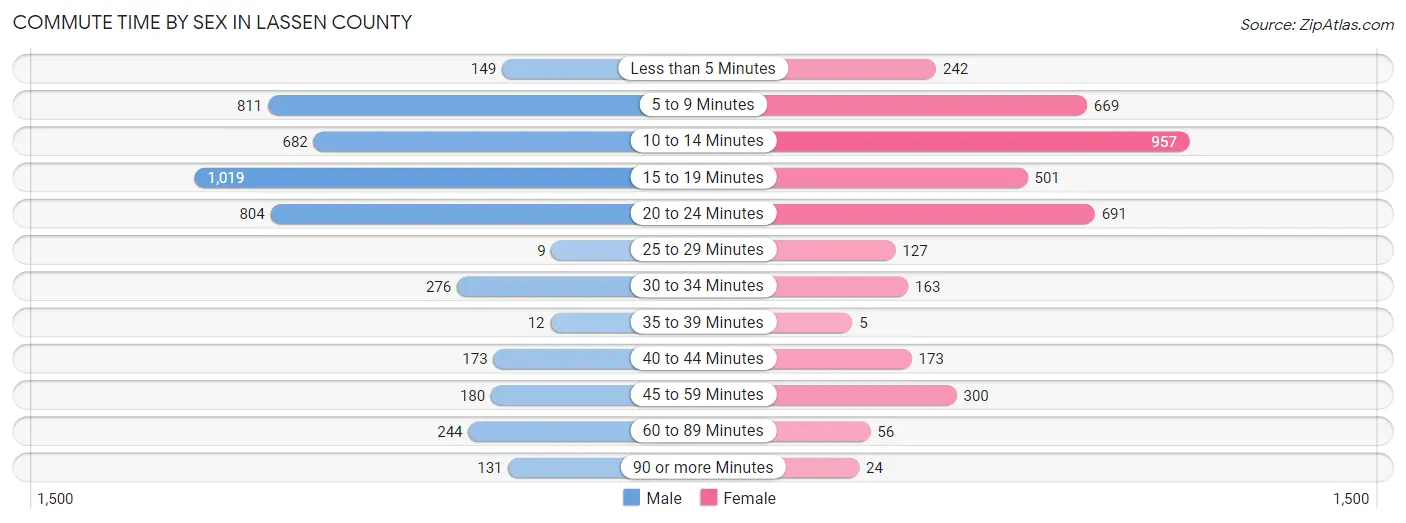
| Commute Time | Male | Female |
| Less than 5 Minutes | 149 (3.3%) | 242 (6.2%) |
| 5 to 9 Minutes | 811 (18.1%) | 669 (17.1%) |
| 10 to 14 Minutes | 682 (15.2%) | 957 (24.5%) |
| 15 to 19 Minutes | 1,019 (22.7%) | 501 (12.8%) |
| 20 to 24 Minutes | 804 (17.9%) | 691 (17.7%) |
| 25 to 29 Minutes | 9 (0.2%) | 127 (3.3%) |
| 30 to 34 Minutes | 276 (6.1%) | 163 (4.2%) |
| 35 to 39 Minutes | 12 (0.3%) | 5 (0.1%) |
| 40 to 44 Minutes | 173 (3.8%) | 173 (4.4%) |
| 45 to 59 Minutes | 180 (4.0%) | 300 (7.7%) |
| 60 to 89 Minutes | 244 (5.4%) | 56 (1.4%) |
| 90 or more Minutes | 131 (2.9%) | 24 (0.6%) |
Time of Departure to Work by Sex in Lassen County
The most frequent times of departure to work in Lassen County are 7:00 AM to 7:29 AM (643, 14.3%) for males and 7:30 AM to 7:59 AM (828, 21.2%) for females.
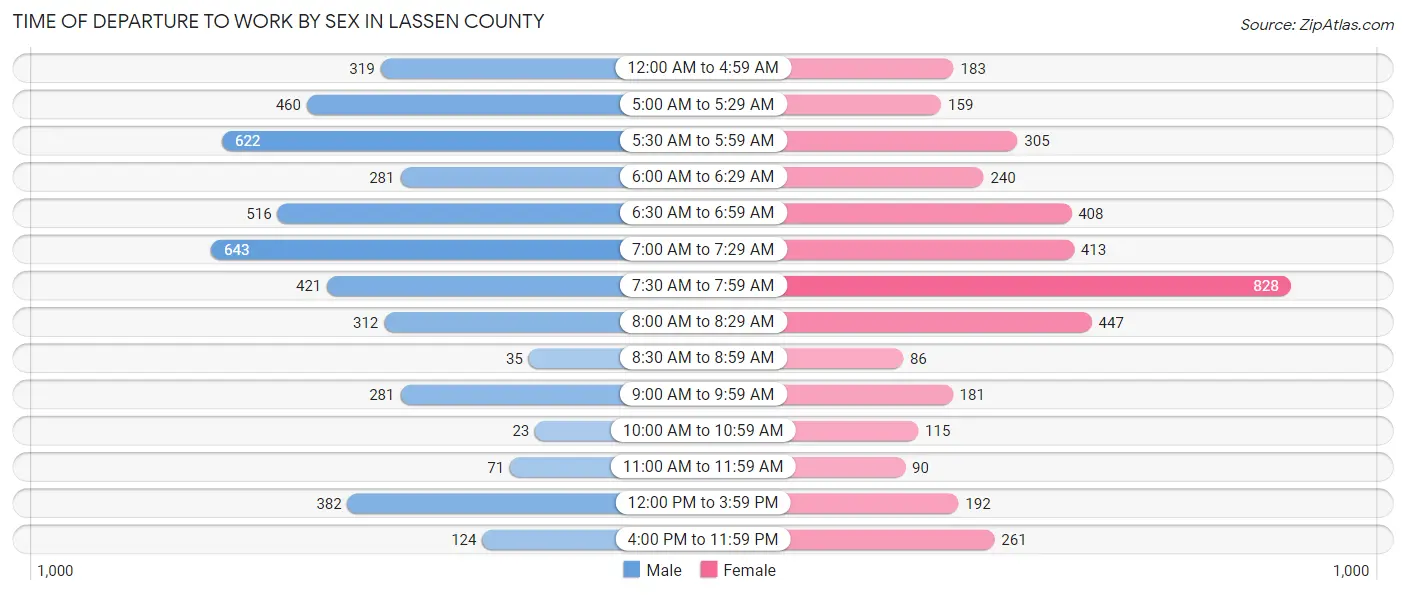
| Time of Departure | Male | Female |
| 12:00 AM to 4:59 AM | 319 (7.1%) | 183 (4.7%) |
| 5:00 AM to 5:29 AM | 460 (10.2%) | 159 (4.1%) |
| 5:30 AM to 5:59 AM | 622 (13.9%) | 305 (7.8%) |
| 6:00 AM to 6:29 AM | 281 (6.3%) | 240 (6.1%) |
| 6:30 AM to 6:59 AM | 516 (11.5%) | 408 (10.4%) |
| 7:00 AM to 7:29 AM | 643 (14.3%) | 413 (10.6%) |
| 7:30 AM to 7:59 AM | 421 (9.4%) | 828 (21.2%) |
| 8:00 AM to 8:29 AM | 312 (7.0%) | 447 (11.4%) |
| 8:30 AM to 8:59 AM | 35 (0.8%) | 86 (2.2%) |
| 9:00 AM to 9:59 AM | 281 (6.3%) | 181 (4.6%) |
| 10:00 AM to 10:59 AM | 23 (0.5%) | 115 (2.9%) |
| 11:00 AM to 11:59 AM | 71 (1.6%) | 90 (2.3%) |
| 12:00 PM to 3:59 PM | 382 (8.5%) | 192 (4.9%) |
| 4:00 PM to 11:59 PM | 124 (2.8%) | 261 (6.7%) |
| Total | 4,490 (100.0%) | 3,908 (100.0%) |
Housing Occupancy in Lassen County
Occupancy by Ownership in Lassen County
Of the total 8,925 dwellings in Lassen County, owner-occupied units account for 6,131 (68.7%), while renter-occupied units make up 2,794 (31.3%).
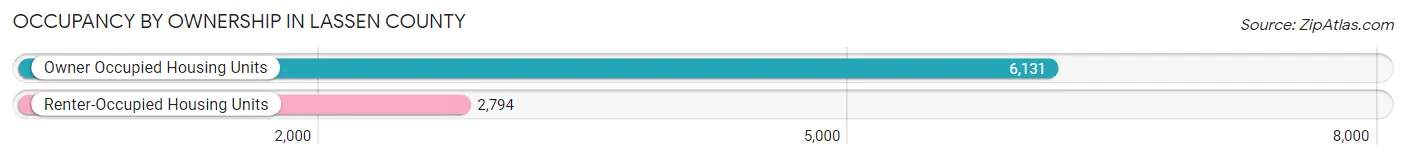
| Occupancy | # Housing Units | % Housing Units |
| Owner Occupied Housing Units | 6,131 | 68.7% |
| Renter-Occupied Housing Units | 2,794 | 31.3% |
| Total Occupied Housing Units | 8,925 | 100.0% |
Occupancy by Household Size in Lassen County
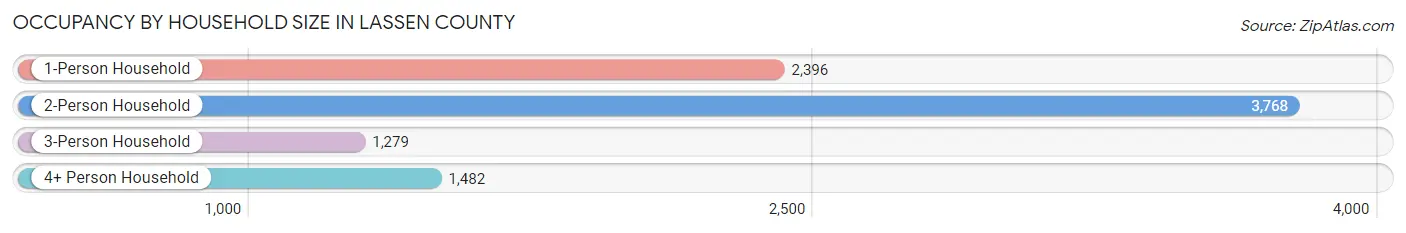
| Household Size | # Housing Units | % Housing Units |
| 1-Person Household | 2,396 | 26.9% |
| 2-Person Household | 3,768 | 42.2% |
| 3-Person Household | 1,279 | 14.3% |
| 4+ Person Household | 1,482 | 16.6% |
| Total Housing Units | 8,925 | 100.0% |
Occupancy by Ownership by Household Size in Lassen County
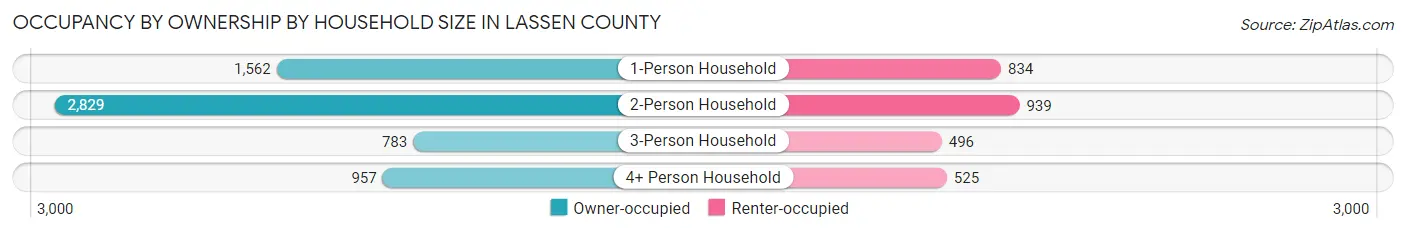
| Household Size | Owner-occupied | Renter-occupied |
| 1-Person Household | 1,562 (65.2%) | 834 (34.8%) |
| 2-Person Household | 2,829 (75.1%) | 939 (24.9%) |
| 3-Person Household | 783 (61.2%) | 496 (38.8%) |
| 4+ Person Household | 957 (64.6%) | 525 (35.4%) |
| Total Housing Units | 6,131 (68.7%) | 2,794 (31.3%) |
Occupancy by Educational Attainment in Lassen County
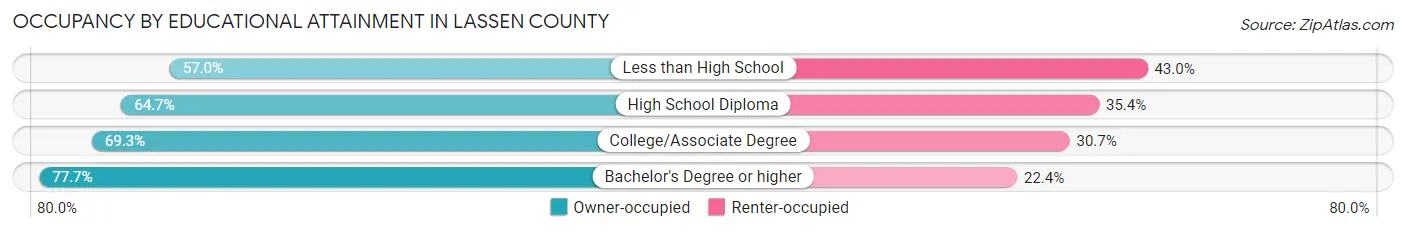
| Household Size | Owner-occupied | Renter-occupied |
| Less than High School | 421 (57.0%) | 318 (43.0%) |
| High School Diploma | 1,483 (64.6%) | 811 (35.3%) |
| College/Associate Degree | 2,903 (69.3%) | 1,284 (30.7%) |
| Bachelor's Degree or higher | 1,324 (77.6%) | 381 (22.4%) |
Occupancy by Age of Householder in Lassen County
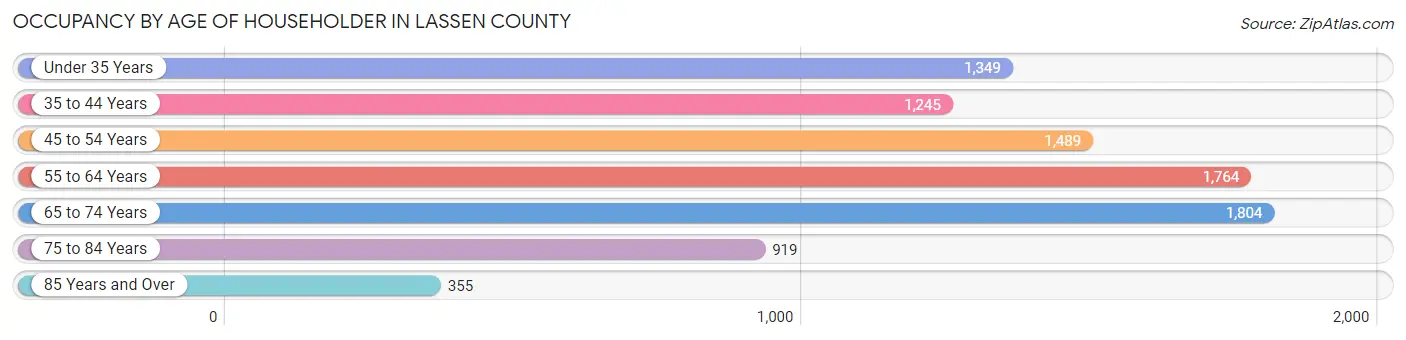
| Age Bracket | # Households | % Households |
| Under 35 Years | 1,349 | 15.1% |
| 35 to 44 Years | 1,245 | 14.0% |
| 45 to 54 Years | 1,489 | 16.7% |
| 55 to 64 Years | 1,764 | 19.8% |
| 65 to 74 Years | 1,804 | 20.2% |
| 75 to 84 Years | 919 | 10.3% |
| 85 Years and Over | 355 | 4.0% |
| Total | 8,925 | 100.0% |
Housing Finances in Lassen County
Median Income by Occupancy in Lassen County
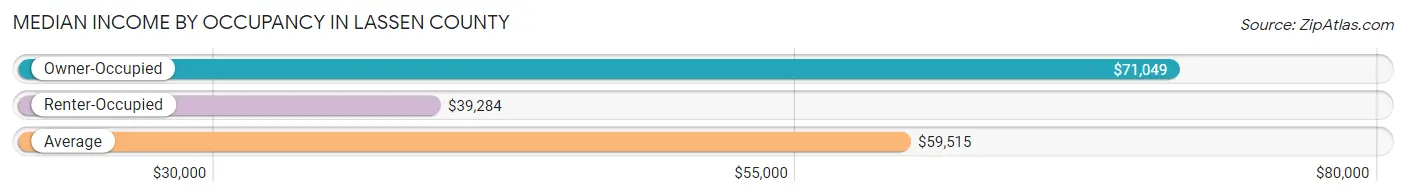
| Occupancy Type | # Households | Median Income |
| Owner-Occupied | 6,131 (68.7%) | $71,049 |
| Renter-Occupied | 2,794 (31.3%) | $39,284 |
| Average | 8,925 (100.0%) | $59,515 |
Occupancy by Householder Income Bracket in Lassen County
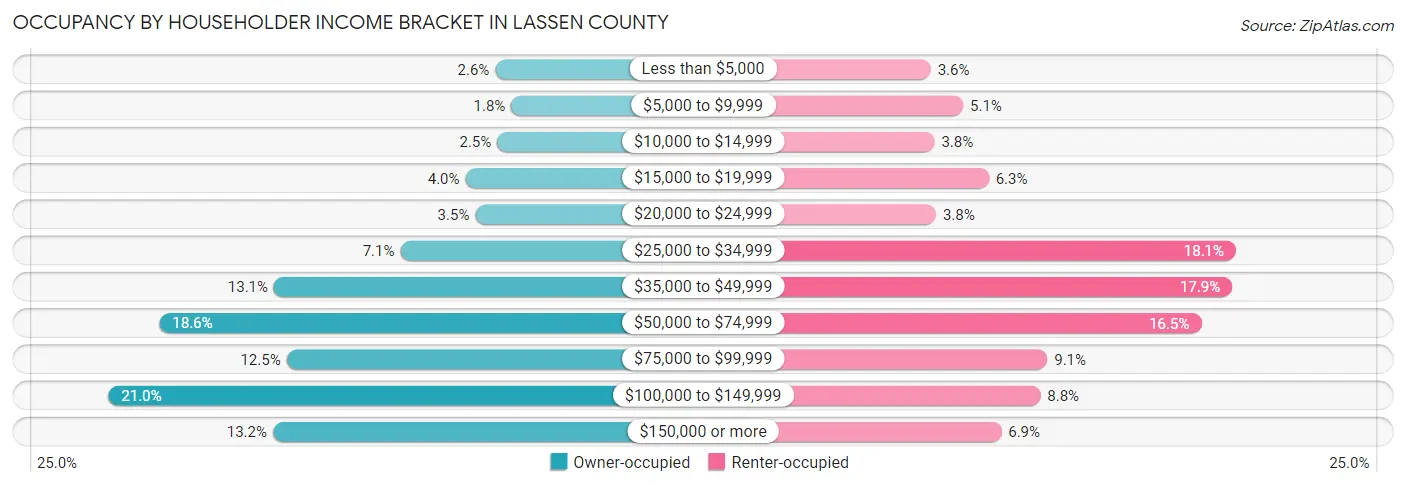
| Income Bracket | Owner-occupied | Renter-occupied |
| Less than $5,000 | 159 (2.6%) | 100 (3.6%) |
| $5,000 to $9,999 | 112 (1.8%) | 143 (5.1%) |
| $10,000 to $14,999 | 153 (2.5%) | 105 (3.8%) |
| $15,000 to $19,999 | 246 (4.0%) | 177 (6.3%) |
| $20,000 to $24,999 | 217 (3.5%) | 107 (3.8%) |
| $25,000 to $34,999 | 436 (7.1%) | 506 (18.1%) |
| $35,000 to $49,999 | 805 (13.1%) | 501 (17.9%) |
| $50,000 to $74,999 | 1,139 (18.6%) | 460 (16.5%) |
| $75,000 to $99,999 | 768 (12.5%) | 255 (9.1%) |
| $100,000 to $149,999 | 1,288 (21.0%) | 246 (8.8%) |
| $150,000 or more | 808 (13.2%) | 194 (6.9%) |
| Total | 6,131 (100.0%) | 2,794 (100.0%) |
Monthly Housing Cost Tiers in Lassen County
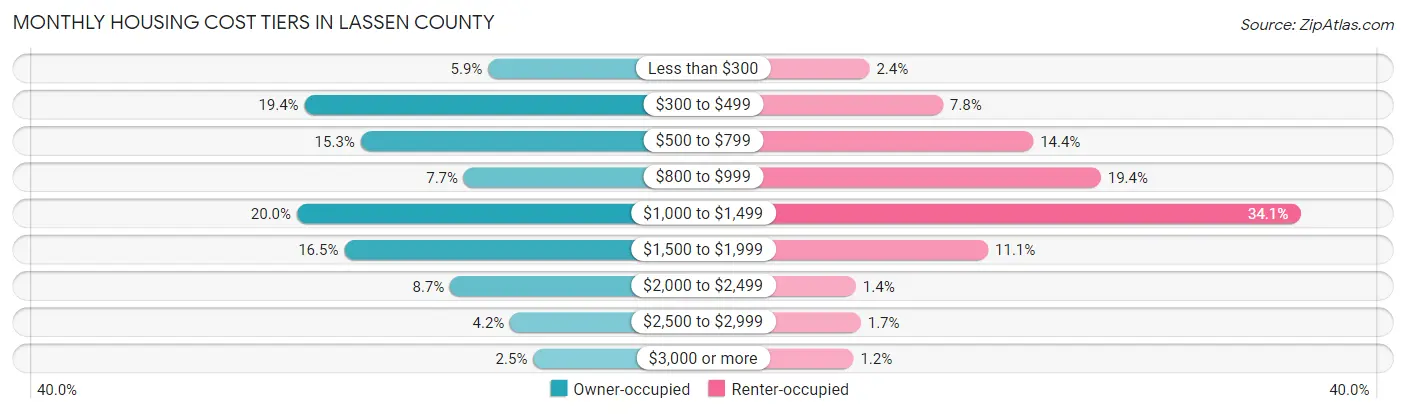
| Monthly Cost | Owner-occupied | Renter-occupied |
| Less than $300 | 359 (5.9%) | 66 (2.4%) |
| $300 to $499 | 1,189 (19.4%) | 217 (7.8%) |
| $500 to $799 | 935 (15.2%) | 403 (14.4%) |
| $800 to $999 | 469 (7.6%) | 542 (19.4%) |
| $1,000 to $1,499 | 1,223 (20.0%) | 952 (34.1%) |
| $1,500 to $1,999 | 1,009 (16.5%) | 310 (11.1%) |
| $2,000 to $2,499 | 531 (8.7%) | 38 (1.4%) |
| $2,500 to $2,999 | 260 (4.2%) | 48 (1.7%) |
| $3,000 or more | 156 (2.5%) | 33 (1.2%) |
| Total | 6,131 (100.0%) | 2,794 (100.0%) |
Physical Housing Characteristics in Lassen County
Housing Structures in Lassen County
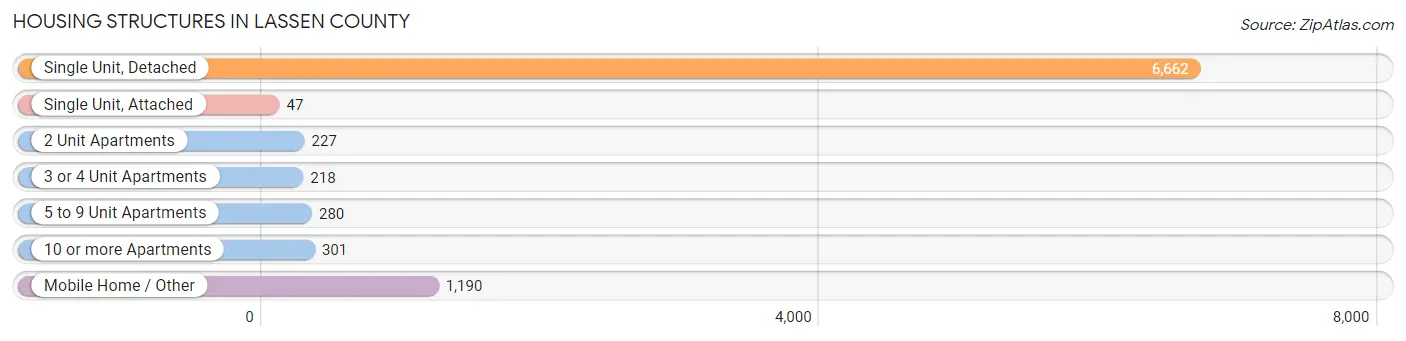
| Structure Type | # Housing Units | % Housing Units |
| Single Unit, Detached | 6,662 | 74.6% |
| Single Unit, Attached | 47 | 0.5% |
| 2 Unit Apartments | 227 | 2.5% |
| 3 or 4 Unit Apartments | 218 | 2.4% |
| 5 to 9 Unit Apartments | 280 | 3.1% |
| 10 or more Apartments | 301 | 3.4% |
| Mobile Home / Other | 1,190 | 13.3% |
| Total | 8,925 | 100.0% |
Housing Structures by Occupancy in Lassen County
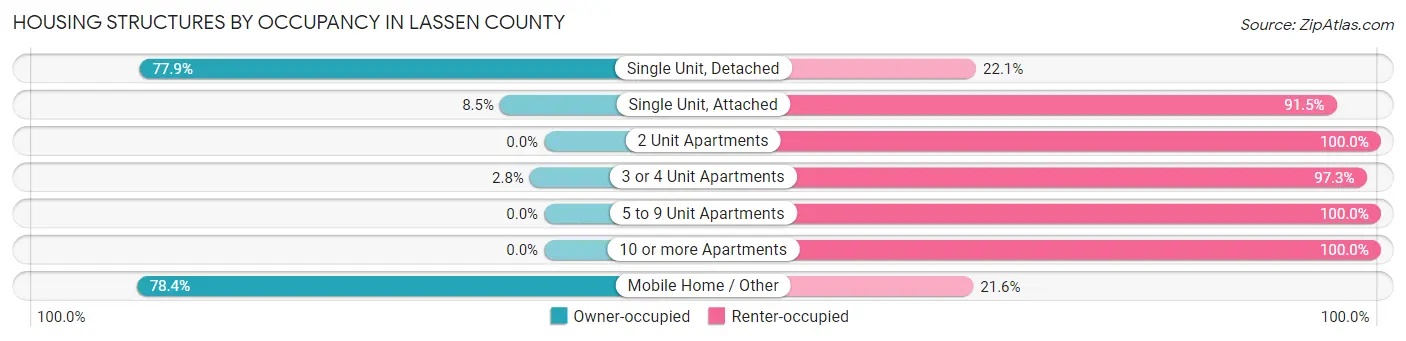
| Structure Type | Owner-occupied | Renter-occupied |
| Single Unit, Detached | 5,188 (77.9%) | 1,474 (22.1%) |
| Single Unit, Attached | 4 (8.5%) | 43 (91.5%) |
| 2 Unit Apartments | 0 (0.0%) | 227 (100.0%) |
| 3 or 4 Unit Apartments | 6 (2.8%) | 212 (97.3%) |
| 5 to 9 Unit Apartments | 0 (0.0%) | 280 (100.0%) |
| 10 or more Apartments | 0 (0.0%) | 301 (100.0%) |
| Mobile Home / Other | 933 (78.4%) | 257 (21.6%) |
| Total | 6,131 (68.7%) | 2,794 (31.3%) |
Housing Structures by Number of Rooms in Lassen County
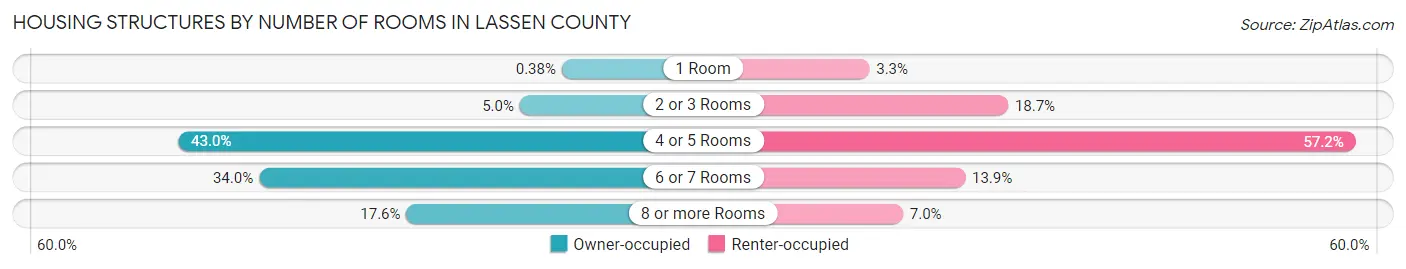
| Number of Rooms | Owner-occupied | Renter-occupied |
| 1 Room | 23 (0.4%) | 91 (3.3%) |
| 2 or 3 Rooms | 309 (5.0%) | 521 (18.6%) |
| 4 or 5 Rooms | 2,634 (43.0%) | 1,599 (57.2%) |
| 6 or 7 Rooms | 2,084 (34.0%) | 388 (13.9%) |
| 8 or more Rooms | 1,081 (17.6%) | 195 (7.0%) |
| Total | 6,131 (100.0%) | 2,794 (100.0%) |
Housing Structure by Heating Type in Lassen County
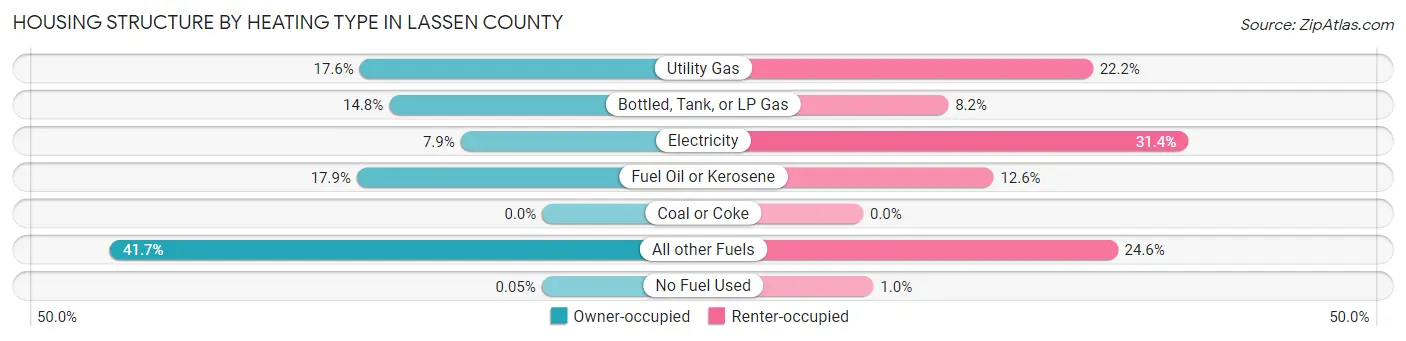
| Heating Type | Owner-occupied | Renter-occupied |
| Utility Gas | 1,081 (17.6%) | 620 (22.2%) |
| Bottled, Tank, or LP Gas | 907 (14.8%) | 230 (8.2%) |
| Electricity | 483 (7.9%) | 877 (31.4%) |
| Fuel Oil or Kerosene | 1,098 (17.9%) | 352 (12.6%) |
| Coal or Coke | 0 (0.0%) | 0 (0.0%) |
| All other Fuels | 2,559 (41.7%) | 687 (24.6%) |
| No Fuel Used | 3 (0.1%) | 28 (1.0%) |
| Total | 6,131 (100.0%) | 2,794 (100.0%) |
Household Vehicle Usage in Lassen County
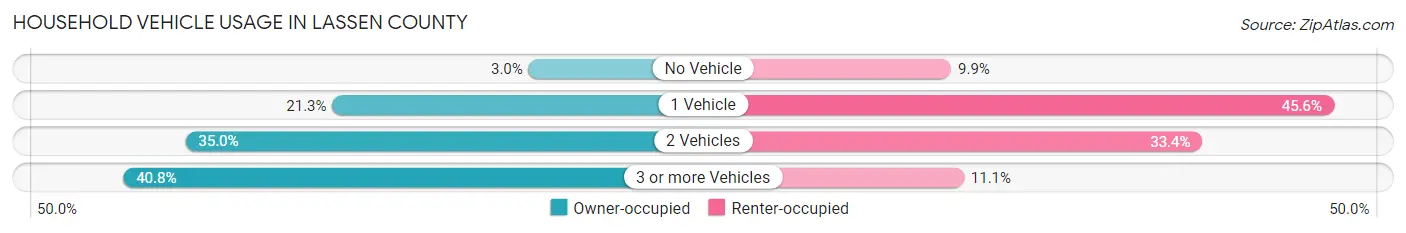
| Vehicles per Household | Owner-occupied | Renter-occupied |
| No Vehicle | 181 (2.9%) | 277 (9.9%) |
| 1 Vehicle | 1,304 (21.3%) | 1,275 (45.6%) |
| 2 Vehicles | 2,145 (35.0%) | 932 (33.4%) |
| 3 or more Vehicles | 2,501 (40.8%) | 310 (11.1%) |
| Total | 6,131 (100.0%) | 2,794 (100.0%) |
Real Estate & Mortgages in Lassen County
Real Estate and Mortgage Overview in Lassen County
| Characteristic | Without Mortgage | With Mortgage |
| Housing Units | 2,850 | 3,281 |
| Median Property Value | $200,900 | $258,300 |
| Median Household Income | $45,867 | $561 |
| Monthly Housing Costs | $480 | $156 |
| Real Estate Taxes | $1,318 | $182 |
Property Value by Mortgage Status in Lassen County
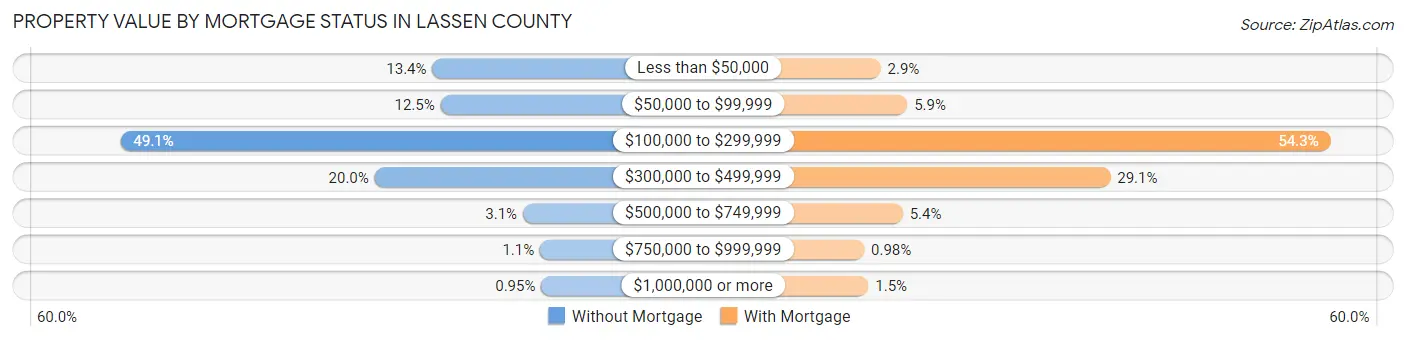
| Property Value | Without Mortgage | With Mortgage |
| Less than $50,000 | 382 (13.4%) | 94 (2.9%) |
| $50,000 to $99,999 | 355 (12.5%) | 194 (5.9%) |
| $100,000 to $299,999 | 1,398 (49.0%) | 1,781 (54.3%) |
| $300,000 to $499,999 | 570 (20.0%) | 955 (29.1%) |
| $500,000 to $749,999 | 87 (3.0%) | 177 (5.4%) |
| $750,000 to $999,999 | 31 (1.1%) | 32 (1.0%) |
| $1,000,000 or more | 27 (0.9%) | 48 (1.5%) |
| Total | 2,850 (100.0%) | 3,281 (100.0%) |
Household Income by Mortgage Status in Lassen County
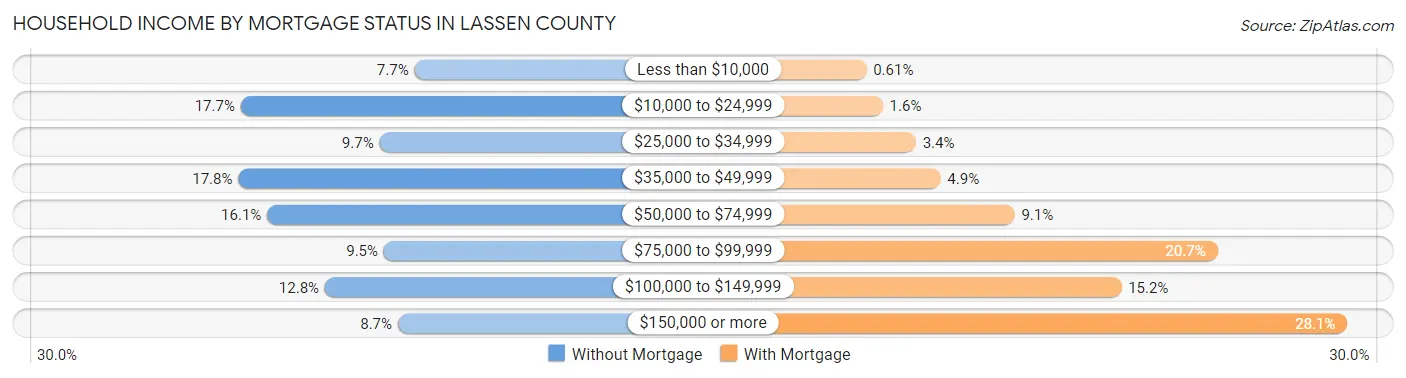
| Household Income | Without Mortgage | With Mortgage |
| Less than $10,000 | 220 (7.7%) | 20 (0.6%) |
| $10,000 to $24,999 | 503 (17.6%) | 51 (1.5%) |
| $25,000 to $34,999 | 277 (9.7%) | 113 (3.4%) |
| $35,000 to $49,999 | 507 (17.8%) | 159 (4.9%) |
| $50,000 to $74,999 | 460 (16.1%) | 298 (9.1%) |
| $75,000 to $99,999 | 270 (9.5%) | 679 (20.7%) |
| $100,000 to $149,999 | 366 (12.8%) | 498 (15.2%) |
| $150,000 or more | 247 (8.7%) | 922 (28.1%) |
| Total | 2,850 (100.0%) | 3,281 (100.0%) |
Property Value to Household Income Ratio in Lassen County
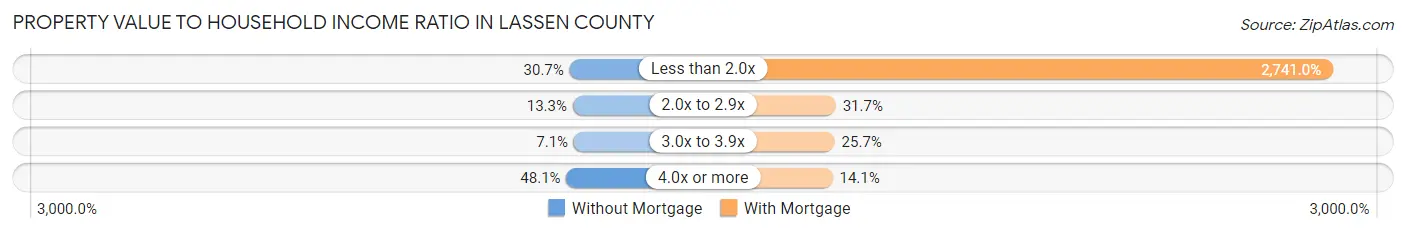
| Value-to-Income Ratio | Without Mortgage | With Mortgage |
| Less than 2.0x | 874 (30.7%) | 89,931 (2,741.0%) |
| 2.0x to 2.9x | 380 (13.3%) | 1,040 (31.7%) |
| 3.0x to 3.9x | 202 (7.1%) | 842 (25.7%) |
| 4.0x or more | 1,370 (48.1%) | 463 (14.1%) |
| Total | 2,850 (100.0%) | 3,281 (100.0%) |
Real Estate Taxes by Mortgage Status in Lassen County
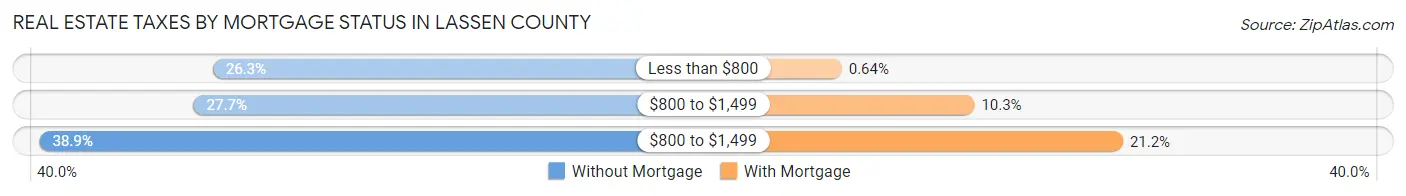
| Property Taxes | Without Mortgage | With Mortgage |
| Less than $800 | 748 (26.3%) | 21 (0.6%) |
| $800 to $1,499 | 788 (27.7%) | 339 (10.3%) |
| $800 to $1,499 | 1,109 (38.9%) | 695 (21.2%) |
| Total | 2,850 (100.0%) | 3,281 (100.0%) |
Health & Disability in Lassen County
Health Insurance Coverage by Age in Lassen County
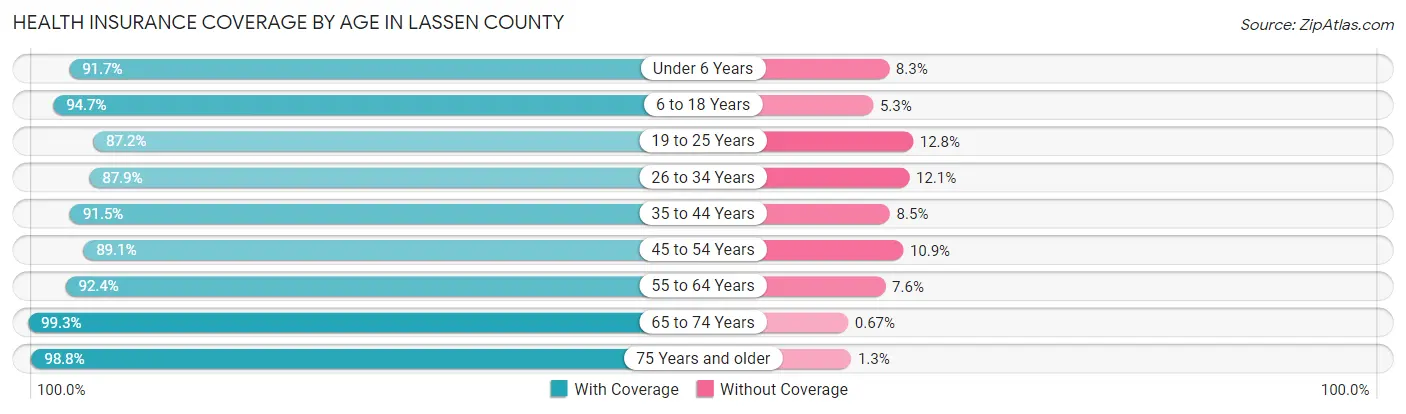
| Age Bracket | With Coverage | Without Coverage |
| Under 6 Years | 1,609 (91.7%) | 146 (8.3%) |
| 6 to 18 Years | 3,793 (94.7%) | 214 (5.3%) |
| 19 to 25 Years | 1,494 (87.2%) | 219 (12.8%) |
| 26 to 34 Years | 2,558 (87.9%) | 351 (12.1%) |
| 35 to 44 Years | 2,522 (91.5%) | 233 (8.5%) |
| 45 to 54 Years | 2,605 (89.1%) | 320 (10.9%) |
| 55 to 64 Years | 3,054 (92.4%) | 252 (7.6%) |
| 65 to 74 Years | 2,801 (99.3%) | 19 (0.7%) |
| 75 Years and older | 1,895 (98.8%) | 24 (1.3%) |
| Total | 22,331 (92.6%) | 1,778 (7.4%) |
Health Insurance Coverage by Citizenship Status in Lassen County
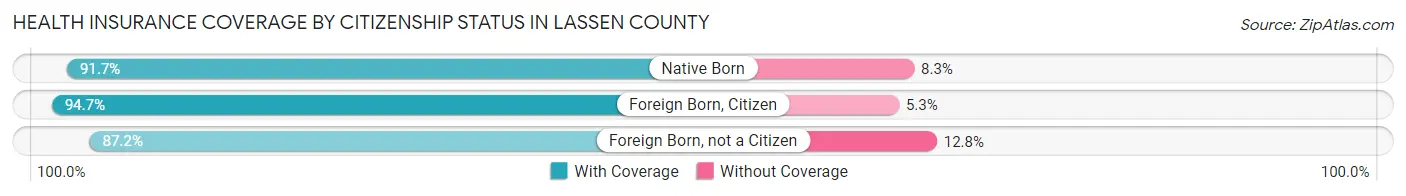
| Citizenship Status | With Coverage | Without Coverage |
| Native Born | 1,609 (91.7%) | 146 (8.3%) |
| Foreign Born, Citizen | 3,793 (94.7%) | 214 (5.3%) |
| Foreign Born, not a Citizen | 1,494 (87.2%) | 219 (12.8%) |
Health Insurance Coverage by Household Income in Lassen County
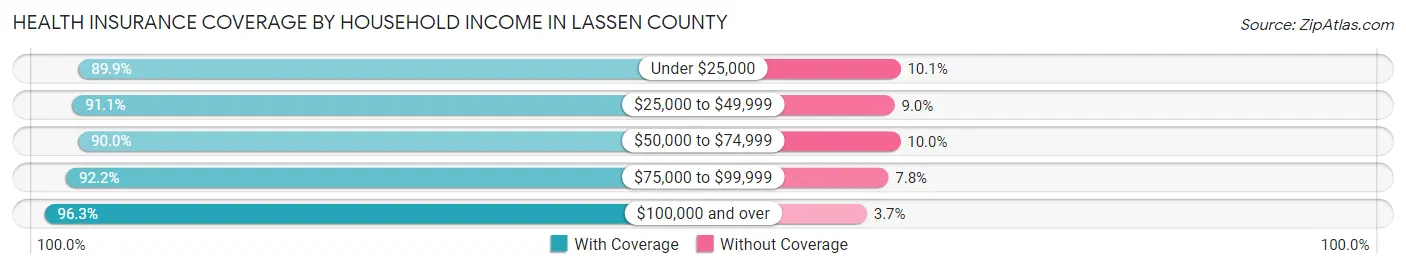
| Household Income | With Coverage | Without Coverage |
| Under $25,000 | 2,547 (89.9%) | 285 (10.1%) |
| $25,000 to $49,999 | 4,394 (91.0%) | 432 (8.9%) |
| $50,000 to $74,999 | 4,153 (90.0%) | 463 (10.0%) |
| $75,000 to $99,999 | 2,738 (92.2%) | 231 (7.8%) |
| $100,000 and over | 8,285 (96.3%) | 322 (3.7%) |
Public vs Private Health Insurance Coverage by Age in Lassen County
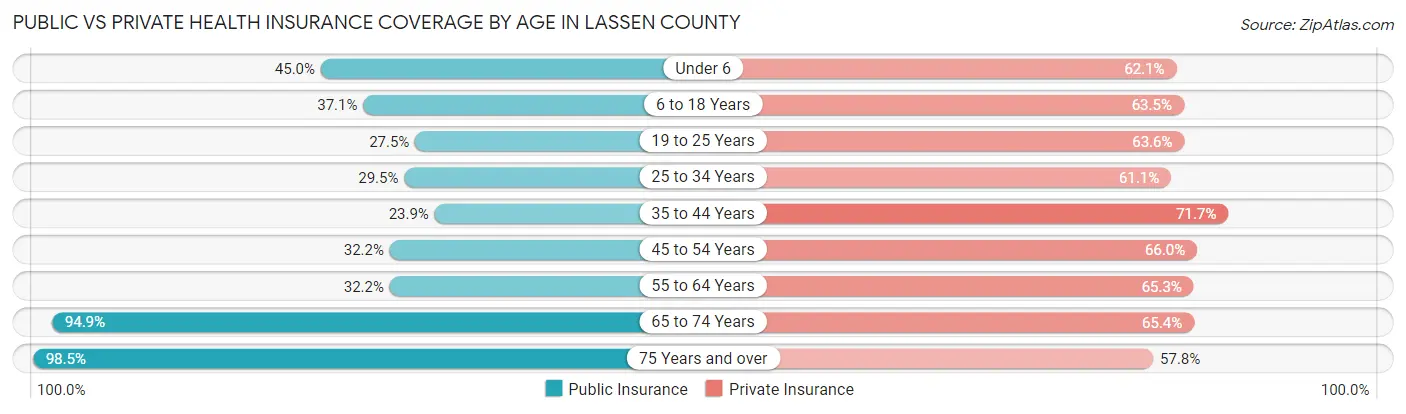
| Age Bracket | Public Insurance | Private Insurance |
| Under 6 | 790 (45.0%) | 1,090 (62.1%) |
| 6 to 18 Years | 1,488 (37.1%) | 2,543 (63.5%) |
| 19 to 25 Years | 471 (27.5%) | 1,089 (63.6%) |
| 25 to 34 Years | 859 (29.5%) | 1,778 (61.1%) |
| 35 to 44 Years | 658 (23.9%) | 1,976 (71.7%) |
| 45 to 54 Years | 942 (32.2%) | 1,929 (65.9%) |
| 55 to 64 Years | 1,065 (32.2%) | 2,159 (65.3%) |
| 65 to 74 Years | 2,677 (94.9%) | 1,844 (65.4%) |
| 75 Years and over | 1,890 (98.5%) | 1,109 (57.8%) |
| Total | 10,840 (45.0%) | 15,517 (64.4%) |
Disability Status by Sex by Age in Lassen County
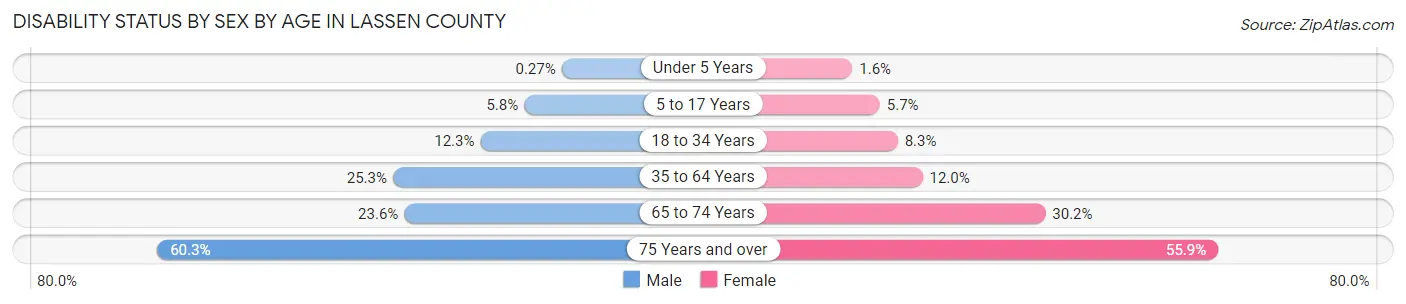
| Age Bracket | Male | Female |
| Under 5 Years | 2 (0.3%) | 12 (1.6%) |
| 5 to 17 Years | 119 (5.8%) | 108 (5.7%) |
| 18 to 34 Years | 350 (12.3%) | 174 (8.3%) |
| 35 to 64 Years | 1,144 (25.3%) | 536 (12.0%) |
| 65 to 74 Years | 339 (23.6%) | 419 (30.2%) |
| 75 Years and over | 530 (60.3%) | 581 (55.9%) |
Disability Class by Sex by Age in Lassen County
Disability Class: Hearing Difficulty
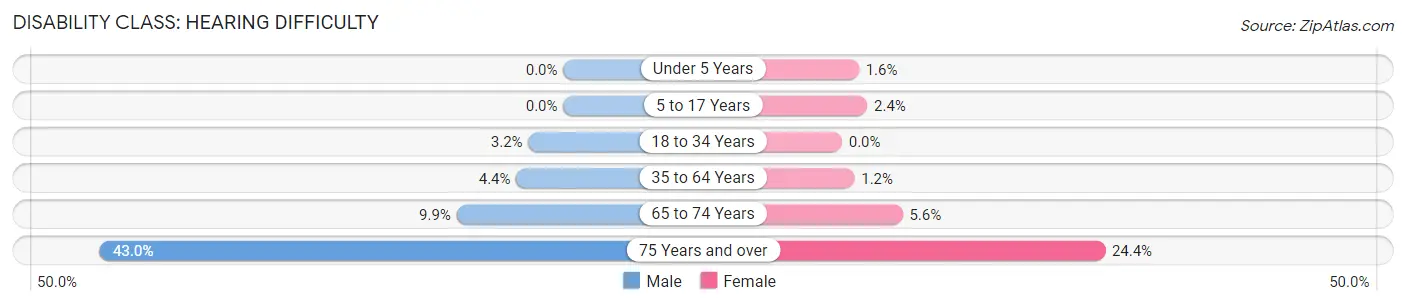
| Age Bracket | Male | Female |
| Under 5 Years | 0 (0.0%) | 12 (1.6%) |
| 5 to 17 Years | 0 (0.0%) | 45 (2.4%) |
| 18 to 34 Years | 92 (3.2%) | 0 (0.0%) |
| 35 to 64 Years | 197 (4.4%) | 52 (1.2%) |
| 65 to 74 Years | 142 (9.9%) | 78 (5.6%) |
| 75 Years and over | 378 (43.0%) | 254 (24.4%) |
Disability Class: Vision Difficulty
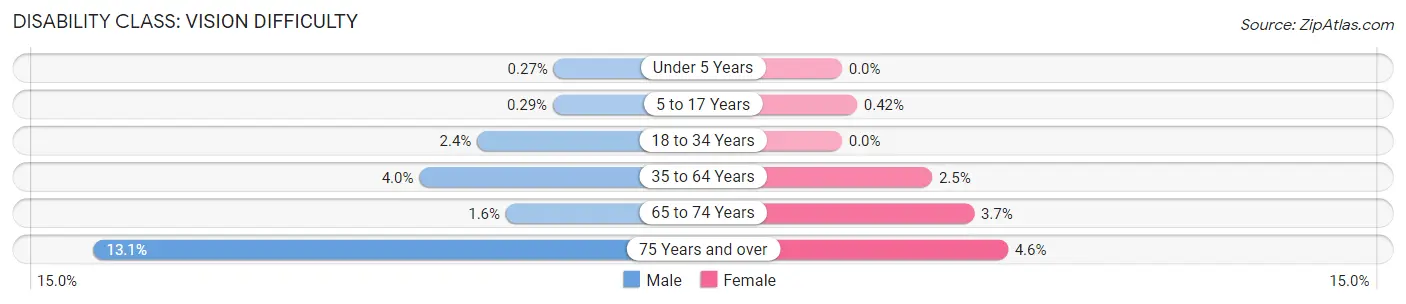
| Age Bracket | Male | Female |
| Under 5 Years | 2 (0.3%) | 0 (0.0%) |
| 5 to 17 Years | 6 (0.3%) | 8 (0.4%) |
| 18 to 34 Years | 68 (2.4%) | 0 (0.0%) |
| 35 to 64 Years | 181 (4.0%) | 112 (2.5%) |
| 65 to 74 Years | 23 (1.6%) | 51 (3.7%) |
| 75 Years and over | 115 (13.1%) | 48 (4.6%) |
Disability Class: Cognitive Difficulty
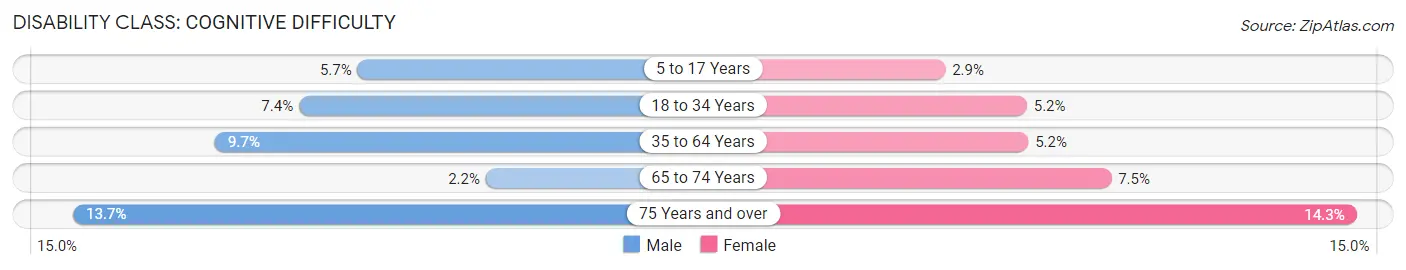
| Age Bracket | Male | Female |
| 5 to 17 Years | 117 (5.7%) | 55 (2.9%) |
| 18 to 34 Years | 209 (7.4%) | 108 (5.1%) |
| 35 to 64 Years | 438 (9.7%) | 232 (5.2%) |
| 65 to 74 Years | 31 (2.2%) | 104 (7.5%) |
| 75 Years and over | 120 (13.7%) | 149 (14.3%) |
Disability Class: Ambulatory Difficulty
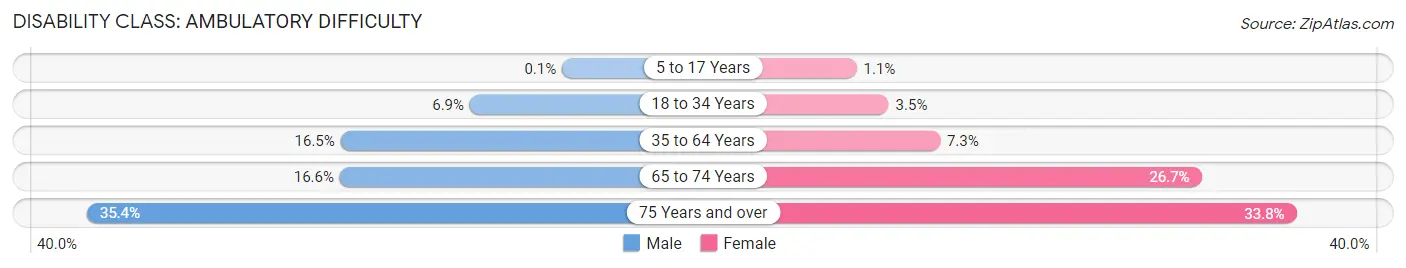
| Age Bracket | Male | Female |
| 5 to 17 Years | 2 (0.1%) | 21 (1.1%) |
| 18 to 34 Years | 197 (6.9%) | 73 (3.5%) |
| 35 to 64 Years | 747 (16.5%) | 326 (7.3%) |
| 65 to 74 Years | 238 (16.6%) | 370 (26.7%) |
| 75 Years and over | 311 (35.4%) | 351 (33.8%) |
Disability Class: Self-Care Difficulty
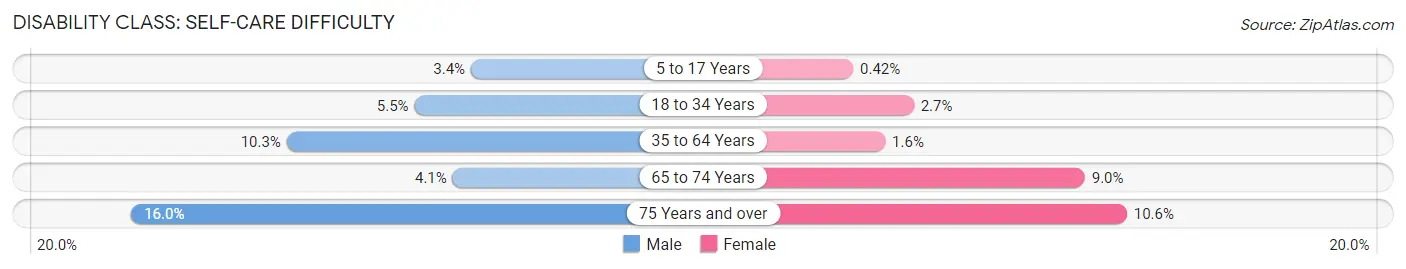
| Age Bracket | Male | Female |
| 5 to 17 Years | 70 (3.4%) | 8 (0.4%) |
| 18 to 34 Years | 157 (5.5%) | 56 (2.7%) |
| 35 to 64 Years | 464 (10.3%) | 72 (1.6%) |
| 65 to 74 Years | 59 (4.1%) | 125 (9.0%) |
| 75 Years and over | 141 (16.0%) | 110 (10.6%) |
Technology Access in Lassen County
Computing Device Access in Lassen County
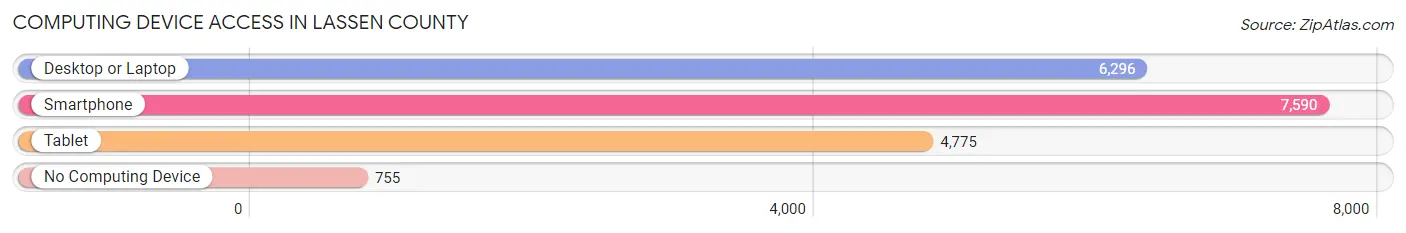
| Device Type | # Households | % Households |
| Desktop or Laptop | 6,296 | 70.5% |
| Smartphone | 7,590 | 85.0% |
| Tablet | 4,775 | 53.5% |
| No Computing Device | 755 | 8.5% |
| Total | 8,925 | 100.0% |
Internet Access in Lassen County
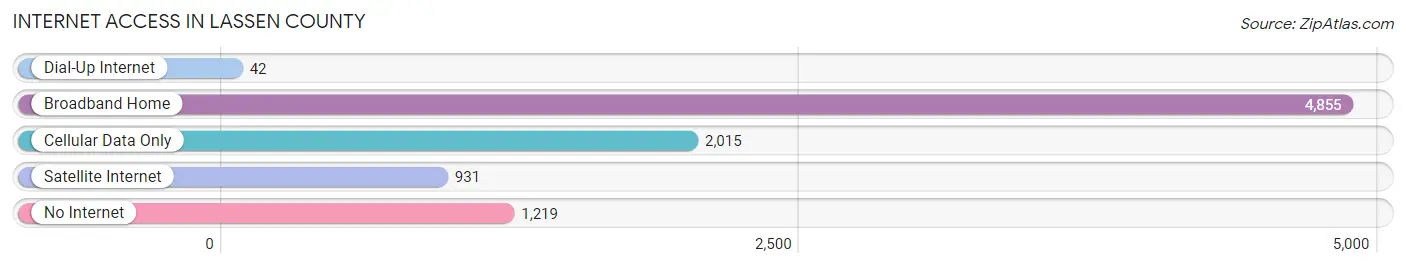
| Internet Type | # Households | % Households |
| Dial-Up Internet | 42 | 0.5% |
| Broadband Home | 4,855 | 54.4% |
| Cellular Data Only | 2,015 | 22.6% |
| Satellite Internet | 931 | 10.4% |
| No Internet | 1,219 | 13.7% |
| Total | 8,925 | 100.0% |
Lassen County Summary
Lassen County is a county located in the northeastern part of the U.S. state of California. As of the 2010 census, the population was 34,895. The county seat and only incorporated city is Susanville. Lassen County comprises the Susanville, California micropolitan statistical area.
History
Lassen County was formed in 1864 from parts of Plumas and Shasta counties. It was named after Peter Lassen, an early explorer in the area. Lassen was one of the 18 counties formed during California's statehood.
The county was named after Peter Lassen, a Danish-born frontiersman and trapper who explored the area in the early 1800s. Lassen was a guide and explorer for John C. Fremont's second expedition to California in 1844-45.
Geography
Lassen County is located in the northeastern corner of California, bordering Nevada to the east and Oregon to the north. It is bordered by Plumas County to the west, Shasta County to the south, and Modoc County to the southeast. The county covers an area of 4,890 square miles, making it the fifth-largest county in California.
The county is mostly mountainous, with the Sierra Nevada range to the west and the Cascade Range to the east. The highest point in the county is Eagle Peak, at 9,235 feet. The county also contains several volcanic peaks, including Lassen Peak, the southernmost active volcano in the Cascade Range.
The county is home to several large lakes, including Eagle Lake, Lake Almanor, and Lake Britton. The Susan River, a tributary of the Feather River, flows through the county.
Economy
Lassen County is a rural county with a largely agricultural economy. The county's main industries are timber, livestock, and mining.
The county is home to several large timber companies, including Sierra Pacific Industries and Sierra Pacific Lumber. The timber industry is the county's largest employer, providing jobs for over 1,000 people.
Livestock is also an important part of the county's economy. Cattle, sheep, and horses are raised in the county, and the county is home to several large dairies.
Mining is also an important part of the county's economy. The county is home to several gold and silver mines, as well as several other mineral mines.
Demographics
As of the 2010 census, there were 34,895 people, 11,845 households, and 8,845 families residing in the county. The population density was 7.2 people per square mile. There were 13,717 housing units at an average density of 2.8 per square mile.
The racial makeup of the county was 87.3% White, 0.7% African American, 4.2% Native American, 0.7% Asian, 0.1% Pacific Islander, 3.2% from other races, and 4.0% from two or more races. Hispanic or Latino of any race were 10.2% of the population.
The median income for a household in the county was $37,813, and the median income for a family was $45,890. The per capita income for the county was $18,845. About 13.2% of families and 17.2% of the population were below the poverty line, including 24.2% of those under age 18 and 8.2% of those age 65 or over.
Common Questions
What is Per Capita Income in Lassen County?
Per Capita income in Lassen County is $23,646.
What is the Median Family Income in Lassen County?
Median Family Income in Lassen County is $69,158.
What is the Median Household income in Lassen County?
Median Household Income in Lassen County is $59,515.
What is Income or Wage Gap in Lassen County?
Income or Wage Gap in Lassen County is 17.8%.
Women in Lassen County earn 82.2 cents for every dollar earned by a man.
What is Family Income Deficit in Lassen County?
Family Income Deficit in Lassen County is $9,437.
Families that are below poverty line in Lassen County earn $9,437 less on average than the poverty threshold level.
What is Inequality or Gini Index in Lassen County?
Inequality or Gini Index in Lassen County is 0.42.
What is the Total Population of Lassen County?
Total Population of Lassen County is 31,873.
What is the Total Male Population of Lassen County?
Total Male Population of Lassen County is 20,127.
What is the Total Female Population of Lassen County?
Total Female Population of Lassen County is 11,746.
What is the Ratio of Males per 100 Females in Lassen County?
There are 171.35 Males per 100 Females in Lassen County.
What is the Ratio of Females per 100 Males in Lassen County?
There are 58.36 Females per 100 Males in Lassen County.
What is the Median Population Age in Lassen County?
Median Population Age in Lassen County is 37.2 Years.
What is the Average Family Size in Lassen County
Average Family Size in Lassen County is 3.2 People.
What is the Average Household Size in Lassen County
Average Household Size in Lassen County is 2.7 People.
How Large is the Labor Force in Lassen County?
There are 9,848 People in the Labor Forcein in Lassen County.
What is the Percentage of People in the Labor Force in Lassen County?
36.5% of People are in the Labor Force in Lassen County.
What is the Unemployment Rate in Lassen County?
Unemployment Rate in Lassen County is 7.9%.