Lake County, CA Map & Demographics
Lake County Map
Lake County Overview
$34,020
PER CAPITA INCOME
$77,378
AVG FAMILY INCOME
$56,259
AVG HOUSEHOLD INCOME
28.7%
WAGE / INCOME GAP [ % ]
71.3¢/ $1
WAGE / INCOME GAP [ $ ]
$10,669
FAMILY INCOME DEFICIT
0.49
INEQUALITY / GINI INDEX
68,024
TOTAL POPULATION
34,144
MALE POPULATION
33,880
FEMALE POPULATION
100.78
MALES / 100 FEMALES
99.23
FEMALES / 100 MALES
44.5
MEDIAN AGE
3.2
AVG FAMILY SIZE
2.5
AVG HOUSEHOLD SIZE
28,403
LABOR FORCE [ PEOPLE ]
51.7%
PERCENT IN LABOR FORCE
10.4%
UNEMPLOYMENT RATE
Lake County Area Codes
Income in Lake County
Income Overview in Lake County
Per Capita Income in Lake County is $34,020, while median incomes of families and households are $77,378 and $56,259 respectively.
| Characteristic | Number | Measure |
| Per Capita Income | 68,024 | $34,020 |
| Median Family Income | 15,698 | $77,378 |
| Mean Family Income | 15,698 | $104,177 |
| Median Household Income | 26,487 | $56,259 |
| Mean Household Income | 26,487 | $83,917 |
| Income Deficit | 15,698 | $10,669 |
| Wage / Income Gap (%) | 68,024 | 28.65% |
| Wage / Income Gap ($) | 68,024 | 71.35¢ per $1 |
| Gini / Inequality Index | 68,024 | 0.49 |
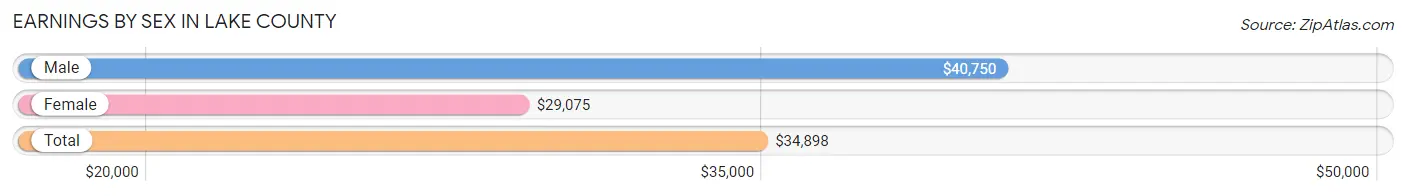
Earnings by Sex in Lake County
Average Earnings in Lake County are $34,898, $40,750 for men and $29,075 for women, a difference of 28.6%.
| Sex | Number | Average Earnings |
| Male | 15,848 (53.3%) | $40,750 |
| Female | 13,879 (46.7%) | $29,075 |
| Total | 29,727 (100.0%) | $34,898 |
Earnings by Sex by Income Bracket in Lake County
The most common earnings brackets in Lake County are $100,000+ for men (2,556 | 16.1%) and $25,000 to $29,999 for women (1,135 | 8.2%).
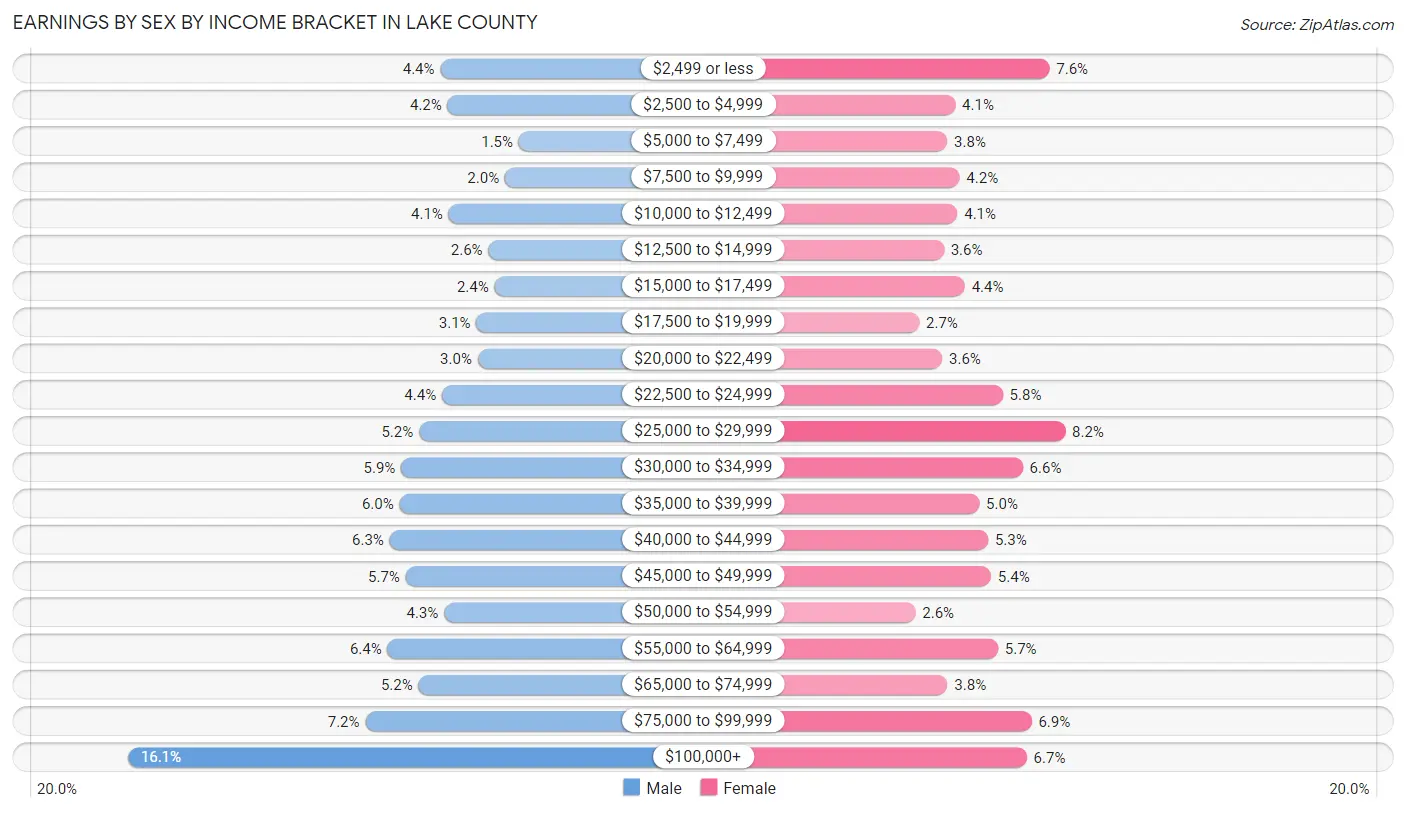
| Income | Male | Female |
| $2,499 or less | 700 (4.4%) | 1,053 (7.6%) |
| $2,500 to $4,999 | 658 (4.2%) | 563 (4.1%) |
| $5,000 to $7,499 | 234 (1.5%) | 522 (3.8%) |
| $7,500 to $9,999 | 317 (2.0%) | 586 (4.2%) |
| $10,000 to $12,499 | 652 (4.1%) | 574 (4.1%) |
| $12,500 to $14,999 | 416 (2.6%) | 504 (3.6%) |
| $15,000 to $17,499 | 378 (2.4%) | 614 (4.4%) |
| $17,500 to $19,999 | 486 (3.1%) | 376 (2.7%) |
| $20,000 to $22,499 | 478 (3.0%) | 495 (3.6%) |
| $22,500 to $24,999 | 691 (4.4%) | 811 (5.8%) |
| $25,000 to $29,999 | 827 (5.2%) | 1,135 (8.2%) |
| $30,000 to $34,999 | 933 (5.9%) | 914 (6.6%) |
| $35,000 to $39,999 | 943 (5.9%) | 688 (5.0%) |
| $40,000 to $44,999 | 1,002 (6.3%) | 734 (5.3%) |
| $45,000 to $49,999 | 907 (5.7%) | 749 (5.4%) |
| $50,000 to $54,999 | 679 (4.3%) | 356 (2.6%) |
| $55,000 to $64,999 | 1,014 (6.4%) | 786 (5.7%) |
| $65,000 to $74,999 | 831 (5.2%) | 523 (3.8%) |
| $75,000 to $99,999 | 1,146 (7.2%) | 960 (6.9%) |
| $100,000+ | 2,556 (16.1%) | 936 (6.7%) |
| Total | 15,848 (100.0%) | 13,879 (100.0%) |
Earnings by Sex by Educational Attainment in Lake County
Average earnings in Lake County are $42,340 for men and $33,355 for women, a difference of 21.2%. Men with an educational attainment of graduate degree enjoy the highest average annual earnings of $69,444, while those with less than high school education earn the least with $35,872. Women with an educational attainment of graduate degree earn the most with the average annual earnings of $59,637, while those with high school diploma education have the smallest earnings of $26,453.
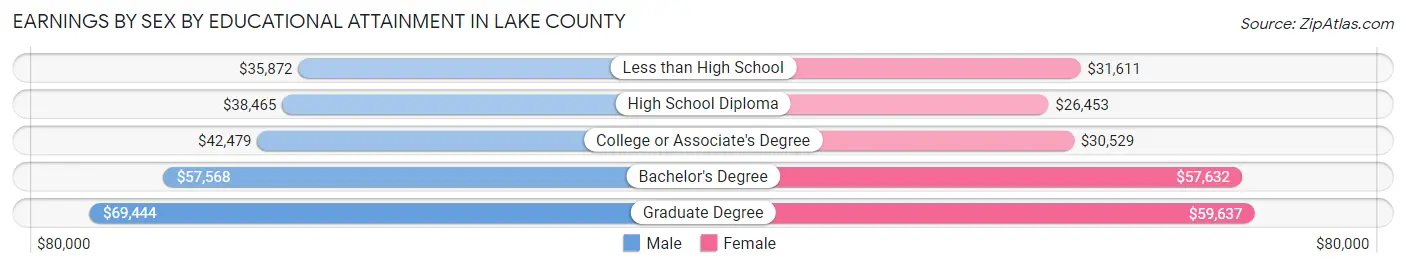
| Educational Attainment | Male Income | Female Income |
| Less than High School | $35,872 | $31,611 |
| High School Diploma | $38,465 | $26,453 |
| College or Associate's Degree | $42,479 | $30,529 |
| Bachelor's Degree | $57,568 | $57,632 |
| Graduate Degree | $69,444 | $59,637 |
| Total | $42,340 | $33,355 |
Family Income in Lake County
Family Income Brackets in Lake County
According to the Lake County family income data, there are 2,857 families falling into the $100,000 to $149,999 income range, which is the most common income bracket and makes up 18.2% of all families. Conversely, the $10,000 to $14,999 income bracket is the least frequent group with only 267 families (1.7%) belonging to this category.
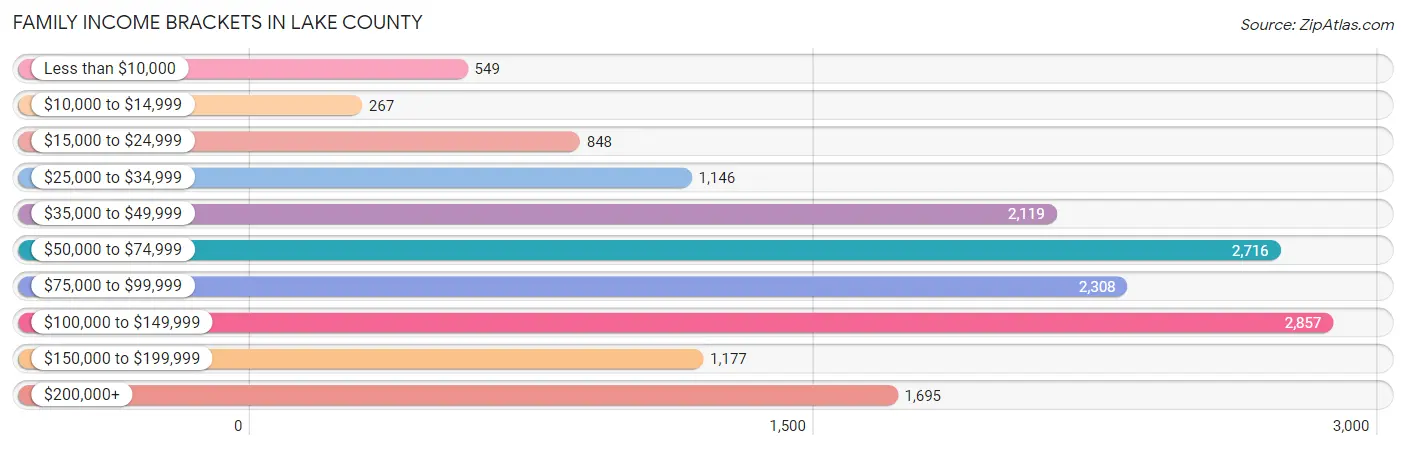
| Income Bracket | # Families | % Families |
| Less than $10,000 | 549 | 3.5% |
| $10,000 to $14,999 | 267 | 1.7% |
| $15,000 to $24,999 | 848 | 5.4% |
| $25,000 to $34,999 | 1,146 | 7.3% |
| $35,000 to $49,999 | 2,119 | 13.5% |
| $50,000 to $74,999 | 2,716 | 17.3% |
| $75,000 to $99,999 | 2,308 | 14.7% |
| $100,000 to $149,999 | 2,857 | 18.2% |
| $150,000 to $199,999 | 1,177 | 7.5% |
| $200,000+ | 1,695 | 10.8% |
Family Income by Famaliy Size in Lake County
7+ person families (259 | 1.7%) account for the highest median family income in Lake County with $118,240 per family, while 2-person families (8,015 | 51.1%) have the highest median income of $34,453 per family member.
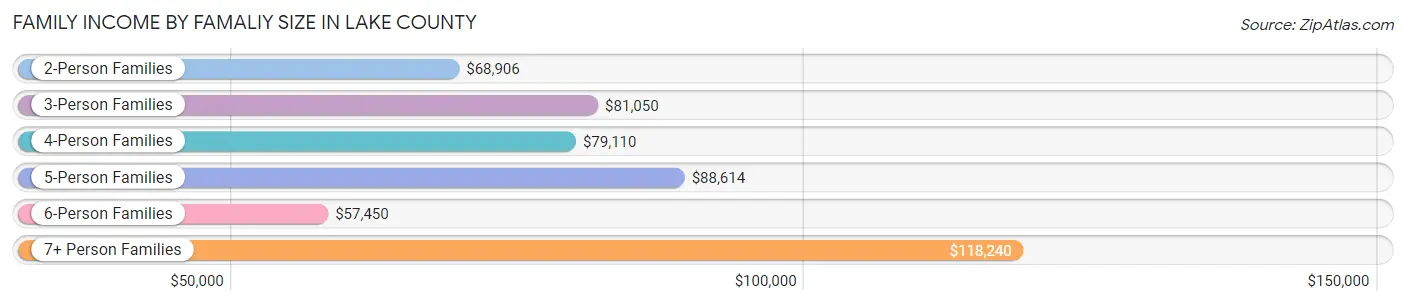
| Income Bracket | # Families | Median Income |
| 2-Person Families | 8,015 (51.1%) | $68,906 |
| 3-Person Families | 3,100 (19.8%) | $81,050 |
| 4-Person Families | 2,593 (16.5%) | $79,110 |
| 5-Person Families | 1,194 (7.6%) | $88,614 |
| 6-Person Families | 537 (3.4%) | $57,450 |
| 7+ Person Families | 259 (1.7%) | $118,240 |
| Total | 15,698 (100.0%) | $77,378 |
Family Income by Number of Earners in Lake County
The median family income in Lake County is $77,378, with families comprising 3+ earners (1,552) having the highest median family income of $119,439, while families with no earners (3,603) have the lowest median family income of $51,725, accounting for 9.9% and 23.0% of families, respectively.
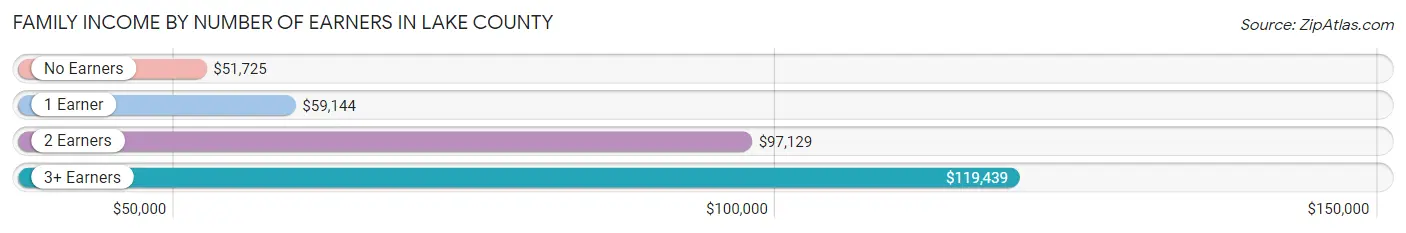
| Number of Earners | # Families | Median Income |
| No Earners | 3,603 (23.0%) | $51,725 |
| 1 Earner | 5,358 (34.1%) | $59,144 |
| 2 Earners | 5,185 (33.0%) | $97,129 |
| 3+ Earners | 1,552 (9.9%) | $119,439 |
| Total | 15,698 (100.0%) | $77,378 |
Household Income in Lake County
Household Income Brackets in Lake County
With 4,715 households falling in the category, the $50,000 to $74,999 income range is the most frequent in Lake County, accounting for 17.8% of all households. In contrast, only 1,351 households (5.1%) fall into the $10,000 to $14,999 income bracket, making it the least populous group.
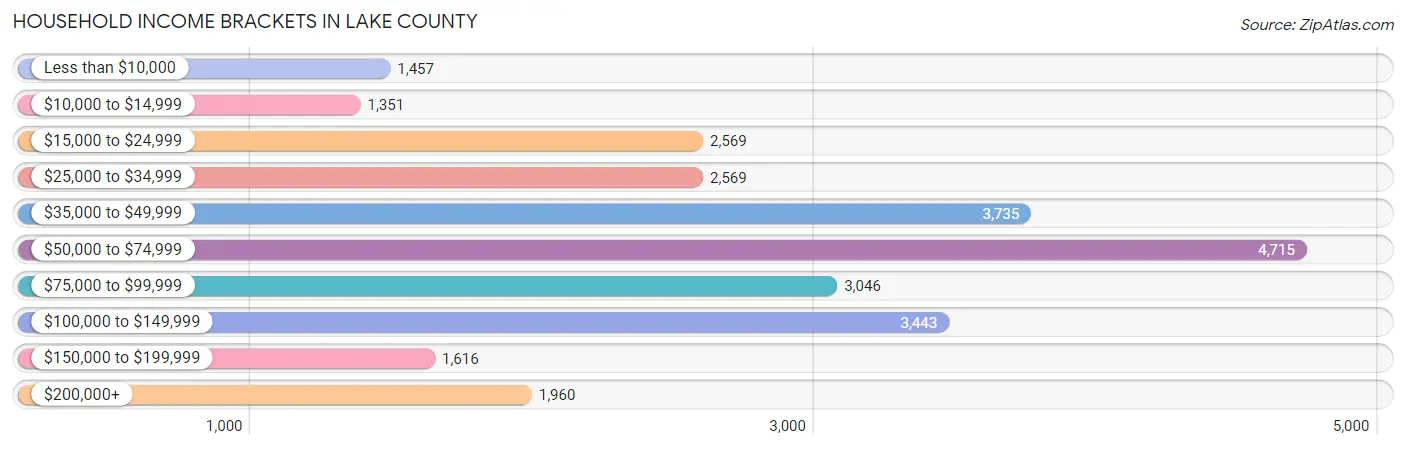
| Income Bracket | # Households | % Households |
| Less than $10,000 | 1,457 | 5.5% |
| $10,000 to $14,999 | 1,351 | 5.1% |
| $15,000 to $24,999 | 2,569 | 9.7% |
| $25,000 to $34,999 | 2,569 | 9.7% |
| $35,000 to $49,999 | 3,735 | 14.1% |
| $50,000 to $74,999 | 4,715 | 17.8% |
| $75,000 to $99,999 | 3,046 | 11.5% |
| $100,000 to $149,999 | 3,443 | 13.0% |
| $150,000 to $199,999 | 1,616 | 6.1% |
| $200,000+ | 1,960 | 7.4% |
Household Income by Householder Age in Lake County
The median household income in Lake County is $56,259, with the highest median household income of $64,075 found in the 25 to 44 years age bracket for the primary householder. A total of 6,572 households (24.8%) fall into this category. Meanwhile, the 15 to 24 years age bracket for the primary householder has the lowest median household income of $45,622, with 697 households (2.6%) in this group.
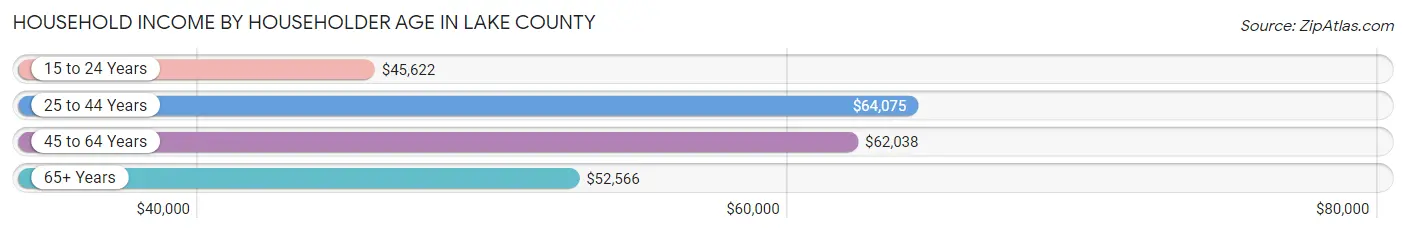
| Income Bracket | # Households | Median Income |
| 15 to 24 Years | 697 (2.6%) | $45,622 |
| 25 to 44 Years | 6,572 (24.8%) | $64,075 |
| 45 to 64 Years | 9,100 (34.4%) | $62,038 |
| 65+ Years | 10,118 (38.2%) | $52,566 |
| Total | 26,487 (100.0%) | $56,259 |
Poverty in Lake County
Income Below Poverty by Sex and Age in Lake County
With 15.2% poverty level for males and 18.0% for females among the residents of Lake County, 6 to 11 year old males and 5 year old females are the most vulnerable to poverty, with 716 males (31.8%) and 112 females (49.3%) in their respective age groups living below the poverty level.
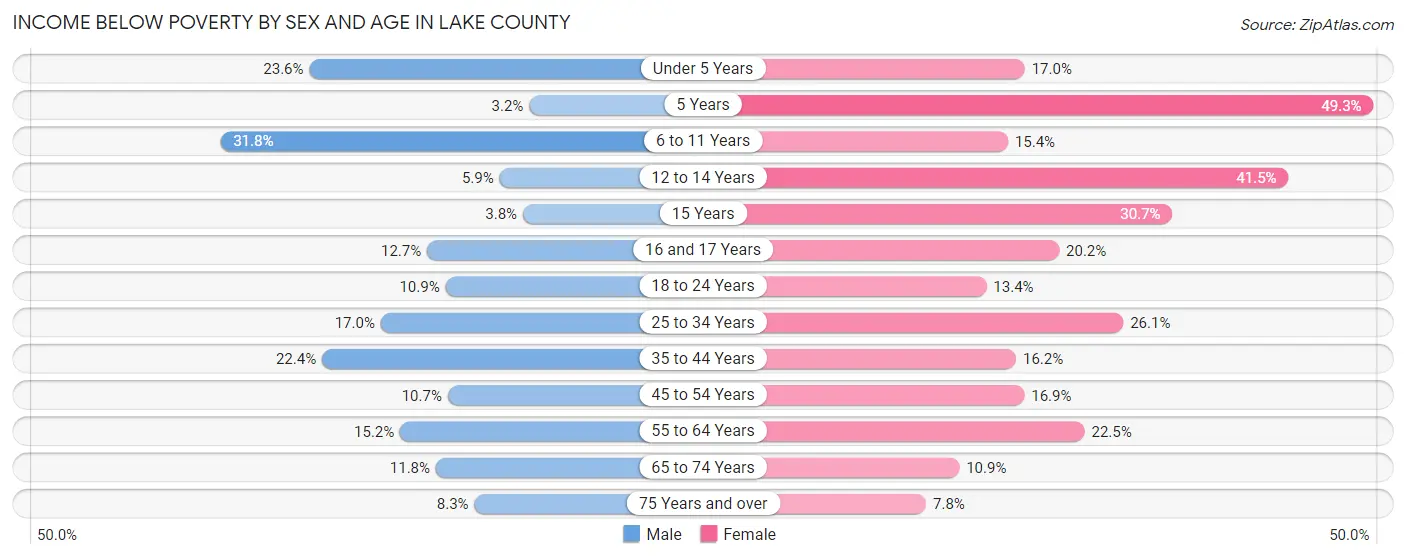
| Age Bracket | Male | Female |
| Under 5 Years | 428 (23.6%) | 314 (17.0%) |
| 5 Years | 9 (3.2%) | 112 (49.3%) |
| 6 to 11 Years | 716 (31.8%) | 345 (15.4%) |
| 12 to 14 Years | 88 (5.9%) | 499 (41.4%) |
| 15 Years | 19 (3.7%) | 154 (30.7%) |
| 16 and 17 Years | 104 (12.7%) | 121 (20.2%) |
| 18 to 24 Years | 261 (10.9%) | 289 (13.4%) |
| 25 to 34 Years | 635 (17.0%) | 936 (26.1%) |
| 35 to 44 Years | 868 (22.4%) | 617 (16.2%) |
| 45 to 54 Years | 402 (10.7%) | 645 (16.9%) |
| 55 to 64 Years | 757 (15.1%) | 1,175 (22.5%) |
| 65 to 74 Years | 558 (11.8%) | 536 (10.9%) |
| 75 Years and over | 237 (8.3%) | 240 (7.8%) |
| Total | 5,082 (15.2%) | 5,983 (18.0%) |
Income Above Poverty by Sex and Age in Lake County
According to the poverty statistics in Lake County, males aged 5 years and females aged 75 years and over are the age groups that are most secure financially, with 96.8% of males and 92.2% of females in these age groups living above the poverty line.
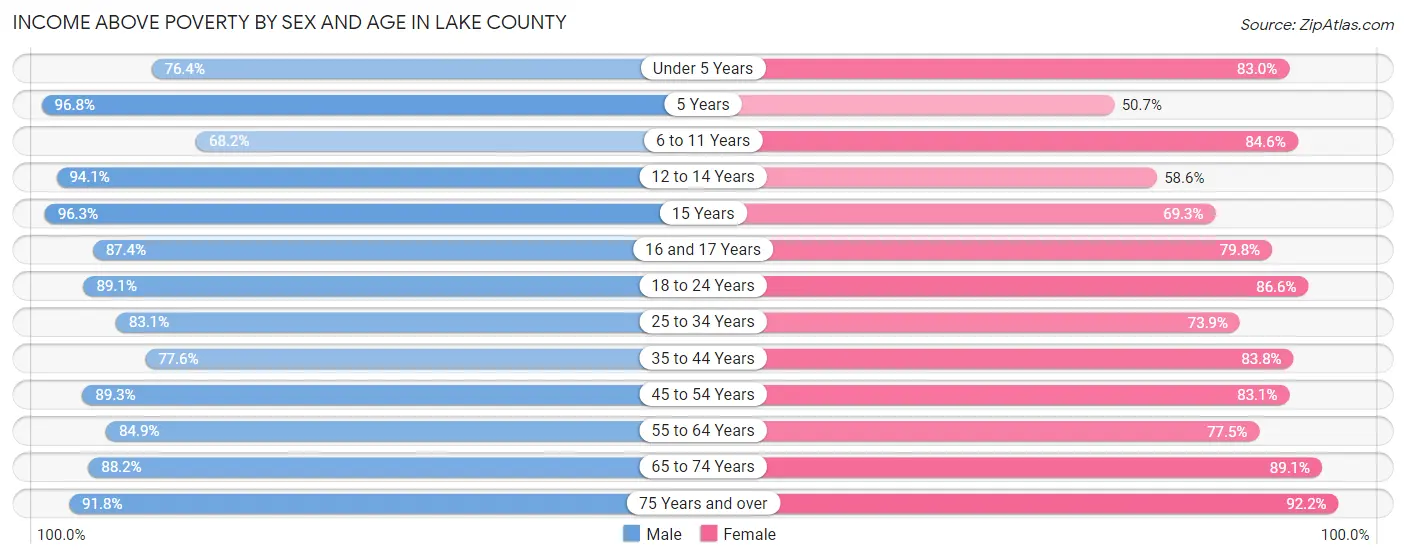
| Age Bracket | Male | Female |
| Under 5 Years | 1,388 (76.4%) | 1,535 (83.0%) |
| 5 Years | 275 (96.8%) | 115 (50.7%) |
| 6 to 11 Years | 1,533 (68.2%) | 1,893 (84.6%) |
| 12 to 14 Years | 1,398 (94.1%) | 705 (58.6%) |
| 15 Years | 487 (96.3%) | 348 (69.3%) |
| 16 and 17 Years | 718 (87.4%) | 479 (79.8%) |
| 18 to 24 Years | 2,124 (89.1%) | 1,864 (86.6%) |
| 25 to 34 Years | 3,112 (83.1%) | 2,647 (73.9%) |
| 35 to 44 Years | 3,007 (77.6%) | 3,199 (83.8%) |
| 45 to 54 Years | 3,345 (89.3%) | 3,162 (83.1%) |
| 55 to 64 Years | 4,241 (84.9%) | 4,040 (77.5%) |
| 65 to 74 Years | 4,160 (88.2%) | 4,383 (89.1%) |
| 75 Years and over | 2,637 (91.7%) | 2,831 (92.2%) |
| Total | 28,425 (84.8%) | 27,201 (82.0%) |
Income Below Poverty Among Married-Couple Families in Lake County
The poverty statistics for married-couple families in Lake County show that 4.2% or 462 of the total 11,124 families live below the poverty line. Families with 5 or more children have the highest poverty rate of 100.0%, comprising of 43 families. On the other hand, families with 1 or 2 children have the lowest poverty rate of 1.1%, which includes 32 families.
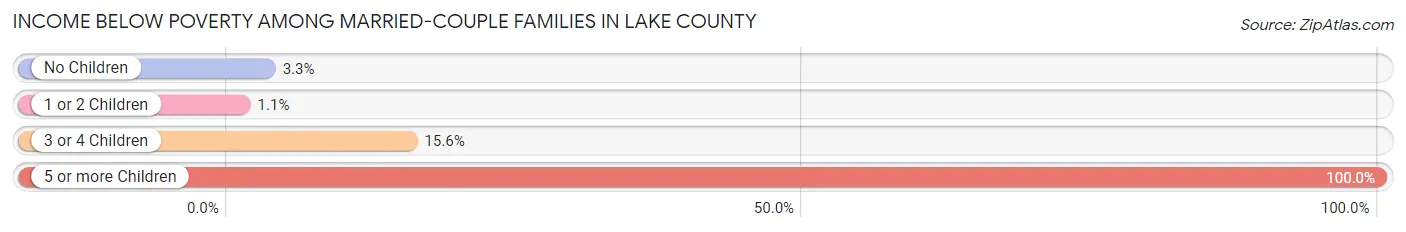
| Children | Above Poverty | Below Poverty |
| No Children | 6,984 (96.7%) | 237 (3.3%) |
| 1 or 2 Children | 2,868 (98.9%) | 32 (1.1%) |
| 3 or 4 Children | 810 (84.4%) | 150 (15.6%) |
| 5 or more Children | 0 (0.0%) | 43 (100.0%) |
| Total | 10,662 (95.9%) | 462 (4.2%) |
Income Below Poverty Among Single-Parent Households in Lake County
According to the poverty data in Lake County, 20.1% or 278 single-father households and 27.1% or 865 single-mother households are living below the poverty line. Among single-father households, those with 3 or 4 children have the highest poverty rate, with 56 households (44.1%) experiencing poverty. Likewise, among single-mother households, those with 5 or more children have the highest poverty rate, with 43 households (67.2%) falling below the poverty line.
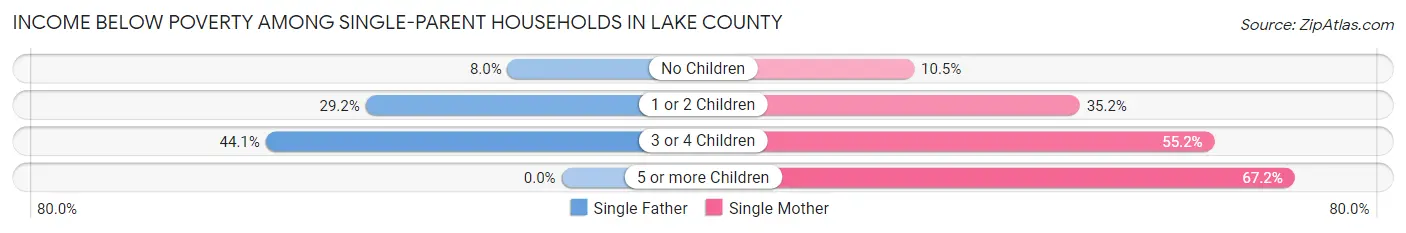
| Children | Single Father | Single Mother |
| No Children | 55 (8.0%) | 145 (10.5%) |
| 1 or 2 Children | 167 (29.2%) | 503 (35.2%) |
| 3 or 4 Children | 56 (44.1%) | 174 (55.2%) |
| 5 or more Children | 0 (0.0%) | 43 (67.2%) |
| Total | 278 (20.1%) | 865 (27.1%) |
Income Below Poverty Among Married-Couple vs Single-Parent Households in Lake County
The poverty data for Lake County shows that 462 of the married-couple family households (4.2%) and 1,143 of the single-parent households (25.0%) are living below the poverty level. Within the married-couple family households, those with 5 or more children have the highest poverty rate, with 43 households (100.0%) falling below the poverty line. Among the single-parent households, those with 5 or more children have the highest poverty rate, with 43 household (67.2%) living below poverty.
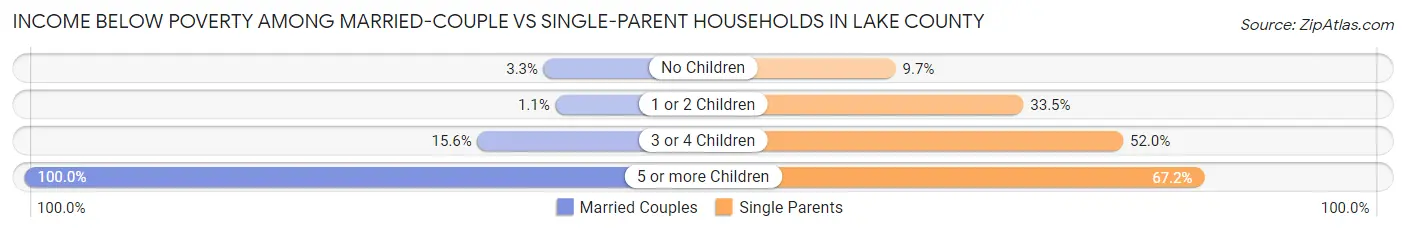
| Children | Married-Couple Families | Single-Parent Households |
| No Children | 237 (3.3%) | 200 (9.7%) |
| 1 or 2 Children | 32 (1.1%) | 670 (33.5%) |
| 3 or 4 Children | 150 (15.6%) | 230 (52.0%) |
| 5 or more Children | 43 (100.0%) | 43 (67.2%) |
| Total | 462 (4.2%) | 1,143 (25.0%) |
Race in Lake County
The most populous races in Lake County are White / Caucasian (48,251 | 70.9%), Hispanic or Latino (15,672 | 23.0%), and Some other Race (9,001 | 13.2%).
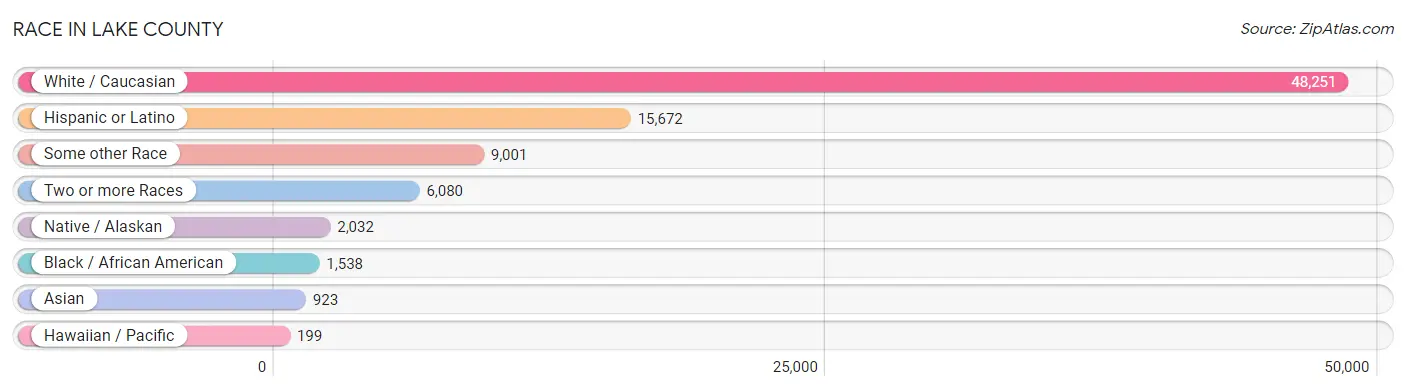
| Race | # Population | % Population |
| Asian | 923 | 1.4% |
| Black / African American | 1,538 | 2.3% |
| Hawaiian / Pacific | 199 | 0.3% |
| Hispanic or Latino | 15,672 | 23.0% |
| Native / Alaskan | 2,032 | 3.0% |
| White / Caucasian | 48,251 | 70.9% |
| Two or more Races | 6,080 | 8.9% |
| Some other Race | 9,001 | 13.2% |
| Total | 68,024 | 100.0% |
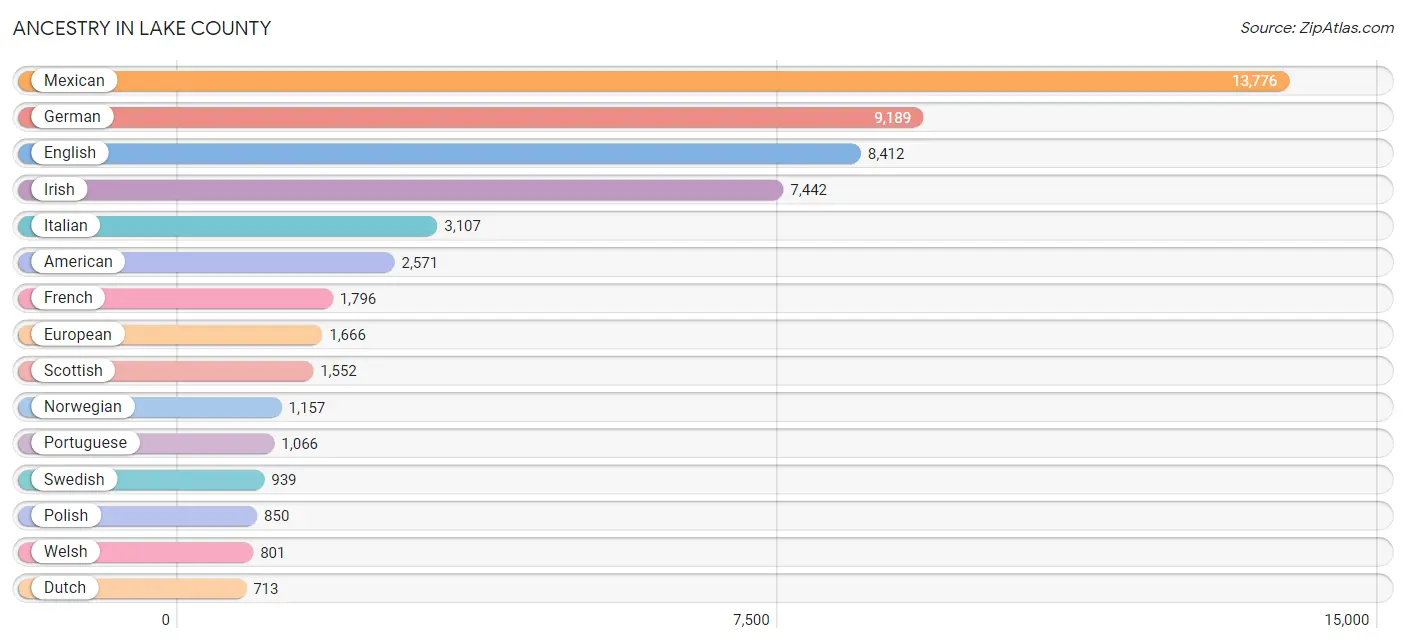
Ancestry in Lake County
The most populous ancestries reported in Lake County are Mexican (13,776 | 20.3%), German (9,189 | 13.5%), English (8,412 | 12.4%), Irish (7,442 | 10.9%), and Italian (3,107 | 4.6%), together accounting for 61.6% of all Lake County residents.
| Ancestry | # Population | % Population |
| Afghan | 44 | 0.1% |
| African | 147 | 0.2% |
| Alaska Native | 8 | 0.0% |
| American | 2,571 | 3.8% |
| Apache | 93 | 0.1% |
| Arab | 153 | 0.2% |
| Armenian | 159 | 0.2% |
| Australian | 8 | 0.0% |
| Austrian | 111 | 0.2% |
| Basque | 23 | 0.0% |
| Belgian | 35 | 0.1% |
| Bhutanese | 109 | 0.2% |
| Blackfeet | 106 | 0.2% |
| British | 280 | 0.4% |
| Bulgarian | 35 | 0.1% |
| Burmese | 153 | 0.2% |
| Cambodian | 24 | 0.0% |
| Canadian | 59 | 0.1% |
| Central American | 482 | 0.7% |
| Central American Indian | 29 | 0.0% |
| Cherokee | 411 | 0.6% |
| Chickasaw | 28 | 0.0% |
| Chilean | 28 | 0.0% |
| Choctaw | 131 | 0.2% |
| Colombian | 7 | 0.0% |
| Creek | 40 | 0.1% |
| Croatian | 21 | 0.0% |
| Cuban | 70 | 0.1% |
| Czech | 165 | 0.2% |
| Czechoslovakian | 33 | 0.1% |
| Danish | 249 | 0.4% |
| Dutch | 713 | 1.1% |
| Dutch West Indian | 70 | 0.1% |
| Eastern European | 42 | 0.1% |
| English | 8,412 | 12.4% |
| European | 1,666 | 2.5% |
| Finnish | 94 | 0.1% |
| French | 1,796 | 2.6% |
| French American Indian | 34 | 0.1% |
| French Canadian | 244 | 0.4% |
| German | 9,189 | 13.5% |
| German Russian | 8 | 0.0% |
| Greek | 177 | 0.3% |
| Guamanian / Chamorro | 30 | 0.0% |
| Guatemalan | 43 | 0.1% |
| Haitian | 30 | 0.0% |
| Honduran | 100 | 0.2% |
| Hungarian | 180 | 0.3% |
| Icelander | 25 | 0.0% |
| Indian (Asian) | 336 | 0.5% |
| Inupiat | 9 | 0.0% |
| Iranian | 64 | 0.1% |
| Iraqi | 29 | 0.0% |
| Irish | 7,442 | 10.9% |
| Italian | 3,107 | 4.6% |
| Jamaican | 8 | 0.0% |
| Japanese | 39 | 0.1% |
| Korean | 496 | 0.7% |
| Latvian | 19 | 0.0% |
| Lebanese | 20 | 0.0% |
| Lithuanian | 7 | 0.0% |
| Malaysian | 20 | 0.0% |
| Maltese | 16 | 0.0% |
| Mexican | 13,776 | 20.3% |
| Mexican American Indian | 181 | 0.3% |
| Native Hawaiian | 87 | 0.1% |
| Navajo | 105 | 0.2% |
| Nicaraguan | 107 | 0.2% |
| Northern European | 166 | 0.2% |
| Norwegian | 1,157 | 1.7% |
| Paiute | 146 | 0.2% |
| Pakistani | 59 | 0.1% |
| Pennsylvania German | 46 | 0.1% |
| Peruvian | 112 | 0.2% |
| Polish | 850 | 1.3% |
| Portuguese | 1,066 | 1.6% |
| Pueblo | 5 | 0.0% |
| Puerto Rican | 165 | 0.2% |
| Romanian | 64 | 0.1% |
| Russian | 399 | 0.6% |
| Salvadoran | 232 | 0.3% |
| Samoan | 177 | 0.3% |
| Scandinavian | 118 | 0.2% |
| Scotch-Irish | 608 | 0.9% |
| Scottish | 1,552 | 2.3% |
| Seminole | 13 | 0.0% |
| Sioux | 115 | 0.2% |
| Slavic | 11 | 0.0% |
| Slovak | 99 | 0.2% |
| South American | 147 | 0.2% |
| Spaniard | 260 | 0.4% |
| Spanish | 570 | 0.8% |
| Sri Lankan | 64 | 0.1% |
| Subsaharan African | 147 | 0.2% |
| Swedish | 939 | 1.4% |
| Swiss | 263 | 0.4% |
| Syrian | 78 | 0.1% |
| Thai | 36 | 0.1% |
| Tongan | 53 | 0.1% |
| Ukrainian | 46 | 0.1% |
| Welsh | 801 | 1.2% |
| Yaqui | 6 | 0.0% |
| Yugoslavian | 61 | 0.1% | View All 103 Rows |
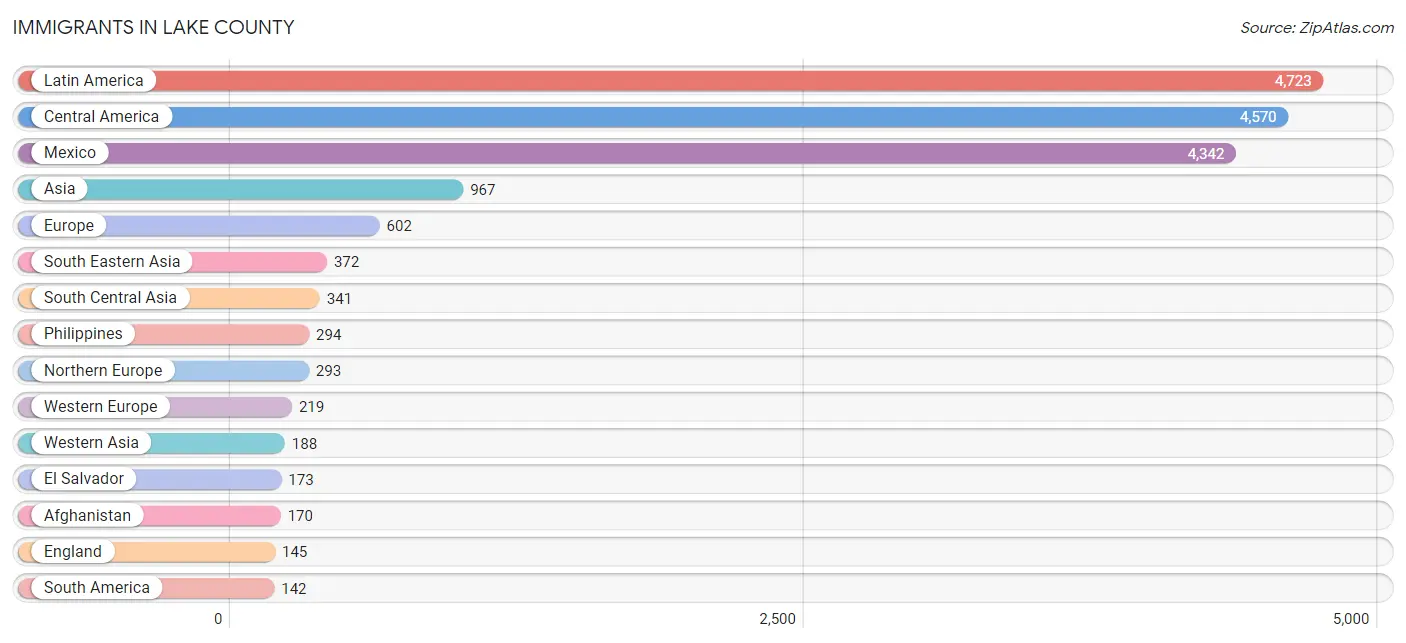
Immigrants in Lake County
The most numerous immigrant groups reported in Lake County came from Latin America (4,723 | 6.9%), Central America (4,570 | 6.7%), Mexico (4,342 | 6.4%), Asia (967 | 1.4%), and Europe (602 | 0.9%), together accounting for 22.3% of all Lake County residents.
| Immigration Origin | # Population | % Population |
| Afghanistan | 170 | 0.3% |
| Africa | 65 | 0.1% |
| Armenia | 117 | 0.2% |
| Asia | 967 | 1.4% |
| Australia | 19 | 0.0% |
| Brazil | 18 | 0.0% |
| Bulgaria | 11 | 0.0% |
| Cambodia | 8 | 0.0% |
| Canada | 95 | 0.1% |
| Caribbean | 11 | 0.0% |
| Central America | 4,570 | 6.7% |
| China | 40 | 0.1% |
| Croatia | 3 | 0.0% |
| Cuba | 11 | 0.0% |
| Denmark | 7 | 0.0% |
| Eastern Asia | 66 | 0.1% |
| Eastern Europe | 59 | 0.1% |
| El Salvador | 173 | 0.3% |
| England | 145 | 0.2% |
| Europe | 602 | 0.9% |
| Fiji | 21 | 0.0% |
| France | 9 | 0.0% |
| Germany | 140 | 0.2% |
| Ghana | 24 | 0.0% |
| Guatemala | 41 | 0.1% |
| Honduras | 14 | 0.0% |
| India | 30 | 0.0% |
| Iran | 76 | 0.1% |
| Iraq | 29 | 0.0% |
| Ireland | 15 | 0.0% |
| Italy | 17 | 0.0% |
| Japan | 8 | 0.0% |
| Jordan | 29 | 0.0% |
| Korea | 18 | 0.0% |
| Laos | 20 | 0.0% |
| Latin America | 4,723 | 6.9% |
| Mexico | 4,342 | 6.4% |
| Netherlands | 38 | 0.1% |
| Northern Europe | 293 | 0.4% |
| Norway | 31 | 0.1% |
| Oceania | 128 | 0.2% |
| Pakistan | 65 | 0.1% |
| Peru | 105 | 0.2% |
| Philippines | 294 | 0.4% |
| Portugal | 9 | 0.0% |
| Romania | 3 | 0.0% |
| Russia | 42 | 0.1% |
| Scotland | 11 | 0.0% |
| Singapore | 6 | 0.0% |
| South America | 142 | 0.2% |
| South Central Asia | 341 | 0.5% |
| South Eastern Asia | 372 | 0.5% |
| Southern Europe | 26 | 0.0% |
| Switzerland | 32 | 0.1% |
| Syria | 13 | 0.0% |
| Taiwan | 10 | 0.0% |
| Thailand | 11 | 0.0% |
| Vietnam | 33 | 0.1% |
| Western Africa | 24 | 0.0% |
| Western Asia | 188 | 0.3% |
| Western Europe | 219 | 0.3% | View All 61 Rows |
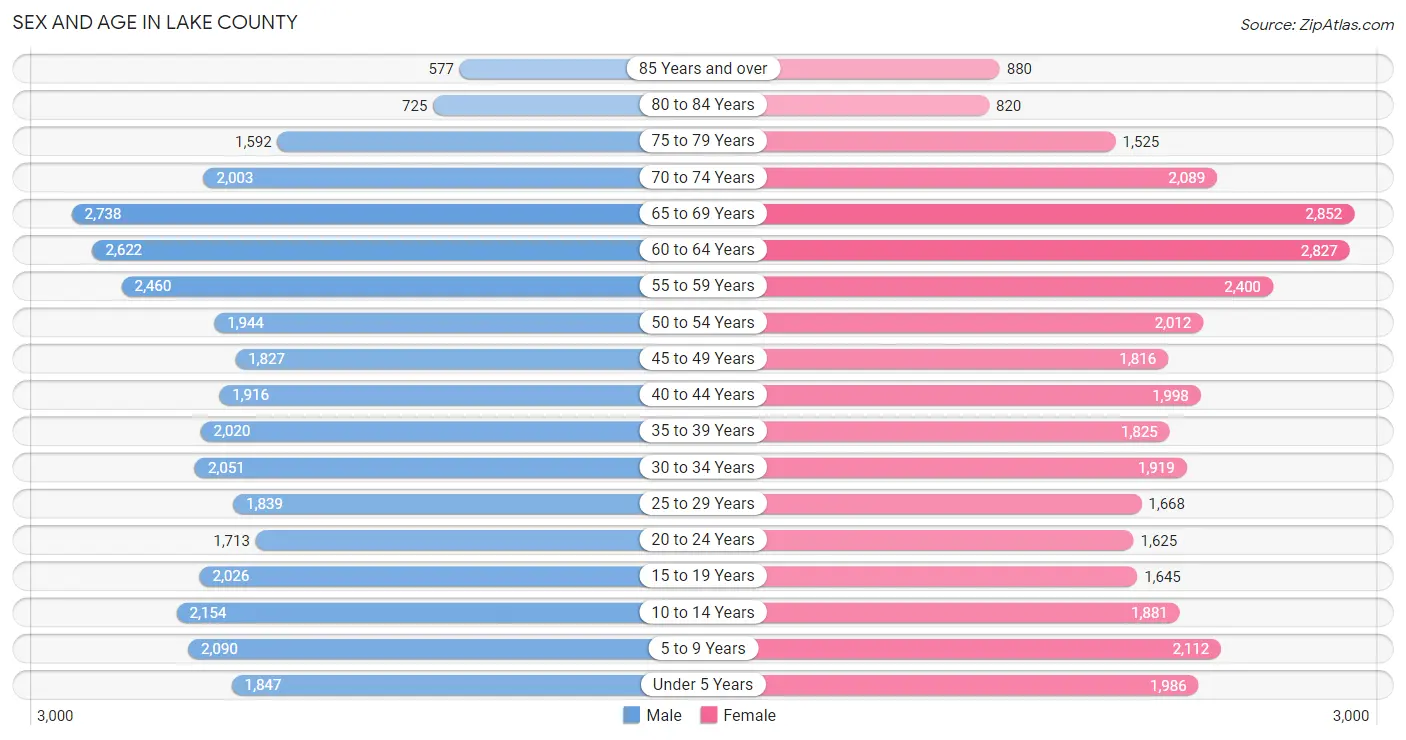
Sex and Age in Lake County
Sex and Age in Lake County
The most populous age groups in Lake County are 65 to 69 Years (2,738 | 8.0%) for men and 65 to 69 Years (2,852 | 8.4%) for women.
| Age Bracket | Male | Female |
| Under 5 Years | 1,847 (5.4%) | 1,986 (5.9%) |
| 5 to 9 Years | 2,090 (6.1%) | 2,112 (6.2%) |
| 10 to 14 Years | 2,154 (6.3%) | 1,881 (5.6%) |
| 15 to 19 Years | 2,026 (5.9%) | 1,645 (4.9%) |
| 20 to 24 Years | 1,713 (5.0%) | 1,625 (4.8%) |
| 25 to 29 Years | 1,839 (5.4%) | 1,668 (4.9%) |
| 30 to 34 Years | 2,051 (6.0%) | 1,919 (5.7%) |
| 35 to 39 Years | 2,020 (5.9%) | 1,825 (5.4%) |
| 40 to 44 Years | 1,916 (5.6%) | 1,998 (5.9%) |
| 45 to 49 Years | 1,827 (5.3%) | 1,816 (5.4%) |
| 50 to 54 Years | 1,944 (5.7%) | 2,012 (5.9%) |
| 55 to 59 Years | 2,460 (7.2%) | 2,400 (7.1%) |
| 60 to 64 Years | 2,622 (7.7%) | 2,827 (8.3%) |
| 65 to 69 Years | 2,738 (8.0%) | 2,852 (8.4%) |
| 70 to 74 Years | 2,003 (5.9%) | 2,089 (6.2%) |
| 75 to 79 Years | 1,592 (4.7%) | 1,525 (4.5%) |
| 80 to 84 Years | 725 (2.1%) | 820 (2.4%) |
| 85 Years and over | 577 (1.7%) | 880 (2.6%) |
| Total | 34,144 (100.0%) | 33,880 (100.0%) |
Families and Households in Lake County
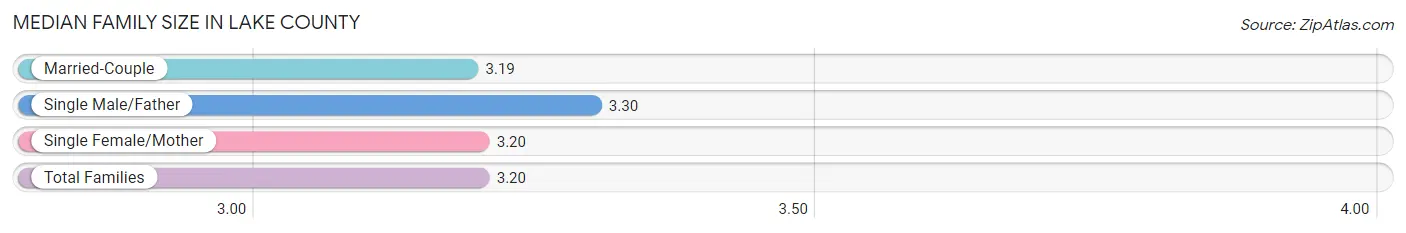
Median Family Size in Lake County
The median family size in Lake County is 3.20 persons per family, with single male/father families (1,384 | 8.8%) accounting for the largest median family size of 3.3 persons per family. On the other hand, married-couple families (11,124 | 70.9%) represent the smallest median family size with 3.19 persons per family.
| Family Type | # Families | Family Size |
| Married-Couple | 11,124 (70.9%) | 3.19 |
| Single Male/Father | 1,384 (8.8%) | 3.30 |
| Single Female/Mother | 3,190 (20.3%) | 3.20 |
| Total Families | 15,698 (100.0%) | 3.20 |
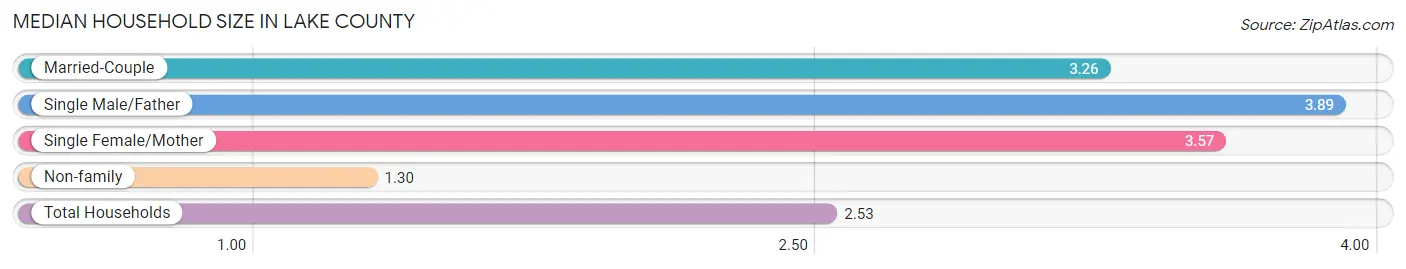
Median Household Size in Lake County
The median household size in Lake County is 2.53 persons per household, with single male/father households (1,384 | 5.2%) accounting for the largest median household size of 3.89 persons per household. non-family households (10,789 | 40.7%) represent the smallest median household size with 1.30 persons per household.
| Household Type | # Households | Household Size |
| Married-Couple | 11,124 (42.0%) | 3.26 |
| Single Male/Father | 1,384 (5.2%) | 3.89 |
| Single Female/Mother | 3,190 (12.0%) | 3.57 |
| Non-family | 10,789 (40.7%) | 1.30 |
| Total Households | 26,487 (100.0%) | 2.53 |
Household Size by Marriage Status in Lake County
Out of a total of 26,487 households in Lake County, 15,698 (59.3%) are family households, while 10,789 (40.7%) are nonfamily households. The most numerous type of family households are 2-person households, comprising 7,132, and the most common type of nonfamily households are 1-person households, comprising 8,457.
| Household Size | Family Households | Nonfamily Households |
| 1-Person Households | - | 8,457 (31.9%) |
| 2-Person Households | 7,132 (26.9%) | 2,029 (7.7%) |
| 3-Person Households | 3,430 (13.0%) | 258 (1.0%) |
| 4-Person Households | 2,748 (10.4%) | 45 (0.2%) |
| 5-Person Households | 1,368 (5.2%) | 0 (0.0%) |
| 6-Person Households | 614 (2.3%) | 0 (0.0%) |
| 7+ Person Households | 406 (1.5%) | 0 (0.0%) |
| Total | 15,698 (59.3%) | 10,789 (40.7%) |
Female Fertility in Lake County
Fertility by Age in Lake County
Average fertility rate in Lake County is 59.0 births per 1,000 women. Women in the age bracket of 20 to 34 years have the highest fertility rate with 87.0 births per 1,000 women. Women in the age bracket of 20 to 34 years acount for 60.3% of all women with births.
| Age Bracket | Women with Births | Births / 1,000 Women |
| 15 to 19 years | 0 (0.0%) | 0.0 |
| 20 to 34 years | 456 (60.3%) | 87.0 |
| 35 to 50 years | 300 (39.7%) | 51.0 |
| Total | 756 (100.0%) | 59.0 |
Fertility by Age by Marriage Status in Lake County
52.0% of women with births (756) in Lake County are married. The highest percentage of unmarried women with births falls into 20 to 34 years age bracket with 48.7% of them unmarried at the time of birth, while the lowest percentage of unmarried women with births belong to 35 to 50 years age bracket with 47.0% of them unmarried.
| Age Bracket | Married | Unmarried |
| 15 to 19 years | 0 (0.0%) | 0 (0.0%) |
| 20 to 34 years | 234 (51.3%) | 222 (48.7%) |
| 35 to 50 years | 159 (53.0%) | 141 (47.0%) |
| Total | 393 (52.0%) | 363 (48.0%) |
Fertility by Education in Lake County
Average fertility rate in Lake County is 59.0 births per 1,000 women. Women with the education attainment of college or associate's degree have the highest fertility rate of 73.0 births per 1,000 women, while women with the education attainment of graduate degree have the lowest fertility at 18.0 births per 1,000 women. Women with the education attainment of college or associate's degree represent 45.9% of all women with births.
| Educational Attainment | Women with Births | Births / 1,000 Women |
| Less than High School | 101 (13.4%) | 40.0 |
| High School Diploma | 207 (27.4%) | 62.0 |
| College or Associate's Degree | 347 (45.9%) | 73.0 |
| Bachelor's Degree | 92 (12.2%) | 57.0 |
| Graduate Degree | 9 (1.2%) | 18.0 |
| Total | 756 (100.0%) | 59.0 |
Fertility by Education by Marriage Status in Lake County
48.0% of women with births in Lake County are unmarried. Women with the educational attainment of bachelor's degree are most likely to be married with 100.0% of them married at childbirth, while women with the educational attainment of high school diploma are least likely to be married with 68.6% of them unmarried at childbirth.
| Educational Attainment | Married | Unmarried |
| Less than High School | 46 (45.5%) | 55 (54.5%) |
| High School Diploma | 65 (31.4%) | 142 (68.6%) |
| College or Associate's Degree | 181 (52.2%) | 166 (47.8%) |
| Bachelor's Degree | 92 (100.0%) | 0 (0.0%) |
| Graduate Degree | 9 (100.0%) | 0 (0.0%) |
| Total | 393 (52.0%) | 363 (48.0%) |
Employment Characteristics in Lake County
Employment by Class of Employer in Lake County
Among the 24,313 employed individuals in Lake County, private company employees (13,981 | 57.5%), local government employees (2,965 | 12.2%), and self-employed (not incorporated) (2,552 | 10.5%) make up the most common classes of employment.
| Employer Class | # Employees | % Employees |
| Private Company Employees | 13,981 | 57.5% |
| Self-Employed (Incorporated) | 914 | 3.8% |
| Self-Employed (Not Incorporated) | 2,552 | 10.5% |
| Not-for-profit Organizations | 1,856 | 7.6% |
| Local Government Employees | 2,965 | 12.2% |
| State Government Employees | 1,411 | 5.8% |
| Federal Government Employees | 634 | 2.6% |
| Unpaid Family Workers | 0 | 0.0% |
| Total | 24,313 | 100.0% |
Employment Status by Age in Lake County
According to the labor force statistics for Lake County, out of the total population over 16 years of age (54,938), 51.7% or 28,403 individuals are in the labor force, with 10.4% or 2,954 of them unemployed. The age group with the highest labor force participation rate is 45 to 54 years, with 79.1% or 6,011 individuals in the labor force. Within the labor force, the 16 to 19 years age range has the highest percentage of unemployed individuals, with 22.3% or 177 of them being unemployed.
| Age Bracket | In Labor Force | Unemployed |
| 16 to 19 Years | 794 (29.9%) | 177 (22.3%) |
| 20 to 24 Years | 2,463 (73.8%) | 345 (14.0%) |
| 25 to 29 Years | 2,571 (73.3%) | 332 (12.9%) |
| 30 to 34 Years | 2,775 (69.9%) | 211 (7.6%) |
| 35 to 44 Years | 5,734 (73.9%) | 648 (11.3%) |
| 45 to 54 Years | 6,011 (79.1%) | 715 (11.9%) |
| 55 to 59 Years | 2,756 (56.7%) | 245 (8.9%) |
| 60 to 64 Years | 2,457 (45.1%) | 133 (5.4%) |
| 65 to 74 Years | 2,546 (26.3%) | 145 (5.7%) |
| 75 Years and over | 294 (4.8%) | 0 (0.0%) |
| Total | 28,403 (51.7%) | 2,954 (10.4%) |
Employment Status by Educational Attainment in Lake County
According to labor force statistics for Lake County, 67.3% of individuals (22,306) out of the total population between 25 and 64 years of age (33,144) are in the labor force, with 10.3% or 2,298 of them being unemployed. The group with the highest labor force participation rate are those with the educational attainment of bachelor's degree or higher, with 77.9% or 4,214 individuals in the labor force. Within the labor force, individuals with less than high school education have the highest percentage of unemployment, with 13.0% or 349 of them being unemployed.
| Educational Attainment | In Labor Force | Unemployed |
| Less than High School | 2,688 (56.0%) | 624 (13.0%) |
| High School Diploma | 5,867 (58.9%) | 1,245 (12.5%) |
| College / Associate Degree | 9,535 (73.5%) | 1,323 (10.2%) |
| Bachelor's Degree or higher | 4,214 (77.9%) | 303 (5.6%) |
| Total | 22,306 (67.3%) | 3,414 (10.3%) |
Employment Occupations by Sex in Lake County
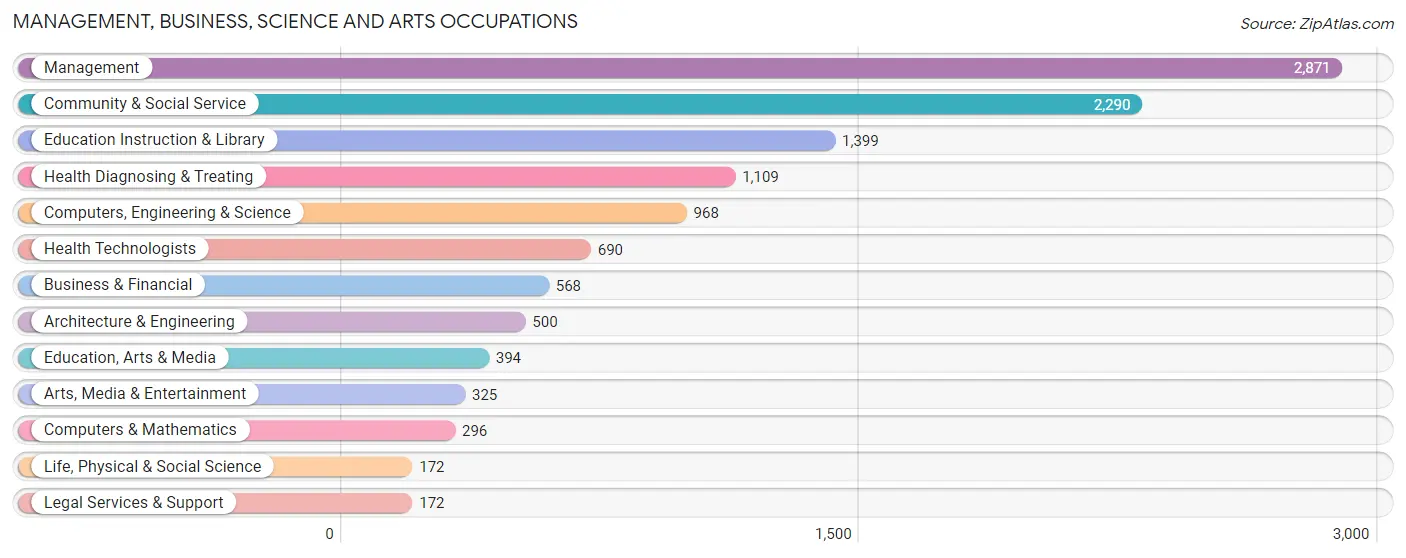
Management, Business, Science and Arts Occupations
The most common Management, Business, Science and Arts occupations in Lake County are Management (2,871 | 11.3%), Community & Social Service (2,290 | 9.0%), Education Instruction & Library (1,399 | 5.5%), Health Diagnosing & Treating (1,109 | 4.4%), and Computers, Engineering & Science (968 | 3.8%).
Management, Business, Science and Arts Occupations by Sex
Within the Management, Business, Science and Arts occupations in Lake County, the most male-oriented occupations are Computers & Mathematics (89.2%), Architecture & Engineering (88.4%), and Computers, Engineering & Science (80.7%), while the most female-oriented occupations are Legal Services & Support (83.7%), Education, Arts & Media (82.2%), and Education Instruction & Library (80.4%).
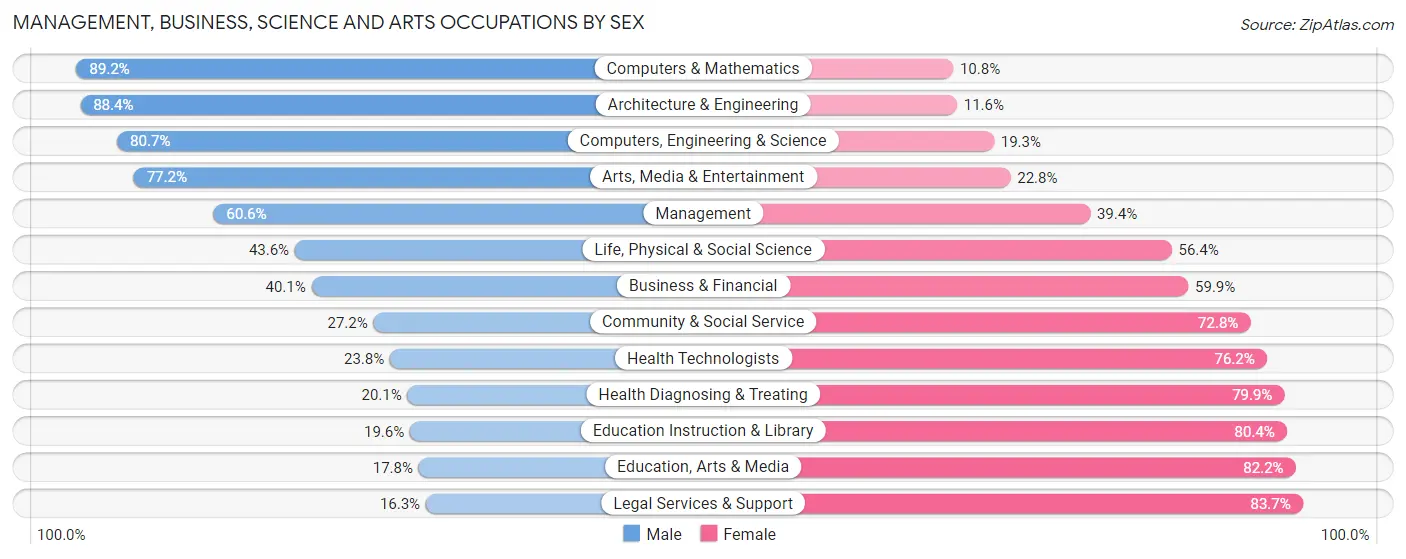
| Occupation | Male | Female |
| Management | 1,740 (60.6%) | 1,131 (39.4%) |
| Business & Financial | 228 (40.1%) | 340 (59.9%) |
| Computers, Engineering & Science | 781 (80.7%) | 187 (19.3%) |
| Computers & Mathematics | 264 (89.2%) | 32 (10.8%) |
| Architecture & Engineering | 442 (88.4%) | 58 (11.6%) |
| Life, Physical & Social Science | 75 (43.6%) | 97 (56.4%) |
| Community & Social Service | 623 (27.2%) | 1,667 (72.8%) |
| Education, Arts & Media | 70 (17.8%) | 324 (82.2%) |
| Legal Services & Support | 28 (16.3%) | 144 (83.7%) |
| Education Instruction & Library | 274 (19.6%) | 1,125 (80.4%) |
| Arts, Media & Entertainment | 251 (77.2%) | 74 (22.8%) |
| Health Diagnosing & Treating | 223 (20.1%) | 886 (79.9%) |
| Health Technologists | 164 (23.8%) | 526 (76.2%) |
| Total (Category) | 3,595 (46.1%) | 4,211 (53.9%) |
| Total (Overall) | 13,328 (52.5%) | 12,080 (47.5%) |
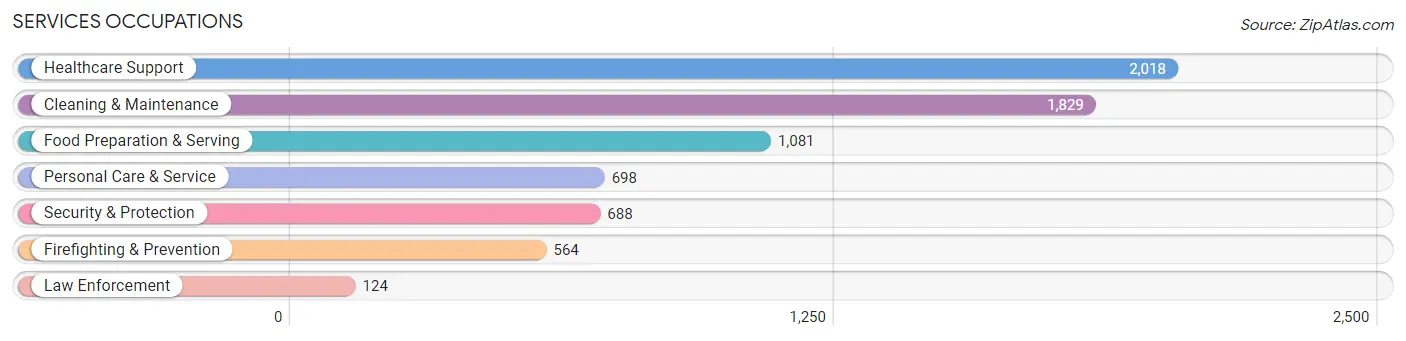
Services Occupations
The most common Services occupations in Lake County are Healthcare Support (2,018 | 7.9%), Cleaning & Maintenance (1,829 | 7.2%), Food Preparation & Serving (1,081 | 4.3%), Personal Care & Service (698 | 2.8%), and Security & Protection (688 | 2.7%).
Services Occupations by Sex
Within the Services occupations in Lake County, the most male-oriented occupations are Firefighting & Prevention (76.1%), Security & Protection (73.0%), and Cleaning & Maintenance (59.1%), while the most female-oriented occupations are Personal Care & Service (80.4%), Healthcare Support (75.1%), and Food Preparation & Serving (66.5%).
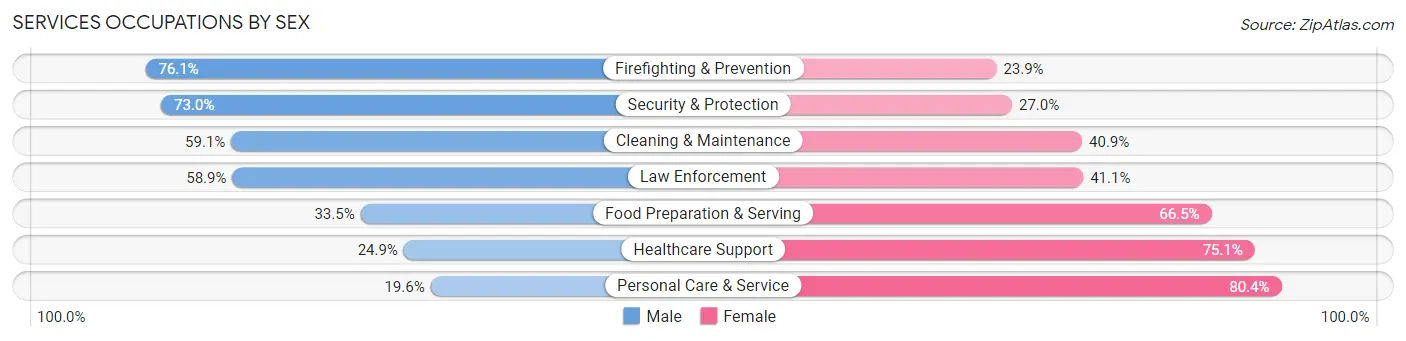
| Occupation | Male | Female |
| Healthcare Support | 503 (24.9%) | 1,515 (75.1%) |
| Security & Protection | 502 (73.0%) | 186 (27.0%) |
| Firefighting & Prevention | 429 (76.1%) | 135 (23.9%) |
| Law Enforcement | 73 (58.9%) | 51 (41.1%) |
| Food Preparation & Serving | 362 (33.5%) | 719 (66.5%) |
| Cleaning & Maintenance | 1,081 (59.1%) | 748 (40.9%) |
| Personal Care & Service | 137 (19.6%) | 561 (80.4%) |
| Total (Category) | 2,585 (40.9%) | 3,729 (59.1%) |
| Total (Overall) | 13,328 (52.5%) | 12,080 (47.5%) |
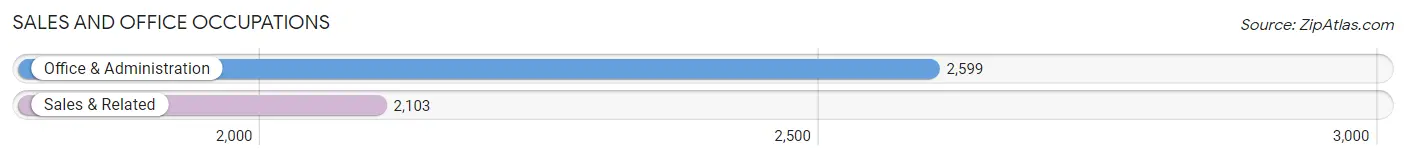
Sales and Office Occupations
The most common Sales and Office occupations in Lake County are Office & Administration (2,599 | 10.2%), and Sales & Related (2,103 | 8.3%).
Sales and Office Occupations by Sex
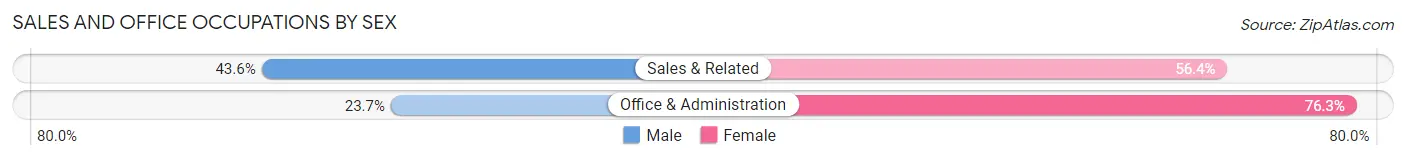
| Occupation | Male | Female |
| Sales & Related | 916 (43.6%) | 1,187 (56.4%) |
| Office & Administration | 615 (23.7%) | 1,984 (76.3%) |
| Total (Category) | 1,531 (32.6%) | 3,171 (67.4%) |
| Total (Overall) | 13,328 (52.5%) | 12,080 (47.5%) |
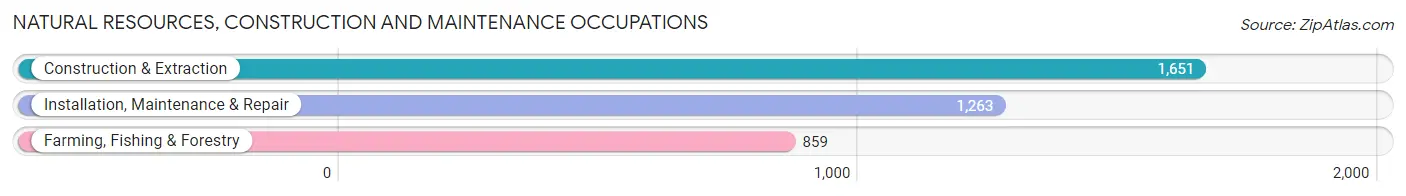
Natural Resources, Construction and Maintenance Occupations
The most common Natural Resources, Construction and Maintenance occupations in Lake County are Construction & Extraction (1,651 | 6.5%), Installation, Maintenance & Repair (1,263 | 5.0%), and Farming, Fishing & Forestry (859 | 3.4%).
Natural Resources, Construction and Maintenance Occupations by Sex
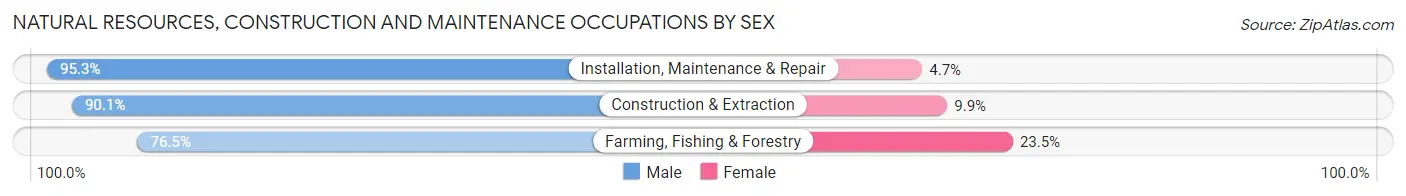
| Occupation | Male | Female |
| Farming, Fishing & Forestry | 657 (76.5%) | 202 (23.5%) |
| Construction & Extraction | 1,488 (90.1%) | 163 (9.9%) |
| Installation, Maintenance & Repair | 1,204 (95.3%) | 59 (4.7%) |
| Total (Category) | 3,349 (88.8%) | 424 (11.2%) |
| Total (Overall) | 13,328 (52.5%) | 12,080 (47.5%) |
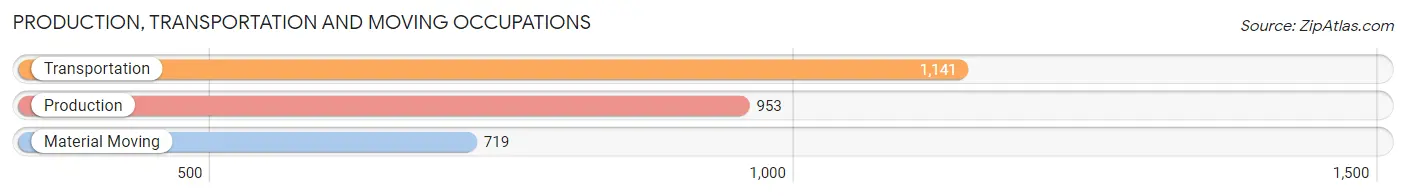
Production, Transportation and Moving Occupations
The most common Production, Transportation and Moving occupations in Lake County are Transportation (1,141 | 4.5%), Production (953 | 3.7%), and Material Moving (719 | 2.8%).
Production, Transportation and Moving Occupations by Sex
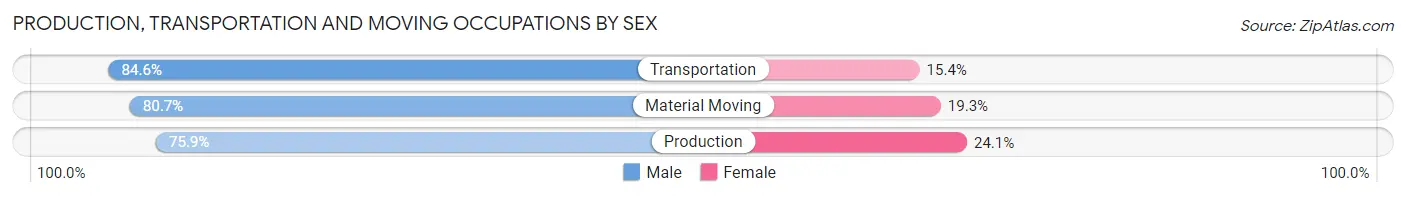
| Occupation | Male | Female |
| Production | 723 (75.9%) | 230 (24.1%) |
| Transportation | 965 (84.6%) | 176 (15.4%) |
| Material Moving | 580 (80.7%) | 139 (19.3%) |
| Total (Category) | 2,268 (80.6%) | 545 (19.4%) |
| Total (Overall) | 13,328 (52.5%) | 12,080 (47.5%) |
Employment Industries by Sex in Lake County
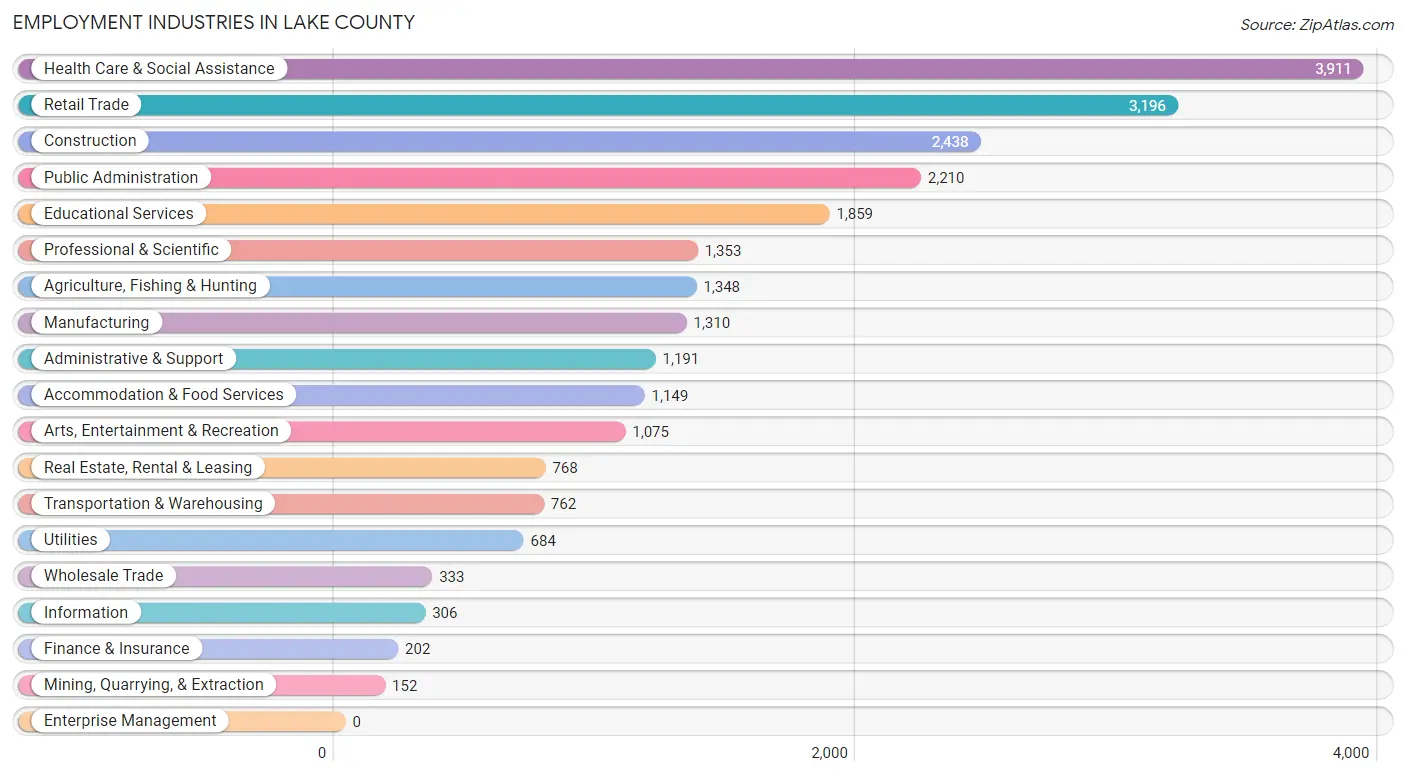
Employment Industries in Lake County
The major employment industries in Lake County include Health Care & Social Assistance (3,911 | 15.4%), Retail Trade (3,196 | 12.6%), Construction (2,438 | 9.6%), Public Administration (2,210 | 8.7%), and Educational Services (1,859 | 7.3%).
Employment Industries by Sex in Lake County
The Lake County industries that see more men than women are Mining, Quarrying, & Extraction (100.0%), Agriculture, Fishing & Hunting (78.8%), and Administrative & Support (78.0%), whereas the industries that tend to have a higher number of women are Educational Services (75.5%), Health Care & Social Assistance (72.8%), and Accommodation & Food Services (70.2%).
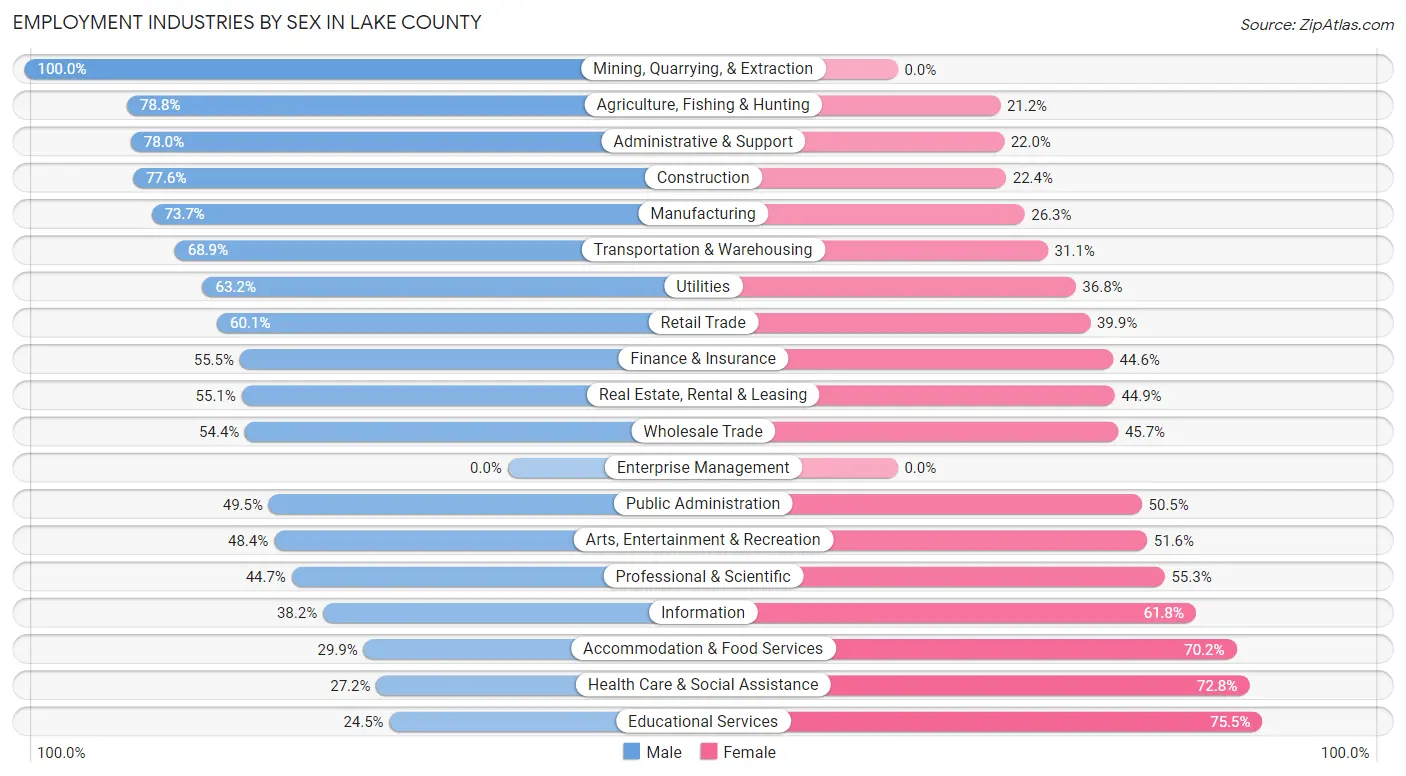
| Industry | Male | Female |
| Agriculture, Fishing & Hunting | 1,062 (78.8%) | 286 (21.2%) |
| Mining, Quarrying, & Extraction | 152 (100.0%) | 0 (0.0%) |
| Construction | 1,891 (77.6%) | 547 (22.4%) |
| Manufacturing | 966 (73.7%) | 344 (26.3%) |
| Wholesale Trade | 181 (54.3%) | 152 (45.7%) |
| Retail Trade | 1,922 (60.1%) | 1,274 (39.9%) |
| Transportation & Warehousing | 525 (68.9%) | 237 (31.1%) |
| Utilities | 432 (63.2%) | 252 (36.8%) |
| Information | 117 (38.2%) | 189 (61.8%) |
| Finance & Insurance | 112 (55.4%) | 90 (44.6%) |
| Real Estate, Rental & Leasing | 423 (55.1%) | 345 (44.9%) |
| Professional & Scientific | 605 (44.7%) | 748 (55.3%) |
| Enterprise Management | 0 (0.0%) | 0 (0.0%) |
| Administrative & Support | 929 (78.0%) | 262 (22.0%) |
| Educational Services | 455 (24.5%) | 1,404 (75.5%) |
| Health Care & Social Assistance | 1,064 (27.2%) | 2,847 (72.8%) |
| Arts, Entertainment & Recreation | 520 (48.4%) | 555 (51.6%) |
| Accommodation & Food Services | 343 (29.8%) | 806 (70.2%) |
| Public Administration | 1,093 (49.5%) | 1,117 (50.5%) |
| Total | 13,328 (52.5%) | 12,080 (47.5%) |
Education in Lake County
School Enrollment in Lake County
The most common levels of schooling among the 14,099 students in Lake County are high school (3,567 | 25.3%), middle school (3,109 | 22.1%), and elementary school (2,871 | 20.4%).
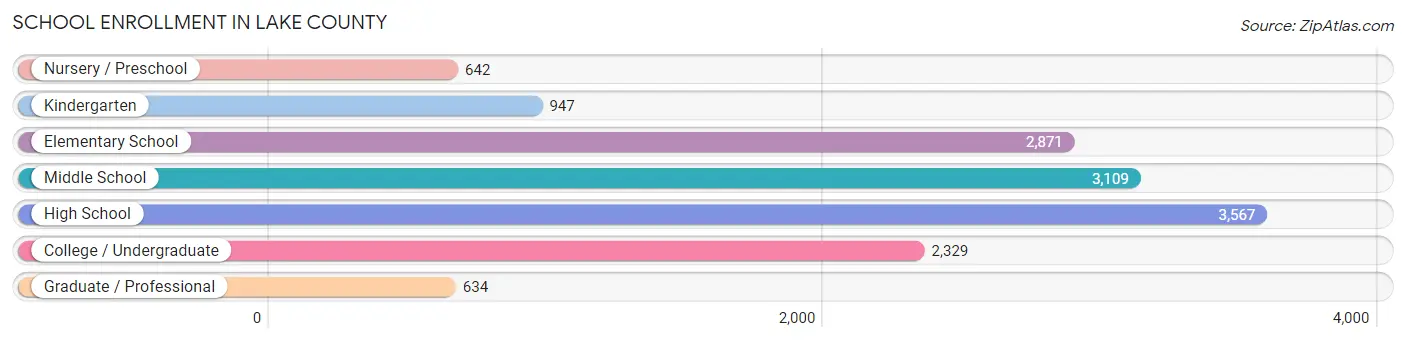
| School Level | # Students | % Students |
| Nursery / Preschool | 642 | 4.5% |
| Kindergarten | 947 | 6.7% |
| Elementary School | 2,871 | 20.4% |
| Middle School | 3,109 | 22.1% |
| High School | 3,567 | 25.3% |
| College / Undergraduate | 2,329 | 16.5% |
| Graduate / Professional | 634 | 4.5% |
| Total | 14,099 | 100.0% |
School Enrollment by Age by Funding Source in Lake County
Out of a total of 14,099 students who are enrolled in schools in Lake County, 1,128 (8.0%) attend a private institution, while the remaining 12,971 (92.0%) are enrolled in public schools. The age group of 3 to 4 year olds has the highest likelihood of being enrolled in private schools, with 252 (40.0% in the age bracket) enrolled. Conversely, the age group of 10 to 14 year olds has the lowest likelihood of being enrolled in a private school, with 3,783 (97.3% in the age bracket) attending a public institution.
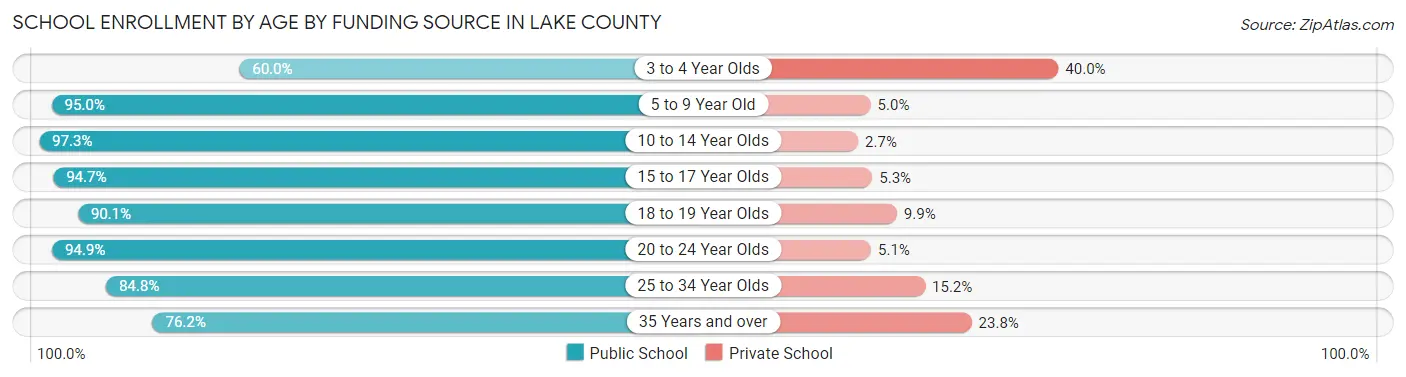
| Age Bracket | Public School | Private School |
| 3 to 4 Year Olds | 378 (60.0%) | 252 (40.0%) |
| 5 to 9 Year Old | 3,495 (95.0%) | 185 (5.0%) |
| 10 to 14 Year Olds | 3,783 (97.3%) | 105 (2.7%) |
| 15 to 17 Year Olds | 2,218 (94.7%) | 125 (5.3%) |
| 18 to 19 Year Olds | 690 (90.1%) | 76 (9.9%) |
| 20 to 24 Year Olds | 1,133 (94.9%) | 61 (5.1%) |
| 25 to 34 Year Olds | 548 (84.8%) | 98 (15.2%) |
| 35 Years and over | 725 (76.2%) | 227 (23.8%) |
| Total | 12,971 (92.0%) | 1,128 (8.0%) |
Educational Attainment by Field of Study in Lake County
Business (1,368 | 14.1%), education (997 | 10.3%), science & technology (944 | 9.8%), social sciences (932 | 9.6%), and liberal arts & history (840 | 8.7%) are the most common fields of study among 9,686 individuals in Lake County who have obtained a bachelor's degree or higher.
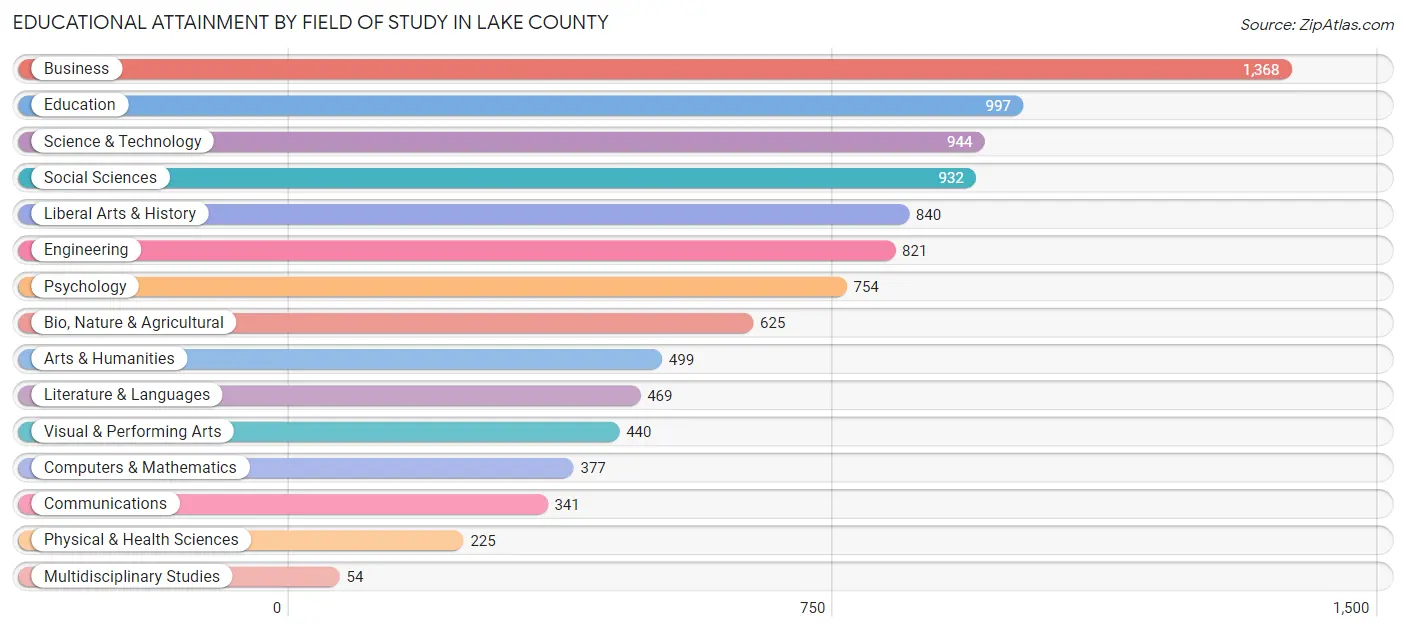
| Field of Study | # Graduates | % Graduates |
| Computers & Mathematics | 377 | 3.9% |
| Bio, Nature & Agricultural | 625 | 6.5% |
| Physical & Health Sciences | 225 | 2.3% |
| Psychology | 754 | 7.8% |
| Social Sciences | 932 | 9.6% |
| Engineering | 821 | 8.5% |
| Multidisciplinary Studies | 54 | 0.6% |
| Science & Technology | 944 | 9.8% |
| Business | 1,368 | 14.1% |
| Education | 997 | 10.3% |
| Literature & Languages | 469 | 4.8% |
| Liberal Arts & History | 840 | 8.7% |
| Visual & Performing Arts | 440 | 4.5% |
| Communications | 341 | 3.5% |
| Arts & Humanities | 499 | 5.1% |
| Total | 9,686 | 100.0% |
Transportation & Commute in Lake County
Vehicle Availability by Sex in Lake County
The most prevalent vehicle ownership categories in Lake County are males with 2 vehicles (4,940, accounting for 39.3%) and females with 2 vehicles (3,902, making up 42.6%).
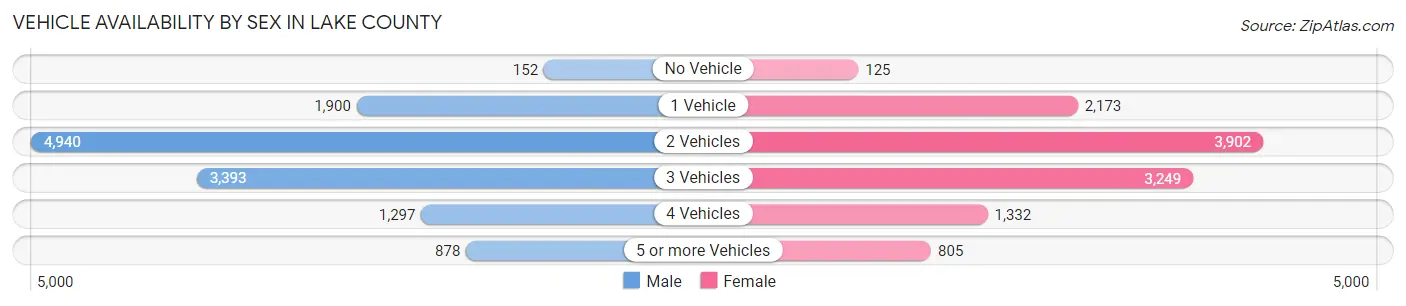
| Vehicles Available | Male | Female |
| No Vehicle | 152 (1.2%) | 125 (1.1%) |
| 1 Vehicle | 1,900 (15.1%) | 2,173 (18.8%) |
| 2 Vehicles | 4,940 (39.3%) | 3,902 (33.7%) |
| 3 Vehicles | 3,393 (27.0%) | 3,249 (28.0%) |
| 4 Vehicles | 1,297 (10.3%) | 1,332 (11.5%) |
| 5 or more Vehicles | 878 (7.0%) | 805 (7.0%) |
| Total | 12,560 (100.0%) | 11,586 (100.0%) |
Commute Time in Lake County
The most frequently occuring commute durations in Lake County are 10 to 14 minutes (2,976 commuters, 14.3%), 30 to 34 minutes (2,773 commuters, 13.4%), and 5 to 9 minutes (2,606 commuters, 12.6%).
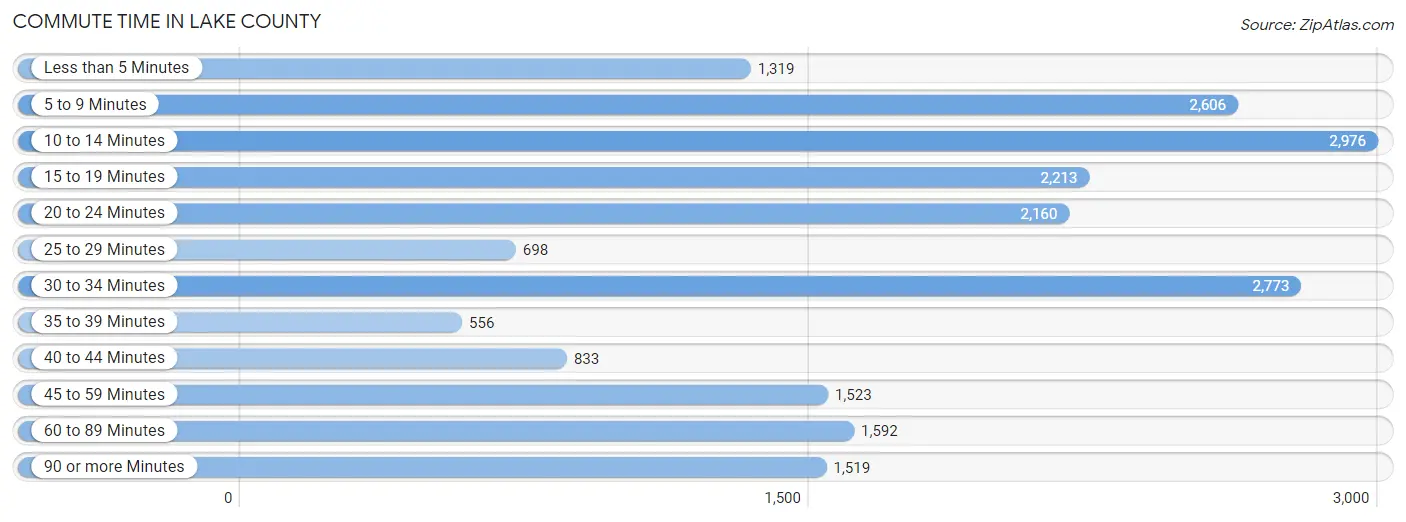
| Commute Time | # Commuters | % Commuters |
| Less than 5 Minutes | 1,319 | 6.4% |
| 5 to 9 Minutes | 2,606 | 12.6% |
| 10 to 14 Minutes | 2,976 | 14.3% |
| 15 to 19 Minutes | 2,213 | 10.7% |
| 20 to 24 Minutes | 2,160 | 10.4% |
| 25 to 29 Minutes | 698 | 3.4% |
| 30 to 34 Minutes | 2,773 | 13.4% |
| 35 to 39 Minutes | 556 | 2.7% |
| 40 to 44 Minutes | 833 | 4.0% |
| 45 to 59 Minutes | 1,523 | 7.3% |
| 60 to 89 Minutes | 1,592 | 7.7% |
| 90 or more Minutes | 1,519 | 7.3% |
Commute Time by Sex in Lake County
The most common commute times in Lake County are 30 to 34 minutes (1,628 commuters, 15.3%) for males and 10 to 14 minutes (1,736 commuters, 17.2%) for females.
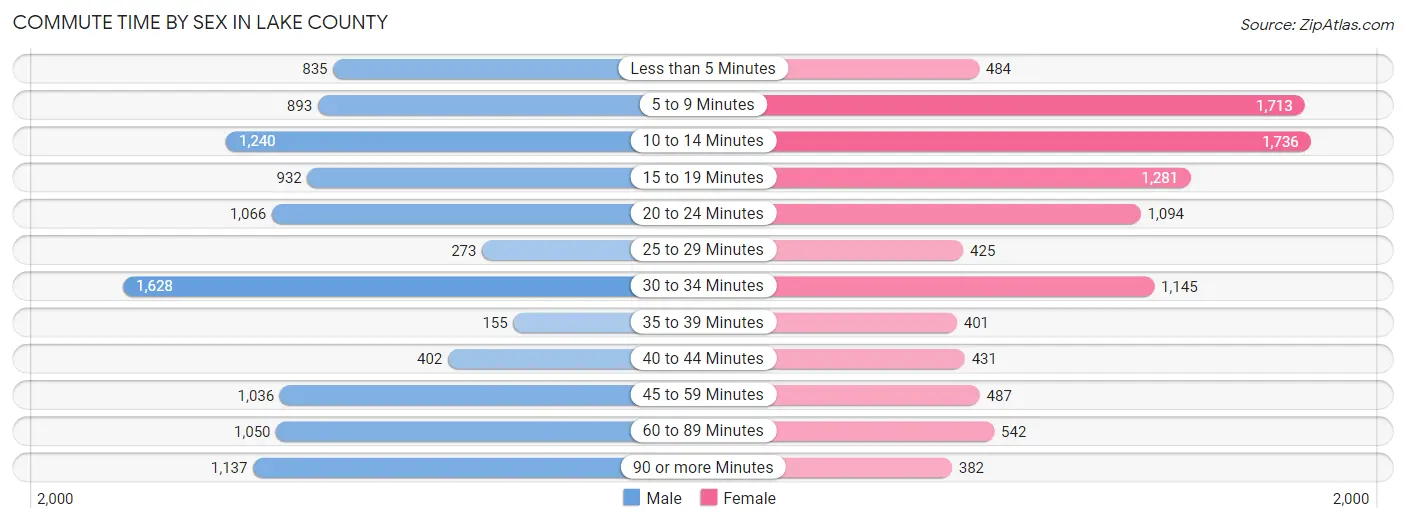
| Commute Time | Male | Female |
| Less than 5 Minutes | 835 (7.8%) | 484 (4.8%) |
| 5 to 9 Minutes | 893 (8.4%) | 1,713 (16.9%) |
| 10 to 14 Minutes | 1,240 (11.7%) | 1,736 (17.2%) |
| 15 to 19 Minutes | 932 (8.7%) | 1,281 (12.7%) |
| 20 to 24 Minutes | 1,066 (10.0%) | 1,094 (10.8%) |
| 25 to 29 Minutes | 273 (2.6%) | 425 (4.2%) |
| 30 to 34 Minutes | 1,628 (15.3%) | 1,145 (11.3%) |
| 35 to 39 Minutes | 155 (1.5%) | 401 (4.0%) |
| 40 to 44 Minutes | 402 (3.8%) | 431 (4.3%) |
| 45 to 59 Minutes | 1,036 (9.7%) | 487 (4.8%) |
| 60 to 89 Minutes | 1,050 (9.9%) | 542 (5.4%) |
| 90 or more Minutes | 1,137 (10.7%) | 382 (3.8%) |
Time of Departure to Work by Sex in Lake County
The most frequent times of departure to work in Lake County are 8:00 AM to 8:29 AM (1,381, 13.0%) for males and 7:30 AM to 7:59 AM (2,220, 21.9%) for females.
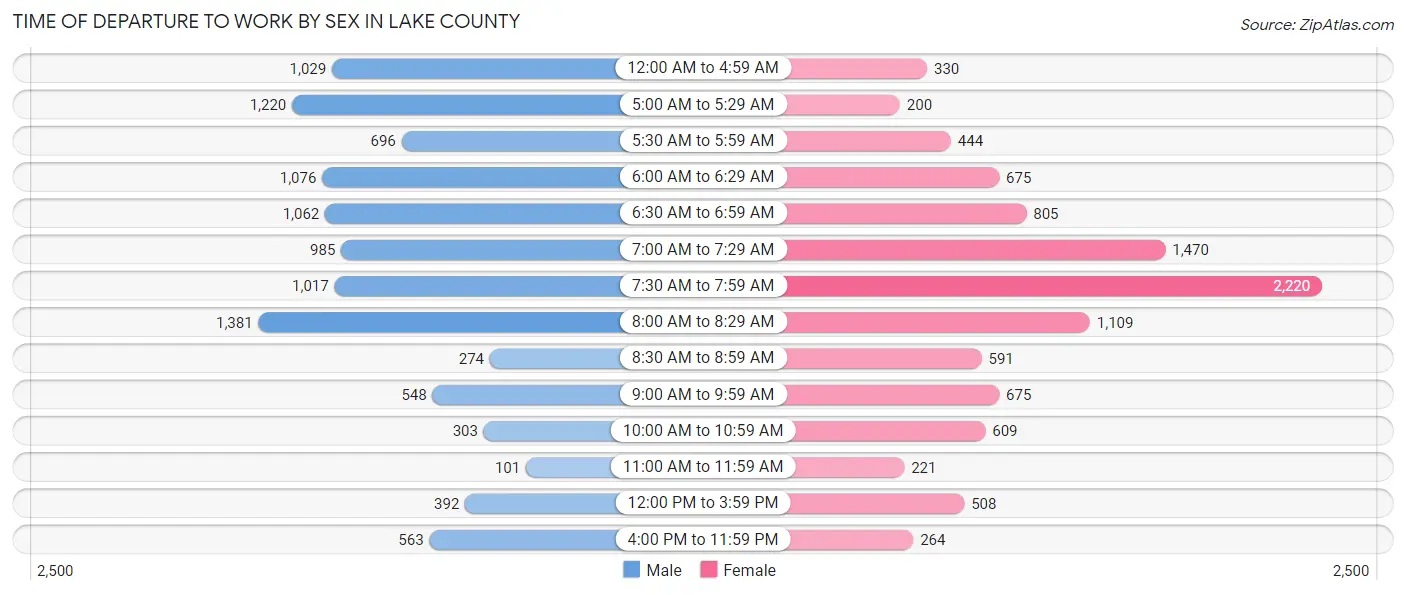
| Time of Departure | Male | Female |
| 12:00 AM to 4:59 AM | 1,029 (9.7%) | 330 (3.3%) |
| 5:00 AM to 5:29 AM | 1,220 (11.5%) | 200 (2.0%) |
| 5:30 AM to 5:59 AM | 696 (6.5%) | 444 (4.4%) |
| 6:00 AM to 6:29 AM | 1,076 (10.1%) | 675 (6.7%) |
| 6:30 AM to 6:59 AM | 1,062 (10.0%) | 805 (8.0%) |
| 7:00 AM to 7:29 AM | 985 (9.2%) | 1,470 (14.5%) |
| 7:30 AM to 7:59 AM | 1,017 (9.6%) | 2,220 (21.9%) |
| 8:00 AM to 8:29 AM | 1,381 (13.0%) | 1,109 (11.0%) |
| 8:30 AM to 8:59 AM | 274 (2.6%) | 591 (5.8%) |
| 9:00 AM to 9:59 AM | 548 (5.1%) | 675 (6.7%) |
| 10:00 AM to 10:59 AM | 303 (2.9%) | 609 (6.0%) |
| 11:00 AM to 11:59 AM | 101 (0.9%) | 221 (2.2%) |
| 12:00 PM to 3:59 PM | 392 (3.7%) | 508 (5.0%) |
| 4:00 PM to 11:59 PM | 563 (5.3%) | 264 (2.6%) |
| Total | 10,647 (100.0%) | 10,121 (100.0%) |
Housing Occupancy in Lake County
Occupancy by Ownership in Lake County
Of the total 26,487 dwellings in Lake County, owner-occupied units account for 18,420 (69.5%), while renter-occupied units make up 8,067 (30.5%).
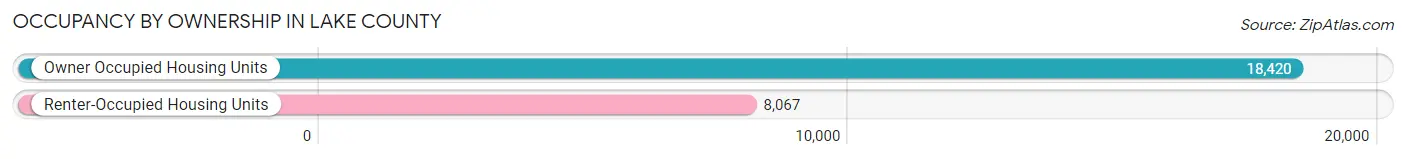
| Occupancy | # Housing Units | % Housing Units |
| Owner Occupied Housing Units | 18,420 | 69.5% |
| Renter-Occupied Housing Units | 8,067 | 30.5% |
| Total Occupied Housing Units | 26,487 | 100.0% |
Occupancy by Household Size in Lake County
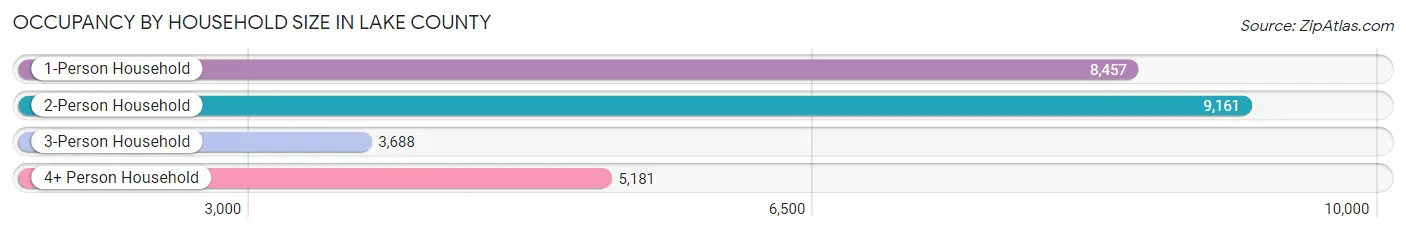
| Household Size | # Housing Units | % Housing Units |
| 1-Person Household | 8,457 | 31.9% |
| 2-Person Household | 9,161 | 34.6% |
| 3-Person Household | 3,688 | 13.9% |
| 4+ Person Household | 5,181 | 19.6% |
| Total Housing Units | 26,487 | 100.0% |
Occupancy by Ownership by Household Size in Lake County
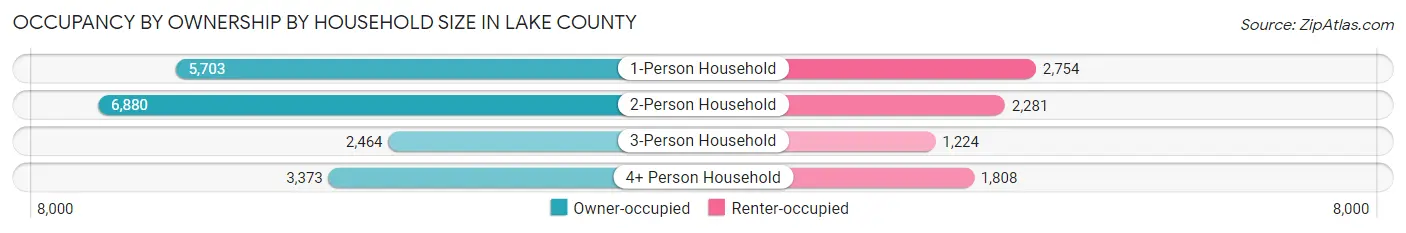
| Household Size | Owner-occupied | Renter-occupied |
| 1-Person Household | 5,703 (67.4%) | 2,754 (32.6%) |
| 2-Person Household | 6,880 (75.1%) | 2,281 (24.9%) |
| 3-Person Household | 2,464 (66.8%) | 1,224 (33.2%) |
| 4+ Person Household | 3,373 (65.1%) | 1,808 (34.9%) |
| Total Housing Units | 18,420 (69.5%) | 8,067 (30.5%) |
Occupancy by Educational Attainment in Lake County
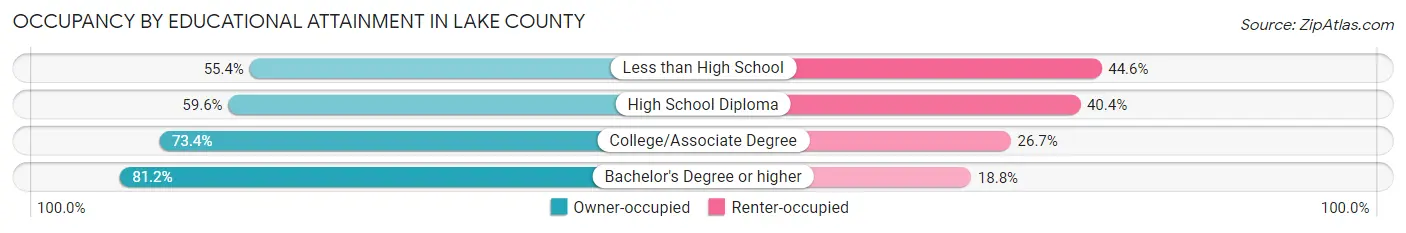
| Household Size | Owner-occupied | Renter-occupied |
| Less than High School | 1,515 (55.4%) | 1,221 (44.6%) |
| High School Diploma | 4,087 (59.6%) | 2,772 (40.4%) |
| College/Associate Degree | 8,410 (73.4%) | 3,055 (26.7%) |
| Bachelor's Degree or higher | 4,408 (81.2%) | 1,019 (18.8%) |
Occupancy by Age of Householder in Lake County
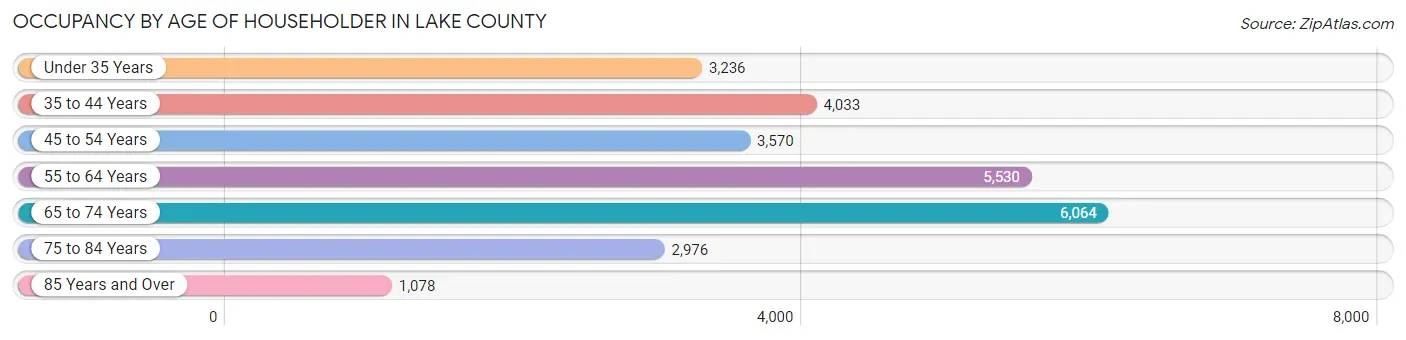
| Age Bracket | # Households | % Households |
| Under 35 Years | 3,236 | 12.2% |
| 35 to 44 Years | 4,033 | 15.2% |
| 45 to 54 Years | 3,570 | 13.5% |
| 55 to 64 Years | 5,530 | 20.9% |
| 65 to 74 Years | 6,064 | 22.9% |
| 75 to 84 Years | 2,976 | 11.2% |
| 85 Years and Over | 1,078 | 4.1% |
| Total | 26,487 | 100.0% |
Housing Finances in Lake County
Median Income by Occupancy in Lake County
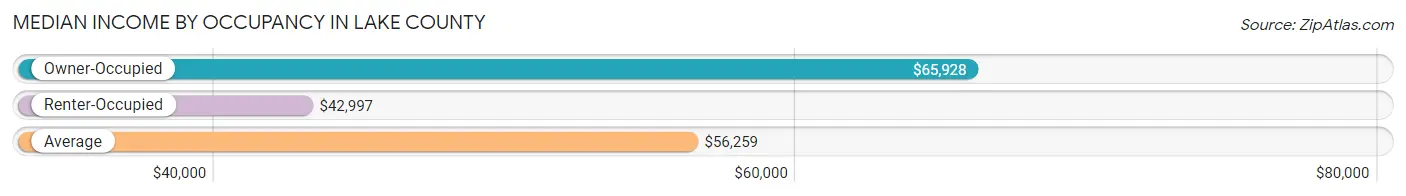
| Occupancy Type | # Households | Median Income |
| Owner-Occupied | 18,420 (69.5%) | $65,928 |
| Renter-Occupied | 8,067 (30.5%) | $42,997 |
| Average | 26,487 (100.0%) | $56,259 |
Occupancy by Householder Income Bracket in Lake County
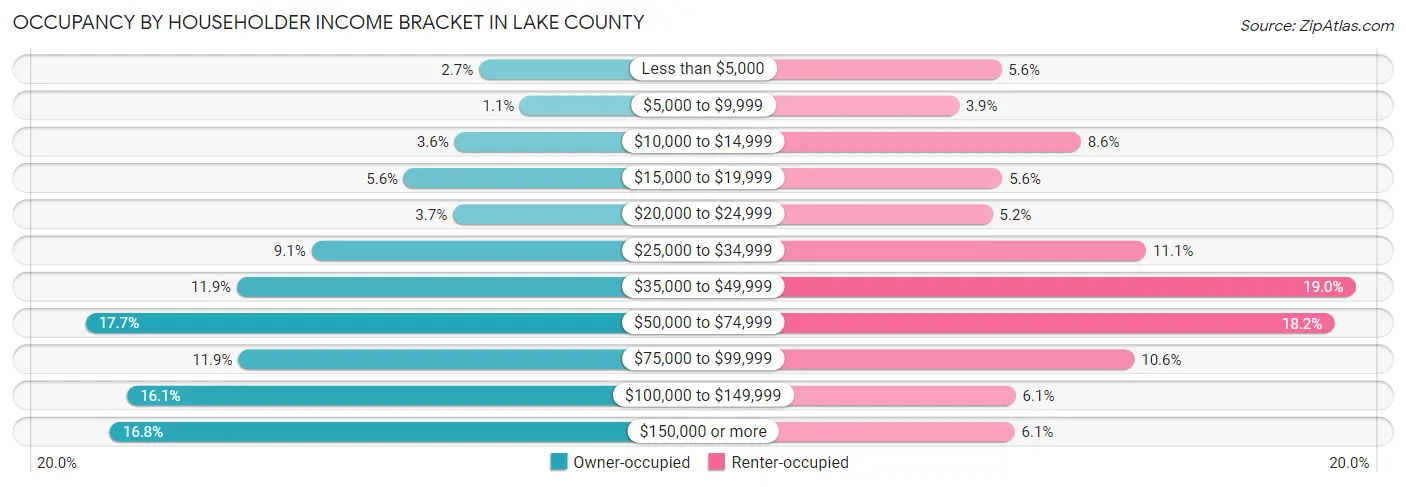
| Income Bracket | Owner-occupied | Renter-occupied |
| Less than $5,000 | 496 (2.7%) | 448 (5.6%) |
| $5,000 to $9,999 | 207 (1.1%) | 317 (3.9%) |
| $10,000 to $14,999 | 667 (3.6%) | 692 (8.6%) |
| $15,000 to $19,999 | 1,023 (5.6%) | 451 (5.6%) |
| $20,000 to $24,999 | 677 (3.7%) | 421 (5.2%) |
| $25,000 to $34,999 | 1,670 (9.1%) | 893 (11.1%) |
| $35,000 to $49,999 | 2,193 (11.9%) | 1,536 (19.0%) |
| $50,000 to $74,999 | 3,255 (17.7%) | 1,471 (18.2%) |
| $75,000 to $99,999 | 2,184 (11.9%) | 857 (10.6%) |
| $100,000 to $149,999 | 2,963 (16.1%) | 492 (6.1%) |
| $150,000 or more | 3,085 (16.8%) | 489 (6.1%) |
| Total | 18,420 (100.0%) | 8,067 (100.0%) |
Monthly Housing Cost Tiers in Lake County
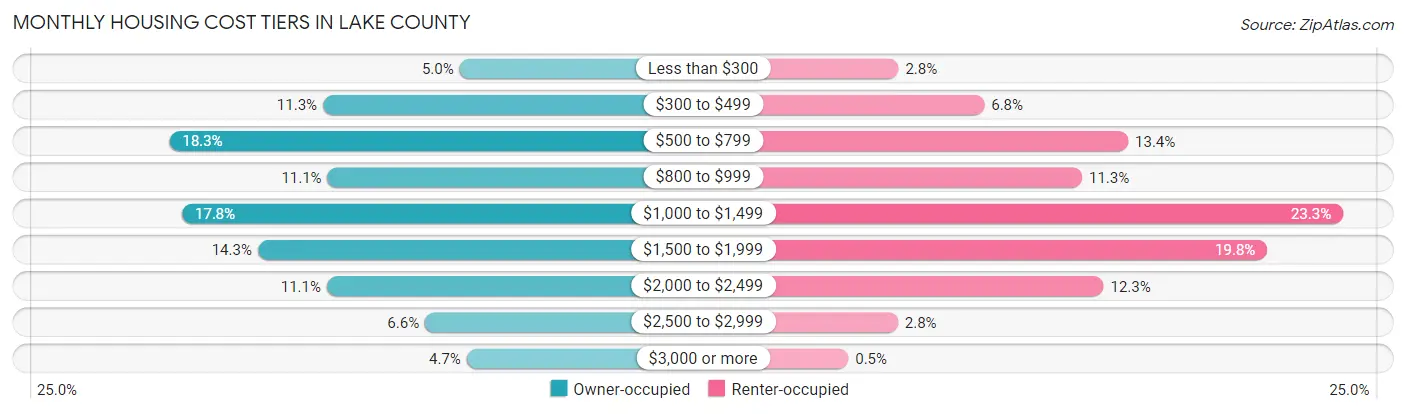
| Monthly Cost | Owner-occupied | Renter-occupied |
| Less than $300 | 918 (5.0%) | 227 (2.8%) |
| $300 to $499 | 2,076 (11.3%) | 545 (6.8%) |
| $500 to $799 | 3,379 (18.3%) | 1,079 (13.4%) |
| $800 to $999 | 2,038 (11.1%) | 908 (11.3%) |
| $1,000 to $1,499 | 3,271 (17.8%) | 1,877 (23.3%) |
| $1,500 to $1,999 | 2,628 (14.3%) | 1,596 (19.8%) |
| $2,000 to $2,499 | 2,043 (11.1%) | 988 (12.2%) |
| $2,500 to $2,999 | 1,211 (6.6%) | 224 (2.8%) |
| $3,000 or more | 856 (4.6%) | 40 (0.5%) |
| Total | 18,420 (100.0%) | 8,067 (100.0%) |
Physical Housing Characteristics in Lake County
Housing Structures in Lake County
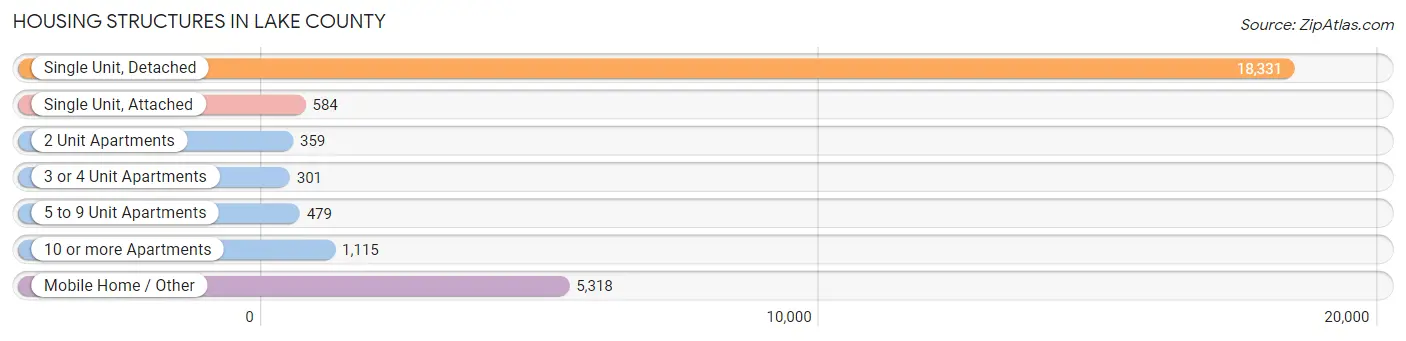
| Structure Type | # Housing Units | % Housing Units |
| Single Unit, Detached | 18,331 | 69.2% |
| Single Unit, Attached | 584 | 2.2% |
| 2 Unit Apartments | 359 | 1.4% |
| 3 or 4 Unit Apartments | 301 | 1.1% |
| 5 to 9 Unit Apartments | 479 | 1.8% |
| 10 or more Apartments | 1,115 | 4.2% |
| Mobile Home / Other | 5,318 | 20.1% |
| Total | 26,487 | 100.0% |
Housing Structures by Occupancy in Lake County
| Structure Type | Owner-occupied | Renter-occupied |
| Single Unit, Detached | 13,974 (76.2%) | 4,357 (23.8%) |
| Single Unit, Attached | 335 (57.4%) | 249 (42.6%) |
| 2 Unit Apartments | 29 (8.1%) | 330 (91.9%) |
| 3 or 4 Unit Apartments | 68 (22.6%) | 233 (77.4%) |
| 5 to 9 Unit Apartments | 0 (0.0%) | 479 (100.0%) |
| 10 or more Apartments | 158 (14.2%) | 957 (85.8%) |
| Mobile Home / Other | 3,856 (72.5%) | 1,462 (27.5%) |
| Total | 18,420 (69.5%) | 8,067 (30.5%) |
Housing Structures by Number of Rooms in Lake County
| Number of Rooms | Owner-occupied | Renter-occupied |
| 1 Room | 269 (1.5%) | 395 (4.9%) |
| 2 or 3 Rooms | 1,152 (6.2%) | 1,486 (18.4%) |
| 4 or 5 Rooms | 8,145 (44.2%) | 4,055 (50.3%) |
| 6 or 7 Rooms | 6,522 (35.4%) | 1,888 (23.4%) |
| 8 or more Rooms | 2,332 (12.7%) | 243 (3.0%) |
| Total | 18,420 (100.0%) | 8,067 (100.0%) |
Housing Structure by Heating Type in Lake County
| Heating Type | Owner-occupied | Renter-occupied |
| Utility Gas | 822 (4.5%) | 566 (7.0%) |
| Bottled, Tank, or LP Gas | 5,189 (28.2%) | 1,754 (21.7%) |
| Electricity | 6,058 (32.9%) | 4,187 (51.9%) |
| Fuel Oil or Kerosene | 2,173 (11.8%) | 275 (3.4%) |
| Coal or Coke | 18 (0.1%) | 0 (0.0%) |
| All other Fuels | 4,087 (22.2%) | 1,196 (14.8%) |
| No Fuel Used | 73 (0.4%) | 89 (1.1%) |
| Total | 18,420 (100.0%) | 8,067 (100.0%) |
Household Vehicle Usage in Lake County
| Vehicles per Household | Owner-occupied | Renter-occupied |
| No Vehicle | 575 (3.1%) | 910 (11.3%) |
| 1 Vehicle | 4,963 (26.9%) | 3,072 (38.1%) |
| 2 Vehicles | 6,620 (35.9%) | 2,653 (32.9%) |
| 3 or more Vehicles | 6,262 (34.0%) | 1,432 (17.7%) |
| Total | 18,420 (100.0%) | 8,067 (100.0%) |
Real Estate & Mortgages in Lake County
Real Estate and Mortgage Overview in Lake County
| Characteristic | Without Mortgage | With Mortgage |
| Housing Units | 8,482 | 9,938 |
| Median Property Value | $252,800 | $327,700 |
| Median Household Income | $50,905 | $2,110 |
| Monthly Housing Costs | $609 | $847 |
| Real Estate Taxes | $1,768 | $298 |
Property Value by Mortgage Status in Lake County
| Property Value | Without Mortgage | With Mortgage |
| Less than $50,000 | 1,035 (12.2%) | 256 (2.6%) |
| $50,000 to $99,999 | 1,086 (12.8%) | 306 (3.1%) |
| $100,000 to $299,999 | 3,066 (36.1%) | 3,907 (39.3%) |
| $300,000 to $499,999 | 2,020 (23.8%) | 3,335 (33.6%) |
| $500,000 to $749,999 | 830 (9.8%) | 1,255 (12.6%) |
| $750,000 to $999,999 | 307 (3.6%) | 414 (4.2%) |
| $1,000,000 or more | 138 (1.6%) | 465 (4.7%) |
| Total | 8,482 (100.0%) | 9,938 (100.0%) |
Household Income by Mortgage Status in Lake County
| Household Income | Without Mortgage | With Mortgage |
| Less than $10,000 | 401 (4.7%) | 56 (0.6%) |
| $10,000 to $24,999 | 1,556 (18.3%) | 302 (3.0%) |
| $25,000 to $34,999 | 1,024 (12.1%) | 811 (8.2%) |
| $35,000 to $49,999 | 1,180 (13.9%) | 646 (6.5%) |
| $50,000 to $74,999 | 1,511 (17.8%) | 1,013 (10.2%) |
| $75,000 to $99,999 | 810 (9.6%) | 1,744 (17.5%) |
| $100,000 to $149,999 | 1,025 (12.1%) | 1,374 (13.8%) |
| $150,000 or more | 975 (11.5%) | 1,938 (19.5%) |
| Total | 8,482 (100.0%) | 9,938 (100.0%) |
Property Value to Household Income Ratio in Lake County
| Value-to-Income Ratio | Without Mortgage | With Mortgage |
| Less than 2.0x | 2,419 (28.5%) | 84,115 (846.4%) |
| 2.0x to 2.9x | 758 (8.9%) | 1,582 (15.9%) |
| 3.0x to 3.9x | 1,033 (12.2%) | 2,213 (22.3%) |
| 4.0x or more | 4,235 (49.9%) | 1,555 (15.7%) |
| Total | 8,482 (100.0%) | 9,938 (100.0%) |
Real Estate Taxes by Mortgage Status in Lake County
| Property Taxes | Without Mortgage | With Mortgage |
| Less than $800 | 1,703 (20.1%) | 71 (0.7%) |
| $800 to $1,499 | 1,499 (17.7%) | 572 (5.8%) |
| $800 to $1,499 | 4,509 (53.2%) | 2,024 (20.4%) |
| Total | 8,482 (100.0%) | 9,938 (100.0%) |
Health & Disability in Lake County
Health Insurance Coverage by Age in Lake County
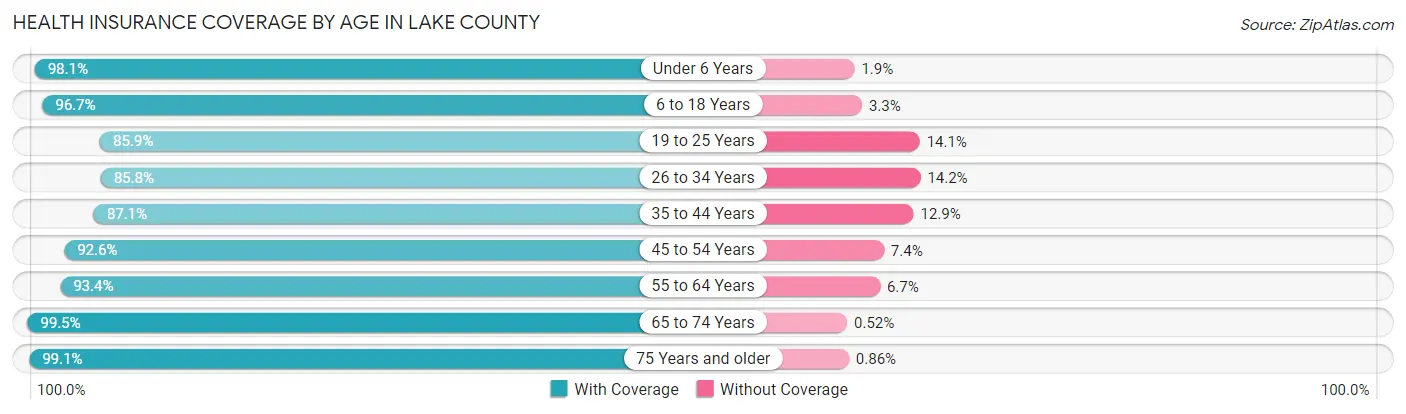
| Age Bracket | With Coverage | Without Coverage |
| Under 6 Years | 4,332 (98.1%) | 84 (1.9%) |
| 6 to 18 Years | 10,308 (96.7%) | 353 (3.3%) |
| 19 to 25 Years | 3,624 (85.9%) | 593 (14.1%) |
| 26 to 34 Years | 6,041 (85.8%) | 1,000 (14.2%) |
| 35 to 44 Years | 6,686 (87.1%) | 991 (12.9%) |
| 45 to 54 Years | 6,996 (92.6%) | 558 (7.4%) |
| 55 to 64 Years | 9,534 (93.3%) | 679 (6.7%) |
| 65 to 74 Years | 9,587 (99.5%) | 50 (0.5%) |
| 75 Years and older | 5,894 (99.1%) | 51 (0.9%) |
| Total | 63,002 (93.5%) | 4,359 (6.5%) |
Health Insurance Coverage by Citizenship Status in Lake County
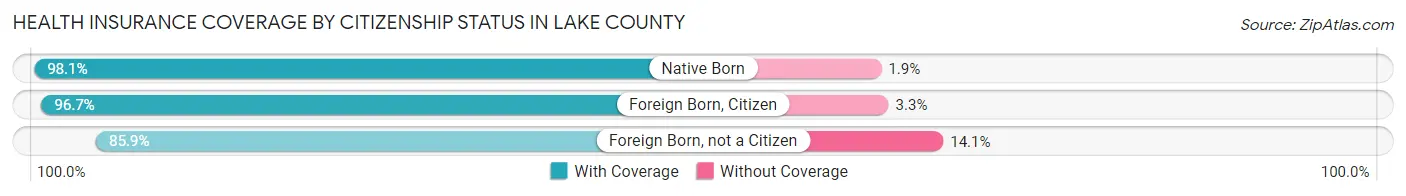
| Citizenship Status | With Coverage | Without Coverage |
| Native Born | 4,332 (98.1%) | 84 (1.9%) |
| Foreign Born, Citizen | 10,308 (96.7%) | 353 (3.3%) |
| Foreign Born, not a Citizen | 3,624 (85.9%) | 593 (14.1%) |
Health Insurance Coverage by Household Income in Lake County
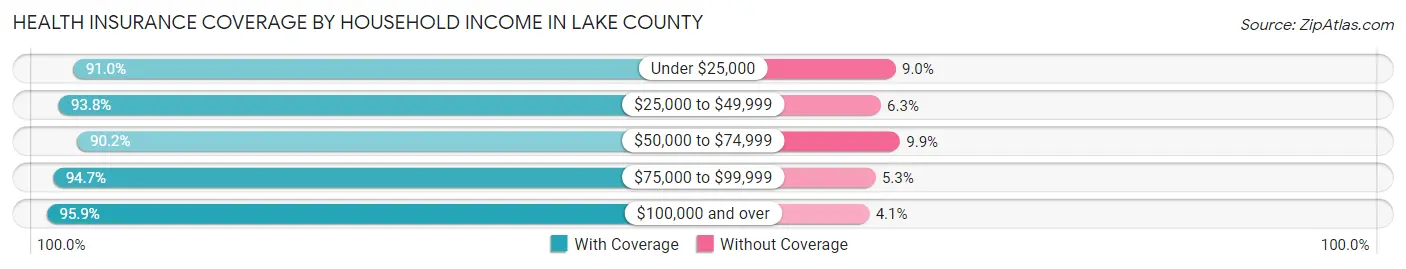
| Household Income | With Coverage | Without Coverage |
| Under $25,000 | 7,853 (91.0%) | 780 (9.0%) |
| $25,000 to $49,999 | 13,969 (93.8%) | 931 (6.2%) |
| $50,000 to $74,999 | 11,209 (90.1%) | 1,225 (9.9%) |
| $75,000 to $99,999 | 8,720 (94.7%) | 485 (5.3%) |
| $100,000 and over | 20,868 (95.9%) | 892 (4.1%) |
Public vs Private Health Insurance Coverage by Age in Lake County
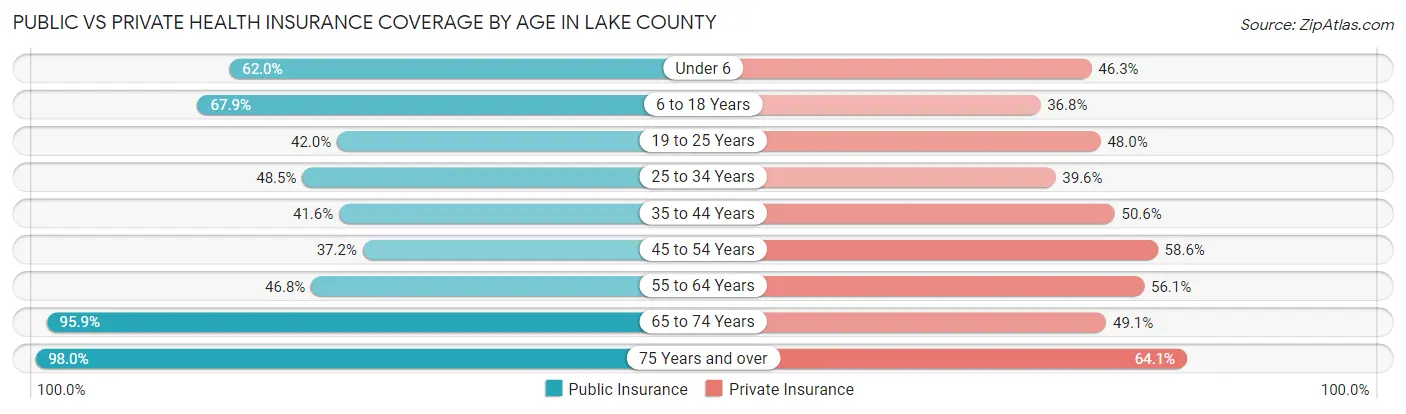
| Age Bracket | Public Insurance | Private Insurance |
| Under 6 | 2,738 (62.0%) | 2,046 (46.3%) |
| 6 to 18 Years | 7,236 (67.9%) | 3,926 (36.8%) |
| 19 to 25 Years | 1,771 (42.0%) | 2,025 (48.0%) |
| 25 to 34 Years | 3,412 (48.5%) | 2,791 (39.6%) |
| 35 to 44 Years | 3,197 (41.6%) | 3,886 (50.6%) |
| 45 to 54 Years | 2,813 (37.2%) | 4,429 (58.6%) |
| 55 to 64 Years | 4,781 (46.8%) | 5,729 (56.1%) |
| 65 to 74 Years | 9,242 (95.9%) | 4,728 (49.1%) |
| 75 Years and over | 5,827 (98.0%) | 3,808 (64.0%) |
| Total | 41,017 (60.9%) | 33,368 (49.5%) |
Disability Status by Sex by Age in Lake County
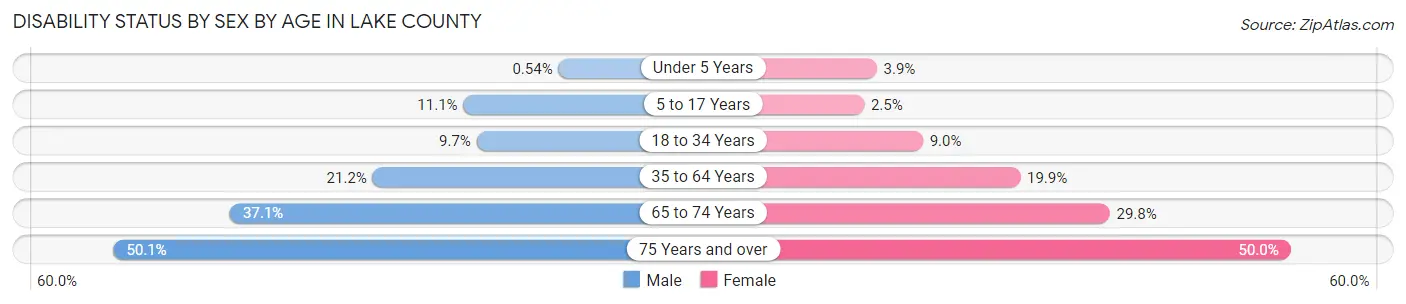
| Age Bracket | Male | Female |
| Under 5 Years | 10 (0.5%) | 77 (3.9%) |
| 5 to 17 Years | 620 (11.1%) | 126 (2.5%) |
| 18 to 34 Years | 589 (9.7%) | 517 (9.0%) |
| 35 to 64 Years | 2,678 (21.2%) | 2,548 (19.9%) |
| 65 to 74 Years | 1,752 (37.1%) | 1,467 (29.8%) |
| 75 Years and over | 1,440 (50.1%) | 1,535 (50.0%) |
Disability Class by Sex by Age in Lake County
Disability Class: Hearing Difficulty
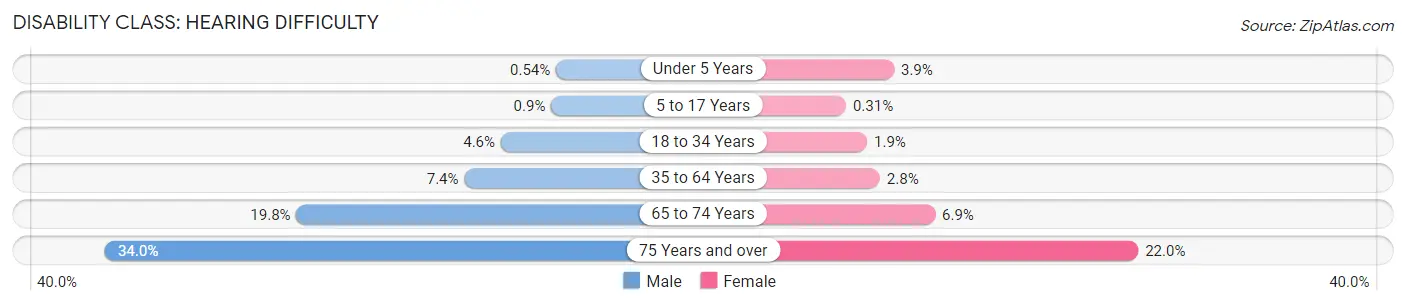
| Age Bracket | Male | Female |
| Under 5 Years | 10 (0.5%) | 77 (3.9%) |
| 5 to 17 Years | 50 (0.9%) | 16 (0.3%) |
| 18 to 34 Years | 283 (4.6%) | 108 (1.9%) |
| 35 to 64 Years | 927 (7.3%) | 363 (2.8%) |
| 65 to 74 Years | 935 (19.8%) | 341 (6.9%) |
| 75 Years and over | 978 (34.0%) | 676 (22.0%) |
Disability Class: Vision Difficulty
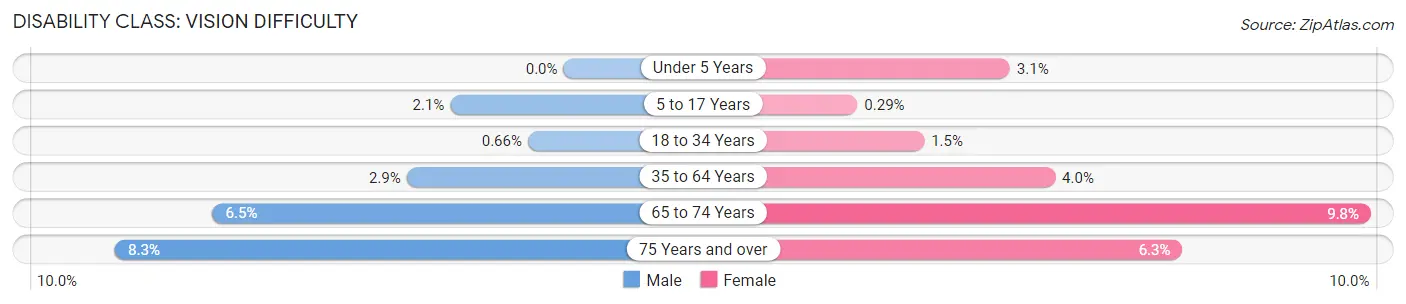
| Age Bracket | Male | Female |
| Under 5 Years | 0 (0.0%) | 62 (3.1%) |
| 5 to 17 Years | 117 (2.1%) | 15 (0.3%) |
| 18 to 34 Years | 40 (0.7%) | 88 (1.5%) |
| 35 to 64 Years | 367 (2.9%) | 509 (4.0%) |
| 65 to 74 Years | 307 (6.5%) | 483 (9.8%) |
| 75 Years and over | 239 (8.3%) | 194 (6.3%) |
Disability Class: Cognitive Difficulty
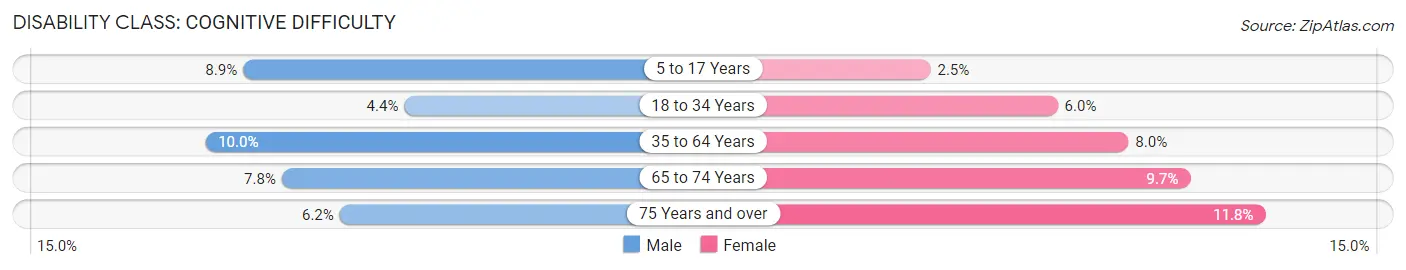
| Age Bracket | Male | Female |
| 5 to 17 Years | 497 (8.9%) | 126 (2.5%) |
| 18 to 34 Years | 270 (4.4%) | 345 (6.0%) |
| 35 to 64 Years | 1,257 (10.0%) | 1,024 (8.0%) |
| 65 to 74 Years | 370 (7.8%) | 477 (9.7%) |
| 75 Years and over | 179 (6.2%) | 362 (11.8%) |
Disability Class: Ambulatory Difficulty
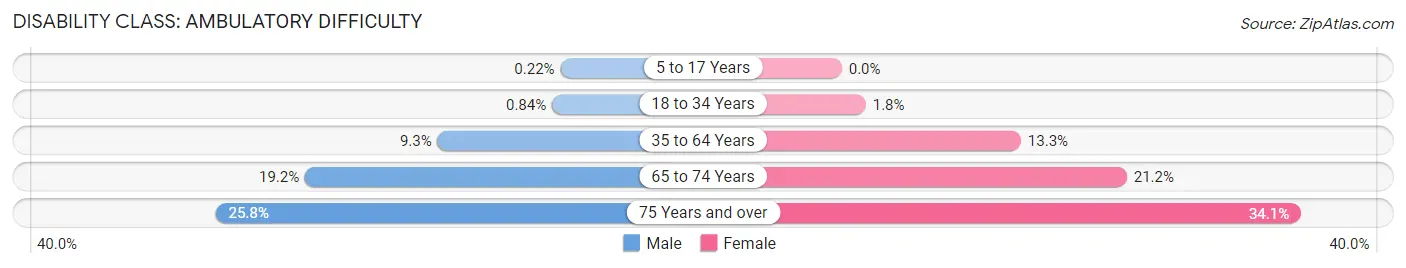
| Age Bracket | Male | Female |
| 5 to 17 Years | 12 (0.2%) | 0 (0.0%) |
| 18 to 34 Years | 51 (0.8%) | 102 (1.8%) |
| 35 to 64 Years | 1,178 (9.3%) | 1,708 (13.3%) |
| 65 to 74 Years | 905 (19.2%) | 1,041 (21.2%) |
| 75 Years and over | 742 (25.8%) | 1,047 (34.1%) |
Disability Class: Self-Care Difficulty
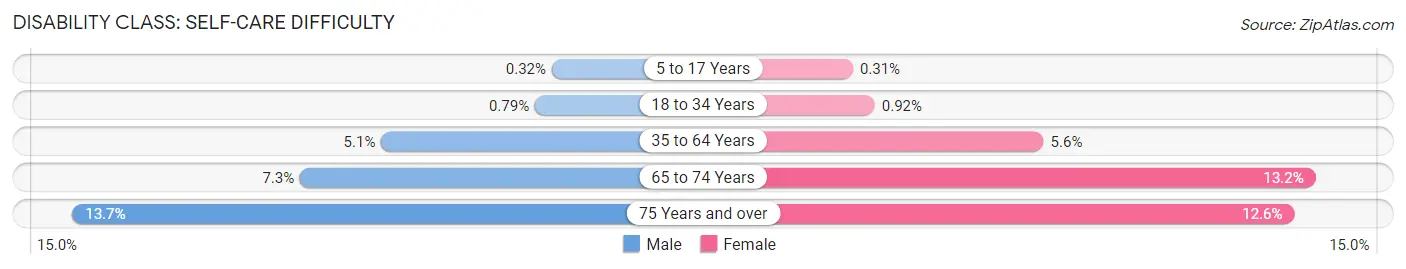
| Age Bracket | Male | Female |
| 5 to 17 Years | 18 (0.3%) | 16 (0.3%) |
| 18 to 34 Years | 48 (0.8%) | 53 (0.9%) |
| 35 to 64 Years | 639 (5.1%) | 722 (5.6%) |
| 65 to 74 Years | 346 (7.3%) | 649 (13.2%) |
| 75 Years and over | 393 (13.7%) | 387 (12.6%) |
Technology Access in Lake County
Computing Device Access in Lake County
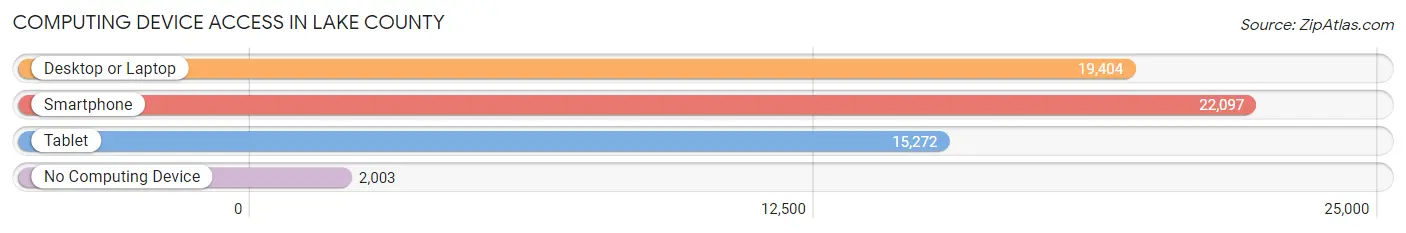
| Device Type | # Households | % Households |
| Desktop or Laptop | 19,404 | 73.3% |
| Smartphone | 22,097 | 83.4% |
| Tablet | 15,272 | 57.7% |
| No Computing Device | 2,003 | 7.6% |
| Total | 26,487 | 100.0% |
Internet Access in Lake County
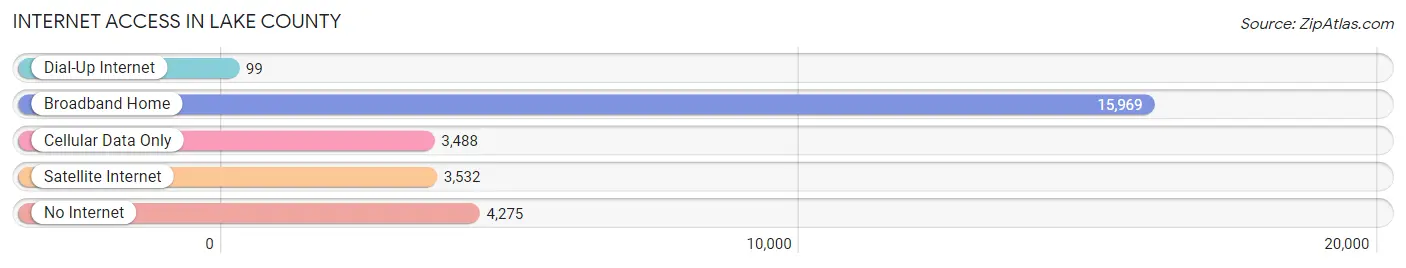
| Internet Type | # Households | % Households |
| Dial-Up Internet | 99 | 0.4% |
| Broadband Home | 15,969 | 60.3% |
| Cellular Data Only | 3,488 | 13.2% |
| Satellite Internet | 3,532 | 13.3% |
| No Internet | 4,275 | 16.1% |
| Total | 26,487 | 100.0% |
Lake County Summary
Lake County is a county located in the northern part of the U.S. state of California. As of the 2010 census, the population was 64,665. The county seat is Lakeport. The county takes its name from Clear Lake, the dominant geographic feature in the county and the largest natural lake wholly within California.
History
The first inhabitants of Lake County were the Pomo people, who lived in the area for thousands of years. The first European settlers arrived in the area in the early 1850s, and the county was officially established in 1861. The county was originally part of Napa and Mendocino counties, but was split off in 1861.
The county was originally home to several Native American tribes, including the Pomo, Wappo, and Konkow. The county was also home to several gold mining camps during the California Gold Rush.
Geography
Lake County is located in the northern part of California, and is bordered by Mendocino County to the north, Napa County to the east, Sonoma County to the south, and Colusa County to the west. The county covers an area of 1,329 square miles, and is home to Clear Lake, the largest natural lake wholly within California.
The county is mostly mountainous, with the Mayacamas Mountains to the east and the Coast Range to the west. The highest point in the county is Mount Konocti, which rises to an elevation of 4,299 feet.
The county is home to several rivers including the Russian River Cache Creek and Putah Creek
Economy
The economy of Lake County is largely based on agriculture and tourism. The county is home to several wineries, and is a popular destination for wine tasting. The county is also home to several resorts and recreational areas, including Clear Lake State Park and Anderson Marsh State Historic Park.
The county is also home to several industries including lumber electronics and food processing
Demographics
As of the 2010 census, the population of Lake County was 64,665. The racial makeup of the county was 68.3% White, 0.7% African American, 3.2% Native American, 0.7% Asian, 0.1% Pacific Islander, 22.2% from other races, and 4.9% from two or more races. Hispanic or Latino of any race were 33.2% of the population.
The median income for a household in the county was $41,845, and the median income for a family was $48,945. The per capita income for the county was $20,945. About 14.2% of families and 18.2% of the population were below the poverty line, including 25.2% of those under age 18 and 8.2% of those age 65 or over.
Common Questions
What is Per Capita Income in Lake County?
Per Capita income in Lake County is $34,020.
What is the Median Family Income in Lake County?
Median Family Income in Lake County is $77,378.
What is the Median Household income in Lake County?
Median Household Income in Lake County is $56,259.
What is Income or Wage Gap in Lake County?
Income or Wage Gap in Lake County is 28.7%.
Women in Lake County earn 71.3 cents for every dollar earned by a man.
What is Family Income Deficit in Lake County?
Family Income Deficit in Lake County is $10,669.
Families that are below poverty line in Lake County earn $10,669 less on average than the poverty threshold level.
What is Inequality or Gini Index in Lake County?
Inequality or Gini Index in Lake County is 0.49.
What is the Total Population of Lake County?
Total Population of Lake County is 68,024.
What is the Total Male Population of Lake County?
Total Male Population of Lake County is 34,144.
What is the Total Female Population of Lake County?
Total Female Population of Lake County is 33,880.
What is the Ratio of Males per 100 Females in Lake County?
There are 100.78 Males per 100 Females in Lake County.
What is the Ratio of Females per 100 Males in Lake County?
There are 99.23 Females per 100 Males in Lake County.
What is the Median Population Age in Lake County?
Median Population Age in Lake County is 44.5 Years.
What is the Average Family Size in Lake County
Average Family Size in Lake County is 3.2 People.
What is the Average Household Size in Lake County
Average Household Size in Lake County is 2.5 People.
How Large is the Labor Force in Lake County?
There are 28,403 People in the Labor Forcein in Lake County.
What is the Percentage of People in the Labor Force in Lake County?
51.7% of People are in the Labor Force in Lake County.
What is the Unemployment Rate in Lake County?
Unemployment Rate in Lake County is 10.4%.