Kings County, CA Map & Demographics
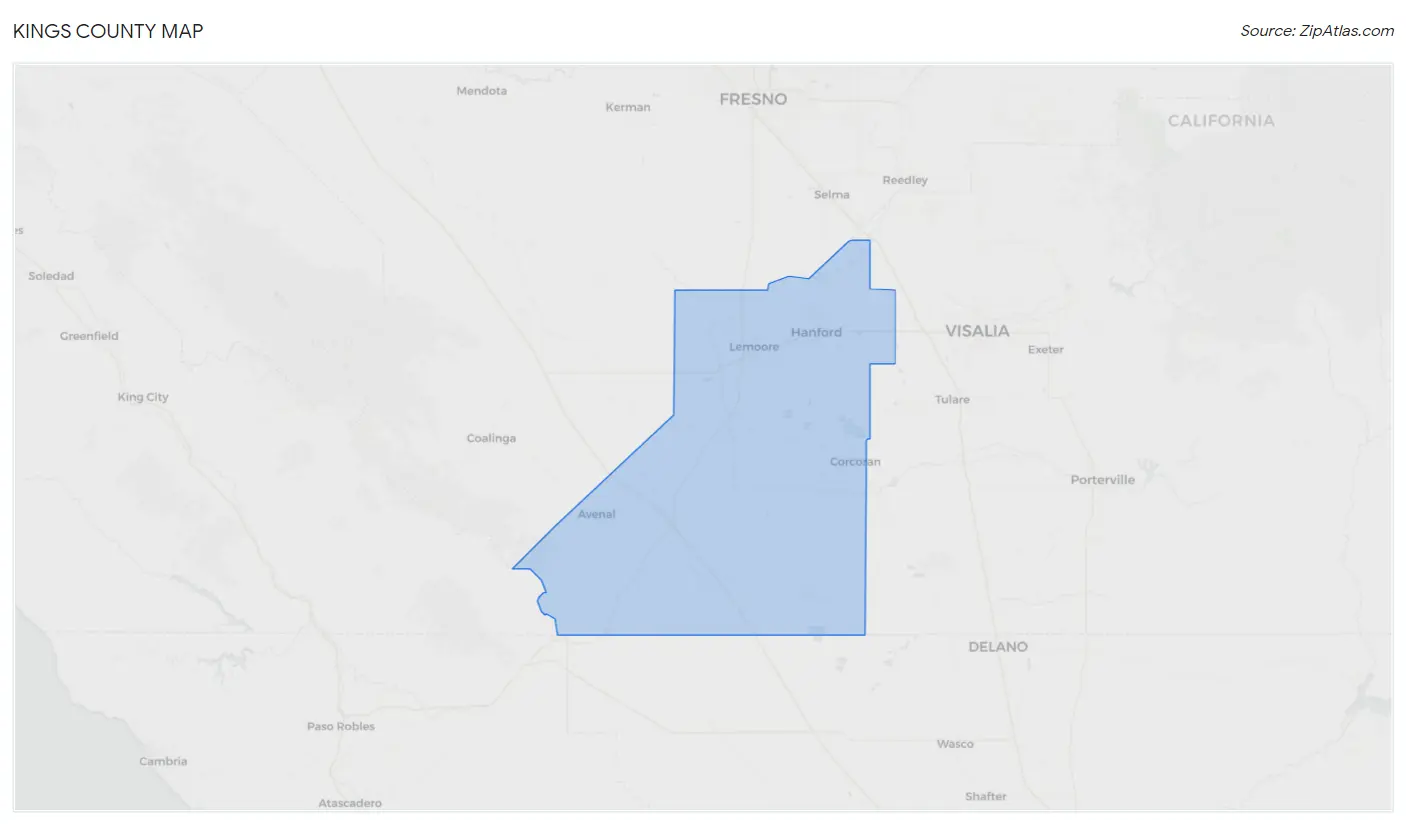
Kings County Map
Kings County Overview
$26,193
PER CAPITA INCOME
$72,111
AVG FAMILY INCOME
$68,540
AVG HOUSEHOLD INCOME
30.5%
WAGE / INCOME GAP [ % ]
69.5¢/ $1
WAGE / INCOME GAP [ $ ]
$12,257
FAMILY INCOME DEFICIT
0.41
INEQUALITY / GINI INDEX
152,515
TOTAL POPULATION
84,277
MALE POPULATION
68,238
FEMALE POPULATION
123.50
MALES / 100 FEMALES
80.97
FEMALES / 100 MALES
32.1
MEDIAN AGE
3.6
AVG FAMILY SIZE
3.2
AVG HOUSEHOLD SIZE
63,802
LABOR FORCE [ PEOPLE ]
55.1%
PERCENT IN LABOR FORCE
9.2%
UNEMPLOYMENT RATE
Kings County Area Codes
Income in Kings County
Income Overview in Kings County
Per Capita Income in Kings County is $26,193, while median incomes of families and households are $72,111 and $68,540 respectively.
| Characteristic | Number | Measure |
| Per Capita Income | 152,515 | $26,193 |
| Median Family Income | 33,660 | $72,111 |
| Mean Family Income | 33,660 | $89,753 |
| Median Household Income | 43,594 | $68,540 |
| Mean Household Income | 43,594 | $85,040 |
| Income Deficit | 33,660 | $12,257 |
| Wage / Income Gap (%) | 152,515 | 30.50% |
| Wage / Income Gap ($) | 152,515 | 69.50¢ per $1 |
| Gini / Inequality Index | 152,515 | 0.41 |
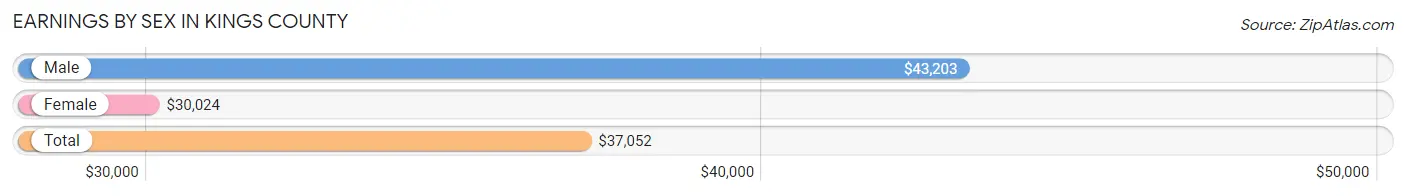
Earnings by Sex in Kings County
Average Earnings in Kings County are $37,052, $43,203 for men and $30,024 for women, a difference of 30.5%.
| Sex | Number | Average Earnings |
| Male | 39,020 (59.4%) | $43,203 |
| Female | 26,720 (40.6%) | $30,024 |
| Total | 65,740 (100.0%) | $37,052 |
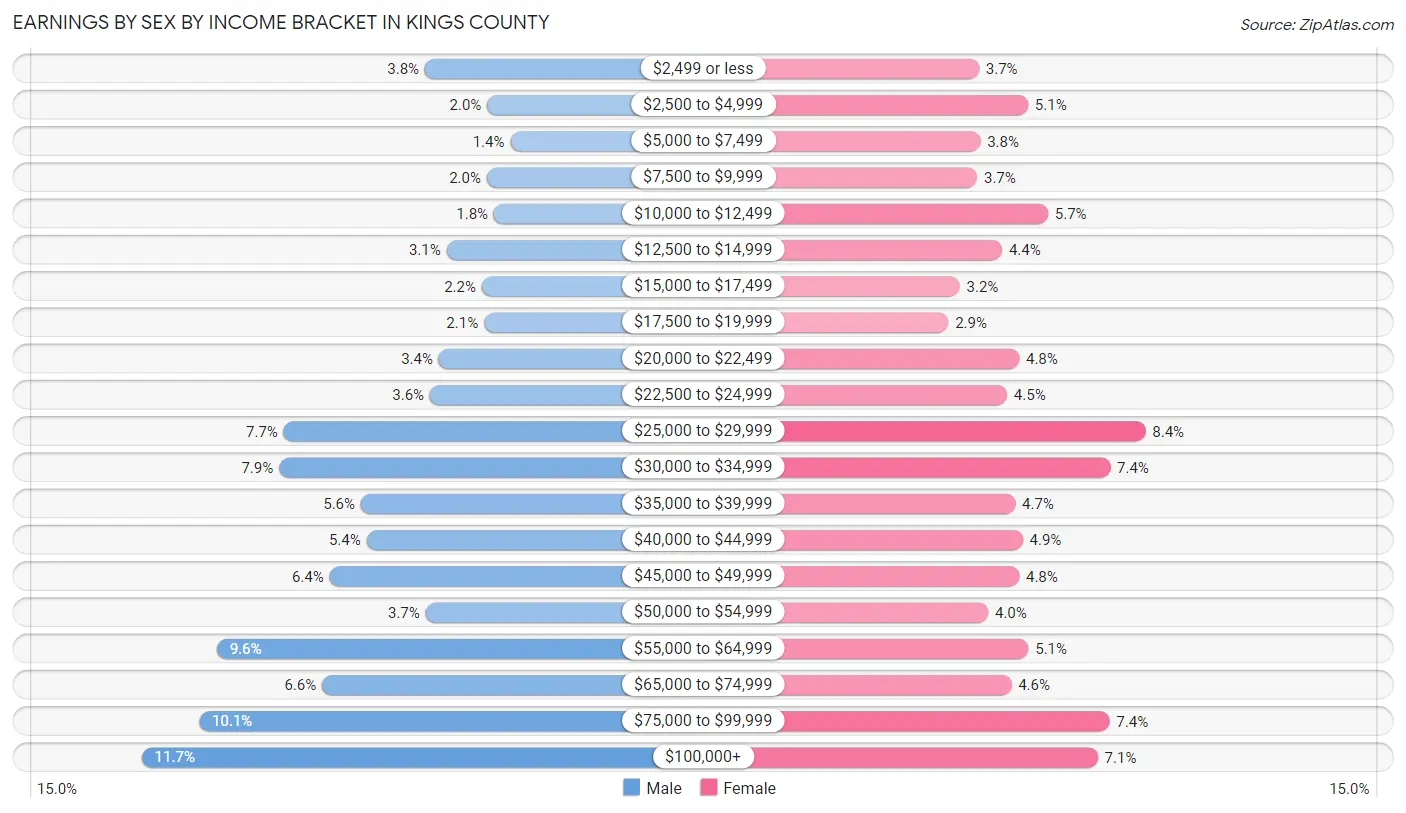
Earnings by Sex by Income Bracket in Kings County
The most common earnings brackets in Kings County are $100,000+ for men (4,571 | 11.7%) and $25,000 to $29,999 for women (2,242 | 8.4%).
| Income | Male | Female |
| $2,499 or less | 1,465 (3.7%) | 991 (3.7%) |
| $2,500 to $4,999 | 779 (2.0%) | 1,361 (5.1%) |
| $5,000 to $7,499 | 526 (1.3%) | 1,001 (3.7%) |
| $7,500 to $9,999 | 784 (2.0%) | 979 (3.7%) |
| $10,000 to $12,499 | 707 (1.8%) | 1,510 (5.7%) |
| $12,500 to $14,999 | 1,227 (3.1%) | 1,164 (4.4%) |
| $15,000 to $17,499 | 840 (2.1%) | 847 (3.2%) |
| $17,500 to $19,999 | 815 (2.1%) | 762 (2.9%) |
| $20,000 to $22,499 | 1,310 (3.4%) | 1,292 (4.8%) |
| $22,500 to $24,999 | 1,407 (3.6%) | 1,202 (4.5%) |
| $25,000 to $29,999 | 3,012 (7.7%) | 2,242 (8.4%) |
| $30,000 to $34,999 | 3,062 (7.9%) | 1,976 (7.4%) |
| $35,000 to $39,999 | 2,167 (5.6%) | 1,265 (4.7%) |
| $40,000 to $44,999 | 2,104 (5.4%) | 1,319 (4.9%) |
| $45,000 to $49,999 | 2,509 (6.4%) | 1,294 (4.8%) |
| $50,000 to $54,999 | 1,454 (3.7%) | 1,060 (4.0%) |
| $55,000 to $64,999 | 3,747 (9.6%) | 1,364 (5.1%) |
| $65,000 to $74,999 | 2,592 (6.6%) | 1,234 (4.6%) |
| $75,000 to $99,999 | 3,942 (10.1%) | 1,972 (7.4%) |
| $100,000+ | 4,571 (11.7%) | 1,885 (7.0%) |
| Total | 39,020 (100.0%) | 26,720 (100.0%) |
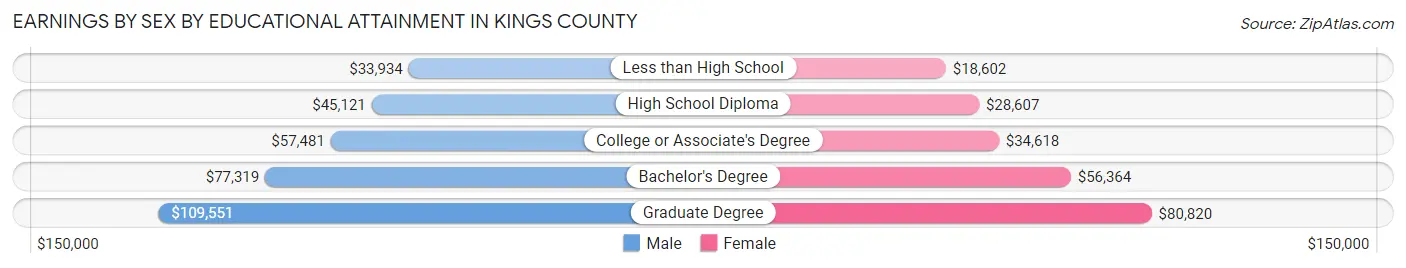
Earnings by Sex by Educational Attainment in Kings County
Average earnings in Kings County are $47,973 for men and $34,022 for women, a difference of 29.1%. Men with an educational attainment of graduate degree enjoy the highest average annual earnings of $109,551, while those with less than high school education earn the least with $33,934. Women with an educational attainment of graduate degree earn the most with the average annual earnings of $80,820, while those with less than high school education have the smallest earnings of $18,602.
| Educational Attainment | Male Income | Female Income |
| Less than High School | $33,934 | $18,602 |
| High School Diploma | $45,121 | $28,607 |
| College or Associate's Degree | $57,481 | $34,618 |
| Bachelor's Degree | $77,319 | $56,364 |
| Graduate Degree | $109,551 | $80,820 |
| Total | $47,973 | $34,022 |
Family Income in Kings County
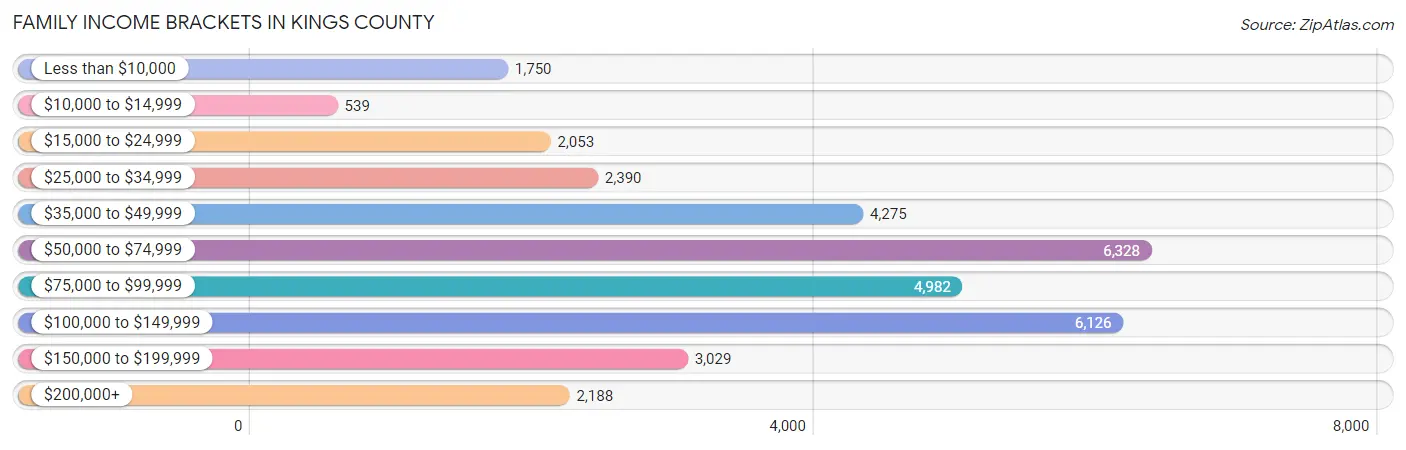
Family Income Brackets in Kings County
According to the Kings County family income data, there are 6,328 families falling into the $50,000 to $74,999 income range, which is the most common income bracket and makes up 18.8% of all families. Conversely, the $10,000 to $14,999 income bracket is the least frequent group with only 539 families (1.6%) belonging to this category.
| Income Bracket | # Families | % Families |
| Less than $10,000 | 1,750 | 5.2% |
| $10,000 to $14,999 | 539 | 1.6% |
| $15,000 to $24,999 | 2,053 | 6.1% |
| $25,000 to $34,999 | 2,390 | 7.1% |
| $35,000 to $49,999 | 4,275 | 12.7% |
| $50,000 to $74,999 | 6,328 | 18.8% |
| $75,000 to $99,999 | 4,982 | 14.8% |
| $100,000 to $149,999 | 6,126 | 18.2% |
| $150,000 to $199,999 | 3,029 | 9.0% |
| $200,000+ | 2,188 | 6.5% |
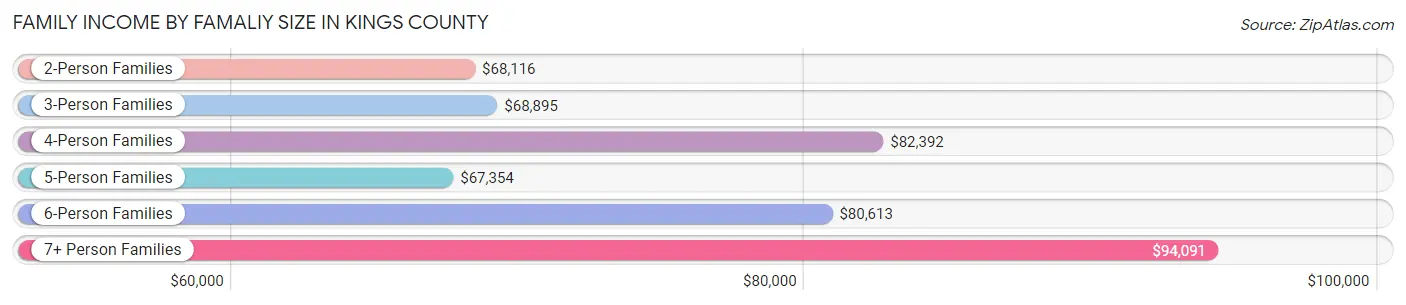
Family Income by Famaliy Size in Kings County
7+ person families (1,044 | 3.1%) account for the highest median family income in Kings County with $94,091 per family, while 2-person families (11,856 | 35.2%) have the highest median income of $34,058 per family member.
| Income Bracket | # Families | Median Income |
| 2-Person Families | 11,856 (35.2%) | $68,116 |
| 3-Person Families | 7,061 (21.0%) | $68,895 |
| 4-Person Families | 7,178 (21.3%) | $82,392 |
| 5-Person Families | 4,377 (13.0%) | $67,354 |
| 6-Person Families | 2,144 (6.4%) | $80,613 |
| 7+ Person Families | 1,044 (3.1%) | $94,091 |
| Total | 33,660 (100.0%) | $72,111 |
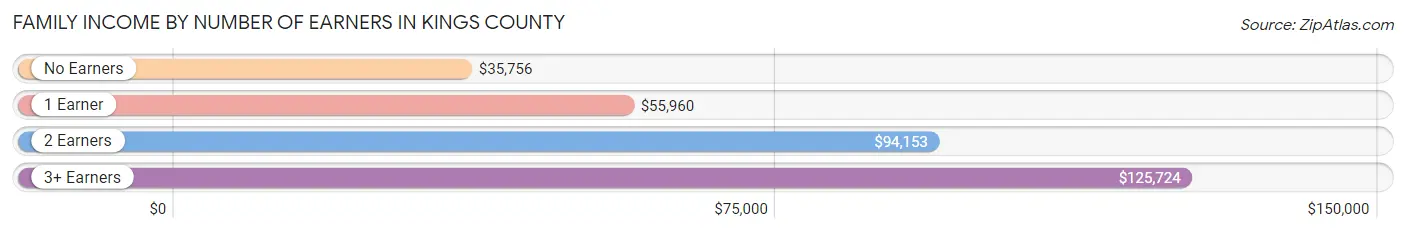
Family Income by Number of Earners in Kings County
The median family income in Kings County is $72,111, with families comprising 3+ earners (3,365) having the highest median family income of $125,724, while families with no earners (4,788) have the lowest median family income of $35,756, accounting for 10.0% and 14.2% of families, respectively.
| Number of Earners | # Families | Median Income |
| No Earners | 4,788 (14.2%) | $35,756 |
| 1 Earner | 13,111 (39.0%) | $55,960 |
| 2 Earners | 12,396 (36.8%) | $94,153 |
| 3+ Earners | 3,365 (10.0%) | $125,724 |
| Total | 33,660 (100.0%) | $72,111 |
Household Income in Kings County
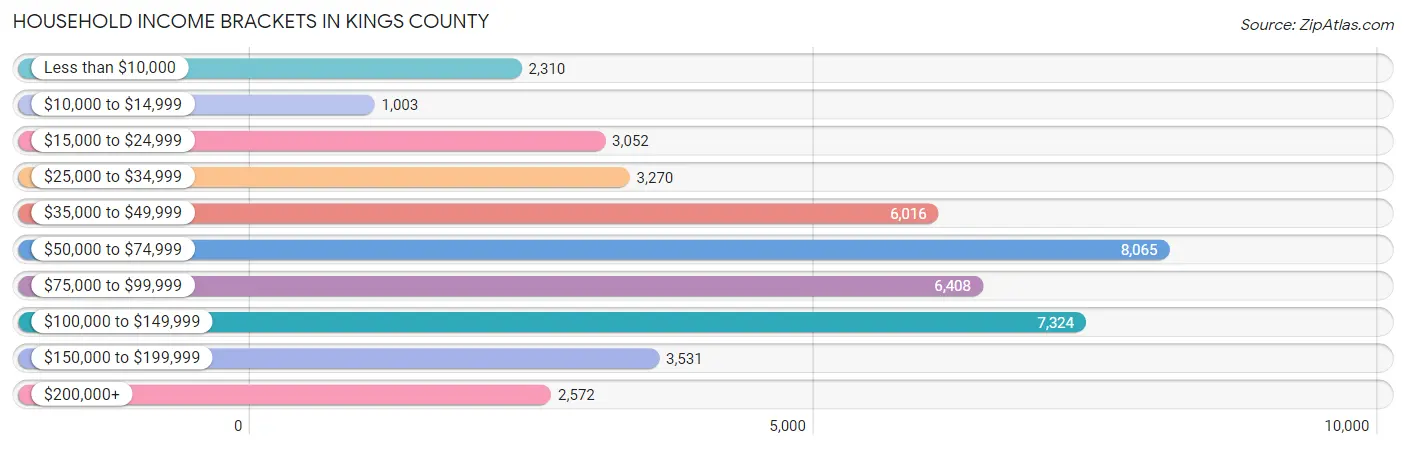
Household Income Brackets in Kings County
With 8,065 households falling in the category, the $50,000 to $74,999 income range is the most frequent in Kings County, accounting for 18.5% of all households. In contrast, only 1,003 households (2.3%) fall into the $10,000 to $14,999 income bracket, making it the least populous group.
| Income Bracket | # Households | % Households |
| Less than $10,000 | 2,310 | 5.3% |
| $10,000 to $14,999 | 1,003 | 2.3% |
| $15,000 to $24,999 | 3,052 | 7.0% |
| $25,000 to $34,999 | 3,270 | 7.5% |
| $35,000 to $49,999 | 6,016 | 13.8% |
| $50,000 to $74,999 | 8,065 | 18.5% |
| $75,000 to $99,999 | 6,408 | 14.7% |
| $100,000 to $149,999 | 7,324 | 16.8% |
| $150,000 to $199,999 | 3,531 | 8.1% |
| $200,000+ | 2,572 | 5.9% |
Household Income by Householder Age in Kings County
The median household income in Kings County is $68,540, with the highest median household income of $83,447 found in the 45 to 64 years age bracket for the primary householder. A total of 14,592 households (33.5%) fall into this category. Meanwhile, the 15 to 24 years age bracket for the primary householder has the lowest median household income of $44,792, with 2,066 households (4.7%) in this group.
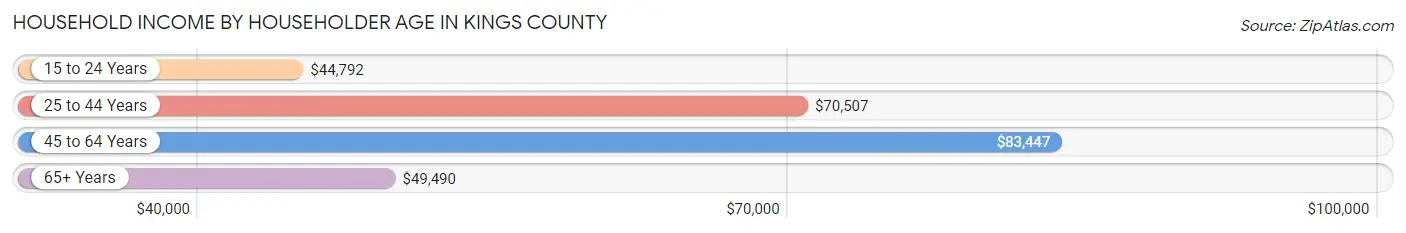
| Income Bracket | # Households | Median Income |
| 15 to 24 Years | 2,066 (4.7%) | $44,792 |
| 25 to 44 Years | 17,555 (40.3%) | $70,507 |
| 45 to 64 Years | 14,592 (33.5%) | $83,447 |
| 65+ Years | 9,381 (21.5%) | $49,490 |
| Total | 43,594 (100.0%) | $68,540 |
Poverty in Kings County
Income Below Poverty by Sex and Age in Kings County
With 15.0% poverty level for males and 17.5% for females among the residents of Kings County, under 5 year old males and under 5 year old females are the most vulnerable to poverty, with 1,456 males (26.3%) and 1,446 females (26.1%) in their respective age groups living below the poverty level.
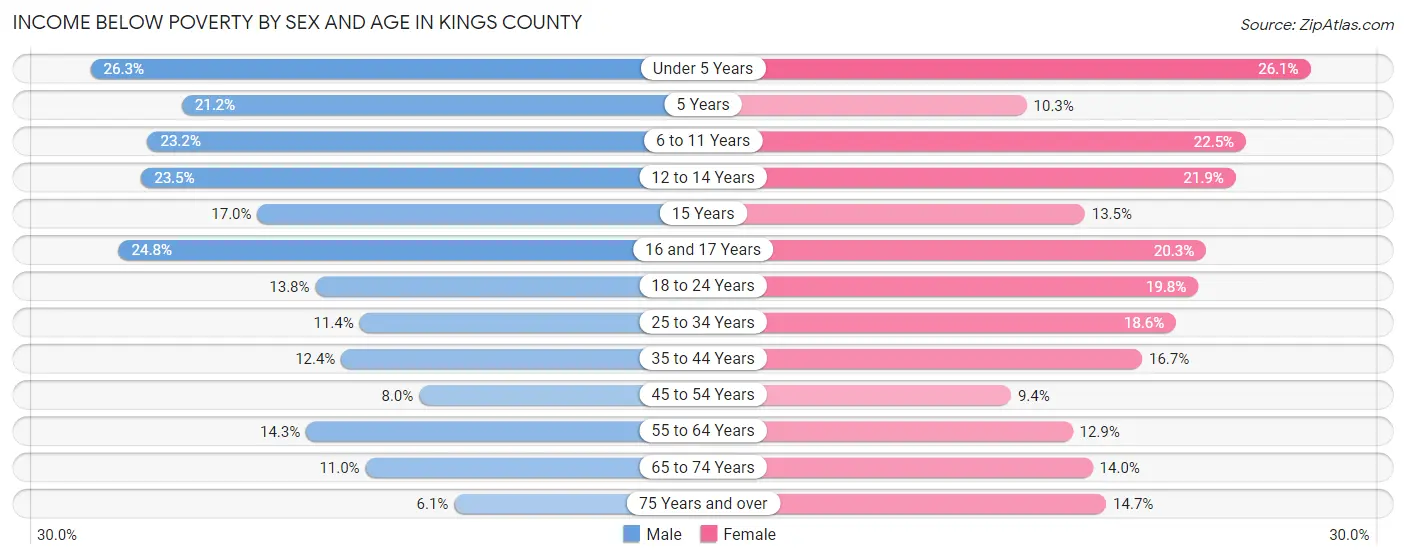
| Age Bracket | Male | Female |
| Under 5 Years | 1,456 (26.3%) | 1,446 (26.1%) |
| 5 Years | 236 (21.2%) | 100 (10.3%) |
| 6 to 11 Years | 1,646 (23.2%) | 1,531 (22.5%) |
| 12 to 14 Years | 813 (23.5%) | 802 (21.9%) |
| 15 Years | 188 (17.0%) | 146 (13.5%) |
| 16 and 17 Years | 557 (24.8%) | 421 (20.3%) |
| 18 to 24 Years | 1,053 (13.8%) | 1,377 (19.8%) |
| 25 to 34 Years | 1,312 (11.4%) | 1,893 (18.6%) |
| 35 to 44 Years | 1,322 (12.4%) | 1,439 (16.7%) |
| 45 to 54 Years | 636 (8.0%) | 648 (9.4%) |
| 55 to 64 Years | 909 (14.3%) | 857 (12.9%) |
| 65 to 74 Years | 489 (11.0%) | 663 (14.0%) |
| 75 Years and over | 166 (6.1%) | 528 (14.7%) |
| Total | 10,783 (15.0%) | 11,851 (17.5%) |
Income Above Poverty by Sex and Age in Kings County
According to the poverty statistics in Kings County, males aged 75 years and over and females aged 45 to 54 years are the age groups that are most secure financially, with 93.9% of males and 90.6% of females in these age groups living above the poverty line.
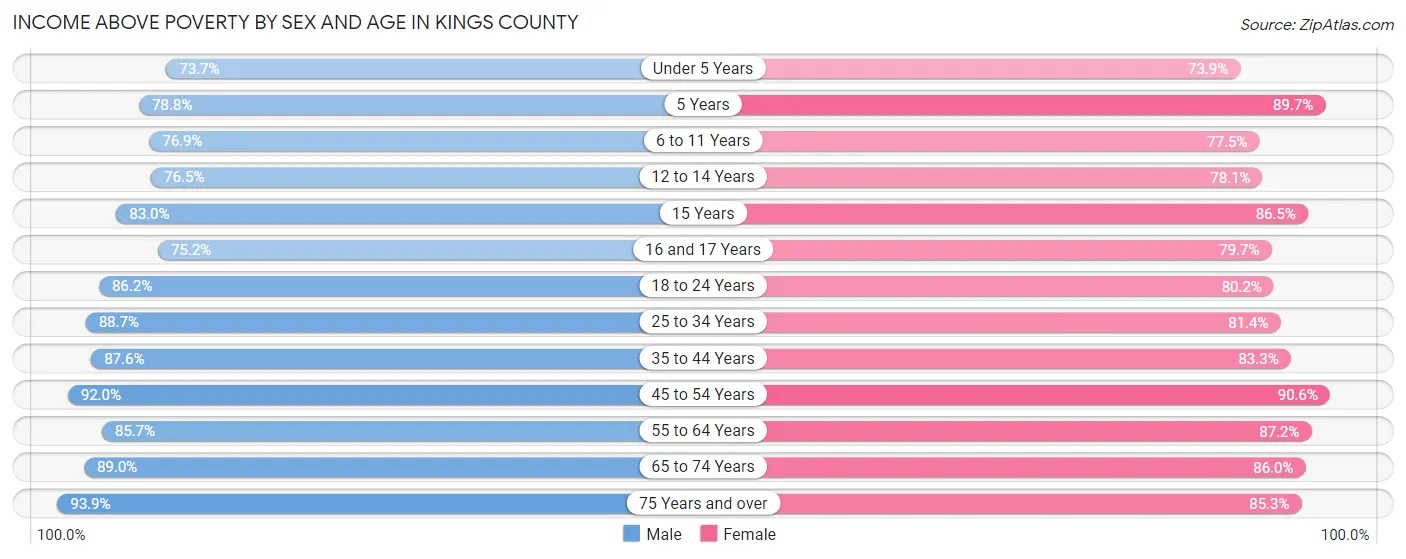
| Age Bracket | Male | Female |
| Under 5 Years | 4,076 (73.7%) | 4,097 (73.9%) |
| 5 Years | 875 (78.8%) | 872 (89.7%) |
| 6 to 11 Years | 5,465 (76.8%) | 5,274 (77.5%) |
| 12 to 14 Years | 2,647 (76.5%) | 2,855 (78.1%) |
| 15 Years | 915 (83.0%) | 933 (86.5%) |
| 16 and 17 Years | 1,693 (75.2%) | 1,655 (79.7%) |
| 18 to 24 Years | 6,573 (86.2%) | 5,562 (80.2%) |
| 25 to 34 Years | 10,252 (88.6%) | 8,277 (81.4%) |
| 35 to 44 Years | 9,369 (87.6%) | 7,166 (83.3%) |
| 45 to 54 Years | 7,287 (92.0%) | 6,229 (90.6%) |
| 55 to 64 Years | 5,433 (85.7%) | 5,810 (87.2%) |
| 65 to 74 Years | 3,948 (89.0%) | 4,082 (86.0%) |
| 75 Years and over | 2,564 (93.9%) | 3,060 (85.3%) |
| Total | 61,097 (85.0%) | 55,872 (82.5%) |
Income Below Poverty Among Married-Couple Families in Kings County
The poverty statistics for married-couple families in Kings County show that 7.4% or 1,657 of the total 22,400 families live below the poverty line. Families with 5 or more children have the highest poverty rate of 19.2%, comprising of 41 families. On the other hand, families with no children have the lowest poverty rate of 3.7%, which includes 384 families.
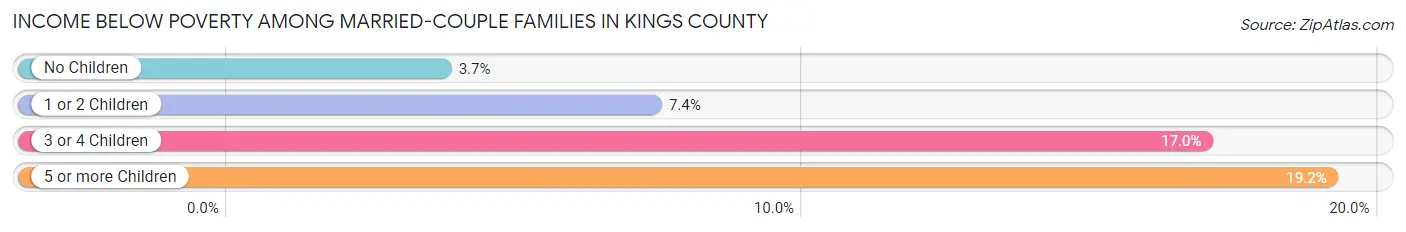
| Children | Above Poverty | Below Poverty |
| No Children | 9,945 (96.3%) | 384 (3.7%) |
| 1 or 2 Children | 7,539 (92.6%) | 601 (7.4%) |
| 3 or 4 Children | 3,086 (83.0%) | 631 (17.0%) |
| 5 or more Children | 173 (80.8%) | 41 (19.2%) |
| Total | 20,743 (92.6%) | 1,657 (7.4%) |
Income Below Poverty Among Single-Parent Households in Kings County
According to the poverty data in Kings County, 14.3% or 522 single-father households and 31.0% or 2,360 single-mother households are living below the poverty line. Among single-father households, those with 1 or 2 children have the highest poverty rate, with 365 households (22.9%) experiencing poverty. Likewise, among single-mother households, those with 5 or more children have the highest poverty rate, with 129 households (87.2%) falling below the poverty line.
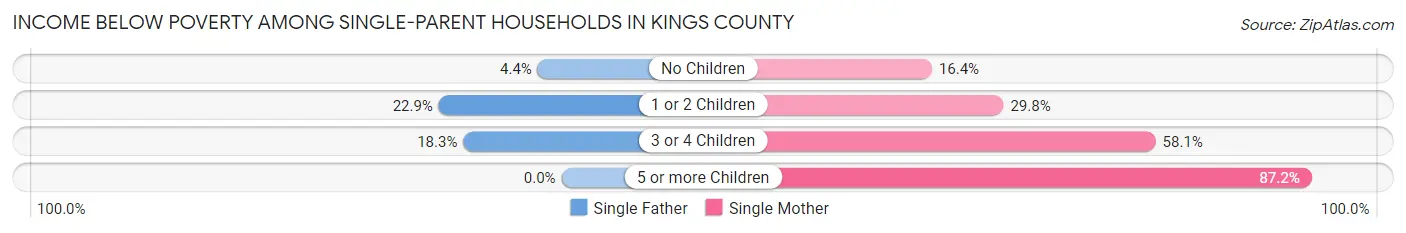
| Children | Single Father | Single Mother |
| No Children | 69 (4.4%) | 426 (16.4%) |
| 1 or 2 Children | 365 (22.9%) | 1,078 (29.8%) |
| 3 or 4 Children | 88 (18.3%) | 727 (58.1%) |
| 5 or more Children | 0 (0.0%) | 129 (87.2%) |
| Total | 522 (14.3%) | 2,360 (31.0%) |
Income Below Poverty Among Married-Couple vs Single-Parent Households in Kings County
The poverty data for Kings County shows that 1,657 of the married-couple family households (7.4%) and 2,882 of the single-parent households (25.6%) are living below the poverty level. Within the married-couple family households, those with 5 or more children have the highest poverty rate, with 41 households (19.2%) falling below the poverty line. Among the single-parent households, those with 5 or more children have the highest poverty rate, with 129 household (80.1%) living below poverty.
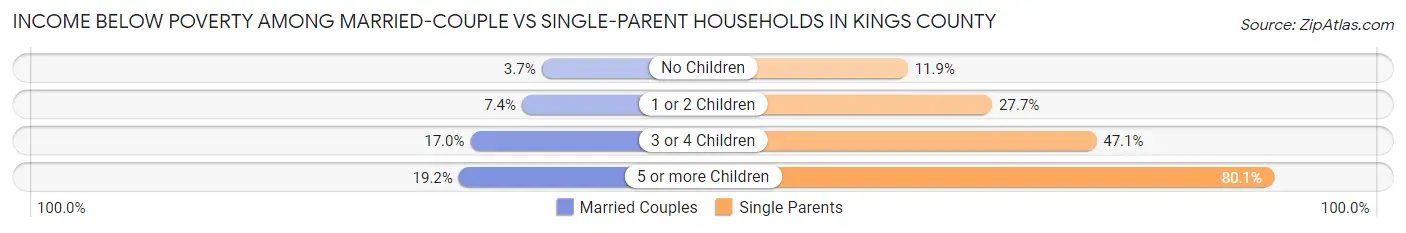
| Children | Married-Couple Families | Single-Parent Households |
| No Children | 384 (3.7%) | 495 (11.9%) |
| 1 or 2 Children | 601 (7.4%) | 1,443 (27.7%) |
| 3 or 4 Children | 631 (17.0%) | 815 (47.1%) |
| 5 or more Children | 41 (19.2%) | 129 (80.1%) |
| Total | 1,657 (7.4%) | 2,882 (25.6%) |
Race in Kings County
The most populous races in Kings County are Hispanic or Latino (85,622 | 56.1%), White / Caucasian (78,680 | 51.6%), and Some other Race (31,275 | 20.5%).
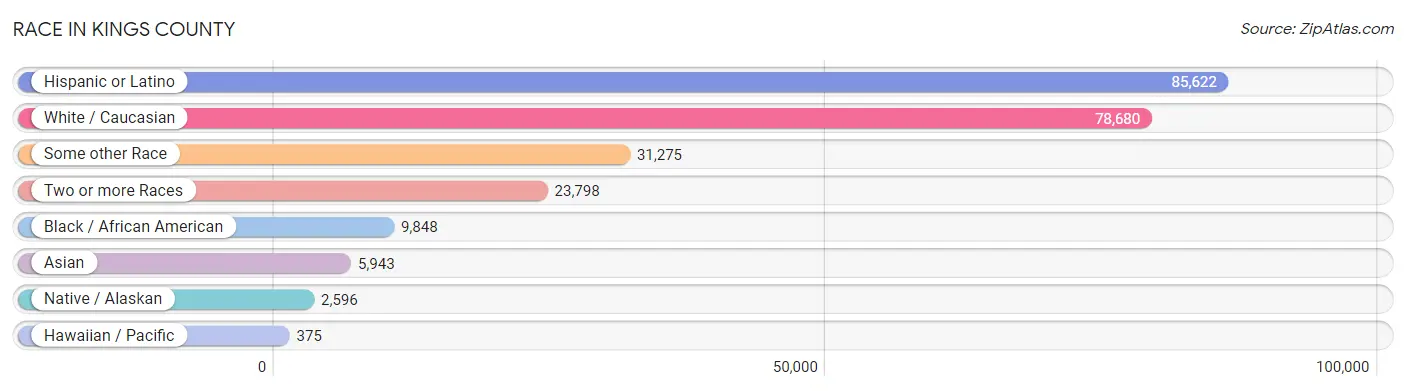
| Race | # Population | % Population |
| Asian | 5,943 | 3.9% |
| Black / African American | 9,848 | 6.5% |
| Hawaiian / Pacific | 375 | 0.3% |
| Hispanic or Latino | 85,622 | 56.1% |
| Native / Alaskan | 2,596 | 1.7% |
| White / Caucasian | 78,680 | 51.6% |
| Two or more Races | 23,798 | 15.6% |
| Some other Race | 31,275 | 20.5% |
| Total | 152,515 | 100.0% |
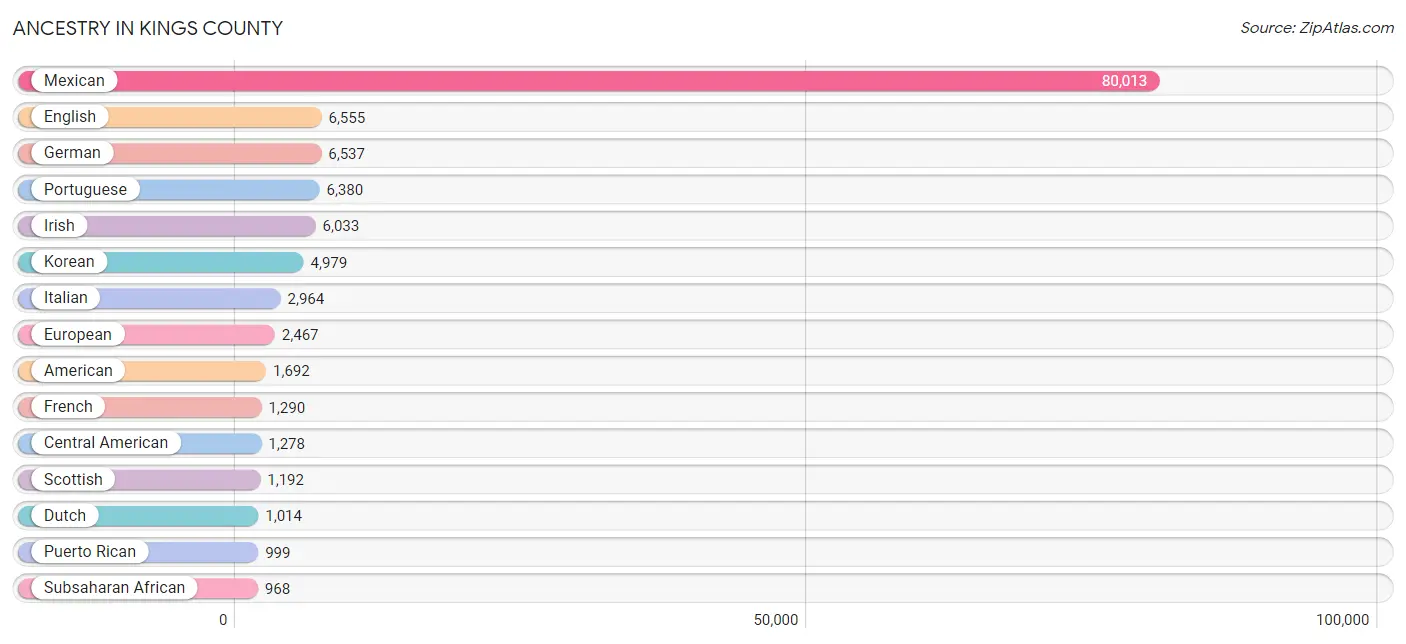
Ancestry in Kings County
The most populous ancestries reported in Kings County are Mexican (80,013 | 52.5%), English (6,555 | 4.3%), German (6,537 | 4.3%), Portuguese (6,380 | 4.2%), and Irish (6,033 | 4.0%), together accounting for 69.2% of all Kings County residents.
| Ancestry | # Population | % Population |
| African | 463 | 0.3% |
| American | 1,692 | 1.1% |
| Apache | 225 | 0.2% |
| Arab | 625 | 0.4% |
| Argentinean | 5 | 0.0% |
| Armenian | 206 | 0.1% |
| Assyrian / Chaldean / Syriac | 10 | 0.0% |
| Australian | 2 | 0.0% |
| Bangladeshi | 706 | 0.5% |
| Basque | 57 | 0.0% |
| Belizean | 17 | 0.0% |
| Bhutanese | 630 | 0.4% |
| Blackfeet | 151 | 0.1% |
| Brazilian | 33 | 0.0% |
| British | 157 | 0.1% |
| British West Indian | 26 | 0.0% |
| Burmese | 267 | 0.2% |
| Canadian | 120 | 0.1% |
| Celtic | 17 | 0.0% |
| Central American | 1,278 | 0.8% |
| Central American Indian | 243 | 0.2% |
| Cherokee | 491 | 0.3% |
| Cheyenne | 7 | 0.0% |
| Chickasaw | 4 | 0.0% |
| Chilean | 17 | 0.0% |
| Choctaw | 194 | 0.1% |
| Colombian | 87 | 0.1% |
| Comanche | 58 | 0.0% |
| Creek | 86 | 0.1% |
| Croatian | 47 | 0.0% |
| Cuban | 166 | 0.1% |
| Czech | 92 | 0.1% |
| Czechoslovakian | 60 | 0.0% |
| Danish | 393 | 0.3% |
| Delaware | 43 | 0.0% |
| Dominican | 129 | 0.1% |
| Dutch | 1,014 | 0.7% |
| Eastern European | 127 | 0.1% |
| Ecuadorian | 71 | 0.1% |
| Egyptian | 9 | 0.0% |
| English | 6,555 | 4.3% |
| European | 2,467 | 1.6% |
| Finnish | 50 | 0.0% |
| French | 1,290 | 0.9% |
| French American Indian | 40 | 0.0% |
| French Canadian | 112 | 0.1% |
| German | 6,537 | 4.3% |
| German Russian | 4 | 0.0% |
| Greek | 153 | 0.1% |
| Guamanian / Chamorro | 159 | 0.1% |
| Guatemalan | 248 | 0.2% |
| Haitian | 14 | 0.0% |
| Honduran | 444 | 0.3% |
| Hopi | 7 | 0.0% |
| Hungarian | 25 | 0.0% |
| Icelander | 9 | 0.0% |
| Indian (Asian) | 964 | 0.6% |
| Iranian | 14 | 0.0% |
| Iraqi | 48 | 0.0% |
| Irish | 6,033 | 4.0% |
| Iroquois | 23 | 0.0% |
| Italian | 2,964 | 1.9% |
| Jamaican | 82 | 0.1% |
| Japanese | 84 | 0.1% |
| Jordanian | 15 | 0.0% |
| Kenyan | 21 | 0.0% |
| Korean | 4,979 | 3.3% |
| Lebanese | 29 | 0.0% |
| Lithuanian | 22 | 0.0% |
| Malaysian | 116 | 0.1% |
| Mexican | 80,013 | 52.5% |
| Mexican American Indian | 602 | 0.4% |
| Moroccan | 4 | 0.0% |
| Native Hawaiian | 296 | 0.2% |
| Navajo | 109 | 0.1% |
| Nicaraguan | 25 | 0.0% |
| Nigerian | 292 | 0.2% |
| Northern European | 130 | 0.1% |
| Norwegian | 701 | 0.5% |
| Osage | 9 | 0.0% |
| Pakistani | 167 | 0.1% |
| Palestinian | 147 | 0.1% |
| Peruvian | 78 | 0.1% |
| Polish | 411 | 0.3% |
| Portuguese | 6,380 | 4.2% |
| Pueblo | 1 | 0.0% |
| Puerto Rican | 999 | 0.7% |
| Romanian | 129 | 0.1% |
| Russian | 227 | 0.2% |
| Salvadoran | 498 | 0.3% |
| Samoan | 168 | 0.1% |
| Scandinavian | 364 | 0.2% |
| Scotch-Irish | 237 | 0.2% |
| Scottish | 1,192 | 0.8% |
| Serbian | 3 | 0.0% |
| Sioux | 52 | 0.0% |
| Slovak | 12 | 0.0% |
| South African | 48 | 0.0% |
| South American | 258 | 0.2% |
| South American Indian | 5 | 0.0% |
| Spaniard | 926 | 0.6% |
| Spanish | 828 | 0.5% |
| Sri Lankan | 255 | 0.2% |
| Subsaharan African | 968 | 0.6% |
| Swedish | 854 | 0.6% |
| Swiss | 163 | 0.1% |
| Syrian | 68 | 0.0% |
| Thai | 160 | 0.1% |
| Tohono O'Odham | 160 | 0.1% |
| Tongan | 11 | 0.0% |
| Ukrainian | 26 | 0.0% |
| Ute | 15 | 0.0% |
| Welsh | 382 | 0.3% |
| West Indian | 21 | 0.0% |
| Yaqui | 42 | 0.0% |
| Yugoslavian | 39 | 0.0% |
| Zimbabwean | 28 | 0.0% | View All 117 Rows |
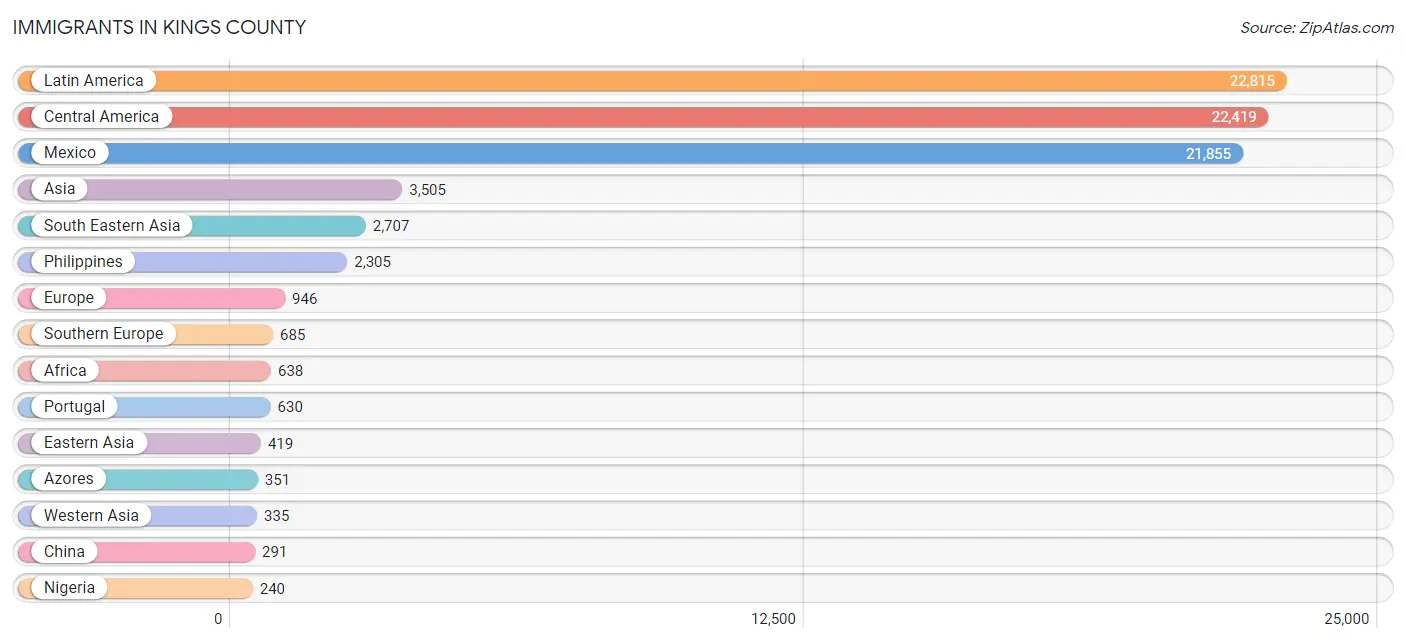
Immigrants in Kings County
The most numerous immigrant groups reported in Kings County came from Latin America (22,815 | 15.0%), Central America (22,419 | 14.7%), Mexico (21,855 | 14.3%), Asia (3,505 | 2.3%), and South Eastern Asia (2,707 | 1.8%), together accounting for 48.1% of all Kings County residents.
| Immigration Origin | # Population | % Population |
| Africa | 638 | 0.4% |
| Argentina | 41 | 0.0% |
| Armenia | 49 | 0.0% |
| Asia | 3,505 | 2.3% |
| Australia | 43 | 0.0% |
| Azores | 351 | 0.2% |
| Brazil | 15 | 0.0% |
| Cambodia | 22 | 0.0% |
| Cameroon | 47 | 0.0% |
| Canada | 157 | 0.1% |
| Caribbean | 210 | 0.1% |
| Central America | 22,419 | 14.7% |
| China | 291 | 0.2% |
| Colombia | 9 | 0.0% |
| Costa Rica | 33 | 0.0% |
| Cuba | 53 | 0.0% |
| Dominican Republic | 48 | 0.0% |
| Eastern Africa | 226 | 0.2% |
| Eastern Asia | 419 | 0.3% |
| Eastern Europe | 137 | 0.1% |
| Ecuador | 30 | 0.0% |
| Egypt | 4 | 0.0% |
| El Salvador | 196 | 0.1% |
| England | 30 | 0.0% |
| Ethiopia | 4 | 0.0% |
| Europe | 946 | 0.6% |
| Germany | 50 | 0.0% |
| Guatemala | 223 | 0.2% |
| Haiti | 62 | 0.0% |
| Honduras | 95 | 0.1% |
| Hong Kong | 15 | 0.0% |
| India | 22 | 0.0% |
| Iran | 14 | 0.0% |
| Iraq | 41 | 0.0% |
| Italy | 16 | 0.0% |
| Jamaica | 2 | 0.0% |
| Japan | 72 | 0.1% |
| Kenya | 202 | 0.1% |
| Korea | 56 | 0.0% |
| Laos | 41 | 0.0% |
| Latin America | 22,815 | 15.0% |
| Lebanon | 52 | 0.0% |
| Lithuania | 27 | 0.0% |
| Mexico | 21,855 | 14.3% |
| Middle Africa | 47 | 0.0% |
| Morocco | 14 | 0.0% |
| Nicaragua | 17 | 0.0% |
| Nigeria | 240 | 0.2% |
| Northern Africa | 18 | 0.0% |
| Northern Europe | 74 | 0.1% |
| Norway | 25 | 0.0% |
| Oceania | 90 | 0.1% |
| Pakistan | 8 | 0.0% |
| Peru | 91 | 0.1% |
| Philippines | 2,305 | 1.5% |
| Portugal | 630 | 0.4% |
| Romania | 94 | 0.1% |
| Russia | 16 | 0.0% |
| Singapore | 8 | 0.0% |
| South Africa | 107 | 0.1% |
| South America | 186 | 0.1% |
| South Central Asia | 44 | 0.0% |
| South Eastern Asia | 2,707 | 1.8% |
| Southern Europe | 685 | 0.4% |
| Spain | 39 | 0.0% |
| Sweden | 12 | 0.0% |
| Taiwan | 82 | 0.1% |
| Thailand | 135 | 0.1% |
| Trinidad and Tobago | 34 | 0.0% |
| Turkey | 7 | 0.0% |
| Vietnam | 164 | 0.1% |
| Western Africa | 240 | 0.2% |
| Western Asia | 335 | 0.2% |
| Western Europe | 50 | 0.0% |
| Yemen | 186 | 0.1% |
| Zimbabwe | 13 | 0.0% | View All 76 Rows |
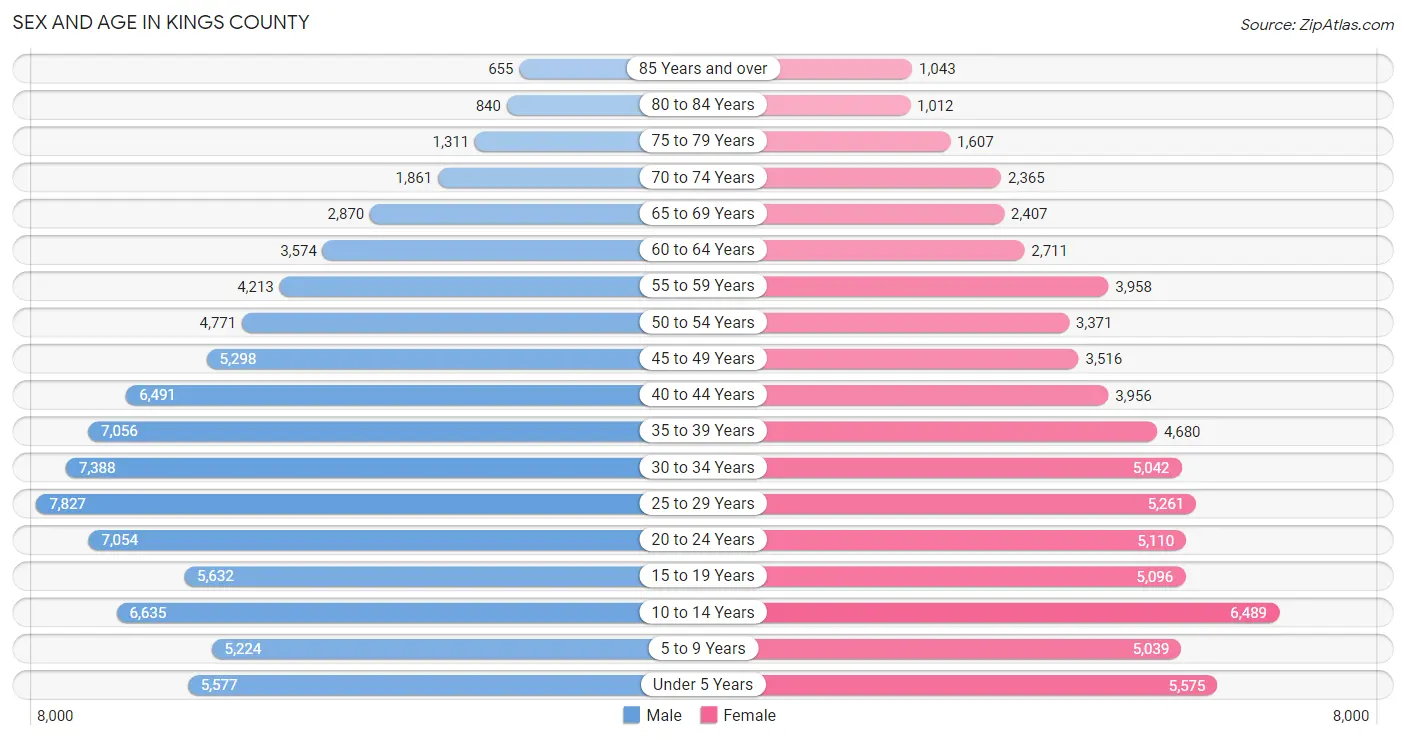
Sex and Age in Kings County
Sex and Age in Kings County
The most populous age groups in Kings County are 25 to 29 Years (7,827 | 9.3%) for men and 10 to 14 Years (6,489 | 9.5%) for women.
| Age Bracket | Male | Female |
| Under 5 Years | 5,577 (6.6%) | 5,575 (8.2%) |
| 5 to 9 Years | 5,224 (6.2%) | 5,039 (7.4%) |
| 10 to 14 Years | 6,635 (7.9%) | 6,489 (9.5%) |
| 15 to 19 Years | 5,632 (6.7%) | 5,096 (7.5%) |
| 20 to 24 Years | 7,054 (8.4%) | 5,110 (7.5%) |
| 25 to 29 Years | 7,827 (9.3%) | 5,261 (7.7%) |
| 30 to 34 Years | 7,388 (8.8%) | 5,042 (7.4%) |
| 35 to 39 Years | 7,056 (8.4%) | 4,680 (6.9%) |
| 40 to 44 Years | 6,491 (7.7%) | 3,956 (5.8%) |
| 45 to 49 Years | 5,298 (6.3%) | 3,516 (5.1%) |
| 50 to 54 Years | 4,771 (5.7%) | 3,371 (4.9%) |
| 55 to 59 Years | 4,213 (5.0%) | 3,958 (5.8%) |
| 60 to 64 Years | 3,574 (4.2%) | 2,711 (4.0%) |
| 65 to 69 Years | 2,870 (3.4%) | 2,407 (3.5%) |
| 70 to 74 Years | 1,861 (2.2%) | 2,365 (3.5%) |
| 75 to 79 Years | 1,311 (1.6%) | 1,607 (2.4%) |
| 80 to 84 Years | 840 (1.0%) | 1,012 (1.5%) |
| 85 Years and over | 655 (0.8%) | 1,043 (1.5%) |
| Total | 84,277 (100.0%) | 68,238 (100.0%) |
Families and Households in Kings County
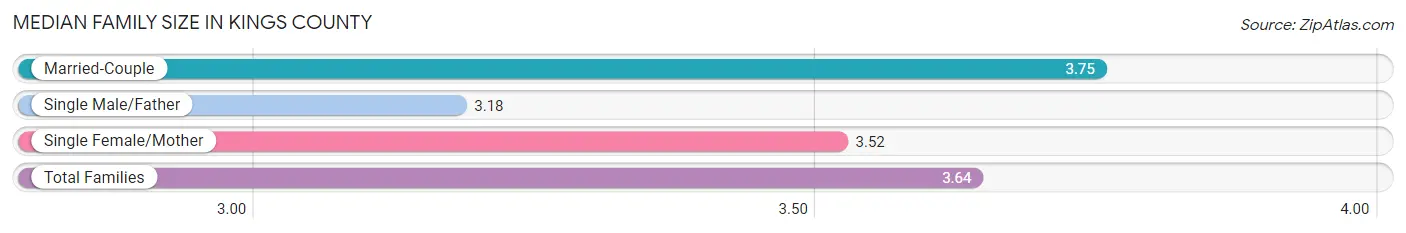
Median Family Size in Kings County
The median family size in Kings County is 3.64 persons per family, with married-couple families (22,400 | 66.5%) accounting for the largest median family size of 3.75 persons per family. On the other hand, single male/father families (3,649 | 10.8%) represent the smallest median family size with 3.18 persons per family.
| Family Type | # Families | Family Size |
| Married-Couple | 22,400 (66.5%) | 3.75 |
| Single Male/Father | 3,649 (10.8%) | 3.18 |
| Single Female/Mother | 7,611 (22.6%) | 3.52 |
| Total Families | 33,660 (100.0%) | 3.64 |
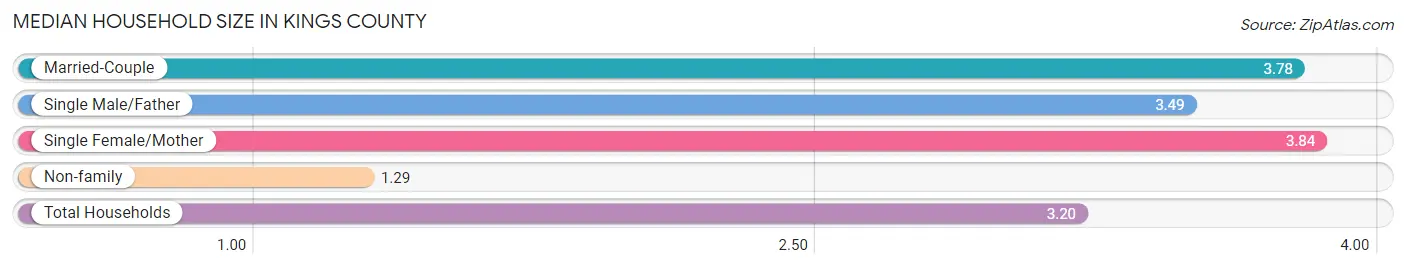
Median Household Size in Kings County
The median household size in Kings County is 3.20 persons per household, with single female/mother households (7,611 | 17.5%) accounting for the largest median household size of 3.84 persons per household. non-family households (9,934 | 22.8%) represent the smallest median household size with 1.29 persons per household.
| Household Type | # Households | Household Size |
| Married-Couple | 22,400 (51.4%) | 3.78 |
| Single Male/Father | 3,649 (8.4%) | 3.49 |
| Single Female/Mother | 7,611 (17.5%) | 3.84 |
| Non-family | 9,934 (22.8%) | 1.29 |
| Total Households | 43,594 (100.0%) | 3.20 |
Household Size by Marriage Status in Kings County
Out of a total of 43,594 households in Kings County, 33,660 (77.2%) are family households, while 9,934 (22.8%) are nonfamily households. The most numerous type of family households are 2-person households, comprising 10,831, and the most common type of nonfamily households are 1-person households, comprising 7,832.
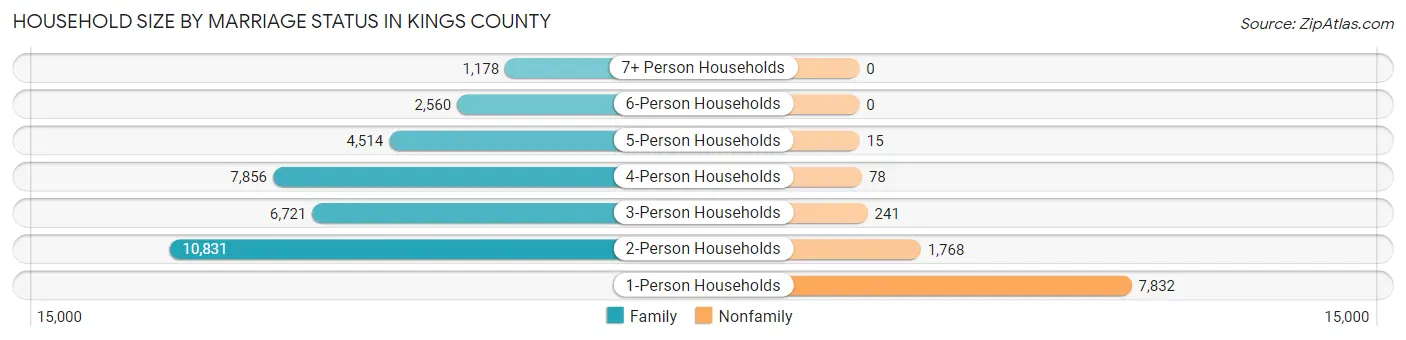
| Household Size | Family Households | Nonfamily Households |
| 1-Person Households | - | 7,832 (18.0%) |
| 2-Person Households | 10,831 (24.8%) | 1,768 (4.1%) |
| 3-Person Households | 6,721 (15.4%) | 241 (0.5%) |
| 4-Person Households | 7,856 (18.0%) | 78 (0.2%) |
| 5-Person Households | 4,514 (10.3%) | 15 (0.0%) |
| 6-Person Households | 2,560 (5.9%) | 0 (0.0%) |
| 7+ Person Households | 1,178 (2.7%) | 0 (0.0%) |
| Total | 33,660 (77.2%) | 9,934 (22.8%) |
Female Fertility in Kings County
Fertility by Age in Kings County
Average fertility rate in Kings County is 74.0 births per 1,000 women. Women in the age bracket of 20 to 34 years have the highest fertility rate with 123.0 births per 1,000 women. Women in the age bracket of 20 to 34 years acount for 76.5% of all women with births.
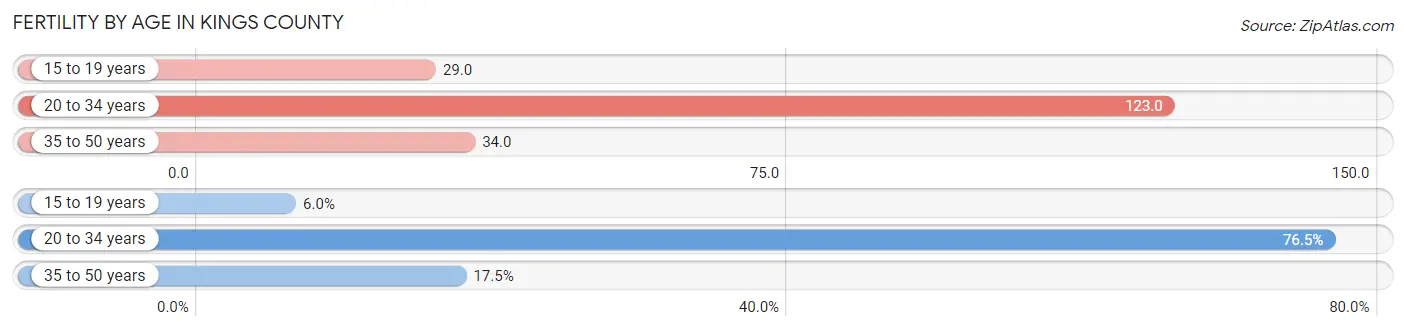
| Age Bracket | Women with Births | Births / 1,000 Women |
| 15 to 19 years | 148 (6.0%) | 29.0 |
| 20 to 34 years | 1,892 (76.5%) | 123.0 |
| 35 to 50 years | 434 (17.5%) | 34.0 |
| Total | 2,474 (100.0%) | 74.0 |
Fertility by Age by Marriage Status in Kings County
65.5% of women with births (2,474) in Kings County are married. The highest percentage of unmarried women with births falls into 15 to 19 years age bracket with 79.7% of them unmarried at the time of birth, while the lowest percentage of unmarried women with births belong to 35 to 50 years age bracket with 6.0% of them unmarried.
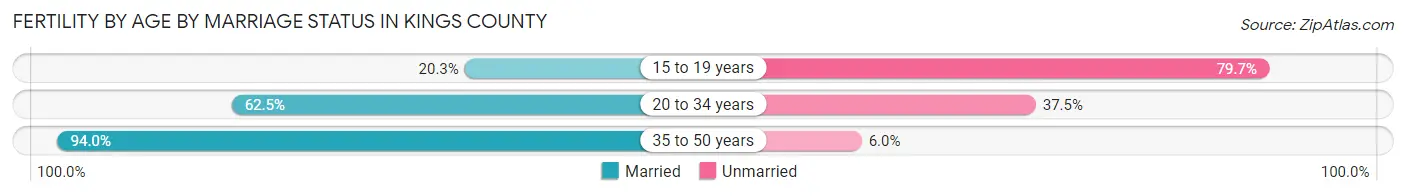
| Age Bracket | Married | Unmarried |
| 15 to 19 years | 30 (20.3%) | 118 (79.7%) |
| 20 to 34 years | 1,182 (62.5%) | 710 (37.5%) |
| 35 to 50 years | 408 (94.0%) | 26 (6.0%) |
| Total | 1,620 (65.5%) | 854 (34.5%) |
Fertility by Education in Kings County
Average fertility rate in Kings County is 74.0 births per 1,000 women. Women with the education attainment of bachelor's degree have the highest fertility rate of 107.0 births per 1,000 women, while women with the education attainment of graduate degree have the lowest fertility at 23.0 births per 1,000 women. Women with the education attainment of college or associate's degree represent 40.9% of all women with births.
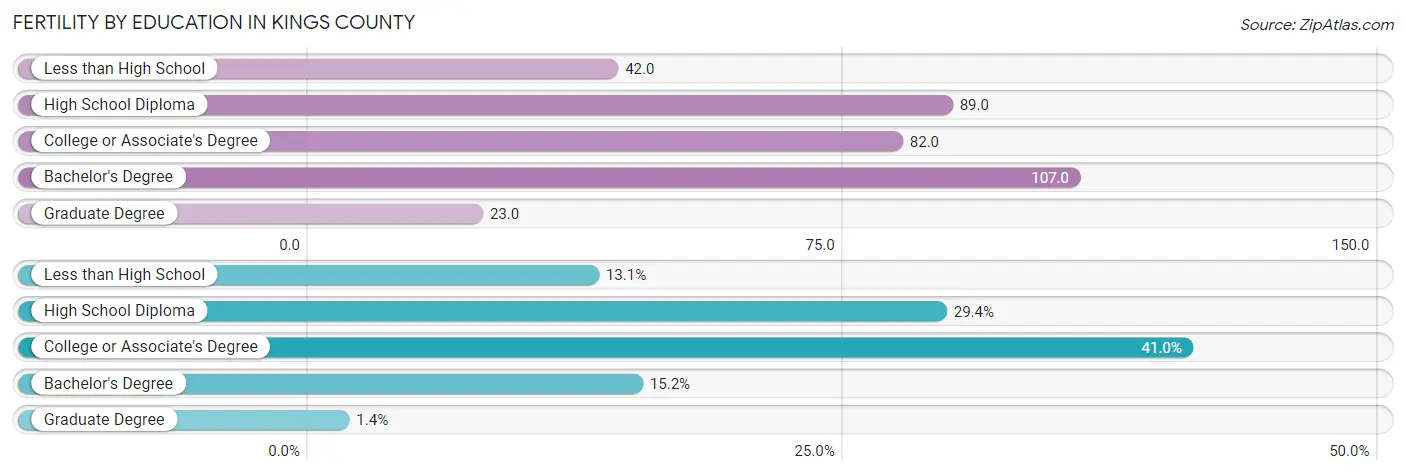
| Educational Attainment | Women with Births | Births / 1,000 Women |
| Less than High School | 324 (13.1%) | 42.0 |
| High School Diploma | 727 (29.4%) | 89.0 |
| College or Associate's Degree | 1,013 (40.9%) | 82.0 |
| Bachelor's Degree | 375 (15.2%) | 107.0 |
| Graduate Degree | 35 (1.4%) | 23.0 |
| Total | 2,474 (100.0%) | 74.0 |
Fertility by Education by Marriage Status in Kings County
34.5% of women with births in Kings County are unmarried. Women with the educational attainment of graduate degree are most likely to be married with 100.0% of them married at childbirth, while women with the educational attainment of less than high school are least likely to be married with 66.0% of them unmarried at childbirth.
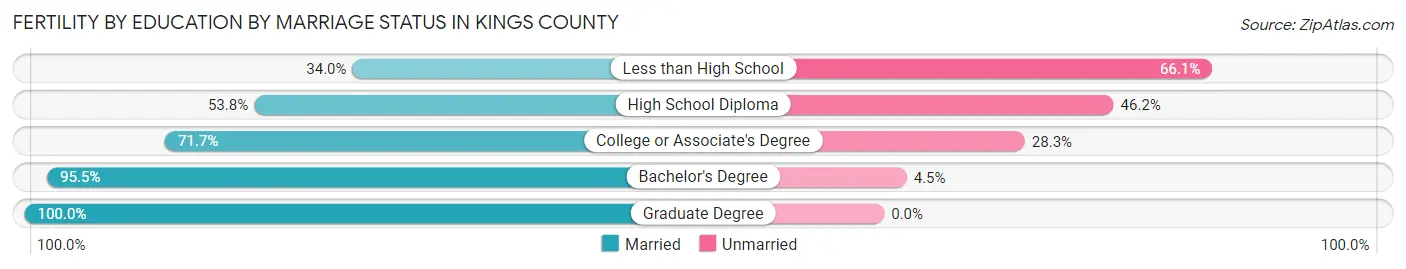
| Educational Attainment | Married | Unmarried |
| Less than High School | 110 (34.0%) | 214 (66.0%) |
| High School Diploma | 391 (53.8%) | 336 (46.2%) |
| College or Associate's Degree | 726 (71.7%) | 287 (28.3%) |
| Bachelor's Degree | 358 (95.5%) | 17 (4.5%) |
| Graduate Degree | 35 (100.0%) | 0 (0.0%) |
| Total | 1,620 (65.5%) | 854 (34.5%) |
Employment Characteristics in Kings County
Employment by Class of Employer in Kings County
Among the 56,893 employed individuals in Kings County, private company employees (31,726 | 55.8%), federal government employees (8,327 | 14.6%), and local government employees (5,521 | 9.7%) make up the most common classes of employment.
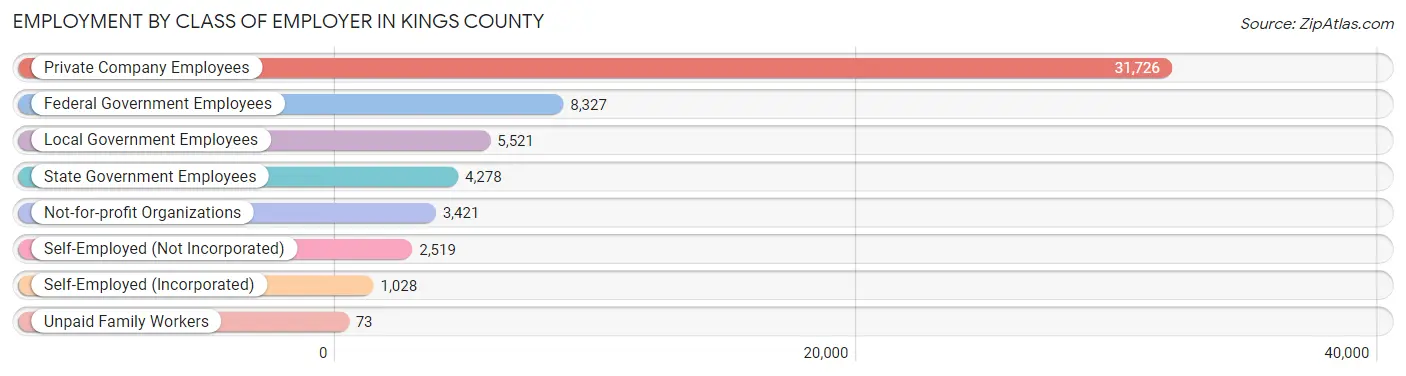
| Employer Class | # Employees | % Employees |
| Private Company Employees | 31,726 | 55.8% |
| Self-Employed (Incorporated) | 1,028 | 1.8% |
| Self-Employed (Not Incorporated) | 2,519 | 4.4% |
| Not-for-profit Organizations | 3,421 | 6.0% |
| Local Government Employees | 5,521 | 9.7% |
| State Government Employees | 4,278 | 7.5% |
| Federal Government Employees | 8,327 | 14.6% |
| Unpaid Family Workers | 73 | 0.1% |
| Total | 56,893 | 100.0% |
Employment Status by Age in Kings County
According to the labor force statistics for Kings County, out of the total population over 16 years of age (115,794), 55.1% or 63,802 individuals are in the labor force, with 9.2% or 5,870 of them unemployed. The age group with the highest labor force participation rate is 35 to 44 years, with 70.4% or 15,617 individuals in the labor force. Within the labor force, the 16 to 19 years age range has the highest percentage of unemployed individuals, with 21.2% or 480 of them being unemployed.
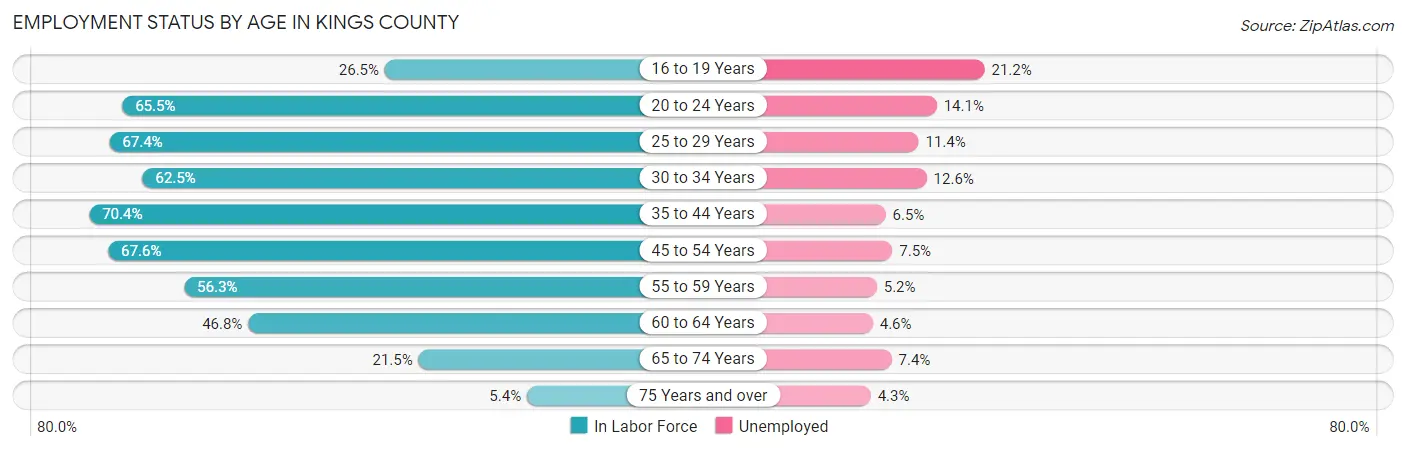
| Age Bracket | In Labor Force | Unemployed |
| 16 to 19 Years | 2,265 (26.5%) | 480 (21.2%) |
| 20 to 24 Years | 7,967 (65.5%) | 1,123 (14.1%) |
| 25 to 29 Years | 8,821 (67.4%) | 1,006 (11.4%) |
| 30 to 34 Years | 7,769 (62.5%) | 979 (12.6%) |
| 35 to 44 Years | 15,617 (70.4%) | 1,015 (6.5%) |
| 45 to 54 Years | 11,462 (67.6%) | 860 (7.5%) |
| 55 to 59 Years | 4,600 (56.3%) | 239 (5.2%) |
| 60 to 64 Years | 2,941 (46.8%) | 135 (4.6%) |
| 65 to 74 Years | 2,043 (21.5%) | 151 (7.4%) |
| 75 Years and over | 349 (5.4%) | 15 (4.3%) |
| Total | 63,802 (55.1%) | 5,870 (9.2%) |
Employment Status by Educational Attainment in Kings County
According to labor force statistics for Kings County, 64.7% of individuals (51,186) out of the total population between 25 and 64 years of age (79,113) are in the labor force, with 8.2% or 4,197 of them being unemployed. The group with the highest labor force participation rate are those with the educational attainment of bachelor's degree or higher, with 86.1% or 9,885 individuals in the labor force. Within the labor force, individuals with less than high school education have the highest percentage of unemployment, with 12.4% or 1,254 of them being unemployed.
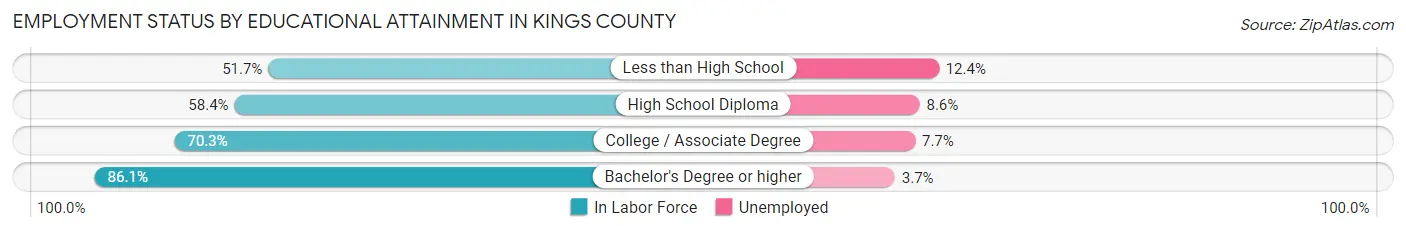
| Educational Attainment | In Labor Force | Unemployed |
| Less than High School | 10,109 (51.7%) | 2,425 (12.4%) |
| High School Diploma | 12,764 (58.4%) | 1,880 (8.6%) |
| College / Associate Degree | 18,434 (70.3%) | 2,019 (7.7%) |
| Bachelor's Degree or higher | 9,885 (86.1%) | 425 (3.7%) |
| Total | 51,186 (64.7%) | 6,487 (8.2%) |
Employment Occupations by Sex in Kings County
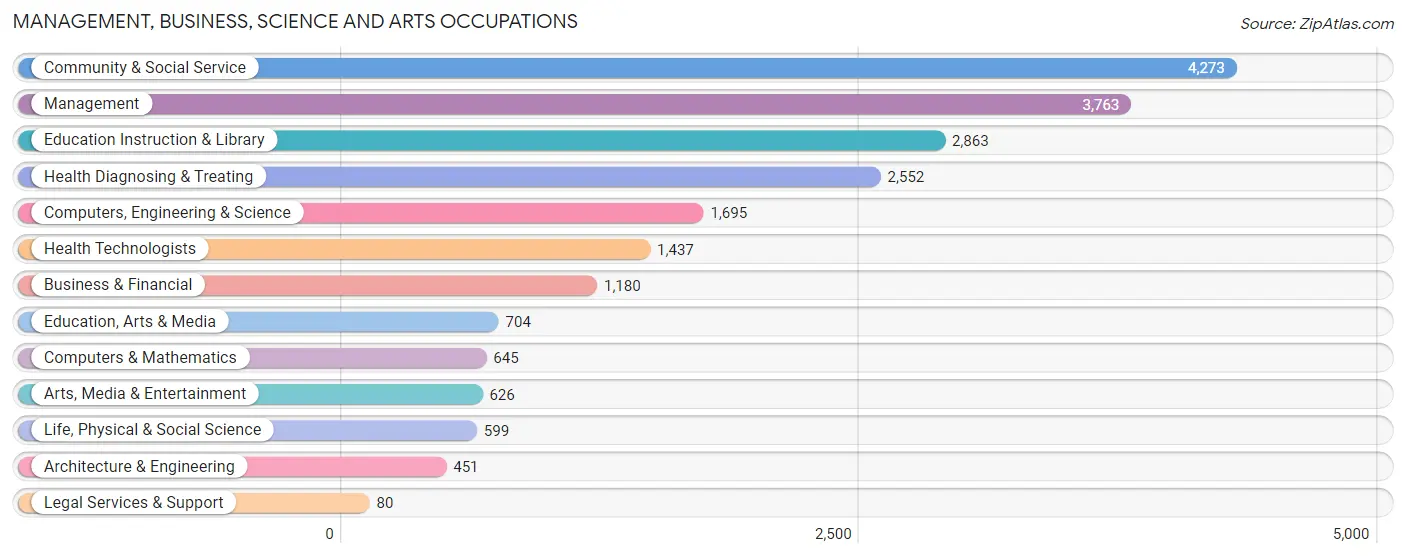
Management, Business, Science and Arts Occupations
The most common Management, Business, Science and Arts occupations in Kings County are Community & Social Service (4,273 | 8.1%), Management (3,763 | 7.1%), Education Instruction & Library (2,863 | 5.4%), Health Diagnosing & Treating (2,552 | 4.8%), and Computers, Engineering & Science (1,695 | 3.2%).
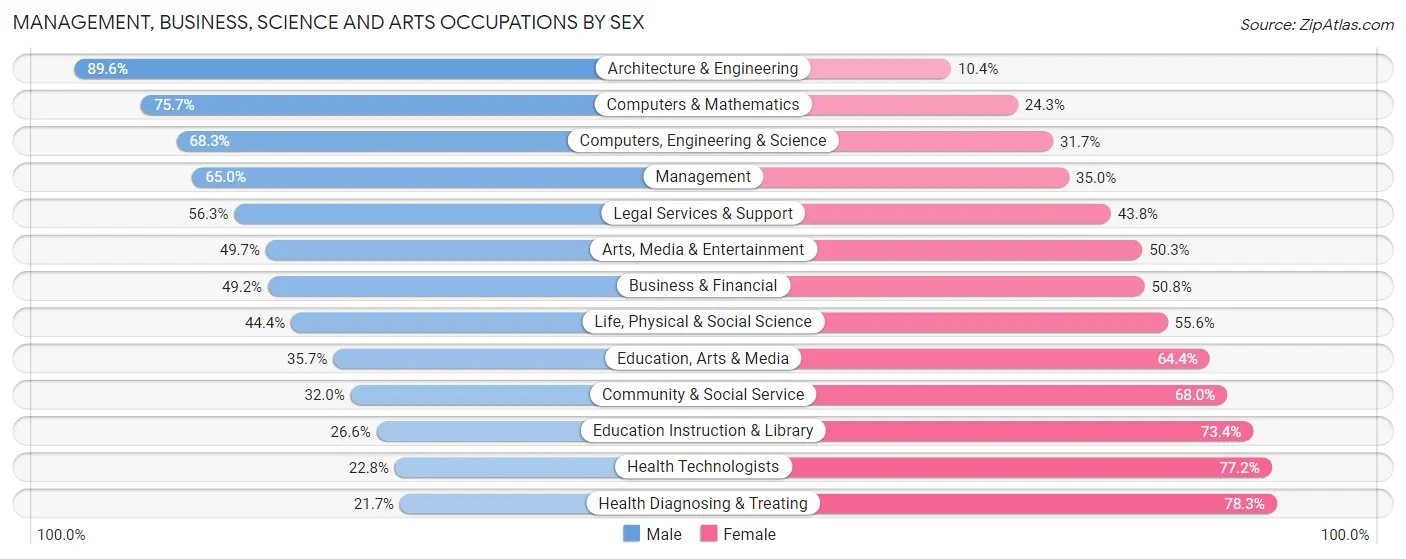
Management, Business, Science and Arts Occupations by Sex
Within the Management, Business, Science and Arts occupations in Kings County, the most male-oriented occupations are Architecture & Engineering (89.6%), Computers & Mathematics (75.7%), and Computers, Engineering & Science (68.3%), while the most female-oriented occupations are Health Diagnosing & Treating (78.3%), Health Technologists (77.2%), and Education Instruction & Library (73.4%).
| Occupation | Male | Female |
| Management | 2,445 (65.0%) | 1,318 (35.0%) |
| Business & Financial | 581 (49.2%) | 599 (50.8%) |
| Computers, Engineering & Science | 1,158 (68.3%) | 537 (31.7%) |
| Computers & Mathematics | 488 (75.7%) | 157 (24.3%) |
| Architecture & Engineering | 404 (89.6%) | 47 (10.4%) |
| Life, Physical & Social Science | 266 (44.4%) | 333 (55.6%) |
| Community & Social Service | 1,368 (32.0%) | 2,905 (68.0%) |
| Education, Arts & Media | 251 (35.6%) | 453 (64.3%) |
| Legal Services & Support | 45 (56.2%) | 35 (43.8%) |
| Education Instruction & Library | 761 (26.6%) | 2,102 (73.4%) |
| Arts, Media & Entertainment | 311 (49.7%) | 315 (50.3%) |
| Health Diagnosing & Treating | 554 (21.7%) | 1,998 (78.3%) |
| Health Technologists | 327 (22.8%) | 1,110 (77.2%) |
| Total (Category) | 6,106 (45.4%) | 7,357 (54.6%) |
| Total (Overall) | 30,961 (58.5%) | 21,954 (41.5%) |
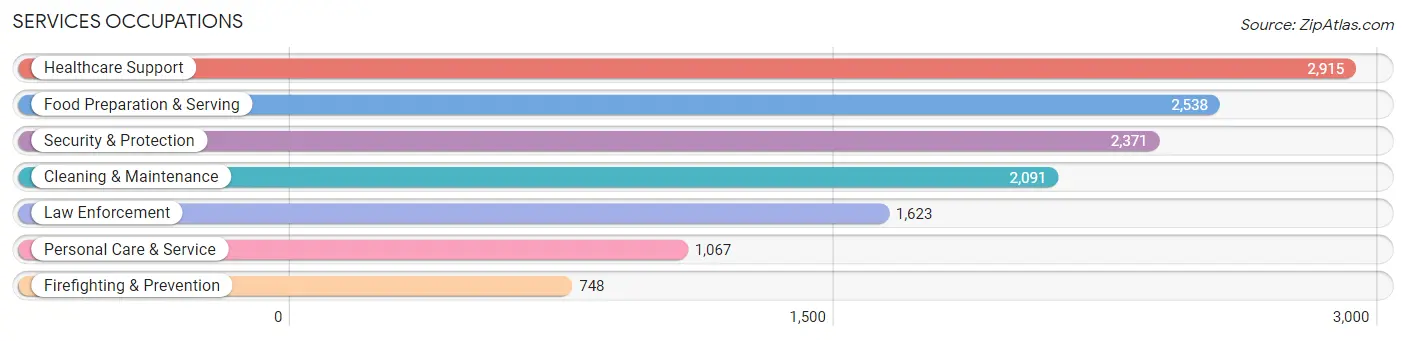
Services Occupations
The most common Services occupations in Kings County are Healthcare Support (2,915 | 5.5%), Food Preparation & Serving (2,538 | 4.8%), Security & Protection (2,371 | 4.5%), Cleaning & Maintenance (2,091 | 4.0%), and Law Enforcement (1,623 | 3.1%).
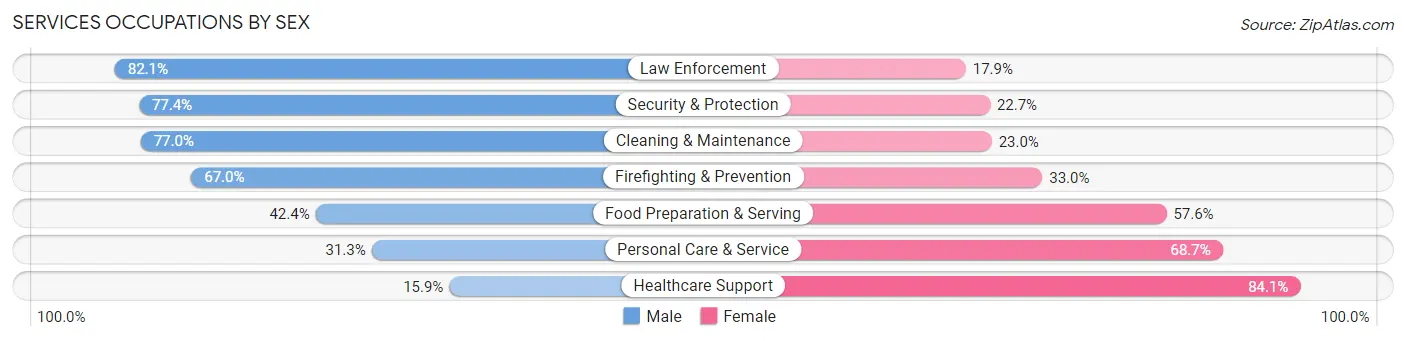
Services Occupations by Sex
Within the Services occupations in Kings County, the most male-oriented occupations are Law Enforcement (82.1%), Security & Protection (77.3%), and Cleaning & Maintenance (77.0%), while the most female-oriented occupations are Healthcare Support (84.1%), Personal Care & Service (68.7%), and Food Preparation & Serving (57.6%).
| Occupation | Male | Female |
| Healthcare Support | 464 (15.9%) | 2,451 (84.1%) |
| Security & Protection | 1,834 (77.3%) | 537 (22.7%) |
| Firefighting & Prevention | 501 (67.0%) | 247 (33.0%) |
| Law Enforcement | 1,333 (82.1%) | 290 (17.9%) |
| Food Preparation & Serving | 1,076 (42.4%) | 1,462 (57.6%) |
| Cleaning & Maintenance | 1,610 (77.0%) | 481 (23.0%) |
| Personal Care & Service | 334 (31.3%) | 733 (68.7%) |
| Total (Category) | 5,318 (48.4%) | 5,664 (51.6%) |
| Total (Overall) | 30,961 (58.5%) | 21,954 (41.5%) |
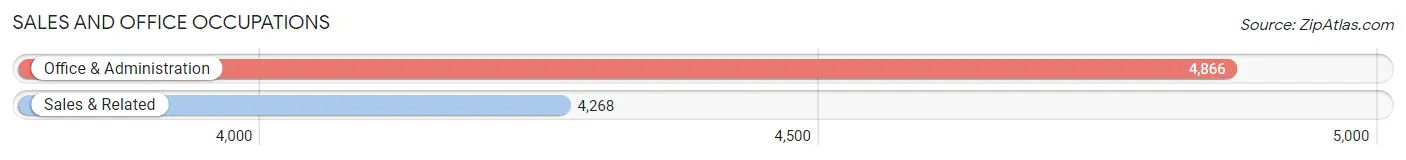
Sales and Office Occupations
The most common Sales and Office occupations in Kings County are Office & Administration (4,866 | 9.2%), and Sales & Related (4,268 | 8.1%).
Sales and Office Occupations by Sex
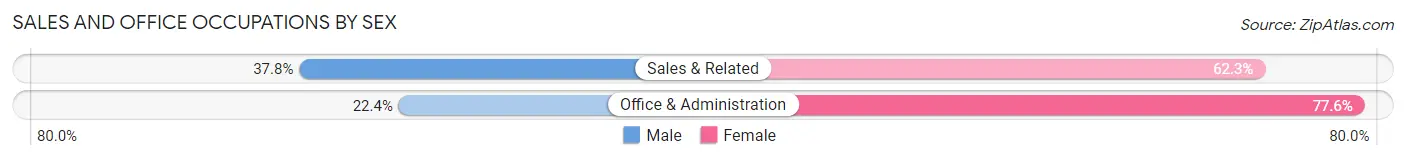
| Occupation | Male | Female |
| Sales & Related | 1,611 (37.8%) | 2,657 (62.3%) |
| Office & Administration | 1,092 (22.4%) | 3,774 (77.6%) |
| Total (Category) | 2,703 (29.6%) | 6,431 (70.4%) |
| Total (Overall) | 30,961 (58.5%) | 21,954 (41.5%) |
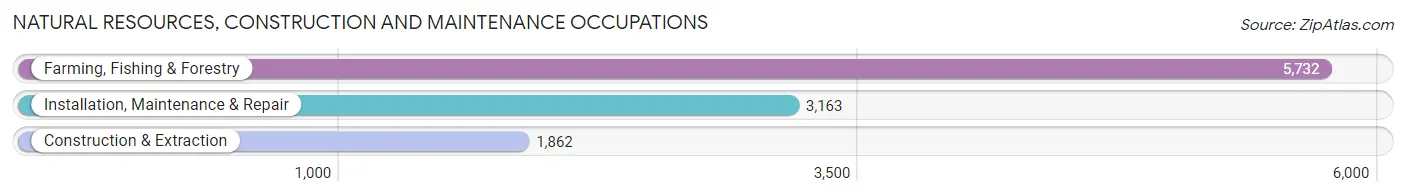
Natural Resources, Construction and Maintenance Occupations
The most common Natural Resources, Construction and Maintenance occupations in Kings County are Farming, Fishing & Forestry (5,732 | 10.8%), Installation, Maintenance & Repair (3,163 | 6.0%), and Construction & Extraction (1,862 | 3.5%).
Natural Resources, Construction and Maintenance Occupations by Sex
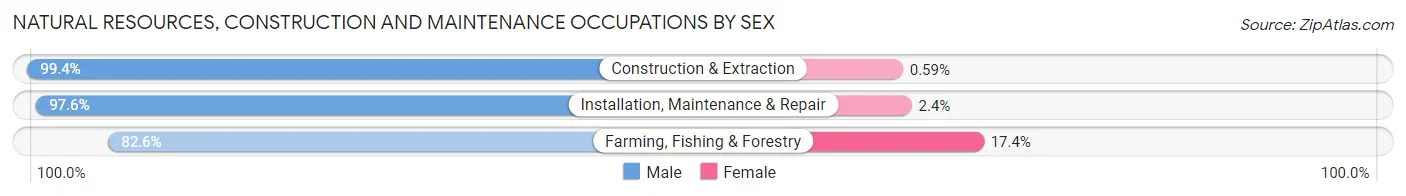
| Occupation | Male | Female |
| Farming, Fishing & Forestry | 4,733 (82.6%) | 999 (17.4%) |
| Construction & Extraction | 1,851 (99.4%) | 11 (0.6%) |
| Installation, Maintenance & Repair | 3,086 (97.6%) | 77 (2.4%) |
| Total (Category) | 9,670 (89.9%) | 1,087 (10.1%) |
| Total (Overall) | 30,961 (58.5%) | 21,954 (41.5%) |
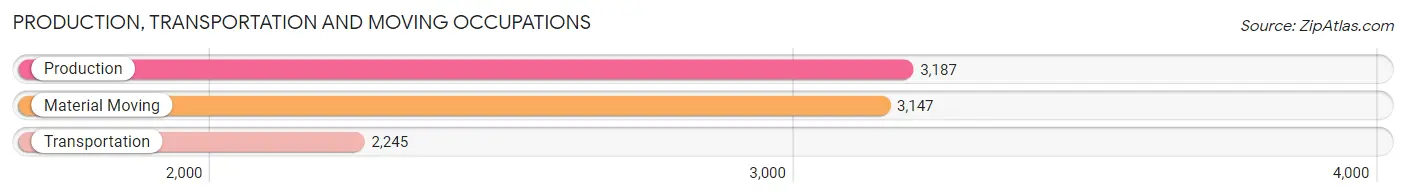
Production, Transportation and Moving Occupations
The most common Production, Transportation and Moving occupations in Kings County are Production (3,187 | 6.0%), Material Moving (3,147 | 5.9%), and Transportation (2,245 | 4.2%).
Production, Transportation and Moving Occupations by Sex
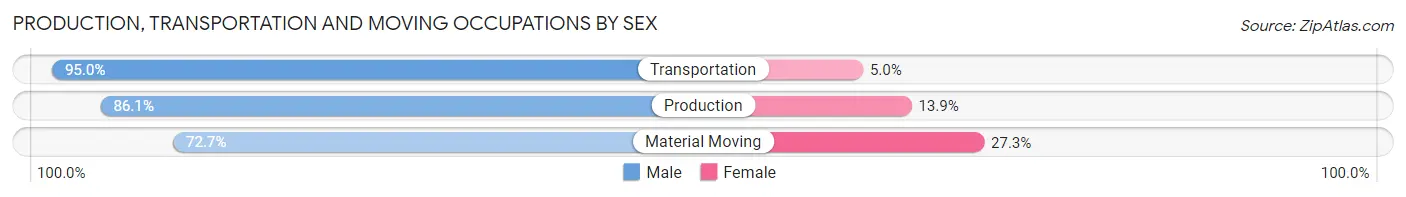
| Occupation | Male | Female |
| Production | 2,743 (86.1%) | 444 (13.9%) |
| Transportation | 2,132 (95.0%) | 113 (5.0%) |
| Material Moving | 2,289 (72.7%) | 858 (27.3%) |
| Total (Category) | 7,164 (83.5%) | 1,415 (16.5%) |
| Total (Overall) | 30,961 (58.5%) | 21,954 (41.5%) |
Employment Industries by Sex in Kings County
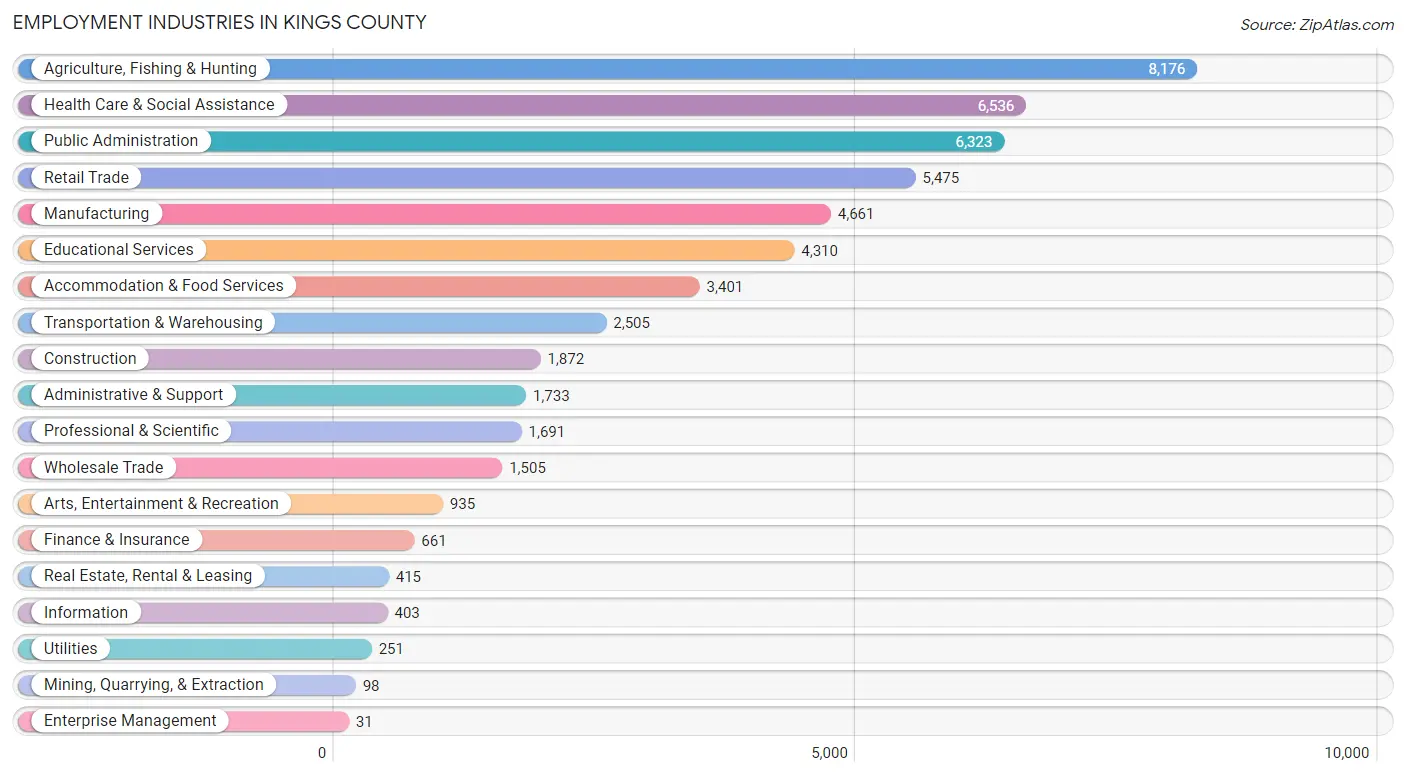
Employment Industries in Kings County
The major employment industries in Kings County include Agriculture, Fishing & Hunting (8,176 | 15.4%), Health Care & Social Assistance (6,536 | 12.3%), Public Administration (6,323 | 11.9%), Retail Trade (5,475 | 10.3%), and Manufacturing (4,661 | 8.8%).
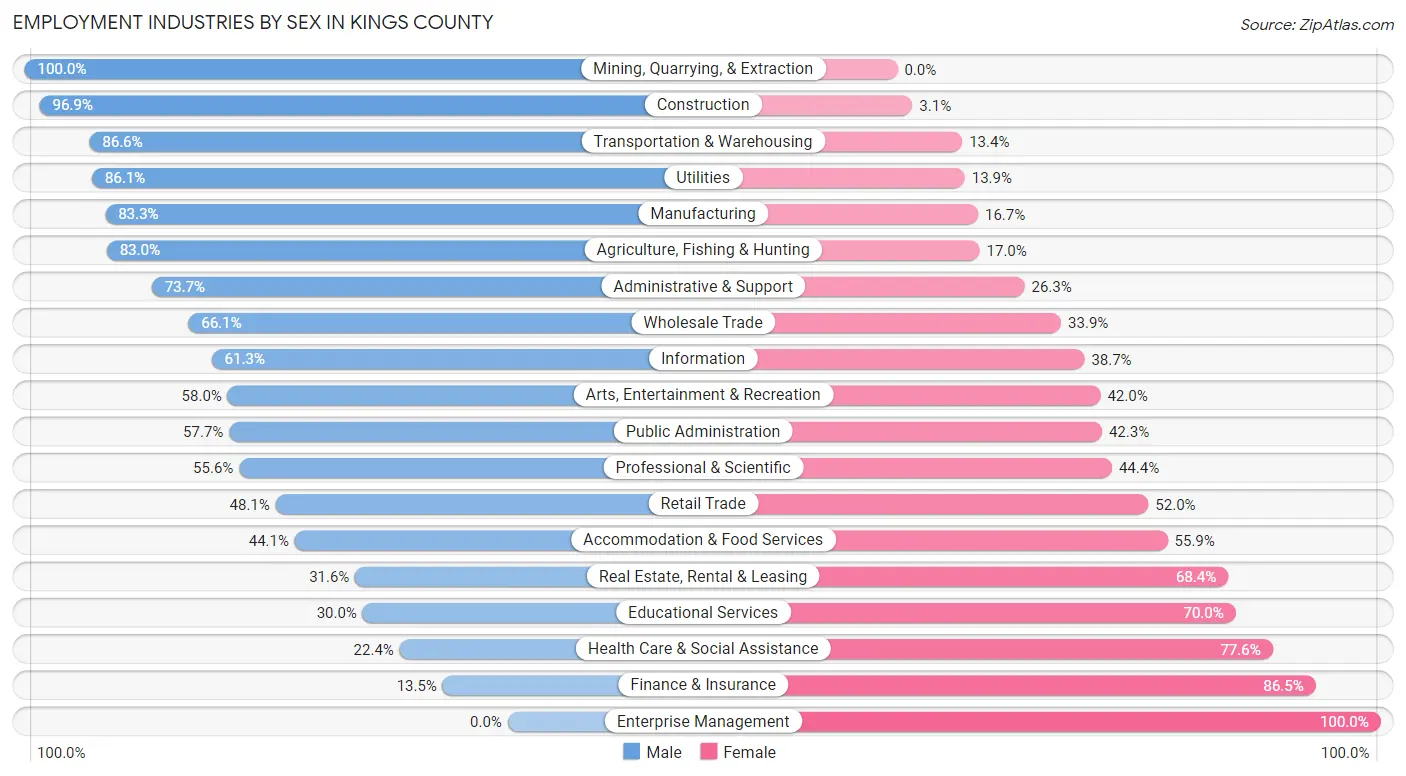
Employment Industries by Sex in Kings County
The Kings County industries that see more men than women are Mining, Quarrying, & Extraction (100.0%), Construction (96.9%), and Transportation & Warehousing (86.6%), whereas the industries that tend to have a higher number of women are Enterprise Management (100.0%), Finance & Insurance (86.5%), and Health Care & Social Assistance (77.6%).
| Industry | Male | Female |
| Agriculture, Fishing & Hunting | 6,785 (83.0%) | 1,391 (17.0%) |
| Mining, Quarrying, & Extraction | 98 (100.0%) | 0 (0.0%) |
| Construction | 1,814 (96.9%) | 58 (3.1%) |
| Manufacturing | 3,883 (83.3%) | 778 (16.7%) |
| Wholesale Trade | 995 (66.1%) | 510 (33.9%) |
| Retail Trade | 2,631 (48.0%) | 2,844 (51.9%) |
| Transportation & Warehousing | 2,169 (86.6%) | 336 (13.4%) |
| Utilities | 216 (86.1%) | 35 (13.9%) |
| Information | 247 (61.3%) | 156 (38.7%) |
| Finance & Insurance | 89 (13.5%) | 572 (86.5%) |
| Real Estate, Rental & Leasing | 131 (31.6%) | 284 (68.4%) |
| Professional & Scientific | 940 (55.6%) | 751 (44.4%) |
| Enterprise Management | 0 (0.0%) | 31 (100.0%) |
| Administrative & Support | 1,277 (73.7%) | 456 (26.3%) |
| Educational Services | 1,294 (30.0%) | 3,016 (70.0%) |
| Health Care & Social Assistance | 1,462 (22.4%) | 5,074 (77.6%) |
| Arts, Entertainment & Recreation | 542 (58.0%) | 393 (42.0%) |
| Accommodation & Food Services | 1,499 (44.1%) | 1,902 (55.9%) |
| Public Administration | 3,646 (57.7%) | 2,677 (42.3%) |
| Total | 30,961 (58.5%) | 21,954 (41.5%) |
Education in Kings County
School Enrollment in Kings County
The most common levels of schooling among the 43,331 students in Kings County are high school (10,816 | 25.0%), middle school (9,915 | 22.9%), and college / undergraduate (9,091 | 21.0%).
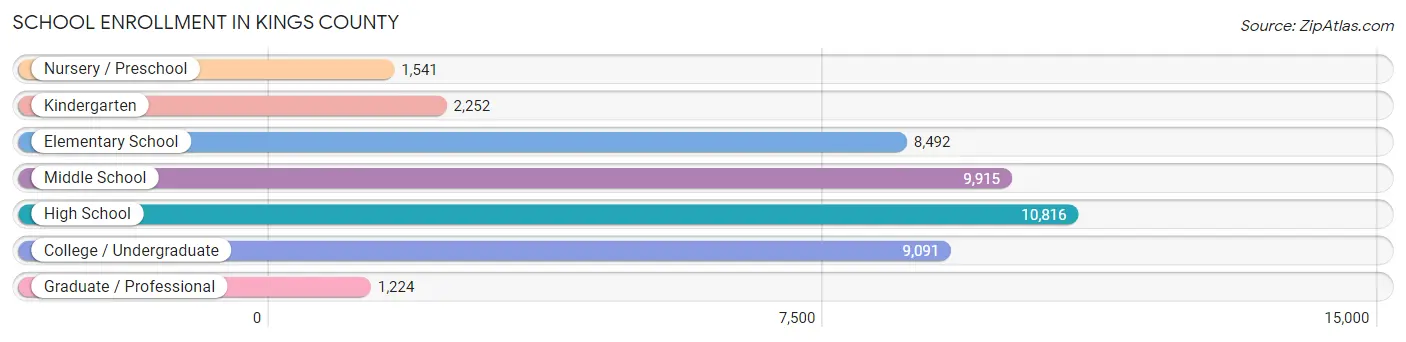
| School Level | # Students | % Students |
| Nursery / Preschool | 1,541 | 3.6% |
| Kindergarten | 2,252 | 5.2% |
| Elementary School | 8,492 | 19.6% |
| Middle School | 9,915 | 22.9% |
| High School | 10,816 | 25.0% |
| College / Undergraduate | 9,091 | 21.0% |
| Graduate / Professional | 1,224 | 2.8% |
| Total | 43,331 | 100.0% |
School Enrollment by Age by Funding Source in Kings County
Out of a total of 43,331 students who are enrolled in schools in Kings County, 5,546 (12.8%) attend a private institution, while the remaining 37,785 (87.2%) are enrolled in public schools. The age group of 35 years and over has the highest likelihood of being enrolled in private schools, with 2,004 (51.8% in the age bracket) enrolled. Conversely, the age group of 5 to 9 year old has the lowest likelihood of being enrolled in a private school, with 9,416 (97.4% in the age bracket) attending a public institution.
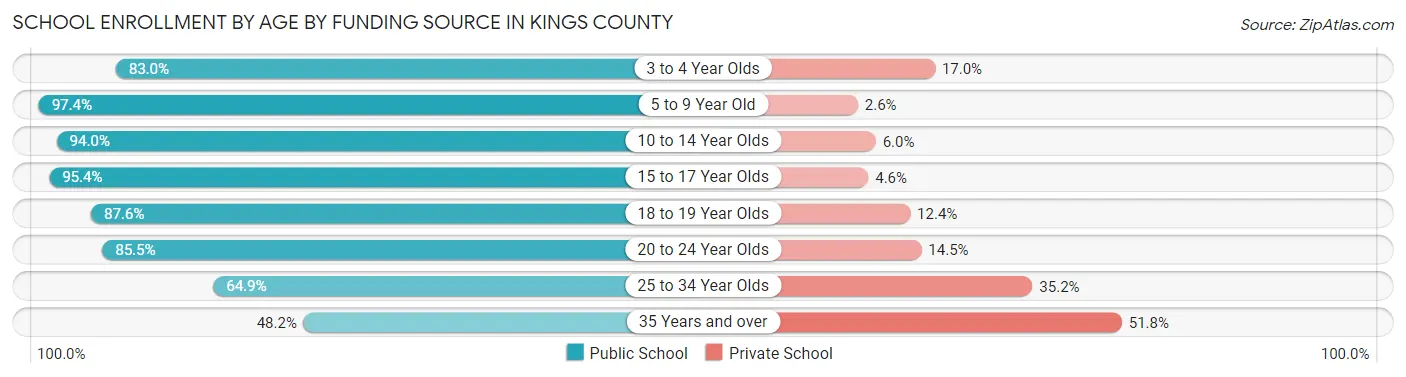
| Age Bracket | Public School | Private School |
| 3 to 4 Year Olds | 1,011 (83.0%) | 207 (17.0%) |
| 5 to 9 Year Old | 9,416 (97.4%) | 255 (2.6%) |
| 10 to 14 Year Olds | 12,181 (94.0%) | 774 (6.0%) |
| 15 to 17 Year Olds | 6,028 (95.4%) | 290 (4.6%) |
| 18 to 19 Year Olds | 2,172 (87.6%) | 307 (12.4%) |
| 20 to 24 Year Olds | 2,888 (85.5%) | 489 (14.5%) |
| 25 to 34 Year Olds | 2,234 (64.8%) | 1,211 (35.1%) |
| 35 Years and over | 1,864 (48.2%) | 2,004 (51.8%) |
| Total | 37,785 (87.2%) | 5,546 (12.8%) |
Educational Attainment by Field of Study in Kings County
Business (2,264 | 15.5%), science & technology (1,620 | 11.1%), liberal arts & history (1,581 | 10.8%), education (1,490 | 10.2%), and arts & humanities (1,416 | 9.7%) are the most common fields of study among 14,614 individuals in Kings County who have obtained a bachelor's degree or higher.
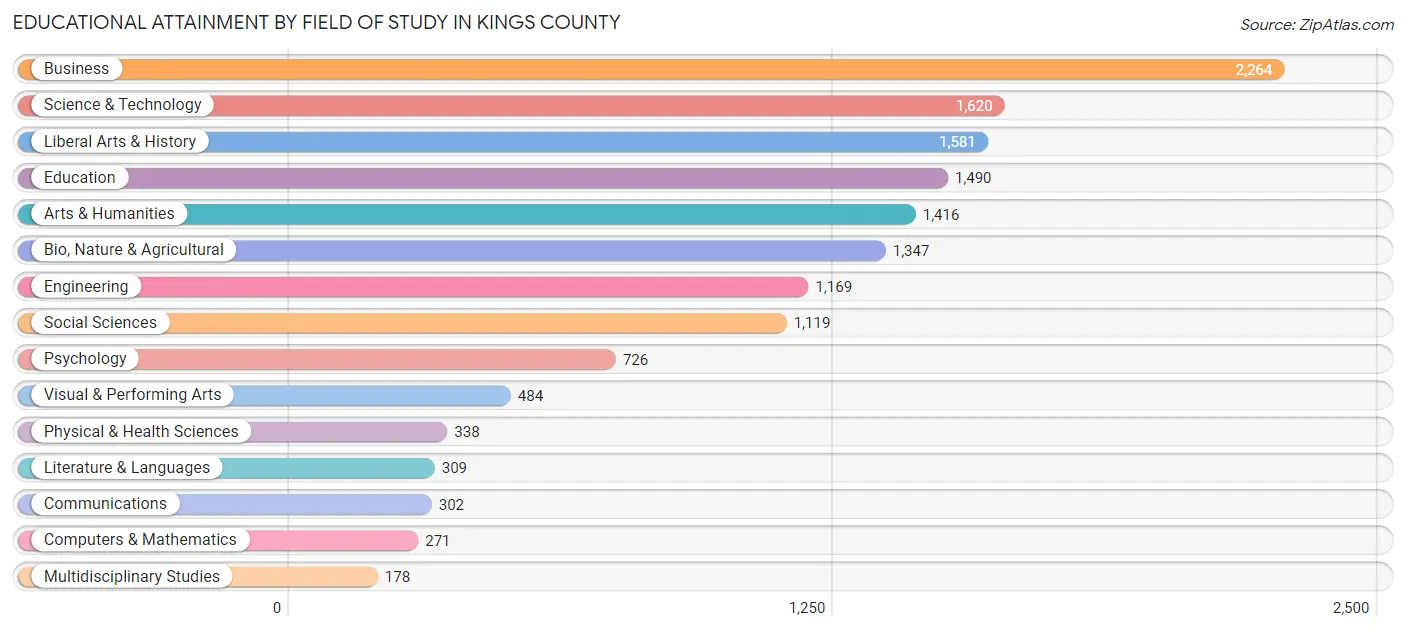
| Field of Study | # Graduates | % Graduates |
| Computers & Mathematics | 271 | 1.8% |
| Bio, Nature & Agricultural | 1,347 | 9.2% |
| Physical & Health Sciences | 338 | 2.3% |
| Psychology | 726 | 5.0% |
| Social Sciences | 1,119 | 7.7% |
| Engineering | 1,169 | 8.0% |
| Multidisciplinary Studies | 178 | 1.2% |
| Science & Technology | 1,620 | 11.1% |
| Business | 2,264 | 15.5% |
| Education | 1,490 | 10.2% |
| Literature & Languages | 309 | 2.1% |
| Liberal Arts & History | 1,581 | 10.8% |
| Visual & Performing Arts | 484 | 3.3% |
| Communications | 302 | 2.1% |
| Arts & Humanities | 1,416 | 9.7% |
| Total | 14,614 | 100.0% |
Transportation & Commute in Kings County
Vehicle Availability by Sex in Kings County
The most prevalent vehicle ownership categories in Kings County are males with 2 vehicles (14,065, accounting for 42.1%) and females with 2 vehicles (8,284, making up 65.1%).
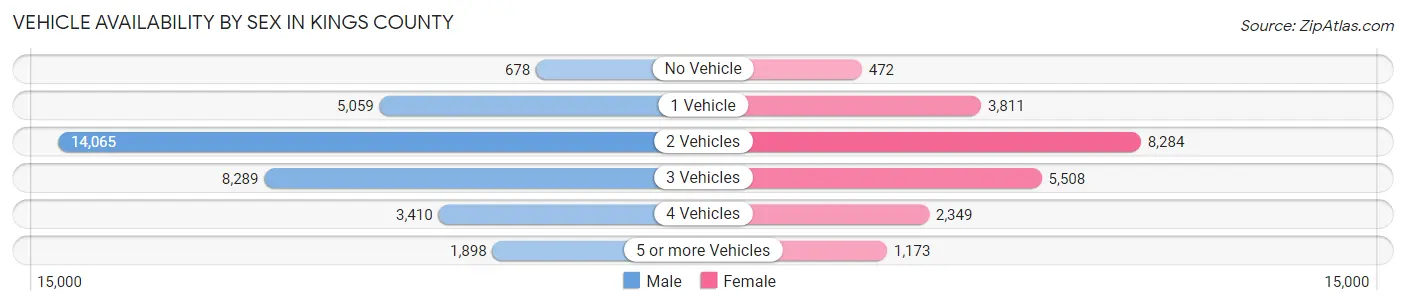
| Vehicles Available | Male | Female |
| No Vehicle | 678 (2.0%) | 472 (2.2%) |
| 1 Vehicle | 5,059 (15.1%) | 3,811 (17.6%) |
| 2 Vehicles | 14,065 (42.1%) | 8,284 (38.4%) |
| 3 Vehicles | 8,289 (24.8%) | 5,508 (25.5%) |
| 4 Vehicles | 3,410 (10.2%) | 2,349 (10.9%) |
| 5 or more Vehicles | 1,898 (5.7%) | 1,173 (5.4%) |
| Total | 33,399 (100.0%) | 21,597 (100.0%) |
Commute Time in Kings County
The most frequently occuring commute durations in Kings County are 5 to 9 minutes (10,034 commuters, 18.5%), 15 to 19 minutes (7,641 commuters, 14.1%), and 10 to 14 minutes (7,610 commuters, 14.0%).
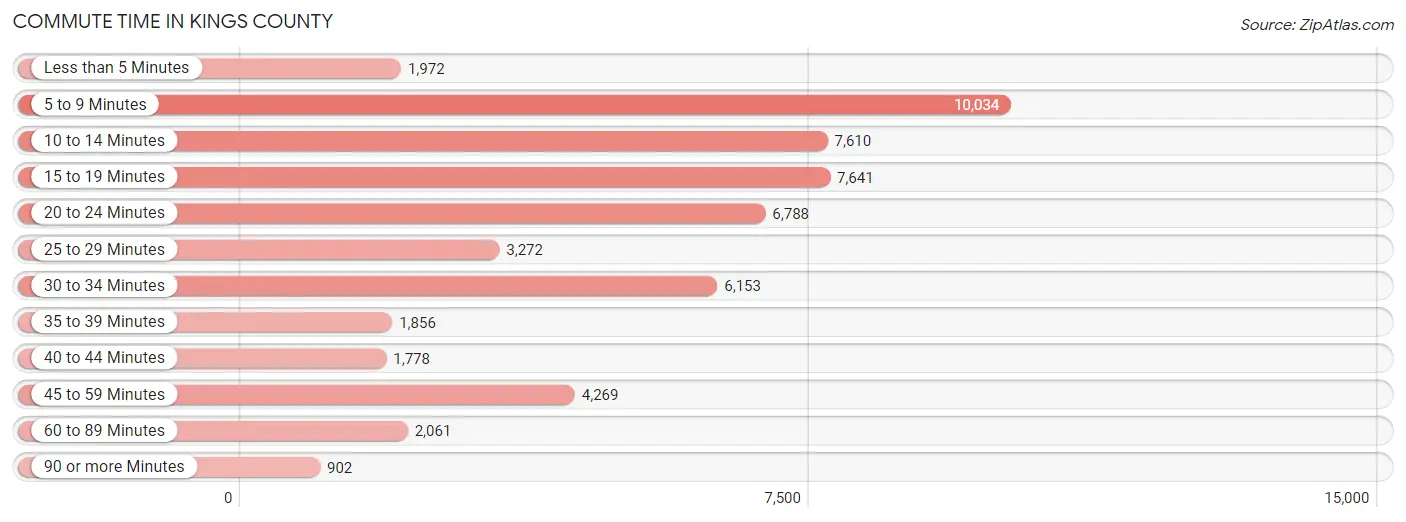
| Commute Time | # Commuters | % Commuters |
| Less than 5 Minutes | 1,972 | 3.6% |
| 5 to 9 Minutes | 10,034 | 18.5% |
| 10 to 14 Minutes | 7,610 | 14.0% |
| 15 to 19 Minutes | 7,641 | 14.1% |
| 20 to 24 Minutes | 6,788 | 12.5% |
| 25 to 29 Minutes | 3,272 | 6.0% |
| 30 to 34 Minutes | 6,153 | 11.3% |
| 35 to 39 Minutes | 1,856 | 3.4% |
| 40 to 44 Minutes | 1,778 | 3.3% |
| 45 to 59 Minutes | 4,269 | 7.9% |
| 60 to 89 Minutes | 2,061 | 3.8% |
| 90 or more Minutes | 902 | 1.7% |
Commute Time by Sex in Kings County
The most common commute times in Kings County are 5 to 9 minutes (5,386 commuters, 15.9%) for males and 5 to 9 minutes (4,648 commuters, 22.8%) for females.
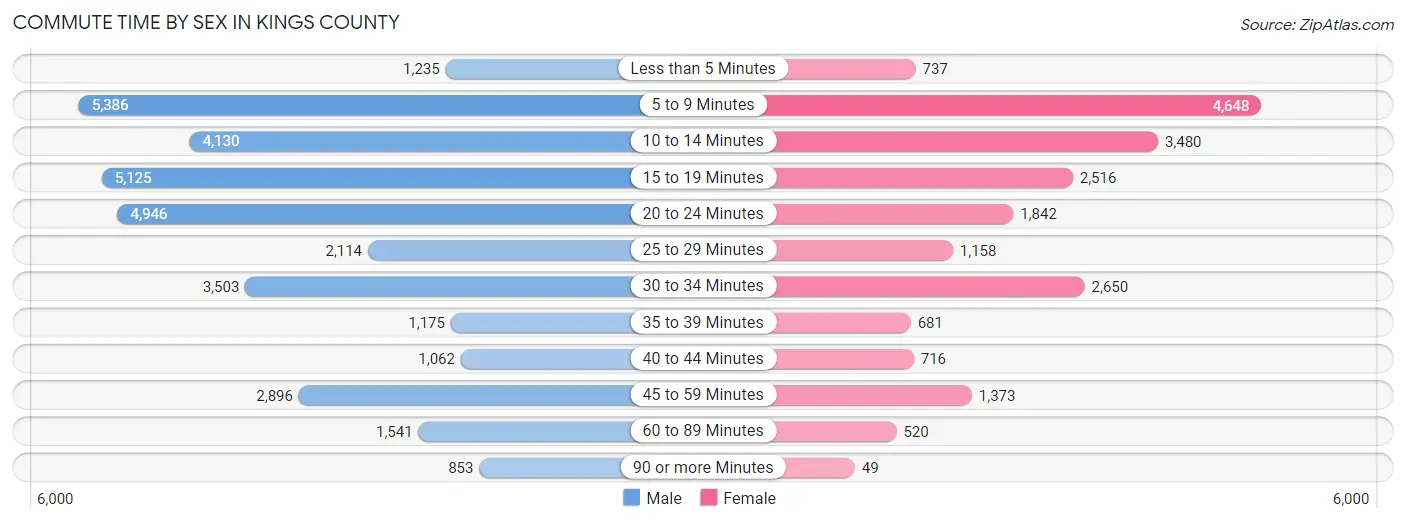
| Commute Time | Male | Female |
| Less than 5 Minutes | 1,235 (3.6%) | 737 (3.6%) |
| 5 to 9 Minutes | 5,386 (15.9%) | 4,648 (22.8%) |
| 10 to 14 Minutes | 4,130 (12.2%) | 3,480 (17.1%) |
| 15 to 19 Minutes | 5,125 (15.1%) | 2,516 (12.3%) |
| 20 to 24 Minutes | 4,946 (14.6%) | 1,842 (9.0%) |
| 25 to 29 Minutes | 2,114 (6.2%) | 1,158 (5.7%) |
| 30 to 34 Minutes | 3,503 (10.3%) | 2,650 (13.0%) |
| 35 to 39 Minutes | 1,175 (3.5%) | 681 (3.3%) |
| 40 to 44 Minutes | 1,062 (3.1%) | 716 (3.5%) |
| 45 to 59 Minutes | 2,896 (8.5%) | 1,373 (6.7%) |
| 60 to 89 Minutes | 1,541 (4.5%) | 520 (2.5%) |
| 90 or more Minutes | 853 (2.5%) | 49 (0.2%) |
Time of Departure to Work by Sex in Kings County
The most frequent times of departure to work in Kings County are 6:00 AM to 6:29 AM (4,462, 13.1%) for males and 7:30 AM to 7:59 AM (3,079, 15.1%) for females.
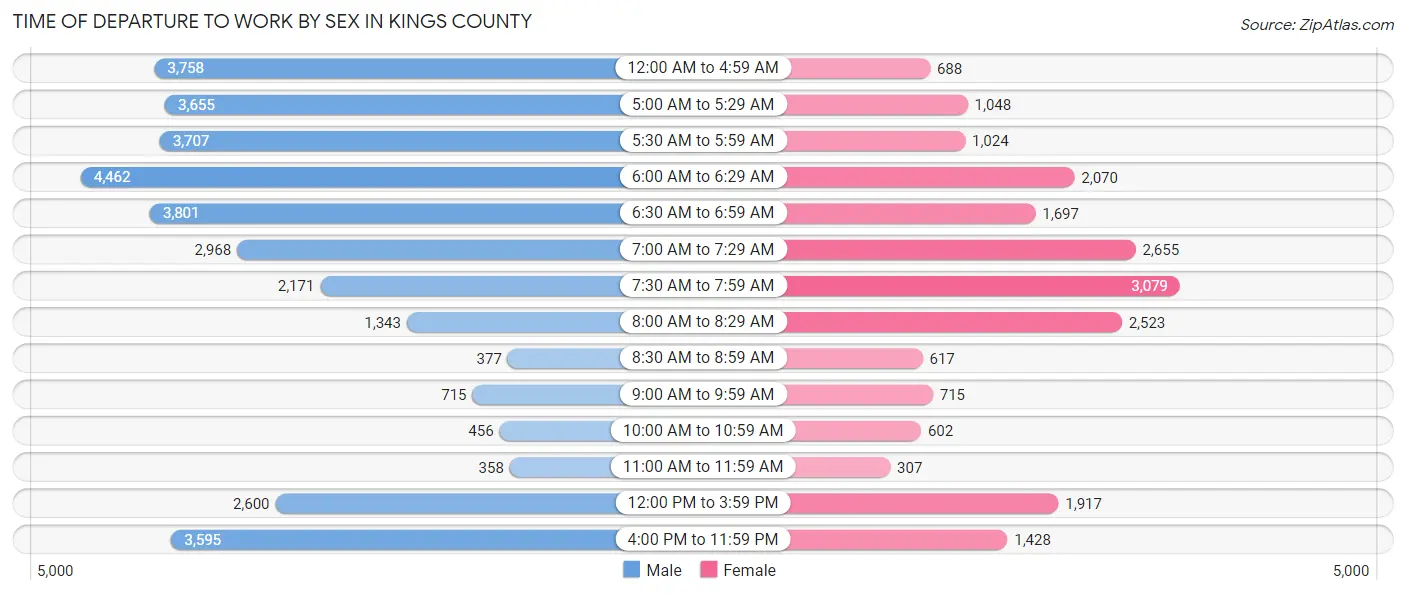
| Time of Departure | Male | Female |
| 12:00 AM to 4:59 AM | 3,758 (11.1%) | 688 (3.4%) |
| 5:00 AM to 5:29 AM | 3,655 (10.8%) | 1,048 (5.1%) |
| 5:30 AM to 5:59 AM | 3,707 (10.9%) | 1,024 (5.0%) |
| 6:00 AM to 6:29 AM | 4,462 (13.1%) | 2,070 (10.2%) |
| 6:30 AM to 6:59 AM | 3,801 (11.2%) | 1,697 (8.3%) |
| 7:00 AM to 7:29 AM | 2,968 (8.7%) | 2,655 (13.0%) |
| 7:30 AM to 7:59 AM | 2,171 (6.4%) | 3,079 (15.1%) |
| 8:00 AM to 8:29 AM | 1,343 (4.0%) | 2,523 (12.4%) |
| 8:30 AM to 8:59 AM | 377 (1.1%) | 617 (3.0%) |
| 9:00 AM to 9:59 AM | 715 (2.1%) | 715 (3.5%) |
| 10:00 AM to 10:59 AM | 456 (1.3%) | 602 (3.0%) |
| 11:00 AM to 11:59 AM | 358 (1.1%) | 307 (1.5%) |
| 12:00 PM to 3:59 PM | 2,600 (7.6%) | 1,917 (9.4%) |
| 4:00 PM to 11:59 PM | 3,595 (10.6%) | 1,428 (7.0%) |
| Total | 33,966 (100.0%) | 20,370 (100.0%) |
Housing Occupancy in Kings County
Occupancy by Ownership in Kings County
Of the total 43,594 dwellings in Kings County, owner-occupied units account for 23,924 (54.9%), while renter-occupied units make up 19,670 (45.1%).
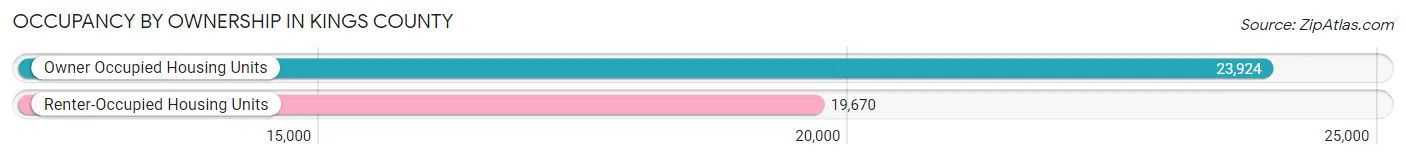
| Occupancy | # Housing Units | % Housing Units |
| Owner Occupied Housing Units | 23,924 | 54.9% |
| Renter-Occupied Housing Units | 19,670 | 45.1% |
| Total Occupied Housing Units | 43,594 | 100.0% |
Occupancy by Household Size in Kings County
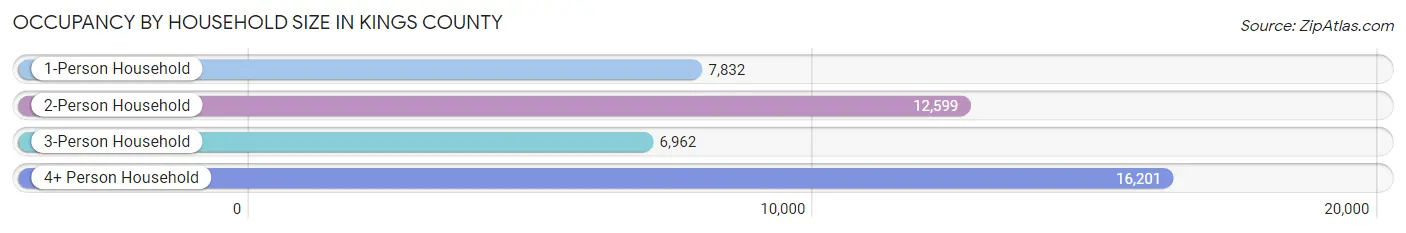
| Household Size | # Housing Units | % Housing Units |
| 1-Person Household | 7,832 | 18.0% |
| 2-Person Household | 12,599 | 28.9% |
| 3-Person Household | 6,962 | 16.0% |
| 4+ Person Household | 16,201 | 37.2% |
| Total Housing Units | 43,594 | 100.0% |
Occupancy by Ownership by Household Size in Kings County
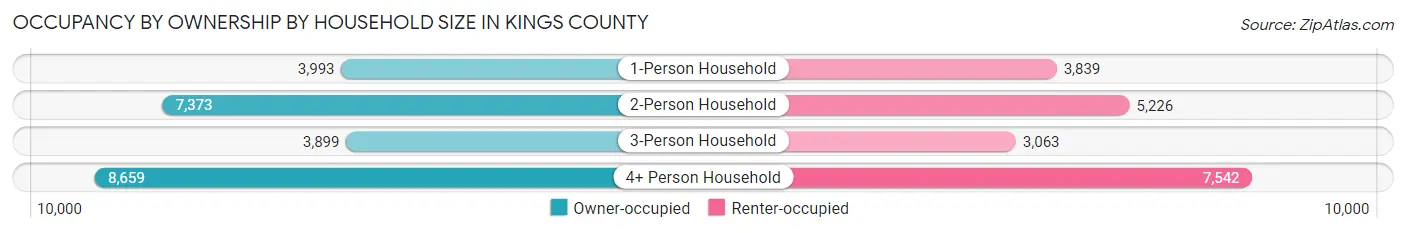
| Household Size | Owner-occupied | Renter-occupied |
| 1-Person Household | 3,993 (51.0%) | 3,839 (49.0%) |
| 2-Person Household | 7,373 (58.5%) | 5,226 (41.5%) |
| 3-Person Household | 3,899 (56.0%) | 3,063 (44.0%) |
| 4+ Person Household | 8,659 (53.4%) | 7,542 (46.6%) |
| Total Housing Units | 23,924 (54.9%) | 19,670 (45.1%) |
Occupancy by Educational Attainment in Kings County
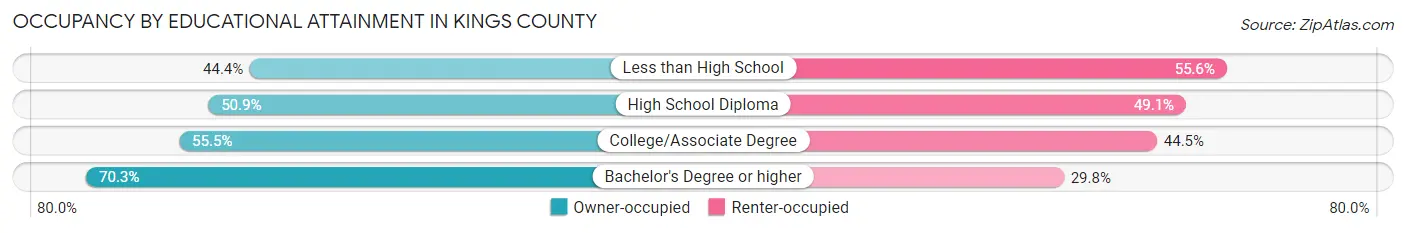
| Household Size | Owner-occupied | Renter-occupied |
| Less than High School | 3,888 (44.4%) | 4,870 (55.6%) |
| High School Diploma | 5,453 (50.9%) | 5,266 (49.1%) |
| College/Associate Degree | 8,858 (55.5%) | 7,109 (44.5%) |
| Bachelor's Degree or higher | 5,725 (70.3%) | 2,425 (29.7%) |
Occupancy by Age of Householder in Kings County
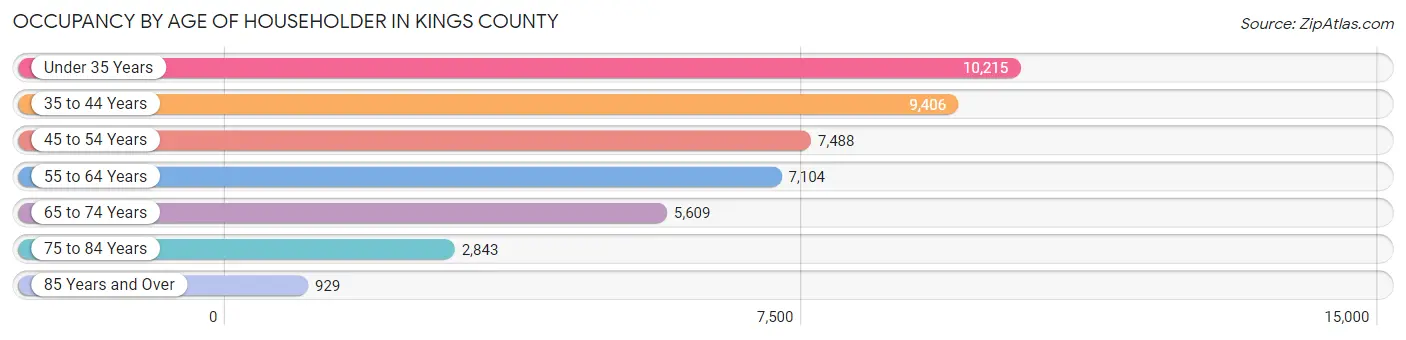
| Age Bracket | # Households | % Households |
| Under 35 Years | 10,215 | 23.4% |
| 35 to 44 Years | 9,406 | 21.6% |
| 45 to 54 Years | 7,488 | 17.2% |
| 55 to 64 Years | 7,104 | 16.3% |
| 65 to 74 Years | 5,609 | 12.9% |
| 75 to 84 Years | 2,843 | 6.5% |
| 85 Years and Over | 929 | 2.1% |
| Total | 43,594 | 100.0% |
Housing Finances in Kings County
Median Income by Occupancy in Kings County
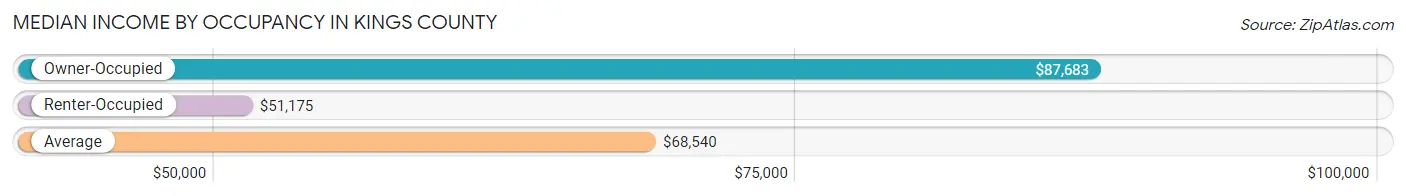
| Occupancy Type | # Households | Median Income |
| Owner-Occupied | 23,924 (54.9%) | $87,683 |
| Renter-Occupied | 19,670 (45.1%) | $51,175 |
| Average | 43,594 (100.0%) | $68,540 |
Occupancy by Householder Income Bracket in Kings County
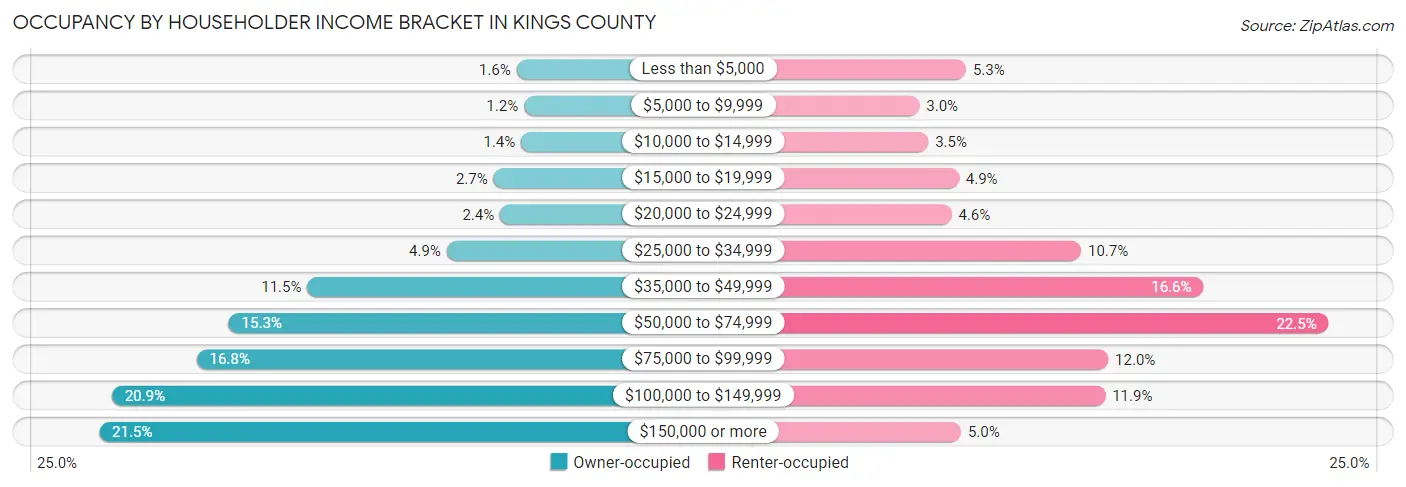
| Income Bracket | Owner-occupied | Renter-occupied |
| Less than $5,000 | 376 (1.6%) | 1,034 (5.3%) |
| $5,000 to $9,999 | 291 (1.2%) | 597 (3.0%) |
| $10,000 to $14,999 | 325 (1.4%) | 680 (3.5%) |
| $15,000 to $19,999 | 638 (2.7%) | 967 (4.9%) |
| $20,000 to $24,999 | 565 (2.4%) | 898 (4.6%) |
| $25,000 to $34,999 | 1,173 (4.9%) | 2,112 (10.7%) |
| $35,000 to $49,999 | 2,760 (11.5%) | 3,258 (16.6%) |
| $50,000 to $74,999 | 3,655 (15.3%) | 4,430 (22.5%) |
| $75,000 to $99,999 | 4,021 (16.8%) | 2,367 (12.0%) |
| $100,000 to $149,999 | 4,988 (20.8%) | 2,339 (11.9%) |
| $150,000 or more | 5,132 (21.4%) | 988 (5.0%) |
| Total | 23,924 (100.0%) | 19,670 (100.0%) |
Monthly Housing Cost Tiers in Kings County
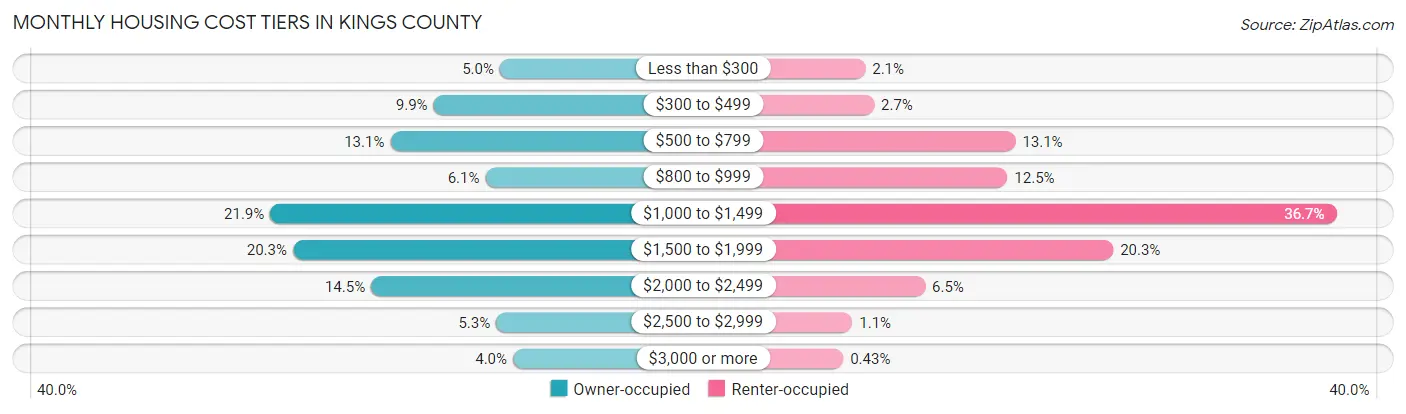
| Monthly Cost | Owner-occupied | Renter-occupied |
| Less than $300 | 1,197 (5.0%) | 403 (2.1%) |
| $300 to $499 | 2,365 (9.9%) | 531 (2.7%) |
| $500 to $799 | 3,127 (13.1%) | 2,579 (13.1%) |
| $800 to $999 | 1,451 (6.1%) | 2,462 (12.5%) |
| $1,000 to $1,499 | 5,244 (21.9%) | 7,227 (36.7%) |
| $1,500 to $1,999 | 4,845 (20.3%) | 3,994 (20.3%) |
| $2,000 to $2,499 | 3,467 (14.5%) | 1,271 (6.5%) |
| $2,500 to $2,999 | 1,262 (5.3%) | 216 (1.1%) |
| $3,000 or more | 966 (4.0%) | 84 (0.4%) |
| Total | 23,924 (100.0%) | 19,670 (100.0%) |
Physical Housing Characteristics in Kings County
Housing Structures in Kings County
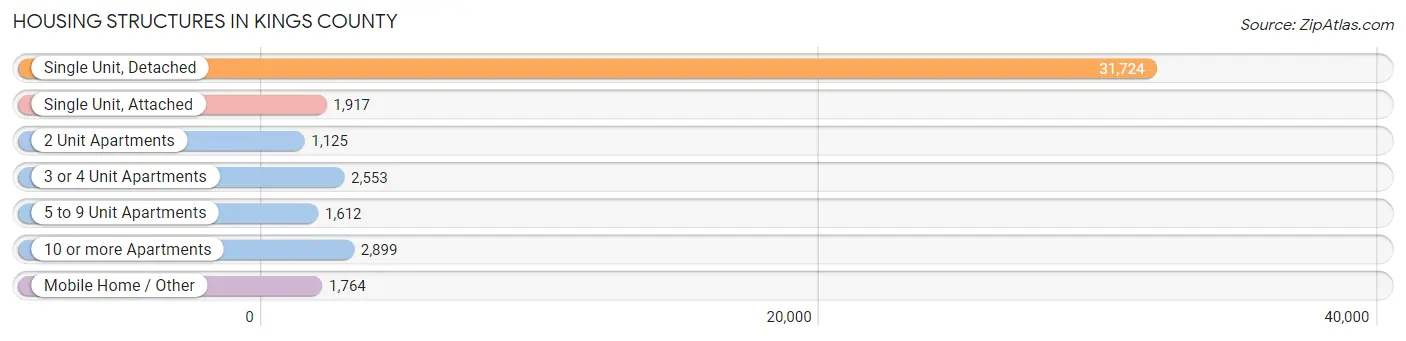
| Structure Type | # Housing Units | % Housing Units |
| Single Unit, Detached | 31,724 | 72.8% |
| Single Unit, Attached | 1,917 | 4.4% |
| 2 Unit Apartments | 1,125 | 2.6% |
| 3 or 4 Unit Apartments | 2,553 | 5.9% |
| 5 to 9 Unit Apartments | 1,612 | 3.7% |
| 10 or more Apartments | 2,899 | 6.7% |
| Mobile Home / Other | 1,764 | 4.1% |
| Total | 43,594 | 100.0% |
Housing Structures by Occupancy in Kings County
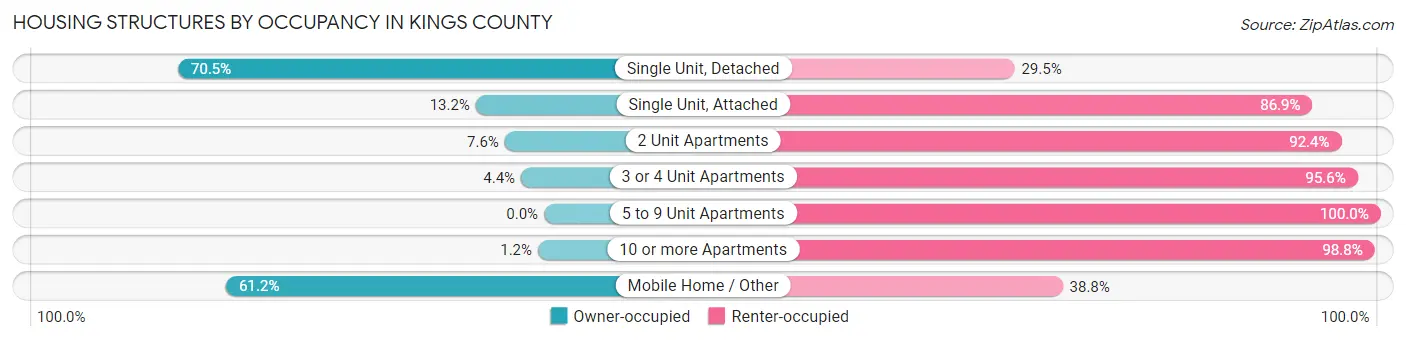
| Structure Type | Owner-occupied | Renter-occupied |
| Single Unit, Detached | 22,360 (70.5%) | 9,364 (29.5%) |
| Single Unit, Attached | 252 (13.2%) | 1,665 (86.9%) |
| 2 Unit Apartments | 85 (7.6%) | 1,040 (92.4%) |
| 3 or 4 Unit Apartments | 113 (4.4%) | 2,440 (95.6%) |
| 5 to 9 Unit Apartments | 0 (0.0%) | 1,612 (100.0%) |
| 10 or more Apartments | 34 (1.2%) | 2,865 (98.8%) |
| Mobile Home / Other | 1,080 (61.2%) | 684 (38.8%) |
| Total | 23,924 (54.9%) | 19,670 (45.1%) |
Housing Structures by Number of Rooms in Kings County
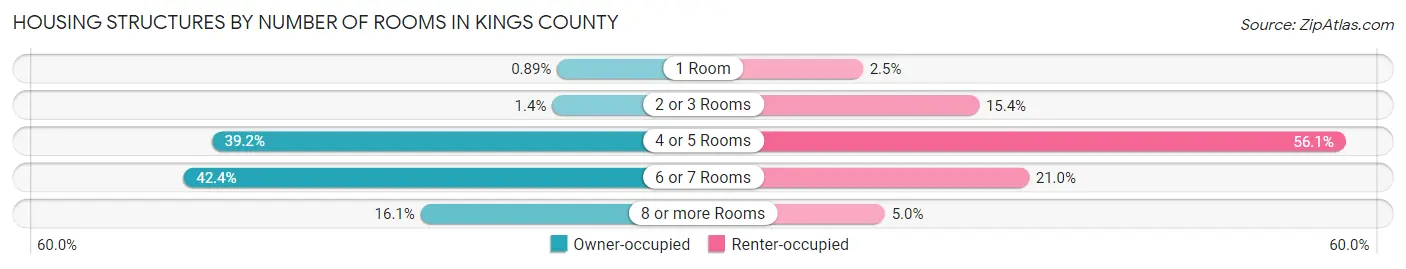
| Number of Rooms | Owner-occupied | Renter-occupied |
| 1 Room | 212 (0.9%) | 497 (2.5%) |
| 2 or 3 Rooms | 345 (1.4%) | 3,036 (15.4%) |
| 4 or 5 Rooms | 9,387 (39.2%) | 11,037 (56.1%) |
| 6 or 7 Rooms | 10,140 (42.4%) | 4,123 (21.0%) |
| 8 or more Rooms | 3,840 (16.1%) | 977 (5.0%) |
| Total | 23,924 (100.0%) | 19,670 (100.0%) |
Housing Structure by Heating Type in Kings County
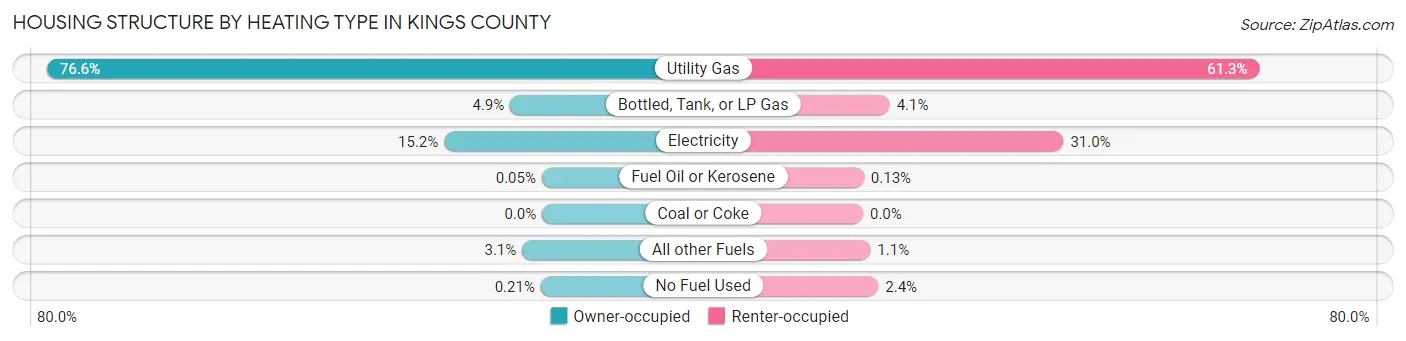
| Heating Type | Owner-occupied | Renter-occupied |
| Utility Gas | 18,313 (76.5%) | 12,049 (61.3%) |
| Bottled, Tank, or LP Gas | 1,183 (4.9%) | 810 (4.1%) |
| Electricity | 3,625 (15.1%) | 6,094 (31.0%) |
| Fuel Oil or Kerosene | 13 (0.1%) | 25 (0.1%) |
| Coal or Coke | 0 (0.0%) | 0 (0.0%) |
| All other Fuels | 740 (3.1%) | 225 (1.1%) |
| No Fuel Used | 50 (0.2%) | 467 (2.4%) |
| Total | 23,924 (100.0%) | 19,670 (100.0%) |
Household Vehicle Usage in Kings County
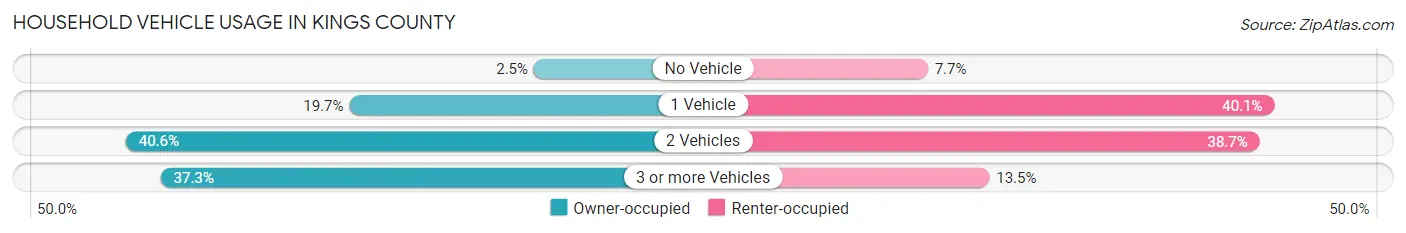
| Vehicles per Household | Owner-occupied | Renter-occupied |
| No Vehicle | 589 (2.5%) | 1,520 (7.7%) |
| 1 Vehicle | 4,711 (19.7%) | 7,885 (40.1%) |
| 2 Vehicles | 9,700 (40.6%) | 7,613 (38.7%) |
| 3 or more Vehicles | 8,924 (37.3%) | 2,652 (13.5%) |
| Total | 23,924 (100.0%) | 19,670 (100.0%) |
Real Estate & Mortgages in Kings County
Real Estate and Mortgage Overview in Kings County
| Characteristic | Without Mortgage | With Mortgage |
| Housing Units | 7,730 | 16,194 |
| Median Property Value | $253,600 | $289,400 |
| Median Household Income | $71,381 | $3,966 |
| Monthly Housing Costs | $531 | $902 |
| Real Estate Taxes | $1,741 | $501 |
Property Value by Mortgage Status in Kings County
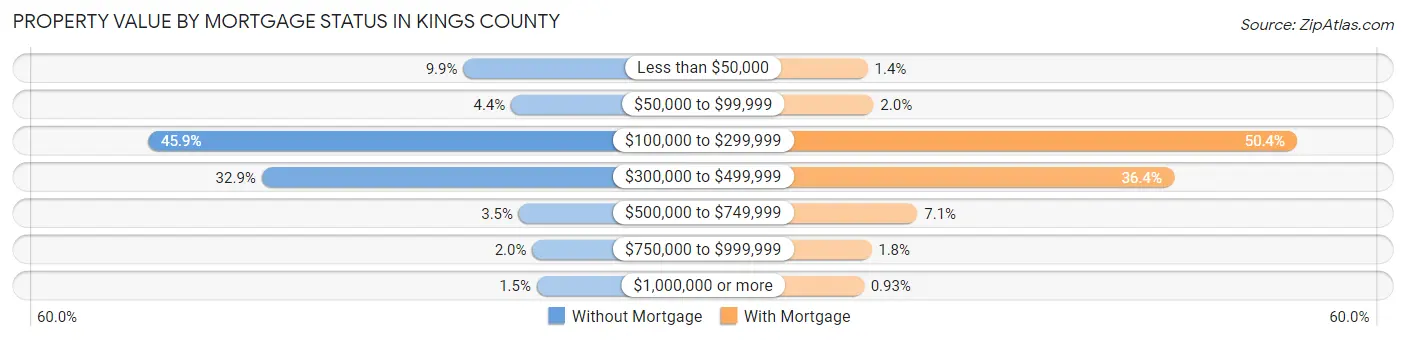
| Property Value | Without Mortgage | With Mortgage |
| Less than $50,000 | 762 (9.9%) | 224 (1.4%) |
| $50,000 to $99,999 | 340 (4.4%) | 330 (2.0%) |
| $100,000 to $299,999 | 3,547 (45.9%) | 8,167 (50.4%) |
| $300,000 to $499,999 | 2,544 (32.9%) | 5,888 (36.4%) |
| $500,000 to $749,999 | 271 (3.5%) | 1,144 (7.1%) |
| $750,000 to $999,999 | 153 (2.0%) | 291 (1.8%) |
| $1,000,000 or more | 113 (1.5%) | 150 (0.9%) |
| Total | 7,730 (100.0%) | 16,194 (100.0%) |
Household Income by Mortgage Status in Kings County
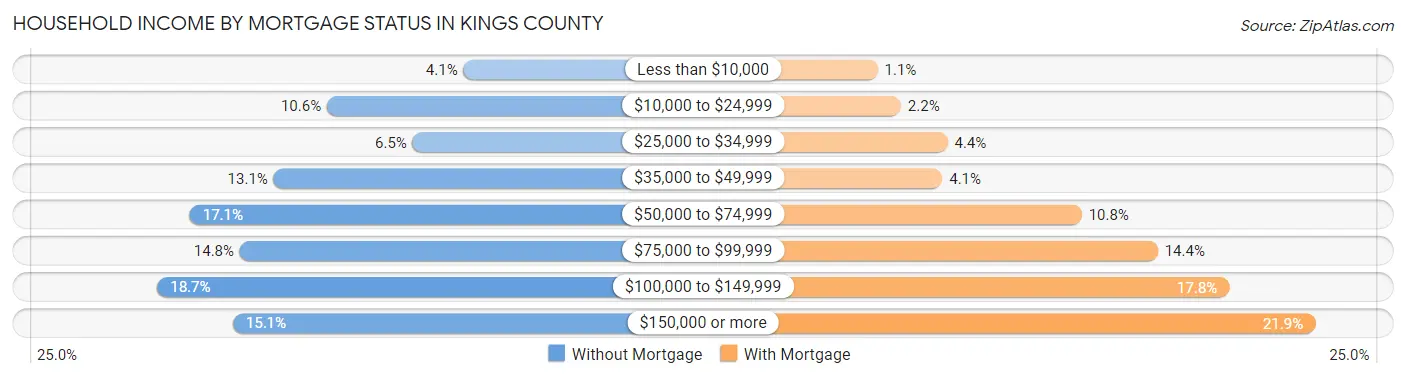
| Household Income | Without Mortgage | With Mortgage |
| Less than $10,000 | 317 (4.1%) | 170 (1.1%) |
| $10,000 to $24,999 | 819 (10.6%) | 350 (2.2%) |
| $25,000 to $34,999 | 504 (6.5%) | 709 (4.4%) |
| $35,000 to $49,999 | 1,016 (13.1%) | 669 (4.1%) |
| $50,000 to $74,999 | 1,324 (17.1%) | 1,744 (10.8%) |
| $75,000 to $99,999 | 1,140 (14.7%) | 2,331 (14.4%) |
| $100,000 to $149,999 | 1,444 (18.7%) | 2,881 (17.8%) |
| $150,000 or more | 1,166 (15.1%) | 3,544 (21.9%) |
| Total | 7,730 (100.0%) | 16,194 (100.0%) |
Property Value to Household Income Ratio in Kings County
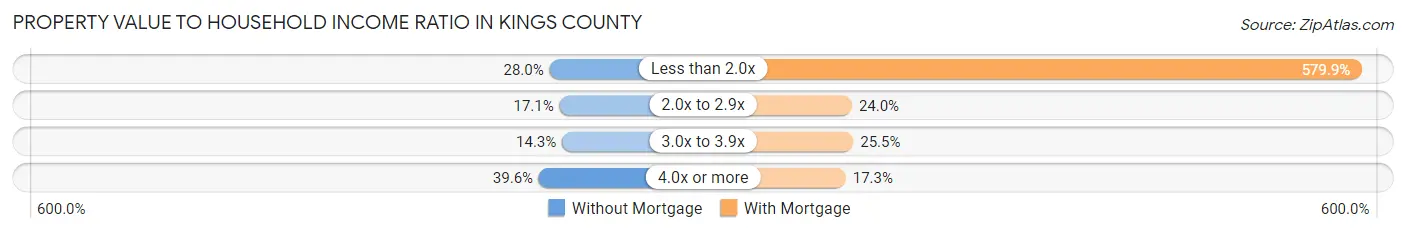
| Value-to-Income Ratio | Without Mortgage | With Mortgage |
| Less than 2.0x | 2,164 (28.0%) | 93,909 (579.9%) |
| 2.0x to 2.9x | 1,321 (17.1%) | 3,889 (24.0%) |
| 3.0x to 3.9x | 1,105 (14.3%) | 4,121 (25.5%) |
| 4.0x or more | 3,061 (39.6%) | 2,806 (17.3%) |
| Total | 7,730 (100.0%) | 16,194 (100.0%) |
Real Estate Taxes by Mortgage Status in Kings County
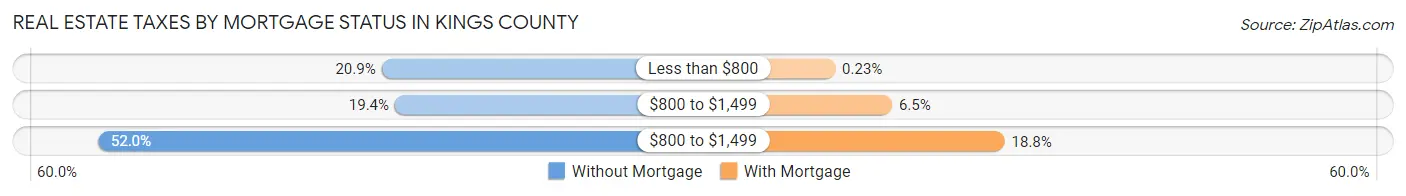
| Property Taxes | Without Mortgage | With Mortgage |
| Less than $800 | 1,615 (20.9%) | 38 (0.2%) |
| $800 to $1,499 | 1,501 (19.4%) | 1,046 (6.5%) |
| $800 to $1,499 | 4,017 (52.0%) | 3,045 (18.8%) |
| Total | 7,730 (100.0%) | 16,194 (100.0%) |
Health & Disability in Kings County
Health Insurance Coverage by Age in Kings County
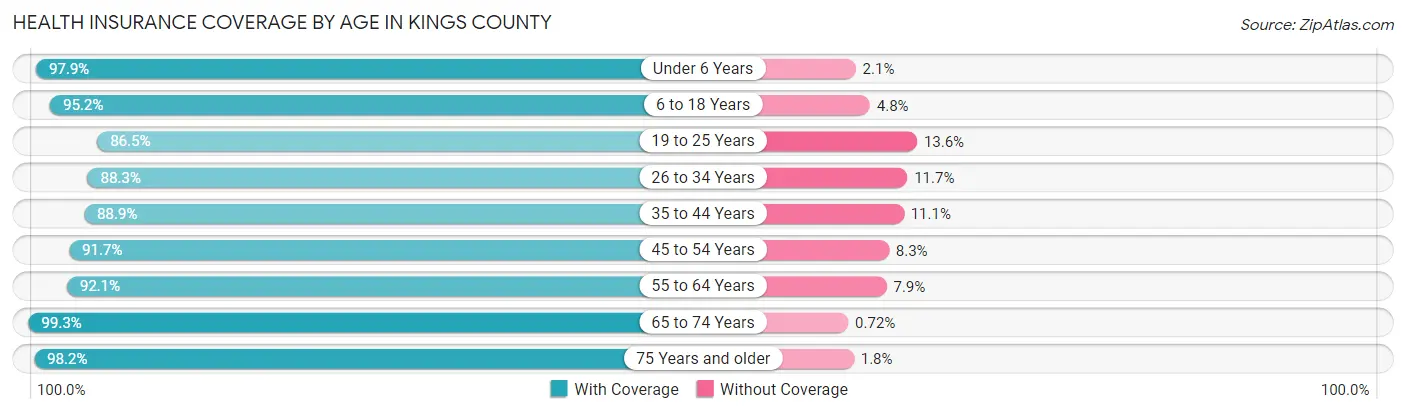
| Age Bracket | With Coverage | Without Coverage |
| Under 6 Years | 12,955 (97.9%) | 280 (2.1%) |
| 6 to 18 Years | 28,446 (95.2%) | 1,421 (4.8%) |
| 19 to 25 Years | 11,959 (86.5%) | 1,874 (13.6%) |
| 26 to 34 Years | 15,925 (88.3%) | 2,119 (11.7%) |
| 35 to 44 Years | 16,155 (88.9%) | 2,013 (11.1%) |
| 45 to 54 Years | 13,376 (91.7%) | 1,213 (8.3%) |
| 55 to 64 Years | 11,912 (92.1%) | 1,019 (7.9%) |
| 65 to 74 Years | 9,116 (99.3%) | 66 (0.7%) |
| 75 Years and older | 6,206 (98.2%) | 112 (1.8%) |
| Total | 126,050 (92.6%) | 10,117 (7.4%) |
Health Insurance Coverage by Citizenship Status in Kings County
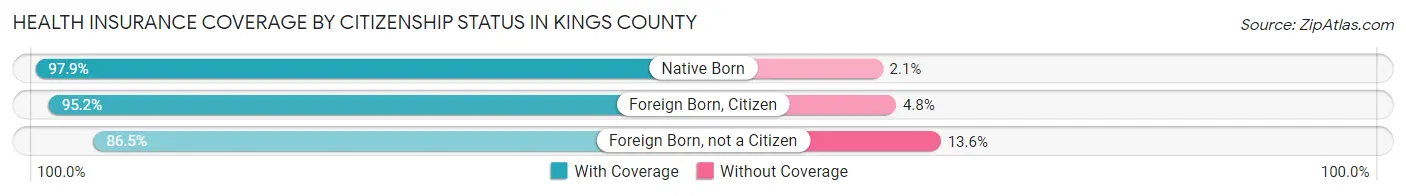
| Citizenship Status | With Coverage | Without Coverage |
| Native Born | 12,955 (97.9%) | 280 (2.1%) |
| Foreign Born, Citizen | 28,446 (95.2%) | 1,421 (4.8%) |
| Foreign Born, not a Citizen | 11,959 (86.5%) | 1,874 (13.6%) |
Health Insurance Coverage by Household Income in Kings County
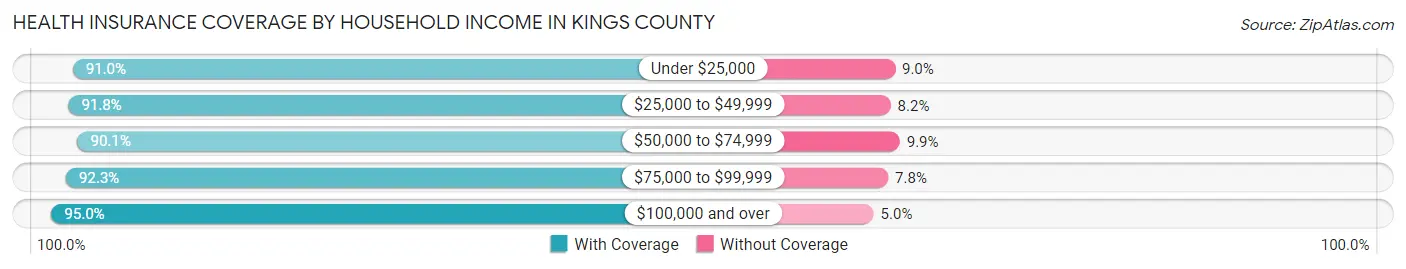
| Household Income | With Coverage | Without Coverage |
| Under $25,000 | 14,714 (91.0%) | 1,463 (9.0%) |
| $25,000 to $49,999 | 25,037 (91.8%) | 2,243 (8.2%) |
| $50,000 to $74,999 | 21,500 (90.1%) | 2,369 (9.9%) |
| $75,000 to $99,999 | 20,294 (92.2%) | 1,706 (7.7%) |
| $100,000 and over | 44,074 (95.0%) | 2,336 (5.0%) |
Public vs Private Health Insurance Coverage by Age in Kings County
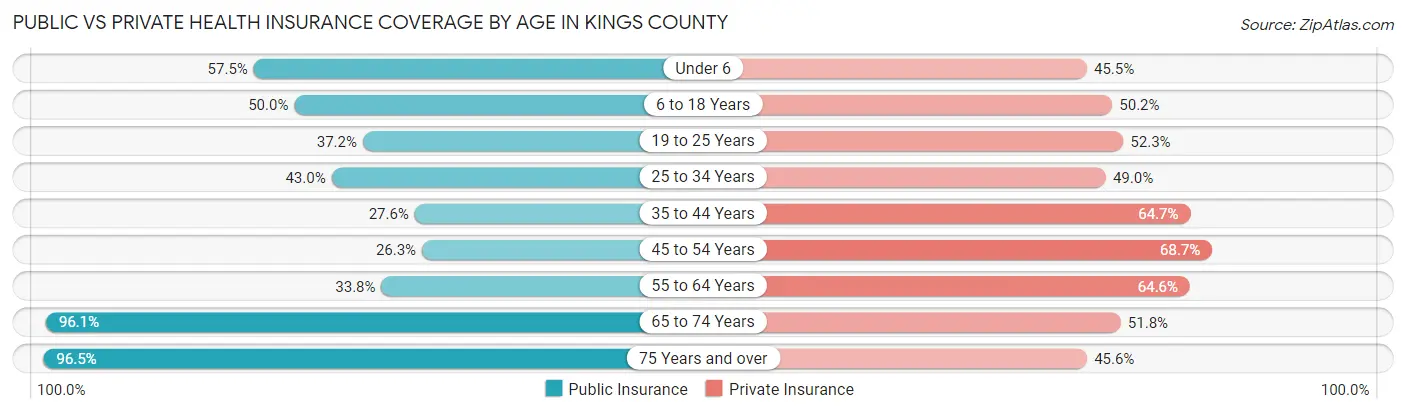
| Age Bracket | Public Insurance | Private Insurance |
| Under 6 | 7,608 (57.5%) | 6,025 (45.5%) |
| 6 to 18 Years | 14,918 (49.9%) | 15,000 (50.2%) |
| 19 to 25 Years | 5,150 (37.2%) | 7,231 (52.3%) |
| 25 to 34 Years | 7,766 (43.0%) | 8,849 (49.0%) |
| 35 to 44 Years | 5,012 (27.6%) | 11,752 (64.7%) |
| 45 to 54 Years | 3,829 (26.3%) | 10,028 (68.7%) |
| 55 to 64 Years | 4,368 (33.8%) | 8,353 (64.6%) |
| 65 to 74 Years | 8,820 (96.1%) | 4,757 (51.8%) |
| 75 Years and over | 6,097 (96.5%) | 2,878 (45.6%) |
| Total | 63,568 (46.7%) | 74,873 (55.0%) |
Disability Status by Sex by Age in Kings County
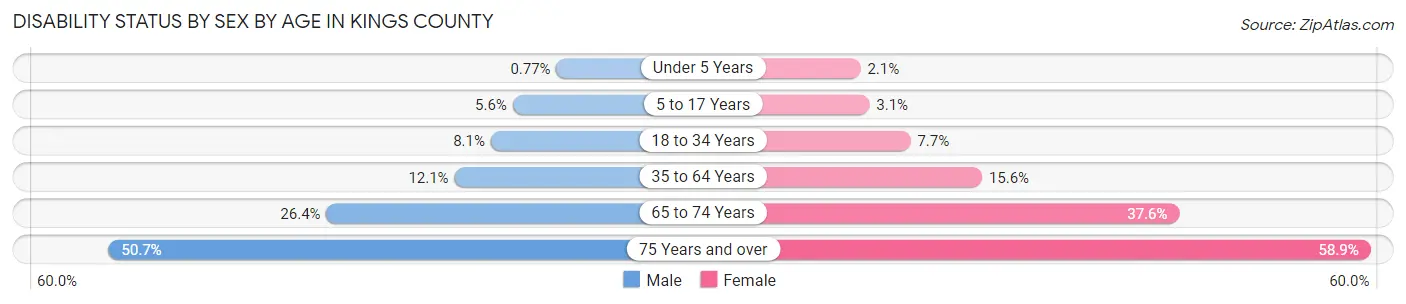
| Age Bracket | Male | Female |
| Under 5 Years | 43 (0.8%) | 116 (2.1%) |
| 5 to 17 Years | 858 (5.6%) | 451 (3.1%) |
| 18 to 34 Years | 1,386 (8.1%) | 1,284 (7.6%) |
| 35 to 64 Years | 2,874 (12.1%) | 3,433 (15.6%) |
| 65 to 74 Years | 1,171 (26.4%) | 1,783 (37.6%) |
| 75 Years and over | 1,383 (50.7%) | 2,113 (58.9%) |
Disability Class by Sex by Age in Kings County
Disability Class: Hearing Difficulty
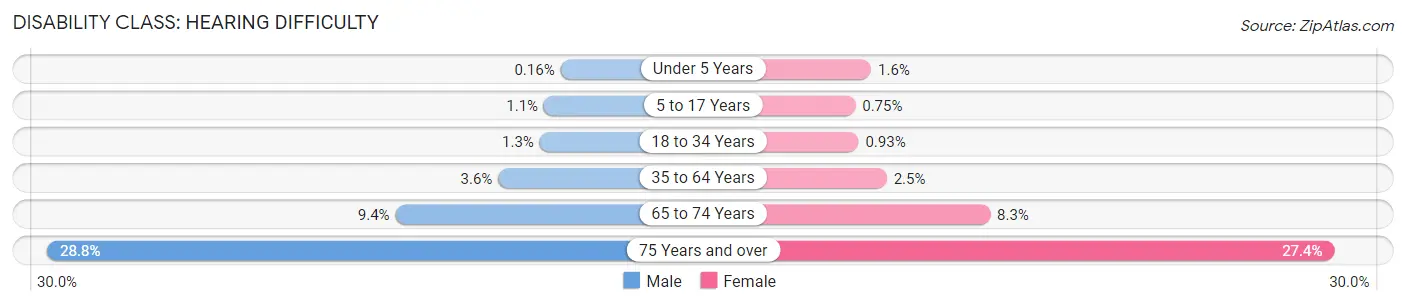
| Age Bracket | Male | Female |
| Under 5 Years | 9 (0.2%) | 91 (1.6%) |
| 5 to 17 Years | 164 (1.1%) | 110 (0.7%) |
| 18 to 34 Years | 227 (1.3%) | 156 (0.9%) |
| 35 to 64 Years | 860 (3.6%) | 549 (2.5%) |
| 65 to 74 Years | 415 (9.3%) | 392 (8.3%) |
| 75 Years and over | 785 (28.7%) | 984 (27.4%) |
Disability Class: Vision Difficulty
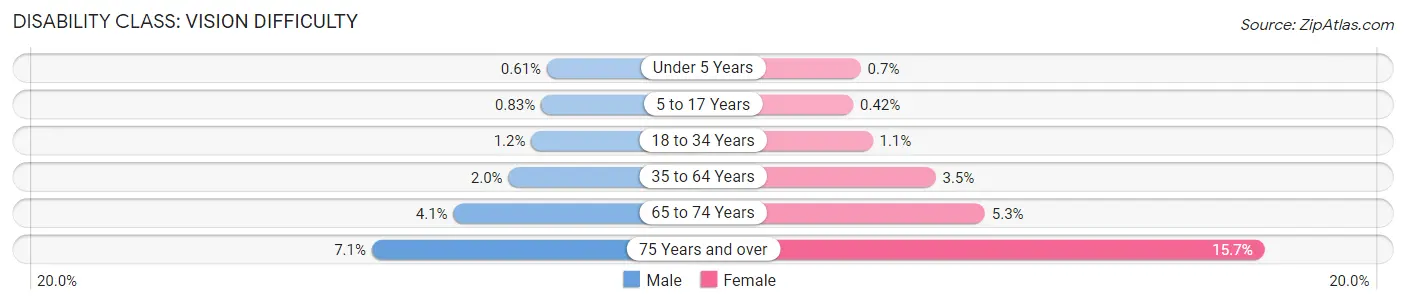
| Age Bracket | Male | Female |
| Under 5 Years | 34 (0.6%) | 39 (0.7%) |
| 5 to 17 Years | 127 (0.8%) | 62 (0.4%) |
| 18 to 34 Years | 204 (1.2%) | 192 (1.1%) |
| 35 to 64 Years | 483 (2.0%) | 766 (3.5%) |
| 65 to 74 Years | 181 (4.1%) | 252 (5.3%) |
| 75 Years and over | 194 (7.1%) | 563 (15.7%) |
Disability Class: Cognitive Difficulty
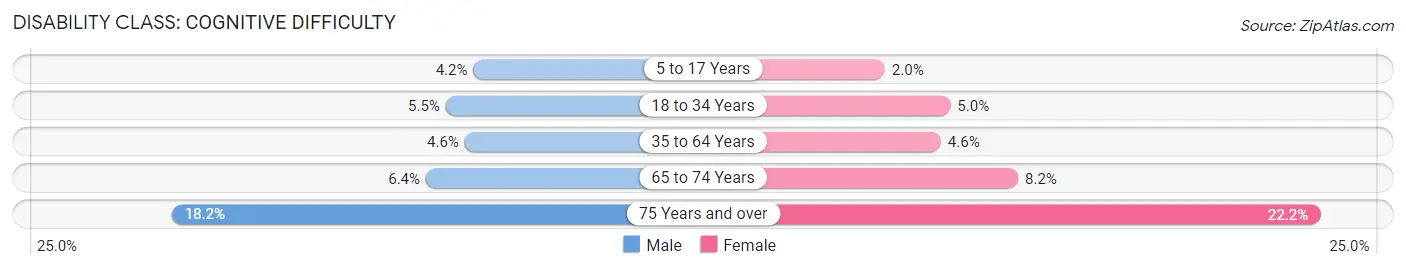
| Age Bracket | Male | Female |
| 5 to 17 Years | 636 (4.2%) | 294 (2.0%) |
| 18 to 34 Years | 936 (5.5%) | 846 (5.0%) |
| 35 to 64 Years | 1,086 (4.6%) | 1,011 (4.6%) |
| 65 to 74 Years | 283 (6.4%) | 388 (8.2%) |
| 75 Years and over | 496 (18.2%) | 796 (22.2%) |
Disability Class: Ambulatory Difficulty
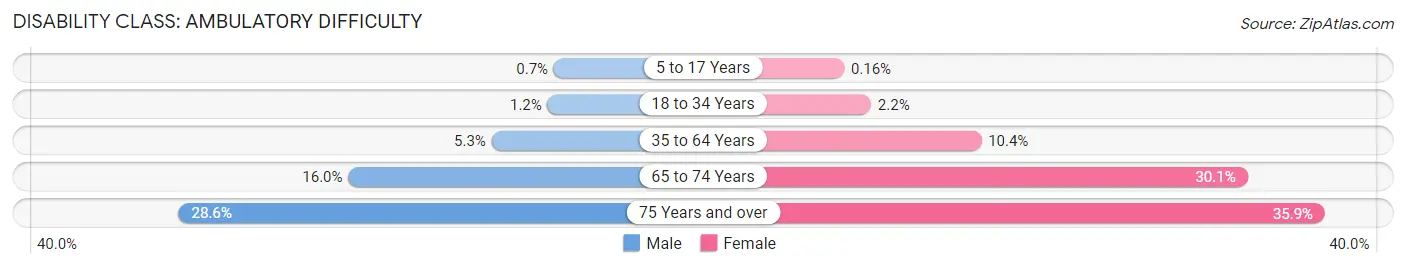
| Age Bracket | Male | Female |
| 5 to 17 Years | 107 (0.7%) | 23 (0.2%) |
| 18 to 34 Years | 201 (1.2%) | 362 (2.2%) |
| 35 to 64 Years | 1,261 (5.3%) | 2,277 (10.3%) |
| 65 to 74 Years | 708 (16.0%) | 1,429 (30.1%) |
| 75 Years and over | 780 (28.6%) | 1,287 (35.9%) |
Disability Class: Self-Care Difficulty
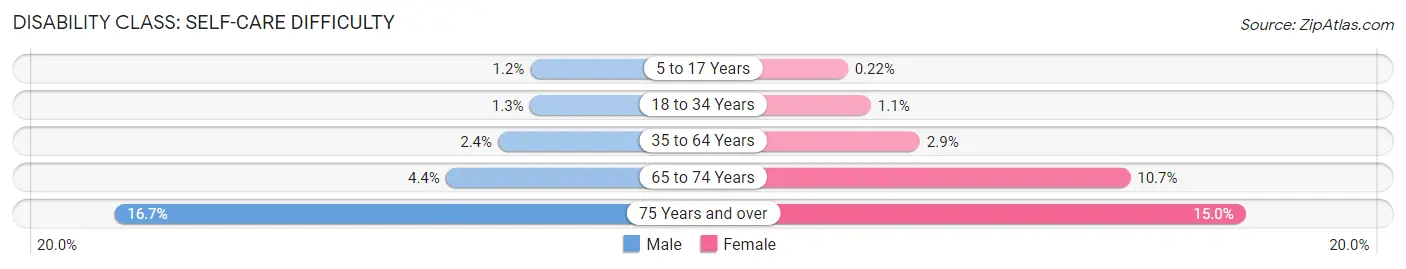
| Age Bracket | Male | Female |
| 5 to 17 Years | 187 (1.2%) | 33 (0.2%) |
| 18 to 34 Years | 216 (1.3%) | 181 (1.1%) |
| 35 to 64 Years | 576 (2.4%) | 637 (2.9%) |
| 65 to 74 Years | 194 (4.4%) | 508 (10.7%) |
| 75 Years and over | 455 (16.7%) | 538 (15.0%) |
Technology Access in Kings County
Computing Device Access in Kings County
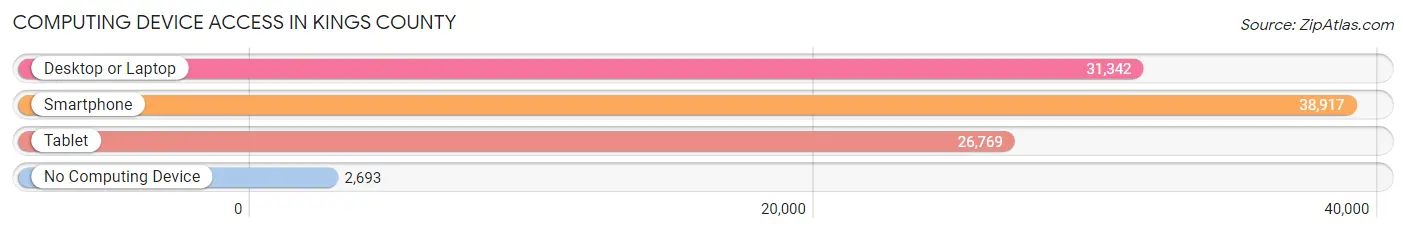
| Device Type | # Households | % Households |
| Desktop or Laptop | 31,342 | 71.9% |
| Smartphone | 38,917 | 89.3% |
| Tablet | 26,769 | 61.4% |
| No Computing Device | 2,693 | 6.2% |
| Total | 43,594 | 100.0% |
Internet Access in Kings County
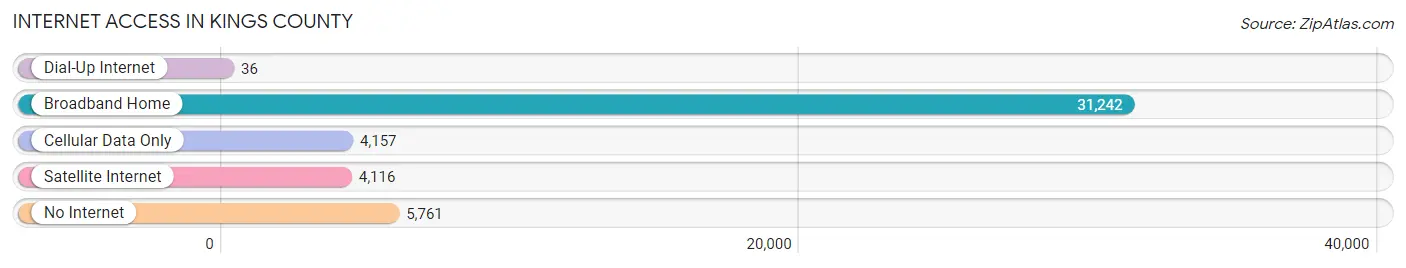
| Internet Type | # Households | % Households |
| Dial-Up Internet | 36 | 0.1% |
| Broadband Home | 31,242 | 71.7% |
| Cellular Data Only | 4,157 | 9.5% |
| Satellite Internet | 4,116 | 9.4% |
| No Internet | 5,761 | 13.2% |
| Total | 43,594 | 100.0% |
Kings County Summary
Kings County is a county located in the Central Valley of California, in the United States. It is the most populous county in the state, with a population of 1,919,819 as of the 2020 census. The county seat is Hanford. Kings County is bordered by Fresno County to the north, Tulare County to the east, Kern County to the south, and San Joaquin County to the west.
History
Kings County was formed in 1893 from parts of Tulare and Fresno Counties. It was named after the Kings River, which was named in 1805 by Spanish explorer Gabriel Moraga for the biblical King Solomon. The county was originally part of the vast Rancho Sanjon de Santa Rita Mexican land grant.
The county was an agricultural center for much of its history, with cotton, grapes, and citrus being the main crops. In the early 20th century, the county was known for its production of raisins. The county also had a large dairy industry, with the largest dairy in the world located in Hanford.
Geography
Kings County covers an area of 4,082 square miles, making it the fourth-largest county in California. It is located in the Central Valley of California, between the Sierra Nevada Mountains to the west and the Coast Ranges to the east. The county is mostly flat, with some rolling hills in the northern and eastern parts. The Kings River runs through the county, and is the main source of water for the county.
The climate of Kings County is Mediterranean, with hot, dry summers and mild, wet winters. The average annual temperature is around 70°F, and the average annual precipitation is around 10 inches.
Economy
Agriculture is the main economic activity in Kings County. The county is the leading producer of cotton, grapes, and citrus in California. Other crops grown in the county include almonds, pistachios, tomatoes, and melons. The county is also home to a large dairy industry, with the largest dairy in the world located in Hanford.
The county also has a large manufacturing sector, with companies such as Nestle, Kraft Foods, and Frito-Lay having large operations in the county. The county is also home to a large oil and gas industry, with several oil and gas fields located in the county.
Demographics
As of the 2020 census, the population of Kings County was 1,919,819, making it the most populous county in California. The population is made up of a diverse mix of ethnicities, with the largest groups being Hispanic (47.3%), White (31.2%), and Asian (13.2%). The median household income in the county is $60,845, and the median home value is $269,400.
The county is home to several large cities, including Hanford (the county seat), Corcoran, Lemoore, Avenal, and Armona. The county also has several smaller towns, such as Stratford, Kettleman City, and Corcoran.
Conclusion
Kings County is a large and diverse county located in the Central Valley of California. It is the most populous county in the state, with a population of 1,919,819 as of the 2020 census. The county is an agricultural center, with cotton, grapes, and citrus being the main crops. The county also has a large manufacturing sector, with companies such as Nestle, Kraft Foods, and Frito-Lay having large operations in the county. The county is home to a diverse mix of ethnicities, with the largest groups being Hispanic, White, and Asian.
Common Questions
What is Per Capita Income in Kings County?
Per Capita income in Kings County is $26,193.
What is the Median Family Income in Kings County?
Median Family Income in Kings County is $72,111.
What is the Median Household income in Kings County?
Median Household Income in Kings County is $68,540.
What is Income or Wage Gap in Kings County?
Income or Wage Gap in Kings County is 30.5%.
Women in Kings County earn 69.5 cents for every dollar earned by a man.
What is Family Income Deficit in Kings County?
Family Income Deficit in Kings County is $12,257.
Families that are below poverty line in Kings County earn $12,257 less on average than the poverty threshold level.
What is Inequality or Gini Index in Kings County?
Inequality or Gini Index in Kings County is 0.41.
What is the Total Population of Kings County?
Total Population of Kings County is 152,515.
What is the Total Male Population of Kings County?
Total Male Population of Kings County is 84,277.
What is the Total Female Population of Kings County?
Total Female Population of Kings County is 68,238.
What is the Ratio of Males per 100 Females in Kings County?
There are 123.50 Males per 100 Females in Kings County.
What is the Ratio of Females per 100 Males in Kings County?
There are 80.97 Females per 100 Males in Kings County.
What is the Median Population Age in Kings County?
Median Population Age in Kings County is 32.1 Years.
What is the Average Family Size in Kings County
Average Family Size in Kings County is 3.6 People.
What is the Average Household Size in Kings County
Average Household Size in Kings County is 3.2 People.
How Large is the Labor Force in Kings County?
There are 63,802 People in the Labor Forcein in Kings County.
What is the Percentage of People in the Labor Force in Kings County?
55.1% of People are in the Labor Force in Kings County.
What is the Unemployment Rate in Kings County?
Unemployment Rate in Kings County is 9.2%.