Kern County, CA Map & Demographics
Kern County Map
Kern County Overview
$27,976
PER CAPITA INCOME
$71,065
AVG FAMILY INCOME
$63,883
AVG HOUSEHOLD INCOME
32.3%
WAGE / INCOME GAP [ % ]
67.7¢/ $1
WAGE / INCOME GAP [ $ ]
$10,944
FAMILY INCOME DEFICIT
0.47
INEQUALITY / GINI INDEX
906,883
TOTAL POPULATION
464,093
MALE POPULATION
442,790
FEMALE POPULATION
104.81
MALES / 100 FEMALES
95.41
FEMALES / 100 MALES
32.2
MEDIAN AGE
3.7
AVG FAMILY SIZE
3.2
AVG HOUSEHOLD SIZE
394,506
LABOR FORCE [ PEOPLE ]
58.5%
PERCENT IN LABOR FORCE
8.4%
UNEMPLOYMENT RATE
Income in Kern County
Income Overview in Kern County
Per Capita Income in Kern County is $27,976, while median incomes of families and households are $71,065 and $63,883 respectively.
| Characteristic | Number | Measure |
| Per Capita Income | 906,883 | $27,976 |
| Median Family Income | 205,689 | $71,065 |
| Mean Family Income | 205,689 | $96,045 |
| Median Household Income | 277,499 | $63,883 |
| Mean Household Income | 277,499 | $87,915 |
| Income Deficit | 205,689 | $10,944 |
| Wage / Income Gap (%) | 906,883 | 32.33% |
| Wage / Income Gap ($) | 906,883 | 67.67¢ per $1 |
| Gini / Inequality Index | 906,883 | 0.47 |
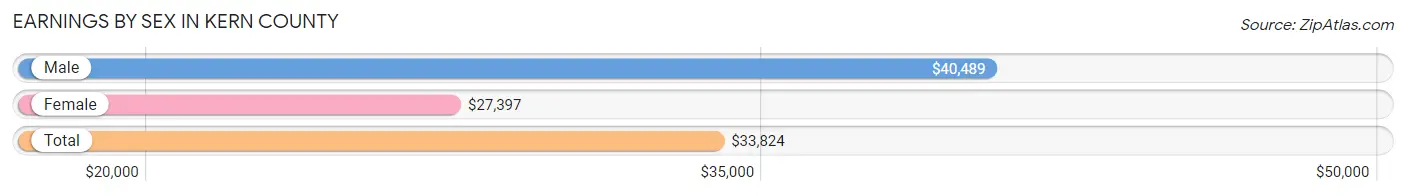
Earnings by Sex in Kern County
Average Earnings in Kern County are $33,824, $40,489 for men and $27,397 for women, a difference of 32.3%.
| Sex | Number | Average Earnings |
| Male | 223,574 (55.8%) | $40,489 |
| Female | 177,054 (44.2%) | $27,397 |
| Total | 400,628 (100.0%) | $33,824 |
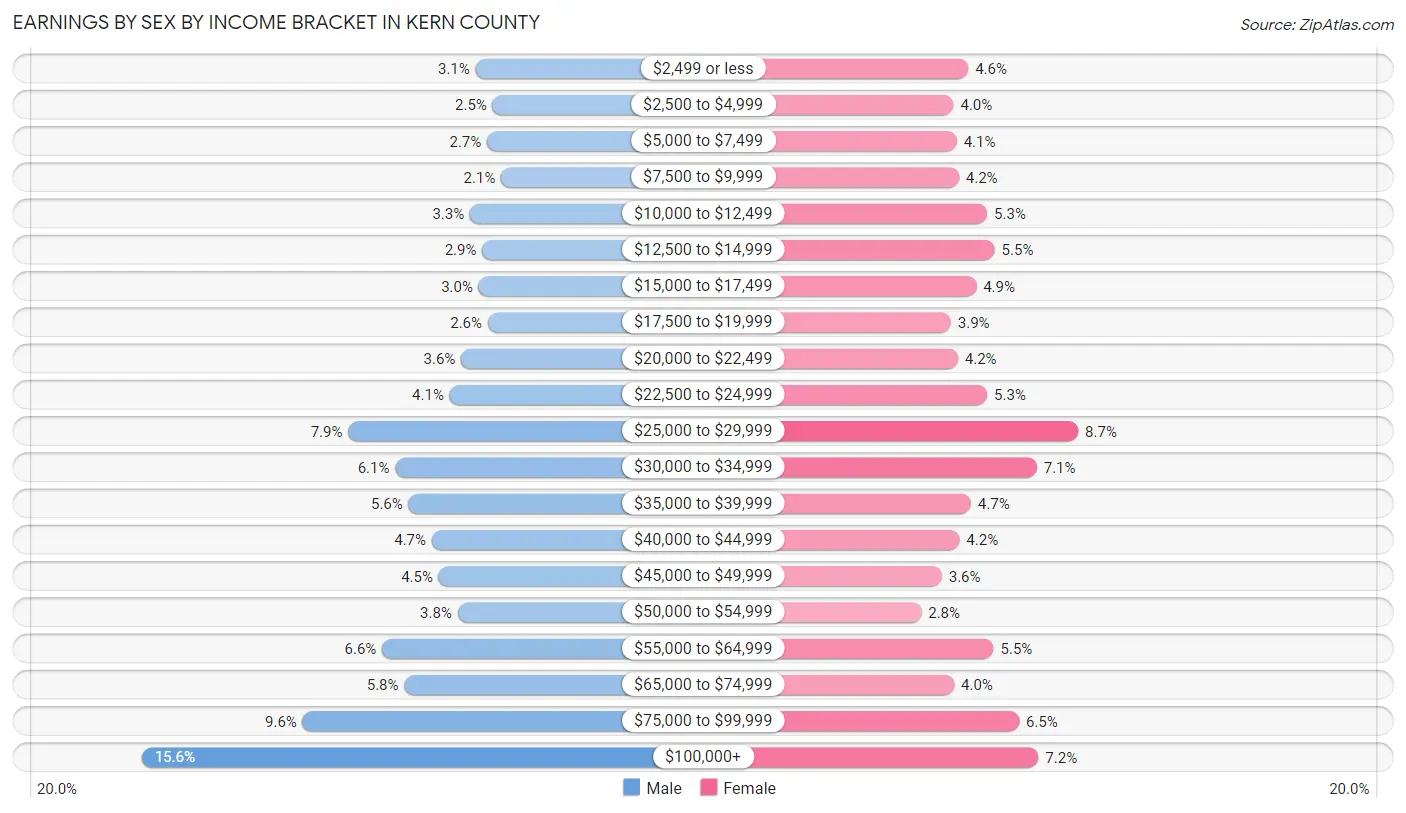
Earnings by Sex by Income Bracket in Kern County
The most common earnings brackets in Kern County are $100,000+ for men (34,892 | 15.6%) and $25,000 to $29,999 for women (15,345 | 8.7%).
| Income | Male | Female |
| $2,499 or less | 6,924 (3.1%) | 8,052 (4.5%) |
| $2,500 to $4,999 | 5,507 (2.5%) | 7,082 (4.0%) |
| $5,000 to $7,499 | 5,971 (2.7%) | 7,286 (4.1%) |
| $7,500 to $9,999 | 4,788 (2.1%) | 7,434 (4.2%) |
| $10,000 to $12,499 | 7,400 (3.3%) | 9,318 (5.3%) |
| $12,500 to $14,999 | 6,370 (2.9%) | 9,812 (5.5%) |
| $15,000 to $17,499 | 6,665 (3.0%) | 8,590 (4.9%) |
| $17,500 to $19,999 | 5,894 (2.6%) | 6,904 (3.9%) |
| $20,000 to $22,499 | 8,131 (3.6%) | 7,366 (4.2%) |
| $22,500 to $24,999 | 9,103 (4.1%) | 9,313 (5.3%) |
| $25,000 to $29,999 | 17,599 (7.9%) | 15,345 (8.7%) |
| $30,000 to $34,999 | 13,661 (6.1%) | 12,608 (7.1%) |
| $35,000 to $39,999 | 12,544 (5.6%) | 8,232 (4.6%) |
| $40,000 to $44,999 | 10,607 (4.7%) | 7,469 (4.2%) |
| $45,000 to $49,999 | 10,013 (4.5%) | 6,297 (3.6%) |
| $50,000 to $54,999 | 8,425 (3.8%) | 4,945 (2.8%) |
| $55,000 to $64,999 | 14,745 (6.6%) | 9,738 (5.5%) |
| $65,000 to $74,999 | 12,910 (5.8%) | 7,124 (4.0%) |
| $75,000 to $99,999 | 21,425 (9.6%) | 11,428 (6.5%) |
| $100,000+ | 34,892 (15.6%) | 12,711 (7.2%) |
| Total | 223,574 (100.0%) | 177,054 (100.0%) |
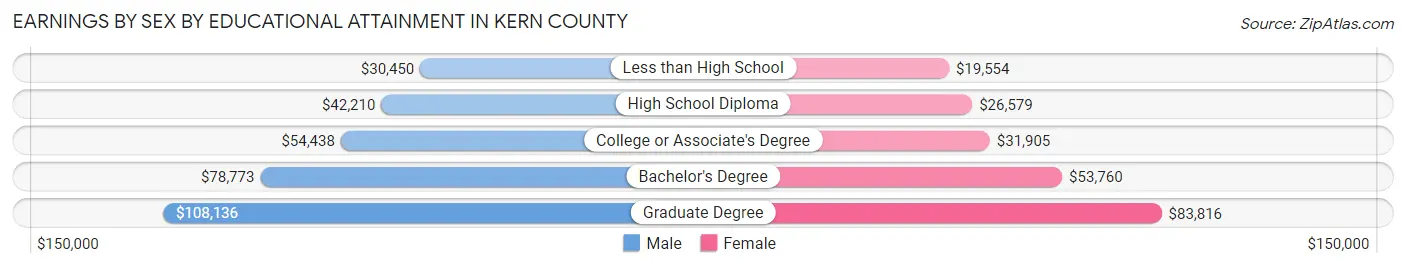
Earnings by Sex by Educational Attainment in Kern County
Average earnings in Kern County are $46,685 for men and $31,317 for women, a difference of 32.9%. Men with an educational attainment of graduate degree enjoy the highest average annual earnings of $108,136, while those with less than high school education earn the least with $30,450. Women with an educational attainment of graduate degree earn the most with the average annual earnings of $83,816, while those with less than high school education have the smallest earnings of $19,554.
| Educational Attainment | Male Income | Female Income |
| Less than High School | $30,450 | $19,554 |
| High School Diploma | $42,210 | $26,579 |
| College or Associate's Degree | $54,438 | $31,905 |
| Bachelor's Degree | $78,773 | $53,760 |
| Graduate Degree | $108,136 | $83,816 |
| Total | $46,685 | $31,317 |
Family Income in Kern County
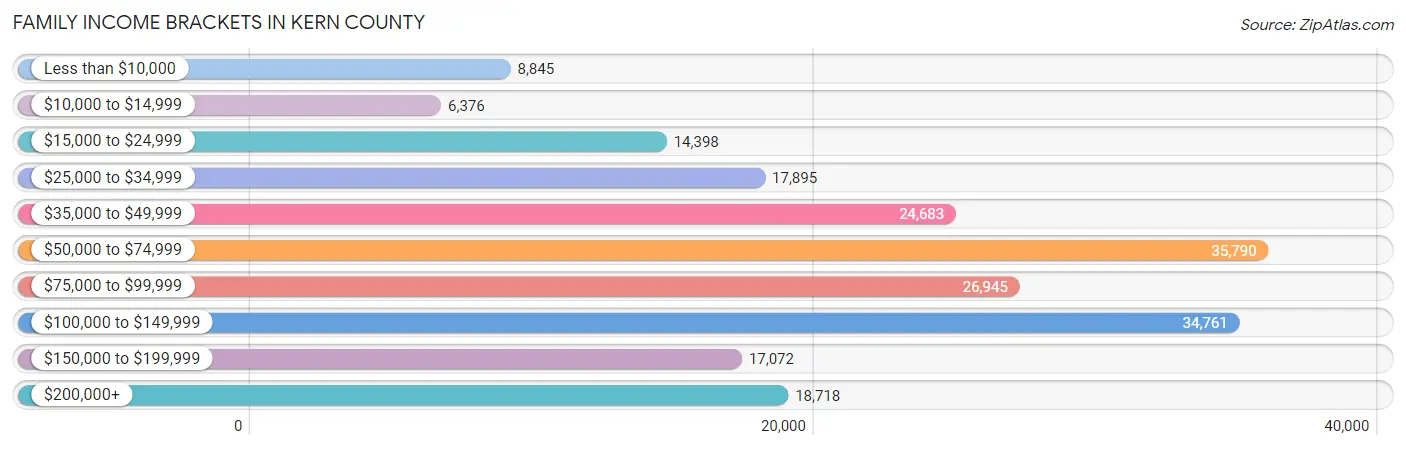
Family Income Brackets in Kern County
According to the Kern County family income data, there are 35,790 families falling into the $50,000 to $74,999 income range, which is the most common income bracket and makes up 17.4% of all families. Conversely, the $10,000 to $14,999 income bracket is the least frequent group with only 6,376 families (3.1%) belonging to this category.
| Income Bracket | # Families | % Families |
| Less than $10,000 | 8,845 | 4.3% |
| $10,000 to $14,999 | 6,376 | 3.1% |
| $15,000 to $24,999 | 14,398 | 7.0% |
| $25,000 to $34,999 | 17,895 | 8.7% |
| $35,000 to $49,999 | 24,683 | 12.0% |
| $50,000 to $74,999 | 35,790 | 17.4% |
| $75,000 to $99,999 | 26,945 | 13.1% |
| $100,000 to $149,999 | 34,761 | 16.9% |
| $150,000 to $199,999 | 17,072 | 8.3% |
| $200,000+ | 18,718 | 9.1% |
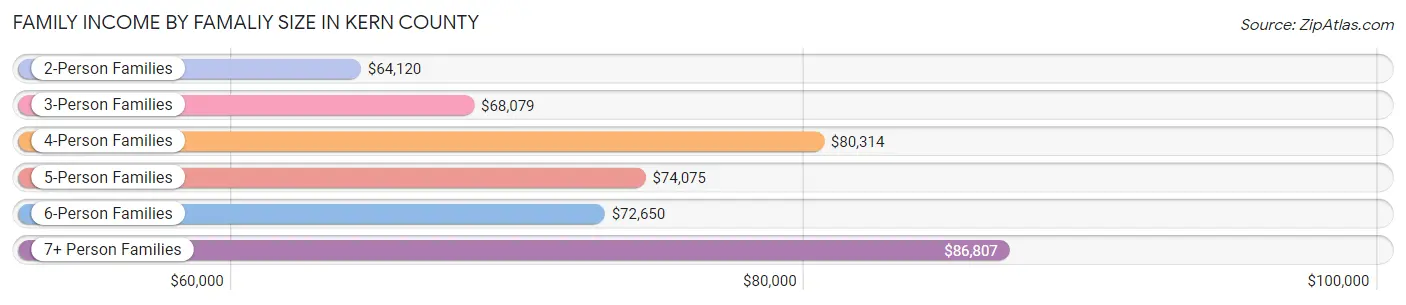
Family Income by Famaliy Size in Kern County
7+ person families (8,027 | 3.9%) account for the highest median family income in Kern County with $86,807 per family, while 2-person families (73,205 | 35.6%) have the highest median income of $32,060 per family member.
| Income Bracket | # Families | Median Income |
| 2-Person Families | 73,205 (35.6%) | $64,120 |
| 3-Person Families | 44,807 (21.8%) | $68,079 |
| 4-Person Families | 42,723 (20.8%) | $80,314 |
| 5-Person Families | 24,688 (12.0%) | $74,075 |
| 6-Person Families | 12,239 (5.9%) | $72,650 |
| 7+ Person Families | 8,027 (3.9%) | $86,807 |
| Total | 205,689 (100.0%) | $71,065 |
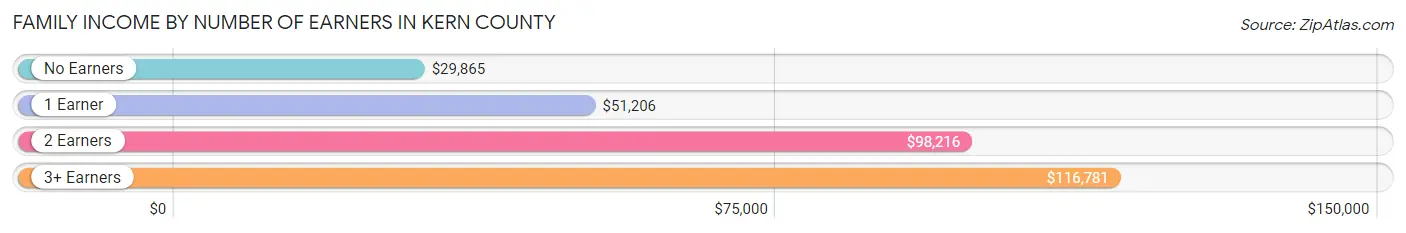
Family Income by Number of Earners in Kern County
The median family income in Kern County is $71,065, with families comprising 3+ earners (25,200) having the highest median family income of $116,781, while families with no earners (30,583) have the lowest median family income of $29,865, accounting for 12.2% and 14.9% of families, respectively.
| Number of Earners | # Families | Median Income |
| No Earners | 30,583 (14.9%) | $29,865 |
| 1 Earner | 76,288 (37.1%) | $51,206 |
| 2 Earners | 73,618 (35.8%) | $98,216 |
| 3+ Earners | 25,200 (12.2%) | $116,781 |
| Total | 205,689 (100.0%) | $71,065 |
Household Income in Kern County
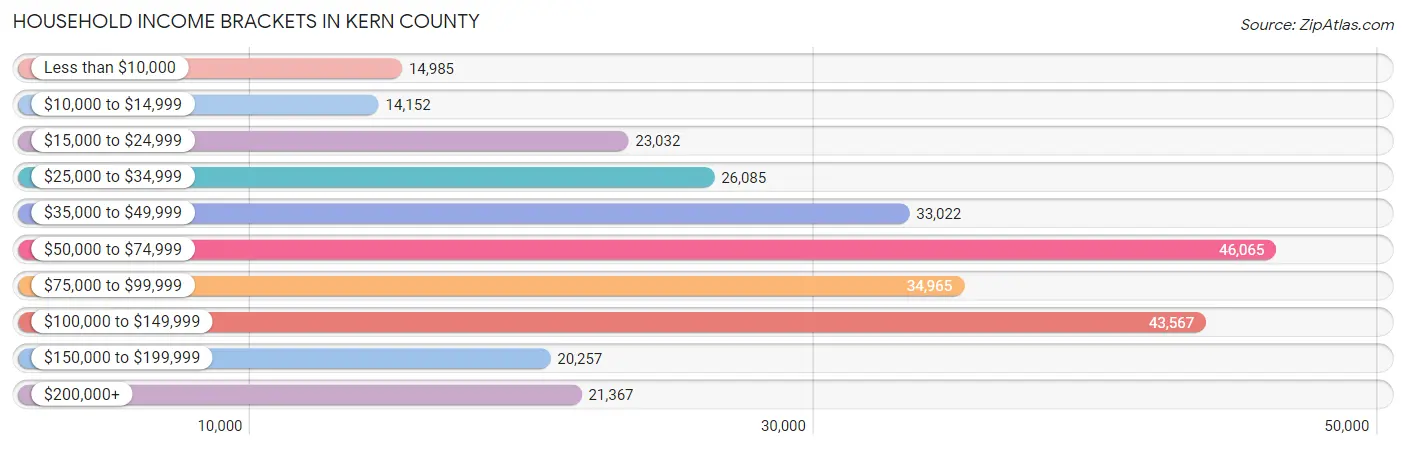
Household Income Brackets in Kern County
With 46,065 households falling in the category, the $50,000 to $74,999 income range is the most frequent in Kern County, accounting for 16.6% of all households. In contrast, only 14,152 households (5.1%) fall into the $10,000 to $14,999 income bracket, making it the least populous group.
| Income Bracket | # Households | % Households |
| Less than $10,000 | 14,985 | 5.4% |
| $10,000 to $14,999 | 14,152 | 5.1% |
| $15,000 to $24,999 | 23,032 | 8.3% |
| $25,000 to $34,999 | 26,085 | 9.4% |
| $35,000 to $49,999 | 33,022 | 11.9% |
| $50,000 to $74,999 | 46,065 | 16.6% |
| $75,000 to $99,999 | 34,965 | 12.6% |
| $100,000 to $149,999 | 43,567 | 15.7% |
| $150,000 to $199,999 | 20,257 | 7.3% |
| $200,000+ | 21,367 | 7.7% |
Household Income by Householder Age in Kern County
The median household income in Kern County is $63,883, with the highest median household income of $73,922 found in the 45 to 64 years age bracket for the primary householder. A total of 100,389 households (36.2%) fall into this category. Meanwhile, the 15 to 24 years age bracket for the primary householder has the lowest median household income of $39,694, with 9,614 households (3.5%) in this group.
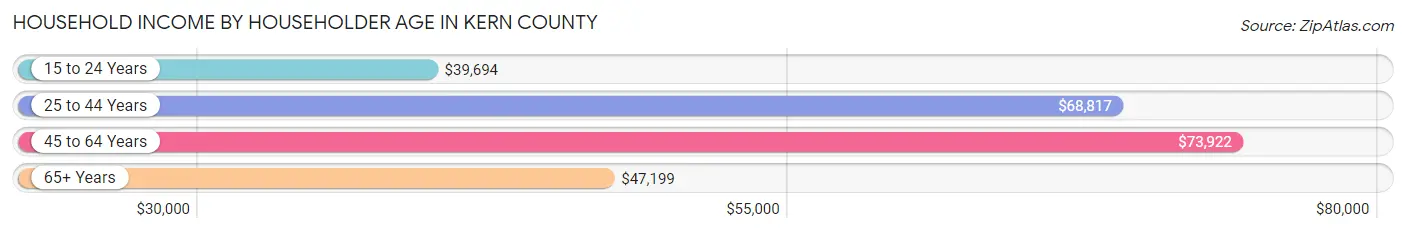
| Income Bracket | # Households | Median Income |
| 15 to 24 Years | 9,614 (3.5%) | $39,694 |
| 25 to 44 Years | 107,706 (38.8%) | $68,817 |
| 45 to 64 Years | 100,389 (36.2%) | $73,922 |
| 65+ Years | 59,790 (21.5%) | $47,199 |
| Total | 277,499 (100.0%) | $63,883 |
Poverty in Kern County
Income Below Poverty by Sex and Age in Kern County
With 17.4% poverty level for males and 21.2% for females among the residents of Kern County, 5 year old males and 5 year old females are the most vulnerable to poverty, with 1,941 males (31.5%) and 2,032 females (27.8%) in their respective age groups living below the poverty level.
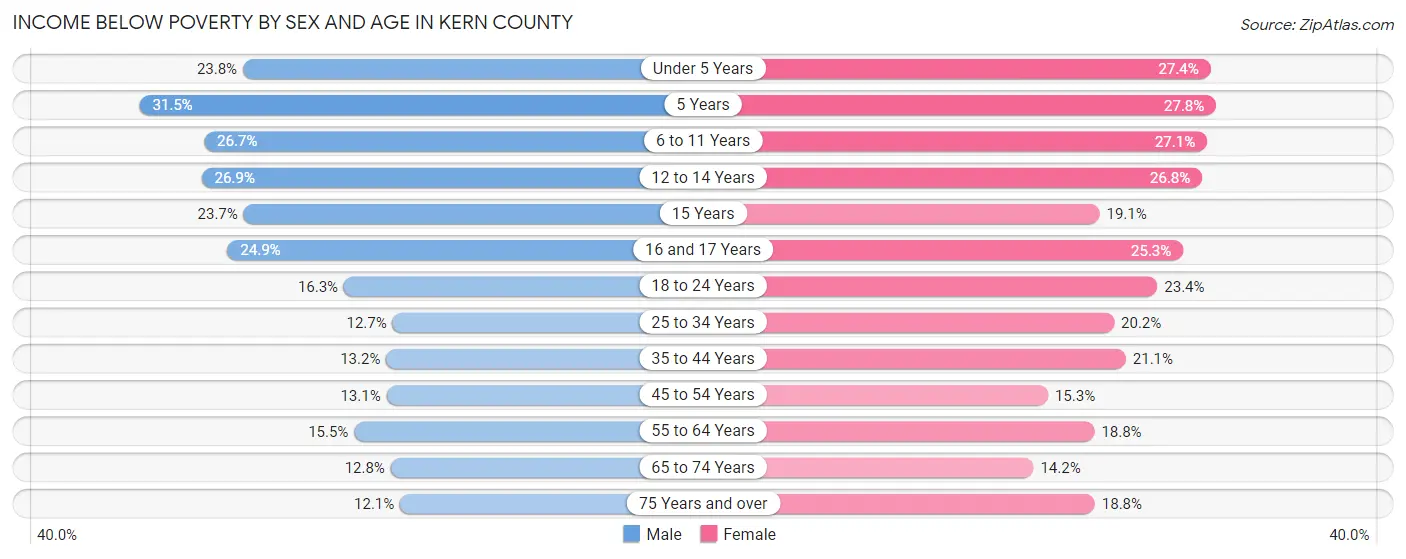
| Age Bracket | Male | Female |
| Under 5 Years | 7,898 (23.8%) | 8,663 (27.4%) |
| 5 Years | 1,941 (31.5%) | 2,032 (27.8%) |
| 6 to 11 Years | 11,884 (26.7%) | 11,974 (27.1%) |
| 12 to 14 Years | 6,691 (26.9%) | 5,725 (26.8%) |
| 15 Years | 1,919 (23.7%) | 1,437 (19.1%) |
| 16 and 17 Years | 3,560 (24.9%) | 3,573 (25.3%) |
| 18 to 24 Years | 7,552 (16.3%) | 10,168 (23.4%) |
| 25 to 34 Years | 8,416 (12.7%) | 13,054 (20.2%) |
| 35 to 44 Years | 7,555 (13.2%) | 11,767 (21.1%) |
| 45 to 54 Years | 6,273 (13.1%) | 7,422 (15.3%) |
| 55 to 64 Years | 7,125 (15.5%) | 8,787 (18.8%) |
| 65 to 74 Years | 3,854 (12.8%) | 4,595 (14.2%) |
| 75 Years and over | 2,026 (12.1%) | 4,122 (18.8%) |
| Total | 76,694 (17.4%) | 93,319 (21.2%) |
Income Above Poverty by Sex and Age in Kern County
According to the poverty statistics in Kern County, males aged 75 years and over and females aged 65 to 74 years are the age groups that are most secure financially, with 87.9% of males and 85.8% of females in these age groups living above the poverty line.
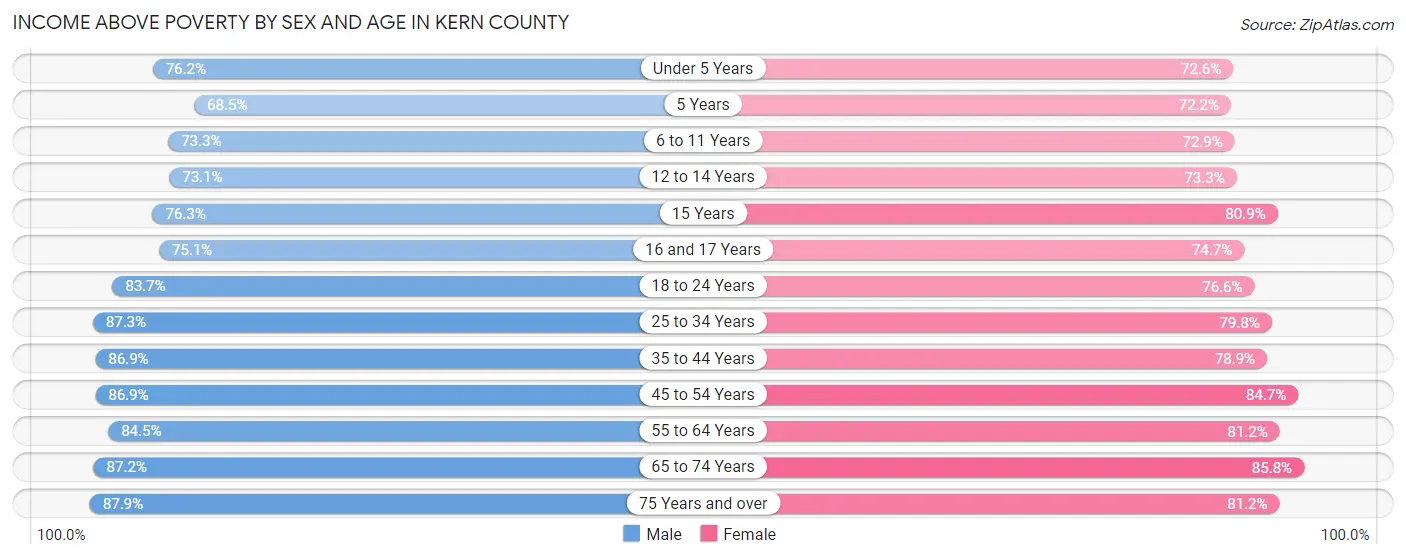
| Age Bracket | Male | Female |
| Under 5 Years | 25,304 (76.2%) | 22,972 (72.6%) |
| 5 Years | 4,226 (68.5%) | 5,280 (72.2%) |
| 6 to 11 Years | 32,669 (73.3%) | 32,190 (72.9%) |
| 12 to 14 Years | 18,222 (73.1%) | 15,677 (73.3%) |
| 15 Years | 6,165 (76.3%) | 6,072 (80.9%) |
| 16 and 17 Years | 10,716 (75.1%) | 10,529 (74.7%) |
| 18 to 24 Years | 38,814 (83.7%) | 33,221 (76.6%) |
| 25 to 34 Years | 57,933 (87.3%) | 51,506 (79.8%) |
| 35 to 44 Years | 49,889 (86.9%) | 44,039 (78.9%) |
| 45 to 54 Years | 41,506 (86.9%) | 41,064 (84.7%) |
| 55 to 64 Years | 38,740 (84.5%) | 38,056 (81.2%) |
| 65 to 74 Years | 26,220 (87.2%) | 27,686 (85.8%) |
| 75 Years and over | 14,690 (87.9%) | 17,818 (81.2%) |
| Total | 365,094 (82.6%) | 346,110 (78.8%) |
Income Below Poverty Among Married-Couple Families in Kern County
The poverty statistics for married-couple families in Kern County show that 8.8% or 12,168 of the total 138,902 families live below the poverty line. Families with 5 or more children have the highest poverty rate of 37.0%, comprising of 727 families. On the other hand, families with no children have the lowest poverty rate of 6.0%, which includes 3,982 families.
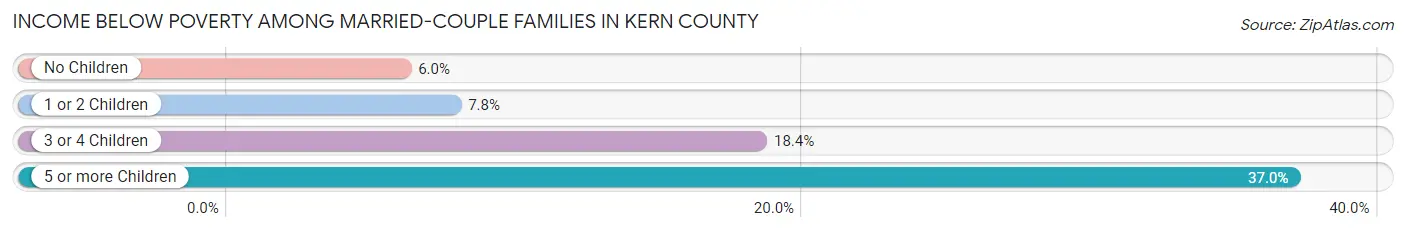
| Children | Above Poverty | Below Poverty |
| No Children | 62,072 (94.0%) | 3,982 (6.0%) |
| 1 or 2 Children | 48,449 (92.2%) | 4,079 (7.8%) |
| 3 or 4 Children | 14,974 (81.6%) | 3,380 (18.4%) |
| 5 or more Children | 1,239 (63.0%) | 727 (37.0%) |
| Total | 126,734 (91.2%) | 12,168 (8.8%) |
Income Below Poverty Among Single-Parent Households in Kern County
According to the poverty data in Kern County, 18.4% or 4,023 single-father households and 35.0% or 15,734 single-mother households are living below the poverty line. Among single-father households, those with 5 or more children have the highest poverty rate, with 257 households (62.1%) experiencing poverty. Likewise, among single-mother households, those with 5 or more children have the highest poverty rate, with 874 households (72.1%) falling below the poverty line.
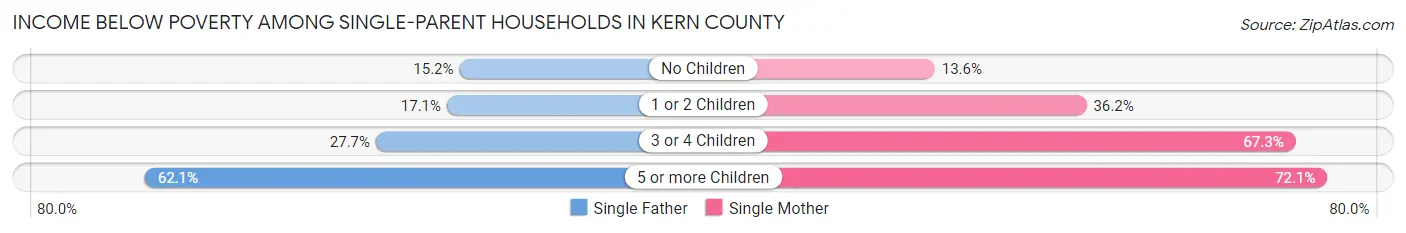
| Children | Single Father | Single Mother |
| No Children | 1,273 (15.2%) | 1,967 (13.6%) |
| 1 or 2 Children | 1,807 (17.1%) | 7,904 (36.2%) |
| 3 or 4 Children | 686 (27.7%) | 4,989 (67.3%) |
| 5 or more Children | 257 (62.1%) | 874 (72.1%) |
| Total | 4,023 (18.4%) | 15,734 (35.0%) |
Income Below Poverty Among Married-Couple vs Single-Parent Households in Kern County
The poverty data for Kern County shows that 12,168 of the married-couple family households (8.8%) and 19,757 of the single-parent households (29.6%) are living below the poverty level. Within the married-couple family households, those with 5 or more children have the highest poverty rate, with 727 households (37.0%) falling below the poverty line. Among the single-parent households, those with 5 or more children have the highest poverty rate, with 1,131 household (69.5%) living below poverty.
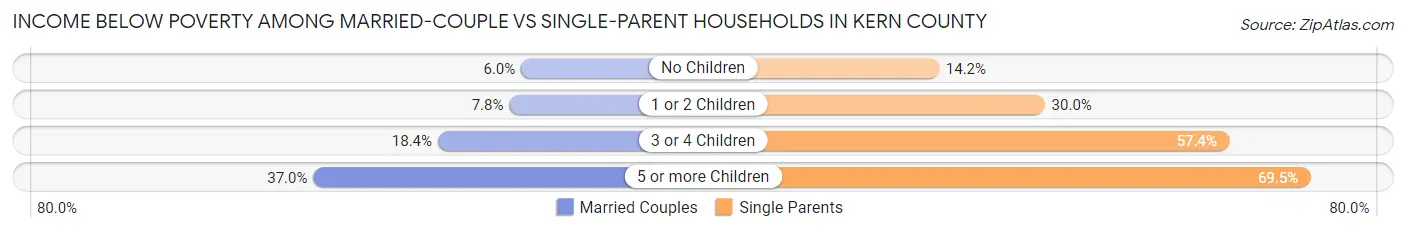
| Children | Married-Couple Families | Single-Parent Households |
| No Children | 3,982 (6.0%) | 3,240 (14.2%) |
| 1 or 2 Children | 4,079 (7.8%) | 9,711 (29.9%) |
| 3 or 4 Children | 3,380 (18.4%) | 5,675 (57.4%) |
| 5 or more Children | 727 (37.0%) | 1,131 (69.5%) |
| Total | 12,168 (8.8%) | 19,757 (29.6%) |
Race in Kern County
The most populous races in Kern County are White / Caucasian (509,039 | 56.1%), Hispanic or Latino (501,705 | 55.3%), and Two or more Races (154,003 | 17.0%).
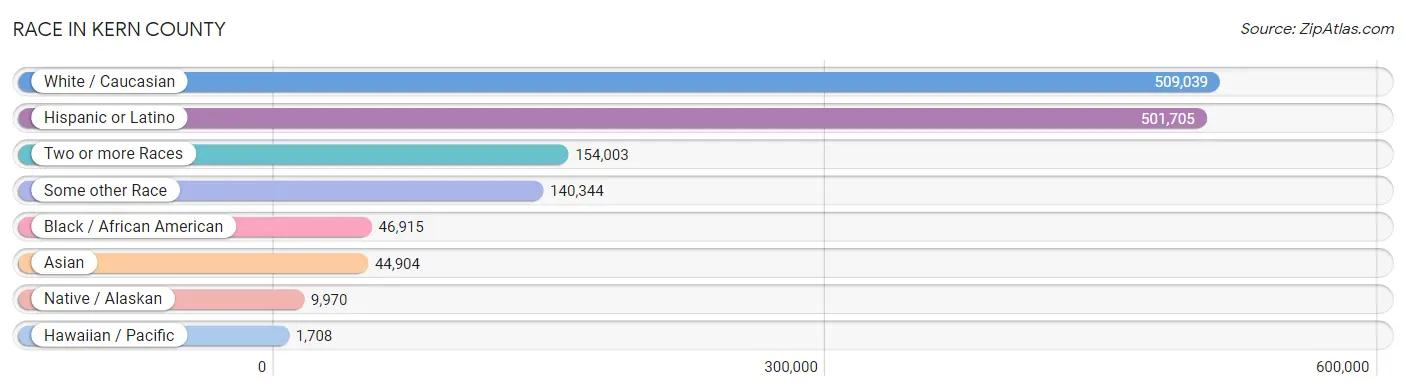
| Race | # Population | % Population |
| Asian | 44,904 | 5.0% |
| Black / African American | 46,915 | 5.2% |
| Hawaiian / Pacific | 1,708 | 0.2% |
| Hispanic or Latino | 501,705 | 55.3% |
| Native / Alaskan | 9,970 | 1.1% |
| White / Caucasian | 509,039 | 56.1% |
| Two or more Races | 154,003 | 17.0% |
| Some other Race | 140,344 | 15.5% |
| Total | 906,883 | 100.0% |
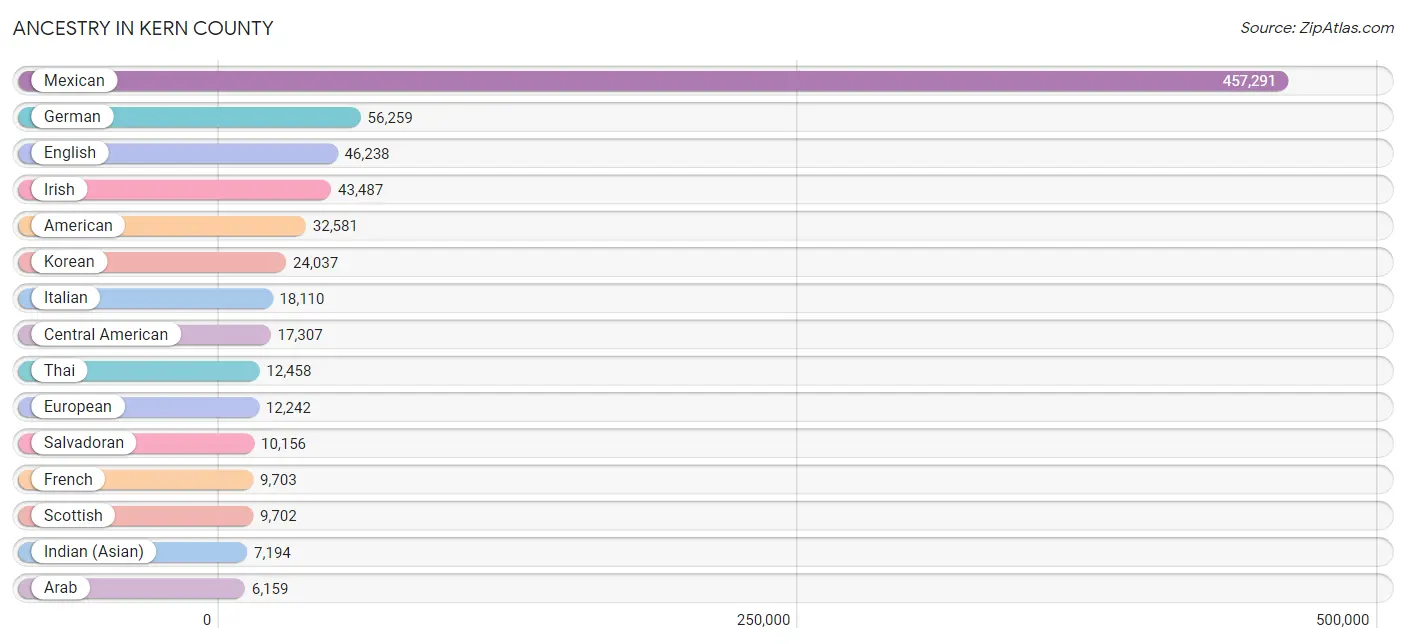
Ancestry in Kern County
The most populous ancestries reported in Kern County are Mexican (457,291 | 50.4%), German (56,259 | 6.2%), English (46,238 | 5.1%), Irish (43,487 | 4.8%), and American (32,581 | 3.6%), together accounting for 70.1% of all Kern County residents.
| Ancestry | # Population | % Population |
| Afghan | 366 | 0.0% |
| African | 1,705 | 0.2% |
| Alaska Native | 156 | 0.0% |
| Albanian | 113 | 0.0% |
| American | 32,581 | 3.6% |
| Apache | 685 | 0.1% |
| Arab | 6,159 | 0.7% |
| Argentinean | 423 | 0.1% |
| Armenian | 1,626 | 0.2% |
| Assyrian / Chaldean / Syriac | 54 | 0.0% |
| Australian | 104 | 0.0% |
| Austrian | 427 | 0.1% |
| Bahamian | 4 | 0.0% |
| Bangladeshi | 425 | 0.1% |
| Basque | 1,210 | 0.1% |
| Belgian | 181 | 0.0% |
| Belizean | 576 | 0.1% |
| Bhutanese | 2,458 | 0.3% |
| Blackfeet | 823 | 0.1% |
| Bolivian | 210 | 0.0% |
| Brazilian | 179 | 0.0% |
| British | 2,749 | 0.3% |
| Bulgarian | 55 | 0.0% |
| Burmese | 2,662 | 0.3% |
| Cajun | 173 | 0.0% |
| Cambodian | 66 | 0.0% |
| Canadian | 1,211 | 0.1% |
| Celtic | 78 | 0.0% |
| Central American | 17,307 | 1.9% |
| Central American Indian | 1,562 | 0.2% |
| Cherokee | 3,766 | 0.4% |
| Cheyenne | 53 | 0.0% |
| Chickasaw | 254 | 0.0% |
| Chilean | 71 | 0.0% |
| Chippewa | 86 | 0.0% |
| Choctaw | 1,511 | 0.2% |
| Colombian | 910 | 0.1% |
| Comanche | 162 | 0.0% |
| Costa Rican | 412 | 0.1% |
| Cree | 121 | 0.0% |
| Creek | 95 | 0.0% |
| Croatian | 455 | 0.1% |
| Crow | 23 | 0.0% |
| Cuban | 984 | 0.1% |
| Czech | 834 | 0.1% |
| Czechoslovakian | 515 | 0.1% |
| Danish | 2,048 | 0.2% |
| Delaware | 9 | 0.0% |
| Dominican | 252 | 0.0% |
| Dutch | 5,085 | 0.6% |
| Dutch West Indian | 52 | 0.0% |
| Eastern European | 611 | 0.1% |
| Ecuadorian | 215 | 0.0% |
| Egyptian | 1,471 | 0.2% |
| English | 46,238 | 5.1% |
| Estonian | 5 | 0.0% |
| Ethiopian | 114 | 0.0% |
| European | 12,242 | 1.3% |
| Filipino | 126 | 0.0% |
| Finnish | 653 | 0.1% |
| French | 9,703 | 1.1% |
| French American Indian | 81 | 0.0% |
| French Canadian | 1,281 | 0.1% |
| German | 56,259 | 6.2% |
| Ghanaian | 683 | 0.1% |
| Greek | 906 | 0.1% |
| Guamanian / Chamorro | 726 | 0.1% |
| Guatemalan | 4,103 | 0.4% |
| Guyanese | 7 | 0.0% |
| Haitian | 182 | 0.0% |
| Honduran | 1,977 | 0.2% |
| Hopi | 122 | 0.0% |
| Hungarian | 833 | 0.1% |
| Icelander | 79 | 0.0% |
| Indian (Asian) | 7,194 | 0.8% |
| Indonesian | 342 | 0.0% |
| Iranian | 402 | 0.0% |
| Irish | 43,487 | 4.8% |
| Iroquois | 95 | 0.0% |
| Israeli | 60 | 0.0% |
| Italian | 18,110 | 2.0% |
| Jamaican | 950 | 0.1% |
| Japanese | 1,099 | 0.1% |
| Jordanian | 340 | 0.0% |
| Kenyan | 8 | 0.0% |
| Kiowa | 39 | 0.0% |
| Korean | 24,037 | 2.6% |
| Laotian | 282 | 0.0% |
| Latvian | 231 | 0.0% |
| Lebanese | 427 | 0.1% |
| Lithuanian | 354 | 0.0% |
| Lumbee | 42 | 0.0% |
| Luxembourger | 24 | 0.0% |
| Macedonian | 9 | 0.0% |
| Malaysian | 428 | 0.1% |
| Maltese | 8 | 0.0% |
| Mexican | 457,291 | 50.4% |
| Mexican American Indian | 3,582 | 0.4% |
| Mongolian | 57 | 0.0% |
| Moroccan | 168 | 0.0% |
| Native Hawaiian | 2,265 | 0.3% |
| Navajo | 447 | 0.1% |
| Nepalese | 3 | 0.0% |
| New Zealander | 20 | 0.0% |
| Nicaraguan | 352 | 0.0% |
| Nigerian | 756 | 0.1% |
| Northern European | 1,264 | 0.1% |
| Norwegian | 4,445 | 0.5% |
| Osage | 86 | 0.0% |
| Paiute | 332 | 0.0% |
| Pakistani | 702 | 0.1% |
| Palestinian | 178 | 0.0% |
| Panamanian | 109 | 0.0% |
| Paraguayan | 17 | 0.0% |
| Pennsylvania German | 47 | 0.0% |
| Peruvian | 1,481 | 0.2% |
| Pima | 52 | 0.0% |
| Polish | 4,860 | 0.5% |
| Portuguese | 3,576 | 0.4% |
| Potawatomi | 111 | 0.0% |
| Pueblo | 89 | 0.0% |
| Puerto Rican | 6,054 | 0.7% |
| Puget Sound Salish | 11 | 0.0% |
| Romanian | 479 | 0.1% |
| Russian | 2,272 | 0.3% |
| Salvadoran | 10,156 | 1.1% |
| Samoan | 876 | 0.1% |
| Scandinavian | 1,977 | 0.2% |
| Scotch-Irish | 4,172 | 0.5% |
| Scottish | 9,702 | 1.1% |
| Seminole | 227 | 0.0% |
| Serbian | 71 | 0.0% |
| Shoshone | 12 | 0.0% |
| Sierra Leonean | 6 | 0.0% |
| Sioux | 271 | 0.0% |
| Slavic | 144 | 0.0% |
| Slovak | 174 | 0.0% |
| Slovene | 57 | 0.0% |
| South African | 228 | 0.0% |
| South American | 3,626 | 0.4% |
| South American Indian | 11 | 0.0% |
| Spaniard | 3,616 | 0.4% |
| Spanish | 2,694 | 0.3% |
| Spanish American | 152 | 0.0% |
| Spanish American Indian | 46 | 0.0% |
| Sri Lankan | 3,367 | 0.4% |
| Subsaharan African | 3,741 | 0.4% |
| Swedish | 4,697 | 0.5% |
| Swiss | 1,616 | 0.2% |
| Syrian | 646 | 0.1% |
| Thai | 12,458 | 1.4% |
| Tlingit-Haida | 80 | 0.0% |
| Tohono O'Odham | 150 | 0.0% |
| Tongan | 76 | 0.0% |
| Trinidadian and Tobagonian | 11 | 0.0% |
| Turkish | 1,306 | 0.1% |
| U.S. Virgin Islander | 124 | 0.0% |
| Ugandan | 254 | 0.0% |
| Ukrainian | 809 | 0.1% |
| Uruguayan | 17 | 0.0% |
| Venezuelan | 282 | 0.0% |
| Vietnamese | 246 | 0.0% |
| Welsh | 3,631 | 0.4% |
| West Indian | 56 | 0.0% |
| Yaqui | 708 | 0.1% |
| Yugoslavian | 285 | 0.0% |
| Yuman | 10 | 0.0% | View All 167 Rows |
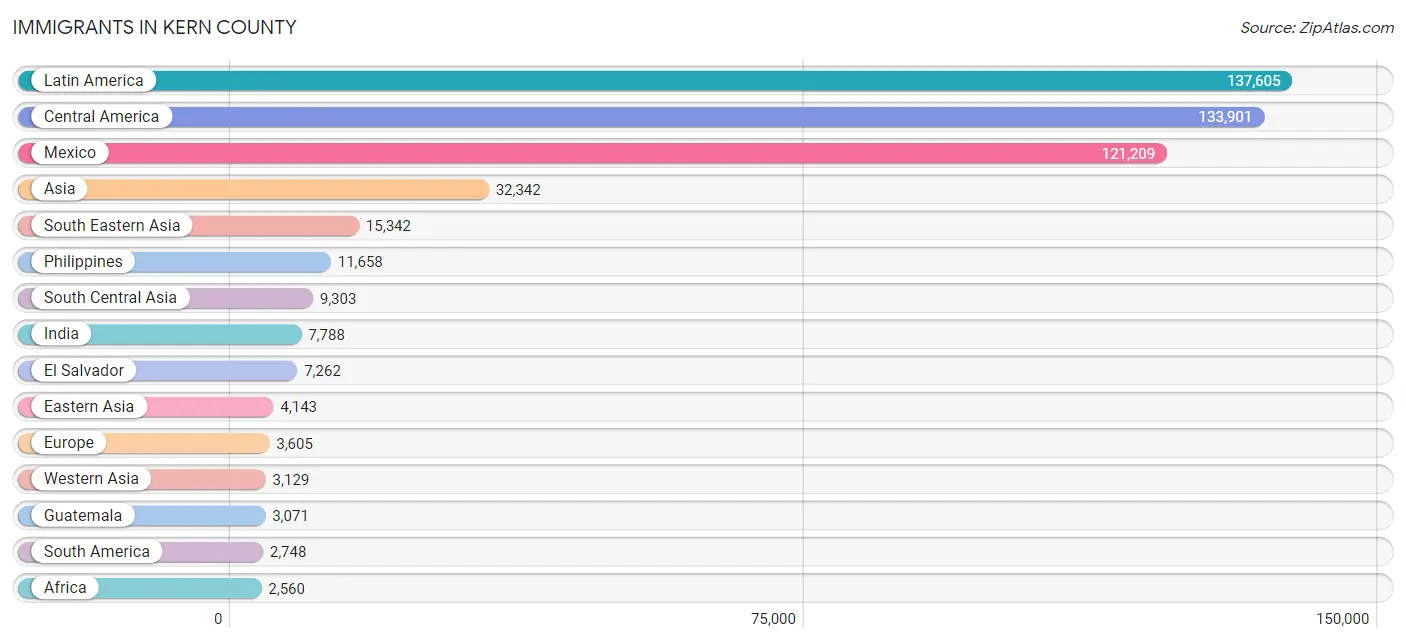
Immigrants in Kern County
The most numerous immigrant groups reported in Kern County came from Latin America (137,605 | 15.2%), Central America (133,901 | 14.8%), Mexico (121,209 | 13.4%), Asia (32,342 | 3.6%), and South Eastern Asia (15,342 | 1.7%), together accounting for 48.6% of all Kern County residents.
| Immigration Origin | # Population | % Population |
| Afghanistan | 206 | 0.0% |
| Africa | 2,560 | 0.3% |
| Argentina | 166 | 0.0% |
| Armenia | 80 | 0.0% |
| Asia | 32,342 | 3.6% |
| Australia | 201 | 0.0% |
| Austria | 7 | 0.0% |
| Azores | 30 | 0.0% |
| Bahamas | 4 | 0.0% |
| Bangladesh | 323 | 0.0% |
| Belarus | 35 | 0.0% |
| Belgium | 21 | 0.0% |
| Belize | 212 | 0.0% |
| Bolivia | 111 | 0.0% |
| Brazil | 224 | 0.0% |
| Bulgaria | 16 | 0.0% |
| Cambodia | 212 | 0.0% |
| Canada | 1,975 | 0.2% |
| Caribbean | 956 | 0.1% |
| Central America | 133,901 | 14.8% |
| Chile | 54 | 0.0% |
| China | 2,210 | 0.2% |
| Colombia | 557 | 0.1% |
| Costa Rica | 132 | 0.0% |
| Cuba | 289 | 0.0% |
| Czechoslovakia | 33 | 0.0% |
| Denmark | 18 | 0.0% |
| Dominican Republic | 27 | 0.0% |
| Eastern Africa | 667 | 0.1% |
| Eastern Asia | 4,143 | 0.5% |
| Eastern Europe | 1,173 | 0.1% |
| Ecuador | 114 | 0.0% |
| Egypt | 896 | 0.1% |
| El Salvador | 7,262 | 0.8% |
| England | 537 | 0.1% |
| Eritrea | 11 | 0.0% |
| Ethiopia | 93 | 0.0% |
| Europe | 3,605 | 0.4% |
| Fiji | 175 | 0.0% |
| France | 154 | 0.0% |
| Germany | 457 | 0.1% |
| Ghana | 202 | 0.0% |
| Greece | 90 | 0.0% |
| Guatemala | 3,071 | 0.3% |
| Guyana | 18 | 0.0% |
| Haiti | 101 | 0.0% |
| Honduras | 1,708 | 0.2% |
| Hong Kong | 368 | 0.0% |
| Hungary | 54 | 0.0% |
| India | 7,788 | 0.9% |
| Indonesia | 287 | 0.0% |
| Iran | 534 | 0.1% |
| Ireland | 59 | 0.0% |
| Israel | 97 | 0.0% |
| Italy | 147 | 0.0% |
| Jamaica | 425 | 0.1% |
| Japan | 424 | 0.1% |
| Jordan | 287 | 0.0% |
| Kenya | 111 | 0.0% |
| Korea | 1,462 | 0.2% |
| Kuwait | 78 | 0.0% |
| Laos | 211 | 0.0% |
| Latin America | 137,605 | 15.2% |
| Latvia | 6 | 0.0% |
| Lebanon | 120 | 0.0% |
| Liberia | 7 | 0.0% |
| Lithuania | 12 | 0.0% |
| Malaysia | 49 | 0.0% |
| Mexico | 121,209 | 13.4% |
| Moldova | 131 | 0.0% |
| Morocco | 51 | 0.0% |
| Nepal | 32 | 0.0% |
| Netherlands | 106 | 0.0% |
| Nicaragua | 266 | 0.0% |
| Nigeria | 418 | 0.1% |
| Northern Africa | 947 | 0.1% |
| Northern Europe | 901 | 0.1% |
| Oceania | 529 | 0.1% |
| Pakistan | 334 | 0.0% |
| Panama | 23 | 0.0% |
| Peru | 1,128 | 0.1% |
| Philippines | 11,658 | 1.3% |
| Poland | 59 | 0.0% |
| Portugal | 127 | 0.0% |
| Romania | 124 | 0.0% |
| Russia | 252 | 0.0% |
| Saudi Arabia | 51 | 0.0% |
| Scotland | 13 | 0.0% |
| Serbia | 51 | 0.0% |
| Sierra Leone | 40 | 0.0% |
| Singapore | 16 | 0.0% |
| South Africa | 224 | 0.0% |
| South America | 2,748 | 0.3% |
| South Central Asia | 9,303 | 1.0% |
| South Eastern Asia | 15,342 | 1.7% |
| Southern Europe | 780 | 0.1% |
| Spain | 416 | 0.1% |
| Sri Lanka | 59 | 0.0% |
| Sweden | 12 | 0.0% |
| Switzerland | 6 | 0.0% |
| Syria | 403 | 0.0% |
| Taiwan | 180 | 0.0% |
| Thailand | 598 | 0.1% |
| Trinidad and Tobago | 34 | 0.0% |
| Turkey | 763 | 0.1% |
| Uganda | 123 | 0.0% |
| Ukraine | 380 | 0.0% |
| Uruguay | 53 | 0.0% |
| Uzbekistan | 27 | 0.0% |
| Venezuela | 255 | 0.0% |
| Vietnam | 2,036 | 0.2% |
| Western Africa | 667 | 0.1% |
| Western Asia | 3,129 | 0.4% |
| Western Europe | 751 | 0.1% |
| Yemen | 1,137 | 0.1% |
| Zimbabwe | 11 | 0.0% | View All 116 Rows |
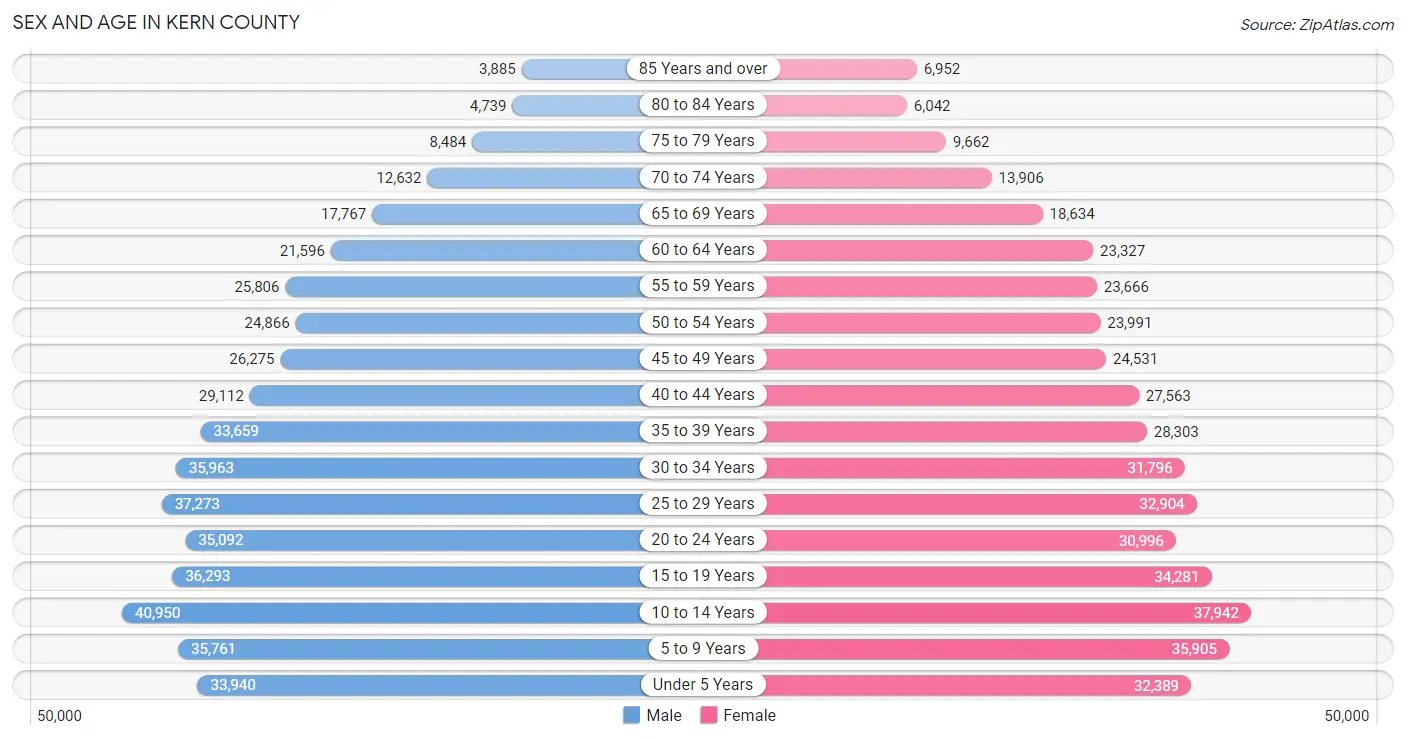
Sex and Age in Kern County
Sex and Age in Kern County
The most populous age groups in Kern County are 10 to 14 Years (40,950 | 8.8%) for men and 10 to 14 Years (37,942 | 8.6%) for women.
| Age Bracket | Male | Female |
| Under 5 Years | 33,940 (7.3%) | 32,389 (7.3%) |
| 5 to 9 Years | 35,761 (7.7%) | 35,905 (8.1%) |
| 10 to 14 Years | 40,950 (8.8%) | 37,942 (8.6%) |
| 15 to 19 Years | 36,293 (7.8%) | 34,281 (7.7%) |
| 20 to 24 Years | 35,092 (7.6%) | 30,996 (7.0%) |
| 25 to 29 Years | 37,273 (8.0%) | 32,904 (7.4%) |
| 30 to 34 Years | 35,963 (7.7%) | 31,796 (7.2%) |
| 35 to 39 Years | 33,659 (7.2%) | 28,303 (6.4%) |
| 40 to 44 Years | 29,112 (6.3%) | 27,563 (6.2%) |
| 45 to 49 Years | 26,275 (5.7%) | 24,531 (5.5%) |
| 50 to 54 Years | 24,866 (5.4%) | 23,991 (5.4%) |
| 55 to 59 Years | 25,806 (5.6%) | 23,666 (5.3%) |
| 60 to 64 Years | 21,596 (4.6%) | 23,327 (5.3%) |
| 65 to 69 Years | 17,767 (3.8%) | 18,634 (4.2%) |
| 70 to 74 Years | 12,632 (2.7%) | 13,906 (3.1%) |
| 75 to 79 Years | 8,484 (1.8%) | 9,662 (2.2%) |
| 80 to 84 Years | 4,739 (1.0%) | 6,042 (1.4%) |
| 85 Years and over | 3,885 (0.8%) | 6,952 (1.6%) |
| Total | 464,093 (100.0%) | 442,790 (100.0%) |
Families and Households in Kern County
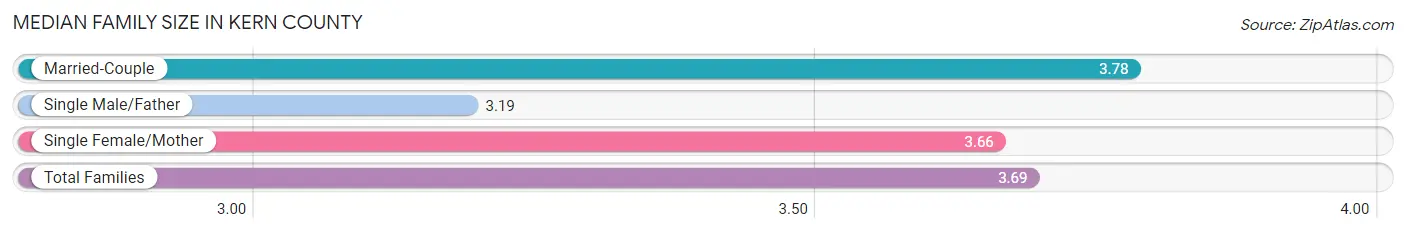
Median Family Size in Kern County
The median family size in Kern County is 3.69 persons per family, with married-couple families (138,902 | 67.5%) accounting for the largest median family size of 3.78 persons per family. On the other hand, single male/father families (21,835 | 10.6%) represent the smallest median family size with 3.19 persons per family.
| Family Type | # Families | Family Size |
| Married-Couple | 138,902 (67.5%) | 3.78 |
| Single Male/Father | 21,835 (10.6%) | 3.19 |
| Single Female/Mother | 44,952 (21.8%) | 3.66 |
| Total Families | 205,689 (100.0%) | 3.69 |
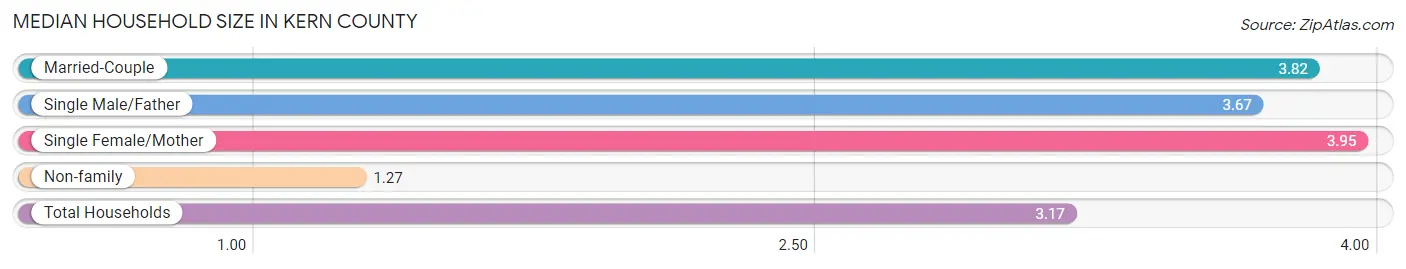
Median Household Size in Kern County
The median household size in Kern County is 3.17 persons per household, with single female/mother households (44,952 | 16.2%) accounting for the largest median household size of 3.95 persons per household. non-family households (71,810 | 25.9%) represent the smallest median household size with 1.27 persons per household.
| Household Type | # Households | Household Size |
| Married-Couple | 138,902 (50.0%) | 3.82 |
| Single Male/Father | 21,835 (7.9%) | 3.67 |
| Single Female/Mother | 44,952 (16.2%) | 3.95 |
| Non-family | 71,810 (25.9%) | 1.27 |
| Total Households | 277,499 (100.0%) | 3.17 |
Household Size by Marriage Status in Kern County
Out of a total of 277,499 households in Kern County, 205,689 (74.1%) are family households, while 71,810 (25.9%) are nonfamily households. The most numerous type of family households are 2-person households, comprising 66,099, and the most common type of nonfamily households are 1-person households, comprising 57,539.
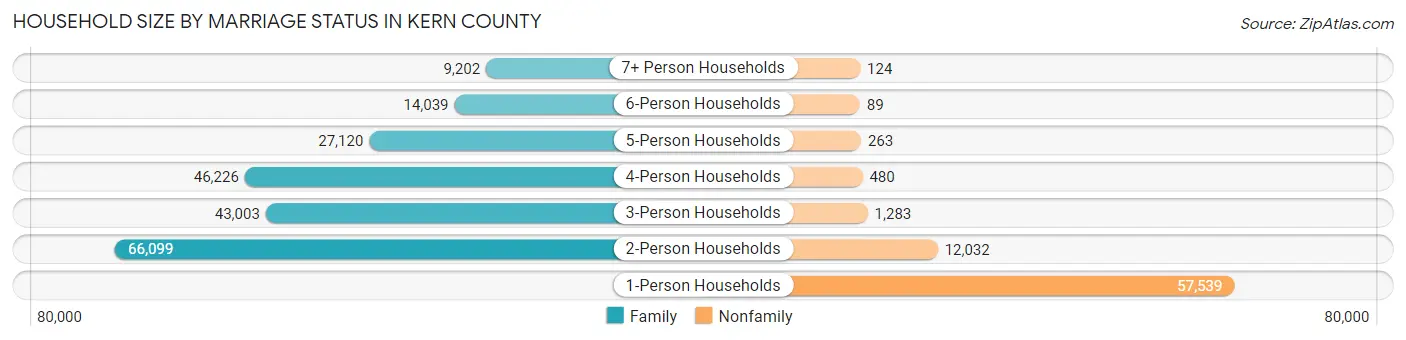
| Household Size | Family Households | Nonfamily Households |
| 1-Person Households | - | 57,539 (20.7%) |
| 2-Person Households | 66,099 (23.8%) | 12,032 (4.3%) |
| 3-Person Households | 43,003 (15.5%) | 1,283 (0.5%) |
| 4-Person Households | 46,226 (16.7%) | 480 (0.2%) |
| 5-Person Households | 27,120 (9.8%) | 263 (0.1%) |
| 6-Person Households | 14,039 (5.1%) | 89 (0.0%) |
| 7+ Person Households | 9,202 (3.3%) | 124 (0.0%) |
| Total | 205,689 (74.1%) | 71,810 (25.9%) |
Female Fertility in Kern County
Fertility by Age in Kern County
Average fertility rate in Kern County is 65.0 births per 1,000 women. Women in the age bracket of 20 to 34 years have the highest fertility rate with 115.0 births per 1,000 women. Women in the age bracket of 20 to 34 years acount for 78.3% of all women with births.
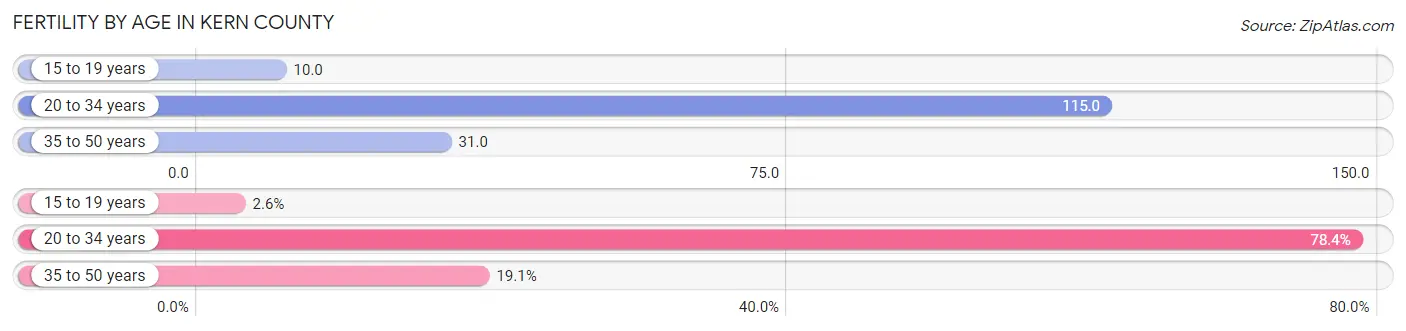
| Age Bracket | Women with Births | Births / 1,000 Women |
| 15 to 19 years | 357 (2.5%) | 10.0 |
| 20 to 34 years | 10,968 (78.3%) | 115.0 |
| 35 to 50 years | 2,673 (19.1%) | 31.0 |
| Total | 13,998 (100.0%) | 65.0 |
Fertility by Age by Marriage Status in Kern County
57.6% of women with births (13,998) in Kern County are married. The highest percentage of unmarried women with births falls into 15 to 19 years age bracket with 68.6% of them unmarried at the time of birth, while the lowest percentage of unmarried women with births belong to 35 to 50 years age bracket with 36.4% of them unmarried.
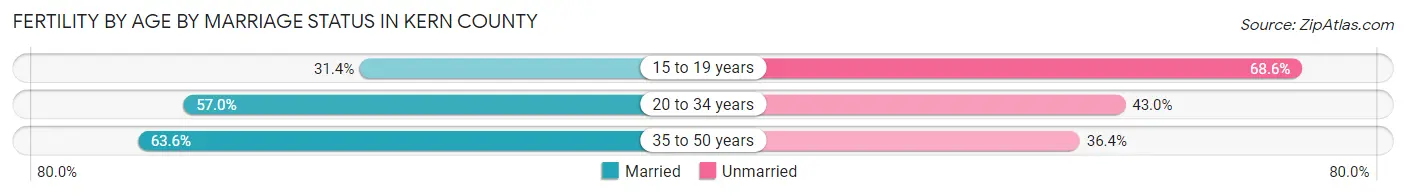
| Age Bracket | Married | Unmarried |
| 15 to 19 years | 112 (31.4%) | 245 (68.6%) |
| 20 to 34 years | 6,252 (57.0%) | 4,716 (43.0%) |
| 35 to 50 years | 1,700 (63.6%) | 973 (36.4%) |
| Total | 8,063 (57.6%) | 5,935 (42.4%) |
Fertility by Education in Kern County
Average fertility rate in Kern County is 65.0 births per 1,000 women. Women with the education attainment of bachelor's degree have the highest fertility rate of 83.0 births per 1,000 women, while women with the education attainment of less than high school have the lowest fertility at 45.0 births per 1,000 women. Women with the education attainment of college or associate's degree represent 35.8% of all women with births.
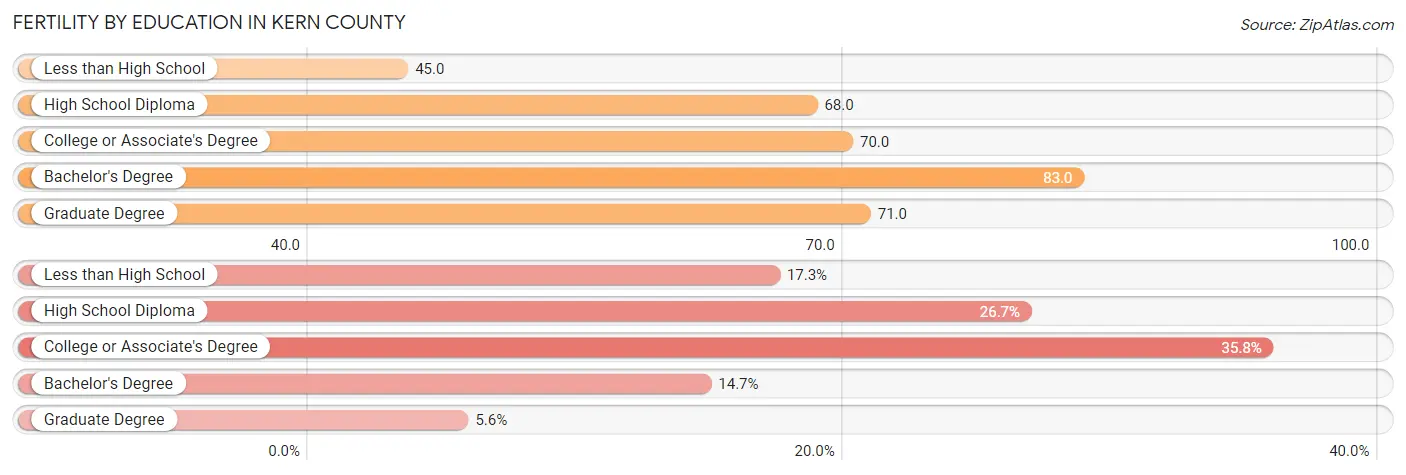
| Educational Attainment | Women with Births | Births / 1,000 Women |
| Less than High School | 2,416 (17.3%) | 45.0 |
| High School Diploma | 3,737 (26.7%) | 68.0 |
| College or Associate's Degree | 5,005 (35.8%) | 70.0 |
| Bachelor's Degree | 2,057 (14.7%) | 83.0 |
| Graduate Degree | 783 (5.6%) | 71.0 |
| Total | 13,998 (100.0%) | 65.0 |
Fertility by Education by Marriage Status in Kern County
42.4% of women with births in Kern County are unmarried. Women with the educational attainment of graduate degree are most likely to be married with 94.1% of them married at childbirth, while women with the educational attainment of less than high school are least likely to be married with 51.3% of them unmarried at childbirth.
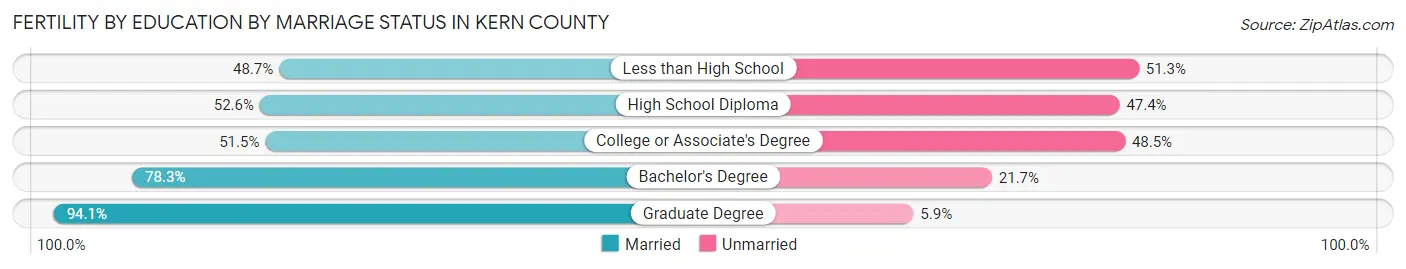
| Educational Attainment | Married | Unmarried |
| Less than High School | 1,177 (48.7%) | 1,239 (51.3%) |
| High School Diploma | 1,966 (52.6%) | 1,771 (47.4%) |
| College or Associate's Degree | 2,578 (51.5%) | 2,427 (48.5%) |
| Bachelor's Degree | 1,611 (78.3%) | 446 (21.7%) |
| Graduate Degree | 737 (94.1%) | 46 (5.9%) |
| Total | 8,063 (57.6%) | 5,935 (42.4%) |
Employment Characteristics in Kern County
Employment by Class of Employer in Kern County
Among the 351,806 employed individuals in Kern County, private company employees (238,072 | 67.7%), local government employees (34,382 | 9.8%), and self-employed (not incorporated) (21,890 | 6.2%) make up the most common classes of employment.
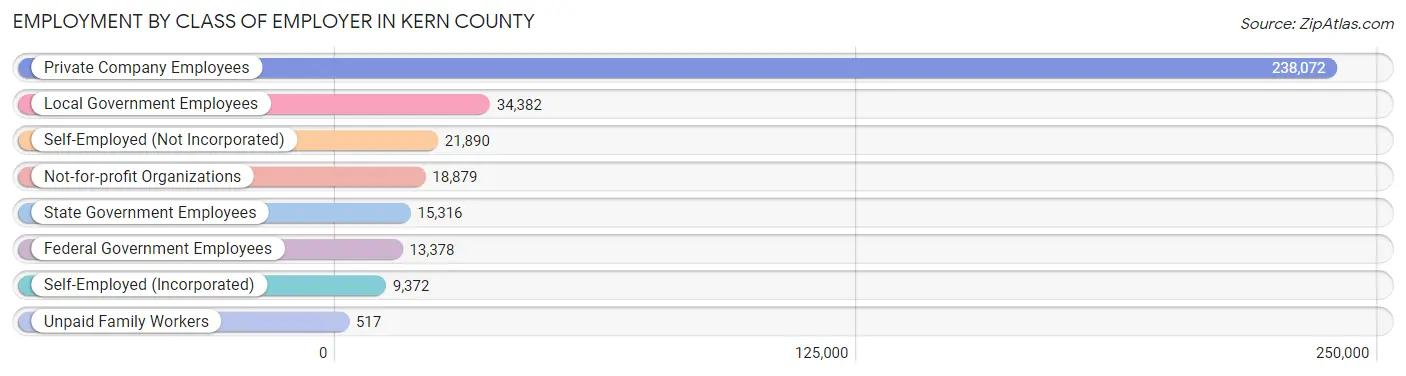
| Employer Class | # Employees | % Employees |
| Private Company Employees | 238,072 | 67.7% |
| Self-Employed (Incorporated) | 9,372 | 2.7% |
| Self-Employed (Not Incorporated) | 21,890 | 6.2% |
| Not-for-profit Organizations | 18,879 | 5.4% |
| Local Government Employees | 34,382 | 9.8% |
| State Government Employees | 15,316 | 4.3% |
| Federal Government Employees | 13,378 | 3.8% |
| Unpaid Family Workers | 517 | 0.2% |
| Total | 351,806 | 100.0% |
Employment Status by Age in Kern County
According to the labor force statistics for Kern County, out of the total population over 16 years of age (674,370), 58.5% or 394,506 individuals are in the labor force, with 8.4% or 33,139 of them unemployed. The age group with the highest labor force participation rate is 30 to 34 years, with 74.9% or 50,751 individuals in the labor force. Within the labor force, the 16 to 19 years age range has the highest percentage of unemployed individuals, with 24.2% or 3,617 of them being unemployed.
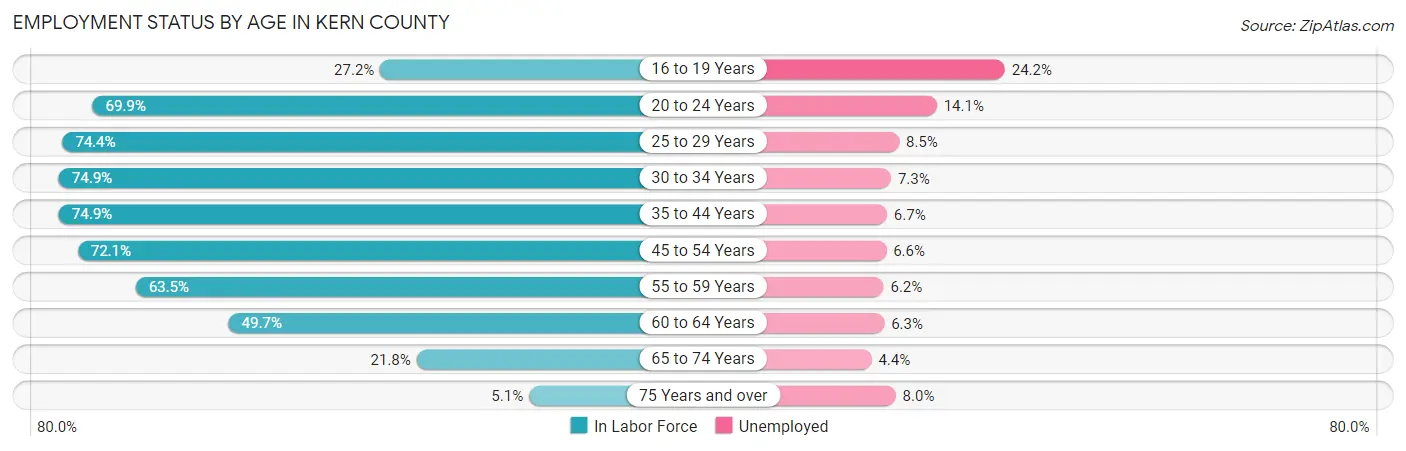
| Age Bracket | In Labor Force | Unemployed |
| 16 to 19 Years | 14,946 (27.2%) | 3,617 (24.2%) |
| 20 to 24 Years | 46,196 (69.9%) | 6,514 (14.1%) |
| 25 to 29 Years | 52,212 (74.4%) | 4,438 (8.5%) |
| 30 to 34 Years | 50,751 (74.9%) | 3,705 (7.3%) |
| 35 to 44 Years | 88,859 (74.9%) | 5,954 (6.7%) |
| 45 to 54 Years | 71,857 (72.1%) | 4,743 (6.6%) |
| 55 to 59 Years | 31,415 (63.5%) | 1,948 (6.2%) |
| 60 to 64 Years | 22,327 (49.7%) | 1,407 (6.3%) |
| 65 to 74 Years | 13,721 (21.8%) | 604 (4.4%) |
| 75 Years and over | 2,028 (5.1%) | 162 (8.0%) |
| Total | 394,506 (58.5%) | 33,139 (8.4%) |
Employment Status by Educational Attainment in Kern County
According to labor force statistics for Kern County, 70.4% of individuals (317,244) out of the total population between 25 and 64 years of age (450,631) are in the labor force, with 7.0% or 22,207 of them being unemployed. The group with the highest labor force participation rate are those with the educational attainment of bachelor's degree or higher, with 84.8% or 69,420 individuals in the labor force. Within the labor force, individuals with less than high school education have the highest percentage of unemployment, with 9.2% or 5,678 of them being unemployed.
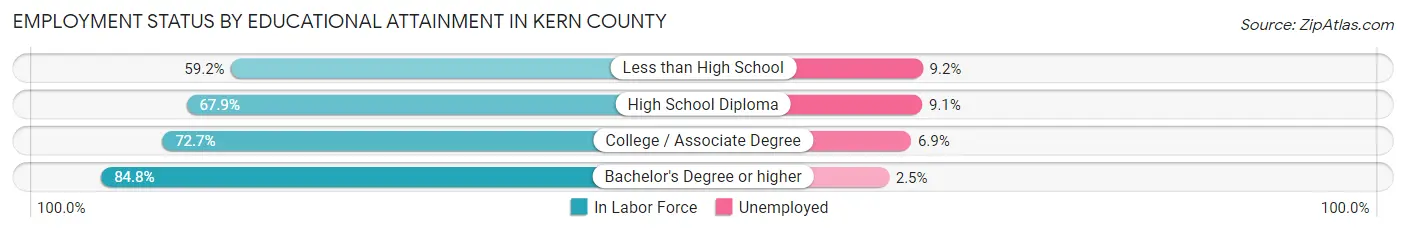
| Educational Attainment | In Labor Force | Unemployed |
| Less than High School | 61,722 (59.2%) | 9,592 (9.2%) |
| High School Diploma | 85,894 (67.9%) | 11,512 (9.1%) |
| College / Associate Degree | 100,331 (72.7%) | 9,522 (6.9%) |
| Bachelor's Degree or higher | 69,420 (84.8%) | 2,047 (2.5%) |
| Total | 317,244 (70.4%) | 31,544 (7.0%) |
Employment Occupations by Sex in Kern County
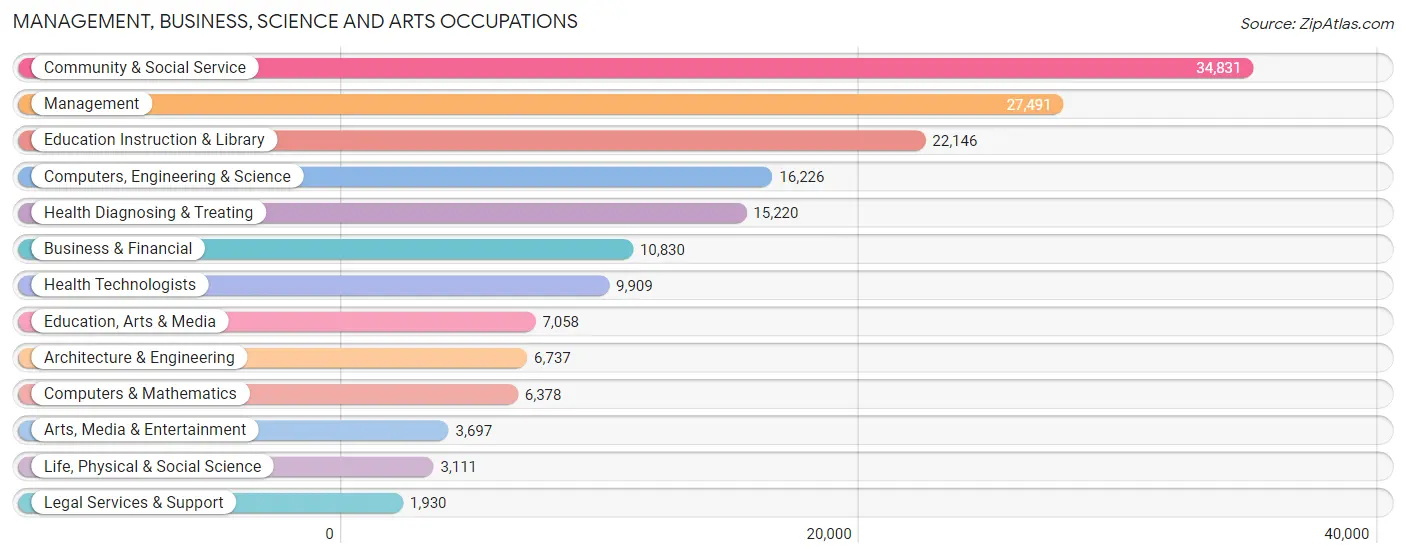
Management, Business, Science and Arts Occupations
The most common Management, Business, Science and Arts occupations in Kern County are Community & Social Service (34,831 | 9.7%), Management (27,491 | 7.7%), Education Instruction & Library (22,146 | 6.2%), Computers, Engineering & Science (16,226 | 4.5%), and Health Diagnosing & Treating (15,220 | 4.2%).
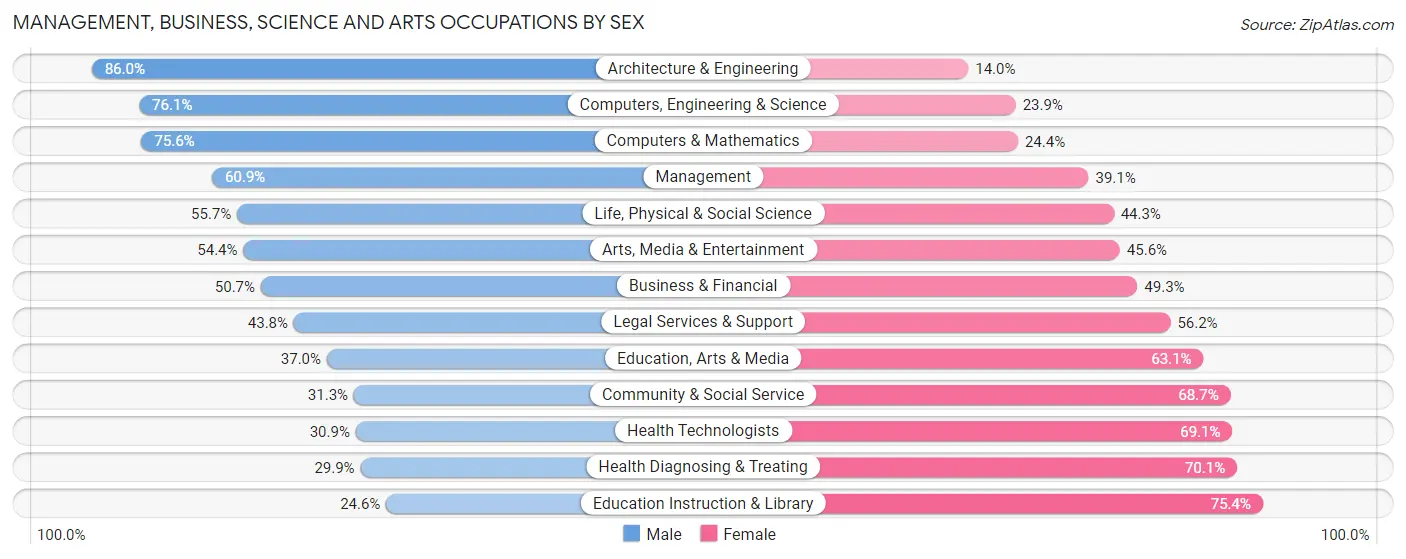
Management, Business, Science and Arts Occupations by Sex
Within the Management, Business, Science and Arts occupations in Kern County, the most male-oriented occupations are Architecture & Engineering (86.0%), Computers, Engineering & Science (76.1%), and Computers & Mathematics (75.6%), while the most female-oriented occupations are Education Instruction & Library (75.4%), Health Diagnosing & Treating (70.1%), and Health Technologists (69.1%).
| Occupation | Male | Female |
| Management | 16,746 (60.9%) | 10,745 (39.1%) |
| Business & Financial | 5,493 (50.7%) | 5,337 (49.3%) |
| Computers, Engineering & Science | 12,349 (76.1%) | 3,877 (23.9%) |
| Computers & Mathematics | 4,824 (75.6%) | 1,554 (24.4%) |
| Architecture & Engineering | 5,793 (86.0%) | 944 (14.0%) |
| Life, Physical & Social Science | 1,732 (55.7%) | 1,379 (44.3%) |
| Community & Social Service | 10,906 (31.3%) | 23,925 (68.7%) |
| Education, Arts & Media | 2,608 (36.9%) | 4,450 (63.0%) |
| Legal Services & Support | 846 (43.8%) | 1,084 (56.2%) |
| Education Instruction & Library | 5,442 (24.6%) | 16,704 (75.4%) |
| Arts, Media & Entertainment | 2,010 (54.4%) | 1,687 (45.6%) |
| Health Diagnosing & Treating | 4,557 (29.9%) | 10,663 (70.1%) |
| Health Technologists | 3,064 (30.9%) | 6,845 (69.1%) |
| Total (Category) | 50,051 (47.8%) | 54,547 (52.1%) |
| Total (Overall) | 199,901 (55.7%) | 159,060 (44.3%) |
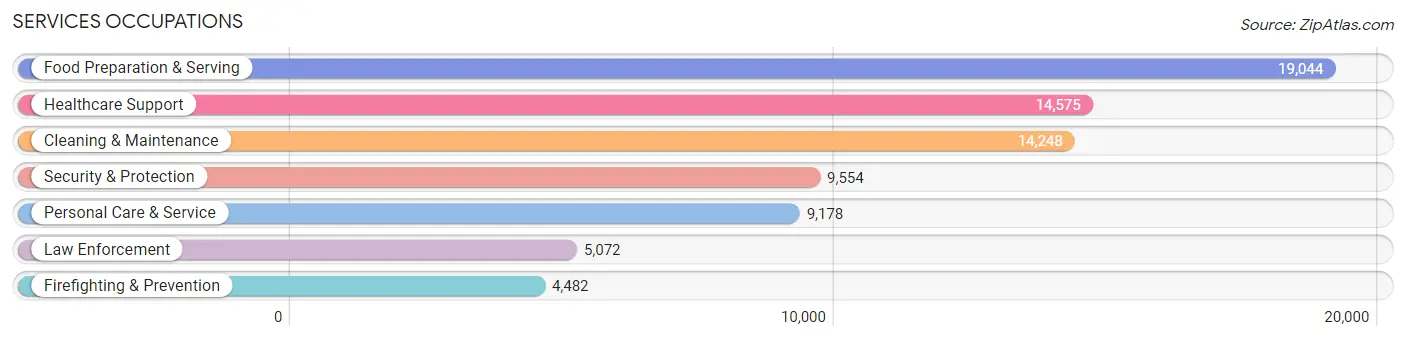
Services Occupations
The most common Services occupations in Kern County are Food Preparation & Serving (19,044 | 5.3%), Healthcare Support (14,575 | 4.1%), Cleaning & Maintenance (14,248 | 4.0%), Security & Protection (9,554 | 2.7%), and Personal Care & Service (9,178 | 2.6%).
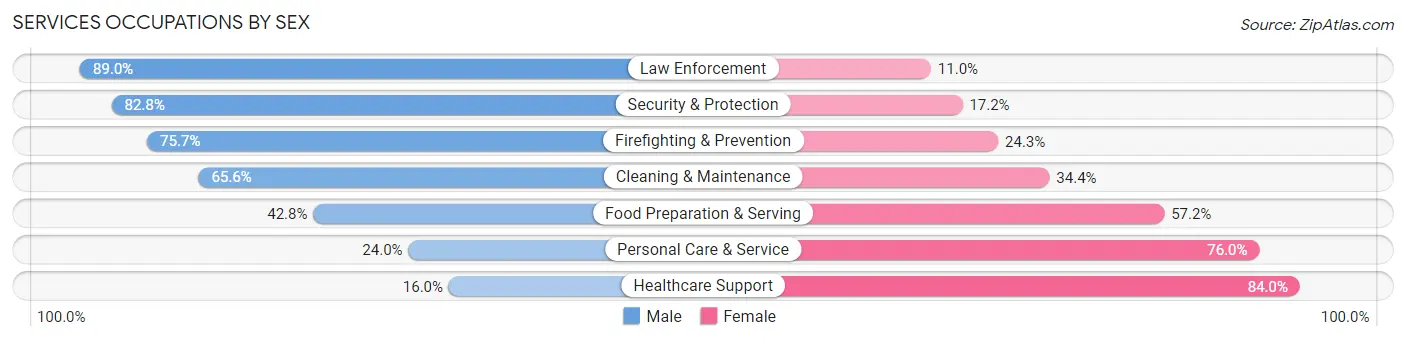
Services Occupations by Sex
Within the Services occupations in Kern County, the most male-oriented occupations are Law Enforcement (89.0%), Security & Protection (82.8%), and Firefighting & Prevention (75.7%), while the most female-oriented occupations are Healthcare Support (84.0%), Personal Care & Service (76.0%), and Food Preparation & Serving (57.2%).
| Occupation | Male | Female |
| Healthcare Support | 2,331 (16.0%) | 12,244 (84.0%) |
| Security & Protection | 7,910 (82.8%) | 1,644 (17.2%) |
| Firefighting & Prevention | 3,394 (75.7%) | 1,088 (24.3%) |
| Law Enforcement | 4,516 (89.0%) | 556 (11.0%) |
| Food Preparation & Serving | 8,158 (42.8%) | 10,886 (57.2%) |
| Cleaning & Maintenance | 9,342 (65.6%) | 4,906 (34.4%) |
| Personal Care & Service | 2,203 (24.0%) | 6,975 (76.0%) |
| Total (Category) | 29,944 (45.0%) | 36,655 (55.0%) |
| Total (Overall) | 199,901 (55.7%) | 159,060 (44.3%) |
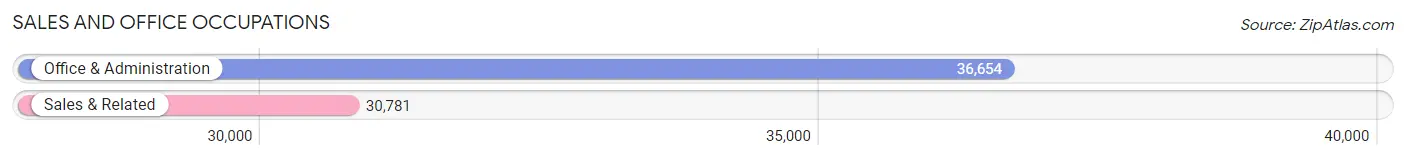
Sales and Office Occupations
The most common Sales and Office occupations in Kern County are Office & Administration (36,654 | 10.2%), and Sales & Related (30,781 | 8.6%).
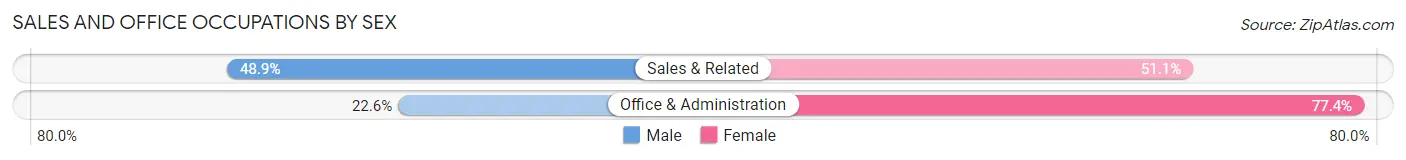
Sales and Office Occupations by Sex
| Occupation | Male | Female |
| Sales & Related | 15,040 (48.9%) | 15,741 (51.1%) |
| Office & Administration | 8,270 (22.6%) | 28,384 (77.4%) |
| Total (Category) | 23,310 (34.6%) | 44,125 (65.4%) |
| Total (Overall) | 199,901 (55.7%) | 159,060 (44.3%) |
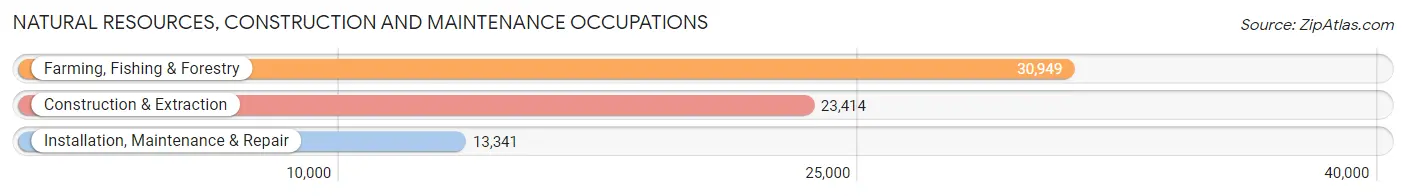
Natural Resources, Construction and Maintenance Occupations
The most common Natural Resources, Construction and Maintenance occupations in Kern County are Farming, Fishing & Forestry (30,949 | 8.6%), Construction & Extraction (23,414 | 6.5%), and Installation, Maintenance & Repair (13,341 | 3.7%).
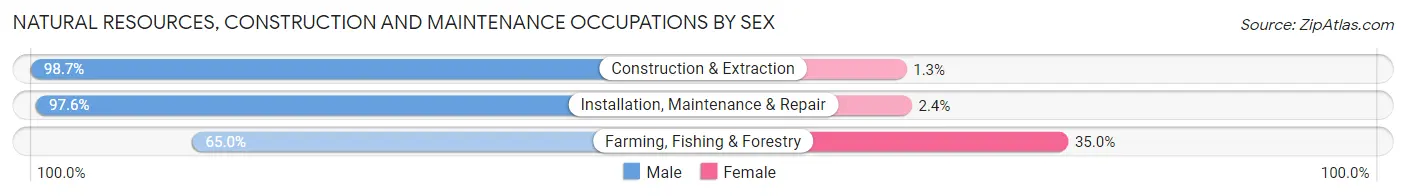
Natural Resources, Construction and Maintenance Occupations by Sex
| Occupation | Male | Female |
| Farming, Fishing & Forestry | 20,126 (65.0%) | 10,823 (35.0%) |
| Construction & Extraction | 23,104 (98.7%) | 310 (1.3%) |
| Installation, Maintenance & Repair | 13,020 (97.6%) | 321 (2.4%) |
| Total (Category) | 56,250 (83.1%) | 11,454 (16.9%) |
| Total (Overall) | 199,901 (55.7%) | 159,060 (44.3%) |
Production, Transportation and Moving Occupations
The most common Production, Transportation and Moving occupations in Kern County are Material Moving (19,822 | 5.5%), Transportation (16,792 | 4.7%), and Production (16,011 | 4.5%).
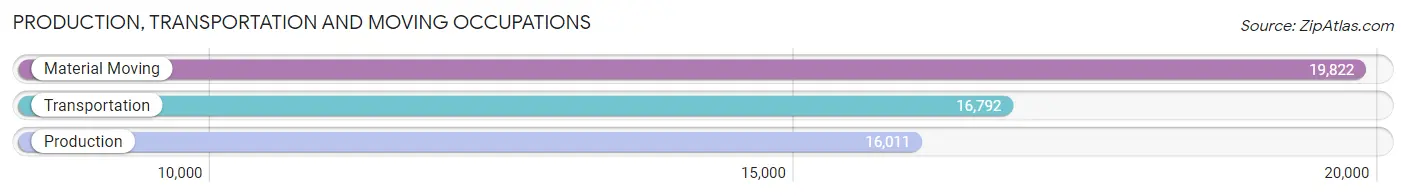
Production, Transportation and Moving Occupations by Sex
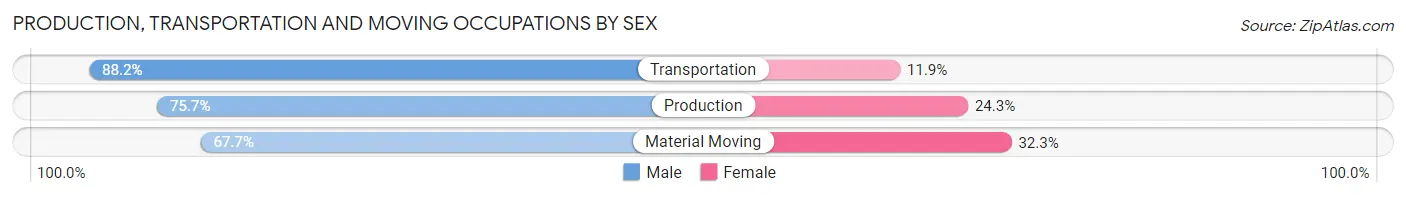
| Occupation | Male | Female |
| Production | 12,121 (75.7%) | 3,890 (24.3%) |
| Transportation | 14,802 (88.1%) | 1,990 (11.8%) |
| Material Moving | 13,423 (67.7%) | 6,399 (32.3%) |
| Total (Category) | 40,346 (76.7%) | 12,279 (23.3%) |
| Total (Overall) | 199,901 (55.7%) | 159,060 (44.3%) |
Employment Industries by Sex in Kern County
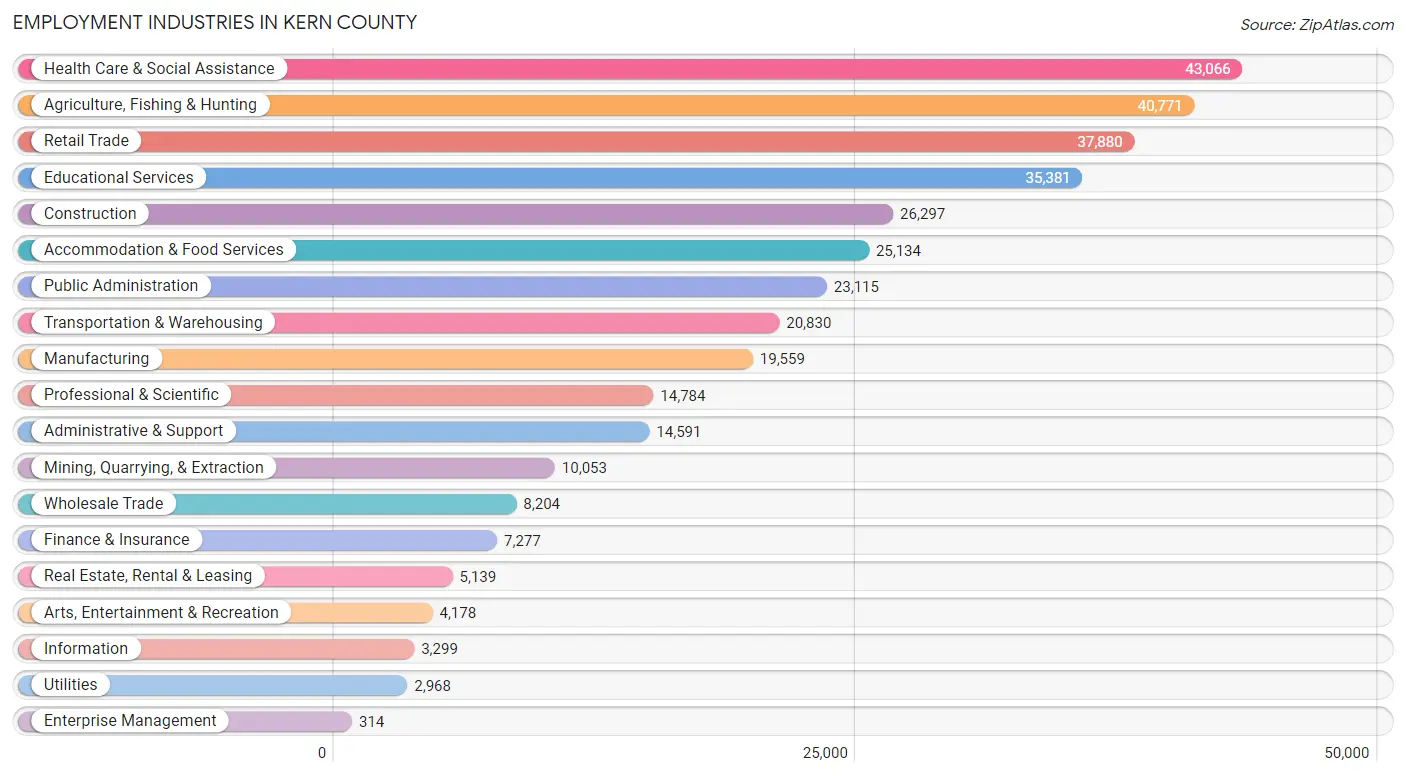
Employment Industries in Kern County
The major employment industries in Kern County include Health Care & Social Assistance (43,066 | 12.0%), Agriculture, Fishing & Hunting (40,771 | 11.4%), Retail Trade (37,880 | 10.5%), Educational Services (35,381 | 9.9%), and Construction (26,297 | 7.3%).
Employment Industries by Sex in Kern County
The Kern County industries that see more men than women are Construction (91.7%), Mining, Quarrying, & Extraction (89.8%), and Utilities (79.0%), whereas the industries that tend to have a higher number of women are Health Care & Social Assistance (76.1%), Enterprise Management (73.6%), and Educational Services (71.0%).
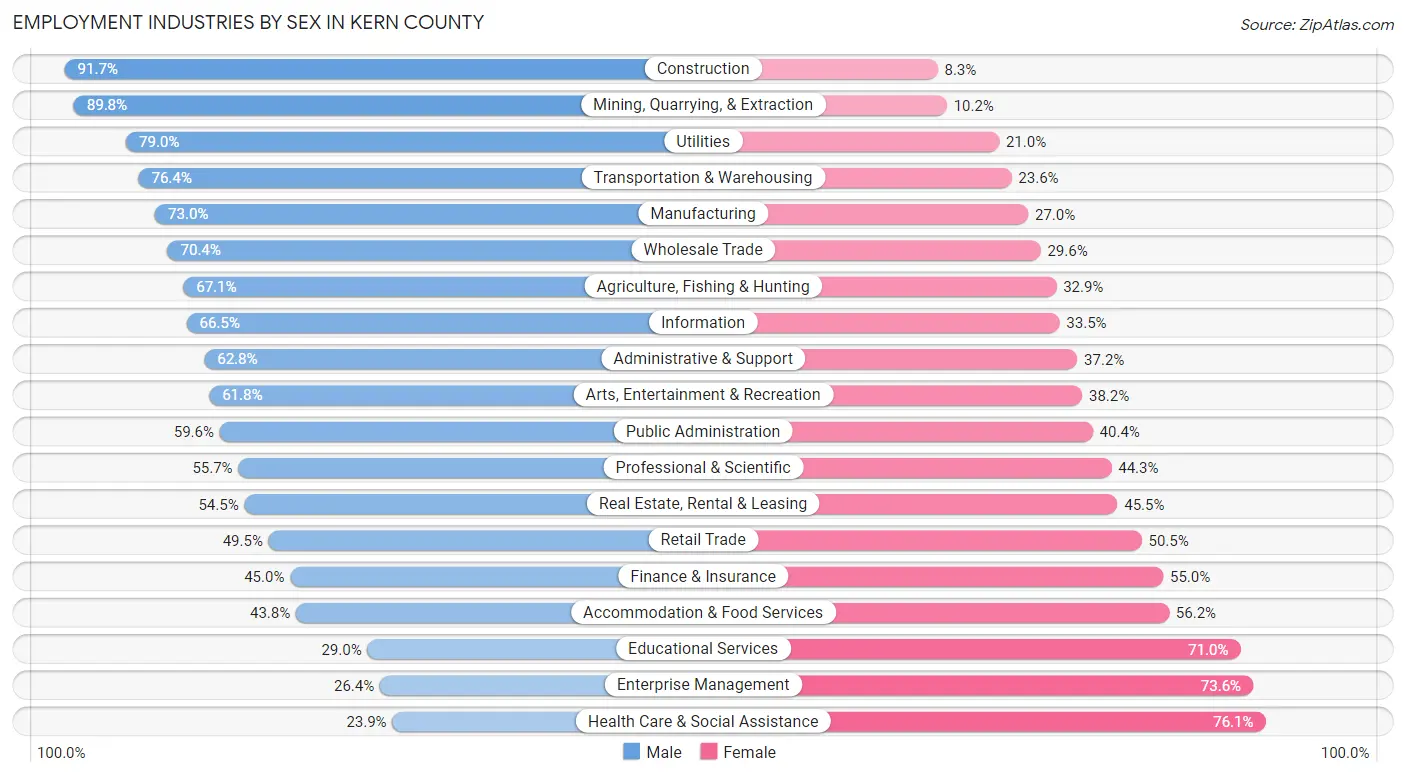
| Industry | Male | Female |
| Agriculture, Fishing & Hunting | 27,374 (67.1%) | 13,397 (32.9%) |
| Mining, Quarrying, & Extraction | 9,028 (89.8%) | 1,025 (10.2%) |
| Construction | 24,115 (91.7%) | 2,182 (8.3%) |
| Manufacturing | 14,273 (73.0%) | 5,286 (27.0%) |
| Wholesale Trade | 5,775 (70.4%) | 2,429 (29.6%) |
| Retail Trade | 18,738 (49.5%) | 19,142 (50.5%) |
| Transportation & Warehousing | 15,916 (76.4%) | 4,914 (23.6%) |
| Utilities | 2,344 (79.0%) | 624 (21.0%) |
| Information | 2,193 (66.5%) | 1,106 (33.5%) |
| Finance & Insurance | 3,276 (45.0%) | 4,001 (55.0%) |
| Real Estate, Rental & Leasing | 2,800 (54.5%) | 2,339 (45.5%) |
| Professional & Scientific | 8,240 (55.7%) | 6,544 (44.3%) |
| Enterprise Management | 83 (26.4%) | 231 (73.6%) |
| Administrative & Support | 9,163 (62.8%) | 5,428 (37.2%) |
| Educational Services | 10,272 (29.0%) | 25,109 (71.0%) |
| Health Care & Social Assistance | 10,274 (23.9%) | 32,792 (76.1%) |
| Arts, Entertainment & Recreation | 2,581 (61.8%) | 1,597 (38.2%) |
| Accommodation & Food Services | 11,010 (43.8%) | 14,124 (56.2%) |
| Public Administration | 13,775 (59.6%) | 9,340 (40.4%) |
| Total | 199,901 (55.7%) | 159,060 (44.3%) |
Education in Kern County
School Enrollment in Kern County
The most common levels of schooling among the 265,678 students in Kern County are high school (63,013 | 23.7%), middle school (61,173 | 23.0%), and elementary school (57,606 | 21.7%).
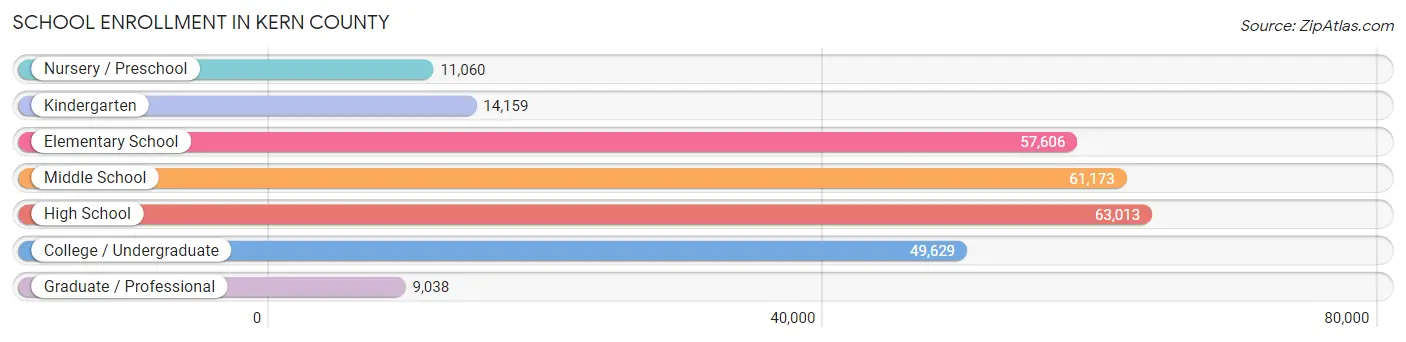
| School Level | # Students | % Students |
| Nursery / Preschool | 11,060 | 4.2% |
| Kindergarten | 14,159 | 5.3% |
| Elementary School | 57,606 | 21.7% |
| Middle School | 61,173 | 23.0% |
| High School | 63,013 | 23.7% |
| College / Undergraduate | 49,629 | 18.7% |
| Graduate / Professional | 9,038 | 3.4% |
| Total | 265,678 | 100.0% |
School Enrollment by Age by Funding Source in Kern County
Out of a total of 265,678 students who are enrolled in schools in Kern County, 25,771 (9.7%) attend a private institution, while the remaining 239,907 (90.3%) are enrolled in public schools. The age group of 35 years and over has the highest likelihood of being enrolled in private schools, with 4,101 (30.9% in the age bracket) enrolled. Conversely, the age group of 15 to 17 year olds has the lowest likelihood of being enrolled in a private school, with 40,388 (95.8% in the age bracket) attending a public institution.
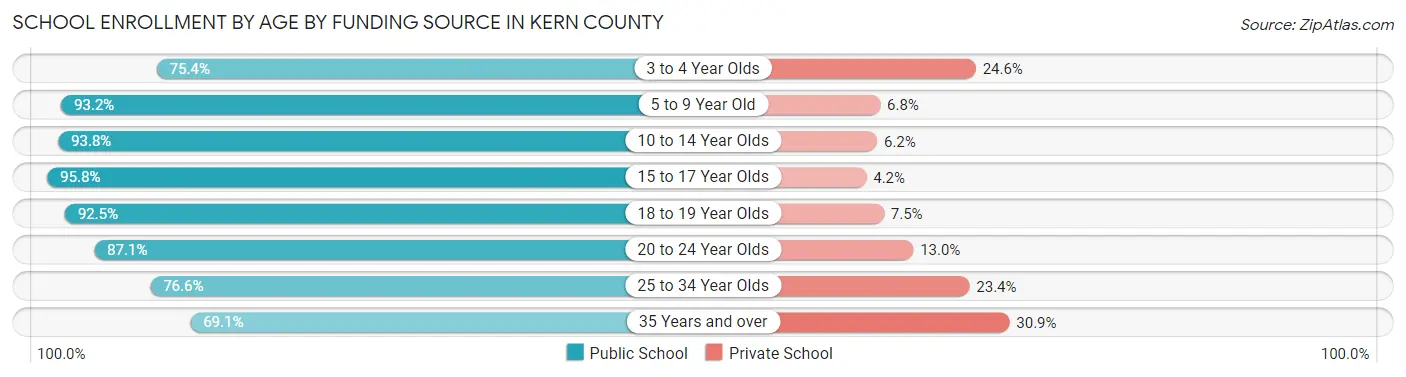
| Age Bracket | Public School | Private School |
| 3 to 4 Year Olds | 6,932 (75.4%) | 2,260 (24.6%) |
| 5 to 9 Year Old | 62,551 (93.2%) | 4,550 (6.8%) |
| 10 to 14 Year Olds | 72,692 (93.8%) | 4,824 (6.2%) |
| 15 to 17 Year Olds | 40,388 (95.8%) | 1,774 (4.2%) |
| 18 to 19 Year Olds | 15,348 (92.5%) | 1,240 (7.5%) |
| 20 to 24 Year Olds | 19,319 (87.1%) | 2,874 (13.0%) |
| 25 to 34 Year Olds | 13,507 (76.6%) | 4,129 (23.4%) |
| 35 Years and over | 9,189 (69.1%) | 4,101 (30.9%) |
| Total | 239,907 (90.3%) | 25,771 (9.7%) |
Educational Attainment by Field of Study in Kern County
Business (18,553 | 17.2%), science & technology (10,832 | 10.0%), education (9,922 | 9.2%), liberal arts & history (8,724 | 8.1%), and social sciences (8,593 | 8.0%) are the most common fields of study among 107,958 individuals in Kern County who have obtained a bachelor's degree or higher.
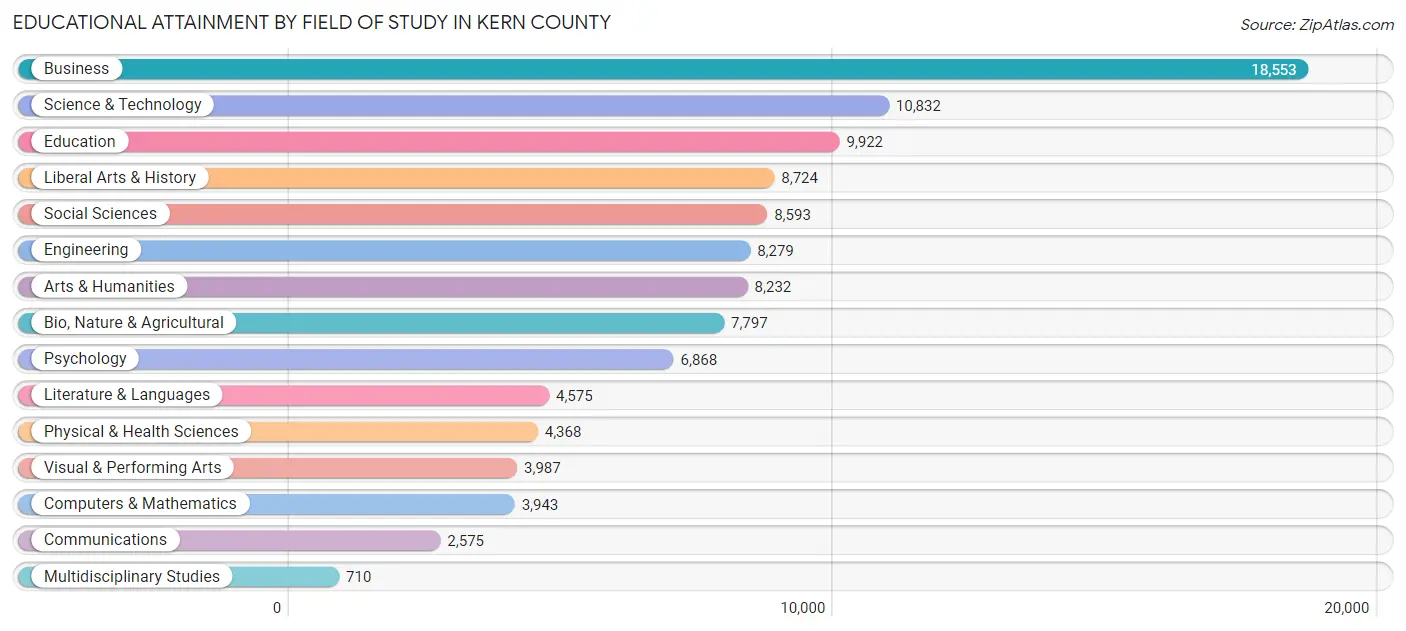
| Field of Study | # Graduates | % Graduates |
| Computers & Mathematics | 3,943 | 3.6% |
| Bio, Nature & Agricultural | 7,797 | 7.2% |
| Physical & Health Sciences | 4,368 | 4.1% |
| Psychology | 6,868 | 6.4% |
| Social Sciences | 8,593 | 8.0% |
| Engineering | 8,279 | 7.7% |
| Multidisciplinary Studies | 710 | 0.7% |
| Science & Technology | 10,832 | 10.0% |
| Business | 18,553 | 17.2% |
| Education | 9,922 | 9.2% |
| Literature & Languages | 4,575 | 4.2% |
| Liberal Arts & History | 8,724 | 8.1% |
| Visual & Performing Arts | 3,987 | 3.7% |
| Communications | 2,575 | 2.4% |
| Arts & Humanities | 8,232 | 7.6% |
| Total | 107,958 | 100.0% |
Transportation & Commute in Kern County
Vehicle Availability by Sex in Kern County
The most prevalent vehicle ownership categories in Kern County are males with 2 vehicles (79,767, accounting for 40.5%) and females with 2 vehicles (58,371, making up 51.9%).
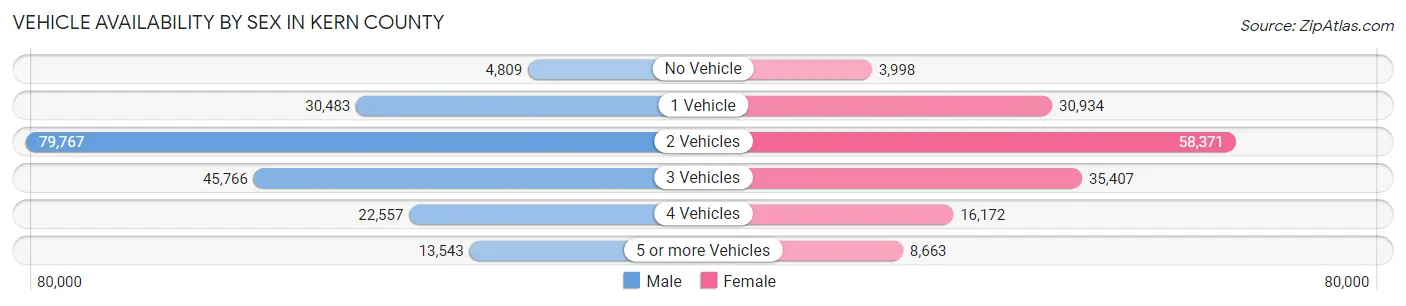
| Vehicles Available | Male | Female |
| No Vehicle | 4,809 (2.4%) | 3,998 (2.6%) |
| 1 Vehicle | 30,483 (15.5%) | 30,934 (20.2%) |
| 2 Vehicles | 79,767 (40.5%) | 58,371 (38.0%) |
| 3 Vehicles | 45,766 (23.2%) | 35,407 (23.1%) |
| 4 Vehicles | 22,557 (11.5%) | 16,172 (10.5%) |
| 5 or more Vehicles | 13,543 (6.9%) | 8,663 (5.6%) |
| Total | 196,925 (100.0%) | 153,545 (100.0%) |
Commute Time in Kern County
The most frequently occuring commute durations in Kern County are 15 to 19 minutes (71,210 commuters, 21.6%), 20 to 24 minutes (61,523 commuters, 18.6%), and 10 to 14 minutes (49,349 commuters, 15.0%).
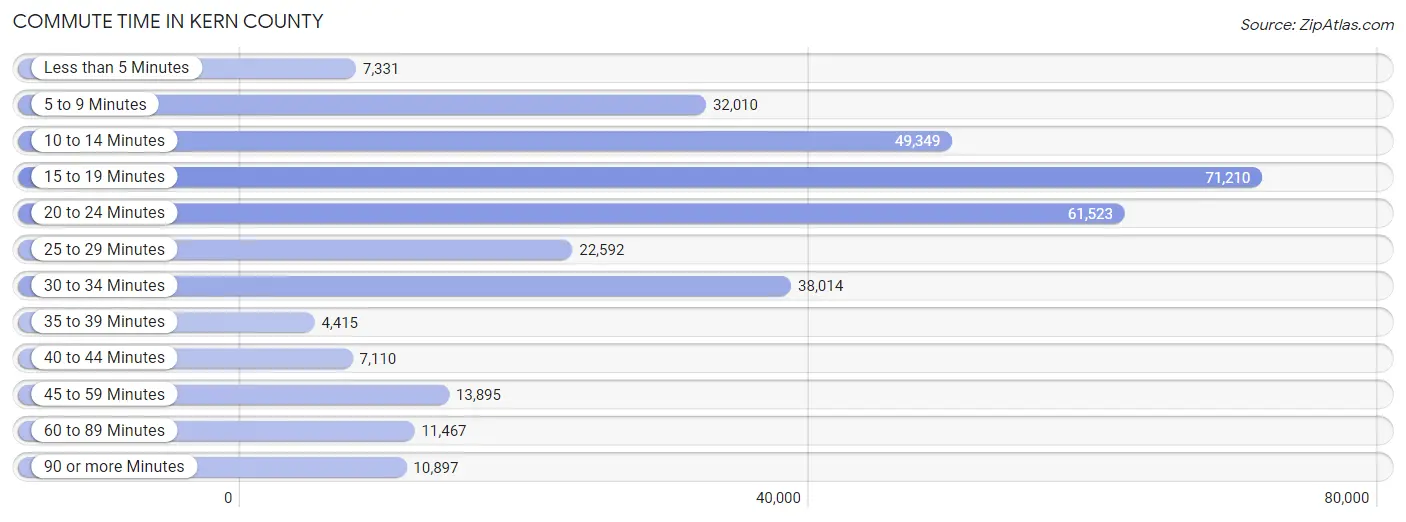
| Commute Time | # Commuters | % Commuters |
| Less than 5 Minutes | 7,331 | 2.2% |
| 5 to 9 Minutes | 32,010 | 9.7% |
| 10 to 14 Minutes | 49,349 | 15.0% |
| 15 to 19 Minutes | 71,210 | 21.6% |
| 20 to 24 Minutes | 61,523 | 18.6% |
| 25 to 29 Minutes | 22,592 | 6.9% |
| 30 to 34 Minutes | 38,014 | 11.5% |
| 35 to 39 Minutes | 4,415 | 1.3% |
| 40 to 44 Minutes | 7,110 | 2.2% |
| 45 to 59 Minutes | 13,895 | 4.2% |
| 60 to 89 Minutes | 11,467 | 3.5% |
| 90 or more Minutes | 10,897 | 3.3% |
Commute Time by Sex in Kern County
The most common commute times in Kern County are 15 to 19 minutes (39,255 commuters, 20.8%) for males and 15 to 19 minutes (31,955 commuters, 22.6%) for females.
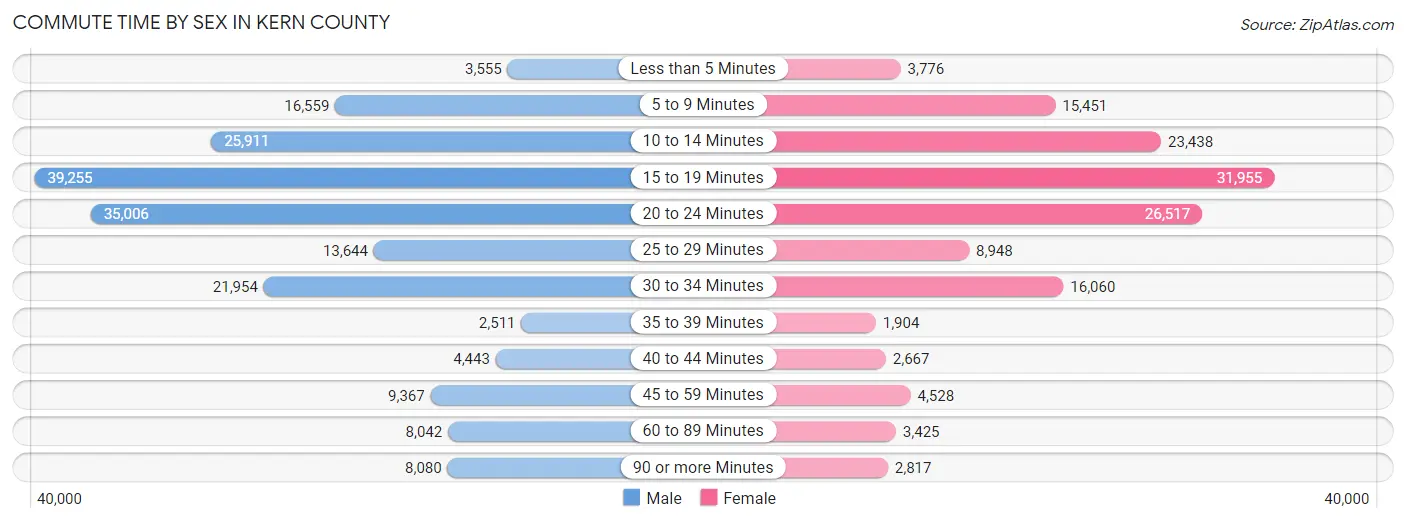
| Commute Time | Male | Female |
| Less than 5 Minutes | 3,555 (1.9%) | 3,776 (2.7%) |
| 5 to 9 Minutes | 16,559 (8.8%) | 15,451 (10.9%) |
| 10 to 14 Minutes | 25,911 (13.8%) | 23,438 (16.6%) |
| 15 to 19 Minutes | 39,255 (20.8%) | 31,955 (22.6%) |
| 20 to 24 Minutes | 35,006 (18.6%) | 26,517 (18.7%) |
| 25 to 29 Minutes | 13,644 (7.2%) | 8,948 (6.3%) |
| 30 to 34 Minutes | 21,954 (11.7%) | 16,060 (11.4%) |
| 35 to 39 Minutes | 2,511 (1.3%) | 1,904 (1.3%) |
| 40 to 44 Minutes | 4,443 (2.4%) | 2,667 (1.9%) |
| 45 to 59 Minutes | 9,367 (5.0%) | 4,528 (3.2%) |
| 60 to 89 Minutes | 8,042 (4.3%) | 3,425 (2.4%) |
| 90 or more Minutes | 8,080 (4.3%) | 2,817 (2.0%) |
Time of Departure to Work by Sex in Kern County
The most frequent times of departure to work in Kern County are 6:00 AM to 6:29 AM (36,338, 19.3%) for males and 7:00 AM to 7:29 AM (21,123, 14.9%) for females.
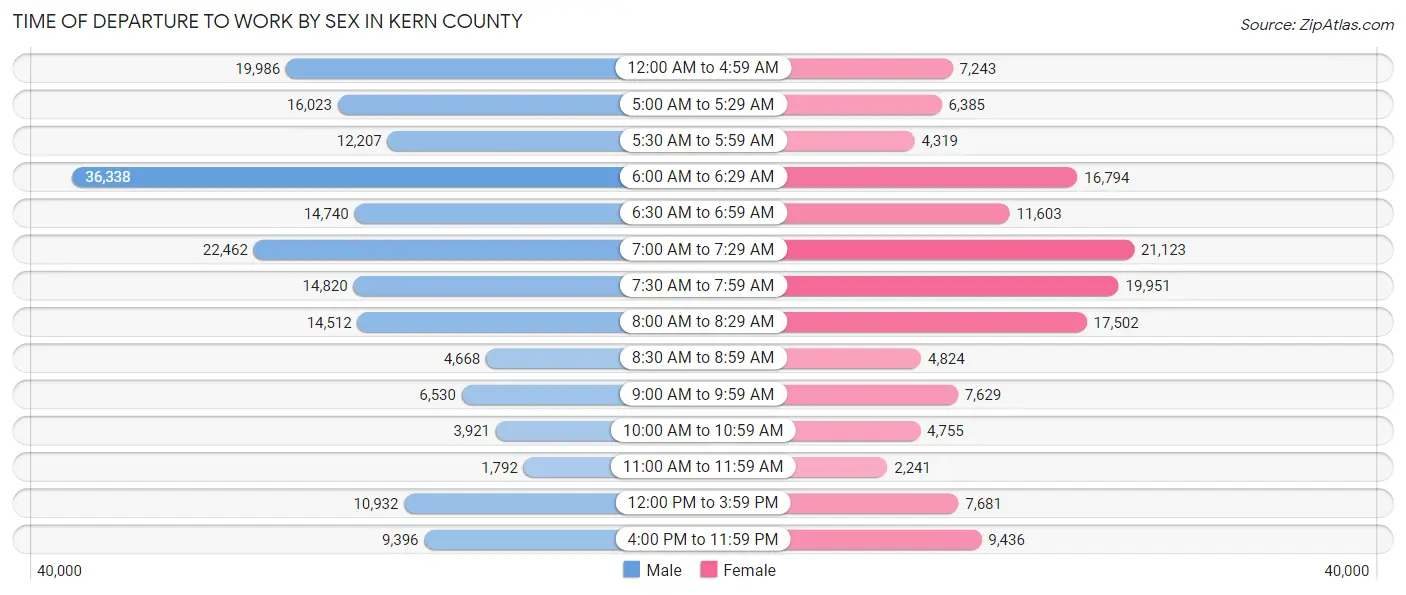
| Time of Departure | Male | Female |
| 12:00 AM to 4:59 AM | 19,986 (10.6%) | 7,243 (5.1%) |
| 5:00 AM to 5:29 AM | 16,023 (8.5%) | 6,385 (4.5%) |
| 5:30 AM to 5:59 AM | 12,207 (6.5%) | 4,319 (3.0%) |
| 6:00 AM to 6:29 AM | 36,338 (19.3%) | 16,794 (11.9%) |
| 6:30 AM to 6:59 AM | 14,740 (7.8%) | 11,603 (8.2%) |
| 7:00 AM to 7:29 AM | 22,462 (11.9%) | 21,123 (14.9%) |
| 7:30 AM to 7:59 AM | 14,820 (7.9%) | 19,951 (14.1%) |
| 8:00 AM to 8:29 AM | 14,512 (7.7%) | 17,502 (12.4%) |
| 8:30 AM to 8:59 AM | 4,668 (2.5%) | 4,824 (3.4%) |
| 9:00 AM to 9:59 AM | 6,530 (3.5%) | 7,629 (5.4%) |
| 10:00 AM to 10:59 AM | 3,921 (2.1%) | 4,755 (3.4%) |
| 11:00 AM to 11:59 AM | 1,792 (0.9%) | 2,241 (1.6%) |
| 12:00 PM to 3:59 PM | 10,932 (5.8%) | 7,681 (5.4%) |
| 4:00 PM to 11:59 PM | 9,396 (5.0%) | 9,436 (6.7%) |
| Total | 188,327 (100.0%) | 141,486 (100.0%) |
Housing Occupancy in Kern County
Occupancy by Ownership in Kern County
Of the total 277,499 dwellings in Kern County, owner-occupied units account for 165,473 (59.6%), while renter-occupied units make up 112,026 (40.4%).
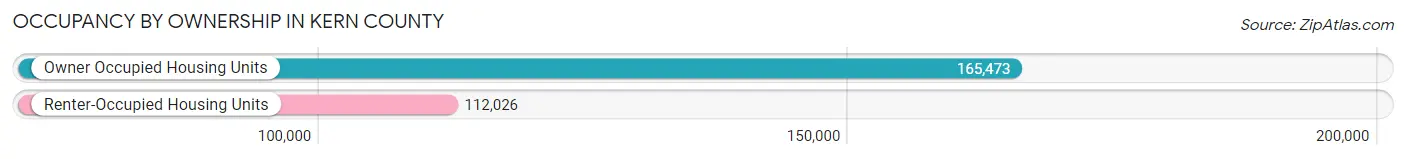
| Occupancy | # Housing Units | % Housing Units |
| Owner Occupied Housing Units | 165,473 | 59.6% |
| Renter-Occupied Housing Units | 112,026 | 40.4% |
| Total Occupied Housing Units | 277,499 | 100.0% |
Occupancy by Household Size in Kern County
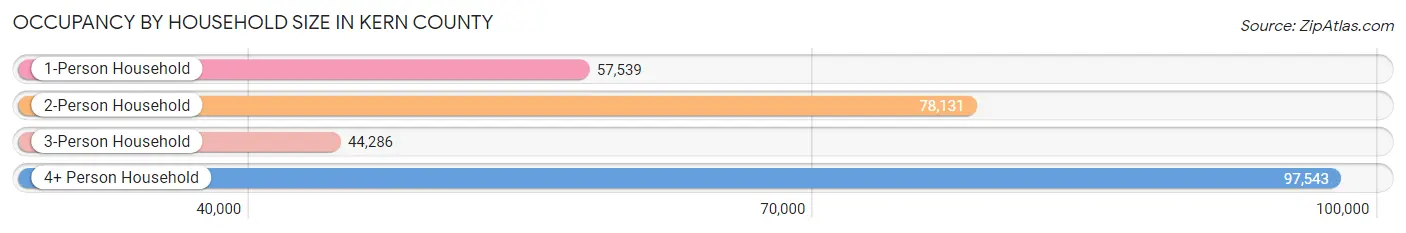
| Household Size | # Housing Units | % Housing Units |
| 1-Person Household | 57,539 | 20.7% |
| 2-Person Household | 78,131 | 28.2% |
| 3-Person Household | 44,286 | 16.0% |
| 4+ Person Household | 97,543 | 35.1% |
| Total Housing Units | 277,499 | 100.0% |
Occupancy by Ownership by Household Size in Kern County
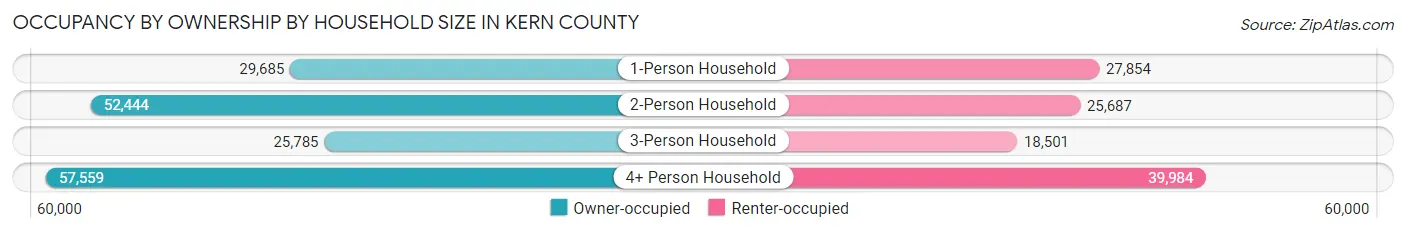
| Household Size | Owner-occupied | Renter-occupied |
| 1-Person Household | 29,685 (51.6%) | 27,854 (48.4%) |
| 2-Person Household | 52,444 (67.1%) | 25,687 (32.9%) |
| 3-Person Household | 25,785 (58.2%) | 18,501 (41.8%) |
| 4+ Person Household | 57,559 (59.0%) | 39,984 (41.0%) |
| Total Housing Units | 165,473 (59.6%) | 112,026 (40.4%) |
Occupancy by Educational Attainment in Kern County
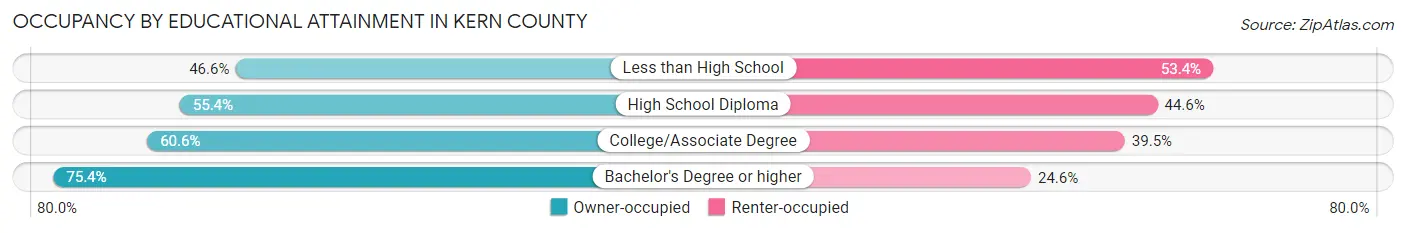
| Household Size | Owner-occupied | Renter-occupied |
| Less than High School | 26,571 (46.6%) | 30,457 (53.4%) |
| High School Diploma | 37,245 (55.4%) | 30,026 (44.6%) |
| College/Associate Degree | 56,563 (60.6%) | 36,852 (39.5%) |
| Bachelor's Degree or higher | 45,094 (75.4%) | 14,691 (24.6%) |
Occupancy by Age of Householder in Kern County
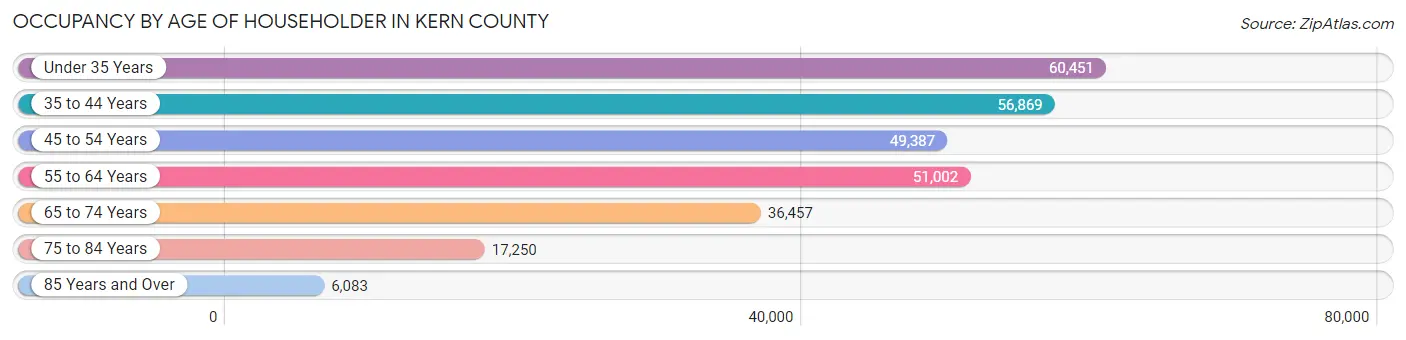
| Age Bracket | # Households | % Households |
| Under 35 Years | 60,451 | 21.8% |
| 35 to 44 Years | 56,869 | 20.5% |
| 45 to 54 Years | 49,387 | 17.8% |
| 55 to 64 Years | 51,002 | 18.4% |
| 65 to 74 Years | 36,457 | 13.1% |
| 75 to 84 Years | 17,250 | 6.2% |
| 85 Years and Over | 6,083 | 2.2% |
| Total | 277,499 | 100.0% |
Housing Finances in Kern County
Median Income by Occupancy in Kern County
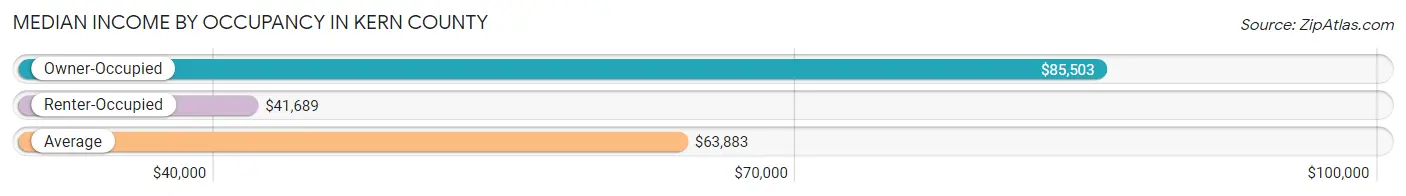
| Occupancy Type | # Households | Median Income |
| Owner-Occupied | 165,473 (59.6%) | $85,503 |
| Renter-Occupied | 112,026 (40.4%) | $41,689 |
| Average | 277,499 (100.0%) | $63,883 |
Occupancy by Householder Income Bracket in Kern County
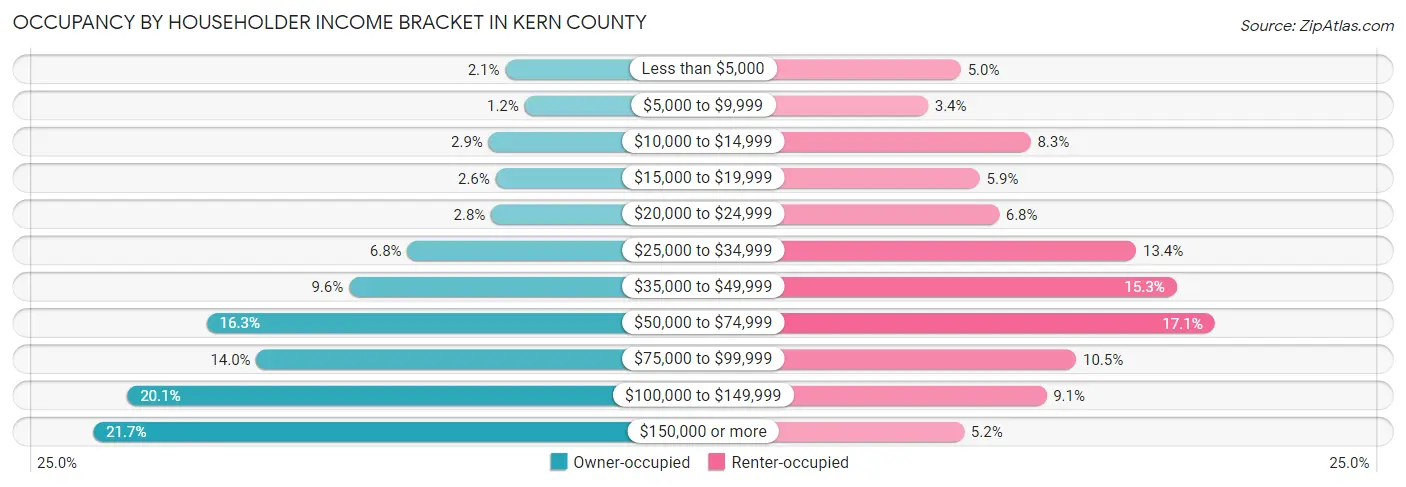
| Income Bracket | Owner-occupied | Renter-occupied |
| Less than $5,000 | 3,485 (2.1%) | 5,614 (5.0%) |
| $5,000 to $9,999 | 1,969 (1.2%) | 3,859 (3.4%) |
| $10,000 to $14,999 | 4,795 (2.9%) | 9,333 (8.3%) |
| $15,000 to $19,999 | 4,249 (2.6%) | 6,625 (5.9%) |
| $20,000 to $24,999 | 4,607 (2.8%) | 7,640 (6.8%) |
| $25,000 to $34,999 | 11,202 (6.8%) | 14,962 (13.4%) |
| $35,000 to $49,999 | 15,801 (9.6%) | 17,133 (15.3%) |
| $50,000 to $74,999 | 27,024 (16.3%) | 19,144 (17.1%) |
| $75,000 to $99,999 | 23,099 (14.0%) | 11,761 (10.5%) |
| $100,000 to $149,999 | 33,274 (20.1%) | 10,169 (9.1%) |
| $150,000 or more | 35,968 (21.7%) | 5,786 (5.2%) |
| Total | 165,473 (100.0%) | 112,026 (100.0%) |
Monthly Housing Cost Tiers in Kern County
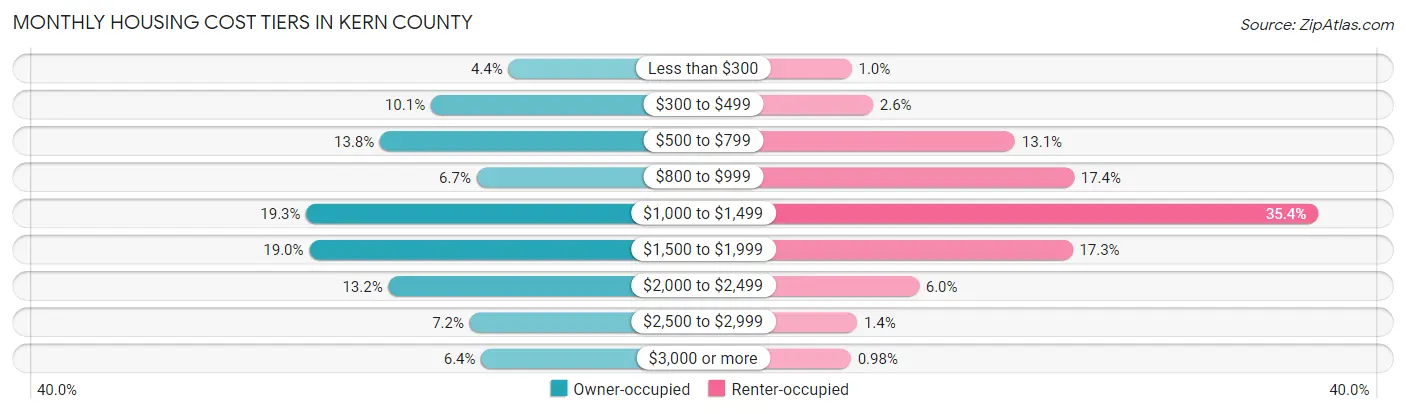
| Monthly Cost | Owner-occupied | Renter-occupied |
| Less than $300 | 7,214 (4.4%) | 1,163 (1.0%) |
| $300 to $499 | 16,658 (10.1%) | 2,928 (2.6%) |
| $500 to $799 | 22,870 (13.8%) | 14,642 (13.1%) |
| $800 to $999 | 11,086 (6.7%) | 19,509 (17.4%) |
| $1,000 to $1,499 | 31,852 (19.3%) | 39,649 (35.4%) |
| $1,500 to $1,999 | 31,497 (19.0%) | 19,390 (17.3%) |
| $2,000 to $2,499 | 21,839 (13.2%) | 6,711 (6.0%) |
| $2,500 to $2,999 | 11,926 (7.2%) | 1,615 (1.4%) |
| $3,000 or more | 10,531 (6.4%) | 1,102 (1.0%) |
| Total | 165,473 (100.0%) | 112,026 (100.0%) |
Physical Housing Characteristics in Kern County
Housing Structures in Kern County
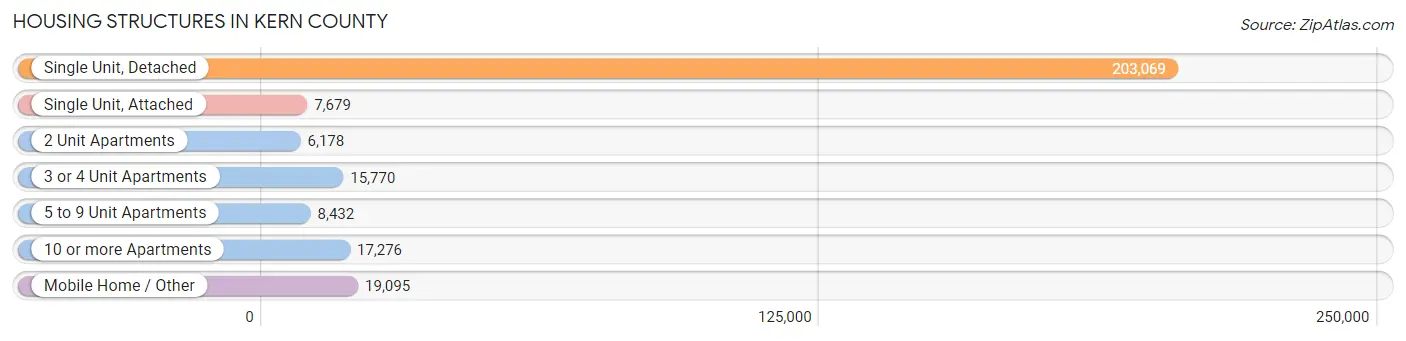
| Structure Type | # Housing Units | % Housing Units |
| Single Unit, Detached | 203,069 | 73.2% |
| Single Unit, Attached | 7,679 | 2.8% |
| 2 Unit Apartments | 6,178 | 2.2% |
| 3 or 4 Unit Apartments | 15,770 | 5.7% |
| 5 to 9 Unit Apartments | 8,432 | 3.0% |
| 10 or more Apartments | 17,276 | 6.2% |
| Mobile Home / Other | 19,095 | 6.9% |
| Total | 277,499 | 100.0% |
Housing Structures by Occupancy in Kern County
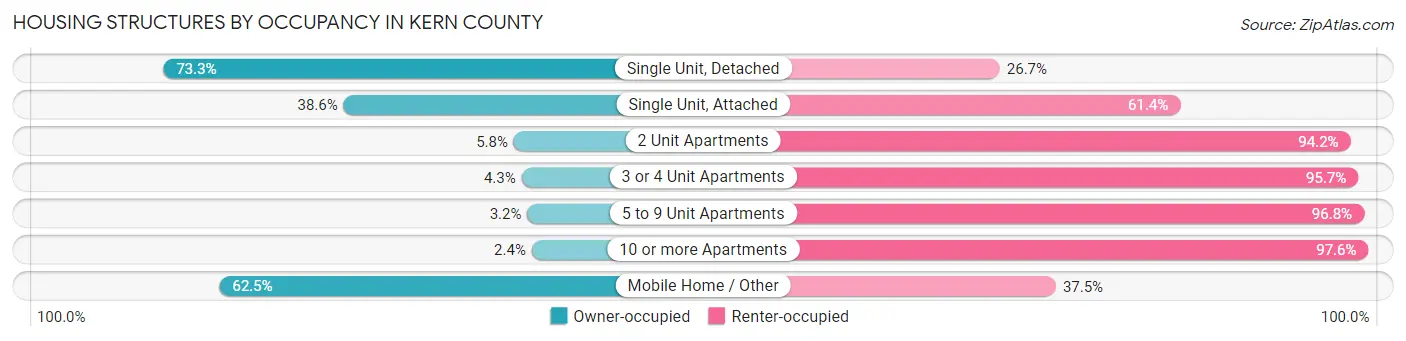
| Structure Type | Owner-occupied | Renter-occupied |
| Single Unit, Detached | 148,856 (73.3%) | 54,213 (26.7%) |
| Single Unit, Attached | 2,963 (38.6%) | 4,716 (61.4%) |
| 2 Unit Apartments | 359 (5.8%) | 5,819 (94.2%) |
| 3 or 4 Unit Apartments | 682 (4.3%) | 15,088 (95.7%) |
| 5 to 9 Unit Apartments | 271 (3.2%) | 8,161 (96.8%) |
| 10 or more Apartments | 408 (2.4%) | 16,868 (97.6%) |
| Mobile Home / Other | 11,934 (62.5%) | 7,161 (37.5%) |
| Total | 165,473 (59.6%) | 112,026 (40.4%) |
Housing Structures by Number of Rooms in Kern County
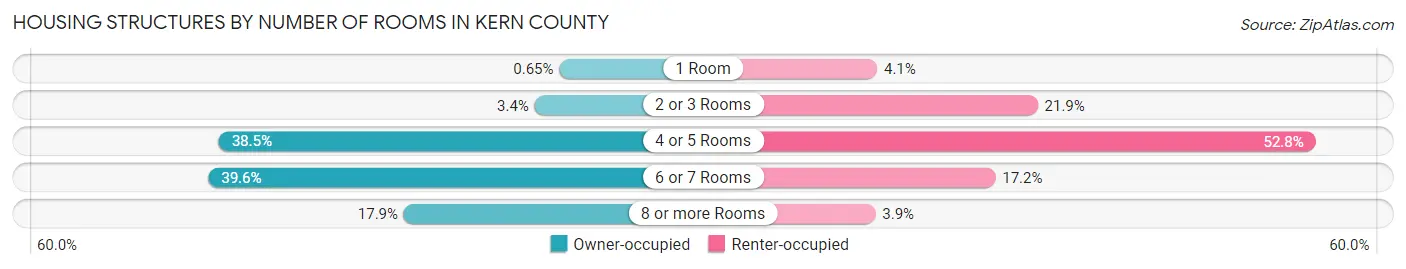
| Number of Rooms | Owner-occupied | Renter-occupied |
| 1 Room | 1,077 (0.6%) | 4,611 (4.1%) |
| 2 or 3 Rooms | 5,602 (3.4%) | 24,573 (21.9%) |
| 4 or 5 Rooms | 63,621 (38.5%) | 59,130 (52.8%) |
| 6 or 7 Rooms | 65,538 (39.6%) | 19,308 (17.2%) |
| 8 or more Rooms | 29,635 (17.9%) | 4,404 (3.9%) |
| Total | 165,473 (100.0%) | 112,026 (100.0%) |
Housing Structure by Heating Type in Kern County
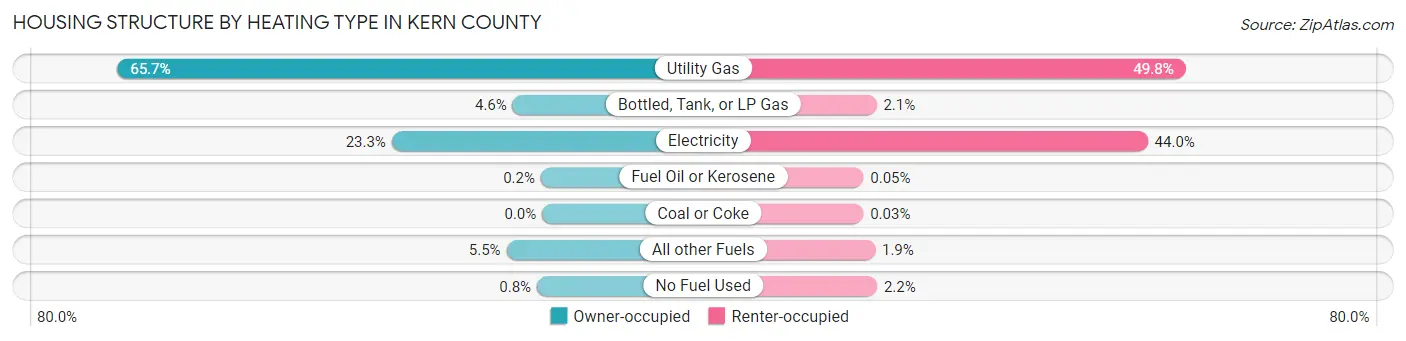
| Heating Type | Owner-occupied | Renter-occupied |
| Utility Gas | 108,671 (65.7%) | 55,835 (49.8%) |
| Bottled, Tank, or LP Gas | 7,547 (4.6%) | 2,325 (2.1%) |
| Electricity | 38,470 (23.3%) | 49,291 (44.0%) |
| Fuel Oil or Kerosene | 338 (0.2%) | 61 (0.1%) |
| Coal or Coke | 4 (0.0%) | 30 (0.0%) |
| All other Fuels | 9,125 (5.5%) | 2,073 (1.8%) |
| No Fuel Used | 1,318 (0.8%) | 2,411 (2.1%) |
| Total | 165,473 (100.0%) | 112,026 (100.0%) |
Household Vehicle Usage in Kern County
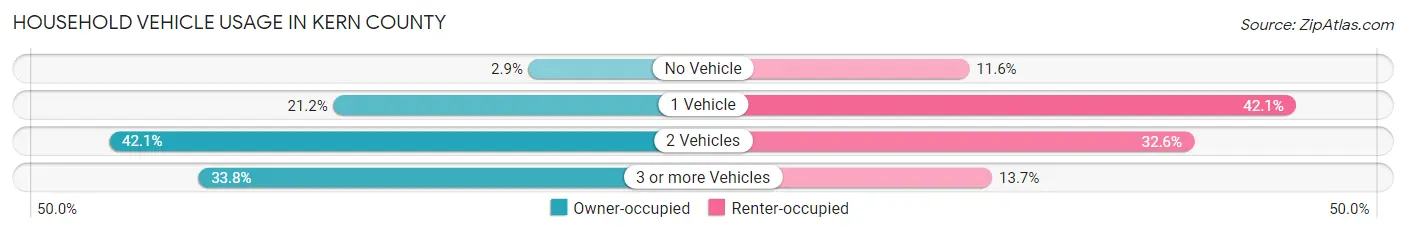
| Vehicles per Household | Owner-occupied | Renter-occupied |
| No Vehicle | 4,861 (2.9%) | 13,022 (11.6%) |
| 1 Vehicle | 35,016 (21.2%) | 47,129 (42.1%) |
| 2 Vehicles | 69,680 (42.1%) | 36,483 (32.6%) |
| 3 or more Vehicles | 55,916 (33.8%) | 15,392 (13.7%) |
| Total | 165,473 (100.0%) | 112,026 (100.0%) |
Real Estate & Mortgages in Kern County
Real Estate and Mortgage Overview in Kern County
| Characteristic | Without Mortgage | With Mortgage |
| Housing Units | 54,744 | 110,729 |
| Median Property Value | $235,100 | $301,500 |
| Median Household Income | $58,413 | $28,186 |
| Monthly Housing Costs | $555 | $10,375 |
| Real Estate Taxes | $2,065 | $2,692 |
Property Value by Mortgage Status in Kern County
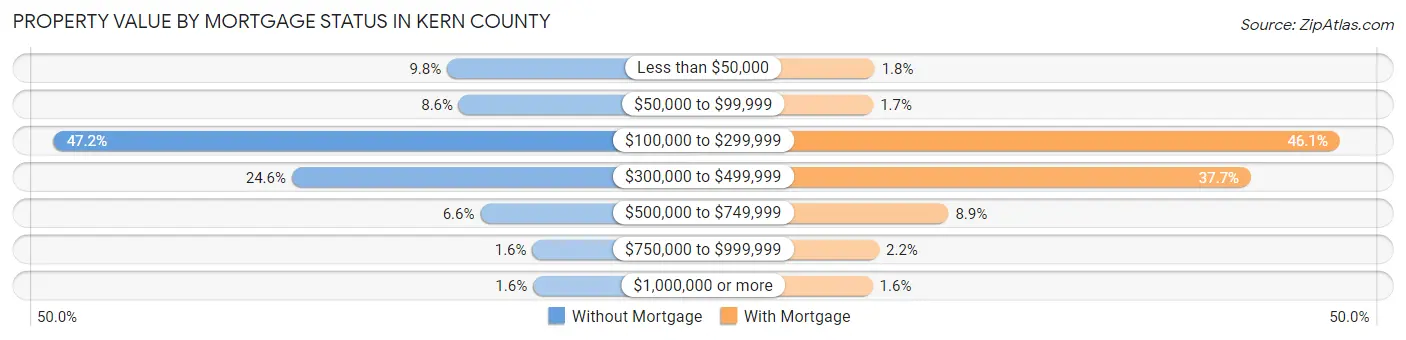
| Property Value | Without Mortgage | With Mortgage |
| Less than $50,000 | 5,346 (9.8%) | 2,023 (1.8%) |
| $50,000 to $99,999 | 4,728 (8.6%) | 1,864 (1.7%) |
| $100,000 to $299,999 | 25,849 (47.2%) | 51,059 (46.1%) |
| $300,000 to $499,999 | 13,442 (24.5%) | 41,689 (37.7%) |
| $500,000 to $749,999 | 3,615 (6.6%) | 9,803 (8.8%) |
| $750,000 to $999,999 | 899 (1.6%) | 2,483 (2.2%) |
| $1,000,000 or more | 865 (1.6%) | 1,808 (1.6%) |
| Total | 54,744 (100.0%) | 110,729 (100.0%) |
Household Income by Mortgage Status in Kern County
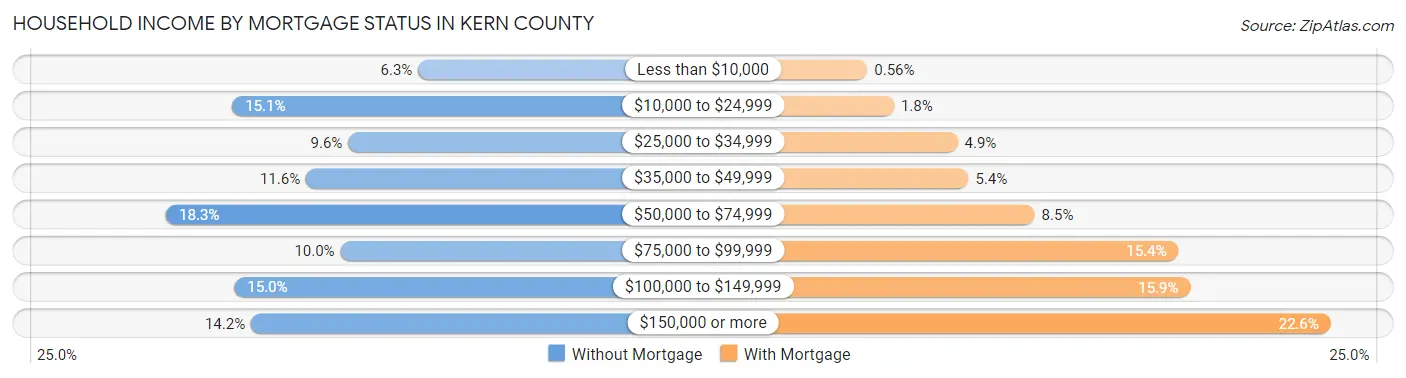
| Household Income | Without Mortgage | With Mortgage |
| Less than $10,000 | 3,426 (6.3%) | 616 (0.6%) |
| $10,000 to $24,999 | 8,272 (15.1%) | 2,028 (1.8%) |
| $25,000 to $34,999 | 5,248 (9.6%) | 5,379 (4.9%) |
| $35,000 to $49,999 | 6,352 (11.6%) | 5,954 (5.4%) |
| $50,000 to $74,999 | 9,995 (18.3%) | 9,449 (8.5%) |
| $75,000 to $99,999 | 5,452 (10.0%) | 17,029 (15.4%) |
| $100,000 to $149,999 | 8,217 (15.0%) | 17,647 (15.9%) |
| $150,000 or more | 7,782 (14.2%) | 25,057 (22.6%) |
| Total | 54,744 (100.0%) | 110,729 (100.0%) |
Property Value to Household Income Ratio in Kern County
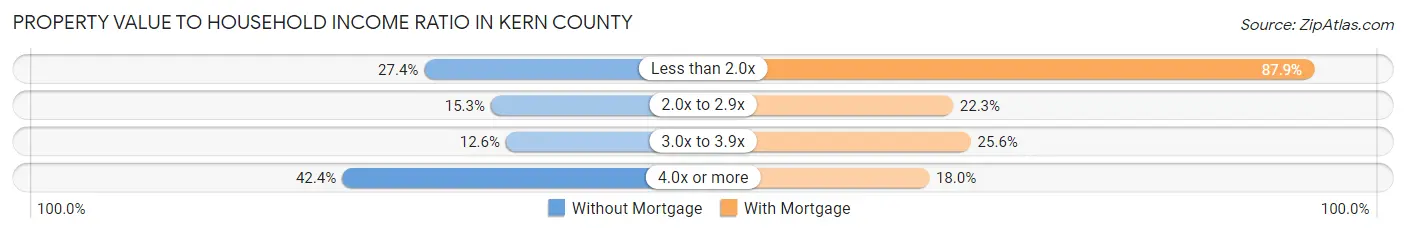
| Value-to-Income Ratio | Without Mortgage | With Mortgage |
| Less than 2.0x | 15,020 (27.4%) | 97,321 (87.9%) |
| 2.0x to 2.9x | 8,396 (15.3%) | 24,722 (22.3%) |
| 3.0x to 3.9x | 6,905 (12.6%) | 28,299 (25.6%) |
| 4.0x or more | 23,192 (42.4%) | 19,921 (18.0%) |
| Total | 54,744 (100.0%) | 110,729 (100.0%) |
Real Estate Taxes by Mortgage Status in Kern County
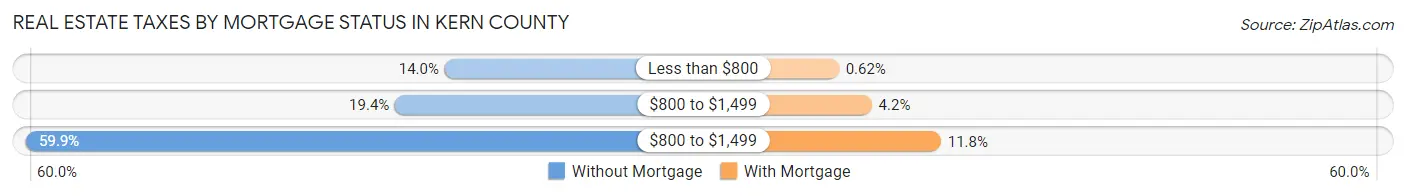
| Property Taxes | Without Mortgage | With Mortgage |
| Less than $800 | 7,636 (14.0%) | 687 (0.6%) |
| $800 to $1,499 | 10,615 (19.4%) | 4,680 (4.2%) |
| $800 to $1,499 | 32,762 (59.9%) | 13,082 (11.8%) |
| Total | 54,744 (100.0%) | 110,729 (100.0%) |
Health & Disability in Kern County
Health Insurance Coverage by Age in Kern County
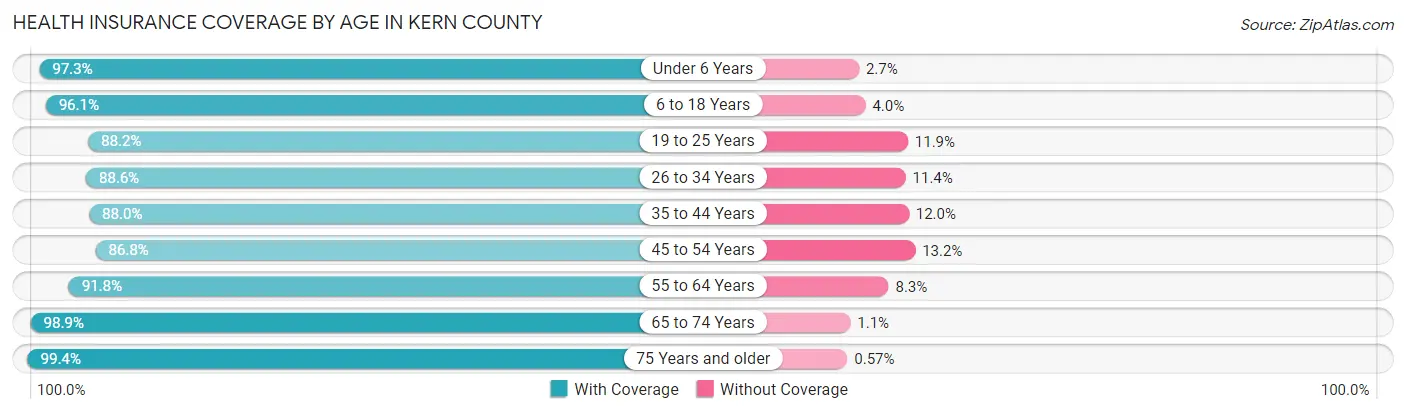
| Age Bracket | With Coverage | Without Coverage |
| Under 6 Years | 77,719 (97.3%) | 2,187 (2.7%) |
| 6 to 18 Years | 187,465 (96.1%) | 7,710 (4.0%) |
| 19 to 25 Years | 78,472 (88.1%) | 10,546 (11.8%) |
| 26 to 34 Years | 102,985 (88.6%) | 13,306 (11.4%) |
| 35 to 44 Years | 99,183 (88.0%) | 13,553 (12.0%) |
| 45 to 54 Years | 83,375 (86.8%) | 12,698 (13.2%) |
| 55 to 64 Years | 85,044 (91.7%) | 7,644 (8.3%) |
| 65 to 74 Years | 61,649 (98.9%) | 706 (1.1%) |
| 75 Years and older | 38,437 (99.4%) | 219 (0.6%) |
| Total | 814,329 (92.2%) | 68,569 (7.8%) |
Health Insurance Coverage by Citizenship Status in Kern County
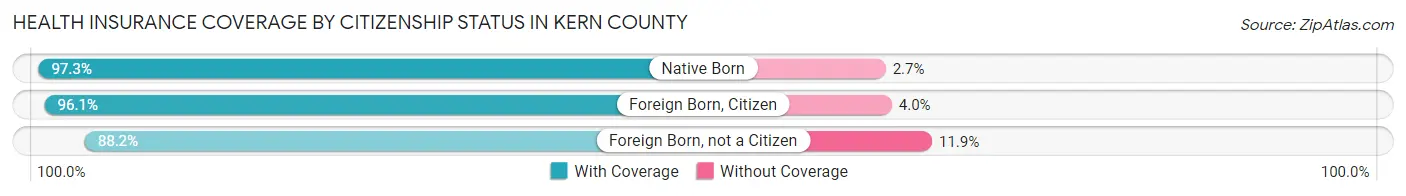
| Citizenship Status | With Coverage | Without Coverage |
| Native Born | 77,719 (97.3%) | 2,187 (2.7%) |
| Foreign Born, Citizen | 187,465 (96.1%) | 7,710 (4.0%) |
| Foreign Born, not a Citizen | 78,472 (88.1%) | 10,546 (11.8%) |
Health Insurance Coverage by Household Income in Kern County
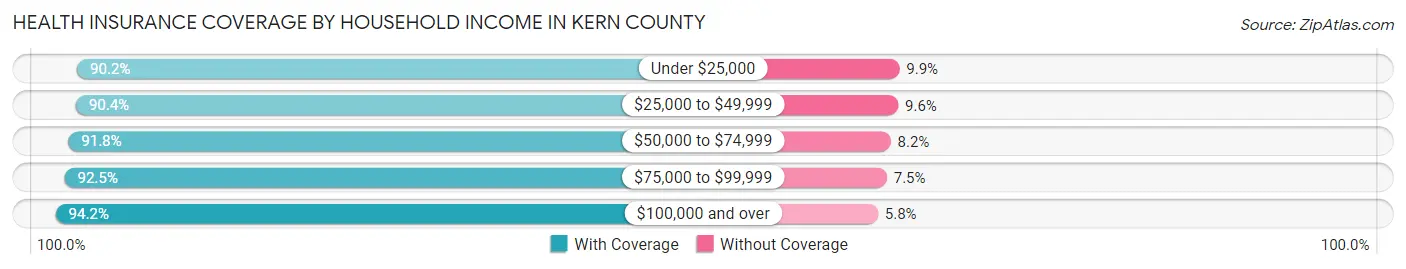
| Household Income | With Coverage | Without Coverage |
| Under $25,000 | 105,571 (90.1%) | 11,539 (9.9%) |
| $25,000 to $49,999 | 159,864 (90.4%) | 17,015 (9.6%) |
| $50,000 to $74,999 | 138,650 (91.8%) | 12,401 (8.2%) |
| $75,000 to $99,999 | 114,482 (92.5%) | 9,263 (7.5%) |
| $100,000 and over | 290,831 (94.2%) | 17,974 (5.8%) |
Public vs Private Health Insurance Coverage by Age in Kern County
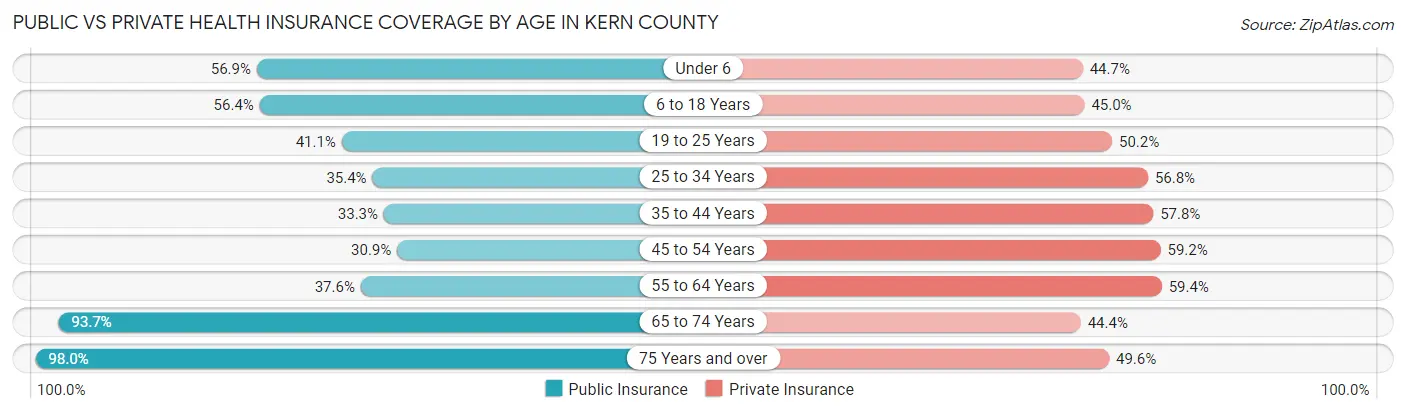
| Age Bracket | Public Insurance | Private Insurance |
| Under 6 | 45,469 (56.9%) | 35,732 (44.7%) |
| 6 to 18 Years | 110,020 (56.4%) | 87,913 (45.0%) |
| 19 to 25 Years | 36,619 (41.1%) | 44,652 (50.2%) |
| 25 to 34 Years | 41,206 (35.4%) | 66,086 (56.8%) |
| 35 to 44 Years | 37,559 (33.3%) | 65,167 (57.8%) |
| 45 to 54 Years | 29,651 (30.9%) | 56,849 (59.2%) |
| 55 to 64 Years | 34,856 (37.6%) | 55,039 (59.4%) |
| 65 to 74 Years | 58,441 (93.7%) | 27,655 (44.4%) |
| 75 Years and over | 37,879 (98.0%) | 19,177 (49.6%) |
| Total | 431,700 (48.9%) | 458,270 (51.9%) |
Disability Status by Sex by Age in Kern County
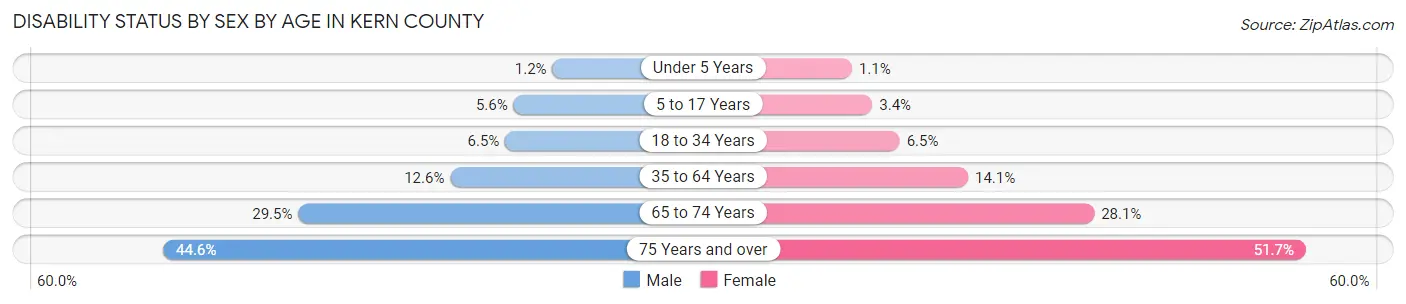
| Age Bracket | Male | Female |
| Under 5 Years | 414 (1.2%) | 367 (1.1%) |
| 5 to 17 Years | 5,496 (5.6%) | 3,248 (3.4%) |
| 18 to 34 Years | 7,234 (6.5%) | 6,967 (6.5%) |
| 35 to 64 Years | 18,947 (12.6%) | 21,240 (14.1%) |
| 65 to 74 Years | 8,878 (29.5%) | 9,074 (28.1%) |
| 75 Years and over | 7,451 (44.6%) | 11,337 (51.7%) |
Disability Class by Sex by Age in Kern County
Disability Class: Hearing Difficulty
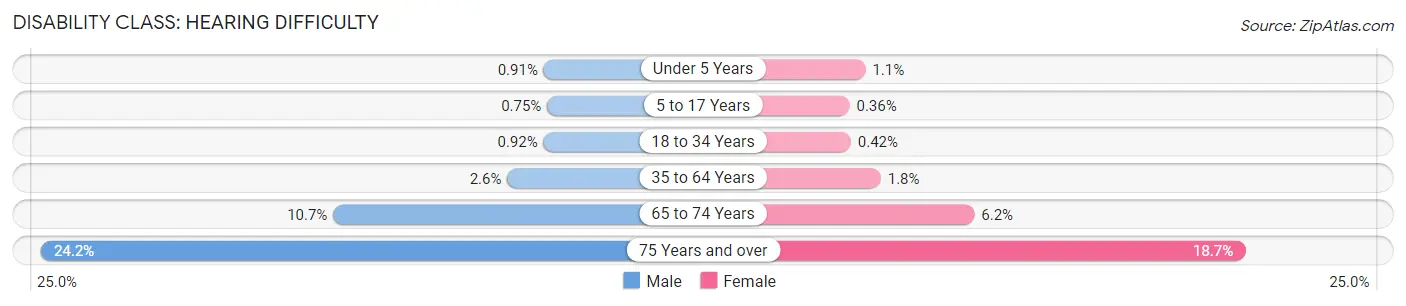
| Age Bracket | Male | Female |
| Under 5 Years | 308 (0.9%) | 357 (1.1%) |
| 5 to 17 Years | 741 (0.7%) | 346 (0.4%) |
| 18 to 34 Years | 1,032 (0.9%) | 458 (0.4%) |
| 35 to 64 Years | 3,904 (2.6%) | 2,733 (1.8%) |
| 65 to 74 Years | 3,212 (10.7%) | 1,984 (6.1%) |
| 75 Years and over | 4,052 (24.2%) | 4,105 (18.7%) |
Disability Class: Vision Difficulty
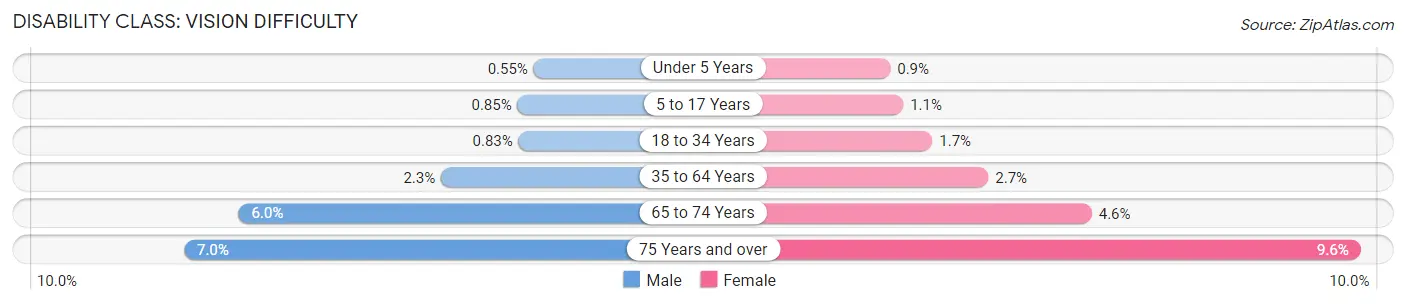
| Age Bracket | Male | Female |
| Under 5 Years | 185 (0.5%) | 290 (0.9%) |
| 5 to 17 Years | 846 (0.9%) | 1,091 (1.1%) |
| 18 to 34 Years | 924 (0.8%) | 1,812 (1.7%) |
| 35 to 64 Years | 3,414 (2.3%) | 4,106 (2.7%) |
| 65 to 74 Years | 1,813 (6.0%) | 1,497 (4.6%) |
| 75 Years and over | 1,176 (7.0%) | 2,113 (9.6%) |
Disability Class: Cognitive Difficulty
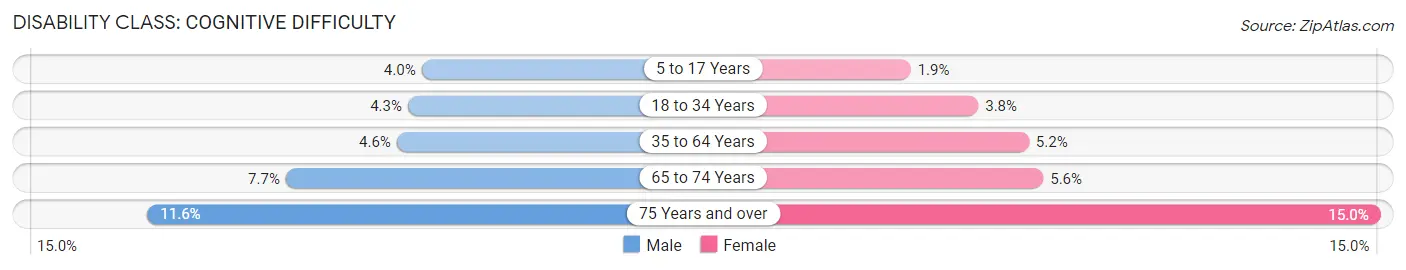
| Age Bracket | Male | Female |
| 5 to 17 Years | 3,917 (4.0%) | 1,832 (1.9%) |
| 18 to 34 Years | 4,829 (4.3%) | 4,100 (3.8%) |
| 35 to 64 Years | 6,981 (4.6%) | 7,875 (5.2%) |
| 65 to 74 Years | 2,325 (7.7%) | 1,811 (5.6%) |
| 75 Years and over | 1,936 (11.6%) | 3,290 (15.0%) |
Disability Class: Ambulatory Difficulty
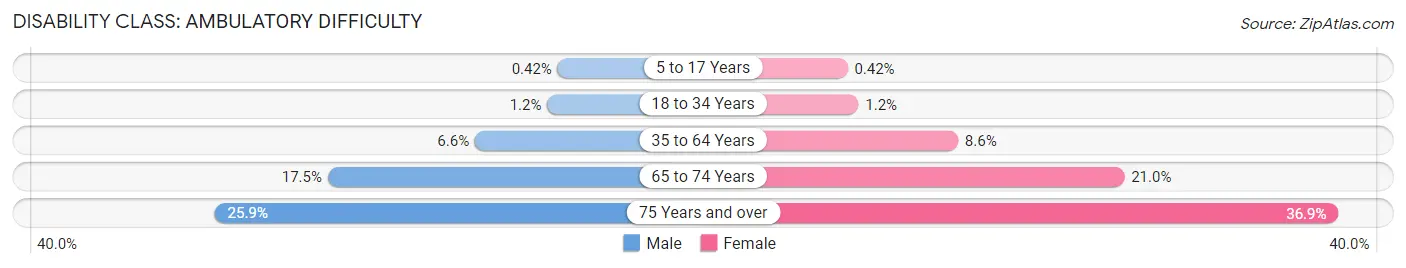
| Age Bracket | Male | Female |
| 5 to 17 Years | 418 (0.4%) | 401 (0.4%) |
| 18 to 34 Years | 1,327 (1.2%) | 1,325 (1.2%) |
| 35 to 64 Years | 9,863 (6.6%) | 13,026 (8.6%) |
| 65 to 74 Years | 5,260 (17.5%) | 6,769 (21.0%) |
| 75 Years and over | 4,328 (25.9%) | 8,088 (36.9%) |
Disability Class: Self-Care Difficulty
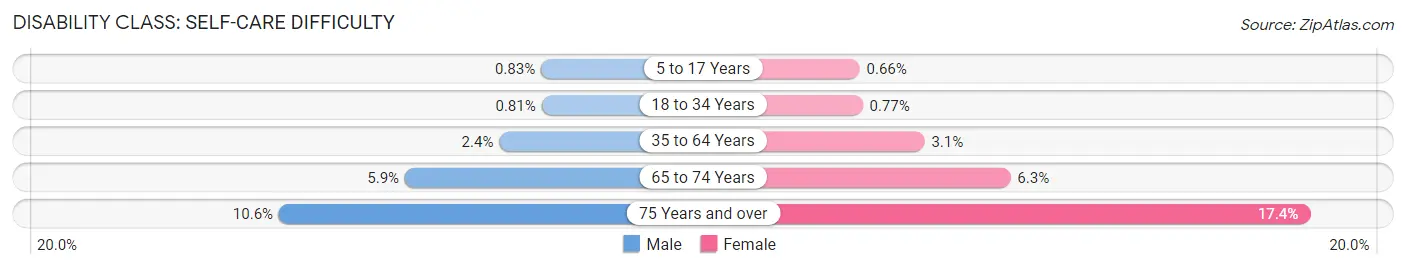
| Age Bracket | Male | Female |
| 5 to 17 Years | 821 (0.8%) | 626 (0.7%) |
| 18 to 34 Years | 899 (0.8%) | 829 (0.8%) |
| 35 to 64 Years | 3,574 (2.4%) | 4,637 (3.1%) |
| 65 to 74 Years | 1,767 (5.9%) | 2,021 (6.3%) |
| 75 Years and over | 1,766 (10.6%) | 3,813 (17.4%) |
Technology Access in Kern County
Computing Device Access in Kern County
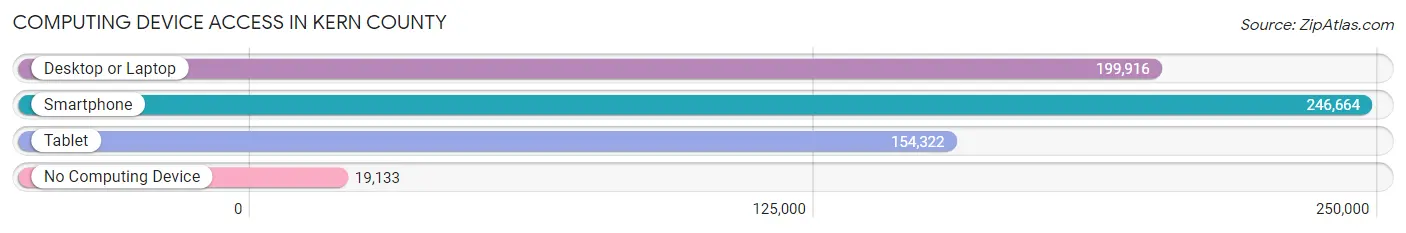
| Device Type | # Households | % Households |
| Desktop or Laptop | 199,916 | 72.0% |
| Smartphone | 246,664 | 88.9% |
| Tablet | 154,322 | 55.6% |
| No Computing Device | 19,133 | 6.9% |
| Total | 277,499 | 100.0% |
Internet Access in Kern County
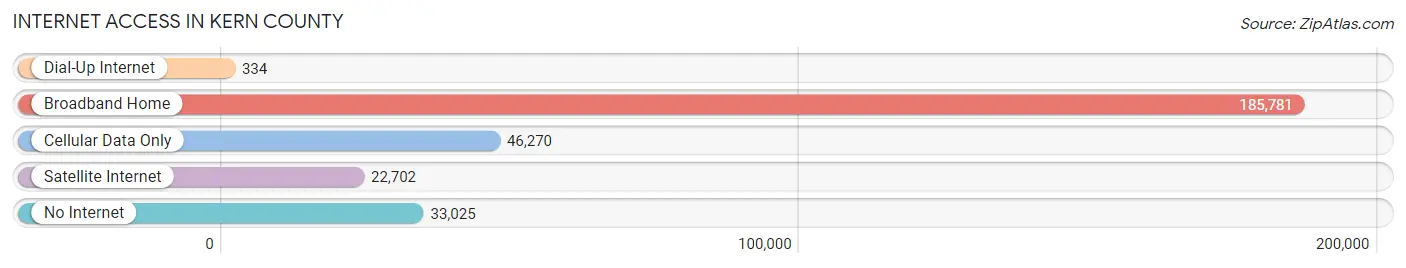
| Internet Type | # Households | % Households |
| Dial-Up Internet | 334 | 0.1% |
| Broadband Home | 185,781 | 66.9% |
| Cellular Data Only | 46,270 | 16.7% |
| Satellite Internet | 22,702 | 8.2% |
| No Internet | 33,025 | 11.9% |
| Total | 277,499 | 100.0% |
Kern County Summary
Kern County, California is located in the southern part of the state, and is the third largest county in California. It is bordered by Fresno County to the north, Tulare County to the east, San Luis Obispo County to the south, and Santa Barbara County to the west. The county seat is Bakersfield, and the largest city is also Bakersfield. Kern County is home to over 890,000 people, making it the 19th most populous county in the United States.
Geography
Kern County covers an area of 8,161 square miles, making it the third largest county in California. It is located in the southern part of the state, and is bordered by Fresno County to the north, Tulare County to the east, San Luis Obispo County to the south, and Santa Barbara County to the west. The county is divided into two distinct regions: the southern Sierra Nevada Mountains and the northern San Joaquin Valley. The Sierra Nevada Mountains are home to the Sequoia National Forest, which is known for its giant sequoia trees. The San Joaquin Valley is a large agricultural region, and is home to the Kern River, which is the longest river in the county.
History
Kern County was formed in 1866 from parts of Los Angeles and Tulare counties. It was named after the Kern River, which was named after Edward Kern, a surveyor for the John C. Fremont expedition in 1845. The county was initially populated by Native American tribes, including the Yokuts, Chumash, and Paiute. In the late 19th century, the county began to attract settlers from the Midwest and East Coast, who were drawn to the area by the promise of gold and other minerals.
The county experienced rapid growth in the early 20th century, due to the discovery of oil in the area. The oil industry quickly became the main economic driver in the county, and the population grew rapidly. The county also experienced a boom in agriculture, with the development of large-scale farming operations.
Economy
Kern County has a diverse economy, with a mix of agriculture, oil and gas, manufacturing, and services. Agriculture is the largest sector of the economy, accounting for over 40% of the county’s total economic output. The county is the leading producer of grapes, citrus, and almonds in the state. Oil and gas production is also a major industry in the county, and is the second largest sector of the economy. Manufacturing is also an important sector, with the county being home to several large companies, including Chevron, Occidental Petroleum, and Phillips 66. The service sector is also a major contributor to the economy, with the county being home to several large hospitals, universities, and other service-oriented businesses.
Demographics
Kern County is home to over 890,000 people, making it the 19th most populous county in the United States. The population is fairly diverse, with the largest ethnic groups being White (47.3%), Hispanic or Latino (41.2%), and Asian (4.7%). The median household income in the county is $54,845, and the median home value is $223,400. The unemployment rate in the county is 8.2%, which is slightly higher than the national average.
Conclusion
Kern County, California is a large and diverse county located in the southern part of the state. It is home to over 890,000 people, and has a diverse economy that is driven by agriculture, oil and gas, manufacturing, and services. The population is fairly diverse, with the largest ethnic groups being White, Hispanic or Latino, and Asian. The median household income in the county is $54,845, and the median home value is $223,400. Kern County is an important part of the state of California, and is an important contributor to the state’s economy.
Common Questions
What is Per Capita Income in Kern County?
Per Capita income in Kern County is $27,976.
What is the Median Family Income in Kern County?
Median Family Income in Kern County is $71,065.
What is the Median Household income in Kern County?
Median Household Income in Kern County is $63,883.
What is Income or Wage Gap in Kern County?
Income or Wage Gap in Kern County is 32.3%.
Women in Kern County earn 67.7 cents for every dollar earned by a man.
What is Family Income Deficit in Kern County?
Family Income Deficit in Kern County is $10,944.
Families that are below poverty line in Kern County earn $10,944 less on average than the poverty threshold level.
What is Inequality or Gini Index in Kern County?
Inequality or Gini Index in Kern County is 0.47.
What is the Total Population of Kern County?
Total Population of Kern County is 906,883.
What is the Total Male Population of Kern County?
Total Male Population of Kern County is 464,093.
What is the Total Female Population of Kern County?
Total Female Population of Kern County is 442,790.
What is the Ratio of Males per 100 Females in Kern County?
There are 104.81 Males per 100 Females in Kern County.
What is the Ratio of Females per 100 Males in Kern County?
There are 95.41 Females per 100 Males in Kern County.
What is the Median Population Age in Kern County?
Median Population Age in Kern County is 32.2 Years.
What is the Average Family Size in Kern County
Average Family Size in Kern County is 3.7 People.
What is the Average Household Size in Kern County
Average Household Size in Kern County is 3.2 People.
How Large is the Labor Force in Kern County?
There are 394,506 People in the Labor Forcein in Kern County.
What is the Percentage of People in the Labor Force in Kern County?
58.5% of People are in the Labor Force in Kern County.
What is the Unemployment Rate in Kern County?
Unemployment Rate in Kern County is 8.4%.