Humboldt County, CA Map & Demographics
Humboldt County Map
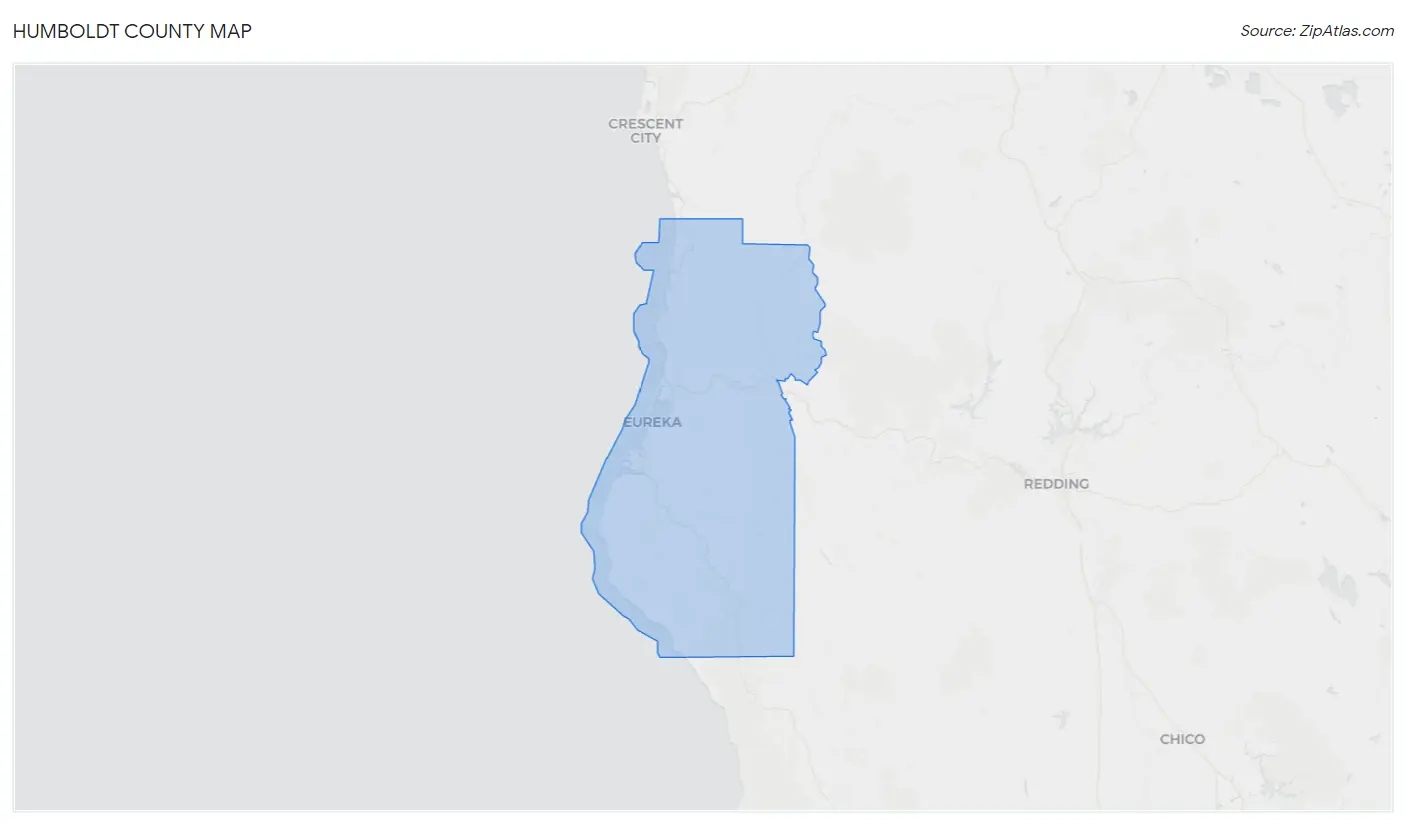
Humboldt County Overview
$33,988
PER CAPITA INCOME
$80,244
AVG FAMILY INCOME
$57,881
AVG HOUSEHOLD INCOME
24.5%
WAGE / INCOME GAP [ % ]
75.5¢/ $1
WAGE / INCOME GAP [ $ ]
$10,676
FAMILY INCOME DEFICIT
0.48
INEQUALITY / GINI INDEX
136,132
TOTAL POPULATION
67,729
MALE POPULATION
68,403
FEMALE POPULATION
99.01
MALES / 100 FEMALES
101.00
FEMALES / 100 MALES
39.5
MEDIAN AGE
3.0
AVG FAMILY SIZE
2.4
AVG HOUSEHOLD SIZE
66,816
LABOR FORCE [ PEOPLE ]
58.9%
PERCENT IN LABOR FORCE
9.2%
UNEMPLOYMENT RATE
Income in Humboldt County
Income Overview in Humboldt County
Per Capita Income in Humboldt County is $33,988, while median incomes of families and households are $80,244 and $57,881 respectively.
| Characteristic | Number | Measure |
| Per Capita Income | 136,132 | $33,988 |
| Median Family Income | 29,397 | $80,244 |
| Mean Family Income | 29,397 | $103,812 |
| Median Household Income | 54,495 | $57,881 |
| Mean Household Income | 54,495 | $81,887 |
| Income Deficit | 29,397 | $10,676 |
| Wage / Income Gap (%) | 136,132 | 24.55% |
| Wage / Income Gap ($) | 136,132 | 75.45¢ per $1 |
| Gini / Inequality Index | 136,132 | 0.48 |
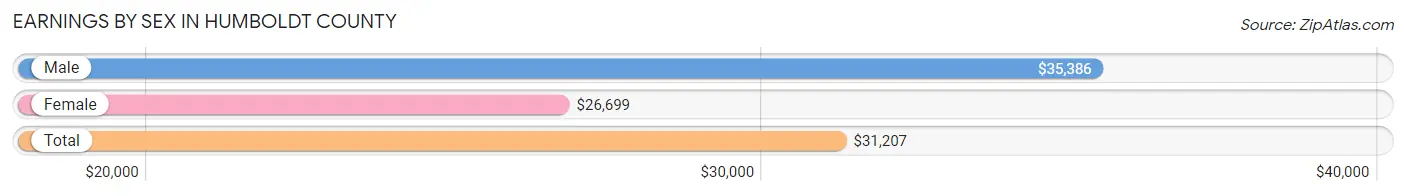
Earnings by Sex in Humboldt County
Average Earnings in Humboldt County are $31,207, $35,386 for men and $26,699 for women, a difference of 24.5%.
| Sex | Number | Average Earnings |
| Male | 36,866 (52.5%) | $35,386 |
| Female | 33,383 (47.5%) | $26,699 |
| Total | 70,249 (100.0%) | $31,207 |
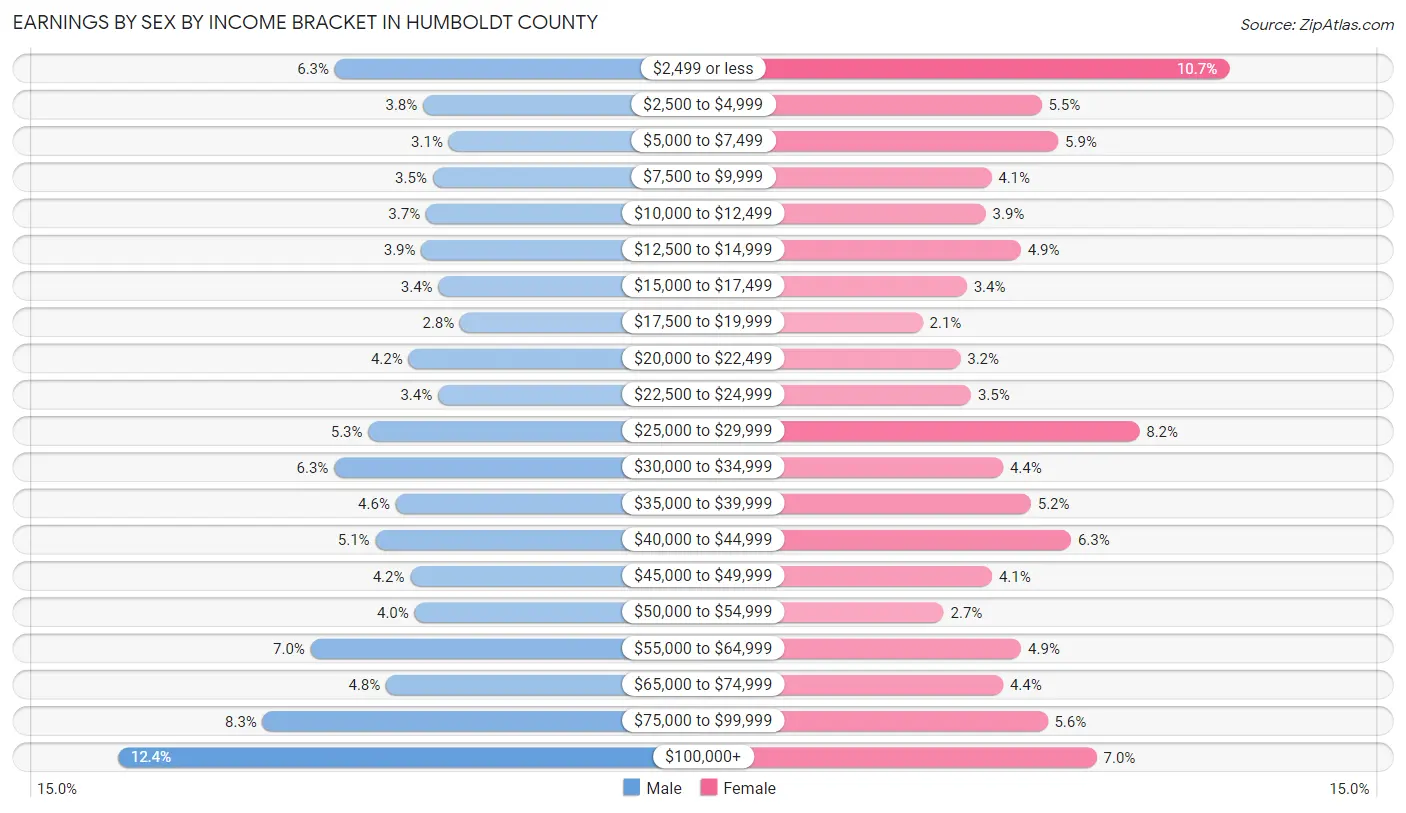
Earnings by Sex by Income Bracket in Humboldt County
The most common earnings brackets in Humboldt County are $100,000+ for men (4,564 | 12.4%) and $2,499 or less for women (3,584 | 10.7%).
| Income | Male | Female |
| $2,499 or less | 2,315 (6.3%) | 3,584 (10.7%) |
| $2,500 to $4,999 | 1,400 (3.8%) | 1,827 (5.5%) |
| $5,000 to $7,499 | 1,134 (3.1%) | 1,982 (5.9%) |
| $7,500 to $9,999 | 1,303 (3.5%) | 1,356 (4.1%) |
| $10,000 to $12,499 | 1,370 (3.7%) | 1,303 (3.9%) |
| $12,500 to $14,999 | 1,418 (3.8%) | 1,632 (4.9%) |
| $15,000 to $17,499 | 1,242 (3.4%) | 1,125 (3.4%) |
| $17,500 to $19,999 | 1,017 (2.8%) | 711 (2.1%) |
| $20,000 to $22,499 | 1,551 (4.2%) | 1,066 (3.2%) |
| $22,500 to $24,999 | 1,245 (3.4%) | 1,165 (3.5%) |
| $25,000 to $29,999 | 1,970 (5.3%) | 2,743 (8.2%) |
| $30,000 to $34,999 | 2,322 (6.3%) | 1,465 (4.4%) |
| $35,000 to $39,999 | 1,685 (4.6%) | 1,725 (5.2%) |
| $40,000 to $44,999 | 1,896 (5.1%) | 2,102 (6.3%) |
| $45,000 to $49,999 | 1,532 (4.2%) | 1,363 (4.1%) |
| $50,000 to $54,999 | 1,489 (4.0%) | 909 (2.7%) |
| $55,000 to $64,999 | 2,566 (7.0%) | 1,635 (4.9%) |
| $65,000 to $74,999 | 1,783 (4.8%) | 1,465 (4.4%) |
| $75,000 to $99,999 | 3,064 (8.3%) | 1,883 (5.6%) |
| $100,000+ | 4,564 (12.4%) | 2,342 (7.0%) |
| Total | 36,866 (100.0%) | 33,383 (100.0%) |
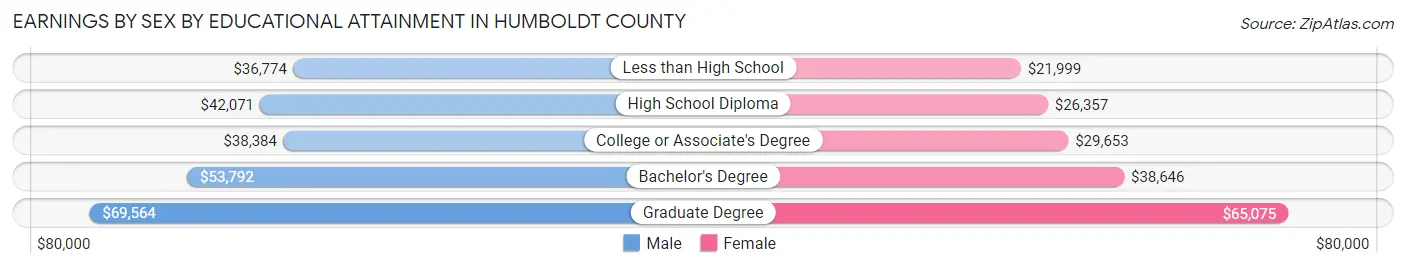
Earnings by Sex by Educational Attainment in Humboldt County
Average earnings in Humboldt County are $43,610 for men and $34,303 for women, a difference of 21.3%. Men with an educational attainment of graduate degree enjoy the highest average annual earnings of $69,564, while those with less than high school education earn the least with $36,774. Women with an educational attainment of graduate degree earn the most with the average annual earnings of $65,075, while those with less than high school education have the smallest earnings of $21,999.
| Educational Attainment | Male Income | Female Income |
| Less than High School | $36,774 | $21,999 |
| High School Diploma | $42,071 | $26,357 |
| College or Associate's Degree | $38,384 | $29,653 |
| Bachelor's Degree | $53,792 | $38,646 |
| Graduate Degree | $69,564 | $65,075 |
| Total | $43,610 | $34,303 |
Family Income in Humboldt County
Family Income Brackets in Humboldt County
According to the Humboldt County family income data, there are 6,026 families falling into the $100,000 to $149,999 income range, which is the most common income bracket and makes up 20.5% of all families. Conversely, the $10,000 to $14,999 income bracket is the least frequent group with only 735 families (2.5%) belonging to this category.
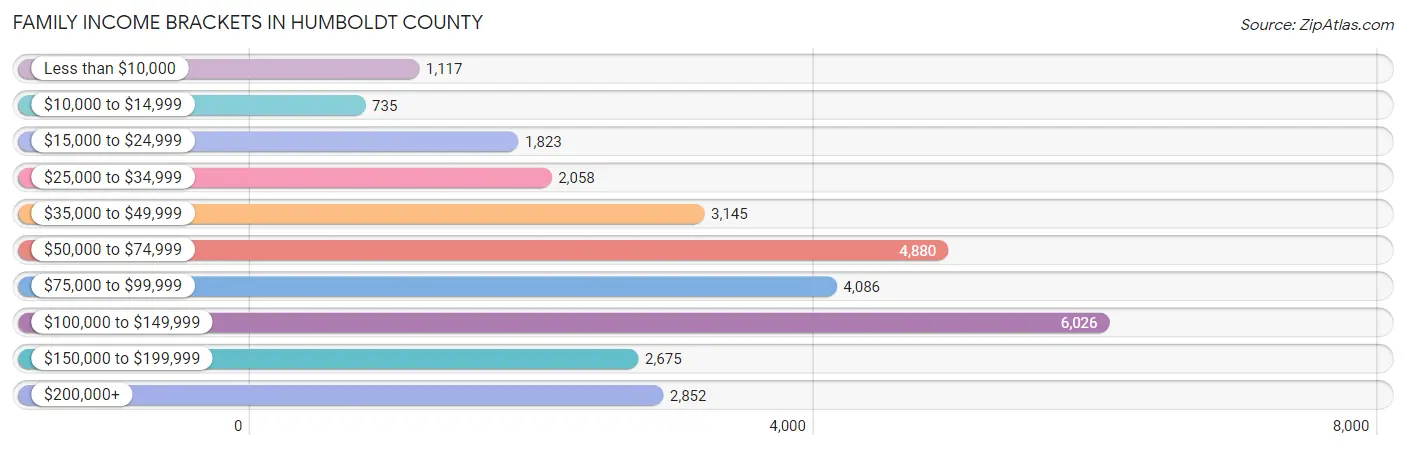
| Income Bracket | # Families | % Families |
| Less than $10,000 | 1,117 | 3.8% |
| $10,000 to $14,999 | 735 | 2.5% |
| $15,000 to $24,999 | 1,823 | 6.2% |
| $25,000 to $34,999 | 2,058 | 7.0% |
| $35,000 to $49,999 | 3,145 | 10.7% |
| $50,000 to $74,999 | 4,880 | 16.6% |
| $75,000 to $99,999 | 4,086 | 13.9% |
| $100,000 to $149,999 | 6,026 | 20.5% |
| $150,000 to $199,999 | 2,675 | 9.1% |
| $200,000+ | 2,852 | 9.7% |
Family Income by Famaliy Size in Humboldt County
7+ person families (458 | 1.6%) account for the highest median family income in Humboldt County with $118,250 per family, while 2-person families (15,686 | 53.4%) have the highest median income of $36,274 per family member.
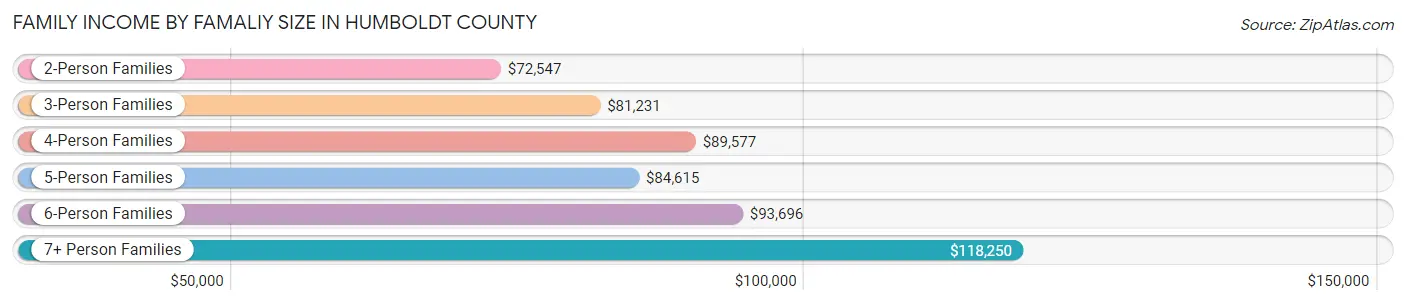
| Income Bracket | # Families | Median Income |
| 2-Person Families | 15,686 (53.4%) | $72,547 |
| 3-Person Families | 5,620 (19.1%) | $81,231 |
| 4-Person Families | 4,891 (16.6%) | $89,577 |
| 5-Person Families | 1,858 (6.3%) | $84,615 |
| 6-Person Families | 884 (3.0%) | $93,696 |
| 7+ Person Families | 458 (1.6%) | $118,250 |
| Total | 29,397 (100.0%) | $80,244 |
Family Income by Number of Earners in Humboldt County
The median family income in Humboldt County is $80,244, with families comprising 3+ earners (2,543) having the highest median family income of $135,975, while families with no earners (5,776) have the lowest median family income of $53,761, accounting for 8.6% and 19.7% of families, respectively.
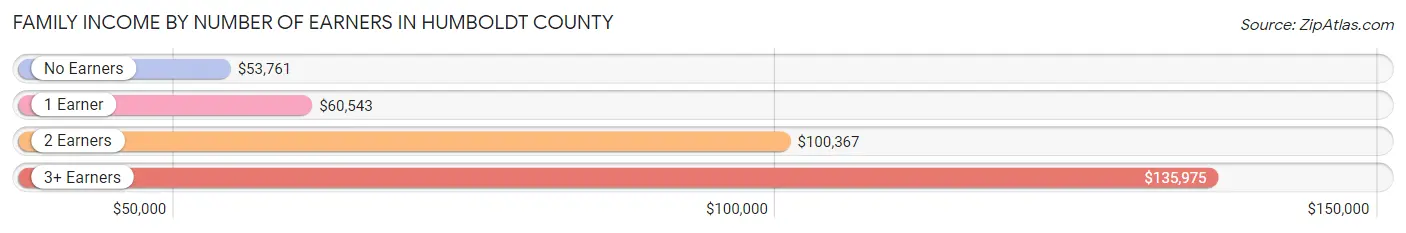
| Number of Earners | # Families | Median Income |
| No Earners | 5,776 (19.7%) | $53,761 |
| 1 Earner | 10,676 (36.3%) | $60,543 |
| 2 Earners | 10,402 (35.4%) | $100,367 |
| 3+ Earners | 2,543 (8.6%) | $135,975 |
| Total | 29,397 (100.0%) | $80,244 |
Household Income in Humboldt County
Household Income Brackets in Humboldt County
With 8,556 households falling in the category, the $50,000 to $74,999 income range is the most frequent in Humboldt County, accounting for 15.7% of all households. In contrast, only 2,997 households (5.5%) fall into the $10,000 to $14,999 income bracket, making it the least populous group.
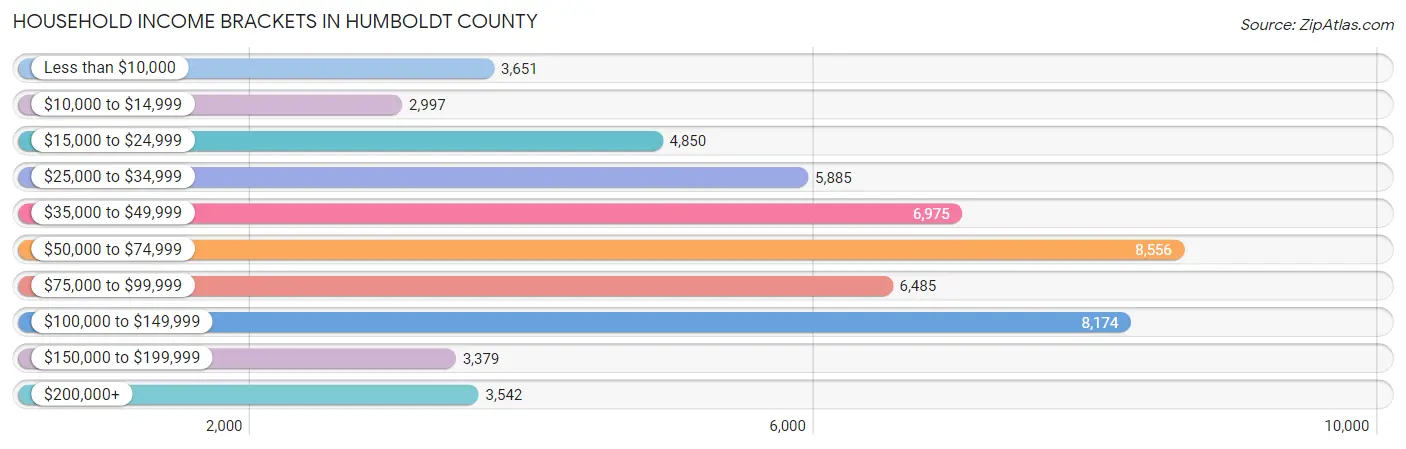
| Income Bracket | # Households | % Households |
| Less than $10,000 | 3,651 | 6.7% |
| $10,000 to $14,999 | 2,997 | 5.5% |
| $15,000 to $24,999 | 4,850 | 8.9% |
| $25,000 to $34,999 | 5,885 | 10.8% |
| $35,000 to $49,999 | 6,975 | 12.8% |
| $50,000 to $74,999 | 8,556 | 15.7% |
| $75,000 to $99,999 | 6,485 | 11.9% |
| $100,000 to $149,999 | 8,174 | 15.0% |
| $150,000 to $199,999 | 3,379 | 6.2% |
| $200,000+ | 3,542 | 6.5% |
Household Income by Householder Age in Humboldt County
The median household income in Humboldt County is $57,881, with the highest median household income of $68,040 found in the 45 to 64 years age bracket for the primary householder. A total of 18,012 households (33.1%) fall into this category. Meanwhile, the 15 to 24 years age bracket for the primary householder has the lowest median household income of $25,432, with 3,810 households (7.0%) in this group.
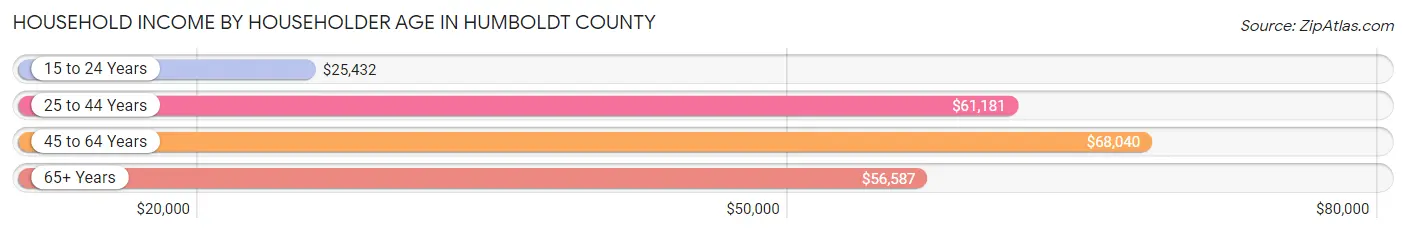
| Income Bracket | # Households | Median Income |
| 15 to 24 Years | 3,810 (7.0%) | $25,432 |
| 25 to 44 Years | 16,303 (29.9%) | $61,181 |
| 45 to 64 Years | 18,012 (33.1%) | $68,040 |
| 65+ Years | 16,370 (30.0%) | $56,587 |
| Total | 54,495 (100.0%) | $57,881 |
Poverty in Humboldt County
Income Below Poverty by Sex and Age in Humboldt County
With 18.7% poverty level for males and 20.9% for females among the residents of Humboldt County, 18 to 24 year old males and 18 to 24 year old females are the most vulnerable to poverty, with 2,514 males (33.4%) and 3,174 females (41.1%) in their respective age groups living below the poverty level.
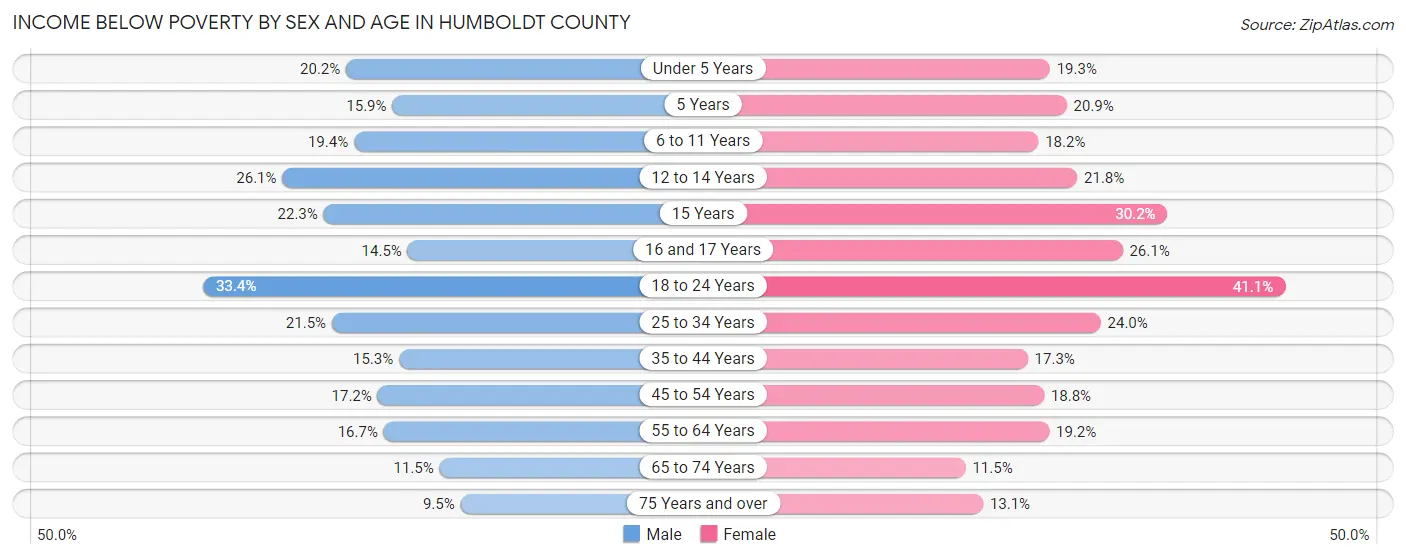
| Age Bracket | Male | Female |
| Under 5 Years | 641 (20.2%) | 631 (19.3%) |
| 5 Years | 96 (15.9%) | 175 (20.9%) |
| 6 to 11 Years | 902 (19.4%) | 760 (18.2%) |
| 12 to 14 Years | 525 (26.1%) | 430 (21.8%) |
| 15 Years | 184 (22.3%) | 178 (30.2%) |
| 16 and 17 Years | 206 (14.4%) | 384 (26.1%) |
| 18 to 24 Years | 2,514 (33.4%) | 3,174 (41.1%) |
| 25 to 34 Years | 1,945 (21.5%) | 2,100 (24.0%) |
| 35 to 44 Years | 1,378 (15.2%) | 1,468 (17.2%) |
| 45 to 54 Years | 1,365 (17.2%) | 1,338 (18.8%) |
| 55 to 64 Years | 1,384 (16.7%) | 1,686 (19.2%) |
| 65 to 74 Years | 894 (11.5%) | 970 (11.5%) |
| 75 Years and over | 377 (9.5%) | 689 (13.1%) |
| Total | 12,411 (18.7%) | 13,983 (20.9%) |
Income Above Poverty by Sex and Age in Humboldt County
According to the poverty statistics in Humboldt County, males aged 75 years and over and females aged 65 to 74 years are the age groups that are most secure financially, with 90.5% of males and 88.5% of females in these age groups living above the poverty line.
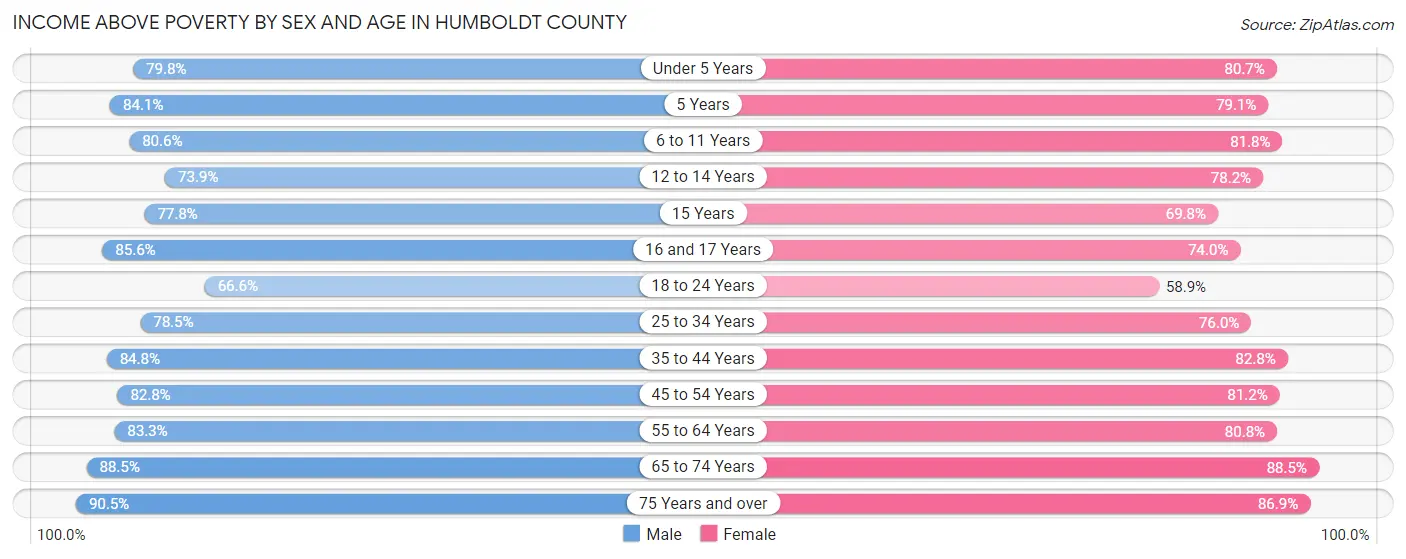
| Age Bracket | Male | Female |
| Under 5 Years | 2,539 (79.8%) | 2,639 (80.7%) |
| 5 Years | 509 (84.1%) | 664 (79.1%) |
| 6 to 11 Years | 3,740 (80.6%) | 3,408 (81.8%) |
| 12 to 14 Years | 1,488 (73.9%) | 1,539 (78.2%) |
| 15 Years | 643 (77.7%) | 411 (69.8%) |
| 16 and 17 Years | 1,220 (85.6%) | 1,090 (74.0%) |
| 18 to 24 Years | 5,005 (66.6%) | 4,543 (58.9%) |
| 25 to 34 Years | 7,112 (78.5%) | 6,642 (76.0%) |
| 35 to 44 Years | 7,656 (84.8%) | 7,041 (82.8%) |
| 45 to 54 Years | 6,551 (82.8%) | 5,796 (81.2%) |
| 55 to 64 Years | 6,918 (83.3%) | 7,076 (80.8%) |
| 65 to 74 Years | 6,888 (88.5%) | 7,483 (88.5%) |
| 75 Years and over | 3,574 (90.5%) | 4,570 (86.9%) |
| Total | 53,843 (81.3%) | 52,902 (79.1%) |
Income Below Poverty Among Married-Couple Families in Humboldt County
The poverty statistics for married-couple families in Humboldt County show that 5.2% or 1,080 of the total 20,694 families live below the poverty line. Families with 5 or more children have the highest poverty rate of 52.8%, comprising of 76 families. On the other hand, families with no children have the lowest poverty rate of 4.0%, which includes 521 families.
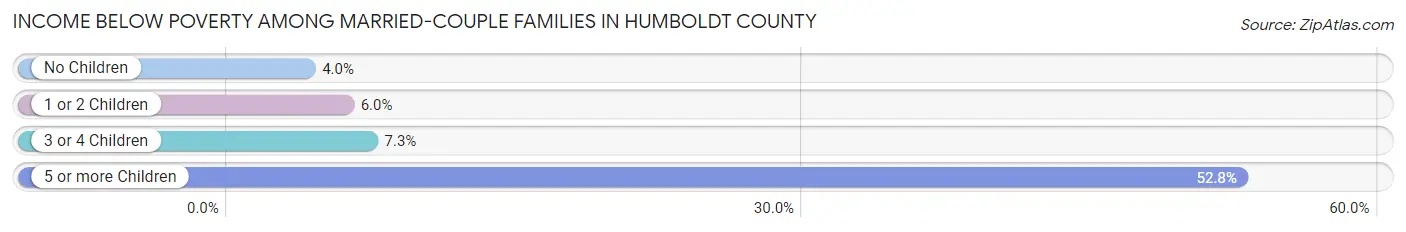
| Children | Above Poverty | Below Poverty |
| No Children | 12,406 (96.0%) | 521 (4.0%) |
| 1 or 2 Children | 5,473 (94.0%) | 352 (6.0%) |
| 3 or 4 Children | 1,667 (92.7%) | 131 (7.3%) |
| 5 or more Children | 68 (47.2%) | 76 (52.8%) |
| Total | 19,614 (94.8%) | 1,080 (5.2%) |
Income Below Poverty Among Single-Parent Households in Humboldt County
According to the poverty data in Humboldt County, 20.6% or 604 single-father households and 27.0% or 1,554 single-mother households are living below the poverty line. Among single-father households, those with 5 or more children have the highest poverty rate, with 4 households (100.0%) experiencing poverty. Likewise, among single-mother households, those with 5 or more children have the highest poverty rate, with 32 households (100.0%) falling below the poverty line.
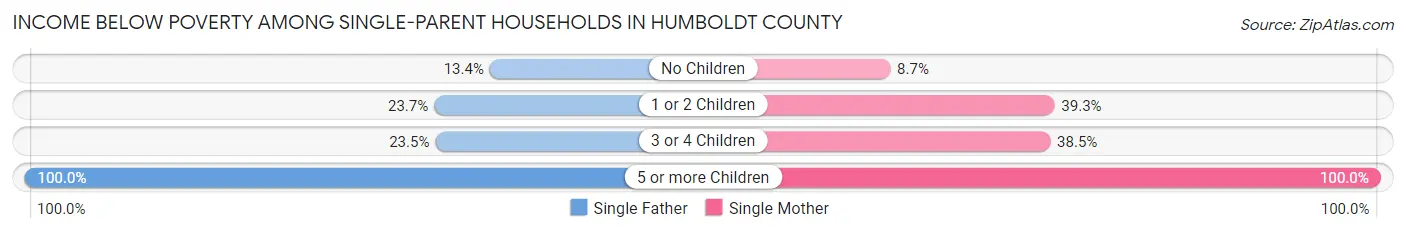
| Children | Single Father | Single Mother |
| No Children | 123 (13.4%) | 205 (8.7%) |
| 1 or 2 Children | 406 (23.7%) | 1,097 (39.3%) |
| 3 or 4 Children | 71 (23.5%) | 220 (38.5%) |
| 5 or more Children | 4 (100.0%) | 32 (100.0%) |
| Total | 604 (20.6%) | 1,554 (27.0%) |
Income Below Poverty Among Married-Couple vs Single-Parent Households in Humboldt County
The poverty data for Humboldt County shows that 1,080 of the married-couple family households (5.2%) and 2,158 of the single-parent households (24.8%) are living below the poverty level. Within the married-couple family households, those with 5 or more children have the highest poverty rate, with 76 households (52.8%) falling below the poverty line. Among the single-parent households, those with 5 or more children have the highest poverty rate, with 36 household (100.0%) living below poverty.
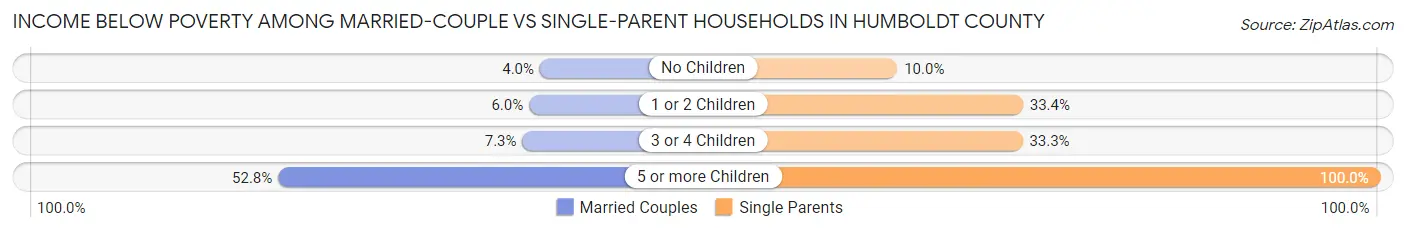
| Children | Married-Couple Families | Single-Parent Households |
| No Children | 521 (4.0%) | 328 (10.0%) |
| 1 or 2 Children | 352 (6.0%) | 1,503 (33.4%) |
| 3 or 4 Children | 131 (7.3%) | 291 (33.3%) |
| 5 or more Children | 76 (52.8%) | 36 (100.0%) |
| Total | 1,080 (5.2%) | 2,158 (24.8%) |
Race in Humboldt County
The most populous races in Humboldt County are White / Caucasian (102,072 | 75.0%), Hispanic or Latino (17,129 | 12.6%), and Two or more Races (14,392 | 10.6%).
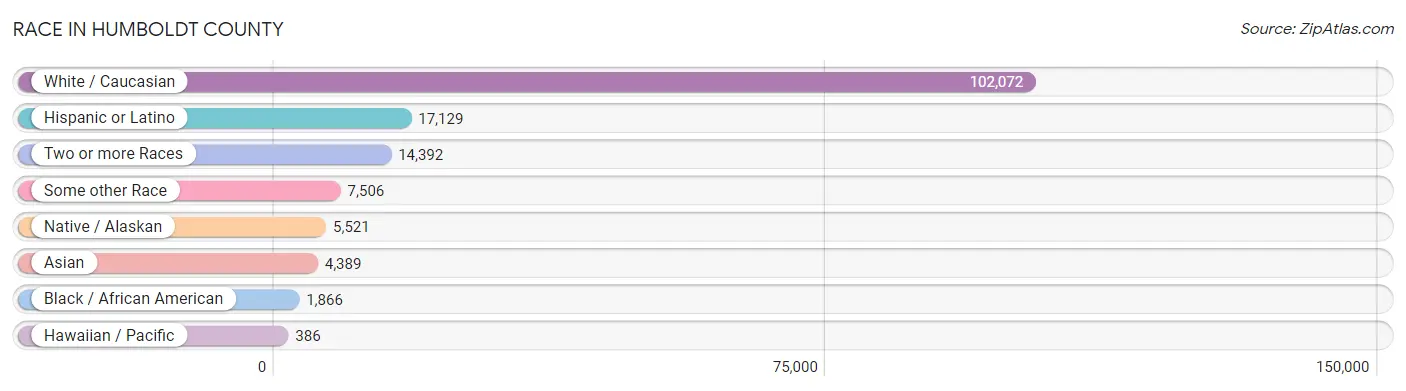
| Race | # Population | % Population |
| Asian | 4,389 | 3.2% |
| Black / African American | 1,866 | 1.4% |
| Hawaiian / Pacific | 386 | 0.3% |
| Hispanic or Latino | 17,129 | 12.6% |
| Native / Alaskan | 5,521 | 4.1% |
| White / Caucasian | 102,072 | 75.0% |
| Two or more Races | 14,392 | 10.6% |
| Some other Race | 7,506 | 5.5% |
| Total | 136,132 | 100.0% |
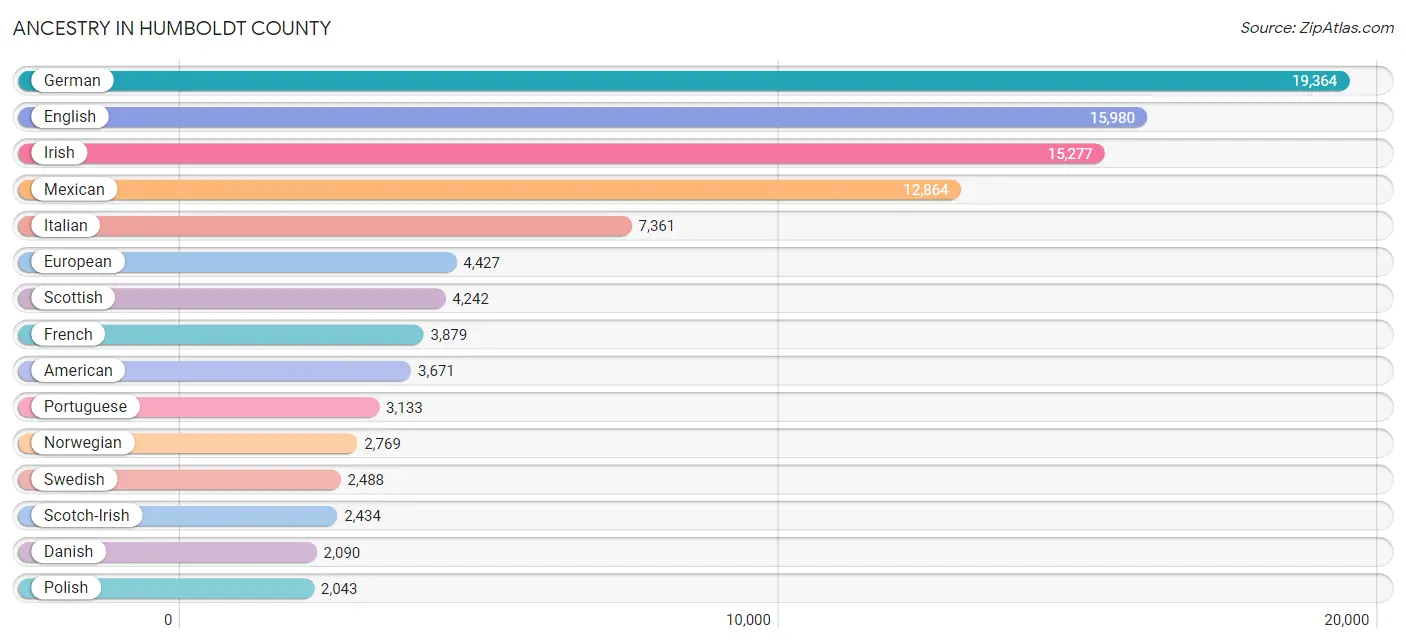
Ancestry in Humboldt County
The most populous ancestries reported in Humboldt County are German (19,364 | 14.2%), English (15,980 | 11.7%), Irish (15,277 | 11.2%), Mexican (12,864 | 9.5%), and Italian (7,361 | 5.4%), together accounting for 52.0% of all Humboldt County residents.
| Ancestry | # Population | % Population |
| African | 58 | 0.0% |
| Alaskan Athabascan | 9 | 0.0% |
| Albanian | 27 | 0.0% |
| Aleut | 202 | 0.2% |
| American | 3,671 | 2.7% |
| Apache | 85 | 0.1% |
| Arab | 323 | 0.2% |
| Argentinean | 7 | 0.0% |
| Armenian | 139 | 0.1% |
| Assyrian / Chaldean / Syriac | 8 | 0.0% |
| Australian | 6 | 0.0% |
| Austrian | 239 | 0.2% |
| Bangladeshi | 1,368 | 1.0% |
| Basque | 417 | 0.3% |
| Belgian | 191 | 0.1% |
| Belizean | 71 | 0.1% |
| Bhutanese | 1,384 | 1.0% |
| Blackfeet | 389 | 0.3% |
| Bolivian | 60 | 0.0% |
| Brazilian | 67 | 0.1% |
| British | 970 | 0.7% |
| British West Indian | 3 | 0.0% |
| Bulgarian | 60 | 0.0% |
| Burmese | 437 | 0.3% |
| Canadian | 144 | 0.1% |
| Cape Verdean | 53 | 0.0% |
| Carpatho Rusyn | 1 | 0.0% |
| Celtic | 46 | 0.0% |
| Central American | 874 | 0.6% |
| Central American Indian | 104 | 0.1% |
| Cherokee | 1,281 | 0.9% |
| Cheyenne | 39 | 0.0% |
| Chickasaw | 58 | 0.0% |
| Chilean | 126 | 0.1% |
| Chinese | 140 | 0.1% |
| Chippewa | 162 | 0.1% |
| Choctaw | 176 | 0.1% |
| Colombian | 251 | 0.2% |
| Comanche | 10 | 0.0% |
| Costa Rican | 168 | 0.1% |
| Creek | 138 | 0.1% |
| Croatian | 281 | 0.2% |
| Crow | 2 | 0.0% |
| Cuban | 283 | 0.2% |
| Czech | 300 | 0.2% |
| Czechoslovakian | 57 | 0.0% |
| Danish | 2,090 | 1.5% |
| Delaware | 53 | 0.0% |
| Dominican | 40 | 0.0% |
| Dutch | 1,966 | 1.4% |
| Dutch West Indian | 50 | 0.0% |
| Eastern European | 973 | 0.7% |
| Ecuadorian | 107 | 0.1% |
| Egyptian | 67 | 0.1% |
| English | 15,980 | 11.7% |
| Ethiopian | 41 | 0.0% |
| European | 4,427 | 3.3% |
| Filipino | 20 | 0.0% |
| Finnish | 685 | 0.5% |
| French | 3,879 | 2.9% |
| French Canadian | 686 | 0.5% |
| German | 19,364 | 14.2% |
| Ghanaian | 105 | 0.1% |
| Greek | 410 | 0.3% |
| Guamanian / Chamorro | 144 | 0.1% |
| Guatemalan | 147 | 0.1% |
| Guyanese | 15 | 0.0% |
| Honduran | 21 | 0.0% |
| Hungarian | 270 | 0.2% |
| Icelander | 115 | 0.1% |
| Indian (Asian) | 1,152 | 0.9% |
| Inupiat | 23 | 0.0% |
| Iranian | 57 | 0.0% |
| Iraqi | 20 | 0.0% |
| Irish | 15,277 | 11.2% |
| Iroquois | 383 | 0.3% |
| Israeli | 58 | 0.0% |
| Italian | 7,361 | 5.4% |
| Jamaican | 95 | 0.1% |
| Japanese | 50 | 0.0% |
| Korean | 1,225 | 0.9% |
| Laotian | 86 | 0.1% |
| Latvian | 237 | 0.2% |
| Lebanese | 99 | 0.1% |
| Lithuanian | 33 | 0.0% |
| Malaysian | 192 | 0.1% |
| Maltese | 46 | 0.0% |
| Mexican | 12,864 | 9.5% |
| Mexican American Indian | 226 | 0.2% |
| Native Hawaiian | 422 | 0.3% |
| Navajo | 140 | 0.1% |
| New Zealander | 42 | 0.0% |
| Nicaraguan | 99 | 0.1% |
| Nigerian | 24 | 0.0% |
| Northern European | 1,441 | 1.1% |
| Norwegian | 2,769 | 2.0% |
| Ottawa | 41 | 0.0% |
| Paiute | 72 | 0.1% |
| Pakistani | 66 | 0.1% |
| Palestinian | 19 | 0.0% |
| Panamanian | 15 | 0.0% |
| Pennsylvania German | 136 | 0.1% |
| Peruvian | 235 | 0.2% |
| Pima | 34 | 0.0% |
| Polish | 2,043 | 1.5% |
| Portuguese | 3,133 | 2.3% |
| Potawatomi | 45 | 0.0% |
| Pueblo | 6 | 0.0% |
| Puerto Rican | 646 | 0.5% |
| Puget Sound Salish | 2 | 0.0% |
| Romanian | 38 | 0.0% |
| Russian | 1,074 | 0.8% |
| Salvadoran | 424 | 0.3% |
| Samoan | 174 | 0.1% |
| Scandinavian | 1,033 | 0.8% |
| Scotch-Irish | 2,434 | 1.8% |
| Scottish | 4,242 | 3.1% |
| Seminole | 148 | 0.1% |
| Serbian | 13 | 0.0% |
| Sioux | 204 | 0.2% |
| Slavic | 107 | 0.1% |
| Slovak | 70 | 0.1% |
| Slovene | 13 | 0.0% |
| South African | 17 | 0.0% |
| South American | 819 | 0.6% |
| South American Indian | 8 | 0.0% |
| Spaniard | 731 | 0.5% |
| Spanish | 447 | 0.3% |
| Spanish American | 16 | 0.0% |
| Spanish American Indian | 5 | 0.0% |
| Sri Lankan | 407 | 0.3% |
| Subsaharan African | 320 | 0.2% |
| Swedish | 2,488 | 1.8% |
| Swiss | 1,009 | 0.7% |
| Syrian | 7 | 0.0% |
| Taiwanese | 51 | 0.0% |
| Thai | 330 | 0.2% |
| Tohono O'Odham | 76 | 0.1% |
| Tongan | 124 | 0.1% |
| Trinidadian and Tobagonian | 27 | 0.0% |
| Turkish | 12 | 0.0% |
| Ugandan | 13 | 0.0% |
| Ukrainian | 399 | 0.3% |
| Uruguayan | 2 | 0.0% |
| Venezuelan | 12 | 0.0% |
| Welsh | 1,601 | 1.2% |
| West Indian | 119 | 0.1% |
| Yakama | 1 | 0.0% |
| Yaqui | 102 | 0.1% |
| Yugoslavian | 128 | 0.1% | View All 150 Rows |
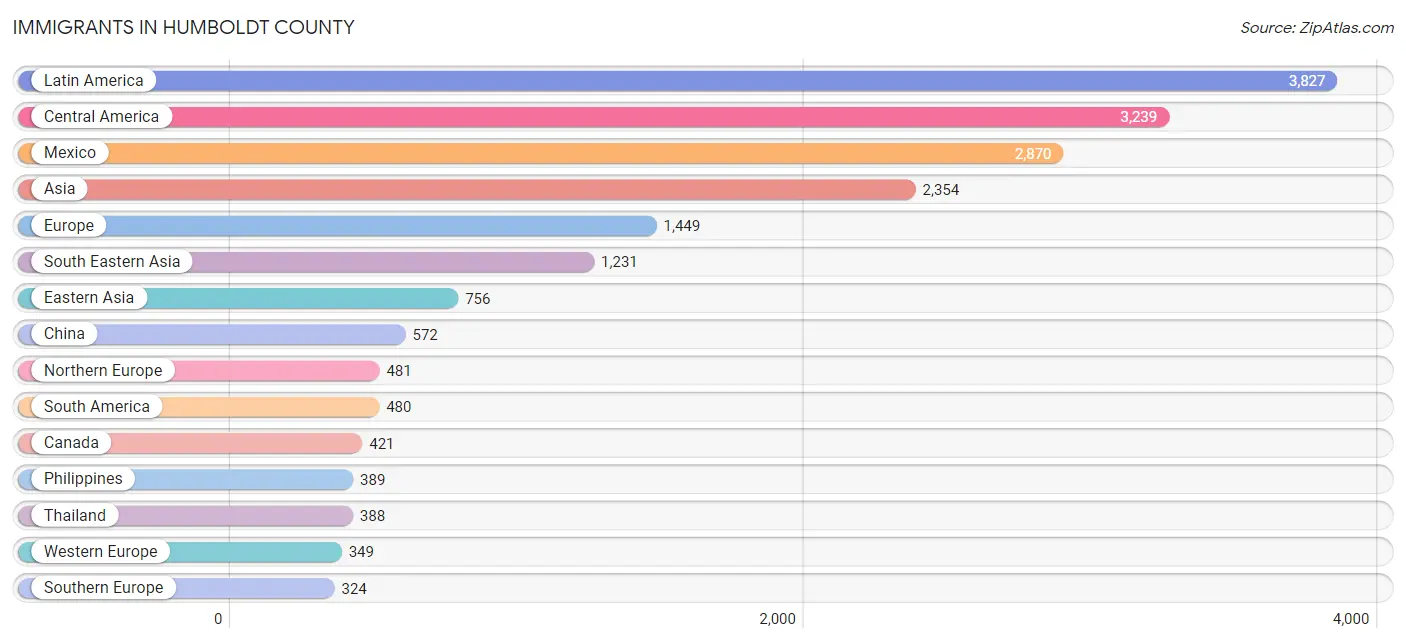
Immigrants in Humboldt County
The most numerous immigrant groups reported in Humboldt County came from Latin America (3,827 | 2.8%), Central America (3,239 | 2.4%), Mexico (2,870 | 2.1%), Asia (2,354 | 1.7%), and Europe (1,449 | 1.1%), together accounting for 10.1% of all Humboldt County residents.
| Immigration Origin | # Population | % Population |
| Africa | 133 | 0.1% |
| Asia | 2,354 | 1.7% |
| Australia | 47 | 0.0% |
| Austria | 4 | 0.0% |
| Azores | 54 | 0.0% |
| Bolivia | 38 | 0.0% |
| Brazil | 151 | 0.1% |
| Bulgaria | 52 | 0.0% |
| Cambodia | 7 | 0.0% |
| Canada | 421 | 0.3% |
| Caribbean | 108 | 0.1% |
| Central America | 3,239 | 2.4% |
| Chile | 59 | 0.0% |
| China | 572 | 0.4% |
| Colombia | 81 | 0.1% |
| Cuba | 74 | 0.1% |
| Czechoslovakia | 55 | 0.0% |
| Denmark | 20 | 0.0% |
| Dominican Republic | 16 | 0.0% |
| Eastern Africa | 27 | 0.0% |
| Eastern Asia | 756 | 0.6% |
| Eastern Europe | 295 | 0.2% |
| Ecuador | 33 | 0.0% |
| El Salvador | 233 | 0.2% |
| England | 282 | 0.2% |
| Ethiopia | 14 | 0.0% |
| Europe | 1,449 | 1.1% |
| Fiji | 137 | 0.1% |
| France | 5 | 0.0% |
| Germany | 219 | 0.2% |
| Ghana | 71 | 0.1% |
| Guatemala | 61 | 0.0% |
| Guyana | 12 | 0.0% |
| Hong Kong | 56 | 0.0% |
| India | 63 | 0.1% |
| Iran | 36 | 0.0% |
| Iraq | 17 | 0.0% |
| Ireland | 15 | 0.0% |
| Italy | 99 | 0.1% |
| Japan | 62 | 0.1% |
| Kazakhstan | 5 | 0.0% |
| Korea | 122 | 0.1% |
| Laos | 249 | 0.2% |
| Latin America | 3,827 | 2.8% |
| Latvia | 13 | 0.0% |
| Liberia | 1 | 0.0% |
| Mexico | 2,870 | 2.1% |
| Morocco | 7 | 0.0% |
| Netherlands | 99 | 0.1% |
| Nicaragua | 60 | 0.0% |
| Northern Africa | 11 | 0.0% |
| Northern Europe | 481 | 0.4% |
| Oceania | 234 | 0.2% |
| Pakistan | 143 | 0.1% |
| Panama | 15 | 0.0% |
| Peru | 106 | 0.1% |
| Philippines | 389 | 0.3% |
| Poland | 17 | 0.0% |
| Portugal | 210 | 0.2% |
| Romania | 66 | 0.1% |
| Russia | 76 | 0.1% |
| Scotland | 13 | 0.0% |
| Serbia | 3 | 0.0% |
| South Africa | 14 | 0.0% |
| South America | 480 | 0.4% |
| South Central Asia | 281 | 0.2% |
| South Eastern Asia | 1,231 | 0.9% |
| Southern Europe | 324 | 0.2% |
| Spain | 15 | 0.0% |
| Sri Lanka | 34 | 0.0% |
| Sudan | 4 | 0.0% |
| Sweden | 1 | 0.0% |
| Switzerland | 22 | 0.0% |
| Taiwan | 28 | 0.0% |
| Thailand | 388 | 0.3% |
| Trinidad and Tobago | 18 | 0.0% |
| Uganda | 13 | 0.0% |
| Ukraine | 4 | 0.0% |
| Vietnam | 176 | 0.1% |
| Western Africa | 81 | 0.1% |
| Western Asia | 86 | 0.1% |
| Western Europe | 349 | 0.3% |
| Yemen | 49 | 0.0% | View All 83 Rows |
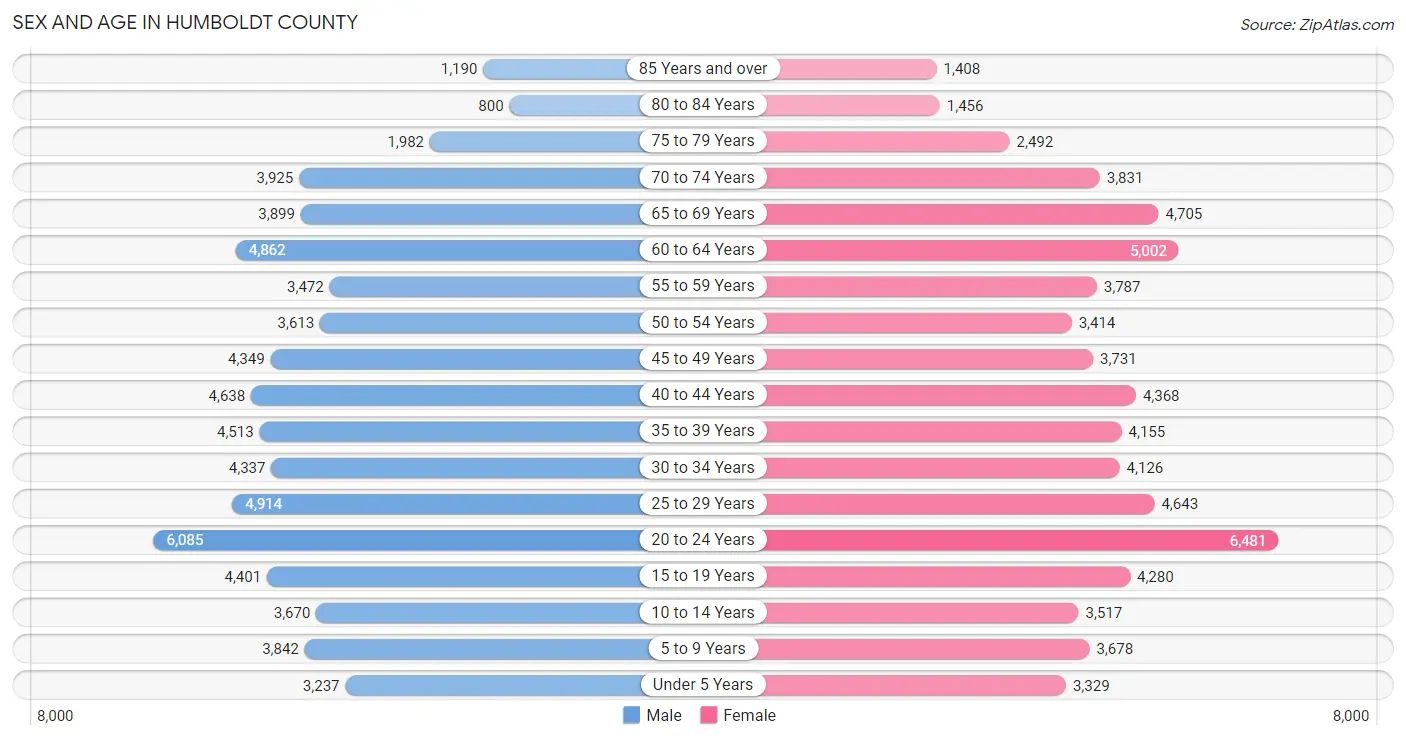
Sex and Age in Humboldt County
Sex and Age in Humboldt County
The most populous age groups in Humboldt County are 20 to 24 Years (6,085 | 9.0%) for men and 20 to 24 Years (6,481 | 9.5%) for women.
| Age Bracket | Male | Female |
| Under 5 Years | 3,237 (4.8%) | 3,329 (4.9%) |
| 5 to 9 Years | 3,842 (5.7%) | 3,678 (5.4%) |
| 10 to 14 Years | 3,670 (5.4%) | 3,517 (5.1%) |
| 15 to 19 Years | 4,401 (6.5%) | 4,280 (6.3%) |
| 20 to 24 Years | 6,085 (9.0%) | 6,481 (9.5%) |
| 25 to 29 Years | 4,914 (7.3%) | 4,643 (6.8%) |
| 30 to 34 Years | 4,337 (6.4%) | 4,126 (6.0%) |
| 35 to 39 Years | 4,513 (6.7%) | 4,155 (6.1%) |
| 40 to 44 Years | 4,638 (6.9%) | 4,368 (6.4%) |
| 45 to 49 Years | 4,349 (6.4%) | 3,731 (5.4%) |
| 50 to 54 Years | 3,613 (5.3%) | 3,414 (5.0%) |
| 55 to 59 Years | 3,472 (5.1%) | 3,787 (5.5%) |
| 60 to 64 Years | 4,862 (7.2%) | 5,002 (7.3%) |
| 65 to 69 Years | 3,899 (5.8%) | 4,705 (6.9%) |
| 70 to 74 Years | 3,925 (5.8%) | 3,831 (5.6%) |
| 75 to 79 Years | 1,982 (2.9%) | 2,492 (3.6%) |
| 80 to 84 Years | 800 (1.2%) | 1,456 (2.1%) |
| 85 Years and over | 1,190 (1.8%) | 1,408 (2.1%) |
| Total | 67,729 (100.0%) | 68,403 (100.0%) |
Families and Households in Humboldt County
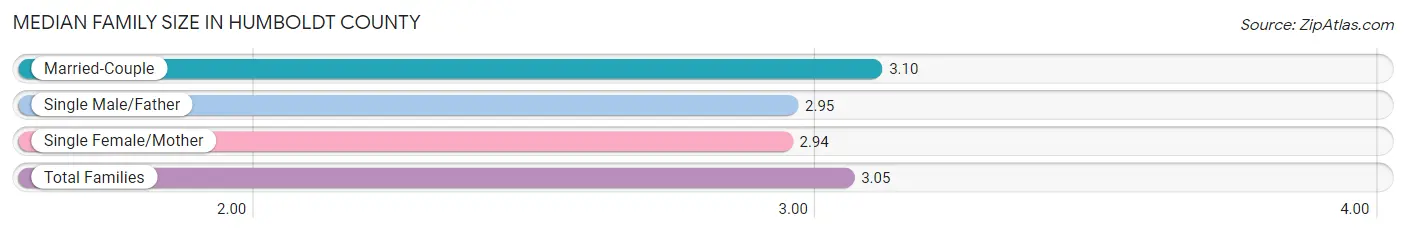
Median Family Size in Humboldt County
The median family size in Humboldt County is 3.05 persons per family, with married-couple families (20,694 | 70.4%) accounting for the largest median family size of 3.1 persons per family. On the other hand, single female/mother families (5,766 | 19.6%) represent the smallest median family size with 2.94 persons per family.
| Family Type | # Families | Family Size |
| Married-Couple | 20,694 (70.4%) | 3.10 |
| Single Male/Father | 2,937 (10.0%) | 2.95 |
| Single Female/Mother | 5,766 (19.6%) | 2.94 |
| Total Families | 29,397 (100.0%) | 3.05 |
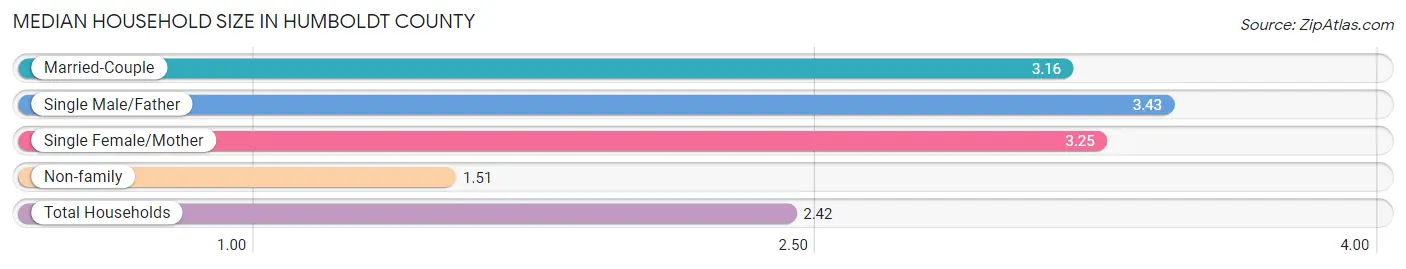
Median Household Size in Humboldt County
The median household size in Humboldt County is 2.42 persons per household, with single male/father households (2,937 | 5.4%) accounting for the largest median household size of 3.43 persons per household. non-family households (25,098 | 46.1%) represent the smallest median household size with 1.51 persons per household.
| Household Type | # Households | Household Size |
| Married-Couple | 20,694 (38.0%) | 3.16 |
| Single Male/Father | 2,937 (5.4%) | 3.43 |
| Single Female/Mother | 5,766 (10.6%) | 3.25 |
| Non-family | 25,098 (46.1%) | 1.51 |
| Total Households | 54,495 (100.0%) | 2.42 |
Household Size by Marriage Status in Humboldt County
Out of a total of 54,495 households in Humboldt County, 29,397 (53.9%) are family households, while 25,098 (46.1%) are nonfamily households. The most numerous type of family households are 2-person households, comprising 14,103, and the most common type of nonfamily households are 1-person households, comprising 17,194.
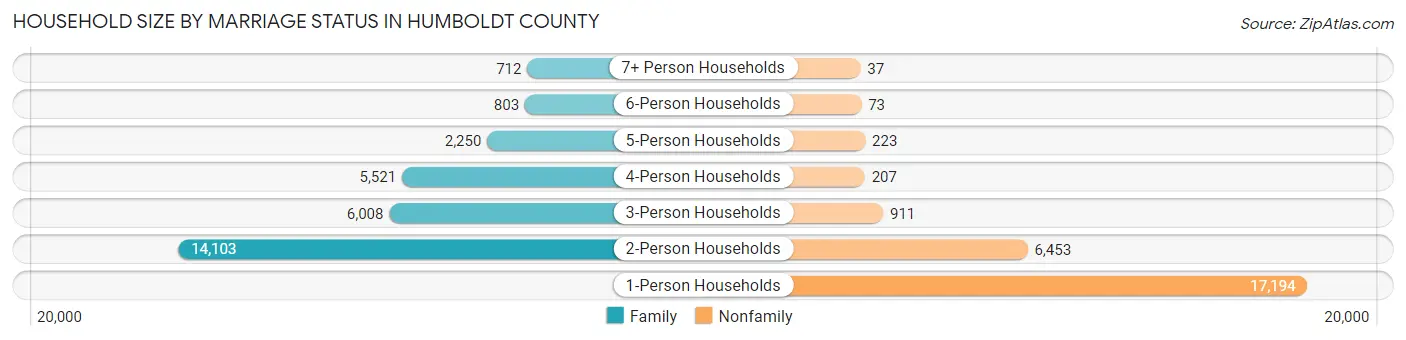
| Household Size | Family Households | Nonfamily Households |
| 1-Person Households | - | 17,194 (31.6%) |
| 2-Person Households | 14,103 (25.9%) | 6,453 (11.8%) |
| 3-Person Households | 6,008 (11.0%) | 911 (1.7%) |
| 4-Person Households | 5,521 (10.1%) | 207 (0.4%) |
| 5-Person Households | 2,250 (4.1%) | 223 (0.4%) |
| 6-Person Households | 803 (1.5%) | 73 (0.1%) |
| 7+ Person Households | 712 (1.3%) | 37 (0.1%) |
| Total | 29,397 (53.9%) | 25,098 (46.1%) |
Female Fertility in Humboldt County
Fertility by Age in Humboldt County
Average fertility rate in Humboldt County is 42.0 births per 1,000 women. Women in the age bracket of 20 to 34 years have the highest fertility rate with 67.0 births per 1,000 women. Women in the age bracket of 20 to 34 years acount for 75.3% of all women with births.
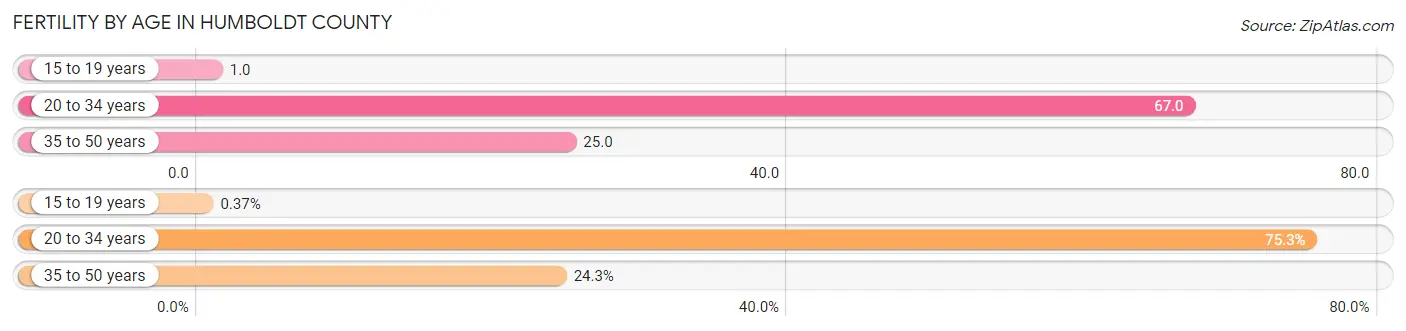
| Age Bracket | Women with Births | Births / 1,000 Women |
| 15 to 19 years | 5 (0.4%) | 1.0 |
| 20 to 34 years | 1,024 (75.3%) | 67.0 |
| 35 to 50 years | 331 (24.3%) | 25.0 |
| Total | 1,360 (100.0%) | 42.0 |
Fertility by Age by Marriage Status in Humboldt County
65.4% of women with births (1,360) in Humboldt County are married. The highest percentage of unmarried women with births falls into 15 to 19 years age bracket with 100.0% of them unmarried at the time of birth, while the lowest percentage of unmarried women with births belong to 35 to 50 years age bracket with 29.0% of them unmarried.
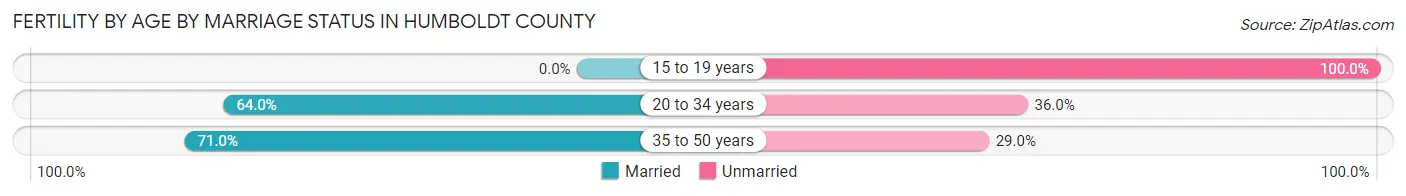
| Age Bracket | Married | Unmarried |
| 15 to 19 years | 0 (0.0%) | 5 (100.0%) |
| 20 to 34 years | 655 (64.0%) | 369 (36.0%) |
| 35 to 50 years | 235 (71.0%) | 96 (29.0%) |
| Total | 889 (65.4%) | 471 (34.6%) |
Fertility by Education in Humboldt County
Average fertility rate in Humboldt County is 42.0 births per 1,000 women. Women with the education attainment of high school diploma have the highest fertility rate of 69.0 births per 1,000 women, while women with the education attainment of bachelor's degree have the lowest fertility at 28.0 births per 1,000 women. Women with the education attainment of college or associate's degree represent 38.1% of all women with births.
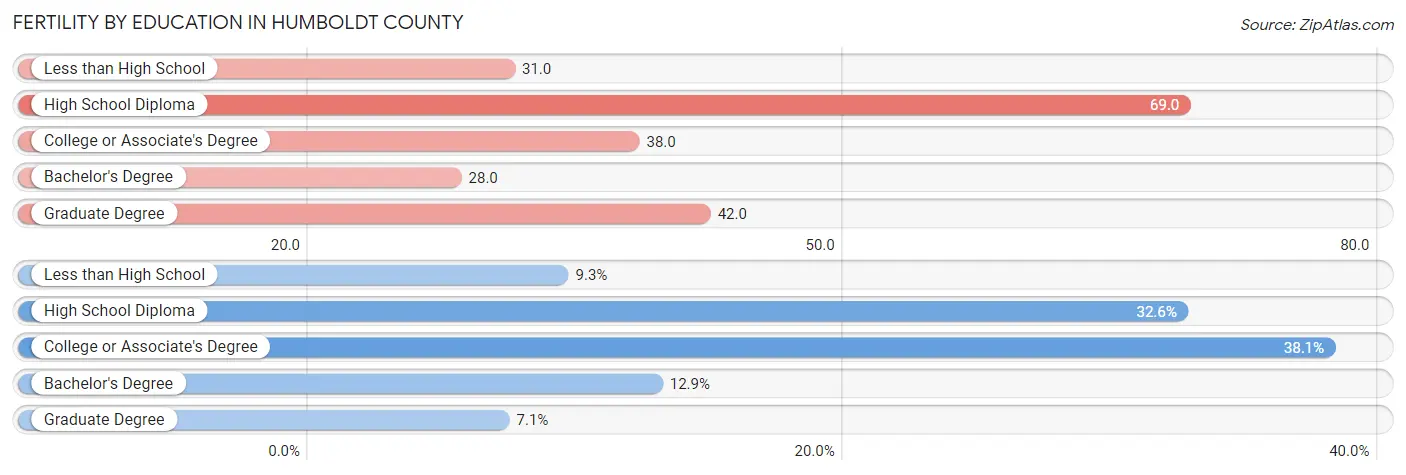
| Educational Attainment | Women with Births | Births / 1,000 Women |
| Less than High School | 127 (9.3%) | 31.0 |
| High School Diploma | 443 (32.6%) | 69.0 |
| College or Associate's Degree | 518 (38.1%) | 38.0 |
| Bachelor's Degree | 175 (12.9%) | 28.0 |
| Graduate Degree | 97 (7.1%) | 42.0 |
| Total | 1,360 (100.0%) | 42.0 |
Fertility by Education by Marriage Status in Humboldt County
34.6% of women with births in Humboldt County are unmarried. Women with the educational attainment of less than high school are most likely to be married with 100.0% of them married at childbirth, while women with the educational attainment of college or associate's degree are least likely to be married with 58.3% of them unmarried at childbirth.
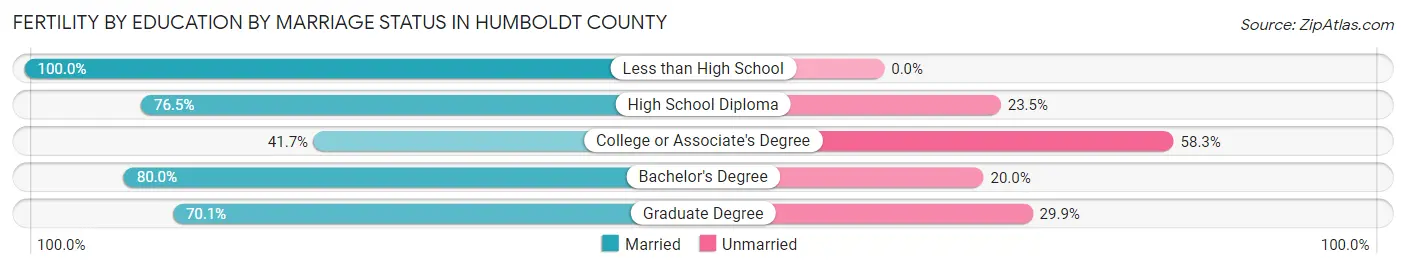
| Educational Attainment | Married | Unmarried |
| Less than High School | 127 (100.0%) | 0 (0.0%) |
| High School Diploma | 339 (76.5%) | 104 (23.5%) |
| College or Associate's Degree | 216 (41.7%) | 302 (58.3%) |
| Bachelor's Degree | 140 (80.0%) | 35 (20.0%) |
| Graduate Degree | 68 (70.1%) | 29 (29.9%) |
| Total | 889 (65.4%) | 471 (34.6%) |
Employment Characteristics in Humboldt County
Employment by Class of Employer in Humboldt County
Among the 58,327 employed individuals in Humboldt County, private company employees (31,508 | 54.0%), self-employed (not incorporated) (7,243 | 12.4%), and local government employees (5,694 | 9.8%) make up the most common classes of employment.
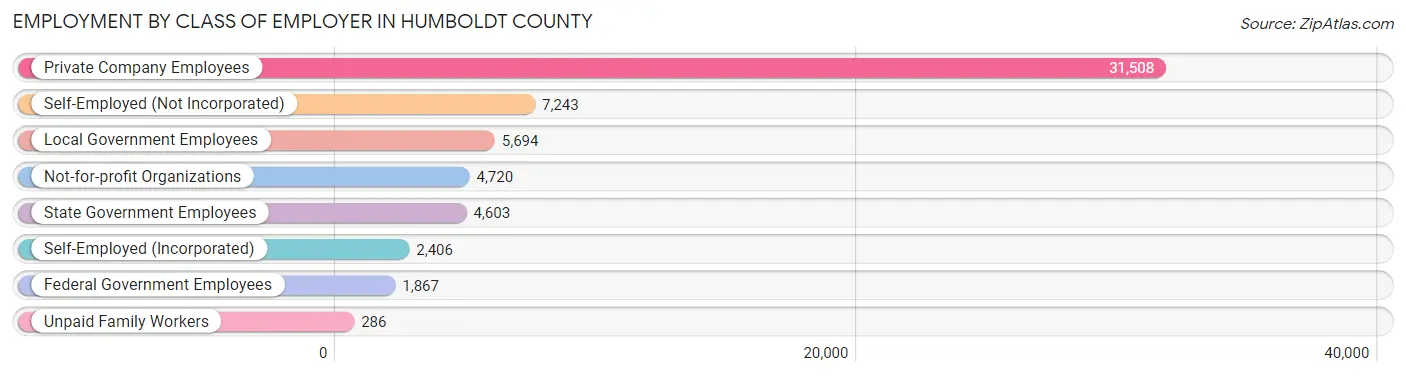
| Employer Class | # Employees | % Employees |
| Private Company Employees | 31,508 | 54.0% |
| Self-Employed (Incorporated) | 2,406 | 4.1% |
| Self-Employed (Not Incorporated) | 7,243 | 12.4% |
| Not-for-profit Organizations | 4,720 | 8.1% |
| Local Government Employees | 5,694 | 9.8% |
| State Government Employees | 4,603 | 7.9% |
| Federal Government Employees | 1,867 | 3.2% |
| Unpaid Family Workers | 286 | 0.5% |
| Total | 58,327 | 100.0% |
Employment Status by Age in Humboldt County
According to the labor force statistics for Humboldt County, out of the total population over 16 years of age (113,440), 58.9% or 66,816 individuals are in the labor force, with 9.2% or 6,147 of them unemployed. The age group with the highest labor force participation rate is 25 to 29 years, with 81.1% or 7,751 individuals in the labor force. Within the labor force, the 16 to 19 years age range has the highest percentage of unemployed individuals, with 21.4% or 642 of them being unemployed.
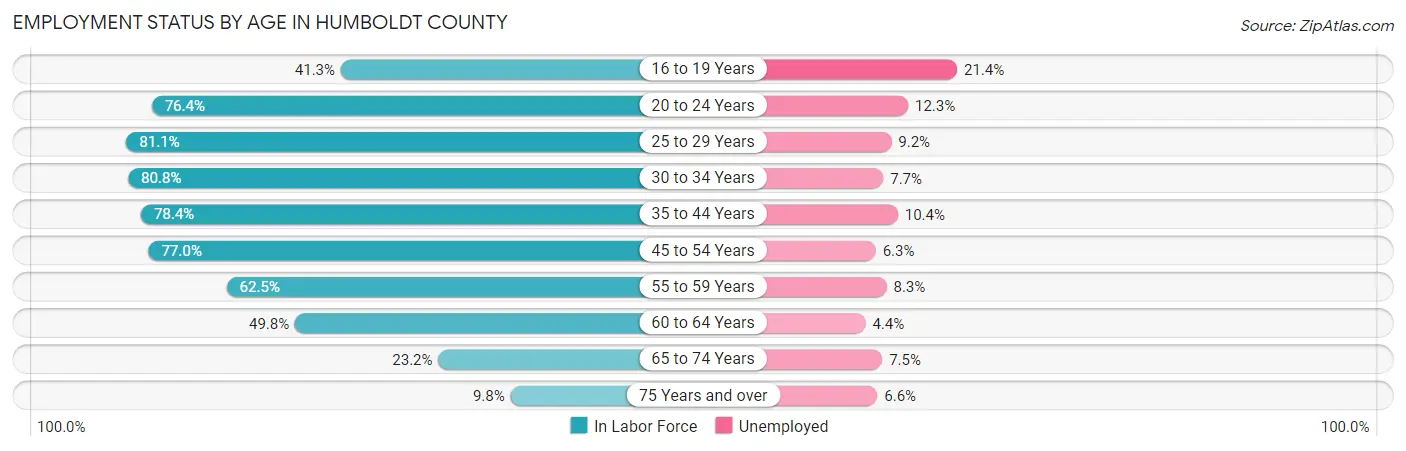
| Age Bracket | In Labor Force | Unemployed |
| 16 to 19 Years | 2,999 (41.3%) | 642 (21.4%) |
| 20 to 24 Years | 9,600 (76.4%) | 1,181 (12.3%) |
| 25 to 29 Years | 7,751 (81.1%) | 713 (9.2%) |
| 30 to 34 Years | 6,838 (80.8%) | 527 (7.7%) |
| 35 to 44 Years | 13,856 (78.4%) | 1,441 (10.4%) |
| 45 to 54 Years | 11,632 (77.0%) | 733 (6.3%) |
| 55 to 59 Years | 4,537 (62.5%) | 377 (8.3%) |
| 60 to 64 Years | 4,912 (49.8%) | 216 (4.4%) |
| 65 to 74 Years | 3,796 (23.2%) | 285 (7.5%) |
| 75 Years and over | 914 (9.8%) | 60 (6.6%) |
| Total | 66,816 (58.9%) | 6,147 (9.2%) |
Employment Status by Educational Attainment in Humboldt County
According to labor force statistics for Humboldt County, 72.9% of individuals (49,517) out of the total population between 25 and 64 years of age (67,924) are in the labor force, with 8.1% or 4,011 of them being unemployed. The group with the highest labor force participation rate are those with the educational attainment of bachelor's degree or higher, with 83.1% or 16,579 individuals in the labor force. Within the labor force, individuals with college / associate degree education have the highest percentage of unemployment, with 10.4% or 1,943 of them being unemployed.
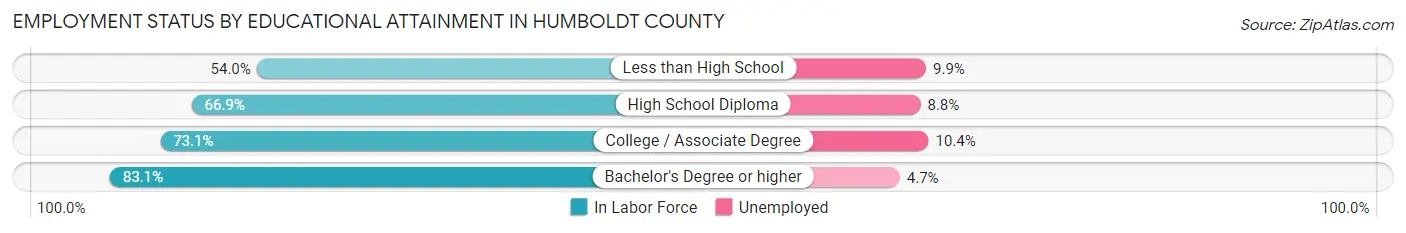
| Educational Attainment | In Labor Force | Unemployed |
| Less than High School | 3,158 (54.0%) | 579 (9.9%) |
| High School Diploma | 11,088 (66.9%) | 1,459 (8.8%) |
| College / Associate Degree | 18,678 (73.1%) | 2,657 (10.4%) |
| Bachelor's Degree or higher | 16,579 (83.1%) | 938 (4.7%) |
| Total | 49,517 (72.9%) | 5,502 (8.1%) |
Employment Occupations by Sex in Humboldt County
Management, Business, Science and Arts Occupations
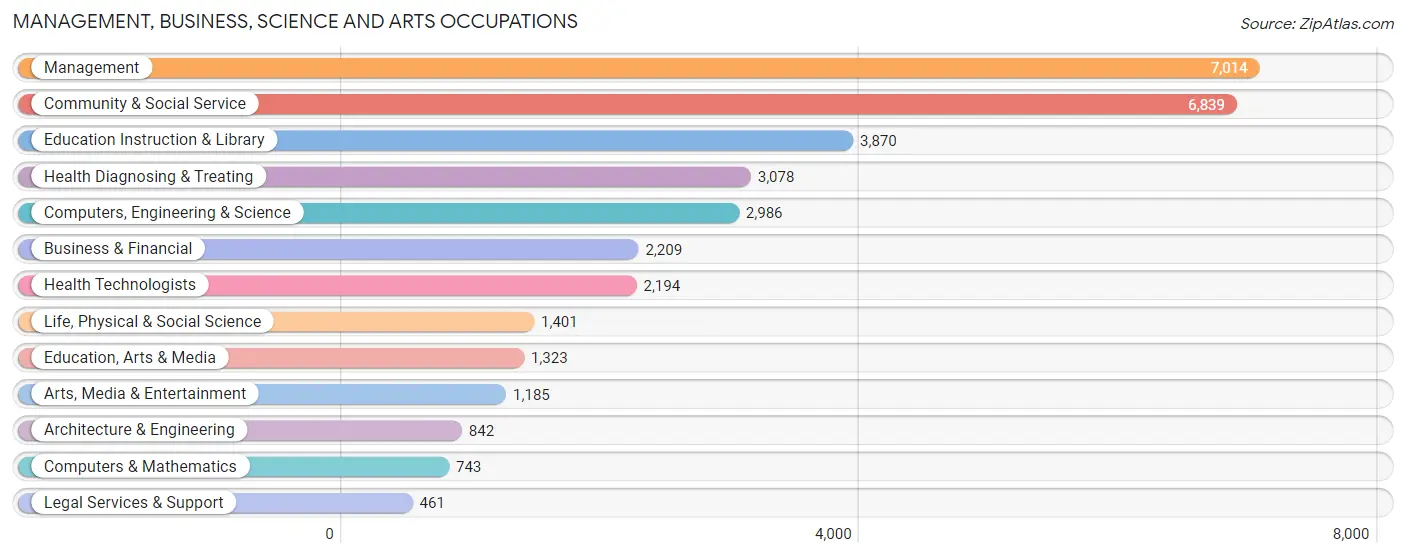
The most common Management, Business, Science and Arts occupations in Humboldt County are Management (7,014 | 11.6%), Community & Social Service (6,839 | 11.3%), Education Instruction & Library (3,870 | 6.4%), Health Diagnosing & Treating (3,078 | 5.1%), and Computers, Engineering & Science (2,986 | 4.9%).
Management, Business, Science and Arts Occupations by Sex
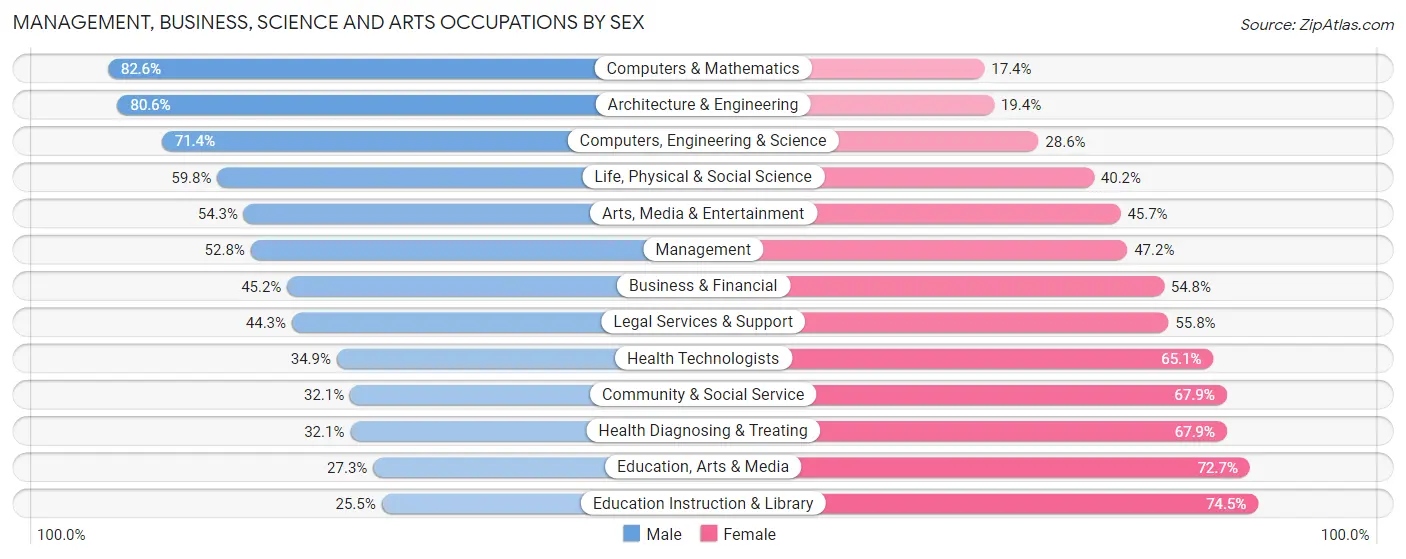
Within the Management, Business, Science and Arts occupations in Humboldt County, the most male-oriented occupations are Computers & Mathematics (82.6%), Architecture & Engineering (80.6%), and Computers, Engineering & Science (71.4%), while the most female-oriented occupations are Education Instruction & Library (74.5%), Education, Arts & Media (72.7%), and Health Diagnosing & Treating (67.9%).
| Occupation | Male | Female |
| Management | 3,706 (52.8%) | 3,308 (47.2%) |
| Business & Financial | 999 (45.2%) | 1,210 (54.8%) |
| Computers, Engineering & Science | 2,131 (71.4%) | 855 (28.6%) |
| Computers & Mathematics | 614 (82.6%) | 129 (17.4%) |
| Architecture & Engineering | 679 (80.6%) | 163 (19.4%) |
| Life, Physical & Social Science | 838 (59.8%) | 563 (40.2%) |
| Community & Social Service | 2,196 (32.1%) | 4,643 (67.9%) |
| Education, Arts & Media | 361 (27.3%) | 962 (72.7%) |
| Legal Services & Support | 204 (44.3%) | 257 (55.7%) |
| Education Instruction & Library | 988 (25.5%) | 2,882 (74.5%) |
| Arts, Media & Entertainment | 643 (54.3%) | 542 (45.7%) |
| Health Diagnosing & Treating | 987 (32.1%) | 2,091 (67.9%) |
| Health Technologists | 765 (34.9%) | 1,429 (65.1%) |
| Total (Category) | 10,019 (45.3%) | 12,107 (54.7%) |
| Total (Overall) | 31,572 (52.2%) | 28,911 (47.8%) |
Services Occupations
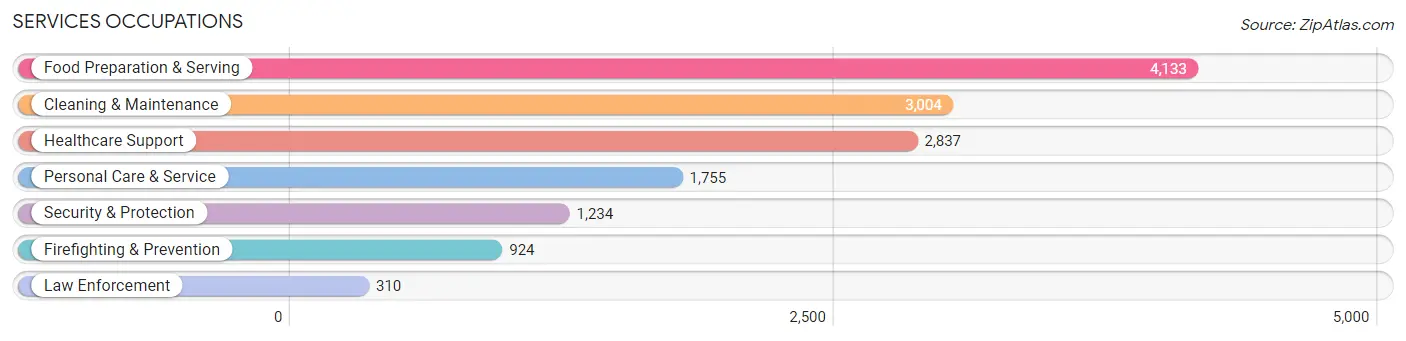
The most common Services occupations in Humboldt County are Food Preparation & Serving (4,133 | 6.8%), Cleaning & Maintenance (3,004 | 5.0%), Healthcare Support (2,837 | 4.7%), Personal Care & Service (1,755 | 2.9%), and Security & Protection (1,234 | 2.0%).
Services Occupations by Sex
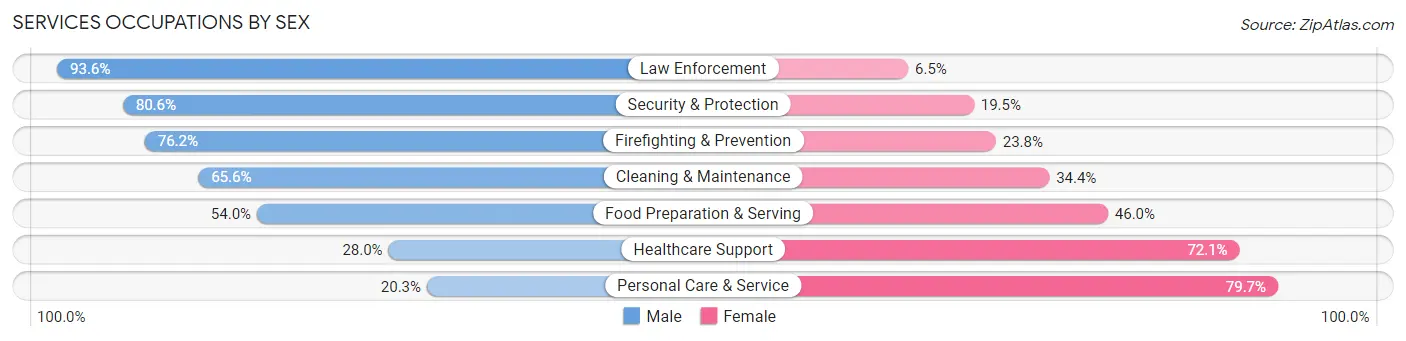
Within the Services occupations in Humboldt County, the most male-oriented occupations are Law Enforcement (93.5%), Security & Protection (80.5%), and Firefighting & Prevention (76.2%), while the most female-oriented occupations are Personal Care & Service (79.7%), Healthcare Support (72.1%), and Food Preparation & Serving (46.0%).
| Occupation | Male | Female |
| Healthcare Support | 793 (28.0%) | 2,044 (72.1%) |
| Security & Protection | 994 (80.5%) | 240 (19.5%) |
| Firefighting & Prevention | 704 (76.2%) | 220 (23.8%) |
| Law Enforcement | 290 (93.5%) | 20 (6.5%) |
| Food Preparation & Serving | 2,232 (54.0%) | 1,901 (46.0%) |
| Cleaning & Maintenance | 1,971 (65.6%) | 1,033 (34.4%) |
| Personal Care & Service | 357 (20.3%) | 1,398 (79.7%) |
| Total (Category) | 6,347 (49.0%) | 6,616 (51.0%) |
| Total (Overall) | 31,572 (52.2%) | 28,911 (47.8%) |
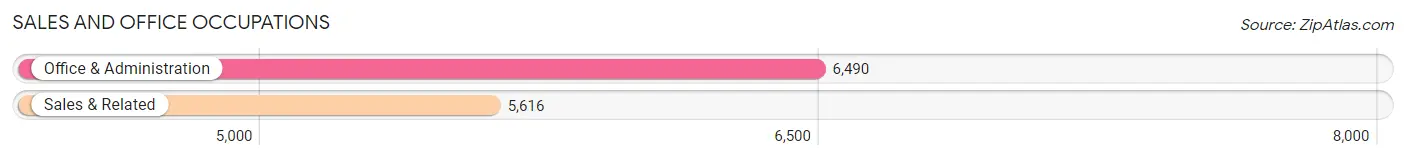
Sales and Office Occupations
The most common Sales and Office occupations in Humboldt County are Office & Administration (6,490 | 10.7%), and Sales & Related (5,616 | 9.3%).
Sales and Office Occupations by Sex
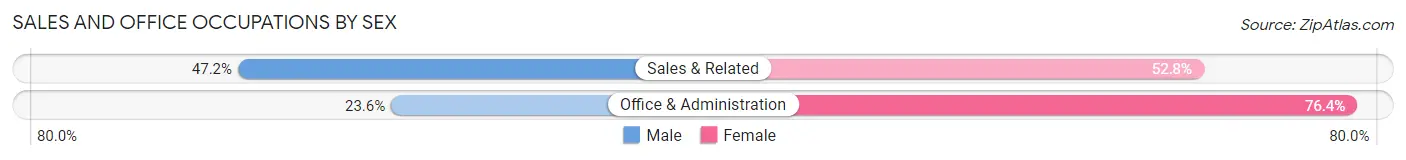
| Occupation | Male | Female |
| Sales & Related | 2,650 (47.2%) | 2,966 (52.8%) |
| Office & Administration | 1,533 (23.6%) | 4,957 (76.4%) |
| Total (Category) | 4,183 (34.5%) | 7,923 (65.4%) |
| Total (Overall) | 31,572 (52.2%) | 28,911 (47.8%) |
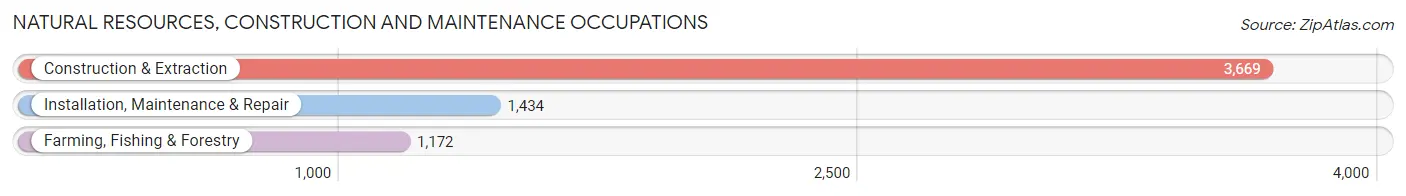
Natural Resources, Construction and Maintenance Occupations
The most common Natural Resources, Construction and Maintenance occupations in Humboldt County are Construction & Extraction (3,669 | 6.1%), Installation, Maintenance & Repair (1,434 | 2.4%), and Farming, Fishing & Forestry (1,172 | 1.9%).
Natural Resources, Construction and Maintenance Occupations by Sex
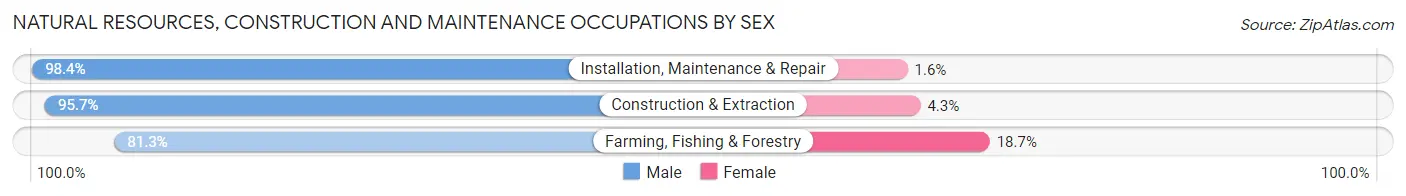
| Occupation | Male | Female |
| Farming, Fishing & Forestry | 953 (81.3%) | 219 (18.7%) |
| Construction & Extraction | 3,512 (95.7%) | 157 (4.3%) |
| Installation, Maintenance & Repair | 1,411 (98.4%) | 23 (1.6%) |
| Total (Category) | 5,876 (93.6%) | 399 (6.4%) |
| Total (Overall) | 31,572 (52.2%) | 28,911 (47.8%) |
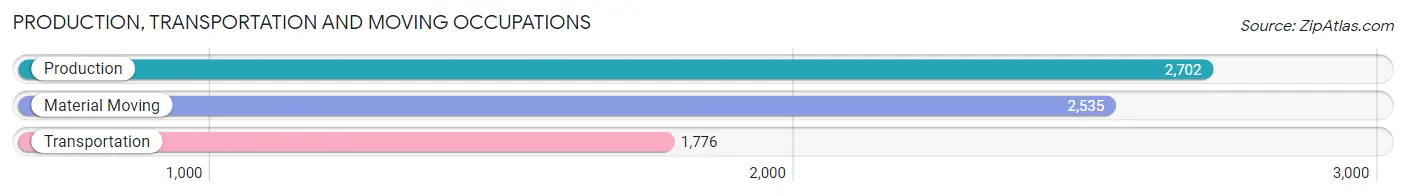
Production, Transportation and Moving Occupations
The most common Production, Transportation and Moving occupations in Humboldt County are Production (2,702 | 4.5%), Material Moving (2,535 | 4.2%), and Transportation (1,776 | 2.9%).
Production, Transportation and Moving Occupations by Sex
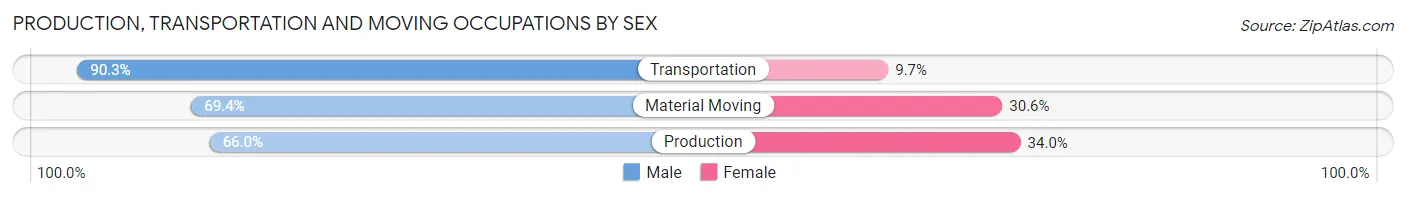
| Occupation | Male | Female |
| Production | 1,784 (66.0%) | 918 (34.0%) |
| Transportation | 1,604 (90.3%) | 172 (9.7%) |
| Material Moving | 1,759 (69.4%) | 776 (30.6%) |
| Total (Category) | 5,147 (73.4%) | 1,866 (26.6%) |
| Total (Overall) | 31,572 (52.2%) | 28,911 (47.8%) |
Employment Industries by Sex in Humboldt County
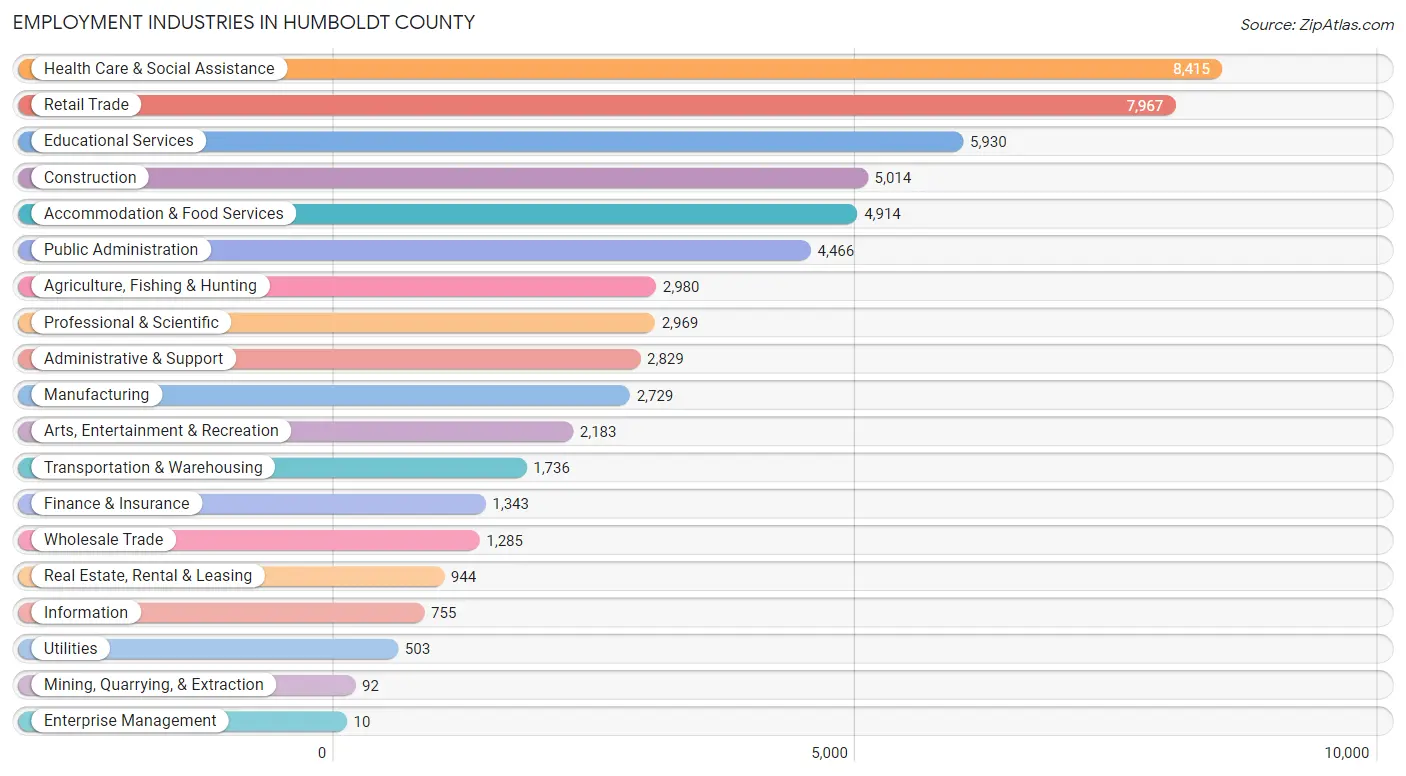
Employment Industries in Humboldt County
The major employment industries in Humboldt County include Health Care & Social Assistance (8,415 | 13.9%), Retail Trade (7,967 | 13.2%), Educational Services (5,930 | 9.8%), Construction (5,014 | 8.3%), and Accommodation & Food Services (4,914 | 8.1%).
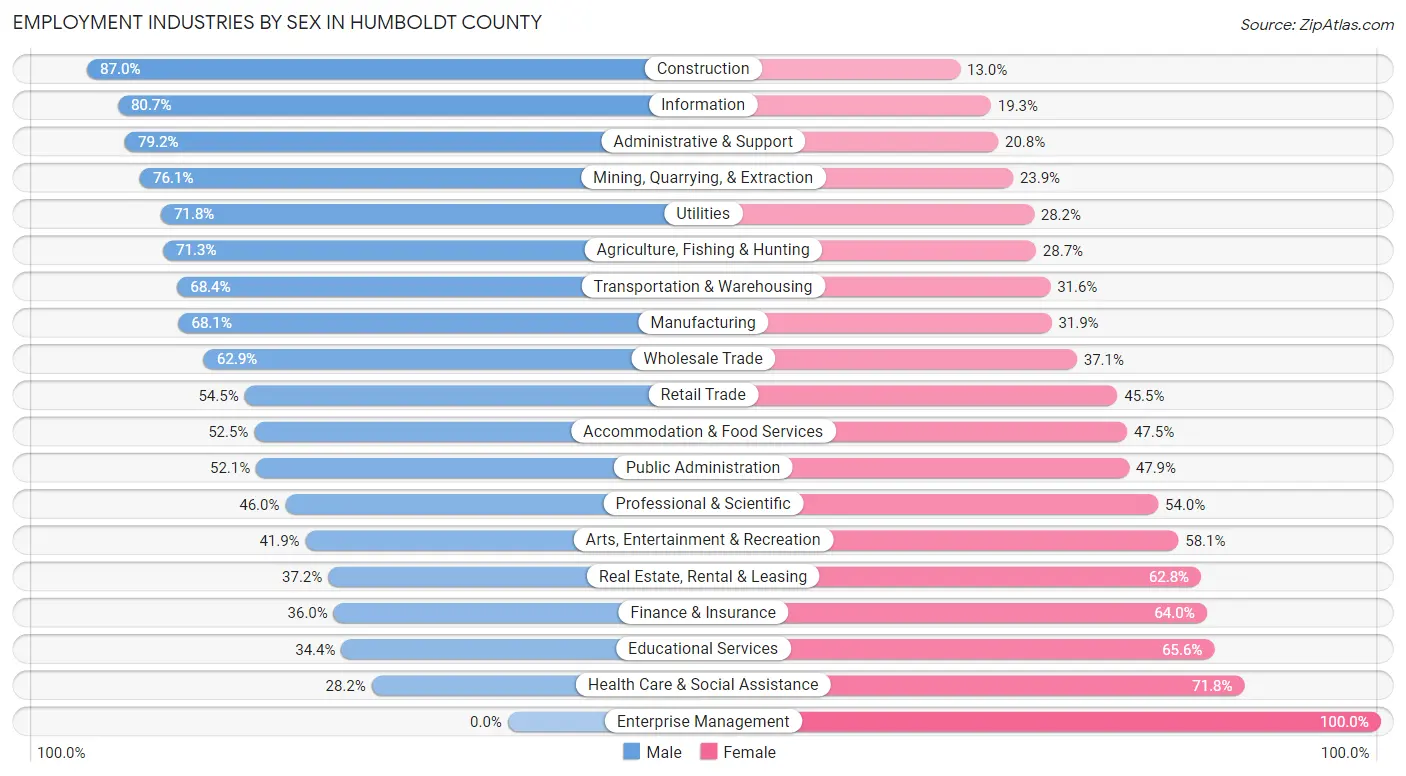
Employment Industries by Sex in Humboldt County
The Humboldt County industries that see more men than women are Construction (87.0%), Information (80.7%), and Administrative & Support (79.2%), whereas the industries that tend to have a higher number of women are Enterprise Management (100.0%), Health Care & Social Assistance (71.8%), and Educational Services (65.6%).
| Industry | Male | Female |
| Agriculture, Fishing & Hunting | 2,126 (71.3%) | 854 (28.7%) |
| Mining, Quarrying, & Extraction | 70 (76.1%) | 22 (23.9%) |
| Construction | 4,364 (87.0%) | 650 (13.0%) |
| Manufacturing | 1,859 (68.1%) | 870 (31.9%) |
| Wholesale Trade | 808 (62.9%) | 477 (37.1%) |
| Retail Trade | 4,341 (54.5%) | 3,626 (45.5%) |
| Transportation & Warehousing | 1,187 (68.4%) | 549 (31.6%) |
| Utilities | 361 (71.8%) | 142 (28.2%) |
| Information | 609 (80.7%) | 146 (19.3%) |
| Finance & Insurance | 484 (36.0%) | 859 (64.0%) |
| Real Estate, Rental & Leasing | 351 (37.2%) | 593 (62.8%) |
| Professional & Scientific | 1,367 (46.0%) | 1,602 (54.0%) |
| Enterprise Management | 0 (0.0%) | 10 (100.0%) |
| Administrative & Support | 2,240 (79.2%) | 589 (20.8%) |
| Educational Services | 2,042 (34.4%) | 3,888 (65.6%) |
| Health Care & Social Assistance | 2,372 (28.2%) | 6,043 (71.8%) |
| Arts, Entertainment & Recreation | 914 (41.9%) | 1,269 (58.1%) |
| Accommodation & Food Services | 2,579 (52.5%) | 2,335 (47.5%) |
| Public Administration | 2,327 (52.1%) | 2,139 (47.9%) |
| Total | 31,572 (52.2%) | 28,911 (47.8%) |
Education in Humboldt County
School Enrollment in Humboldt County
The most common levels of schooling among the 32,833 students in Humboldt County are college / undergraduate (10,979 | 33.4%), elementary school (5,912 | 18.0%), and high school (5,659 | 17.2%).
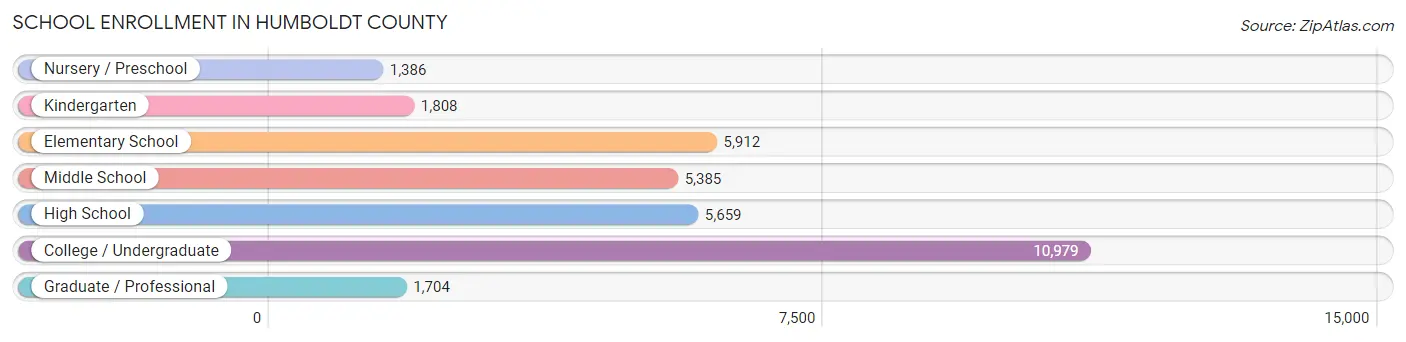
| School Level | # Students | % Students |
| Nursery / Preschool | 1,386 | 4.2% |
| Kindergarten | 1,808 | 5.5% |
| Elementary School | 5,912 | 18.0% |
| Middle School | 5,385 | 16.4% |
| High School | 5,659 | 17.2% |
| College / Undergraduate | 10,979 | 33.4% |
| Graduate / Professional | 1,704 | 5.2% |
| Total | 32,833 | 100.0% |
School Enrollment by Age by Funding Source in Humboldt County
Out of a total of 32,833 students who are enrolled in schools in Humboldt County, 2,955 (9.0%) attend a private institution, while the remaining 29,878 (91.0%) are enrolled in public schools. The age group of 3 to 4 year olds has the highest likelihood of being enrolled in private schools, with 605 (47.4% in the age bracket) enrolled. Conversely, the age group of 20 to 24 year olds has the lowest likelihood of being enrolled in a private school, with 5,894 (98.0% in the age bracket) attending a public institution.
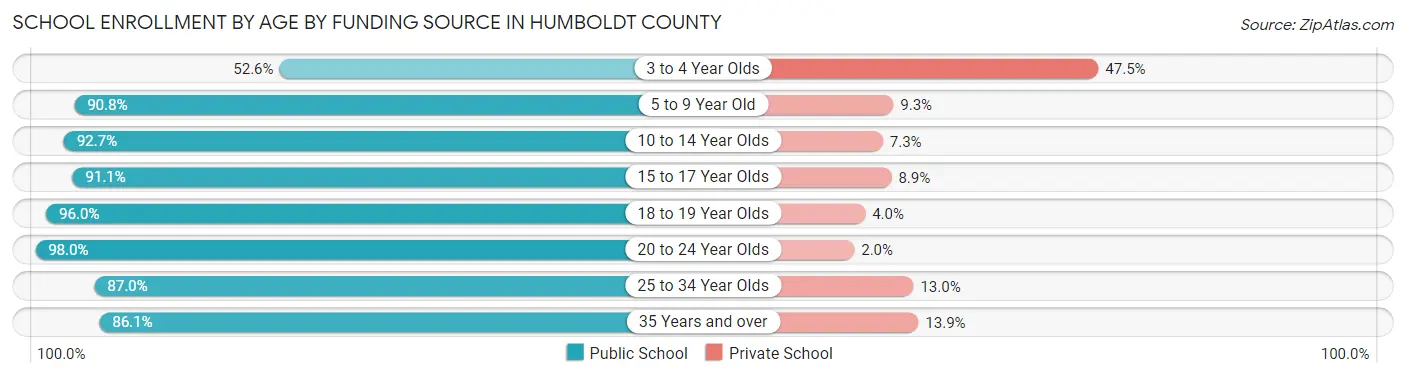
| Age Bracket | Public School | Private School |
| 3 to 4 Year Olds | 670 (52.5%) | 605 (47.4%) |
| 5 to 9 Year Old | 6,462 (90.7%) | 659 (9.2%) |
| 10 to 14 Year Olds | 6,452 (92.7%) | 508 (7.3%) |
| 15 to 17 Year Olds | 3,890 (91.1%) | 380 (8.9%) |
| 18 to 19 Year Olds | 2,871 (96.0%) | 120 (4.0%) |
| 20 to 24 Year Olds | 5,894 (98.0%) | 119 (2.0%) |
| 25 to 34 Year Olds | 2,382 (87.0%) | 356 (13.0%) |
| 35 Years and over | 1,261 (86.1%) | 204 (13.9%) |
| Total | 29,878 (91.0%) | 2,955 (9.0%) |
Educational Attainment by Field of Study in Humboldt County
Bio, nature & agricultural (4,790 | 15.2%), social sciences (3,162 | 10.0%), education (2,937 | 9.3%), business (2,858 | 9.1%), and visual & performing arts (2,575 | 8.2%) are the most common fields of study among 31,507 individuals in Humboldt County who have obtained a bachelor's degree or higher.
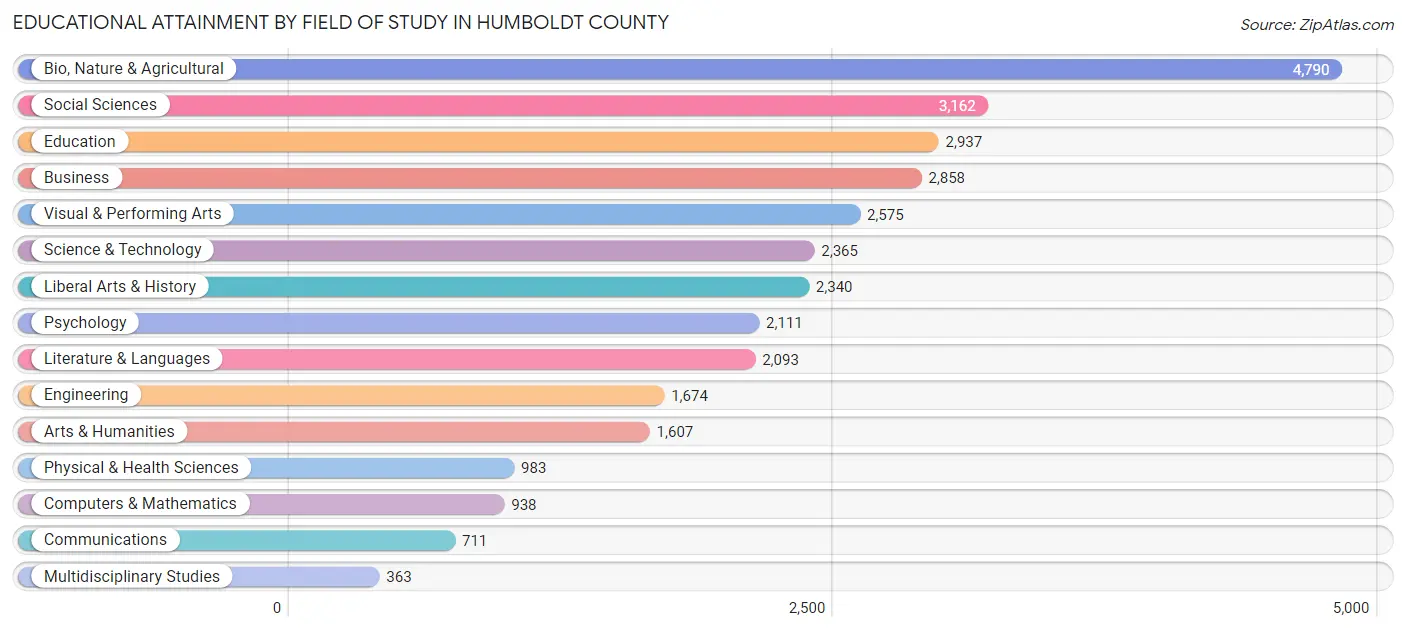
| Field of Study | # Graduates | % Graduates |
| Computers & Mathematics | 938 | 3.0% |
| Bio, Nature & Agricultural | 4,790 | 15.2% |
| Physical & Health Sciences | 983 | 3.1% |
| Psychology | 2,111 | 6.7% |
| Social Sciences | 3,162 | 10.0% |
| Engineering | 1,674 | 5.3% |
| Multidisciplinary Studies | 363 | 1.1% |
| Science & Technology | 2,365 | 7.5% |
| Business | 2,858 | 9.1% |
| Education | 2,937 | 9.3% |
| Literature & Languages | 2,093 | 6.6% |
| Liberal Arts & History | 2,340 | 7.4% |
| Visual & Performing Arts | 2,575 | 8.2% |
| Communications | 711 | 2.3% |
| Arts & Humanities | 1,607 | 5.1% |
| Total | 31,507 | 100.0% |
Transportation & Commute in Humboldt County
Vehicle Availability by Sex in Humboldt County
The most prevalent vehicle ownership categories in Humboldt County are males with 2 vehicles (11,744, accounting for 39.0%) and females with 2 vehicles (10,616, making up 42.9%).
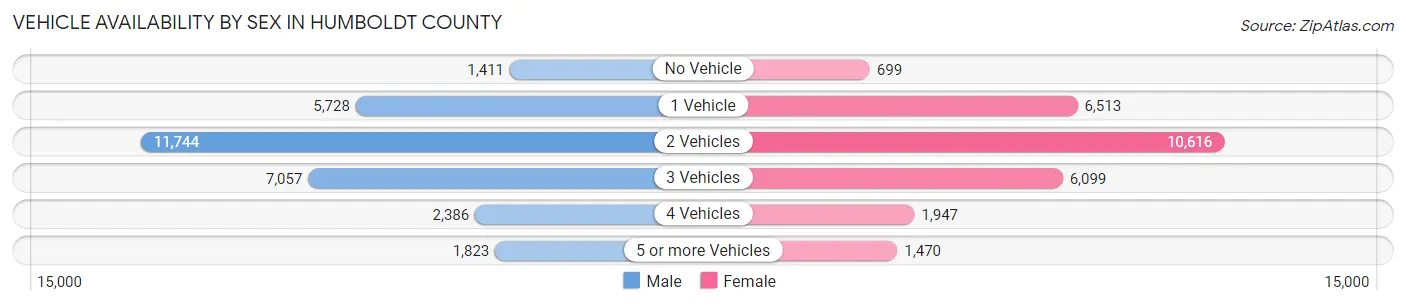
| Vehicles Available | Male | Female |
| No Vehicle | 1,411 (4.7%) | 699 (2.6%) |
| 1 Vehicle | 5,728 (19.0%) | 6,513 (23.8%) |
| 2 Vehicles | 11,744 (39.0%) | 10,616 (38.8%) |
| 3 Vehicles | 7,057 (23.4%) | 6,099 (22.3%) |
| 4 Vehicles | 2,386 (7.9%) | 1,947 (7.1%) |
| 5 or more Vehicles | 1,823 (6.0%) | 1,470 (5.4%) |
| Total | 30,149 (100.0%) | 27,344 (100.0%) |
Commute Time in Humboldt County
The most frequently occuring commute durations in Humboldt County are 5 to 9 minutes (10,977 commuters, 21.1%), 10 to 14 minutes (9,606 commuters, 18.5%), and 15 to 19 minutes (8,984 commuters, 17.3%).
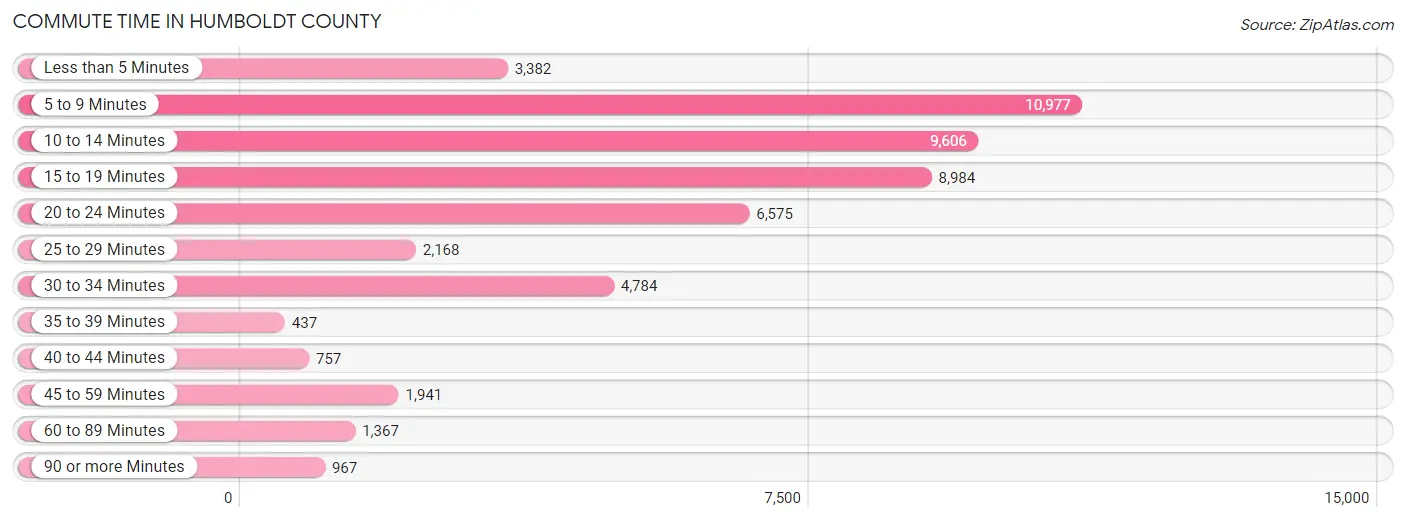
| Commute Time | # Commuters | % Commuters |
| Less than 5 Minutes | 3,382 | 6.5% |
| 5 to 9 Minutes | 10,977 | 21.1% |
| 10 to 14 Minutes | 9,606 | 18.5% |
| 15 to 19 Minutes | 8,984 | 17.3% |
| 20 to 24 Minutes | 6,575 | 12.7% |
| 25 to 29 Minutes | 2,168 | 4.2% |
| 30 to 34 Minutes | 4,784 | 9.2% |
| 35 to 39 Minutes | 437 | 0.8% |
| 40 to 44 Minutes | 757 | 1.5% |
| 45 to 59 Minutes | 1,941 | 3.7% |
| 60 to 89 Minutes | 1,367 | 2.6% |
| 90 or more Minutes | 967 | 1.9% |
Commute Time by Sex in Humboldt County
The most common commute times in Humboldt County are 10 to 14 minutes (5,233 commuters, 19.0%) for males and 5 to 9 minutes (5,949 commuters, 24.4%) for females.
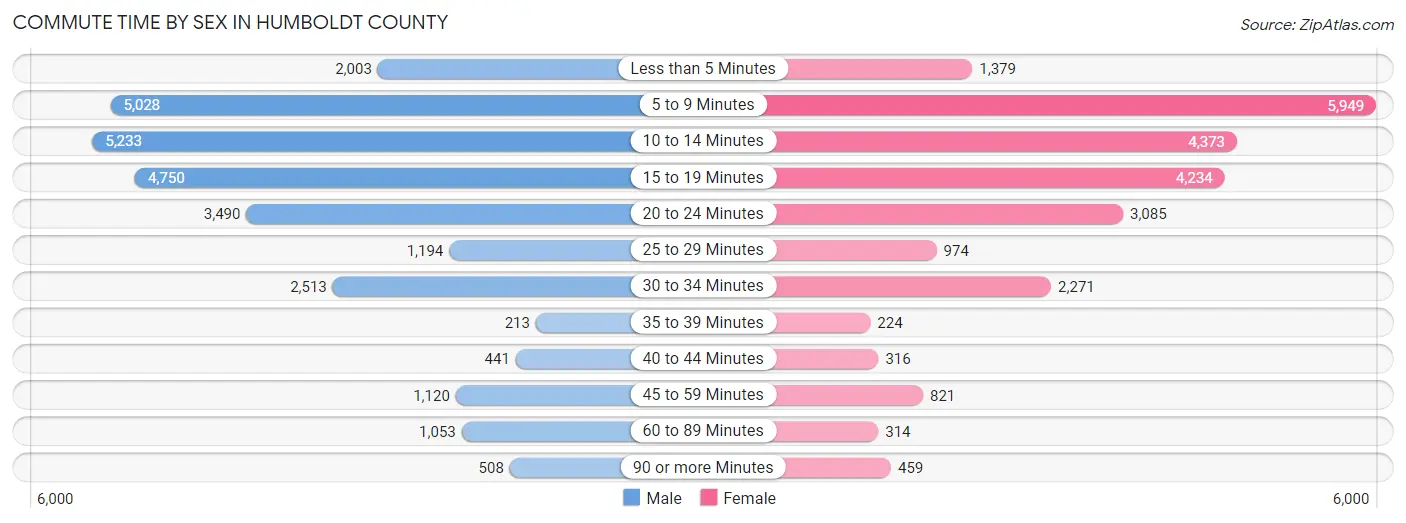
| Commute Time | Male | Female |
| Less than 5 Minutes | 2,003 (7.3%) | 1,379 (5.7%) |
| 5 to 9 Minutes | 5,028 (18.2%) | 5,949 (24.4%) |
| 10 to 14 Minutes | 5,233 (19.0%) | 4,373 (17.9%) |
| 15 to 19 Minutes | 4,750 (17.2%) | 4,234 (17.3%) |
| 20 to 24 Minutes | 3,490 (12.7%) | 3,085 (12.6%) |
| 25 to 29 Minutes | 1,194 (4.3%) | 974 (4.0%) |
| 30 to 34 Minutes | 2,513 (9.1%) | 2,271 (9.3%) |
| 35 to 39 Minutes | 213 (0.8%) | 224 (0.9%) |
| 40 to 44 Minutes | 441 (1.6%) | 316 (1.3%) |
| 45 to 59 Minutes | 1,120 (4.1%) | 821 (3.4%) |
| 60 to 89 Minutes | 1,053 (3.8%) | 314 (1.3%) |
| 90 or more Minutes | 508 (1.8%) | 459 (1.9%) |
Time of Departure to Work by Sex in Humboldt County
The most frequent times of departure to work in Humboldt County are 7:30 AM to 7:59 AM (4,024, 14.6%) for males and 7:30 AM to 7:59 AM (5,052, 20.7%) for females.
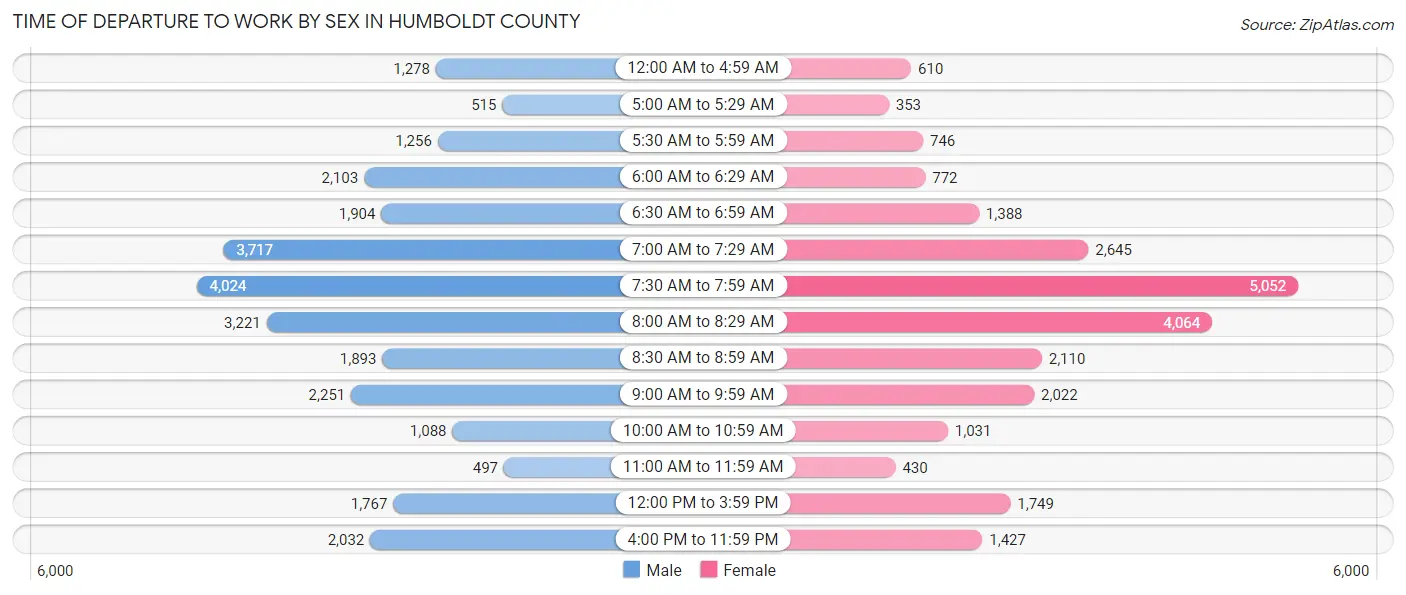
| Time of Departure | Male | Female |
| 12:00 AM to 4:59 AM | 1,278 (4.6%) | 610 (2.5%) |
| 5:00 AM to 5:29 AM | 515 (1.9%) | 353 (1.5%) |
| 5:30 AM to 5:59 AM | 1,256 (4.6%) | 746 (3.1%) |
| 6:00 AM to 6:29 AM | 2,103 (7.6%) | 772 (3.2%) |
| 6:30 AM to 6:59 AM | 1,904 (6.9%) | 1,388 (5.7%) |
| 7:00 AM to 7:29 AM | 3,717 (13.5%) | 2,645 (10.8%) |
| 7:30 AM to 7:59 AM | 4,024 (14.6%) | 5,052 (20.7%) |
| 8:00 AM to 8:29 AM | 3,221 (11.7%) | 4,064 (16.7%) |
| 8:30 AM to 8:59 AM | 1,893 (6.9%) | 2,110 (8.6%) |
| 9:00 AM to 9:59 AM | 2,251 (8.2%) | 2,022 (8.3%) |
| 10:00 AM to 10:59 AM | 1,088 (4.0%) | 1,031 (4.2%) |
| 11:00 AM to 11:59 AM | 497 (1.8%) | 430 (1.8%) |
| 12:00 PM to 3:59 PM | 1,767 (6.4%) | 1,749 (7.2%) |
| 4:00 PM to 11:59 PM | 2,032 (7.4%) | 1,427 (5.9%) |
| Total | 27,546 (100.0%) | 24,399 (100.0%) |
Housing Occupancy in Humboldt County
Occupancy by Ownership in Humboldt County
Of the total 54,495 dwellings in Humboldt County, owner-occupied units account for 30,965 (56.8%), while renter-occupied units make up 23,530 (43.2%).
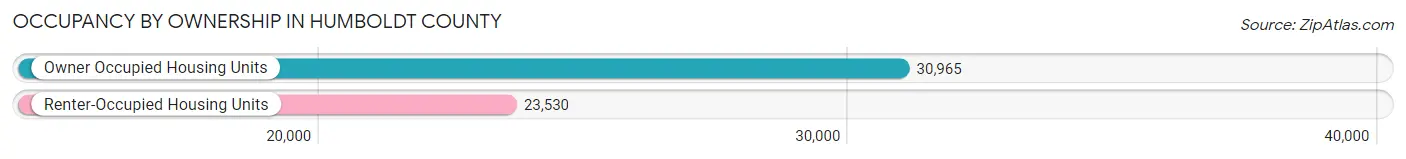
| Occupancy | # Housing Units | % Housing Units |
| Owner Occupied Housing Units | 30,965 | 56.8% |
| Renter-Occupied Housing Units | 23,530 | 43.2% |
| Total Occupied Housing Units | 54,495 | 100.0% |
Occupancy by Household Size in Humboldt County
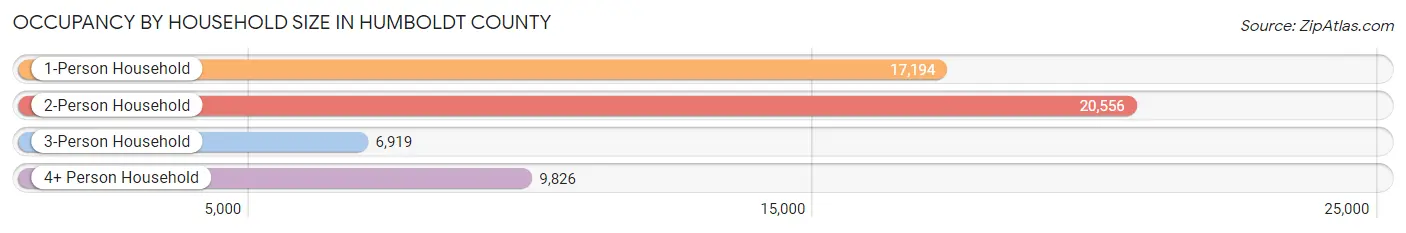
| Household Size | # Housing Units | % Housing Units |
| 1-Person Household | 17,194 | 31.6% |
| 2-Person Household | 20,556 | 37.7% |
| 3-Person Household | 6,919 | 12.7% |
| 4+ Person Household | 9,826 | 18.0% |
| Total Housing Units | 54,495 | 100.0% |
Occupancy by Ownership by Household Size in Humboldt County
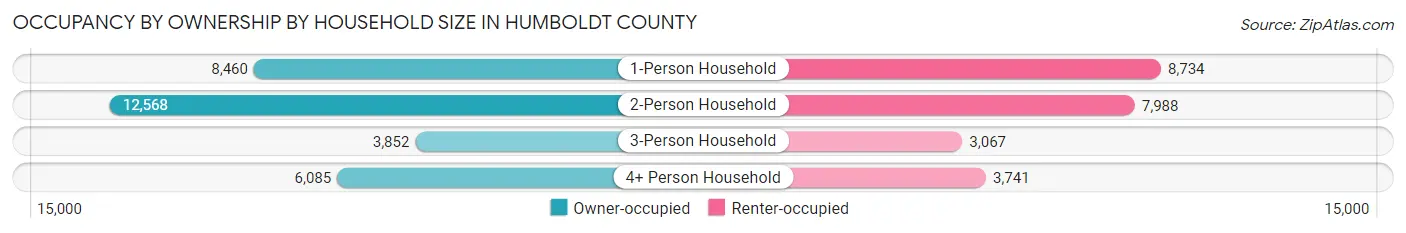
| Household Size | Owner-occupied | Renter-occupied |
| 1-Person Household | 8,460 (49.2%) | 8,734 (50.8%) |
| 2-Person Household | 12,568 (61.1%) | 7,988 (38.9%) |
| 3-Person Household | 3,852 (55.7%) | 3,067 (44.3%) |
| 4+ Person Household | 6,085 (61.9%) | 3,741 (38.1%) |
| Total Housing Units | 30,965 (56.8%) | 23,530 (43.2%) |
Occupancy by Educational Attainment in Humboldt County
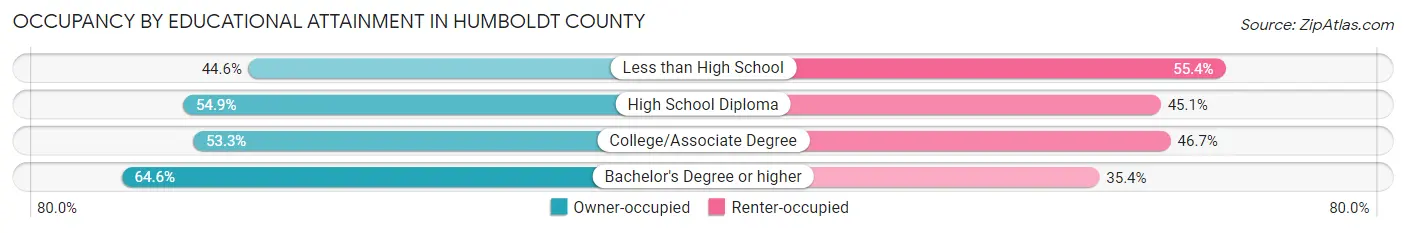
| Household Size | Owner-occupied | Renter-occupied |
| Less than High School | 1,639 (44.6%) | 2,035 (55.4%) |
| High School Diploma | 5,534 (54.9%) | 4,551 (45.1%) |
| College/Associate Degree | 11,888 (53.3%) | 10,422 (46.7%) |
| Bachelor's Degree or higher | 11,904 (64.6%) | 6,522 (35.4%) |
Occupancy by Age of Householder in Humboldt County
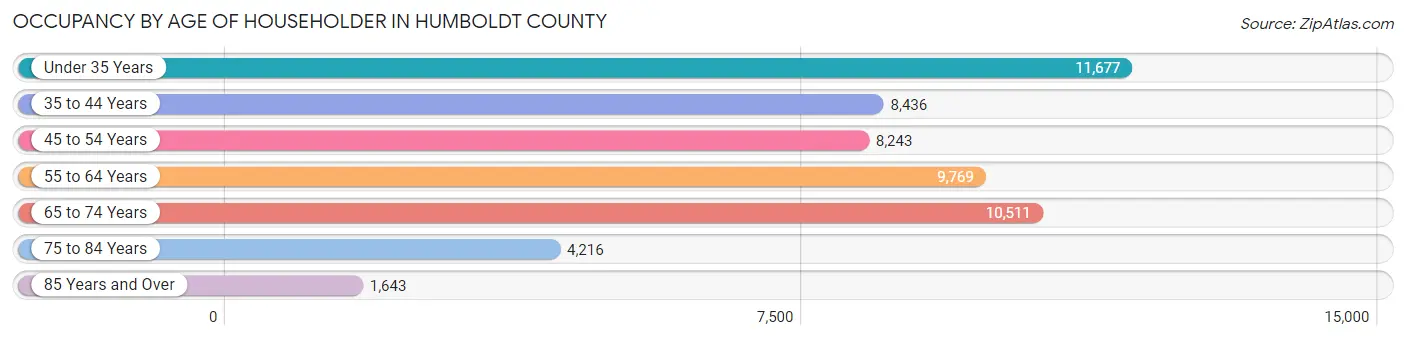
| Age Bracket | # Households | % Households |
| Under 35 Years | 11,677 | 21.4% |
| 35 to 44 Years | 8,436 | 15.5% |
| 45 to 54 Years | 8,243 | 15.1% |
| 55 to 64 Years | 9,769 | 17.9% |
| 65 to 74 Years | 10,511 | 19.3% |
| 75 to 84 Years | 4,216 | 7.7% |
| 85 Years and Over | 1,643 | 3.0% |
| Total | 54,495 | 100.0% |
Housing Finances in Humboldt County
Median Income by Occupancy in Humboldt County
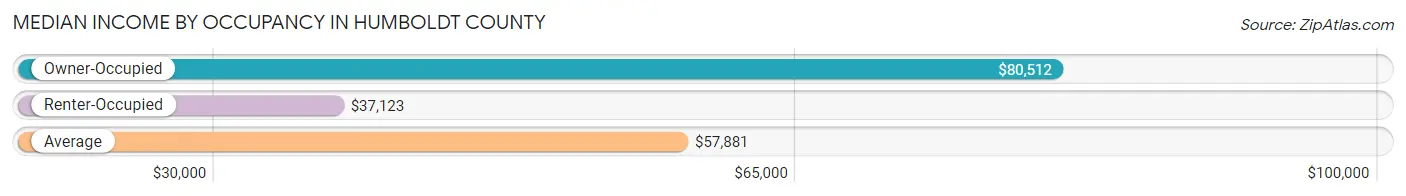
| Occupancy Type | # Households | Median Income |
| Owner-Occupied | 30,965 (56.8%) | $80,512 |
| Renter-Occupied | 23,530 (43.2%) | $37,123 |
| Average | 54,495 (100.0%) | $57,881 |
Occupancy by Householder Income Bracket in Humboldt County
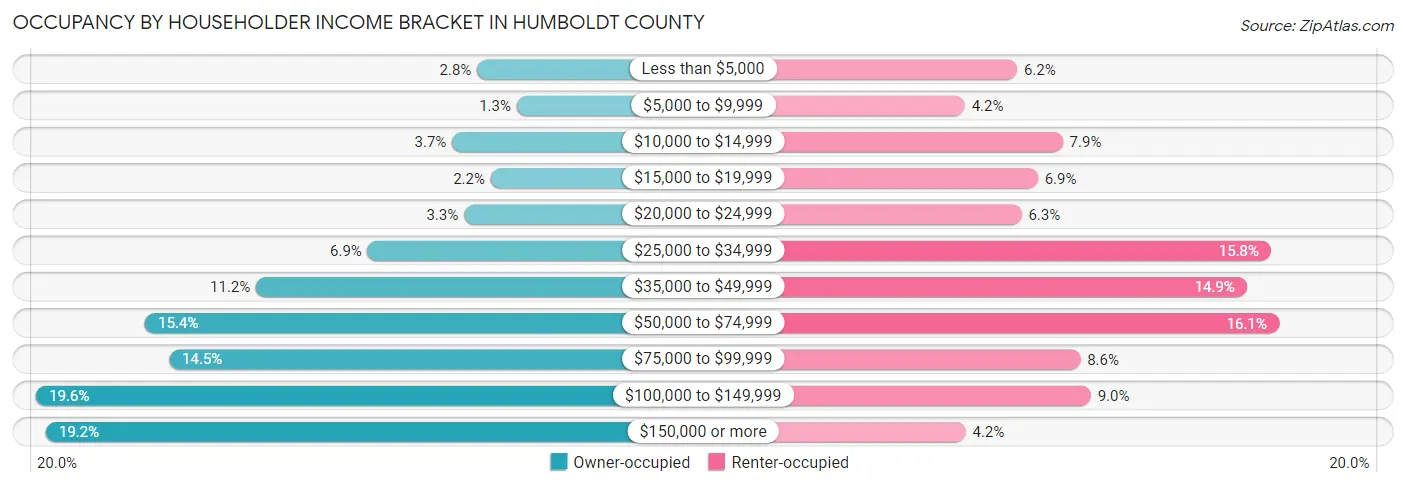
| Income Bracket | Owner-occupied | Renter-occupied |
| Less than $5,000 | 854 (2.8%) | 1,446 (6.1%) |
| $5,000 to $9,999 | 387 (1.3%) | 978 (4.2%) |
| $10,000 to $14,999 | 1,150 (3.7%) | 1,857 (7.9%) |
| $15,000 to $19,999 | 694 (2.2%) | 1,634 (6.9%) |
| $20,000 to $24,999 | 1,011 (3.3%) | 1,486 (6.3%) |
| $25,000 to $34,999 | 2,146 (6.9%) | 3,723 (15.8%) |
| $35,000 to $49,999 | 3,463 (11.2%) | 3,506 (14.9%) |
| $50,000 to $74,999 | 4,772 (15.4%) | 3,792 (16.1%) |
| $75,000 to $99,999 | 4,489 (14.5%) | 2,014 (8.6%) |
| $100,000 to $149,999 | 6,057 (19.6%) | 2,108 (9.0%) |
| $150,000 or more | 5,942 (19.2%) | 986 (4.2%) |
| Total | 30,965 (100.0%) | 23,530 (100.0%) |
Monthly Housing Cost Tiers in Humboldt County
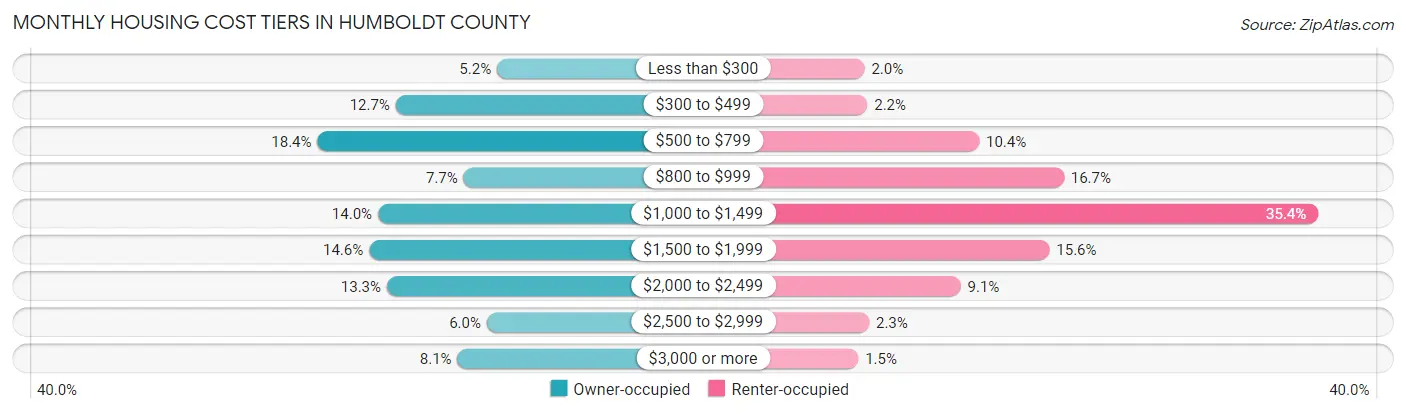
| Monthly Cost | Owner-occupied | Renter-occupied |
| Less than $300 | 1,614 (5.2%) | 469 (2.0%) |
| $300 to $499 | 3,922 (12.7%) | 518 (2.2%) |
| $500 to $799 | 5,709 (18.4%) | 2,454 (10.4%) |
| $800 to $999 | 2,374 (7.7%) | 3,922 (16.7%) |
| $1,000 to $1,499 | 4,330 (14.0%) | 8,330 (35.4%) |
| $1,500 to $1,999 | 4,530 (14.6%) | 3,674 (15.6%) |
| $2,000 to $2,499 | 4,126 (13.3%) | 2,133 (9.1%) |
| $2,500 to $2,999 | 1,845 (6.0%) | 548 (2.3%) |
| $3,000 or more | 2,515 (8.1%) | 361 (1.5%) |
| Total | 30,965 (100.0%) | 23,530 (100.0%) |
Physical Housing Characteristics in Humboldt County
Housing Structures in Humboldt County
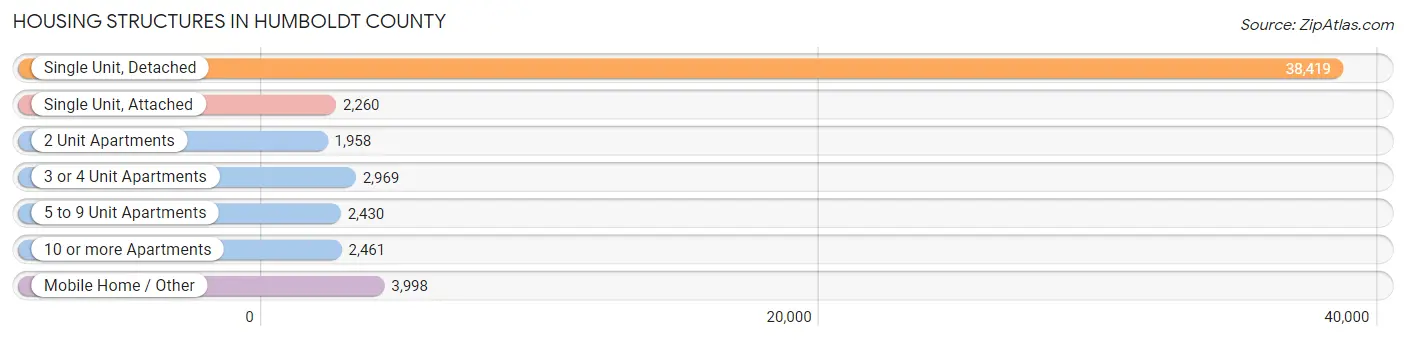
| Structure Type | # Housing Units | % Housing Units |
| Single Unit, Detached | 38,419 | 70.5% |
| Single Unit, Attached | 2,260 | 4.2% |
| 2 Unit Apartments | 1,958 | 3.6% |
| 3 or 4 Unit Apartments | 2,969 | 5.4% |
| 5 to 9 Unit Apartments | 2,430 | 4.5% |
| 10 or more Apartments | 2,461 | 4.5% |
| Mobile Home / Other | 3,998 | 7.3% |
| Total | 54,495 | 100.0% |
Housing Structures by Occupancy in Humboldt County
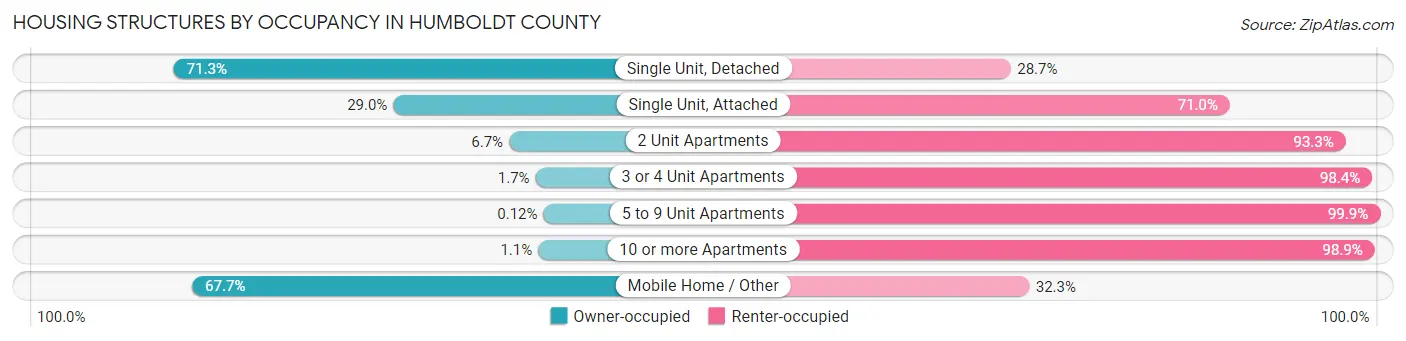
| Structure Type | Owner-occupied | Renter-occupied |
| Single Unit, Detached | 27,389 (71.3%) | 11,030 (28.7%) |
| Single Unit, Attached | 656 (29.0%) | 1,604 (71.0%) |
| 2 Unit Apartments | 132 (6.7%) | 1,826 (93.3%) |
| 3 or 4 Unit Apartments | 49 (1.7%) | 2,920 (98.4%) |
| 5 to 9 Unit Apartments | 3 (0.1%) | 2,427 (99.9%) |
| 10 or more Apartments | 28 (1.1%) | 2,433 (98.9%) |
| Mobile Home / Other | 2,708 (67.7%) | 1,290 (32.3%) |
| Total | 30,965 (56.8%) | 23,530 (43.2%) |
Housing Structures by Number of Rooms in Humboldt County
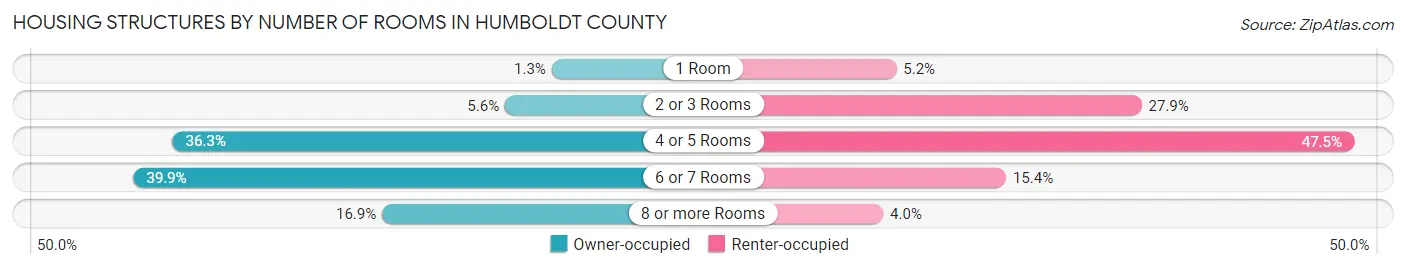
| Number of Rooms | Owner-occupied | Renter-occupied |
| 1 Room | 386 (1.3%) | 1,229 (5.2%) |
| 2 or 3 Rooms | 1,726 (5.6%) | 6,564 (27.9%) |
| 4 or 5 Rooms | 11,242 (36.3%) | 11,181 (47.5%) |
| 6 or 7 Rooms | 12,366 (39.9%) | 3,615 (15.4%) |
| 8 or more Rooms | 5,245 (16.9%) | 941 (4.0%) |
| Total | 30,965 (100.0%) | 23,530 (100.0%) |
Housing Structure by Heating Type in Humboldt County
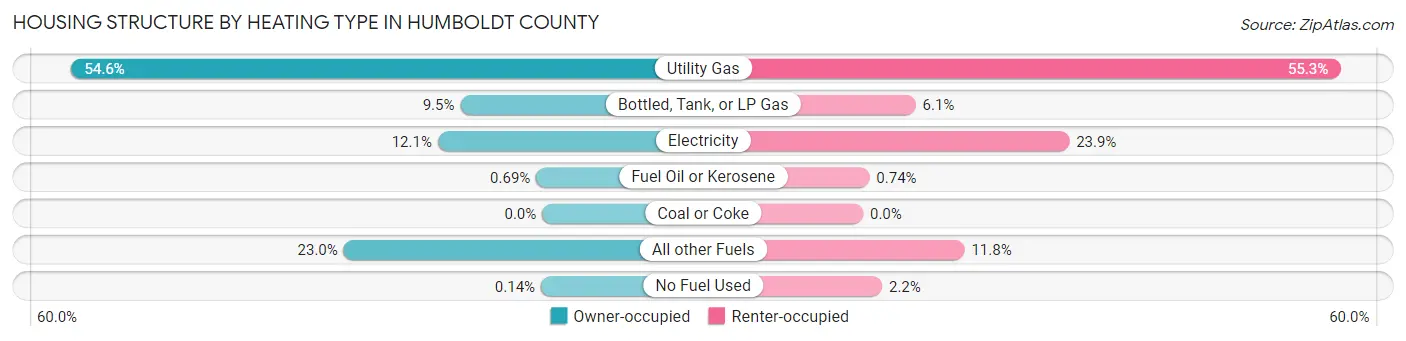
| Heating Type | Owner-occupied | Renter-occupied |
| Utility Gas | 16,897 (54.6%) | 13,013 (55.3%) |
| Bottled, Tank, or LP Gas | 2,936 (9.5%) | 1,434 (6.1%) |
| Electricity | 3,748 (12.1%) | 5,624 (23.9%) |
| Fuel Oil or Kerosene | 215 (0.7%) | 175 (0.7%) |
| Coal or Coke | 0 (0.0%) | 0 (0.0%) |
| All other Fuels | 7,126 (23.0%) | 2,767 (11.8%) |
| No Fuel Used | 43 (0.1%) | 517 (2.2%) |
| Total | 30,965 (100.0%) | 23,530 (100.0%) |
Household Vehicle Usage in Humboldt County
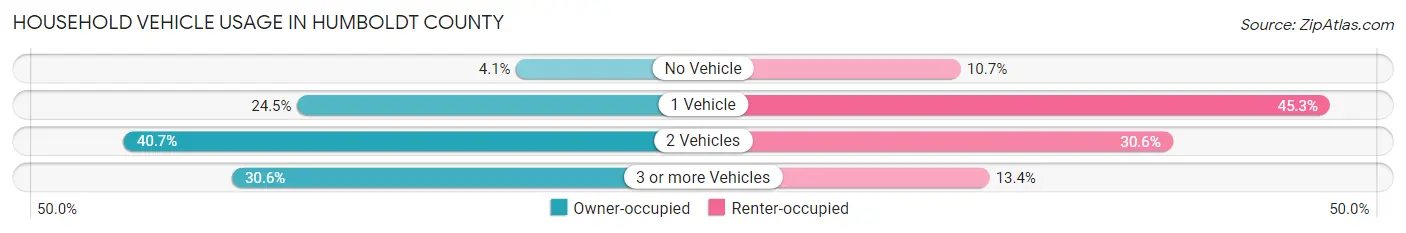
| Vehicles per Household | Owner-occupied | Renter-occupied |
| No Vehicle | 1,266 (4.1%) | 2,528 (10.7%) |
| 1 Vehicle | 7,600 (24.5%) | 10,650 (45.3%) |
| 2 Vehicles | 12,611 (40.7%) | 7,195 (30.6%) |
| 3 or more Vehicles | 9,488 (30.6%) | 3,157 (13.4%) |
| Total | 30,965 (100.0%) | 23,530 (100.0%) |
Real Estate & Mortgages in Humboldt County
Real Estate and Mortgage Overview in Humboldt County
| Characteristic | Without Mortgage | With Mortgage |
| Housing Units | 13,986 | 16,979 |
| Median Property Value | $367,300 | $396,400 |
| Median Household Income | $60,267 | $3,914 |
| Monthly Housing Costs | $576 | $2,363 |
| Real Estate Taxes | $2,152 | $278 |
Property Value by Mortgage Status in Humboldt County
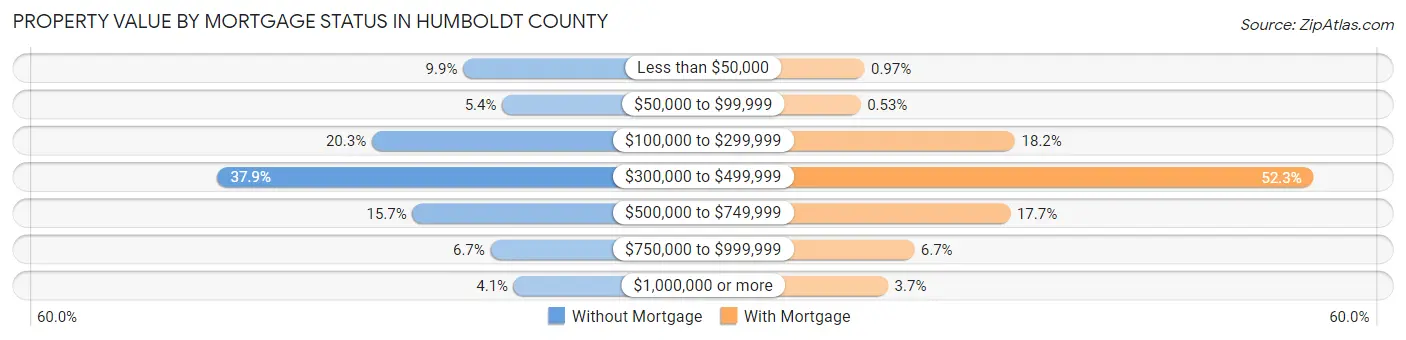
| Property Value | Without Mortgage | With Mortgage |
| Less than $50,000 | 1,381 (9.9%) | 165 (1.0%) |
| $50,000 to $99,999 | 757 (5.4%) | 90 (0.5%) |
| $100,000 to $299,999 | 2,839 (20.3%) | 3,087 (18.2%) |
| $300,000 to $499,999 | 5,306 (37.9%) | 8,886 (52.3%) |
| $500,000 to $749,999 | 2,190 (15.7%) | 2,997 (17.6%) |
| $750,000 to $999,999 | 942 (6.7%) | 1,131 (6.7%) |
| $1,000,000 or more | 571 (4.1%) | 623 (3.7%) |
| Total | 13,986 (100.0%) | 16,979 (100.0%) |
Household Income by Mortgage Status in Humboldt County
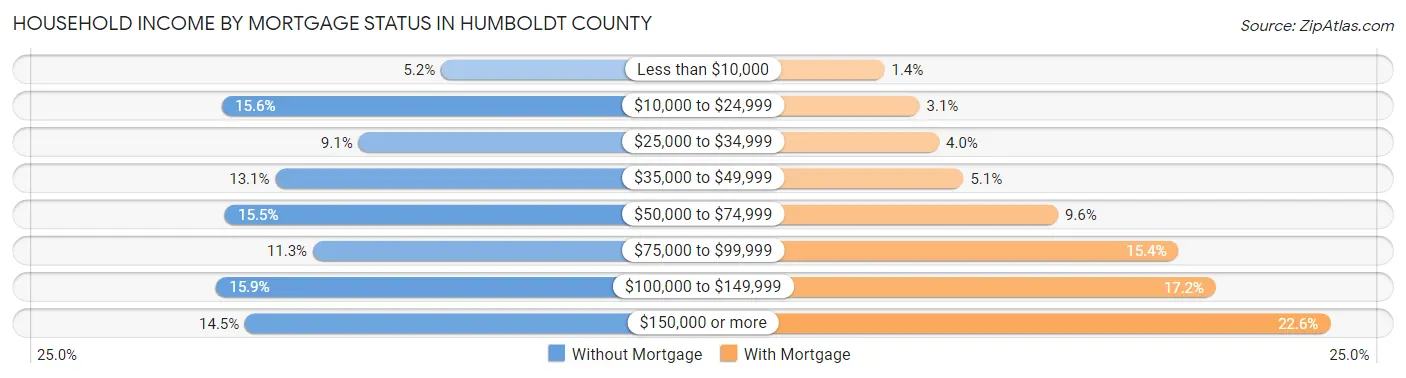
| Household Income | Without Mortgage | With Mortgage |
| Less than $10,000 | 723 (5.2%) | 234 (1.4%) |
| $10,000 to $24,999 | 2,180 (15.6%) | 518 (3.0%) |
| $25,000 to $34,999 | 1,273 (9.1%) | 675 (4.0%) |
| $35,000 to $49,999 | 1,826 (13.1%) | 873 (5.1%) |
| $50,000 to $74,999 | 2,161 (15.4%) | 1,637 (9.6%) |
| $75,000 to $99,999 | 1,576 (11.3%) | 2,611 (15.4%) |
| $100,000 to $149,999 | 2,219 (15.9%) | 2,913 (17.2%) |
| $150,000 or more | 2,028 (14.5%) | 3,838 (22.6%) |
| Total | 13,986 (100.0%) | 16,979 (100.0%) |
Property Value to Household Income Ratio in Humboldt County
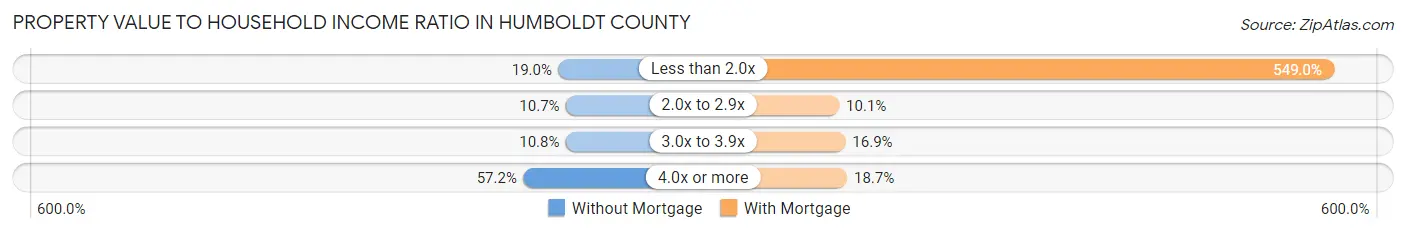
| Value-to-Income Ratio | Without Mortgage | With Mortgage |
| Less than 2.0x | 2,657 (19.0%) | 93,211 (549.0%) |
| 2.0x to 2.9x | 1,497 (10.7%) | 1,712 (10.1%) |
| 3.0x to 3.9x | 1,511 (10.8%) | 2,865 (16.9%) |
| 4.0x or more | 7,999 (57.2%) | 3,170 (18.7%) |
| Total | 13,986 (100.0%) | 16,979 (100.0%) |
Real Estate Taxes by Mortgage Status in Humboldt County
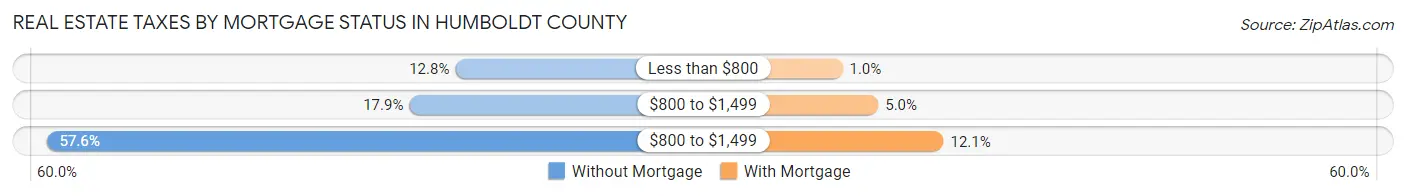
| Property Taxes | Without Mortgage | With Mortgage |
| Less than $800 | 1,792 (12.8%) | 177 (1.0%) |
| $800 to $1,499 | 2,496 (17.8%) | 843 (5.0%) |
| $800 to $1,499 | 8,055 (57.6%) | 2,057 (12.1%) |
| Total | 13,986 (100.0%) | 16,979 (100.0%) |
Health & Disability in Humboldt County
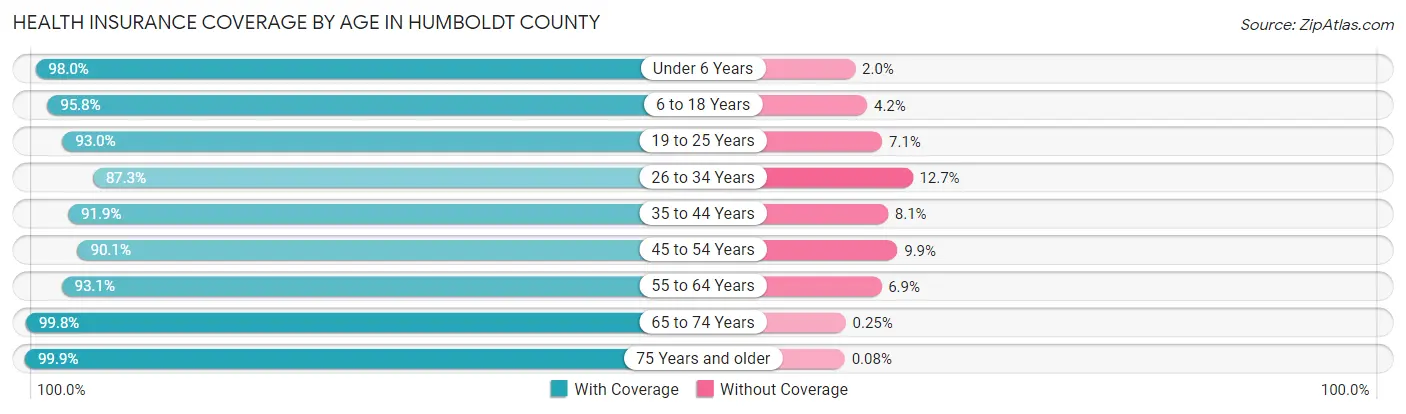
Health Insurance Coverage by Age in Humboldt County
| Age Bracket | With Coverage | Without Coverage |
| Under 6 Years | 7,889 (98.0%) | 163 (2.0%) |
| 6 to 18 Years | 19,076 (95.8%) | 845 (4.2%) |
| 19 to 25 Years | 15,201 (92.9%) | 1,153 (7.0%) |
| 26 to 34 Years | 13,826 (87.3%) | 2,013 (12.7%) |
| 35 to 44 Years | 16,089 (91.9%) | 1,421 (8.1%) |
| 45 to 54 Years | 13,556 (90.1%) | 1,487 (9.9%) |
| 55 to 64 Years | 15,889 (93.1%) | 1,175 (6.9%) |
| 65 to 74 Years | 16,194 (99.8%) | 41 (0.3%) |
| 75 Years and older | 9,203 (99.9%) | 7 (0.1%) |
| Total | 126,923 (93.9%) | 8,305 (6.1%) |
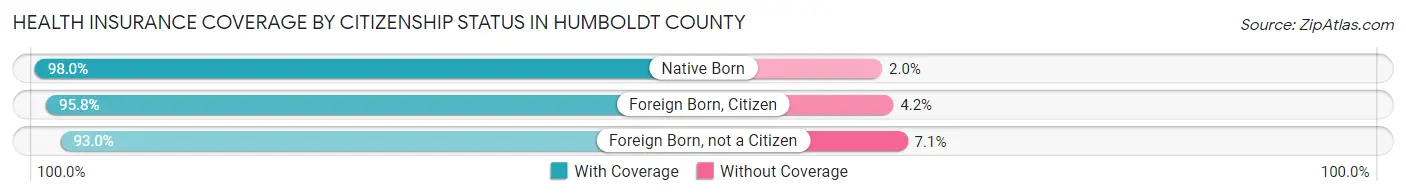
Health Insurance Coverage by Citizenship Status in Humboldt County
| Citizenship Status | With Coverage | Without Coverage |
| Native Born | 7,889 (98.0%) | 163 (2.0%) |
| Foreign Born, Citizen | 19,076 (95.8%) | 845 (4.2%) |
| Foreign Born, not a Citizen | 15,201 (92.9%) | 1,153 (7.0%) |
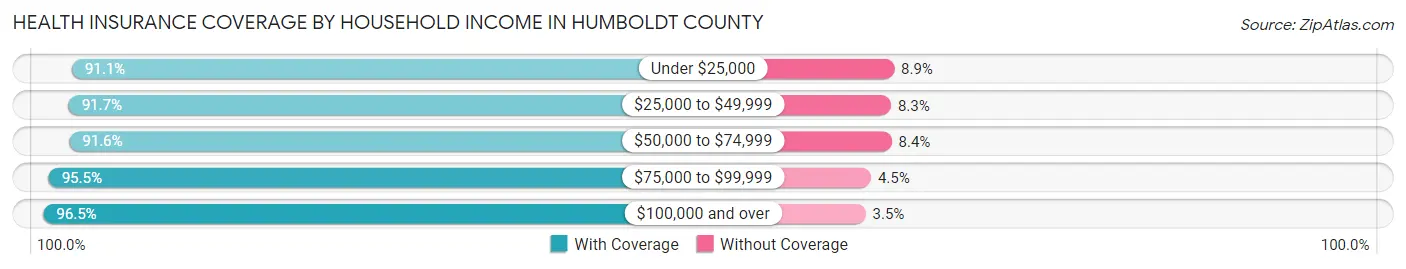
Health Insurance Coverage by Household Income in Humboldt County
| Household Income | With Coverage | Without Coverage |
| Under $25,000 | 18,181 (91.1%) | 1,769 (8.9%) |
| $25,000 to $49,999 | 23,920 (91.7%) | 2,158 (8.3%) |
| $50,000 to $74,999 | 19,252 (91.6%) | 1,763 (8.4%) |
| $75,000 to $99,999 | 16,874 (95.5%) | 801 (4.5%) |
| $100,000 and over | 45,432 (96.5%) | 1,662 (3.5%) |
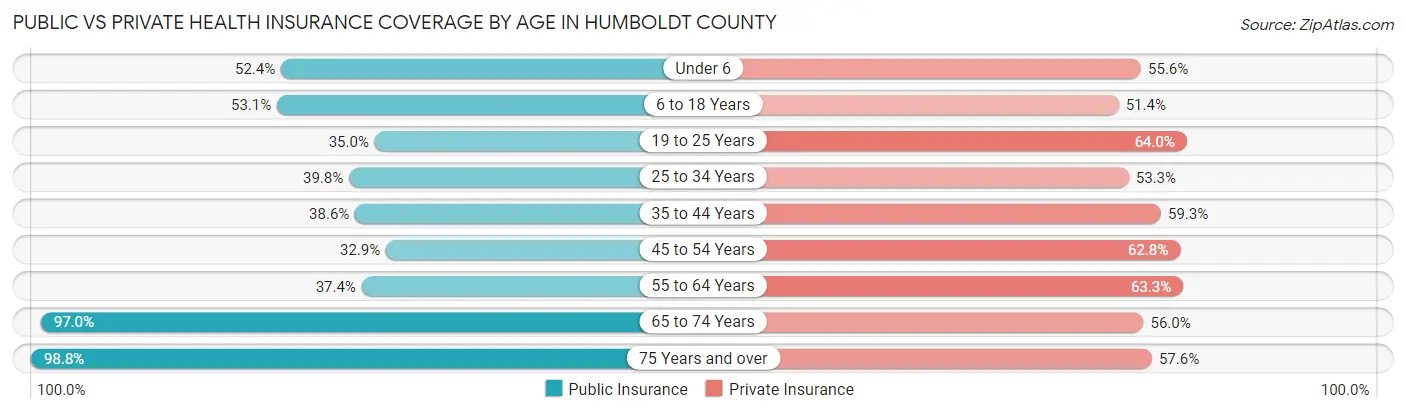
Public vs Private Health Insurance Coverage by Age in Humboldt County
| Age Bracket | Public Insurance | Private Insurance |
| Under 6 | 4,219 (52.4%) | 4,474 (55.6%) |
| 6 to 18 Years | 10,587 (53.1%) | 10,240 (51.4%) |
| 19 to 25 Years | 5,726 (35.0%) | 10,468 (64.0%) |
| 25 to 34 Years | 6,300 (39.8%) | 8,439 (53.3%) |
| 35 to 44 Years | 6,765 (38.6%) | 10,377 (59.3%) |
| 45 to 54 Years | 4,949 (32.9%) | 9,446 (62.8%) |
| 55 to 64 Years | 6,387 (37.4%) | 10,807 (63.3%) |
| 65 to 74 Years | 15,746 (97.0%) | 9,094 (56.0%) |
| 75 Years and over | 9,101 (98.8%) | 5,303 (57.6%) |
| Total | 69,780 (51.6%) | 78,648 (58.2%) |
Disability Status by Sex by Age in Humboldt County
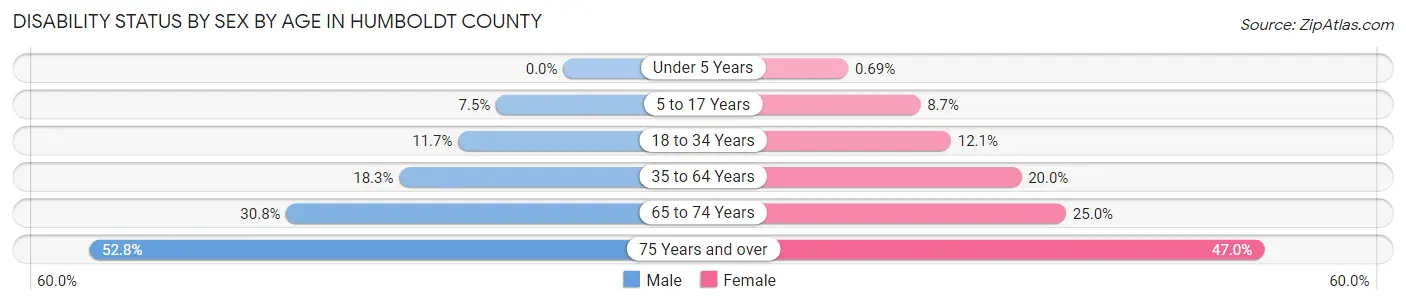
| Age Bracket | Male | Female |
| Under 5 Years | 0 (0.0%) | 23 (0.7%) |
| 5 to 17 Years | 730 (7.5%) | 809 (8.7%) |
| 18 to 34 Years | 2,004 (11.7%) | 2,116 (12.1%) |
| 35 to 64 Years | 4,607 (18.3%) | 4,876 (20.0%) |
| 65 to 74 Years | 2,400 (30.8%) | 2,110 (25.0%) |
| 75 Years and over | 2,087 (52.8%) | 2,473 (47.0%) |
Disability Class by Sex by Age in Humboldt County
Disability Class: Hearing Difficulty
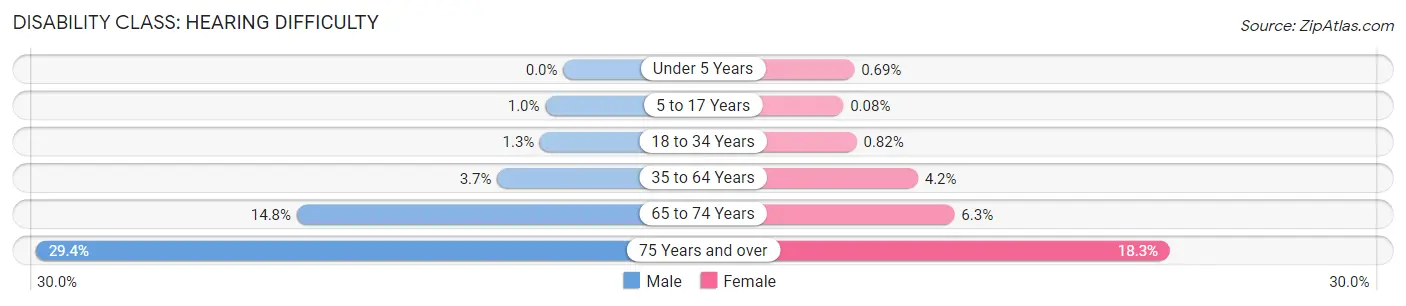
| Age Bracket | Male | Female |
| Under 5 Years | 0 (0.0%) | 23 (0.7%) |
| 5 to 17 Years | 98 (1.0%) | 7 (0.1%) |
| 18 to 34 Years | 221 (1.3%) | 143 (0.8%) |
| 35 to 64 Years | 928 (3.7%) | 1,033 (4.2%) |
| 65 to 74 Years | 1,155 (14.8%) | 530 (6.3%) |
| 75 Years and over | 1,161 (29.4%) | 961 (18.3%) |
Disability Class: Vision Difficulty
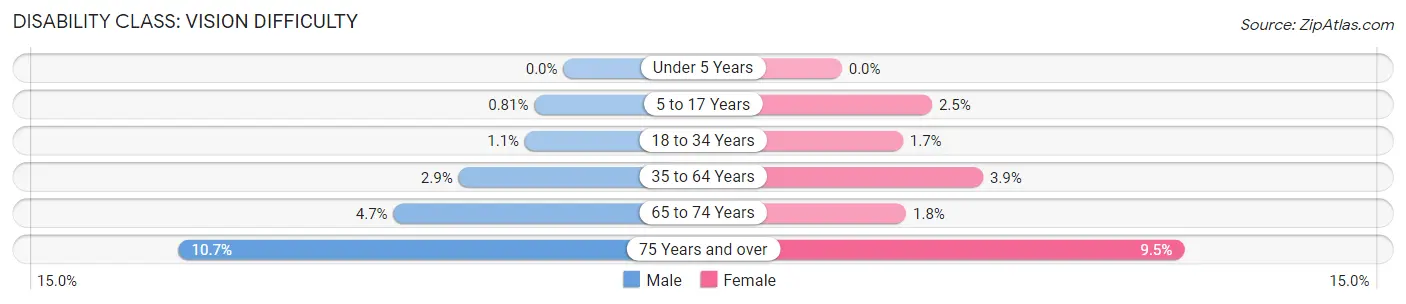
| Age Bracket | Male | Female |
| Under 5 Years | 0 (0.0%) | 0 (0.0%) |
| 5 to 17 Years | 79 (0.8%) | 233 (2.5%) |
| 18 to 34 Years | 184 (1.1%) | 297 (1.7%) |
| 35 to 64 Years | 736 (2.9%) | 960 (3.9%) |
| 65 to 74 Years | 368 (4.7%) | 151 (1.8%) |
| 75 Years and over | 423 (10.7%) | 501 (9.5%) |
Disability Class: Cognitive Difficulty
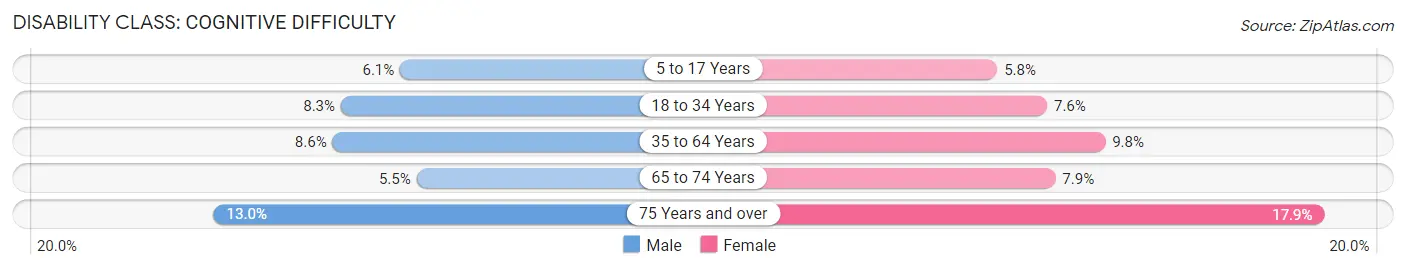
| Age Bracket | Male | Female |
| 5 to 17 Years | 592 (6.1%) | 535 (5.8%) |
| 18 to 34 Years | 1,415 (8.3%) | 1,329 (7.6%) |
| 35 to 64 Years | 2,160 (8.6%) | 2,387 (9.8%) |
| 65 to 74 Years | 424 (5.4%) | 670 (7.9%) |
| 75 Years and over | 513 (13.0%) | 942 (17.9%) |
Disability Class: Ambulatory Difficulty
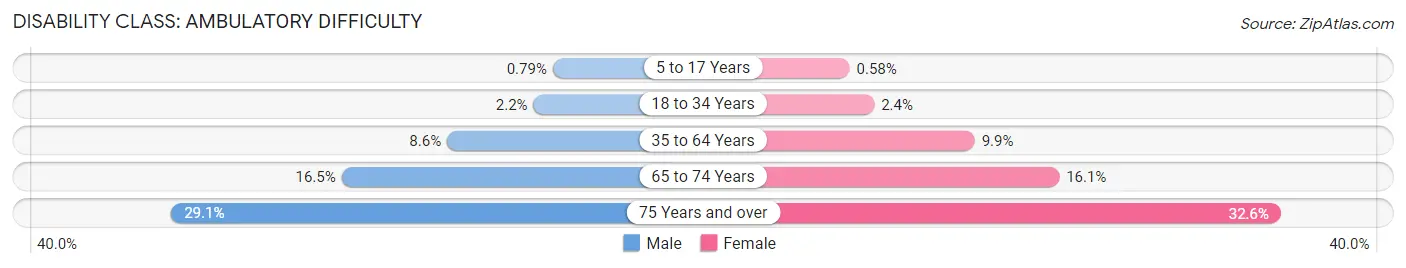
| Age Bracket | Male | Female |
| 5 to 17 Years | 77 (0.8%) | 54 (0.6%) |
| 18 to 34 Years | 381 (2.2%) | 421 (2.4%) |
| 35 to 64 Years | 2,179 (8.6%) | 2,409 (9.9%) |
| 65 to 74 Years | 1,282 (16.5%) | 1,364 (16.1%) |
| 75 Years and over | 1,150 (29.1%) | 1,714 (32.6%) |
Disability Class: Self-Care Difficulty
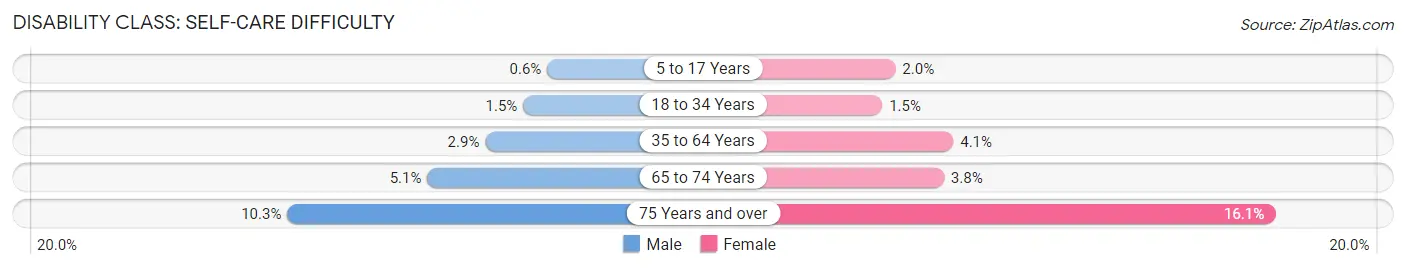
| Age Bracket | Male | Female |
| 5 to 17 Years | 59 (0.6%) | 184 (2.0%) |
| 18 to 34 Years | 255 (1.5%) | 262 (1.5%) |
| 35 to 64 Years | 730 (2.9%) | 1,011 (4.1%) |
| 65 to 74 Years | 393 (5.1%) | 320 (3.8%) |
| 75 Years and over | 405 (10.2%) | 848 (16.1%) |
Technology Access in Humboldt County
Computing Device Access in Humboldt County
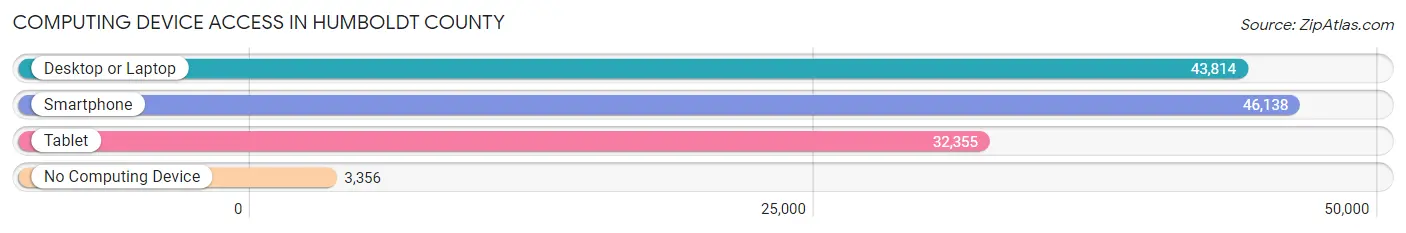
| Device Type | # Households | % Households |
| Desktop or Laptop | 43,814 | 80.4% |
| Smartphone | 46,138 | 84.7% |
| Tablet | 32,355 | 59.4% |
| No Computing Device | 3,356 | 6.2% |
| Total | 54,495 | 100.0% |
Internet Access in Humboldt County
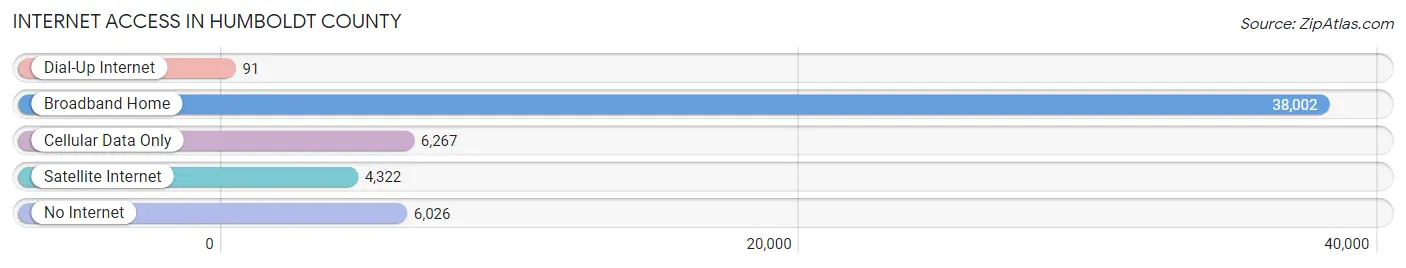
| Internet Type | # Households | % Households |
| Dial-Up Internet | 91 | 0.2% |
| Broadband Home | 38,002 | 69.7% |
| Cellular Data Only | 6,267 | 11.5% |
| Satellite Internet | 4,322 | 7.9% |
| No Internet | 6,026 | 11.1% |
| Total | 54,495 | 100.0% |
Humboldt County Summary
Humboldt County is a county located in the northern part of California, United States. It is the fourth-largest county in the state by population, with a population of 134,623 as of the 2010 census. The county seat is Eureka, the largest city in the county. Humboldt County is located on the Pacific coast of California, and is bordered by Del Norte County to the north, Trinity County to the east, Mendocino County to the south, and the Pacific Ocean to the west.
History
Humboldt County was formed in 1853 from parts of Trinity County. It was named after the German naturalist Alexander von Humboldt, who explored the area in the early 19th century. The county was originally populated by Native American tribes, including the Wiyot, Yurok, and Hupa. The first European settlers arrived in the area in the 1850s, and the county was officially established in 1853.
The county was initially a major producer of timber, and the logging industry was the primary source of income for many of the county’s residents. The timber industry declined in the late 20th century, and the county’s economy shifted to focus on tourism, agriculture, and fishing.
Geography
Humboldt County is located in the northern part of California, and is bordered by Del Norte County to the north, Trinity County to the east, Mendocino County to the south, and the Pacific Ocean to the west. The county covers an area of 4,572 square miles, making it the fourth-largest county in the state by area.
The county is divided into two distinct regions: the Coast Range and the Redwood Empire. The Coast Range is located in the western part of the county and is characterized by steep, rugged terrain and dense forests. The Redwood Empire is located in the eastern part of the county and is characterized by flat, rolling hills and redwood forests.
The county is home to several rivers, including the Eel River, the Klamath River, and the Mad River. The Eel River is the largest river in the county, and is a major source of water for the region.
Economy
Humboldt County’s economy is largely based on tourism, agriculture, and fishing. The county is home to several state parks, including Redwood National Park, which is a major tourist destination. The county is also home to several wineries, and the wine industry is a major contributor to the local economy.
Agriculture is also an important part of the county’s economy. The county is home to several farms, and the primary crops grown in the area are apples, pears, and other fruits and vegetables. The fishing industry is also an important part of the local economy, and the county is home to several commercial fishing operations.
Demographics
As of the 2010 census, Humboldt County had a population of 134,623. The racial makeup of the county was 79.2% White, 0.7% African American, 5.3% Native American, 2.2% Asian, 0.2% Pacific Islander, 8.2% from other races, and 4.2% from two or more races. Hispanic or Latino of any race were 16.3% of the population.
The median household income in the county was $41,845, and the median family income was $50,817. The per capita income in the county was $22,845. About 14.2% of the population was below the poverty line.
Humboldt County is home to several Native American tribes, including the Wiyot, Yurok, and Hupa. The county is also home to a large population of immigrants, primarily from Mexico and Central America. The county is also home to a large population of retirees, and the median age in the county is 40.7 years.
Common Questions
What is Per Capita Income in Humboldt County?
Per Capita income in Humboldt County is $33,988.
What is the Median Family Income in Humboldt County?
Median Family Income in Humboldt County is $80,244.
What is the Median Household income in Humboldt County?
Median Household Income in Humboldt County is $57,881.
What is Income or Wage Gap in Humboldt County?
Income or Wage Gap in Humboldt County is 24.5%.
Women in Humboldt County earn 75.5 cents for every dollar earned by a man.
What is Family Income Deficit in Humboldt County?
Family Income Deficit in Humboldt County is $10,676.
Families that are below poverty line in Humboldt County earn $10,676 less on average than the poverty threshold level.
What is Inequality or Gini Index in Humboldt County?
Inequality or Gini Index in Humboldt County is 0.48.
What is the Total Population of Humboldt County?
Total Population of Humboldt County is 136,132.
What is the Total Male Population of Humboldt County?
Total Male Population of Humboldt County is 67,729.
What is the Total Female Population of Humboldt County?
Total Female Population of Humboldt County is 68,403.
What is the Ratio of Males per 100 Females in Humboldt County?
There are 99.01 Males per 100 Females in Humboldt County.
What is the Ratio of Females per 100 Males in Humboldt County?
There are 101.00 Females per 100 Males in Humboldt County.
What is the Median Population Age in Humboldt County?
Median Population Age in Humboldt County is 39.5 Years.
What is the Average Family Size in Humboldt County
Average Family Size in Humboldt County is 3.0 People.
What is the Average Household Size in Humboldt County
Average Household Size in Humboldt County is 2.4 People.
How Large is the Labor Force in Humboldt County?
There are 66,816 People in the Labor Forcein in Humboldt County.
What is the Percentage of People in the Labor Force in Humboldt County?
58.9% of People are in the Labor Force in Humboldt County.
What is the Unemployment Rate in Humboldt County?
Unemployment Rate in Humboldt County is 9.2%.