Glenn County, CA Map & Demographics
Glenn County Overview
$28,106
PER CAPITA INCOME
$75,654
AVG FAMILY INCOME
$64,033
AVG HOUSEHOLD INCOME
22.7%
WAGE / INCOME GAP [ % ]
77.3¢/ $1
WAGE / INCOME GAP [ $ ]
$11,931
FAMILY INCOME DEFICIT
0.41
INEQUALITY / GINI INDEX
28,657
TOTAL POPULATION
14,763
MALE POPULATION
13,894
FEMALE POPULATION
106.25
MALES / 100 FEMALES
94.11
FEMALES / 100 MALES
35.8
MEDIAN AGE
3.5
AVG FAMILY SIZE
2.9
AVG HOUSEHOLD SIZE
13,559
LABOR FORCE [ PEOPLE ]
61.6%
PERCENT IN LABOR FORCE
7.7%
UNEMPLOYMENT RATE
Glenn County Area Codes
Income in Glenn County
Income Overview in Glenn County
Per Capita Income in Glenn County is $28,106, while median incomes of families and households are $75,654 and $64,033 respectively.
| Characteristic | Number | Measure |
| Per Capita Income | 28,657 | $28,106 |
| Median Family Income | 6,870 | $75,654 |
| Mean Family Income | 6,870 | $88,679 |
| Median Household Income | 9,742 | $64,033 |
| Mean Household Income | 9,742 | $78,523 |
| Income Deficit | 6,870 | $11,931 |
| Wage / Income Gap (%) | 28,657 | 22.68% |
| Wage / Income Gap ($) | 28,657 | 77.32¢ per $1 |
| Gini / Inequality Index | 28,657 | 0.41 |
Earnings by Sex in Glenn County
Average Earnings in Glenn County are $34,833, $39,144 for men and $30,266 for women, a difference of 22.7%.
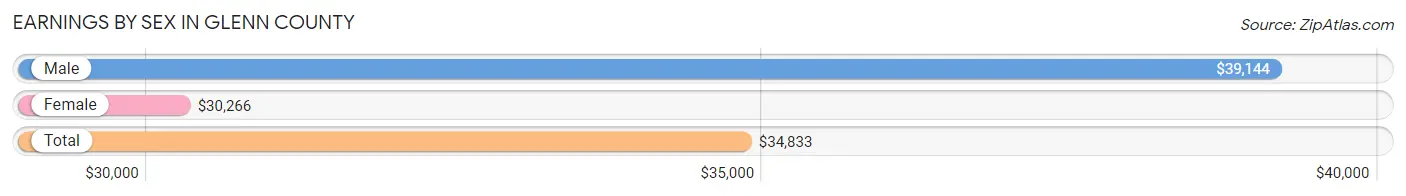
| Sex | Number | Average Earnings |
| Male | 8,017 (58.0%) | $39,144 |
| Female | 5,804 (42.0%) | $30,266 |
| Total | 13,821 (100.0%) | $34,833 |
Earnings by Sex by Income Bracket in Glenn County
The most common earnings brackets in Glenn County are $75,000 to $99,999 for men (887 | 11.1%) and $30,000 to $34,999 for women (464 | 8.0%).
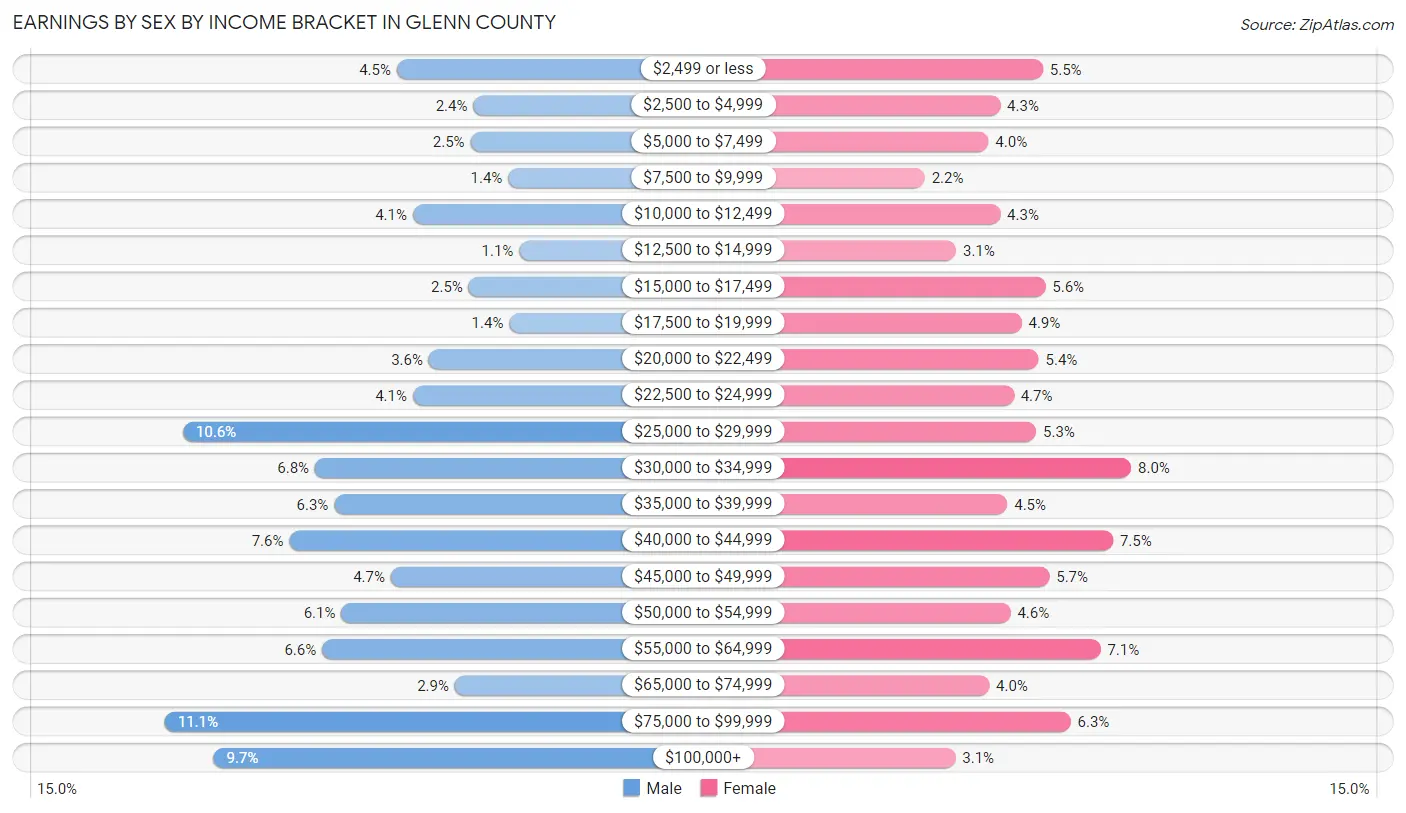
| Income | Male | Female |
| $2,499 or less | 364 (4.5%) | 320 (5.5%) |
| $2,500 to $4,999 | 192 (2.4%) | 250 (4.3%) |
| $5,000 to $7,499 | 198 (2.5%) | 231 (4.0%) |
| $7,500 to $9,999 | 113 (1.4%) | 127 (2.2%) |
| $10,000 to $12,499 | 328 (4.1%) | 250 (4.3%) |
| $12,500 to $14,999 | 88 (1.1%) | 178 (3.1%) |
| $15,000 to $17,499 | 202 (2.5%) | 324 (5.6%) |
| $17,500 to $19,999 | 111 (1.4%) | 285 (4.9%) |
| $20,000 to $22,499 | 292 (3.6%) | 313 (5.4%) |
| $22,500 to $24,999 | 328 (4.1%) | 272 (4.7%) |
| $25,000 to $29,999 | 846 (10.5%) | 309 (5.3%) |
| $30,000 to $34,999 | 548 (6.8%) | 464 (8.0%) |
| $35,000 to $39,999 | 505 (6.3%) | 262 (4.5%) |
| $40,000 to $44,999 | 606 (7.6%) | 434 (7.5%) |
| $45,000 to $49,999 | 378 (4.7%) | 330 (5.7%) |
| $50,000 to $54,999 | 489 (6.1%) | 267 (4.6%) |
| $55,000 to $64,999 | 532 (6.6%) | 414 (7.1%) |
| $65,000 to $74,999 | 233 (2.9%) | 232 (4.0%) |
| $75,000 to $99,999 | 887 (11.1%) | 365 (6.3%) |
| $100,000+ | 777 (9.7%) | 177 (3.0%) |
| Total | 8,017 (100.0%) | 5,804 (100.0%) |
Earnings by Sex by Educational Attainment in Glenn County
Average earnings in Glenn County are $42,479 for men and $34,917 for women, a difference of 17.8%. Men with an educational attainment of graduate degree enjoy the highest average annual earnings of $104,135, while those with less than high school education earn the least with $35,577. Women with an educational attainment of graduate degree earn the most with the average annual earnings of $71,765, while those with less than high school education have the smallest earnings of $23,841.
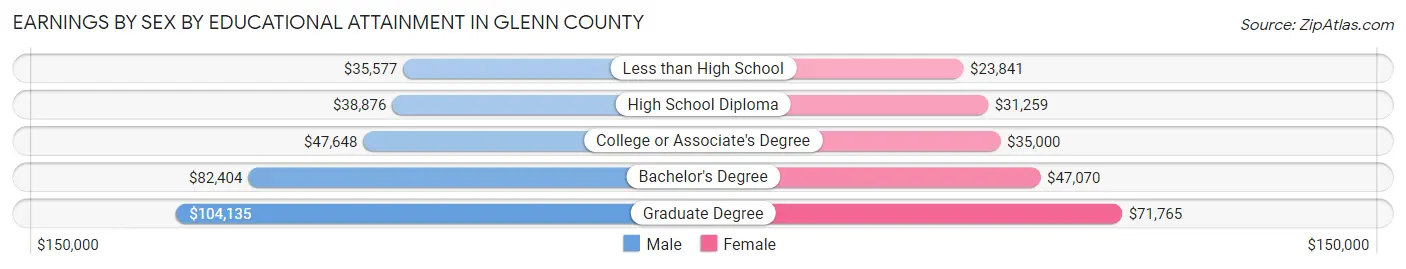
| Educational Attainment | Male Income | Female Income |
| Less than High School | $35,577 | $23,841 |
| High School Diploma | $38,876 | $31,259 |
| College or Associate's Degree | $47,648 | $35,000 |
| Bachelor's Degree | $82,404 | $47,070 |
| Graduate Degree | $104,135 | $71,765 |
| Total | $42,479 | $34,917 |
Family Income in Glenn County
Family Income Brackets in Glenn County
According to the Glenn County family income data, there are 1,491 families falling into the $100,000 to $149,999 income range, which is the most common income bracket and makes up 21.7% of all families. Conversely, the less than $10,000 income bracket is the least frequent group with only 220 families (3.2%) belonging to this category.
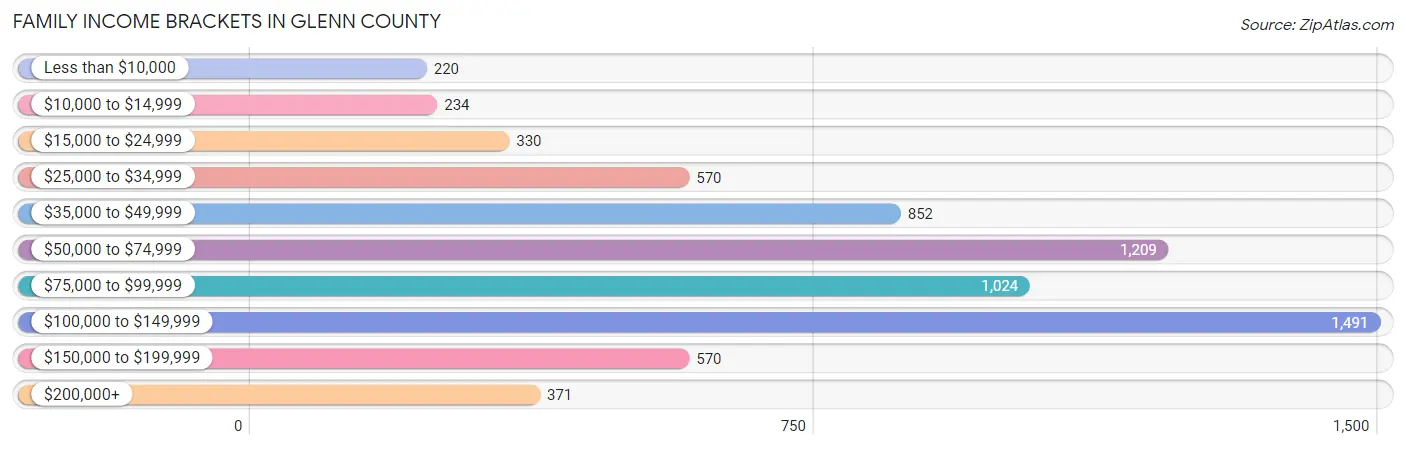
| Income Bracket | # Families | % Families |
| Less than $10,000 | 220 | 3.2% |
| $10,000 to $14,999 | 234 | 3.4% |
| $15,000 to $24,999 | 330 | 4.8% |
| $25,000 to $34,999 | 570 | 8.3% |
| $35,000 to $49,999 | 852 | 12.4% |
| $50,000 to $74,999 | 1,209 | 17.6% |
| $75,000 to $99,999 | 1,024 | 14.9% |
| $100,000 to $149,999 | 1,491 | 21.7% |
| $150,000 to $199,999 | 570 | 8.3% |
| $200,000+ | 371 | 5.4% |
Family Income by Famaliy Size in Glenn County
4-person families (1,248 | 18.2%) account for the highest median family income in Glenn County with $98,618 per family, while 2-person families (2,990 | 43.5%) have the highest median income of $35,266 per family member.
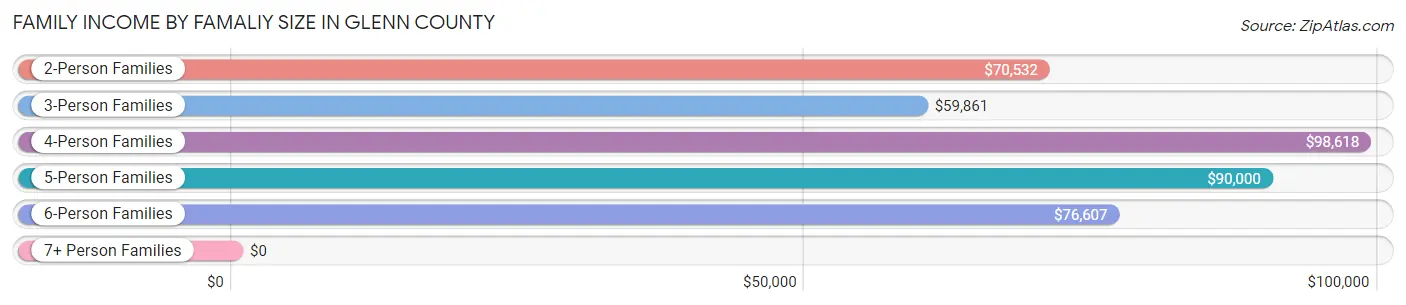
| Income Bracket | # Families | Median Income |
| 2-Person Families | 2,990 (43.5%) | $70,532 |
| 3-Person Families | 1,523 (22.2%) | $59,861 |
| 4-Person Families | 1,248 (18.2%) | $98,618 |
| 5-Person Families | 654 (9.5%) | $90,000 |
| 6-Person Families | 221 (3.2%) | $76,607 |
| 7+ Person Families | 234 (3.4%) | $0 |
| Total | 6,870 (100.0%) | $75,654 |
Family Income by Number of Earners in Glenn County
The median family income in Glenn County is $75,654, with families comprising 3+ earners (948) having the highest median family income of $127,500, while families with no earners (1,074) have the lowest median family income of $40,427, accounting for 13.8% and 15.6% of families, respectively.
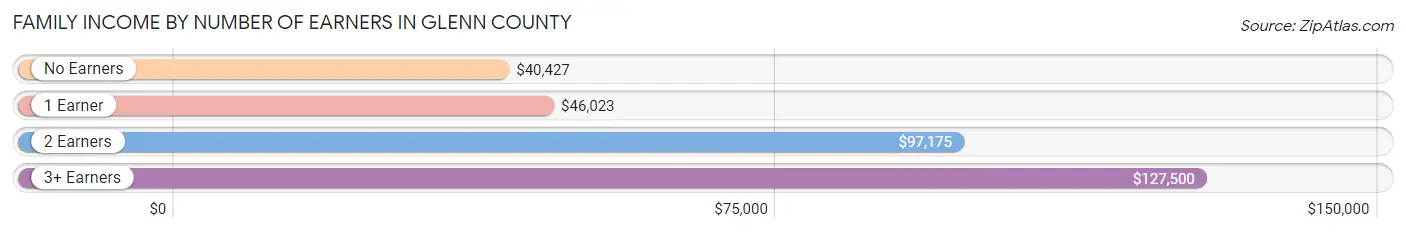
| Number of Earners | # Families | Median Income |
| No Earners | 1,074 (15.6%) | $40,427 |
| 1 Earner | 2,369 (34.5%) | $46,023 |
| 2 Earners | 2,479 (36.1%) | $97,175 |
| 3+ Earners | 948 (13.8%) | $127,500 |
| Total | 6,870 (100.0%) | $75,654 |
Household Income in Glenn County
Household Income Brackets in Glenn County
With 1,822 households falling in the category, the $50,000 to $74,999 income range is the most frequent in Glenn County, accounting for 18.7% of all households. In contrast, only 399 households (4.1%) fall into the less than $10,000 income bracket, making it the least populous group.
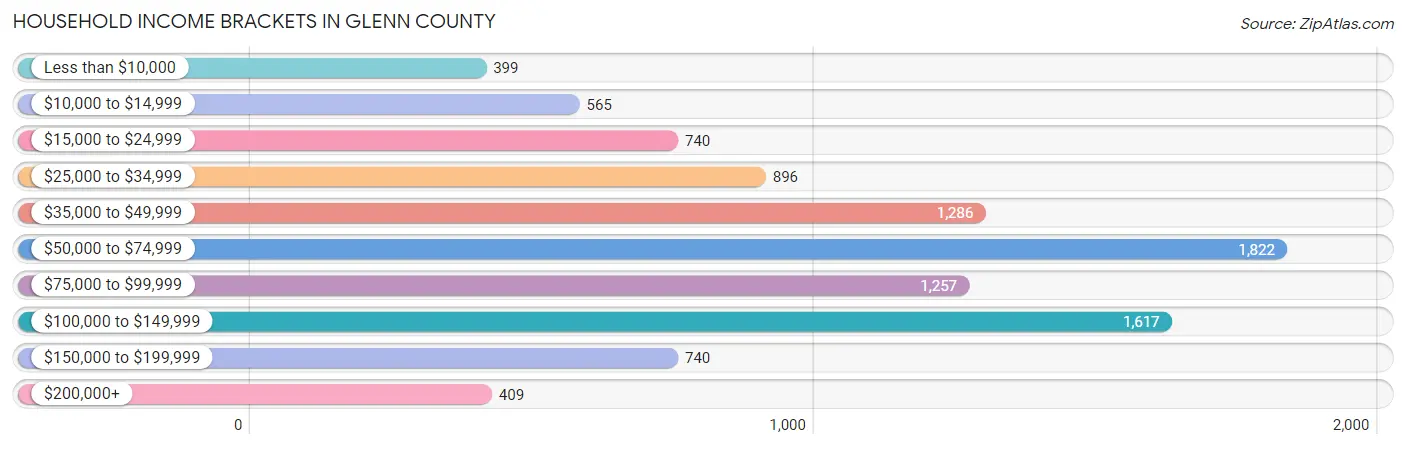
| Income Bracket | # Households | % Households |
| Less than $10,000 | 399 | 4.1% |
| $10,000 to $14,999 | 565 | 5.8% |
| $15,000 to $24,999 | 740 | 7.6% |
| $25,000 to $34,999 | 896 | 9.2% |
| $35,000 to $49,999 | 1,286 | 13.2% |
| $50,000 to $74,999 | 1,822 | 18.7% |
| $75,000 to $99,999 | 1,257 | 12.9% |
| $100,000 to $149,999 | 1,617 | 16.6% |
| $150,000 to $199,999 | 740 | 7.6% |
| $200,000+ | 409 | 4.2% |
Household Income by Householder Age in Glenn County
The median household income in Glenn County is $64,033, with the highest median household income of $73,300 found in the 45 to 64 years age bracket for the primary householder. A total of 3,388 households (34.8%) fall into this category. Meanwhile, the 15 to 24 years age bracket for the primary householder has the lowest median household income of $43,958, with 212 households (2.2%) in this group.
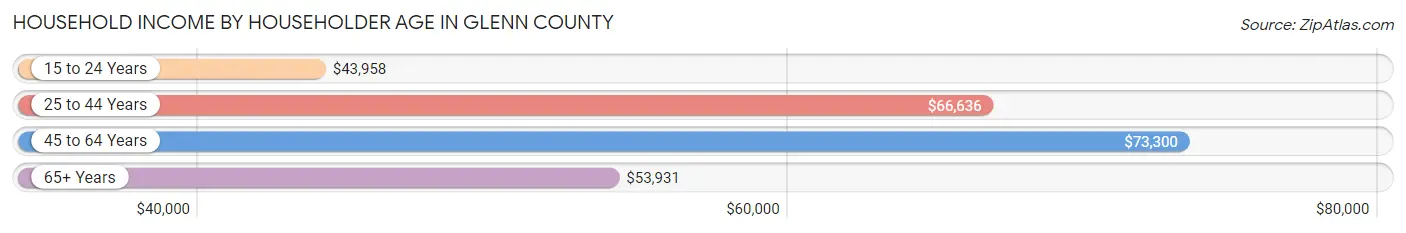
| Income Bracket | # Households | Median Income |
| 15 to 24 Years | 212 (2.2%) | $43,958 |
| 25 to 44 Years | 3,271 (33.6%) | $66,636 |
| 45 to 64 Years | 3,388 (34.8%) | $73,300 |
| 65+ Years | 2,871 (29.5%) | $53,931 |
| Total | 9,742 (100.0%) | $64,033 |
Poverty in Glenn County
Income Below Poverty by Sex and Age in Glenn County
With 12.1% poverty level for males and 18.6% for females among the residents of Glenn County, under 5 year old males and 5 year old females are the most vulnerable to poverty, with 539 males (43.4%) and 81 females (75.0%) in their respective age groups living below the poverty level.
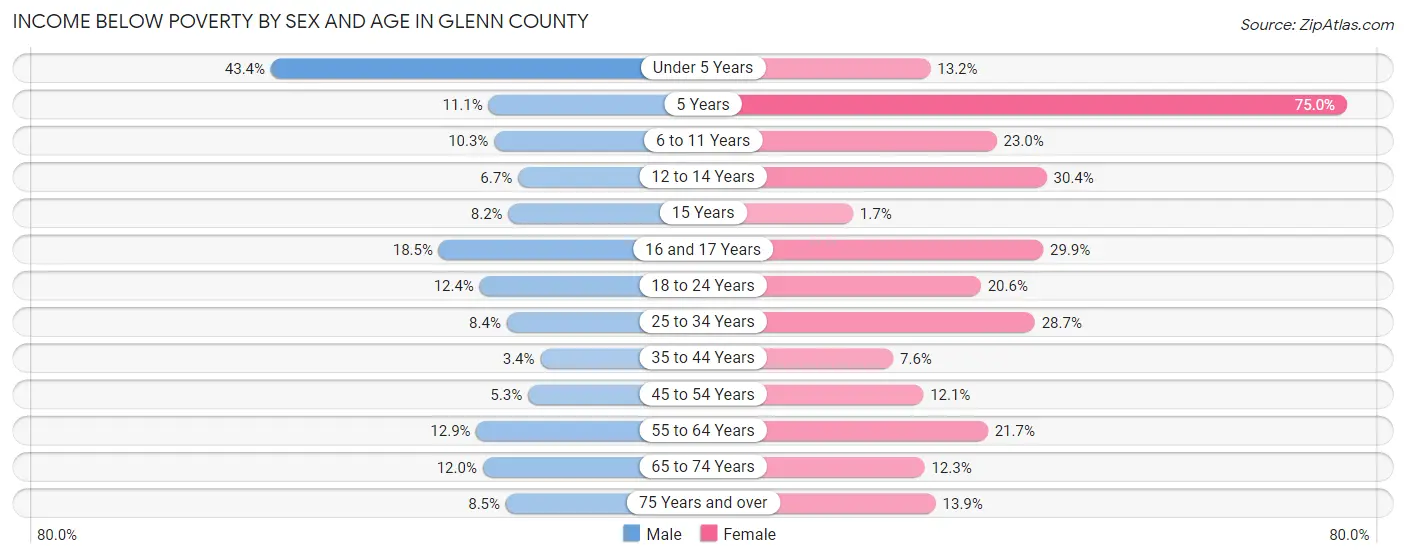
| Age Bracket | Male | Female |
| Under 5 Years | 539 (43.4%) | 109 (13.2%) |
| 5 Years | 21 (11.1%) | 81 (75.0%) |
| 6 to 11 Years | 120 (10.3%) | 281 (23.0%) |
| 12 to 14 Years | 56 (6.7%) | 201 (30.4%) |
| 15 Years | 15 (8.2%) | 3 (1.7%) |
| 16 and 17 Years | 83 (18.5%) | 144 (29.9%) |
| 18 to 24 Years | 163 (12.4%) | 262 (20.6%) |
| 25 to 34 Years | 167 (8.4%) | 491 (28.6%) |
| 35 to 44 Years | 58 (3.4%) | 124 (7.6%) |
| 45 to 54 Years | 83 (5.2%) | 188 (12.1%) |
| 55 to 64 Years | 220 (12.9%) | 358 (21.7%) |
| 65 to 74 Years | 172 (12.0%) | 175 (12.3%) |
| 75 Years and over | 71 (8.5%) | 150 (13.9%) |
| Total | 1,768 (12.1%) | 2,567 (18.6%) |
Income Above Poverty by Sex and Age in Glenn County
According to the poverty statistics in Glenn County, males aged 35 to 44 years and females aged 15 years are the age groups that are most secure financially, with 96.6% of males and 98.4% of females in these age groups living above the poverty line.
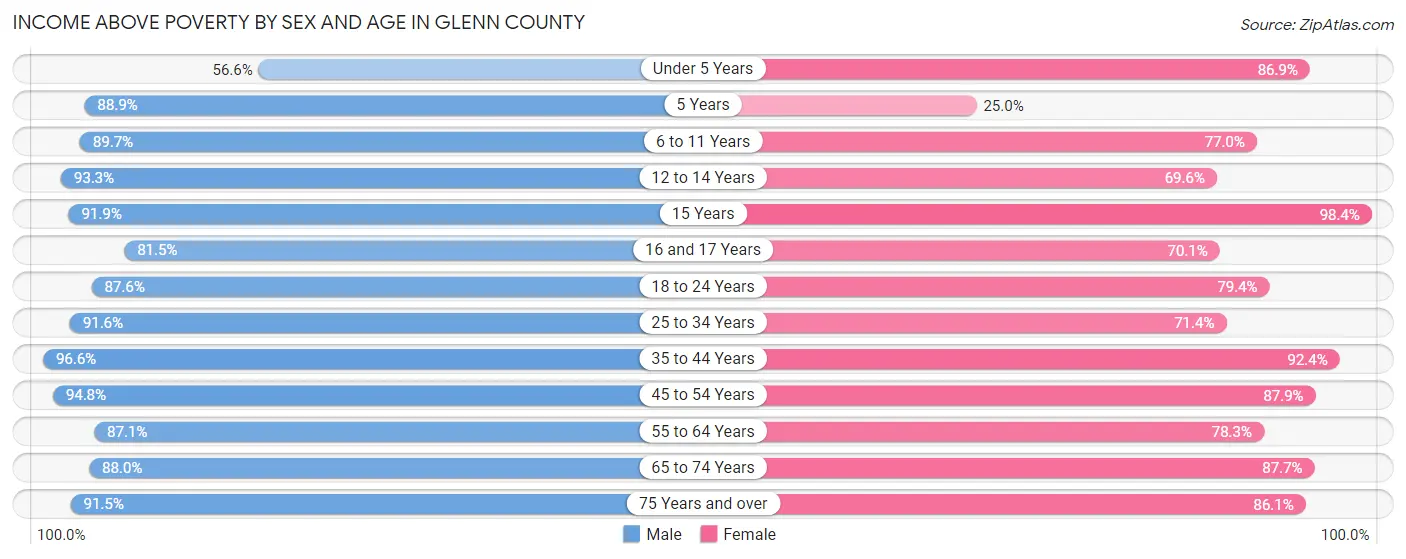
| Age Bracket | Male | Female |
| Under 5 Years | 702 (56.6%) | 720 (86.9%) |
| 5 Years | 168 (88.9%) | 27 (25.0%) |
| 6 to 11 Years | 1,048 (89.7%) | 942 (77.0%) |
| 12 to 14 Years | 775 (93.3%) | 460 (69.6%) |
| 15 Years | 169 (91.8%) | 179 (98.4%) |
| 16 and 17 Years | 366 (81.5%) | 338 (70.1%) |
| 18 to 24 Years | 1,149 (87.6%) | 1,008 (79.4%) |
| 25 to 34 Years | 1,819 (91.6%) | 1,223 (71.4%) |
| 35 to 44 Years | 1,644 (96.6%) | 1,504 (92.4%) |
| 45 to 54 Years | 1,499 (94.8%) | 1,367 (87.9%) |
| 55 to 64 Years | 1,484 (87.1%) | 1,294 (78.3%) |
| 65 to 74 Years | 1,265 (88.0%) | 1,250 (87.7%) |
| 75 Years and over | 760 (91.5%) | 927 (86.1%) |
| Total | 12,848 (87.9%) | 11,239 (81.4%) |
Income Below Poverty Among Married-Couple Families in Glenn County
The poverty statistics for married-couple families in Glenn County show that 6.9% or 357 of the total 5,182 families live below the poverty line. Families with 5 or more children have the highest poverty rate of 79.8%, comprising of 99 families. On the other hand, families with 3 or 4 children have the lowest poverty rate of 1.7%, which includes 10 families.
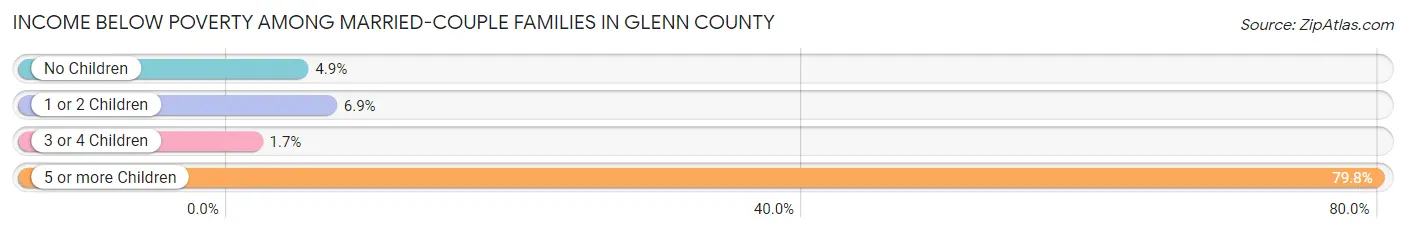
| Children | Above Poverty | Below Poverty |
| No Children | 2,873 (95.1%) | 148 (4.9%) |
| 1 or 2 Children | 1,353 (93.1%) | 100 (6.9%) |
| 3 or 4 Children | 574 (98.3%) | 10 (1.7%) |
| 5 or more Children | 25 (20.2%) | 99 (79.8%) |
| Total | 4,825 (93.1%) | 357 (6.9%) |
Income Below Poverty Among Single-Parent Households in Glenn County
According to the poverty data in Glenn County, 15.6% or 87 single-father households and 30.8% or 348 single-mother households are living below the poverty line. Among single-father households, those with 3 or 4 children have the highest poverty rate, with 2 households (100.0%) experiencing poverty. Likewise, among single-mother households, those with 5 or more children have the highest poverty rate, with 1 households (100.0%) falling below the poverty line.
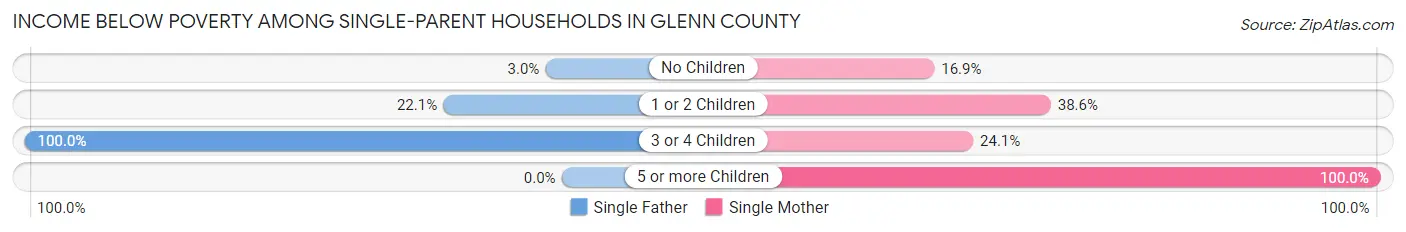
| Children | Single Father | Single Mother |
| No Children | 6 (3.0%) | 53 (16.9%) |
| 1 or 2 Children | 79 (22.1%) | 260 (38.6%) |
| 3 or 4 Children | 2 (100.0%) | 34 (24.1%) |
| 5 or more Children | 0 (0.0%) | 1 (100.0%) |
| Total | 87 (15.6%) | 348 (30.8%) |
Income Below Poverty Among Married-Couple vs Single-Parent Households in Glenn County
The poverty data for Glenn County shows that 357 of the married-couple family households (6.9%) and 435 of the single-parent households (25.8%) are living below the poverty level. Within the married-couple family households, those with 5 or more children have the highest poverty rate, with 99 households (79.8%) falling below the poverty line. Among the single-parent households, those with 5 or more children have the highest poverty rate, with 1 household (100.0%) living below poverty.
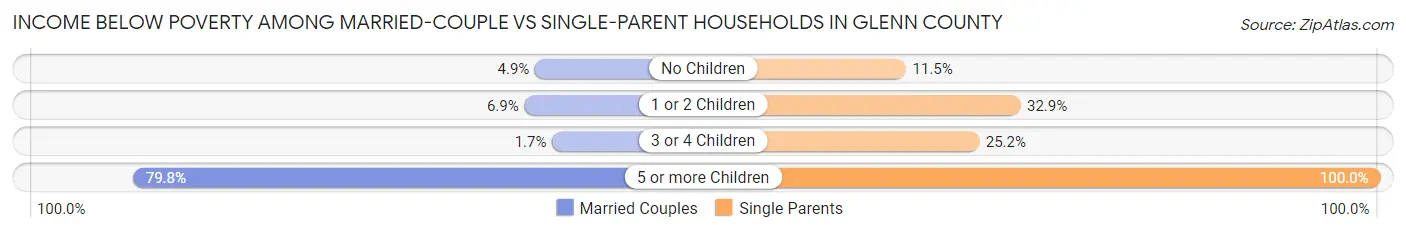
| Children | Married-Couple Families | Single-Parent Households |
| No Children | 148 (4.9%) | 59 (11.5%) |
| 1 or 2 Children | 100 (6.9%) | 339 (32.9%) |
| 3 or 4 Children | 10 (1.7%) | 36 (25.2%) |
| 5 or more Children | 99 (79.8%) | 1 (100.0%) |
| Total | 357 (6.9%) | 435 (25.8%) |
Race in Glenn County
The most populous races in Glenn County are White / Caucasian (19,350 | 67.5%), Hispanic or Latino (12,418 | 43.3%), and Some other Race (4,085 | 14.2%).
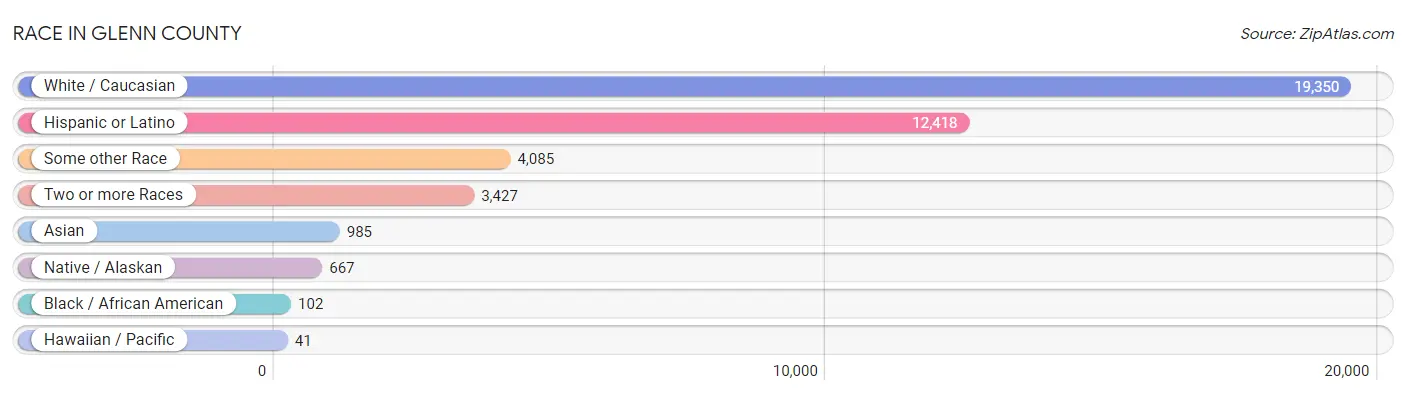
| Race | # Population | % Population |
| Asian | 985 | 3.4% |
| Black / African American | 102 | 0.4% |
| Hawaiian / Pacific | 41 | 0.1% |
| Hispanic or Latino | 12,418 | 43.3% |
| Native / Alaskan | 667 | 2.3% |
| White / Caucasian | 19,350 | 67.5% |
| Two or more Races | 3,427 | 12.0% |
| Some other Race | 4,085 | 14.2% |
| Total | 28,657 | 100.0% |
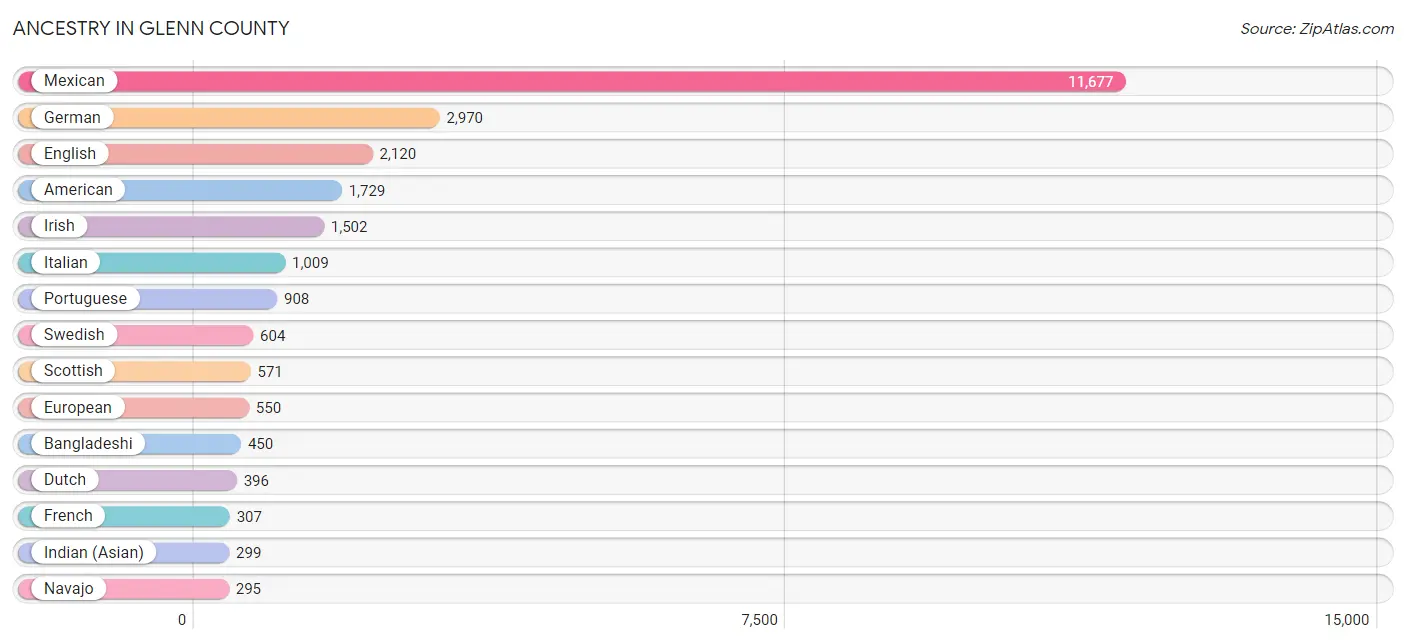
Ancestry in Glenn County
The most populous ancestries reported in Glenn County are Mexican (11,677 | 40.7%), German (2,970 | 10.4%), English (2,120 | 7.4%), American (1,729 | 6.0%), and Irish (1,502 | 5.2%), together accounting for 69.8% of all Glenn County residents.
| Ancestry | # Population | % Population |
| African | 3 | 0.0% |
| American | 1,729 | 6.0% |
| Apache | 18 | 0.1% |
| Arab | 11 | 0.0% |
| Austrian | 4 | 0.0% |
| Bangladeshi | 450 | 1.6% |
| Belgian | 9 | 0.0% |
| Bhutanese | 58 | 0.2% |
| British | 69 | 0.2% |
| Canadian | 149 | 0.5% |
| Central American | 293 | 1.0% |
| Central American Indian | 15 | 0.1% |
| Cherokee | 119 | 0.4% |
| Chickasaw | 31 | 0.1% |
| Chippewa | 8 | 0.0% |
| Choctaw | 69 | 0.2% |
| Colombian | 33 | 0.1% |
| Creek | 27 | 0.1% |
| Croatian | 17 | 0.1% |
| Cuban | 31 | 0.1% |
| Czech | 27 | 0.1% |
| Czechoslovakian | 30 | 0.1% |
| Danish | 196 | 0.7% |
| Dominican | 48 | 0.2% |
| Dutch | 396 | 1.4% |
| Eastern European | 23 | 0.1% |
| English | 2,120 | 7.4% |
| European | 550 | 1.9% |
| Finnish | 20 | 0.1% |
| French | 307 | 1.1% |
| French Canadian | 45 | 0.2% |
| German | 2,970 | 10.4% |
| Greek | 44 | 0.2% |
| Guatemalan | 9 | 0.0% |
| Honduran | 37 | 0.1% |
| Hopi | 8 | 0.0% |
| Hungarian | 42 | 0.2% |
| Indian (Asian) | 299 | 1.0% |
| Irish | 1,502 | 5.2% |
| Italian | 1,009 | 3.5% |
| Korean | 107 | 0.4% |
| Lebanese | 9 | 0.0% |
| Lithuanian | 3 | 0.0% |
| Malaysian | 67 | 0.2% |
| Maltese | 9 | 0.0% |
| Mexican | 11,677 | 40.7% |
| Mexican American Indian | 89 | 0.3% |
| Moroccan | 2 | 0.0% |
| Native Hawaiian | 36 | 0.1% |
| Navajo | 295 | 1.0% |
| Nicaraguan | 59 | 0.2% |
| Northern European | 19 | 0.1% |
| Norwegian | 231 | 0.8% |
| Pakistani | 2 | 0.0% |
| Pennsylvania German | 10 | 0.0% |
| Peruvian | 8 | 0.0% |
| Polish | 203 | 0.7% |
| Portuguese | 908 | 3.2% |
| Puerto Rican | 37 | 0.1% |
| Russian | 33 | 0.1% |
| Salvadoran | 188 | 0.7% |
| Samoan | 24 | 0.1% |
| Scandinavian | 19 | 0.1% |
| Scotch-Irish | 226 | 0.8% |
| Scottish | 571 | 2.0% |
| Sioux | 63 | 0.2% |
| Slovak | 2 | 0.0% |
| South American | 41 | 0.1% |
| Spaniard | 62 | 0.2% |
| Spanish | 111 | 0.4% |
| Sri Lankan | 73 | 0.3% |
| Subsaharan African | 3 | 0.0% |
| Swedish | 604 | 2.1% |
| Swiss | 92 | 0.3% |
| Thai | 13 | 0.1% |
| Ukrainian | 4 | 0.0% |
| Welsh | 100 | 0.4% | View All 77 Rows |
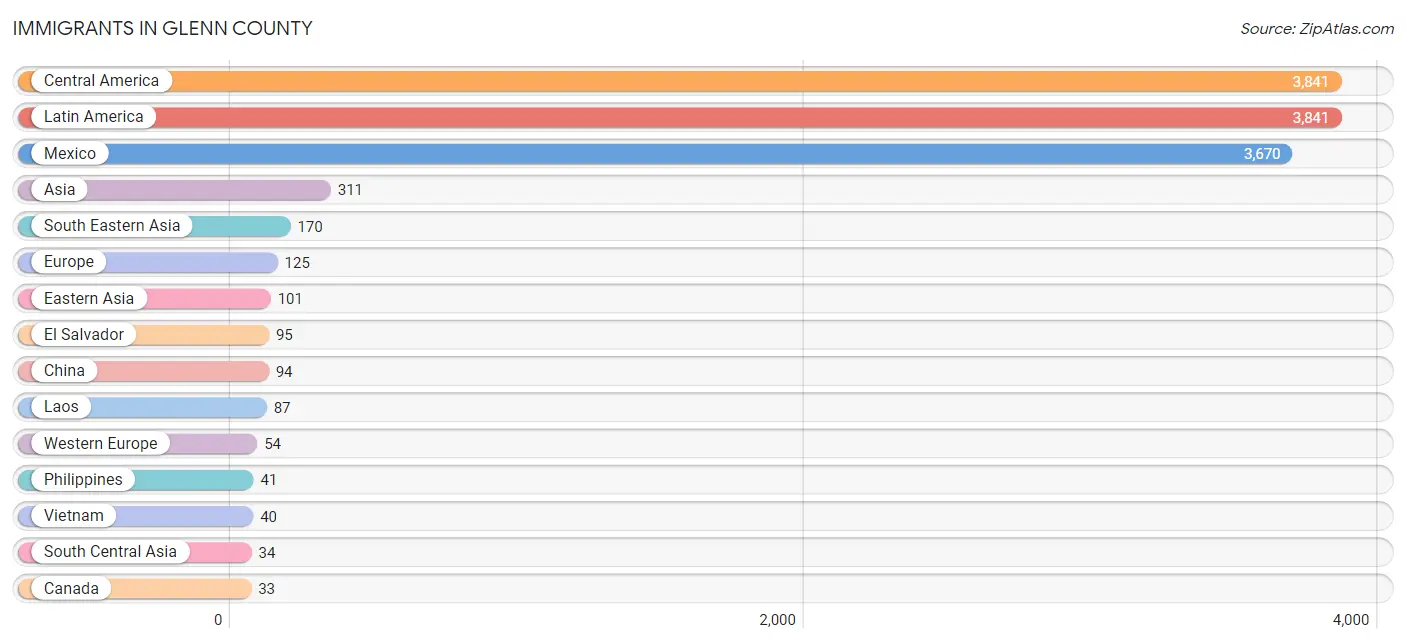
Immigrants in Glenn County
The most numerous immigrant groups reported in Glenn County came from Central America (3,841 | 13.4%), Latin America (3,841 | 13.4%), Mexico (3,670 | 12.8%), Asia (311 | 1.1%), and South Eastern Asia (170 | 0.6%), together accounting for 41.3% of all Glenn County residents.
| Immigration Origin | # Population | % Population |
| Africa | 2 | 0.0% |
| Asia | 311 | 1.1% |
| Australia | 5 | 0.0% |
| Canada | 33 | 0.1% |
| Central America | 3,841 | 13.4% |
| China | 94 | 0.3% |
| Costa Rica | 9 | 0.0% |
| Eastern Asia | 101 | 0.4% |
| Eastern Europe | 29 | 0.1% |
| El Salvador | 95 | 0.3% |
| Europe | 125 | 0.4% |
| Germany | 32 | 0.1% |
| Guatemala | 9 | 0.0% |
| Honduras | 26 | 0.1% |
| India | 11 | 0.0% |
| Ireland | 11 | 0.0% |
| Japan | 7 | 0.0% |
| Laos | 87 | 0.3% |
| Latin America | 3,841 | 13.4% |
| Mexico | 3,670 | 12.8% |
| Morocco | 2 | 0.0% |
| Netherlands | 16 | 0.1% |
| Nicaragua | 32 | 0.1% |
| Northern Africa | 2 | 0.0% |
| Northern Europe | 33 | 0.1% |
| Oceania | 5 | 0.0% |
| Pakistan | 23 | 0.1% |
| Philippines | 41 | 0.1% |
| Poland | 27 | 0.1% |
| Russia | 2 | 0.0% |
| South Central Asia | 34 | 0.1% |
| South Eastern Asia | 170 | 0.6% |
| Southern Europe | 9 | 0.0% |
| Switzerland | 6 | 0.0% |
| Syria | 6 | 0.0% |
| Thailand | 2 | 0.0% |
| Vietnam | 40 | 0.1% |
| Western Asia | 6 | 0.0% |
| Western Europe | 54 | 0.2% | View All 39 Rows |
Sex and Age in Glenn County
Sex and Age in Glenn County
The most populous age groups in Glenn County are 10 to 14 Years (1,401 | 9.5%) for men and 15 to 19 Years (1,092 | 7.9%) for women.
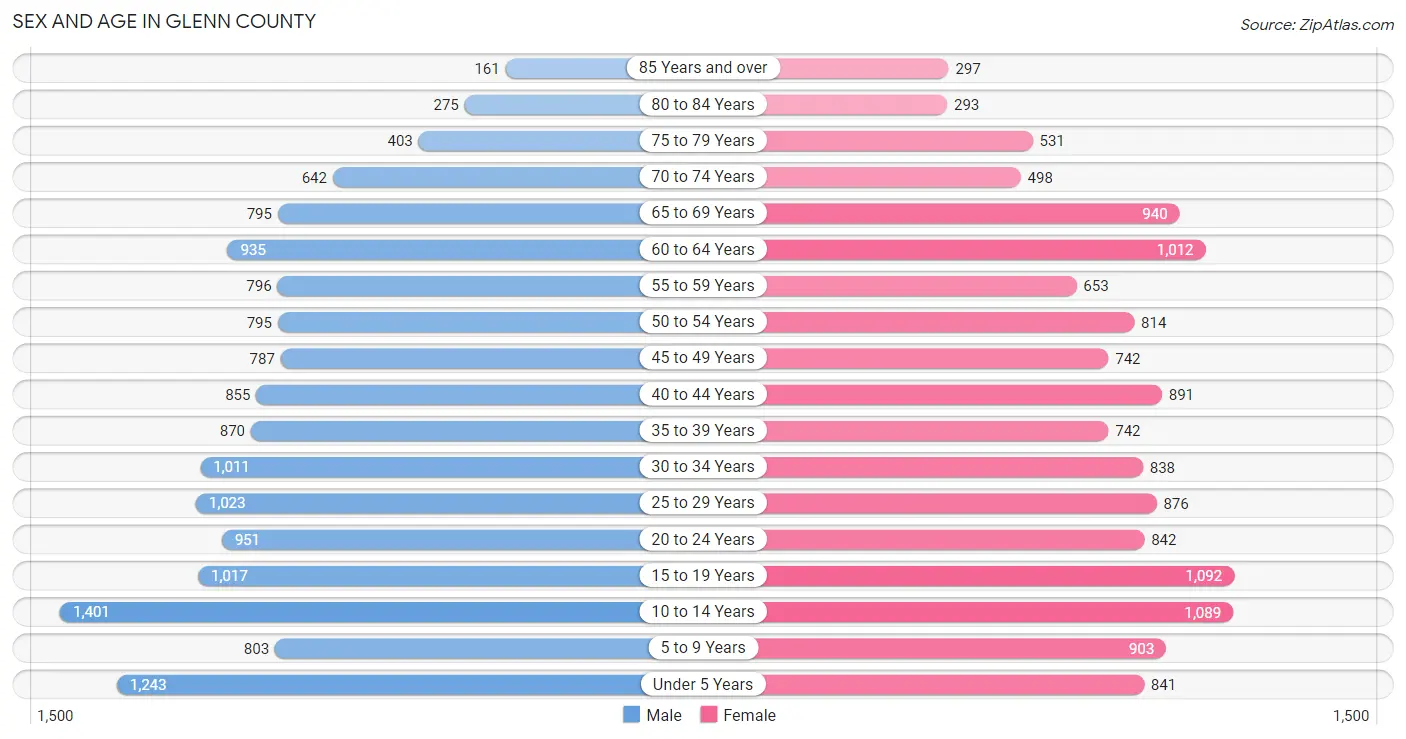
| Age Bracket | Male | Female |
| Under 5 Years | 1,243 (8.4%) | 841 (6.0%) |
| 5 to 9 Years | 803 (5.4%) | 903 (6.5%) |
| 10 to 14 Years | 1,401 (9.5%) | 1,089 (7.8%) |
| 15 to 19 Years | 1,017 (6.9%) | 1,092 (7.9%) |
| 20 to 24 Years | 951 (6.4%) | 842 (6.1%) |
| 25 to 29 Years | 1,023 (6.9%) | 876 (6.3%) |
| 30 to 34 Years | 1,011 (6.9%) | 838 (6.0%) |
| 35 to 39 Years | 870 (5.9%) | 742 (5.3%) |
| 40 to 44 Years | 855 (5.8%) | 891 (6.4%) |
| 45 to 49 Years | 787 (5.3%) | 742 (5.3%) |
| 50 to 54 Years | 795 (5.4%) | 814 (5.9%) |
| 55 to 59 Years | 796 (5.4%) | 653 (4.7%) |
| 60 to 64 Years | 935 (6.3%) | 1,012 (7.3%) |
| 65 to 69 Years | 795 (5.4%) | 940 (6.8%) |
| 70 to 74 Years | 642 (4.3%) | 498 (3.6%) |
| 75 to 79 Years | 403 (2.7%) | 531 (3.8%) |
| 80 to 84 Years | 275 (1.9%) | 293 (2.1%) |
| 85 Years and over | 161 (1.1%) | 297 (2.1%) |
| Total | 14,763 (100.0%) | 13,894 (100.0%) |
Families and Households in Glenn County
Median Family Size in Glenn County
The median family size in Glenn County is 3.55 persons per family, with married-couple families (5,182 | 75.4%) accounting for the largest median family size of 3.62 persons per family. On the other hand, single male/father families (558 | 8.1%) represent the smallest median family size with 3.18 persons per family.
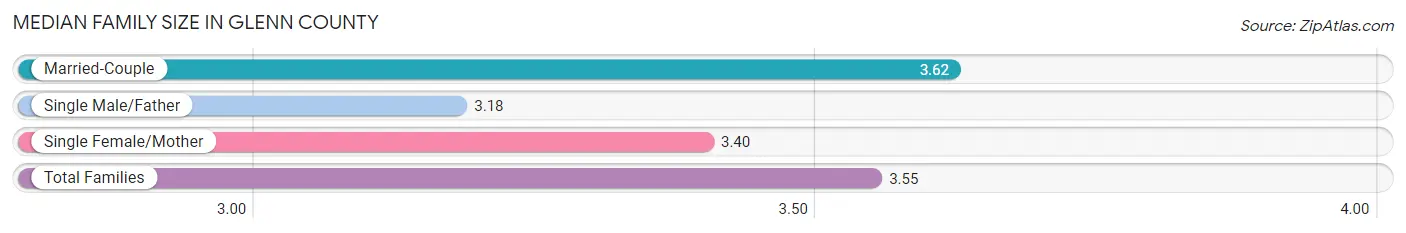
| Family Type | # Families | Family Size |
| Married-Couple | 5,182 (75.4%) | 3.62 |
| Single Male/Father | 558 (8.1%) | 3.18 |
| Single Female/Mother | 1,130 (16.5%) | 3.40 |
| Total Families | 6,870 (100.0%) | 3.55 |
Median Household Size in Glenn County
The median household size in Glenn County is 2.92 persons per household, with married-couple households (5,182 | 53.2%) accounting for the largest median household size of 3.65 persons per household. non-family households (2,872 | 29.5%) represent the smallest median household size with 1.19 persons per household.
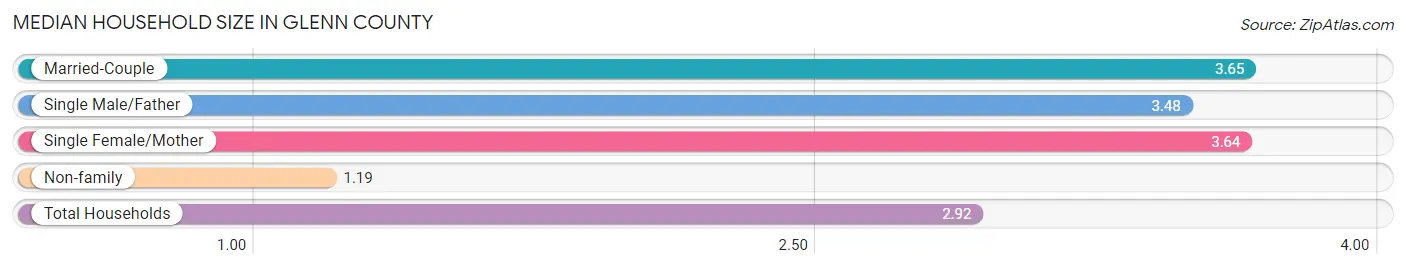
| Household Type | # Households | Household Size |
| Married-Couple | 5,182 (53.2%) | 3.65 |
| Single Male/Father | 558 (5.7%) | 3.48 |
| Single Female/Mother | 1,130 (11.6%) | 3.64 |
| Non-family | 2,872 (29.5%) | 1.19 |
| Total Households | 9,742 (100.0%) | 2.92 |
Household Size by Marriage Status in Glenn County
Out of a total of 9,742 households in Glenn County, 6,870 (70.5%) are family households, while 2,872 (29.5%) are nonfamily households. The most numerous type of family households are 2-person households, comprising 2,902, and the most common type of nonfamily households are 1-person households, comprising 2,382.
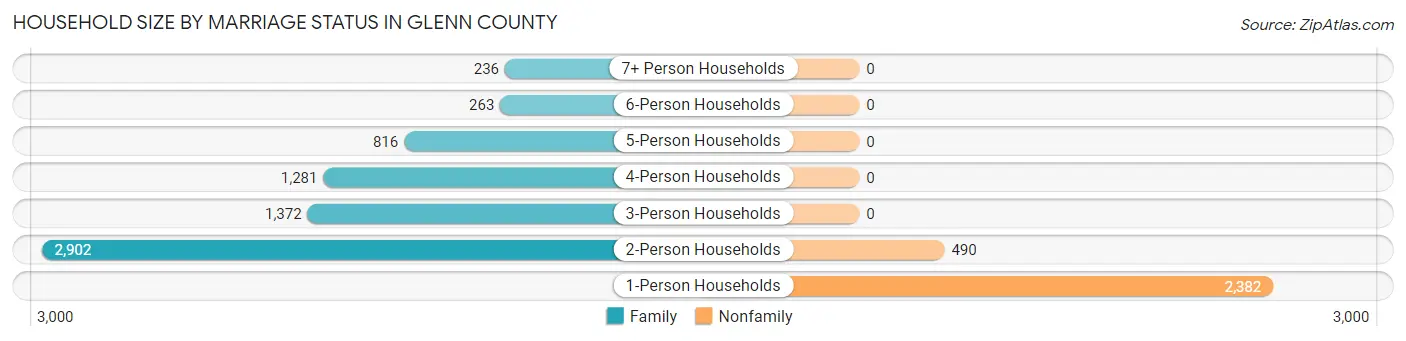
| Household Size | Family Households | Nonfamily Households |
| 1-Person Households | - | 2,382 (24.4%) |
| 2-Person Households | 2,902 (29.8%) | 490 (5.0%) |
| 3-Person Households | 1,372 (14.1%) | 0 (0.0%) |
| 4-Person Households | 1,281 (13.2%) | 0 (0.0%) |
| 5-Person Households | 816 (8.4%) | 0 (0.0%) |
| 6-Person Households | 263 (2.7%) | 0 (0.0%) |
| 7+ Person Households | 236 (2.4%) | 0 (0.0%) |
| Total | 6,870 (70.5%) | 2,872 (29.5%) |
Female Fertility in Glenn County
Fertility by Age in Glenn County
Average fertility rate in Glenn County is 74.0 births per 1,000 women. Women in the age bracket of 20 to 34 years have the highest fertility rate with 130.0 births per 1,000 women. Women in the age bracket of 20 to 34 years acount for 71.0% of all women with births.
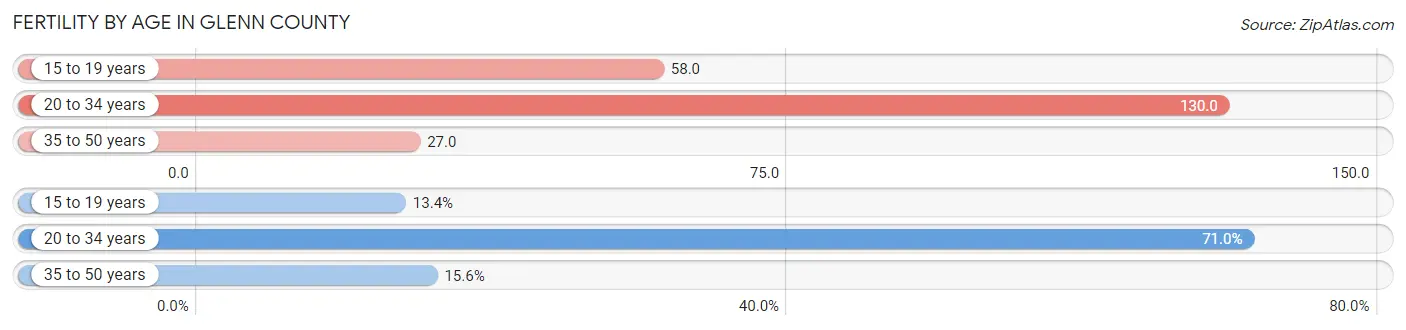
| Age Bracket | Women with Births | Births / 1,000 Women |
| 15 to 19 years | 63 (13.4%) | 58.0 |
| 20 to 34 years | 333 (71.0%) | 130.0 |
| 35 to 50 years | 73 (15.6%) | 27.0 |
| Total | 469 (100.0%) | 74.0 |
Fertility by Age by Marriage Status in Glenn County
73.6% of women with births (469) in Glenn County are married. The highest percentage of unmarried women with births falls into 15 to 19 years age bracket with 100.0% of them unmarried at the time of birth, while the lowest percentage of unmarried women with births belong to 20 to 34 years age bracket with 10.8% of them unmarried.
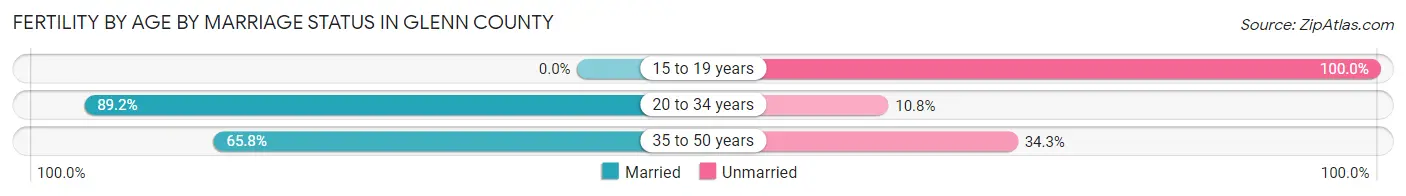
| Age Bracket | Married | Unmarried |
| 15 to 19 years | 0 (0.0%) | 63 (100.0%) |
| 20 to 34 years | 297 (89.2%) | 36 (10.8%) |
| 35 to 50 years | 48 (65.7%) | 25 (34.3%) |
| Total | 345 (73.6%) | 124 (26.4%) |
Fertility by Education in Glenn County
Average fertility rate in Glenn County is 74.0 births per 1,000 women. Women with the education attainment of graduate degree have the highest fertility rate of 319.0 births per 1,000 women, while women with the education attainment of bachelor's degree have the lowest fertility at 28.0 births per 1,000 women. Women with the education attainment of less than high school represent 36.9% of all women with births.
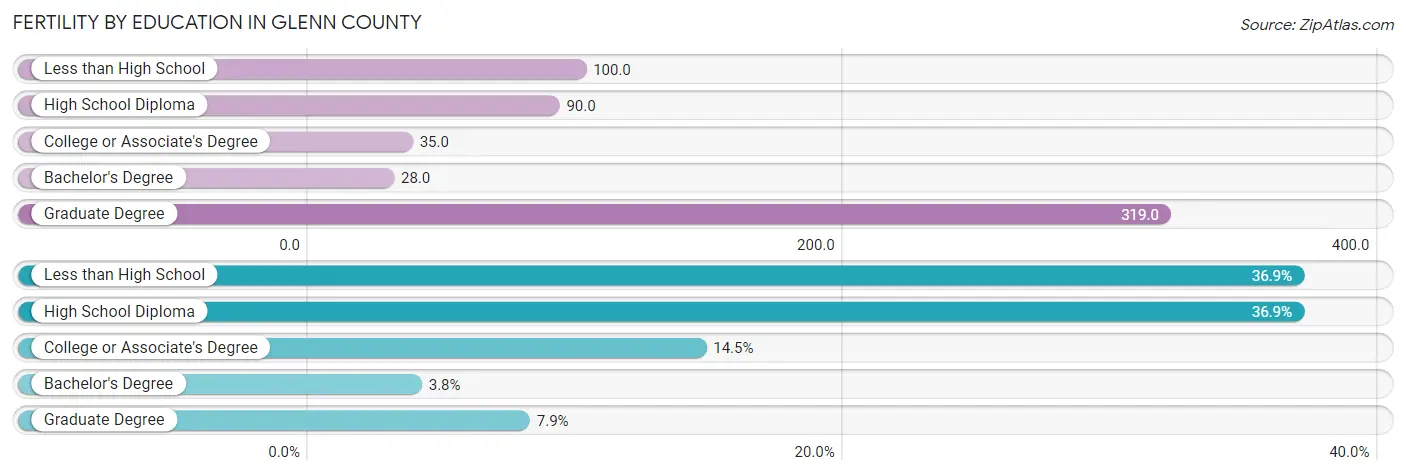
| Educational Attainment | Women with Births | Births / 1,000 Women |
| Less than High School | 173 (36.9%) | 100.0 |
| High School Diploma | 173 (36.9%) | 90.0 |
| College or Associate's Degree | 68 (14.5%) | 35.0 |
| Bachelor's Degree | 18 (3.8%) | 28.0 |
| Graduate Degree | 37 (7.9%) | 319.0 |
| Total | 469 (100.0%) | 74.0 |
Fertility by Education by Marriage Status in Glenn County
26.4% of women with births in Glenn County are unmarried. Women with the educational attainment of graduate degree are most likely to be married with 100.0% of them married at childbirth, while women with the educational attainment of high school diploma are least likely to be married with 34.7% of them unmarried at childbirth.
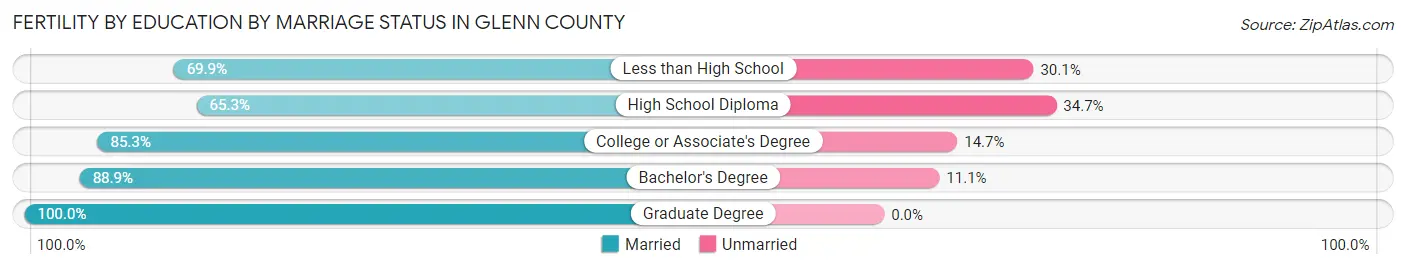
| Educational Attainment | Married | Unmarried |
| Less than High School | 121 (69.9%) | 52 (30.1%) |
| High School Diploma | 113 (65.3%) | 60 (34.7%) |
| College or Associate's Degree | 58 (85.3%) | 10 (14.7%) |
| Bachelor's Degree | 16 (88.9%) | 2 (11.1%) |
| Graduate Degree | 37 (100.0%) | 0 (0.0%) |
| Total | 345 (73.6%) | 124 (26.4%) |
Employment Characteristics in Glenn County
Employment by Class of Employer in Glenn County
Among the 12,118 employed individuals in Glenn County, private company employees (8,203 | 67.7%), local government employees (1,338 | 11.0%), and self-employed (not incorporated) (1,127 | 9.3%) make up the most common classes of employment.
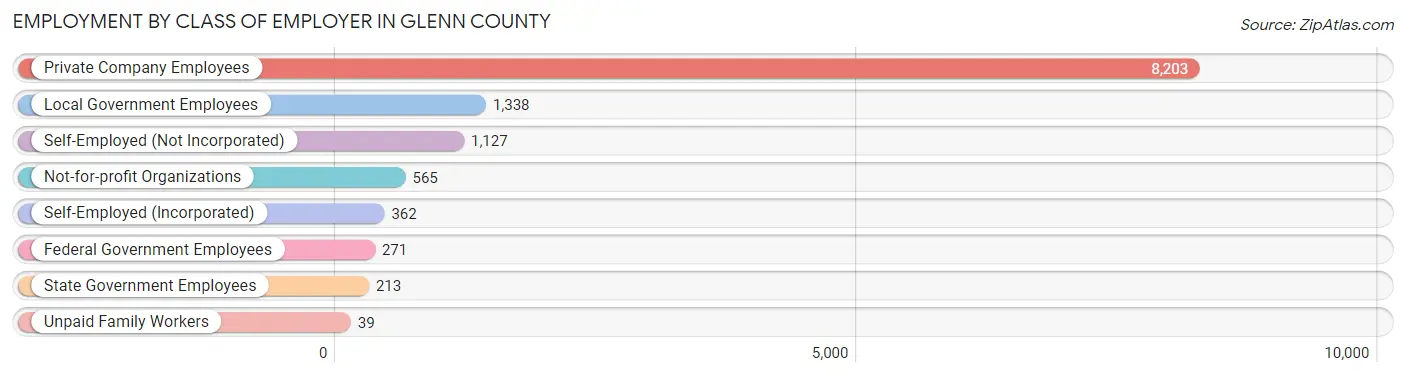
| Employer Class | # Employees | % Employees |
| Private Company Employees | 8,203 | 67.7% |
| Self-Employed (Incorporated) | 362 | 3.0% |
| Self-Employed (Not Incorporated) | 1,127 | 9.3% |
| Not-for-profit Organizations | 565 | 4.7% |
| Local Government Employees | 1,338 | 11.0% |
| State Government Employees | 213 | 1.8% |
| Federal Government Employees | 271 | 2.2% |
| Unpaid Family Workers | 39 | 0.3% |
| Total | 12,118 | 100.0% |
Employment Status by Age in Glenn County
According to the labor force statistics for Glenn County, out of the total population over 16 years of age (22,011), 61.6% or 13,559 individuals are in the labor force, with 7.7% or 1,044 of them unemployed. The age group with the highest labor force participation rate is 35 to 44 years, with 85.7% or 2,878 individuals in the labor force. Within the labor force, the 16 to 19 years age range has the highest percentage of unemployed individuals, with 27.2% or 205 of them being unemployed.
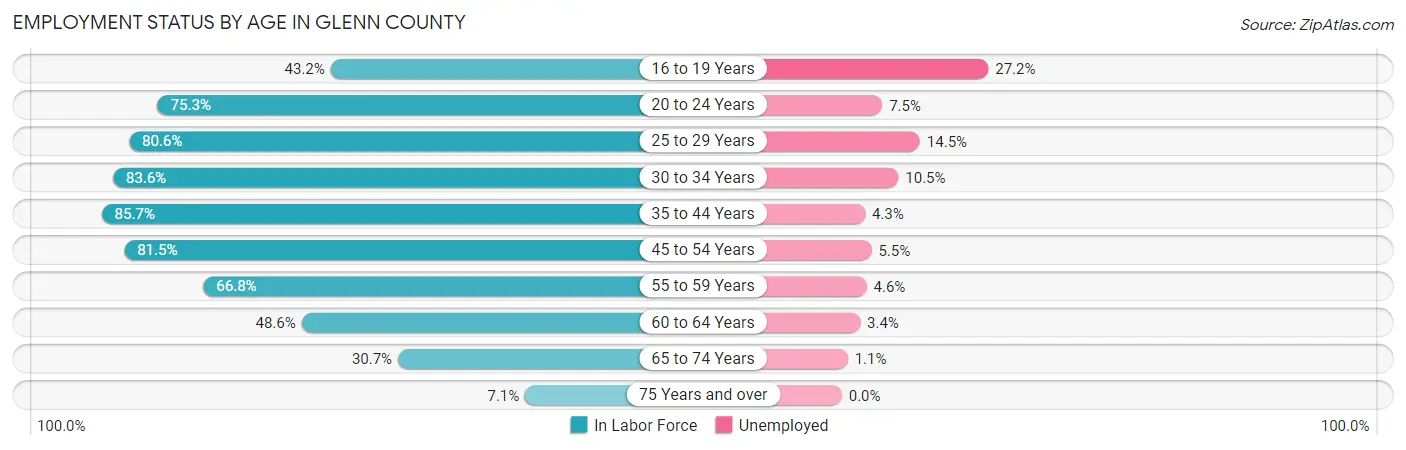
| Age Bracket | In Labor Force | Unemployed |
| 16 to 19 Years | 753 (43.2%) | 205 (27.2%) |
| 20 to 24 Years | 1,350 (75.3%) | 101 (7.5%) |
| 25 to 29 Years | 1,531 (80.6%) | 222 (14.5%) |
| 30 to 34 Years | 1,546 (83.6%) | 162 (10.5%) |
| 35 to 44 Years | 2,878 (85.7%) | 124 (4.3%) |
| 45 to 54 Years | 2,557 (81.5%) | 141 (5.5%) |
| 55 to 59 Years | 968 (66.8%) | 45 (4.6%) |
| 60 to 64 Years | 946 (48.6%) | 32 (3.4%) |
| 65 to 74 Years | 883 (30.7%) | 10 (1.1%) |
| 75 Years and over | 139 (7.1%) | 0 (0.0%) |
| Total | 13,559 (61.6%) | 1,044 (7.7%) |
Employment Status by Educational Attainment in Glenn County
According to labor force statistics for Glenn County, 76.5% of individuals (10,435) out of the total population between 25 and 64 years of age (13,640) are in the labor force, with 7.0% or 730 of them being unemployed. The group with the highest labor force participation rate are those with the educational attainment of bachelor's degree or higher, with 90.2% or 1,661 individuals in the labor force. Within the labor force, individuals with high school diploma education have the highest percentage of unemployment, with 12.6% or 397 of them being unemployed.
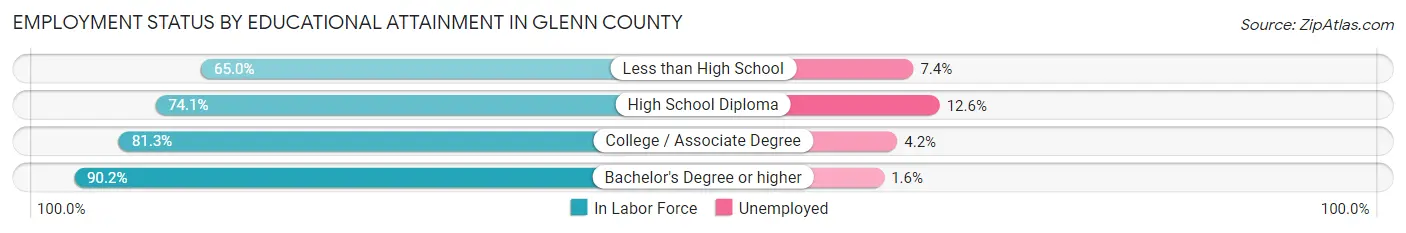
| Educational Attainment | In Labor Force | Unemployed |
| Less than High School | 2,059 (65.0%) | 234 (7.4%) |
| High School Diploma | 3,151 (74.1%) | 536 (12.6%) |
| College / Associate Degree | 3,560 (81.3%) | 184 (4.2%) |
| Bachelor's Degree or higher | 1,661 (90.2%) | 29 (1.6%) |
| Total | 10,435 (76.5%) | 955 (7.0%) |
Employment Occupations by Sex in Glenn County
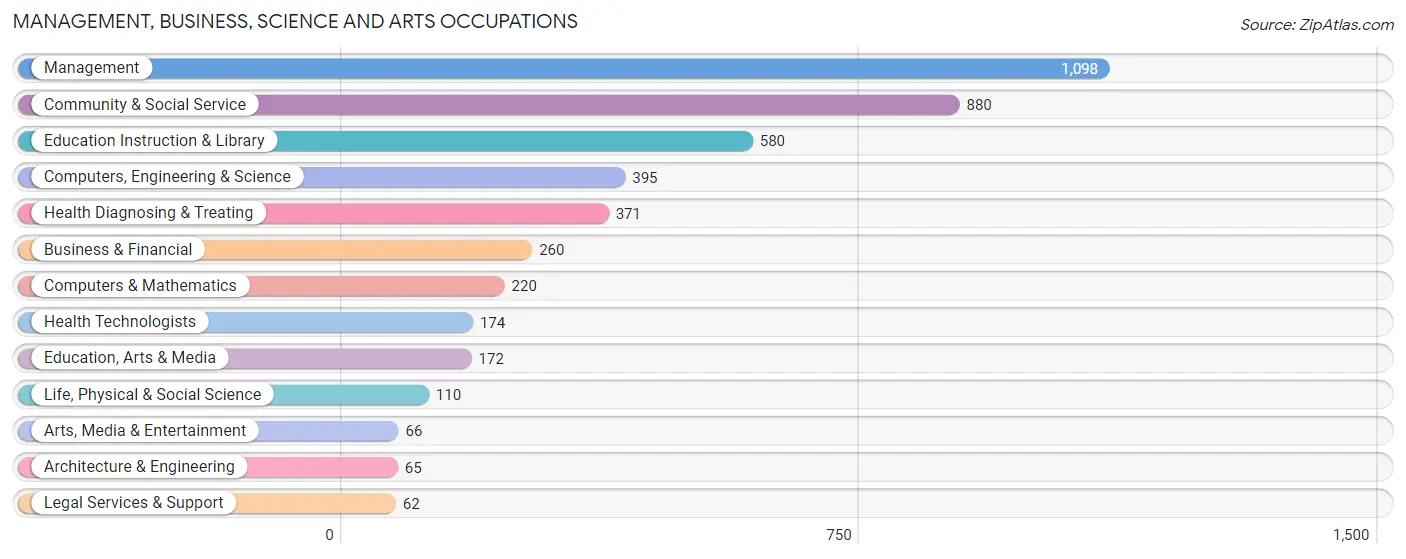
Management, Business, Science and Arts Occupations
The most common Management, Business, Science and Arts occupations in Glenn County are Management (1,098 | 8.8%), Community & Social Service (880 | 7.0%), Education Instruction & Library (580 | 4.6%), Computers, Engineering & Science (395 | 3.2%), and Health Diagnosing & Treating (371 | 3.0%).
Management, Business, Science and Arts Occupations by Sex
Within the Management, Business, Science and Arts occupations in Glenn County, the most male-oriented occupations are Architecture & Engineering (100.0%), Computers & Mathematics (84.1%), and Computers, Engineering & Science (84.1%), while the most female-oriented occupations are Health Diagnosing & Treating (90.0%), Education, Arts & Media (88.4%), and Education Instruction & Library (86.2%).
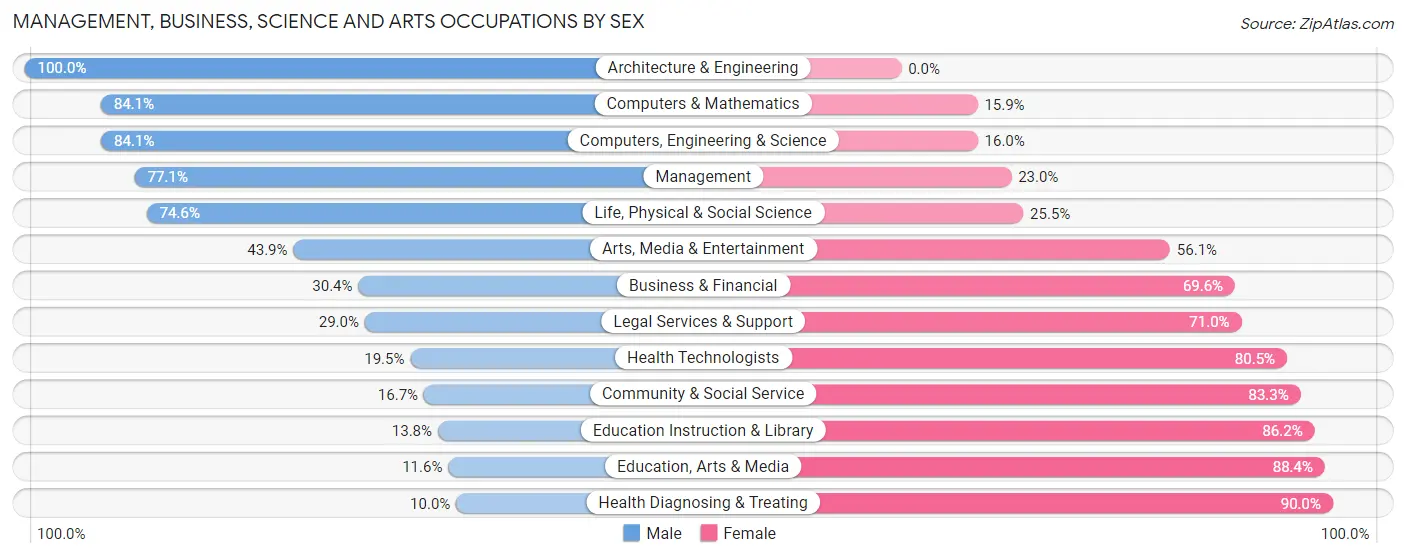
| Occupation | Male | Female |
| Management | 846 (77.0%) | 252 (23.0%) |
| Business & Financial | 79 (30.4%) | 181 (69.6%) |
| Computers, Engineering & Science | 332 (84.1%) | 63 (16.0%) |
| Computers & Mathematics | 185 (84.1%) | 35 (15.9%) |
| Architecture & Engineering | 65 (100.0%) | 0 (0.0%) |
| Life, Physical & Social Science | 82 (74.6%) | 28 (25.5%) |
| Community & Social Service | 147 (16.7%) | 733 (83.3%) |
| Education, Arts & Media | 20 (11.6%) | 152 (88.4%) |
| Legal Services & Support | 18 (29.0%) | 44 (71.0%) |
| Education Instruction & Library | 80 (13.8%) | 500 (86.2%) |
| Arts, Media & Entertainment | 29 (43.9%) | 37 (56.1%) |
| Health Diagnosing & Treating | 37 (10.0%) | 334 (90.0%) |
| Health Technologists | 34 (19.5%) | 140 (80.5%) |
| Total (Category) | 1,441 (48.0%) | 1,563 (52.0%) |
| Total (Overall) | 7,189 (57.5%) | 5,307 (42.5%) |
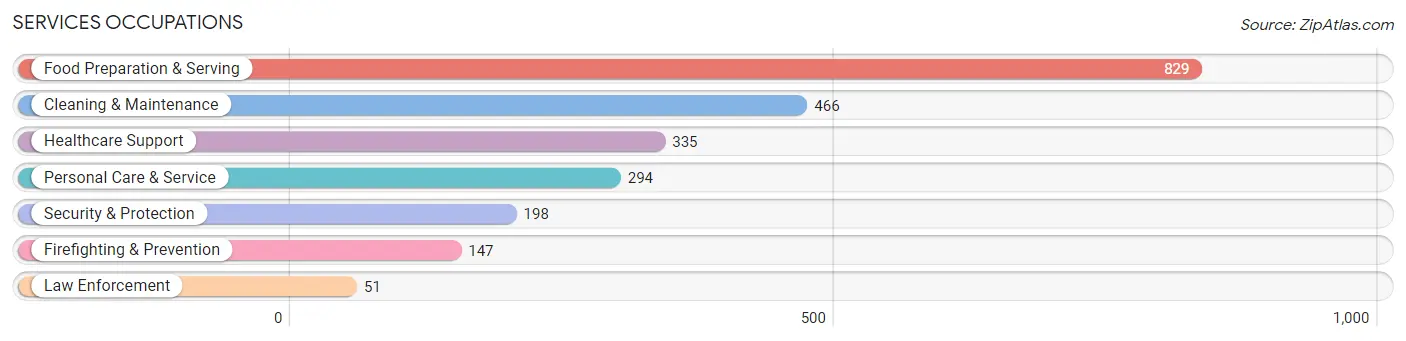
Services Occupations
The most common Services occupations in Glenn County are Food Preparation & Serving (829 | 6.6%), Cleaning & Maintenance (466 | 3.7%), Healthcare Support (335 | 2.7%), Personal Care & Service (294 | 2.4%), and Security & Protection (198 | 1.6%).
Services Occupations by Sex
Within the Services occupations in Glenn County, the most male-oriented occupations are Law Enforcement (100.0%), Security & Protection (87.4%), and Firefighting & Prevention (83.0%), while the most female-oriented occupations are Healthcare Support (100.0%), Personal Care & Service (85.7%), and Food Preparation & Serving (62.0%).
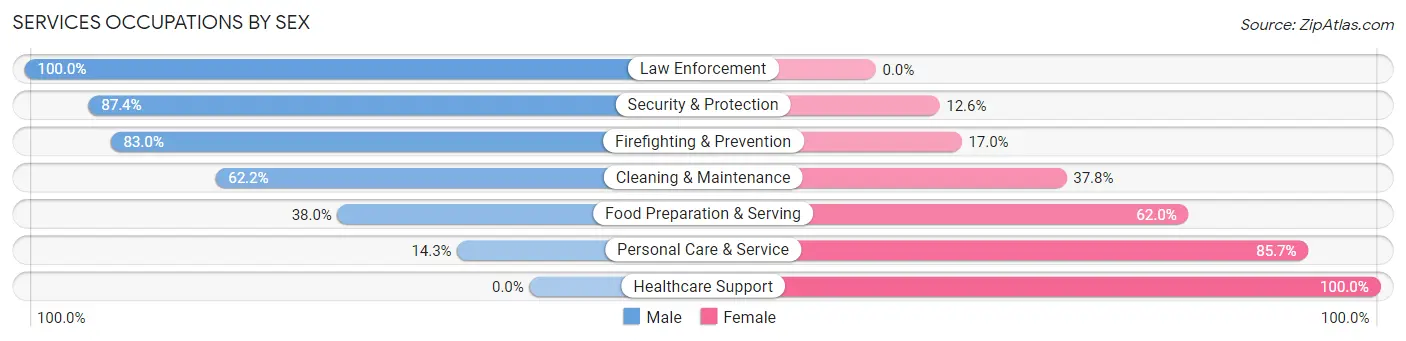
| Occupation | Male | Female |
| Healthcare Support | 0 (0.0%) | 335 (100.0%) |
| Security & Protection | 173 (87.4%) | 25 (12.6%) |
| Firefighting & Prevention | 122 (83.0%) | 25 (17.0%) |
| Law Enforcement | 51 (100.0%) | 0 (0.0%) |
| Food Preparation & Serving | 315 (38.0%) | 514 (62.0%) |
| Cleaning & Maintenance | 290 (62.2%) | 176 (37.8%) |
| Personal Care & Service | 42 (14.3%) | 252 (85.7%) |
| Total (Category) | 820 (38.6%) | 1,302 (61.4%) |
| Total (Overall) | 7,189 (57.5%) | 5,307 (42.5%) |
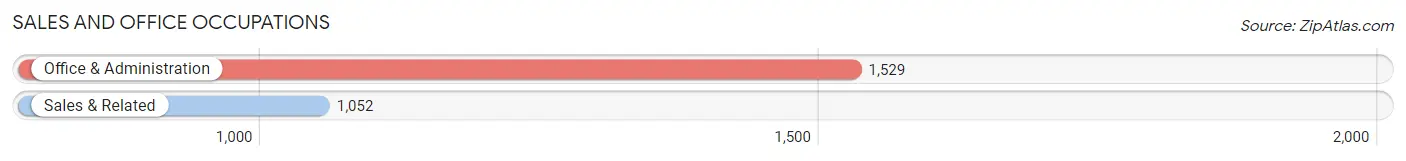
Sales and Office Occupations
The most common Sales and Office occupations in Glenn County are Office & Administration (1,529 | 12.2%), and Sales & Related (1,052 | 8.4%).
Sales and Office Occupations by Sex
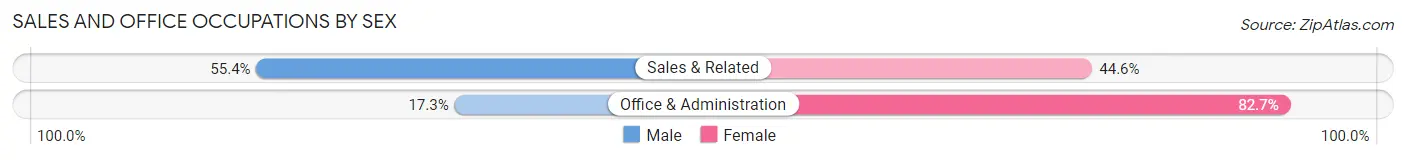
| Occupation | Male | Female |
| Sales & Related | 583 (55.4%) | 469 (44.6%) |
| Office & Administration | 265 (17.3%) | 1,264 (82.7%) |
| Total (Category) | 848 (32.9%) | 1,733 (67.1%) |
| Total (Overall) | 7,189 (57.5%) | 5,307 (42.5%) |
Natural Resources, Construction and Maintenance Occupations
The most common Natural Resources, Construction and Maintenance occupations in Glenn County are Farming, Fishing & Forestry (1,379 | 11.0%), Construction & Extraction (660 | 5.3%), and Installation, Maintenance & Repair (441 | 3.5%).
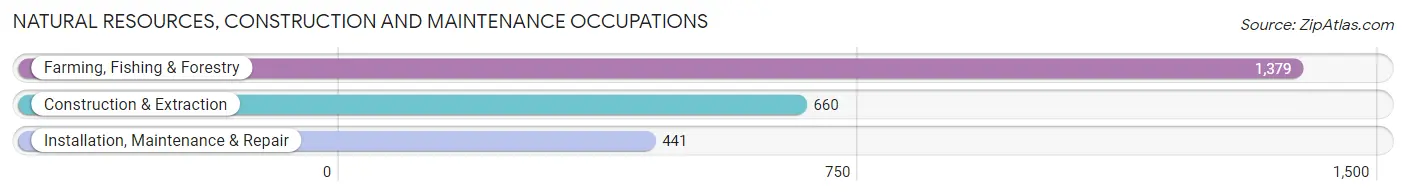
Natural Resources, Construction and Maintenance Occupations by Sex
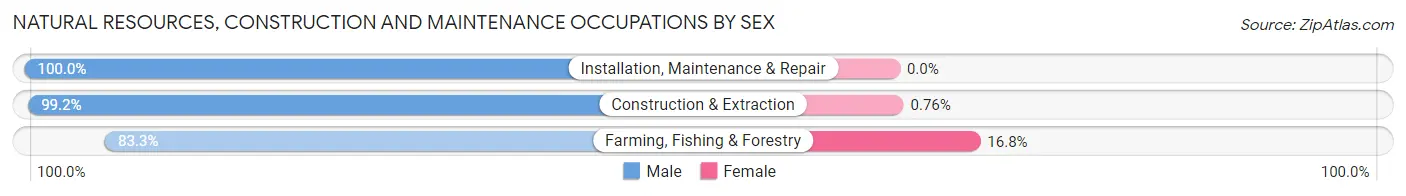
| Occupation | Male | Female |
| Farming, Fishing & Forestry | 1,148 (83.3%) | 231 (16.8%) |
| Construction & Extraction | 655 (99.2%) | 5 (0.8%) |
| Installation, Maintenance & Repair | 441 (100.0%) | 0 (0.0%) |
| Total (Category) | 2,244 (90.5%) | 236 (9.5%) |
| Total (Overall) | 7,189 (57.5%) | 5,307 (42.5%) |
Production, Transportation and Moving Occupations
The most common Production, Transportation and Moving occupations in Glenn County are Production (1,143 | 9.1%), Material Moving (743 | 5.9%), and Transportation (423 | 3.4%).
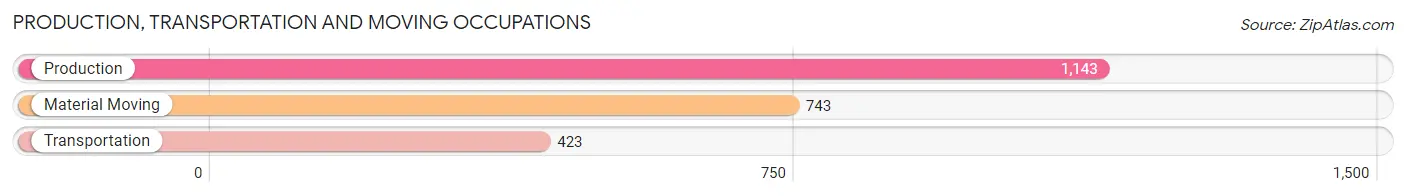
Production, Transportation and Moving Occupations by Sex
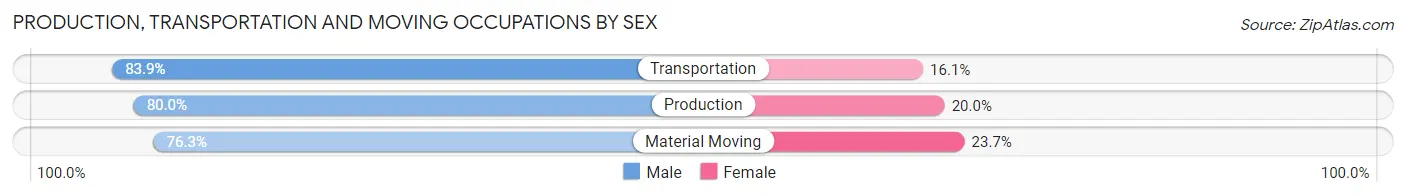
| Occupation | Male | Female |
| Production | 914 (80.0%) | 229 (20.0%) |
| Transportation | 355 (83.9%) | 68 (16.1%) |
| Material Moving | 567 (76.3%) | 176 (23.7%) |
| Total (Category) | 1,836 (79.5%) | 473 (20.5%) |
| Total (Overall) | 7,189 (57.5%) | 5,307 (42.5%) |
Employment Industries by Sex in Glenn County
Employment Industries in Glenn County
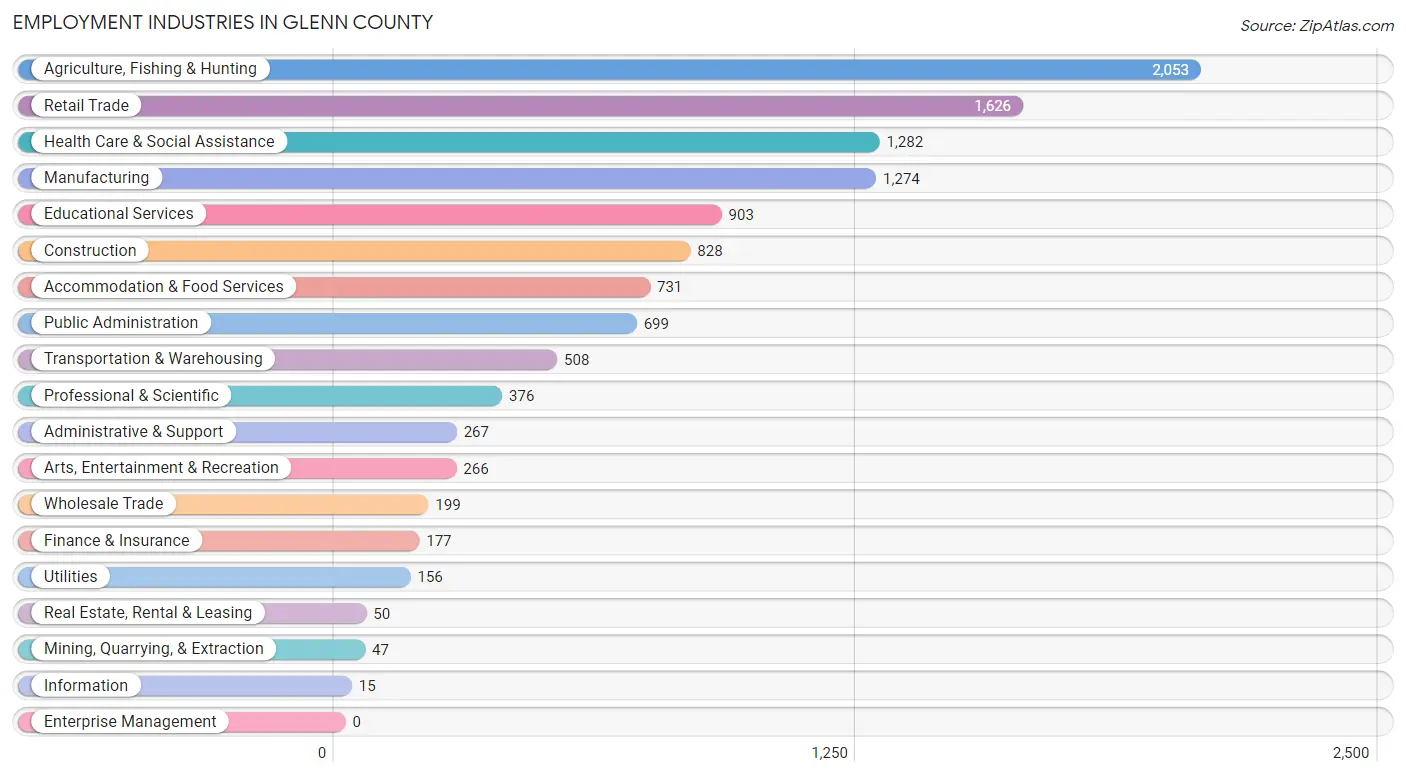
The major employment industries in Glenn County include Agriculture, Fishing & Hunting (2,053 | 16.4%), Retail Trade (1,626 | 13.0%), Health Care & Social Assistance (1,282 | 10.3%), Manufacturing (1,274 | 10.2%), and Educational Services (903 | 7.2%).
Employment Industries by Sex in Glenn County
The Glenn County industries that see more men than women are Mining, Quarrying, & Extraction (100.0%), Construction (91.4%), and Transportation & Warehousing (88.2%), whereas the industries that tend to have a higher number of women are Finance & Insurance (97.7%), Health Care & Social Assistance (87.9%), and Educational Services (71.5%).
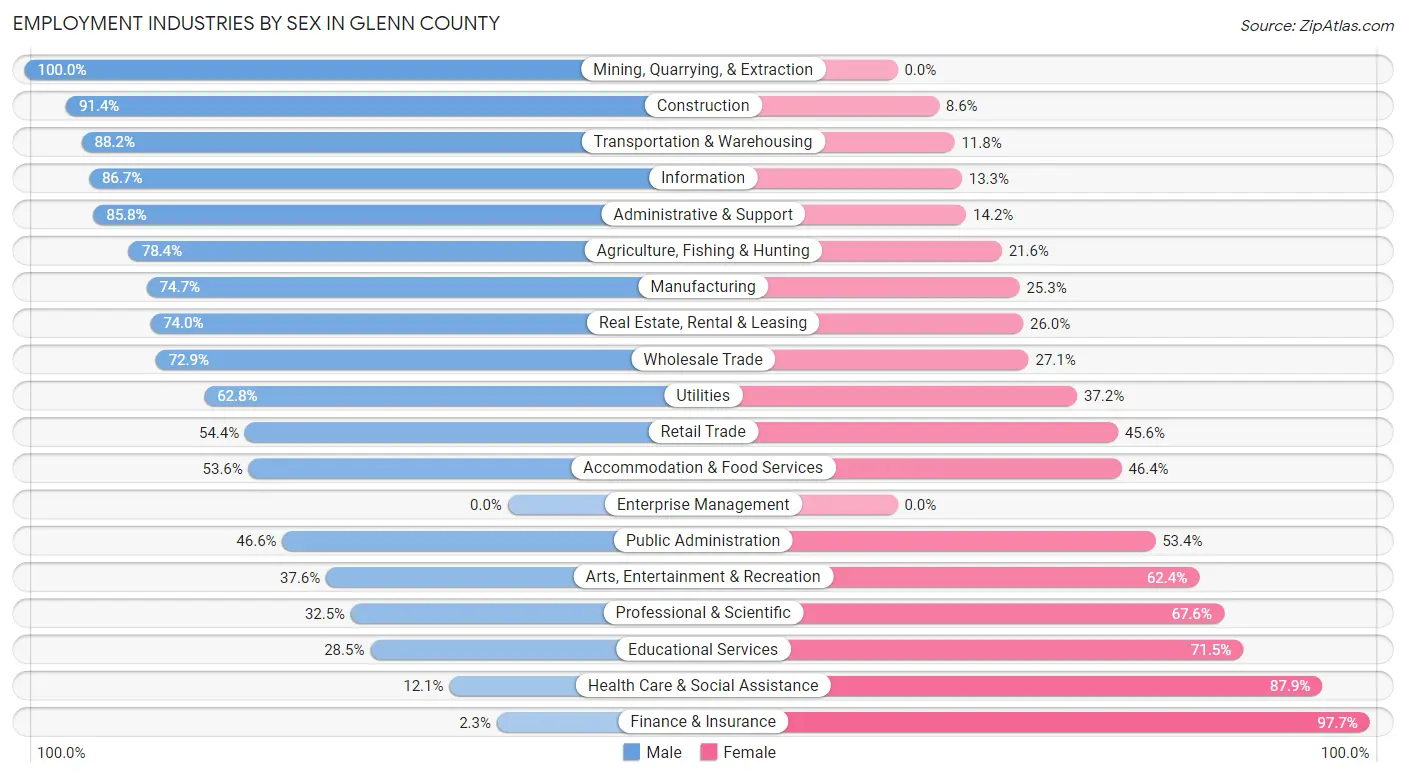
| Industry | Male | Female |
| Agriculture, Fishing & Hunting | 1,610 (78.4%) | 443 (21.6%) |
| Mining, Quarrying, & Extraction | 47 (100.0%) | 0 (0.0%) |
| Construction | 757 (91.4%) | 71 (8.6%) |
| Manufacturing | 952 (74.7%) | 322 (25.3%) |
| Wholesale Trade | 145 (72.9%) | 54 (27.1%) |
| Retail Trade | 884 (54.4%) | 742 (45.6%) |
| Transportation & Warehousing | 448 (88.2%) | 60 (11.8%) |
| Utilities | 98 (62.8%) | 58 (37.2%) |
| Information | 13 (86.7%) | 2 (13.3%) |
| Finance & Insurance | 4 (2.3%) | 173 (97.7%) |
| Real Estate, Rental & Leasing | 37 (74.0%) | 13 (26.0%) |
| Professional & Scientific | 122 (32.5%) | 254 (67.5%) |
| Enterprise Management | 0 (0.0%) | 0 (0.0%) |
| Administrative & Support | 229 (85.8%) | 38 (14.2%) |
| Educational Services | 257 (28.5%) | 646 (71.5%) |
| Health Care & Social Assistance | 155 (12.1%) | 1,127 (87.9%) |
| Arts, Entertainment & Recreation | 100 (37.6%) | 166 (62.4%) |
| Accommodation & Food Services | 392 (53.6%) | 339 (46.4%) |
| Public Administration | 326 (46.6%) | 373 (53.4%) |
| Total | 7,189 (57.5%) | 5,307 (42.5%) |
Education in Glenn County
School Enrollment in Glenn County
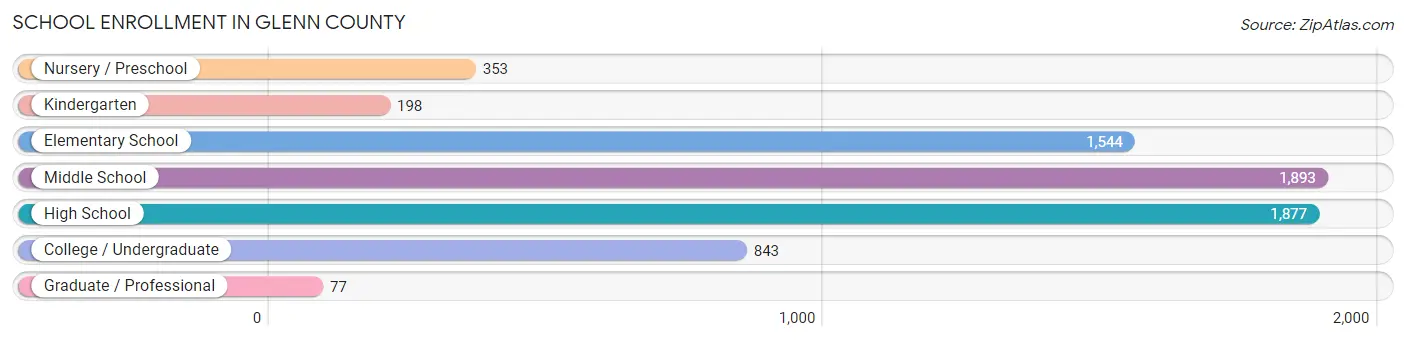
The most common levels of schooling among the 6,785 students in Glenn County are middle school (1,893 | 27.9%), high school (1,877 | 27.7%), and elementary school (1,544 | 22.8%).
| School Level | # Students | % Students |
| Nursery / Preschool | 353 | 5.2% |
| Kindergarten | 198 | 2.9% |
| Elementary School | 1,544 | 22.8% |
| Middle School | 1,893 | 27.9% |
| High School | 1,877 | 27.7% |
| College / Undergraduate | 843 | 12.4% |
| Graduate / Professional | 77 | 1.1% |
| Total | 6,785 | 100.0% |
School Enrollment by Age by Funding Source in Glenn County
Out of a total of 6,785 students who are enrolled in schools in Glenn County, 930 (13.7%) attend a private institution, while the remaining 5,855 (86.3%) are enrolled in public schools. The age group of 3 to 4 year olds has the highest likelihood of being enrolled in private schools, with 80 (41.2% in the age bracket) enrolled. Conversely, the age group of 25 to 34 year olds has the lowest likelihood of being enrolled in a private school, with 77 (100.0% in the age bracket) attending a public institution.
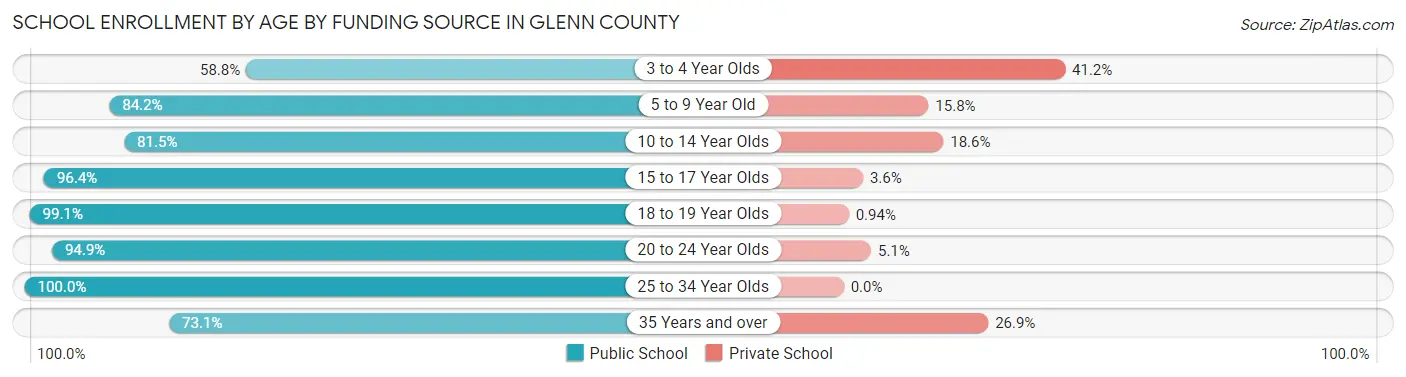
| Age Bracket | Public School | Private School |
| 3 to 4 Year Olds | 114 (58.8%) | 80 (41.2%) |
| 5 to 9 Year Old | 1,345 (84.2%) | 252 (15.8%) |
| 10 to 14 Year Olds | 2,007 (81.5%) | 457 (18.5%) |
| 15 to 17 Year Olds | 1,206 (96.4%) | 45 (3.6%) |
| 18 to 19 Year Olds | 525 (99.1%) | 5 (0.9%) |
| 20 to 24 Year Olds | 391 (94.9%) | 21 (5.1%) |
| 25 to 34 Year Olds | 77 (100.0%) | 0 (0.0%) |
| 35 Years and over | 190 (73.1%) | 70 (26.9%) |
| Total | 5,855 (86.3%) | 930 (13.7%) |
Educational Attainment by Field of Study in Glenn County
Bio, nature & agricultural (670 | 23.1%), business (502 | 17.3%), liberal arts & history (315 | 10.8%), education (297 | 10.2%), and science & technology (295 | 10.2%) are the most common fields of study among 2,903 individuals in Glenn County who have obtained a bachelor's degree or higher.
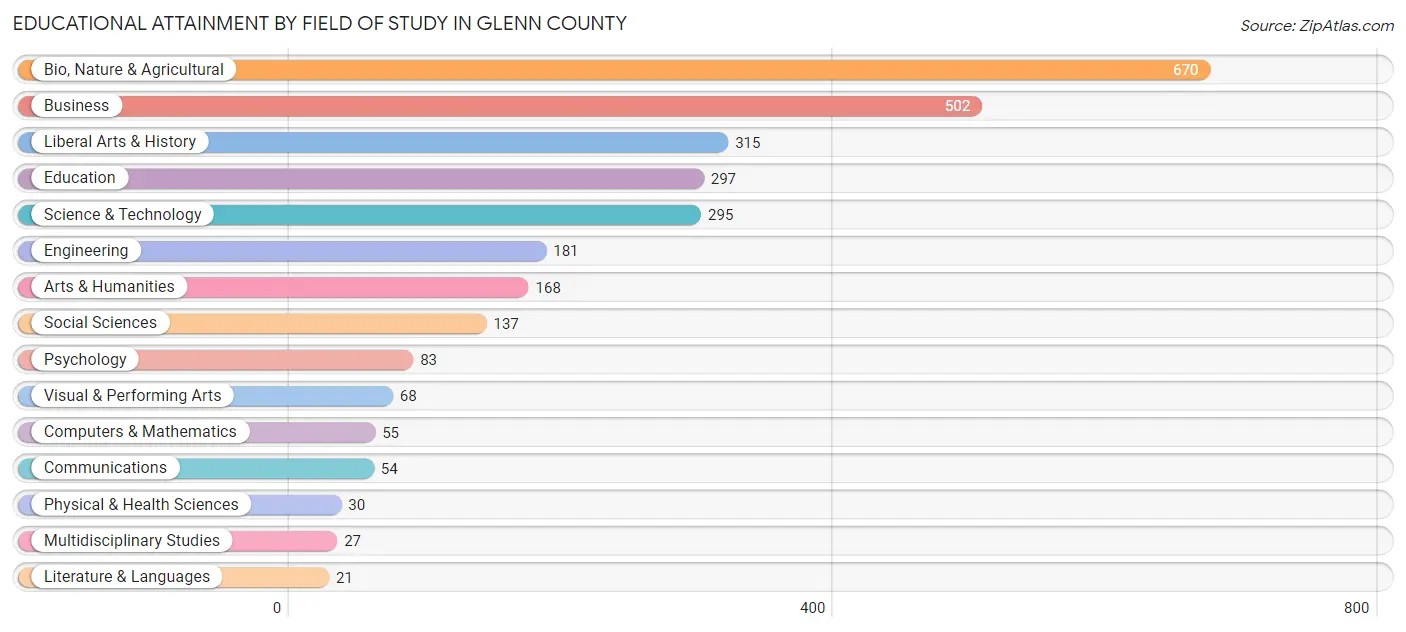
| Field of Study | # Graduates | % Graduates |
| Computers & Mathematics | 55 | 1.9% |
| Bio, Nature & Agricultural | 670 | 23.1% |
| Physical & Health Sciences | 30 | 1.0% |
| Psychology | 83 | 2.9% |
| Social Sciences | 137 | 4.7% |
| Engineering | 181 | 6.2% |
| Multidisciplinary Studies | 27 | 0.9% |
| Science & Technology | 295 | 10.2% |
| Business | 502 | 17.3% |
| Education | 297 | 10.2% |
| Literature & Languages | 21 | 0.7% |
| Liberal Arts & History | 315 | 10.8% |
| Visual & Performing Arts | 68 | 2.3% |
| Communications | 54 | 1.9% |
| Arts & Humanities | 168 | 5.8% |
| Total | 2,903 | 100.0% |
Transportation & Commute in Glenn County
Vehicle Availability by Sex in Glenn County
The most prevalent vehicle ownership categories in Glenn County are males with 2 vehicles (2,217, accounting for 31.8%) and females with 2 vehicles (1,728, making up 43.3%).
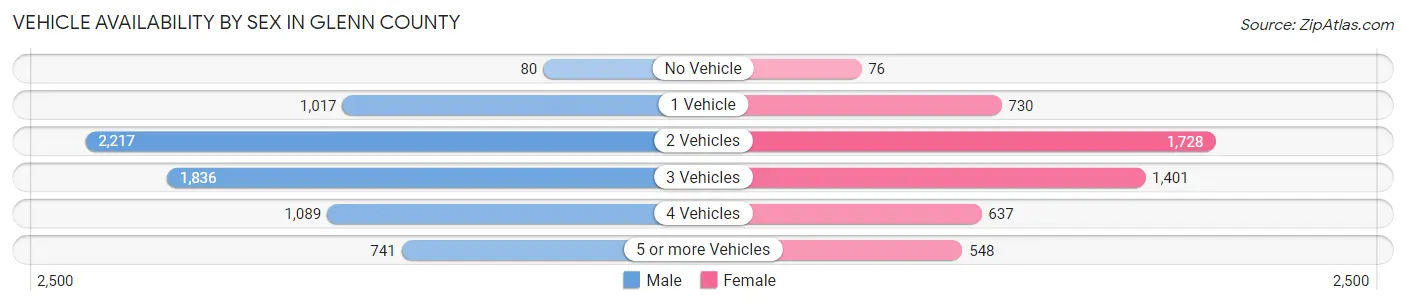
| Vehicles Available | Male | Female |
| No Vehicle | 80 (1.1%) | 76 (1.5%) |
| 1 Vehicle | 1,017 (14.6%) | 730 (14.3%) |
| 2 Vehicles | 2,217 (31.8%) | 1,728 (33.8%) |
| 3 Vehicles | 1,836 (26.3%) | 1,401 (27.4%) |
| 4 Vehicles | 1,089 (15.6%) | 637 (12.4%) |
| 5 or more Vehicles | 741 (10.6%) | 548 (10.7%) |
| Total | 6,980 (100.0%) | 5,120 (100.0%) |
Commute Time in Glenn County
The most frequently occuring commute durations in Glenn County are 5 to 9 minutes (1,878 commuters, 16.7%), 15 to 19 minutes (1,773 commuters, 15.8%), and 10 to 14 minutes (1,656 commuters, 14.7%).
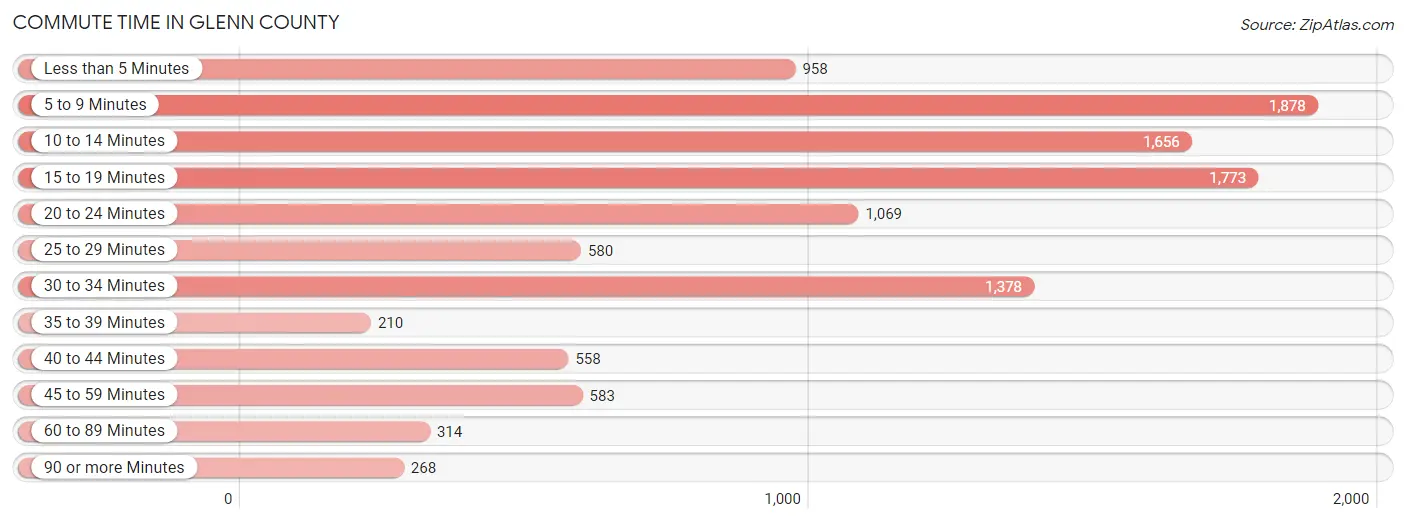
| Commute Time | # Commuters | % Commuters |
| Less than 5 Minutes | 958 | 8.5% |
| 5 to 9 Minutes | 1,878 | 16.7% |
| 10 to 14 Minutes | 1,656 | 14.7% |
| 15 to 19 Minutes | 1,773 | 15.8% |
| 20 to 24 Minutes | 1,069 | 9.5% |
| 25 to 29 Minutes | 580 | 5.2% |
| 30 to 34 Minutes | 1,378 | 12.3% |
| 35 to 39 Minutes | 210 | 1.9% |
| 40 to 44 Minutes | 558 | 5.0% |
| 45 to 59 Minutes | 583 | 5.2% |
| 60 to 89 Minutes | 314 | 2.8% |
| 90 or more Minutes | 268 | 2.4% |
Commute Time by Sex in Glenn County
The most common commute times in Glenn County are 10 to 14 minutes (1,137 commuters, 17.4%) for males and 5 to 9 minutes (818 commuters, 17.4%) for females.
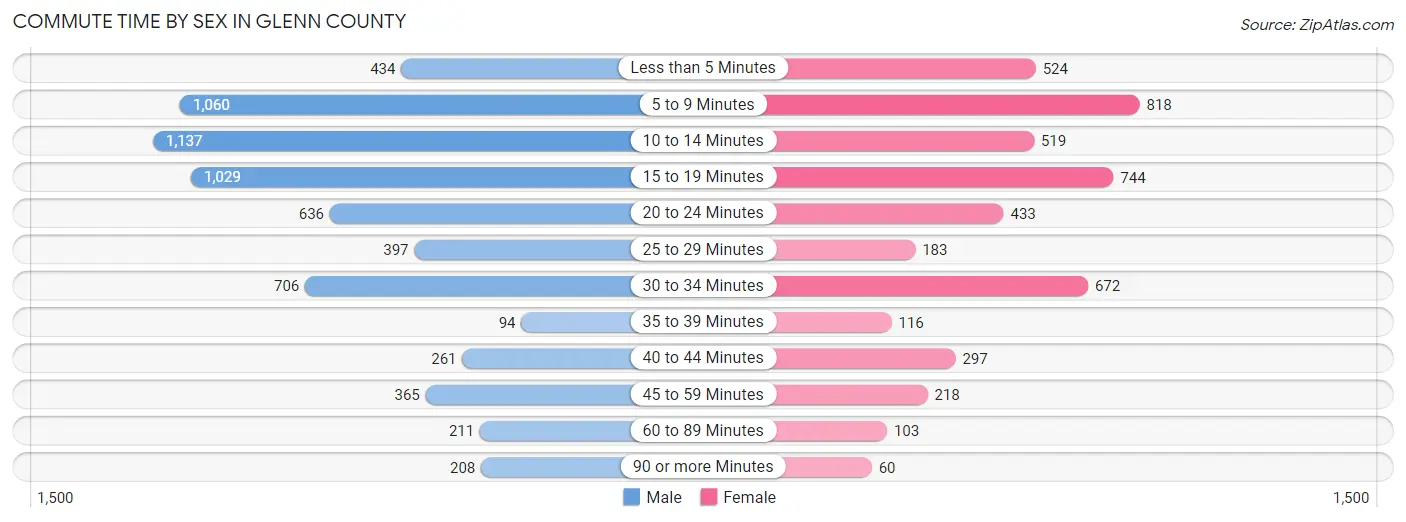
| Commute Time | Male | Female |
| Less than 5 Minutes | 434 (6.6%) | 524 (11.2%) |
| 5 to 9 Minutes | 1,060 (16.2%) | 818 (17.4%) |
| 10 to 14 Minutes | 1,137 (17.4%) | 519 (11.1%) |
| 15 to 19 Minutes | 1,029 (15.7%) | 744 (15.9%) |
| 20 to 24 Minutes | 636 (9.7%) | 433 (9.2%) |
| 25 to 29 Minutes | 397 (6.1%) | 183 (3.9%) |
| 30 to 34 Minutes | 706 (10.8%) | 672 (14.3%) |
| 35 to 39 Minutes | 94 (1.4%) | 116 (2.5%) |
| 40 to 44 Minutes | 261 (4.0%) | 297 (6.3%) |
| 45 to 59 Minutes | 365 (5.6%) | 218 (4.6%) |
| 60 to 89 Minutes | 211 (3.2%) | 103 (2.2%) |
| 90 or more Minutes | 208 (3.2%) | 60 (1.3%) |
Time of Departure to Work by Sex in Glenn County
The most frequent times of departure to work in Glenn County are 7:00 AM to 7:29 AM (1,137, 17.4%) for males and 7:30 AM to 7:59 AM (1,006, 21.5%) for females.
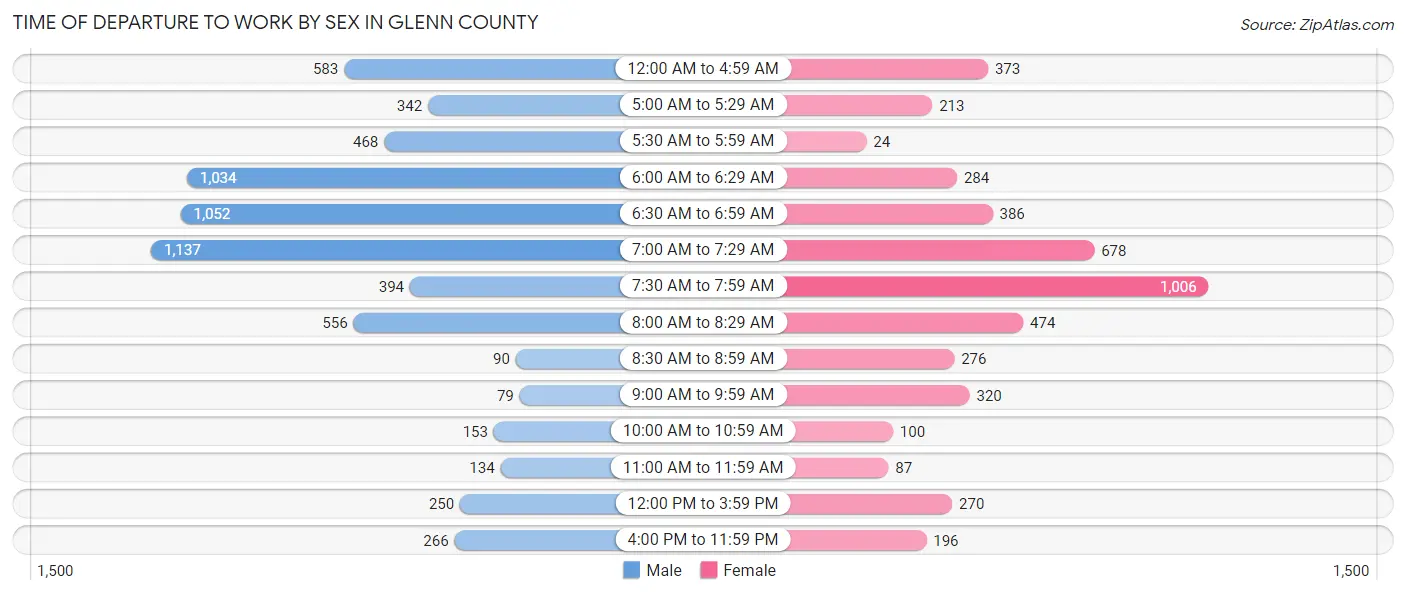
| Time of Departure | Male | Female |
| 12:00 AM to 4:59 AM | 583 (8.9%) | 373 (8.0%) |
| 5:00 AM to 5:29 AM | 342 (5.2%) | 213 (4.5%) |
| 5:30 AM to 5:59 AM | 468 (7.2%) | 24 (0.5%) |
| 6:00 AM to 6:29 AM | 1,034 (15.8%) | 284 (6.1%) |
| 6:30 AM to 6:59 AM | 1,052 (16.1%) | 386 (8.2%) |
| 7:00 AM to 7:29 AM | 1,137 (17.4%) | 678 (14.5%) |
| 7:30 AM to 7:59 AM | 394 (6.0%) | 1,006 (21.5%) |
| 8:00 AM to 8:29 AM | 556 (8.5%) | 474 (10.1%) |
| 8:30 AM to 8:59 AM | 90 (1.4%) | 276 (5.9%) |
| 9:00 AM to 9:59 AM | 79 (1.2%) | 320 (6.8%) |
| 10:00 AM to 10:59 AM | 153 (2.3%) | 100 (2.1%) |
| 11:00 AM to 11:59 AM | 134 (2.1%) | 87 (1.9%) |
| 12:00 PM to 3:59 PM | 250 (3.8%) | 270 (5.8%) |
| 4:00 PM to 11:59 PM | 266 (4.1%) | 196 (4.2%) |
| Total | 6,538 (100.0%) | 4,687 (100.0%) |
Housing Occupancy in Glenn County
Occupancy by Ownership in Glenn County
Of the total 9,742 dwellings in Glenn County, owner-occupied units account for 5,906 (60.6%), while renter-occupied units make up 3,836 (39.4%).
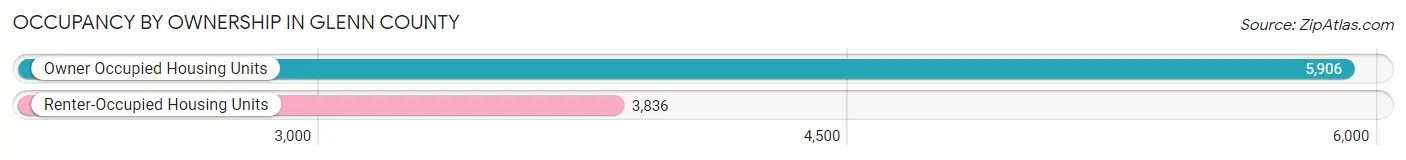
| Occupancy | # Housing Units | % Housing Units |
| Owner Occupied Housing Units | 5,906 | 60.6% |
| Renter-Occupied Housing Units | 3,836 | 39.4% |
| Total Occupied Housing Units | 9,742 | 100.0% |
Occupancy by Household Size in Glenn County
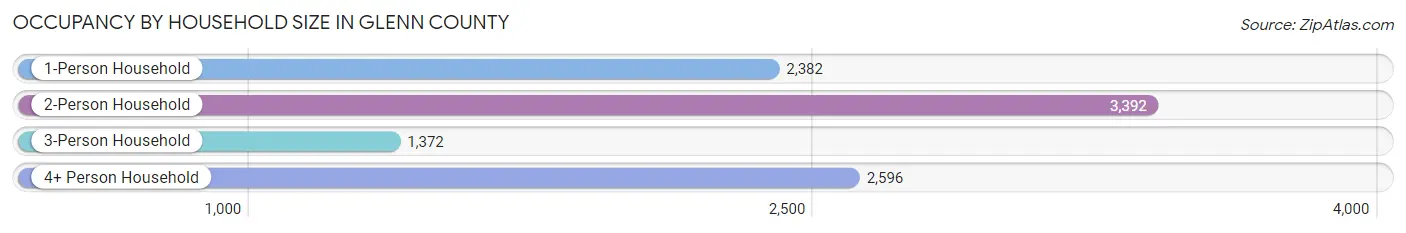
| Household Size | # Housing Units | % Housing Units |
| 1-Person Household | 2,382 | 24.4% |
| 2-Person Household | 3,392 | 34.8% |
| 3-Person Household | 1,372 | 14.1% |
| 4+ Person Household | 2,596 | 26.7% |
| Total Housing Units | 9,742 | 100.0% |
Occupancy by Ownership by Household Size in Glenn County
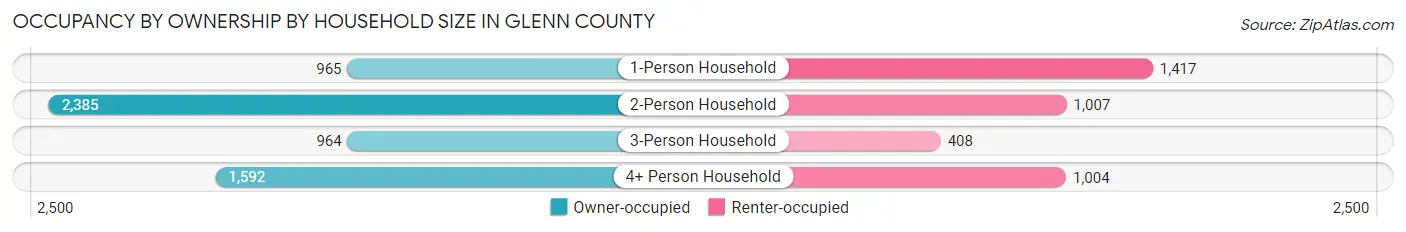
| Household Size | Owner-occupied | Renter-occupied |
| 1-Person Household | 965 (40.5%) | 1,417 (59.5%) |
| 2-Person Household | 2,385 (70.3%) | 1,007 (29.7%) |
| 3-Person Household | 964 (70.3%) | 408 (29.7%) |
| 4+ Person Household | 1,592 (61.3%) | 1,004 (38.7%) |
| Total Housing Units | 5,906 (60.6%) | 3,836 (39.4%) |
Occupancy by Educational Attainment in Glenn County
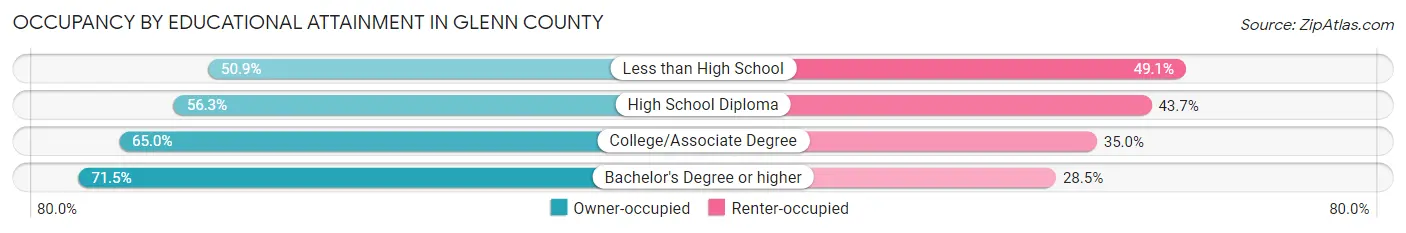
| Household Size | Owner-occupied | Renter-occupied |
| Less than High School | 891 (50.9%) | 860 (49.1%) |
| High School Diploma | 1,807 (56.3%) | 1,401 (43.7%) |
| College/Associate Degree | 2,120 (65.0%) | 1,141 (35.0%) |
| Bachelor's Degree or higher | 1,088 (71.5%) | 434 (28.5%) |
Occupancy by Age of Householder in Glenn County
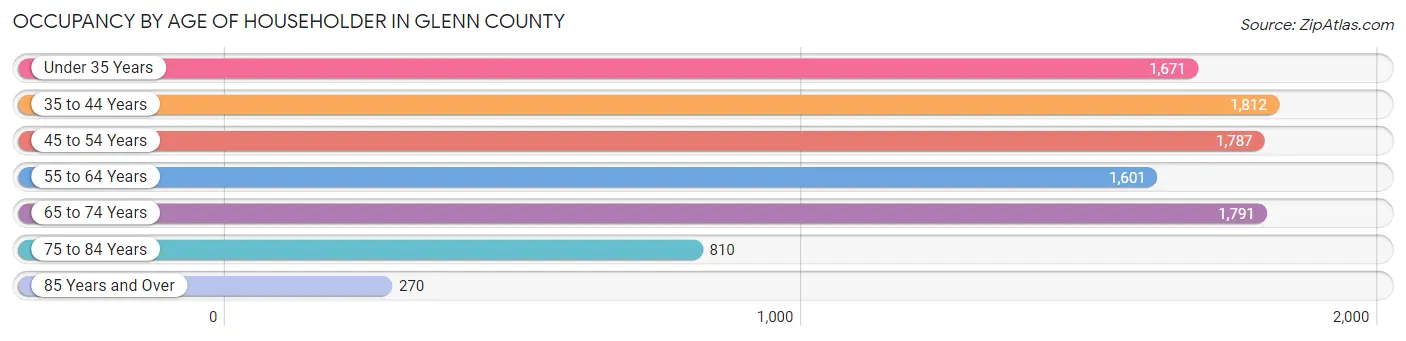
| Age Bracket | # Households | % Households |
| Under 35 Years | 1,671 | 17.2% |
| 35 to 44 Years | 1,812 | 18.6% |
| 45 to 54 Years | 1,787 | 18.3% |
| 55 to 64 Years | 1,601 | 16.4% |
| 65 to 74 Years | 1,791 | 18.4% |
| 75 to 84 Years | 810 | 8.3% |
| 85 Years and Over | 270 | 2.8% |
| Total | 9,742 | 100.0% |
Housing Finances in Glenn County
Median Income by Occupancy in Glenn County
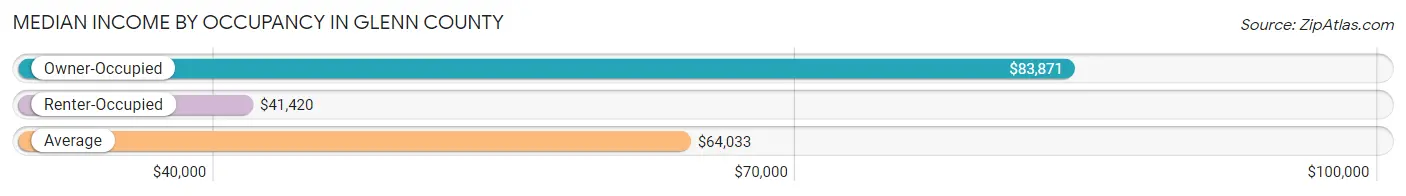
| Occupancy Type | # Households | Median Income |
| Owner-Occupied | 5,906 (60.6%) | $83,871 |
| Renter-Occupied | 3,836 (39.4%) | $41,420 |
| Average | 9,742 (100.0%) | $64,033 |
Occupancy by Householder Income Bracket in Glenn County
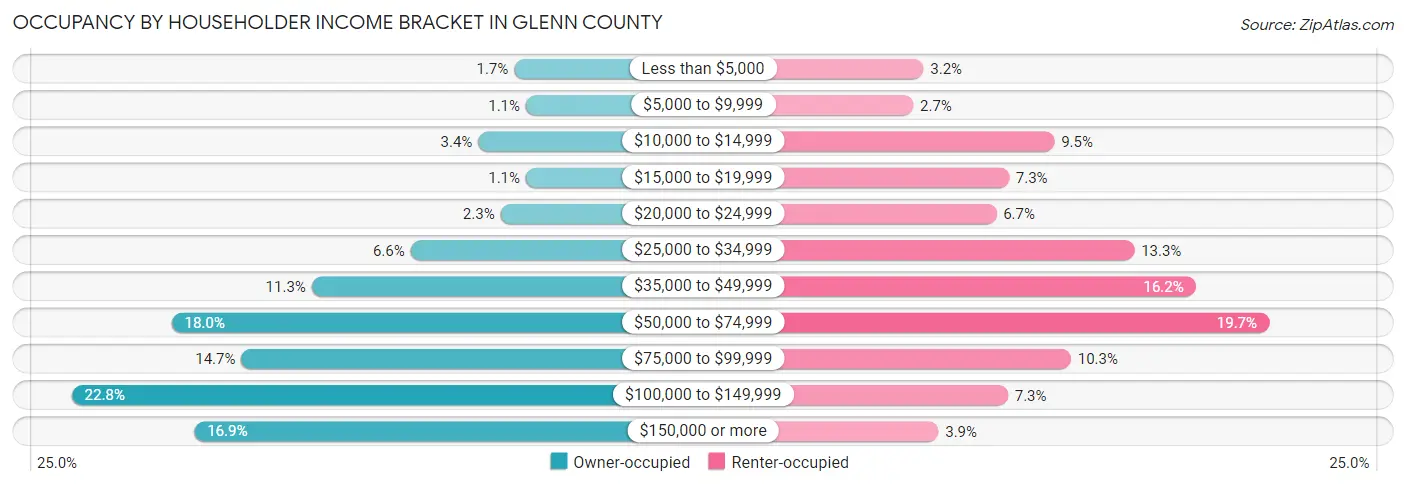
| Income Bracket | Owner-occupied | Renter-occupied |
| Less than $5,000 | 100 (1.7%) | 124 (3.2%) |
| $5,000 to $9,999 | 67 (1.1%) | 105 (2.7%) |
| $10,000 to $14,999 | 201 (3.4%) | 363 (9.5%) |
| $15,000 to $19,999 | 67 (1.1%) | 280 (7.3%) |
| $20,000 to $24,999 | 138 (2.3%) | 257 (6.7%) |
| $25,000 to $34,999 | 391 (6.6%) | 509 (13.3%) |
| $35,000 to $49,999 | 669 (11.3%) | 621 (16.2%) |
| $50,000 to $74,999 | 1,063 (18.0%) | 755 (19.7%) |
| $75,000 to $99,999 | 867 (14.7%) | 393 (10.2%) |
| $100,000 to $149,999 | 1,344 (22.8%) | 278 (7.2%) |
| $150,000 or more | 999 (16.9%) | 151 (3.9%) |
| Total | 5,906 (100.0%) | 3,836 (100.0%) |
Monthly Housing Cost Tiers in Glenn County
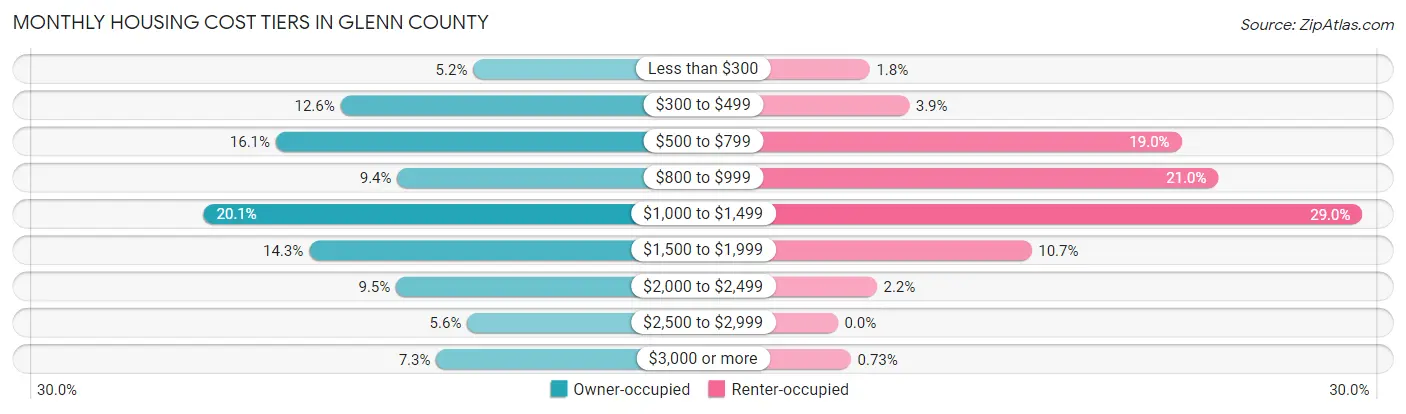
| Monthly Cost | Owner-occupied | Renter-occupied |
| Less than $300 | 308 (5.2%) | 68 (1.8%) |
| $300 to $499 | 741 (12.6%) | 151 (3.9%) |
| $500 to $799 | 952 (16.1%) | 729 (19.0%) |
| $800 to $999 | 556 (9.4%) | 807 (21.0%) |
| $1,000 to $1,499 | 1,188 (20.1%) | 1,112 (29.0%) |
| $1,500 to $1,999 | 844 (14.3%) | 411 (10.7%) |
| $2,000 to $2,499 | 560 (9.5%) | 83 (2.2%) |
| $2,500 to $2,999 | 328 (5.6%) | 0 (0.0%) |
| $3,000 or more | 429 (7.3%) | 28 (0.7%) |
| Total | 5,906 (100.0%) | 3,836 (100.0%) |
Physical Housing Characteristics in Glenn County
Housing Structures in Glenn County
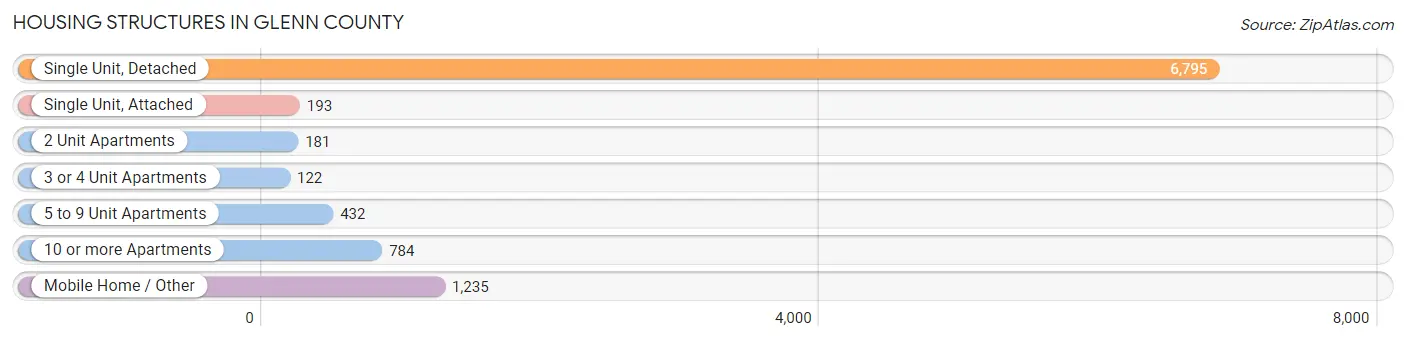
| Structure Type | # Housing Units | % Housing Units |
| Single Unit, Detached | 6,795 | 69.8% |
| Single Unit, Attached | 193 | 2.0% |
| 2 Unit Apartments | 181 | 1.9% |
| 3 or 4 Unit Apartments | 122 | 1.3% |
| 5 to 9 Unit Apartments | 432 | 4.4% |
| 10 or more Apartments | 784 | 8.1% |
| Mobile Home / Other | 1,235 | 12.7% |
| Total | 9,742 | 100.0% |
Housing Structures by Occupancy in Glenn County
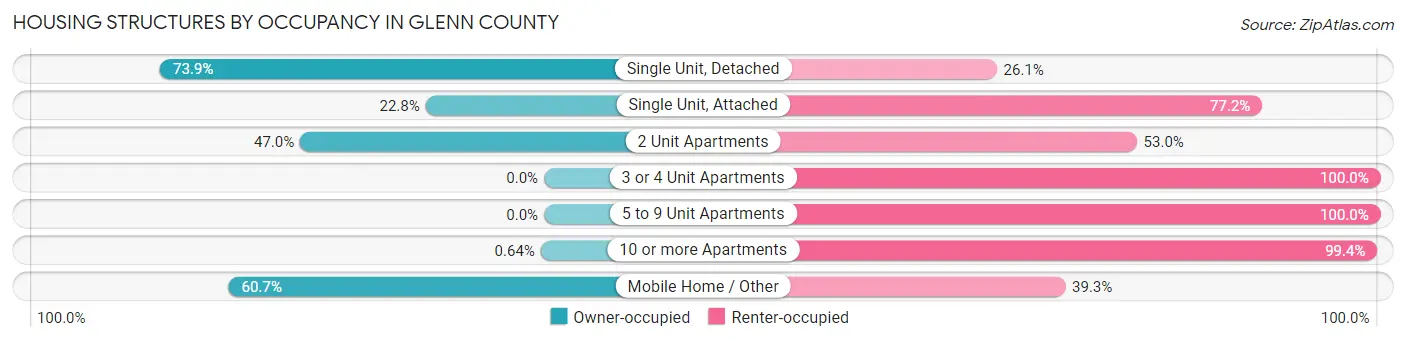
| Structure Type | Owner-occupied | Renter-occupied |
| Single Unit, Detached | 5,022 (73.9%) | 1,773 (26.1%) |
| Single Unit, Attached | 44 (22.8%) | 149 (77.2%) |
| 2 Unit Apartments | 85 (47.0%) | 96 (53.0%) |
| 3 or 4 Unit Apartments | 0 (0.0%) | 122 (100.0%) |
| 5 to 9 Unit Apartments | 0 (0.0%) | 432 (100.0%) |
| 10 or more Apartments | 5 (0.6%) | 779 (99.4%) |
| Mobile Home / Other | 750 (60.7%) | 485 (39.3%) |
| Total | 5,906 (60.6%) | 3,836 (39.4%) |
Housing Structures by Number of Rooms in Glenn County
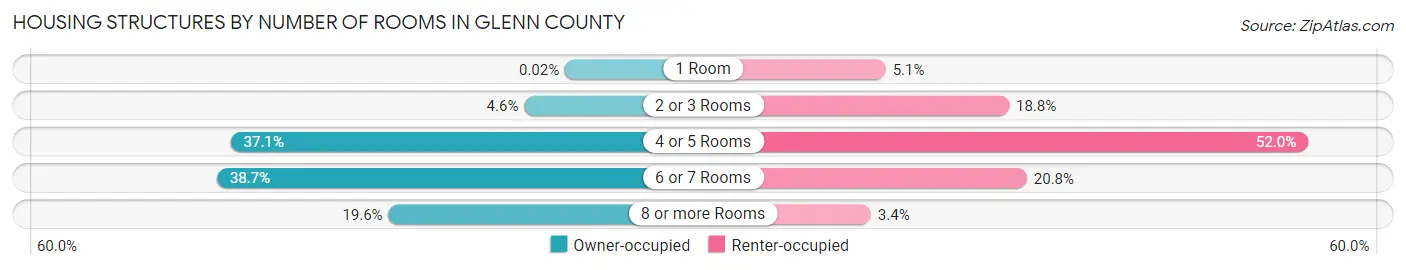
| Number of Rooms | Owner-occupied | Renter-occupied |
| 1 Room | 1 (0.0%) | 195 (5.1%) |
| 2 or 3 Rooms | 269 (4.5%) | 720 (18.8%) |
| 4 or 5 Rooms | 2,193 (37.1%) | 1,993 (52.0%) |
| 6 or 7 Rooms | 2,284 (38.7%) | 796 (20.7%) |
| 8 or more Rooms | 1,159 (19.6%) | 132 (3.4%) |
| Total | 5,906 (100.0%) | 3,836 (100.0%) |
Housing Structure by Heating Type in Glenn County
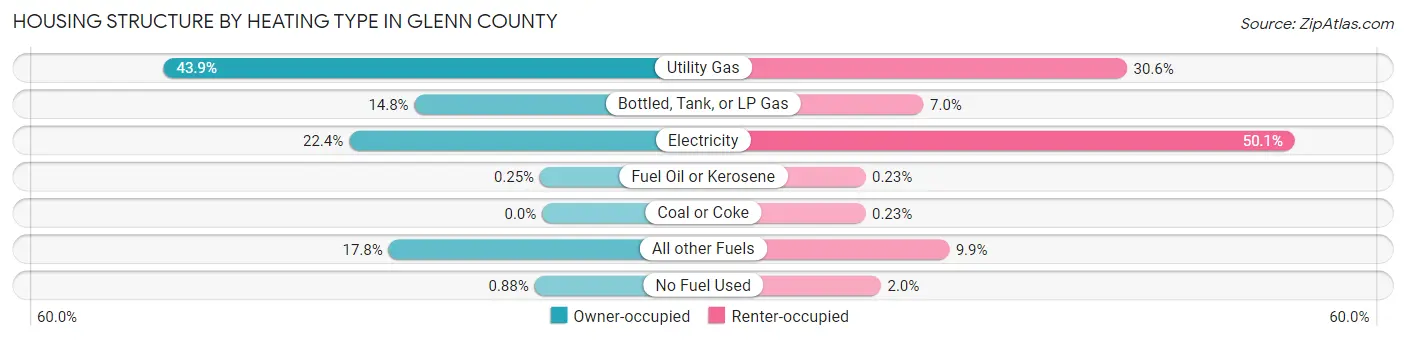
| Heating Type | Owner-occupied | Renter-occupied |
| Utility Gas | 2,592 (43.9%) | 1,172 (30.5%) |
| Bottled, Tank, or LP Gas | 874 (14.8%) | 267 (7.0%) |
| Electricity | 1,322 (22.4%) | 1,920 (50.0%) |
| Fuel Oil or Kerosene | 15 (0.3%) | 9 (0.2%) |
| Coal or Coke | 0 (0.0%) | 9 (0.2%) |
| All other Fuels | 1,051 (17.8%) | 381 (9.9%) |
| No Fuel Used | 52 (0.9%) | 78 (2.0%) |
| Total | 5,906 (100.0%) | 3,836 (100.0%) |
Household Vehicle Usage in Glenn County
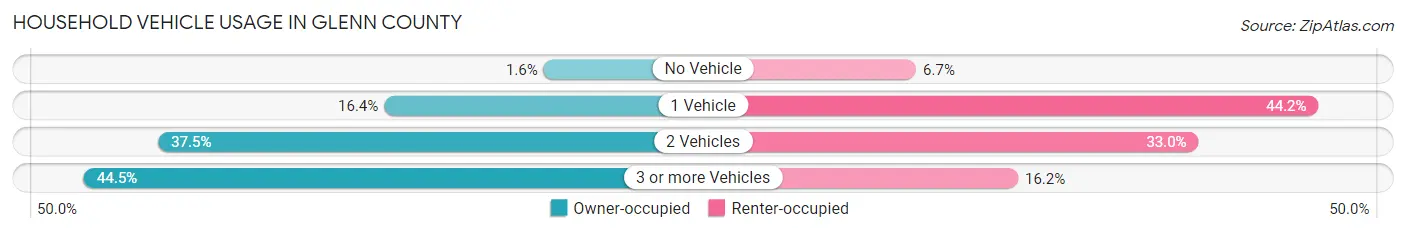
| Vehicles per Household | Owner-occupied | Renter-occupied |
| No Vehicle | 92 (1.6%) | 255 (6.7%) |
| 1 Vehicle | 971 (16.4%) | 1,695 (44.2%) |
| 2 Vehicles | 2,217 (37.5%) | 1,266 (33.0%) |
| 3 or more Vehicles | 2,626 (44.5%) | 620 (16.2%) |
| Total | 5,906 (100.0%) | 3,836 (100.0%) |
Real Estate & Mortgages in Glenn County
Real Estate and Mortgage Overview in Glenn County
| Characteristic | Without Mortgage | With Mortgage |
| Housing Units | 2,441 | 3,465 |
| Median Property Value | $263,900 | $334,900 |
| Median Household Income | $77,896 | $637 |
| Monthly Housing Costs | $548 | $338 |
| Real Estate Taxes | $1,757 | $67 |
Property Value by Mortgage Status in Glenn County
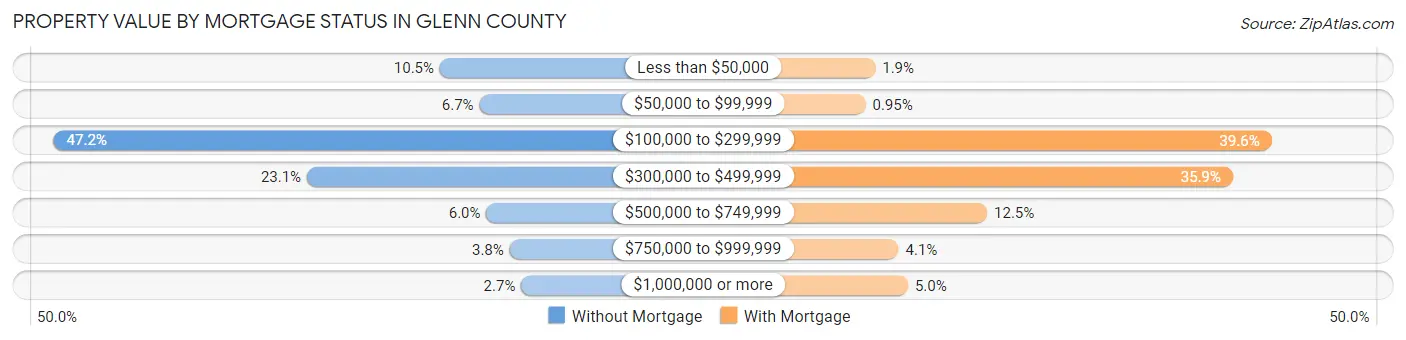
| Property Value | Without Mortgage | With Mortgage |
| Less than $50,000 | 255 (10.4%) | 65 (1.9%) |
| $50,000 to $99,999 | 163 (6.7%) | 33 (0.9%) |
| $100,000 to $299,999 | 1,153 (47.2%) | 1,373 (39.6%) |
| $300,000 to $499,999 | 564 (23.1%) | 1,245 (35.9%) |
| $500,000 to $749,999 | 147 (6.0%) | 434 (12.5%) |
| $750,000 to $999,999 | 93 (3.8%) | 142 (4.1%) |
| $1,000,000 or more | 66 (2.7%) | 173 (5.0%) |
| Total | 2,441 (100.0%) | 3,465 (100.0%) |
Household Income by Mortgage Status in Glenn County
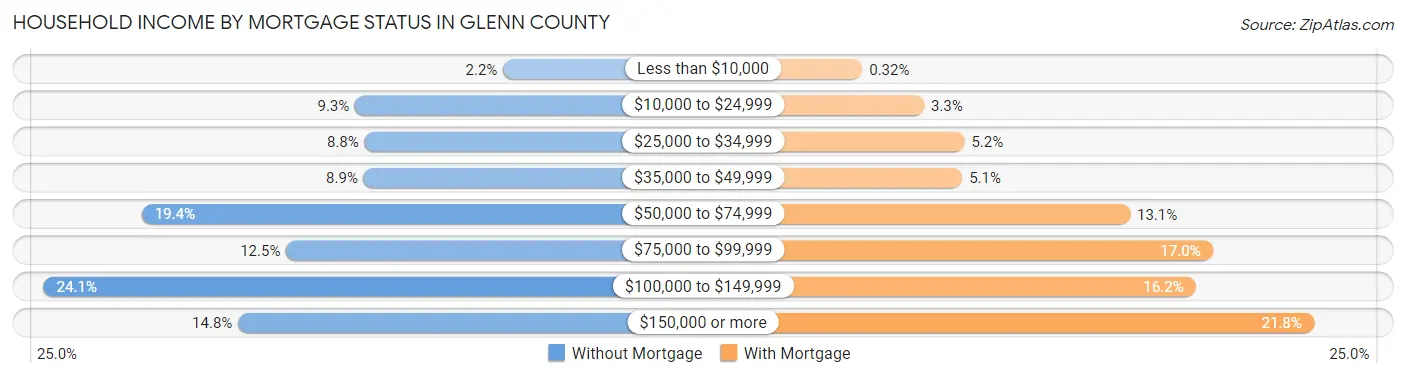
| Household Income | Without Mortgage | With Mortgage |
| Less than $10,000 | 54 (2.2%) | 11 (0.3%) |
| $10,000 to $24,999 | 226 (9.3%) | 113 (3.3%) |
| $25,000 to $34,999 | 215 (8.8%) | 180 (5.2%) |
| $35,000 to $49,999 | 216 (8.8%) | 176 (5.1%) |
| $50,000 to $74,999 | 474 (19.4%) | 453 (13.1%) |
| $75,000 to $99,999 | 306 (12.5%) | 589 (17.0%) |
| $100,000 to $149,999 | 588 (24.1%) | 561 (16.2%) |
| $150,000 or more | 362 (14.8%) | 756 (21.8%) |
| Total | 2,441 (100.0%) | 3,465 (100.0%) |
Property Value to Household Income Ratio in Glenn County
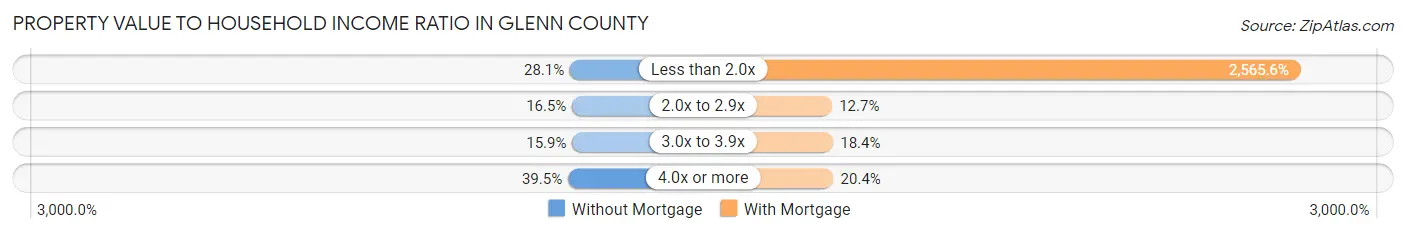
| Value-to-Income Ratio | Without Mortgage | With Mortgage |
| Less than 2.0x | 685 (28.1%) | 88,899 (2,565.6%) |
| 2.0x to 2.9x | 403 (16.5%) | 439 (12.7%) |
| 3.0x to 3.9x | 389 (15.9%) | 636 (18.3%) |
| 4.0x or more | 964 (39.5%) | 707 (20.4%) |
| Total | 2,441 (100.0%) | 3,465 (100.0%) |
Real Estate Taxes by Mortgage Status in Glenn County
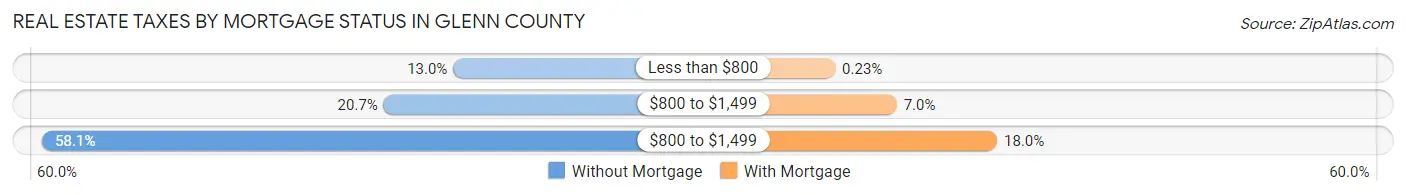
| Property Taxes | Without Mortgage | With Mortgage |
| Less than $800 | 318 (13.0%) | 8 (0.2%) |
| $800 to $1,499 | 504 (20.6%) | 242 (7.0%) |
| $800 to $1,499 | 1,418 (58.1%) | 623 (18.0%) |
| Total | 2,441 (100.0%) | 3,465 (100.0%) |
Health & Disability in Glenn County
Health Insurance Coverage by Age in Glenn County
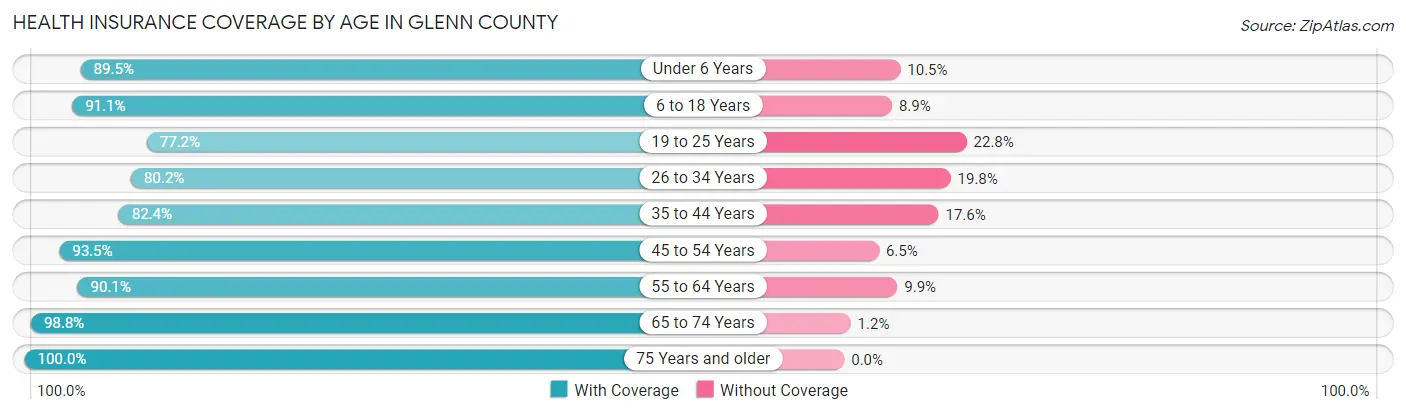
| Age Bracket | With Coverage | Without Coverage |
| Under 6 Years | 2,132 (89.5%) | 249 (10.5%) |
| 6 to 18 Years | 5,322 (91.1%) | 519 (8.9%) |
| 19 to 25 Years | 1,743 (77.2%) | 515 (22.8%) |
| 26 to 34 Years | 2,709 (80.2%) | 670 (19.8%) |
| 35 to 44 Years | 2,730 (82.4%) | 582 (17.6%) |
| 45 to 54 Years | 2,934 (93.5%) | 203 (6.5%) |
| 55 to 64 Years | 3,024 (90.1%) | 332 (9.9%) |
| 65 to 74 Years | 2,828 (98.8%) | 34 (1.2%) |
| 75 Years and older | 1,908 (100.0%) | 0 (0.0%) |
| Total | 25,330 (89.1%) | 3,104 (10.9%) |
Health Insurance Coverage by Citizenship Status in Glenn County
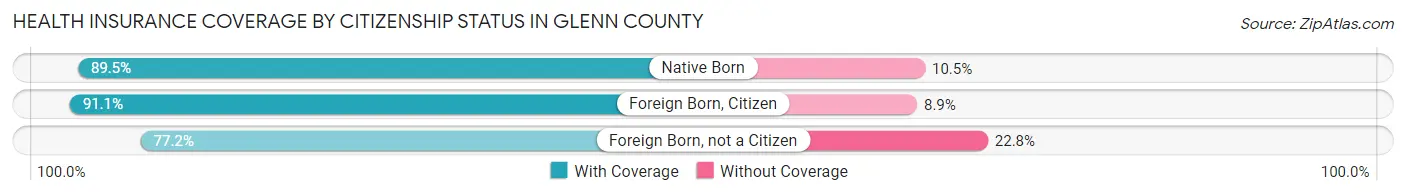
| Citizenship Status | With Coverage | Without Coverage |
| Native Born | 2,132 (89.5%) | 249 (10.5%) |
| Foreign Born, Citizen | 5,322 (91.1%) | 519 (8.9%) |
| Foreign Born, not a Citizen | 1,743 (77.2%) | 515 (22.8%) |
Health Insurance Coverage by Household Income in Glenn County
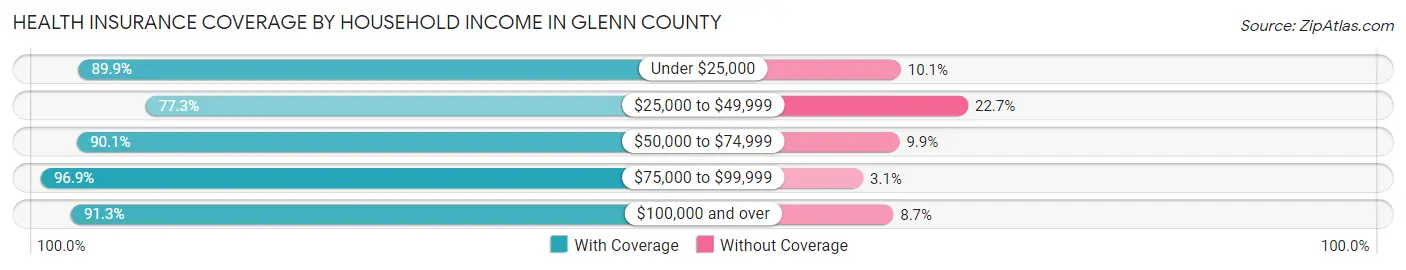
| Household Income | With Coverage | Without Coverage |
| Under $25,000 | 3,630 (89.9%) | 409 (10.1%) |
| $25,000 to $49,999 | 4,093 (77.3%) | 1,203 (22.7%) |
| $50,000 to $74,999 | 4,775 (90.1%) | 523 (9.9%) |
| $75,000 to $99,999 | 4,102 (96.9%) | 130 (3.1%) |
| $100,000 and over | 8,694 (91.3%) | 830 (8.7%) |
Public vs Private Health Insurance Coverage by Age in Glenn County
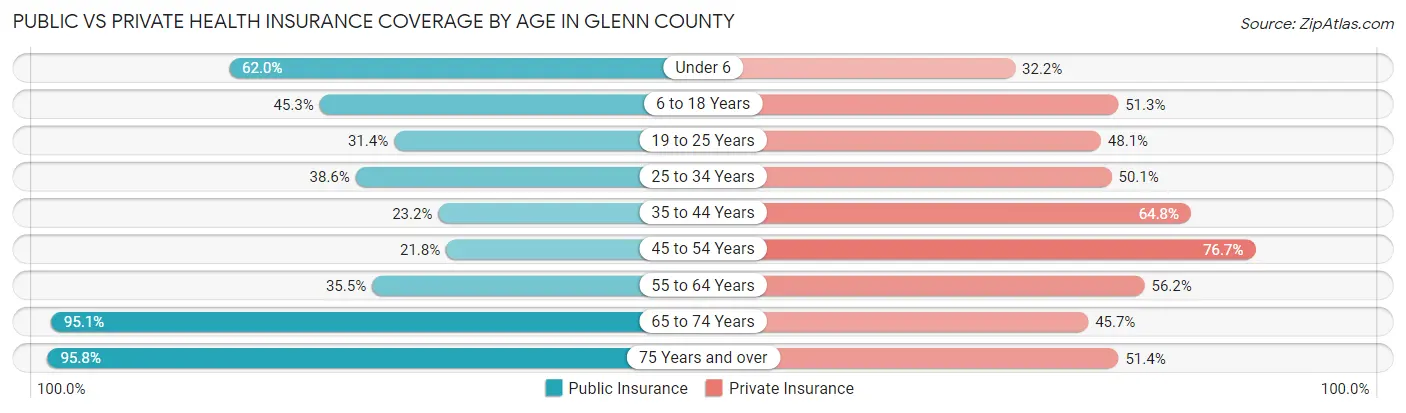
| Age Bracket | Public Insurance | Private Insurance |
| Under 6 | 1,477 (62.0%) | 766 (32.2%) |
| 6 to 18 Years | 2,643 (45.3%) | 2,997 (51.3%) |
| 19 to 25 Years | 710 (31.4%) | 1,086 (48.1%) |
| 25 to 34 Years | 1,303 (38.6%) | 1,692 (50.1%) |
| 35 to 44 Years | 769 (23.2%) | 2,146 (64.8%) |
| 45 to 54 Years | 683 (21.8%) | 2,407 (76.7%) |
| 55 to 64 Years | 1,192 (35.5%) | 1,886 (56.2%) |
| 65 to 74 Years | 2,722 (95.1%) | 1,309 (45.7%) |
| 75 Years and over | 1,827 (95.8%) | 980 (51.4%) |
| Total | 13,326 (46.9%) | 15,269 (53.7%) |
Disability Status by Sex by Age in Glenn County
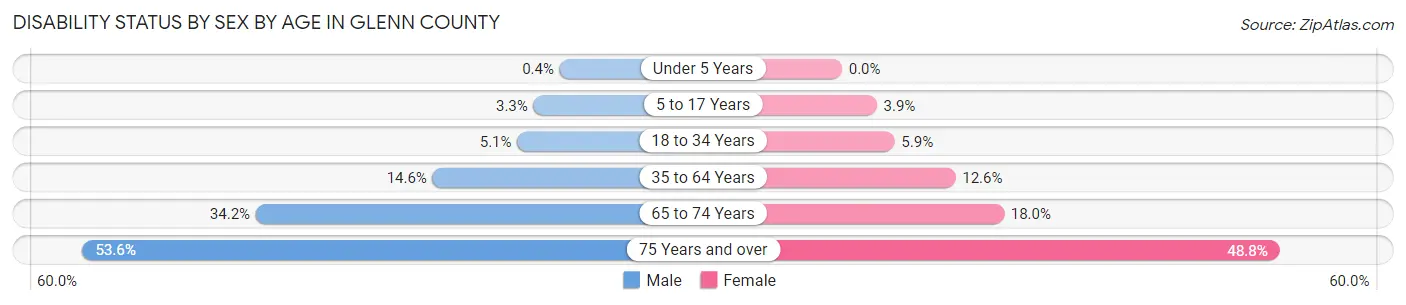
| Age Bracket | Male | Female |
| Under 5 Years | 5 (0.4%) | 0 (0.0%) |
| 5 to 17 Years | 94 (3.3%) | 103 (3.9%) |
| 18 to 34 Years | 169 (5.1%) | 175 (5.9%) |
| 35 to 64 Years | 723 (14.5%) | 611 (12.6%) |
| 65 to 74 Years | 492 (34.2%) | 257 (18.0%) |
| 75 Years and over | 445 (53.5%) | 525 (48.7%) |
Disability Class by Sex by Age in Glenn County
Disability Class: Hearing Difficulty
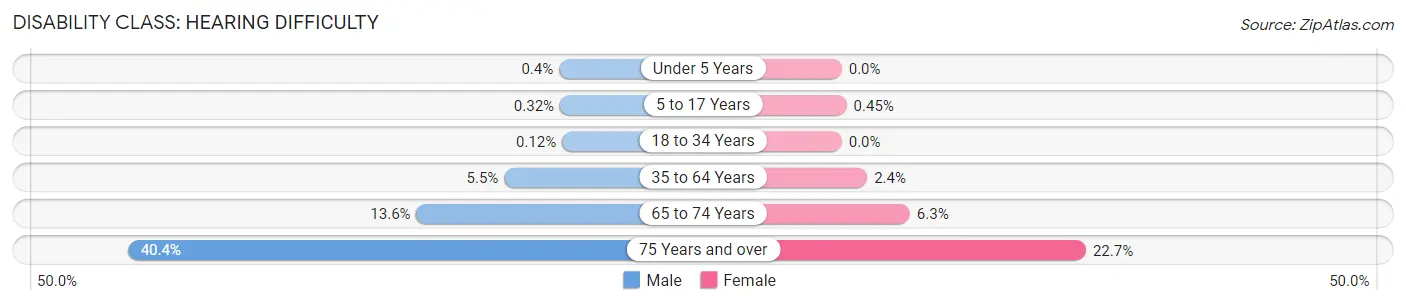
| Age Bracket | Male | Female |
| Under 5 Years | 5 (0.4%) | 0 (0.0%) |
| 5 to 17 Years | 9 (0.3%) | 12 (0.4%) |
| 18 to 34 Years | 4 (0.1%) | 0 (0.0%) |
| 35 to 64 Years | 273 (5.5%) | 114 (2.4%) |
| 65 to 74 Years | 196 (13.6%) | 90 (6.3%) |
| 75 Years and over | 336 (40.4%) | 244 (22.7%) |
Disability Class: Vision Difficulty
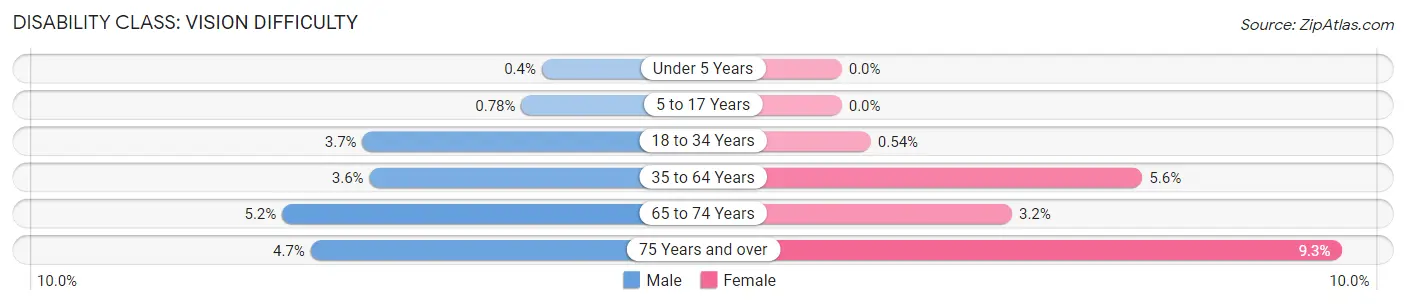
| Age Bracket | Male | Female |
| Under 5 Years | 5 (0.4%) | 0 (0.0%) |
| 5 to 17 Years | 22 (0.8%) | 0 (0.0%) |
| 18 to 34 Years | 123 (3.7%) | 16 (0.5%) |
| 35 to 64 Years | 179 (3.6%) | 270 (5.6%) |
| 65 to 74 Years | 75 (5.2%) | 45 (3.2%) |
| 75 Years and over | 39 (4.7%) | 100 (9.3%) |
Disability Class: Cognitive Difficulty
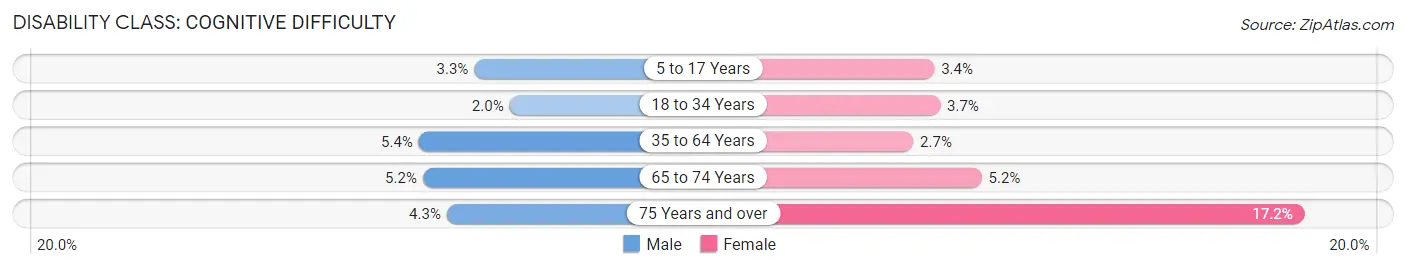
| Age Bracket | Male | Female |
| 5 to 17 Years | 94 (3.3%) | 91 (3.4%) |
| 18 to 34 Years | 66 (2.0%) | 109 (3.6%) |
| 35 to 64 Years | 267 (5.4%) | 128 (2.6%) |
| 65 to 74 Years | 75 (5.2%) | 74 (5.2%) |
| 75 Years and over | 36 (4.3%) | 185 (17.2%) |
Disability Class: Ambulatory Difficulty
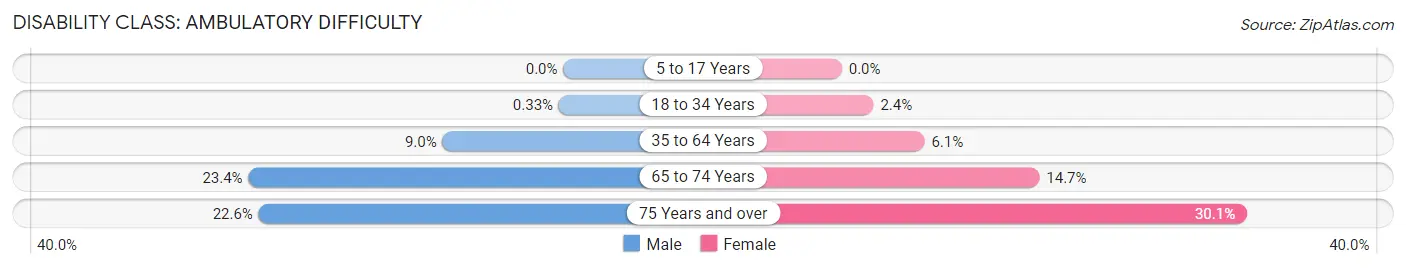
| Age Bracket | Male | Female |
| 5 to 17 Years | 0 (0.0%) | 0 (0.0%) |
| 18 to 34 Years | 11 (0.3%) | 70 (2.4%) |
| 35 to 64 Years | 446 (9.0%) | 297 (6.1%) |
| 65 to 74 Years | 336 (23.4%) | 209 (14.7%) |
| 75 Years and over | 188 (22.6%) | 324 (30.1%) |
Disability Class: Self-Care Difficulty
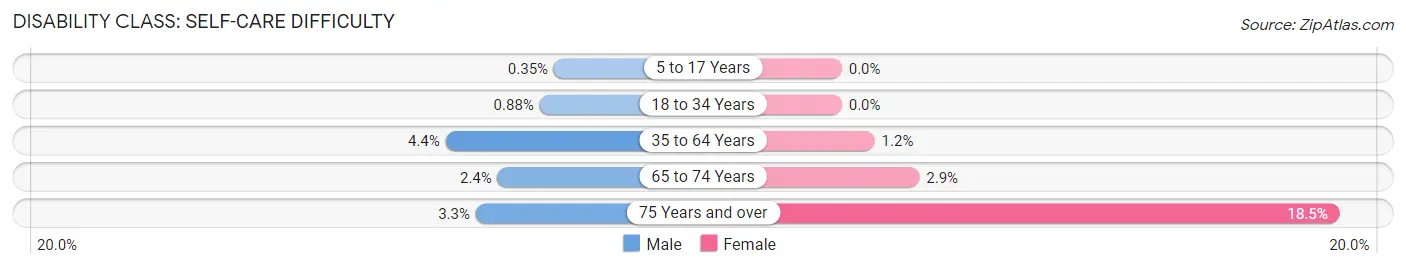
| Age Bracket | Male | Female |
| 5 to 17 Years | 10 (0.4%) | 0 (0.0%) |
| 18 to 34 Years | 29 (0.9%) | 0 (0.0%) |
| 35 to 64 Years | 217 (4.4%) | 59 (1.2%) |
| 65 to 74 Years | 35 (2.4%) | 41 (2.9%) |
| 75 Years and over | 27 (3.3%) | 199 (18.5%) |
Technology Access in Glenn County
Computing Device Access in Glenn County
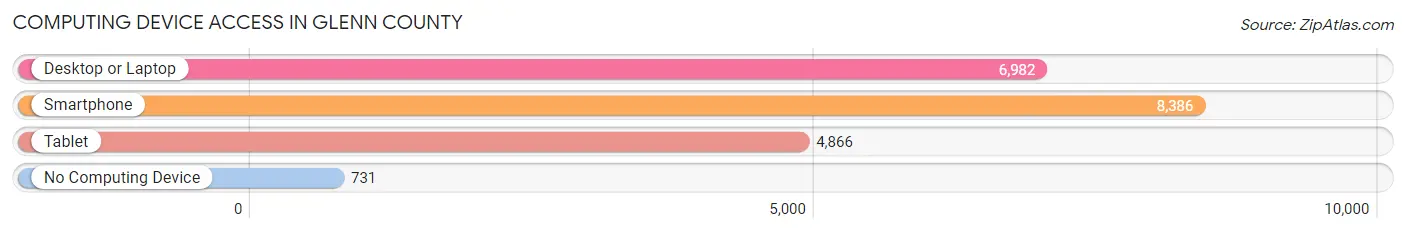
| Device Type | # Households | % Households |
| Desktop or Laptop | 6,982 | 71.7% |
| Smartphone | 8,386 | 86.1% |
| Tablet | 4,866 | 49.9% |
| No Computing Device | 731 | 7.5% |
| Total | 9,742 | 100.0% |
Internet Access in Glenn County
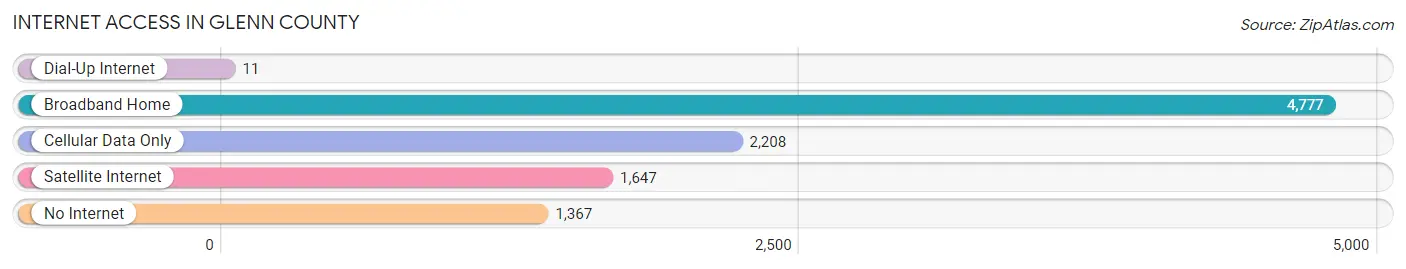
| Internet Type | # Households | % Households |
| Dial-Up Internet | 11 | 0.1% |
| Broadband Home | 4,777 | 49.0% |
| Cellular Data Only | 2,208 | 22.7% |
| Satellite Internet | 1,647 | 16.9% |
| No Internet | 1,367 | 14.0% |
| Total | 9,742 | 100.0% |
Glenn County Summary
Glenn County is located in the northern part of California, in the Central Valley region. It is bordered by Tehama County to the north, Butte County to the east, Colusa County to the south, and Yolo County to the west. The county seat is Willows, and the largest city is Orland. The county has a total area of 1,327 square miles, of which 1,312 square miles is land and 15 square miles is water.
History
Glenn County was formed in 1891 from parts of Colusa County. It was named after Dr. Hugh J. Glenn, who was the largest wheat farmer in the state during the late 19th century. The county was formed to provide better access to the county seat of Willows, which was located in Colusa County at the time.
The first settlers in the area were Native Americans, who lived in the area for thousands of years before the arrival of Europeans. The first Europeans to settle in the area were Spanish missionaries, who established missions in the area in the late 18th century.
In the mid-19th century, the area was settled by ranchers and farmers, who established small towns and villages. The county was officially established in 1891, and the county seat was moved to Willows.
Geography
Glenn County is located in the Central Valley region of California. It is bordered by Tehama County to the north, Butte County to the east, Colusa County to the south, and Yolo County to the west. The county has a total area of 1,327 square miles, of which 1,312 square miles is land and 15 square miles is water.
The county is mostly flat, with rolling hills in the northern and eastern parts. The Sacramento River runs through the county, and the Stony Creek and Butte Creek rivers also flow through the county. The county is home to several lakes, including Black Butte Lake, Stony Gorge Reservoir, and Lake Almanor.
Economy
The economy of Glenn County is largely based on agriculture. The county is one of the top producers of rice in the state, and is also a major producer of walnuts, almonds, and other tree nuts. Other crops grown in the county include tomatoes, corn, wheat, and hay.
The county is also home to several manufacturing companies, including a large food processing plant in Orland. The county is also home to several wineries, and is a popular destination for wine tasting.
Demographics
As of the 2010 census, the population of Glenn County was 28,122. The racial makeup of the county was 75.3% White, 0.7% African American, 1.3% Native American, 0.7% Asian, 0.1% Pacific Islander, 18.7% from other races, and 3.2% from two or more races. Hispanic or Latino of any race were 33.2% of the population.
The median income for a household in the county was $41,945, and the median income for a family was $48,945. The per capita income for the county was $19,845. About 15.2% of the population was below the poverty line.
Common Questions
What is Per Capita Income in Glenn County?
Per Capita income in Glenn County is $28,106.
What is the Median Family Income in Glenn County?
Median Family Income in Glenn County is $75,654.
What is the Median Household income in Glenn County?
Median Household Income in Glenn County is $64,033.
What is Income or Wage Gap in Glenn County?
Income or Wage Gap in Glenn County is 22.7%.
Women in Glenn County earn 77.3 cents for every dollar earned by a man.
What is Family Income Deficit in Glenn County?
Family Income Deficit in Glenn County is $11,931.
Families that are below poverty line in Glenn County earn $11,931 less on average than the poverty threshold level.
What is Inequality or Gini Index in Glenn County?
Inequality or Gini Index in Glenn County is 0.41.
What is the Total Population of Glenn County?
Total Population of Glenn County is 28,657.
What is the Total Male Population of Glenn County?
Total Male Population of Glenn County is 14,763.
What is the Total Female Population of Glenn County?
Total Female Population of Glenn County is 13,894.
What is the Ratio of Males per 100 Females in Glenn County?
There are 106.25 Males per 100 Females in Glenn County.
What is the Ratio of Females per 100 Males in Glenn County?
There are 94.11 Females per 100 Males in Glenn County.
What is the Median Population Age in Glenn County?
Median Population Age in Glenn County is 35.8 Years.
What is the Average Family Size in Glenn County
Average Family Size in Glenn County is 3.5 People.
What is the Average Household Size in Glenn County
Average Household Size in Glenn County is 2.9 People.
How Large is the Labor Force in Glenn County?
There are 13,559 People in the Labor Forcein in Glenn County.
What is the Percentage of People in the Labor Force in Glenn County?
61.6% of People are in the Labor Force in Glenn County.
What is the Unemployment Rate in Glenn County?
Unemployment Rate in Glenn County is 7.7%.