Del Norte County, CA Map & Demographics
Del Norte County Map
Del Norte County Overview
$28,396
PER CAPITA INCOME
$74,548
AVG FAMILY INCOME
$61,149
AVG HOUSEHOLD INCOME
14.9%
WAGE / INCOME GAP [ % ]
85.1¢/ $1
WAGE / INCOME GAP [ $ ]
$10,911
FAMILY INCOME DEFICIT
0.43
INEQUALITY / GINI INDEX
27,462
TOTAL POPULATION
14,809
MALE POPULATION
12,653
FEMALE POPULATION
117.04
MALES / 100 FEMALES
85.44
FEMALES / 100 MALES
40.0
MEDIAN AGE
3.2
AVG FAMILY SIZE
2.6
AVG HOUSEHOLD SIZE
10,574
LABOR FORCE [ PEOPLE ]
47.6%
PERCENT IN LABOR FORCE
6.3%
UNEMPLOYMENT RATE
Del Norte County Area Codes
Income in Del Norte County
Income Overview in Del Norte County
Per Capita Income in Del Norte County is $28,396, while median incomes of families and households are $74,548 and $61,149 respectively.
| Characteristic | Number | Measure |
| Per Capita Income | 27,462 | $28,396 |
| Median Family Income | 6,320 | $74,548 |
| Mean Family Income | 6,320 | $89,722 |
| Median Household Income | 9,530 | $61,149 |
| Mean Household Income | 9,530 | $79,344 |
| Income Deficit | 6,320 | $10,911 |
| Wage / Income Gap (%) | 27,462 | 14.85% |
| Wage / Income Gap ($) | 27,462 | 85.15¢ per $1 |
| Gini / Inequality Index | 27,462 | 0.43 |
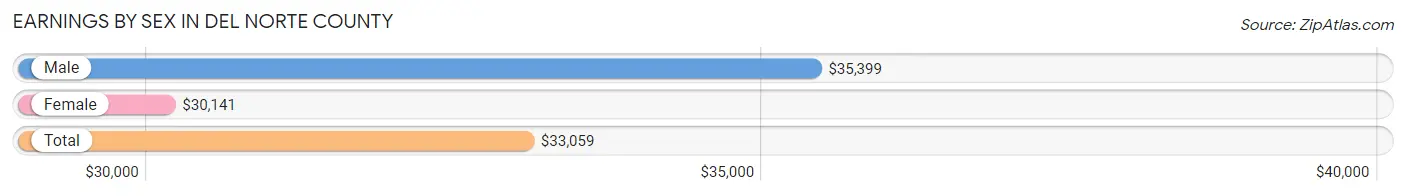
Earnings by Sex in Del Norte County
Average Earnings in Del Norte County are $33,059, $35,399 for men and $30,141 for women, a difference of 14.8%.
| Sex | Number | Average Earnings |
| Male | 5,988 (52.5%) | $35,399 |
| Female | 5,414 (47.5%) | $30,141 |
| Total | 11,402 (100.0%) | $33,059 |
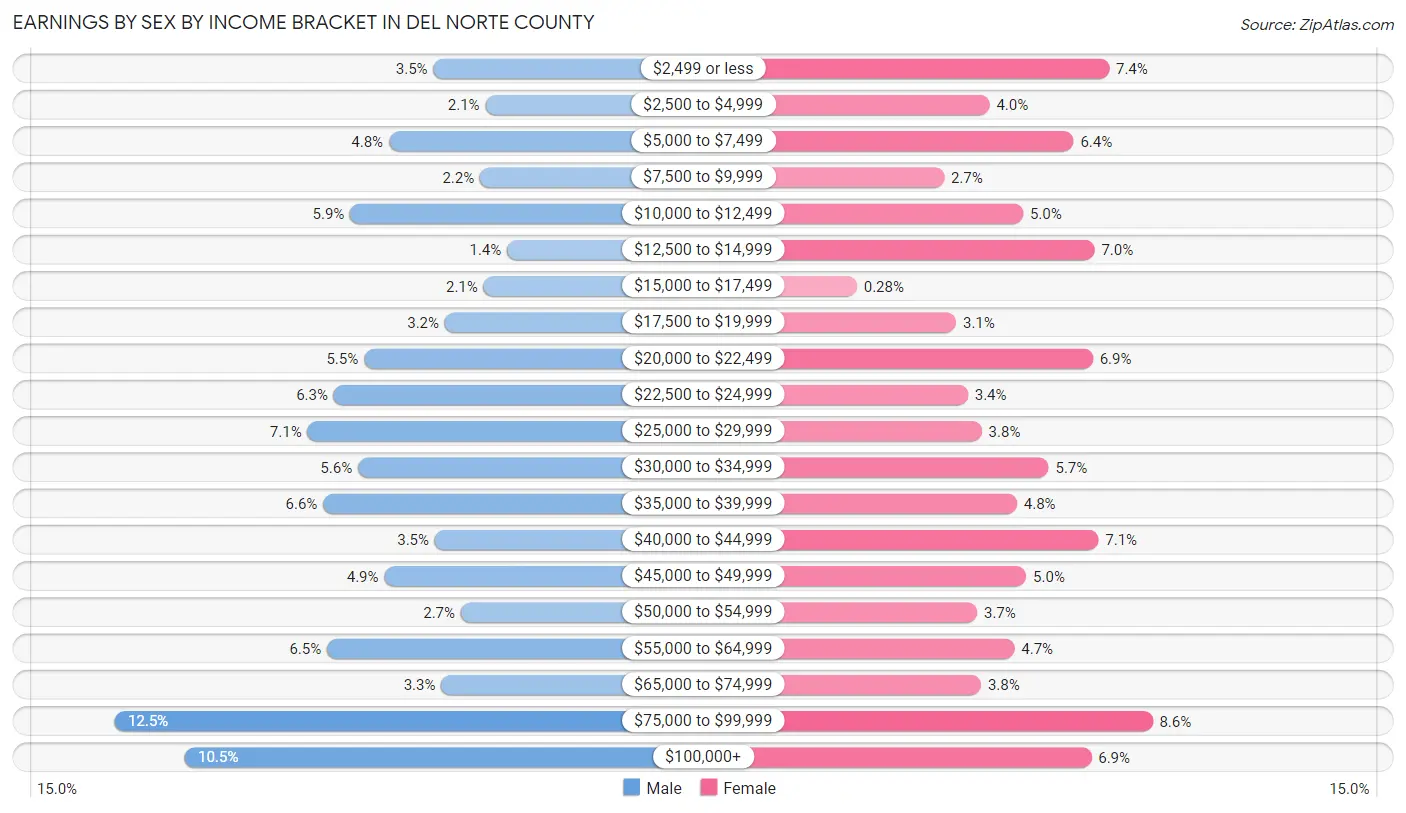
Earnings by Sex by Income Bracket in Del Norte County
The most common earnings brackets in Del Norte County are $75,000 to $99,999 for men (746 | 12.5%) and $75,000 to $99,999 for women (465 | 8.6%).
| Income | Male | Female |
| $2,499 or less | 210 (3.5%) | 399 (7.4%) |
| $2,500 to $4,999 | 123 (2.1%) | 217 (4.0%) |
| $5,000 to $7,499 | 285 (4.8%) | 345 (6.4%) |
| $7,500 to $9,999 | 132 (2.2%) | 148 (2.7%) |
| $10,000 to $12,499 | 350 (5.9%) | 268 (5.0%) |
| $12,500 to $14,999 | 86 (1.4%) | 377 (7.0%) |
| $15,000 to $17,499 | 126 (2.1%) | 15 (0.3%) |
| $17,500 to $19,999 | 191 (3.2%) | 166 (3.1%) |
| $20,000 to $22,499 | 327 (5.5%) | 374 (6.9%) |
| $22,500 to $24,999 | 378 (6.3%) | 184 (3.4%) |
| $25,000 to $29,999 | 422 (7.0%) | 205 (3.8%) |
| $30,000 to $34,999 | 337 (5.6%) | 307 (5.7%) |
| $35,000 to $39,999 | 396 (6.6%) | 259 (4.8%) |
| $40,000 to $44,999 | 208 (3.5%) | 383 (7.1%) |
| $45,000 to $49,999 | 293 (4.9%) | 273 (5.0%) |
| $50,000 to $54,999 | 164 (2.7%) | 198 (3.7%) |
| $55,000 to $64,999 | 389 (6.5%) | 255 (4.7%) |
| $65,000 to $74,999 | 197 (3.3%) | 204 (3.8%) |
| $75,000 to $99,999 | 746 (12.5%) | 465 (8.6%) |
| $100,000+ | 628 (10.5%) | 372 (6.9%) |
| Total | 5,988 (100.0%) | 5,414 (100.0%) |
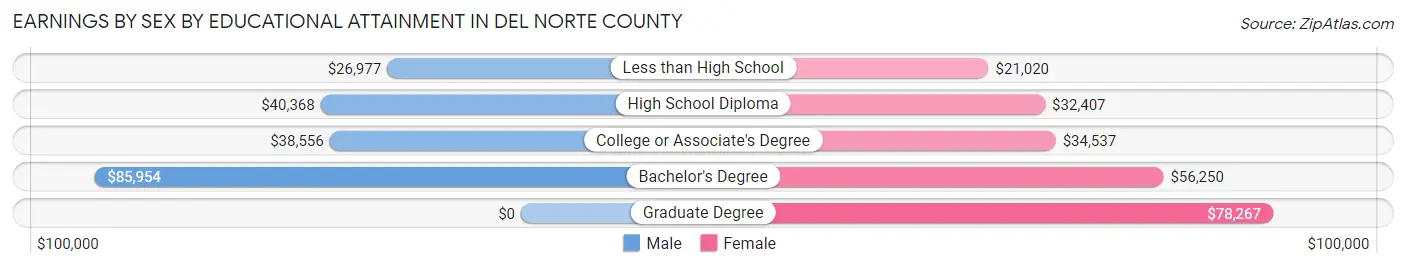
Earnings by Sex by Educational Attainment in Del Norte County
Average earnings in Del Norte County are $39,196 for men and $35,488 for women, a difference of 9.5%. Men with an educational attainment of bachelor's degree enjoy the highest average annual earnings of $85,954, while those with less than high school education earn the least with $26,977. Women with an educational attainment of graduate degree earn the most with the average annual earnings of $78,267, while those with less than high school education have the smallest earnings of $21,020.
| Educational Attainment | Male Income | Female Income |
| Less than High School | $26,977 | $21,020 |
| High School Diploma | $40,368 | $32,407 |
| College or Associate's Degree | $38,556 | $34,537 |
| Bachelor's Degree | $85,954 | $56,250 |
| Graduate Degree | - | - |
| Total | $39,196 | $35,488 |
Family Income in Del Norte County
Family Income Brackets in Del Norte County
According to the Del Norte County family income data, there are 1,289 families falling into the $100,000 to $149,999 income range, which is the most common income bracket and makes up 20.4% of all families. Conversely, the $10,000 to $14,999 income bracket is the least frequent group with only 177 families (2.8%) belonging to this category.
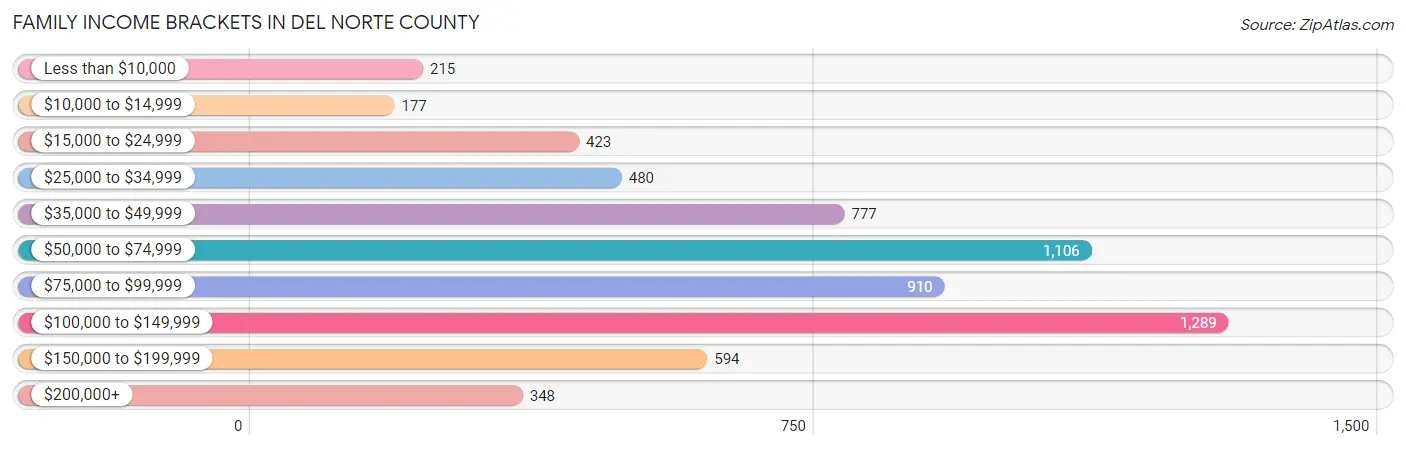
| Income Bracket | # Families | % Families |
| Less than $10,000 | 215 | 3.4% |
| $10,000 to $14,999 | 177 | 2.8% |
| $15,000 to $24,999 | 423 | 6.7% |
| $25,000 to $34,999 | 480 | 7.6% |
| $35,000 to $49,999 | 777 | 12.3% |
| $50,000 to $74,999 | 1,106 | 17.5% |
| $75,000 to $99,999 | 910 | 14.4% |
| $100,000 to $149,999 | 1,289 | 20.4% |
| $150,000 to $199,999 | 594 | 9.4% |
| $200,000+ | 348 | 5.5% |
Family Income by Famaliy Size in Del Norte County
7+ person families (74 | 1.2%) account for the highest median family income in Del Norte County with $152,143 per family, while 2-person families (3,202 | 50.7%) have the highest median income of $31,762 per family member.
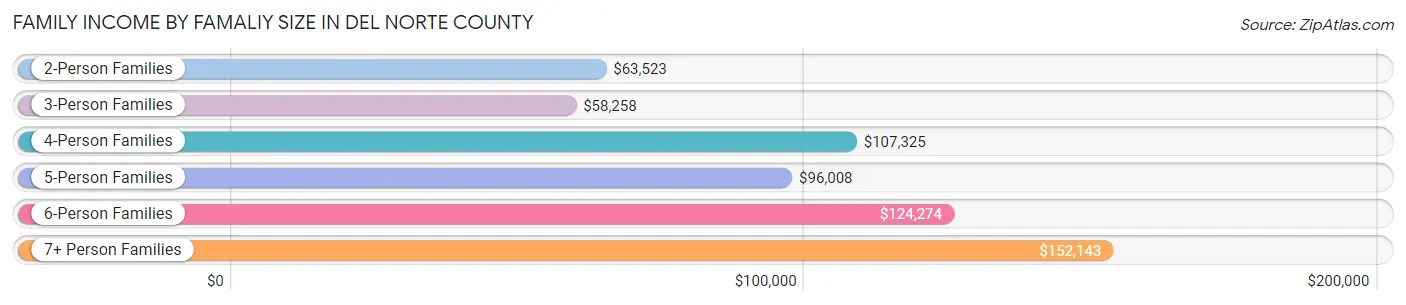
| Income Bracket | # Families | Median Income |
| 2-Person Families | 3,202 (50.7%) | $63,523 |
| 3-Person Families | 1,364 (21.6%) | $58,258 |
| 4-Person Families | 799 (12.6%) | $107,325 |
| 5-Person Families | 617 (9.8%) | $96,008 |
| 6-Person Families | 264 (4.2%) | $124,274 |
| 7+ Person Families | 74 (1.2%) | $152,143 |
| Total | 6,320 (100.0%) | $74,548 |
Family Income by Number of Earners in Del Norte County
The median family income in Del Norte County is $74,548, with families comprising 3+ earners (725) having the highest median family income of $122,275, while families with 1 earner (2,219) have the lowest median family income of $48,613, accounting for 11.5% and 35.1% of families, respectively.
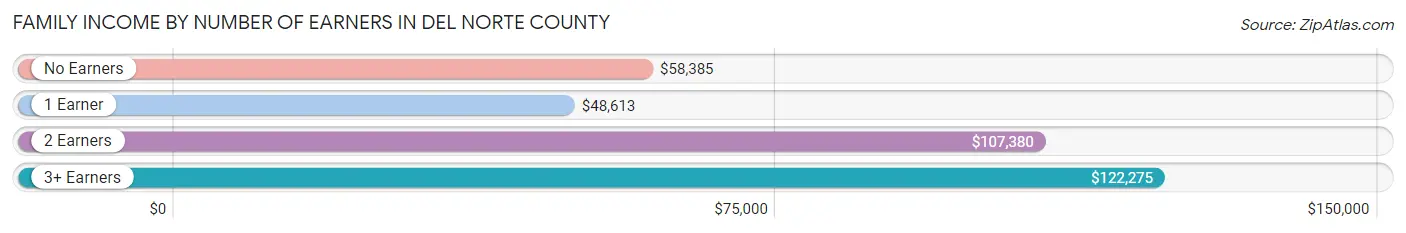
| Number of Earners | # Families | Median Income |
| No Earners | 1,425 (22.6%) | $58,385 |
| 1 Earner | 2,219 (35.1%) | $48,613 |
| 2 Earners | 1,951 (30.9%) | $107,380 |
| 3+ Earners | 725 (11.5%) | $122,275 |
| Total | 6,320 (100.0%) | $74,548 |
Household Income in Del Norte County
Household Income Brackets in Del Norte County
With 1,601 households falling in the category, the $50,000 to $74,999 income range is the most frequent in Del Norte County, accounting for 16.8% of all households. In contrast, only 314 households (3.3%) fall into the less than $10,000 income bracket, making it the least populous group.
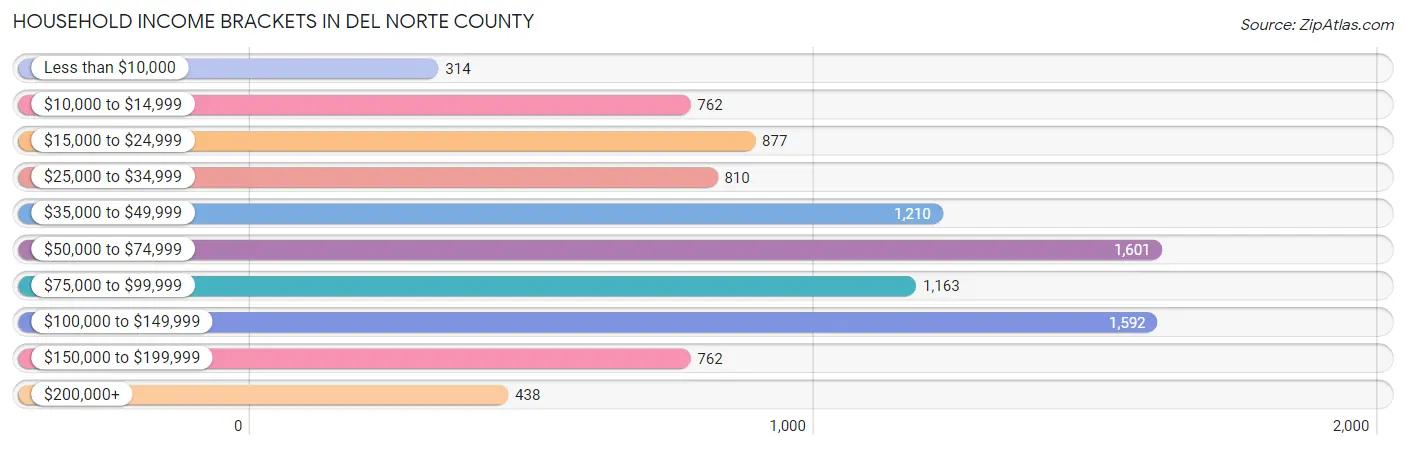
| Income Bracket | # Households | % Households |
| Less than $10,000 | 314 | 3.3% |
| $10,000 to $14,999 | 762 | 8.0% |
| $15,000 to $24,999 | 877 | 9.2% |
| $25,000 to $34,999 | 810 | 8.5% |
| $35,000 to $49,999 | 1,210 | 12.7% |
| $50,000 to $74,999 | 1,601 | 16.8% |
| $75,000 to $99,999 | 1,163 | 12.2% |
| $100,000 to $149,999 | 1,592 | 16.7% |
| $150,000 to $199,999 | 762 | 8.0% |
| $200,000+ | 438 | 4.6% |
Household Income by Householder Age in Del Norte County
The median household income in Del Norte County is $61,149, with the highest median household income of $77,500 found in the 25 to 44 years age bracket for the primary householder. A total of 2,540 households (26.7%) fall into this category. Meanwhile, the 15 to 24 years age bracket for the primary householder has the lowest median household income of $29,529, with 205 households (2.1%) in this group.
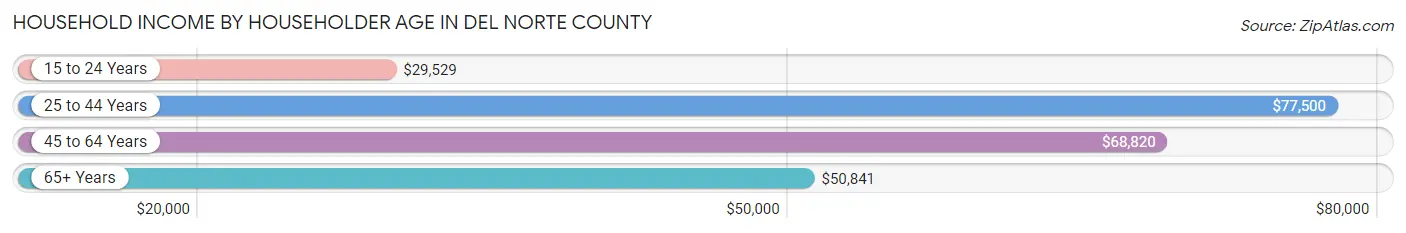
| Income Bracket | # Households | Median Income |
| 15 to 24 Years | 205 (2.1%) | $29,529 |
| 25 to 44 Years | 2,540 (26.7%) | $77,500 |
| 45 to 64 Years | 3,473 (36.4%) | $68,820 |
| 65+ Years | 3,312 (34.7%) | $50,841 |
| Total | 9,530 (100.0%) | $61,149 |
Poverty in Del Norte County
Income Below Poverty by Sex and Age in Del Norte County
With 12.6% poverty level for males and 16.0% for females among the residents of Del Norte County, 5 year old males and 18 to 24 year old females are the most vulnerable to poverty, with 45 males (23.7%) and 282 females (32.3%) in their respective age groups living below the poverty level.
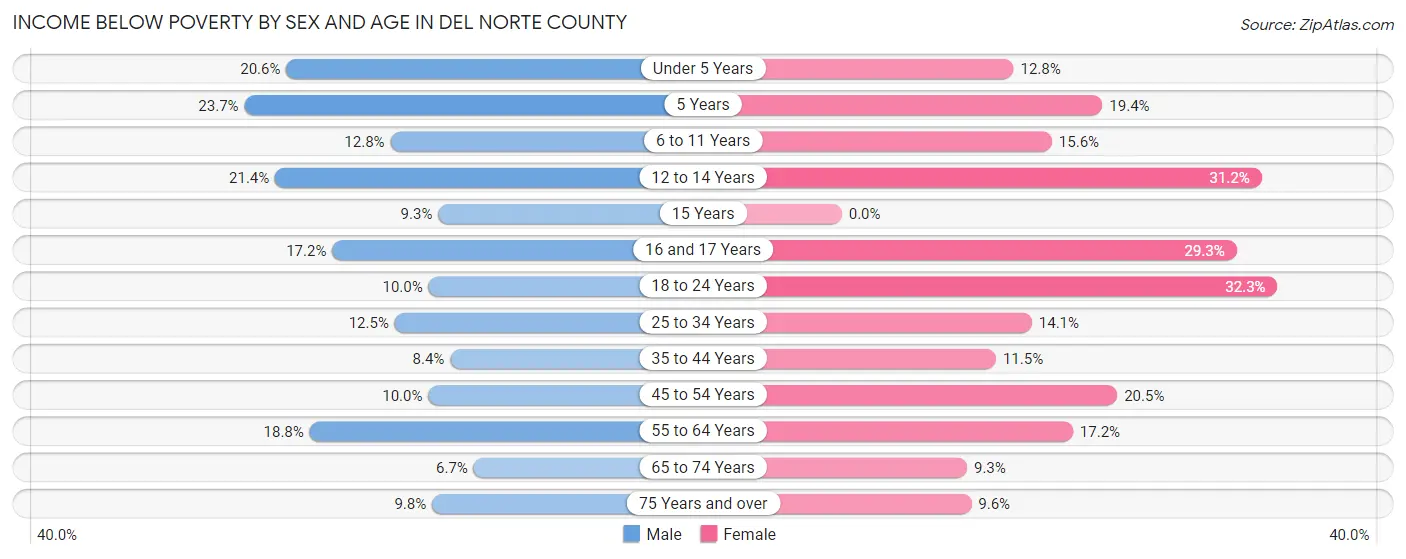
| Age Bracket | Male | Female |
| Under 5 Years | 136 (20.6%) | 104 (12.8%) |
| 5 Years | 45 (23.7%) | 6 (19.4%) |
| 6 to 11 Years | 133 (12.8%) | 173 (15.6%) |
| 12 to 14 Years | 104 (21.4%) | 139 (31.2%) |
| 15 Years | 21 (9.3%) | 0 (0.0%) |
| 16 and 17 Years | 64 (17.2%) | 51 (29.3%) |
| 18 to 24 Years | 81 (10.0%) | 282 (32.3%) |
| 25 to 34 Years | 190 (12.5%) | 201 (14.1%) |
| 35 to 44 Years | 123 (8.4%) | 165 (11.5%) |
| 45 to 54 Years | 159 (10.0%) | 292 (20.4%) |
| 55 to 64 Years | 339 (18.8%) | 332 (17.2%) |
| 65 to 74 Years | 105 (6.7%) | 151 (9.3%) |
| 75 Years and over | 85 (9.8%) | 104 (9.6%) |
| Total | 1,585 (12.6%) | 2,000 (16.0%) |
Income Above Poverty by Sex and Age in Del Norte County
According to the poverty statistics in Del Norte County, males aged 65 to 74 years and females aged 15 years are the age groups that are most secure financially, with 93.3% of males and 100.0% of females in these age groups living above the poverty line.
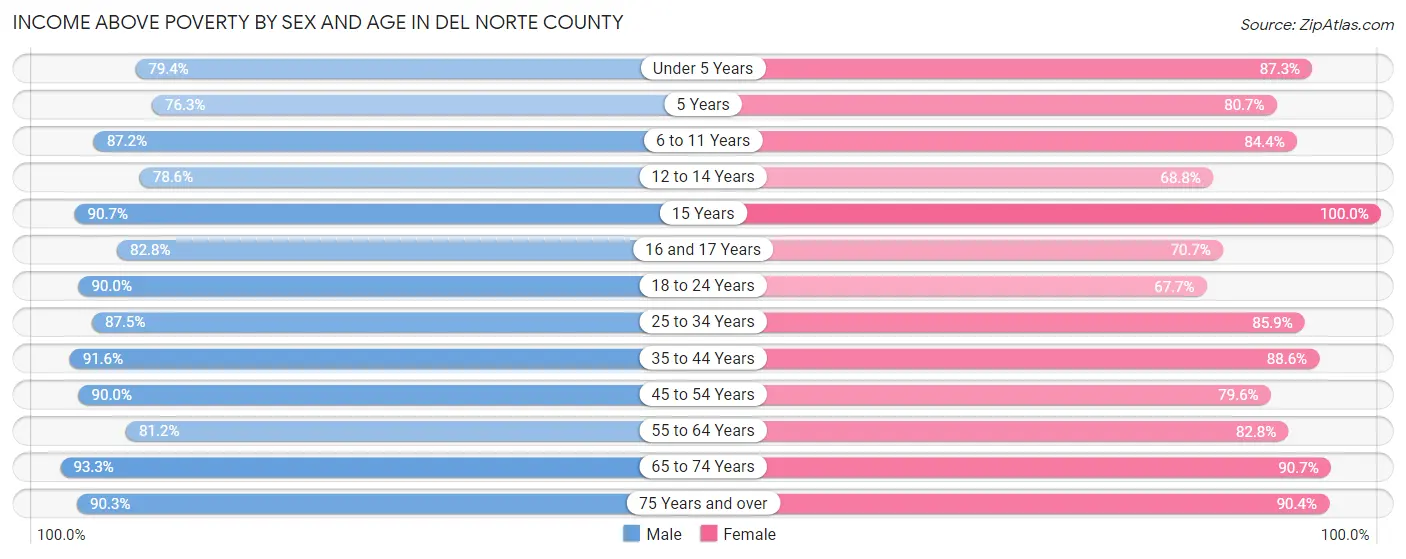
| Age Bracket | Male | Female |
| Under 5 Years | 525 (79.4%) | 712 (87.3%) |
| 5 Years | 145 (76.3%) | 25 (80.6%) |
| 6 to 11 Years | 903 (87.2%) | 936 (84.4%) |
| 12 to 14 Years | 382 (78.6%) | 307 (68.8%) |
| 15 Years | 205 (90.7%) | 119 (100.0%) |
| 16 and 17 Years | 309 (82.8%) | 123 (70.7%) |
| 18 to 24 Years | 728 (90.0%) | 590 (67.7%) |
| 25 to 34 Years | 1,327 (87.5%) | 1,224 (85.9%) |
| 35 to 44 Years | 1,342 (91.6%) | 1,276 (88.5%) |
| 45 to 54 Years | 1,427 (90.0%) | 1,136 (79.5%) |
| 55 to 64 Years | 1,460 (81.2%) | 1,603 (82.8%) |
| 65 to 74 Years | 1,471 (93.3%) | 1,472 (90.7%) |
| 75 Years and over | 787 (90.2%) | 977 (90.4%) |
| Total | 11,011 (87.4%) | 10,500 (84.0%) |
Income Below Poverty Among Married-Couple Families in Del Norte County
The poverty statistics for married-couple families in Del Norte County show that 5.6% or 247 of the total 4,425 families live below the poverty line. Families with 1 or 2 children have the highest poverty rate of 17.2%, comprising of 211 families. On the other hand, families with 3 or 4 children have the lowest poverty rate of 0.0%, which includes 0 families.
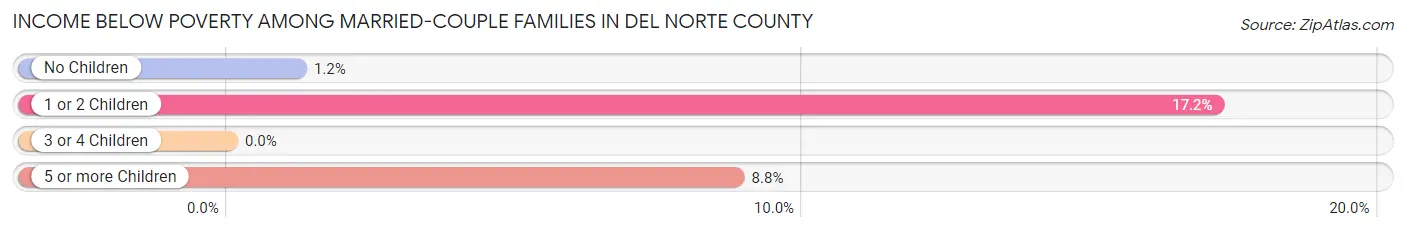
| Children | Above Poverty | Below Poverty |
| No Children | 2,711 (98.8%) | 33 (1.2%) |
| 1 or 2 Children | 1,018 (82.8%) | 211 (17.2%) |
| 3 or 4 Children | 418 (100.0%) | 0 (0.0%) |
| 5 or more Children | 31 (91.2%) | 3 (8.8%) |
| Total | 4,178 (94.4%) | 247 (5.6%) |
Income Below Poverty Among Single-Parent Households in Del Norte County
According to the poverty data in Del Norte County, 21.5% or 147 single-father households and 18.2% or 221 single-mother households are living below the poverty line. Among single-father households, those with 1 or 2 children have the highest poverty rate, with 140 households (38.8%) experiencing poverty. Likewise, among single-mother households, those with 5 or more children have the highest poverty rate, with 4 households (40.0%) falling below the poverty line.
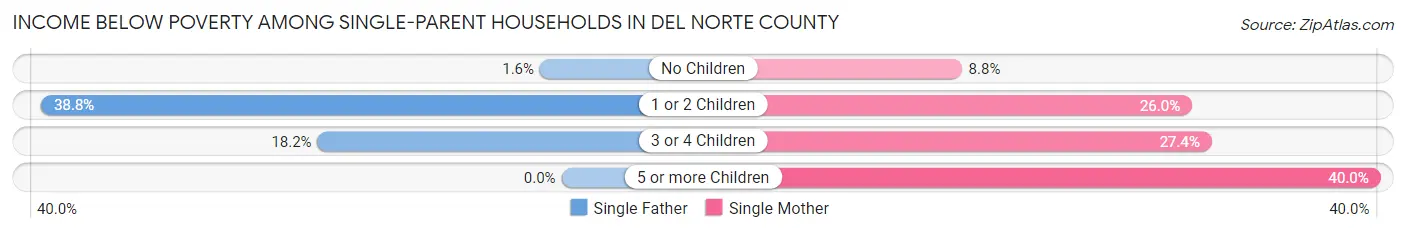
| Children | Single Father | Single Mother |
| No Children | 5 (1.6%) | 50 (8.8%) |
| 1 or 2 Children | 140 (38.8%) | 116 (26.0%) |
| 3 or 4 Children | 2 (18.2%) | 51 (27.4%) |
| 5 or more Children | 0 (0.0%) | 4 (40.0%) |
| Total | 147 (21.5%) | 221 (18.2%) |
Income Below Poverty Among Married-Couple vs Single-Parent Households in Del Norte County
The poverty data for Del Norte County shows that 247 of the married-couple family households (5.6%) and 368 of the single-parent households (19.4%) are living below the poverty level. Within the married-couple family households, those with 1 or 2 children have the highest poverty rate, with 211 households (17.2%) falling below the poverty line. Among the single-parent households, those with 5 or more children have the highest poverty rate, with 4 household (40.0%) living below poverty.
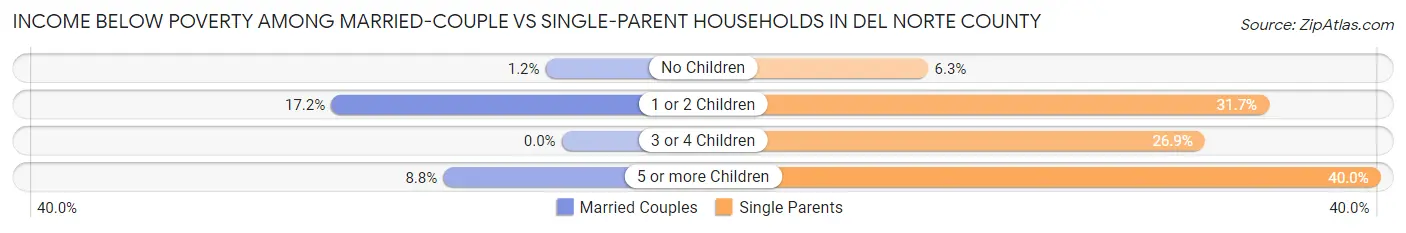
| Children | Married-Couple Families | Single-Parent Households |
| No Children | 33 (1.2%) | 55 (6.2%) |
| 1 or 2 Children | 211 (17.2%) | 256 (31.7%) |
| 3 or 4 Children | 0 (0.0%) | 53 (26.9%) |
| 5 or more Children | 3 (8.8%) | 4 (40.0%) |
| Total | 247 (5.6%) | 368 (19.4%) |
Race in Del Norte County
The most populous races in Del Norte County are White / Caucasian (18,969 | 69.1%), Hispanic or Latino (5,607 | 20.4%), and Two or more Races (2,869 | 10.4%).
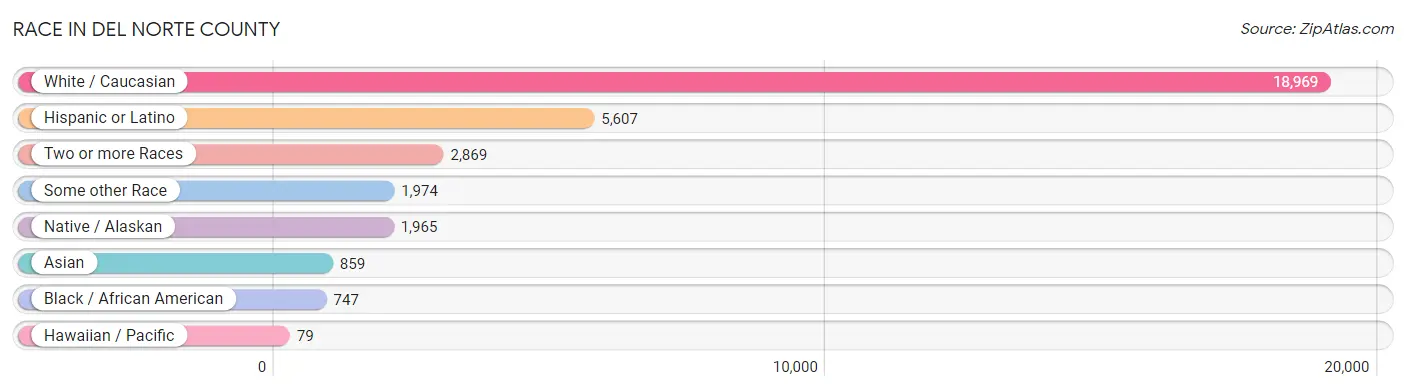
| Race | # Population | % Population |
| Asian | 859 | 3.1% |
| Black / African American | 747 | 2.7% |
| Hawaiian / Pacific | 79 | 0.3% |
| Hispanic or Latino | 5,607 | 20.4% |
| Native / Alaskan | 1,965 | 7.2% |
| White / Caucasian | 18,969 | 69.1% |
| Two or more Races | 2,869 | 10.4% |
| Some other Race | 1,974 | 7.2% |
| Total | 27,462 | 100.0% |
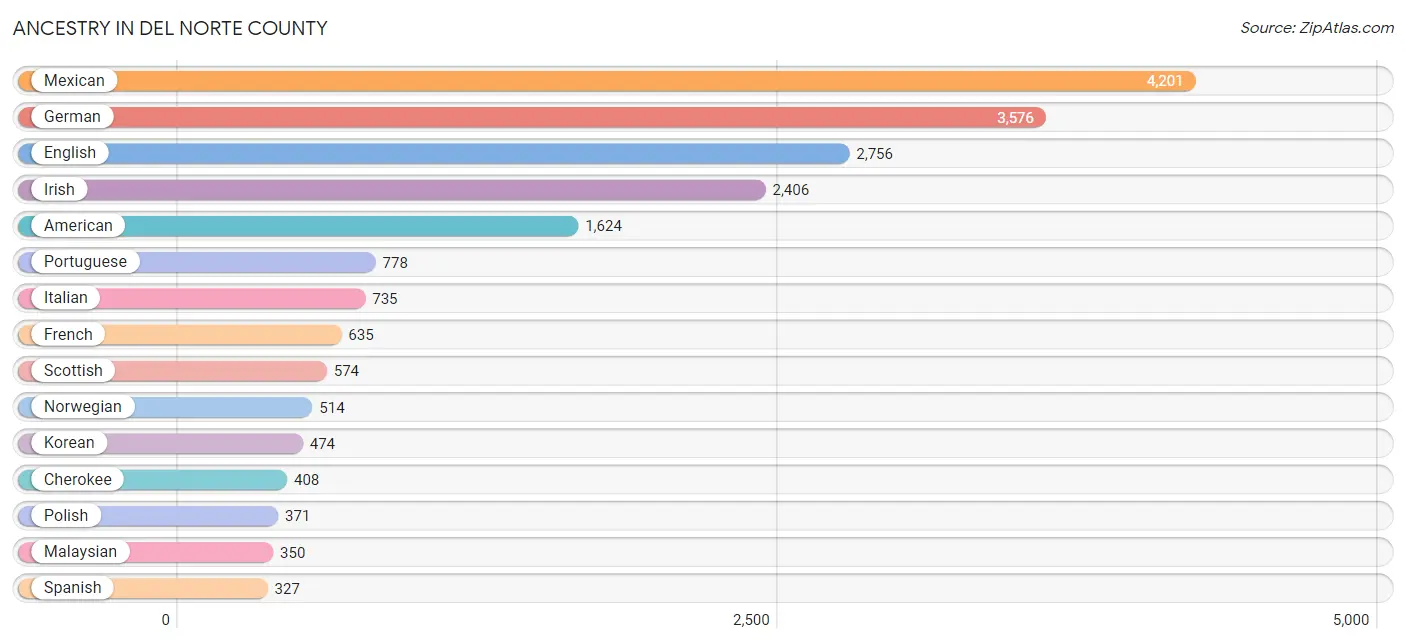
Ancestry in Del Norte County
The most populous ancestries reported in Del Norte County are Mexican (4,201 | 15.3%), German (3,576 | 13.0%), English (2,756 | 10.0%), Irish (2,406 | 8.8%), and American (1,624 | 5.9%), together accounting for 53.0% of all Del Norte County residents.
| Ancestry | # Population | % Population |
| African | 103 | 0.4% |
| Alaska Native | 3 | 0.0% |
| American | 1,624 | 5.9% |
| Apache | 48 | 0.2% |
| Arab | 41 | 0.2% |
| Armenian | 13 | 0.1% |
| Austrian | 4 | 0.0% |
| Bangladeshi | 143 | 0.5% |
| Bhutanese | 94 | 0.3% |
| Blackfeet | 29 | 0.1% |
| British | 117 | 0.4% |
| Burmese | 139 | 0.5% |
| Canadian | 22 | 0.1% |
| Central American | 33 | 0.1% |
| Central American Indian | 5 | 0.0% |
| Cherokee | 408 | 1.5% |
| Chilean | 6 | 0.0% |
| Chippewa | 50 | 0.2% |
| Choctaw | 105 | 0.4% |
| Creek | 7 | 0.0% |
| Croatian | 11 | 0.0% |
| Czech | 99 | 0.4% |
| Czechoslovakian | 34 | 0.1% |
| Danish | 202 | 0.7% |
| Dutch | 321 | 1.2% |
| Dutch West Indian | 8 | 0.0% |
| Eastern European | 52 | 0.2% |
| English | 2,756 | 10.0% |
| European | 276 | 1.0% |
| Finnish | 42 | 0.2% |
| French | 635 | 2.3% |
| French American Indian | 3 | 0.0% |
| French Canadian | 30 | 0.1% |
| German | 3,576 | 13.0% |
| Guatemalan | 1 | 0.0% |
| Hungarian | 44 | 0.2% |
| Indian (Asian) | 65 | 0.2% |
| Iranian | 22 | 0.1% |
| Irish | 2,406 | 8.8% |
| Iroquois | 25 | 0.1% |
| Italian | 735 | 2.7% |
| Korean | 474 | 1.7% |
| Lithuanian | 36 | 0.1% |
| Malaysian | 350 | 1.3% |
| Mexican | 4,201 | 15.3% |
| Mexican American Indian | 25 | 0.1% |
| Moroccan | 20 | 0.1% |
| Native Hawaiian | 284 | 1.0% |
| Navajo | 4 | 0.0% |
| Northern European | 22 | 0.1% |
| Norwegian | 514 | 1.9% |
| Paiute | 6 | 0.0% |
| Pakistani | 322 | 1.2% |
| Pennsylvania German | 17 | 0.1% |
| Polish | 371 | 1.3% |
| Portuguese | 778 | 2.8% |
| Potawatomi | 3 | 0.0% |
| Pueblo | 3 | 0.0% |
| Puerto Rican | 121 | 0.4% |
| Romanian | 3 | 0.0% |
| Russian | 70 | 0.3% |
| Salvadoran | 32 | 0.1% |
| Samoan | 95 | 0.4% |
| Scandinavian | 196 | 0.7% |
| Scotch-Irish | 225 | 0.8% |
| Scottish | 574 | 2.1% |
| Serbian | 9 | 0.0% |
| Sioux | 2 | 0.0% |
| Slavic | 22 | 0.1% |
| South American | 6 | 0.0% |
| Spaniard | 134 | 0.5% |
| Spanish | 327 | 1.2% |
| Spanish American | 165 | 0.6% |
| Sri Lankan | 130 | 0.5% |
| Subsaharan African | 103 | 0.4% |
| Swedish | 320 | 1.2% |
| Swiss | 95 | 0.4% |
| Syrian | 21 | 0.1% |
| Thai | 31 | 0.1% |
| Ukrainian | 79 | 0.3% |
| Welsh | 60 | 0.2% |
| Yuman | 15 | 0.1% |
| Yup'ik | 36 | 0.1% | View All 83 Rows |
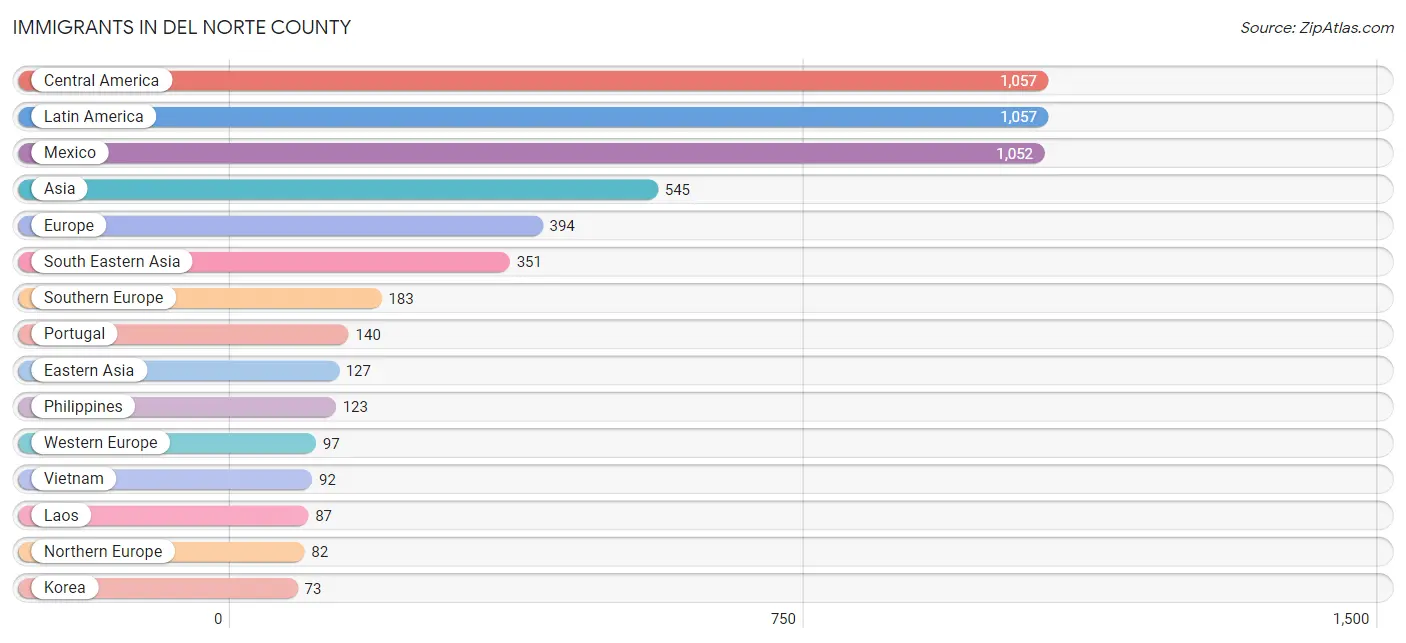
Immigrants in Del Norte County
The most numerous immigrant groups reported in Del Norte County came from Central America (1,057 | 3.8%), Latin America (1,057 | 3.8%), Mexico (1,052 | 3.8%), Asia (545 | 2.0%), and Europe (394 | 1.4%), together accounting for 14.9% of all Del Norte County residents.
| Immigration Origin | # Population | % Population |
| Asia | 545 | 2.0% |
| Azores | 49 | 0.2% |
| Bangladesh | 1 | 0.0% |
| Canada | 66 | 0.2% |
| Central America | 1,057 | 3.8% |
| China | 22 | 0.1% |
| Croatia | 11 | 0.0% |
| Czechoslovakia | 11 | 0.0% |
| Eastern Asia | 127 | 0.5% |
| Eastern Europe | 32 | 0.1% |
| El Salvador | 2 | 0.0% |
| England | 19 | 0.1% |
| Europe | 394 | 1.4% |
| Germany | 43 | 0.2% |
| Honduras | 3 | 0.0% |
| Hong Kong | 14 | 0.1% |
| India | 21 | 0.1% |
| Iran | 22 | 0.1% |
| Ireland | 8 | 0.0% |
| Italy | 43 | 0.2% |
| Japan | 32 | 0.1% |
| Korea | 73 | 0.3% |
| Laos | 87 | 0.3% |
| Latin America | 1,057 | 3.8% |
| Mexico | 1,052 | 3.8% |
| Netherlands | 10 | 0.0% |
| Northern Europe | 82 | 0.3% |
| Norway | 6 | 0.0% |
| Oceania | 24 | 0.1% |
| Philippines | 123 | 0.4% |
| Portugal | 140 | 0.5% |
| Russia | 10 | 0.0% |
| South Central Asia | 44 | 0.2% |
| South Eastern Asia | 351 | 1.3% |
| Southern Europe | 183 | 0.7% |
| Sweden | 26 | 0.1% |
| Switzerland | 44 | 0.2% |
| Thailand | 49 | 0.2% |
| Vietnam | 92 | 0.3% |
| Western Asia | 23 | 0.1% |
| Western Europe | 97 | 0.4% | View All 41 Rows |
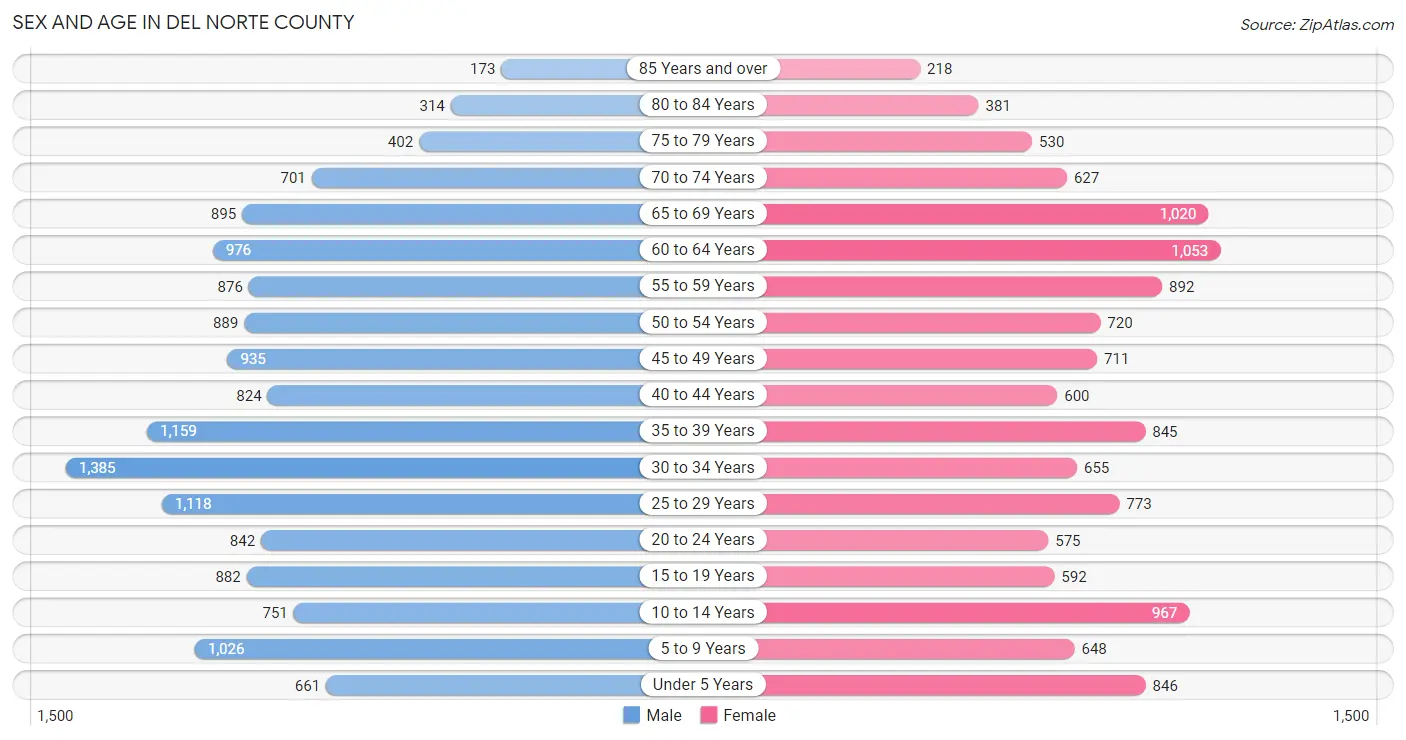
Sex and Age in Del Norte County
Sex and Age in Del Norte County
The most populous age groups in Del Norte County are 30 to 34 Years (1,385 | 9.3%) for men and 60 to 64 Years (1,053 | 8.3%) for women.
| Age Bracket | Male | Female |
| Under 5 Years | 661 (4.5%) | 846 (6.7%) |
| 5 to 9 Years | 1,026 (6.9%) | 648 (5.1%) |
| 10 to 14 Years | 751 (5.1%) | 967 (7.6%) |
| 15 to 19 Years | 882 (6.0%) | 592 (4.7%) |
| 20 to 24 Years | 842 (5.7%) | 575 (4.5%) |
| 25 to 29 Years | 1,118 (7.5%) | 773 (6.1%) |
| 30 to 34 Years | 1,385 (9.3%) | 655 (5.2%) |
| 35 to 39 Years | 1,159 (7.8%) | 845 (6.7%) |
| 40 to 44 Years | 824 (5.6%) | 600 (4.7%) |
| 45 to 49 Years | 935 (6.3%) | 711 (5.6%) |
| 50 to 54 Years | 889 (6.0%) | 720 (5.7%) |
| 55 to 59 Years | 876 (5.9%) | 892 (7.0%) |
| 60 to 64 Years | 976 (6.6%) | 1,053 (8.3%) |
| 65 to 69 Years | 895 (6.0%) | 1,020 (8.1%) |
| 70 to 74 Years | 701 (4.7%) | 627 (5.0%) |
| 75 to 79 Years | 402 (2.7%) | 530 (4.2%) |
| 80 to 84 Years | 314 (2.1%) | 381 (3.0%) |
| 85 Years and over | 173 (1.2%) | 218 (1.7%) |
| Total | 14,809 (100.0%) | 12,653 (100.0%) |
Families and Households in Del Norte County
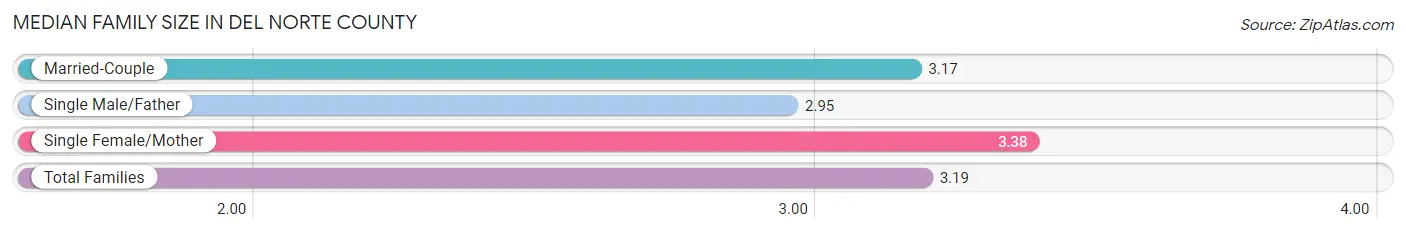
Median Family Size in Del Norte County
The median family size in Del Norte County is 3.19 persons per family, with single female/mother families (1,212 | 19.2%) accounting for the largest median family size of 3.38 persons per family. On the other hand, single male/father families (683 | 10.8%) represent the smallest median family size with 2.95 persons per family.
| Family Type | # Families | Family Size |
| Married-Couple | 4,425 (70.0%) | 3.17 |
| Single Male/Father | 683 (10.8%) | 2.95 |
| Single Female/Mother | 1,212 (19.2%) | 3.38 |
| Total Families | 6,320 (100.0%) | 3.19 |
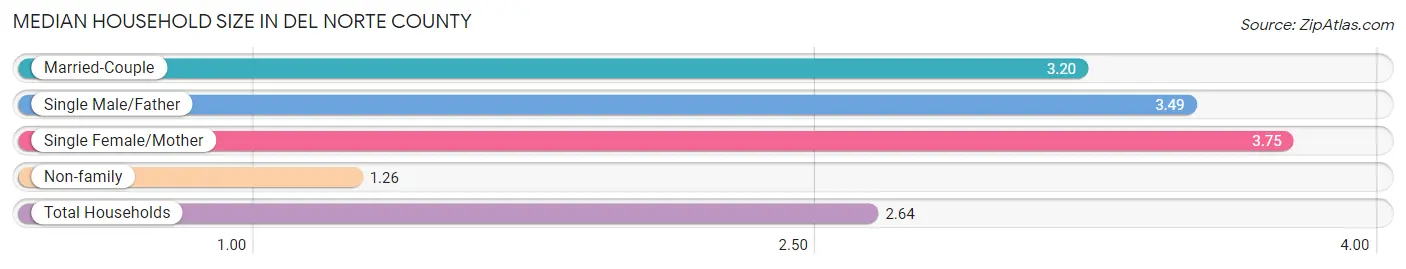
Median Household Size in Del Norte County
The median household size in Del Norte County is 2.64 persons per household, with single female/mother households (1,212 | 12.7%) accounting for the largest median household size of 3.75 persons per household. non-family households (3,210 | 33.7%) represent the smallest median household size with 1.26 persons per household.
| Household Type | # Households | Household Size |
| Married-Couple | 4,425 (46.4%) | 3.20 |
| Single Male/Father | 683 (7.2%) | 3.49 |
| Single Female/Mother | 1,212 (12.7%) | 3.75 |
| Non-family | 3,210 (33.7%) | 1.26 |
| Total Households | 9,530 (100.0%) | 2.64 |
Household Size by Marriage Status in Del Norte County
Out of a total of 9,530 households in Del Norte County, 6,320 (66.3%) are family households, while 3,210 (33.7%) are nonfamily households. The most numerous type of family households are 2-person households, comprising 2,919, and the most common type of nonfamily households are 1-person households, comprising 2,550.
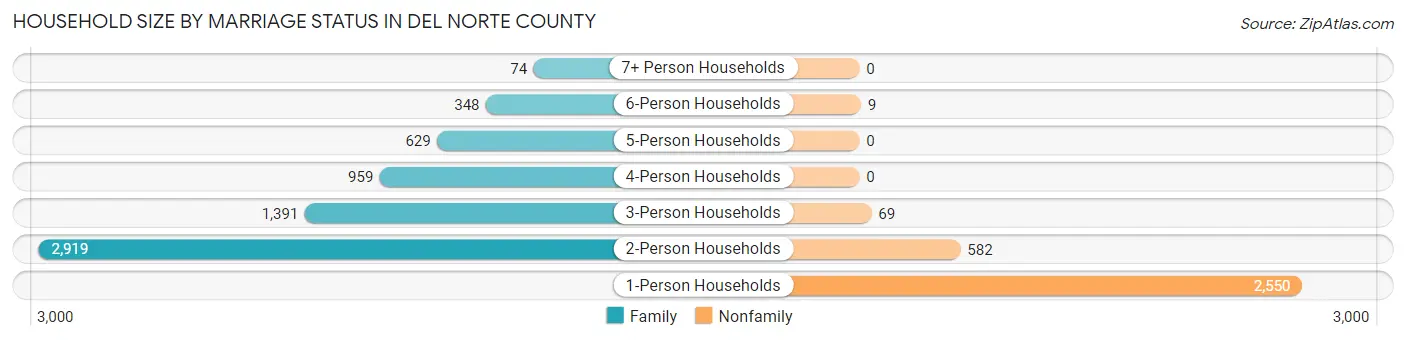
| Household Size | Family Households | Nonfamily Households |
| 1-Person Households | - | 2,550 (26.8%) |
| 2-Person Households | 2,919 (30.6%) | 582 (6.1%) |
| 3-Person Households | 1,391 (14.6%) | 69 (0.7%) |
| 4-Person Households | 959 (10.1%) | 0 (0.0%) |
| 5-Person Households | 629 (6.6%) | 0 (0.0%) |
| 6-Person Households | 348 (3.6%) | 9 (0.1%) |
| 7+ Person Households | 74 (0.8%) | 0 (0.0%) |
| Total | 6,320 (66.3%) | 3,210 (33.7%) |
Female Fertility in Del Norte County
Fertility by Age in Del Norte County
Average fertility rate in Del Norte County is 32.0 births per 1,000 women. Women in the age bracket of 15 to 19 years have the highest fertility rate with 69.0 births per 1,000 women. Women in the age bracket of 20 to 34 years acount for 52.2% of all women with births.
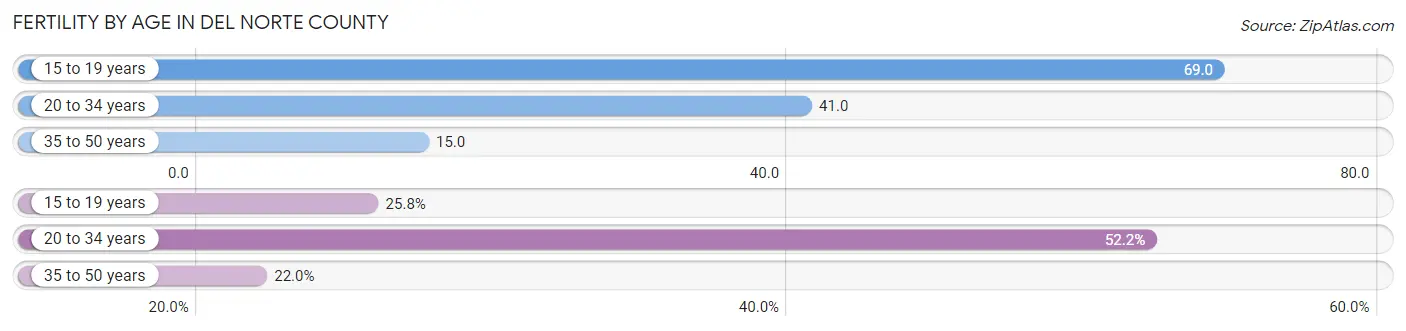
| Age Bracket | Women with Births | Births / 1,000 Women |
| 15 to 19 years | 41 (25.8%) | 69.0 |
| 20 to 34 years | 83 (52.2%) | 41.0 |
| 35 to 50 years | 35 (22.0%) | 15.0 |
| Total | 159 (100.0%) | 32.0 |
Fertility by Age by Marriage Status in Del Norte County
67.3% of women with births (159) in Del Norte County are married. The highest percentage of unmarried women with births falls into 15 to 19 years age bracket with 100.0% of them unmarried at the time of birth, while the lowest percentage of unmarried women with births belong to 35 to 50 years age bracket with 0.0% of them unmarried.
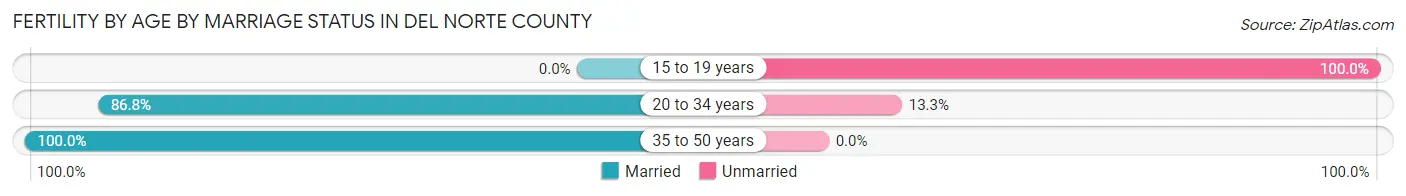
| Age Bracket | Married | Unmarried |
| 15 to 19 years | 0 (0.0%) | 41 (100.0%) |
| 20 to 34 years | 72 (86.8%) | 11 (13.3%) |
| 35 to 50 years | 35 (100.0%) | 0 (0.0%) |
| Total | 107 (67.3%) | 52 (32.7%) |
Fertility by Education in Del Norte County
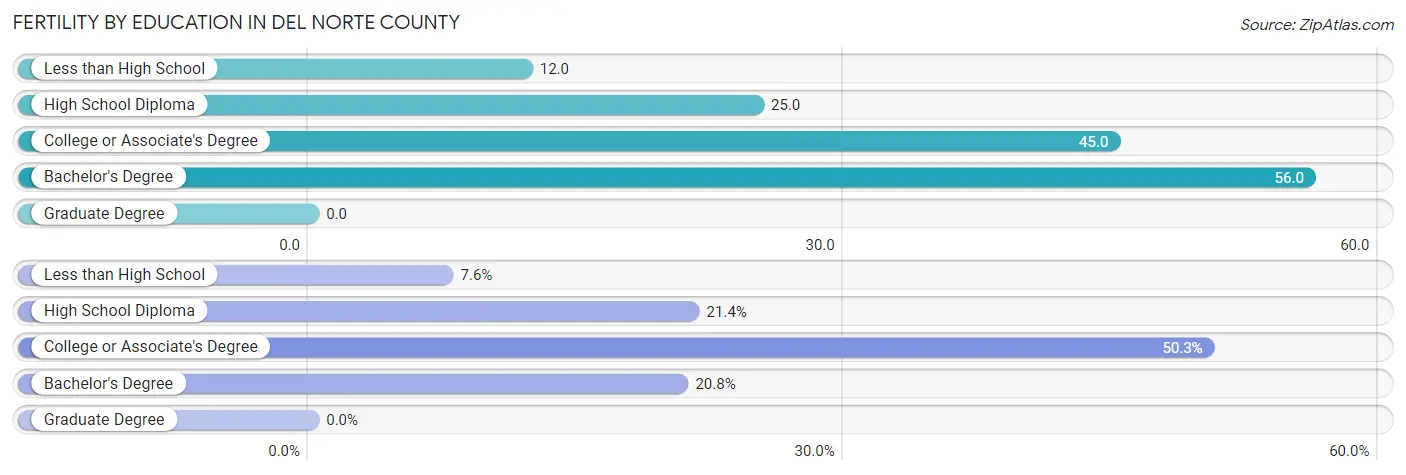
| Educational Attainment | Women with Births | Births / 1,000 Women |
| Less than High School | 12 (7.5%) | 12.0 |
| High School Diploma | 34 (21.4%) | 25.0 |
| College or Associate's Degree | 80 (50.3%) | 45.0 |
| Bachelor's Degree | 33 (20.7%) | 56.0 |
| Graduate Degree | 0 (0.0%) | 0.0 |
| Total | 159 (100.0%) | 32.0 |
Fertility by Education by Marriage Status in Del Norte County
32.7% of women with births in Del Norte County are unmarried. Women with the educational attainment of bachelor's degree are most likely to be married with 100.0% of them married at childbirth, while women with the educational attainment of less than high school are least likely to be married with 66.7% of them unmarried at childbirth.
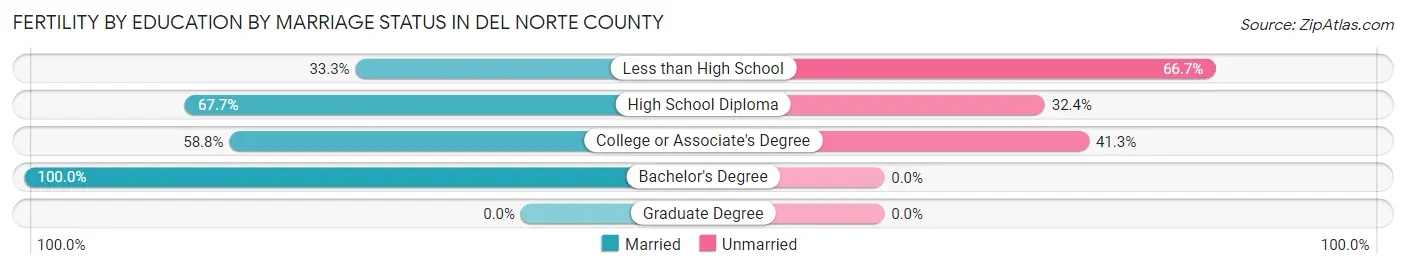
| Educational Attainment | Married | Unmarried |
| Less than High School | 4 (33.3%) | 8 (66.7%) |
| High School Diploma | 23 (67.6%) | 11 (32.4%) |
| College or Associate's Degree | 47 (58.8%) | 33 (41.2%) |
| Bachelor's Degree | 33 (100.0%) | 0 (0.0%) |
| Graduate Degree | 0 (0.0%) | 0 (0.0%) |
| Total | 107 (67.3%) | 52 (32.7%) |
Employment Characteristics in Del Norte County
Employment by Class of Employer in Del Norte County
Among the 9,607 employed individuals in Del Norte County, private company employees (4,599 | 47.9%), local government employees (1,363 | 14.2%), and self-employed (not incorporated) (1,098 | 11.4%) make up the most common classes of employment.
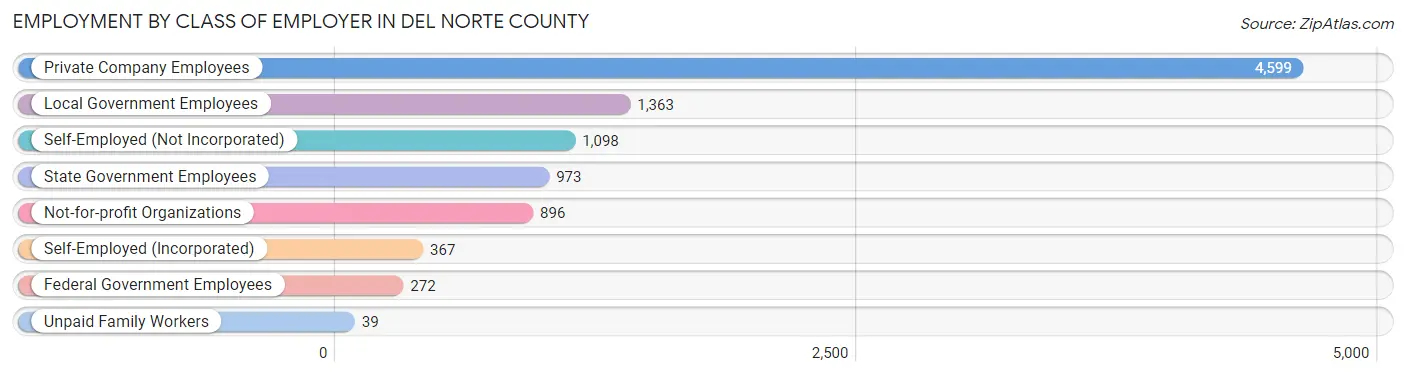
| Employer Class | # Employees | % Employees |
| Private Company Employees | 4,599 | 47.9% |
| Self-Employed (Incorporated) | 367 | 3.8% |
| Self-Employed (Not Incorporated) | 1,098 | 11.4% |
| Not-for-profit Organizations | 896 | 9.3% |
| Local Government Employees | 1,363 | 14.2% |
| State Government Employees | 973 | 10.1% |
| Federal Government Employees | 272 | 2.8% |
| Unpaid Family Workers | 39 | 0.4% |
| Total | 9,607 | 100.0% |
Employment Status by Age in Del Norte County
According to the labor force statistics for Del Norte County, out of the total population over 16 years of age (22,214), 47.6% or 10,574 individuals are in the labor force, with 6.3% or 666 of them unemployed. The age group with the highest labor force participation rate is 35 to 44 years, with 68.8% or 2,358 individuals in the labor force. Within the labor force, the 16 to 19 years age range has the highest percentage of unemployed individuals, with 12.3% or 61 of them being unemployed.
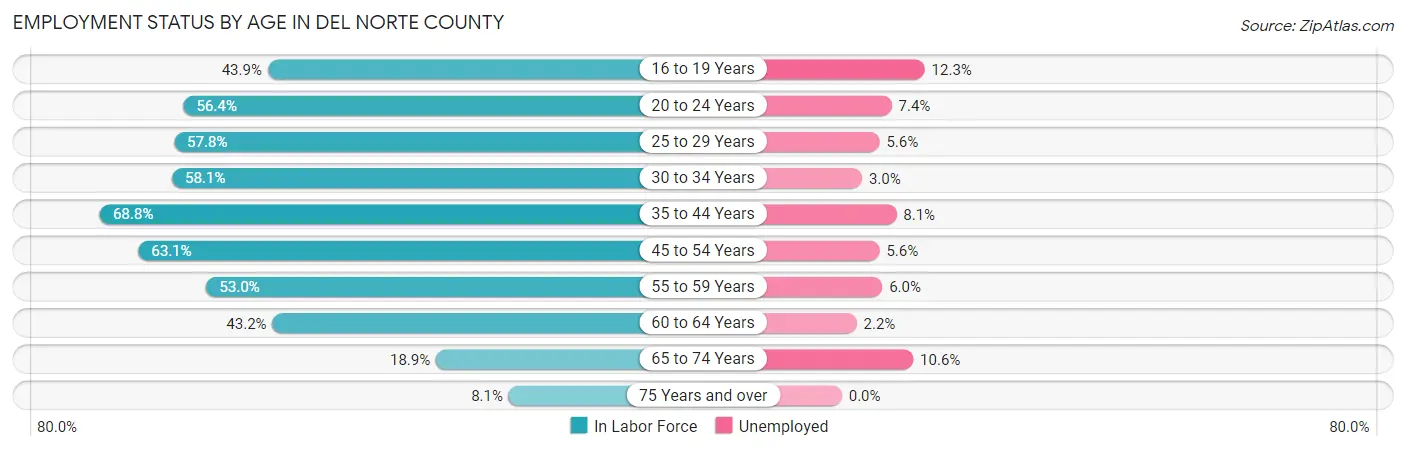
| Age Bracket | In Labor Force | Unemployed |
| 16 to 19 Years | 494 (43.9%) | 61 (12.3%) |
| 20 to 24 Years | 799 (56.4%) | 59 (7.4%) |
| 25 to 29 Years | 1,093 (57.8%) | 61 (5.6%) |
| 30 to 34 Years | 1,185 (58.1%) | 36 (3.0%) |
| 35 to 44 Years | 2,358 (68.8%) | 191 (8.1%) |
| 45 to 54 Years | 2,054 (63.1%) | 115 (5.6%) |
| 55 to 59 Years | 937 (53.0%) | 56 (6.0%) |
| 60 to 64 Years | 877 (43.2%) | 19 (2.2%) |
| 65 to 74 Years | 613 (18.9%) | 65 (10.6%) |
| 75 Years and over | 163 (8.1%) | 0 (0.0%) |
| Total | 10,574 (47.6%) | 666 (6.3%) |
Employment Status by Educational Attainment in Del Norte County
According to labor force statistics for Del Norte County, 59.0% of individuals (8,502) out of the total population between 25 and 64 years of age (14,411) are in the labor force, with 5.6% or 476 of them being unemployed. The group with the highest labor force participation rate are those with the educational attainment of bachelor's degree or higher, with 75.8% or 1,776 individuals in the labor force. Within the labor force, individuals with high school diploma education have the highest percentage of unemployment, with 7.8% or 190 of them being unemployed.
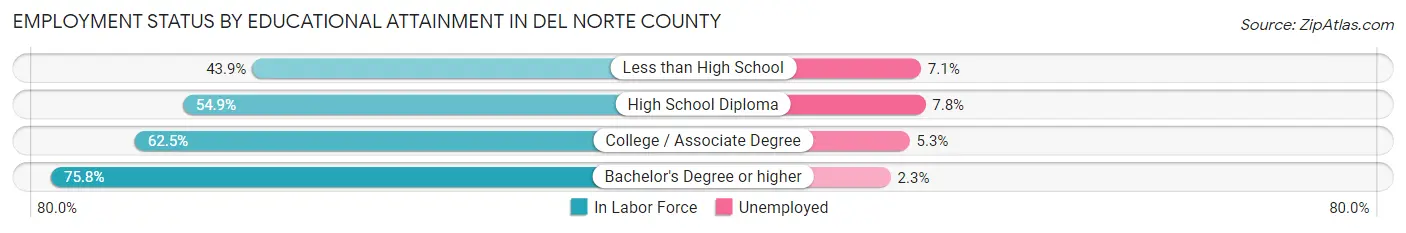
| Educational Attainment | In Labor Force | Unemployed |
| Less than High School | 1,126 (43.9%) | 182 (7.1%) |
| High School Diploma | 2,435 (54.9%) | 346 (7.8%) |
| College / Associate Degree | 3,168 (62.5%) | 269 (5.3%) |
| Bachelor's Degree or higher | 1,776 (75.8%) | 54 (2.3%) |
| Total | 8,502 (59.0%) | 807 (5.6%) |
Employment Occupations by Sex in Del Norte County
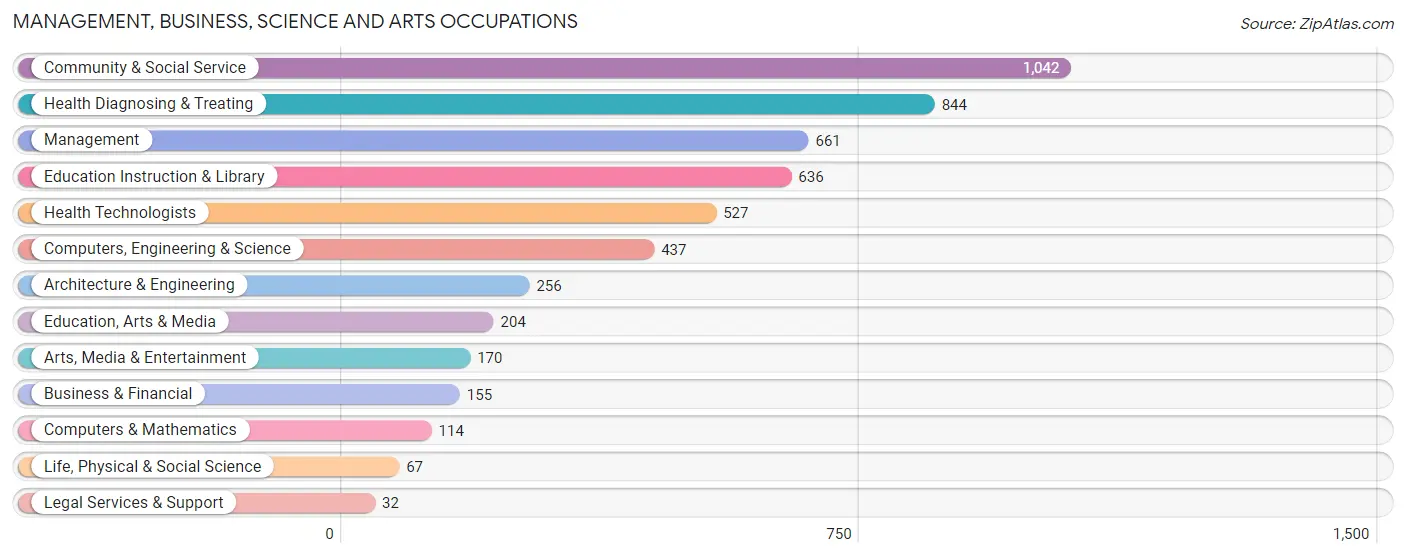
Management, Business, Science and Arts Occupations
The most common Management, Business, Science and Arts occupations in Del Norte County are Community & Social Service (1,042 | 10.5%), Health Diagnosing & Treating (844 | 8.5%), Management (661 | 6.7%), Education Instruction & Library (636 | 6.4%), and Health Technologists (527 | 5.3%).
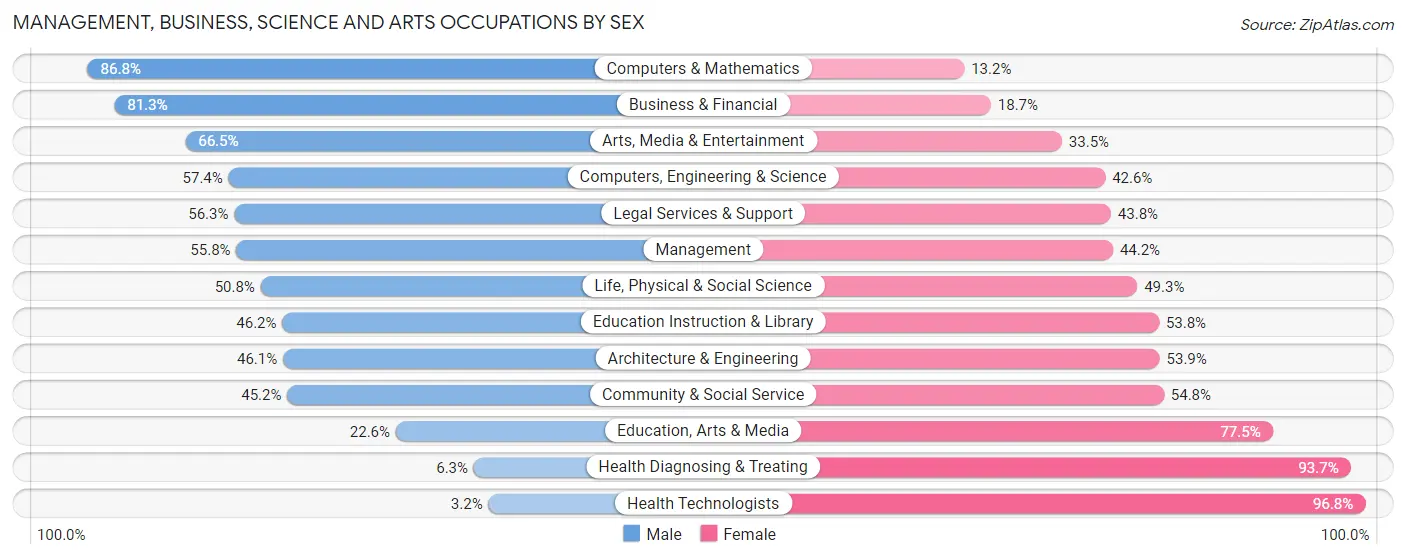
Management, Business, Science and Arts Occupations by Sex
Within the Management, Business, Science and Arts occupations in Del Norte County, the most male-oriented occupations are Computers & Mathematics (86.8%), Business & Financial (81.3%), and Arts, Media & Entertainment (66.5%), while the most female-oriented occupations are Health Technologists (96.8%), Health Diagnosing & Treating (93.7%), and Education, Arts & Media (77.4%).
| Occupation | Male | Female |
| Management | 369 (55.8%) | 292 (44.2%) |
| Business & Financial | 126 (81.3%) | 29 (18.7%) |
| Computers, Engineering & Science | 251 (57.4%) | 186 (42.6%) |
| Computers & Mathematics | 99 (86.8%) | 15 (13.2%) |
| Architecture & Engineering | 118 (46.1%) | 138 (53.9%) |
| Life, Physical & Social Science | 34 (50.7%) | 33 (49.2%) |
| Community & Social Service | 471 (45.2%) | 571 (54.8%) |
| Education, Arts & Media | 46 (22.6%) | 158 (77.4%) |
| Legal Services & Support | 18 (56.2%) | 14 (43.8%) |
| Education Instruction & Library | 294 (46.2%) | 342 (53.8%) |
| Arts, Media & Entertainment | 113 (66.5%) | 57 (33.5%) |
| Health Diagnosing & Treating | 53 (6.3%) | 791 (93.7%) |
| Health Technologists | 17 (3.2%) | 510 (96.8%) |
| Total (Category) | 1,270 (40.5%) | 1,869 (59.5%) |
| Total (Overall) | 5,324 (53.7%) | 4,588 (46.3%) |
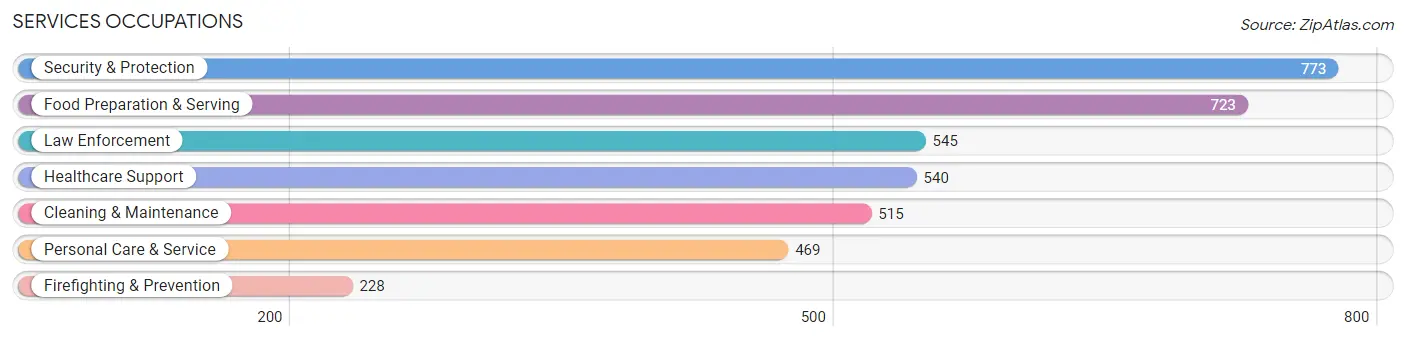
Services Occupations
The most common Services occupations in Del Norte County are Security & Protection (773 | 7.8%), Food Preparation & Serving (723 | 7.3%), Law Enforcement (545 | 5.5%), Healthcare Support (540 | 5.4%), and Cleaning & Maintenance (515 | 5.2%).
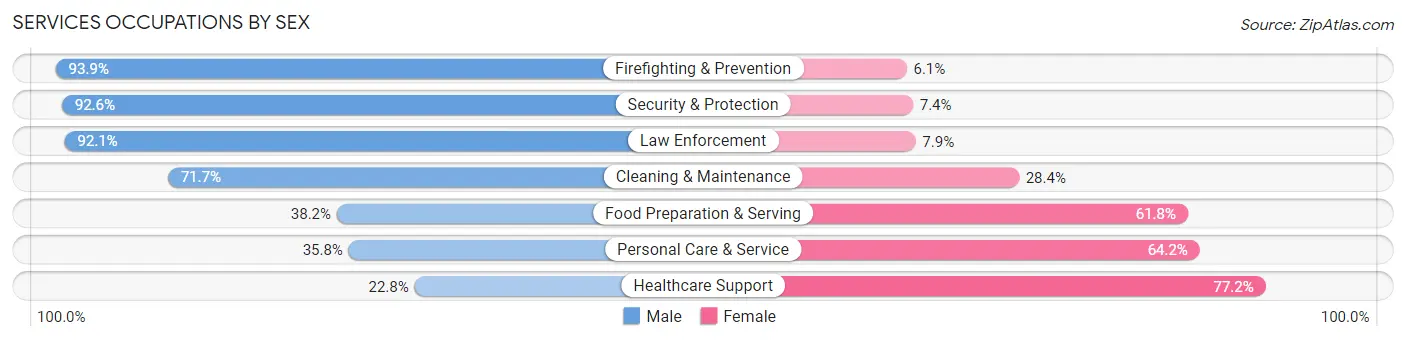
Services Occupations by Sex
Within the Services occupations in Del Norte County, the most male-oriented occupations are Firefighting & Prevention (93.9%), Security & Protection (92.6%), and Law Enforcement (92.1%), while the most female-oriented occupations are Healthcare Support (77.2%), Personal Care & Service (64.2%), and Food Preparation & Serving (61.8%).
| Occupation | Male | Female |
| Healthcare Support | 123 (22.8%) | 417 (77.2%) |
| Security & Protection | 716 (92.6%) | 57 (7.4%) |
| Firefighting & Prevention | 214 (93.9%) | 14 (6.1%) |
| Law Enforcement | 502 (92.1%) | 43 (7.9%) |
| Food Preparation & Serving | 276 (38.2%) | 447 (61.8%) |
| Cleaning & Maintenance | 369 (71.7%) | 146 (28.3%) |
| Personal Care & Service | 168 (35.8%) | 301 (64.2%) |
| Total (Category) | 1,652 (54.7%) | 1,368 (45.3%) |
| Total (Overall) | 5,324 (53.7%) | 4,588 (46.3%) |
Sales and Office Occupations
The most common Sales and Office occupations in Del Norte County are Office & Administration (1,011 | 10.2%), and Sales & Related (804 | 8.1%).

Sales and Office Occupations by Sex

| Occupation | Male | Female |
| Sales & Related | 362 (45.0%) | 442 (55.0%) |
| Office & Administration | 194 (19.2%) | 817 (80.8%) |
| Total (Category) | 556 (30.6%) | 1,259 (69.4%) |
| Total (Overall) | 5,324 (53.7%) | 4,588 (46.3%) |
Natural Resources, Construction and Maintenance Occupations
The most common Natural Resources, Construction and Maintenance occupations in Del Norte County are Construction & Extraction (463 | 4.7%), Installation, Maintenance & Repair (341 | 3.4%), and Farming, Fishing & Forestry (304 | 3.1%).

Natural Resources, Construction and Maintenance Occupations by Sex

| Occupation | Male | Female |
| Farming, Fishing & Forestry | 304 (100.0%) | 0 (0.0%) |
| Construction & Extraction | 435 (94.0%) | 28 (6.0%) |
| Installation, Maintenance & Repair | 341 (100.0%) | 0 (0.0%) |
| Total (Category) | 1,080 (97.5%) | 28 (2.5%) |
| Total (Overall) | 5,324 (53.7%) | 4,588 (46.3%) |
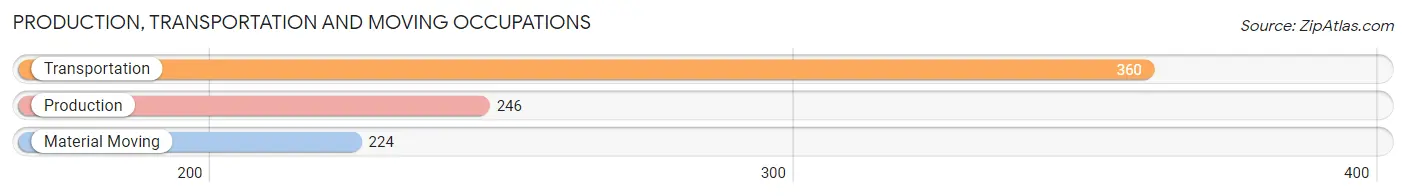
Production, Transportation and Moving Occupations
The most common Production, Transportation and Moving occupations in Del Norte County are Transportation (360 | 3.6%), Production (246 | 2.5%), and Material Moving (224 | 2.3%).
Production, Transportation and Moving Occupations by Sex

| Occupation | Male | Female |
| Production | 214 (87.0%) | 32 (13.0%) |
| Transportation | 360 (100.0%) | 0 (0.0%) |
| Material Moving | 192 (85.7%) | 32 (14.3%) |
| Total (Category) | 766 (92.3%) | 64 (7.7%) |
| Total (Overall) | 5,324 (53.7%) | 4,588 (46.3%) |
Employment Industries by Sex in Del Norte County
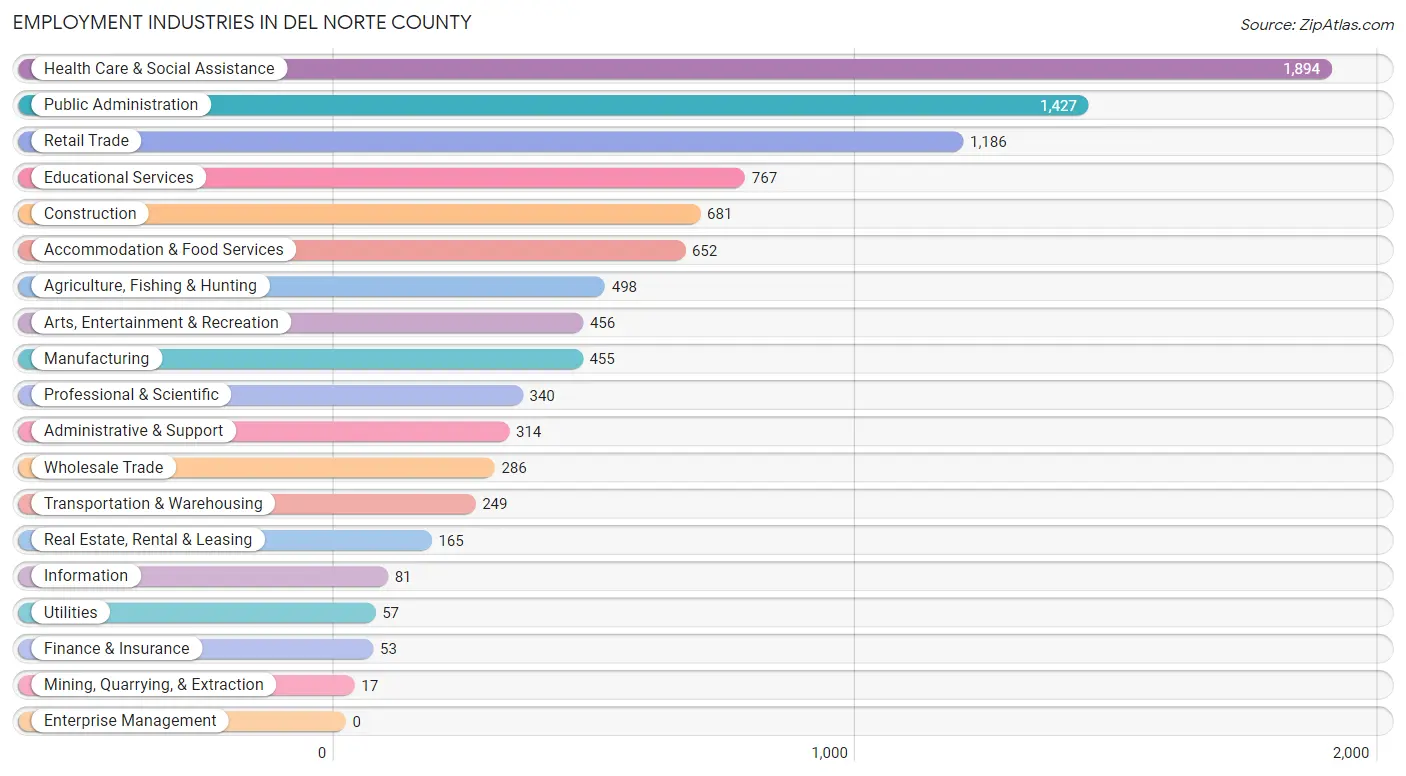
Employment Industries in Del Norte County
The major employment industries in Del Norte County include Health Care & Social Assistance (1,894 | 19.1%), Public Administration (1,427 | 14.4%), Retail Trade (1,186 | 12.0%), Educational Services (767 | 7.7%), and Construction (681 | 6.9%).
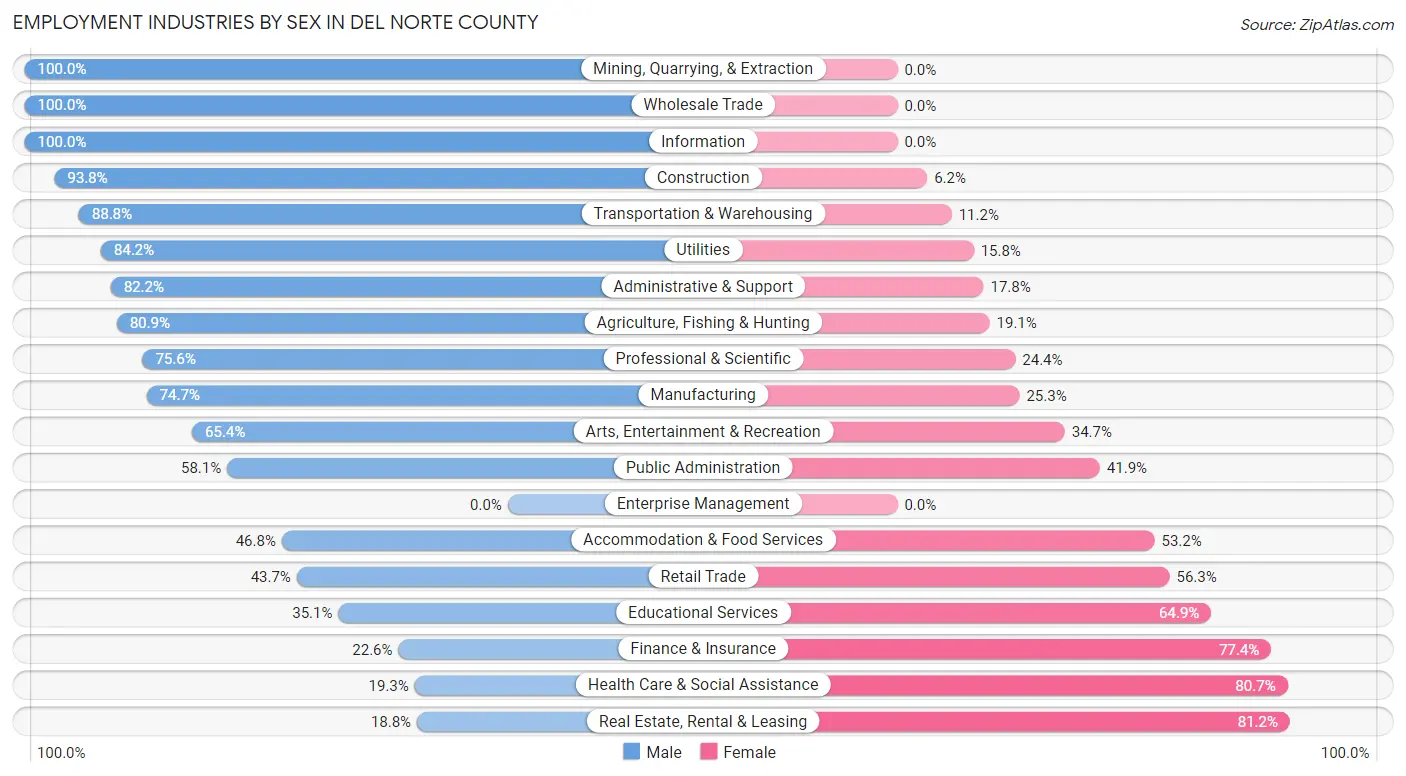
Employment Industries by Sex in Del Norte County
The Del Norte County industries that see more men than women are Mining, Quarrying, & Extraction (100.0%), Wholesale Trade (100.0%), and Information (100.0%), whereas the industries that tend to have a higher number of women are Real Estate, Rental & Leasing (81.2%), Health Care & Social Assistance (80.7%), and Finance & Insurance (77.4%).
| Industry | Male | Female |
| Agriculture, Fishing & Hunting | 403 (80.9%) | 95 (19.1%) |
| Mining, Quarrying, & Extraction | 17 (100.0%) | 0 (0.0%) |
| Construction | 639 (93.8%) | 42 (6.2%) |
| Manufacturing | 340 (74.7%) | 115 (25.3%) |
| Wholesale Trade | 286 (100.0%) | 0 (0.0%) |
| Retail Trade | 518 (43.7%) | 668 (56.3%) |
| Transportation & Warehousing | 221 (88.8%) | 28 (11.2%) |
| Utilities | 48 (84.2%) | 9 (15.8%) |
| Information | 81 (100.0%) | 0 (0.0%) |
| Finance & Insurance | 12 (22.6%) | 41 (77.4%) |
| Real Estate, Rental & Leasing | 31 (18.8%) | 134 (81.2%) |
| Professional & Scientific | 257 (75.6%) | 83 (24.4%) |
| Enterprise Management | 0 (0.0%) | 0 (0.0%) |
| Administrative & Support | 258 (82.2%) | 56 (17.8%) |
| Educational Services | 269 (35.1%) | 498 (64.9%) |
| Health Care & Social Assistance | 365 (19.3%) | 1,529 (80.7%) |
| Arts, Entertainment & Recreation | 298 (65.3%) | 158 (34.6%) |
| Accommodation & Food Services | 305 (46.8%) | 347 (53.2%) |
| Public Administration | 829 (58.1%) | 598 (41.9%) |
| Total | 5,324 (53.7%) | 4,588 (46.3%) |
Education in Del Norte County
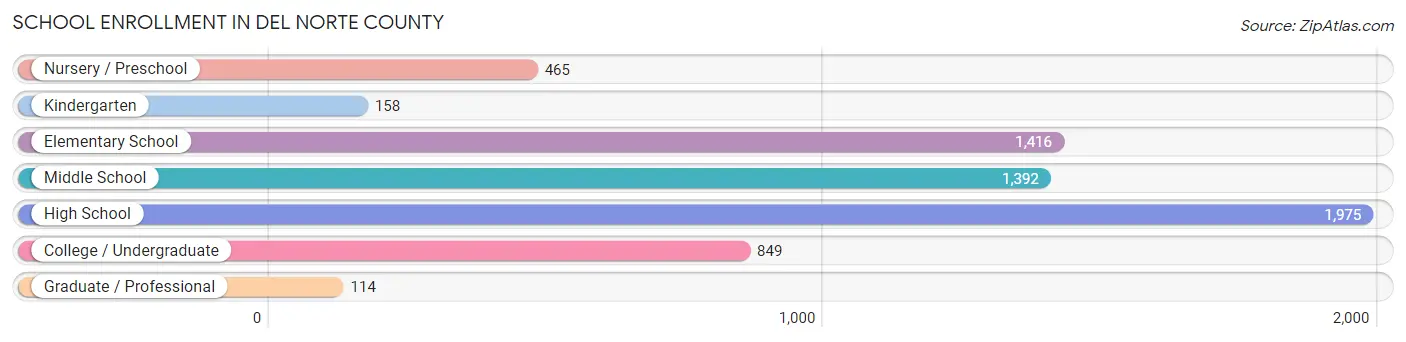
School Enrollment in Del Norte County
The most common levels of schooling among the 6,369 students in Del Norte County are high school (1,975 | 31.0%), elementary school (1,416 | 22.2%), and middle school (1,392 | 21.9%).
| School Level | # Students | % Students |
| Nursery / Preschool | 465 | 7.3% |
| Kindergarten | 158 | 2.5% |
| Elementary School | 1,416 | 22.2% |
| Middle School | 1,392 | 21.9% |
| High School | 1,975 | 31.0% |
| College / Undergraduate | 849 | 13.3% |
| Graduate / Professional | 114 | 1.8% |
| Total | 6,369 | 100.0% |
School Enrollment by Age by Funding Source in Del Norte County
Out of a total of 6,369 students who are enrolled in schools in Del Norte County, 974 (15.3%) attend a private institution, while the remaining 5,395 (84.7%) are enrolled in public schools. The age group of 3 to 4 year olds has the highest likelihood of being enrolled in private schools, with 153 (39.0% in the age bracket) enrolled. Conversely, the age group of 15 to 17 year olds has the lowest likelihood of being enrolled in a private school, with 780 (90.5% in the age bracket) attending a public institution.
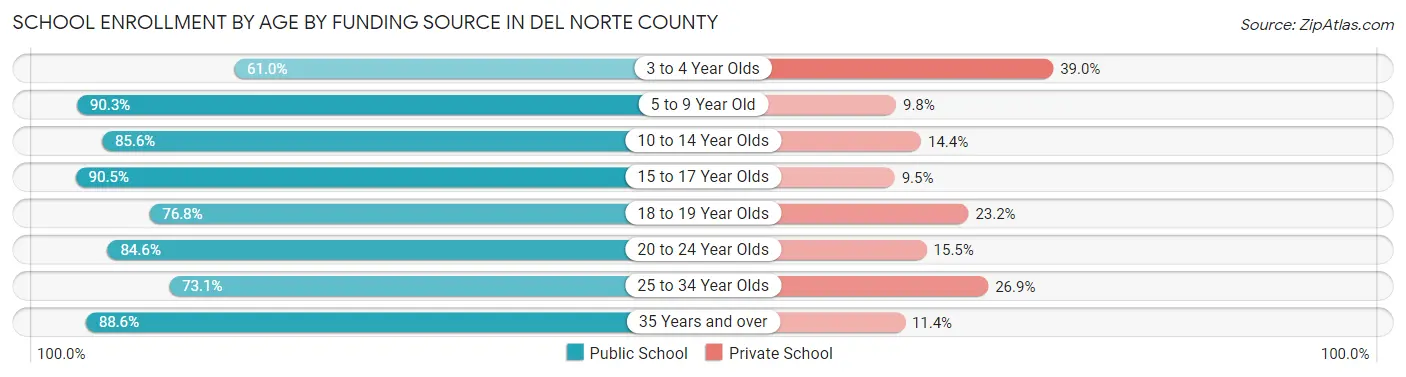
| Age Bracket | Public School | Private School |
| 3 to 4 Year Olds | 239 (61.0%) | 153 (39.0%) |
| 5 to 9 Year Old | 1,463 (90.2%) | 158 (9.8%) |
| 10 to 14 Year Olds | 1,449 (85.6%) | 244 (14.4%) |
| 15 to 17 Year Olds | 780 (90.5%) | 82 (9.5%) |
| 18 to 19 Year Olds | 294 (76.8%) | 89 (23.2%) |
| 20 to 24 Year Olds | 312 (84.6%) | 57 (15.4%) |
| 25 to 34 Year Olds | 331 (73.1%) | 122 (26.9%) |
| 35 Years and over | 528 (88.6%) | 68 (11.4%) |
| Total | 5,395 (84.7%) | 974 (15.3%) |
Educational Attainment by Field of Study in Del Norte County
Education (590 | 14.9%), social sciences (498 | 12.6%), business (477 | 12.0%), engineering (364 | 9.2%), and bio, nature & agricultural (330 | 8.3%) are the most common fields of study among 3,957 individuals in Del Norte County who have obtained a bachelor's degree or higher.
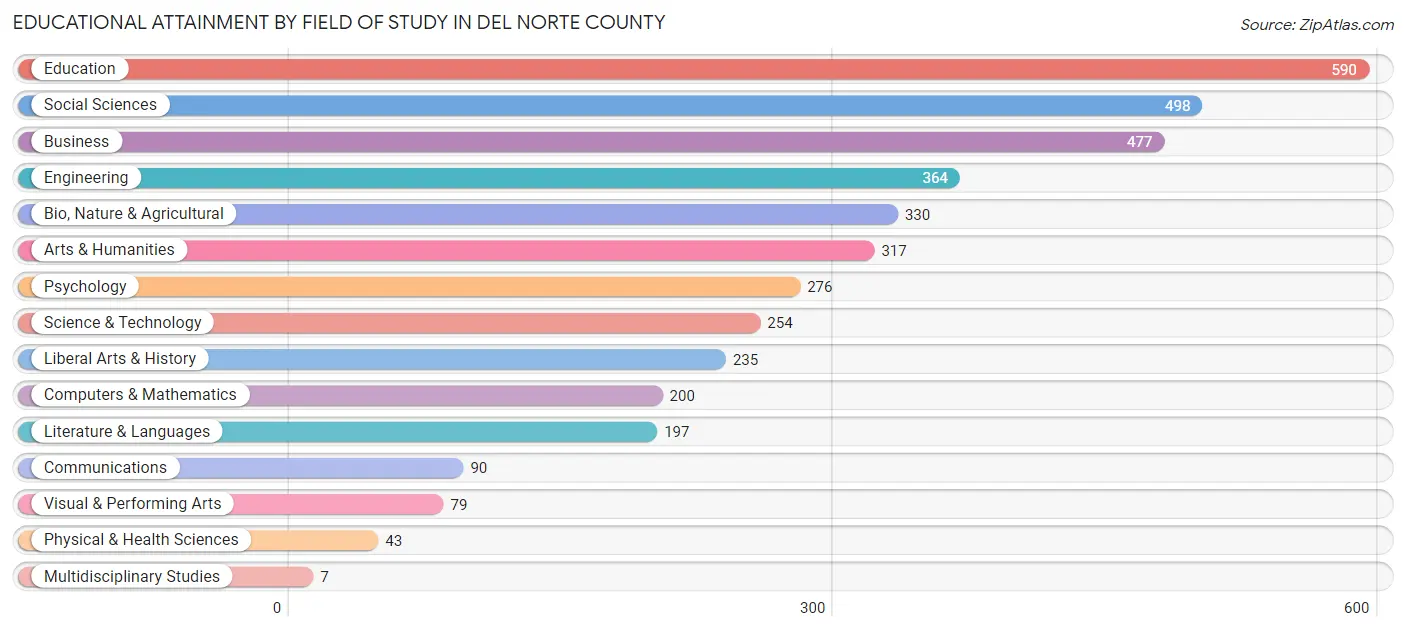
| Field of Study | # Graduates | % Graduates |
| Computers & Mathematics | 200 | 5.1% |
| Bio, Nature & Agricultural | 330 | 8.3% |
| Physical & Health Sciences | 43 | 1.1% |
| Psychology | 276 | 7.0% |
| Social Sciences | 498 | 12.6% |
| Engineering | 364 | 9.2% |
| Multidisciplinary Studies | 7 | 0.2% |
| Science & Technology | 254 | 6.4% |
| Business | 477 | 12.0% |
| Education | 590 | 14.9% |
| Literature & Languages | 197 | 5.0% |
| Liberal Arts & History | 235 | 5.9% |
| Visual & Performing Arts | 79 | 2.0% |
| Communications | 90 | 2.3% |
| Arts & Humanities | 317 | 8.0% |
| Total | 3,957 | 100.0% |
Transportation & Commute in Del Norte County
Vehicle Availability by Sex in Del Norte County
The most prevalent vehicle ownership categories in Del Norte County are males with 2 vehicles (2,386, accounting for 45.8%) and females with 2 vehicles (1,680, making up 54.2%).
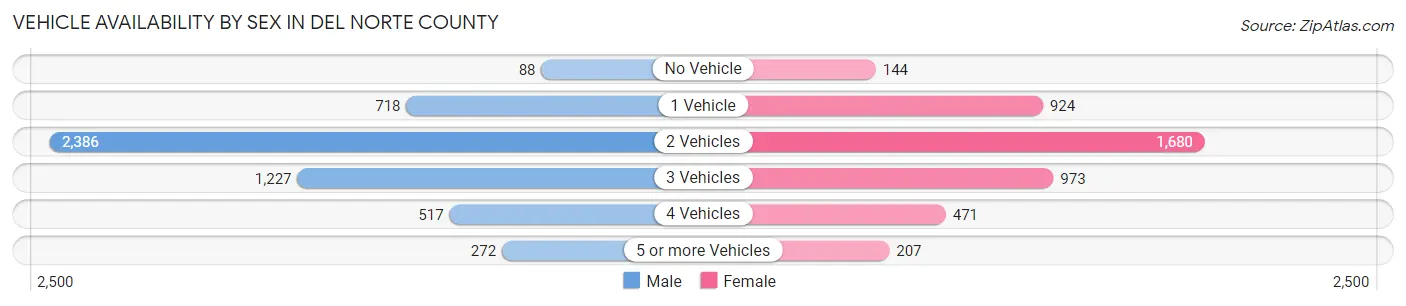
| Vehicles Available | Male | Female |
| No Vehicle | 88 (1.7%) | 144 (3.3%) |
| 1 Vehicle | 718 (13.8%) | 924 (21.0%) |
| 2 Vehicles | 2,386 (45.8%) | 1,680 (38.2%) |
| 3 Vehicles | 1,227 (23.6%) | 973 (22.1%) |
| 4 Vehicles | 517 (9.9%) | 471 (10.7%) |
| 5 or more Vehicles | 272 (5.2%) | 207 (4.7%) |
| Total | 5,208 (100.0%) | 4,399 (100.0%) |
Commute Time in Del Norte County
The most frequently occuring commute durations in Del Norte County are 5 to 9 minutes (2,571 commuters, 28.7%), 10 to 14 minutes (2,072 commuters, 23.2%), and 15 to 19 minutes (1,069 commuters, 11.9%).
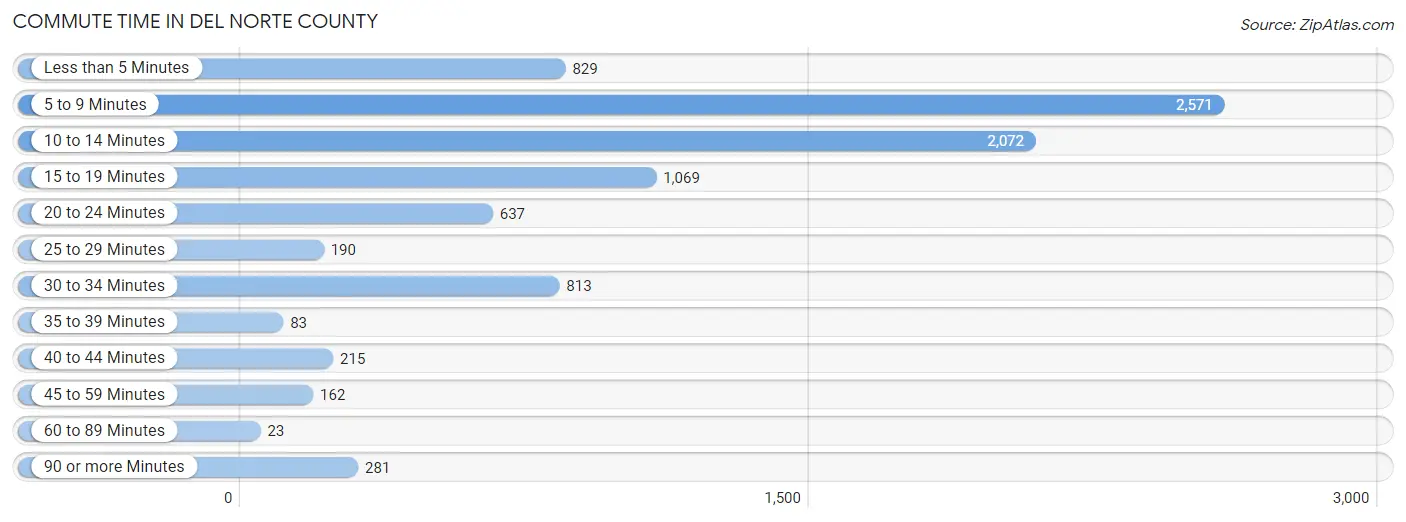
| Commute Time | # Commuters | % Commuters |
| Less than 5 Minutes | 829 | 9.3% |
| 5 to 9 Minutes | 2,571 | 28.7% |
| 10 to 14 Minutes | 2,072 | 23.2% |
| 15 to 19 Minutes | 1,069 | 11.9% |
| 20 to 24 Minutes | 637 | 7.1% |
| 25 to 29 Minutes | 190 | 2.1% |
| 30 to 34 Minutes | 813 | 9.1% |
| 35 to 39 Minutes | 83 | 0.9% |
| 40 to 44 Minutes | 215 | 2.4% |
| 45 to 59 Minutes | 162 | 1.8% |
| 60 to 89 Minutes | 23 | 0.3% |
| 90 or more Minutes | 281 | 3.1% |
Commute Time by Sex in Del Norte County
The most common commute times in Del Norte County are 5 to 9 minutes (1,130 commuters, 22.9%) for males and 5 to 9 minutes (1,441 commuters, 35.8%) for females.
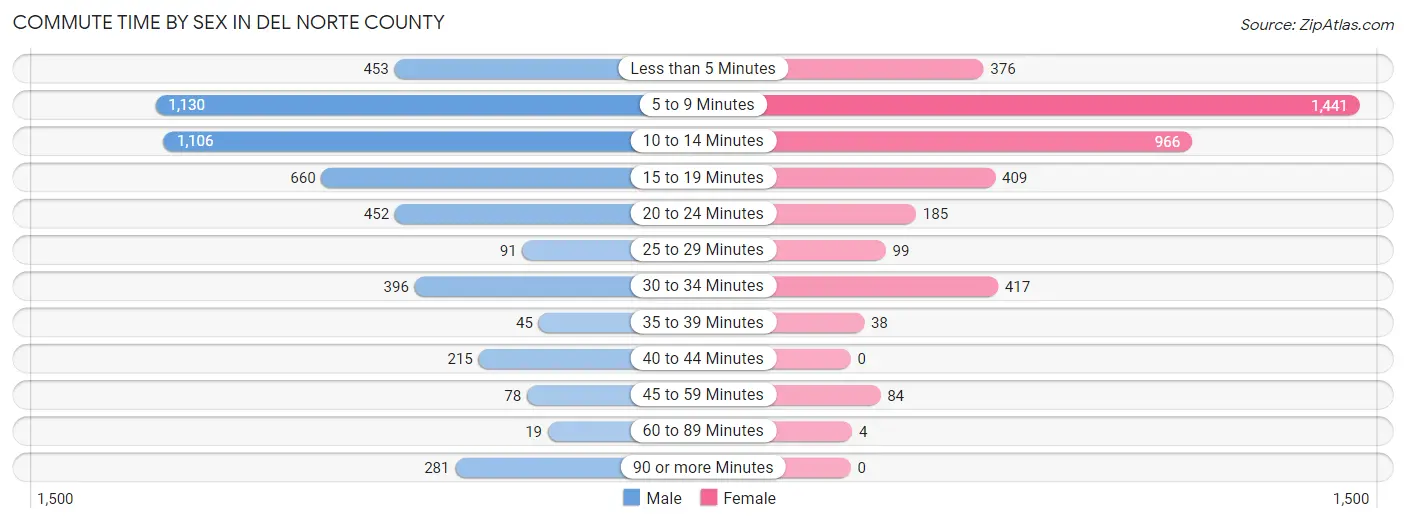
| Commute Time | Male | Female |
| Less than 5 Minutes | 453 (9.2%) | 376 (9.4%) |
| 5 to 9 Minutes | 1,130 (22.9%) | 1,441 (35.8%) |
| 10 to 14 Minutes | 1,106 (22.5%) | 966 (24.0%) |
| 15 to 19 Minutes | 660 (13.4%) | 409 (10.2%) |
| 20 to 24 Minutes | 452 (9.2%) | 185 (4.6%) |
| 25 to 29 Minutes | 91 (1.8%) | 99 (2.5%) |
| 30 to 34 Minutes | 396 (8.0%) | 417 (10.4%) |
| 35 to 39 Minutes | 45 (0.9%) | 38 (0.9%) |
| 40 to 44 Minutes | 215 (4.4%) | 0 (0.0%) |
| 45 to 59 Minutes | 78 (1.6%) | 84 (2.1%) |
| 60 to 89 Minutes | 19 (0.4%) | 4 (0.1%) |
| 90 or more Minutes | 281 (5.7%) | 0 (0.0%) |
Time of Departure to Work by Sex in Del Norte County
The most frequent times of departure to work in Del Norte County are 6:30 AM to 6:59 AM (622, 12.6%) for males and 7:30 AM to 7:59 AM (1,024, 25.5%) for females.
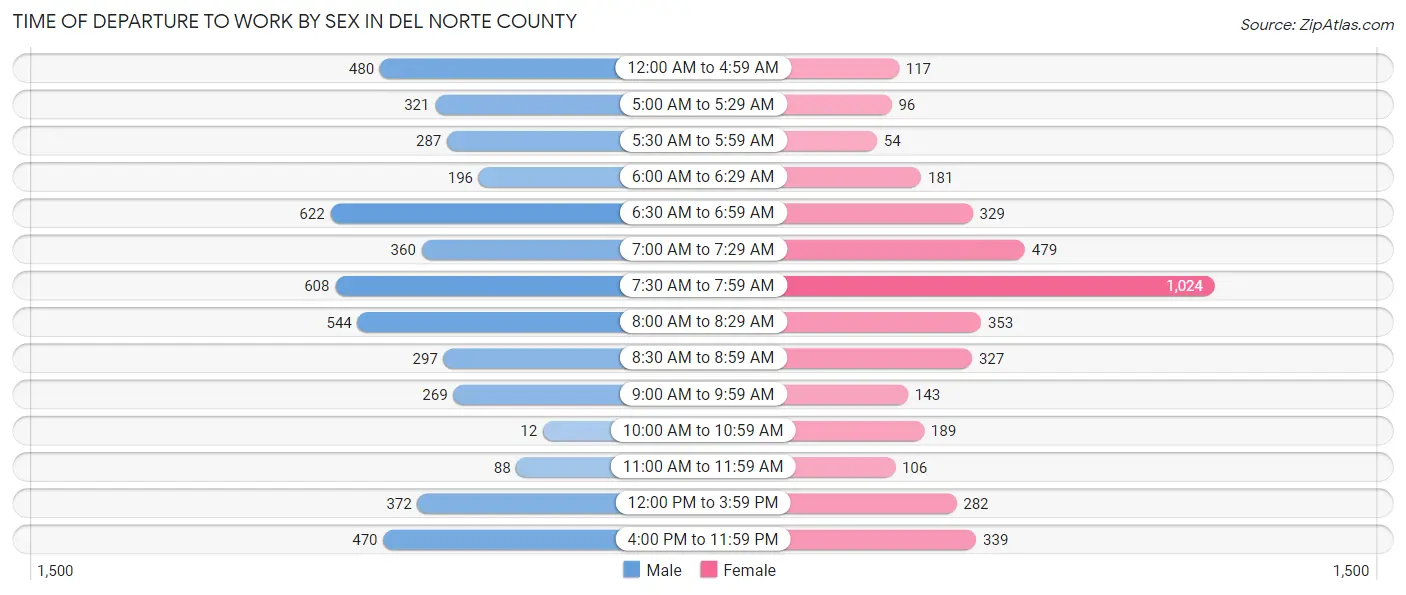
| Time of Departure | Male | Female |
| 12:00 AM to 4:59 AM | 480 (9.7%) | 117 (2.9%) |
| 5:00 AM to 5:29 AM | 321 (6.5%) | 96 (2.4%) |
| 5:30 AM to 5:59 AM | 287 (5.8%) | 54 (1.3%) |
| 6:00 AM to 6:29 AM | 196 (4.0%) | 181 (4.5%) |
| 6:30 AM to 6:59 AM | 622 (12.6%) | 329 (8.2%) |
| 7:00 AM to 7:29 AM | 360 (7.3%) | 479 (11.9%) |
| 7:30 AM to 7:59 AM | 608 (12.3%) | 1,024 (25.5%) |
| 8:00 AM to 8:29 AM | 544 (11.0%) | 353 (8.8%) |
| 8:30 AM to 8:59 AM | 297 (6.0%) | 327 (8.1%) |
| 9:00 AM to 9:59 AM | 269 (5.5%) | 143 (3.6%) |
| 10:00 AM to 10:59 AM | 12 (0.2%) | 189 (4.7%) |
| 11:00 AM to 11:59 AM | 88 (1.8%) | 106 (2.6%) |
| 12:00 PM to 3:59 PM | 372 (7.5%) | 282 (7.0%) |
| 4:00 PM to 11:59 PM | 470 (9.5%) | 339 (8.4%) |
| Total | 4,926 (100.0%) | 4,019 (100.0%) |
Housing Occupancy in Del Norte County
Occupancy by Ownership in Del Norte County
Of the total 9,530 dwellings in Del Norte County, owner-occupied units account for 6,492 (68.1%), while renter-occupied units make up 3,038 (31.9%).
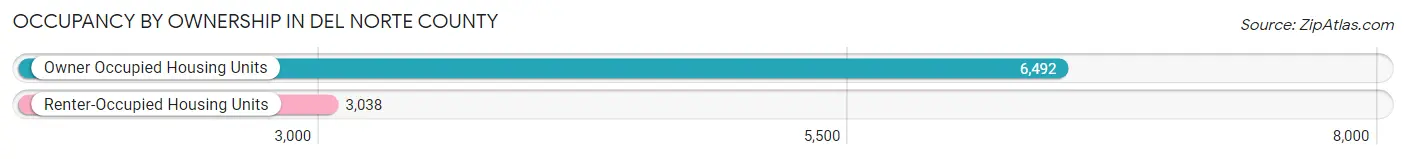
| Occupancy | # Housing Units | % Housing Units |
| Owner Occupied Housing Units | 6,492 | 68.1% |
| Renter-Occupied Housing Units | 3,038 | 31.9% |
| Total Occupied Housing Units | 9,530 | 100.0% |
Occupancy by Household Size in Del Norte County
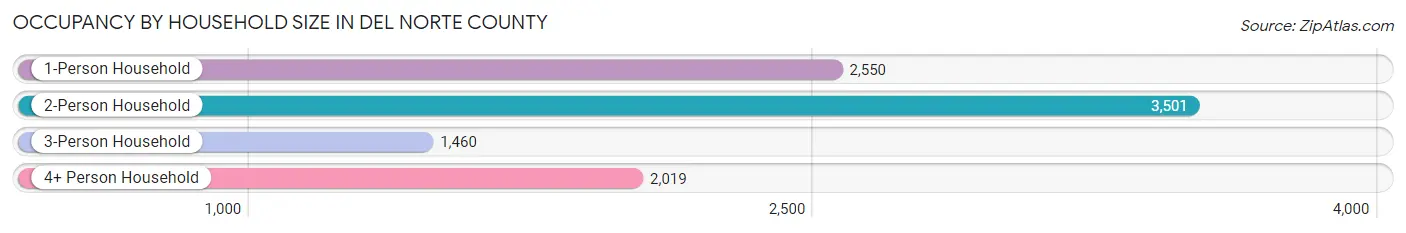
| Household Size | # Housing Units | % Housing Units |
| 1-Person Household | 2,550 | 26.8% |
| 2-Person Household | 3,501 | 36.7% |
| 3-Person Household | 1,460 | 15.3% |
| 4+ Person Household | 2,019 | 21.2% |
| Total Housing Units | 9,530 | 100.0% |
Occupancy by Ownership by Household Size in Del Norte County
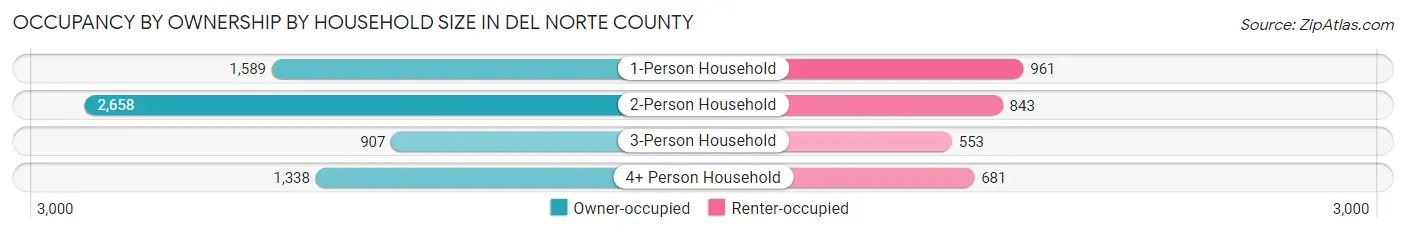
| Household Size | Owner-occupied | Renter-occupied |
| 1-Person Household | 1,589 (62.3%) | 961 (37.7%) |
| 2-Person Household | 2,658 (75.9%) | 843 (24.1%) |
| 3-Person Household | 907 (62.1%) | 553 (37.9%) |
| 4+ Person Household | 1,338 (66.3%) | 681 (33.7%) |
| Total Housing Units | 6,492 (68.1%) | 3,038 (31.9%) |
Occupancy by Educational Attainment in Del Norte County
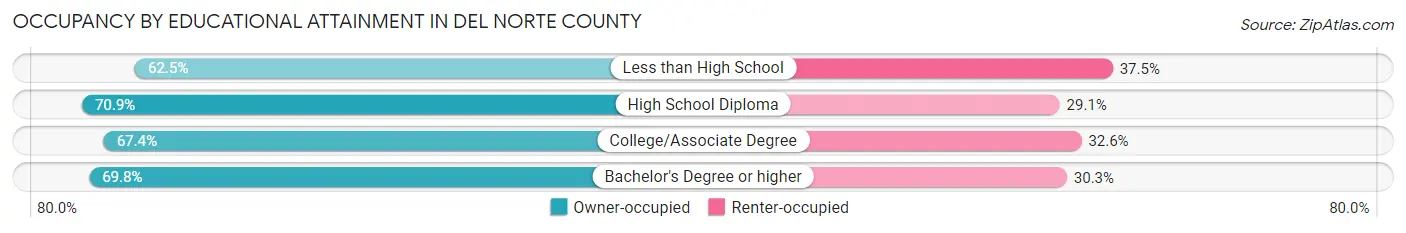
| Household Size | Owner-occupied | Renter-occupied |
| Less than High School | 751 (62.5%) | 451 (37.5%) |
| High School Diploma | 1,430 (70.9%) | 587 (29.1%) |
| College/Associate Degree | 2,660 (67.4%) | 1,284 (32.6%) |
| Bachelor's Degree or higher | 1,651 (69.8%) | 716 (30.2%) |
Occupancy by Age of Householder in Del Norte County
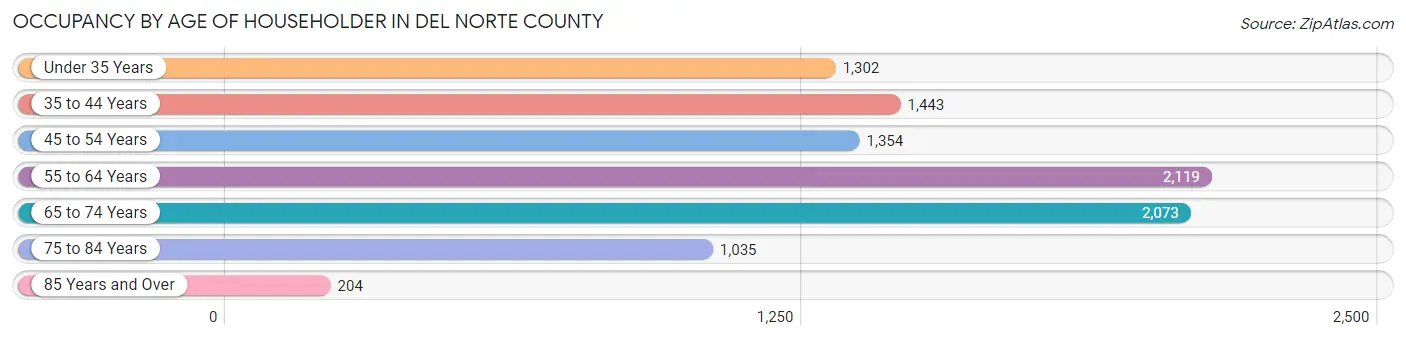
| Age Bracket | # Households | % Households |
| Under 35 Years | 1,302 | 13.7% |
| 35 to 44 Years | 1,443 | 15.1% |
| 45 to 54 Years | 1,354 | 14.2% |
| 55 to 64 Years | 2,119 | 22.2% |
| 65 to 74 Years | 2,073 | 21.7% |
| 75 to 84 Years | 1,035 | 10.9% |
| 85 Years and Over | 204 | 2.1% |
| Total | 9,530 | 100.0% |
Housing Finances in Del Norte County
Median Income by Occupancy in Del Norte County
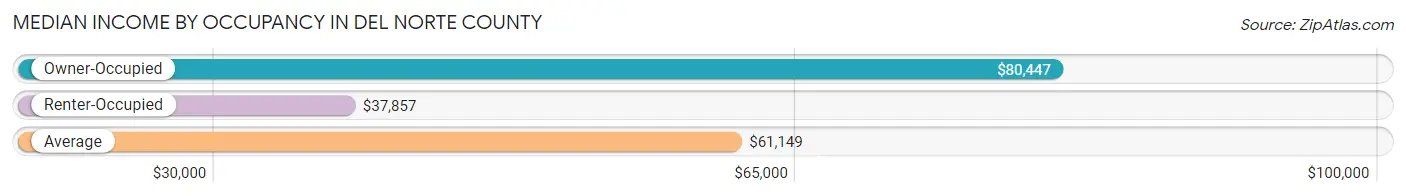
| Occupancy Type | # Households | Median Income |
| Owner-Occupied | 6,492 (68.1%) | $80,447 |
| Renter-Occupied | 3,038 (31.9%) | $37,857 |
| Average | 9,530 (100.0%) | $61,149 |
Occupancy by Householder Income Bracket in Del Norte County
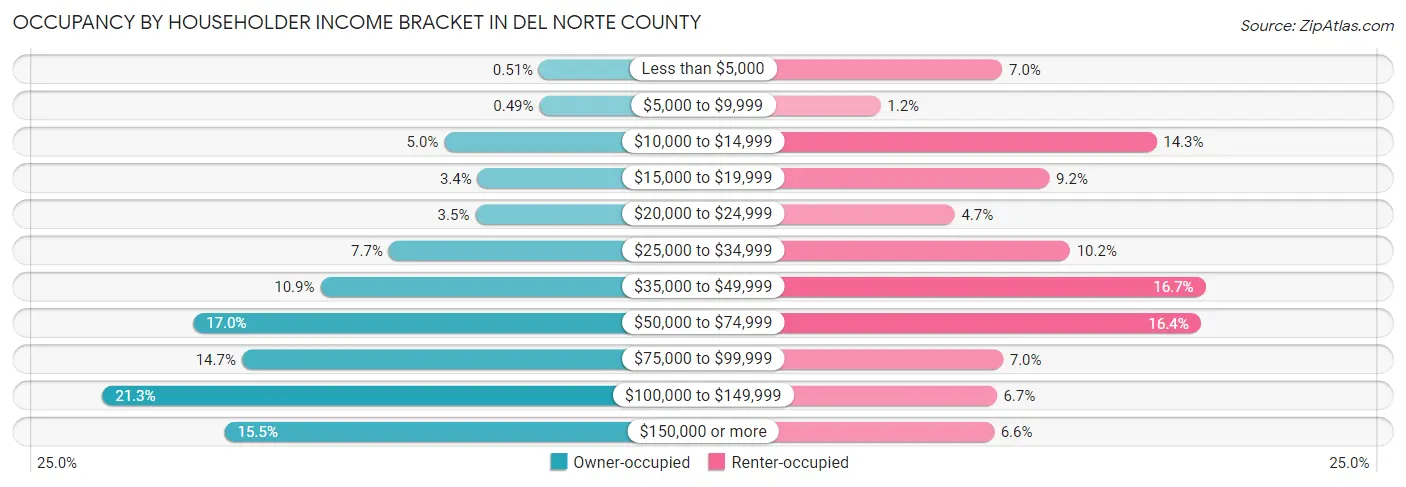
| Income Bracket | Owner-occupied | Renter-occupied |
| Less than $5,000 | 33 (0.5%) | 212 (7.0%) |
| $5,000 to $9,999 | 32 (0.5%) | 36 (1.2%) |
| $10,000 to $14,999 | 326 (5.0%) | 435 (14.3%) |
| $15,000 to $19,999 | 223 (3.4%) | 280 (9.2%) |
| $20,000 to $24,999 | 230 (3.5%) | 143 (4.7%) |
| $25,000 to $34,999 | 497 (7.7%) | 310 (10.2%) |
| $35,000 to $49,999 | 709 (10.9%) | 506 (16.7%) |
| $50,000 to $74,999 | 1,102 (17.0%) | 499 (16.4%) |
| $75,000 to $99,999 | 952 (14.7%) | 213 (7.0%) |
| $100,000 to $149,999 | 1,383 (21.3%) | 204 (6.7%) |
| $150,000 or more | 1,005 (15.5%) | 200 (6.6%) |
| Total | 6,492 (100.0%) | 3,038 (100.0%) |
Monthly Housing Cost Tiers in Del Norte County
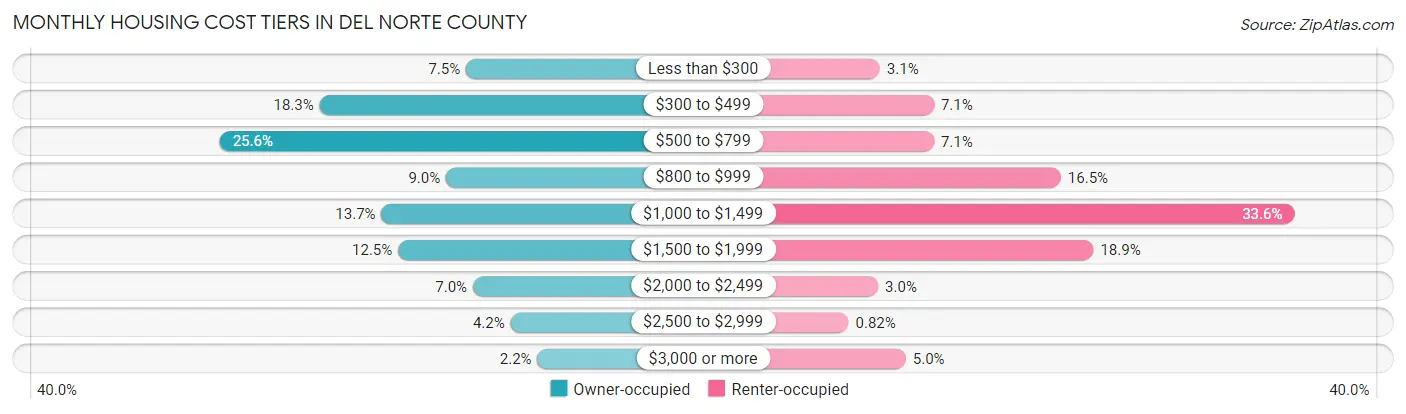
| Monthly Cost | Owner-occupied | Renter-occupied |
| Less than $300 | 486 (7.5%) | 95 (3.1%) |
| $300 to $499 | 1,187 (18.3%) | 216 (7.1%) |
| $500 to $799 | 1,664 (25.6%) | 216 (7.1%) |
| $800 to $999 | 582 (9.0%) | 500 (16.5%) |
| $1,000 to $1,499 | 891 (13.7%) | 1,022 (33.6%) |
| $1,500 to $1,999 | 811 (12.5%) | 573 (18.9%) |
| $2,000 to $2,499 | 453 (7.0%) | 91 (3.0%) |
| $2,500 to $2,999 | 273 (4.2%) | 25 (0.8%) |
| $3,000 or more | 145 (2.2%) | 153 (5.0%) |
| Total | 6,492 (100.0%) | 3,038 (100.0%) |
Physical Housing Characteristics in Del Norte County
Housing Structures in Del Norte County
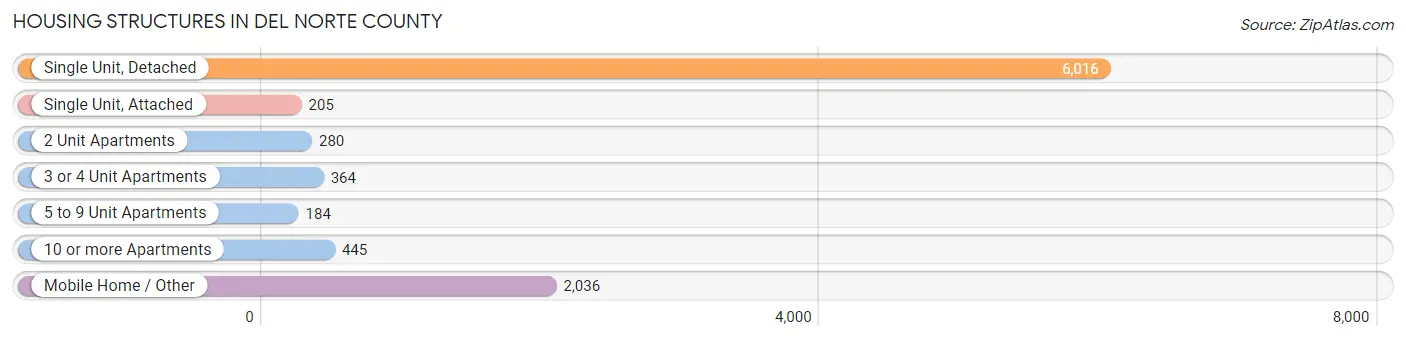
| Structure Type | # Housing Units | % Housing Units |
| Single Unit, Detached | 6,016 | 63.1% |
| Single Unit, Attached | 205 | 2.1% |
| 2 Unit Apartments | 280 | 2.9% |
| 3 or 4 Unit Apartments | 364 | 3.8% |
| 5 to 9 Unit Apartments | 184 | 1.9% |
| 10 or more Apartments | 445 | 4.7% |
| Mobile Home / Other | 2,036 | 21.4% |
| Total | 9,530 | 100.0% |
Housing Structures by Occupancy in Del Norte County
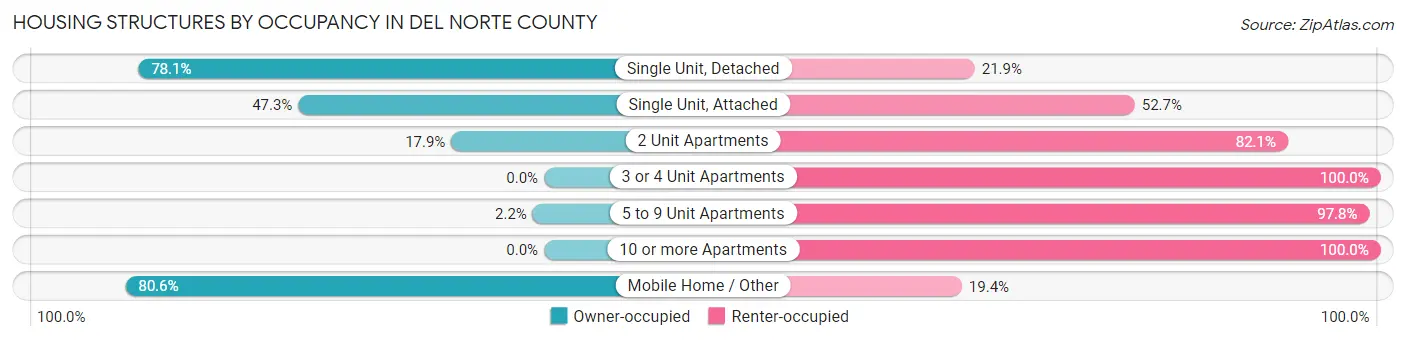
| Structure Type | Owner-occupied | Renter-occupied |
| Single Unit, Detached | 4,700 (78.1%) | 1,316 (21.9%) |
| Single Unit, Attached | 97 (47.3%) | 108 (52.7%) |
| 2 Unit Apartments | 50 (17.9%) | 230 (82.1%) |
| 3 or 4 Unit Apartments | 0 (0.0%) | 364 (100.0%) |
| 5 to 9 Unit Apartments | 4 (2.2%) | 180 (97.8%) |
| 10 or more Apartments | 0 (0.0%) | 445 (100.0%) |
| Mobile Home / Other | 1,641 (80.6%) | 395 (19.4%) |
| Total | 6,492 (68.1%) | 3,038 (31.9%) |
Housing Structures by Number of Rooms in Del Norte County
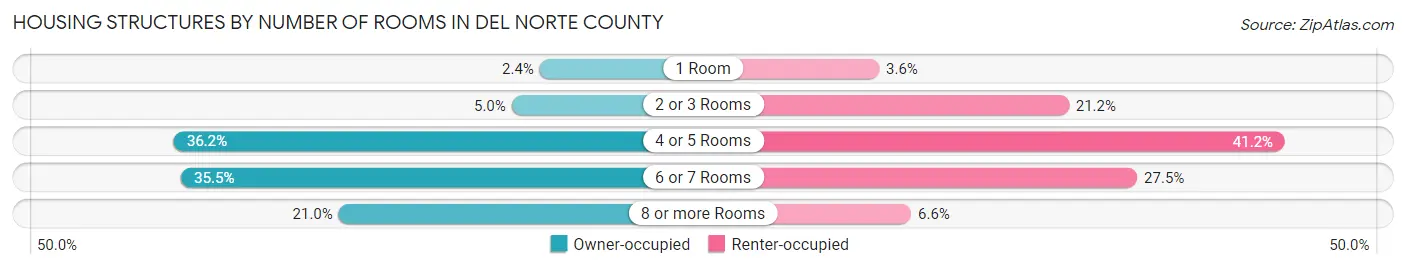
| Number of Rooms | Owner-occupied | Renter-occupied |
| 1 Room | 153 (2.4%) | 110 (3.6%) |
| 2 or 3 Rooms | 322 (5.0%) | 643 (21.2%) |
| 4 or 5 Rooms | 2,350 (36.2%) | 1,250 (41.1%) |
| 6 or 7 Rooms | 2,306 (35.5%) | 835 (27.5%) |
| 8 or more Rooms | 1,361 (21.0%) | 200 (6.6%) |
| Total | 6,492 (100.0%) | 3,038 (100.0%) |
Housing Structure by Heating Type in Del Norte County
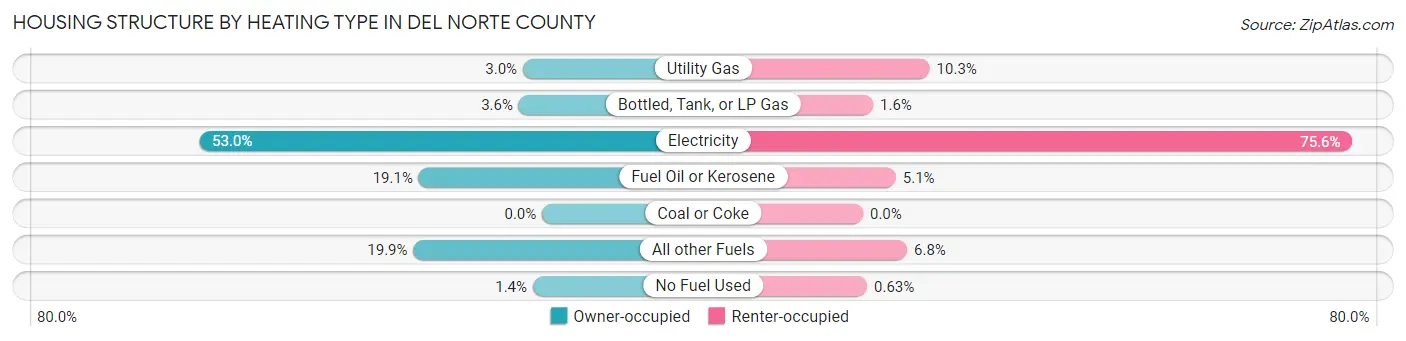
| Heating Type | Owner-occupied | Renter-occupied |
| Utility Gas | 192 (3.0%) | 313 (10.3%) |
| Bottled, Tank, or LP Gas | 234 (3.6%) | 47 (1.5%) |
| Electricity | 3,443 (53.0%) | 2,298 (75.6%) |
| Fuel Oil or Kerosene | 1,238 (19.1%) | 154 (5.1%) |
| Coal or Coke | 0 (0.0%) | 0 (0.0%) |
| All other Fuels | 1,292 (19.9%) | 207 (6.8%) |
| No Fuel Used | 93 (1.4%) | 19 (0.6%) |
| Total | 6,492 (100.0%) | 3,038 (100.0%) |
Household Vehicle Usage in Del Norte County
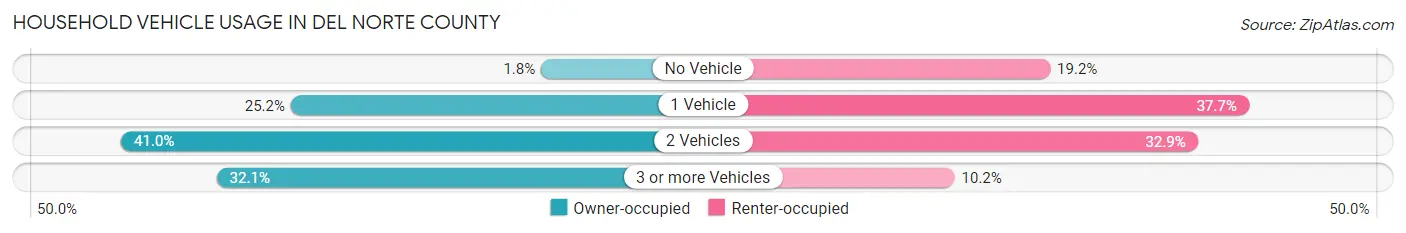
| Vehicles per Household | Owner-occupied | Renter-occupied |
| No Vehicle | 116 (1.8%) | 582 (19.2%) |
| 1 Vehicle | 1,633 (25.2%) | 1,145 (37.7%) |
| 2 Vehicles | 2,661 (41.0%) | 1,000 (32.9%) |
| 3 or more Vehicles | 2,082 (32.1%) | 311 (10.2%) |
| Total | 6,492 (100.0%) | 3,038 (100.0%) |
Real Estate & Mortgages in Del Norte County
Real Estate and Mortgage Overview in Del Norte County
| Characteristic | Without Mortgage | With Mortgage |
| Housing Units | 3,574 | 2,918 |
| Median Property Value | $254,900 | $319,600 |
| Median Household Income | $60,199 | $629 |
| Monthly Housing Costs | $519 | $145 |
| Real Estate Taxes | $1,450 | $63 |
Property Value by Mortgage Status in Del Norte County
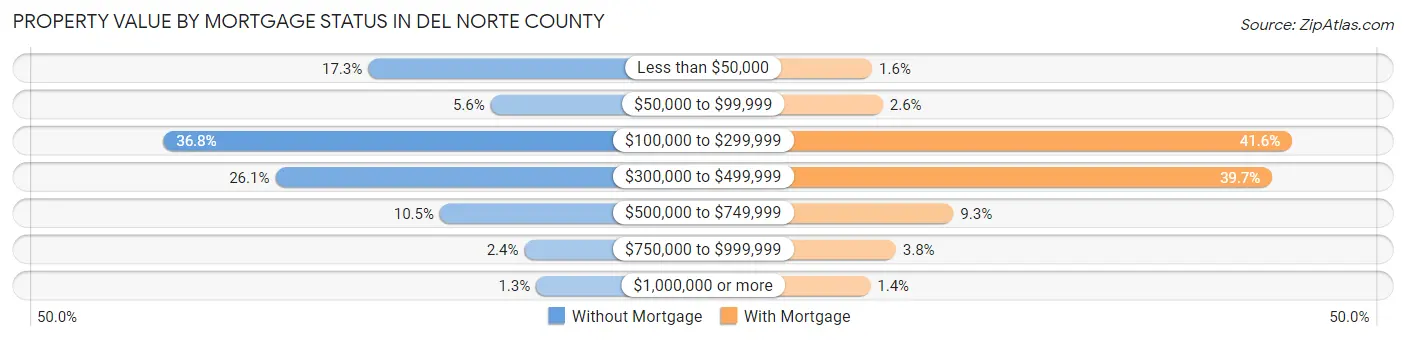
| Property Value | Without Mortgage | With Mortgage |
| Less than $50,000 | 618 (17.3%) | 46 (1.6%) |
| $50,000 to $99,999 | 201 (5.6%) | 76 (2.6%) |
| $100,000 to $299,999 | 1,315 (36.8%) | 1,213 (41.6%) |
| $300,000 to $499,999 | 934 (26.1%) | 1,158 (39.7%) |
| $500,000 to $749,999 | 374 (10.5%) | 272 (9.3%) |
| $750,000 to $999,999 | 86 (2.4%) | 112 (3.8%) |
| $1,000,000 or more | 46 (1.3%) | 41 (1.4%) |
| Total | 3,574 (100.0%) | 2,918 (100.0%) |
Household Income by Mortgage Status in Del Norte County
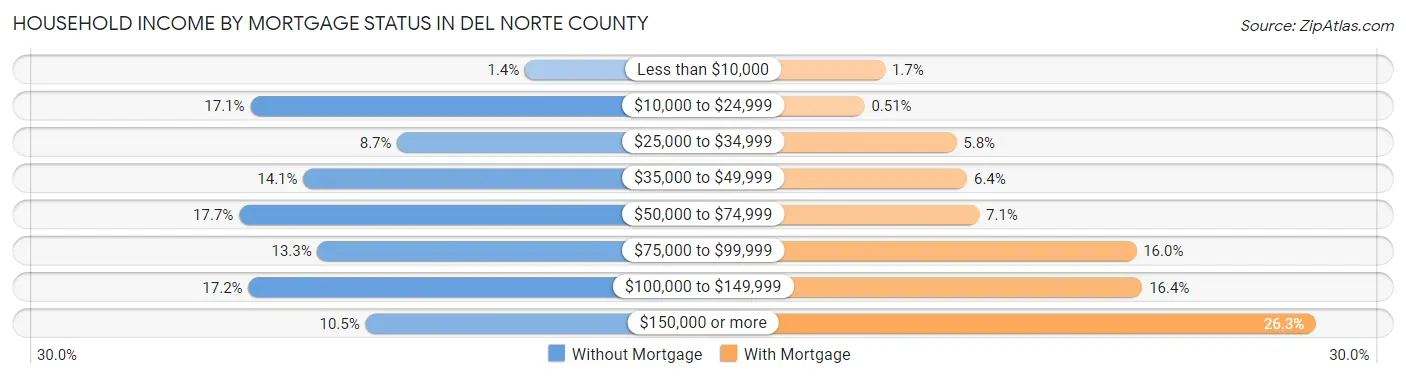
| Household Income | Without Mortgage | With Mortgage |
| Less than $10,000 | 50 (1.4%) | 49 (1.7%) |
| $10,000 to $24,999 | 611 (17.1%) | 15 (0.5%) |
| $25,000 to $34,999 | 311 (8.7%) | 168 (5.8%) |
| $35,000 to $49,999 | 503 (14.1%) | 186 (6.4%) |
| $50,000 to $74,999 | 634 (17.7%) | 206 (7.1%) |
| $75,000 to $99,999 | 474 (13.3%) | 468 (16.0%) |
| $100,000 to $149,999 | 615 (17.2%) | 478 (16.4%) |
| $150,000 or more | 376 (10.5%) | 768 (26.3%) |
| Total | 3,574 (100.0%) | 2,918 (100.0%) |
Property Value to Household Income Ratio in Del Norte County
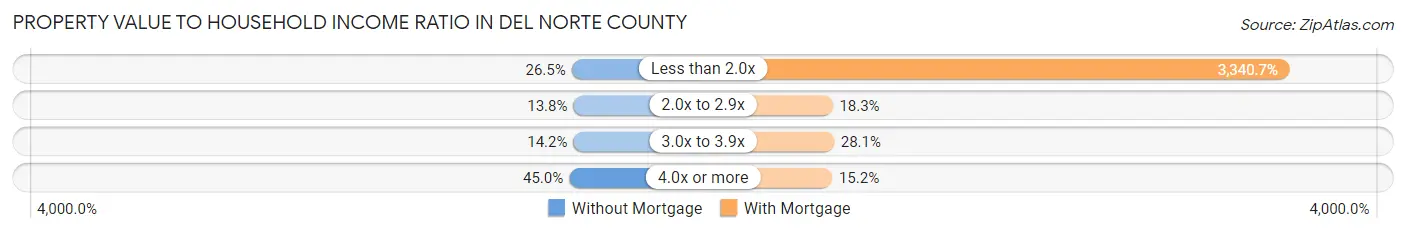
| Value-to-Income Ratio | Without Mortgage | With Mortgage |
| Less than 2.0x | 946 (26.5%) | 97,481 (3,340.7%) |
| 2.0x to 2.9x | 492 (13.8%) | 534 (18.3%) |
| 3.0x to 3.9x | 507 (14.2%) | 820 (28.1%) |
| 4.0x or more | 1,609 (45.0%) | 442 (15.1%) |
| Total | 3,574 (100.0%) | 2,918 (100.0%) |
Real Estate Taxes by Mortgage Status in Del Norte County

| Property Taxes | Without Mortgage | With Mortgage |
| Less than $800 | 916 (25.6%) | 0 (0.0%) |
| $800 to $1,499 | 739 (20.7%) | 187 (6.4%) |
| $800 to $1,499 | 1,537 (43.0%) | 587 (20.1%) |
| Total | 3,574 (100.0%) | 2,918 (100.0%) |
Health & Disability in Del Norte County
Health Insurance Coverage by Age in Del Norte County
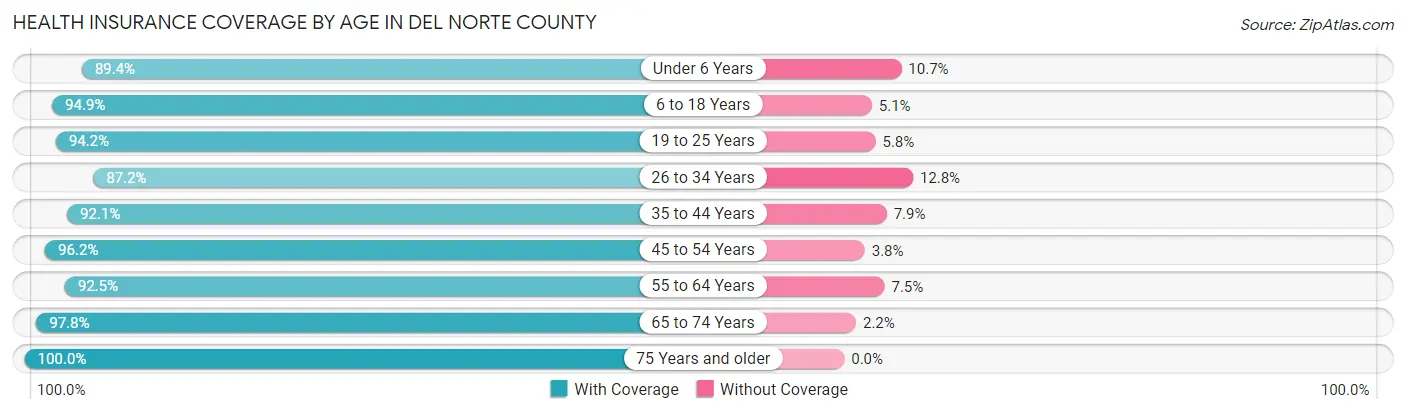
| Age Bracket | With Coverage | Without Coverage |
| Under 6 Years | 1,544 (89.3%) | 184 (10.6%) |
| 6 to 18 Years | 4,243 (94.9%) | 230 (5.1%) |
| 19 to 25 Years | 1,503 (94.2%) | 93 (5.8%) |
| 26 to 34 Years | 2,282 (87.2%) | 335 (12.8%) |
| 35 to 44 Years | 2,676 (92.1%) | 230 (7.9%) |
| 45 to 54 Years | 2,899 (96.2%) | 115 (3.8%) |
| 55 to 64 Years | 3,454 (92.5%) | 280 (7.5%) |
| 65 to 74 Years | 3,129 (97.8%) | 70 (2.2%) |
| 75 Years and older | 1,953 (100.0%) | 0 (0.0%) |
| Total | 23,683 (93.9%) | 1,537 (6.1%) |
Health Insurance Coverage by Citizenship Status in Del Norte County

| Citizenship Status | With Coverage | Without Coverage |
| Native Born | 1,544 (89.3%) | 184 (10.6%) |
| Foreign Born, Citizen | 4,243 (94.9%) | 230 (5.1%) |
| Foreign Born, not a Citizen | 1,503 (94.2%) | 93 (5.8%) |
Health Insurance Coverage by Household Income in Del Norte County

| Household Income | With Coverage | Without Coverage |
| Under $25,000 | 3,224 (94.3%) | 195 (5.7%) |
| $25,000 to $49,999 | 4,475 (93.6%) | 304 (6.4%) |
| $50,000 to $74,999 | 3,990 (93.7%) | 269 (6.3%) |
| $75,000 to $99,999 | 3,348 (93.2%) | 244 (6.8%) |
| $100,000 and over | 8,560 (94.2%) | 525 (5.8%) |
Public vs Private Health Insurance Coverage by Age in Del Norte County
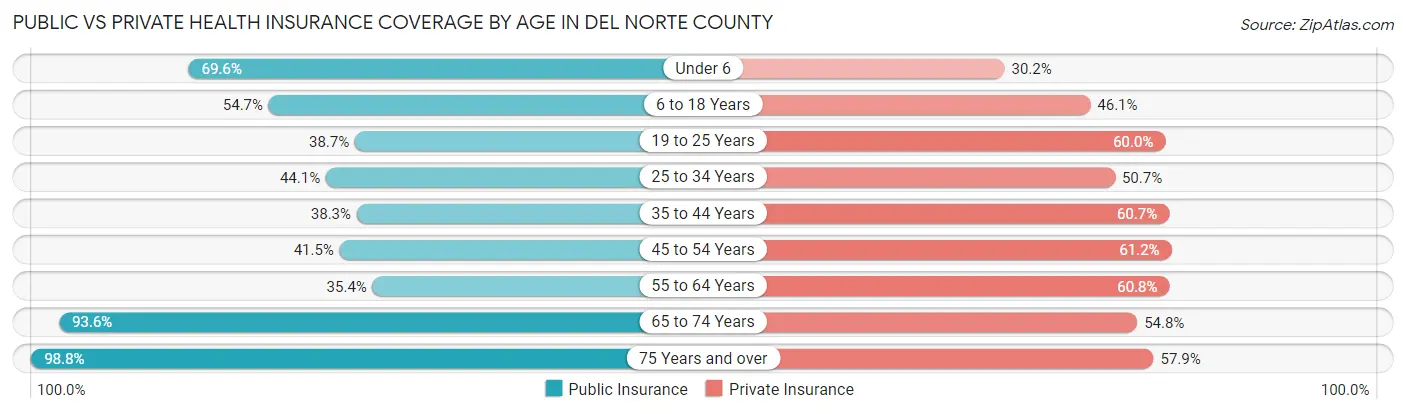
| Age Bracket | Public Insurance | Private Insurance |
| Under 6 | 1,202 (69.6%) | 522 (30.2%) |
| 6 to 18 Years | 2,445 (54.7%) | 2,064 (46.1%) |
| 19 to 25 Years | 617 (38.7%) | 958 (60.0%) |
| 25 to 34 Years | 1,153 (44.1%) | 1,327 (50.7%) |
| 35 to 44 Years | 1,114 (38.3%) | 1,765 (60.7%) |
| 45 to 54 Years | 1,251 (41.5%) | 1,844 (61.2%) |
| 55 to 64 Years | 1,322 (35.4%) | 2,270 (60.8%) |
| 65 to 74 Years | 2,995 (93.6%) | 1,754 (54.8%) |
| 75 Years and over | 1,929 (98.8%) | 1,130 (57.9%) |
| Total | 14,028 (55.6%) | 13,634 (54.1%) |
Disability Status by Sex by Age in Del Norte County
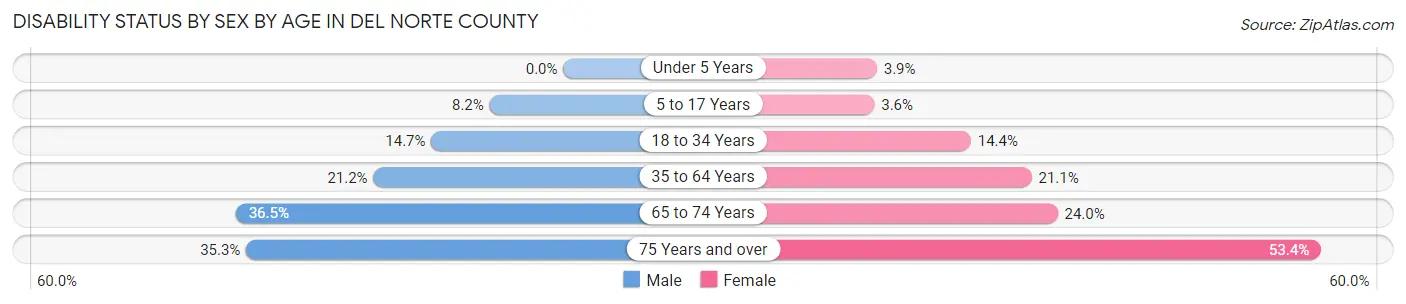
| Age Bracket | Male | Female |
| Under 5 Years | 0 (0.0%) | 33 (3.9%) |
| 5 to 17 Years | 195 (8.2%) | 69 (3.6%) |
| 18 to 34 Years | 342 (14.7%) | 330 (14.4%) |
| 35 to 64 Years | 1,026 (21.1%) | 1,015 (21.1%) |
| 65 to 74 Years | 575 (36.5%) | 390 (24.0%) |
| 75 Years and over | 308 (35.3%) | 577 (53.4%) |
Disability Class by Sex by Age in Del Norte County
Disability Class: Hearing Difficulty
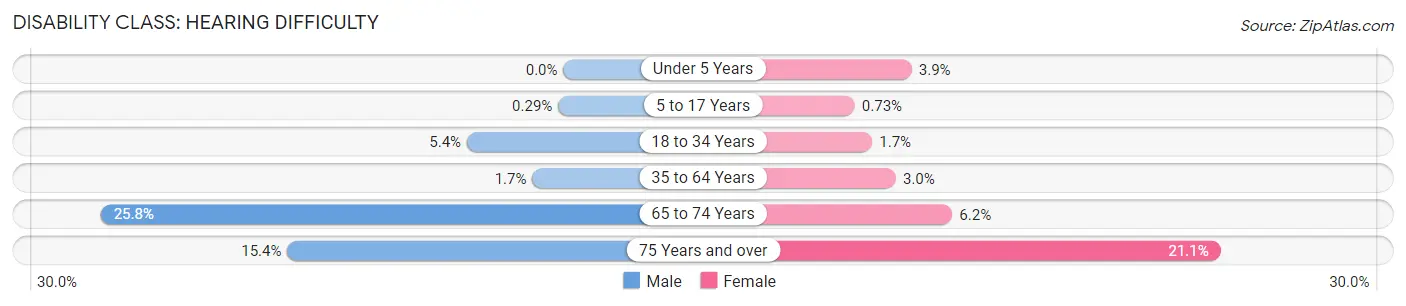
| Age Bracket | Male | Female |
| Under 5 Years | 0 (0.0%) | 33 (3.9%) |
| 5 to 17 Years | 7 (0.3%) | 14 (0.7%) |
| 18 to 34 Years | 125 (5.4%) | 39 (1.7%) |
| 35 to 64 Years | 84 (1.7%) | 145 (3.0%) |
| 65 to 74 Years | 406 (25.8%) | 100 (6.2%) |
| 75 Years and over | 134 (15.4%) | 228 (21.1%) |
Disability Class: Vision Difficulty
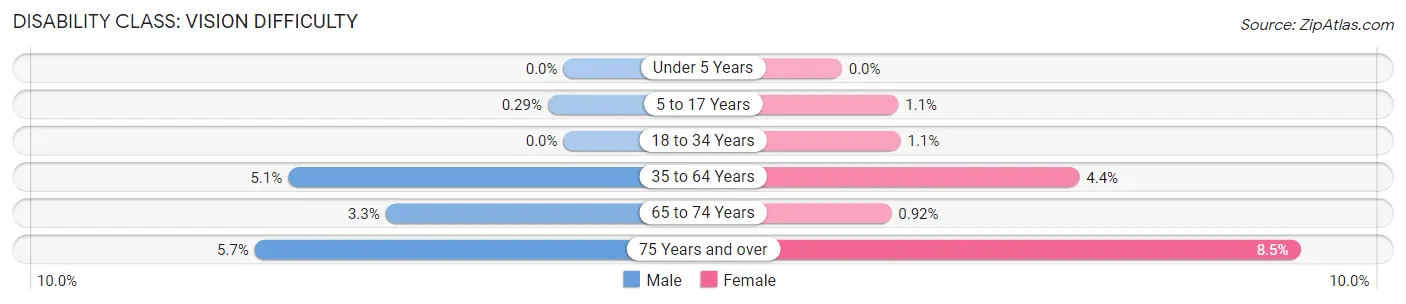
| Age Bracket | Male | Female |
| Under 5 Years | 0 (0.0%) | 0 (0.0%) |
| 5 to 17 Years | 7 (0.3%) | 20 (1.1%) |
| 18 to 34 Years | 0 (0.0%) | 25 (1.1%) |
| 35 to 64 Years | 248 (5.1%) | 212 (4.4%) |
| 65 to 74 Years | 52 (3.3%) | 15 (0.9%) |
| 75 Years and over | 50 (5.7%) | 92 (8.5%) |
Disability Class: Cognitive Difficulty
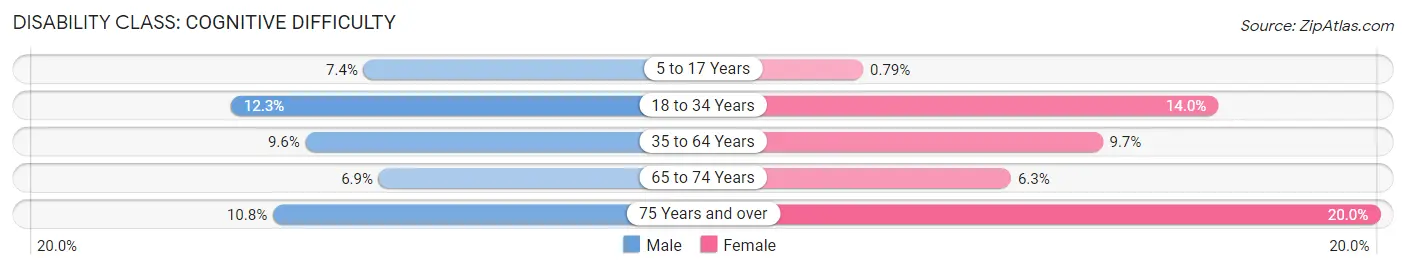
| Age Bracket | Male | Female |
| 5 to 17 Years | 176 (7.4%) | 15 (0.8%) |
| 18 to 34 Years | 287 (12.3%) | 321 (14.0%) |
| 35 to 64 Years | 464 (9.6%) | 465 (9.7%) |
| 65 to 74 Years | 108 (6.9%) | 102 (6.3%) |
| 75 Years and over | 94 (10.8%) | 216 (20.0%) |
Disability Class: Ambulatory Difficulty
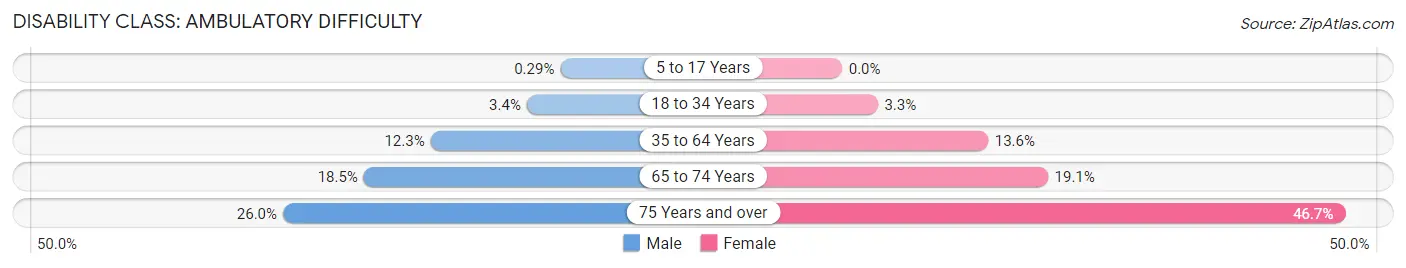
| Age Bracket | Male | Female |
| 5 to 17 Years | 7 (0.3%) | 0 (0.0%) |
| 18 to 34 Years | 79 (3.4%) | 76 (3.3%) |
| 35 to 64 Years | 598 (12.3%) | 651 (13.6%) |
| 65 to 74 Years | 292 (18.5%) | 310 (19.1%) |
| 75 Years and over | 227 (26.0%) | 505 (46.7%) |
Disability Class: Self-Care Difficulty
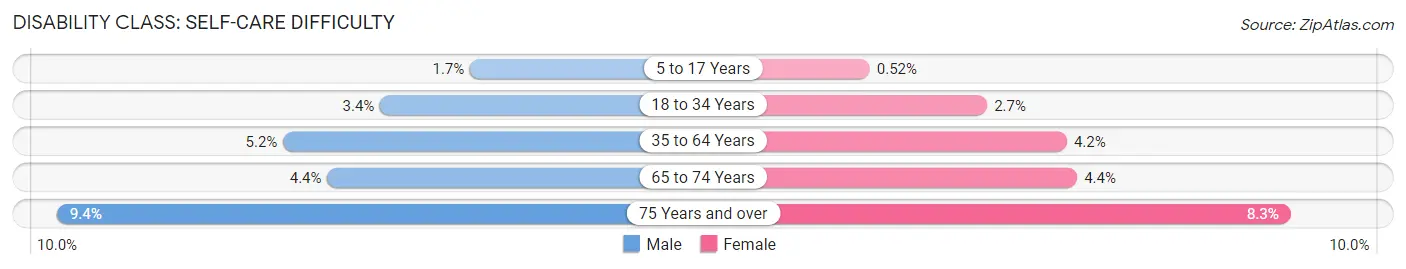
| Age Bracket | Male | Female |
| 5 to 17 Years | 41 (1.7%) | 10 (0.5%) |
| 18 to 34 Years | 79 (3.4%) | 62 (2.7%) |
| 35 to 64 Years | 252 (5.2%) | 201 (4.2%) |
| 65 to 74 Years | 69 (4.4%) | 71 (4.4%) |
| 75 Years and over | 82 (9.4%) | 90 (8.3%) |
Technology Access in Del Norte County
Computing Device Access in Del Norte County
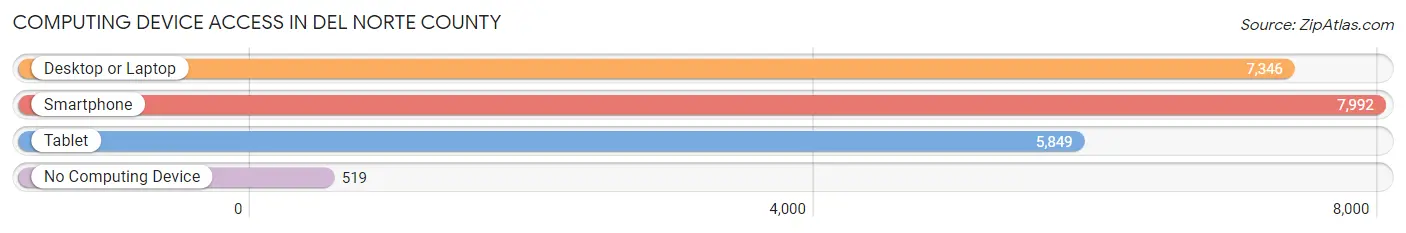
| Device Type | # Households | % Households |
| Desktop or Laptop | 7,346 | 77.1% |
| Smartphone | 7,992 | 83.9% |
| Tablet | 5,849 | 61.4% |
| No Computing Device | 519 | 5.4% |
| Total | 9,530 | 100.0% |
Internet Access in Del Norte County
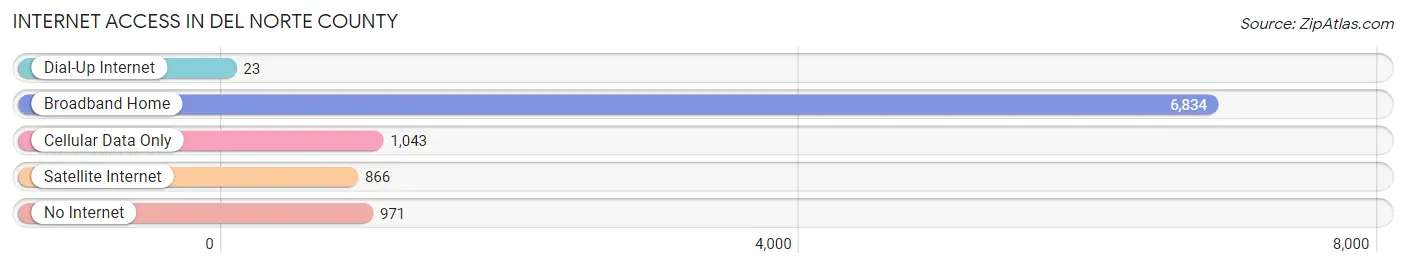
| Internet Type | # Households | % Households |
| Dial-Up Internet | 23 | 0.2% |
| Broadband Home | 6,834 | 71.7% |
| Cellular Data Only | 1,043 | 10.9% |
| Satellite Internet | 866 | 9.1% |
| No Internet | 971 | 10.2% |
| Total | 9,530 | 100.0% |
Del Norte County Summary
Del Norte County is located in the far northwestern corner of California, bordering Oregon to the north and the Pacific Ocean to the west. It is the northernmost county in the state and is part of the Redwood Empire region. The county covers an area of 1,230 square miles and has a population of 28,610 as of the 2020 census.
History
Del Norte County was formed in 1857 from parts of Klamath and Trinity counties. It was named after the Rio del Norte, which was the original name for the Klamath River. The county was originally inhabited by the Tolowa and Yurok Native American tribes, who had lived in the area for thousands of years.
In the late 19th century, the county was heavily logged for its redwood trees, which were used to build homes and other structures. The logging industry was a major source of employment for the county until the mid-20th century.
In the early 20th century, the county was a popular destination for tourists, who came to enjoy the rugged coastline and the redwood forests. The county was also home to a thriving fishing industry, which provided employment for many of the county’s residents.
Geography
Del Norte County is located in the far northwestern corner of California, bordering Oregon to the north and the Pacific Ocean to the west. It is the northernmost county in the state and is part of the Redwood Empire region. The county covers an area of 1,230 square miles and has a population of 28,610 as of the 2020 census.
The county is divided into two distinct regions: the coastal plain and the mountainous interior. The coastal plain is characterized by rugged cliffs, sandy beaches, and dense redwood forests. The mountainous interior is home to the Smith River National Recreation Area, which is a popular destination for hikers, campers, and fishermen.
The county is home to several state parks, including Jedediah Smith Redwoods State Park, Del Norte Coast Redwoods State Park, and Prairie Creek Redwoods State Park. These parks are popular destinations for visitors who come to enjoy the natural beauty of the area.
Economy
Del Norte County’s economy is largely based on tourism, fishing, and logging. The county is home to several state parks, which attract visitors from all over the world. The county is also home to a thriving fishing industry, which provides employment for many of the county’s residents.
Logging is still an important part of the county’s economy, although it has declined in recent years due to environmental concerns. The county is also home to several small businesses, including restaurants, retail stores, and hotels.
Demographics
As of the 2020 census, Del Norte County had a population of 28,610. The population is largely white (83.3%), with smaller percentages of Hispanic (7.2%), Native American (4.2%), and Asian (2.2%) residents. The median household income is $45,845, and the median age is 44.
Del Norte County is home to several Native American tribes, including the Tolowa, Yurok, and Karuk. These tribes have lived in the area for thousands of years and continue to play an important role in the county’s culture and economy.
Conclusion
Del Norte County is a beautiful and diverse county located in the far northwestern corner of California. It is home to a thriving tourism industry, a thriving fishing industry, and a declining logging industry. The county is also home to several Native American tribes, who have lived in the area for thousands of years. The county has a population of 28,610 and a median household income of $45,845.
Common Questions
What is Per Capita Income in Del Norte County?
Per Capita income in Del Norte County is $28,396.
What is the Median Family Income in Del Norte County?
Median Family Income in Del Norte County is $74,548.
What is the Median Household income in Del Norte County?
Median Household Income in Del Norte County is $61,149.
What is Income or Wage Gap in Del Norte County?
Income or Wage Gap in Del Norte County is 14.9%.
Women in Del Norte County earn 85.1 cents for every dollar earned by a man.
What is Family Income Deficit in Del Norte County?
Family Income Deficit in Del Norte County is $10,911.
Families that are below poverty line in Del Norte County earn $10,911 less on average than the poverty threshold level.
What is Inequality or Gini Index in Del Norte County?
Inequality or Gini Index in Del Norte County is 0.43.
What is the Total Population of Del Norte County?
Total Population of Del Norte County is 27,462.
What is the Total Male Population of Del Norte County?
Total Male Population of Del Norte County is 14,809.
What is the Total Female Population of Del Norte County?
Total Female Population of Del Norte County is 12,653.
What is the Ratio of Males per 100 Females in Del Norte County?
There are 117.04 Males per 100 Females in Del Norte County.
What is the Ratio of Females per 100 Males in Del Norte County?
There are 85.44 Females per 100 Males in Del Norte County.
What is the Median Population Age in Del Norte County?
Median Population Age in Del Norte County is 40.0 Years.
What is the Average Family Size in Del Norte County
Average Family Size in Del Norte County is 3.2 People.
What is the Average Household Size in Del Norte County
Average Household Size in Del Norte County is 2.6 People.
How Large is the Labor Force in Del Norte County?
There are 10,574 People in the Labor Forcein in Del Norte County.
What is the Percentage of People in the Labor Force in Del Norte County?
47.6% of People are in the Labor Force in Del Norte County.
What is the Unemployment Rate in Del Norte County?
Unemployment Rate in Del Norte County is 6.3%.