Colusa County, CA Map & Demographics
Colusa County Map
Colusa County Overview
$31,915
PER CAPITA INCOME
$80,746
AVG FAMILY INCOME
$69,619
AVG HOUSEHOLD INCOME
37.8%
WAGE / INCOME GAP [ % ]
62.2¢/ $1
WAGE / INCOME GAP [ $ ]
$8,518
FAMILY INCOME DEFICIT
0.46
INEQUALITY / GINI INDEX
21,811
TOTAL POPULATION
11,112
MALE POPULATION
10,699
FEMALE POPULATION
103.86
MALES / 100 FEMALES
96.28
FEMALES / 100 MALES
36.0
MEDIAN AGE
3.6
AVG FAMILY SIZE
2.9
AVG HOUSEHOLD SIZE
10,500
LABOR FORCE [ PEOPLE ]
63.1%
PERCENT IN LABOR FORCE
7.4%
UNEMPLOYMENT RATE
Colusa County Area Codes
Income in Colusa County
Income Overview in Colusa County
Per Capita Income in Colusa County is $31,915, while median incomes of families and households are $80,746 and $69,619 respectively.
| Characteristic | Number | Measure |
| Per Capita Income | 21,811 | $31,915 |
| Median Family Income | 5,164 | $80,746 |
| Mean Family Income | 5,164 | $107,448 |
| Median Household Income | 7,432 | $69,619 |
| Mean Household Income | 7,432 | $91,248 |
| Income Deficit | 5,164 | $8,518 |
| Wage / Income Gap (%) | 21,811 | 37.83% |
| Wage / Income Gap ($) | 21,811 | 62.17¢ per $1 |
| Gini / Inequality Index | 21,811 | 0.46 |
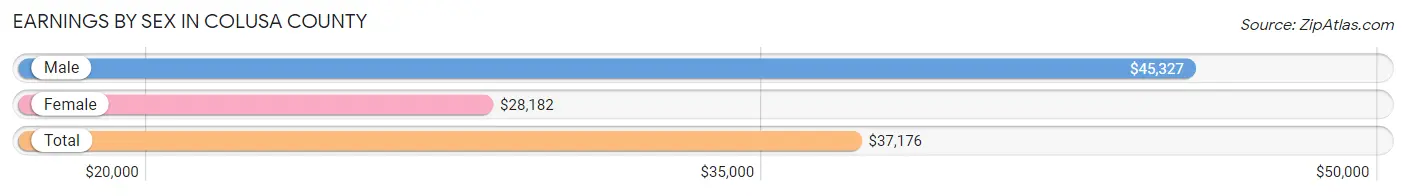
Earnings by Sex in Colusa County
Average Earnings in Colusa County are $37,176, $45,327 for men and $28,182 for women, a difference of 37.8%.
| Sex | Number | Average Earnings |
| Male | 5,879 (54.9%) | $45,327 |
| Female | 4,819 (45.1%) | $28,182 |
| Total | 10,698 (100.0%) | $37,176 |
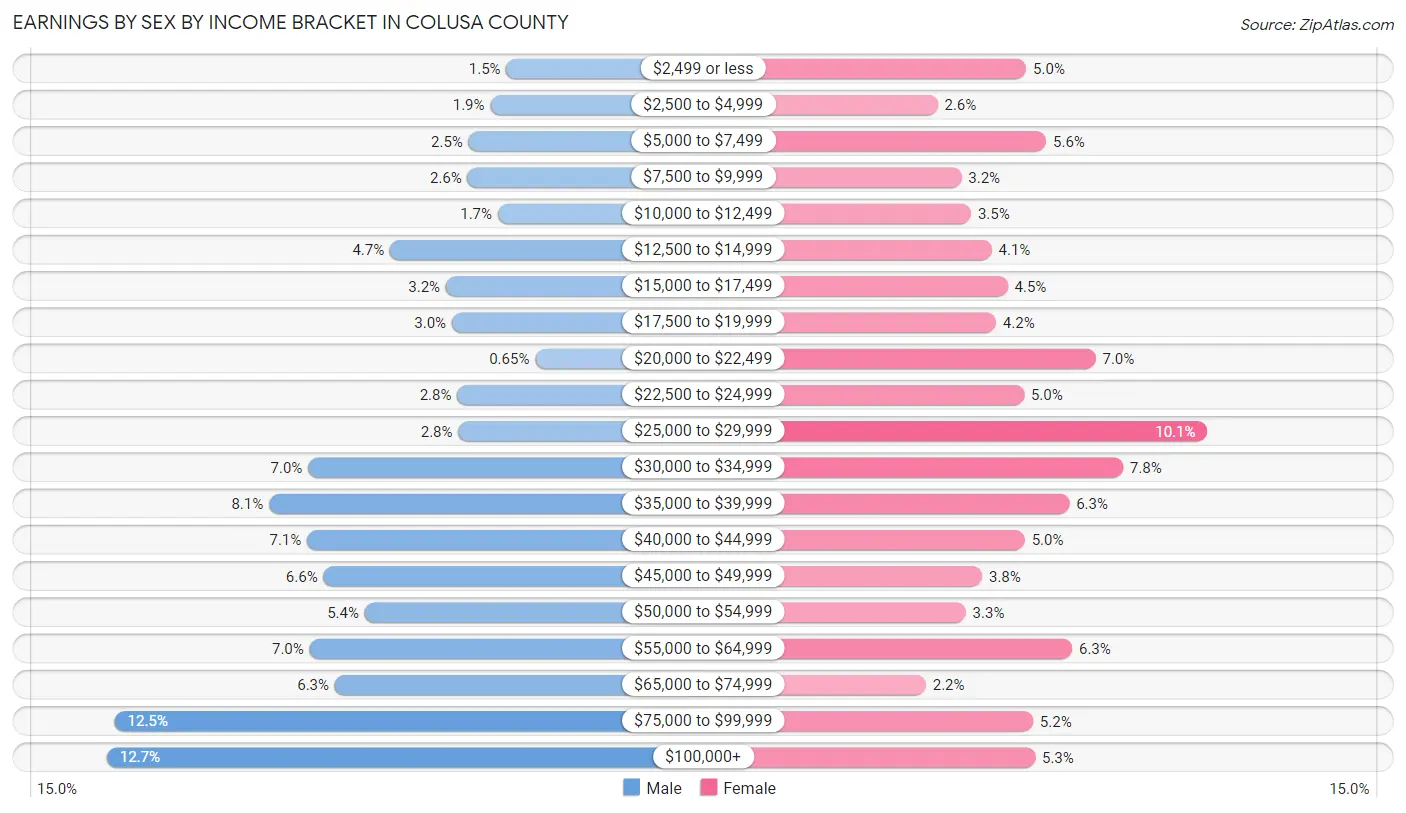
Earnings by Sex by Income Bracket in Colusa County
The most common earnings brackets in Colusa County are $100,000+ for men (746 | 12.7%) and $25,000 to $29,999 for women (488 | 10.1%).
| Income | Male | Female |
| $2,499 or less | 86 (1.5%) | 243 (5.0%) |
| $2,500 to $4,999 | 112 (1.9%) | 123 (2.5%) |
| $5,000 to $7,499 | 148 (2.5%) | 270 (5.6%) |
| $7,500 to $9,999 | 150 (2.5%) | 155 (3.2%) |
| $10,000 to $12,499 | 100 (1.7%) | 168 (3.5%) |
| $12,500 to $14,999 | 278 (4.7%) | 196 (4.1%) |
| $15,000 to $17,499 | 186 (3.2%) | 218 (4.5%) |
| $17,500 to $19,999 | 176 (3.0%) | 202 (4.2%) |
| $20,000 to $22,499 | 38 (0.6%) | 337 (7.0%) |
| $22,500 to $24,999 | 167 (2.8%) | 240 (5.0%) |
| $25,000 to $29,999 | 165 (2.8%) | 488 (10.1%) |
| $30,000 to $34,999 | 413 (7.0%) | 374 (7.8%) |
| $35,000 to $39,999 | 478 (8.1%) | 301 (6.2%) |
| $40,000 to $44,999 | 415 (7.1%) | 241 (5.0%) |
| $45,000 to $49,999 | 388 (6.6%) | 183 (3.8%) |
| $50,000 to $54,999 | 320 (5.4%) | 161 (3.3%) |
| $55,000 to $64,999 | 411 (7.0%) | 305 (6.3%) |
| $65,000 to $74,999 | 369 (6.3%) | 107 (2.2%) |
| $75,000 to $99,999 | 733 (12.5%) | 252 (5.2%) |
| $100,000+ | 746 (12.7%) | 255 (5.3%) |
| Total | 5,879 (100.0%) | 4,819 (100.0%) |
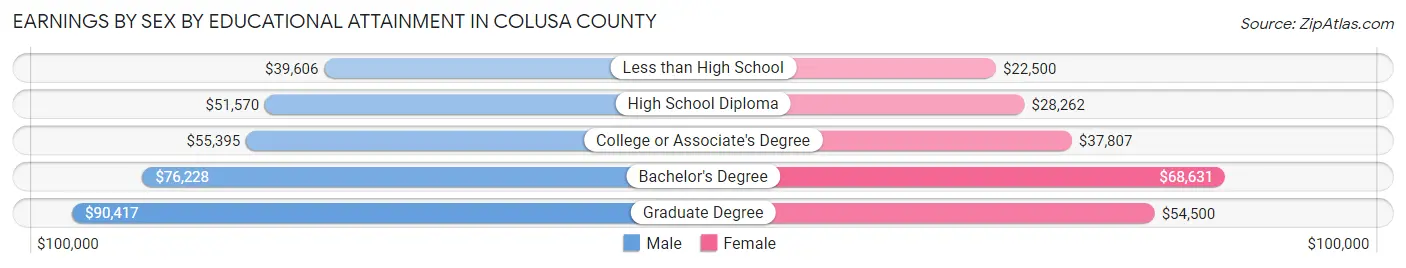
Earnings by Sex by Educational Attainment in Colusa County
Average earnings in Colusa County are $49,031 for men and $31,986 for women, a difference of 34.8%. Men with an educational attainment of graduate degree enjoy the highest average annual earnings of $90,417, while those with less than high school education earn the least with $39,606. Women with an educational attainment of bachelor's degree earn the most with the average annual earnings of $68,631, while those with less than high school education have the smallest earnings of $22,500.
| Educational Attainment | Male Income | Female Income |
| Less than High School | $39,606 | $22,500 |
| High School Diploma | $51,570 | $28,262 |
| College or Associate's Degree | $55,395 | $37,807 |
| Bachelor's Degree | $76,228 | $68,631 |
| Graduate Degree | $90,417 | $54,500 |
| Total | $49,031 | $31,986 |
Family Income in Colusa County
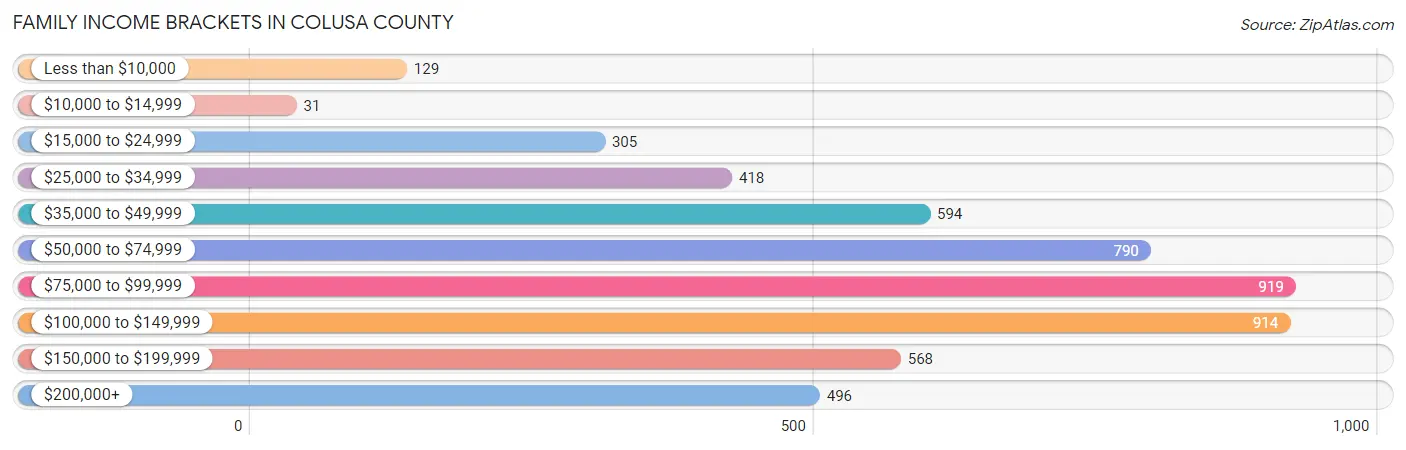
Family Income Brackets in Colusa County
According to the Colusa County family income data, there are 919 families falling into the $75,000 to $99,999 income range, which is the most common income bracket and makes up 17.8% of all families. Conversely, the $10,000 to $14,999 income bracket is the least frequent group with only 31 families (0.6%) belonging to this category.
| Income Bracket | # Families | % Families |
| Less than $10,000 | 129 | 2.5% |
| $10,000 to $14,999 | 31 | 0.6% |
| $15,000 to $24,999 | 305 | 5.9% |
| $25,000 to $34,999 | 418 | 8.1% |
| $35,000 to $49,999 | 594 | 11.5% |
| $50,000 to $74,999 | 790 | 15.3% |
| $75,000 to $99,999 | 919 | 17.8% |
| $100,000 to $149,999 | 914 | 17.7% |
| $150,000 to $199,999 | 568 | 11.0% |
| $200,000+ | 496 | 9.6% |
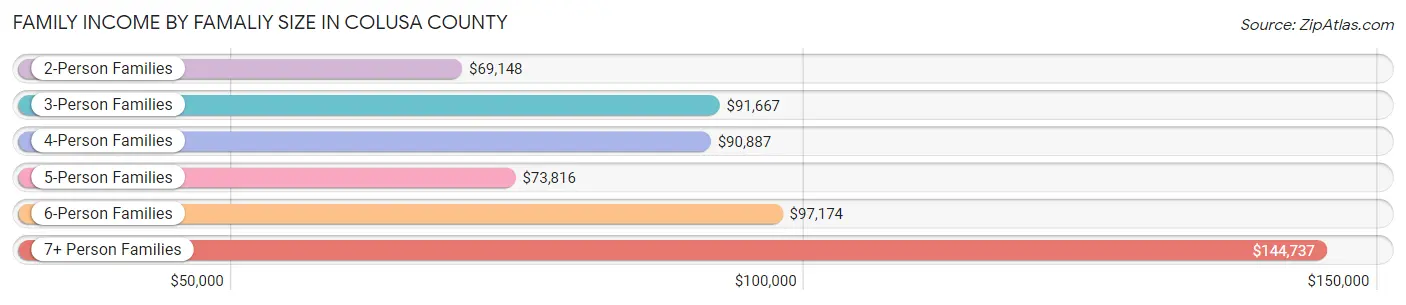
Family Income by Famaliy Size in Colusa County
7+ person families (172 | 3.3%) account for the highest median family income in Colusa County with $144,737 per family, while 2-person families (2,020 | 39.1%) have the highest median income of $34,574 per family member.
| Income Bracket | # Families | Median Income |
| 2-Person Families | 2,020 (39.1%) | $69,148 |
| 3-Person Families | 1,016 (19.7%) | $91,667 |
| 4-Person Families | 1,070 (20.7%) | $90,887 |
| 5-Person Families | 594 (11.5%) | $73,816 |
| 6-Person Families | 292 (5.7%) | $97,174 |
| 7+ Person Families | 172 (3.3%) | $144,737 |
| Total | 5,164 (100.0%) | $80,746 |
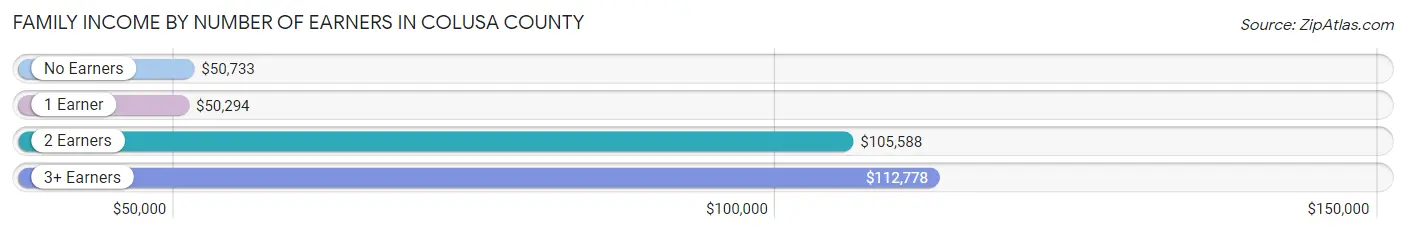
Family Income by Number of Earners in Colusa County
The median family income in Colusa County is $80,746, with families comprising 3+ earners (820) having the highest median family income of $112,778, while families with 1 earner (1,660) have the lowest median family income of $50,294, accounting for 15.9% and 32.2% of families, respectively.
| Number of Earners | # Families | Median Income |
| No Earners | 784 (15.2%) | $50,733 |
| 1 Earner | 1,660 (32.2%) | $50,294 |
| 2 Earners | 1,900 (36.8%) | $105,588 |
| 3+ Earners | 820 (15.9%) | $112,778 |
| Total | 5,164 (100.0%) | $80,746 |
Household Income in Colusa County
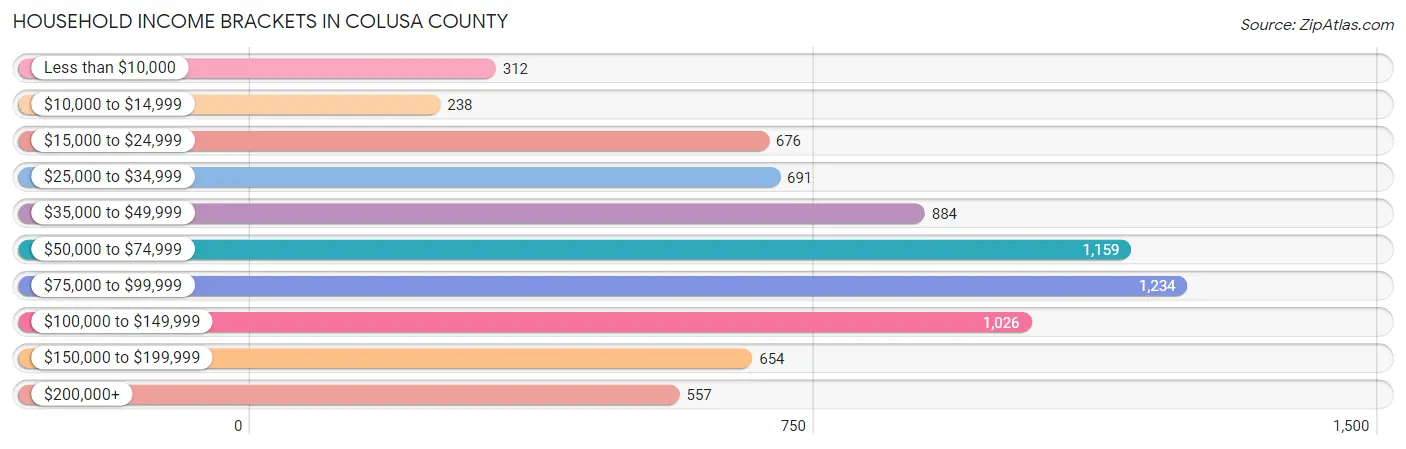
Household Income Brackets in Colusa County
With 1,234 households falling in the category, the $75,000 to $99,999 income range is the most frequent in Colusa County, accounting for 16.6% of all households. In contrast, only 238 households (3.2%) fall into the $10,000 to $14,999 income bracket, making it the least populous group.
| Income Bracket | # Households | % Households |
| Less than $10,000 | 312 | 4.2% |
| $10,000 to $14,999 | 238 | 3.2% |
| $15,000 to $24,999 | 676 | 9.1% |
| $25,000 to $34,999 | 691 | 9.3% |
| $35,000 to $49,999 | 884 | 11.9% |
| $50,000 to $74,999 | 1,159 | 15.6% |
| $75,000 to $99,999 | 1,234 | 16.6% |
| $100,000 to $149,999 | 1,026 | 13.8% |
| $150,000 to $199,999 | 654 | 8.8% |
| $200,000+ | 557 | 7.5% |
Household Income by Householder Age in Colusa County
The median household income in Colusa County is $69,619, with the highest median household income of $79,205 found in the 25 to 44 years age bracket for the primary householder. A total of 2,439 households (32.8%) fall into this category. Meanwhile, the 15 to 24 years age bracket for the primary householder has the lowest median household income of $0, with 97 households (1.3%) in this group.
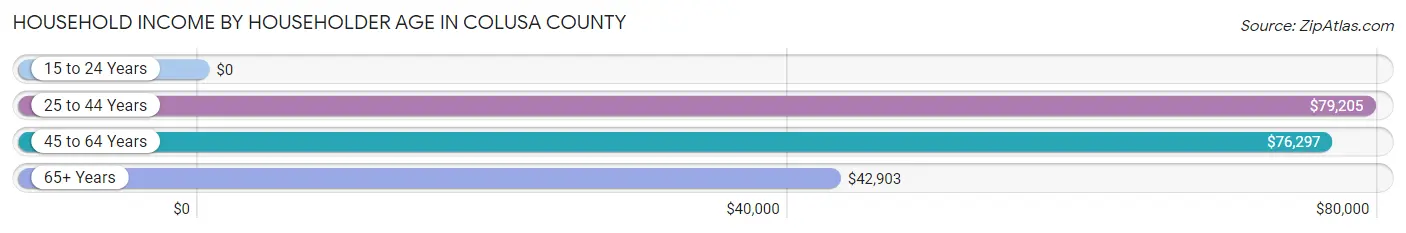
| Income Bracket | # Households | Median Income |
| 15 to 24 Years | 97 (1.3%) | $0 |
| 25 to 44 Years | 2,439 (32.8%) | $79,205 |
| 45 to 64 Years | 2,780 (37.4%) | $76,297 |
| 65+ Years | 2,116 (28.5%) | $42,903 |
| Total | 7,432 (100.0%) | $69,619 |
Poverty in Colusa County
Income Below Poverty by Sex and Age in Colusa County
With 9.4% poverty level for males and 12.6% for females among the residents of Colusa County, 12 to 14 year old males and 15 year old females are the most vulnerable to poverty, with 96 males (23.1%) and 51 females (28.8%) in their respective age groups living below the poverty level.
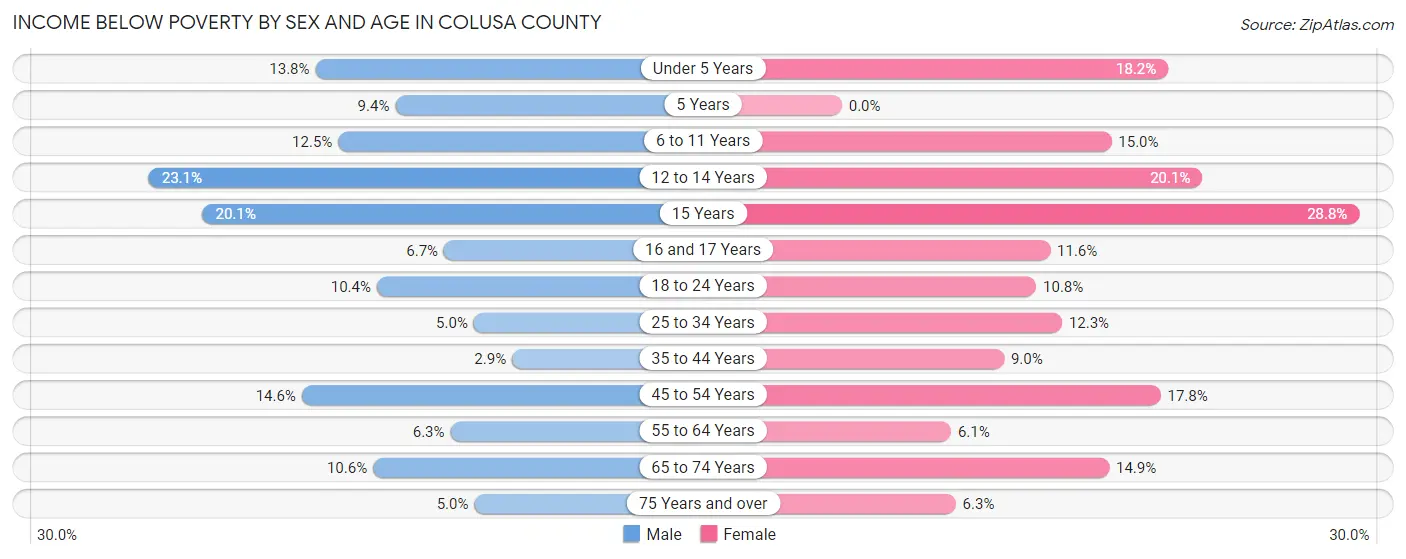
| Age Bracket | Male | Female |
| Under 5 Years | 95 (13.8%) | 143 (18.2%) |
| 5 Years | 19 (9.4%) | 0 (0.0%) |
| 6 to 11 Years | 140 (12.5%) | 131 (15.0%) |
| 12 to 14 Years | 96 (23.1%) | 111 (20.1%) |
| 15 Years | 43 (20.1%) | 51 (28.8%) |
| 16 and 17 Years | 21 (6.7%) | 37 (11.6%) |
| 18 to 24 Years | 106 (10.4%) | 104 (10.8%) |
| 25 to 34 Years | 73 (5.0%) | 163 (12.3%) |
| 35 to 44 Years | 40 (2.9%) | 126 (9.0%) |
| 45 to 54 Years | 180 (14.6%) | 211 (17.7%) |
| 55 to 64 Years | 84 (6.3%) | 80 (6.1%) |
| 65 to 74 Years | 105 (10.6%) | 128 (14.9%) |
| 75 Years and over | 31 (5.0%) | 46 (6.3%) |
| Total | 1,033 (9.4%) | 1,331 (12.6%) |
Income Above Poverty by Sex and Age in Colusa County
According to the poverty statistics in Colusa County, males aged 35 to 44 years and females aged 5 years are the age groups that are most secure financially, with 97.1% of males and 100.0% of females in these age groups living above the poverty line.
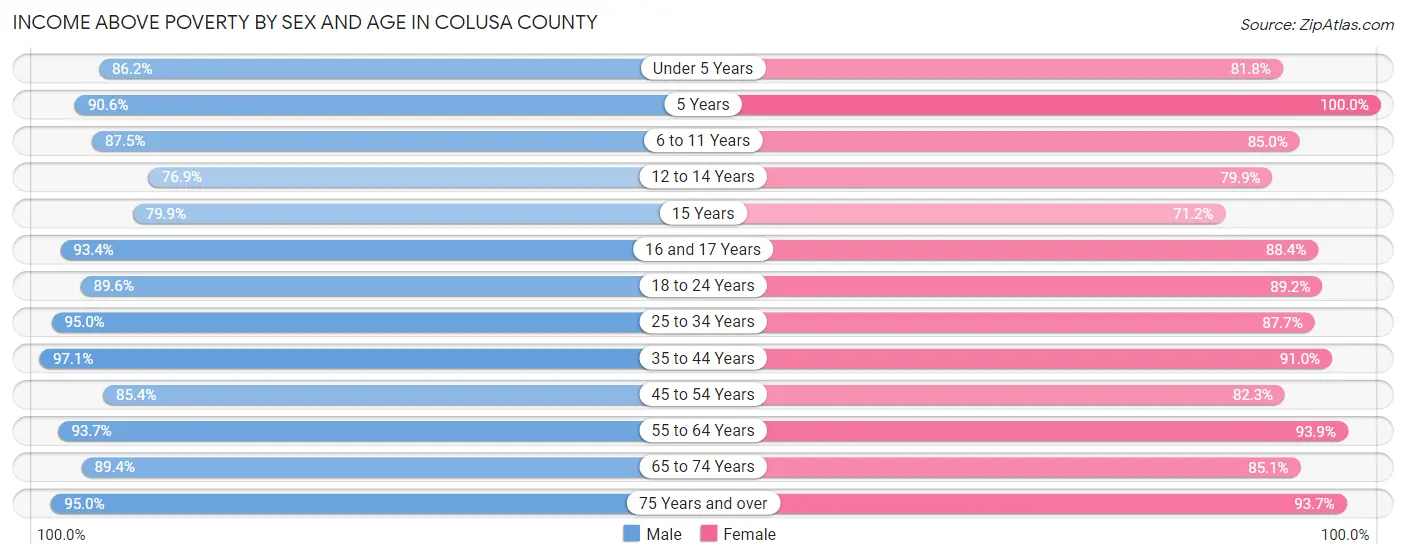
| Age Bracket | Male | Female |
| Under 5 Years | 593 (86.2%) | 644 (81.8%) |
| 5 Years | 184 (90.6%) | 90 (100.0%) |
| 6 to 11 Years | 976 (87.5%) | 742 (85.0%) |
| 12 to 14 Years | 320 (76.9%) | 442 (79.9%) |
| 15 Years | 171 (79.9%) | 126 (71.2%) |
| 16 and 17 Years | 295 (93.3%) | 282 (88.4%) |
| 18 to 24 Years | 914 (89.6%) | 857 (89.2%) |
| 25 to 34 Years | 1,391 (95.0%) | 1,166 (87.7%) |
| 35 to 44 Years | 1,361 (97.1%) | 1,270 (91.0%) |
| 45 to 54 Years | 1,055 (85.4%) | 978 (82.3%) |
| 55 to 64 Years | 1,252 (93.7%) | 1,235 (93.9%) |
| 65 to 74 Years | 886 (89.4%) | 732 (85.1%) |
| 75 Years and over | 594 (95.0%) | 680 (93.7%) |
| Total | 9,992 (90.6%) | 9,244 (87.4%) |
Income Below Poverty Among Married-Couple Families in Colusa County
The poverty statistics for married-couple families in Colusa County show that 5.4% or 213 of the total 3,975 families live below the poverty line. Families with 3 or 4 children have the highest poverty rate of 21.6%, comprising of 101 families. On the other hand, families with 5 or more children have the lowest poverty rate of 0.0%, which includes 0 families.
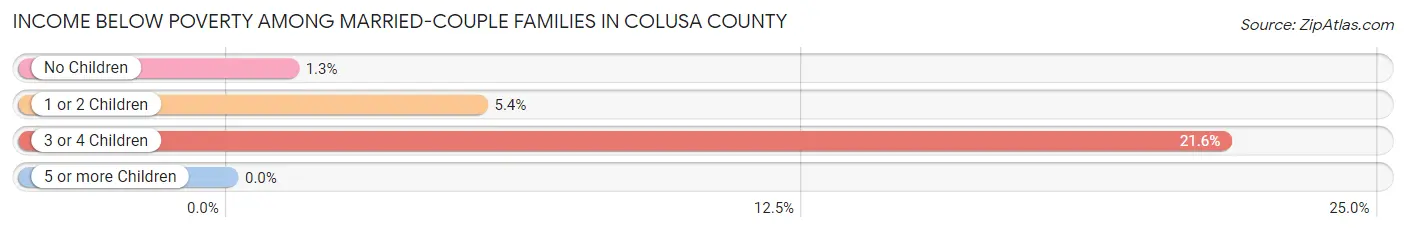
| Children | Above Poverty | Below Poverty |
| No Children | 1,862 (98.7%) | 25 (1.3%) |
| 1 or 2 Children | 1,515 (94.6%) | 87 (5.4%) |
| 3 or 4 Children | 366 (78.4%) | 101 (21.6%) |
| 5 or more Children | 19 (100.0%) | 0 (0.0%) |
| Total | 3,762 (94.6%) | 213 (5.4%) |
Income Below Poverty Among Single-Parent Households in Colusa County
According to the poverty data in Colusa County, 12.4% or 46 single-father households and 28.4% or 232 single-mother households are living below the poverty line. Among single-father households, those with no children have the highest poverty rate, with 35 households (18.1%) experiencing poverty. Likewise, among single-mother households, those with 3 or 4 children have the highest poverty rate, with 83 households (70.3%) falling below the poverty line.
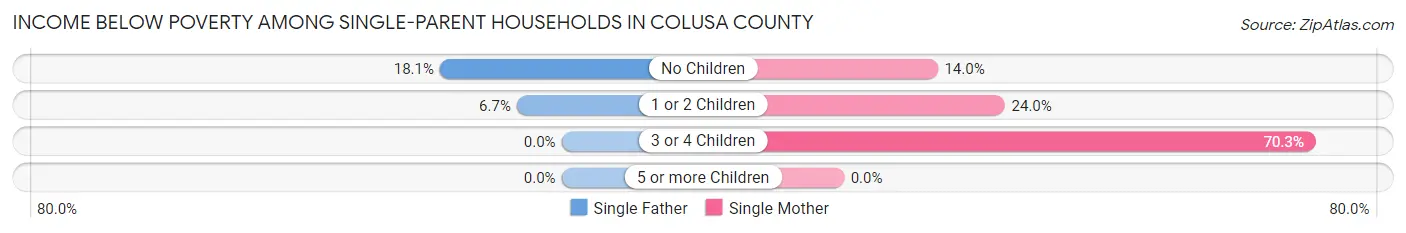
| Children | Single Father | Single Mother |
| No Children | 35 (18.1%) | 26 (14.0%) |
| 1 or 2 Children | 11 (6.7%) | 123 (24.0%) |
| 3 or 4 Children | 0 (0.0%) | 83 (70.3%) |
| 5 or more Children | 0 (0.0%) | 0 (0.0%) |
| Total | 46 (12.4%) | 232 (28.4%) |
Income Below Poverty Among Married-Couple vs Single-Parent Households in Colusa County
The poverty data for Colusa County shows that 213 of the married-couple family households (5.4%) and 278 of the single-parent households (23.4%) are living below the poverty level. Within the married-couple family households, those with 3 or 4 children have the highest poverty rate, with 101 households (21.6%) falling below the poverty line. Among the single-parent households, those with 3 or 4 children have the highest poverty rate, with 83 household (62.9%) living below poverty.
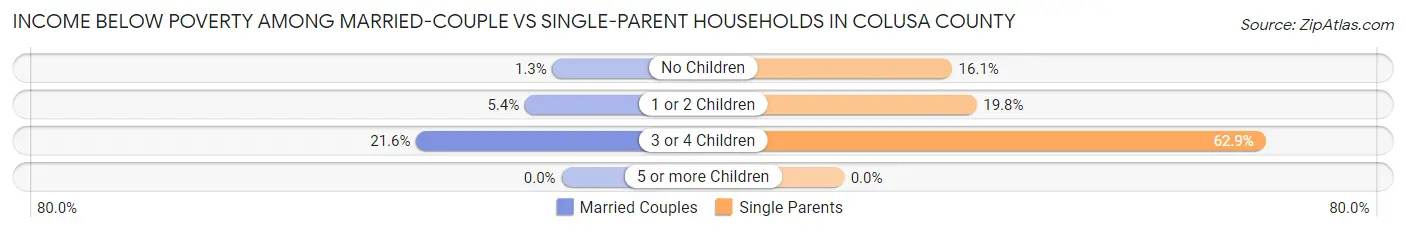
| Children | Married-Couple Families | Single-Parent Households |
| No Children | 25 (1.3%) | 61 (16.1%) |
| 1 or 2 Children | 87 (5.4%) | 134 (19.8%) |
| 3 or 4 Children | 101 (21.6%) | 83 (62.9%) |
| 5 or more Children | 0 (0.0%) | 0 (0.0%) |
| Total | 213 (5.4%) | 278 (23.4%) |
Race in Colusa County
The most populous races in Colusa County are White / Caucasian (13,290 | 60.9%), Hispanic or Latino (13,280 | 60.9%), and Some other Race (3,885 | 17.8%).
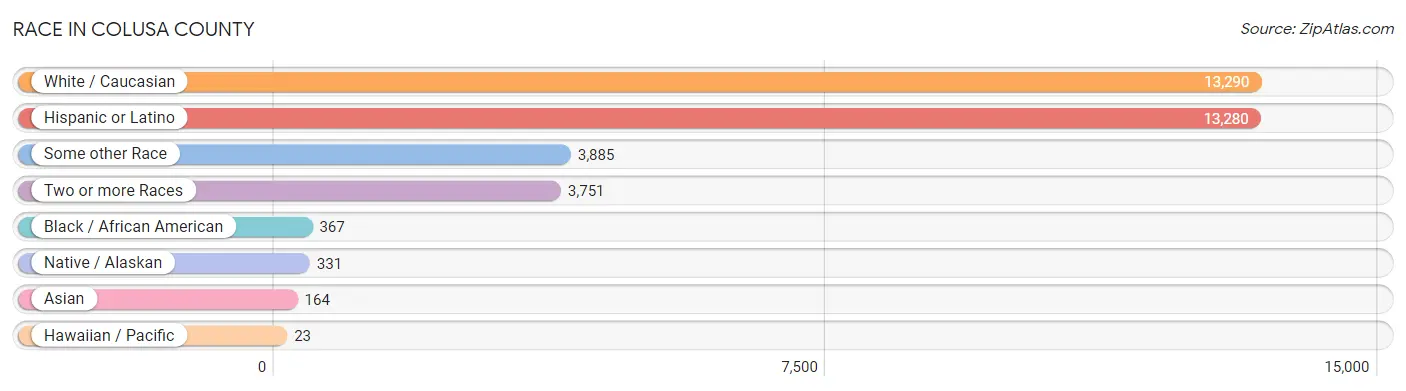
| Race | # Population | % Population |
| Asian | 164 | 0.7% |
| Black / African American | 367 | 1.7% |
| Hawaiian / Pacific | 23 | 0.1% |
| Hispanic or Latino | 13,280 | 60.9% |
| Native / Alaskan | 331 | 1.5% |
| White / Caucasian | 13,290 | 60.9% |
| Two or more Races | 3,751 | 17.2% |
| Some other Race | 3,885 | 17.8% |
| Total | 21,811 | 100.0% |
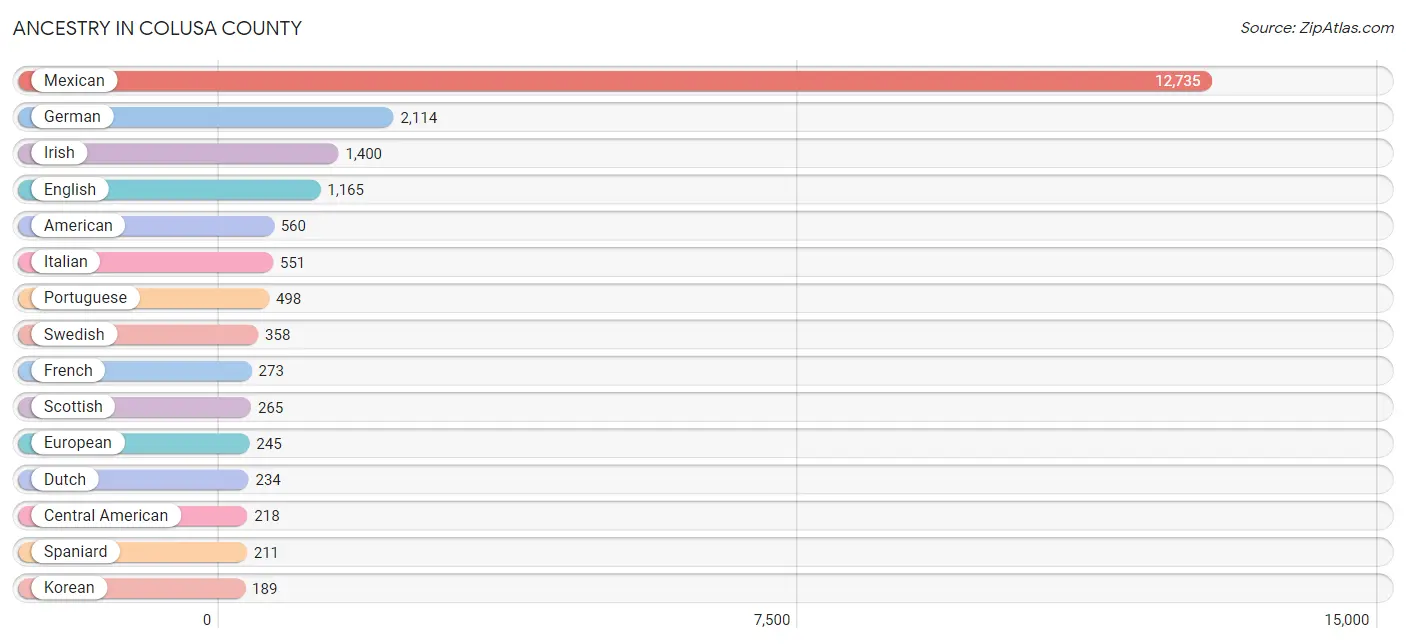
Ancestry in Colusa County
The most populous ancestries reported in Colusa County are Mexican (12,735 | 58.4%), German (2,114 | 9.7%), Irish (1,400 | 6.4%), English (1,165 | 5.3%), and American (560 | 2.6%), together accounting for 82.4% of all Colusa County residents.
| Ancestry | # Population | % Population |
| African | 49 | 0.2% |
| American | 560 | 2.6% |
| Austrian | 55 | 0.3% |
| Blackfeet | 26 | 0.1% |
| Brazilian | 1 | 0.0% |
| British | 75 | 0.3% |
| Canadian | 20 | 0.1% |
| Central American | 218 | 1.0% |
| Cherokee | 187 | 0.9% |
| Choctaw | 4 | 0.0% |
| Costa Rican | 167 | 0.8% |
| Czech | 3 | 0.0% |
| Czechoslovakian | 3 | 0.0% |
| Danish | 64 | 0.3% |
| Dutch | 234 | 1.1% |
| Eastern European | 43 | 0.2% |
| English | 1,165 | 5.3% |
| European | 245 | 1.1% |
| Finnish | 14 | 0.1% |
| French | 273 | 1.3% |
| French Canadian | 70 | 0.3% |
| German | 2,114 | 9.7% |
| Greek | 16 | 0.1% |
| Honduran | 14 | 0.1% |
| Hungarian | 3 | 0.0% |
| Indian (Asian) | 23 | 0.1% |
| Irish | 1,400 | 6.4% |
| Iroquois | 37 | 0.2% |
| Italian | 551 | 2.5% |
| Jamaican | 25 | 0.1% |
| Japanese | 26 | 0.1% |
| Korean | 189 | 0.9% |
| Laotian | 126 | 0.6% |
| Lithuanian | 6 | 0.0% |
| Mexican | 12,735 | 58.4% |
| Mexican American Indian | 112 | 0.5% |
| Nicaraguan | 20 | 0.1% |
| Northern European | 2 | 0.0% |
| Norwegian | 121 | 0.5% |
| Pakistani | 1 | 0.0% |
| Polish | 70 | 0.3% |
| Portuguese | 498 | 2.3% |
| Potawatomi | 27 | 0.1% |
| Russian | 107 | 0.5% |
| Salvadoran | 17 | 0.1% |
| Scandinavian | 62 | 0.3% |
| Scotch-Irish | 175 | 0.8% |
| Scottish | 265 | 1.2% |
| South American | 9 | 0.0% |
| Spaniard | 211 | 1.0% |
| Spanish | 40 | 0.2% |
| Sri Lankan | 4 | 0.0% |
| Subsaharan African | 49 | 0.2% |
| Swedish | 358 | 1.6% |
| Swiss | 57 | 0.3% |
| Thai | 13 | 0.1% |
| Tongan | 21 | 0.1% |
| Ukrainian | 113 | 0.5% |
| Welsh | 28 | 0.1% | View All 59 Rows |
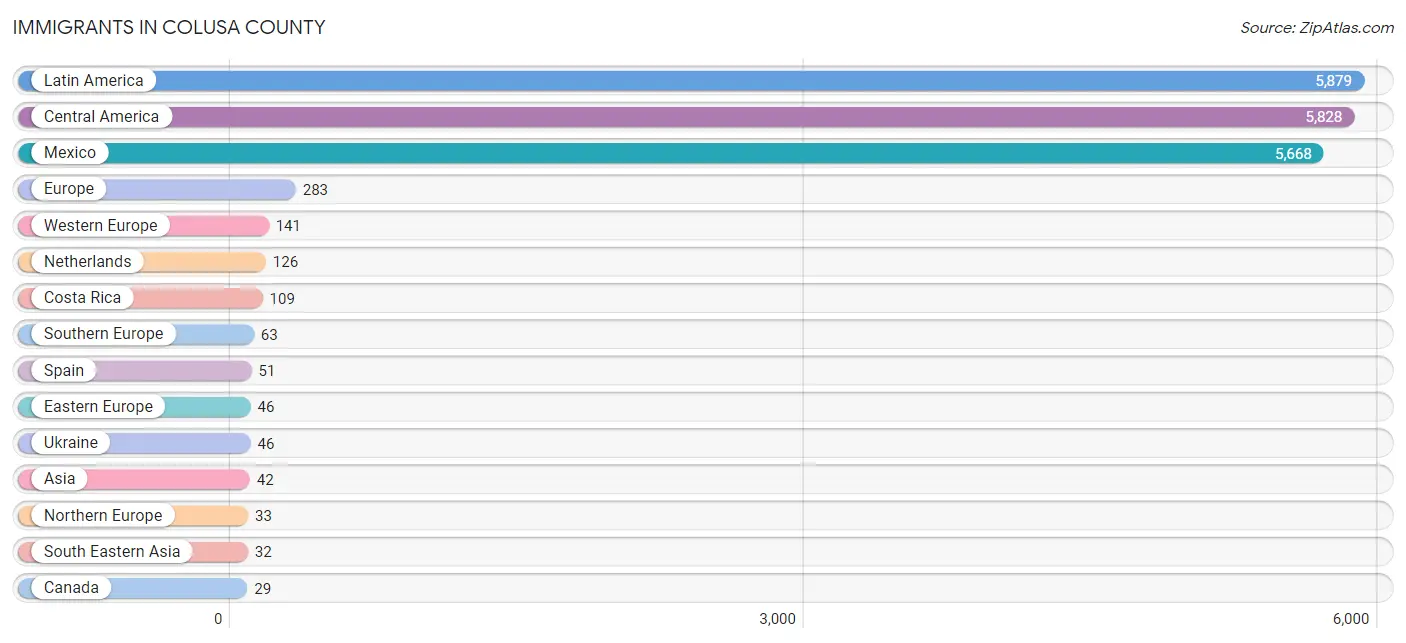
Immigrants in Colusa County
The most numerous immigrant groups reported in Colusa County came from Latin America (5,879 | 27.0%), Central America (5,828 | 26.7%), Mexico (5,668 | 26.0%), Europe (283 | 1.3%), and Western Europe (141 | 0.6%), together accounting for 81.6% of all Colusa County residents.
| Immigration Origin | # Population | % Population |
| Asia | 42 | 0.2% |
| Austria | 11 | 0.1% |
| Azores | 7 | 0.0% |
| Cambodia | 20 | 0.1% |
| Canada | 29 | 0.1% |
| Caribbean | 25 | 0.1% |
| Central America | 5,828 | 26.7% |
| China | 1 | 0.0% |
| Costa Rica | 109 | 0.5% |
| Eastern Asia | 1 | 0.0% |
| Eastern Europe | 46 | 0.2% |
| El Salvador | 10 | 0.1% |
| England | 23 | 0.1% |
| Europe | 283 | 1.3% |
| Fiji | 11 | 0.1% |
| France | 4 | 0.0% |
| Guatemala | 27 | 0.1% |
| Honduras | 14 | 0.1% |
| India | 7 | 0.0% |
| Ireland | 8 | 0.0% |
| Italy | 5 | 0.0% |
| Jamaica | 25 | 0.1% |
| Latin America | 5,879 | 27.0% |
| Mexico | 5,668 | 26.0% |
| Netherlands | 126 | 0.6% |
| Northern Europe | 33 | 0.2% |
| Norway | 2 | 0.0% |
| Oceania | 11 | 0.1% |
| Peru | 26 | 0.1% |
| Philippines | 11 | 0.1% |
| Portugal | 7 | 0.0% |
| South America | 26 | 0.1% |
| South Central Asia | 9 | 0.0% |
| South Eastern Asia | 32 | 0.2% |
| Southern Europe | 63 | 0.3% |
| Spain | 51 | 0.2% |
| Thailand | 1 | 0.0% |
| Ukraine | 46 | 0.2% |
| Uzbekistan | 2 | 0.0% |
| Western Europe | 141 | 0.6% | View All 40 Rows |
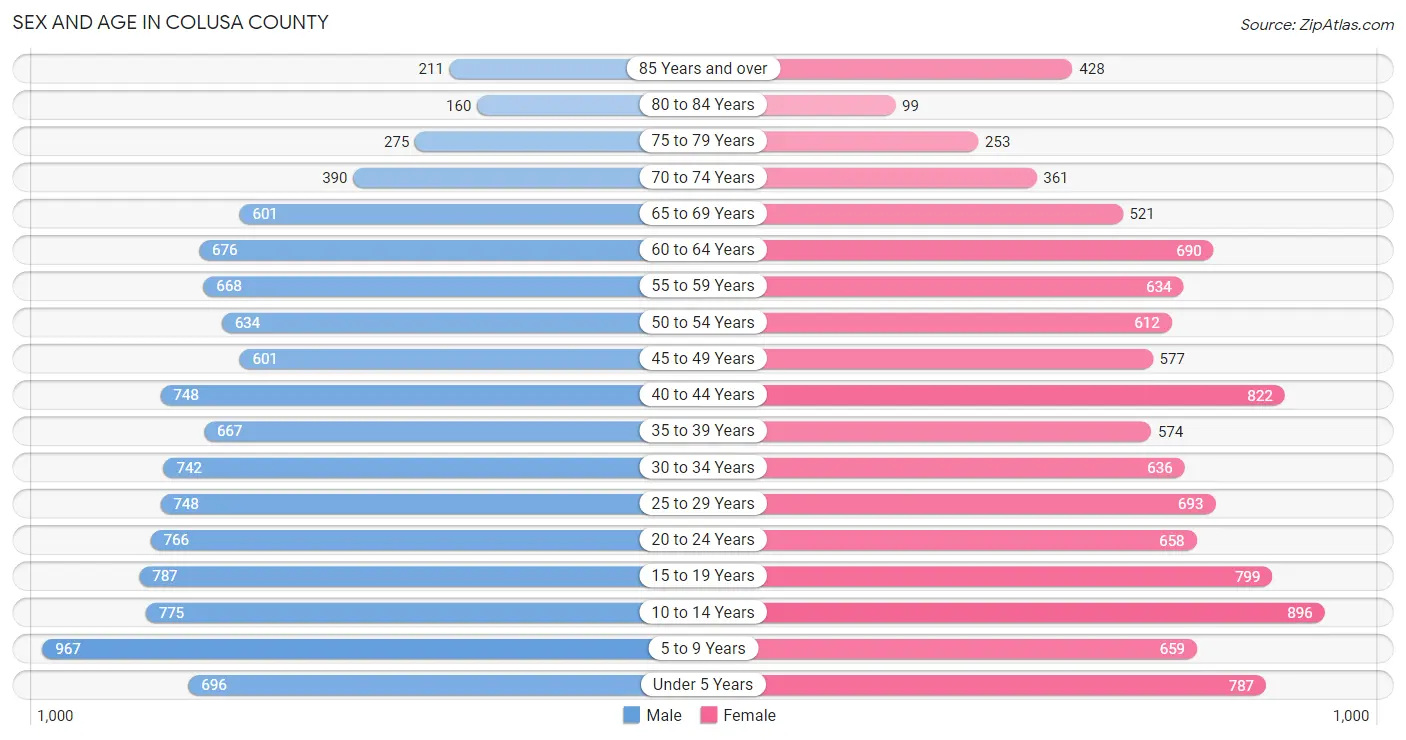
Sex and Age in Colusa County
Sex and Age in Colusa County
The most populous age groups in Colusa County are 5 to 9 Years (967 | 8.7%) for men and 10 to 14 Years (896 | 8.4%) for women.
| Age Bracket | Male | Female |
| Under 5 Years | 696 (6.3%) | 787 (7.4%) |
| 5 to 9 Years | 967 (8.7%) | 659 (6.2%) |
| 10 to 14 Years | 775 (7.0%) | 896 (8.4%) |
| 15 to 19 Years | 787 (7.1%) | 799 (7.5%) |
| 20 to 24 Years | 766 (6.9%) | 658 (6.1%) |
| 25 to 29 Years | 748 (6.7%) | 693 (6.5%) |
| 30 to 34 Years | 742 (6.7%) | 636 (5.9%) |
| 35 to 39 Years | 667 (6.0%) | 574 (5.4%) |
| 40 to 44 Years | 748 (6.7%) | 822 (7.7%) |
| 45 to 49 Years | 601 (5.4%) | 577 (5.4%) |
| 50 to 54 Years | 634 (5.7%) | 612 (5.7%) |
| 55 to 59 Years | 668 (6.0%) | 634 (5.9%) |
| 60 to 64 Years | 676 (6.1%) | 690 (6.5%) |
| 65 to 69 Years | 601 (5.4%) | 521 (4.9%) |
| 70 to 74 Years | 390 (3.5%) | 361 (3.4%) |
| 75 to 79 Years | 275 (2.5%) | 253 (2.4%) |
| 80 to 84 Years | 160 (1.4%) | 99 (0.9%) |
| 85 Years and over | 211 (1.9%) | 428 (4.0%) |
| Total | 11,112 (100.0%) | 10,699 (100.0%) |
Families and Households in Colusa County
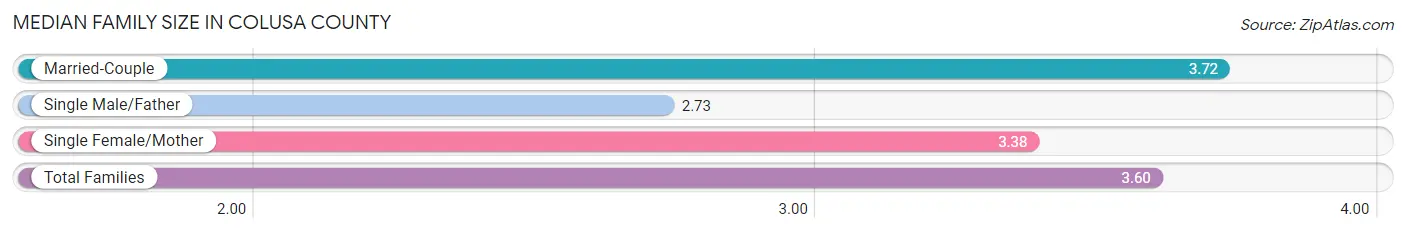
Median Family Size in Colusa County
The median family size in Colusa County is 3.60 persons per family, with married-couple families (3,975 | 77.0%) accounting for the largest median family size of 3.72 persons per family. On the other hand, single male/father families (372 | 7.2%) represent the smallest median family size with 2.73 persons per family.
| Family Type | # Families | Family Size |
| Married-Couple | 3,975 (77.0%) | 3.72 |
| Single Male/Father | 372 (7.2%) | 2.73 |
| Single Female/Mother | 817 (15.8%) | 3.38 |
| Total Families | 5,164 (100.0%) | 3.60 |
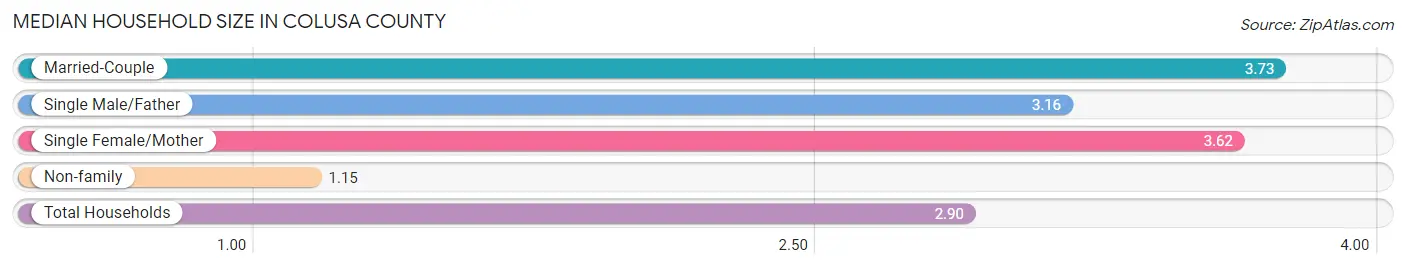
Median Household Size in Colusa County
The median household size in Colusa County is 2.90 persons per household, with married-couple households (3,975 | 53.5%) accounting for the largest median household size of 3.73 persons per household. non-family households (2,268 | 30.5%) represent the smallest median household size with 1.15 persons per household.
| Household Type | # Households | Household Size |
| Married-Couple | 3,975 (53.5%) | 3.73 |
| Single Male/Father | 372 (5.0%) | 3.16 |
| Single Female/Mother | 817 (11.0%) | 3.62 |
| Non-family | 2,268 (30.5%) | 1.15 |
| Total Households | 7,432 (100.0%) | 2.90 |
Household Size by Marriage Status in Colusa County
Out of a total of 7,432 households in Colusa County, 5,164 (69.5%) are family households, while 2,268 (30.5%) are nonfamily households. The most numerous type of family households are 2-person households, comprising 1,869, and the most common type of nonfamily households are 1-person households, comprising 1,962.
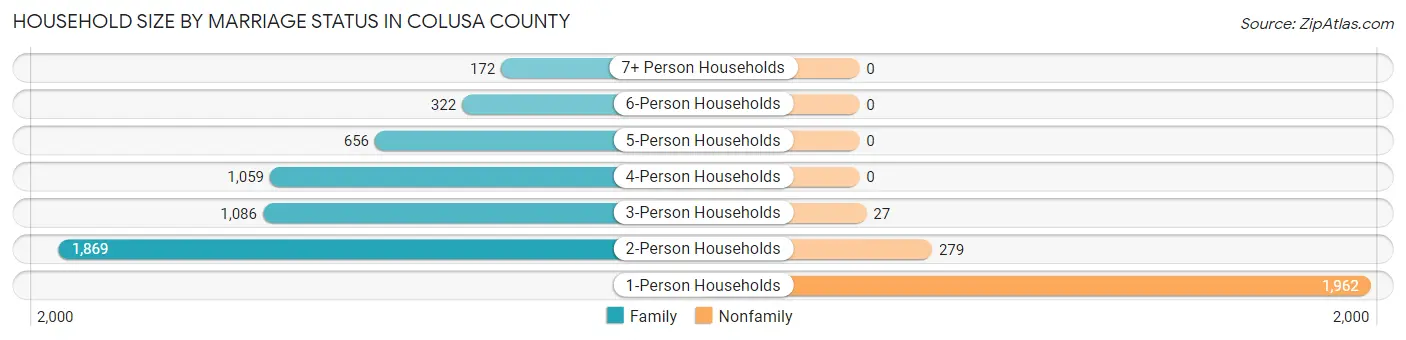
| Household Size | Family Households | Nonfamily Households |
| 1-Person Households | - | 1,962 (26.4%) |
| 2-Person Households | 1,869 (25.2%) | 279 (3.7%) |
| 3-Person Households | 1,086 (14.6%) | 27 (0.4%) |
| 4-Person Households | 1,059 (14.2%) | 0 (0.0%) |
| 5-Person Households | 656 (8.8%) | 0 (0.0%) |
| 6-Person Households | 322 (4.3%) | 0 (0.0%) |
| 7+ Person Households | 172 (2.3%) | 0 (0.0%) |
| Total | 5,164 (69.5%) | 2,268 (30.5%) |
Female Fertility in Colusa County
Fertility by Age in Colusa County
Average fertility rate in Colusa County is 61.0 births per 1,000 women. Women in the age bracket of 20 to 34 years have the highest fertility rate with 127.0 births per 1,000 women. Women in the age bracket of 20 to 34 years acount for 84.9% of all women with births.
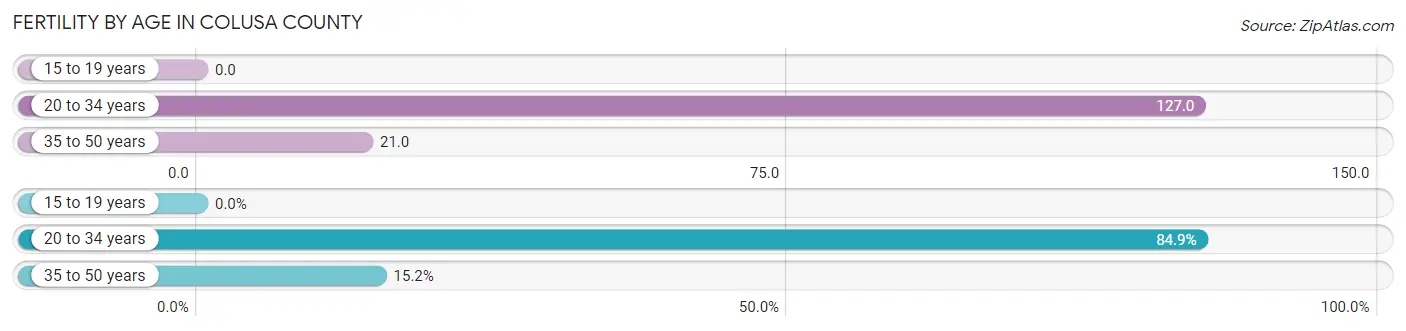
| Age Bracket | Women with Births | Births / 1,000 Women |
| 15 to 19 years | 0 (0.0%) | 0.0 |
| 20 to 34 years | 252 (84.9%) | 127.0 |
| 35 to 50 years | 45 (15.1%) | 21.0 |
| Total | 297 (100.0%) | 61.0 |
Fertility by Age by Marriage Status in Colusa County
75.1% of women with births (297) in Colusa County are married. The highest percentage of unmarried women with births falls into 20 to 34 years age bracket with 29.4% of them unmarried at the time of birth, while the lowest percentage of unmarried women with births belong to 35 to 50 years age bracket with 0.0% of them unmarried.
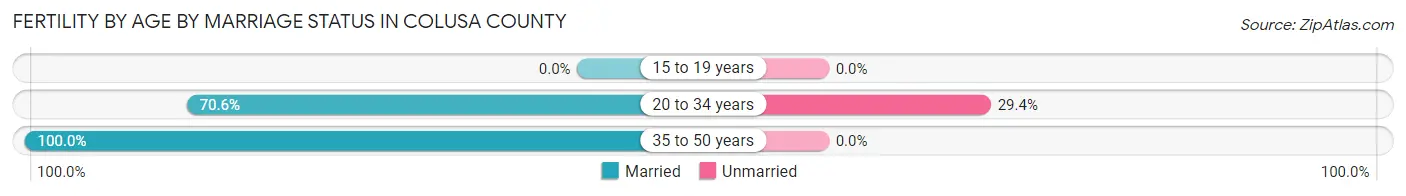
| Age Bracket | Married | Unmarried |
| 15 to 19 years | 0 (0.0%) | 0 (0.0%) |
| 20 to 34 years | 178 (70.6%) | 74 (29.4%) |
| 35 to 50 years | 45 (100.0%) | 0 (0.0%) |
| Total | 223 (75.1%) | 74 (24.9%) |
Fertility by Education in Colusa County
Average fertility rate in Colusa County is 61.0 births per 1,000 women. Women with the education attainment of bachelor's degree have the highest fertility rate of 227.0 births per 1,000 women, while women with the education attainment of high school diploma have the lowest fertility at 9.0 births per 1,000 women. Women with the education attainment of bachelor's degree represent 41.4% of all women with births.
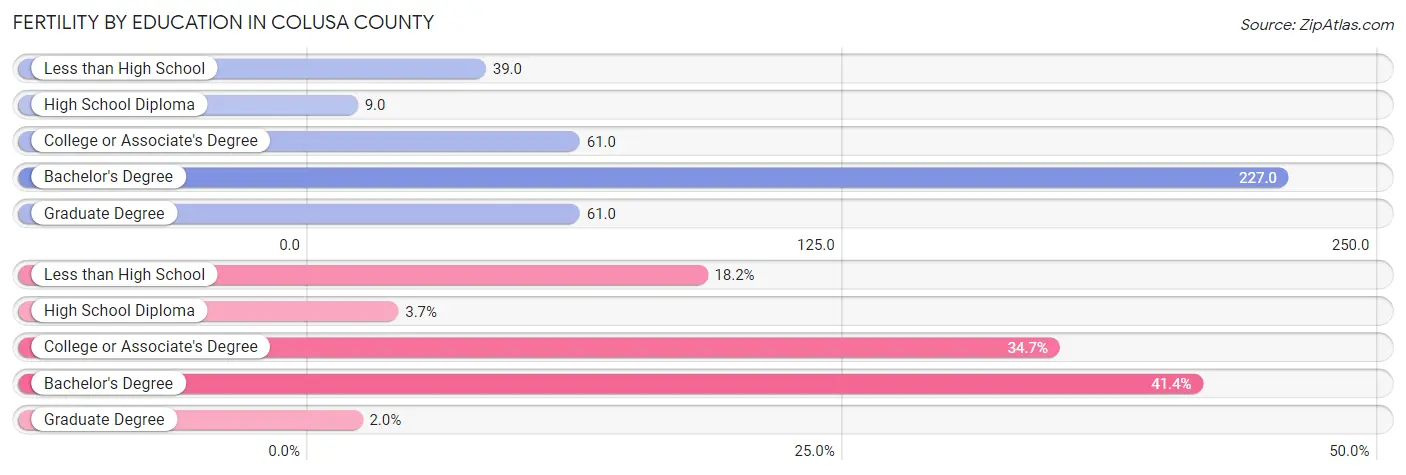
| Educational Attainment | Women with Births | Births / 1,000 Women |
| Less than High School | 54 (18.2%) | 39.0 |
| High School Diploma | 11 (3.7%) | 9.0 |
| College or Associate's Degree | 103 (34.7%) | 61.0 |
| Bachelor's Degree | 123 (41.4%) | 227.0 |
| Graduate Degree | 6 (2.0%) | 61.0 |
| Total | 297 (100.0%) | 61.0 |
Fertility by Education by Marriage Status in Colusa County
24.9% of women with births in Colusa County are unmarried. Women with the educational attainment of less than high school are most likely to be married with 100.0% of them married at childbirth, while women with the educational attainment of bachelor's degree are least likely to be married with 41.5% of them unmarried at childbirth.
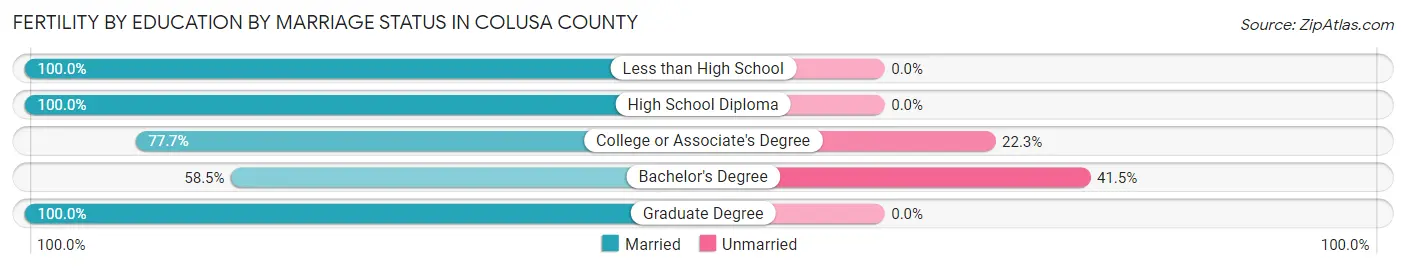
| Educational Attainment | Married | Unmarried |
| Less than High School | 54 (100.0%) | 0 (0.0%) |
| High School Diploma | 11 (100.0%) | 0 (0.0%) |
| College or Associate's Degree | 80 (77.7%) | 23 (22.3%) |
| Bachelor's Degree | 72 (58.5%) | 51 (41.5%) |
| Graduate Degree | 6 (100.0%) | 0 (0.0%) |
| Total | 223 (75.1%) | 74 (24.9%) |
Employment Characteristics in Colusa County
Employment by Class of Employer in Colusa County
Among the 9,477 employed individuals in Colusa County, private company employees (6,033 | 63.7%), local government employees (1,136 | 12.0%), and self-employed (not incorporated) (930 | 9.8%) make up the most common classes of employment.
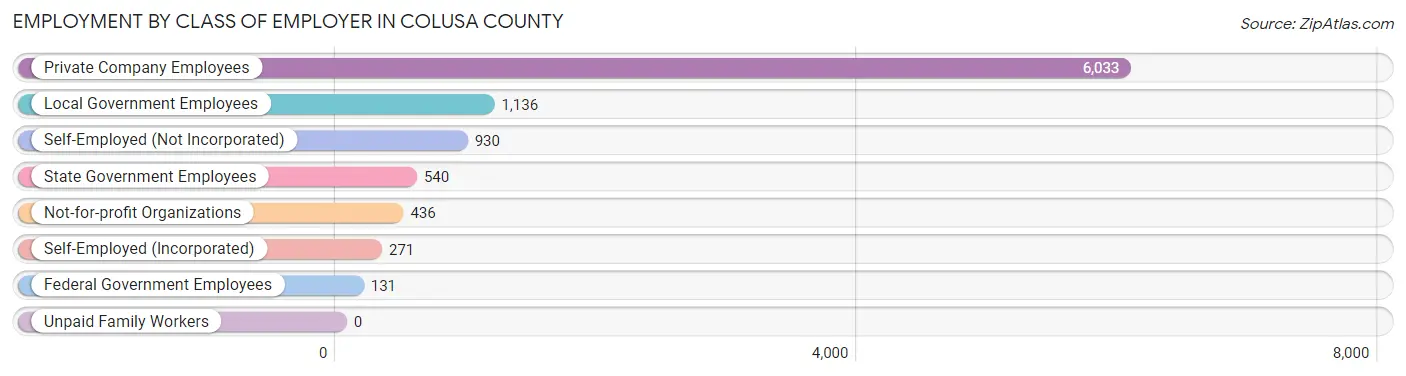
| Employer Class | # Employees | % Employees |
| Private Company Employees | 6,033 | 63.7% |
| Self-Employed (Incorporated) | 271 | 2.9% |
| Self-Employed (Not Incorporated) | 930 | 9.8% |
| Not-for-profit Organizations | 436 | 4.6% |
| Local Government Employees | 1,136 | 12.0% |
| State Government Employees | 540 | 5.7% |
| Federal Government Employees | 131 | 1.4% |
| Unpaid Family Workers | 0 | 0.0% |
| Total | 9,477 | 100.0% |
Employment Status by Age in Colusa County
According to the labor force statistics for Colusa County, out of the total population over 16 years of age (16,640), 63.1% or 10,500 individuals are in the labor force, with 7.4% or 777 of them unemployed. The age group with the highest labor force participation rate is 30 to 34 years, with 82.3% or 1,134 individuals in the labor force. Within the labor force, the 16 to 19 years age range has the highest percentage of unemployed individuals, with 11.2% or 38 of them being unemployed.
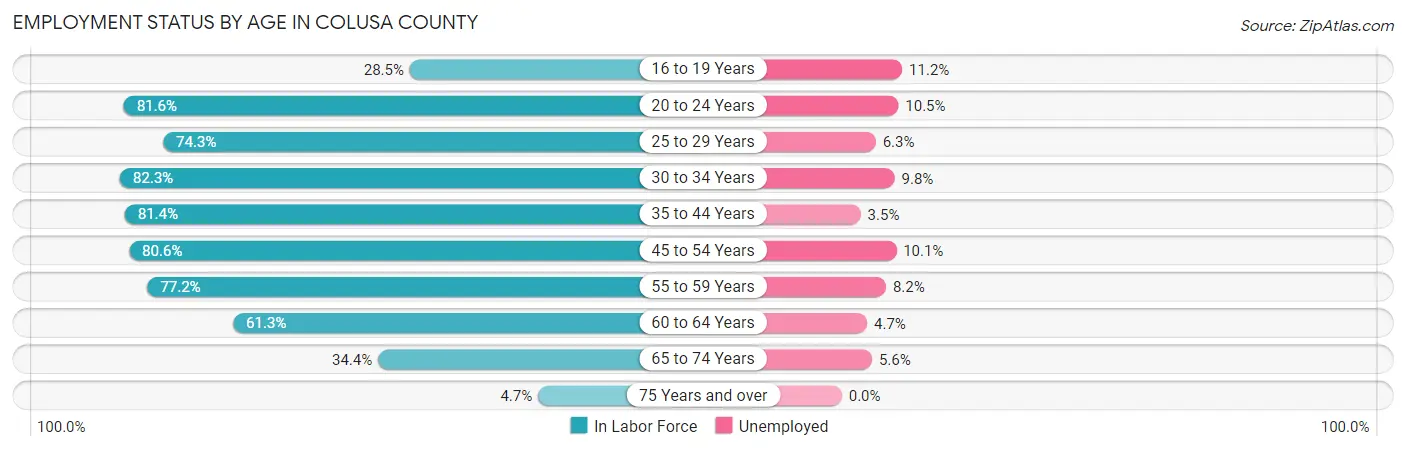
| Age Bracket | In Labor Force | Unemployed |
| 16 to 19 Years | 341 (28.5%) | 38 (11.2%) |
| 20 to 24 Years | 1,162 (81.6%) | 122 (10.5%) |
| 25 to 29 Years | 1,071 (74.3%) | 67 (6.3%) |
| 30 to 34 Years | 1,134 (82.3%) | 111 (9.8%) |
| 35 to 44 Years | 2,288 (81.4%) | 80 (3.5%) |
| 45 to 54 Years | 1,954 (80.6%) | 197 (10.1%) |
| 55 to 59 Years | 1,005 (77.2%) | 82 (8.2%) |
| 60 to 64 Years | 837 (61.3%) | 39 (4.7%) |
| 65 to 74 Years | 644 (34.4%) | 36 (5.6%) |
| 75 Years and over | 67 (4.7%) | 0 (0.0%) |
| Total | 10,500 (63.1%) | 777 (7.4%) |
Employment Status by Educational Attainment in Colusa County
According to labor force statistics for Colusa County, 77.3% of individuals (8,288) out of the total population between 25 and 64 years of age (10,722) are in the labor force, with 7.0% or 580 of them being unemployed. The group with the highest labor force participation rate are those with the educational attainment of bachelor's degree or higher, with 87.4% or 1,230 individuals in the labor force. Within the labor force, individuals with less than high school education have the highest percentage of unemployment, with 14.7% or 317 of them being unemployed.
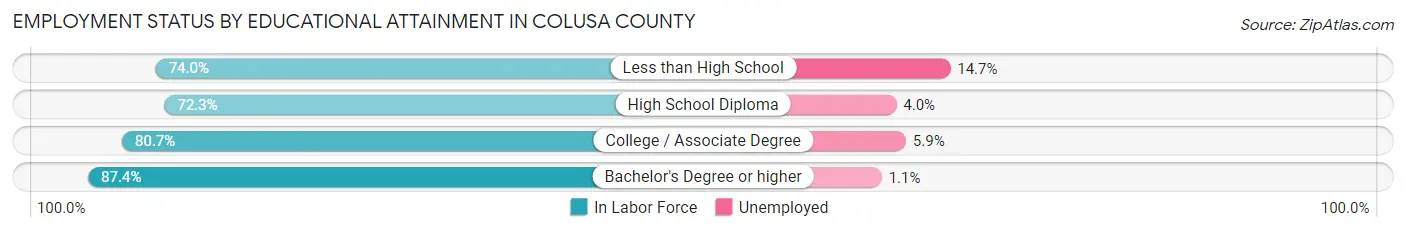
| Educational Attainment | In Labor Force | Unemployed |
| Less than High School | 2,157 (74.0%) | 429 (14.7%) |
| High School Diploma | 2,264 (72.3%) | 125 (4.0%) |
| College / Associate Degree | 2,638 (80.7%) | 193 (5.9%) |
| Bachelor's Degree or higher | 1,230 (87.4%) | 15 (1.1%) |
| Total | 8,288 (77.3%) | 751 (7.0%) |
Employment Occupations by Sex in Colusa County
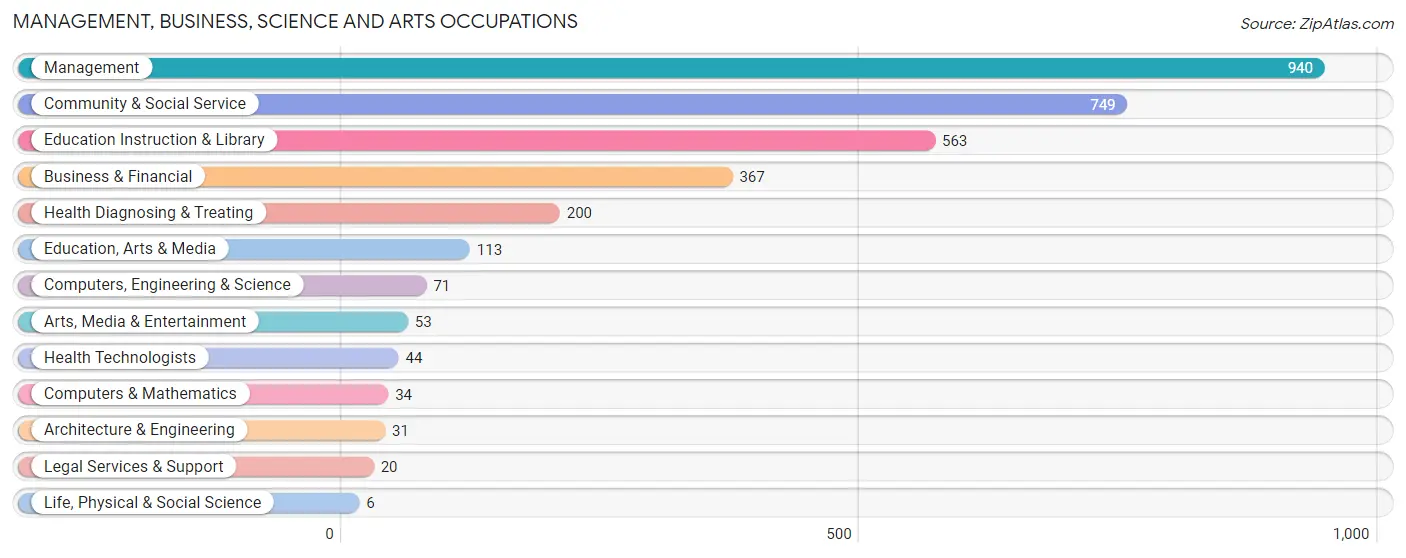
Management, Business, Science and Arts Occupations
The most common Management, Business, Science and Arts occupations in Colusa County are Management (940 | 9.7%), Community & Social Service (749 | 7.7%), Education Instruction & Library (563 | 5.8%), Business & Financial (367 | 3.8%), and Health Diagnosing & Treating (200 | 2.1%).
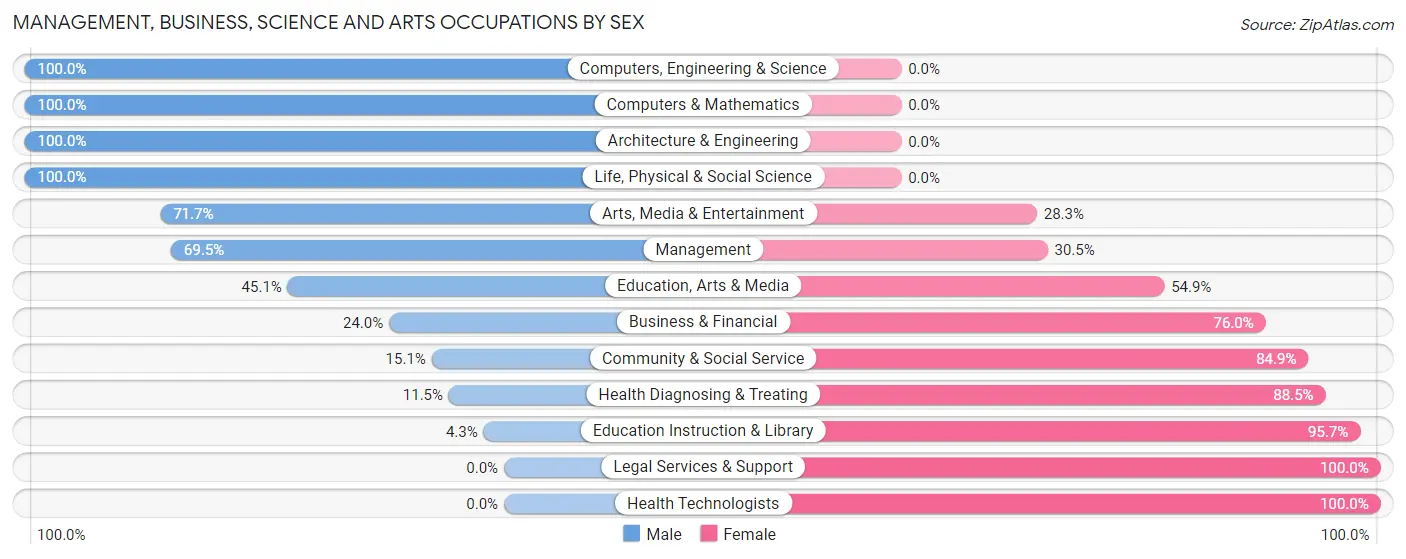
Management, Business, Science and Arts Occupations by Sex
Within the Management, Business, Science and Arts occupations in Colusa County, the most male-oriented occupations are Computers, Engineering & Science (100.0%), Computers & Mathematics (100.0%), and Architecture & Engineering (100.0%), while the most female-oriented occupations are Legal Services & Support (100.0%), Health Technologists (100.0%), and Education Instruction & Library (95.7%).
| Occupation | Male | Female |
| Management | 653 (69.5%) | 287 (30.5%) |
| Business & Financial | 88 (24.0%) | 279 (76.0%) |
| Computers, Engineering & Science | 71 (100.0%) | 0 (0.0%) |
| Computers & Mathematics | 34 (100.0%) | 0 (0.0%) |
| Architecture & Engineering | 31 (100.0%) | 0 (0.0%) |
| Life, Physical & Social Science | 6 (100.0%) | 0 (0.0%) |
| Community & Social Service | 113 (15.1%) | 636 (84.9%) |
| Education, Arts & Media | 51 (45.1%) | 62 (54.9%) |
| Legal Services & Support | 0 (0.0%) | 20 (100.0%) |
| Education Instruction & Library | 24 (4.3%) | 539 (95.7%) |
| Arts, Media & Entertainment | 38 (71.7%) | 15 (28.3%) |
| Health Diagnosing & Treating | 23 (11.5%) | 177 (88.5%) |
| Health Technologists | 0 (0.0%) | 44 (100.0%) |
| Total (Category) | 948 (40.7%) | 1,379 (59.3%) |
| Total (Overall) | 5,454 (56.1%) | 4,274 (43.9%) |
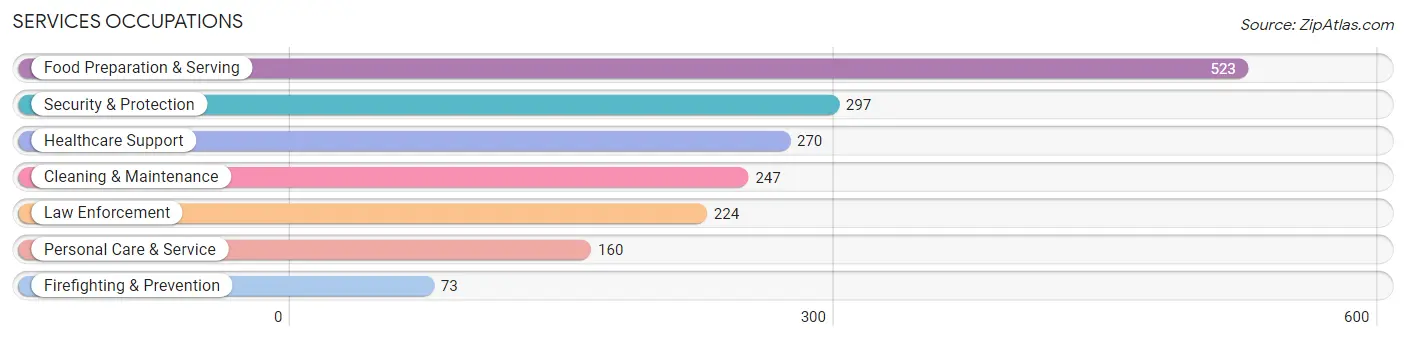
Services Occupations
The most common Services occupations in Colusa County are Food Preparation & Serving (523 | 5.4%), Security & Protection (297 | 3.0%), Healthcare Support (270 | 2.8%), Cleaning & Maintenance (247 | 2.5%), and Law Enforcement (224 | 2.3%).
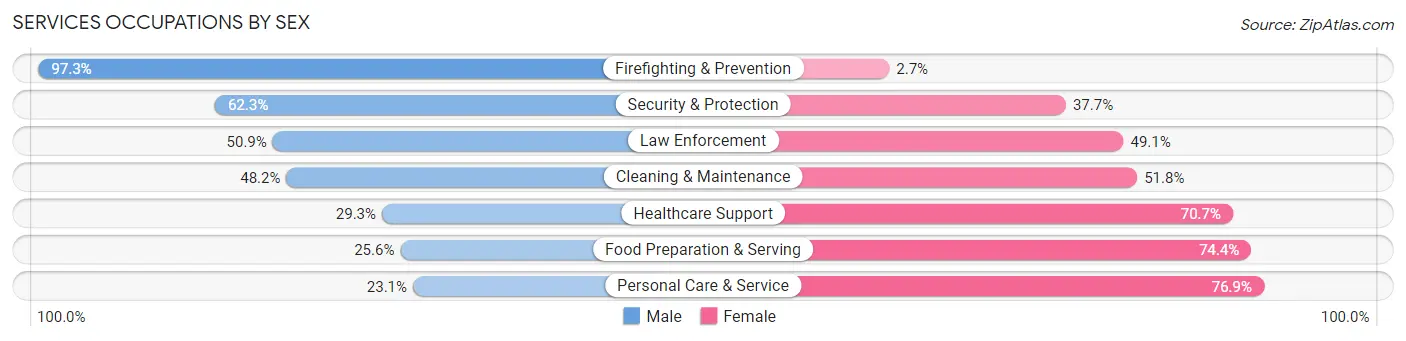
Services Occupations by Sex
Within the Services occupations in Colusa County, the most male-oriented occupations are Firefighting & Prevention (97.3%), Security & Protection (62.3%), and Law Enforcement (50.9%), while the most female-oriented occupations are Personal Care & Service (76.9%), Food Preparation & Serving (74.4%), and Healthcare Support (70.7%).
| Occupation | Male | Female |
| Healthcare Support | 79 (29.3%) | 191 (70.7%) |
| Security & Protection | 185 (62.3%) | 112 (37.7%) |
| Firefighting & Prevention | 71 (97.3%) | 2 (2.7%) |
| Law Enforcement | 114 (50.9%) | 110 (49.1%) |
| Food Preparation & Serving | 134 (25.6%) | 389 (74.4%) |
| Cleaning & Maintenance | 119 (48.2%) | 128 (51.8%) |
| Personal Care & Service | 37 (23.1%) | 123 (76.9%) |
| Total (Category) | 554 (37.0%) | 943 (63.0%) |
| Total (Overall) | 5,454 (56.1%) | 4,274 (43.9%) |
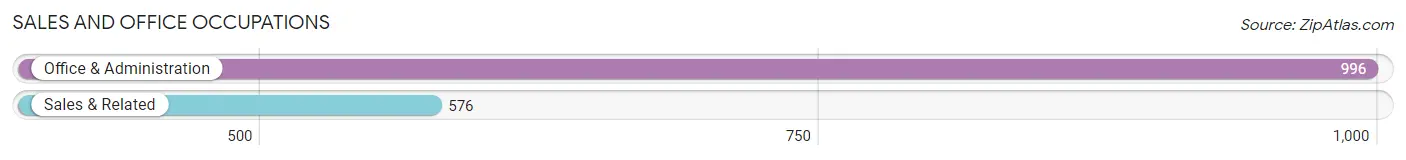
Sales and Office Occupations
The most common Sales and Office occupations in Colusa County are Office & Administration (996 | 10.2%), and Sales & Related (576 | 5.9%).
Sales and Office Occupations by Sex
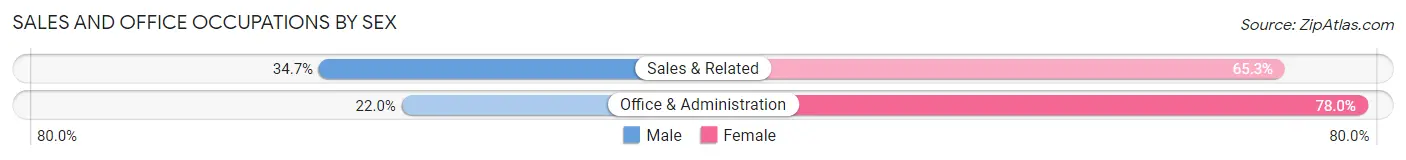
| Occupation | Male | Female |
| Sales & Related | 200 (34.7%) | 376 (65.3%) |
| Office & Administration | 219 (22.0%) | 777 (78.0%) |
| Total (Category) | 419 (26.7%) | 1,153 (73.4%) |
| Total (Overall) | 5,454 (56.1%) | 4,274 (43.9%) |
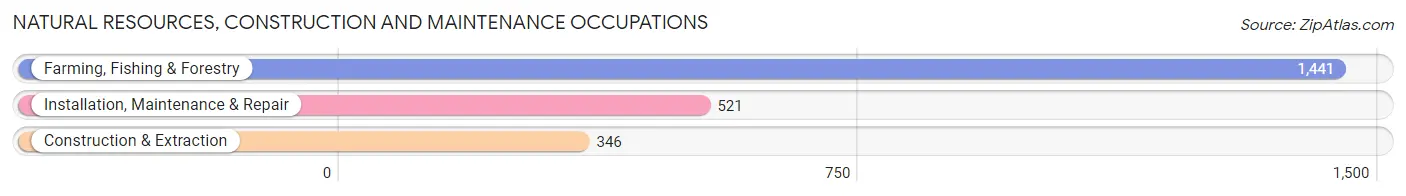
Natural Resources, Construction and Maintenance Occupations
The most common Natural Resources, Construction and Maintenance occupations in Colusa County are Farming, Fishing & Forestry (1,441 | 14.8%), Installation, Maintenance & Repair (521 | 5.4%), and Construction & Extraction (346 | 3.6%).
Natural Resources, Construction and Maintenance Occupations by Sex
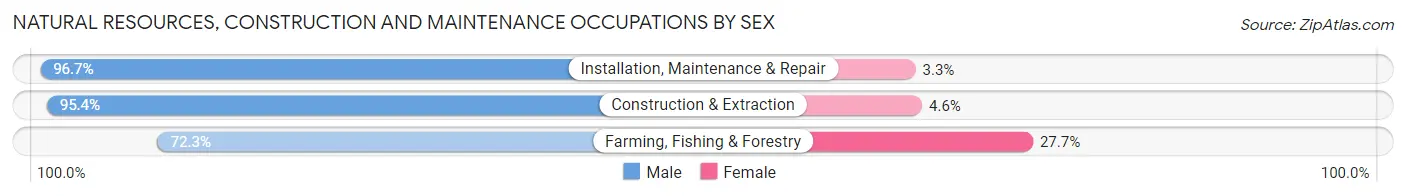
| Occupation | Male | Female |
| Farming, Fishing & Forestry | 1,042 (72.3%) | 399 (27.7%) |
| Construction & Extraction | 330 (95.4%) | 16 (4.6%) |
| Installation, Maintenance & Repair | 504 (96.7%) | 17 (3.3%) |
| Total (Category) | 1,876 (81.3%) | 432 (18.7%) |
| Total (Overall) | 5,454 (56.1%) | 4,274 (43.9%) |
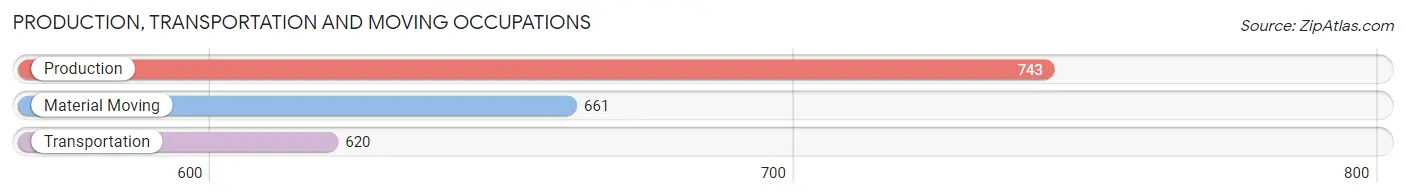
Production, Transportation and Moving Occupations
The most common Production, Transportation and Moving occupations in Colusa County are Production (743 | 7.6%), Material Moving (661 | 6.8%), and Transportation (620 | 6.4%).
Production, Transportation and Moving Occupations by Sex
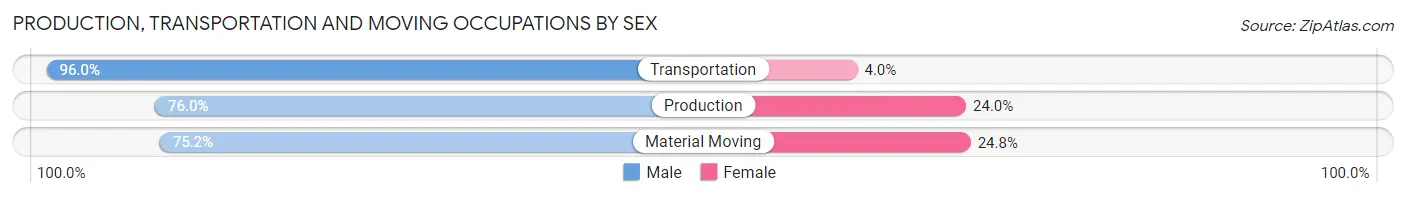
| Occupation | Male | Female |
| Production | 565 (76.0%) | 178 (24.0%) |
| Transportation | 595 (96.0%) | 25 (4.0%) |
| Material Moving | 497 (75.2%) | 164 (24.8%) |
| Total (Category) | 1,657 (81.9%) | 367 (18.1%) |
| Total (Overall) | 5,454 (56.1%) | 4,274 (43.9%) |
Employment Industries by Sex in Colusa County
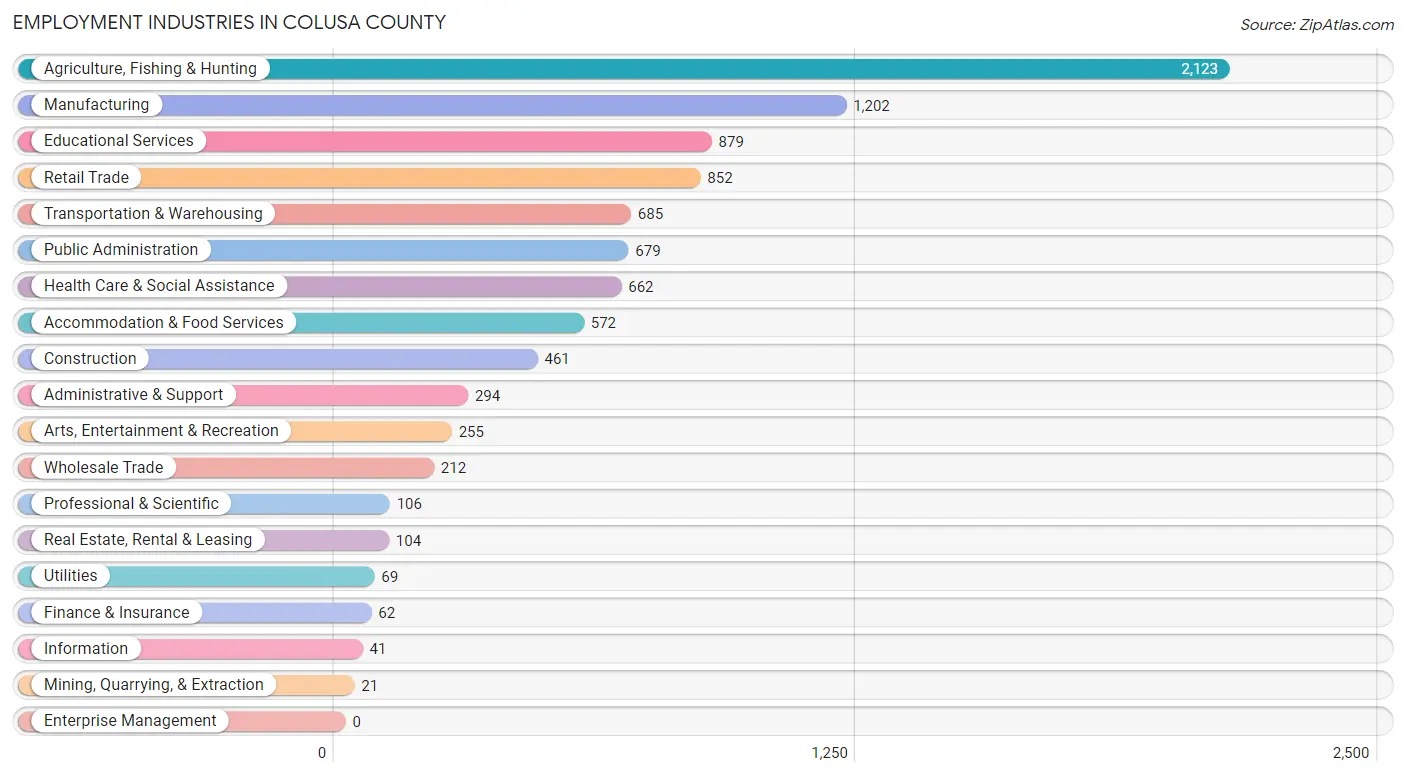
Employment Industries in Colusa County
The major employment industries in Colusa County include Agriculture, Fishing & Hunting (2,123 | 21.8%), Manufacturing (1,202 | 12.4%), Educational Services (879 | 9.0%), Retail Trade (852 | 8.8%), and Transportation & Warehousing (685 | 7.0%).
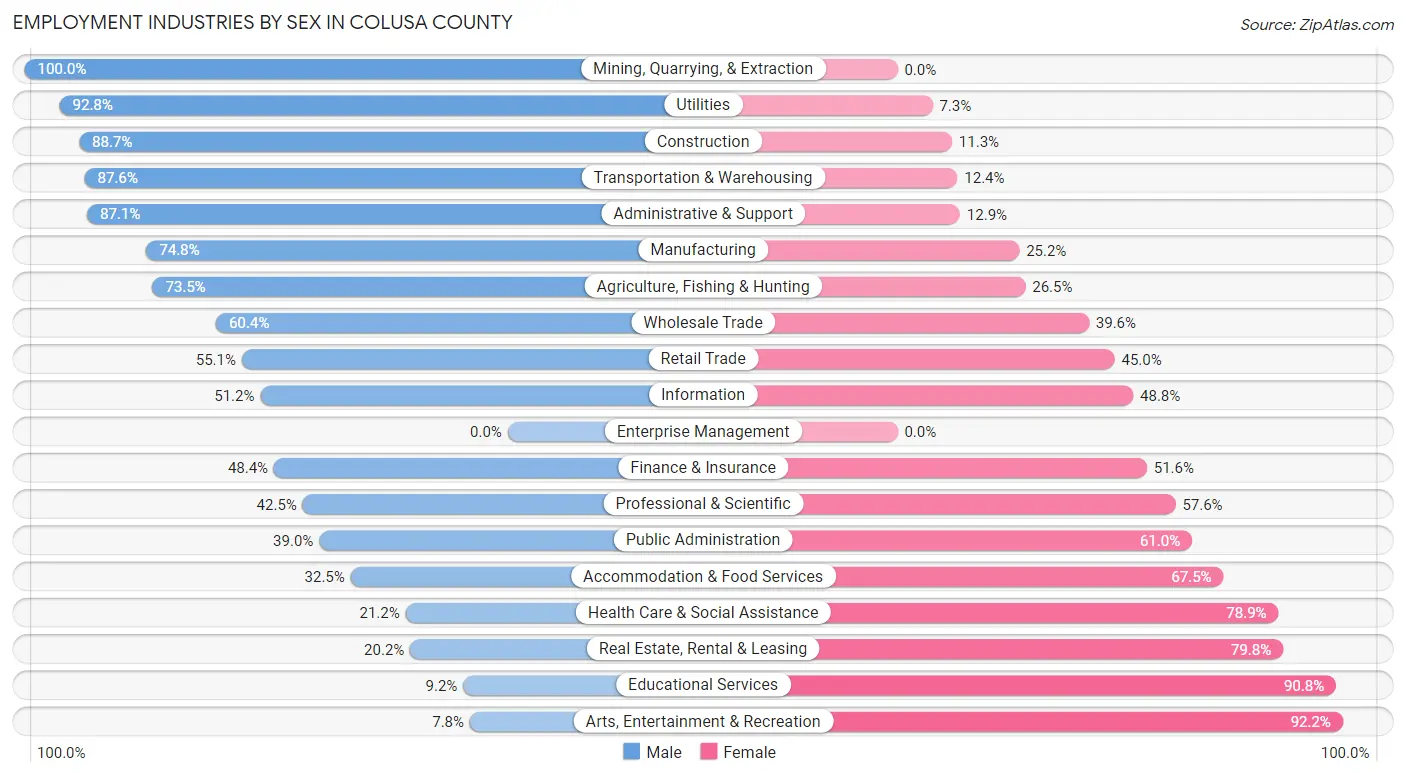
Employment Industries by Sex in Colusa County
The Colusa County industries that see more men than women are Mining, Quarrying, & Extraction (100.0%), Utilities (92.7%), and Construction (88.7%), whereas the industries that tend to have a higher number of women are Arts, Entertainment & Recreation (92.2%), Educational Services (90.8%), and Real Estate, Rental & Leasing (79.8%).
| Industry | Male | Female |
| Agriculture, Fishing & Hunting | 1,561 (73.5%) | 562 (26.5%) |
| Mining, Quarrying, & Extraction | 21 (100.0%) | 0 (0.0%) |
| Construction | 409 (88.7%) | 52 (11.3%) |
| Manufacturing | 899 (74.8%) | 303 (25.2%) |
| Wholesale Trade | 128 (60.4%) | 84 (39.6%) |
| Retail Trade | 469 (55.0%) | 383 (45.0%) |
| Transportation & Warehousing | 600 (87.6%) | 85 (12.4%) |
| Utilities | 64 (92.7%) | 5 (7.2%) |
| Information | 21 (51.2%) | 20 (48.8%) |
| Finance & Insurance | 30 (48.4%) | 32 (51.6%) |
| Real Estate, Rental & Leasing | 21 (20.2%) | 83 (79.8%) |
| Professional & Scientific | 45 (42.4%) | 61 (57.6%) |
| Enterprise Management | 0 (0.0%) | 0 (0.0%) |
| Administrative & Support | 256 (87.1%) | 38 (12.9%) |
| Educational Services | 81 (9.2%) | 798 (90.8%) |
| Health Care & Social Assistance | 140 (21.1%) | 522 (78.8%) |
| Arts, Entertainment & Recreation | 20 (7.8%) | 235 (92.2%) |
| Accommodation & Food Services | 186 (32.5%) | 386 (67.5%) |
| Public Administration | 265 (39.0%) | 414 (61.0%) |
| Total | 5,454 (56.1%) | 4,274 (43.9%) |
Education in Colusa County
School Enrollment in Colusa County
The most common levels of schooling among the 5,596 students in Colusa County are high school (1,449 | 25.9%), middle school (1,295 | 23.1%), and elementary school (1,278 | 22.8%).
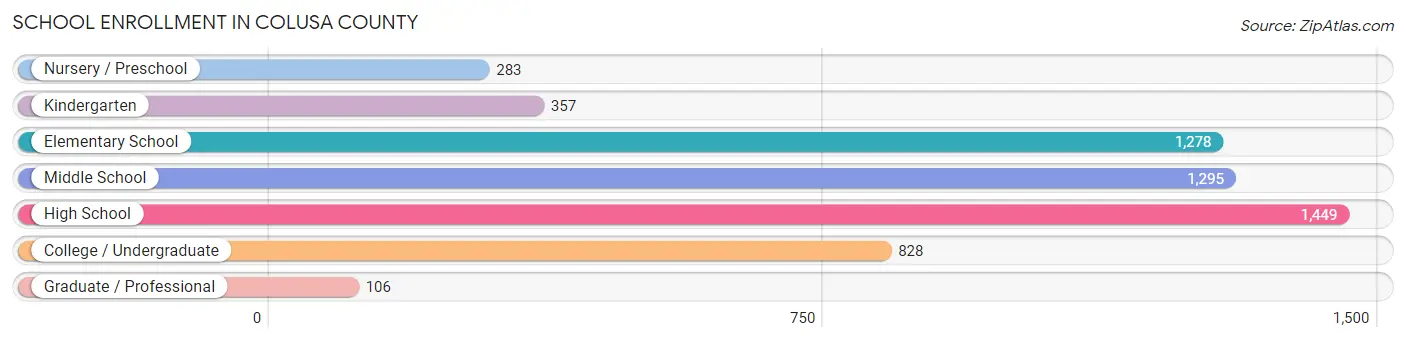
| School Level | # Students | % Students |
| Nursery / Preschool | 283 | 5.1% |
| Kindergarten | 357 | 6.4% |
| Elementary School | 1,278 | 22.8% |
| Middle School | 1,295 | 23.1% |
| High School | 1,449 | 25.9% |
| College / Undergraduate | 828 | 14.8% |
| Graduate / Professional | 106 | 1.9% |
| Total | 5,596 | 100.0% |
School Enrollment by Age by Funding Source in Colusa County
Out of a total of 5,596 students who are enrolled in schools in Colusa County, 190 (3.4%) attend a private institution, while the remaining 5,406 (96.6%) are enrolled in public schools. The age group of 3 to 4 year olds has the highest likelihood of being enrolled in private schools, with 68 (23.1% in the age bracket) enrolled. Conversely, the age group of 20 to 24 year olds has the lowest likelihood of being enrolled in a private school, with 266 (100.0% in the age bracket) attending a public institution.
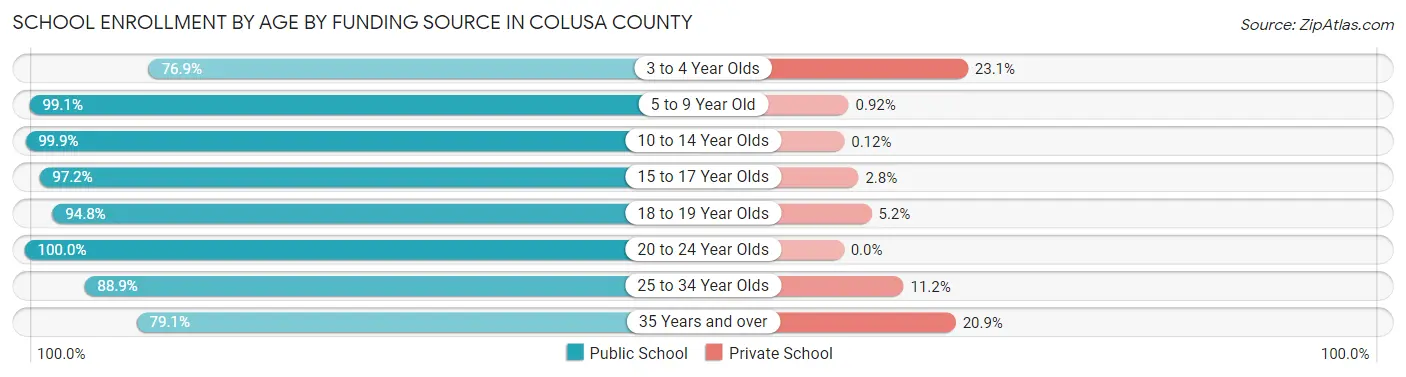
| Age Bracket | Public School | Private School |
| 3 to 4 Year Olds | 226 (76.9%) | 68 (23.1%) |
| 5 to 9 Year Old | 1,510 (99.1%) | 14 (0.9%) |
| 10 to 14 Year Olds | 1,632 (99.9%) | 2 (0.1%) |
| 15 to 17 Year Olds | 987 (97.2%) | 28 (2.8%) |
| 18 to 19 Year Olds | 420 (94.8%) | 23 (5.2%) |
| 20 to 24 Year Olds | 266 (100.0%) | 0 (0.0%) |
| 25 to 34 Year Olds | 271 (88.8%) | 34 (11.2%) |
| 35 Years and over | 91 (79.1%) | 24 (20.9%) |
| Total | 5,406 (96.6%) | 190 (3.4%) |
Educational Attainment by Field of Study in Colusa County
Business (345 | 16.1%), bio, nature & agricultural (343 | 16.0%), education (324 | 15.1%), social sciences (251 | 11.7%), and arts & humanities (151 | 7.0%) are the most common fields of study among 2,144 individuals in Colusa County who have obtained a bachelor's degree or higher.
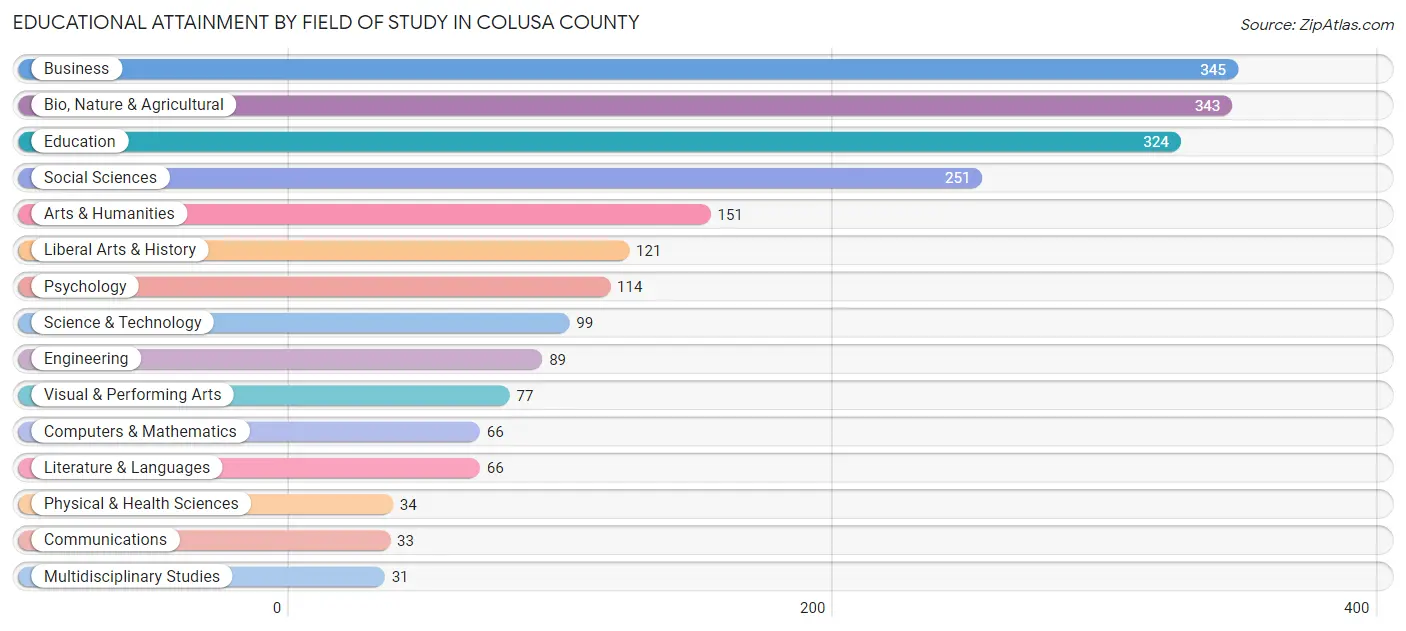
| Field of Study | # Graduates | % Graduates |
| Computers & Mathematics | 66 | 3.1% |
| Bio, Nature & Agricultural | 343 | 16.0% |
| Physical & Health Sciences | 34 | 1.6% |
| Psychology | 114 | 5.3% |
| Social Sciences | 251 | 11.7% |
| Engineering | 89 | 4.2% |
| Multidisciplinary Studies | 31 | 1.5% |
| Science & Technology | 99 | 4.6% |
| Business | 345 | 16.1% |
| Education | 324 | 15.1% |
| Literature & Languages | 66 | 3.1% |
| Liberal Arts & History | 121 | 5.6% |
| Visual & Performing Arts | 77 | 3.6% |
| Communications | 33 | 1.5% |
| Arts & Humanities | 151 | 7.0% |
| Total | 2,144 | 100.0% |
Transportation & Commute in Colusa County
Vehicle Availability by Sex in Colusa County
The most prevalent vehicle ownership categories in Colusa County are males with 3 vehicles (1,831, accounting for 34.2%) and females with 3 vehicles (1,573, making up 44.6%).
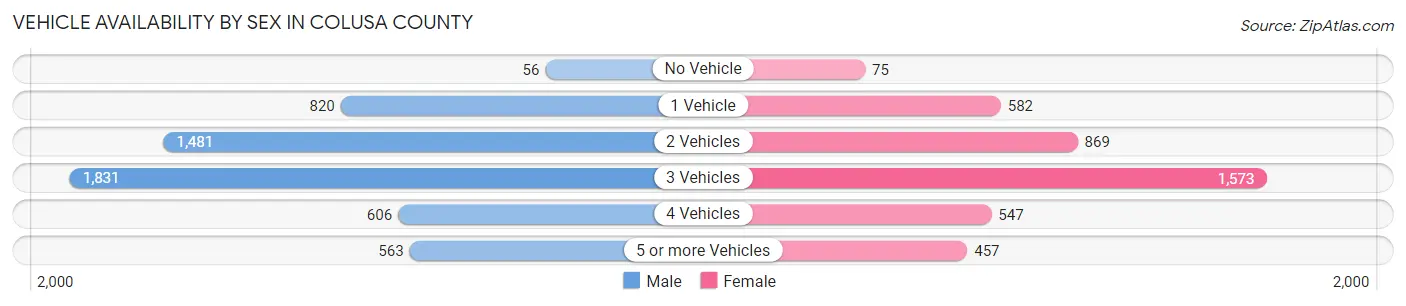
| Vehicles Available | Male | Female |
| No Vehicle | 56 (1.1%) | 75 (1.8%) |
| 1 Vehicle | 820 (15.3%) | 582 (14.2%) |
| 2 Vehicles | 1,481 (27.7%) | 869 (21.2%) |
| 3 Vehicles | 1,831 (34.2%) | 1,573 (38.3%) |
| 4 Vehicles | 606 (11.3%) | 547 (13.3%) |
| 5 or more Vehicles | 563 (10.5%) | 457 (11.1%) |
| Total | 5,357 (100.0%) | 4,103 (100.0%) |
Commute Time in Colusa County
The most frequently occuring commute durations in Colusa County are 5 to 9 minutes (1,379 commuters, 15.3%), 15 to 19 minutes (1,363 commuters, 15.1%), and 10 to 14 minutes (1,247 commuters, 13.9%).
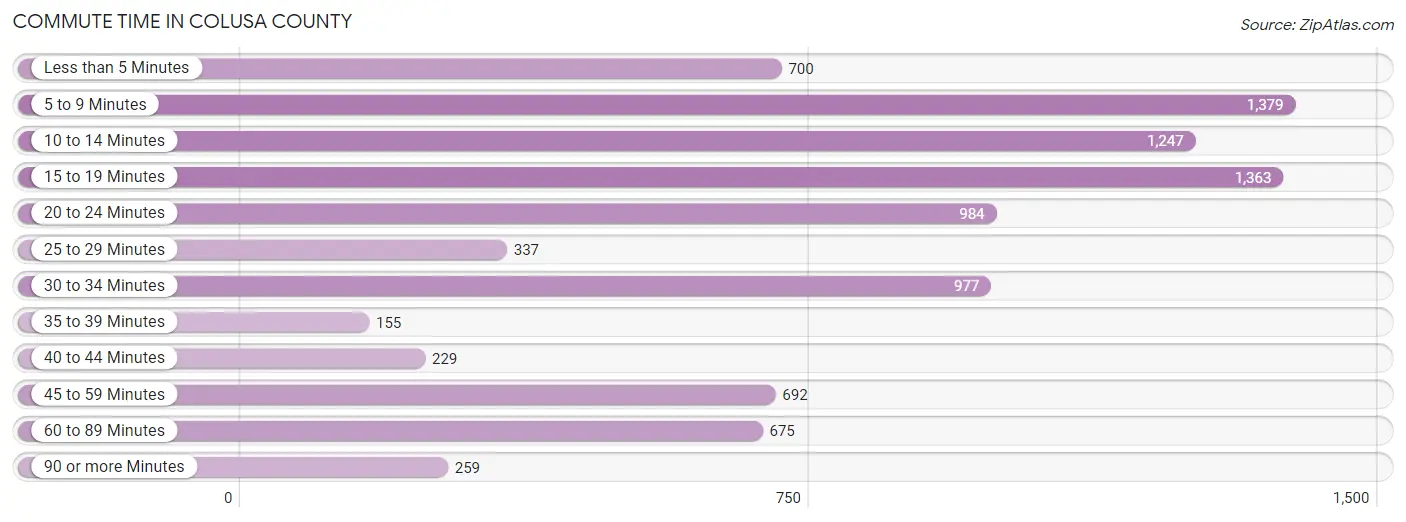
| Commute Time | # Commuters | % Commuters |
| Less than 5 Minutes | 700 | 7.8% |
| 5 to 9 Minutes | 1,379 | 15.3% |
| 10 to 14 Minutes | 1,247 | 13.9% |
| 15 to 19 Minutes | 1,363 | 15.1% |
| 20 to 24 Minutes | 984 | 10.9% |
| 25 to 29 Minutes | 337 | 3.7% |
| 30 to 34 Minutes | 977 | 10.9% |
| 35 to 39 Minutes | 155 | 1.7% |
| 40 to 44 Minutes | 229 | 2.5% |
| 45 to 59 Minutes | 692 | 7.7% |
| 60 to 89 Minutes | 675 | 7.5% |
| 90 or more Minutes | 259 | 2.9% |
Commute Time by Sex in Colusa County
The most common commute times in Colusa County are 10 to 14 minutes (810 commuters, 15.7%) for males and 5 to 9 minutes (676 commuters, 17.6%) for females.
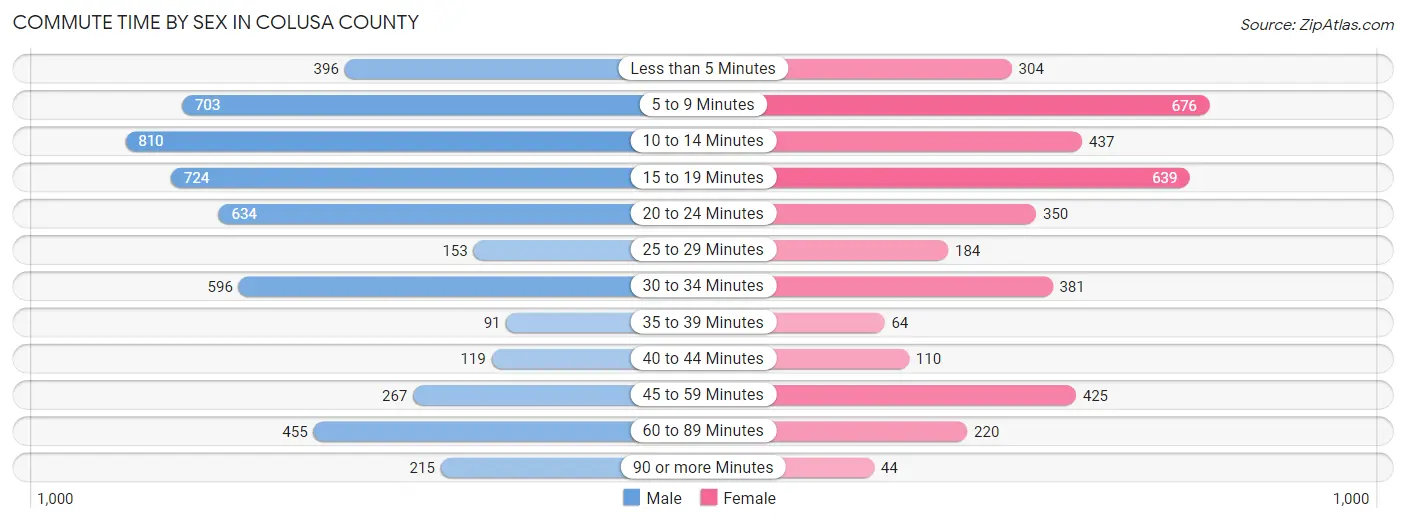
| Commute Time | Male | Female |
| Less than 5 Minutes | 396 (7.7%) | 304 (7.9%) |
| 5 to 9 Minutes | 703 (13.6%) | 676 (17.6%) |
| 10 to 14 Minutes | 810 (15.7%) | 437 (11.4%) |
| 15 to 19 Minutes | 724 (14.0%) | 639 (16.7%) |
| 20 to 24 Minutes | 634 (12.3%) | 350 (9.1%) |
| 25 to 29 Minutes | 153 (3.0%) | 184 (4.8%) |
| 30 to 34 Minutes | 596 (11.5%) | 381 (9.9%) |
| 35 to 39 Minutes | 91 (1.8%) | 64 (1.7%) |
| 40 to 44 Minutes | 119 (2.3%) | 110 (2.9%) |
| 45 to 59 Minutes | 267 (5.2%) | 425 (11.1%) |
| 60 to 89 Minutes | 455 (8.8%) | 220 (5.7%) |
| 90 or more Minutes | 215 (4.2%) | 44 (1.1%) |
Time of Departure to Work by Sex in Colusa County
The most frequent times of departure to work in Colusa County are 6:00 AM to 6:29 AM (857, 16.6%) for males and 7:00 AM to 7:29 AM (893, 23.3%) for females.
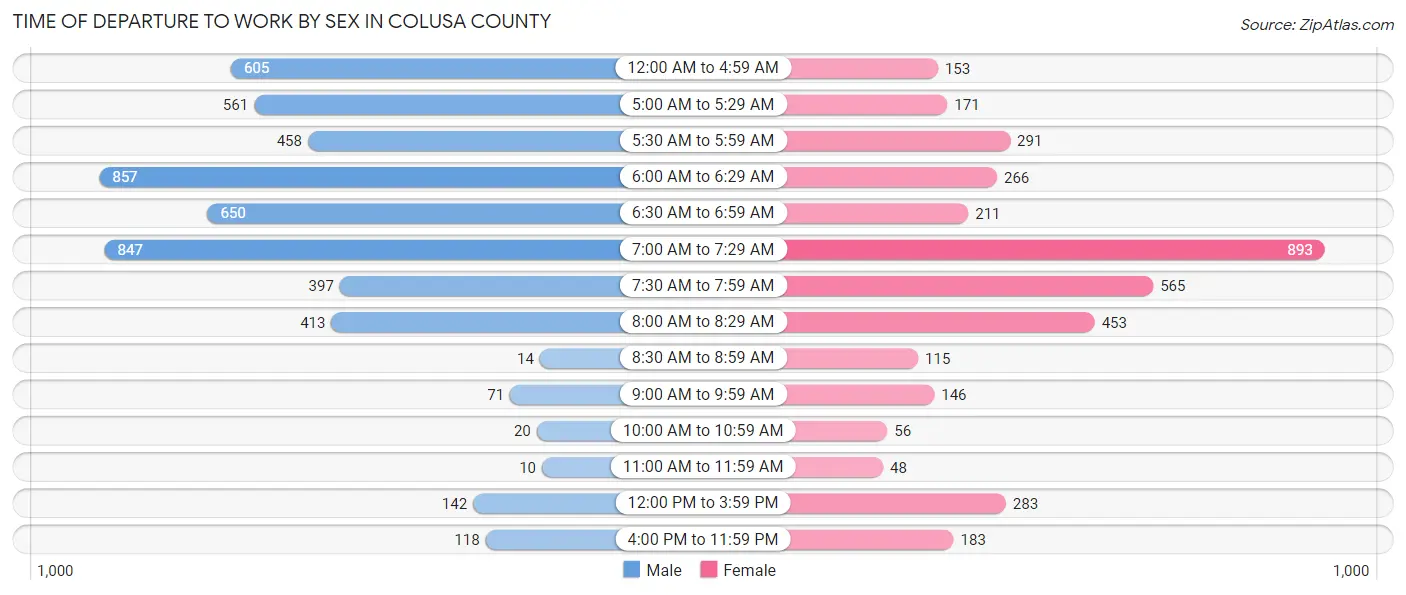
| Time of Departure | Male | Female |
| 12:00 AM to 4:59 AM | 605 (11.7%) | 153 (4.0%) |
| 5:00 AM to 5:29 AM | 561 (10.9%) | 171 (4.5%) |
| 5:30 AM to 5:59 AM | 458 (8.9%) | 291 (7.6%) |
| 6:00 AM to 6:29 AM | 857 (16.6%) | 266 (6.9%) |
| 6:30 AM to 6:59 AM | 650 (12.6%) | 211 (5.5%) |
| 7:00 AM to 7:29 AM | 847 (16.4%) | 893 (23.3%) |
| 7:30 AM to 7:59 AM | 397 (7.7%) | 565 (14.7%) |
| 8:00 AM to 8:29 AM | 413 (8.0%) | 453 (11.8%) |
| 8:30 AM to 8:59 AM | 14 (0.3%) | 115 (3.0%) |
| 9:00 AM to 9:59 AM | 71 (1.4%) | 146 (3.8%) |
| 10:00 AM to 10:59 AM | 20 (0.4%) | 56 (1.5%) |
| 11:00 AM to 11:59 AM | 10 (0.2%) | 48 (1.3%) |
| 12:00 PM to 3:59 PM | 142 (2.8%) | 283 (7.4%) |
| 4:00 PM to 11:59 PM | 118 (2.3%) | 183 (4.8%) |
| Total | 5,163 (100.0%) | 3,834 (100.0%) |
Housing Occupancy in Colusa County
Occupancy by Ownership in Colusa County
Of the total 7,432 dwellings in Colusa County, owner-occupied units account for 4,686 (63.0%), while renter-occupied units make up 2,746 (36.9%).
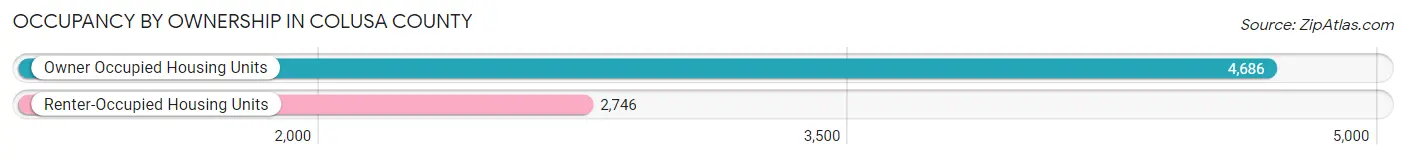
| Occupancy | # Housing Units | % Housing Units |
| Owner Occupied Housing Units | 4,686 | 63.0% |
| Renter-Occupied Housing Units | 2,746 | 36.9% |
| Total Occupied Housing Units | 7,432 | 100.0% |
Occupancy by Household Size in Colusa County
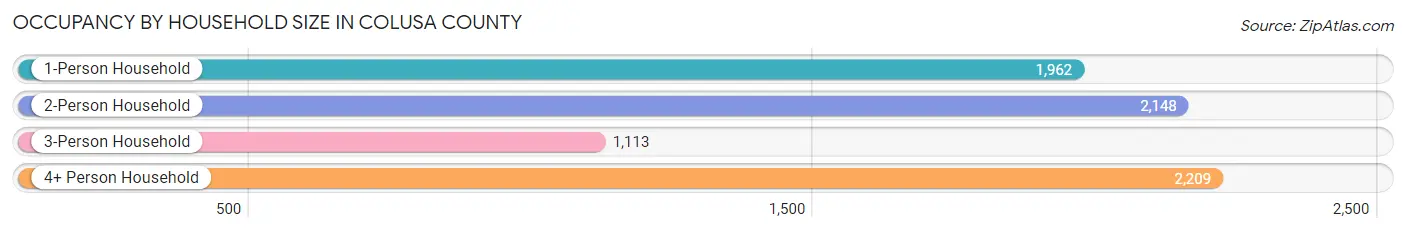
| Household Size | # Housing Units | % Housing Units |
| 1-Person Household | 1,962 | 26.4% |
| 2-Person Household | 2,148 | 28.9% |
| 3-Person Household | 1,113 | 15.0% |
| 4+ Person Household | 2,209 | 29.7% |
| Total Housing Units | 7,432 | 100.0% |
Occupancy by Ownership by Household Size in Colusa County
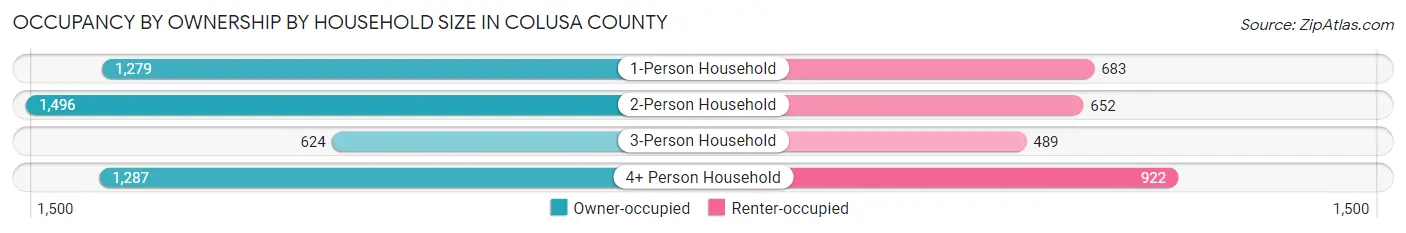
| Household Size | Owner-occupied | Renter-occupied |
| 1-Person Household | 1,279 (65.2%) | 683 (34.8%) |
| 2-Person Household | 1,496 (69.7%) | 652 (30.3%) |
| 3-Person Household | 624 (56.1%) | 489 (43.9%) |
| 4+ Person Household | 1,287 (58.3%) | 922 (41.7%) |
| Total Housing Units | 4,686 (63.0%) | 2,746 (36.9%) |
Occupancy by Educational Attainment in Colusa County
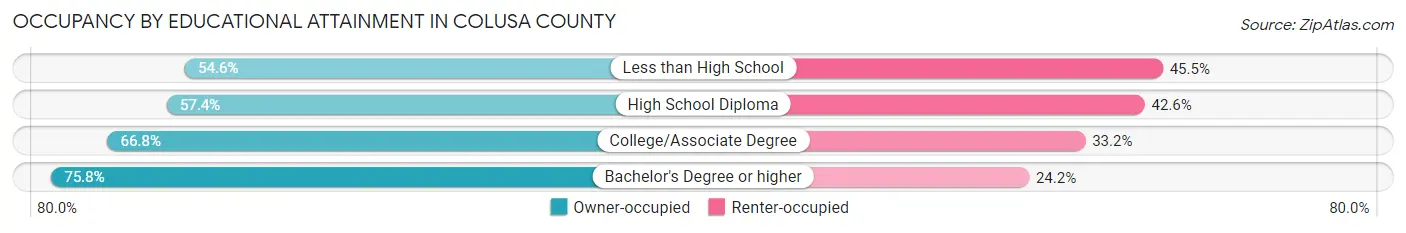
| Household Size | Owner-occupied | Renter-occupied |
| Less than High School | 972 (54.5%) | 810 (45.5%) |
| High School Diploma | 1,079 (57.4%) | 800 (42.6%) |
| College/Associate Degree | 1,663 (66.8%) | 825 (33.2%) |
| Bachelor's Degree or higher | 972 (75.8%) | 311 (24.2%) |
Occupancy by Age of Householder in Colusa County
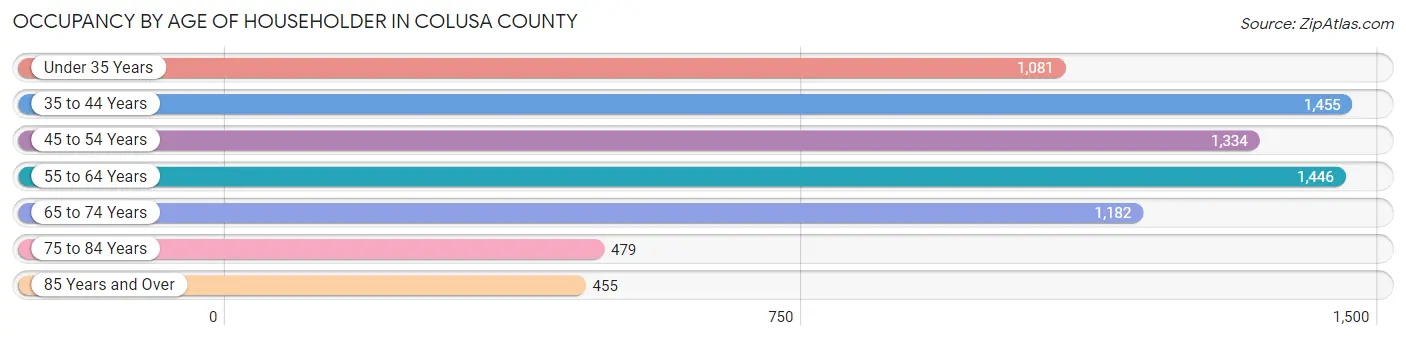
| Age Bracket | # Households | % Households |
| Under 35 Years | 1,081 | 14.5% |
| 35 to 44 Years | 1,455 | 19.6% |
| 45 to 54 Years | 1,334 | 17.9% |
| 55 to 64 Years | 1,446 | 19.5% |
| 65 to 74 Years | 1,182 | 15.9% |
| 75 to 84 Years | 479 | 6.5% |
| 85 Years and Over | 455 | 6.1% |
| Total | 7,432 | 100.0% |
Housing Finances in Colusa County
Median Income by Occupancy in Colusa County
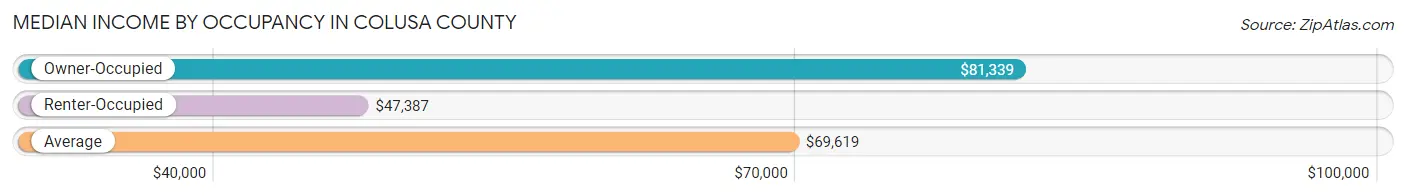
| Occupancy Type | # Households | Median Income |
| Owner-Occupied | 4,686 (63.0%) | $81,339 |
| Renter-Occupied | 2,746 (36.9%) | $47,387 |
| Average | 7,432 (100.0%) | $69,619 |
Occupancy by Householder Income Bracket in Colusa County
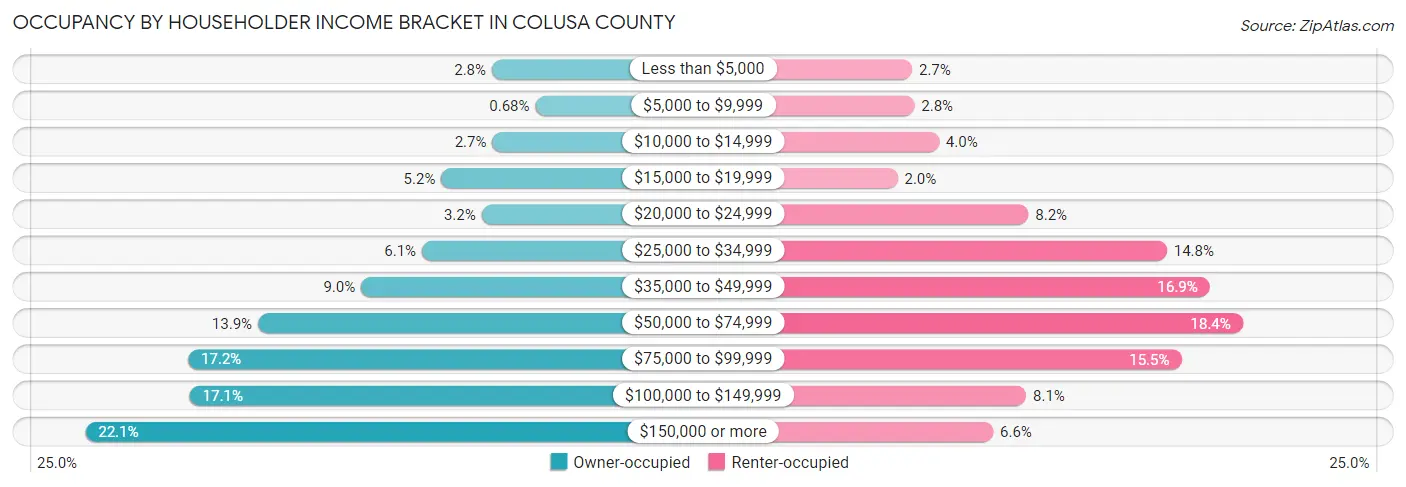
| Income Bracket | Owner-occupied | Renter-occupied |
| Less than $5,000 | 129 (2.8%) | 74 (2.7%) |
| $5,000 to $9,999 | 32 (0.7%) | 77 (2.8%) |
| $10,000 to $14,999 | 128 (2.7%) | 109 (4.0%) |
| $15,000 to $19,999 | 242 (5.2%) | 55 (2.0%) |
| $20,000 to $24,999 | 152 (3.2%) | 226 (8.2%) |
| $25,000 to $34,999 | 285 (6.1%) | 407 (14.8%) |
| $35,000 to $49,999 | 421 (9.0%) | 463 (16.9%) |
| $50,000 to $74,999 | 651 (13.9%) | 506 (18.4%) |
| $75,000 to $99,999 | 807 (17.2%) | 426 (15.5%) |
| $100,000 to $149,999 | 803 (17.1%) | 223 (8.1%) |
| $150,000 or more | 1,036 (22.1%) | 180 (6.6%) |
| Total | 4,686 (100.0%) | 2,746 (100.0%) |
Monthly Housing Cost Tiers in Colusa County
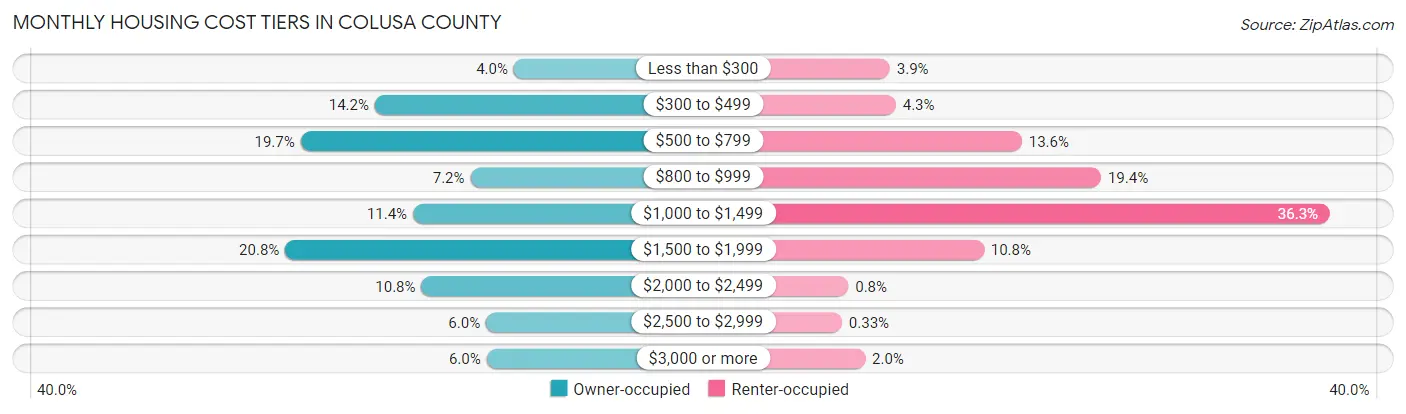
| Monthly Cost | Owner-occupied | Renter-occupied |
| Less than $300 | 186 (4.0%) | 106 (3.9%) |
| $300 to $499 | 666 (14.2%) | 118 (4.3%) |
| $500 to $799 | 922 (19.7%) | 373 (13.6%) |
| $800 to $999 | 336 (7.2%) | 533 (19.4%) |
| $1,000 to $1,499 | 534 (11.4%) | 996 (36.3%) |
| $1,500 to $1,999 | 975 (20.8%) | 296 (10.8%) |
| $2,000 to $2,499 | 505 (10.8%) | 22 (0.8%) |
| $2,500 to $2,999 | 282 (6.0%) | 9 (0.3%) |
| $3,000 or more | 280 (6.0%) | 56 (2.0%) |
| Total | 4,686 (100.0%) | 2,746 (100.0%) |
Physical Housing Characteristics in Colusa County
Housing Structures in Colusa County
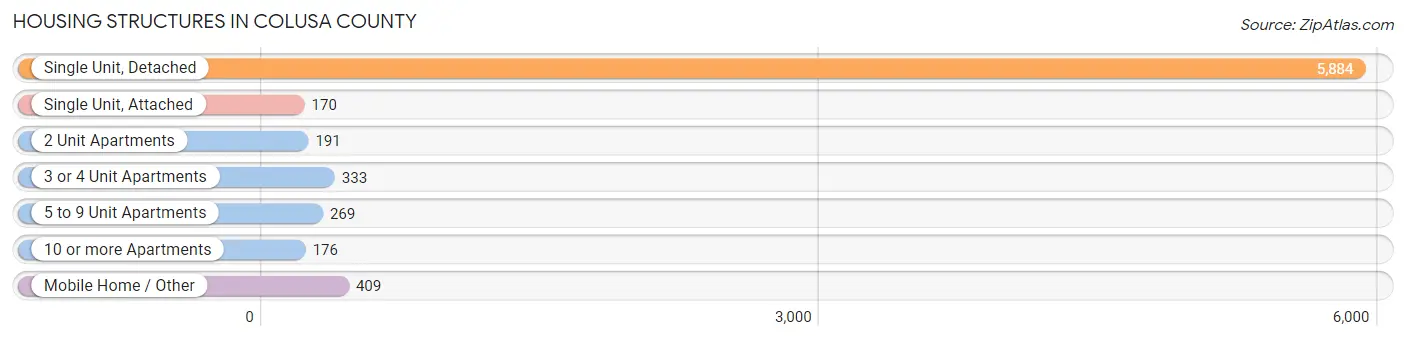
| Structure Type | # Housing Units | % Housing Units |
| Single Unit, Detached | 5,884 | 79.2% |
| Single Unit, Attached | 170 | 2.3% |
| 2 Unit Apartments | 191 | 2.6% |
| 3 or 4 Unit Apartments | 333 | 4.5% |
| 5 to 9 Unit Apartments | 269 | 3.6% |
| 10 or more Apartments | 176 | 2.4% |
| Mobile Home / Other | 409 | 5.5% |
| Total | 7,432 | 100.0% |
Housing Structures by Occupancy in Colusa County
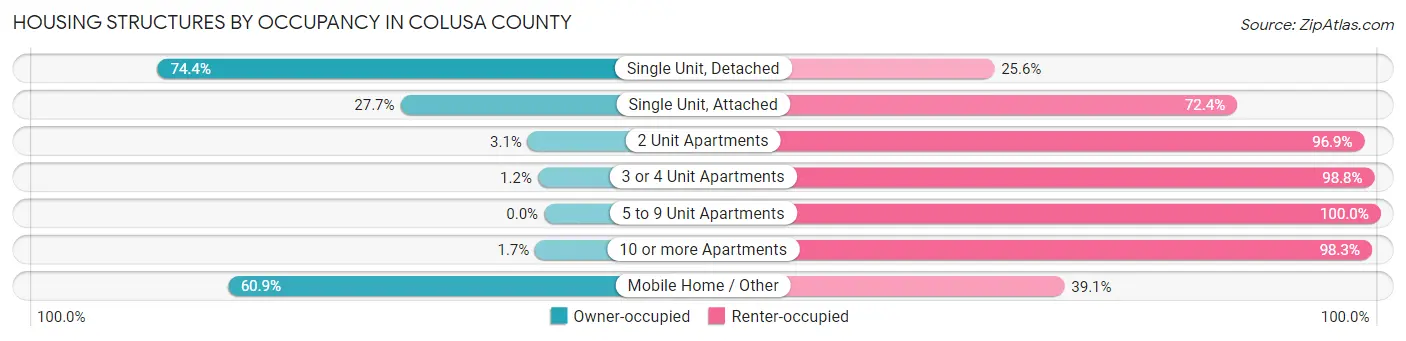
| Structure Type | Owner-occupied | Renter-occupied |
| Single Unit, Detached | 4,377 (74.4%) | 1,507 (25.6%) |
| Single Unit, Attached | 47 (27.7%) | 123 (72.4%) |
| 2 Unit Apartments | 6 (3.1%) | 185 (96.9%) |
| 3 or 4 Unit Apartments | 4 (1.2%) | 329 (98.8%) |
| 5 to 9 Unit Apartments | 0 (0.0%) | 269 (100.0%) |
| 10 or more Apartments | 3 (1.7%) | 173 (98.3%) |
| Mobile Home / Other | 249 (60.9%) | 160 (39.1%) |
| Total | 4,686 (63.0%) | 2,746 (36.9%) |
Housing Structures by Number of Rooms in Colusa County
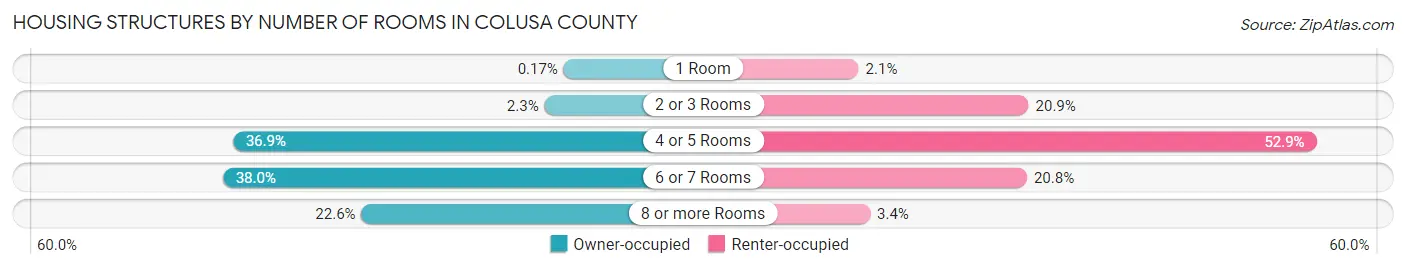
| Number of Rooms | Owner-occupied | Renter-occupied |
| 1 Room | 8 (0.2%) | 57 (2.1%) |
| 2 or 3 Rooms | 108 (2.3%) | 575 (20.9%) |
| 4 or 5 Rooms | 1,729 (36.9%) | 1,452 (52.9%) |
| 6 or 7 Rooms | 1,781 (38.0%) | 570 (20.8%) |
| 8 or more Rooms | 1,060 (22.6%) | 92 (3.4%) |
| Total | 4,686 (100.0%) | 2,746 (100.0%) |
Housing Structure by Heating Type in Colusa County
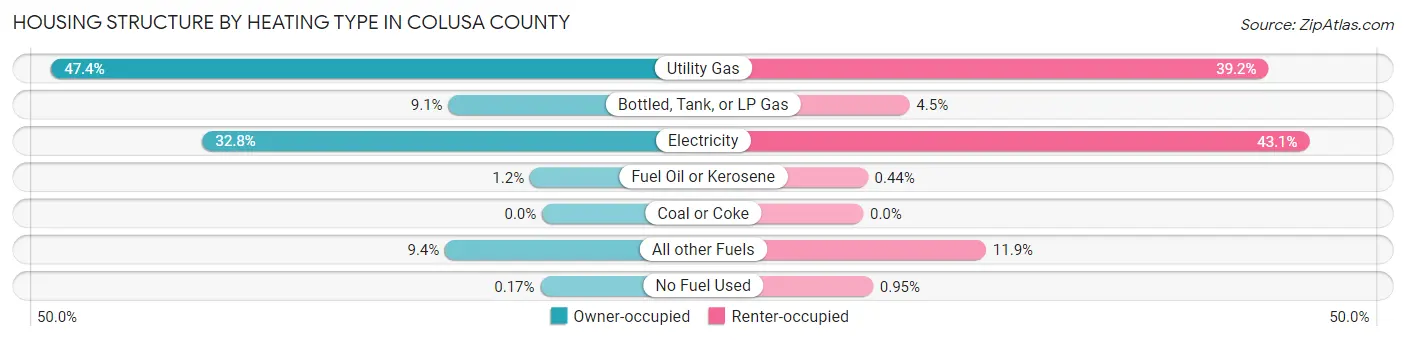
| Heating Type | Owner-occupied | Renter-occupied |
| Utility Gas | 2,222 (47.4%) | 1,075 (39.2%) |
| Bottled, Tank, or LP Gas | 424 (9.0%) | 123 (4.5%) |
| Electricity | 1,538 (32.8%) | 1,184 (43.1%) |
| Fuel Oil or Kerosene | 55 (1.2%) | 12 (0.4%) |
| Coal or Coke | 0 (0.0%) | 0 (0.0%) |
| All other Fuels | 439 (9.4%) | 326 (11.9%) |
| No Fuel Used | 8 (0.2%) | 26 (0.9%) |
| Total | 4,686 (100.0%) | 2,746 (100.0%) |
Household Vehicle Usage in Colusa County
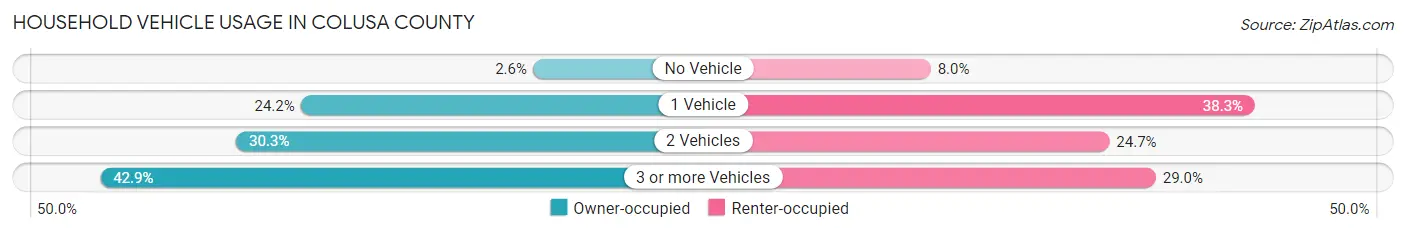
| Vehicles per Household | Owner-occupied | Renter-occupied |
| No Vehicle | 120 (2.6%) | 220 (8.0%) |
| 1 Vehicle | 1,136 (24.2%) | 1,051 (38.3%) |
| 2 Vehicles | 1,418 (30.3%) | 678 (24.7%) |
| 3 or more Vehicles | 2,012 (42.9%) | 797 (29.0%) |
| Total | 4,686 (100.0%) | 2,746 (100.0%) |
Real Estate & Mortgages in Colusa County
Real Estate and Mortgage Overview in Colusa County
| Characteristic | Without Mortgage | With Mortgage |
| Housing Units | 2,038 | 2,648 |
| Median Property Value | $366,700 | $355,900 |
| Median Household Income | $67,958 | $703 |
| Monthly Housing Costs | $549 | $280 |
| Real Estate Taxes | $2,085 | $31 |
Property Value by Mortgage Status in Colusa County
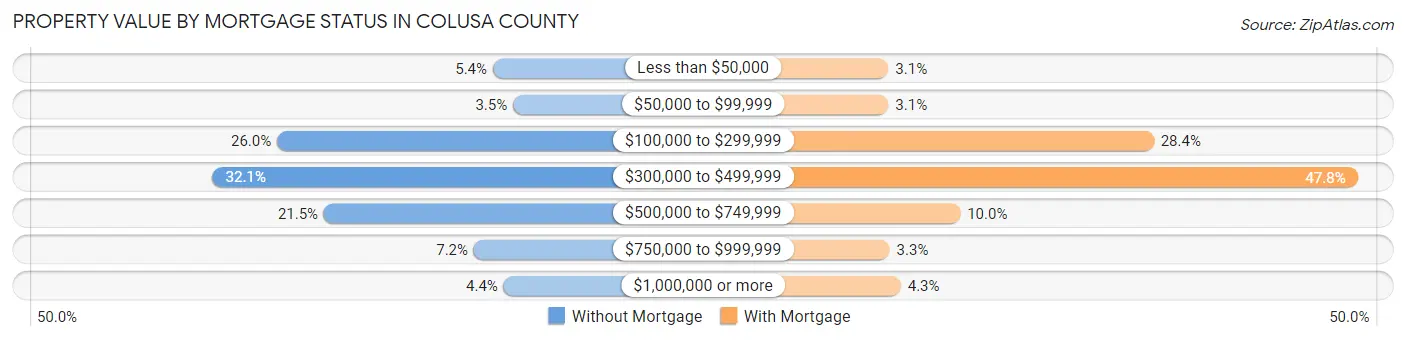
| Property Value | Without Mortgage | With Mortgage |
| Less than $50,000 | 110 (5.4%) | 83 (3.1%) |
| $50,000 to $99,999 | 71 (3.5%) | 83 (3.1%) |
| $100,000 to $299,999 | 529 (26.0%) | 752 (28.4%) |
| $300,000 to $499,999 | 654 (32.1%) | 1,266 (47.8%) |
| $500,000 to $749,999 | 438 (21.5%) | 264 (10.0%) |
| $750,000 to $999,999 | 147 (7.2%) | 86 (3.3%) |
| $1,000,000 or more | 89 (4.4%) | 114 (4.3%) |
| Total | 2,038 (100.0%) | 2,648 (100.0%) |
Household Income by Mortgage Status in Colusa County
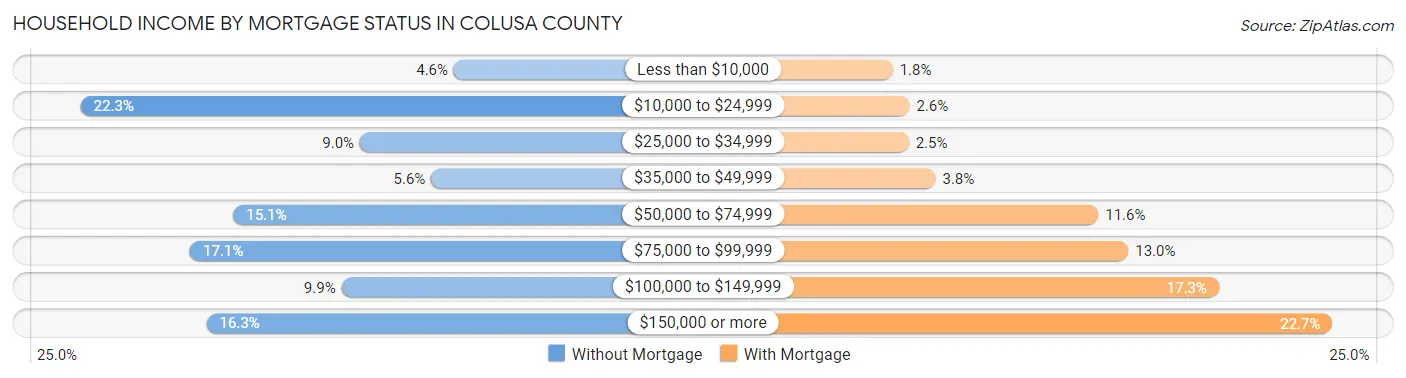
| Household Income | Without Mortgage | With Mortgage |
| Less than $10,000 | 93 (4.6%) | 47 (1.8%) |
| $10,000 to $24,999 | 455 (22.3%) | 68 (2.6%) |
| $25,000 to $34,999 | 184 (9.0%) | 67 (2.5%) |
| $35,000 to $49,999 | 115 (5.6%) | 101 (3.8%) |
| $50,000 to $74,999 | 307 (15.1%) | 306 (11.6%) |
| $75,000 to $99,999 | 349 (17.1%) | 344 (13.0%) |
| $100,000 to $149,999 | 202 (9.9%) | 458 (17.3%) |
| $150,000 or more | 333 (16.3%) | 601 (22.7%) |
| Total | 2,038 (100.0%) | 2,648 (100.0%) |
Property Value to Household Income Ratio in Colusa County
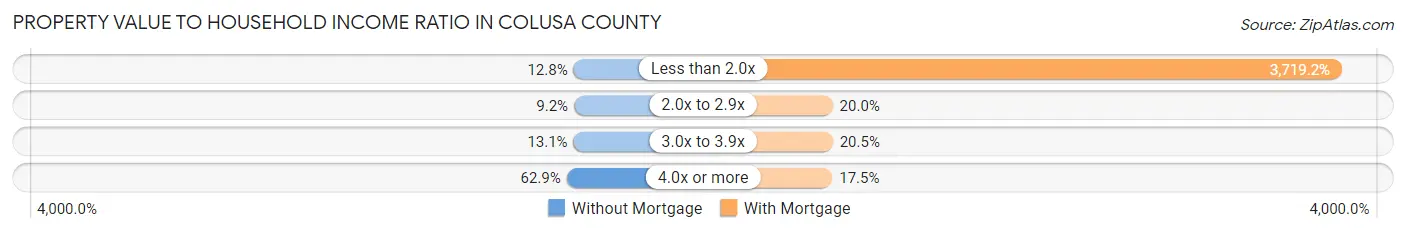
| Value-to-Income Ratio | Without Mortgage | With Mortgage |
| Less than 2.0x | 260 (12.8%) | 98,485 (3,719.2%) |
| 2.0x to 2.9x | 187 (9.2%) | 529 (20.0%) |
| 3.0x to 3.9x | 266 (13.1%) | 544 (20.5%) |
| 4.0x or more | 1,282 (62.9%) | 462 (17.4%) |
| Total | 2,038 (100.0%) | 2,648 (100.0%) |
Real Estate Taxes by Mortgage Status in Colusa County
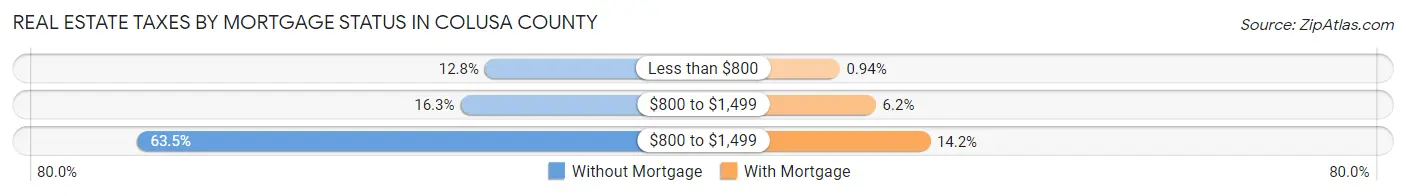
| Property Taxes | Without Mortgage | With Mortgage |
| Less than $800 | 260 (12.8%) | 25 (0.9%) |
| $800 to $1,499 | 333 (16.3%) | 165 (6.2%) |
| $800 to $1,499 | 1,294 (63.5%) | 375 (14.2%) |
| Total | 2,038 (100.0%) | 2,648 (100.0%) |
Health & Disability in Colusa County
Health Insurance Coverage by Age in Colusa County
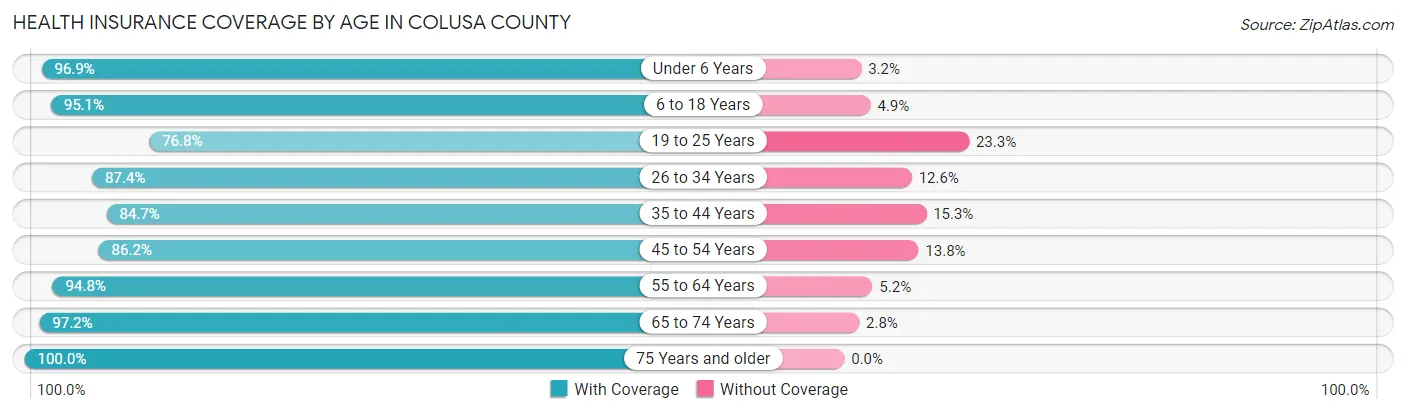
| Age Bracket | With Coverage | Without Coverage |
| Under 6 Years | 1,720 (96.9%) | 56 (3.2%) |
| 6 to 18 Years | 4,186 (95.1%) | 215 (4.9%) |
| 19 to 25 Years | 1,462 (76.7%) | 443 (23.3%) |
| 26 to 34 Years | 2,184 (87.4%) | 314 (12.6%) |
| 35 to 44 Years | 2,370 (84.7%) | 427 (15.3%) |
| 45 to 54 Years | 2,089 (86.2%) | 335 (13.8%) |
| 55 to 64 Years | 2,512 (94.8%) | 139 (5.2%) |
| 65 to 74 Years | 1,800 (97.2%) | 51 (2.8%) |
| 75 Years and older | 1,351 (100.0%) | 0 (0.0%) |
| Total | 19,674 (90.9%) | 1,980 (9.1%) |
Health Insurance Coverage by Citizenship Status in Colusa County
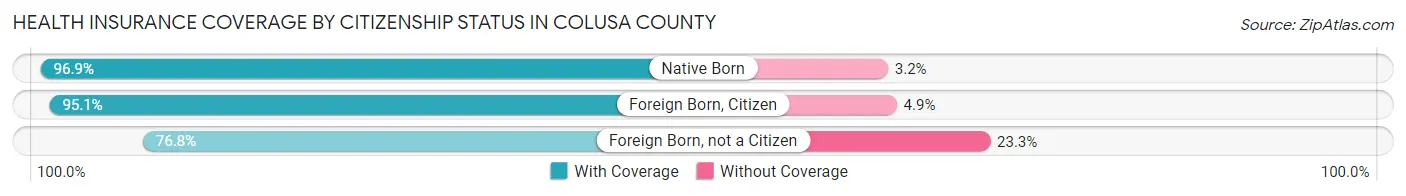
| Citizenship Status | With Coverage | Without Coverage |
| Native Born | 1,720 (96.9%) | 56 (3.2%) |
| Foreign Born, Citizen | 4,186 (95.1%) | 215 (4.9%) |
| Foreign Born, not a Citizen | 1,462 (76.7%) | 443 (23.3%) |
Health Insurance Coverage by Household Income in Colusa County
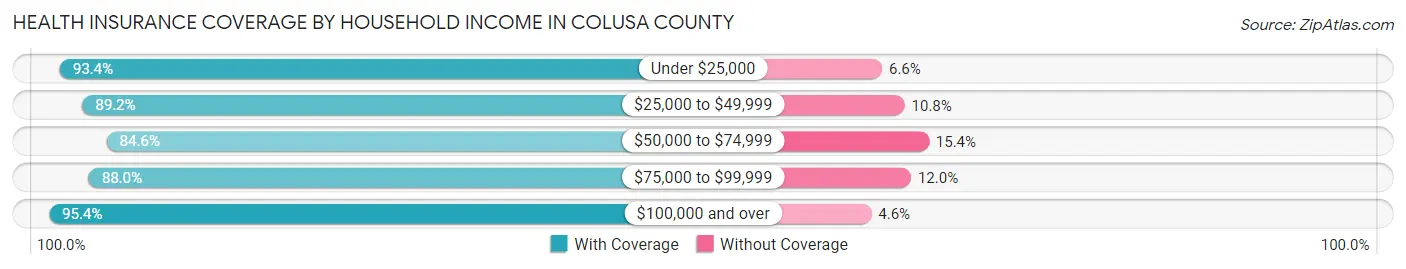
| Household Income | With Coverage | Without Coverage |
| Under $25,000 | 1,940 (93.4%) | 137 (6.6%) |
| $25,000 to $49,999 | 3,491 (89.2%) | 424 (10.8%) |
| $50,000 to $74,999 | 2,835 (84.6%) | 515 (15.4%) |
| $75,000 to $99,999 | 4,031 (88.0%) | 551 (12.0%) |
| $100,000 and over | 7,305 (95.4%) | 352 (4.6%) |
Public vs Private Health Insurance Coverage by Age in Colusa County
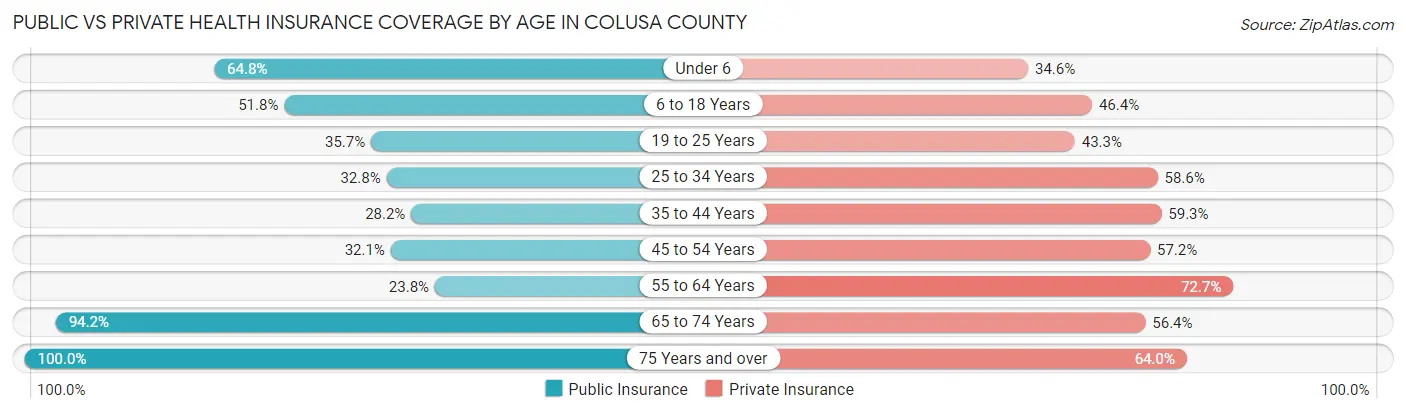
| Age Bracket | Public Insurance | Private Insurance |
| Under 6 | 1,151 (64.8%) | 614 (34.6%) |
| 6 to 18 Years | 2,280 (51.8%) | 2,044 (46.4%) |
| 19 to 25 Years | 680 (35.7%) | 824 (43.2%) |
| 25 to 34 Years | 820 (32.8%) | 1,464 (58.6%) |
| 35 to 44 Years | 790 (28.2%) | 1,659 (59.3%) |
| 45 to 54 Years | 777 (32.1%) | 1,387 (57.2%) |
| 55 to 64 Years | 632 (23.8%) | 1,926 (72.7%) |
| 65 to 74 Years | 1,744 (94.2%) | 1,043 (56.4%) |
| 75 Years and over | 1,351 (100.0%) | 865 (64.0%) |
| Total | 10,225 (47.2%) | 11,826 (54.6%) |
Disability Status by Sex by Age in Colusa County
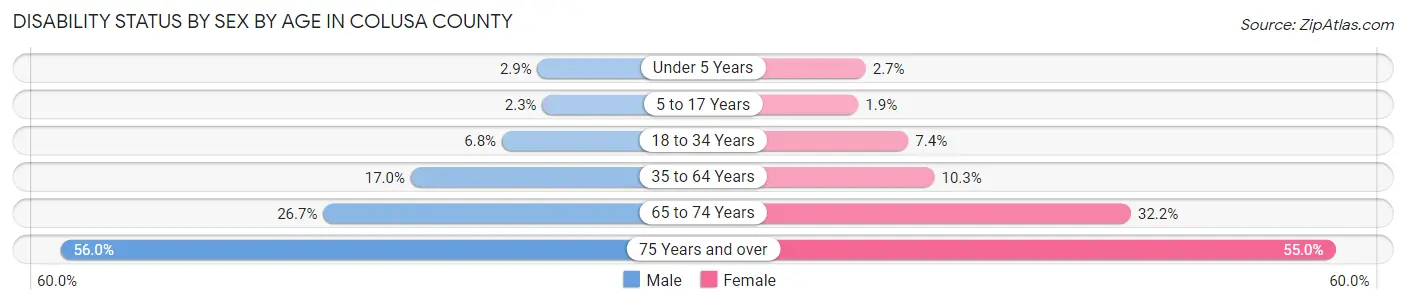
| Age Bracket | Male | Female |
| Under 5 Years | 20 (2.9%) | 21 (2.7%) |
| 5 to 17 Years | 53 (2.3%) | 38 (1.8%) |
| 18 to 34 Years | 170 (6.8%) | 170 (7.4%) |
| 35 to 64 Years | 675 (17.0%) | 403 (10.3%) |
| 65 to 74 Years | 265 (26.7%) | 277 (32.2%) |
| 75 Years and over | 350 (56.0%) | 399 (55.0%) |
Disability Class by Sex by Age in Colusa County
Disability Class: Hearing Difficulty
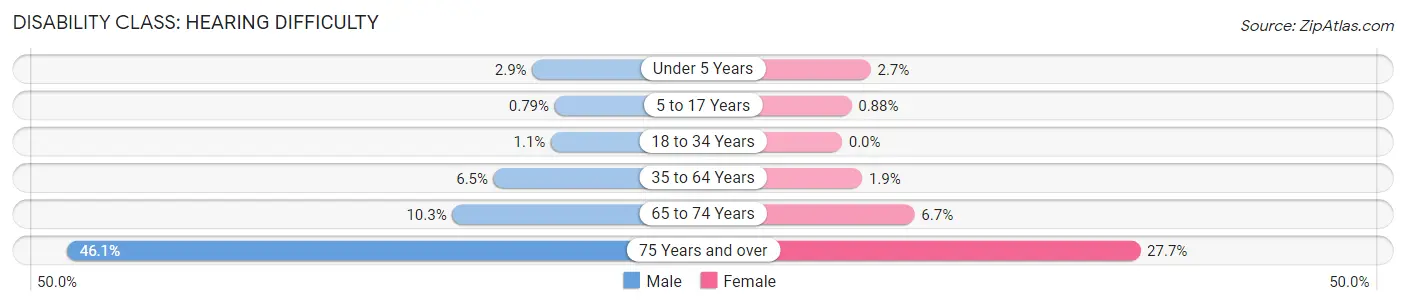
| Age Bracket | Male | Female |
| Under 5 Years | 20 (2.9%) | 21 (2.7%) |
| 5 to 17 Years | 18 (0.8%) | 18 (0.9%) |
| 18 to 34 Years | 28 (1.1%) | 0 (0.0%) |
| 35 to 64 Years | 256 (6.5%) | 73 (1.9%) |
| 65 to 74 Years | 102 (10.3%) | 58 (6.7%) |
| 75 Years and over | 288 (46.1%) | 201 (27.7%) |
Disability Class: Vision Difficulty
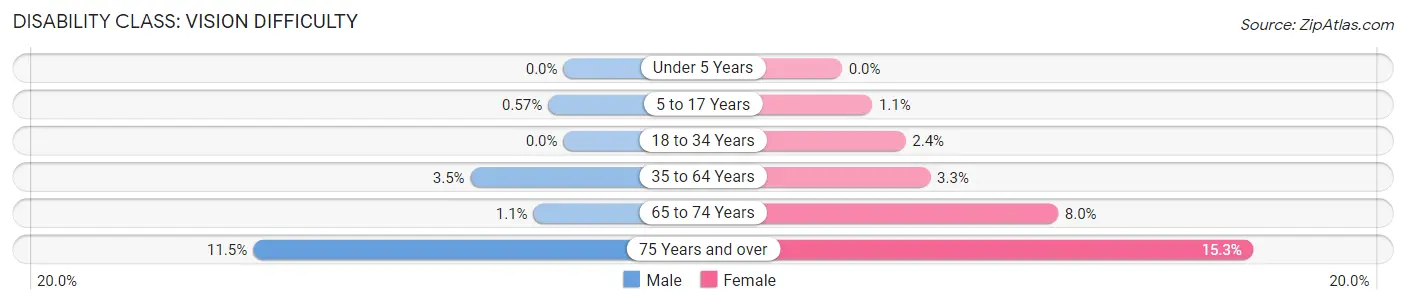
| Age Bracket | Male | Female |
| Under 5 Years | 0 (0.0%) | 0 (0.0%) |
| 5 to 17 Years | 13 (0.6%) | 23 (1.1%) |
| 18 to 34 Years | 0 (0.0%) | 54 (2.4%) |
| 35 to 64 Years | 137 (3.5%) | 128 (3.3%) |
| 65 to 74 Years | 11 (1.1%) | 69 (8.0%) |
| 75 Years and over | 72 (11.5%) | 111 (15.3%) |
Disability Class: Cognitive Difficulty
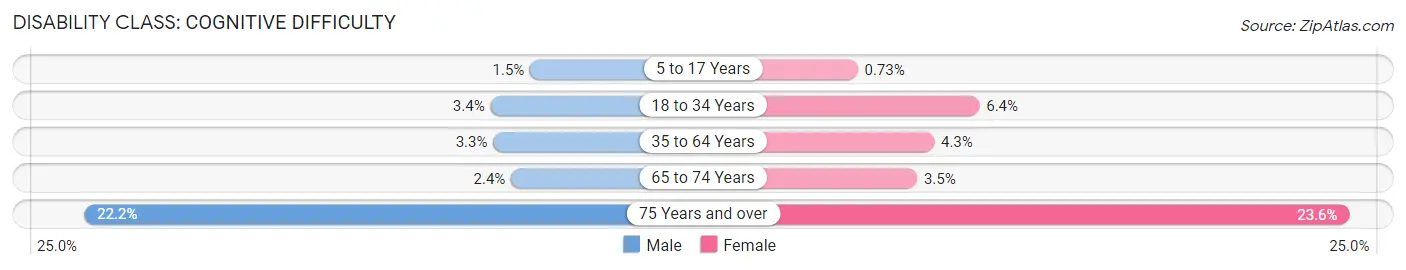
| Age Bracket | Male | Female |
| 5 to 17 Years | 35 (1.5%) | 15 (0.7%) |
| 18 to 34 Years | 84 (3.4%) | 146 (6.4%) |
| 35 to 64 Years | 129 (3.3%) | 167 (4.3%) |
| 65 to 74 Years | 24 (2.4%) | 30 (3.5%) |
| 75 Years and over | 139 (22.2%) | 171 (23.5%) |
Disability Class: Ambulatory Difficulty
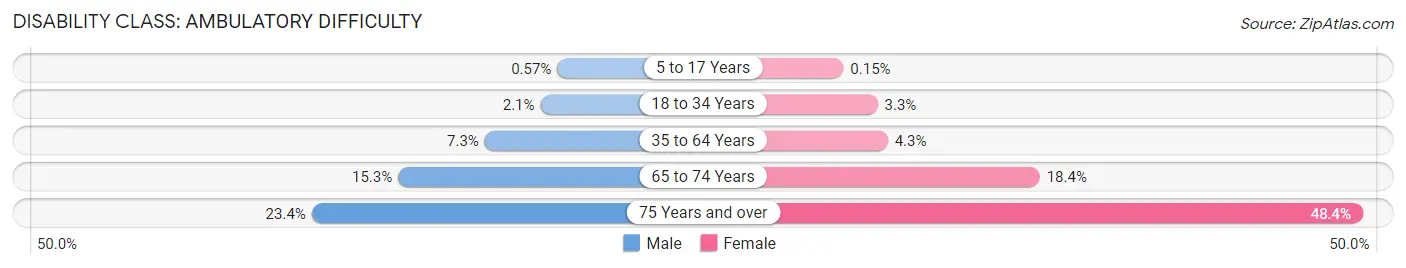
| Age Bracket | Male | Female |
| 5 to 17 Years | 13 (0.6%) | 3 (0.2%) |
| 18 to 34 Years | 53 (2.1%) | 76 (3.3%) |
| 35 to 64 Years | 290 (7.3%) | 166 (4.3%) |
| 65 to 74 Years | 152 (15.3%) | 158 (18.4%) |
| 75 Years and over | 146 (23.4%) | 351 (48.3%) |
Disability Class: Self-Care Difficulty
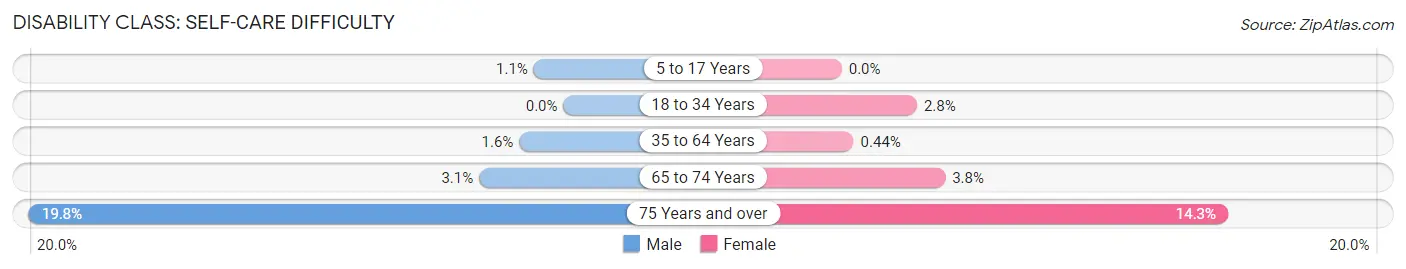
| Age Bracket | Male | Female |
| 5 to 17 Years | 25 (1.1%) | 0 (0.0%) |
| 18 to 34 Years | 0 (0.0%) | 64 (2.8%) |
| 35 to 64 Years | 65 (1.6%) | 17 (0.4%) |
| 65 to 74 Years | 31 (3.1%) | 33 (3.8%) |
| 75 Years and over | 124 (19.8%) | 104 (14.3%) |
Technology Access in Colusa County
Computing Device Access in Colusa County
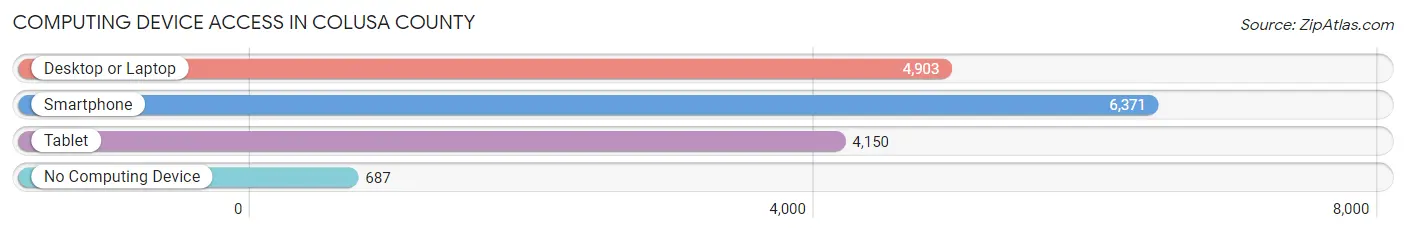
| Device Type | # Households | % Households |
| Desktop or Laptop | 4,903 | 66.0% |
| Smartphone | 6,371 | 85.7% |
| Tablet | 4,150 | 55.8% |
| No Computing Device | 687 | 9.2% |
| Total | 7,432 | 100.0% |
Internet Access in Colusa County
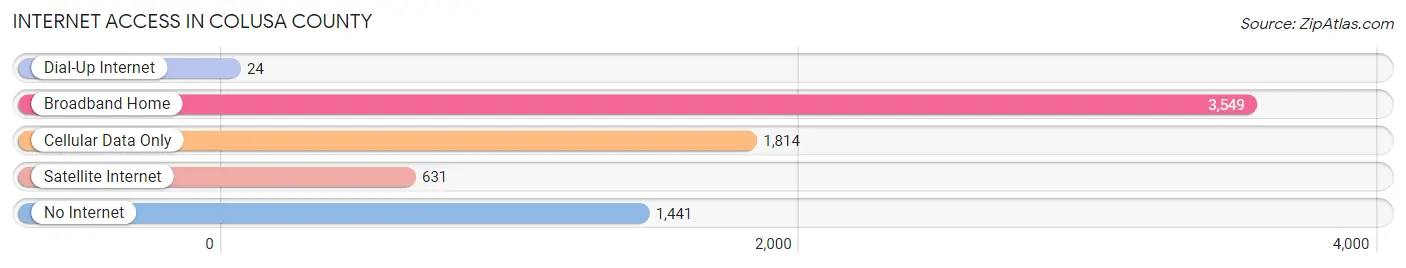
| Internet Type | # Households | % Households |
| Dial-Up Internet | 24 | 0.3% |
| Broadband Home | 3,549 | 47.7% |
| Cellular Data Only | 1,814 | 24.4% |
| Satellite Internet | 631 | 8.5% |
| No Internet | 1,441 | 19.4% |
| Total | 7,432 | 100.0% |
Colusa County Summary
Colusa County is located in the Central Valley of California, and is bordered by Sutter, Yuba, Glenn, and Yolo Counties. It is the fourth smallest county in the state, with a total area of 1,156 square miles. The county seat is Colusa, and the largest city is Williams. As of the 2010 census, the population was 21,419.
History
Colusa County was formed in 1850 from parts of Yuba and Sutter Counties. It was named after the Colusi tribe, who were the original inhabitants of the area. The county was originally part of the Rancho Colus Mexican land grant.
In the late 19th century, the county was a major producer of wheat and other grains. The county also had a thriving lumber industry, and was home to several large sawmills.
Geography
Colusa County is located in the Central Valley of California, and is bordered by Sutter, Yuba, Glenn, and Yolo Counties. It is the fourth smallest county in the state, with a total area of 1,156 square miles. The county is mostly flat, with rolling hills in the east. The Sacramento River forms the northern border of the county, and the Feather River forms the eastern border.
The climate of Colusa County is Mediterranean, with hot, dry summers and cool, wet winters. The average annual precipitation is about 20 inches.
Economy
Agriculture is the main economic activity in Colusa County. The county is a major producer of rice, wheat, and other grains. It is also a major producer of walnuts, almonds, and other tree nuts. Livestock production is also important, with cattle, sheep, and goats being raised in the county.
The county also has a thriving tourism industry, with several wineries, golf courses, and other attractions.
Demographics
As of the 2010 census, the population of Colusa County was 21,419. The racial makeup of the county was 68.3% White, 0.7% African American, 1.3% Native American, 0.7% Asian, 0.1% Pacific Islander, 25.2% from other races, and 3.8% from two or more races. Hispanic or Latino of any race were 44.2% of the population.
The median household income in the county was $41,945, and the median family income was $48,945. The per capita income was $19,845. About 17.2% of the population was below the poverty line.
Common Questions
What is Per Capita Income in Colusa County?
Per Capita income in Colusa County is $31,915.
What is the Median Family Income in Colusa County?
Median Family Income in Colusa County is $80,746.
What is the Median Household income in Colusa County?
Median Household Income in Colusa County is $69,619.
What is Income or Wage Gap in Colusa County?
Income or Wage Gap in Colusa County is 37.8%.
Women in Colusa County earn 62.2 cents for every dollar earned by a man.
What is Family Income Deficit in Colusa County?
Family Income Deficit in Colusa County is $8,518.
Families that are below poverty line in Colusa County earn $8,518 less on average than the poverty threshold level.
What is Inequality or Gini Index in Colusa County?
Inequality or Gini Index in Colusa County is 0.46.
What is the Total Population of Colusa County?
Total Population of Colusa County is 21,811.
What is the Total Male Population of Colusa County?
Total Male Population of Colusa County is 11,112.
What is the Total Female Population of Colusa County?
Total Female Population of Colusa County is 10,699.
What is the Ratio of Males per 100 Females in Colusa County?
There are 103.86 Males per 100 Females in Colusa County.
What is the Ratio of Females per 100 Males in Colusa County?
There are 96.28 Females per 100 Males in Colusa County.
What is the Median Population Age in Colusa County?
Median Population Age in Colusa County is 36.0 Years.
What is the Average Family Size in Colusa County
Average Family Size in Colusa County is 3.6 People.
What is the Average Household Size in Colusa County
Average Household Size in Colusa County is 2.9 People.
How Large is the Labor Force in Colusa County?
There are 10,500 People in the Labor Forcein in Colusa County.
What is the Percentage of People in the Labor Force in Colusa County?
63.1% of People are in the Labor Force in Colusa County.
What is the Unemployment Rate in Colusa County?
Unemployment Rate in Colusa County is 7.4%.