Butte County, CA Map & Demographics
Butte County Map
Butte County Overview
$36,374
PER CAPITA INCOME
$85,990
AVG FAMILY INCOME
$66,085
AVG HOUSEHOLD INCOME
21.8%
WAGE / INCOME GAP [ % ]
78.2¢/ $1
WAGE / INCOME GAP [ $ ]
$10,188
FAMILY INCOME DEFICIT
0.48
INEQUALITY / GINI INDEX
213,605
TOTAL POPULATION
106,376
MALE POPULATION
107,229
FEMALE POPULATION
99.20
MALES / 100 FEMALES
100.80
FEMALES / 100 MALES
36.5
MEDIAN AGE
3.0
AVG FAMILY SIZE
2.5
AVG HOUSEHOLD SIZE
102,896
LABOR FORCE [ PEOPLE ]
58.6%
PERCENT IN LABOR FORCE
7.1%
UNEMPLOYMENT RATE
Income in Butte County
Income Overview in Butte County
Per Capita Income in Butte County is $36,374, while median incomes of families and households are $85,990 and $66,085 respectively.
| Characteristic | Number | Measure |
| Per Capita Income | 213,605 | $36,374 |
| Median Family Income | 48,961 | $85,990 |
| Mean Family Income | 48,961 | $111,860 |
| Median Household Income | 83,319 | $66,085 |
| Mean Household Income | 83,319 | $92,479 |
| Income Deficit | 48,961 | $10,188 |
| Wage / Income Gap (%) | 213,605 | 21.83% |
| Wage / Income Gap ($) | 213,605 | 78.17¢ per $1 |
| Gini / Inequality Index | 213,605 | 0.48 |
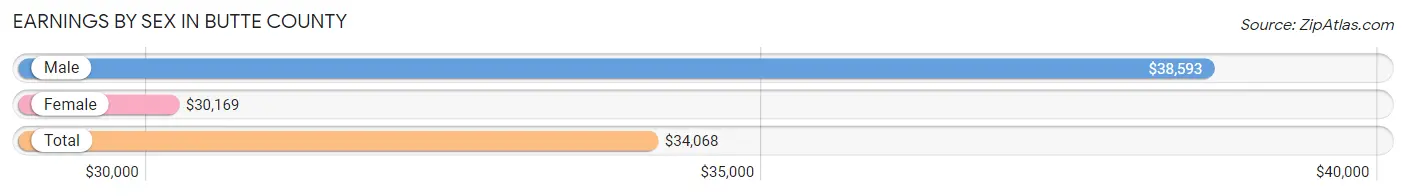
Earnings by Sex in Butte County
Average Earnings in Butte County are $34,068, $38,593 for men and $30,169 for women, a difference of 21.8%.
| Sex | Number | Average Earnings |
| Male | 57,135 (52.5%) | $38,593 |
| Female | 51,768 (47.5%) | $30,169 |
| Total | 108,903 (100.0%) | $34,068 |
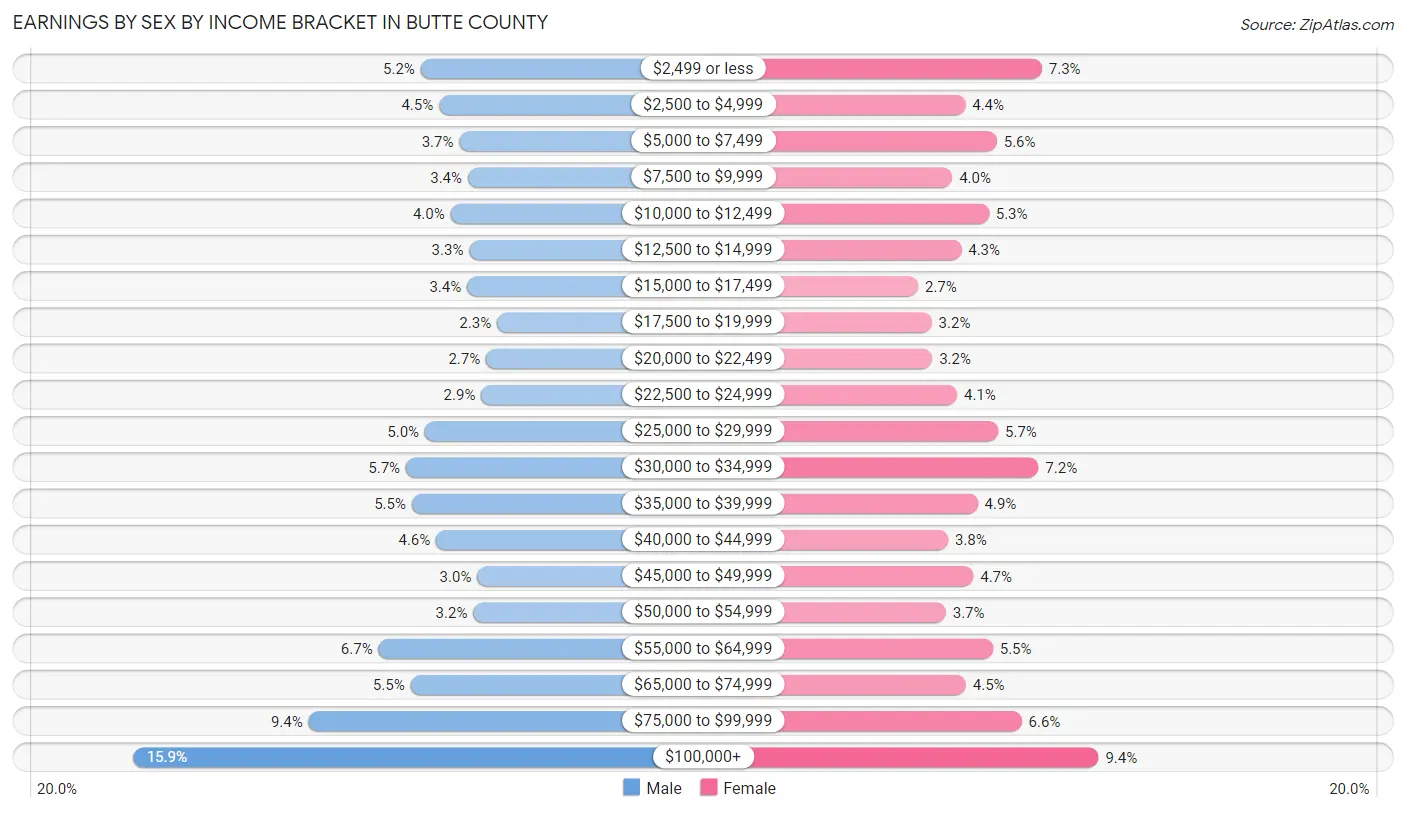
Earnings by Sex by Income Bracket in Butte County
The most common earnings brackets in Butte County are $100,000+ for men (9,090 | 15.9%) and $100,000+ for women (4,881 | 9.4%).
| Income | Male | Female |
| $2,499 or less | 2,949 (5.2%) | 3,782 (7.3%) |
| $2,500 to $4,999 | 2,555 (4.5%) | 2,297 (4.4%) |
| $5,000 to $7,499 | 2,117 (3.7%) | 2,911 (5.6%) |
| $7,500 to $9,999 | 1,936 (3.4%) | 2,047 (4.0%) |
| $10,000 to $12,499 | 2,311 (4.0%) | 2,752 (5.3%) |
| $12,500 to $14,999 | 1,909 (3.3%) | 2,220 (4.3%) |
| $15,000 to $17,499 | 1,955 (3.4%) | 1,383 (2.7%) |
| $17,500 to $19,999 | 1,315 (2.3%) | 1,644 (3.2%) |
| $20,000 to $22,499 | 1,548 (2.7%) | 1,656 (3.2%) |
| $22,500 to $24,999 | 1,651 (2.9%) | 2,137 (4.1%) |
| $25,000 to $29,999 | 2,856 (5.0%) | 2,937 (5.7%) |
| $30,000 to $34,999 | 3,263 (5.7%) | 3,715 (7.2%) |
| $35,000 to $39,999 | 3,135 (5.5%) | 2,535 (4.9%) |
| $40,000 to $44,999 | 2,619 (4.6%) | 1,962 (3.8%) |
| $45,000 to $49,999 | 1,738 (3.0%) | 2,454 (4.7%) |
| $50,000 to $54,999 | 1,823 (3.2%) | 1,921 (3.7%) |
| $55,000 to $64,999 | 3,850 (6.7%) | 2,832 (5.5%) |
| $65,000 to $74,999 | 3,168 (5.5%) | 2,309 (4.5%) |
| $75,000 to $99,999 | 5,347 (9.4%) | 3,393 (6.6%) |
| $100,000+ | 9,090 (15.9%) | 4,881 (9.4%) |
| Total | 57,135 (100.0%) | 51,768 (100.0%) |
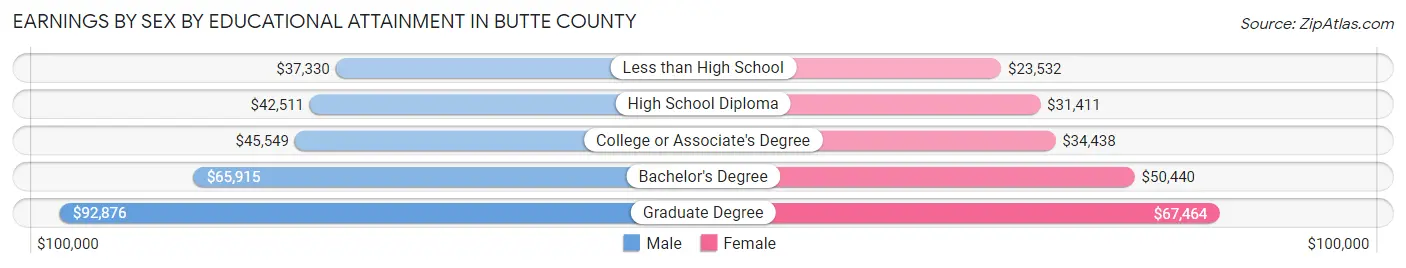
Earnings by Sex by Educational Attainment in Butte County
Average earnings in Butte County are $49,248 for men and $37,915 for women, a difference of 23.0%. Men with an educational attainment of graduate degree enjoy the highest average annual earnings of $92,876, while those with less than high school education earn the least with $37,330. Women with an educational attainment of graduate degree earn the most with the average annual earnings of $67,464, while those with less than high school education have the smallest earnings of $23,532.
| Educational Attainment | Male Income | Female Income |
| Less than High School | $37,330 | $23,532 |
| High School Diploma | $42,511 | $31,411 |
| College or Associate's Degree | $45,549 | $34,438 |
| Bachelor's Degree | $65,915 | $50,440 |
| Graduate Degree | $92,876 | $67,464 |
| Total | $49,248 | $37,915 |
Family Income in Butte County
Family Income Brackets in Butte County
According to the Butte County family income data, there are 9,645 families falling into the $100,000 to $149,999 income range, which is the most common income bracket and makes up 19.7% of all families. Conversely, the $10,000 to $14,999 income bracket is the least frequent group with only 1,469 families (3.0%) belonging to this category.
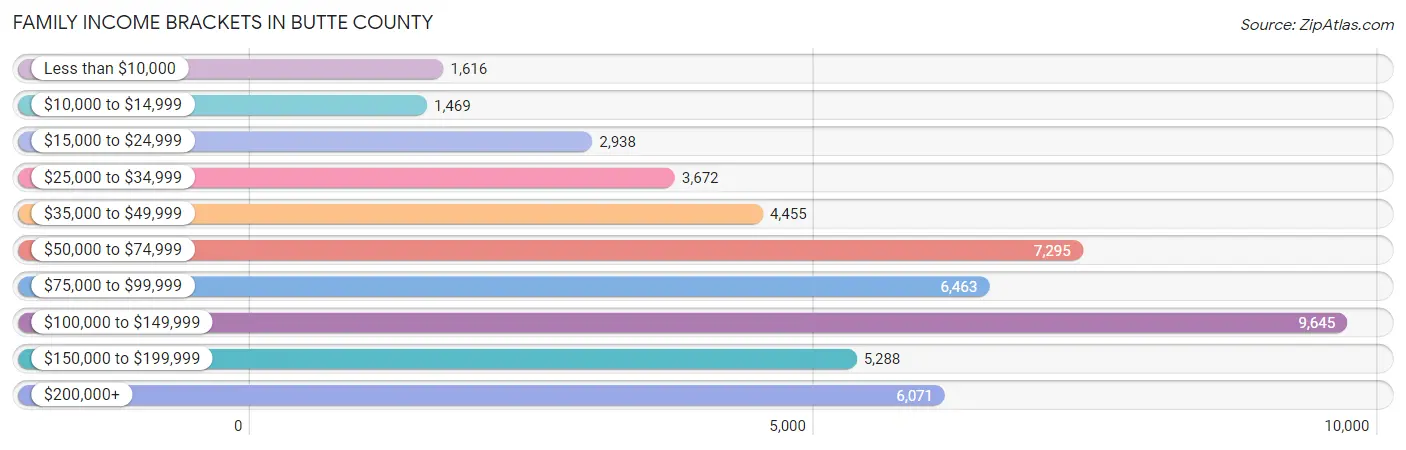
| Income Bracket | # Families | % Families |
| Less than $10,000 | 1,616 | 3.3% |
| $10,000 to $14,999 | 1,469 | 3.0% |
| $15,000 to $24,999 | 2,938 | 6.0% |
| $25,000 to $34,999 | 3,672 | 7.5% |
| $35,000 to $49,999 | 4,455 | 9.1% |
| $50,000 to $74,999 | 7,295 | 14.9% |
| $75,000 to $99,999 | 6,463 | 13.2% |
| $100,000 to $149,999 | 9,645 | 19.7% |
| $150,000 to $199,999 | 5,288 | 10.8% |
| $200,000+ | 6,071 | 12.4% |
Family Income by Famaliy Size in Butte County
4-person families (8,187 | 16.7%) account for the highest median family income in Butte County with $111,577 per family, while 2-person families (24,979 | 51.0%) have the highest median income of $37,738 per family member.
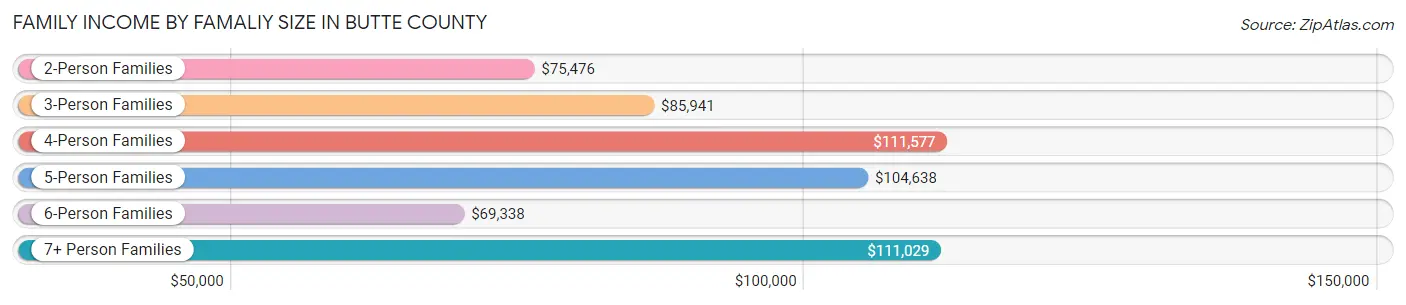
| Income Bracket | # Families | Median Income |
| 2-Person Families | 24,979 (51.0%) | $75,476 |
| 3-Person Families | 10,110 (20.6%) | $85,941 |
| 4-Person Families | 8,187 (16.7%) | $111,577 |
| 5-Person Families | 3,866 (7.9%) | $104,638 |
| 6-Person Families | 1,237 (2.5%) | $69,338 |
| 7+ Person Families | 582 (1.2%) | $111,029 |
| Total | 48,961 (100.0%) | $85,990 |
Family Income by Number of Earners in Butte County
The median family income in Butte County is $85,990, with families comprising 3+ earners (4,330) having the highest median family income of $139,485, while families with no earners (9,805) have the lowest median family income of $47,221, accounting for 8.8% and 20.0% of families, respectively.
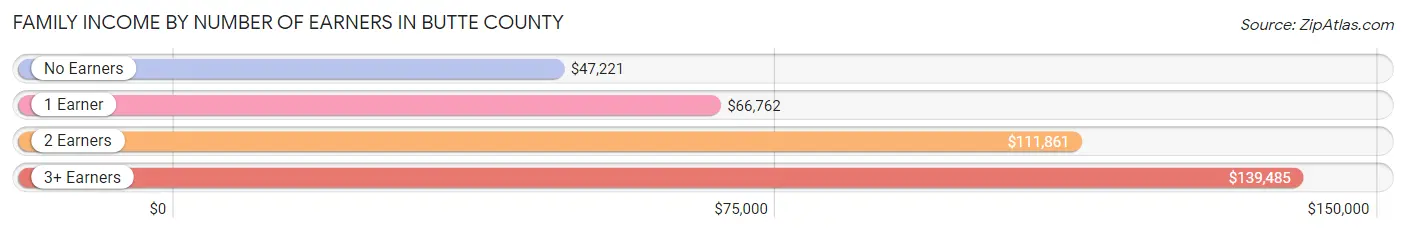
| Number of Earners | # Families | Median Income |
| No Earners | 9,805 (20.0%) | $47,221 |
| 1 Earner | 16,882 (34.5%) | $66,762 |
| 2 Earners | 17,944 (36.6%) | $111,861 |
| 3+ Earners | 4,330 (8.8%) | $139,485 |
| Total | 48,961 (100.0%) | $85,990 |
Household Income in Butte County
Household Income Brackets in Butte County
With 12,998 households falling in the category, the $100,000 to $149,999 income range is the most frequent in Butte County, accounting for 15.6% of all households. In contrast, only 3,749 households (4.5%) fall into the $10,000 to $14,999 income bracket, making it the least populous group.
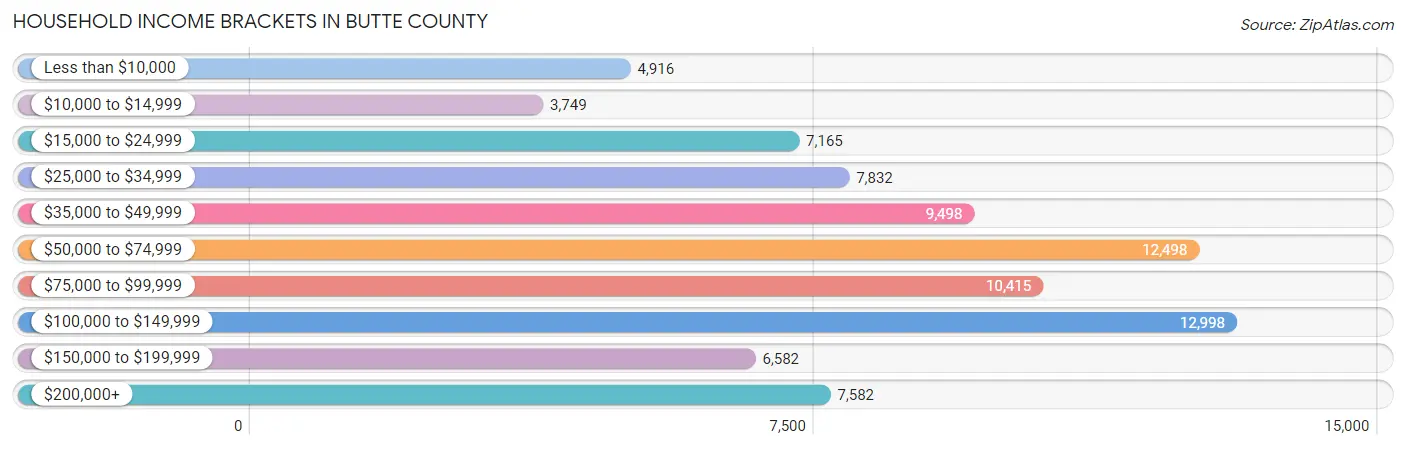
| Income Bracket | # Households | % Households |
| Less than $10,000 | 4,916 | 5.9% |
| $10,000 to $14,999 | 3,749 | 4.5% |
| $15,000 to $24,999 | 7,165 | 8.6% |
| $25,000 to $34,999 | 7,832 | 9.4% |
| $35,000 to $49,999 | 9,498 | 11.4% |
| $50,000 to $74,999 | 12,498 | 15.0% |
| $75,000 to $99,999 | 10,415 | 12.5% |
| $100,000 to $149,999 | 12,998 | 15.6% |
| $150,000 to $199,999 | 6,582 | 7.9% |
| $200,000+ | 7,582 | 9.1% |
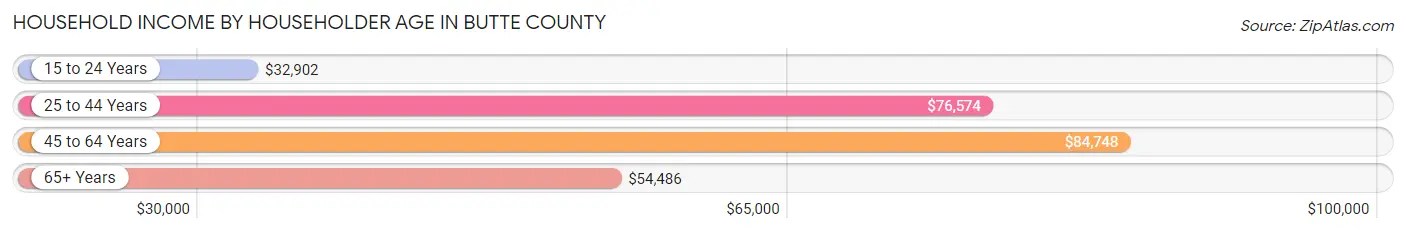
Household Income by Householder Age in Butte County
The median household income in Butte County is $66,085, with the highest median household income of $84,748 found in the 45 to 64 years age bracket for the primary householder. A total of 26,440 households (31.7%) fall into this category. Meanwhile, the 15 to 24 years age bracket for the primary householder has the lowest median household income of $32,902, with 7,790 households (9.3%) in this group.
| Income Bracket | # Households | Median Income |
| 15 to 24 Years | 7,790 (9.3%) | $32,902 |
| 25 to 44 Years | 24,819 (29.8%) | $76,574 |
| 45 to 64 Years | 26,440 (31.7%) | $84,748 |
| 65+ Years | 24,270 (29.1%) | $54,486 |
| Total | 83,319 (100.0%) | $66,085 |
Poverty in Butte County
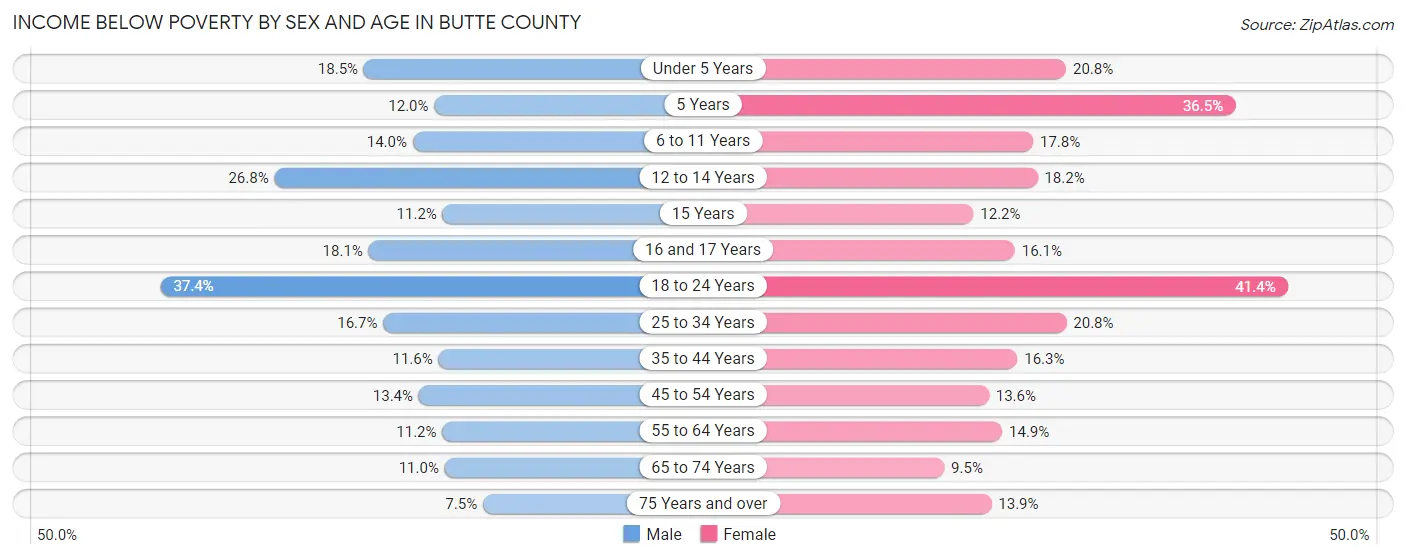
Income Below Poverty by Sex and Age in Butte County
With 17.0% poverty level for males and 19.4% for females among the residents of Butte County, 18 to 24 year old males and 18 to 24 year old females are the most vulnerable to poverty, with 5,508 males (37.4%) and 5,998 females (41.4%) in their respective age groups living below the poverty level.
| Age Bracket | Male | Female |
| Under 5 Years | 1,059 (18.5%) | 1,126 (20.8%) |
| 5 Years | 151 (12.0%) | 324 (36.5%) |
| 6 to 11 Years | 1,049 (14.0%) | 1,303 (17.7%) |
| 12 to 14 Years | 903 (26.8%) | 618 (18.2%) |
| 15 Years | 136 (11.2%) | 153 (12.2%) |
| 16 and 17 Years | 469 (18.1%) | 378 (16.1%) |
| 18 to 24 Years | 5,508 (37.4%) | 5,998 (41.4%) |
| 25 to 34 Years | 2,381 (16.7%) | 2,751 (20.8%) |
| 35 to 44 Years | 1,454 (11.6%) | 1,937 (16.3%) |
| 45 to 54 Years | 1,469 (13.4%) | 1,485 (13.6%) |
| 55 to 64 Years | 1,385 (11.2%) | 1,959 (14.9%) |
| 65 to 74 Years | 1,207 (11.0%) | 1,132 (9.5%) |
| 75 Years and over | 479 (7.5%) | 1,201 (13.9%) |
| Total | 17,650 (17.0%) | 20,365 (19.4%) |
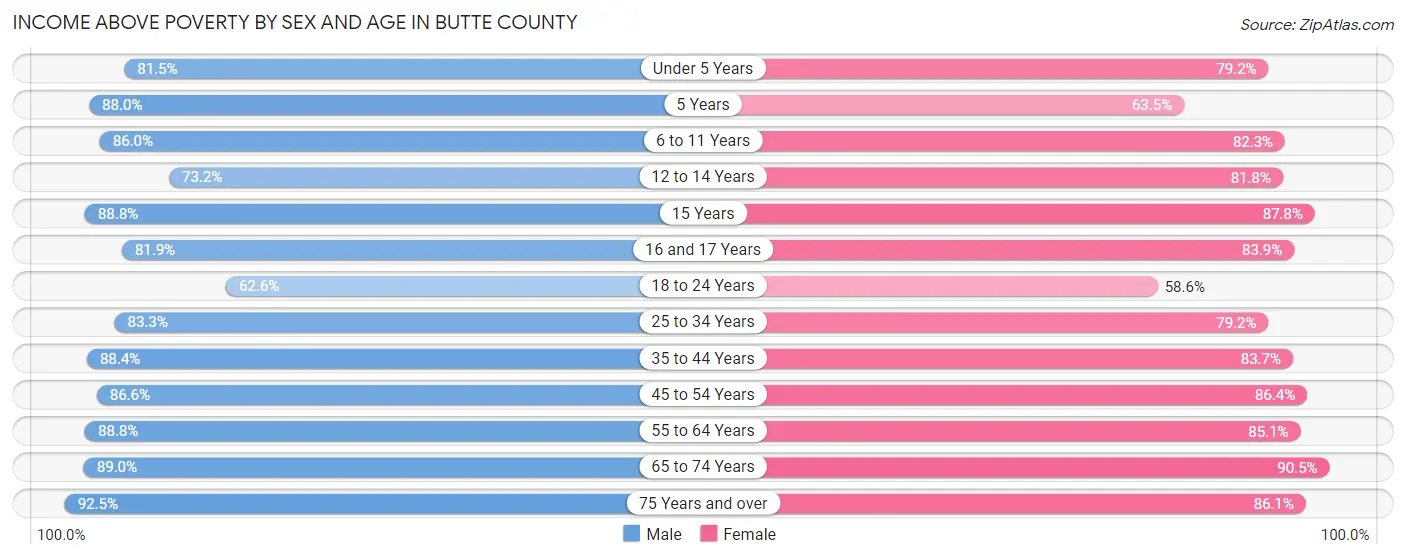
Income Above Poverty by Sex and Age in Butte County
According to the poverty statistics in Butte County, males aged 75 years and over and females aged 65 to 74 years are the age groups that are most secure financially, with 92.5% of males and 90.5% of females in these age groups living above the poverty line.
| Age Bracket | Male | Female |
| Under 5 Years | 4,661 (81.5%) | 4,284 (79.2%) |
| 5 Years | 1,110 (88.0%) | 564 (63.5%) |
| 6 to 11 Years | 6,459 (86.0%) | 6,037 (82.3%) |
| 12 to 14 Years | 2,465 (73.2%) | 2,785 (81.8%) |
| 15 Years | 1,078 (88.8%) | 1,100 (87.8%) |
| 16 and 17 Years | 2,127 (81.9%) | 1,976 (83.9%) |
| 18 to 24 Years | 9,224 (62.6%) | 8,503 (58.6%) |
| 25 to 34 Years | 11,865 (83.3%) | 10,452 (79.2%) |
| 35 to 44 Years | 11,097 (88.4%) | 9,957 (83.7%) |
| 45 to 54 Years | 9,487 (86.6%) | 9,399 (86.4%) |
| 55 to 64 Years | 10,944 (88.8%) | 11,204 (85.1%) |
| 65 to 74 Years | 9,751 (89.0%) | 10,780 (90.5%) |
| 75 Years and over | 5,941 (92.5%) | 7,453 (86.1%) |
| Total | 86,209 (83.0%) | 84,494 (80.6%) |
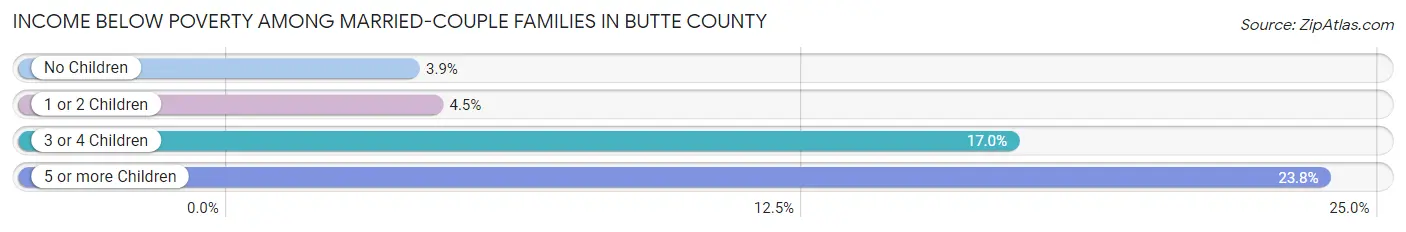
Income Below Poverty Among Married-Couple Families in Butte County
The poverty statistics for married-couple families in Butte County show that 5.3% or 1,824 of the total 34,285 families live below the poverty line. Families with 5 or more children have the highest poverty rate of 23.8%, comprising of 58 families. On the other hand, families with no children have the lowest poverty rate of 3.9%, which includes 831 families.
| Children | Above Poverty | Below Poverty |
| No Children | 20,284 (96.1%) | 831 (3.9%) |
| 1 or 2 Children | 9,607 (95.6%) | 447 (4.4%) |
| 3 or 4 Children | 2,384 (83.0%) | 488 (17.0%) |
| 5 or more Children | 186 (76.2%) | 58 (23.8%) |
| Total | 32,461 (94.7%) | 1,824 (5.3%) |
Income Below Poverty Among Single-Parent Households in Butte County
According to the poverty data in Butte County, 18.2% or 907 single-father households and 25.4% or 2,464 single-mother households are living below the poverty line. Among single-father households, those with 5 or more children have the highest poverty rate, with 5 households (62.5%) experiencing poverty. Likewise, among single-mother households, those with 3 or 4 children have the highest poverty rate, with 501 households (54.0%) falling below the poverty line.
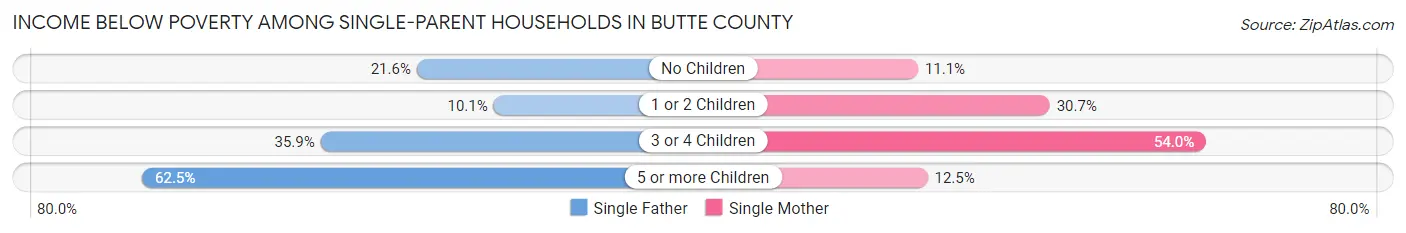
| Children | Single Father | Single Mother |
| No Children | 567 (21.6%) | 408 (11.1%) |
| 1 or 2 Children | 200 (10.1%) | 1,553 (30.7%) |
| 3 or 4 Children | 135 (35.9%) | 501 (54.0%) |
| 5 or more Children | 5 (62.5%) | 2 (12.5%) |
| Total | 907 (18.2%) | 2,464 (25.4%) |
Income Below Poverty Among Married-Couple vs Single-Parent Households in Butte County
The poverty data for Butte County shows that 1,824 of the married-couple family households (5.3%) and 3,371 of the single-parent households (23.0%) are living below the poverty level. Within the married-couple family households, those with 5 or more children have the highest poverty rate, with 58 households (23.8%) falling below the poverty line. Among the single-parent households, those with 3 or 4 children have the highest poverty rate, with 636 household (48.8%) living below poverty.
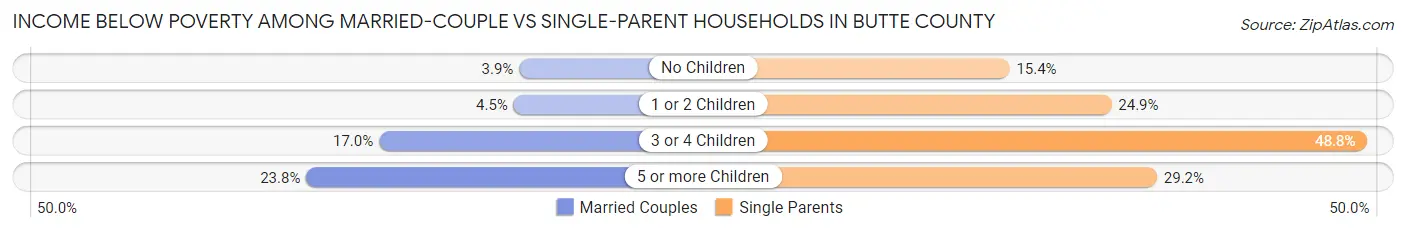
| Children | Married-Couple Families | Single-Parent Households |
| No Children | 831 (3.9%) | 975 (15.4%) |
| 1 or 2 Children | 447 (4.4%) | 1,753 (24.9%) |
| 3 or 4 Children | 488 (17.0%) | 636 (48.8%) |
| 5 or more Children | 58 (23.8%) | 7 (29.2%) |
| Total | 1,824 (5.3%) | 3,371 (23.0%) |
Race in Butte County
The most populous races in Butte County are White / Caucasian (161,779 | 75.7%), Hispanic or Latino (38,361 | 18.0%), and Two or more Races (21,743 | 10.2%).
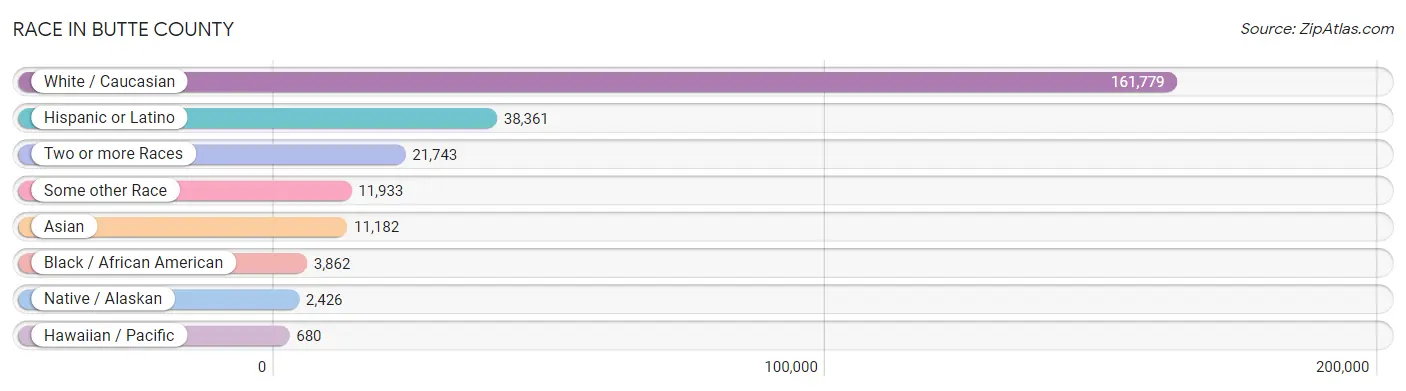
| Race | # Population | % Population |
| Asian | 11,182 | 5.2% |
| Black / African American | 3,862 | 1.8% |
| Hawaiian / Pacific | 680 | 0.3% |
| Hispanic or Latino | 38,361 | 18.0% |
| Native / Alaskan | 2,426 | 1.1% |
| White / Caucasian | 161,779 | 75.7% |
| Two or more Races | 21,743 | 10.2% |
| Some other Race | 11,933 | 5.6% |
| Total | 213,605 | 100.0% |
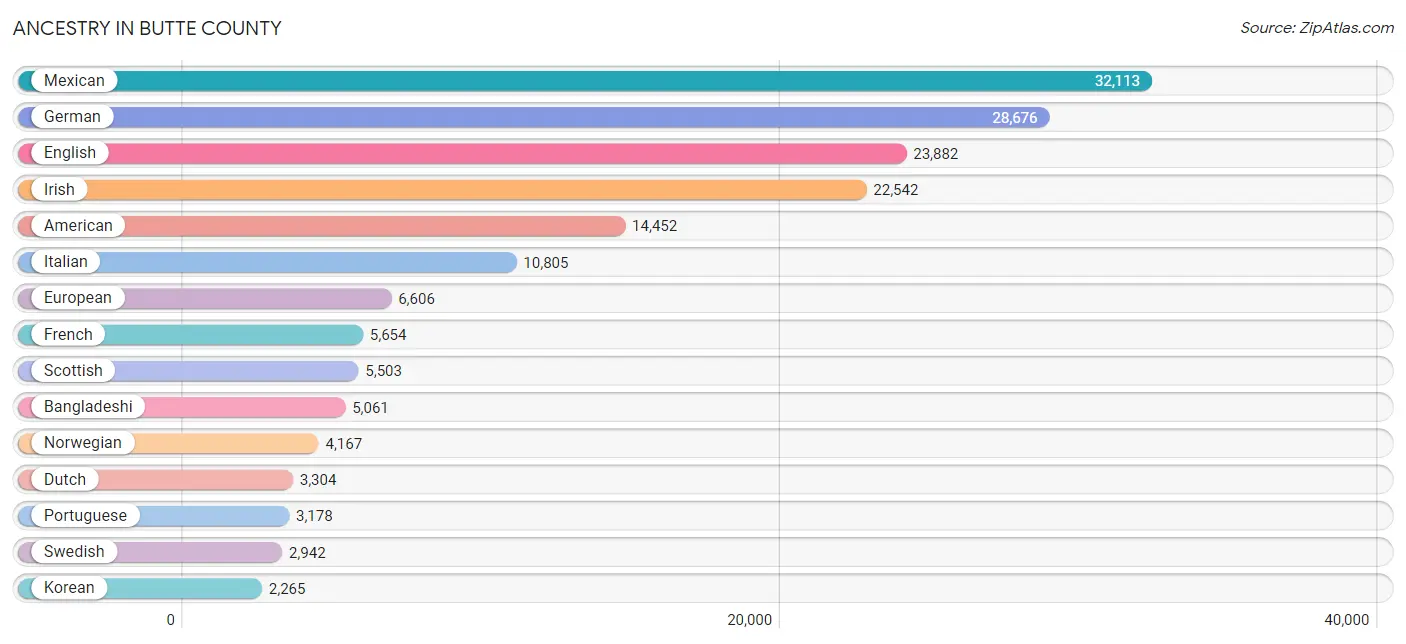
Ancestry in Butte County
The most populous ancestries reported in Butte County are Mexican (32,113 | 15.0%), German (28,676 | 13.4%), English (23,882 | 11.2%), Irish (22,542 | 10.5%), and American (14,452 | 6.8%), together accounting for 57.0% of all Butte County residents.
| Ancestry | # Population | % Population |
| Afghan | 90 | 0.0% |
| African | 387 | 0.2% |
| Alaskan Athabascan | 1 | 0.0% |
| Albanian | 28 | 0.0% |
| Alsatian | 16 | 0.0% |
| American | 14,452 | 6.8% |
| Apache | 133 | 0.1% |
| Arab | 585 | 0.3% |
| Argentinean | 66 | 0.0% |
| Armenian | 422 | 0.2% |
| Australian | 177 | 0.1% |
| Austrian | 286 | 0.1% |
| Bangladeshi | 5,061 | 2.4% |
| Basque | 228 | 0.1% |
| Belgian | 78 | 0.0% |
| Bhutanese | 1,186 | 0.6% |
| Blackfeet | 831 | 0.4% |
| Brazilian | 23 | 0.0% |
| British | 1,480 | 0.7% |
| Bulgarian | 13 | 0.0% |
| Burmese | 705 | 0.3% |
| Cajun | 75 | 0.0% |
| Canadian | 708 | 0.3% |
| Celtic | 84 | 0.0% |
| Central American | 1,070 | 0.5% |
| Central American Indian | 190 | 0.1% |
| Cherokee | 1,923 | 0.9% |
| Chickasaw | 53 | 0.0% |
| Chilean | 81 | 0.0% |
| Chinese | 4 | 0.0% |
| Chippewa | 95 | 0.0% |
| Choctaw | 389 | 0.2% |
| Colombian | 106 | 0.1% |
| Comanche | 9 | 0.0% |
| Costa Rican | 32 | 0.0% |
| Cree | 34 | 0.0% |
| Creek | 45 | 0.0% |
| Croatian | 563 | 0.3% |
| Cuban | 327 | 0.2% |
| Czech | 662 | 0.3% |
| Czechoslovakian | 297 | 0.1% |
| Danish | 1,501 | 0.7% |
| Dominican | 66 | 0.0% |
| Dutch | 3,304 | 1.5% |
| Dutch West Indian | 37 | 0.0% |
| Eastern European | 245 | 0.1% |
| Ecuadorian | 40 | 0.0% |
| Egyptian | 51 | 0.0% |
| English | 23,882 | 11.2% |
| Ethiopian | 18 | 0.0% |
| European | 6,606 | 3.1% |
| Fijian | 140 | 0.1% |
| Filipino | 184 | 0.1% |
| Finnish | 393 | 0.2% |
| French | 5,654 | 2.6% |
| French Canadian | 630 | 0.3% |
| German | 28,676 | 13.4% |
| German Russian | 26 | 0.0% |
| Greek | 523 | 0.2% |
| Guamanian / Chamorro | 143 | 0.1% |
| Guatemalan | 186 | 0.1% |
| Honduran | 64 | 0.0% |
| Hopi | 8 | 0.0% |
| Hungarian | 518 | 0.2% |
| Icelander | 113 | 0.1% |
| Indian (Asian) | 1,720 | 0.8% |
| Indonesian | 33 | 0.0% |
| Iranian | 187 | 0.1% |
| Irish | 22,542 | 10.5% |
| Iroquois | 132 | 0.1% |
| Israeli | 245 | 0.1% |
| Italian | 10,805 | 5.1% |
| Jamaican | 247 | 0.1% |
| Japanese | 100 | 0.1% |
| Korean | 2,265 | 1.1% |
| Laotian | 208 | 0.1% |
| Latvian | 94 | 0.0% |
| Lebanese | 180 | 0.1% |
| Lithuanian | 337 | 0.2% |
| Luxembourger | 15 | 0.0% |
| Malaysian | 634 | 0.3% |
| Maltese | 154 | 0.1% |
| Mexican | 32,113 | 15.0% |
| Mexican American Indian | 786 | 0.4% |
| Moroccan | 28 | 0.0% |
| Native Hawaiian | 368 | 0.2% |
| Navajo | 250 | 0.1% |
| Nepalese | 397 | 0.2% |
| New Zealander | 15 | 0.0% |
| Nicaraguan | 111 | 0.1% |
| Nigerian | 35 | 0.0% |
| Northern European | 589 | 0.3% |
| Norwegian | 4,167 | 1.9% |
| Osage | 23 | 0.0% |
| Ottawa | 5 | 0.0% |
| Paiute | 51 | 0.0% |
| Pakistani | 167 | 0.1% |
| Palestinian | 47 | 0.0% |
| Panamanian | 41 | 0.0% |
| Pennsylvania German | 23 | 0.0% |
| Peruvian | 304 | 0.1% |
| Pima | 10 | 0.0% |
| Polish | 2,210 | 1.0% |
| Portuguese | 3,178 | 1.5% |
| Potawatomi | 30 | 0.0% |
| Pueblo | 25 | 0.0% |
| Puerto Rican | 839 | 0.4% |
| Puget Sound Salish | 57 | 0.0% |
| Romanian | 363 | 0.2% |
| Russian | 1,362 | 0.6% |
| Salvadoran | 636 | 0.3% |
| Samoan | 279 | 0.1% |
| Scandinavian | 861 | 0.4% |
| Scotch-Irish | 2,103 | 1.0% |
| Scottish | 5,503 | 2.6% |
| Seminole | 19 | 0.0% |
| Senegalese | 31 | 0.0% |
| Serbian | 111 | 0.1% |
| Shoshone | 30 | 0.0% |
| Sioux | 444 | 0.2% |
| Slavic | 28 | 0.0% |
| Slovak | 107 | 0.1% |
| Slovene | 29 | 0.0% |
| South African | 46 | 0.0% |
| South American | 609 | 0.3% |
| South American Indian | 40 | 0.0% |
| Spaniard | 1,174 | 0.5% |
| Spanish | 1,209 | 0.6% |
| Spanish American | 29 | 0.0% |
| Sri Lankan | 953 | 0.4% |
| Subsaharan African | 534 | 0.3% |
| Swedish | 2,942 | 1.4% |
| Swiss | 910 | 0.4% |
| Syrian | 102 | 0.1% |
| Thai | 1,001 | 0.5% |
| Tohono O'Odham | 9 | 0.0% |
| Tongan | 201 | 0.1% |
| Turkish | 2 | 0.0% |
| Ukrainian | 451 | 0.2% |
| Venezuelan | 12 | 0.0% |
| Vietnamese | 136 | 0.1% |
| Welsh | 1,451 | 0.7% |
| West Indian | 7 | 0.0% |
| Yaqui | 129 | 0.1% |
| Yugoslavian | 110 | 0.1% |
| Yup'ik | 3 | 0.0% |
| Zimbabwean | 17 | 0.0% | View All 147 Rows |
Immigrants in Butte County
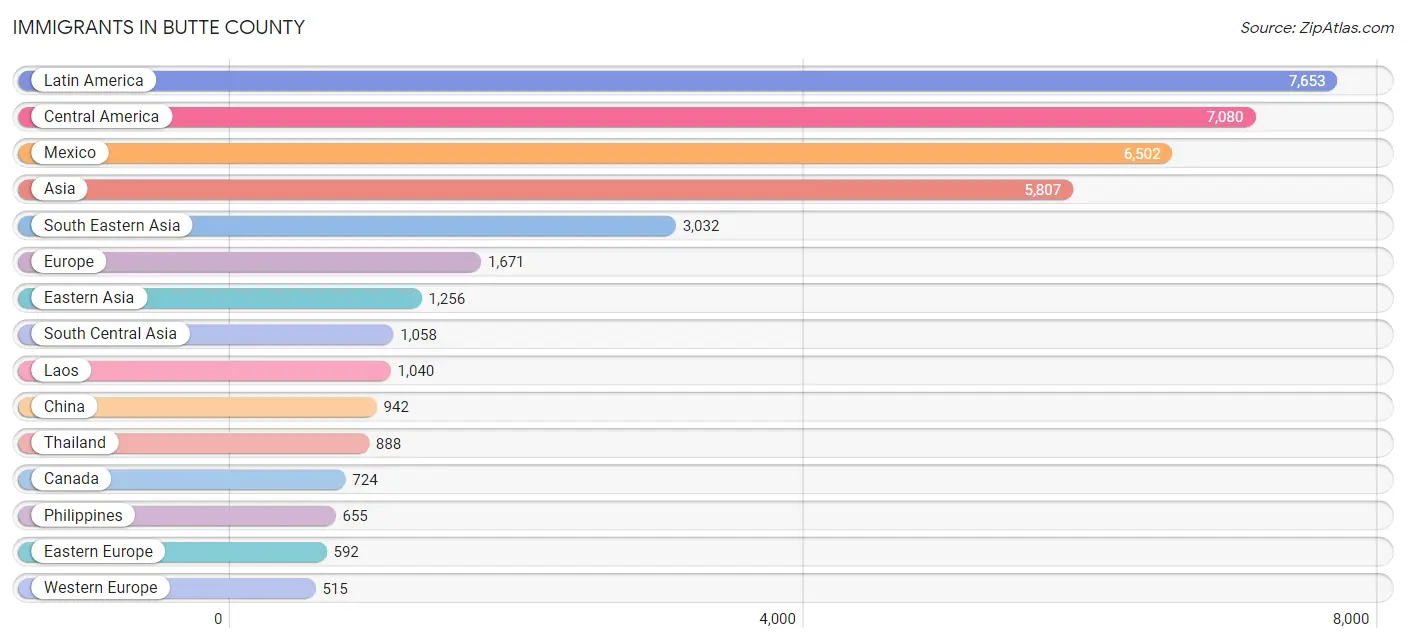
The most numerous immigrant groups reported in Butte County came from Latin America (7,653 | 3.6%), Central America (7,080 | 3.3%), Mexico (6,502 | 3.0%), Asia (5,807 | 2.7%), and South Eastern Asia (3,032 | 1.4%), together accounting for 14.1% of all Butte County residents.
| Immigration Origin | # Population | % Population |
| Afghanistan | 55 | 0.0% |
| Africa | 149 | 0.1% |
| Argentina | 47 | 0.0% |
| Armenia | 53 | 0.0% |
| Asia | 5,807 | 2.7% |
| Australia | 41 | 0.0% |
| Azores | 15 | 0.0% |
| Bangladesh | 96 | 0.0% |
| Belarus | 19 | 0.0% |
| Belgium | 47 | 0.0% |
| Bosnia and Herzegovina | 81 | 0.0% |
| Brazil | 28 | 0.0% |
| Cambodia | 36 | 0.0% |
| Canada | 724 | 0.3% |
| Caribbean | 331 | 0.2% |
| Central America | 7,080 | 3.3% |
| Chile | 24 | 0.0% |
| China | 942 | 0.4% |
| Colombia | 38 | 0.0% |
| Costa Rica | 10 | 0.0% |
| Cuba | 107 | 0.1% |
| Czechoslovakia | 10 | 0.0% |
| Denmark | 11 | 0.0% |
| Eastern Africa | 90 | 0.0% |
| Eastern Asia | 1,256 | 0.6% |
| Eastern Europe | 592 | 0.3% |
| Ecuador | 4 | 0.0% |
| El Salvador | 337 | 0.2% |
| England | 200 | 0.1% |
| Ethiopia | 6 | 0.0% |
| Europe | 1,671 | 0.8% |
| Fiji | 55 | 0.0% |
| France | 31 | 0.0% |
| Germany | 318 | 0.2% |
| Greece | 6 | 0.0% |
| Guatemala | 179 | 0.1% |
| Haiti | 13 | 0.0% |
| Honduras | 21 | 0.0% |
| Hong Kong | 69 | 0.0% |
| Hungary | 28 | 0.0% |
| India | 504 | 0.2% |
| Indonesia | 59 | 0.0% |
| Iran | 192 | 0.1% |
| Israel | 127 | 0.1% |
| Italy | 72 | 0.0% |
| Jamaica | 189 | 0.1% |
| Japan | 78 | 0.0% |
| Kazakhstan | 14 | 0.0% |
| Korea | 236 | 0.1% |
| Kuwait | 109 | 0.1% |
| Laos | 1,040 | 0.5% |
| Latin America | 7,653 | 3.6% |
| Latvia | 11 | 0.0% |
| Lebanon | 22 | 0.0% |
| Mexico | 6,502 | 3.0% |
| Micronesia | 19 | 0.0% |
| Moldova | 11 | 0.0% |
| Netherlands | 71 | 0.0% |
| Nicaragua | 20 | 0.0% |
| Nigeria | 21 | 0.0% |
| Northern Africa | 17 | 0.0% |
| Northern Europe | 438 | 0.2% |
| Oceania | 132 | 0.1% |
| Pakistan | 197 | 0.1% |
| Panama | 11 | 0.0% |
| Peru | 73 | 0.0% |
| Philippines | 655 | 0.3% |
| Poland | 43 | 0.0% |
| Portugal | 15 | 0.0% |
| Romania | 106 | 0.1% |
| Russia | 213 | 0.1% |
| Saudi Arabia | 98 | 0.1% |
| Scotland | 10 | 0.0% |
| South Africa | 21 | 0.0% |
| South America | 242 | 0.1% |
| South Central Asia | 1,058 | 0.5% |
| South Eastern Asia | 3,032 | 1.4% |
| Southern Europe | 126 | 0.1% |
| Spain | 33 | 0.0% |
| Sudan | 9 | 0.0% |
| Sweden | 20 | 0.0% |
| Switzerland | 48 | 0.0% |
| Syria | 35 | 0.0% |
| Taiwan | 146 | 0.1% |
| Thailand | 888 | 0.4% |
| Turkey | 2 | 0.0% |
| Ukraine | 62 | 0.0% |
| Venezuela | 28 | 0.0% |
| Vietnam | 333 | 0.2% |
| West Indies | 22 | 0.0% |
| Western Africa | 21 | 0.0% |
| Western Asia | 453 | 0.2% |
| Western Europe | 515 | 0.2% |
| Zimbabwe | 84 | 0.0% | View All 94 Rows |
Sex and Age in Butte County
Sex and Age in Butte County
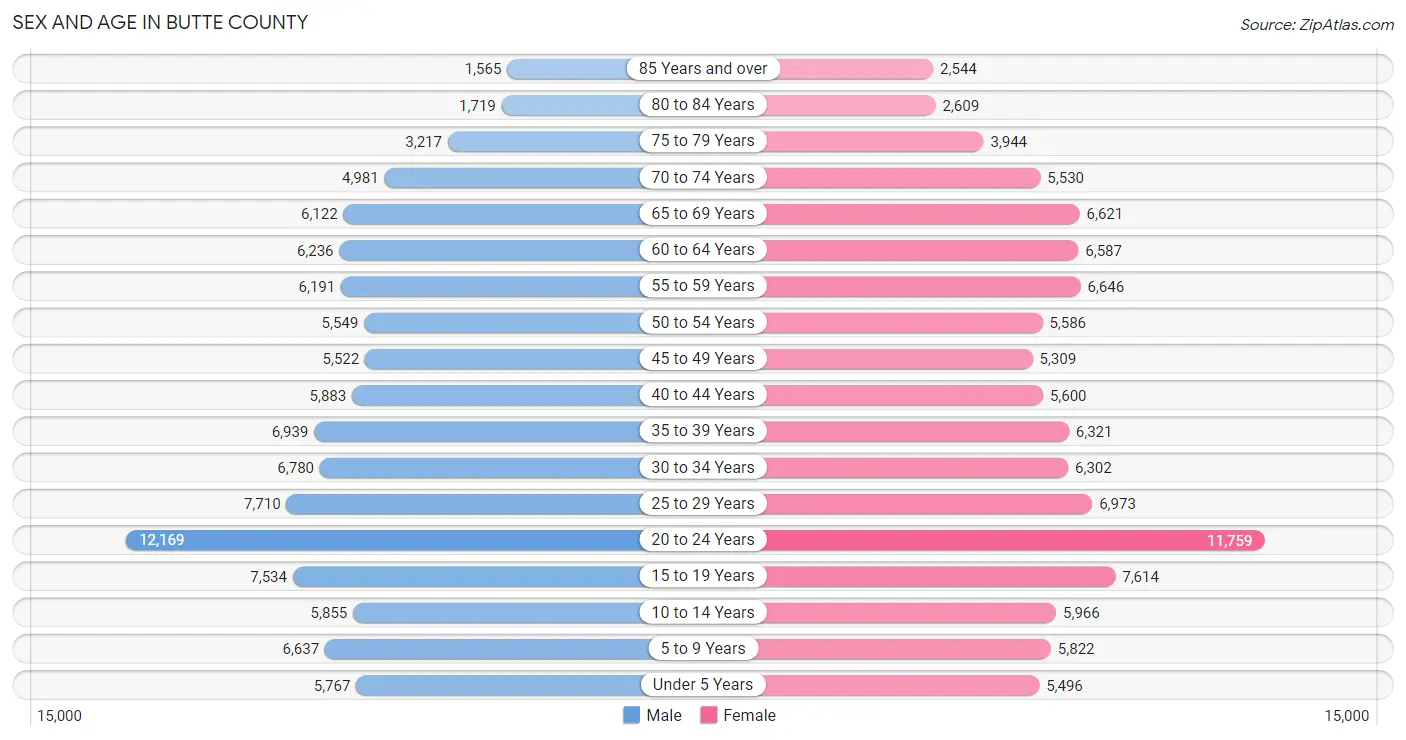
The most populous age groups in Butte County are 20 to 24 Years (12,169 | 11.4%) for men and 20 to 24 Years (11,759 | 11.0%) for women.
| Age Bracket | Male | Female |
| Under 5 Years | 5,767 (5.4%) | 5,496 (5.1%) |
| 5 to 9 Years | 6,637 (6.2%) | 5,822 (5.4%) |
| 10 to 14 Years | 5,855 (5.5%) | 5,966 (5.6%) |
| 15 to 19 Years | 7,534 (7.1%) | 7,614 (7.1%) |
| 20 to 24 Years | 12,169 (11.4%) | 11,759 (11.0%) |
| 25 to 29 Years | 7,710 (7.2%) | 6,973 (6.5%) |
| 30 to 34 Years | 6,780 (6.4%) | 6,302 (5.9%) |
| 35 to 39 Years | 6,939 (6.5%) | 6,321 (5.9%) |
| 40 to 44 Years | 5,883 (5.5%) | 5,600 (5.2%) |
| 45 to 49 Years | 5,522 (5.2%) | 5,309 (5.0%) |
| 50 to 54 Years | 5,549 (5.2%) | 5,586 (5.2%) |
| 55 to 59 Years | 6,191 (5.8%) | 6,646 (6.2%) |
| 60 to 64 Years | 6,236 (5.9%) | 6,587 (6.1%) |
| 65 to 69 Years | 6,122 (5.8%) | 6,621 (6.2%) |
| 70 to 74 Years | 4,981 (4.7%) | 5,530 (5.2%) |
| 75 to 79 Years | 3,217 (3.0%) | 3,944 (3.7%) |
| 80 to 84 Years | 1,719 (1.6%) | 2,609 (2.4%) |
| 85 Years and over | 1,565 (1.5%) | 2,544 (2.4%) |
| Total | 106,376 (100.0%) | 107,229 (100.0%) |
Families and Households in Butte County
Median Family Size in Butte County
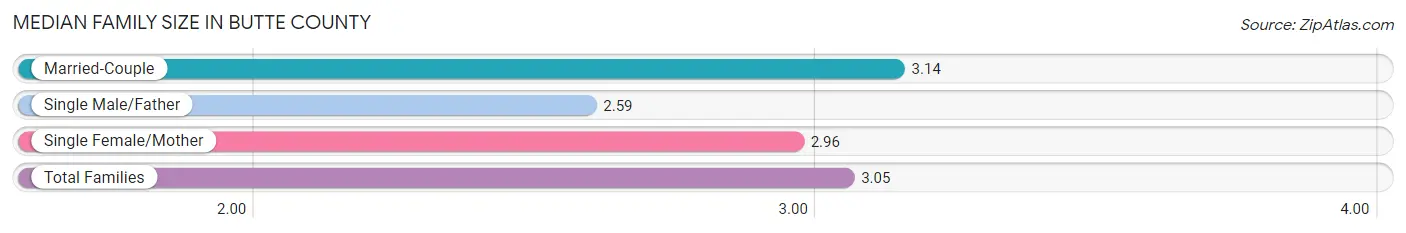
The median family size in Butte County is 3.05 persons per family, with married-couple families (34,285 | 70.0%) accounting for the largest median family size of 3.14 persons per family. On the other hand, single male/father families (4,989 | 10.2%) represent the smallest median family size with 2.59 persons per family.
| Family Type | # Families | Family Size |
| Married-Couple | 34,285 (70.0%) | 3.14 |
| Single Male/Father | 4,989 (10.2%) | 2.59 |
| Single Female/Mother | 9,687 (19.8%) | 2.96 |
| Total Families | 48,961 (100.0%) | 3.05 |
Median Household Size in Butte County
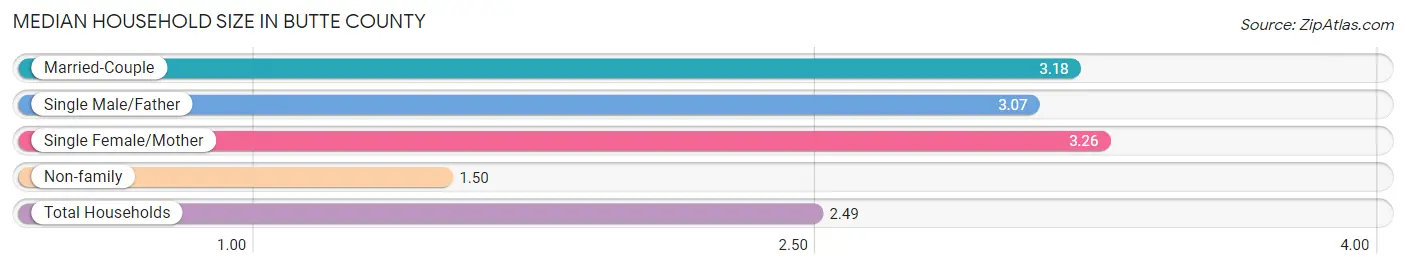
The median household size in Butte County is 2.49 persons per household, with single female/mother households (9,687 | 11.6%) accounting for the largest median household size of 3.26 persons per household. non-family households (34,358 | 41.2%) represent the smallest median household size with 1.50 persons per household.
| Household Type | # Households | Household Size |
| Married-Couple | 34,285 (41.1%) | 3.18 |
| Single Male/Father | 4,989 (6.0%) | 3.07 |
| Single Female/Mother | 9,687 (11.6%) | 3.26 |
| Non-family | 34,358 (41.2%) | 1.50 |
| Total Households | 83,319 (100.0%) | 2.49 |
Household Size by Marriage Status in Butte County
Out of a total of 83,319 households in Butte County, 48,961 (58.8%) are family households, while 34,358 (41.2%) are nonfamily households. The most numerous type of family households are 2-person households, comprising 22,536, and the most common type of nonfamily households are 1-person households, comprising 22,726.
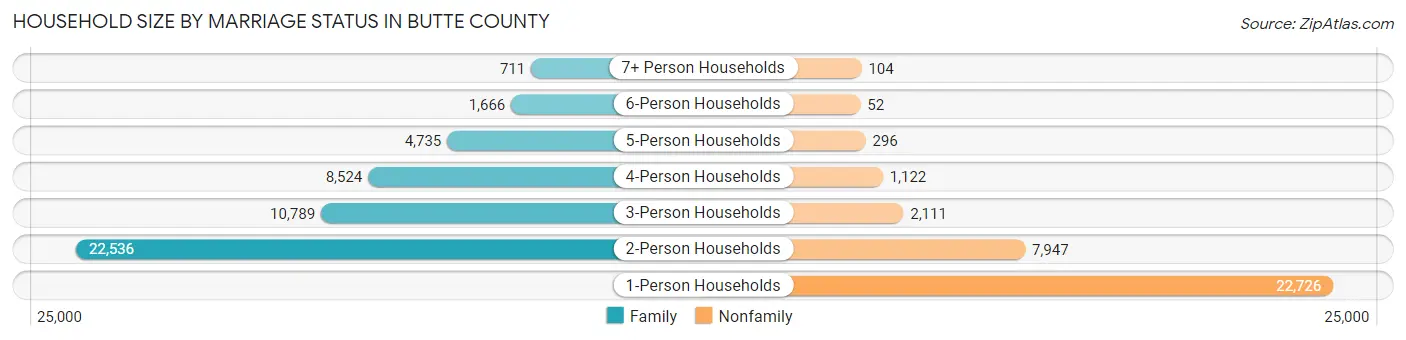
| Household Size | Family Households | Nonfamily Households |
| 1-Person Households | - | 22,726 (27.3%) |
| 2-Person Households | 22,536 (27.1%) | 7,947 (9.5%) |
| 3-Person Households | 10,789 (13.0%) | 2,111 (2.5%) |
| 4-Person Households | 8,524 (10.2%) | 1,122 (1.3%) |
| 5-Person Households | 4,735 (5.7%) | 296 (0.4%) |
| 6-Person Households | 1,666 (2.0%) | 52 (0.1%) |
| 7+ Person Households | 711 (0.9%) | 104 (0.1%) |
| Total | 48,961 (58.8%) | 34,358 (41.2%) |
Female Fertility in Butte County
Fertility by Age in Butte County
Average fertility rate in Butte County is 47.0 births per 1,000 women. Women in the age bracket of 20 to 34 years have the highest fertility rate with 73.0 births per 1,000 women. Women in the age bracket of 20 to 34 years acount for 76.4% of all women with births.
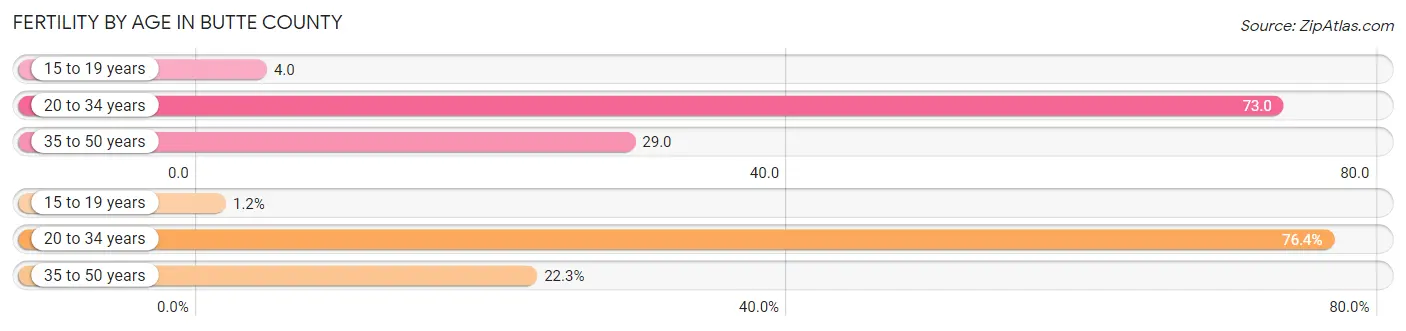
| Age Bracket | Women with Births | Births / 1,000 Women |
| 15 to 19 years | 29 (1.2%) | 4.0 |
| 20 to 34 years | 1,820 (76.4%) | 73.0 |
| 35 to 50 years | 532 (22.3%) | 29.0 |
| Total | 2,381 (100.0%) | 47.0 |
Fertility by Age by Marriage Status in Butte County
62.7% of women with births (2,381) in Butte County are married. The highest percentage of unmarried women with births falls into 15 to 19 years age bracket with 100.0% of them unmarried at the time of birth, while the lowest percentage of unmarried women with births belong to 35 to 50 years age bracket with 19.6% of them unmarried.
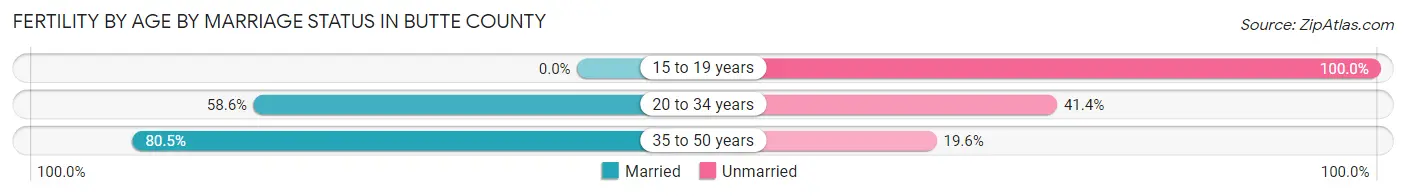
| Age Bracket | Married | Unmarried |
| 15 to 19 years | 0 (0.0%) | 29 (100.0%) |
| 20 to 34 years | 1,067 (58.6%) | 753 (41.4%) |
| 35 to 50 years | 428 (80.4%) | 104 (19.6%) |
| Total | 1,493 (62.7%) | 888 (37.3%) |
Fertility by Education in Butte County
Average fertility rate in Butte County is 47.0 births per 1,000 women. Women with the education attainment of bachelor's degree have the highest fertility rate of 63.0 births per 1,000 women, while women with the education attainment of college or associate's degree have the lowest fertility at 36.0 births per 1,000 women. Women with the education attainment of college or associate's degree represent 31.3% of all women with births.
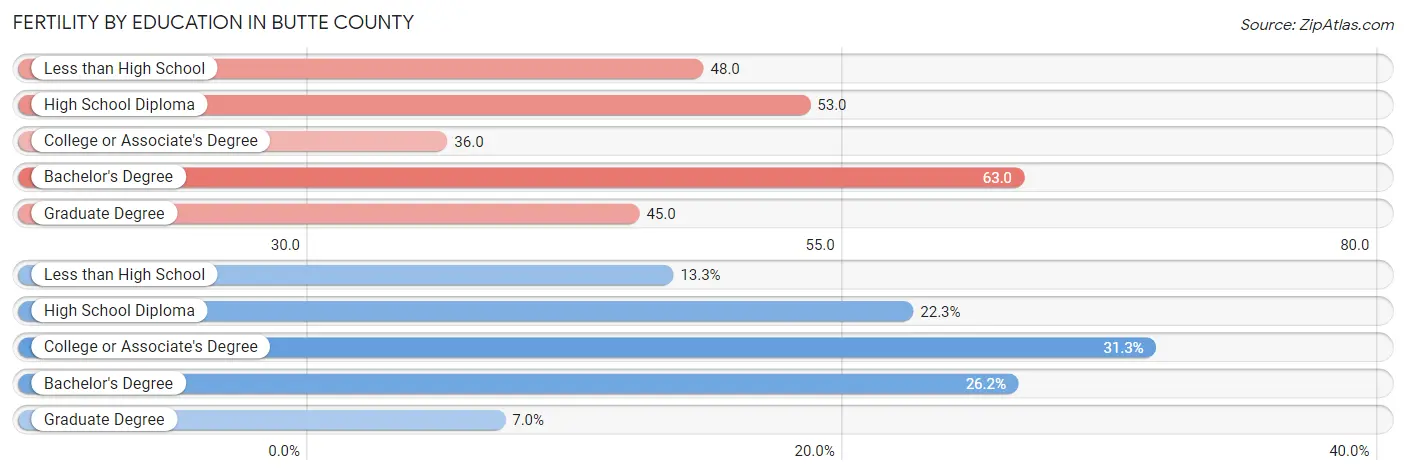
| Educational Attainment | Women with Births | Births / 1,000 Women |
| Less than High School | 316 (13.3%) | 48.0 |
| High School Diploma | 530 (22.3%) | 53.0 |
| College or Associate's Degree | 746 (31.3%) | 36.0 |
| Bachelor's Degree | 623 (26.2%) | 63.0 |
| Graduate Degree | 166 (7.0%) | 45.0 |
| Total | 2,381 (100.0%) | 47.0 |
Fertility by Education by Marriage Status in Butte County
37.3% of women with births in Butte County are unmarried. Women with the educational attainment of graduate degree are most likely to be married with 92.2% of them married at childbirth, while women with the educational attainment of college or associate's degree are least likely to be married with 49.5% of them unmarried at childbirth.
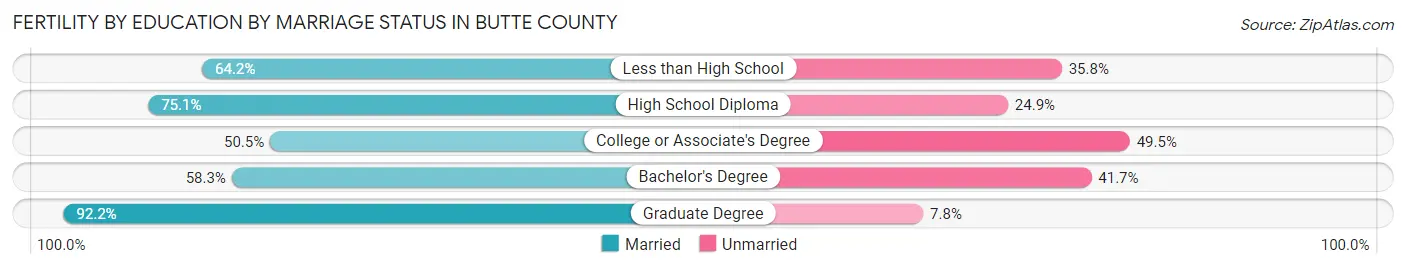
| Educational Attainment | Married | Unmarried |
| Less than High School | 203 (64.2%) | 113 (35.8%) |
| High School Diploma | 398 (75.1%) | 132 (24.9%) |
| College or Associate's Degree | 377 (50.5%) | 369 (49.5%) |
| Bachelor's Degree | 363 (58.3%) | 260 (41.7%) |
| Graduate Degree | 153 (92.2%) | 13 (7.8%) |
| Total | 1,493 (62.7%) | 888 (37.3%) |
Employment Characteristics in Butte County
Employment by Class of Employer in Butte County
Among the 91,975 employed individuals in Butte County, private company employees (55,748 | 60.6%), not-for-profit organizations (8,744 | 9.5%), and local government employees (8,663 | 9.4%) make up the most common classes of employment.
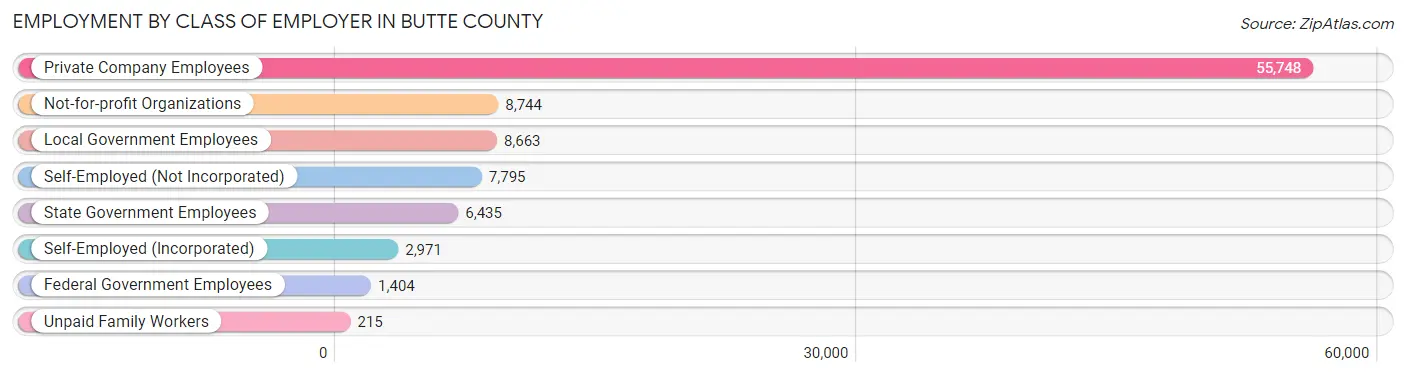
| Employer Class | # Employees | % Employees |
| Private Company Employees | 55,748 | 60.6% |
| Self-Employed (Incorporated) | 2,971 | 3.2% |
| Self-Employed (Not Incorporated) | 7,795 | 8.5% |
| Not-for-profit Organizations | 8,744 | 9.5% |
| Local Government Employees | 8,663 | 9.4% |
| State Government Employees | 6,435 | 7.0% |
| Federal Government Employees | 1,404 | 1.5% |
| Unpaid Family Workers | 215 | 0.2% |
| Total | 91,975 | 100.0% |
Employment Status by Age in Butte County
According to the labor force statistics for Butte County, out of the total population over 16 years of age (175,591), 58.6% or 102,896 individuals are in the labor force, with 7.1% or 7,306 of them unemployed. The age group with the highest labor force participation rate is 25 to 29 years, with 83.2% or 12,216 individuals in the labor force. Within the labor force, the 16 to 19 years age range has the highest percentage of unemployed individuals, with 15.1% or 685 of them being unemployed.
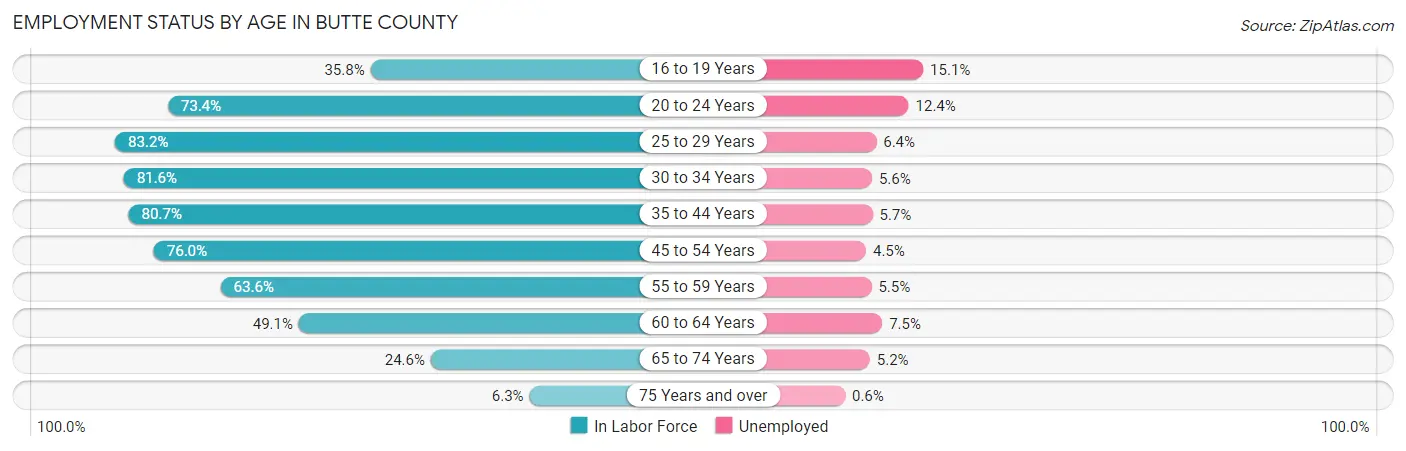
| Age Bracket | In Labor Force | Unemployed |
| 16 to 19 Years | 4,538 (35.8%) | 685 (15.1%) |
| 20 to 24 Years | 17,563 (73.4%) | 2,178 (12.4%) |
| 25 to 29 Years | 12,216 (83.2%) | 782 (6.4%) |
| 30 to 34 Years | 10,675 (81.6%) | 598 (5.6%) |
| 35 to 44 Years | 19,968 (80.7%) | 1,138 (5.7%) |
| 45 to 54 Years | 16,694 (76.0%) | 751 (4.5%) |
| 55 to 59 Years | 8,164 (63.6%) | 449 (5.5%) |
| 60 to 64 Years | 6,296 (49.1%) | 472 (7.5%) |
| 65 to 74 Years | 5,720 (24.6%) | 297 (5.2%) |
| 75 Years and over | 983 (6.3%) | 6 (0.6%) |
| Total | 102,896 (58.6%) | 7,306 (7.1%) |
Employment Status by Educational Attainment in Butte County
According to labor force statistics for Butte County, 73.9% of individuals (73,999) out of the total population between 25 and 64 years of age (100,134) are in the labor force, with 5.7% or 4,218 of them being unemployed. The group with the highest labor force participation rate are those with the educational attainment of bachelor's degree or higher, with 85.5% or 25,535 individuals in the labor force. Within the labor force, individuals with less than high school education have the highest percentage of unemployment, with 11.4% or 610 of them being unemployed.
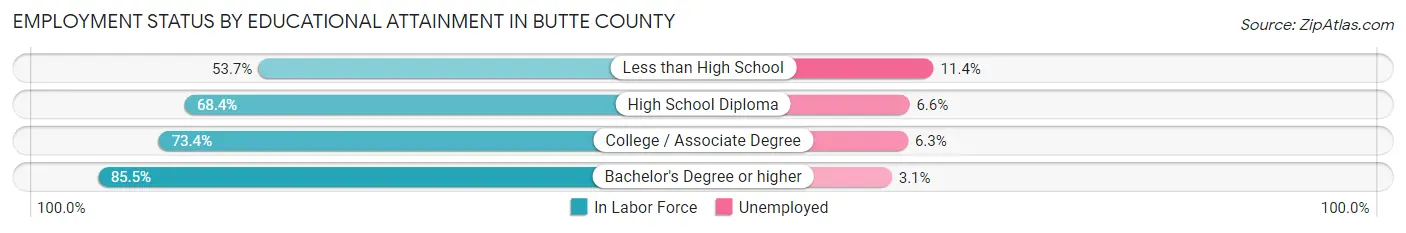
| Educational Attainment | In Labor Force | Unemployed |
| Less than High School | 5,352 (53.7%) | 1,136 (11.4%) |
| High School Diploma | 15,382 (68.4%) | 1,484 (6.6%) |
| College / Associate Degree | 27,755 (73.4%) | 2,382 (6.3%) |
| Bachelor's Degree or higher | 25,535 (85.5%) | 926 (3.1%) |
| Total | 73,999 (73.9%) | 5,708 (5.7%) |
Employment Occupations by Sex in Butte County
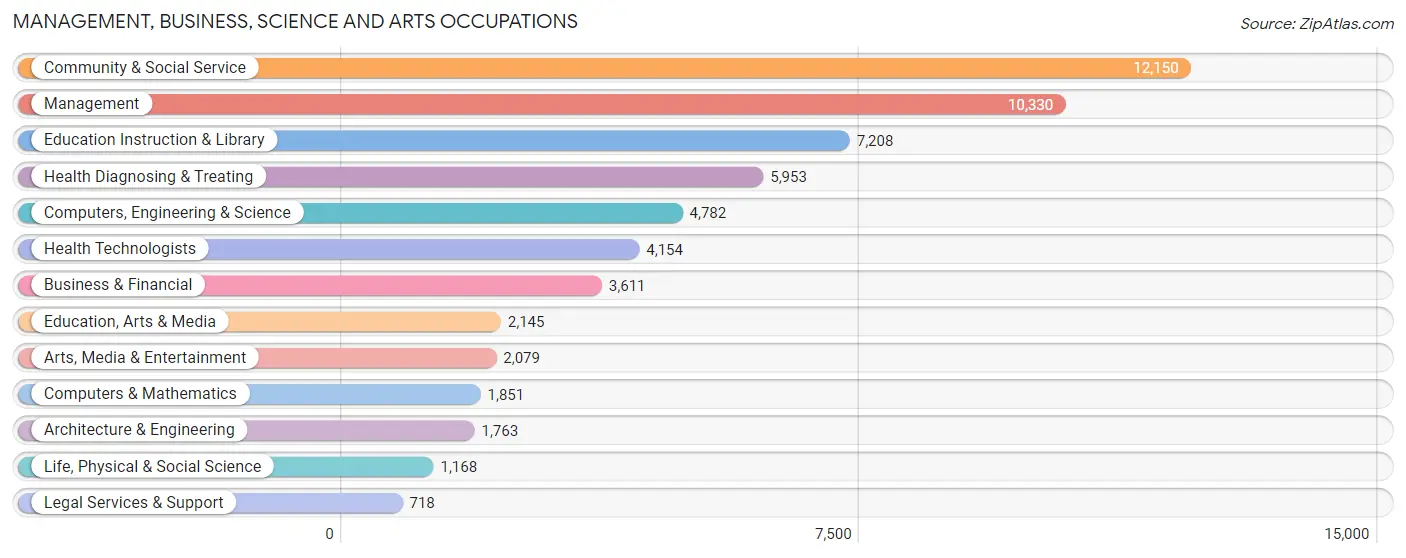
Management, Business, Science and Arts Occupations
The most common Management, Business, Science and Arts occupations in Butte County are Community & Social Service (12,150 | 12.7%), Management (10,330 | 10.8%), Education Instruction & Library (7,208 | 7.6%), Health Diagnosing & Treating (5,953 | 6.2%), and Computers, Engineering & Science (4,782 | 5.0%).
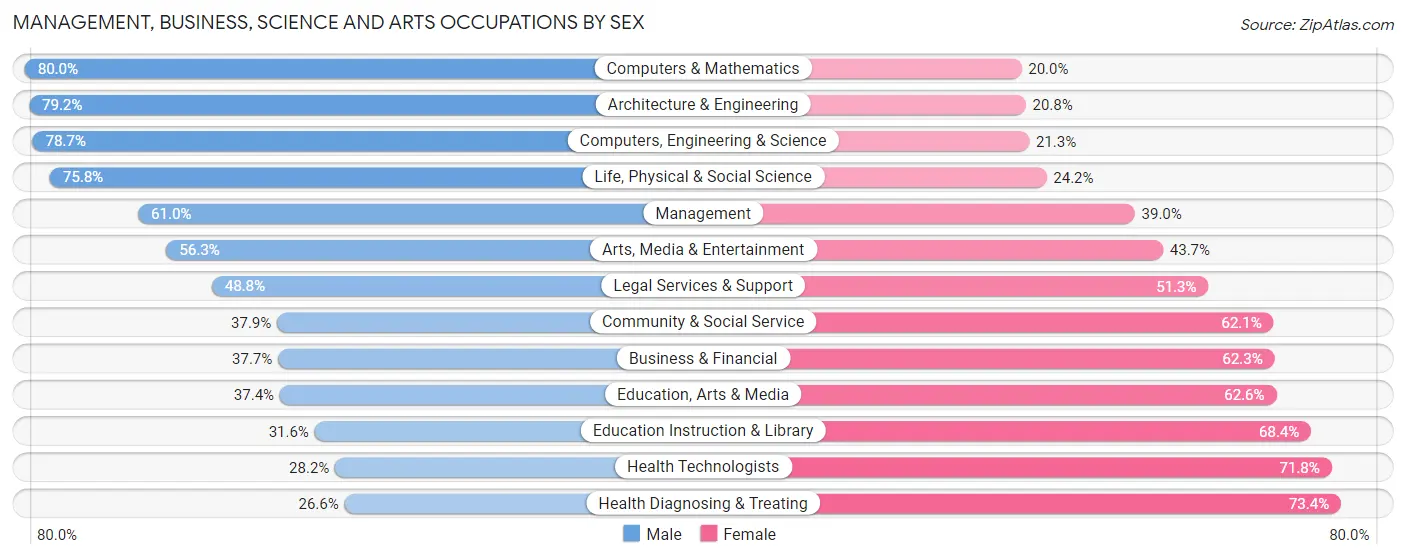
Management, Business, Science and Arts Occupations by Sex
Within the Management, Business, Science and Arts occupations in Butte County, the most male-oriented occupations are Computers & Mathematics (80.0%), Architecture & Engineering (79.2%), and Computers, Engineering & Science (78.7%), while the most female-oriented occupations are Health Diagnosing & Treating (73.4%), Health Technologists (71.8%), and Education Instruction & Library (68.4%).
| Occupation | Male | Female |
| Management | 6,305 (61.0%) | 4,025 (39.0%) |
| Business & Financial | 1,361 (37.7%) | 2,250 (62.3%) |
| Computers, Engineering & Science | 3,762 (78.7%) | 1,020 (21.3%) |
| Computers & Mathematics | 1,480 (80.0%) | 371 (20.0%) |
| Architecture & Engineering | 1,397 (79.2%) | 366 (20.8%) |
| Life, Physical & Social Science | 885 (75.8%) | 283 (24.2%) |
| Community & Social Service | 4,600 (37.9%) | 7,550 (62.1%) |
| Education, Arts & Media | 802 (37.4%) | 1,343 (62.6%) |
| Legal Services & Support | 350 (48.7%) | 368 (51.2%) |
| Education Instruction & Library | 2,277 (31.6%) | 4,931 (68.4%) |
| Arts, Media & Entertainment | 1,171 (56.3%) | 908 (43.7%) |
| Health Diagnosing & Treating | 1,584 (26.6%) | 4,369 (73.4%) |
| Health Technologists | 1,170 (28.2%) | 2,984 (71.8%) |
| Total (Category) | 17,612 (47.8%) | 19,214 (52.2%) |
| Total (Overall) | 49,715 (52.1%) | 45,663 (47.9%) |
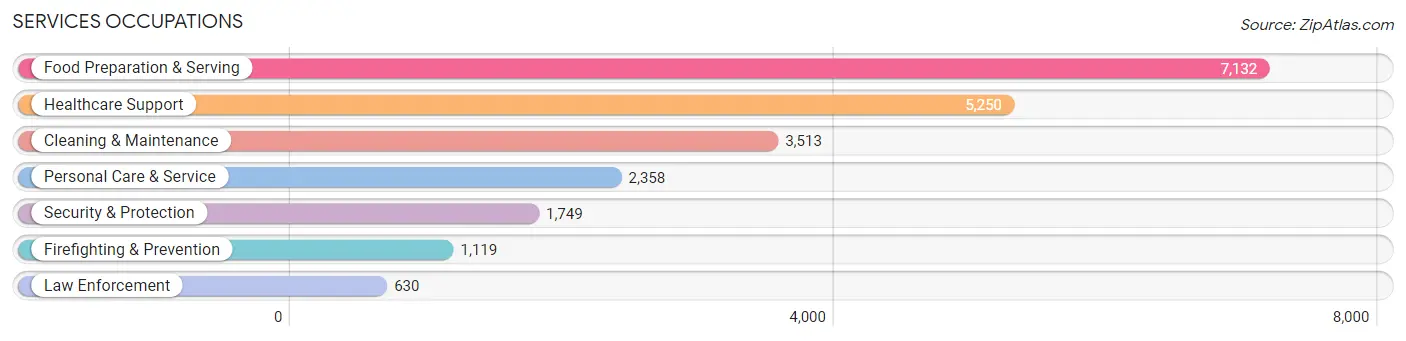
Services Occupations
The most common Services occupations in Butte County are Food Preparation & Serving (7,132 | 7.5%), Healthcare Support (5,250 | 5.5%), Cleaning & Maintenance (3,513 | 3.7%), Personal Care & Service (2,358 | 2.5%), and Security & Protection (1,749 | 1.8%).
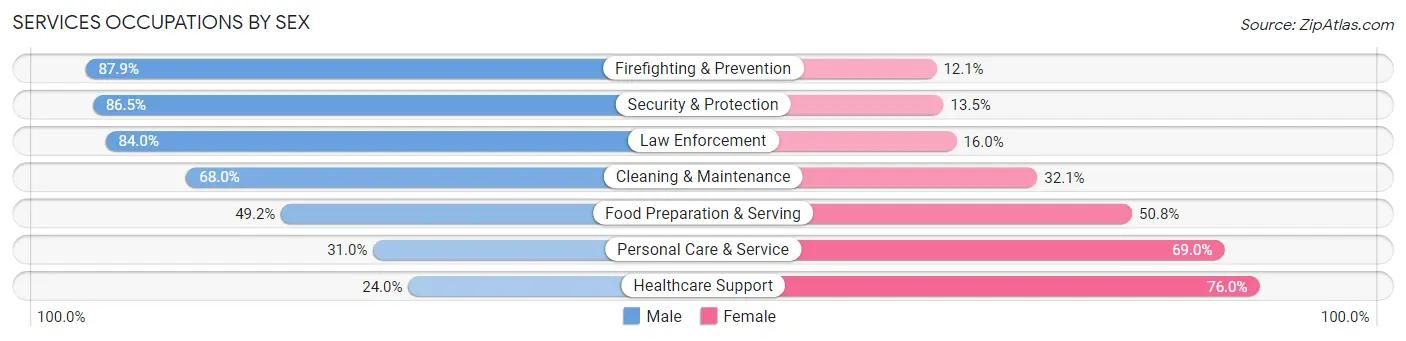
Services Occupations by Sex
Within the Services occupations in Butte County, the most male-oriented occupations are Firefighting & Prevention (87.9%), Security & Protection (86.5%), and Law Enforcement (84.0%), while the most female-oriented occupations are Healthcare Support (76.0%), Personal Care & Service (69.0%), and Food Preparation & Serving (50.8%).
| Occupation | Male | Female |
| Healthcare Support | 1,261 (24.0%) | 3,989 (76.0%) |
| Security & Protection | 1,513 (86.5%) | 236 (13.5%) |
| Firefighting & Prevention | 984 (87.9%) | 135 (12.1%) |
| Law Enforcement | 529 (84.0%) | 101 (16.0%) |
| Food Preparation & Serving | 3,508 (49.2%) | 3,624 (50.8%) |
| Cleaning & Maintenance | 2,387 (67.9%) | 1,126 (32.1%) |
| Personal Care & Service | 730 (31.0%) | 1,628 (69.0%) |
| Total (Category) | 9,399 (47.0%) | 10,603 (53.0%) |
| Total (Overall) | 49,715 (52.1%) | 45,663 (47.9%) |
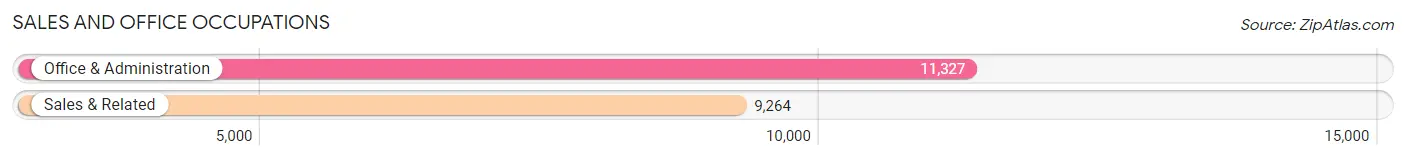
Sales and Office Occupations
The most common Sales and Office occupations in Butte County are Office & Administration (11,327 | 11.9%), and Sales & Related (9,264 | 9.7%).
Sales and Office Occupations by Sex
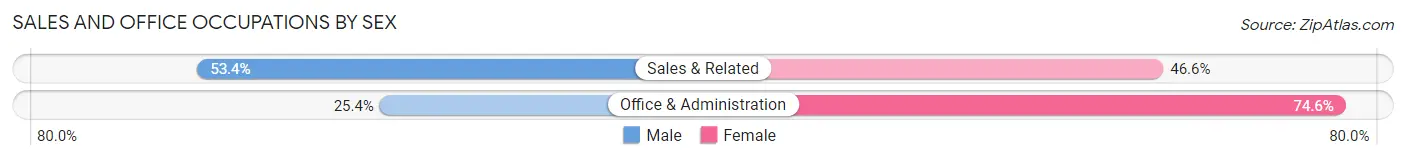
| Occupation | Male | Female |
| Sales & Related | 4,949 (53.4%) | 4,315 (46.6%) |
| Office & Administration | 2,874 (25.4%) | 8,453 (74.6%) |
| Total (Category) | 7,823 (38.0%) | 12,768 (62.0%) |
| Total (Overall) | 49,715 (52.1%) | 45,663 (47.9%) |
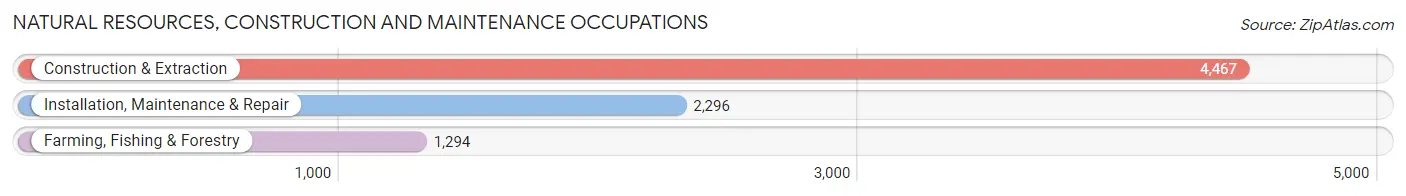
Natural Resources, Construction and Maintenance Occupations
The most common Natural Resources, Construction and Maintenance occupations in Butte County are Construction & Extraction (4,467 | 4.7%), Installation, Maintenance & Repair (2,296 | 2.4%), and Farming, Fishing & Forestry (1,294 | 1.4%).
Natural Resources, Construction and Maintenance Occupations by Sex
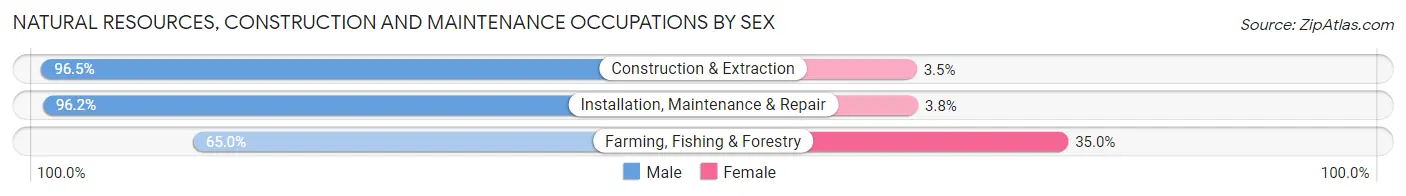
| Occupation | Male | Female |
| Farming, Fishing & Forestry | 841 (65.0%) | 453 (35.0%) |
| Construction & Extraction | 4,311 (96.5%) | 156 (3.5%) |
| Installation, Maintenance & Repair | 2,209 (96.2%) | 87 (3.8%) |
| Total (Category) | 7,361 (91.4%) | 696 (8.6%) |
| Total (Overall) | 49,715 (52.1%) | 45,663 (47.9%) |
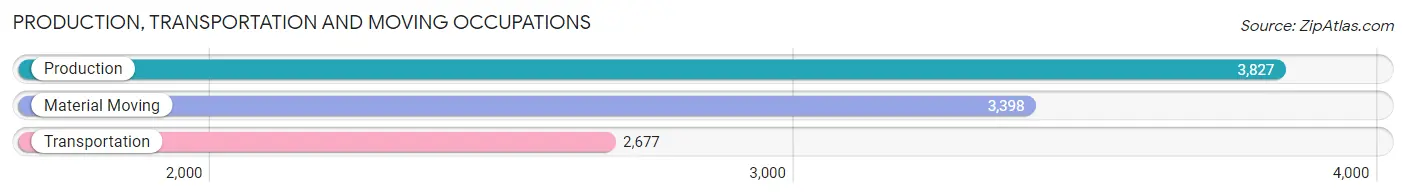
Production, Transportation and Moving Occupations
The most common Production, Transportation and Moving occupations in Butte County are Production (3,827 | 4.0%), Material Moving (3,398 | 3.6%), and Transportation (2,677 | 2.8%).
Production, Transportation and Moving Occupations by Sex
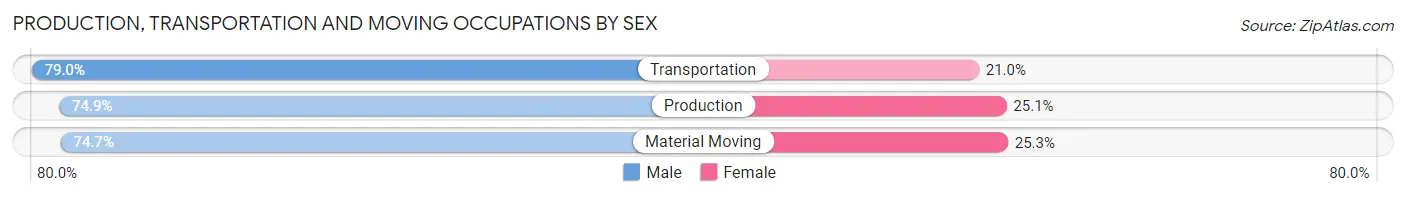
| Occupation | Male | Female |
| Production | 2,867 (74.9%) | 960 (25.1%) |
| Transportation | 2,114 (79.0%) | 563 (21.0%) |
| Material Moving | 2,539 (74.7%) | 859 (25.3%) |
| Total (Category) | 7,520 (75.9%) | 2,382 (24.1%) |
| Total (Overall) | 49,715 (52.1%) | 45,663 (47.9%) |
Employment Industries by Sex in Butte County
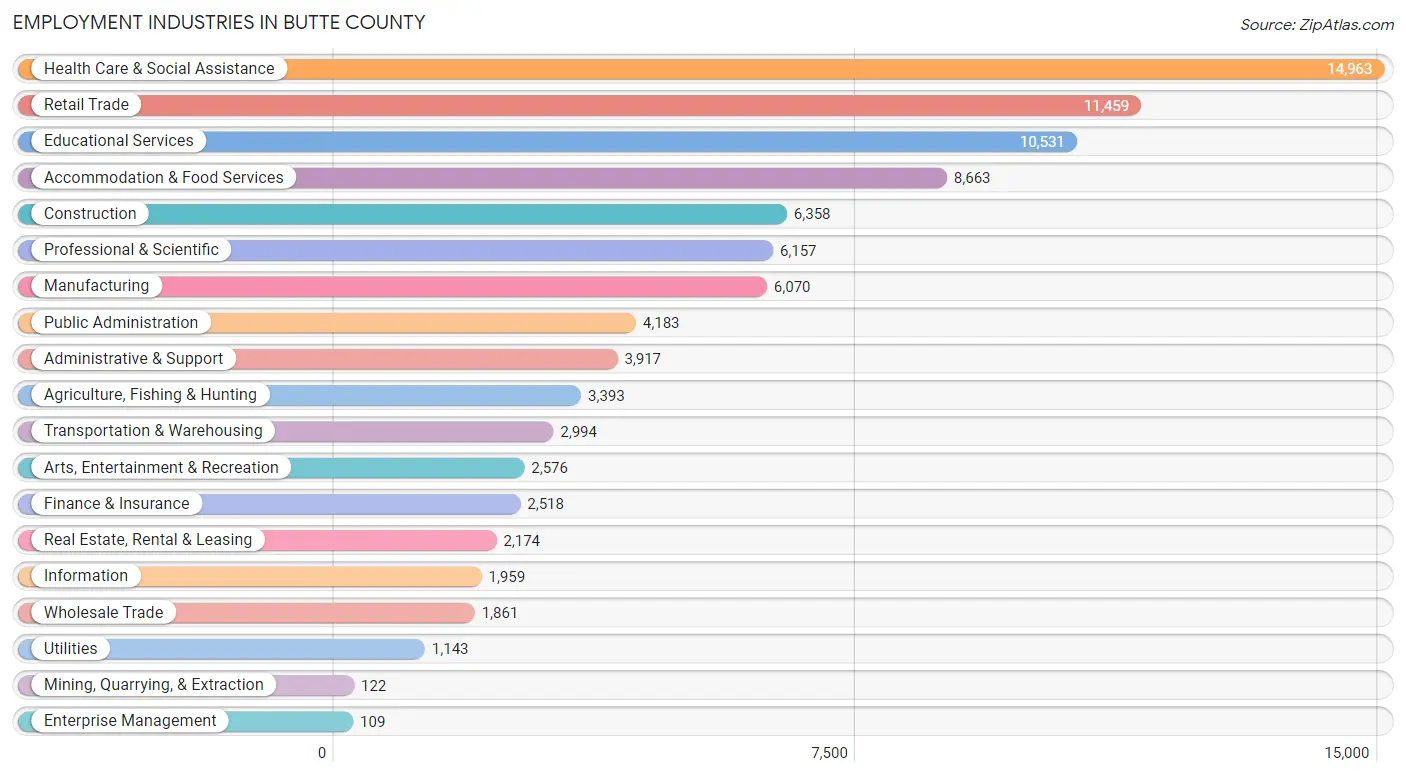
Employment Industries in Butte County
The major employment industries in Butte County include Health Care & Social Assistance (14,963 | 15.7%), Retail Trade (11,459 | 12.0%), Educational Services (10,531 | 11.0%), Accommodation & Food Services (8,663 | 9.1%), and Construction (6,358 | 6.7%).
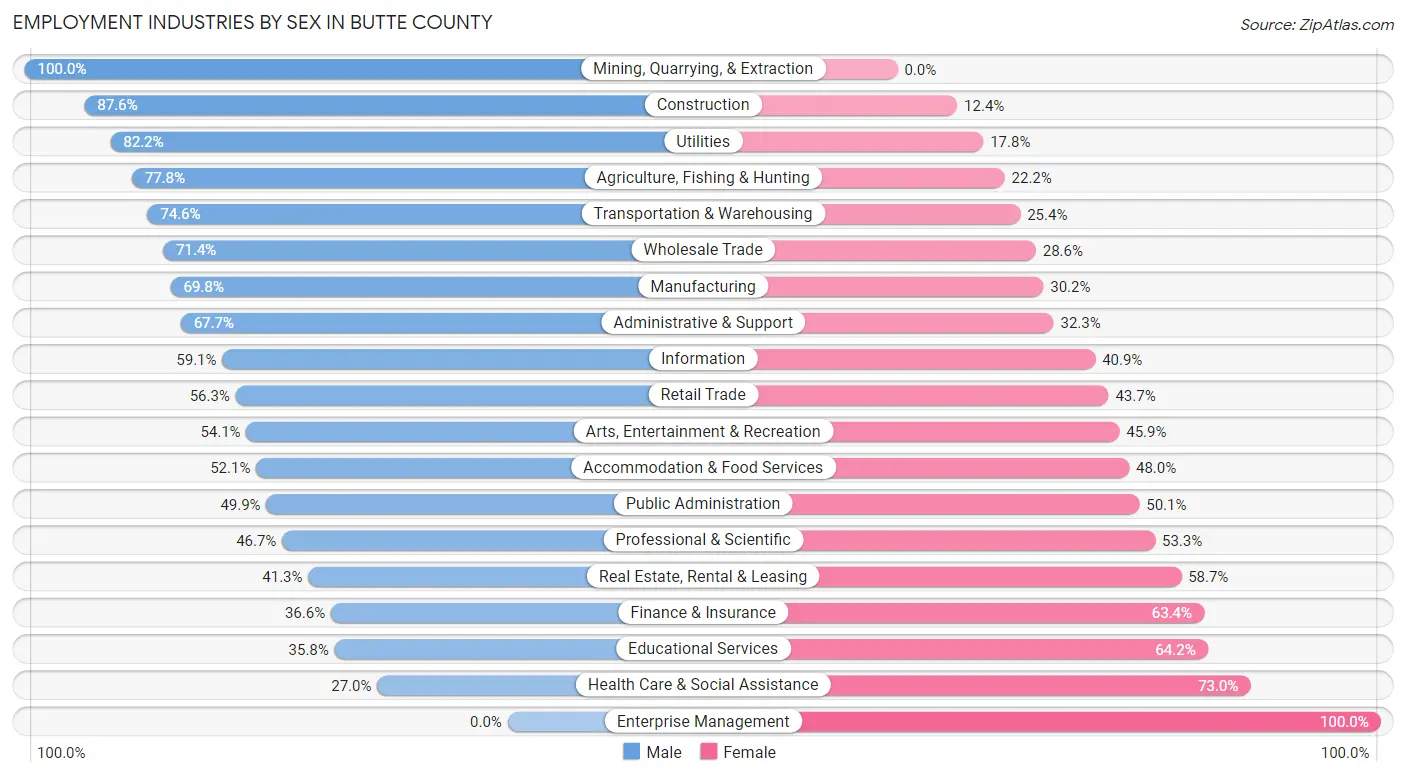
Employment Industries by Sex in Butte County
The Butte County industries that see more men than women are Mining, Quarrying, & Extraction (100.0%), Construction (87.6%), and Utilities (82.2%), whereas the industries that tend to have a higher number of women are Enterprise Management (100.0%), Health Care & Social Assistance (73.0%), and Educational Services (64.2%).
| Industry | Male | Female |
| Agriculture, Fishing & Hunting | 2,640 (77.8%) | 753 (22.2%) |
| Mining, Quarrying, & Extraction | 122 (100.0%) | 0 (0.0%) |
| Construction | 5,572 (87.6%) | 786 (12.4%) |
| Manufacturing | 4,237 (69.8%) | 1,833 (30.2%) |
| Wholesale Trade | 1,328 (71.4%) | 533 (28.6%) |
| Retail Trade | 6,452 (56.3%) | 5,007 (43.7%) |
| Transportation & Warehousing | 2,233 (74.6%) | 761 (25.4%) |
| Utilities | 940 (82.2%) | 203 (17.8%) |
| Information | 1,157 (59.1%) | 802 (40.9%) |
| Finance & Insurance | 921 (36.6%) | 1,597 (63.4%) |
| Real Estate, Rental & Leasing | 897 (41.3%) | 1,277 (58.7%) |
| Professional & Scientific | 2,874 (46.7%) | 3,283 (53.3%) |
| Enterprise Management | 0 (0.0%) | 109 (100.0%) |
| Administrative & Support | 2,651 (67.7%) | 1,266 (32.3%) |
| Educational Services | 3,773 (35.8%) | 6,758 (64.2%) |
| Health Care & Social Assistance | 4,039 (27.0%) | 10,924 (73.0%) |
| Arts, Entertainment & Recreation | 1,393 (54.1%) | 1,183 (45.9%) |
| Accommodation & Food Services | 4,509 (52.0%) | 4,154 (47.9%) |
| Public Administration | 2,089 (49.9%) | 2,094 (50.1%) |
| Total | 49,715 (52.1%) | 45,663 (47.9%) |
Education in Butte County
School Enrollment in Butte County
The most common levels of schooling among the 58,722 students in Butte County are college / undergraduate (22,220 | 37.8%), high school (10,400 | 17.7%), and elementary school (9,510 | 16.2%).
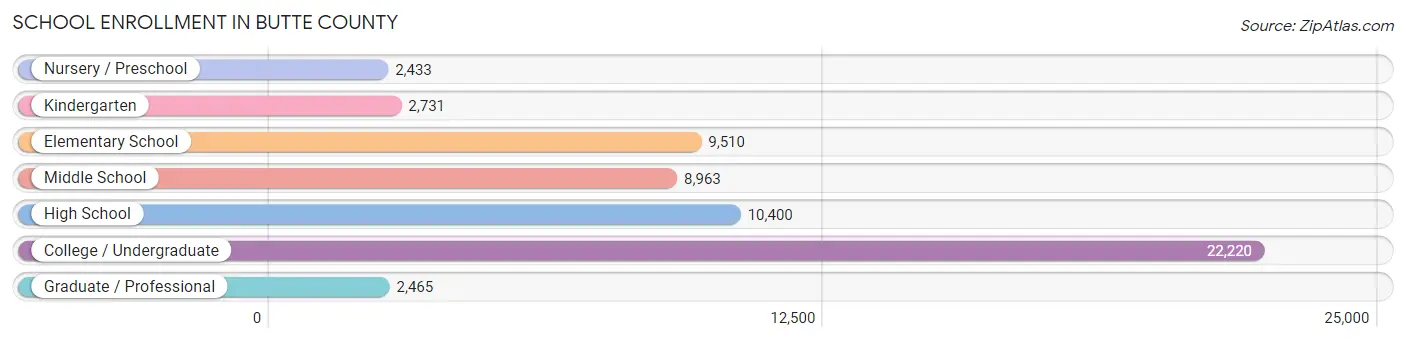
| School Level | # Students | % Students |
| Nursery / Preschool | 2,433 | 4.1% |
| Kindergarten | 2,731 | 4.6% |
| Elementary School | 9,510 | 16.2% |
| Middle School | 8,963 | 15.3% |
| High School | 10,400 | 17.7% |
| College / Undergraduate | 22,220 | 37.8% |
| Graduate / Professional | 2,465 | 4.2% |
| Total | 58,722 | 100.0% |
School Enrollment by Age by Funding Source in Butte County
Out of a total of 58,722 students who are enrolled in schools in Butte County, 5,402 (9.2%) attend a private institution, while the remaining 53,320 (90.8%) are enrolled in public schools. The age group of 3 to 4 year olds has the highest likelihood of being enrolled in private schools, with 794 (43.3% in the age bracket) enrolled. Conversely, the age group of 18 to 19 year olds has the lowest likelihood of being enrolled in a private school, with 5,728 (96.8% in the age bracket) attending a public institution.
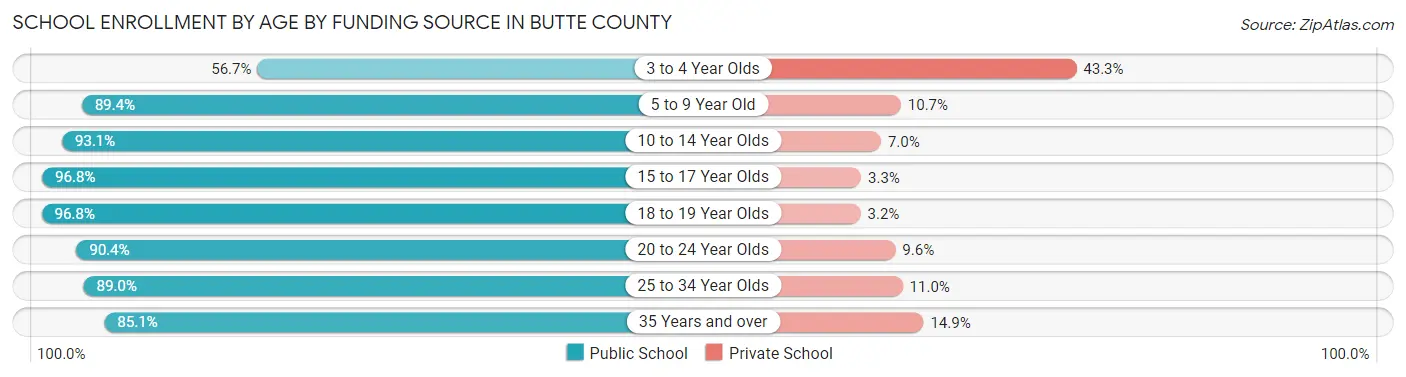
| Age Bracket | Public School | Private School |
| 3 to 4 Year Olds | 1,038 (56.7%) | 794 (43.3%) |
| 5 to 9 Year Old | 10,585 (89.3%) | 1,262 (10.6%) |
| 10 to 14 Year Olds | 10,657 (93.0%) | 796 (7.0%) |
| 15 to 17 Year Olds | 7,140 (96.8%) | 240 (3.3%) |
| 18 to 19 Year Olds | 5,728 (96.8%) | 187 (3.2%) |
| 20 to 24 Year Olds | 12,321 (90.4%) | 1,315 (9.6%) |
| 25 to 34 Year Olds | 3,743 (89.0%) | 462 (11.0%) |
| 35 Years and over | 2,089 (85.1%) | 365 (14.9%) |
| Total | 53,320 (90.8%) | 5,402 (9.2%) |
Educational Attainment by Field of Study in Butte County
Business (6,645 | 14.3%), science & technology (4,895 | 10.5%), social sciences (4,592 | 9.9%), arts & humanities (4,223 | 9.1%), and bio, nature & agricultural (3,899 | 8.4%) are the most common fields of study among 46,411 individuals in Butte County who have obtained a bachelor's degree or higher.
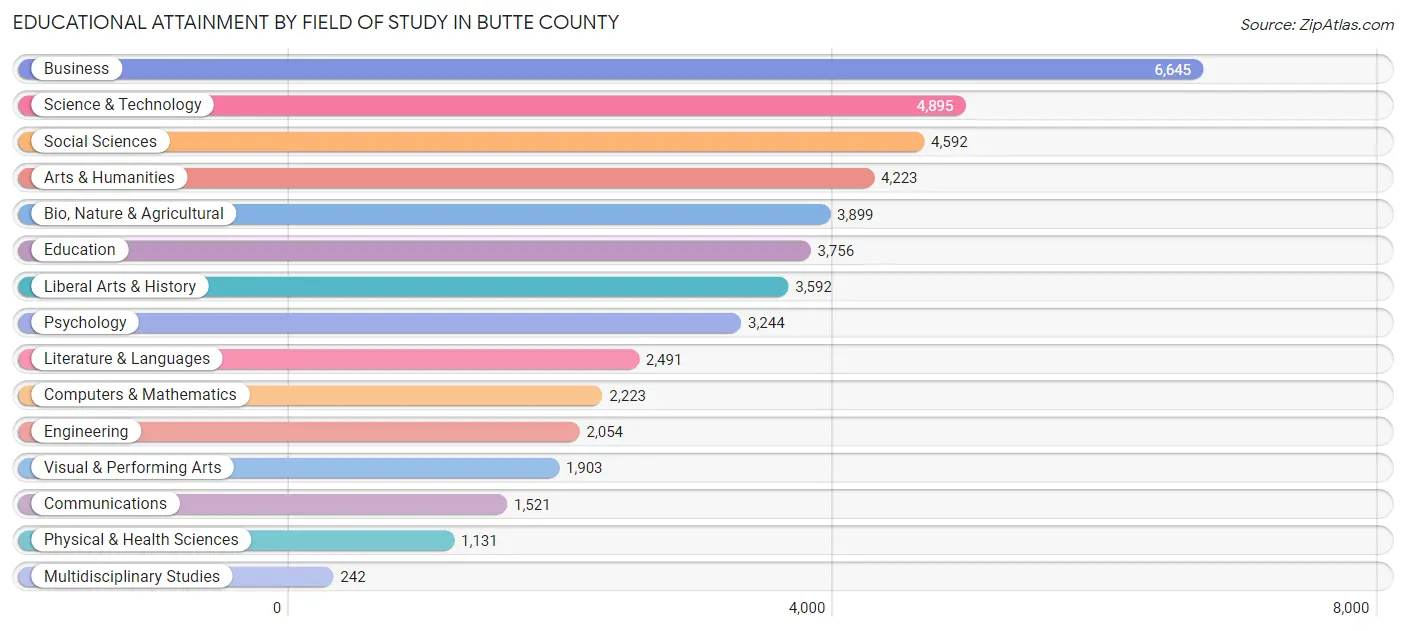
| Field of Study | # Graduates | % Graduates |
| Computers & Mathematics | 2,223 | 4.8% |
| Bio, Nature & Agricultural | 3,899 | 8.4% |
| Physical & Health Sciences | 1,131 | 2.4% |
| Psychology | 3,244 | 7.0% |
| Social Sciences | 4,592 | 9.9% |
| Engineering | 2,054 | 4.4% |
| Multidisciplinary Studies | 242 | 0.5% |
| Science & Technology | 4,895 | 10.5% |
| Business | 6,645 | 14.3% |
| Education | 3,756 | 8.1% |
| Literature & Languages | 2,491 | 5.4% |
| Liberal Arts & History | 3,592 | 7.7% |
| Visual & Performing Arts | 1,903 | 4.1% |
| Communications | 1,521 | 3.3% |
| Arts & Humanities | 4,223 | 9.1% |
| Total | 46,411 | 100.0% |
Transportation & Commute in Butte County
Vehicle Availability by Sex in Butte County
The most prevalent vehicle ownership categories in Butte County are males with 2 vehicles (19,688, accounting for 41.6%) and females with 2 vehicles (17,103, making up 45.4%).
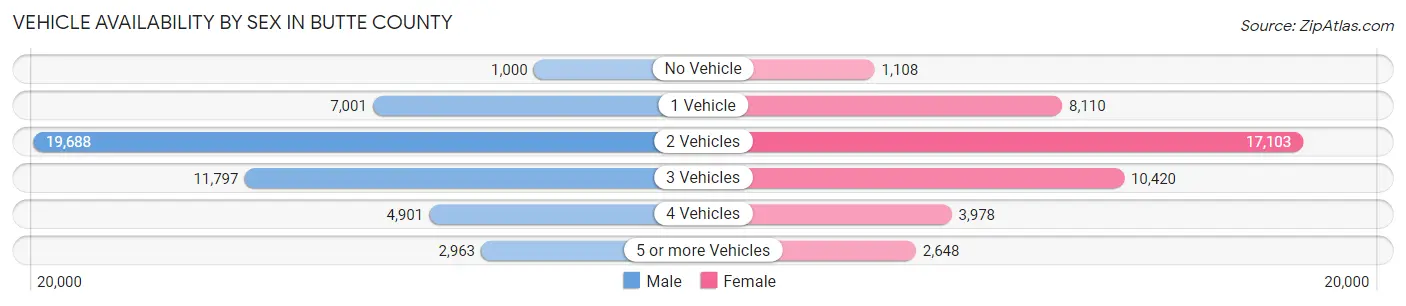
| Vehicles Available | Male | Female |
| No Vehicle | 1,000 (2.1%) | 1,108 (2.5%) |
| 1 Vehicle | 7,001 (14.8%) | 8,110 (18.7%) |
| 2 Vehicles | 19,688 (41.6%) | 17,103 (39.4%) |
| 3 Vehicles | 11,797 (24.9%) | 10,420 (24.0%) |
| 4 Vehicles | 4,901 (10.3%) | 3,978 (9.2%) |
| 5 or more Vehicles | 2,963 (6.3%) | 2,648 (6.1%) |
| Total | 47,350 (100.0%) | 43,367 (100.0%) |
Commute Time in Butte County
The most frequently occuring commute durations in Butte County are 10 to 14 minutes (18,675 commuters, 22.7%), 5 to 9 minutes (15,075 commuters, 18.3%), and 15 to 19 minutes (14,045 commuters, 17.1%).
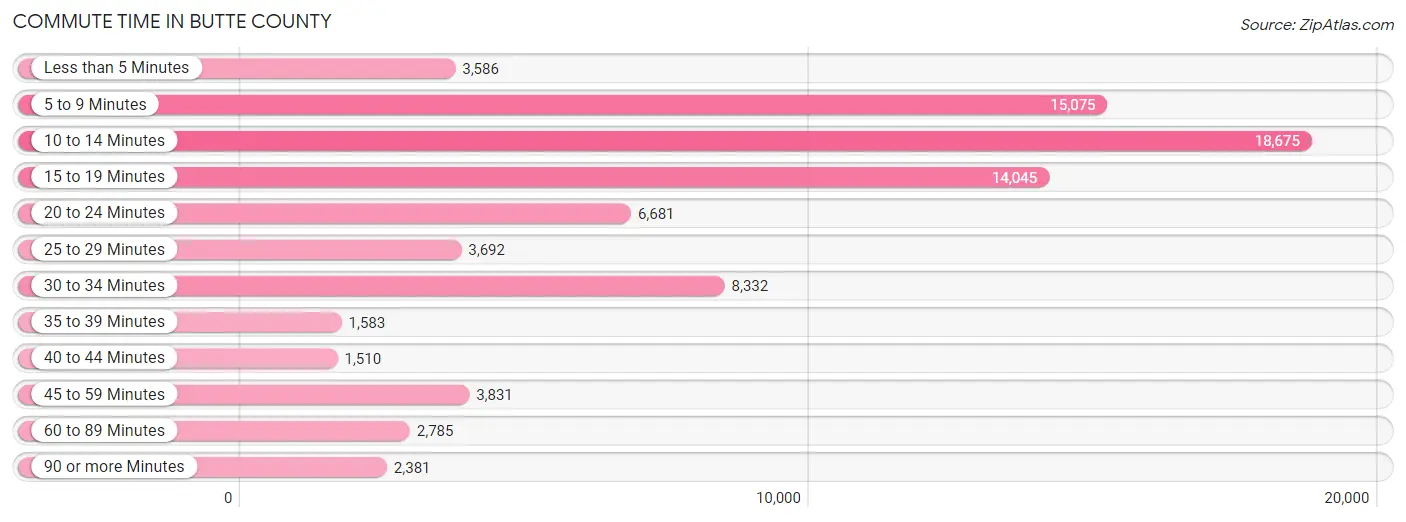
| Commute Time | # Commuters | % Commuters |
| Less than 5 Minutes | 3,586 | 4.4% |
| 5 to 9 Minutes | 15,075 | 18.3% |
| 10 to 14 Minutes | 18,675 | 22.7% |
| 15 to 19 Minutes | 14,045 | 17.1% |
| 20 to 24 Minutes | 6,681 | 8.1% |
| 25 to 29 Minutes | 3,692 | 4.5% |
| 30 to 34 Minutes | 8,332 | 10.1% |
| 35 to 39 Minutes | 1,583 | 1.9% |
| 40 to 44 Minutes | 1,510 | 1.8% |
| 45 to 59 Minutes | 3,831 | 4.7% |
| 60 to 89 Minutes | 2,785 | 3.4% |
| 90 or more Minutes | 2,381 | 2.9% |
Commute Time by Sex in Butte County
The most common commute times in Butte County are 10 to 14 minutes (9,127 commuters, 21.0%) for males and 10 to 14 minutes (9,548 commuters, 24.7%) for females.
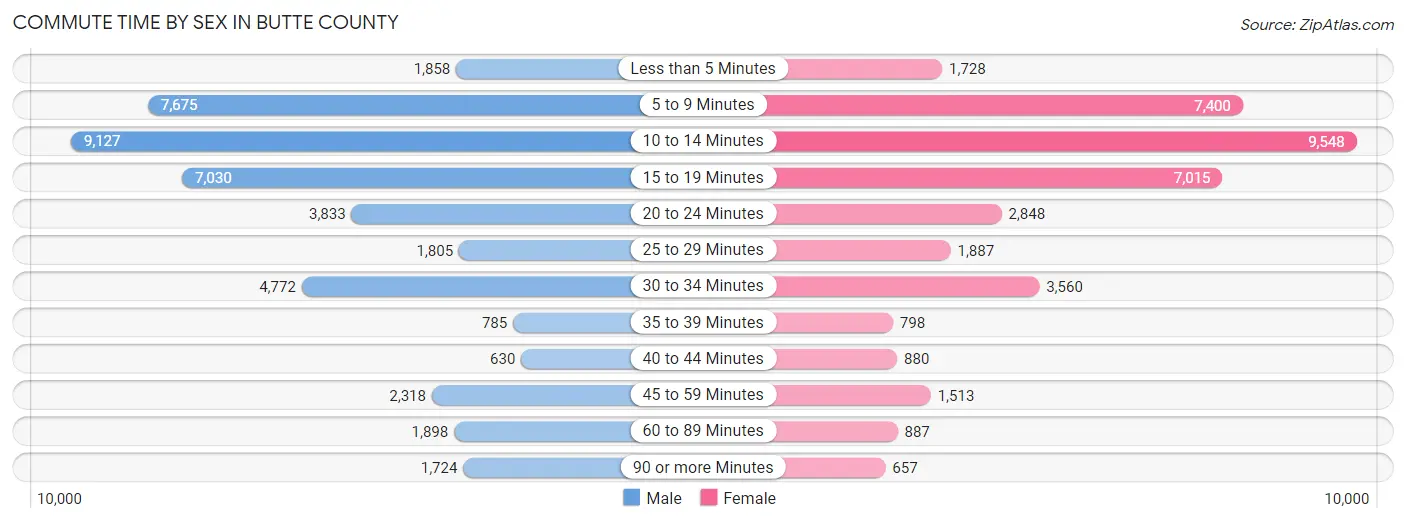
| Commute Time | Male | Female |
| Less than 5 Minutes | 1,858 (4.3%) | 1,728 (4.5%) |
| 5 to 9 Minutes | 7,675 (17.7%) | 7,400 (19.1%) |
| 10 to 14 Minutes | 9,127 (21.0%) | 9,548 (24.7%) |
| 15 to 19 Minutes | 7,030 (16.2%) | 7,015 (18.1%) |
| 20 to 24 Minutes | 3,833 (8.8%) | 2,848 (7.4%) |
| 25 to 29 Minutes | 1,805 (4.2%) | 1,887 (4.9%) |
| 30 to 34 Minutes | 4,772 (11.0%) | 3,560 (9.2%) |
| 35 to 39 Minutes | 785 (1.8%) | 798 (2.1%) |
| 40 to 44 Minutes | 630 (1.5%) | 880 (2.3%) |
| 45 to 59 Minutes | 2,318 (5.3%) | 1,513 (3.9%) |
| 60 to 89 Minutes | 1,898 (4.4%) | 887 (2.3%) |
| 90 or more Minutes | 1,724 (4.0%) | 657 (1.7%) |
Time of Departure to Work by Sex in Butte County
The most frequent times of departure to work in Butte County are 7:00 AM to 7:29 AM (5,135, 11.8%) for males and 7:30 AM to 7:59 AM (6,529, 16.9%) for females.
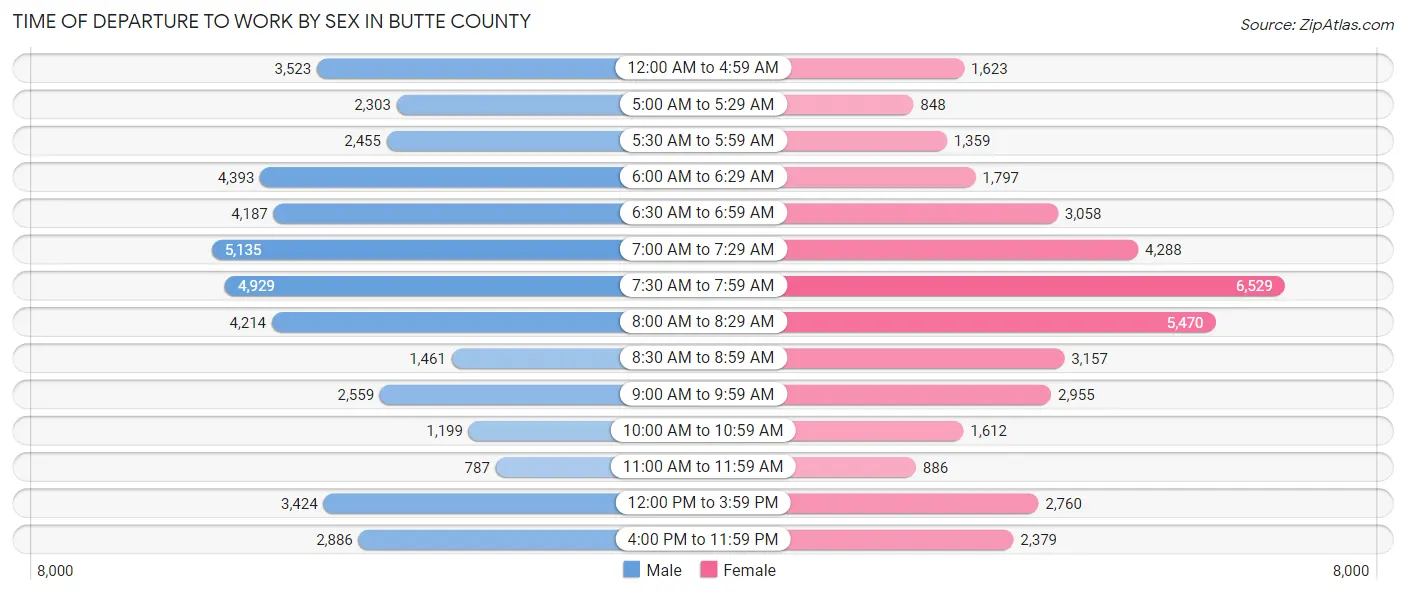
| Time of Departure | Male | Female |
| 12:00 AM to 4:59 AM | 3,523 (8.1%) | 1,623 (4.2%) |
| 5:00 AM to 5:29 AM | 2,303 (5.3%) | 848 (2.2%) |
| 5:30 AM to 5:59 AM | 2,455 (5.7%) | 1,359 (3.5%) |
| 6:00 AM to 6:29 AM | 4,393 (10.1%) | 1,797 (4.6%) |
| 6:30 AM to 6:59 AM | 4,187 (9.6%) | 3,058 (7.9%) |
| 7:00 AM to 7:29 AM | 5,135 (11.8%) | 4,288 (11.1%) |
| 7:30 AM to 7:59 AM | 4,929 (11.3%) | 6,529 (16.9%) |
| 8:00 AM to 8:29 AM | 4,214 (9.7%) | 5,470 (14.1%) |
| 8:30 AM to 8:59 AM | 1,461 (3.4%) | 3,157 (8.2%) |
| 9:00 AM to 9:59 AM | 2,559 (5.9%) | 2,955 (7.6%) |
| 10:00 AM to 10:59 AM | 1,199 (2.8%) | 1,612 (4.2%) |
| 11:00 AM to 11:59 AM | 787 (1.8%) | 886 (2.3%) |
| 12:00 PM to 3:59 PM | 3,424 (7.9%) | 2,760 (7.1%) |
| 4:00 PM to 11:59 PM | 2,886 (6.6%) | 2,379 (6.1%) |
| Total | 43,455 (100.0%) | 38,721 (100.0%) |
Housing Occupancy in Butte County
Occupancy by Ownership in Butte County
Of the total 83,319 dwellings in Butte County, owner-occupied units account for 48,424 (58.1%), while renter-occupied units make up 34,895 (41.9%).
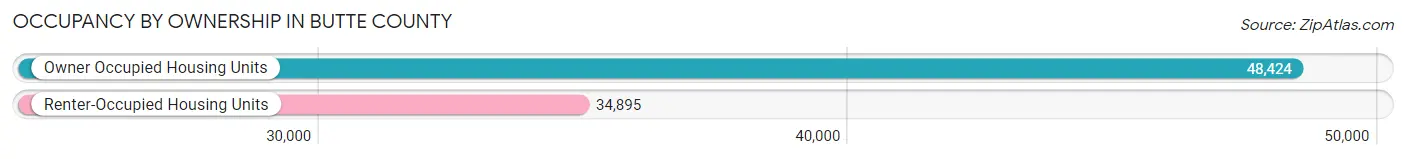
| Occupancy | # Housing Units | % Housing Units |
| Owner Occupied Housing Units | 48,424 | 58.1% |
| Renter-Occupied Housing Units | 34,895 | 41.9% |
| Total Occupied Housing Units | 83,319 | 100.0% |
Occupancy by Household Size in Butte County
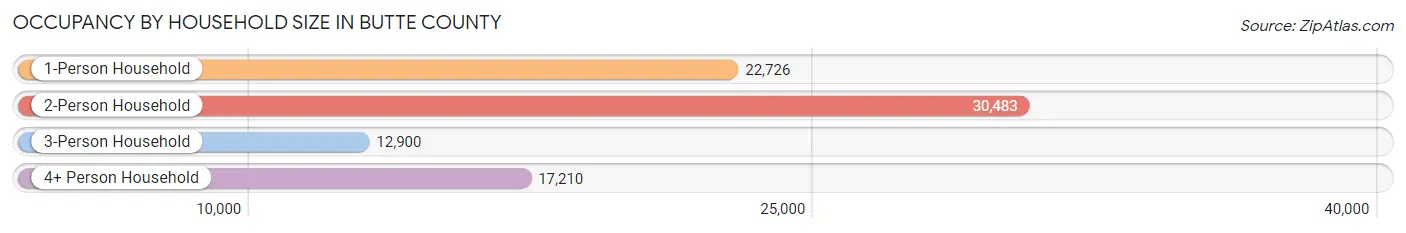
| Household Size | # Housing Units | % Housing Units |
| 1-Person Household | 22,726 | 27.3% |
| 2-Person Household | 30,483 | 36.6% |
| 3-Person Household | 12,900 | 15.5% |
| 4+ Person Household | 17,210 | 20.7% |
| Total Housing Units | 83,319 | 100.0% |
Occupancy by Ownership by Household Size in Butte County
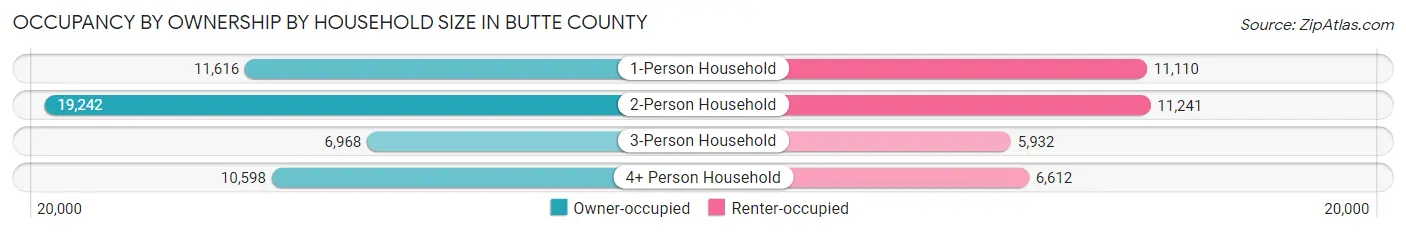
| Household Size | Owner-occupied | Renter-occupied |
| 1-Person Household | 11,616 (51.1%) | 11,110 (48.9%) |
| 2-Person Household | 19,242 (63.1%) | 11,241 (36.9%) |
| 3-Person Household | 6,968 (54.0%) | 5,932 (46.0%) |
| 4+ Person Household | 10,598 (61.6%) | 6,612 (38.4%) |
| Total Housing Units | 48,424 (58.1%) | 34,895 (41.9%) |
Occupancy by Educational Attainment in Butte County
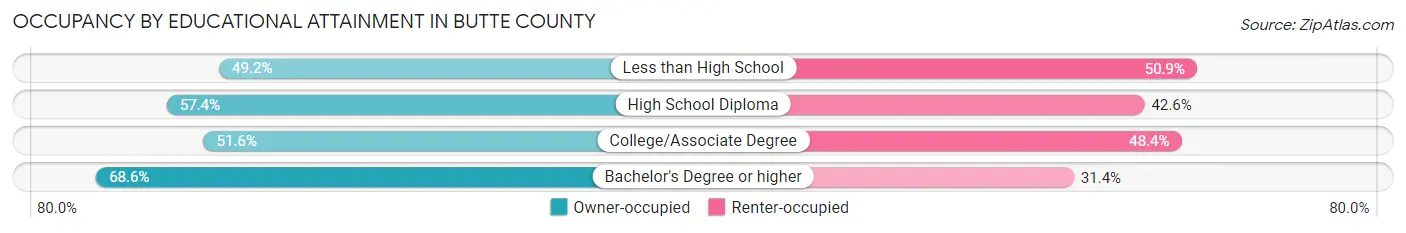
| Household Size | Owner-occupied | Renter-occupied |
| Less than High School | 2,872 (49.1%) | 2,971 (50.8%) |
| High School Diploma | 9,073 (57.4%) | 6,723 (42.6%) |
| College/Associate Degree | 17,756 (51.6%) | 16,645 (48.4%) |
| Bachelor's Degree or higher | 18,723 (68.6%) | 8,556 (31.4%) |
Occupancy by Age of Householder in Butte County
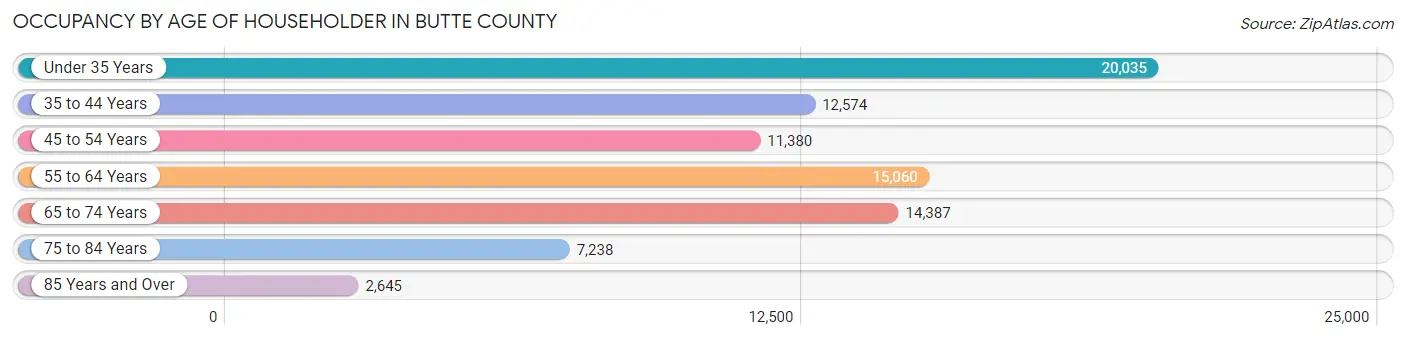
| Age Bracket | # Households | % Households |
| Under 35 Years | 20,035 | 24.0% |
| 35 to 44 Years | 12,574 | 15.1% |
| 45 to 54 Years | 11,380 | 13.7% |
| 55 to 64 Years | 15,060 | 18.1% |
| 65 to 74 Years | 14,387 | 17.3% |
| 75 to 84 Years | 7,238 | 8.7% |
| 85 Years and Over | 2,645 | 3.2% |
| Total | 83,319 | 100.0% |
Housing Finances in Butte County
Median Income by Occupancy in Butte County
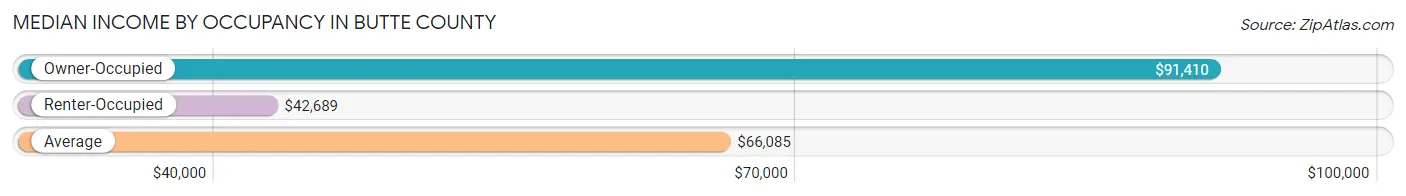
| Occupancy Type | # Households | Median Income |
| Owner-Occupied | 48,424 (58.1%) | $91,410 |
| Renter-Occupied | 34,895 (41.9%) | $42,689 |
| Average | 83,319 (100.0%) | $66,085 |
Occupancy by Householder Income Bracket in Butte County
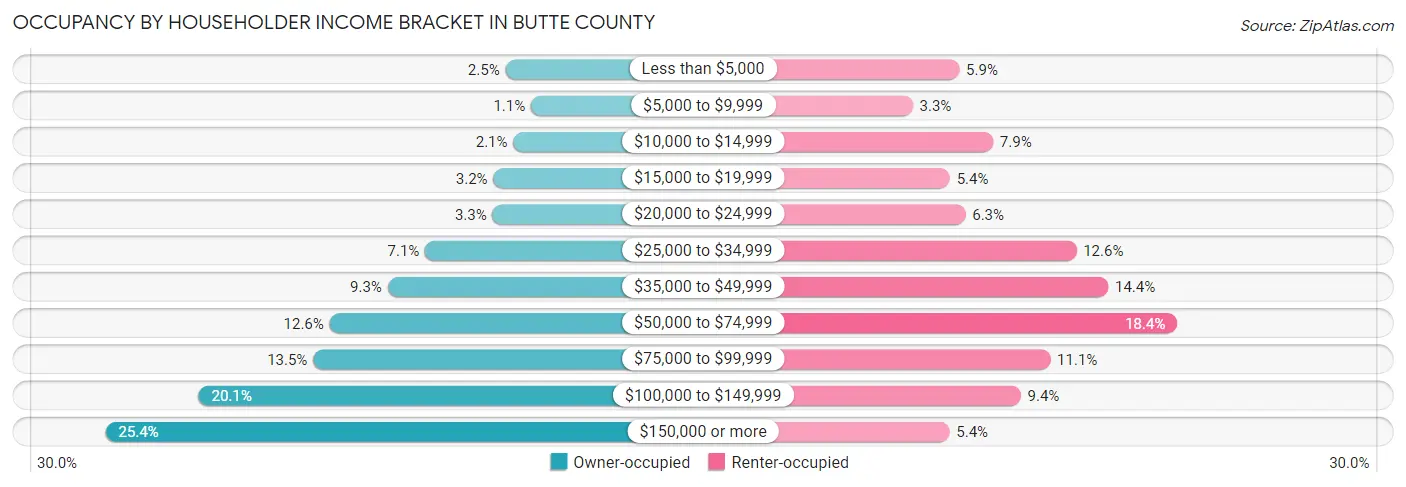
| Income Bracket | Owner-occupied | Renter-occupied |
| Less than $5,000 | 1,221 (2.5%) | 2,065 (5.9%) |
| $5,000 to $9,999 | 513 (1.1%) | 1,137 (3.3%) |
| $10,000 to $14,999 | 1,002 (2.1%) | 2,739 (7.9%) |
| $15,000 to $19,999 | 1,553 (3.2%) | 1,878 (5.4%) |
| $20,000 to $24,999 | 1,581 (3.3%) | 2,187 (6.3%) |
| $25,000 to $34,999 | 3,441 (7.1%) | 4,399 (12.6%) |
| $35,000 to $49,999 | 4,477 (9.2%) | 5,034 (14.4%) |
| $50,000 to $74,999 | 6,087 (12.6%) | 6,413 (18.4%) |
| $75,000 to $99,999 | 6,544 (13.5%) | 3,882 (11.1%) |
| $100,000 to $149,999 | 9,716 (20.1%) | 3,292 (9.4%) |
| $150,000 or more | 12,289 (25.4%) | 1,869 (5.4%) |
| Total | 48,424 (100.0%) | 34,895 (100.0%) |
Monthly Housing Cost Tiers in Butte County
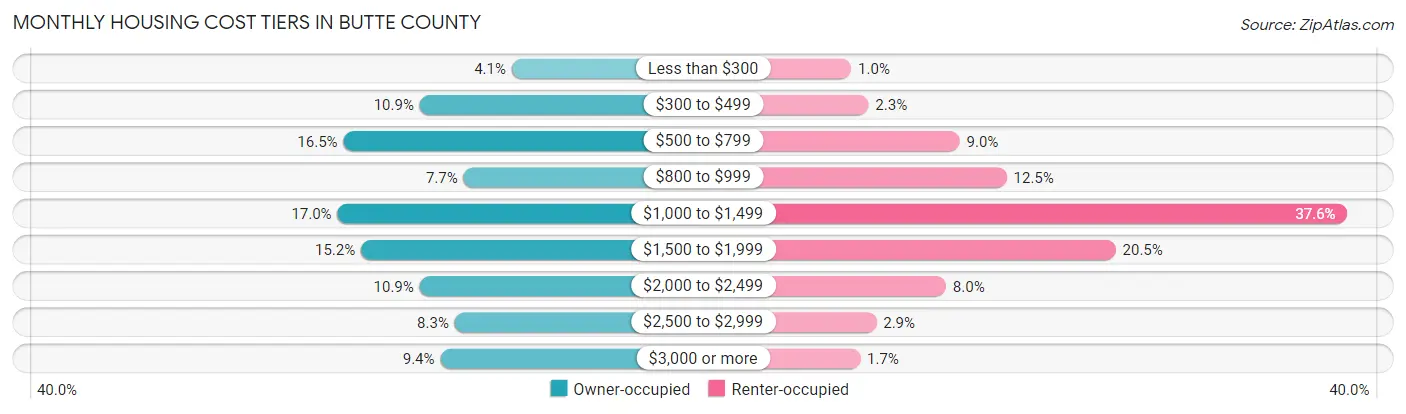
| Monthly Cost | Owner-occupied | Renter-occupied |
| Less than $300 | 1,993 (4.1%) | 351 (1.0%) |
| $300 to $499 | 5,278 (10.9%) | 797 (2.3%) |
| $500 to $799 | 7,998 (16.5%) | 3,139 (9.0%) |
| $800 to $999 | 3,713 (7.7%) | 4,347 (12.5%) |
| $1,000 to $1,499 | 8,211 (17.0%) | 13,108 (37.6%) |
| $1,500 to $1,999 | 7,372 (15.2%) | 7,150 (20.5%) |
| $2,000 to $2,499 | 5,285 (10.9%) | 2,787 (8.0%) |
| $2,500 to $2,999 | 4,030 (8.3%) | 998 (2.9%) |
| $3,000 or more | 4,544 (9.4%) | 584 (1.7%) |
| Total | 48,424 (100.0%) | 34,895 (100.0%) |
Physical Housing Characteristics in Butte County
Housing Structures in Butte County
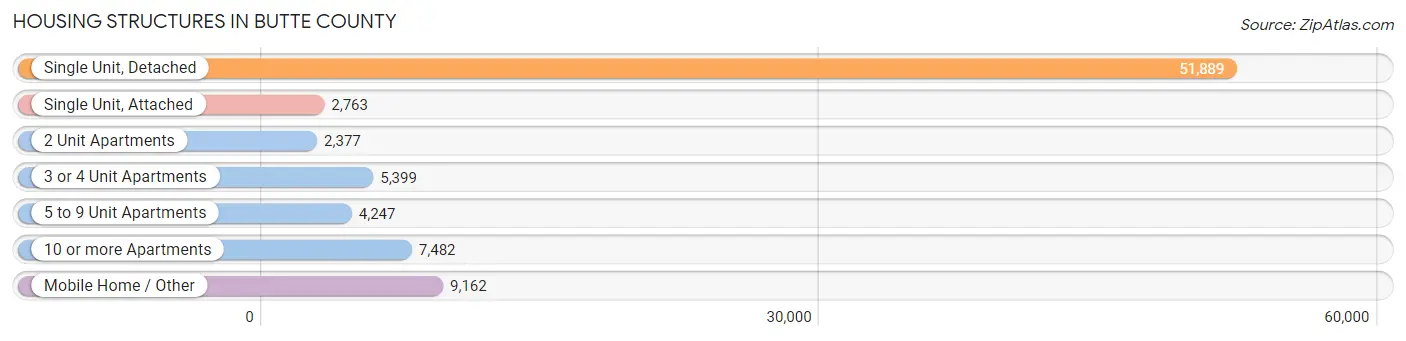
| Structure Type | # Housing Units | % Housing Units |
| Single Unit, Detached | 51,889 | 62.3% |
| Single Unit, Attached | 2,763 | 3.3% |
| 2 Unit Apartments | 2,377 | 2.9% |
| 3 or 4 Unit Apartments | 5,399 | 6.5% |
| 5 to 9 Unit Apartments | 4,247 | 5.1% |
| 10 or more Apartments | 7,482 | 9.0% |
| Mobile Home / Other | 9,162 | 11.0% |
| Total | 83,319 | 100.0% |
Housing Structures by Occupancy in Butte County
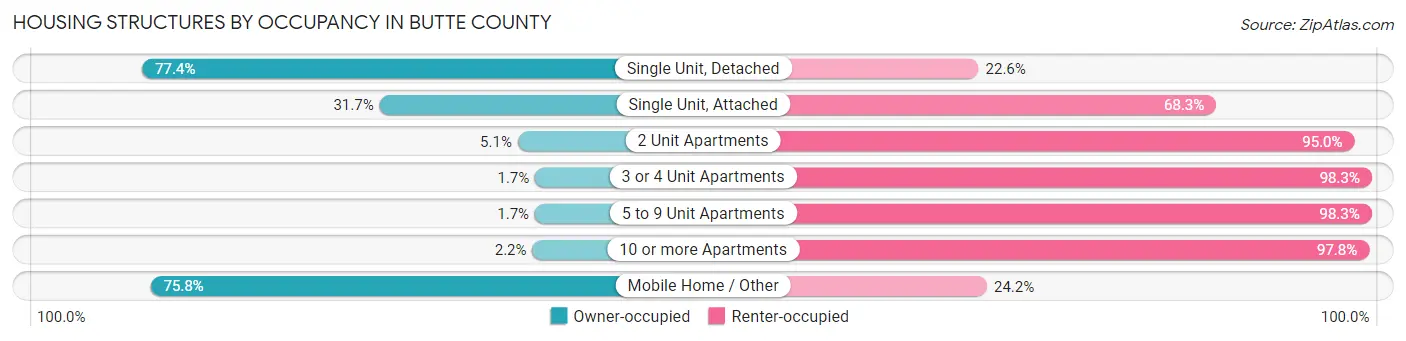
| Structure Type | Owner-occupied | Renter-occupied |
| Single Unit, Detached | 40,155 (77.4%) | 11,734 (22.6%) |
| Single Unit, Attached | 875 (31.7%) | 1,888 (68.3%) |
| 2 Unit Apartments | 120 (5.1%) | 2,257 (95.0%) |
| 3 or 4 Unit Apartments | 92 (1.7%) | 5,307 (98.3%) |
| 5 to 9 Unit Apartments | 74 (1.7%) | 4,173 (98.3%) |
| 10 or more Apartments | 167 (2.2%) | 7,315 (97.8%) |
| Mobile Home / Other | 6,941 (75.8%) | 2,221 (24.2%) |
| Total | 48,424 (58.1%) | 34,895 (41.9%) |
Housing Structures by Number of Rooms in Butte County
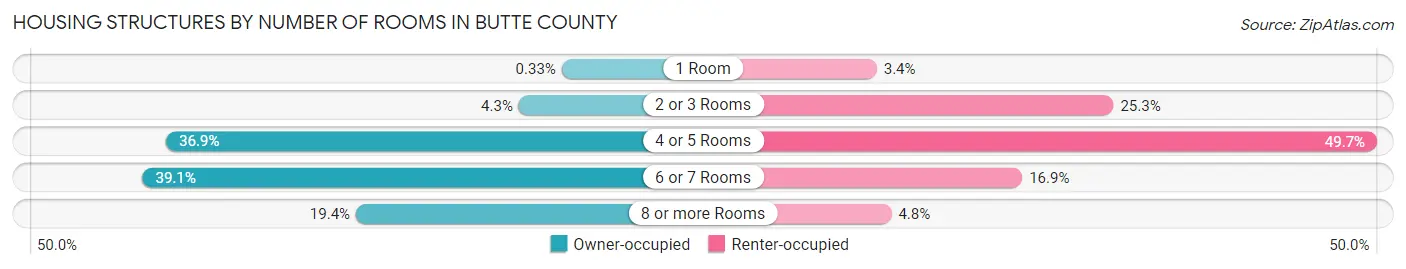
| Number of Rooms | Owner-occupied | Renter-occupied |
| 1 Room | 159 (0.3%) | 1,189 (3.4%) |
| 2 or 3 Rooms | 2,084 (4.3%) | 8,830 (25.3%) |
| 4 or 5 Rooms | 17,875 (36.9%) | 17,328 (49.7%) |
| 6 or 7 Rooms | 18,931 (39.1%) | 5,884 (16.9%) |
| 8 or more Rooms | 9,375 (19.4%) | 1,664 (4.8%) |
| Total | 48,424 (100.0%) | 34,895 (100.0%) |
Housing Structure by Heating Type in Butte County
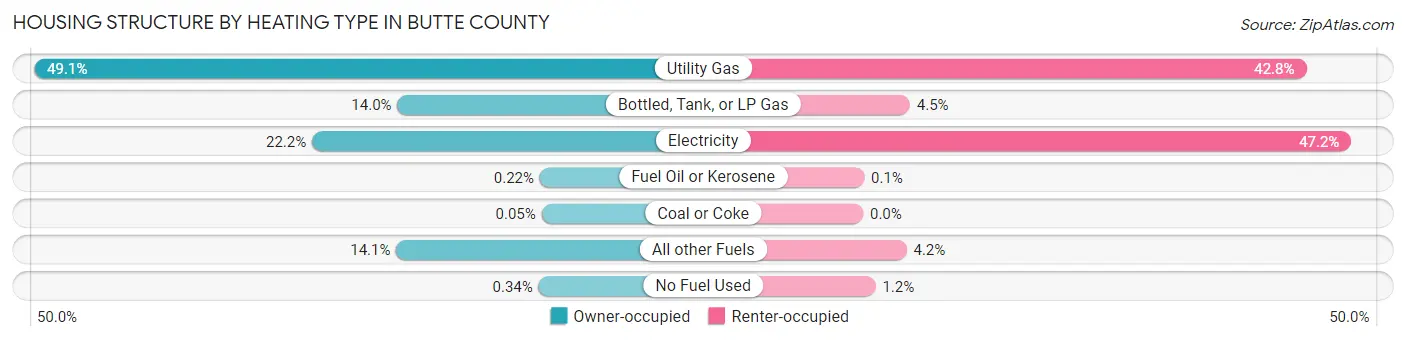
| Heating Type | Owner-occupied | Renter-occupied |
| Utility Gas | 23,769 (49.1%) | 14,943 (42.8%) |
| Bottled, Tank, or LP Gas | 6,770 (14.0%) | 1,576 (4.5%) |
| Electricity | 10,765 (22.2%) | 16,457 (47.2%) |
| Fuel Oil or Kerosene | 108 (0.2%) | 35 (0.1%) |
| Coal or Coke | 25 (0.1%) | 0 (0.0%) |
| All other Fuels | 6,821 (14.1%) | 1,466 (4.2%) |
| No Fuel Used | 166 (0.3%) | 418 (1.2%) |
| Total | 48,424 (100.0%) | 34,895 (100.0%) |
Household Vehicle Usage in Butte County
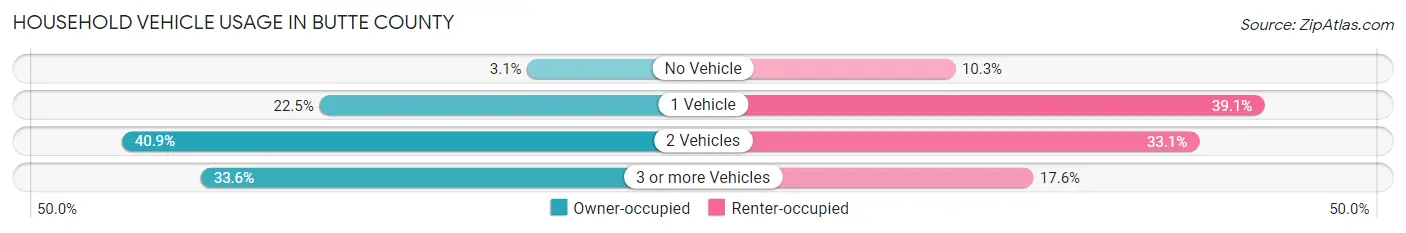
| Vehicles per Household | Owner-occupied | Renter-occupied |
| No Vehicle | 1,480 (3.1%) | 3,583 (10.3%) |
| 1 Vehicle | 10,882 (22.5%) | 13,653 (39.1%) |
| 2 Vehicles | 19,814 (40.9%) | 11,536 (33.1%) |
| 3 or more Vehicles | 16,248 (33.6%) | 6,123 (17.5%) |
| Total | 48,424 (100.0%) | 34,895 (100.0%) |
Real Estate & Mortgages in Butte County
Real Estate and Mortgage Overview in Butte County
| Characteristic | Without Mortgage | With Mortgage |
| Housing Units | 19,527 | 28,897 |
| Median Property Value | $316,900 | $396,100 |
| Median Household Income | $62,706 | $9,124 |
| Monthly Housing Costs | $598 | $4,519 |
| Real Estate Taxes | $2,010 | $560 |
Property Value by Mortgage Status in Butte County
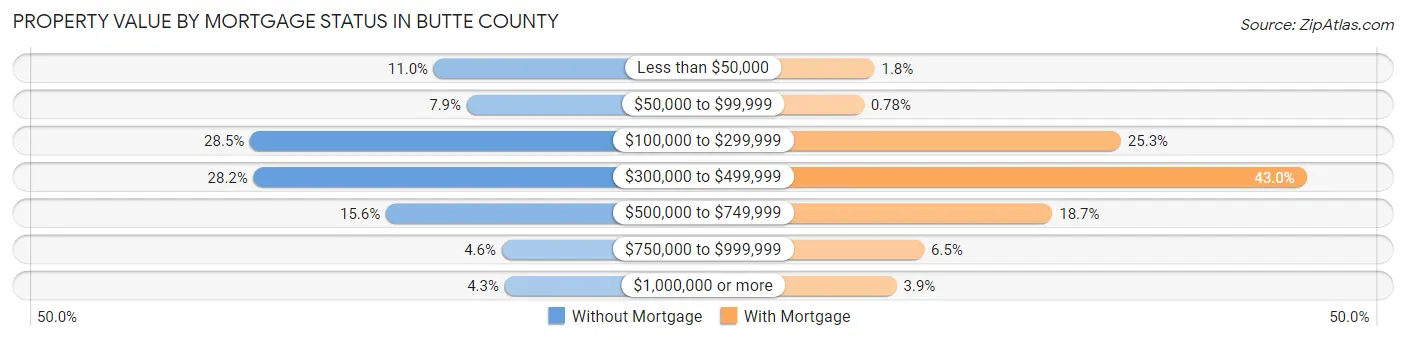
| Property Value | Without Mortgage | With Mortgage |
| Less than $50,000 | 2,151 (11.0%) | 522 (1.8%) |
| $50,000 to $99,999 | 1,539 (7.9%) | 225 (0.8%) |
| $100,000 to $299,999 | 5,569 (28.5%) | 7,301 (25.3%) |
| $300,000 to $499,999 | 5,504 (28.2%) | 12,415 (43.0%) |
| $500,000 to $749,999 | 3,043 (15.6%) | 5,415 (18.7%) |
| $750,000 to $999,999 | 888 (4.5%) | 1,888 (6.5%) |
| $1,000,000 or more | 833 (4.3%) | 1,131 (3.9%) |
| Total | 19,527 (100.0%) | 28,897 (100.0%) |
Household Income by Mortgage Status in Butte County
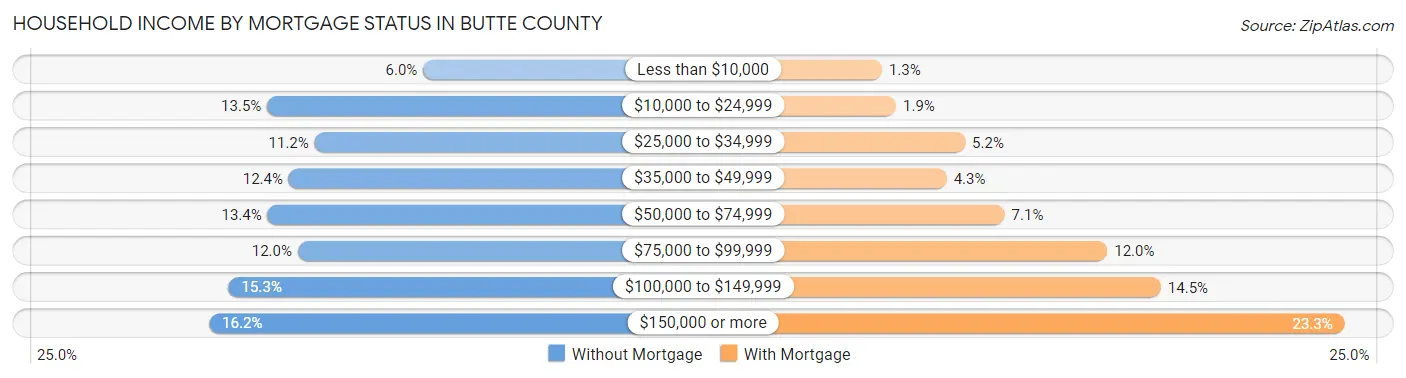
| Household Income | Without Mortgage | With Mortgage |
| Less than $10,000 | 1,176 (6.0%) | 364 (1.3%) |
| $10,000 to $24,999 | 2,627 (13.5%) | 558 (1.9%) |
| $25,000 to $34,999 | 2,186 (11.2%) | 1,509 (5.2%) |
| $35,000 to $49,999 | 2,425 (12.4%) | 1,255 (4.3%) |
| $50,000 to $74,999 | 2,622 (13.4%) | 2,052 (7.1%) |
| $75,000 to $99,999 | 2,341 (12.0%) | 3,465 (12.0%) |
| $100,000 to $149,999 | 2,985 (15.3%) | 4,203 (14.5%) |
| $150,000 or more | 3,165 (16.2%) | 6,731 (23.3%) |
| Total | 19,527 (100.0%) | 28,897 (100.0%) |
Property Value to Household Income Ratio in Butte County
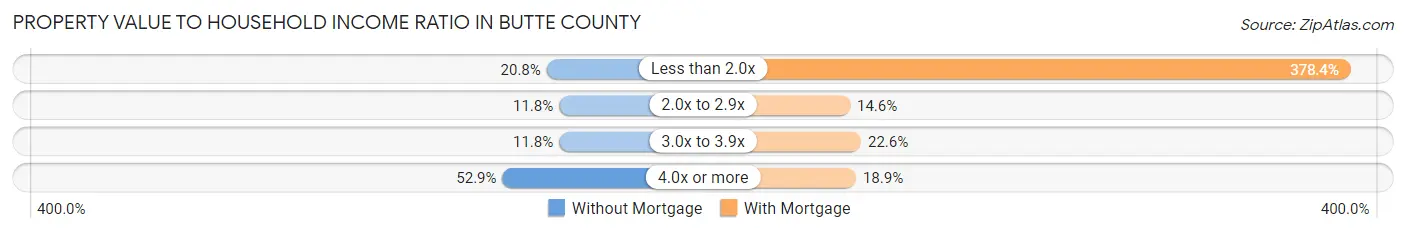
| Value-to-Income Ratio | Without Mortgage | With Mortgage |
| Less than 2.0x | 4,059 (20.8%) | 109,342 (378.4%) |
| 2.0x to 2.9x | 2,296 (11.8%) | 4,216 (14.6%) |
| 3.0x to 3.9x | 2,297 (11.8%) | 6,532 (22.6%) |
| 4.0x or more | 10,336 (52.9%) | 5,473 (18.9%) |
| Total | 19,527 (100.0%) | 28,897 (100.0%) |
Real Estate Taxes by Mortgage Status in Butte County
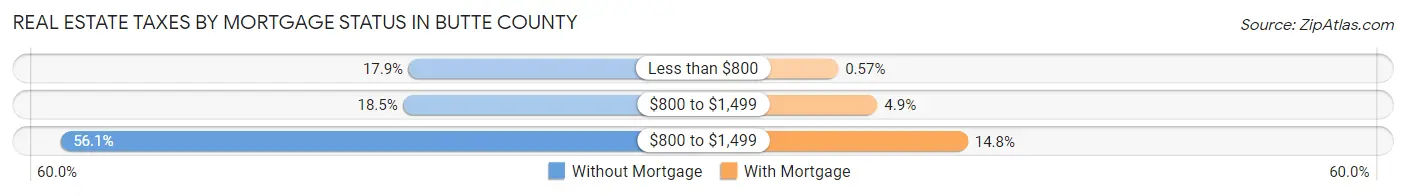
| Property Taxes | Without Mortgage | With Mortgage |
| Less than $800 | 3,491 (17.9%) | 165 (0.6%) |
| $800 to $1,499 | 3,607 (18.5%) | 1,404 (4.9%) |
| $800 to $1,499 | 10,953 (56.1%) | 4,269 (14.8%) |
| Total | 19,527 (100.0%) | 28,897 (100.0%) |
Health & Disability in Butte County
Health Insurance Coverage by Age in Butte County
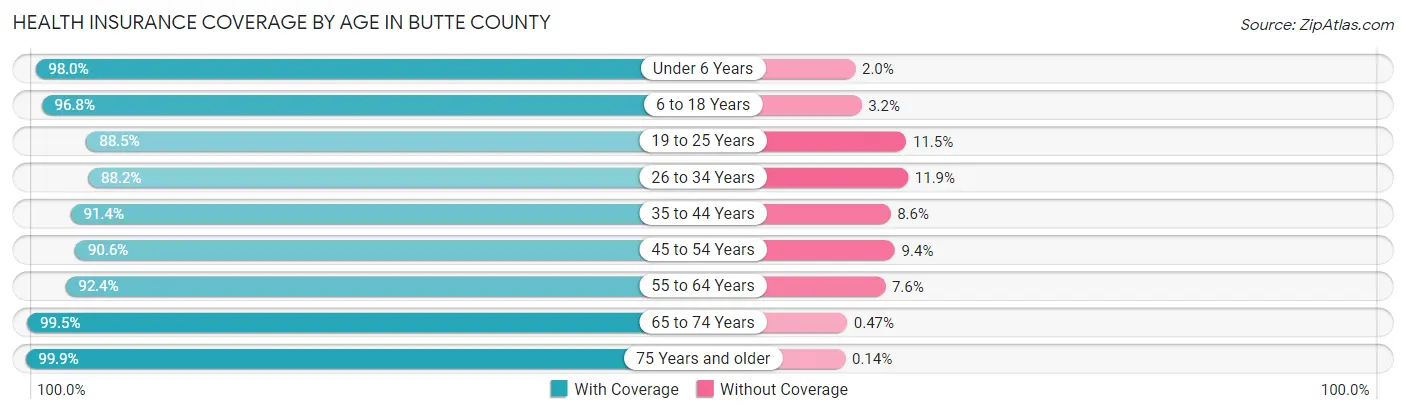
| Age Bracket | With Coverage | Without Coverage |
| Under 6 Years | 13,189 (98.0%) | 269 (2.0%) |
| 6 to 18 Years | 32,140 (96.8%) | 1,048 (3.2%) |
| 19 to 25 Years | 27,108 (88.5%) | 3,528 (11.5%) |
| 26 to 34 Years | 21,683 (88.1%) | 2,914 (11.8%) |
| 35 to 44 Years | 22,340 (91.4%) | 2,092 (8.6%) |
| 45 to 54 Years | 19,789 (90.6%) | 2,051 (9.4%) |
| 55 to 64 Years | 23,556 (92.4%) | 1,936 (7.6%) |
| 65 to 74 Years | 22,763 (99.5%) | 107 (0.5%) |
| 75 Years and older | 15,053 (99.9%) | 21 (0.1%) |
| Total | 197,621 (93.4%) | 13,966 (6.6%) |
Health Insurance Coverage by Citizenship Status in Butte County
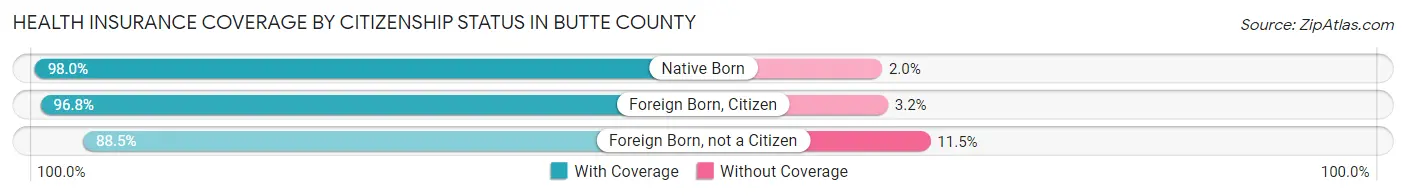
| Citizenship Status | With Coverage | Without Coverage |
| Native Born | 13,189 (98.0%) | 269 (2.0%) |
| Foreign Born, Citizen | 32,140 (96.8%) | 1,048 (3.2%) |
| Foreign Born, not a Citizen | 27,108 (88.5%) | 3,528 (11.5%) |
Health Insurance Coverage by Household Income in Butte County
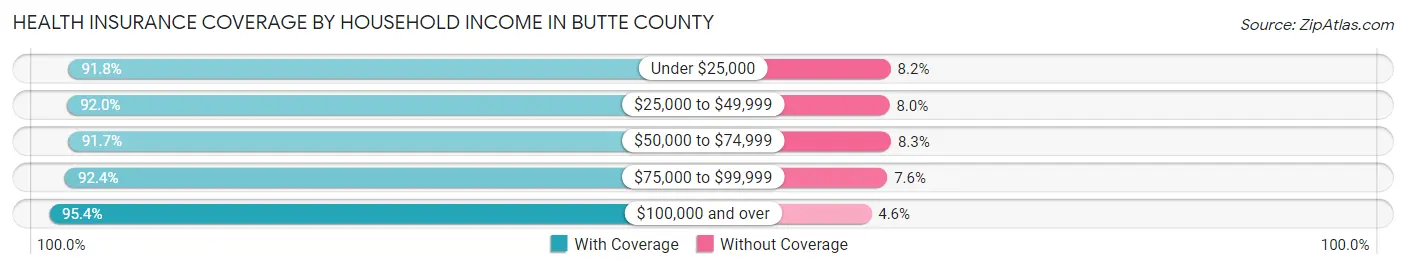
| Household Income | With Coverage | Without Coverage |
| Under $25,000 | 25,083 (91.8%) | 2,247 (8.2%) |
| $25,000 to $49,999 | 34,466 (92.0%) | 2,991 (8.0%) |
| $50,000 to $74,999 | 28,323 (91.7%) | 2,554 (8.3%) |
| $75,000 to $99,999 | 25,999 (92.4%) | 2,132 (7.6%) |
| $100,000 and over | 79,677 (95.4%) | 3,834 (4.6%) |
Public vs Private Health Insurance Coverage by Age in Butte County
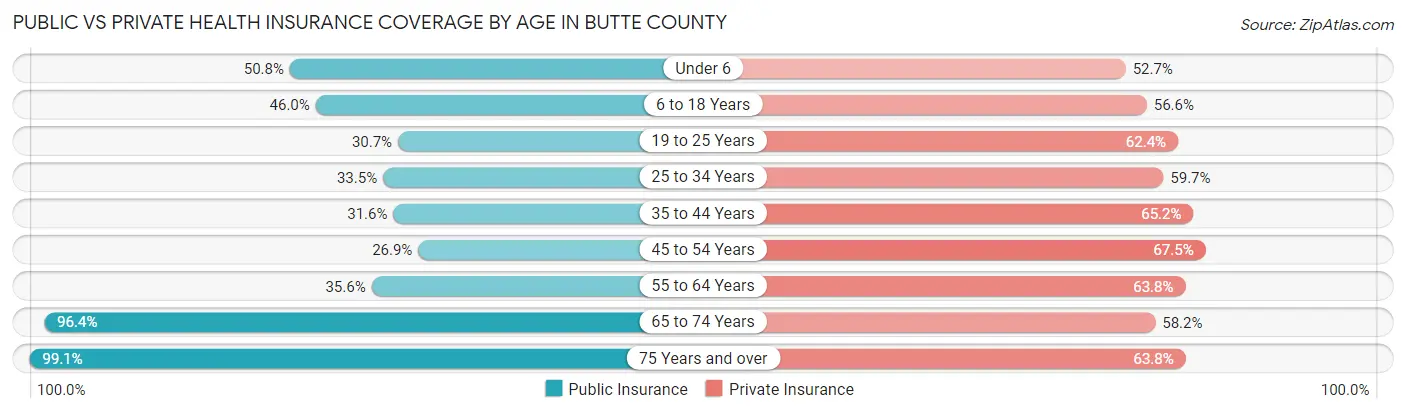
| Age Bracket | Public Insurance | Private Insurance |
| Under 6 | 6,834 (50.8%) | 7,093 (52.7%) |
| 6 to 18 Years | 15,264 (46.0%) | 18,789 (56.6%) |
| 19 to 25 Years | 9,406 (30.7%) | 19,110 (62.4%) |
| 25 to 34 Years | 8,236 (33.5%) | 14,682 (59.7%) |
| 35 to 44 Years | 7,714 (31.6%) | 15,937 (65.2%) |
| 45 to 54 Years | 5,884 (26.9%) | 14,743 (67.5%) |
| 55 to 64 Years | 9,077 (35.6%) | 16,252 (63.7%) |
| 65 to 74 Years | 22,045 (96.4%) | 13,308 (58.2%) |
| 75 Years and over | 14,940 (99.1%) | 9,617 (63.8%) |
| Total | 99,400 (47.0%) | 129,531 (61.2%) |
Disability Status by Sex by Age in Butte County
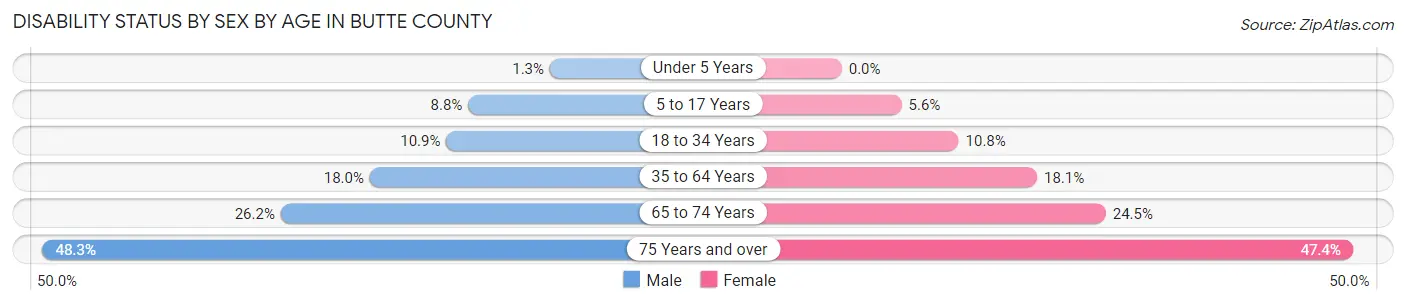
| Age Bracket | Male | Female |
| Under 5 Years | 72 (1.3%) | 0 (0.0%) |
| 5 to 17 Years | 1,439 (8.8%) | 855 (5.6%) |
| 18 to 34 Years | 3,257 (10.9%) | 3,136 (10.8%) |
| 35 to 64 Years | 6,433 (18.0%) | 6,514 (18.1%) |
| 65 to 74 Years | 2,874 (26.2%) | 2,918 (24.5%) |
| 75 Years and over | 3,103 (48.3%) | 4,104 (47.4%) |
Disability Class by Sex by Age in Butte County
Disability Class: Hearing Difficulty
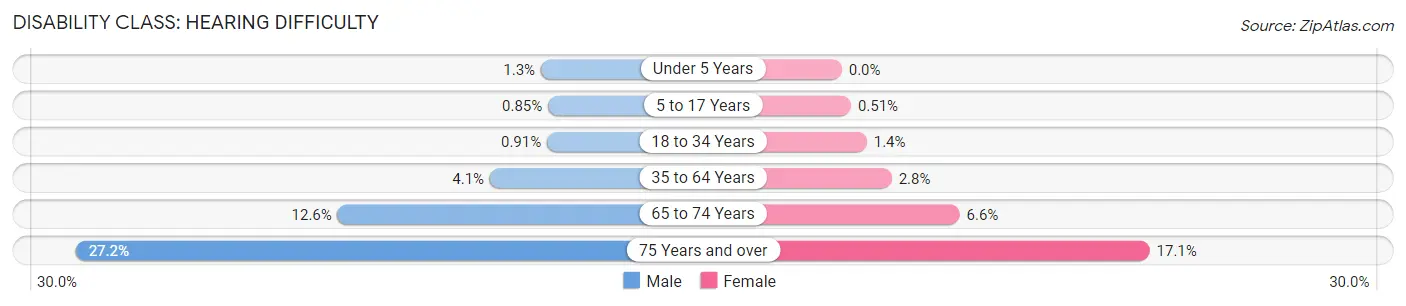
| Age Bracket | Male | Female |
| Under 5 Years | 72 (1.3%) | 0 (0.0%) |
| 5 to 17 Years | 139 (0.9%) | 78 (0.5%) |
| 18 to 34 Years | 273 (0.9%) | 402 (1.4%) |
| 35 to 64 Years | 1,464 (4.1%) | 1,000 (2.8%) |
| 65 to 74 Years | 1,377 (12.6%) | 782 (6.6%) |
| 75 Years and over | 1,743 (27.2%) | 1,483 (17.1%) |
Disability Class: Vision Difficulty
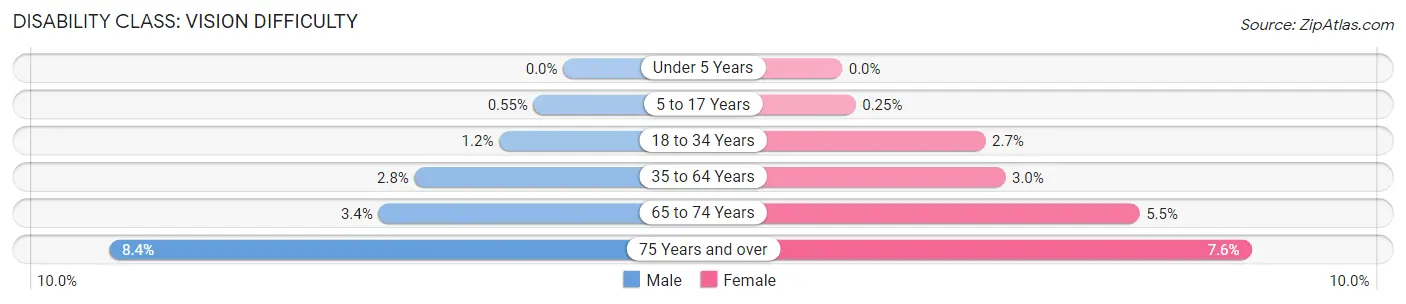
| Age Bracket | Male | Female |
| Under 5 Years | 0 (0.0%) | 0 (0.0%) |
| 5 to 17 Years | 89 (0.5%) | 38 (0.3%) |
| 18 to 34 Years | 356 (1.2%) | 769 (2.7%) |
| 35 to 64 Years | 990 (2.8%) | 1,089 (3.0%) |
| 65 to 74 Years | 376 (3.4%) | 658 (5.5%) |
| 75 Years and over | 541 (8.4%) | 658 (7.6%) |
Disability Class: Cognitive Difficulty
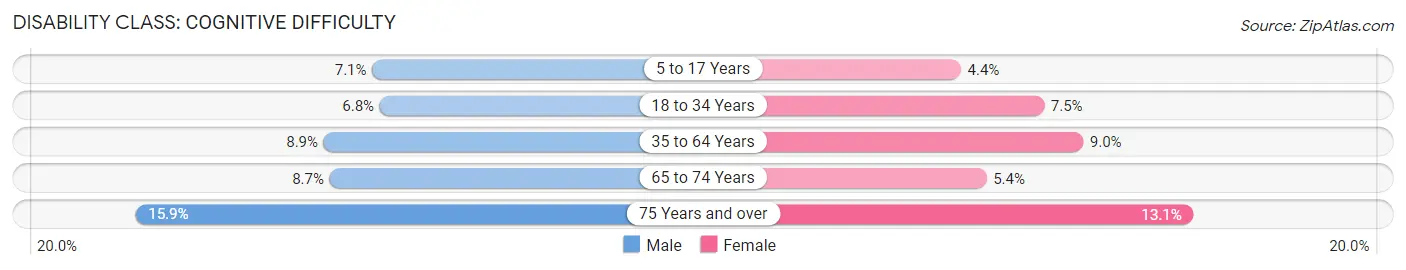
| Age Bracket | Male | Female |
| 5 to 17 Years | 1,156 (7.1%) | 680 (4.4%) |
| 18 to 34 Years | 2,044 (6.8%) | 2,170 (7.5%) |
| 35 to 64 Years | 3,186 (8.9%) | 3,217 (8.9%) |
| 65 to 74 Years | 950 (8.7%) | 638 (5.4%) |
| 75 Years and over | 1,020 (15.9%) | 1,130 (13.1%) |
Disability Class: Ambulatory Difficulty
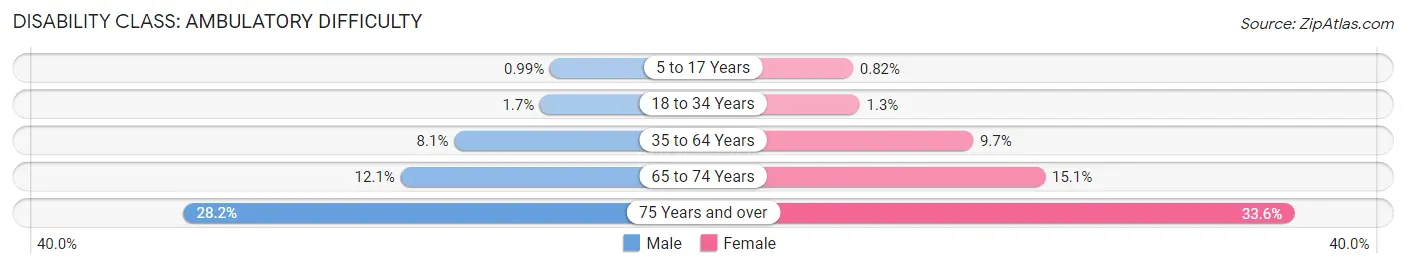
| Age Bracket | Male | Female |
| 5 to 17 Years | 161 (1.0%) | 127 (0.8%) |
| 18 to 34 Years | 518 (1.7%) | 382 (1.3%) |
| 35 to 64 Years | 2,900 (8.1%) | 3,501 (9.7%) |
| 65 to 74 Years | 1,324 (12.1%) | 1,797 (15.1%) |
| 75 Years and over | 1,810 (28.2%) | 2,905 (33.6%) |
Disability Class: Self-Care Difficulty
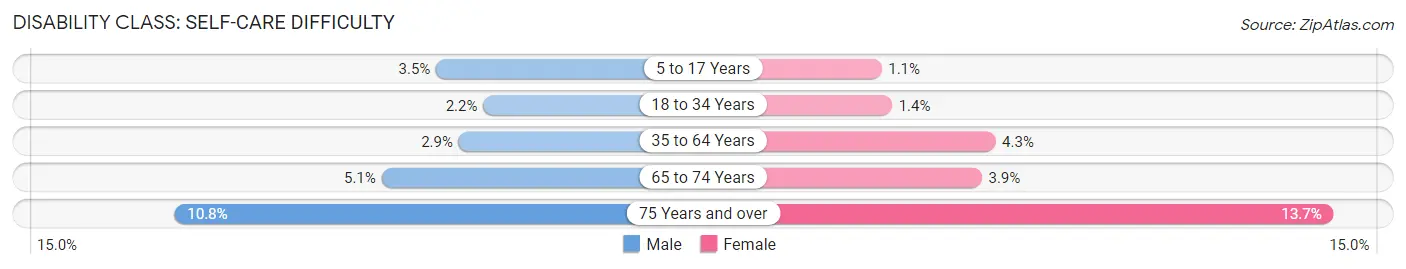
| Age Bracket | Male | Female |
| 5 to 17 Years | 577 (3.5%) | 170 (1.1%) |
| 18 to 34 Years | 669 (2.2%) | 402 (1.4%) |
| 35 to 64 Years | 1,043 (2.9%) | 1,535 (4.3%) |
| 65 to 74 Years | 555 (5.1%) | 463 (3.9%) |
| 75 Years and over | 695 (10.8%) | 1,185 (13.7%) |
Technology Access in Butte County
Computing Device Access in Butte County
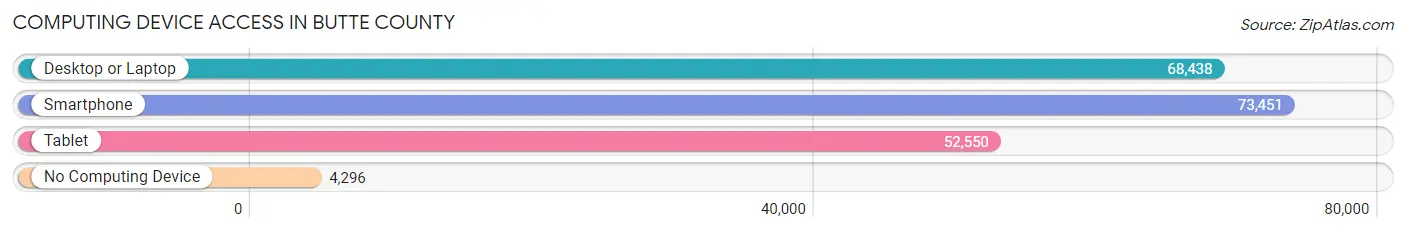
| Device Type | # Households | % Households |
| Desktop or Laptop | 68,438 | 82.1% |
| Smartphone | 73,451 | 88.2% |
| Tablet | 52,550 | 63.1% |
| No Computing Device | 4,296 | 5.2% |
| Total | 83,319 | 100.0% |
Internet Access in Butte County
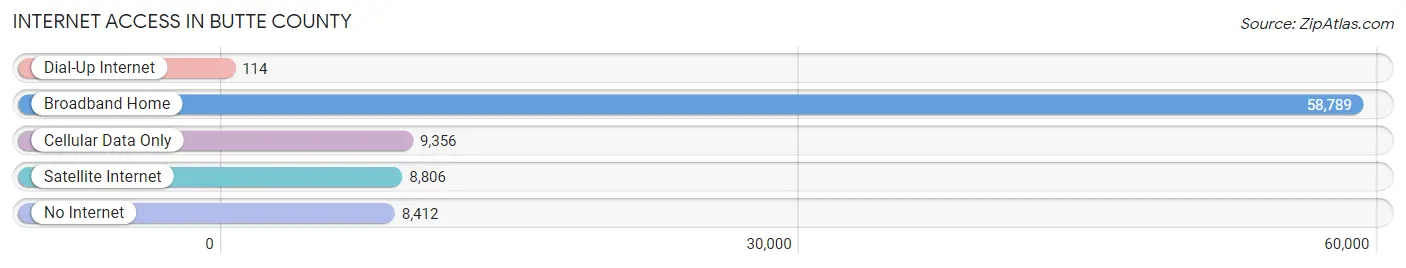
| Internet Type | # Households | % Households |
| Dial-Up Internet | 114 | 0.1% |
| Broadband Home | 58,789 | 70.6% |
| Cellular Data Only | 9,356 | 11.2% |
| Satellite Internet | 8,806 | 10.6% |
| No Internet | 8,412 | 10.1% |
| Total | 83,319 | 100.0% |
Butte County Summary
Butte County is located in the northern part of California, and is part of the Sacramento Valley. It is bordered by Yuba County to the north, Plumas County to the east, Sutter County to the south, and Colusa County to the west. The county seat is Oroville, and the largest city is Chico. Butte County covers an area of 1,677 square miles, and has a population of approximately 220,000 people.
History
Butte County was formed in 1850, and was named after the Sutter Buttes, a small mountain range located in the center of the county. The county was originally inhabited by the Maidu and Mechoopda Native American tribes. In the late 1800s, the county experienced a gold rush, and many miners and settlers moved to the area. The county was also home to several Chinese immigrants who worked in the gold mines.
In the early 1900s, the county experienced a population boom due to the construction of the Oroville Dam. The dam was built to provide irrigation and hydroelectric power to the area. The dam also created Lake Oroville, which is now a popular recreational area.
Geography
Butte County is located in the northern part of California, and is part of the Sacramento Valley. The county is bordered by Yuba County to the north, Plumas County to the east, Sutter County to the south, and Colusa County to the west. The county is divided into two distinct regions: the foothills and the valley. The foothills are located in the northern part of the county, and are characterized by rolling hills and oak woodlands. The valley is located in the southern part of the county, and is characterized by flat plains and agricultural land.
The county is home to several rivers, including the Feather River, the Sacramento River, and the Yuba River. The county is also home to several lakes, including Lake Oroville, Lake Almanor, and Lake Concow.
Economy
Butte County has a diverse economy, with a mix of agriculture, manufacturing, and services. The county is home to several large employers, including Sierra Nevada Brewing Company, Chico State University, and Enloe Medical Center.
Agriculture is an important part of the county’s economy, and the county is home to several large farms and ranches. The county is also home to several wineries, and is a popular destination for wine tasting.
Manufacturing is also an important part of the county’s economy, and the county is home to several large factories, including a paper mill and a steel mill.
Demographics
As of the 2010 census, Butte County had a population of 220,000 people. The population is fairly diverse, with a mix of races and ethnicities. The largest racial group is White (63.3%), followed by Hispanic or Latino (19.2%), Asian (7.2%), African American (4.2%), and Native American (2.2%).
The median household income in Butte County is $50,000, and the median home value is $250,000. The county has a high rate of homeownership, with 73.3% of households owning their own homes.
Butte County is home to several colleges and universities, including Chico State University and Butte College. The county is also home to several museums, including the Chico Museum of Natural History and the Chico Air Museum.
Common Questions
What is Per Capita Income in Butte County?
Per Capita income in Butte County is $36,374.
What is the Median Family Income in Butte County?
Median Family Income in Butte County is $85,990.
What is the Median Household income in Butte County?
Median Household Income in Butte County is $66,085.
What is Income or Wage Gap in Butte County?
Income or Wage Gap in Butte County is 21.8%.
Women in Butte County earn 78.2 cents for every dollar earned by a man.
What is Family Income Deficit in Butte County?
Family Income Deficit in Butte County is $10,188.
Families that are below poverty line in Butte County earn $10,188 less on average than the poverty threshold level.
What is Inequality or Gini Index in Butte County?
Inequality or Gini Index in Butte County is 0.48.
What is the Total Population of Butte County?
Total Population of Butte County is 213,605.
What is the Total Male Population of Butte County?
Total Male Population of Butte County is 106,376.
What is the Total Female Population of Butte County?
Total Female Population of Butte County is 107,229.
What is the Ratio of Males per 100 Females in Butte County?
There are 99.20 Males per 100 Females in Butte County.
What is the Ratio of Females per 100 Males in Butte County?
There are 100.80 Females per 100 Males in Butte County.
What is the Median Population Age in Butte County?
Median Population Age in Butte County is 36.5 Years.
What is the Average Family Size in Butte County
Average Family Size in Butte County is 3.0 People.
What is the Average Household Size in Butte County
Average Household Size in Butte County is 2.5 People.
How Large is the Labor Force in Butte County?
There are 102,896 People in the Labor Forcein in Butte County.
What is the Percentage of People in the Labor Force in Butte County?
58.6% of People are in the Labor Force in Butte County.
What is the Unemployment Rate in Butte County?
Unemployment Rate in Butte County is 7.1%.