Alpine County, CA Map & Demographics
Alpine County Map
Alpine County Overview
$55,425
PER CAPITA INCOME
$114,625
AVG FAMILY INCOME
$101,125
AVG HOUSEHOLD INCOME
18.8%
WAGE / INCOME GAP [ % ]
81.2¢/ $1
WAGE / INCOME GAP [ $ ]
0.57
INEQUALITY / GINI INDEX
1,515
TOTAL POPULATION
882
MALE POPULATION
633
FEMALE POPULATION
139.34
MALES / 100 FEMALES
71.77
FEMALES / 100 MALES
43.0
MEDIAN AGE
4.4
AVG FAMILY SIZE
3.3
AVG HOUSEHOLD SIZE
679
LABOR FORCE [ PEOPLE ]
55.8%
PERCENT IN LABOR FORCE
4.9%
UNEMPLOYMENT RATE
Alpine County Area Codes
Income in Alpine County
Income Overview in Alpine County
Per Capita Income in Alpine County is $55,425, while median incomes of families and households are $114,625 and $101,125 respectively.
| Characteristic | Number | Measure |
| Per Capita Income | 1,515 | $55,425 |
| Median Family Income | 279 | $114,625 |
| Mean Family Income | 279 | $194,577 |
| Median Household Income | 435 | $101,125 |
| Mean Household Income | 435 | $164,883 |
| Income Deficit | 279 | $0 |
| Wage / Income Gap (%) | 1,515 | 18.80% |
| Wage / Income Gap ($) | 1,515 | 81.20¢ per $1 |
| Gini / Inequality Index | 1,515 | 0.57 |
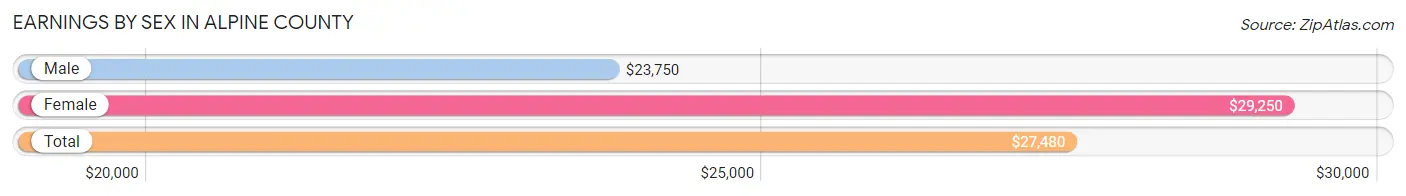
Earnings by Sex in Alpine County
Average Earnings in Alpine County are $27,480, $23,750 for men and $29,250 for women, a difference of 18.8%.
| Sex | Number | Average Earnings |
| Male | 445 (59.9%) | $23,750 |
| Female | 298 (40.1%) | $29,250 |
| Total | 743 (100.0%) | $27,480 |
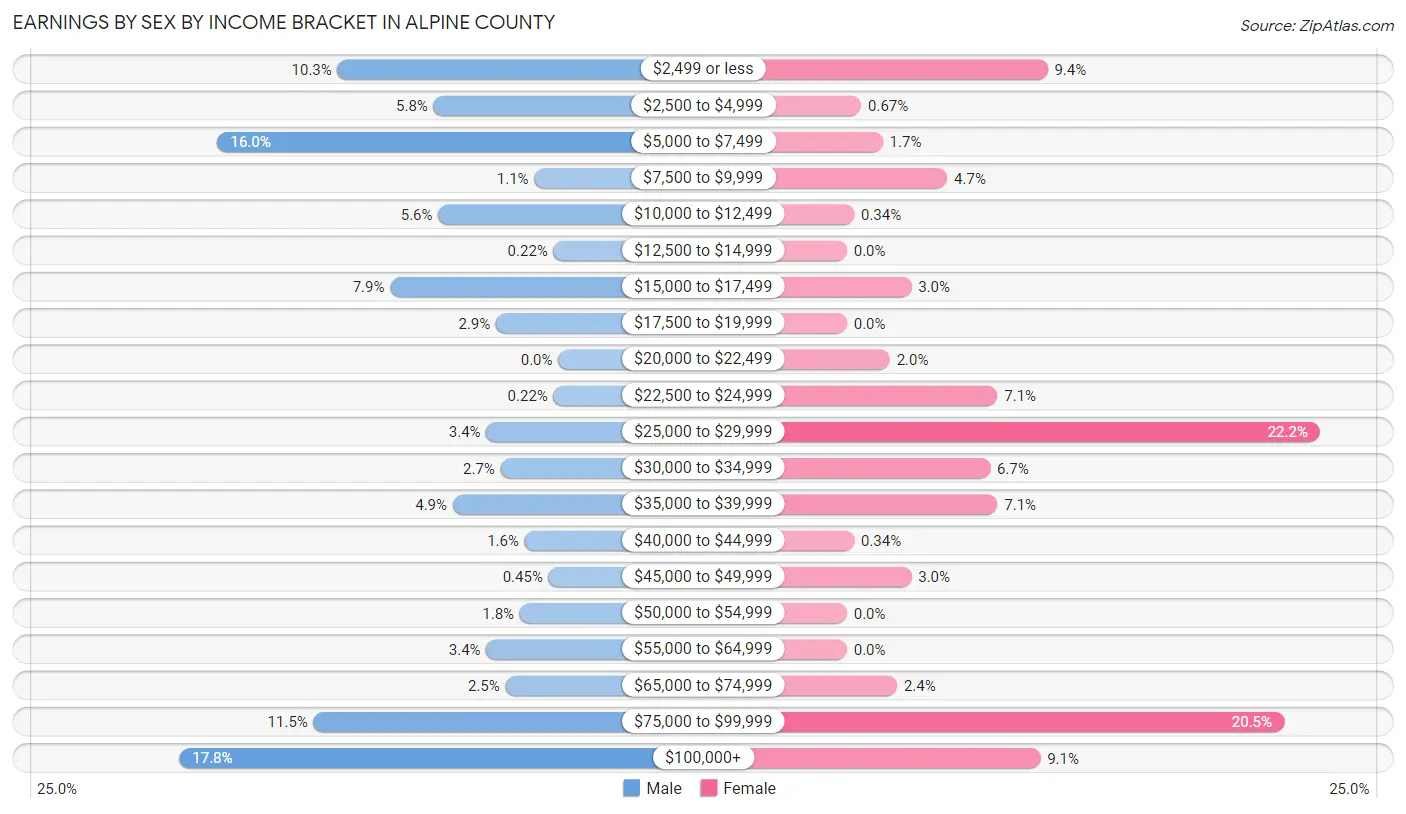
Earnings by Sex by Income Bracket in Alpine County
The most common earnings brackets in Alpine County are $100,000+ for men (79 | 17.7%) and $25,000 to $29,999 for women (66 | 22.2%).
| Income | Male | Female |
| $2,499 or less | 46 (10.3%) | 28 (9.4%) |
| $2,500 to $4,999 | 26 (5.8%) | 2 (0.7%) |
| $5,000 to $7,499 | 71 (16.0%) | 5 (1.7%) |
| $7,500 to $9,999 | 5 (1.1%) | 14 (4.7%) |
| $10,000 to $12,499 | 25 (5.6%) | 1 (0.3%) |
| $12,500 to $14,999 | 1 (0.2%) | 0 (0.0%) |
| $15,000 to $17,499 | 35 (7.9%) | 9 (3.0%) |
| $17,500 to $19,999 | 13 (2.9%) | 0 (0.0%) |
| $20,000 to $22,499 | 0 (0.0%) | 6 (2.0%) |
| $22,500 to $24,999 | 1 (0.2%) | 21 (7.0%) |
| $25,000 to $29,999 | 15 (3.4%) | 66 (22.2%) |
| $30,000 to $34,999 | 12 (2.7%) | 20 (6.7%) |
| $35,000 to $39,999 | 22 (4.9%) | 21 (7.0%) |
| $40,000 to $44,999 | 7 (1.6%) | 1 (0.3%) |
| $45,000 to $49,999 | 2 (0.4%) | 9 (3.0%) |
| $50,000 to $54,999 | 8 (1.8%) | 0 (0.0%) |
| $55,000 to $64,999 | 15 (3.4%) | 0 (0.0%) |
| $65,000 to $74,999 | 11 (2.5%) | 7 (2.4%) |
| $75,000 to $99,999 | 51 (11.5%) | 61 (20.5%) |
| $100,000+ | 79 (17.7%) | 27 (9.1%) |
| Total | 445 (100.0%) | 298 (100.0%) |
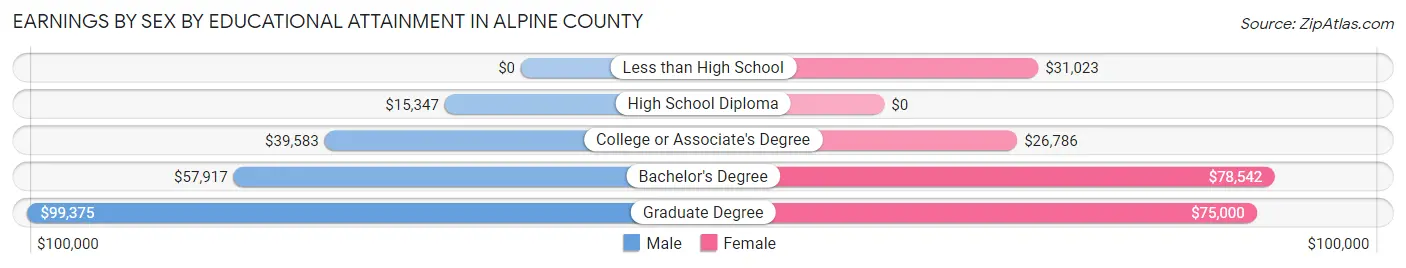
Earnings by Sex by Educational Attainment in Alpine County
Average earnings in Alpine County are $38,750 for men and $31,797 for women, a difference of 17.9%. Men with an educational attainment of graduate degree enjoy the highest average annual earnings of $99,375, while those with high school diploma education earn the least with $15,347. Women with an educational attainment of bachelor's degree earn the most with the average annual earnings of $78,542, while those with college or associate's degree education have the smallest earnings of $26,786.
| Educational Attainment | Male Income | Female Income |
| Less than High School | - | - |
| High School Diploma | $15,347 | $0 |
| College or Associate's Degree | $39,583 | $26,786 |
| Bachelor's Degree | $57,917 | $78,542 |
| Graduate Degree | $99,375 | $75,000 |
| Total | $38,750 | $31,797 |
Family Income in Alpine County
Family Income Brackets in Alpine County
According to the Alpine County family income data, there are 98 families falling into the $100,000 to $149,999 income range, which is the most common income bracket and makes up 35.1% of all families. Conversely, the $10,000 to $14,999 income bracket is the least frequent group with only 2 families (0.7%) belonging to this category.
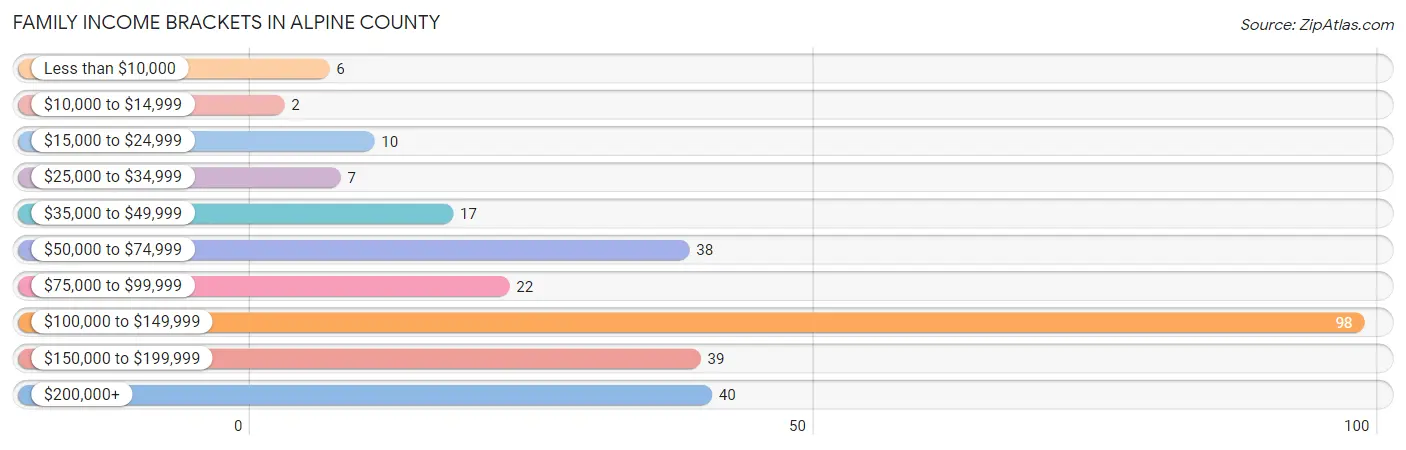
| Income Bracket | # Families | % Families |
| Less than $10,000 | 6 | 2.2% |
| $10,000 to $14,999 | 2 | 0.7% |
| $15,000 to $24,999 | 10 | 3.6% |
| $25,000 to $34,999 | 7 | 2.5% |
| $35,000 to $49,999 | 17 | 6.1% |
| $50,000 to $74,999 | 38 | 13.6% |
| $75,000 to $99,999 | 22 | 7.9% |
| $100,000 to $149,999 | 98 | 35.1% |
| $150,000 to $199,999 | 39 | 14.0% |
| $200,000+ | 40 | 14.3% |
Family Income by Famaliy Size in Alpine County
5-person families (8 | 2.9%) account for the highest median family income in Alpine County with $250,001 per family, while 2-person families (182 | 65.2%) have the highest median income of $56,750 per family member.
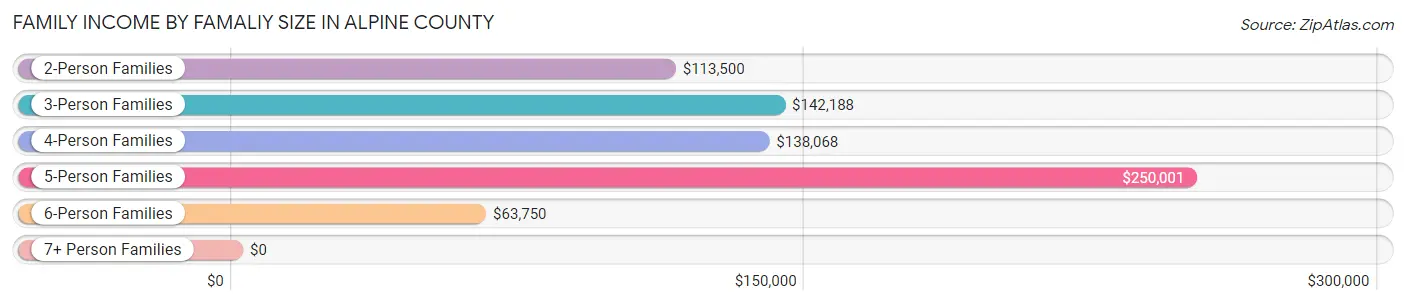
| Income Bracket | # Families | Median Income |
| 2-Person Families | 182 (65.2%) | $113,500 |
| 3-Person Families | 35 (12.5%) | $142,188 |
| 4-Person Families | 43 (15.4%) | $138,068 |
| 5-Person Families | 8 (2.9%) | $250,001 |
| 6-Person Families | 10 (3.6%) | $63,750 |
| 7+ Person Families | 1 (0.4%) | $0 |
| Total | 279 (100.0%) | $114,625 |
Family Income by Number of Earners in Alpine County
The median family income in Alpine County is $114,625, with families comprising 3+ earners (18) having the highest median family income of $143,750, while families with no earners (64) have the lowest median family income of $101,500, accounting for 6.5% and 22.9% of families, respectively.
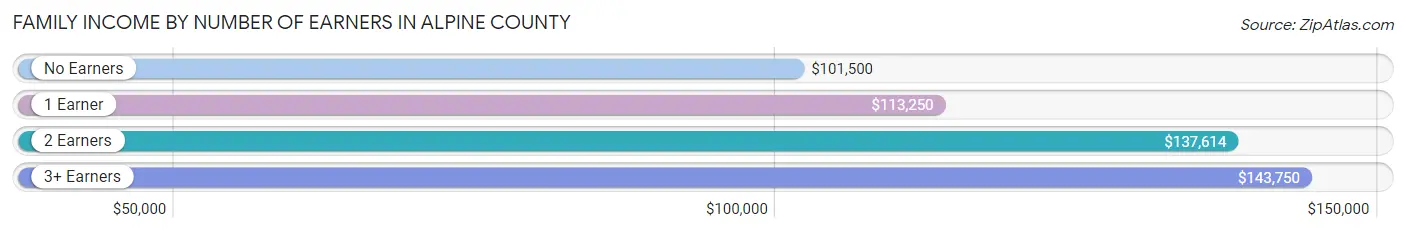
| Number of Earners | # Families | Median Income |
| No Earners | 64 (22.9%) | $101,500 |
| 1 Earner | 112 (40.1%) | $113,250 |
| 2 Earners | 85 (30.5%) | $137,614 |
| 3+ Earners | 18 (6.5%) | $143,750 |
| Total | 279 (100.0%) | $114,625 |
Household Income in Alpine County
Household Income Brackets in Alpine County
With 102 households falling in the category, the $100,000 to $149,999 income range is the most frequent in Alpine County, accounting for 23.4% of all households. In contrast, only 9 households (2.1%) fall into the less than $10,000 income bracket, making it the least populous group.
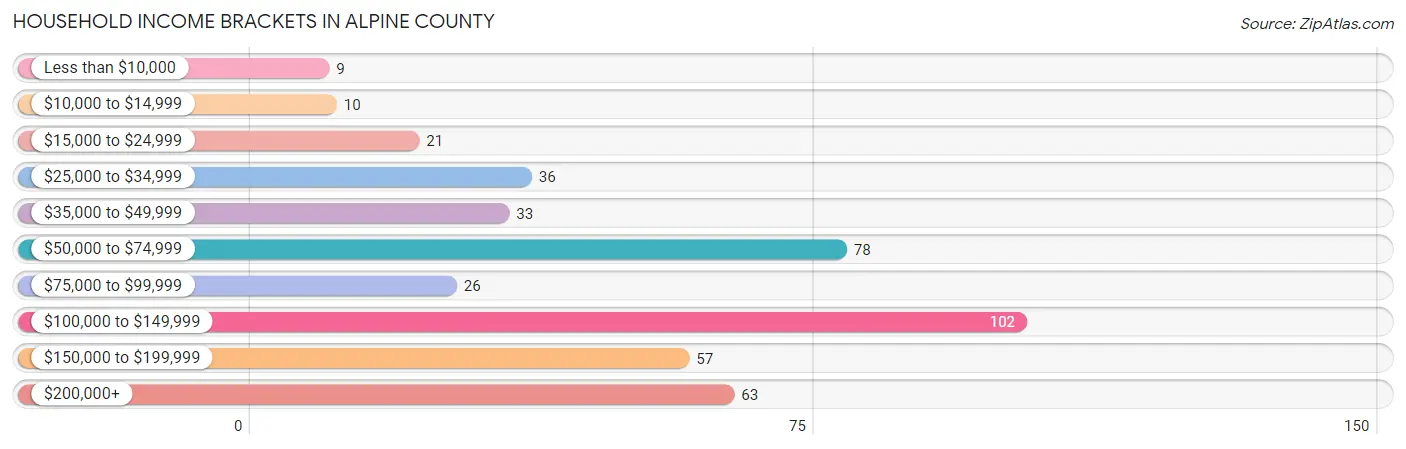
| Income Bracket | # Households | % Households |
| Less than $10,000 | 9 | 2.1% |
| $10,000 to $14,999 | 10 | 2.3% |
| $15,000 to $24,999 | 21 | 4.8% |
| $25,000 to $34,999 | 36 | 8.3% |
| $35,000 to $49,999 | 33 | 7.6% |
| $50,000 to $74,999 | 78 | 17.9% |
| $75,000 to $99,999 | 26 | 6.0% |
| $100,000 to $149,999 | 102 | 23.4% |
| $150,000 to $199,999 | 57 | 13.1% |
| $200,000+ | 63 | 14.5% |
Household Income by Householder Age in Alpine County
The median household income in Alpine County is $101,125, with the highest median household income of $108,500 found in the 65+ years age bracket for the primary householder. A total of 220 households (50.6%) fall into this category. Meanwhile, the 15 to 24 years age bracket for the primary householder has the lowest median household income of $0, with 1 households (0.2%) in this group.
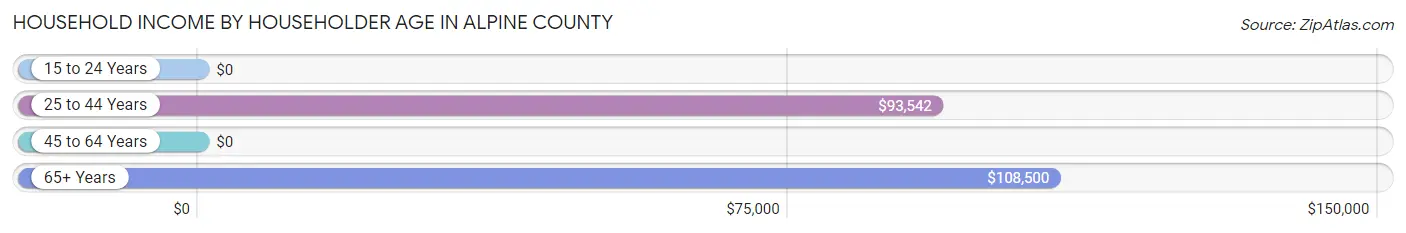
| Income Bracket | # Households | Median Income |
| 15 to 24 Years | 1 (0.2%) | $0 |
| 25 to 44 Years | 67 (15.4%) | $93,542 |
| 45 to 64 Years | 147 (33.8%) | $0 |
| 65+ Years | 220 (50.6%) | $108,500 |
| Total | 435 (100.0%) | $101,125 |
Poverty in Alpine County
Income Below Poverty by Sex and Age in Alpine County
With 17.8% poverty level for males and 8.1% for females among the residents of Alpine County, 6 to 11 year old males and 18 to 24 year old females are the most vulnerable to poverty, with 21 males (38.9%) and 12 females (54.5%) in their respective age groups living below the poverty level.
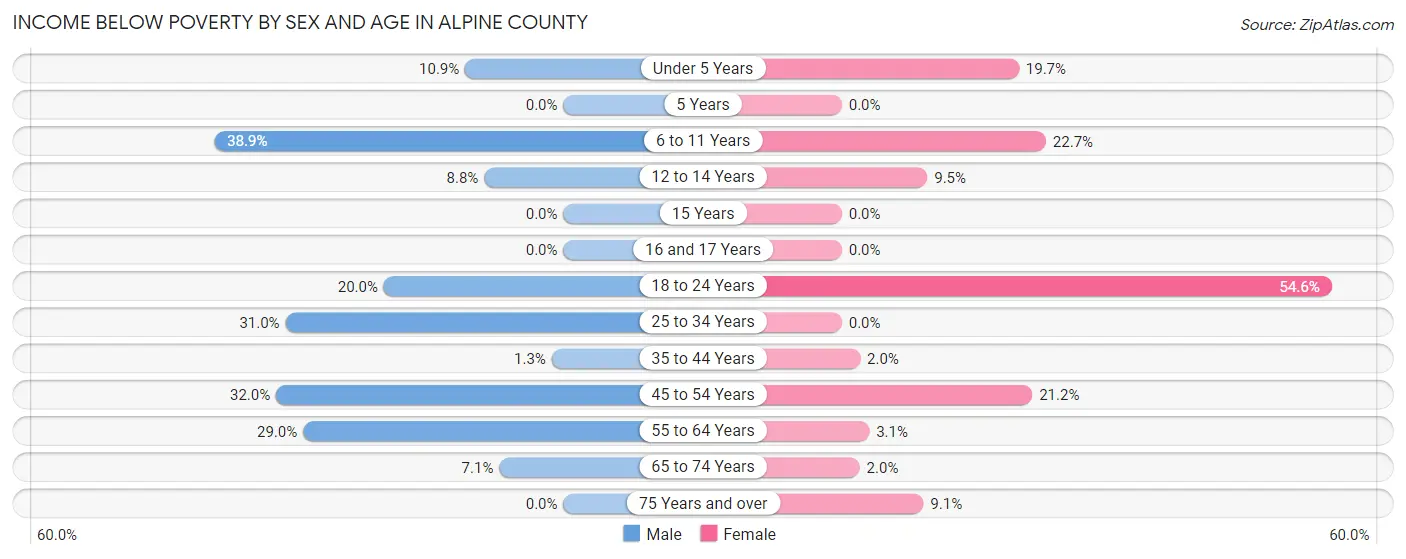
| Age Bracket | Male | Female |
| Under 5 Years | 7 (10.9%) | 14 (19.7%) |
| 5 Years | 0 (0.0%) | 0 (0.0%) |
| 6 to 11 Years | 21 (38.9%) | 5 (22.7%) |
| 12 to 14 Years | 3 (8.8%) | 2 (9.5%) |
| 15 Years | 0 (0.0%) | 0 (0.0%) |
| 16 and 17 Years | 0 (0.0%) | 0 (0.0%) |
| 18 to 24 Years | 16 (20.0%) | 12 (54.5%) |
| 25 to 34 Years | 39 (30.9%) | 0 (0.0%) |
| 35 to 44 Years | 1 (1.3%) | 2 (2.0%) |
| 45 to 54 Years | 16 (32.0%) | 7 (21.2%) |
| 55 to 64 Years | 40 (29.0%) | 4 (3.0%) |
| 65 to 74 Years | 14 (7.1%) | 3 (2.0%) |
| 75 Years and over | 0 (0.0%) | 2 (9.1%) |
| Total | 157 (17.8%) | 51 (8.1%) |
Income Above Poverty by Sex and Age in Alpine County
According to the poverty statistics in Alpine County, males aged 5 years and females aged 15 years are the age groups that are most secure financially, with 100.0% of males and 100.0% of females in these age groups living above the poverty line.
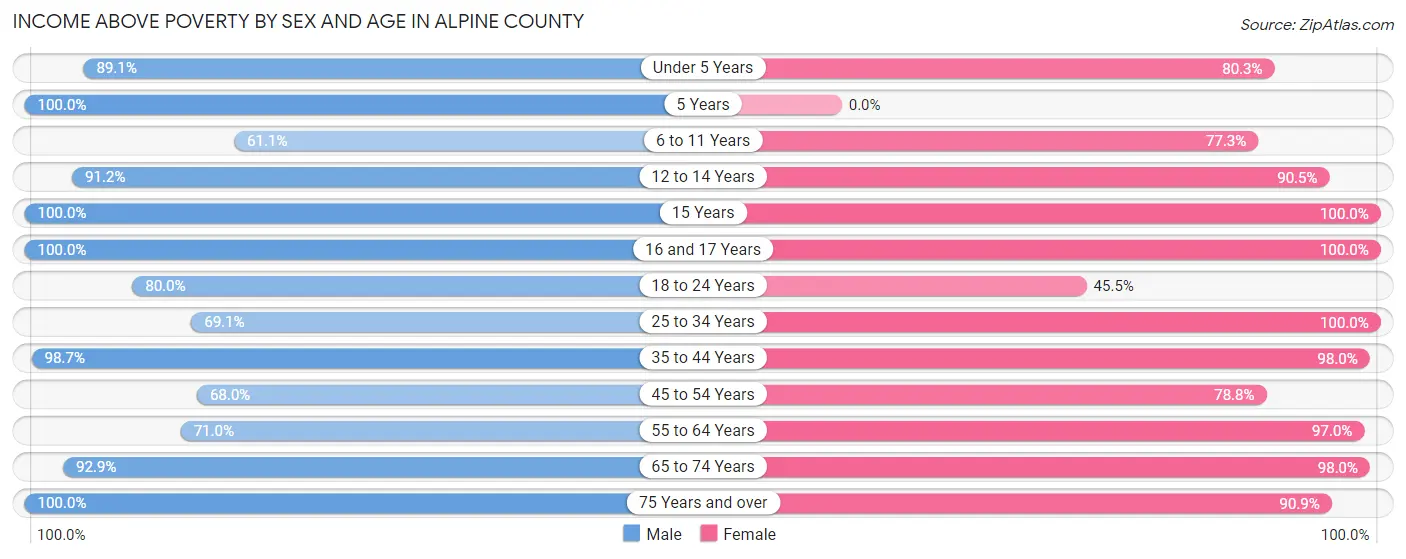
| Age Bracket | Male | Female |
| Under 5 Years | 57 (89.1%) | 57 (80.3%) |
| 5 Years | 10 (100.0%) | 0 (0.0%) |
| 6 to 11 Years | 33 (61.1%) | 17 (77.3%) |
| 12 to 14 Years | 31 (91.2%) | 19 (90.5%) |
| 15 Years | 18 (100.0%) | 5 (100.0%) |
| 16 and 17 Years | 18 (100.0%) | 28 (100.0%) |
| 18 to 24 Years | 64 (80.0%) | 10 (45.5%) |
| 25 to 34 Years | 87 (69.1%) | 29 (100.0%) |
| 35 to 44 Years | 76 (98.7%) | 96 (98.0%) |
| 45 to 54 Years | 34 (68.0%) | 26 (78.8%) |
| 55 to 64 Years | 98 (71.0%) | 127 (97.0%) |
| 65 to 74 Years | 182 (92.9%) | 148 (98.0%) |
| 75 Years and over | 17 (100.0%) | 20 (90.9%) |
| Total | 725 (82.2%) | 582 (91.9%) |
Income Below Poverty Among Married-Couple Families in Alpine County
The poverty statistics for married-couple families in Alpine County show that 4.8% or 11 of the total 228 families live below the poverty line. Families with no children have the highest poverty rate of 6.5%, comprising of 11 families. On the other hand, families with 1 or 2 children have the lowest poverty rate of 0.0%, which includes 0 families.
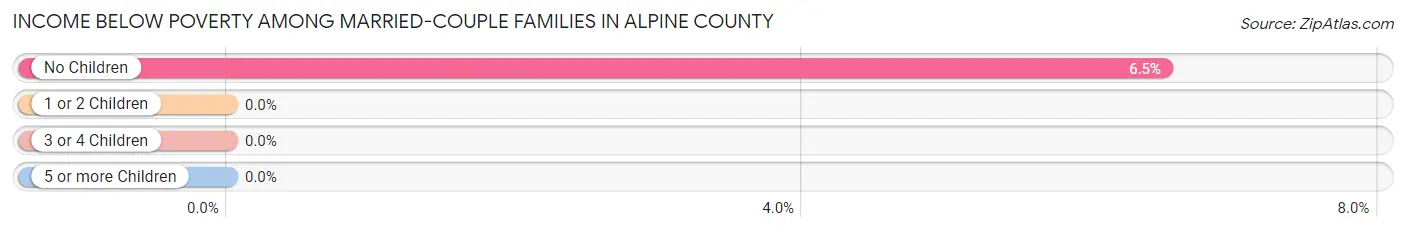
| Children | Above Poverty | Below Poverty |
| No Children | 158 (93.5%) | 11 (6.5%) |
| 1 or 2 Children | 56 (100.0%) | 0 (0.0%) |
| 3 or 4 Children | 3 (100.0%) | 0 (0.0%) |
| 5 or more Children | 0 (0.0%) | 0 (0.0%) |
| Total | 217 (95.2%) | 11 (4.8%) |
Income Below Poverty Among Single-Parent Households in Alpine County
According to the poverty data in Alpine County, 9.1% or 2 single-father households and 20.7% or 6 single-mother households are living below the poverty line. Among single-father households, those with 1 or 2 children have the highest poverty rate, with 1 households (20.0%) experiencing poverty. Likewise, among single-mother households, those with 3 or 4 children have the highest poverty rate, with 2 households (66.7%) falling below the poverty line.
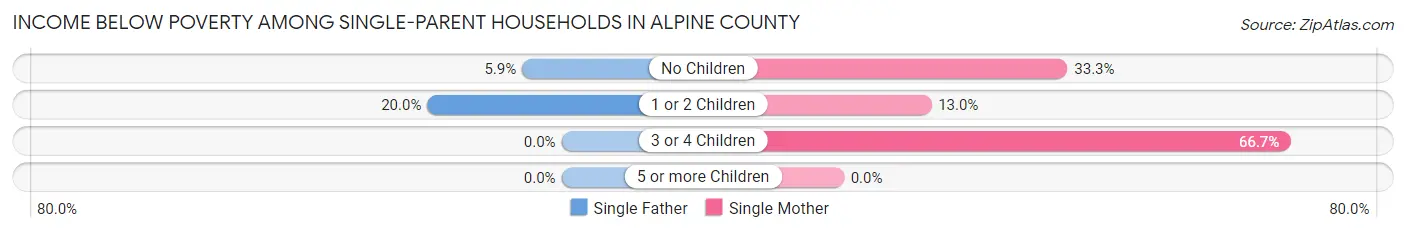
| Children | Single Father | Single Mother |
| No Children | 1 (5.9%) | 1 (33.3%) |
| 1 or 2 Children | 1 (20.0%) | 3 (13.0%) |
| 3 or 4 Children | 0 (0.0%) | 2 (66.7%) |
| 5 or more Children | 0 (0.0%) | 0 (0.0%) |
| Total | 2 (9.1%) | 6 (20.7%) |
Income Below Poverty Among Married-Couple vs Single-Parent Households in Alpine County
The poverty data for Alpine County shows that 11 of the married-couple family households (4.8%) and 8 of the single-parent households (15.7%) are living below the poverty level. Within the married-couple family households, those with no children have the highest poverty rate, with 11 households (6.5%) falling below the poverty line. Among the single-parent households, those with 3 or 4 children have the highest poverty rate, with 2 household (66.7%) living below poverty.
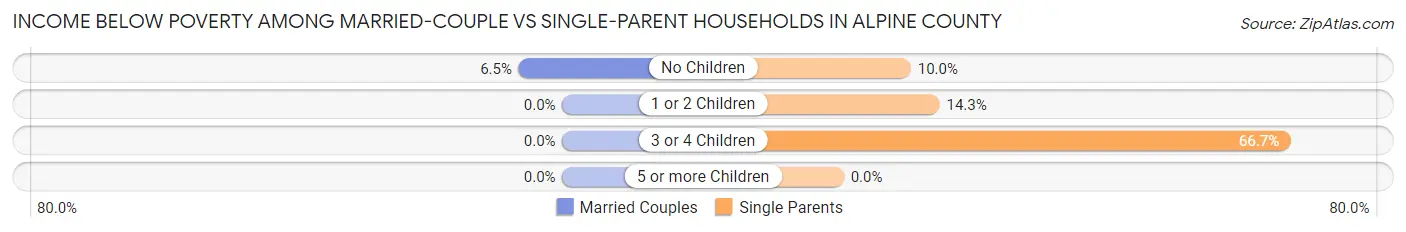
| Children | Married-Couple Families | Single-Parent Households |
| No Children | 11 (6.5%) | 2 (10.0%) |
| 1 or 2 Children | 0 (0.0%) | 4 (14.3%) |
| 3 or 4 Children | 0 (0.0%) | 2 (66.7%) |
| 5 or more Children | 0 (0.0%) | 0 (0.0%) |
| Total | 11 (4.8%) | 8 (15.7%) |
Race in Alpine County
The most populous races in Alpine County are White / Caucasian (961 | 63.4%), Native / Alaskan (391 | 25.8%), and Hispanic or Latino (213 | 14.1%).
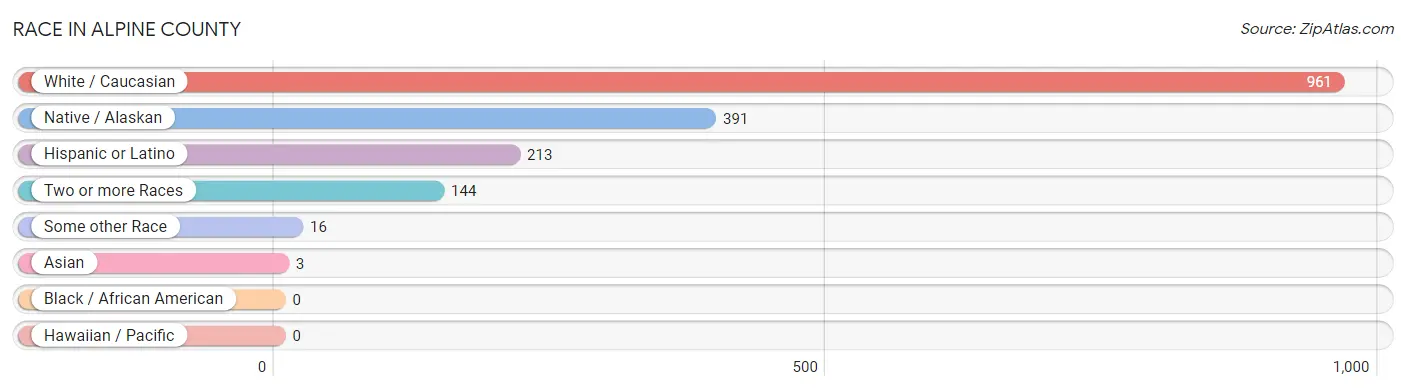
| Race | # Population | % Population |
| Asian | 3 | 0.2% |
| Black / African American | 0 | 0.0% |
| Hawaiian / Pacific | 0 | 0.0% |
| Hispanic or Latino | 213 | 14.1% |
| Native / Alaskan | 391 | 25.8% |
| White / Caucasian | 961 | 63.4% |
| Two or more Races | 144 | 9.5% |
| Some other Race | 16 | 1.1% |
| Total | 1,515 | 100.0% |
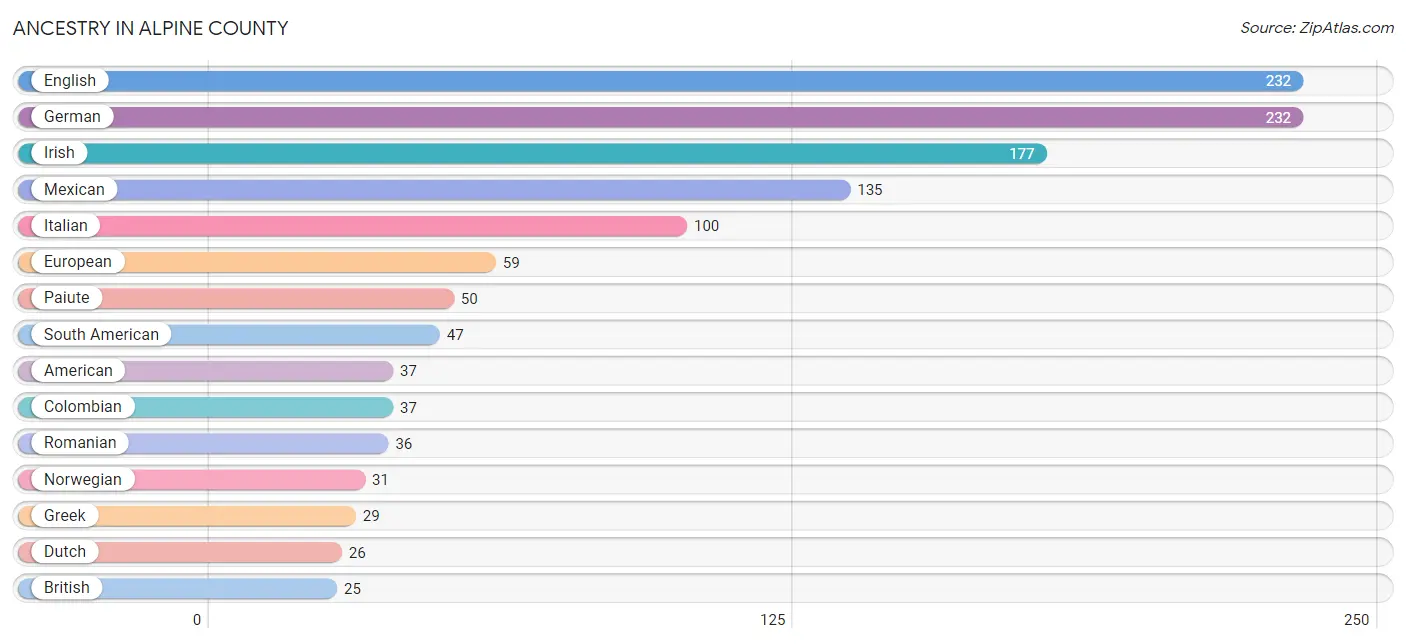
Ancestry in Alpine County
The most populous ancestries reported in Alpine County are English (232 | 15.3%), German (232 | 15.3%), Irish (177 | 11.7%), Mexican (135 | 8.9%), and Italian (100 | 6.6%), together accounting for 57.8% of all Alpine County residents.
| Ancestry | # Population | % Population |
| American | 37 | 2.4% |
| Arab | 6 | 0.4% |
| Argentinean | 10 | 0.7% |
| Austrian | 3 | 0.2% |
| Bhutanese | 2 | 0.1% |
| British | 25 | 1.7% |
| Burmese | 1 | 0.1% |
| Central American | 10 | 0.7% |
| Choctaw | 5 | 0.3% |
| Colombian | 37 | 2.4% |
| Dutch | 26 | 1.7% |
| Eastern European | 4 | 0.3% |
| English | 232 | 15.3% |
| European | 59 | 3.9% |
| French | 7 | 0.5% |
| German | 232 | 15.3% |
| Greek | 29 | 1.9% |
| Guatemalan | 10 | 0.7% |
| Irish | 177 | 11.7% |
| Italian | 100 | 6.6% |
| Korean | 5 | 0.3% |
| Lebanese | 6 | 0.4% |
| Mexican | 135 | 8.9% |
| Northern European | 10 | 0.7% |
| Norwegian | 31 | 2.1% |
| Paiute | 50 | 3.3% |
| Polish | 7 | 0.5% |
| Pueblo | 8 | 0.5% |
| Romanian | 36 | 2.4% |
| Russian | 15 | 1.0% |
| Scandinavian | 9 | 0.6% |
| Scotch-Irish | 8 | 0.5% |
| Scottish | 23 | 1.5% |
| Sioux | 22 | 1.5% |
| South American | 47 | 3.1% |
| Spaniard | 8 | 0.5% |
| Spanish | 8 | 0.5% |
| Swedish | 3 | 0.2% |
| Swiss | 4 | 0.3% |
| Ukrainian | 14 | 0.9% |
| Yaqui | 1 | 0.1% |
| Yuman | 2 | 0.1% | View All 42 Rows |
Immigrants in Alpine County
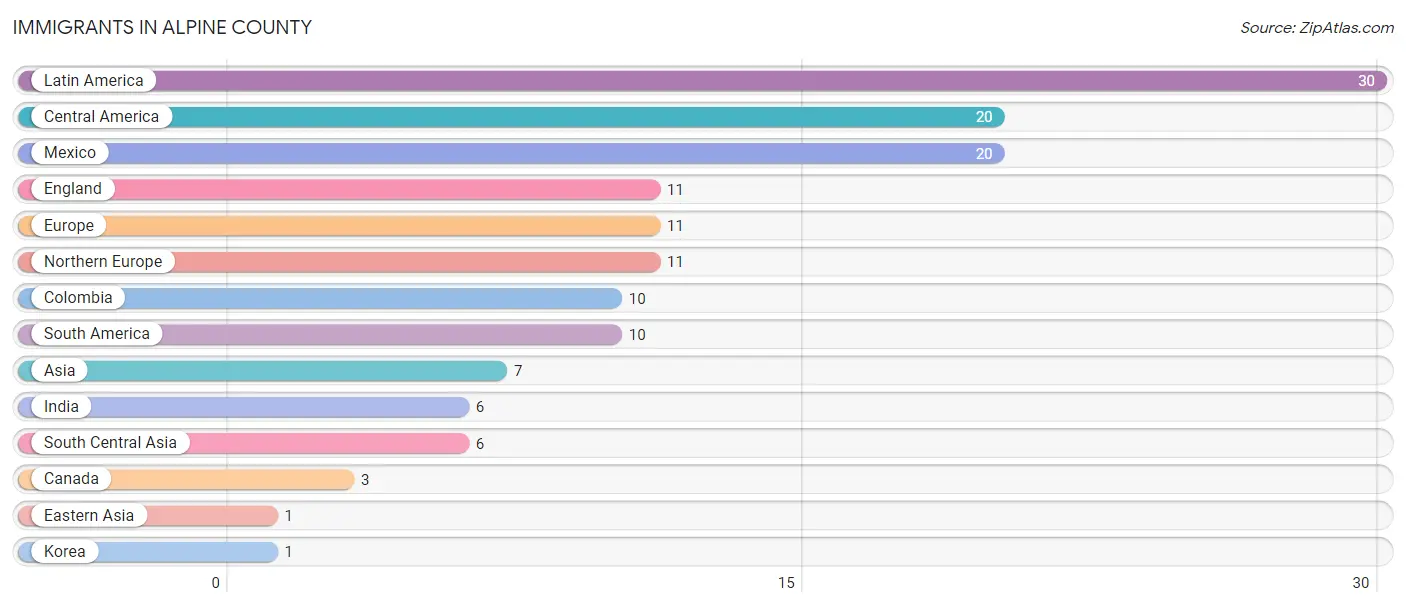
The most numerous immigrant groups reported in Alpine County came from Latin America (30 | 2.0%), Central America (20 | 1.3%), Mexico (20 | 1.3%), England (11 | 0.7%), and Europe (11 | 0.7%), together accounting for 6.1% of all Alpine County residents.
| Immigration Origin | # Population | % Population |
| Asia | 7 | 0.5% |
| Canada | 3 | 0.2% |
| Central America | 20 | 1.3% |
| Colombia | 10 | 0.7% |
| Eastern Asia | 1 | 0.1% |
| England | 11 | 0.7% |
| Europe | 11 | 0.7% |
| India | 6 | 0.4% |
| Korea | 1 | 0.1% |
| Latin America | 30 | 2.0% |
| Mexico | 20 | 1.3% |
| Northern Europe | 11 | 0.7% |
| South America | 10 | 0.7% |
| South Central Asia | 6 | 0.4% | View All 14 Rows |
Sex and Age in Alpine County
Sex and Age in Alpine County
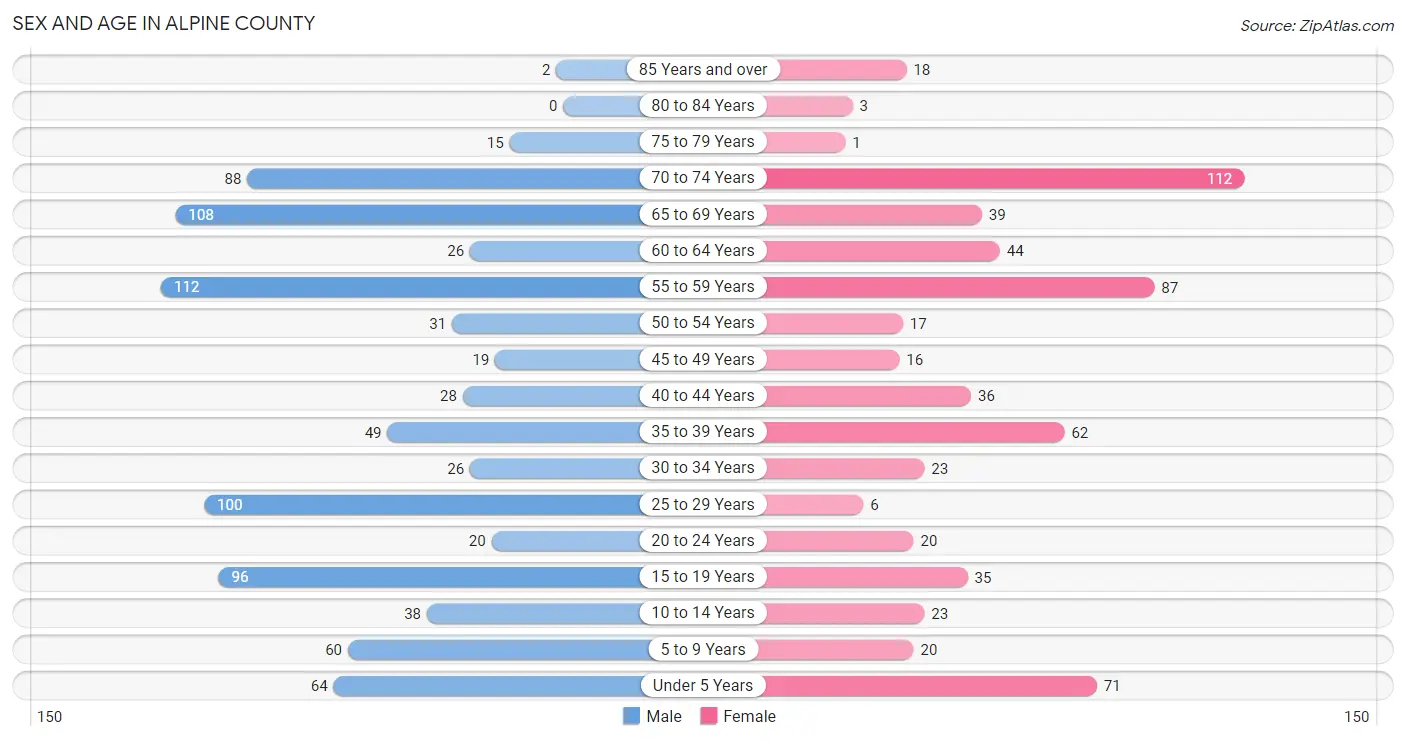
The most populous age groups in Alpine County are 55 to 59 Years (112 | 12.7%) for men and 70 to 74 Years (112 | 17.7%) for women.
| Age Bracket | Male | Female |
| Under 5 Years | 64 (7.3%) | 71 (11.2%) |
| 5 to 9 Years | 60 (6.8%) | 20 (3.2%) |
| 10 to 14 Years | 38 (4.3%) | 23 (3.6%) |
| 15 to 19 Years | 96 (10.9%) | 35 (5.5%) |
| 20 to 24 Years | 20 (2.3%) | 20 (3.2%) |
| 25 to 29 Years | 100 (11.3%) | 6 (0.9%) |
| 30 to 34 Years | 26 (2.9%) | 23 (3.6%) |
| 35 to 39 Years | 49 (5.6%) | 62 (9.8%) |
| 40 to 44 Years | 28 (3.2%) | 36 (5.7%) |
| 45 to 49 Years | 19 (2.1%) | 16 (2.5%) |
| 50 to 54 Years | 31 (3.5%) | 17 (2.7%) |
| 55 to 59 Years | 112 (12.7%) | 87 (13.7%) |
| 60 to 64 Years | 26 (2.9%) | 44 (7.0%) |
| 65 to 69 Years | 108 (12.2%) | 39 (6.2%) |
| 70 to 74 Years | 88 (10.0%) | 112 (17.7%) |
| 75 to 79 Years | 15 (1.7%) | 1 (0.2%) |
| 80 to 84 Years | 0 (0.0%) | 3 (0.5%) |
| 85 Years and over | 2 (0.2%) | 18 (2.8%) |
| Total | 882 (100.0%) | 633 (100.0%) |
Families and Households in Alpine County
Median Family Size in Alpine County
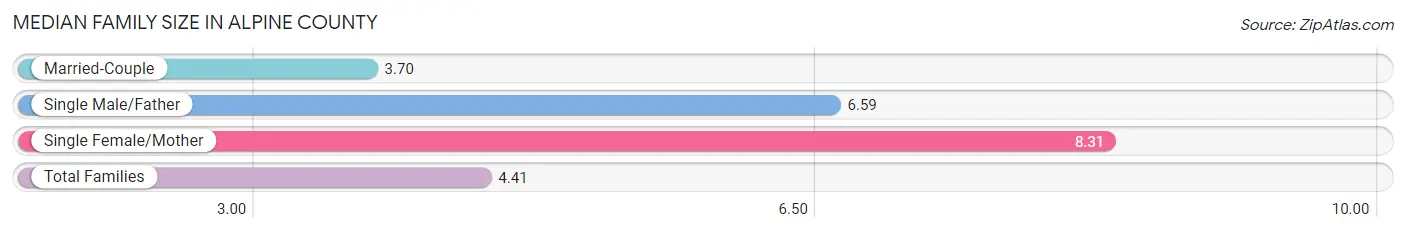
The median family size in Alpine County is 4.41 persons per family, with single female/mother families (29 | 10.4%) accounting for the largest median family size of 8.31 persons per family. On the other hand, married-couple families (228 | 81.7%) represent the smallest median family size with 3.70 persons per family.
| Family Type | # Families | Family Size |
| Married-Couple | 228 (81.7%) | 3.70 |
| Single Male/Father | 22 (7.9%) | 6.59 |
| Single Female/Mother | 29 (10.4%) | 8.31 |
| Total Families | 279 (100.0%) | 4.41 |
Median Household Size in Alpine County
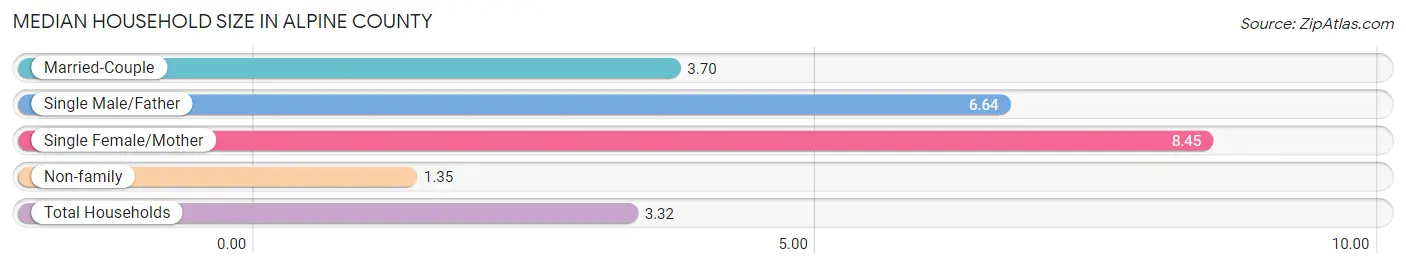
The median household size in Alpine County is 3.32 persons per household, with single female/mother households (29 | 6.7%) accounting for the largest median household size of 8.45 persons per household. non-family households (156 | 35.9%) represent the smallest median household size with 1.35 persons per household.
| Household Type | # Households | Household Size |
| Married-Couple | 228 (52.4%) | 3.70 |
| Single Male/Father | 22 (5.1%) | 6.64 |
| Single Female/Mother | 29 (6.7%) | 8.45 |
| Non-family | 156 (35.9%) | 1.35 |
| Total Households | 435 (100.0%) | 3.32 |
Household Size by Marriage Status in Alpine County
Out of a total of 435 households in Alpine County, 279 (64.1%) are family households, while 156 (35.9%) are nonfamily households. The most numerous type of family households are 2-person households, comprising 181, and the most common type of nonfamily households are 1-person households, comprising 139.
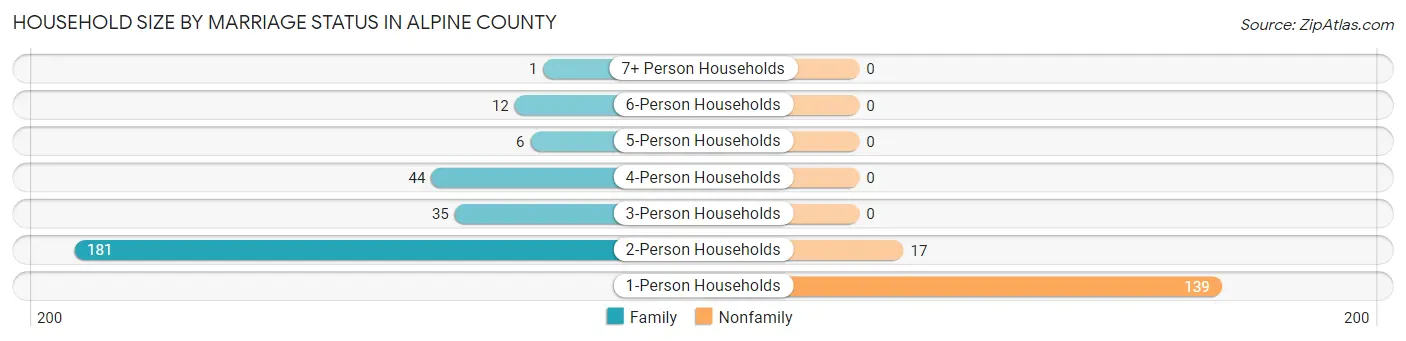
| Household Size | Family Households | Nonfamily Households |
| 1-Person Households | - | 139 (32.0%) |
| 2-Person Households | 181 (41.6%) | 17 (3.9%) |
| 3-Person Households | 35 (8.1%) | 0 (0.0%) |
| 4-Person Households | 44 (10.1%) | 0 (0.0%) |
| 5-Person Households | 6 (1.4%) | 0 (0.0%) |
| 6-Person Households | 12 (2.8%) | 0 (0.0%) |
| 7+ Person Households | 1 (0.2%) | 0 (0.0%) |
| Total | 279 (64.1%) | 156 (35.9%) |
Female Fertility in Alpine County
Fertility by Age in Alpine County
Average fertility rate in Alpine County is 204.0 births per 1,000 women. Women in the age bracket of 35 to 50 years have the highest fertility rate with 350.0 births per 1,000 women. Women in the age bracket of 35 to 50 years acount for 100.0% of all women with births.
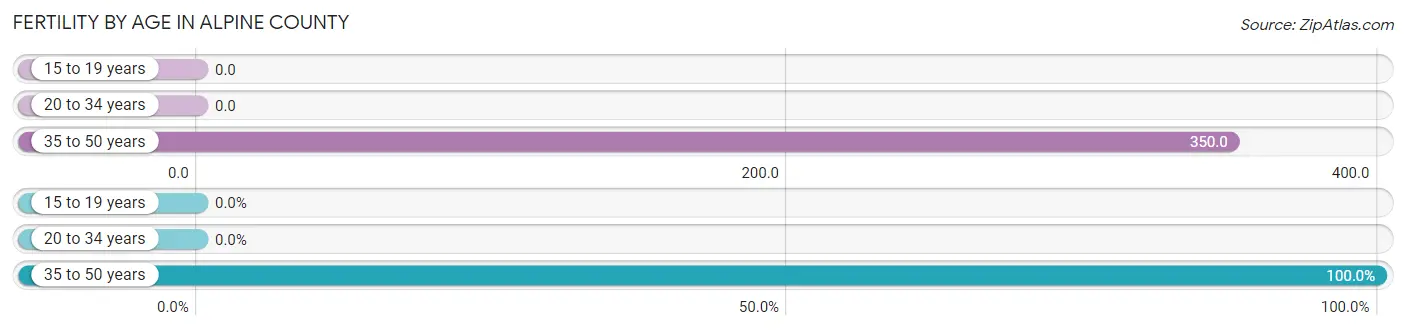
| Age Bracket | Women with Births | Births / 1,000 Women |
| 15 to 19 years | 0 (0.0%) | 0.0 |
| 20 to 34 years | 0 (0.0%) | 0.0 |
| 35 to 50 years | 41 (100.0%) | 350.0 |
| Total | 41 (100.0%) | 204.0 |
Fertility by Age by Marriage Status in Alpine County
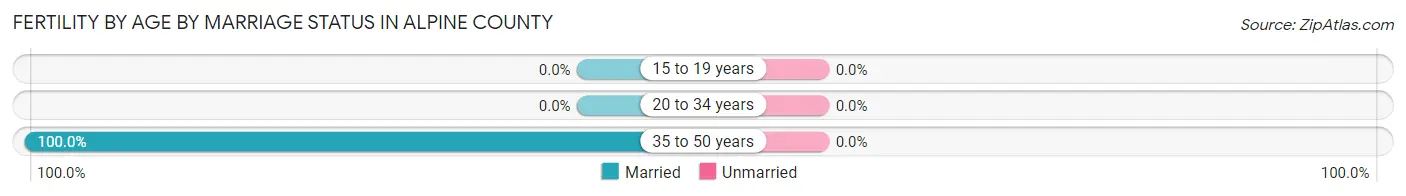
| Age Bracket | Married | Unmarried |
| 15 to 19 years | 0 (0.0%) | 0 (0.0%) |
| 20 to 34 years | 0 (0.0%) | 0 (0.0%) |
| 35 to 50 years | 41 (100.0%) | 0 (0.0%) |
| Total | 41 (100.0%) | 0 (0.0%) |
Fertility by Education in Alpine County
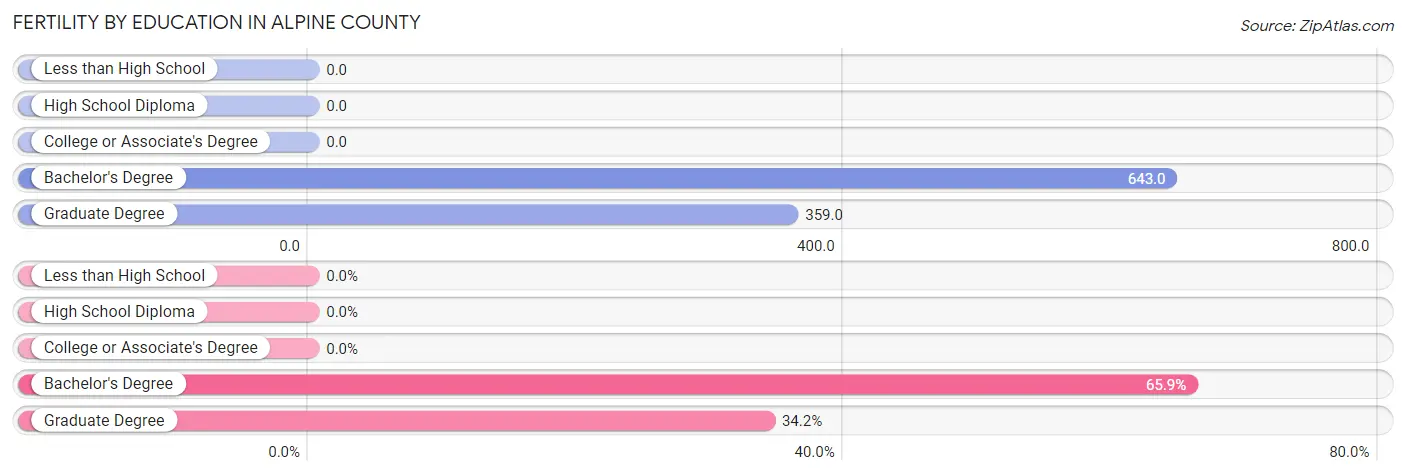
| Educational Attainment | Women with Births | Births / 1,000 Women |
| Less than High School | 0 (0.0%) | 0.0 |
| High School Diploma | 0 (0.0%) | 0.0 |
| College or Associate's Degree | 0 (0.0%) | 0.0 |
| Bachelor's Degree | 27 (65.8%) | 643.0 |
| Graduate Degree | 14 (34.2%) | 359.0 |
| Total | 41 (100.0%) | 204.0 |
Fertility by Education by Marriage Status in Alpine County
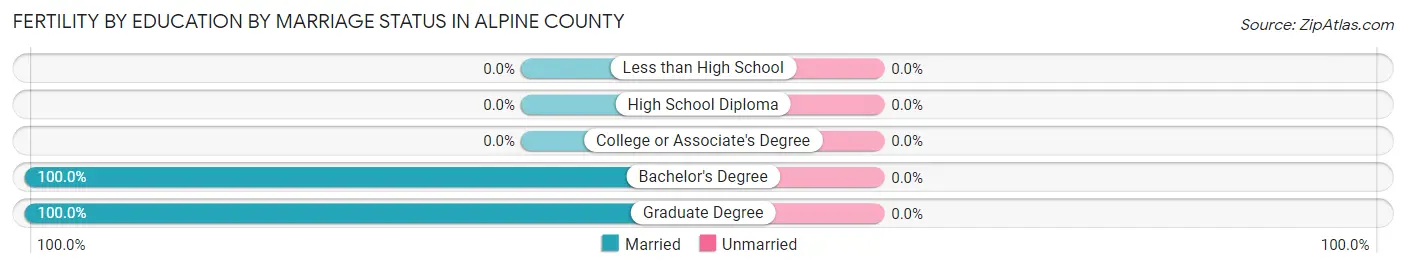
| Educational Attainment | Married | Unmarried |
| Less than High School | 0 (0.0%) | 0 (0.0%) |
| High School Diploma | 0 (0.0%) | 0 (0.0%) |
| College or Associate's Degree | 0 (0.0%) | 0 (0.0%) |
| Bachelor's Degree | 27 (100.0%) | 0 (0.0%) |
| Graduate Degree | 14 (100.0%) | 0 (0.0%) |
| Total | 41 (100.0%) | 0 (0.0%) |
Employment Characteristics in Alpine County
Employment by Class of Employer in Alpine County
Among the 638 employed individuals in Alpine County, private company employees (372 | 58.3%), local government employees (70 | 11.0%), and not-for-profit organizations (64 | 10.0%) make up the most common classes of employment.
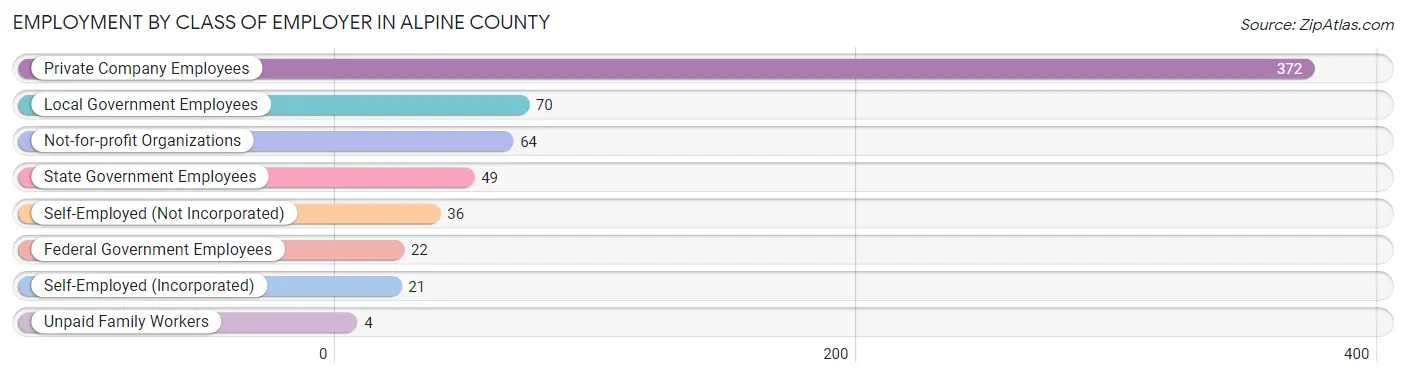
| Employer Class | # Employees | % Employees |
| Private Company Employees | 372 | 58.3% |
| Self-Employed (Incorporated) | 21 | 3.3% |
| Self-Employed (Not Incorporated) | 36 | 5.6% |
| Not-for-profit Organizations | 64 | 10.0% |
| Local Government Employees | 70 | 11.0% |
| State Government Employees | 49 | 7.7% |
| Federal Government Employees | 22 | 3.5% |
| Unpaid Family Workers | 4 | 0.6% |
| Total | 638 | 100.0% |
Employment Status by Age in Alpine County
According to the labor force statistics for Alpine County, out of the total population over 16 years of age (1,216), 55.8% or 679 individuals are in the labor force, with 4.9% or 33 of them unemployed. The age group with the highest labor force participation rate is 35 to 44 years, with 93.7% or 164 individuals in the labor force. Within the labor force, the 55 to 59 years age range has the highest percentage of unemployed individuals, with 8.8% or 13 of them being unemployed.
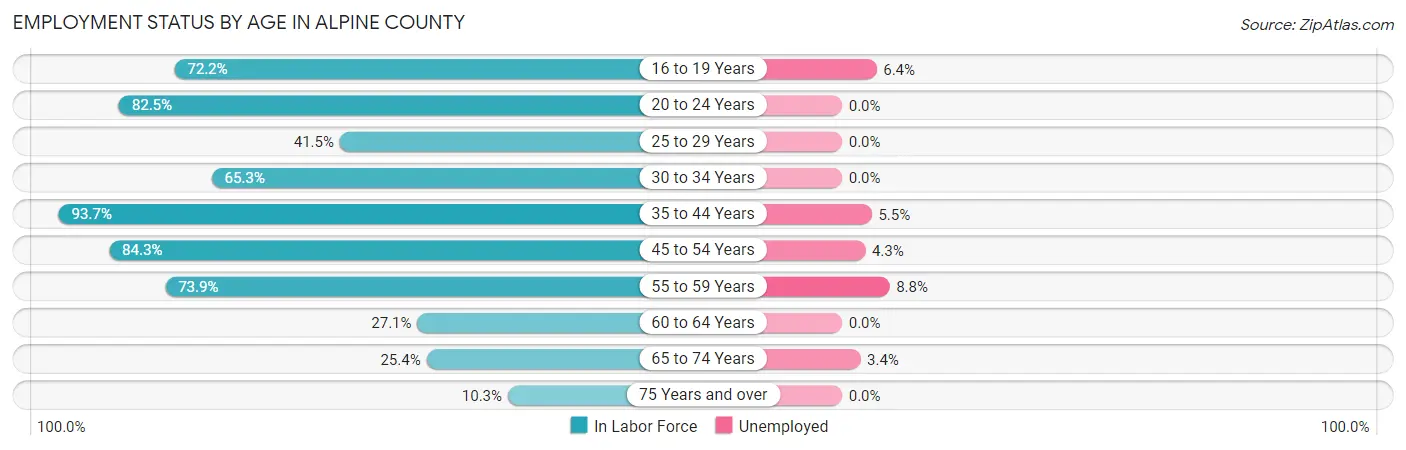
| Age Bracket | In Labor Force | Unemployed |
| 16 to 19 Years | 78 (72.2%) | 5 (6.4%) |
| 20 to 24 Years | 33 (82.5%) | 0 (0.0%) |
| 25 to 29 Years | 44 (41.5%) | 0 (0.0%) |
| 30 to 34 Years | 32 (65.3%) | 0 (0.0%) |
| 35 to 44 Years | 164 (93.7%) | 9 (5.5%) |
| 45 to 54 Years | 70 (84.3%) | 3 (4.3%) |
| 55 to 59 Years | 147 (73.9%) | 13 (8.8%) |
| 60 to 64 Years | 19 (27.1%) | 0 (0.0%) |
| 65 to 74 Years | 88 (25.4%) | 3 (3.4%) |
| 75 Years and over | 4 (10.3%) | 0 (0.0%) |
| Total | 679 (55.8%) | 33 (4.9%) |
Employment Status by Educational Attainment in Alpine County
According to labor force statistics for Alpine County, 69.8% of individuals (476) out of the total population between 25 and 64 years of age (682) are in the labor force, with 5.3% or 25 of them being unemployed. The group with the highest labor force participation rate are those with the educational attainment of college / associate degree, with 85.4% or 182 individuals in the labor force. Within the labor force, individuals with bachelor's degree or higher education have the highest percentage of unemployment, with 7.9% or 15 of them being unemployed.
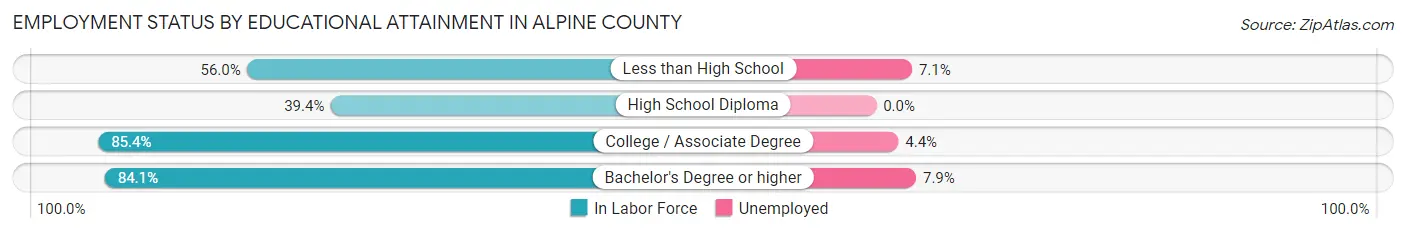
| Educational Attainment | In Labor Force | Unemployed |
| Less than High School | 28 (56.0%) | 4 (7.1%) |
| High School Diploma | 76 (39.4%) | 0 (0.0%) |
| College / Associate Degree | 182 (85.4%) | 9 (4.4%) |
| Bachelor's Degree or higher | 190 (84.1%) | 18 (7.9%) |
| Total | 476 (69.8%) | 36 (5.3%) |
Employment Occupations by Sex in Alpine County
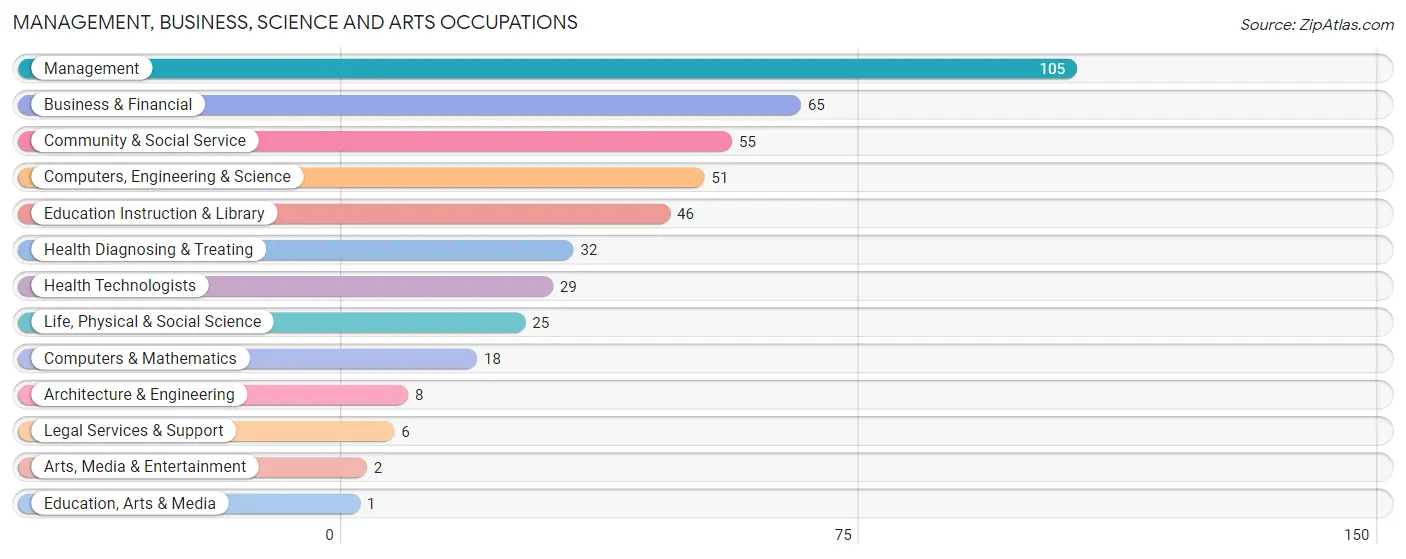
Management, Business, Science and Arts Occupations
The most common Management, Business, Science and Arts occupations in Alpine County are Management (105 | 16.3%), Business & Financial (65 | 10.1%), Community & Social Service (55 | 8.5%), Computers, Engineering & Science (51 | 7.9%), and Education Instruction & Library (46 | 7.1%).
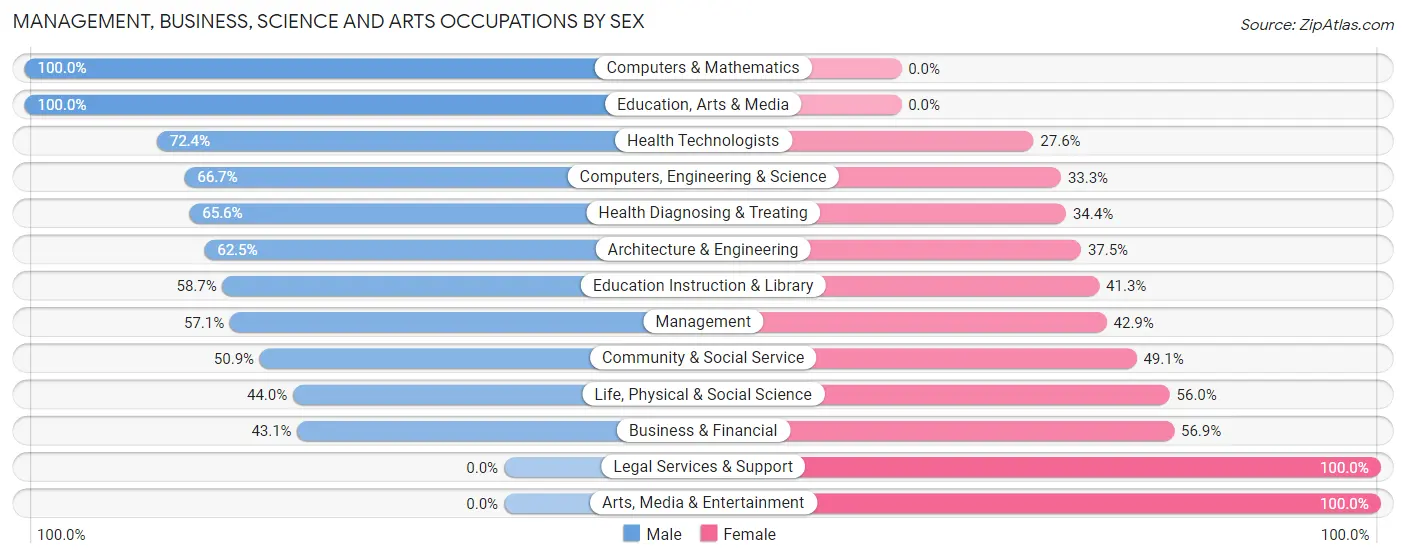
Management, Business, Science and Arts Occupations by Sex
Within the Management, Business, Science and Arts occupations in Alpine County, the most male-oriented occupations are Computers & Mathematics (100.0%), Education, Arts & Media (100.0%), and Health Technologists (72.4%), while the most female-oriented occupations are Legal Services & Support (100.0%), Arts, Media & Entertainment (100.0%), and Business & Financial (56.9%).
| Occupation | Male | Female |
| Management | 60 (57.1%) | 45 (42.9%) |
| Business & Financial | 28 (43.1%) | 37 (56.9%) |
| Computers, Engineering & Science | 34 (66.7%) | 17 (33.3%) |
| Computers & Mathematics | 18 (100.0%) | 0 (0.0%) |
| Architecture & Engineering | 5 (62.5%) | 3 (37.5%) |
| Life, Physical & Social Science | 11 (44.0%) | 14 (56.0%) |
| Community & Social Service | 28 (50.9%) | 27 (49.1%) |
| Education, Arts & Media | 1 (100.0%) | 0 (0.0%) |
| Legal Services & Support | 0 (0.0%) | 6 (100.0%) |
| Education Instruction & Library | 27 (58.7%) | 19 (41.3%) |
| Arts, Media & Entertainment | 0 (0.0%) | 2 (100.0%) |
| Health Diagnosing & Treating | 21 (65.6%) | 11 (34.4%) |
| Health Technologists | 21 (72.4%) | 8 (27.6%) |
| Total (Category) | 171 (55.5%) | 137 (44.5%) |
| Total (Overall) | 382 (59.1%) | 264 (40.9%) |
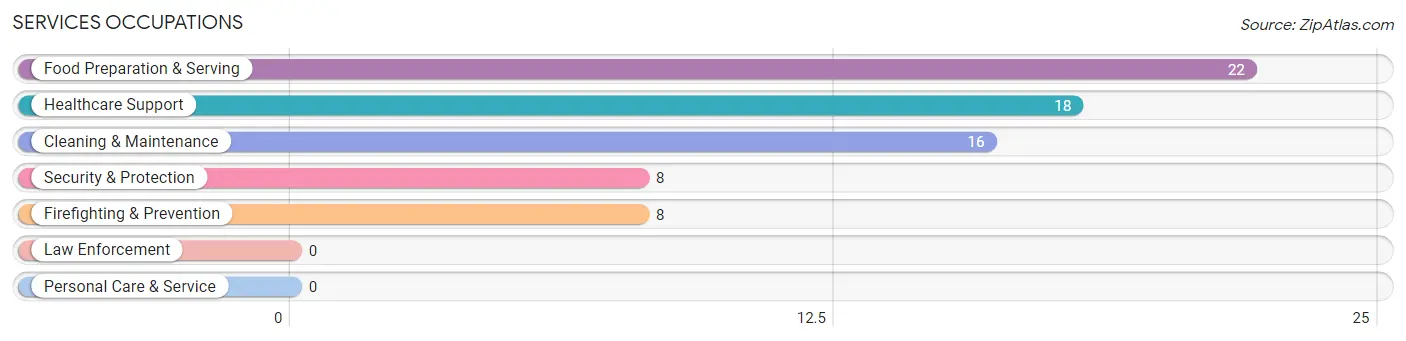
Services Occupations
The most common Services occupations in Alpine County are Food Preparation & Serving (22 | 3.4%), Healthcare Support (18 | 2.8%), Cleaning & Maintenance (16 | 2.5%), Security & Protection (8 | 1.2%), and Firefighting & Prevention (8 | 1.2%).
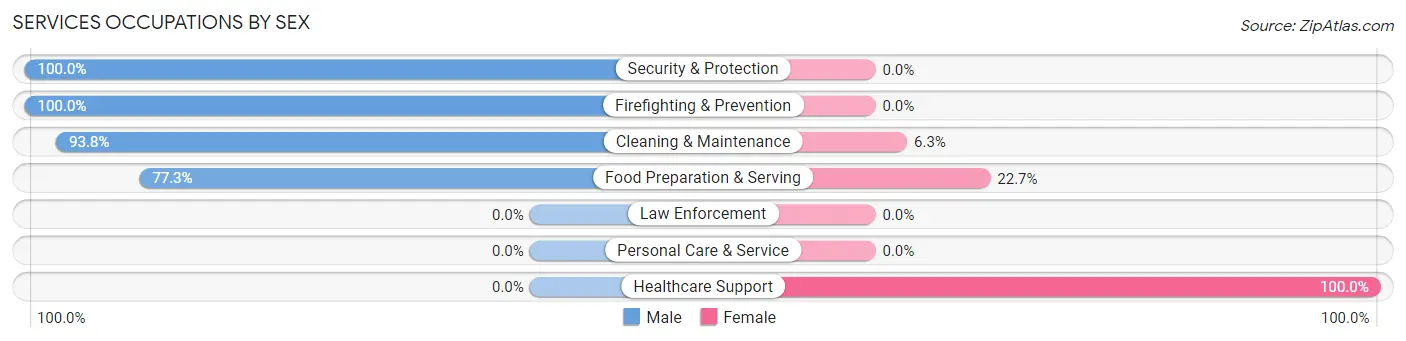
Services Occupations by Sex
Within the Services occupations in Alpine County, the most male-oriented occupations are Security & Protection (100.0%), Firefighting & Prevention (100.0%), and Cleaning & Maintenance (93.8%), while the most female-oriented occupations are Healthcare Support (100.0%), Food Preparation & Serving (22.7%), and Cleaning & Maintenance (6.2%).
| Occupation | Male | Female |
| Healthcare Support | 0 (0.0%) | 18 (100.0%) |
| Security & Protection | 8 (100.0%) | 0 (0.0%) |
| Firefighting & Prevention | 8 (100.0%) | 0 (0.0%) |
| Law Enforcement | 0 (0.0%) | 0 (0.0%) |
| Food Preparation & Serving | 17 (77.3%) | 5 (22.7%) |
| Cleaning & Maintenance | 15 (93.8%) | 1 (6.2%) |
| Personal Care & Service | 0 (0.0%) | 0 (0.0%) |
| Total (Category) | 40 (62.5%) | 24 (37.5%) |
| Total (Overall) | 382 (59.1%) | 264 (40.9%) |
Sales and Office Occupations
The most common Sales and Office occupations in Alpine County are Sales & Related (86 | 13.3%), and Office & Administration (45 | 7.0%).
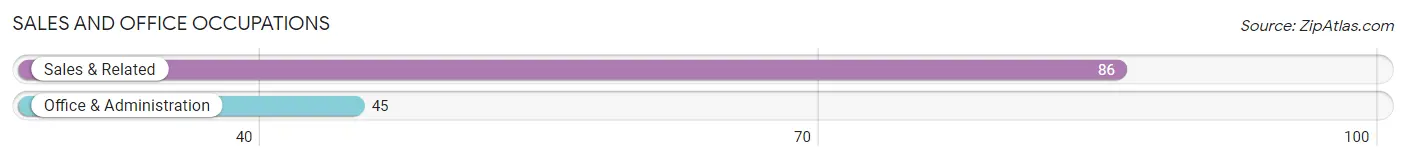
Sales and Office Occupations by Sex
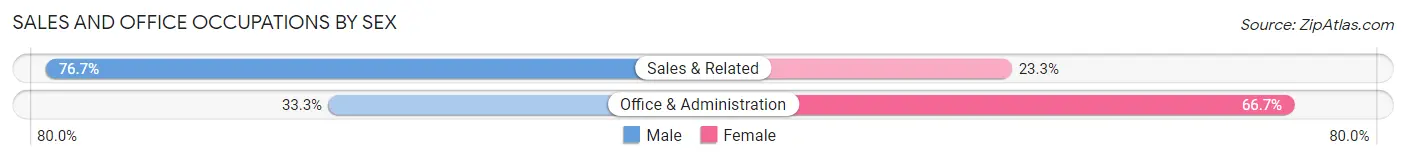
| Occupation | Male | Female |
| Sales & Related | 66 (76.7%) | 20 (23.3%) |
| Office & Administration | 15 (33.3%) | 30 (66.7%) |
| Total (Category) | 81 (61.8%) | 50 (38.2%) |
| Total (Overall) | 382 (59.1%) | 264 (40.9%) |
Natural Resources, Construction and Maintenance Occupations
The most common Natural Resources, Construction and Maintenance occupations in Alpine County are Installation, Maintenance & Repair (28 | 4.3%), Farming, Fishing & Forestry (10 | 1.5%), and Construction & Extraction (9 | 1.4%).
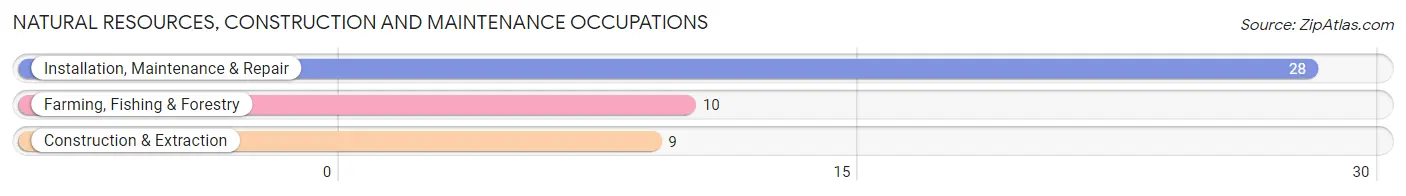
Natural Resources, Construction and Maintenance Occupations by Sex
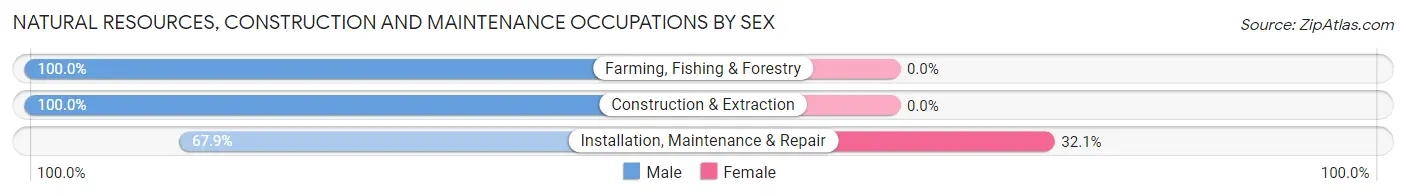
| Occupation | Male | Female |
| Farming, Fishing & Forestry | 10 (100.0%) | 0 (0.0%) |
| Construction & Extraction | 9 (100.0%) | 0 (0.0%) |
| Installation, Maintenance & Repair | 19 (67.9%) | 9 (32.1%) |
| Total (Category) | 38 (80.8%) | 9 (19.2%) |
| Total (Overall) | 382 (59.1%) | 264 (40.9%) |
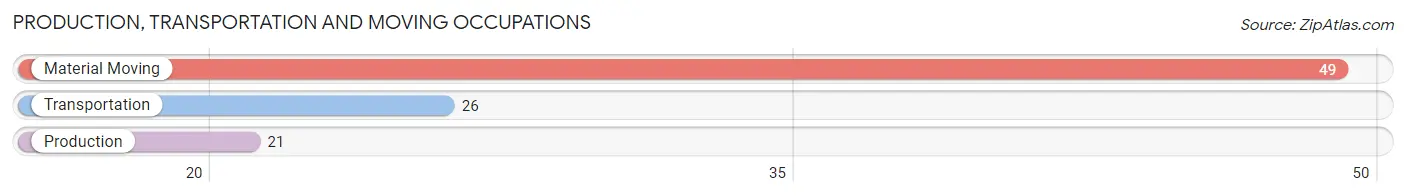
Production, Transportation and Moving Occupations
The most common Production, Transportation and Moving occupations in Alpine County are Material Moving (49 | 7.6%), Transportation (26 | 4.0%), and Production (21 | 3.3%).
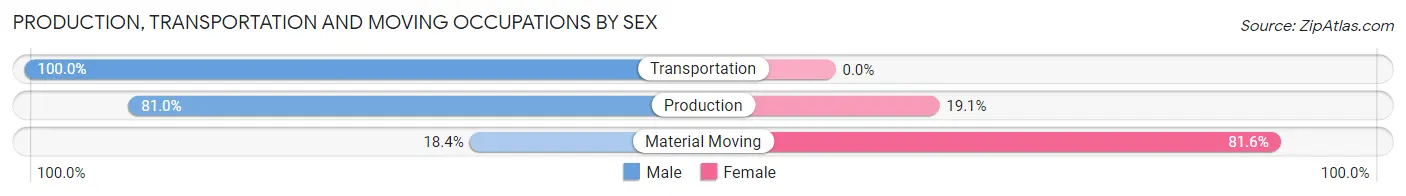
Production, Transportation and Moving Occupations by Sex
| Occupation | Male | Female |
| Production | 17 (80.9%) | 4 (19.1%) |
| Transportation | 26 (100.0%) | 0 (0.0%) |
| Material Moving | 9 (18.4%) | 40 (81.6%) |
| Total (Category) | 52 (54.2%) | 44 (45.8%) |
| Total (Overall) | 382 (59.1%) | 264 (40.9%) |
Employment Industries by Sex in Alpine County
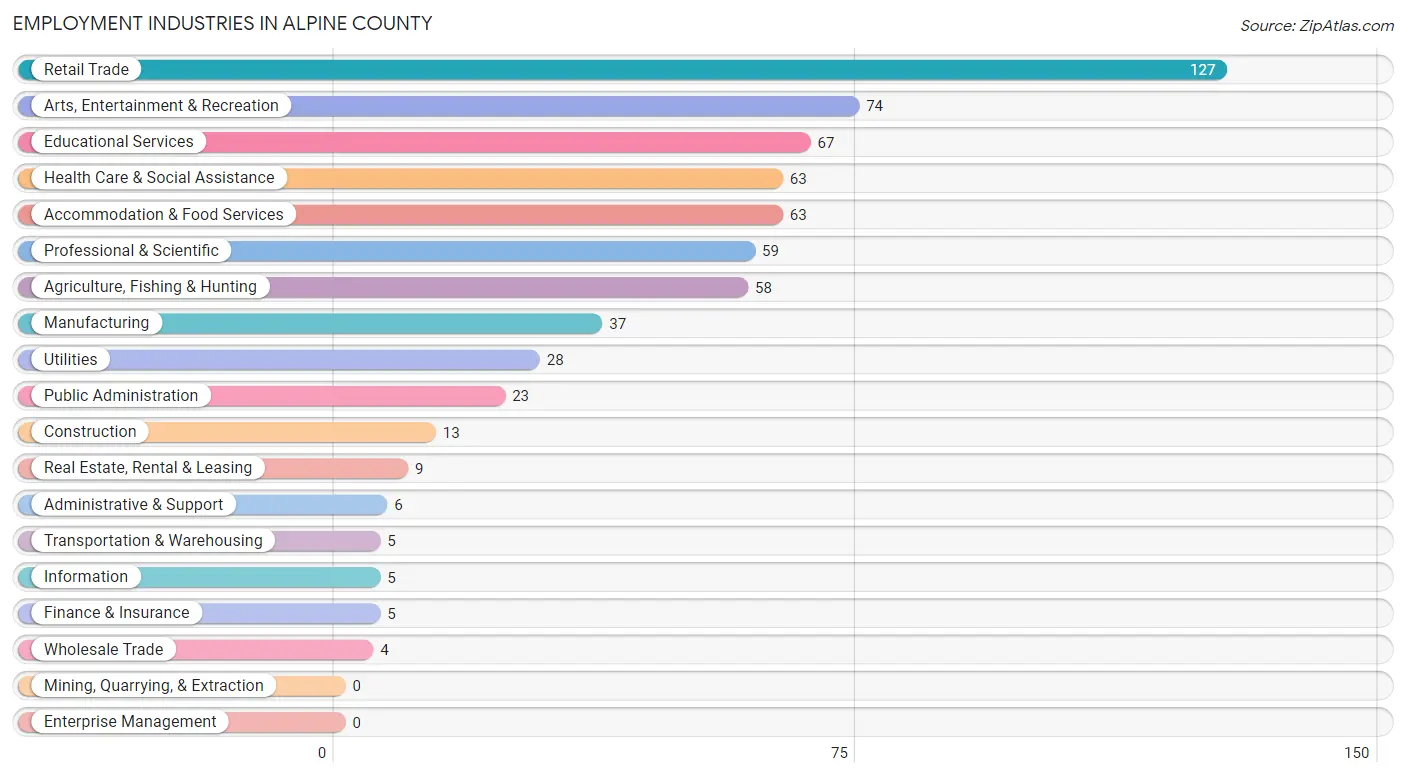
Employment Industries in Alpine County
The major employment industries in Alpine County include Retail Trade (127 | 19.7%), Arts, Entertainment & Recreation (74 | 11.5%), Educational Services (67 | 10.4%), Health Care & Social Assistance (63 | 9.8%), and Accommodation & Food Services (63 | 9.8%).
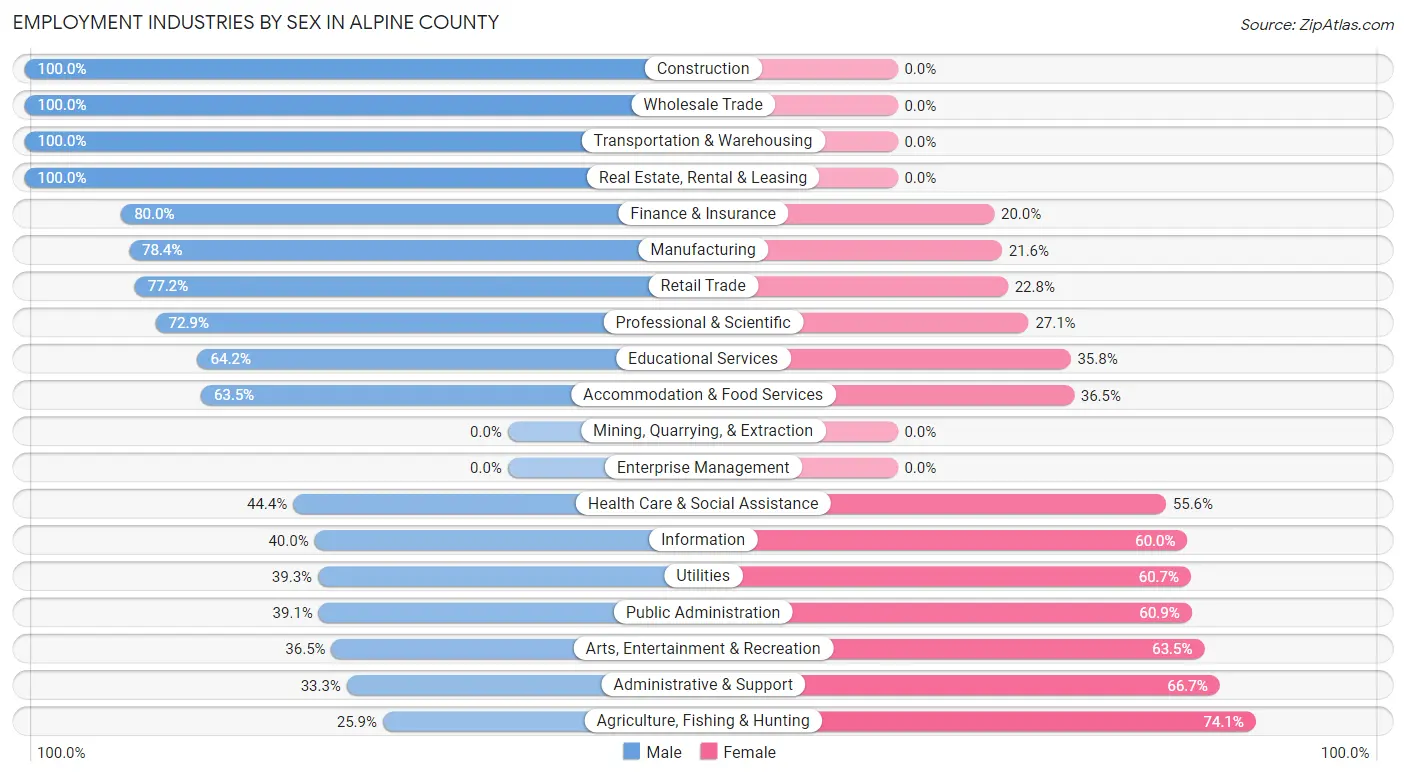
Employment Industries by Sex in Alpine County
The Alpine County industries that see more men than women are Construction (100.0%), Wholesale Trade (100.0%), and Transportation & Warehousing (100.0%), whereas the industries that tend to have a higher number of women are Agriculture, Fishing & Hunting (74.1%), Administrative & Support (66.7%), and Arts, Entertainment & Recreation (63.5%).
| Industry | Male | Female |
| Agriculture, Fishing & Hunting | 15 (25.9%) | 43 (74.1%) |
| Mining, Quarrying, & Extraction | 0 (0.0%) | 0 (0.0%) |
| Construction | 13 (100.0%) | 0 (0.0%) |
| Manufacturing | 29 (78.4%) | 8 (21.6%) |
| Wholesale Trade | 4 (100.0%) | 0 (0.0%) |
| Retail Trade | 98 (77.2%) | 29 (22.8%) |
| Transportation & Warehousing | 5 (100.0%) | 0 (0.0%) |
| Utilities | 11 (39.3%) | 17 (60.7%) |
| Information | 2 (40.0%) | 3 (60.0%) |
| Finance & Insurance | 4 (80.0%) | 1 (20.0%) |
| Real Estate, Rental & Leasing | 9 (100.0%) | 0 (0.0%) |
| Professional & Scientific | 43 (72.9%) | 16 (27.1%) |
| Enterprise Management | 0 (0.0%) | 0 (0.0%) |
| Administrative & Support | 2 (33.3%) | 4 (66.7%) |
| Educational Services | 43 (64.2%) | 24 (35.8%) |
| Health Care & Social Assistance | 28 (44.4%) | 35 (55.6%) |
| Arts, Entertainment & Recreation | 27 (36.5%) | 47 (63.5%) |
| Accommodation & Food Services | 40 (63.5%) | 23 (36.5%) |
| Public Administration | 9 (39.1%) | 14 (60.9%) |
| Total | 382 (59.1%) | 264 (40.9%) |
Education in Alpine County
School Enrollment in Alpine County
The most common levels of schooling among the 356 students in Alpine County are college / undergraduate (88 | 24.7%), high school (68 | 19.1%), and middle school (58 | 16.3%).
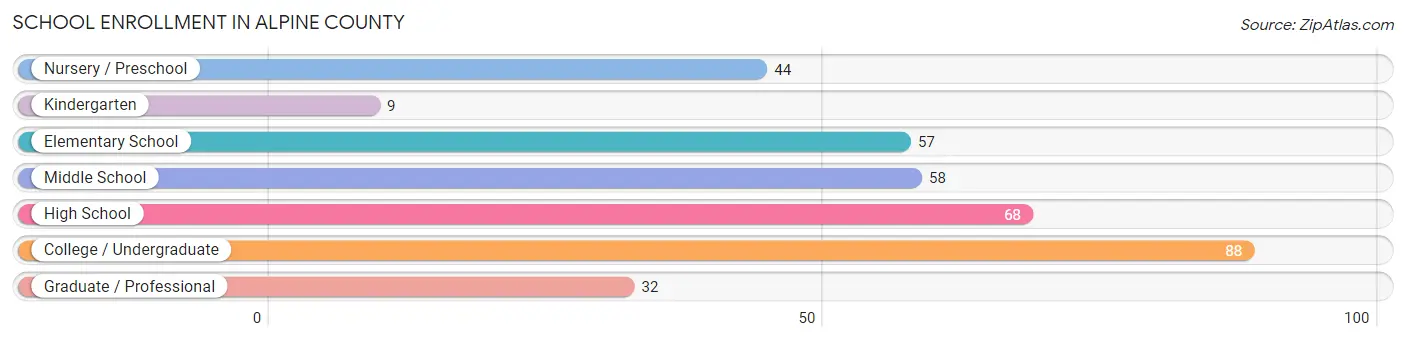
| School Level | # Students | % Students |
| Nursery / Preschool | 44 | 12.4% |
| Kindergarten | 9 | 2.5% |
| Elementary School | 57 | 16.0% |
| Middle School | 58 | 16.3% |
| High School | 68 | 19.1% |
| College / Undergraduate | 88 | 24.7% |
| Graduate / Professional | 32 | 9.0% |
| Total | 356 | 100.0% |
School Enrollment by Age by Funding Source in Alpine County
Out of a total of 356 students who are enrolled in schools in Alpine County, 21 (5.9%) attend a private institution, while the remaining 335 (94.1%) are enrolled in public schools. The age group of 25 to 34 year olds has the highest likelihood of being enrolled in private schools, with 14 (48.3% in the age bracket) enrolled. Conversely, the age group of 3 to 4 year olds has the lowest likelihood of being enrolled in a private school, with 38 (100.0% in the age bracket) attending a public institution.
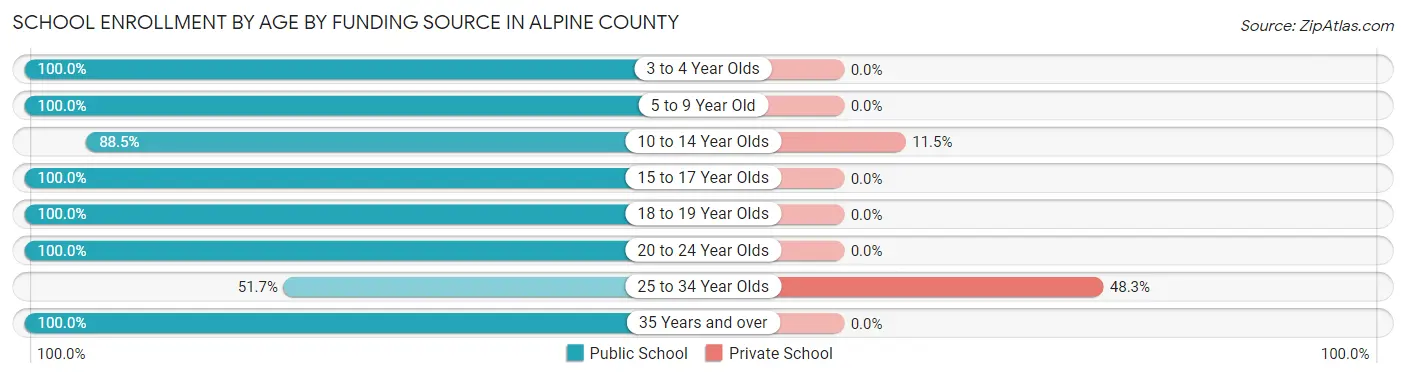
| Age Bracket | Public School | Private School |
| 3 to 4 Year Olds | 38 (100.0%) | 0 (0.0%) |
| 5 to 9 Year Old | 72 (100.0%) | 0 (0.0%) |
| 10 to 14 Year Olds | 54 (88.5%) | 7 (11.5%) |
| 15 to 17 Year Olds | 55 (100.0%) | 0 (0.0%) |
| 18 to 19 Year Olds | 62 (100.0%) | 0 (0.0%) |
| 20 to 24 Year Olds | 10 (100.0%) | 0 (0.0%) |
| 25 to 34 Year Olds | 15 (51.7%) | 14 (48.3%) |
| 35 Years and over | 29 (100.0%) | 0 (0.0%) |
| Total | 335 (94.1%) | 21 (5.9%) |
Educational Attainment by Field of Study in Alpine County
Bio, nature & agricultural (94 | 20.2%), visual & performing arts (47 | 10.1%), computers & mathematics (41 | 8.8%), business (38 | 8.2%), and social sciences (32 | 6.9%) are the most common fields of study among 465 individuals in Alpine County who have obtained a bachelor's degree or higher.
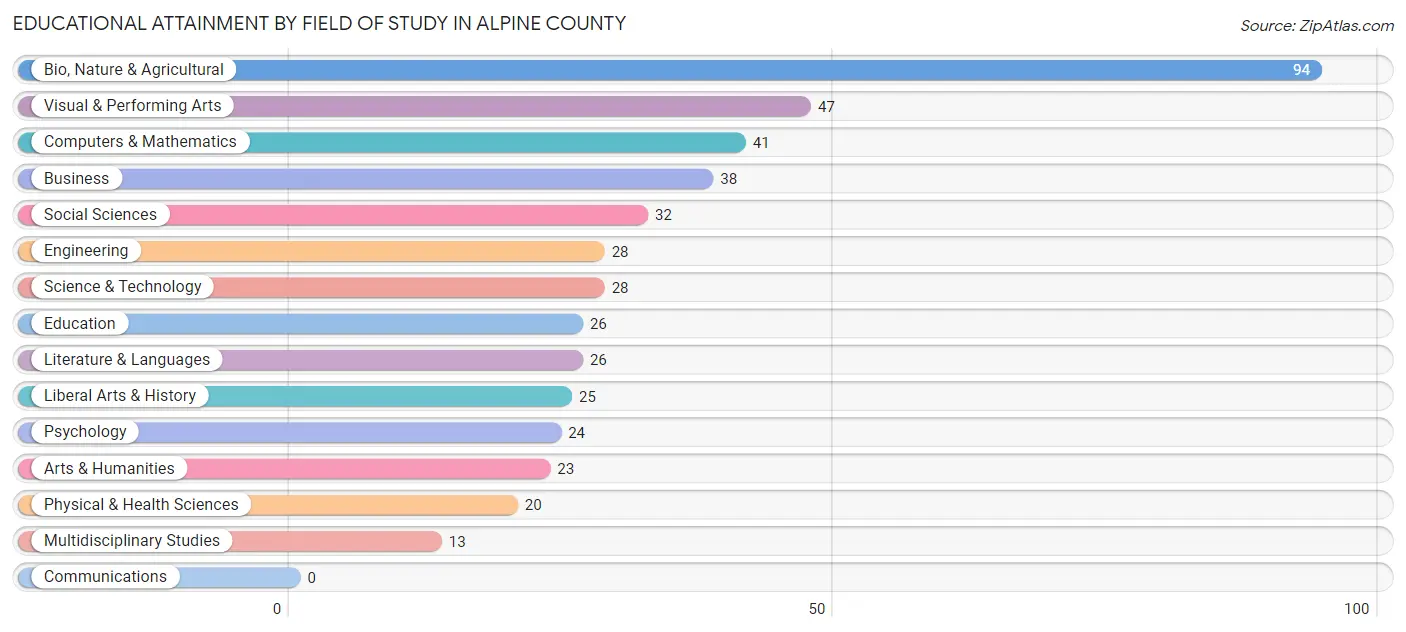
| Field of Study | # Graduates | % Graduates |
| Computers & Mathematics | 41 | 8.8% |
| Bio, Nature & Agricultural | 94 | 20.2% |
| Physical & Health Sciences | 20 | 4.3% |
| Psychology | 24 | 5.2% |
| Social Sciences | 32 | 6.9% |
| Engineering | 28 | 6.0% |
| Multidisciplinary Studies | 13 | 2.8% |
| Science & Technology | 28 | 6.0% |
| Business | 38 | 8.2% |
| Education | 26 | 5.6% |
| Literature & Languages | 26 | 5.6% |
| Liberal Arts & History | 25 | 5.4% |
| Visual & Performing Arts | 47 | 10.1% |
| Communications | 0 | 0.0% |
| Arts & Humanities | 23 | 5.0% |
| Total | 465 | 100.0% |
Transportation & Commute in Alpine County
Vehicle Availability by Sex in Alpine County
The most prevalent vehicle ownership categories in Alpine County are males with 2 vehicles (100, accounting for 29.7%) and females with 2 vehicles (57, making up 37.9%).
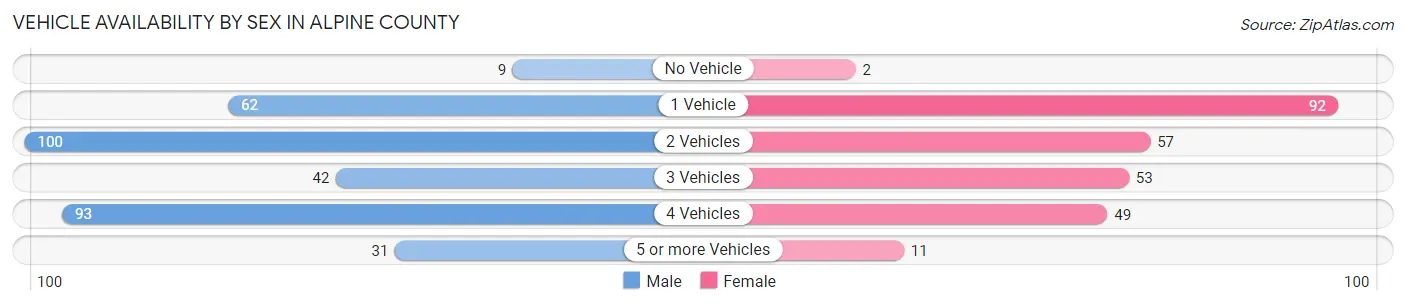
| Vehicles Available | Male | Female |
| No Vehicle | 9 (2.7%) | 2 (0.8%) |
| 1 Vehicle | 62 (18.4%) | 92 (34.8%) |
| 2 Vehicles | 100 (29.7%) | 57 (21.6%) |
| 3 Vehicles | 42 (12.5%) | 53 (20.1%) |
| 4 Vehicles | 93 (27.6%) | 49 (18.6%) |
| 5 or more Vehicles | 31 (9.2%) | 11 (4.2%) |
| Total | 337 (100.0%) | 264 (100.0%) |
Commute Time in Alpine County
The most frequently occuring commute durations in Alpine County are 5 to 9 minutes (93 commuters, 19.2%), 30 to 34 minutes (89 commuters, 18.4%), and 40 to 44 minutes (73 commuters, 15.1%).
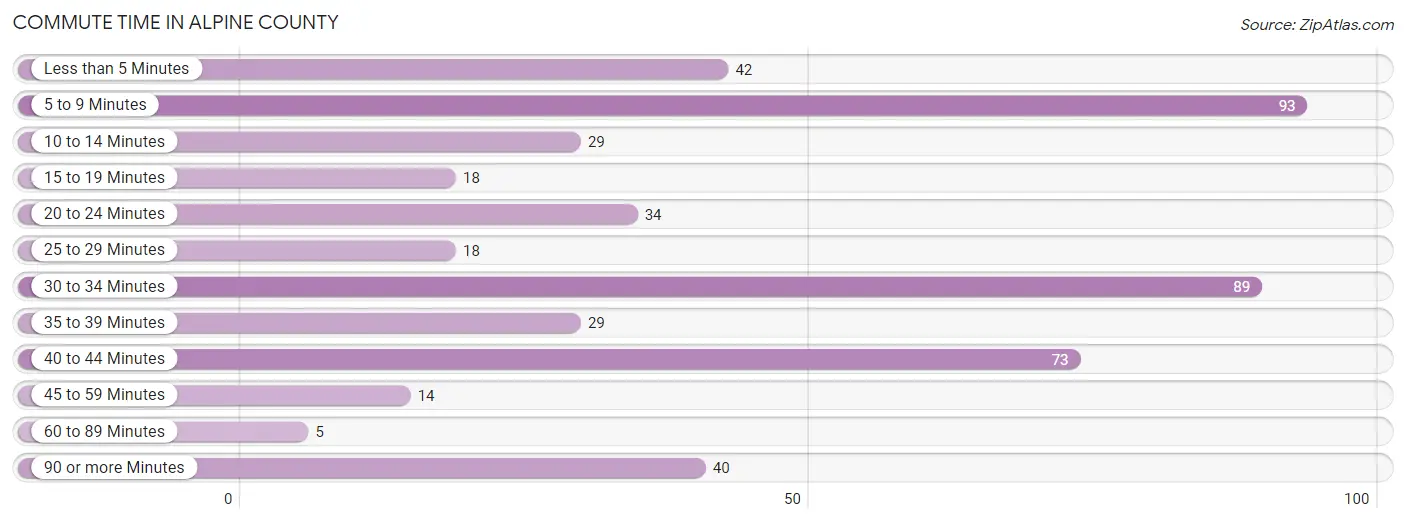
| Commute Time | # Commuters | % Commuters |
| Less than 5 Minutes | 42 | 8.7% |
| 5 to 9 Minutes | 93 | 19.2% |
| 10 to 14 Minutes | 29 | 6.0% |
| 15 to 19 Minutes | 18 | 3.7% |
| 20 to 24 Minutes | 34 | 7.0% |
| 25 to 29 Minutes | 18 | 3.7% |
| 30 to 34 Minutes | 89 | 18.4% |
| 35 to 39 Minutes | 29 | 6.0% |
| 40 to 44 Minutes | 73 | 15.1% |
| 45 to 59 Minutes | 14 | 2.9% |
| 60 to 89 Minutes | 5 | 1.0% |
| 90 or more Minutes | 40 | 8.3% |
Commute Time by Sex in Alpine County
The most common commute times in Alpine County are 30 to 34 minutes (79 commuters, 26.4%) for males and 40 to 44 minutes (70 commuters, 37.8%) for females.
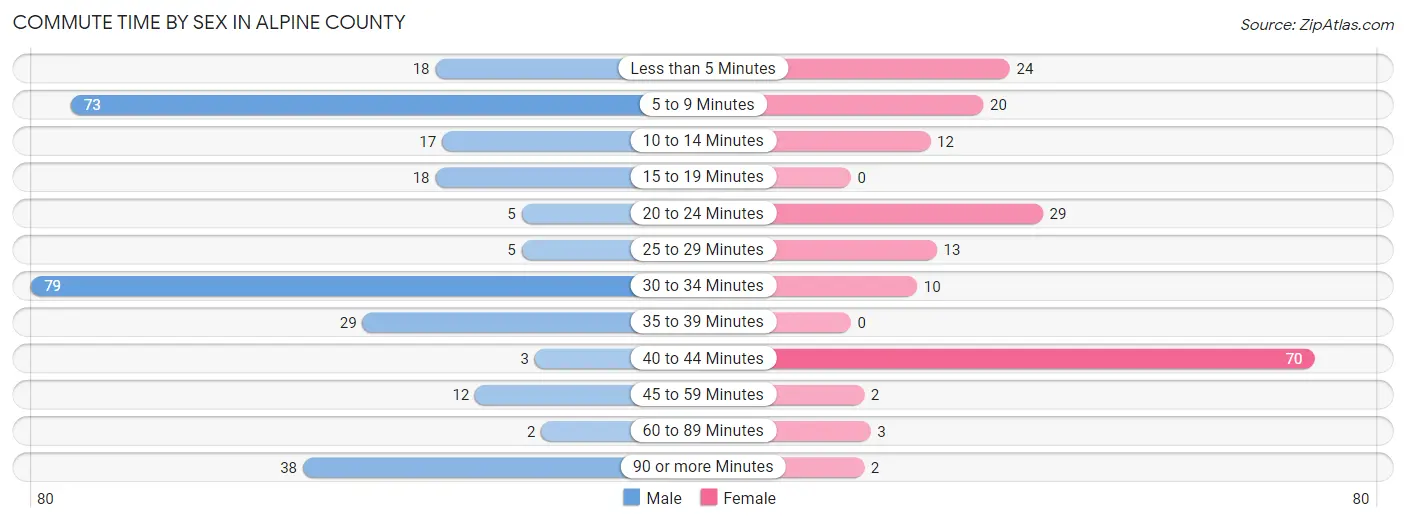
| Commute Time | Male | Female |
| Less than 5 Minutes | 18 (6.0%) | 24 (13.0%) |
| 5 to 9 Minutes | 73 (24.4%) | 20 (10.8%) |
| 10 to 14 Minutes | 17 (5.7%) | 12 (6.5%) |
| 15 to 19 Minutes | 18 (6.0%) | 0 (0.0%) |
| 20 to 24 Minutes | 5 (1.7%) | 29 (15.7%) |
| 25 to 29 Minutes | 5 (1.7%) | 13 (7.0%) |
| 30 to 34 Minutes | 79 (26.4%) | 10 (5.4%) |
| 35 to 39 Minutes | 29 (9.7%) | 0 (0.0%) |
| 40 to 44 Minutes | 3 (1.0%) | 70 (37.8%) |
| 45 to 59 Minutes | 12 (4.0%) | 2 (1.1%) |
| 60 to 89 Minutes | 2 (0.7%) | 3 (1.6%) |
| 90 or more Minutes | 38 (12.7%) | 2 (1.1%) |
Time of Departure to Work by Sex in Alpine County
The most frequent times of departure to work in Alpine County are 7:00 AM to 7:29 AM (152, 50.8%) for males and 7:00 AM to 7:29 AM (63, 34.1%) for females.
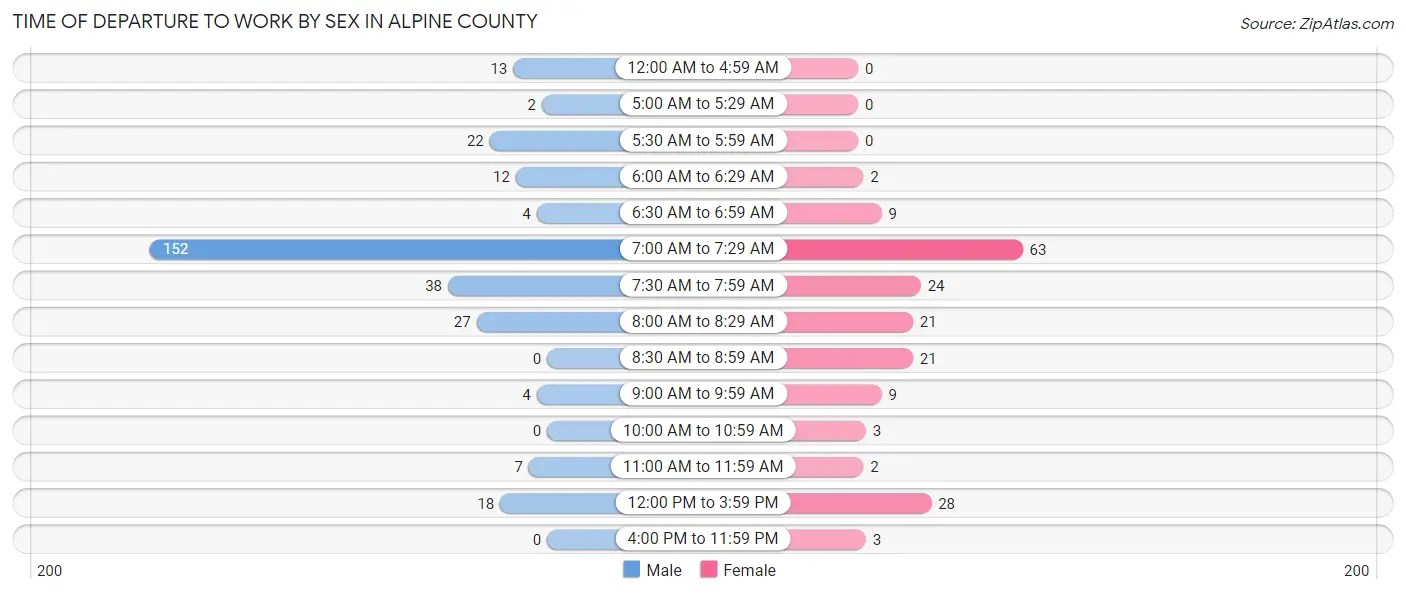
| Time of Departure | Male | Female |
| 12:00 AM to 4:59 AM | 13 (4.3%) | 0 (0.0%) |
| 5:00 AM to 5:29 AM | 2 (0.7%) | 0 (0.0%) |
| 5:30 AM to 5:59 AM | 22 (7.4%) | 0 (0.0%) |
| 6:00 AM to 6:29 AM | 12 (4.0%) | 2 (1.1%) |
| 6:30 AM to 6:59 AM | 4 (1.3%) | 9 (4.9%) |
| 7:00 AM to 7:29 AM | 152 (50.8%) | 63 (34.1%) |
| 7:30 AM to 7:59 AM | 38 (12.7%) | 24 (13.0%) |
| 8:00 AM to 8:29 AM | 27 (9.0%) | 21 (11.4%) |
| 8:30 AM to 8:59 AM | 0 (0.0%) | 21 (11.4%) |
| 9:00 AM to 9:59 AM | 4 (1.3%) | 9 (4.9%) |
| 10:00 AM to 10:59 AM | 0 (0.0%) | 3 (1.6%) |
| 11:00 AM to 11:59 AM | 7 (2.3%) | 2 (1.1%) |
| 12:00 PM to 3:59 PM | 18 (6.0%) | 28 (15.1%) |
| 4:00 PM to 11:59 PM | 0 (0.0%) | 3 (1.6%) |
| Total | 299 (100.0%) | 185 (100.0%) |
Housing Occupancy in Alpine County
Occupancy by Ownership in Alpine County
Of the total 435 dwellings in Alpine County, owner-occupied units account for 360 (82.8%), while renter-occupied units make up 75 (17.2%).
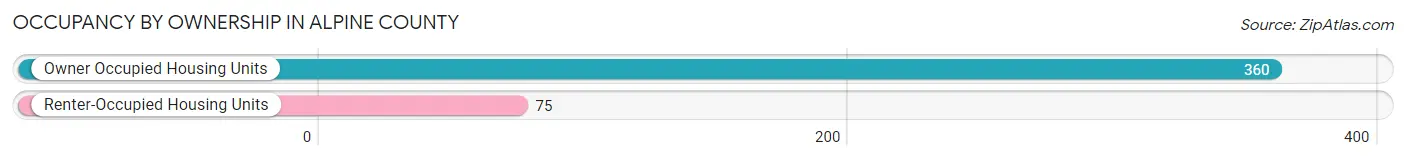
| Occupancy | # Housing Units | % Housing Units |
| Owner Occupied Housing Units | 360 | 82.8% |
| Renter-Occupied Housing Units | 75 | 17.2% |
| Total Occupied Housing Units | 435 | 100.0% |
Occupancy by Household Size in Alpine County
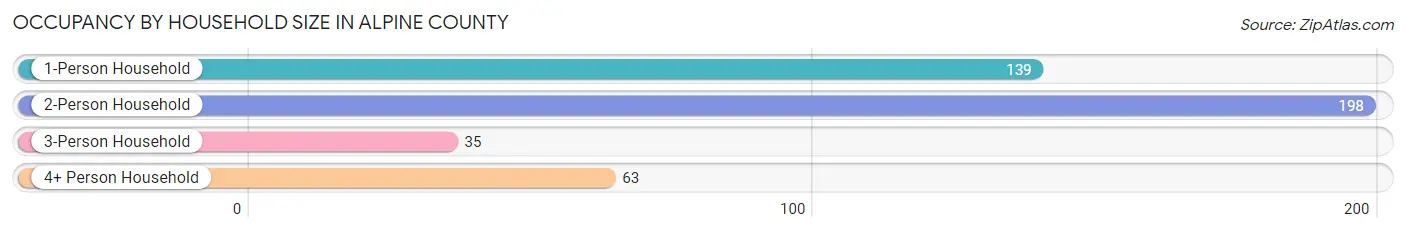
| Household Size | # Housing Units | % Housing Units |
| 1-Person Household | 139 | 32.0% |
| 2-Person Household | 198 | 45.5% |
| 3-Person Household | 35 | 8.1% |
| 4+ Person Household | 63 | 14.5% |
| Total Housing Units | 435 | 100.0% |
Occupancy by Ownership by Household Size in Alpine County
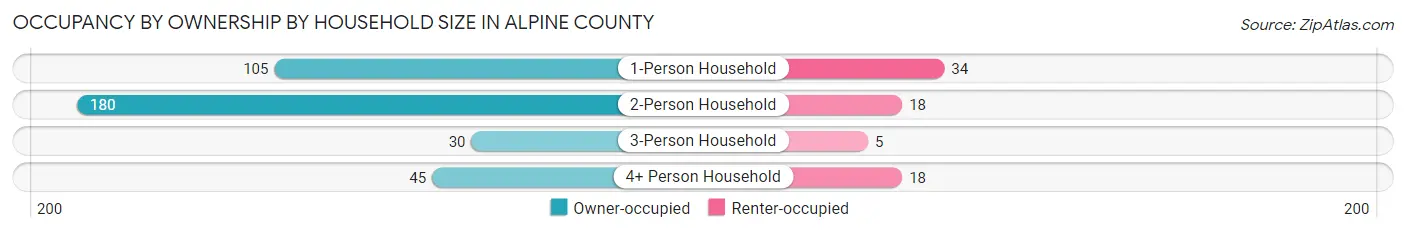
| Household Size | Owner-occupied | Renter-occupied |
| 1-Person Household | 105 (75.5%) | 34 (24.5%) |
| 2-Person Household | 180 (90.9%) | 18 (9.1%) |
| 3-Person Household | 30 (85.7%) | 5 (14.3%) |
| 4+ Person Household | 45 (71.4%) | 18 (28.6%) |
| Total Housing Units | 360 (82.8%) | 75 (17.2%) |
Occupancy by Educational Attainment in Alpine County
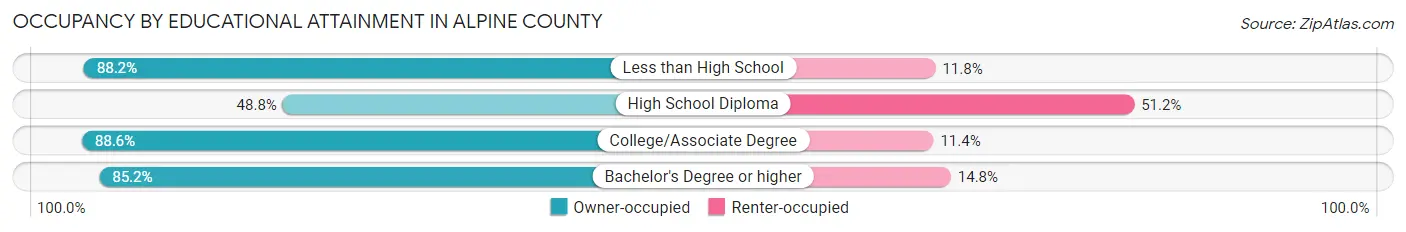
| Household Size | Owner-occupied | Renter-occupied |
| Less than High School | 15 (88.2%) | 2 (11.8%) |
| High School Diploma | 21 (48.8%) | 22 (51.2%) |
| College/Associate Degree | 117 (88.6%) | 15 (11.4%) |
| Bachelor's Degree or higher | 207 (85.2%) | 36 (14.8%) |
Occupancy by Age of Householder in Alpine County
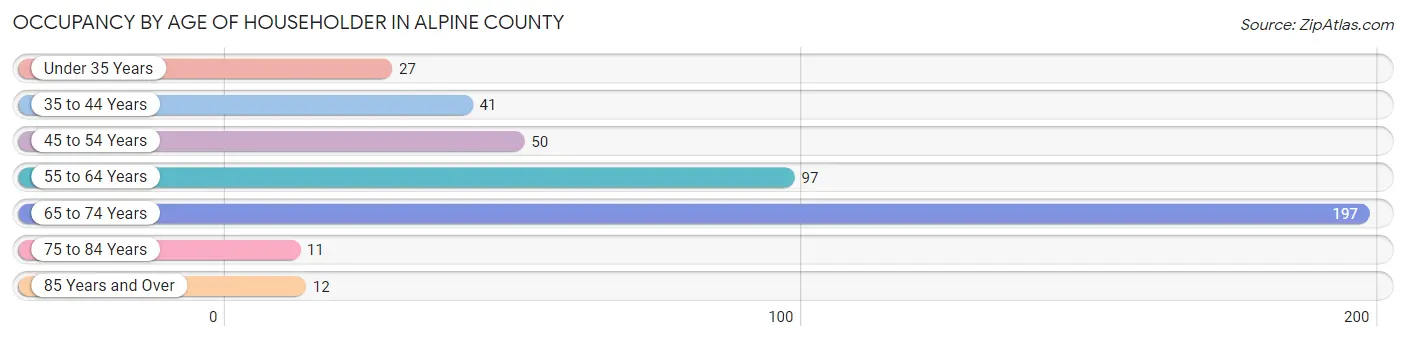
| Age Bracket | # Households | % Households |
| Under 35 Years | 27 | 6.2% |
| 35 to 44 Years | 41 | 9.4% |
| 45 to 54 Years | 50 | 11.5% |
| 55 to 64 Years | 97 | 22.3% |
| 65 to 74 Years | 197 | 45.3% |
| 75 to 84 Years | 11 | 2.5% |
| 85 Years and Over | 12 | 2.8% |
| Total | 435 | 100.0% |
Housing Finances in Alpine County
Median Income by Occupancy in Alpine County
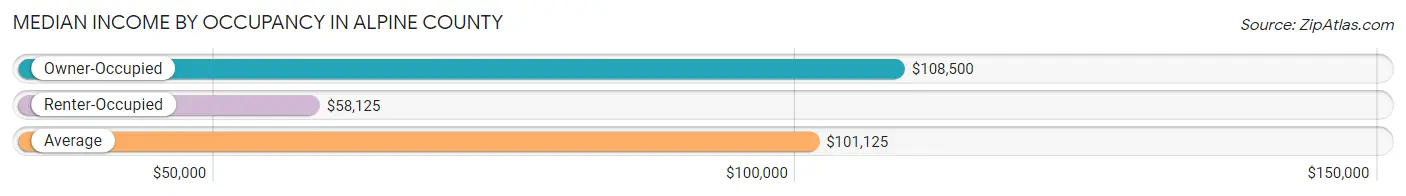
| Occupancy Type | # Households | Median Income |
| Owner-Occupied | 360 (82.8%) | $108,500 |
| Renter-Occupied | 75 (17.2%) | $58,125 |
| Average | 435 (100.0%) | $101,125 |
Occupancy by Householder Income Bracket in Alpine County
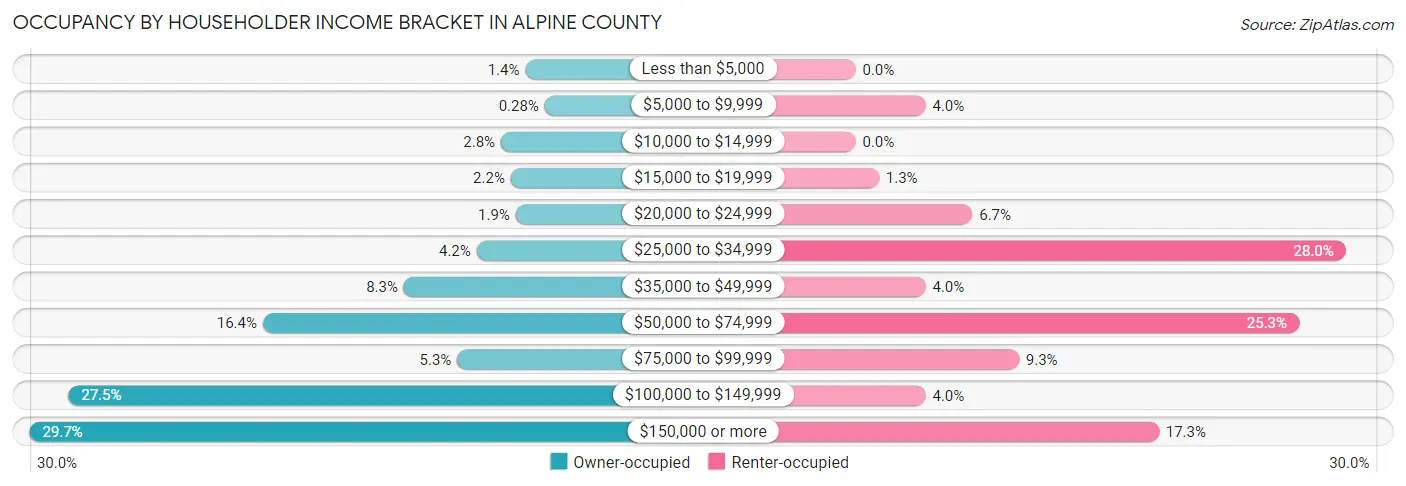
| Income Bracket | Owner-occupied | Renter-occupied |
| Less than $5,000 | 5 (1.4%) | 0 (0.0%) |
| $5,000 to $9,999 | 1 (0.3%) | 3 (4.0%) |
| $10,000 to $14,999 | 10 (2.8%) | 0 (0.0%) |
| $15,000 to $19,999 | 8 (2.2%) | 1 (1.3%) |
| $20,000 to $24,999 | 7 (1.9%) | 5 (6.7%) |
| $25,000 to $34,999 | 15 (4.2%) | 21 (28.0%) |
| $35,000 to $49,999 | 30 (8.3%) | 3 (4.0%) |
| $50,000 to $74,999 | 59 (16.4%) | 19 (25.3%) |
| $75,000 to $99,999 | 19 (5.3%) | 7 (9.3%) |
| $100,000 to $149,999 | 99 (27.5%) | 3 (4.0%) |
| $150,000 or more | 107 (29.7%) | 13 (17.3%) |
| Total | 360 (100.0%) | 75 (100.0%) |
Monthly Housing Cost Tiers in Alpine County
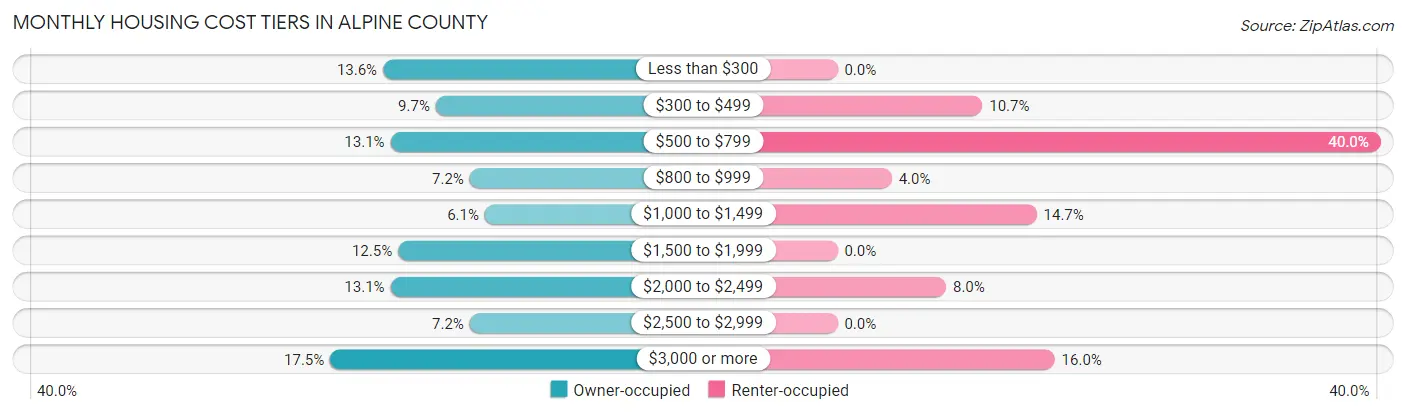
| Monthly Cost | Owner-occupied | Renter-occupied |
| Less than $300 | 49 (13.6%) | 0 (0.0%) |
| $300 to $499 | 35 (9.7%) | 8 (10.7%) |
| $500 to $799 | 47 (13.1%) | 30 (40.0%) |
| $800 to $999 | 26 (7.2%) | 3 (4.0%) |
| $1,000 to $1,499 | 22 (6.1%) | 11 (14.7%) |
| $1,500 to $1,999 | 45 (12.5%) | 0 (0.0%) |
| $2,000 to $2,499 | 47 (13.1%) | 6 (8.0%) |
| $2,500 to $2,999 | 26 (7.2%) | 0 (0.0%) |
| $3,000 or more | 63 (17.5%) | 12 (16.0%) |
| Total | 360 (100.0%) | 75 (100.0%) |
Physical Housing Characteristics in Alpine County
Housing Structures in Alpine County
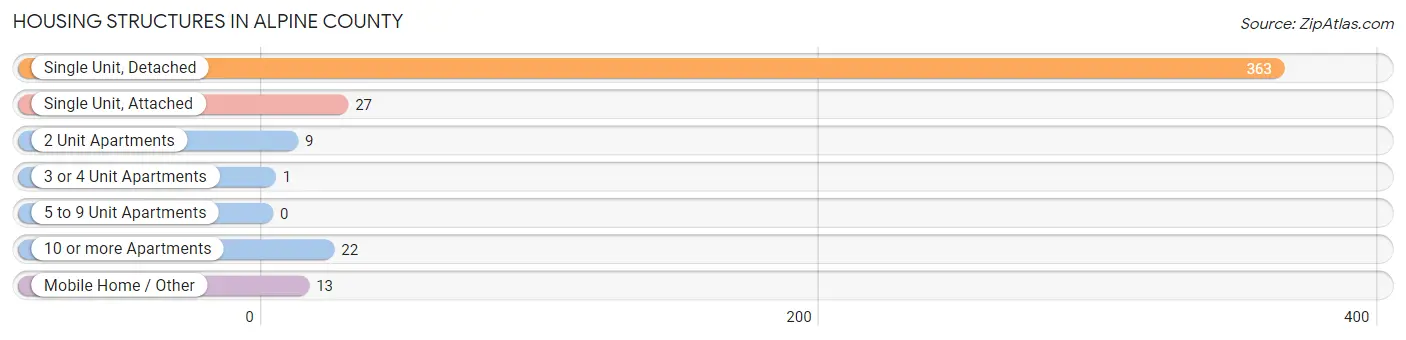
| Structure Type | # Housing Units | % Housing Units |
| Single Unit, Detached | 363 | 83.5% |
| Single Unit, Attached | 27 | 6.2% |
| 2 Unit Apartments | 9 | 2.1% |
| 3 or 4 Unit Apartments | 1 | 0.2% |
| 5 to 9 Unit Apartments | 0 | 0.0% |
| 10 or more Apartments | 22 | 5.1% |
| Mobile Home / Other | 13 | 3.0% |
| Total | 435 | 100.0% |
Housing Structures by Occupancy in Alpine County
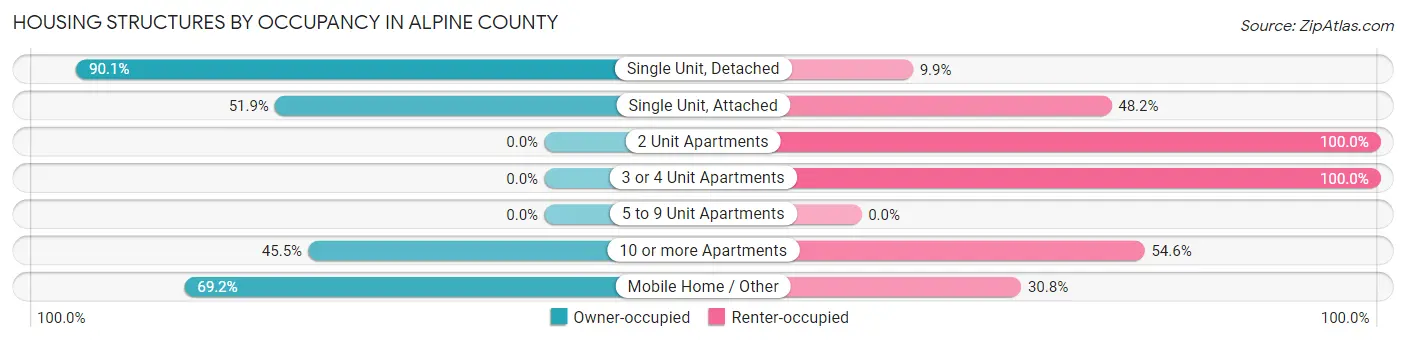
| Structure Type | Owner-occupied | Renter-occupied |
| Single Unit, Detached | 327 (90.1%) | 36 (9.9%) |
| Single Unit, Attached | 14 (51.8%) | 13 (48.1%) |
| 2 Unit Apartments | 0 (0.0%) | 9 (100.0%) |
| 3 or 4 Unit Apartments | 0 (0.0%) | 1 (100.0%) |
| 5 to 9 Unit Apartments | 0 (0.0%) | 0 (0.0%) |
| 10 or more Apartments | 10 (45.5%) | 12 (54.5%) |
| Mobile Home / Other | 9 (69.2%) | 4 (30.8%) |
| Total | 360 (82.8%) | 75 (17.2%) |
Housing Structures by Number of Rooms in Alpine County
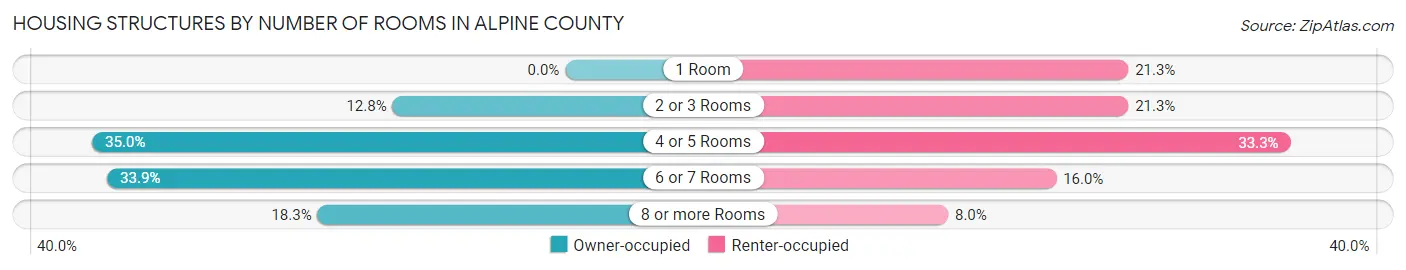
| Number of Rooms | Owner-occupied | Renter-occupied |
| 1 Room | 0 (0.0%) | 16 (21.3%) |
| 2 or 3 Rooms | 46 (12.8%) | 16 (21.3%) |
| 4 or 5 Rooms | 126 (35.0%) | 25 (33.3%) |
| 6 or 7 Rooms | 122 (33.9%) | 12 (16.0%) |
| 8 or more Rooms | 66 (18.3%) | 6 (8.0%) |
| Total | 360 (100.0%) | 75 (100.0%) |
Housing Structure by Heating Type in Alpine County
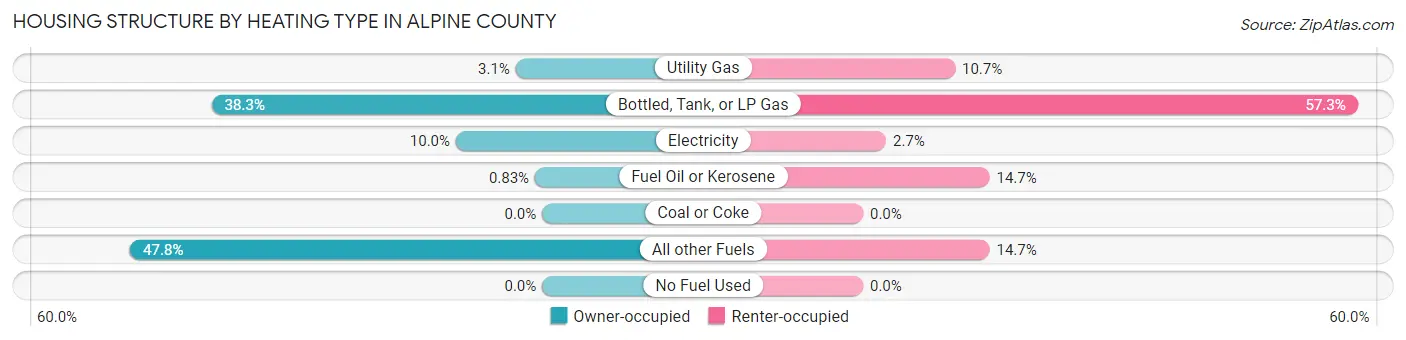
| Heating Type | Owner-occupied | Renter-occupied |
| Utility Gas | 11 (3.1%) | 8 (10.7%) |
| Bottled, Tank, or LP Gas | 138 (38.3%) | 43 (57.3%) |
| Electricity | 36 (10.0%) | 2 (2.7%) |
| Fuel Oil or Kerosene | 3 (0.8%) | 11 (14.7%) |
| Coal or Coke | 0 (0.0%) | 0 (0.0%) |
| All other Fuels | 172 (47.8%) | 11 (14.7%) |
| No Fuel Used | 0 (0.0%) | 0 (0.0%) |
| Total | 360 (100.0%) | 75 (100.0%) |
Household Vehicle Usage in Alpine County
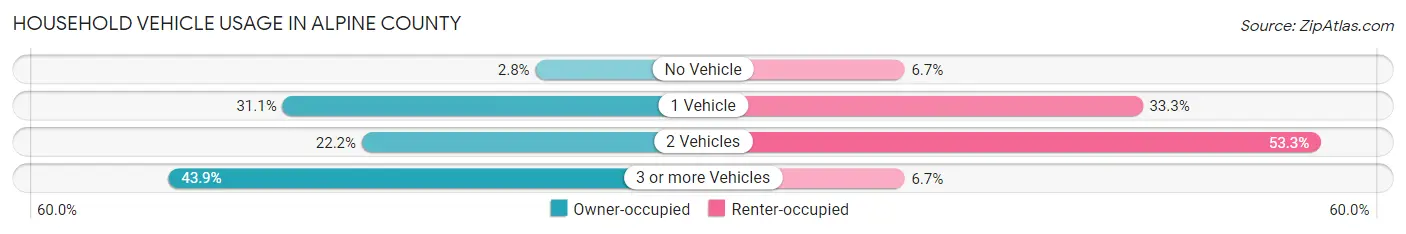
| Vehicles per Household | Owner-occupied | Renter-occupied |
| No Vehicle | 10 (2.8%) | 5 (6.7%) |
| 1 Vehicle | 112 (31.1%) | 25 (33.3%) |
| 2 Vehicles | 80 (22.2%) | 40 (53.3%) |
| 3 or more Vehicles | 158 (43.9%) | 5 (6.7%) |
| Total | 360 (100.0%) | 75 (100.0%) |
Real Estate & Mortgages in Alpine County
Real Estate and Mortgage Overview in Alpine County
| Characteristic | Without Mortgage | With Mortgage |
| Housing Units | 197 | 163 |
| Median Property Value | $418,100 | $518,200 |
| Median Household Income | $59,766 | $79 |
| Monthly Housing Costs | $625 | $52 |
| Real Estate Taxes | $3,278 | $0 |
Property Value by Mortgage Status in Alpine County
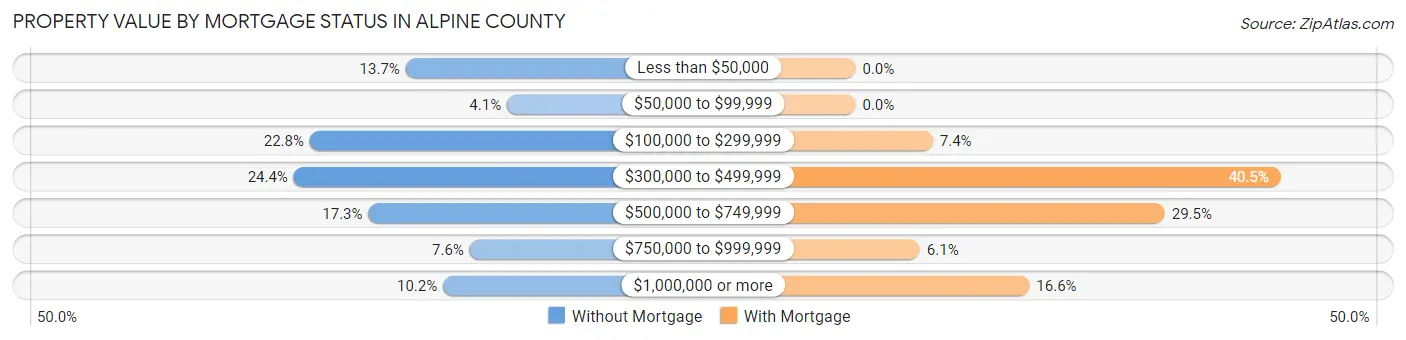
| Property Value | Without Mortgage | With Mortgage |
| Less than $50,000 | 27 (13.7%) | 0 (0.0%) |
| $50,000 to $99,999 | 8 (4.1%) | 0 (0.0%) |
| $100,000 to $299,999 | 45 (22.8%) | 12 (7.4%) |
| $300,000 to $499,999 | 48 (24.4%) | 66 (40.5%) |
| $500,000 to $749,999 | 34 (17.3%) | 48 (29.4%) |
| $750,000 to $999,999 | 15 (7.6%) | 10 (6.1%) |
| $1,000,000 or more | 20 (10.2%) | 27 (16.6%) |
| Total | 197 (100.0%) | 163 (100.0%) |
Household Income by Mortgage Status in Alpine County
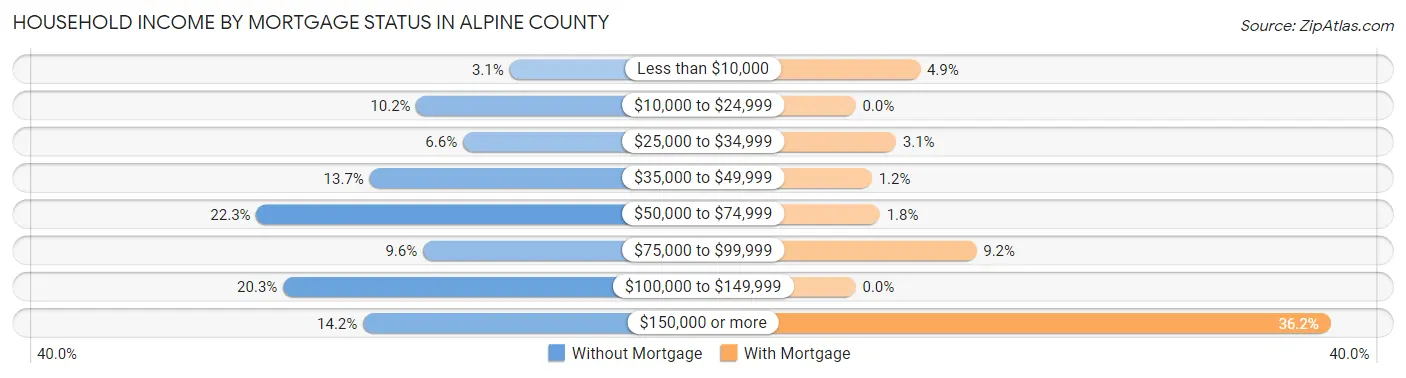
| Household Income | Without Mortgage | With Mortgage |
| Less than $10,000 | 6 (3.0%) | 8 (4.9%) |
| $10,000 to $24,999 | 20 (10.2%) | 0 (0.0%) |
| $25,000 to $34,999 | 13 (6.6%) | 5 (3.1%) |
| $35,000 to $49,999 | 27 (13.7%) | 2 (1.2%) |
| $50,000 to $74,999 | 44 (22.3%) | 3 (1.8%) |
| $75,000 to $99,999 | 19 (9.6%) | 15 (9.2%) |
| $100,000 to $149,999 | 40 (20.3%) | 0 (0.0%) |
| $150,000 or more | 28 (14.2%) | 59 (36.2%) |
| Total | 197 (100.0%) | 163 (100.0%) |
Property Value to Household Income Ratio in Alpine County
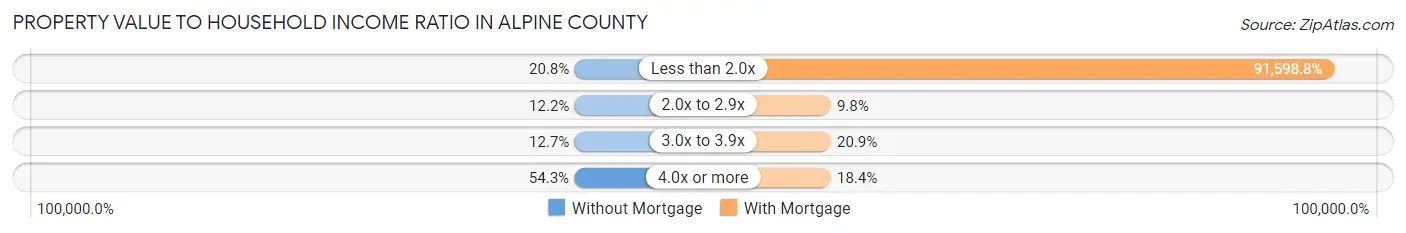
| Value-to-Income Ratio | Without Mortgage | With Mortgage |
| Less than 2.0x | 41 (20.8%) | 149,306 (91,598.8%) |
| 2.0x to 2.9x | 24 (12.2%) | 16 (9.8%) |
| 3.0x to 3.9x | 25 (12.7%) | 34 (20.9%) |
| 4.0x or more | 107 (54.3%) | 30 (18.4%) |
| Total | 197 (100.0%) | 163 (100.0%) |
Real Estate Taxes by Mortgage Status in Alpine County
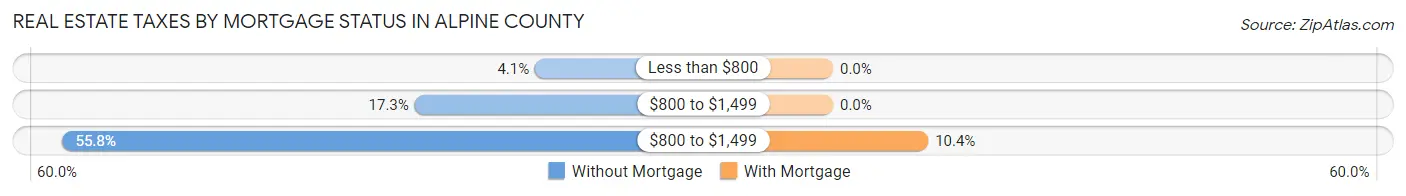
| Property Taxes | Without Mortgage | With Mortgage |
| Less than $800 | 8 (4.1%) | 0 (0.0%) |
| $800 to $1,499 | 34 (17.3%) | 0 (0.0%) |
| $800 to $1,499 | 110 (55.8%) | 17 (10.4%) |
| Total | 197 (100.0%) | 163 (100.0%) |
Health & Disability in Alpine County
Health Insurance Coverage by Age in Alpine County
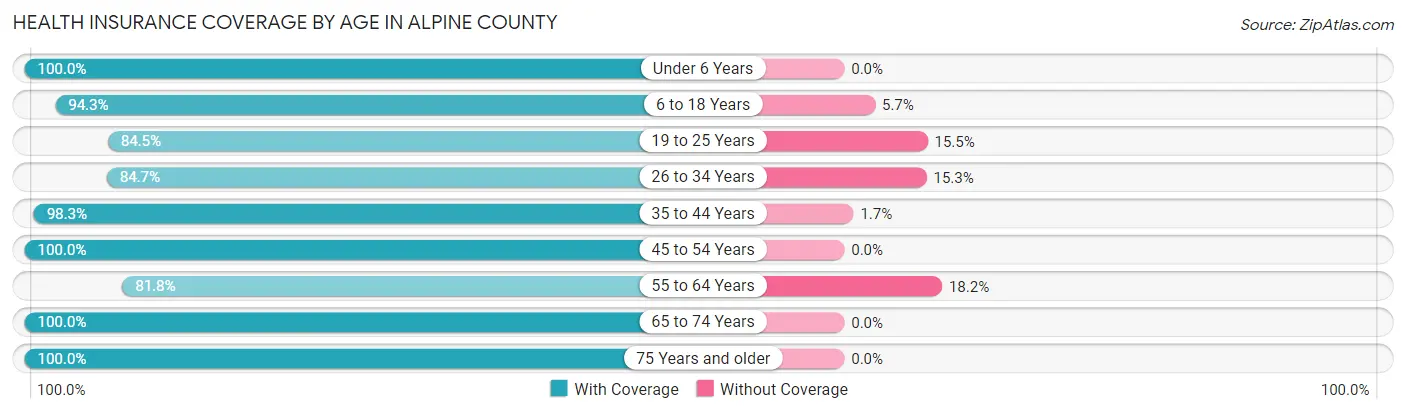
| Age Bracket | With Coverage | Without Coverage |
| Under 6 Years | 145 (100.0%) | 0 (0.0%) |
| 6 to 18 Years | 247 (94.3%) | 15 (5.7%) |
| 19 to 25 Years | 49 (84.5%) | 9 (15.5%) |
| 26 to 34 Years | 116 (84.7%) | 21 (15.3%) |
| 35 to 44 Years | 172 (98.3%) | 3 (1.7%) |
| 45 to 54 Years | 83 (100.0%) | 0 (0.0%) |
| 55 to 64 Years | 220 (81.8%) | 49 (18.2%) |
| 65 to 74 Years | 347 (100.0%) | 0 (0.0%) |
| 75 Years and older | 39 (100.0%) | 0 (0.0%) |
| Total | 1,418 (93.6%) | 97 (6.4%) |
Health Insurance Coverage by Citizenship Status in Alpine County
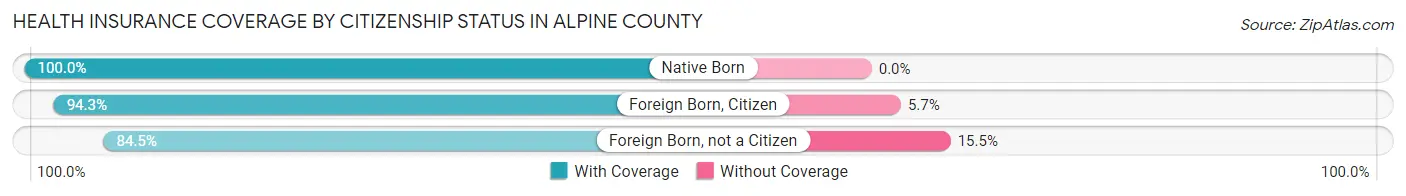
| Citizenship Status | With Coverage | Without Coverage |
| Native Born | 145 (100.0%) | 0 (0.0%) |
| Foreign Born, Citizen | 247 (94.3%) | 15 (5.7%) |
| Foreign Born, not a Citizen | 49 (84.5%) | 9 (15.5%) |
Health Insurance Coverage by Household Income in Alpine County
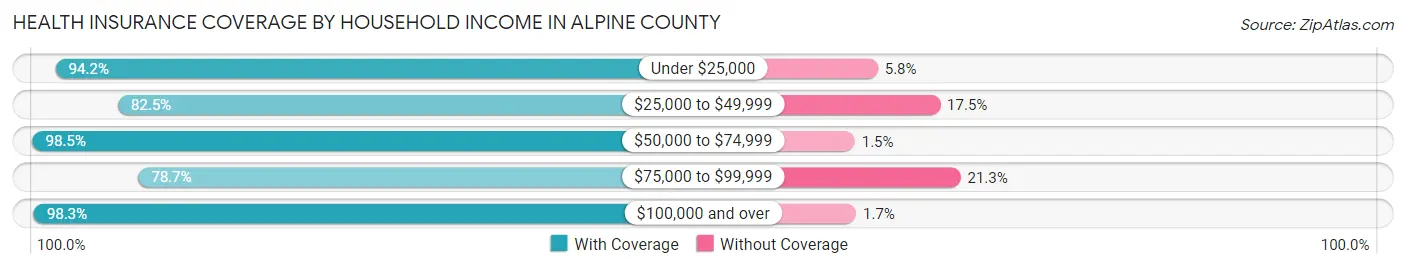
| Household Income | With Coverage | Without Coverage |
| Under $25,000 | 81 (94.2%) | 5 (5.8%) |
| $25,000 to $49,999 | 184 (82.5%) | 39 (17.5%) |
| $50,000 to $74,999 | 263 (98.5%) | 4 (1.5%) |
| $75,000 to $99,999 | 96 (78.7%) | 26 (21.3%) |
| $100,000 and over | 735 (98.3%) | 13 (1.7%) |
Public vs Private Health Insurance Coverage by Age in Alpine County
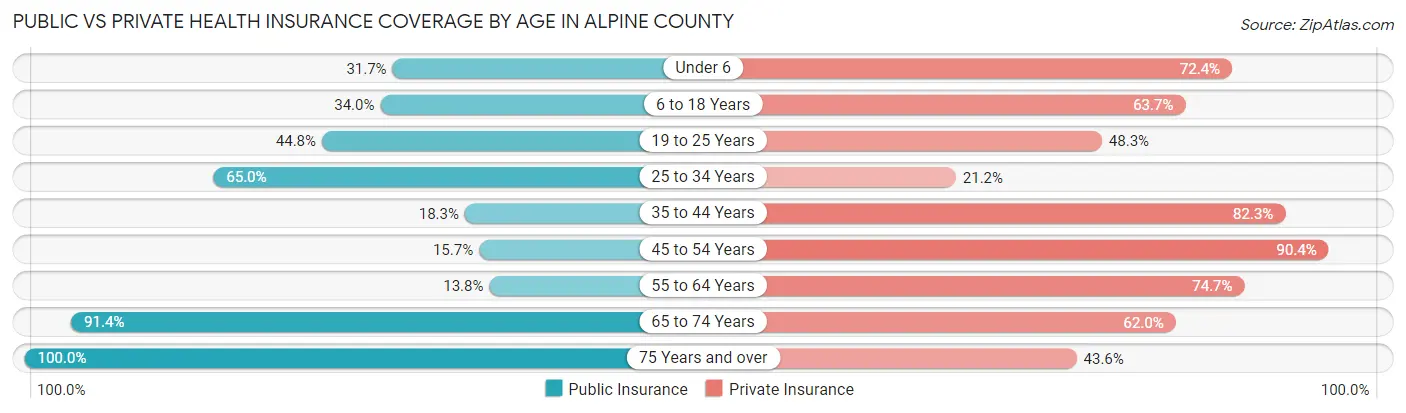
| Age Bracket | Public Insurance | Private Insurance |
| Under 6 | 46 (31.7%) | 105 (72.4%) |
| 6 to 18 Years | 89 (34.0%) | 167 (63.7%) |
| 19 to 25 Years | 26 (44.8%) | 28 (48.3%) |
| 25 to 34 Years | 89 (65.0%) | 29 (21.2%) |
| 35 to 44 Years | 32 (18.3%) | 144 (82.3%) |
| 45 to 54 Years | 13 (15.7%) | 75 (90.4%) |
| 55 to 64 Years | 37 (13.8%) | 201 (74.7%) |
| 65 to 74 Years | 317 (91.3%) | 215 (62.0%) |
| 75 Years and over | 39 (100.0%) | 17 (43.6%) |
| Total | 688 (45.4%) | 981 (64.7%) |
Disability Status by Sex by Age in Alpine County
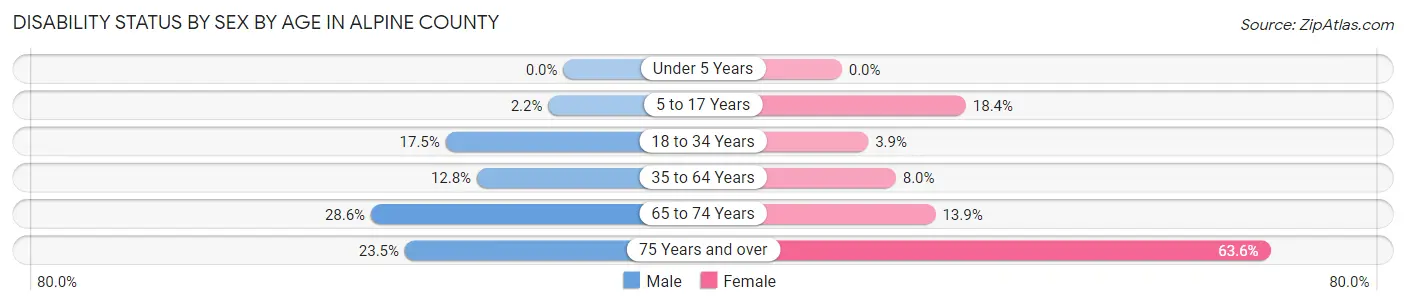
| Age Bracket | Male | Female |
| Under 5 Years | 0 (0.0%) | 0 (0.0%) |
| 5 to 17 Years | 3 (2.2%) | 14 (18.4%) |
| 18 to 34 Years | 36 (17.5%) | 2 (3.9%) |
| 35 to 64 Years | 34 (12.8%) | 21 (8.0%) |
| 65 to 74 Years | 56 (28.6%) | 21 (13.9%) |
| 75 Years and over | 4 (23.5%) | 14 (63.6%) |
Disability Class by Sex by Age in Alpine County
Disability Class: Hearing Difficulty
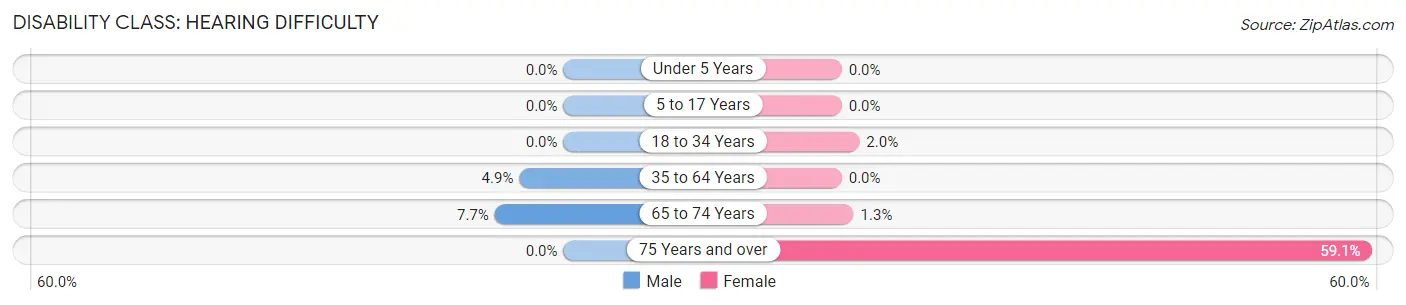
| Age Bracket | Male | Female |
| Under 5 Years | 0 (0.0%) | 0 (0.0%) |
| 5 to 17 Years | 0 (0.0%) | 0 (0.0%) |
| 18 to 34 Years | 0 (0.0%) | 1 (2.0%) |
| 35 to 64 Years | 13 (4.9%) | 0 (0.0%) |
| 65 to 74 Years | 15 (7.6%) | 2 (1.3%) |
| 75 Years and over | 0 (0.0%) | 13 (59.1%) |
Disability Class: Vision Difficulty
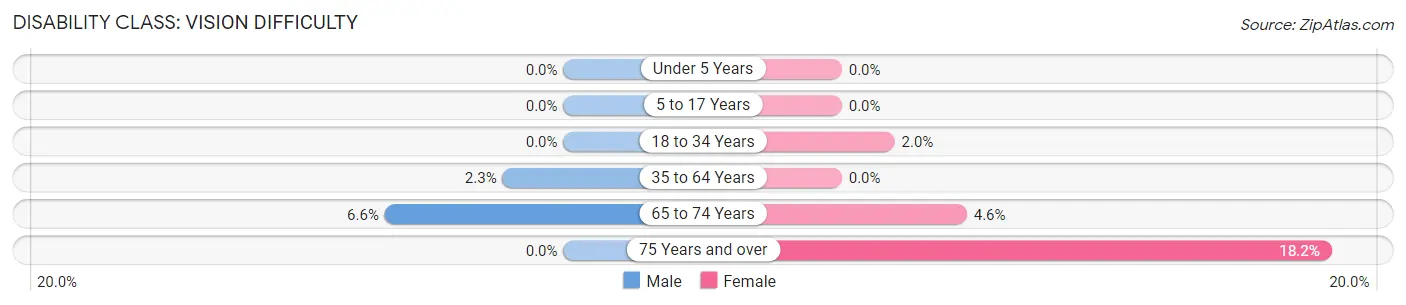
| Age Bracket | Male | Female |
| Under 5 Years | 0 (0.0%) | 0 (0.0%) |
| 5 to 17 Years | 0 (0.0%) | 0 (0.0%) |
| 18 to 34 Years | 0 (0.0%) | 1 (2.0%) |
| 35 to 64 Years | 6 (2.3%) | 0 (0.0%) |
| 65 to 74 Years | 13 (6.6%) | 7 (4.6%) |
| 75 Years and over | 0 (0.0%) | 4 (18.2%) |
Disability Class: Cognitive Difficulty
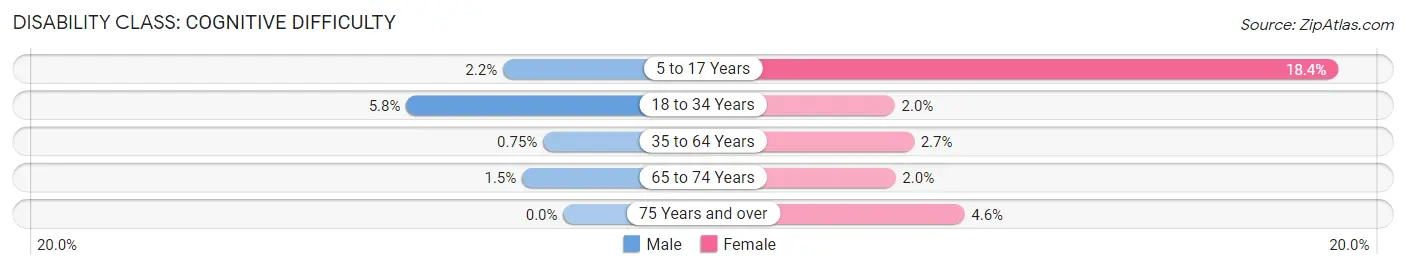
| Age Bracket | Male | Female |
| 5 to 17 Years | 3 (2.2%) | 14 (18.4%) |
| 18 to 34 Years | 12 (5.8%) | 1 (2.0%) |
| 35 to 64 Years | 2 (0.7%) | 7 (2.7%) |
| 65 to 74 Years | 3 (1.5%) | 3 (2.0%) |
| 75 Years and over | 0 (0.0%) | 1 (4.5%) |
Disability Class: Ambulatory Difficulty
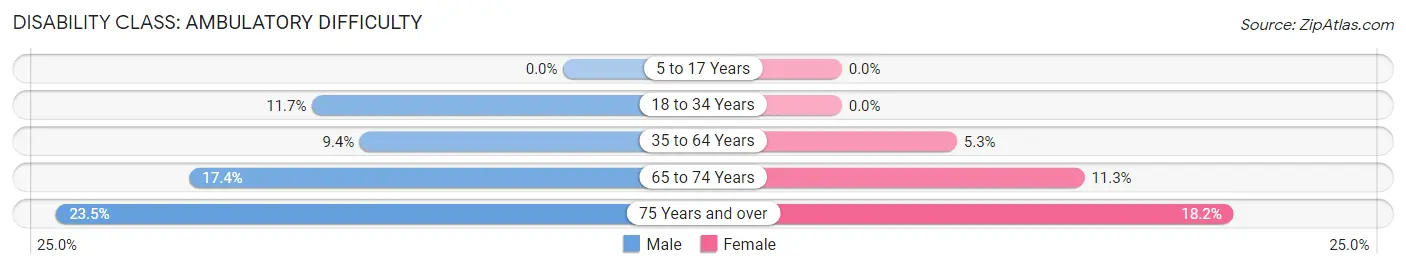
| Age Bracket | Male | Female |
| 5 to 17 Years | 0 (0.0%) | 0 (0.0%) |
| 18 to 34 Years | 24 (11.7%) | 0 (0.0%) |
| 35 to 64 Years | 25 (9.4%) | 14 (5.3%) |
| 65 to 74 Years | 34 (17.3%) | 17 (11.3%) |
| 75 Years and over | 4 (23.5%) | 4 (18.2%) |
Disability Class: Self-Care Difficulty
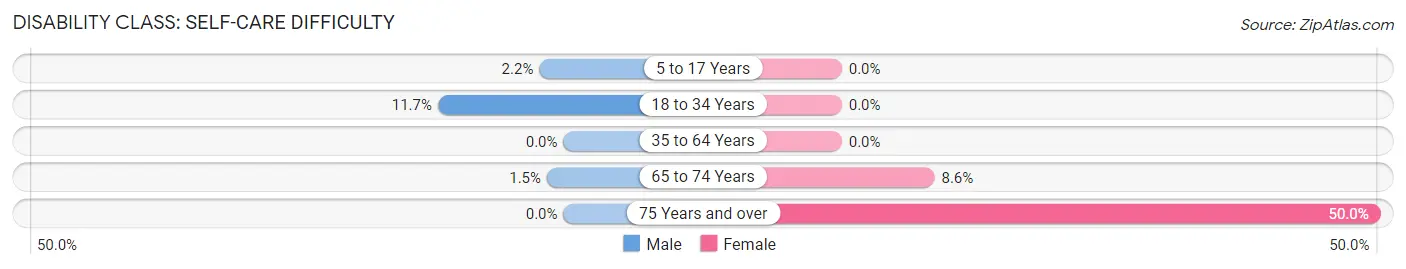
| Age Bracket | Male | Female |
| 5 to 17 Years | 3 (2.2%) | 0 (0.0%) |
| 18 to 34 Years | 24 (11.7%) | 0 (0.0%) |
| 35 to 64 Years | 0 (0.0%) | 0 (0.0%) |
| 65 to 74 Years | 3 (1.5%) | 13 (8.6%) |
| 75 Years and over | 0 (0.0%) | 11 (50.0%) |
Technology Access in Alpine County
Computing Device Access in Alpine County
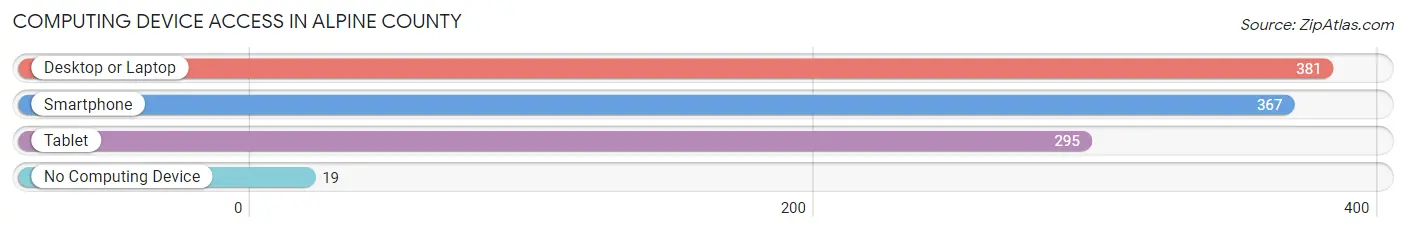
| Device Type | # Households | % Households |
| Desktop or Laptop | 381 | 87.6% |
| Smartphone | 367 | 84.4% |
| Tablet | 295 | 67.8% |
| No Computing Device | 19 | 4.4% |
| Total | 435 | 100.0% |
Internet Access in Alpine County
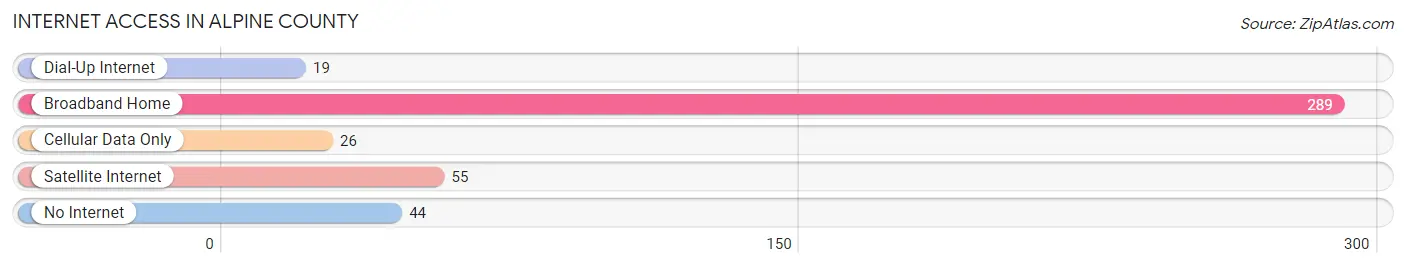
| Internet Type | # Households | % Households |
| Dial-Up Internet | 19 | 4.4% |
| Broadband Home | 289 | 66.4% |
| Cellular Data Only | 26 | 6.0% |
| Satellite Internet | 55 | 12.6% |
| No Internet | 44 | 10.1% |
| Total | 435 | 100.0% |
Alpine County Summary
Alpine County, California is a small county located in the Sierra Nevada mountain range in the eastern part of the state. It is bordered by El Dorado County to the north, Amador County to the east, Calaveras County to the south, and Mono County to the west. The county seat is Markleeville, and the population was 1,208 at the 2010 census.
History
Alpine County was formed in 1864 from parts of Amador, Calaveras, and El Dorado counties. It was named for the alpine terrain of the Sierra Nevada mountain range. The county was originally home to the Washoe people, who were displaced by the influx of miners and settlers in the mid-1800s.
The first permanent settlement in the county was established in 1851, when a group of miners from the nearby town of Placerville established a camp in the area. The camp was named Markleeville after John Marklee, one of the miners. The town quickly grew, and by 1864 it had become the county seat.
The county was a major producer of gold during the California Gold Rush, and the population peaked at around 10,000 in the late 1800s. The population declined after the gold rush, and by the 1930s it had dropped to just over 1,000.
Geography
Alpine County covers an area of 738 square miles, making it the smallest county in California by area. It is located in the Sierra Nevada mountain range, and is bordered by El Dorado County to the north, Amador County to the east, Calaveras County to the south, and Mono County to the west.
The county is home to several mountain peaks, including the highest point in the county, Freel Peak, which has an elevation of 10,881 feet. The county also contains several lakes, including Lake Tahoe, which is located on the border with Nevada.
The county is mostly mountainous, with a few valleys and meadows. The climate is generally cool and dry, with hot summers and cold winters.
Economy
The economy of Alpine County is largely based on tourism and recreation. The county is home to several ski resorts, including Kirkwood Mountain Resort and Heavenly Mountain Resort. The county also has several campgrounds and other recreational areas, including the Toiyabe National Forest and the Carson-Iceberg Wilderness.
The county also has a small agricultural sector with some cattle ranching and hay production
Demographics
As of the 2010 census, the population of Alpine County was 1,208, with a population density of 1.6 people per square mile. The racial makeup of the county was 94.3% White, 0.7% Native American, 0.3% Asian, 0.2% Black or African American, 0.1% Pacific Islander, and 4.4% from other races.
The median household income was $45,938, and the median family income was $50,938. The per capita income was $25,938. About 11.2% of the population was below the poverty line.
The largest employers in the county are the ski resorts, which employ about 1,000 people. Other major employers include the county government, the school district, and the local hospital.
Common Questions
What is Per Capita Income in Alpine County?
Per Capita income in Alpine County is $55,425.
What is the Median Family Income in Alpine County?
Median Family Income in Alpine County is $114,625.
What is the Median Household income in Alpine County?
Median Household Income in Alpine County is $101,125.
What is Income or Wage Gap in Alpine County?
Income or Wage Gap in Alpine County is 18.8%.
Women in Alpine County earn 81.2 cents for every dollar earned by a man.
What is Inequality or Gini Index in Alpine County?
Inequality or Gini Index in Alpine County is 0.57.
What is the Total Population of Alpine County?
Total Population of Alpine County is 1,515.
What is the Total Male Population of Alpine County?
Total Male Population of Alpine County is 882.
What is the Total Female Population of Alpine County?
Total Female Population of Alpine County is 633.
What is the Ratio of Males per 100 Females in Alpine County?
There are 139.34 Males per 100 Females in Alpine County.
What is the Ratio of Females per 100 Males in Alpine County?
There are 71.77 Females per 100 Males in Alpine County.
What is the Median Population Age in Alpine County?
Median Population Age in Alpine County is 43.0 Years.
What is the Average Family Size in Alpine County
Average Family Size in Alpine County is 4.4 People.
What is the Average Household Size in Alpine County
Average Household Size in Alpine County is 3.3 People.
How Large is the Labor Force in Alpine County?
There are 679 People in the Labor Forcein in Alpine County.
What is the Percentage of People in the Labor Force in Alpine County?
55.8% of People are in the Labor Force in Alpine County.
What is the Unemployment Rate in Alpine County?
Unemployment Rate in Alpine County is 4.9%.