Highspire borough, PA Map & Demographics
Highspire borough Overview
$26,747
PER CAPITA INCOME
$60,288
AVG FAMILY INCOME
$50,150
AVG HOUSEHOLD INCOME
34.7%
WAGE / INCOME GAP [ % ]
65.3¢/ $1
WAGE / INCOME GAP [ $ ]
0.33
INEQUALITY / GINI INDEX
2,709
TOTAL POPULATION
1,386
MALE POPULATION
1,323
FEMALE POPULATION
104.76
MALES / 100 FEMALES
95.45
FEMALES / 100 MALES
36.3
MEDIAN AGE
2.9
AVG FAMILY SIZE
2.1
AVG HOUSEHOLD SIZE
1,385
LABOR FORCE [ PEOPLE ]
63.9%
PERCENT IN LABOR FORCE
5.8%
UNEMPLOYMENT RATE
Income in Highspire borough
Income Overview in Highspire borough
Per Capita Income in Highspire borough is $26,747, while median incomes of families and households are $60,288 and $50,150 respectively.
| Characteristic | Number | Measure |
| Per Capita Income | 2,709 | $26,747 |
| Median Family Income | 634 | $60,288 |
| Mean Family Income | 634 | $68,020 |
| Median Household Income | 1,281 | $50,150 |
| Mean Household Income | 1,281 | $57,546 |
| Income Deficit | 634 | $0 |
| Wage / Income Gap (%) | 2,709 | 34.74% |
| Wage / Income Gap ($) | 2,709 | 65.26¢ per $1 |
| Gini / Inequality Index | 2,709 | 0.33 |
Earnings by Sex in Highspire borough
Average Earnings in Highspire borough are $35,984, $46,153 for men and $30,121 for women, a difference of 34.7%.
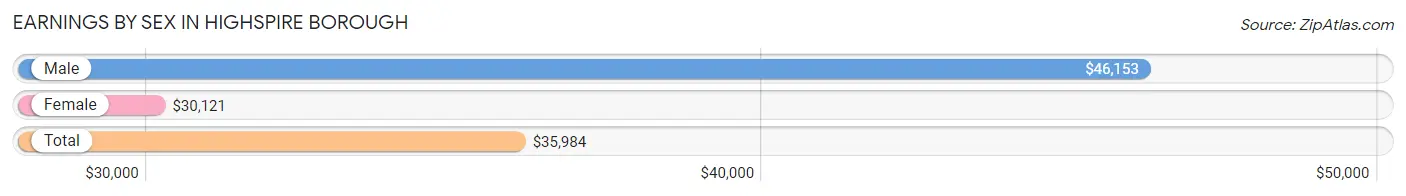
| Sex | Number | Average Earnings |
| Male | 827 (58.2%) | $46,153 |
| Female | 594 (41.8%) | $30,121 |
| Total | 1,421 (100.0%) | $35,984 |
Earnings by Sex by Income Bracket in Highspire borough
The most common earnings brackets in Highspire borough are $45,000 to $49,999 for men (125 | 15.1%) and $30,000 to $34,999 for women (103 | 17.3%).
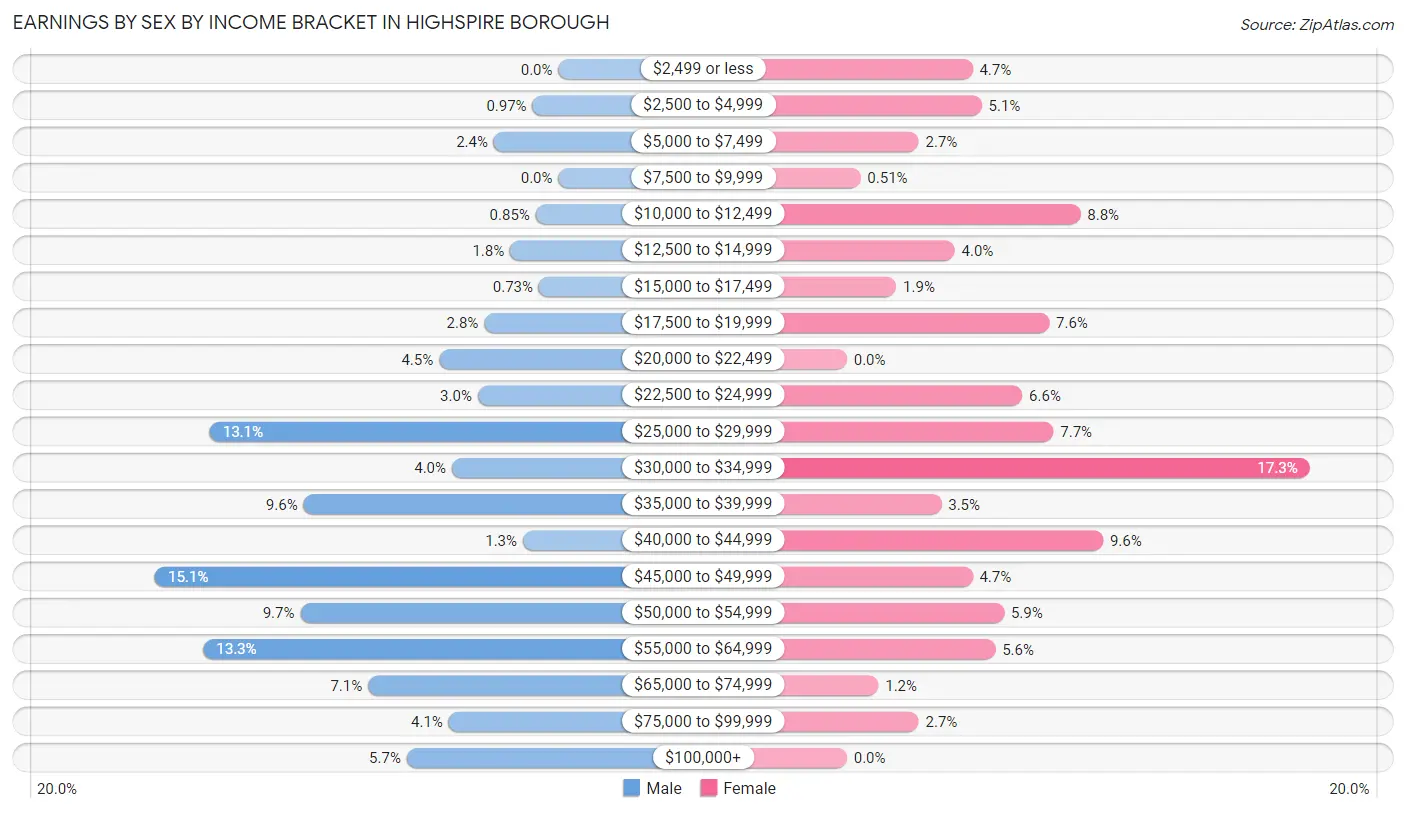
| Income | Male | Female |
| $2,499 or less | 0 (0.0%) | 28 (4.7%) |
| $2,500 to $4,999 | 8 (1.0%) | 30 (5.1%) |
| $5,000 to $7,499 | 20 (2.4%) | 16 (2.7%) |
| $7,500 to $9,999 | 0 (0.0%) | 3 (0.5%) |
| $10,000 to $12,499 | 7 (0.9%) | 52 (8.7%) |
| $12,500 to $14,999 | 15 (1.8%) | 24 (4.0%) |
| $15,000 to $17,499 | 6 (0.7%) | 11 (1.8%) |
| $17,500 to $19,999 | 23 (2.8%) | 45 (7.6%) |
| $20,000 to $22,499 | 37 (4.5%) | 0 (0.0%) |
| $22,500 to $24,999 | 25 (3.0%) | 39 (6.6%) |
| $25,000 to $29,999 | 108 (13.1%) | 46 (7.7%) |
| $30,000 to $34,999 | 33 (4.0%) | 103 (17.3%) |
| $35,000 to $39,999 | 79 (9.6%) | 21 (3.5%) |
| $40,000 to $44,999 | 11 (1.3%) | 57 (9.6%) |
| $45,000 to $49,999 | 125 (15.1%) | 28 (4.7%) |
| $50,000 to $54,999 | 80 (9.7%) | 35 (5.9%) |
| $55,000 to $64,999 | 110 (13.3%) | 33 (5.6%) |
| $65,000 to $74,999 | 59 (7.1%) | 7 (1.2%) |
| $75,000 to $99,999 | 34 (4.1%) | 16 (2.7%) |
| $100,000+ | 47 (5.7%) | 0 (0.0%) |
| Total | 827 (100.0%) | 594 (100.0%) |
Earnings by Sex by Educational Attainment in Highspire borough
Average earnings in Highspire borough are $47,140 for men and $34,604 for women, a difference of 26.6%. Men with an educational attainment of bachelor's degree enjoy the highest average annual earnings of $55,536, while those with high school diploma education earn the least with $36,689. Women with an educational attainment of college or associate's degree earn the most with the average annual earnings of $34,728, while those with bachelor's degree education have the smallest earnings of $31,000.
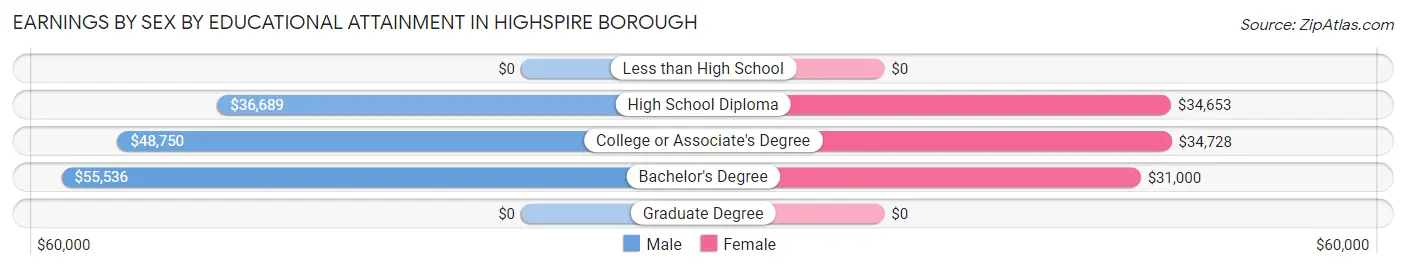
| Educational Attainment | Male Income | Female Income |
| Less than High School | - | - |
| High School Diploma | $36,689 | $34,653 |
| College or Associate's Degree | $48,750 | $34,728 |
| Bachelor's Degree | $55,536 | $31,000 |
| Graduate Degree | - | - |
| Total | $47,140 | $34,604 |
Family Income in Highspire borough
Family Income Brackets in Highspire borough
According to the Highspire borough family income data, there are 171 families falling into the $35,000 to $49,999 income range, which is the most common income bracket and makes up 27.0% of all families.
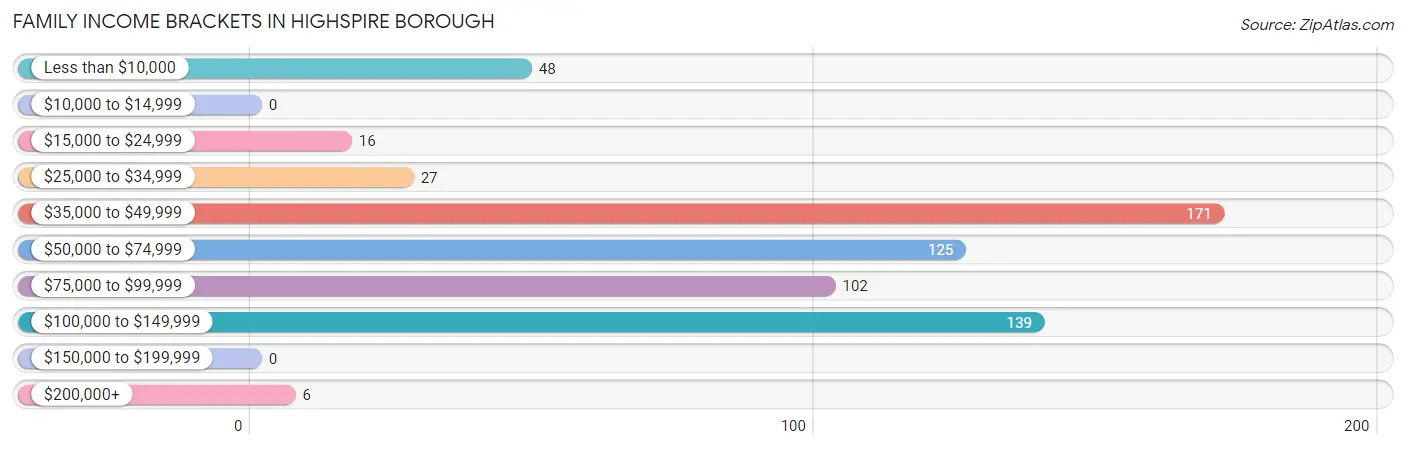
| Income Bracket | # Families | % Families |
| Less than $10,000 | 48 | 7.6% |
| $10,000 to $14,999 | 0 | 0.0% |
| $15,000 to $24,999 | 16 | 2.5% |
| $25,000 to $34,999 | 27 | 4.3% |
| $35,000 to $49,999 | 171 | 27.0% |
| $50,000 to $74,999 | 125 | 19.7% |
| $75,000 to $99,999 | 102 | 16.1% |
| $100,000 to $149,999 | 139 | 21.9% |
| $150,000 to $199,999 | 0 | 0.0% |
| $200,000+ | 6 | 0.9% |
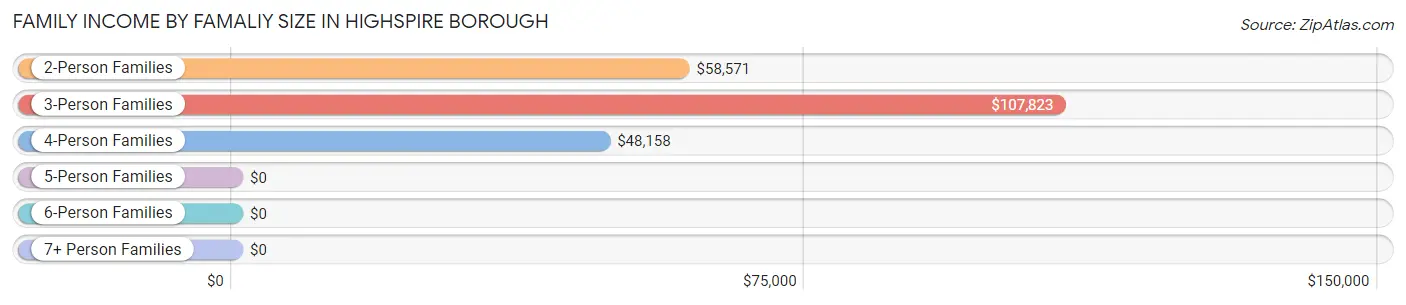
Family Income by Famaliy Size in Highspire borough
3-person families (54 | 8.5%) account for the highest median family income in Highspire borough with $107,823 per family, while 3-person families (54 | 8.5%) have the highest median income of $35,941 per family member.
| Income Bracket | # Families | Median Income |
| 2-Person Families | 394 (62.2%) | $58,571 |
| 3-Person Families | 54 (8.5%) | $107,823 |
| 4-Person Families | 126 (19.9%) | $48,158 |
| 5-Person Families | 15 (2.4%) | $0 |
| 6-Person Families | 0 (0.0%) | $0 |
| 7+ Person Families | 45 (7.1%) | $0 |
| Total | 634 (100.0%) | $60,288 |
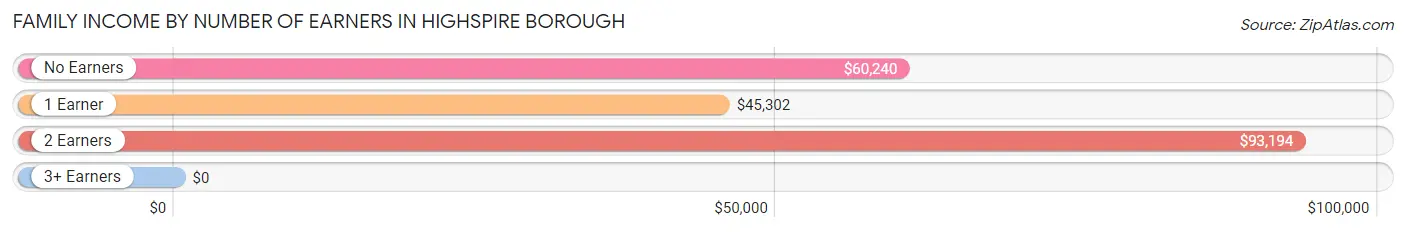
Family Income by Number of Earners in Highspire borough
| Number of Earners | # Families | Median Income |
| No Earners | 107 (16.9%) | $60,240 |
| 1 Earner | 231 (36.4%) | $45,302 |
| 2 Earners | 289 (45.6%) | $93,194 |
| 3+ Earners | 7 (1.1%) | $0 |
| Total | 634 (100.0%) | $60,288 |
Household Income in Highspire borough
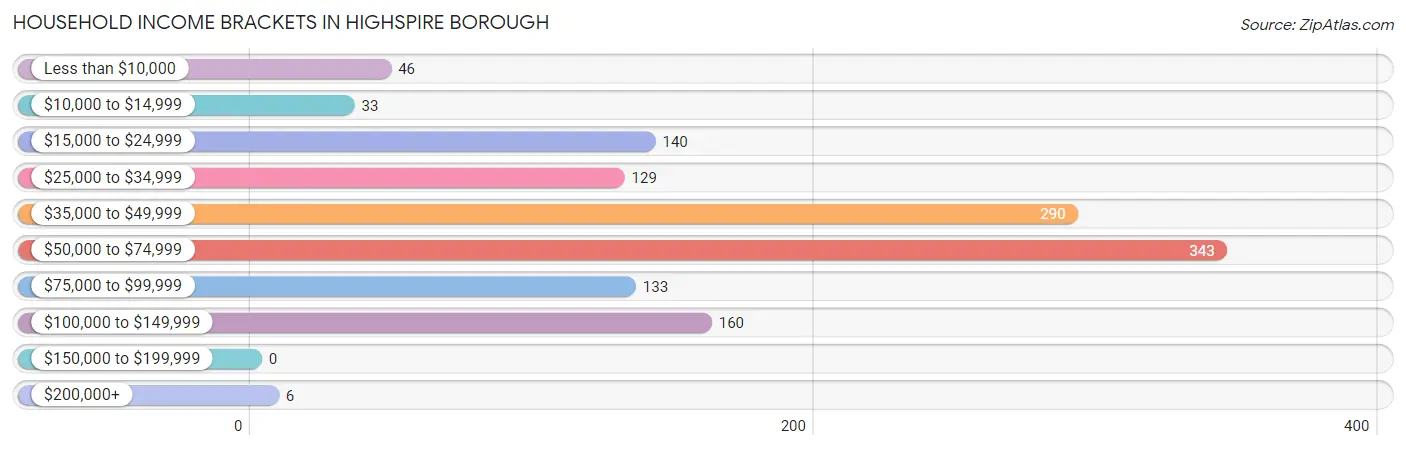
Household Income Brackets in Highspire borough
With 343 households falling in the category, the $50,000 to $74,999 income range is the most frequent in Highspire borough, accounting for 26.8% of all households.
| Income Bracket | # Households | % Households |
| Less than $10,000 | 46 | 3.6% |
| $10,000 to $14,999 | 33 | 2.6% |
| $15,000 to $24,999 | 140 | 10.9% |
| $25,000 to $34,999 | 129 | 10.1% |
| $35,000 to $49,999 | 290 | 22.6% |
| $50,000 to $74,999 | 343 | 26.8% |
| $75,000 to $99,999 | 133 | 10.4% |
| $100,000 to $149,999 | 160 | 12.5% |
| $150,000 to $199,999 | 0 | 0.0% |
| $200,000+ | 6 | 0.5% |
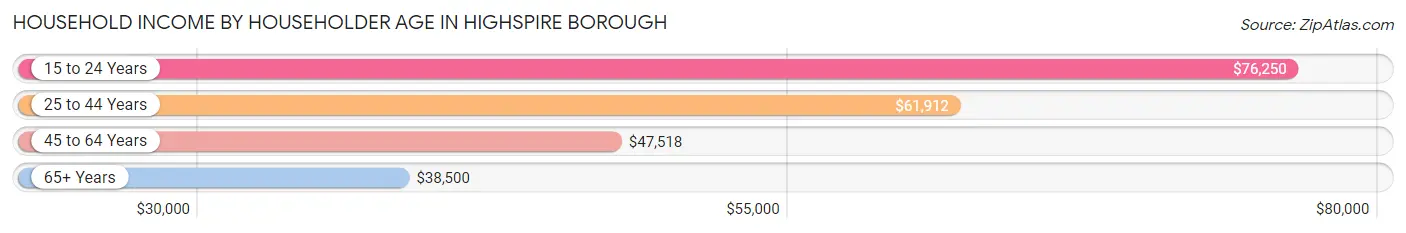
Household Income by Householder Age in Highspire borough
The median household income in Highspire borough is $50,150, with the highest median household income of $76,250 found in the 15 to 24 years age bracket for the primary householder. A total of 134 households (10.5%) fall into this category. Meanwhile, the 65+ years age bracket for the primary householder has the lowest median household income of $38,500, with 314 households (24.5%) in this group.
| Income Bracket | # Households | Median Income |
| 15 to 24 Years | 134 (10.5%) | $76,250 |
| 25 to 44 Years | 320 (25.0%) | $61,912 |
| 45 to 64 Years | 513 (40.1%) | $47,518 |
| 65+ Years | 314 (24.5%) | $38,500 |
| Total | 1,281 (100.0%) | $50,150 |
Poverty in Highspire borough
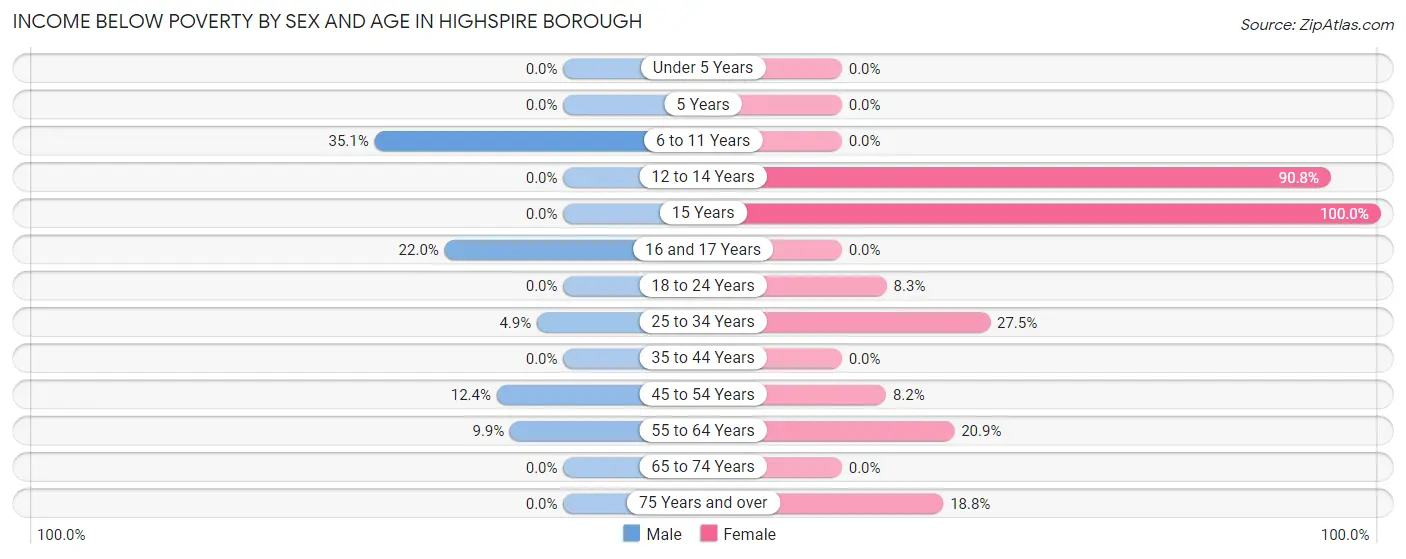
Income Below Poverty by Sex and Age in Highspire borough
With 7.3% poverty level for males and 14.3% for females among the residents of Highspire borough, 6 to 11 year old males and 15 year old females are the most vulnerable to poverty, with 34 males (35.0%) and 12 females (100.0%) in their respective age groups living below the poverty level.
| Age Bracket | Male | Female |
| Under 5 Years | 0 (0.0%) | 0 (0.0%) |
| 5 Years | 0 (0.0%) | 0 (0.0%) |
| 6 to 11 Years | 34 (35.0%) | 0 (0.0%) |
| 12 to 14 Years | 0 (0.0%) | 59 (90.8%) |
| 15 Years | 0 (0.0%) | 12 (100.0%) |
| 16 and 17 Years | 13 (22.0%) | 0 (0.0%) |
| 18 to 24 Years | 0 (0.0%) | 17 (8.3%) |
| 25 to 34 Years | 8 (4.9%) | 41 (27.5%) |
| 35 to 44 Years | 0 (0.0%) | 0 (0.0%) |
| 45 to 54 Years | 22 (12.4%) | 20 (8.2%) |
| 55 to 64 Years | 24 (9.9%) | 24 (20.9%) |
| 65 to 74 Years | 0 (0.0%) | 0 (0.0%) |
| 75 Years and over | 0 (0.0%) | 16 (18.8%) |
| Total | 101 (7.3%) | 189 (14.3%) |
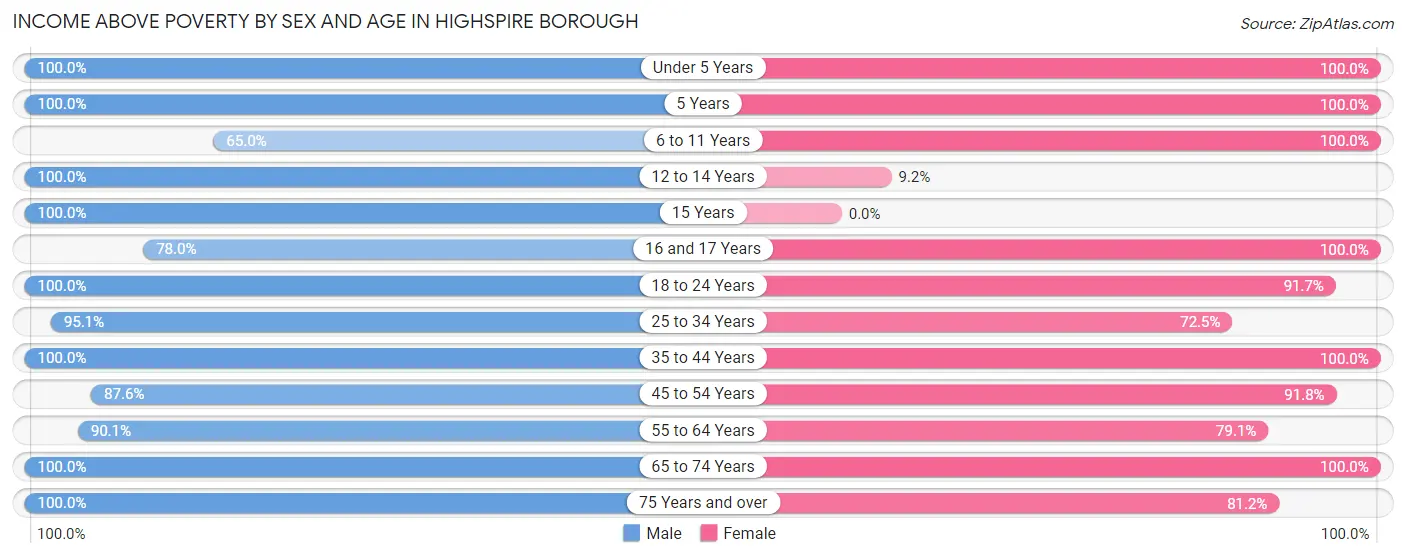
Income Above Poverty by Sex and Age in Highspire borough
According to the poverty statistics in Highspire borough, males aged under 5 years and females aged under 5 years are the age groups that are most secure financially, with 100.0% of males and 100.0% of females in these age groups living above the poverty line.
| Age Bracket | Male | Female |
| Under 5 Years | 22 (100.0%) | 50 (100.0%) |
| 5 Years | 26 (100.0%) | 80 (100.0%) |
| 6 to 11 Years | 63 (64.9%) | 52 (100.0%) |
| 12 to 14 Years | 125 (100.0%) | 6 (9.2%) |
| 15 Years | 12 (100.0%) | 0 (0.0%) |
| 16 and 17 Years | 46 (78.0%) | 37 (100.0%) |
| 18 to 24 Years | 131 (100.0%) | 187 (91.7%) |
| 25 to 34 Years | 156 (95.1%) | 108 (72.5%) |
| 35 to 44 Years | 140 (100.0%) | 104 (100.0%) |
| 45 to 54 Years | 156 (87.6%) | 224 (91.8%) |
| 55 to 64 Years | 219 (90.1%) | 91 (79.1%) |
| 65 to 74 Years | 95 (100.0%) | 126 (100.0%) |
| 75 Years and over | 94 (100.0%) | 69 (81.2%) |
| Total | 1,285 (92.7%) | 1,134 (85.7%) |
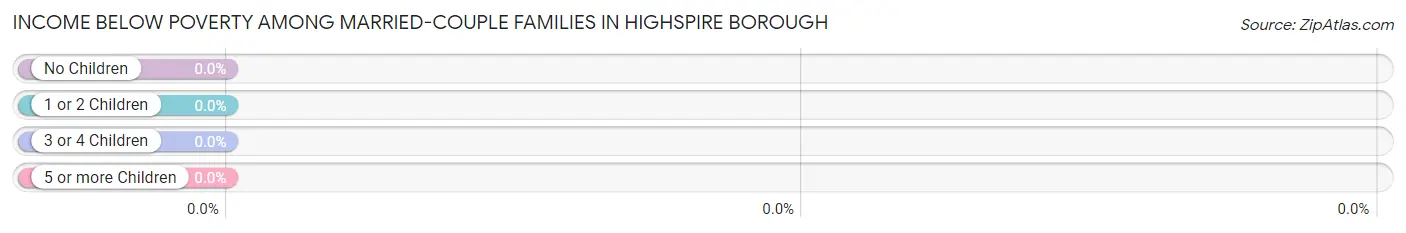
Income Below Poverty Among Married-Couple Families in Highspire borough
| Children | Above Poverty | Below Poverty |
| No Children | 328 (100.0%) | 0 (0.0%) |
| 1 or 2 Children | 49 (100.0%) | 0 (0.0%) |
| 3 or 4 Children | 56 (100.0%) | 0 (0.0%) |
| 5 or more Children | 0 (0.0%) | 0 (0.0%) |
| Total | 433 (100.0%) | 0 (0.0%) |
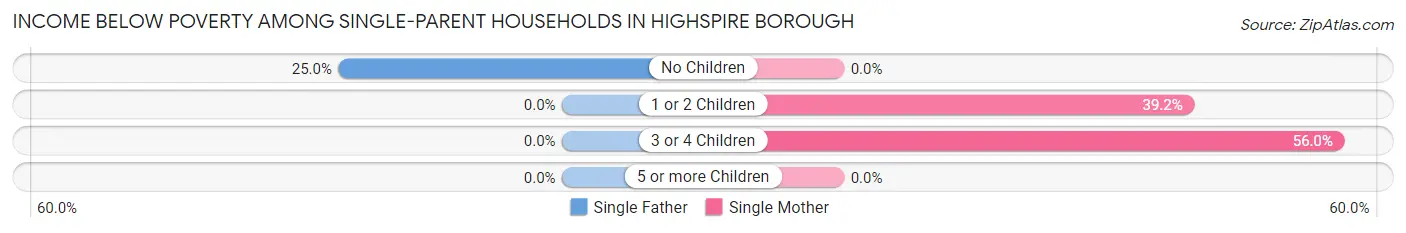
Income Below Poverty Among Single-Parent Households in Highspire borough
According to the poverty data in Highspire borough, 8.2% or 7 single-father households and 41.4% or 48 single-mother households are living below the poverty line. Among single-father households, those with no children have the highest poverty rate, with 7 households (25.0%) experiencing poverty. Likewise, among single-mother households, those with 3 or 4 children have the highest poverty rate, with 28 households (56.0%) falling below the poverty line.
| Children | Single Father | Single Mother |
| No Children | 7 (25.0%) | 0 (0.0%) |
| 1 or 2 Children | 0 (0.0%) | 20 (39.2%) |
| 3 or 4 Children | 0 (0.0%) | 28 (56.0%) |
| 5 or more Children | 0 (0.0%) | 0 (0.0%) |
| Total | 7 (8.2%) | 48 (41.4%) |
Income Below Poverty Among Married-Couple vs Single-Parent Households in Highspire borough
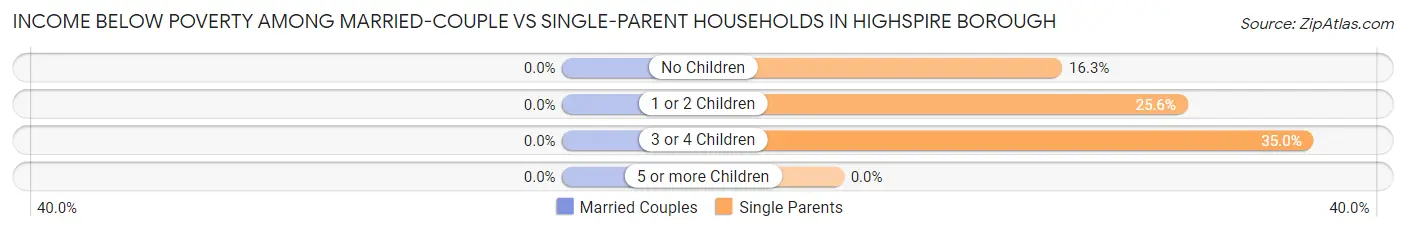
| Children | Married-Couple Families | Single-Parent Households |
| No Children | 0 (0.0%) | 7 (16.3%) |
| 1 or 2 Children | 0 (0.0%) | 20 (25.6%) |
| 3 or 4 Children | 0 (0.0%) | 28 (35.0%) |
| 5 or more Children | 0 (0.0%) | 0 (0.0%) |
| Total | 0 (0.0%) | 55 (27.4%) |
Race in Highspire borough
The most populous races in Highspire borough are White / Caucasian (2,165 | 79.9%), Black / African American (353 | 13.0%), and Hispanic or Latino (149 | 5.5%).
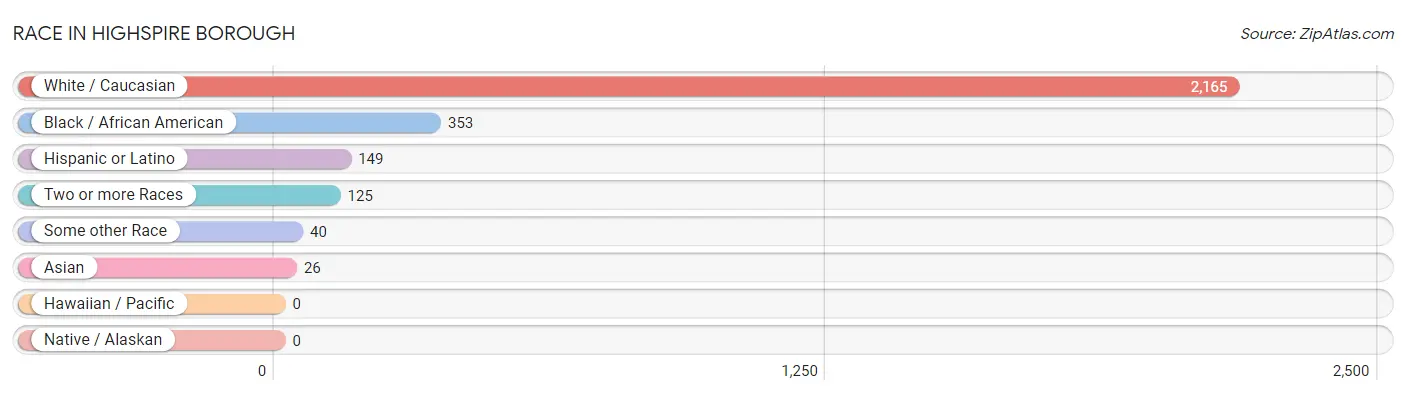
| Race | # Population | % Population |
| Asian | 26 | 1.0% |
| Black / African American | 353 | 13.0% |
| Hawaiian / Pacific | 0 | 0.0% |
| Hispanic or Latino | 149 | 5.5% |
| Native / Alaskan | 0 | 0.0% |
| White / Caucasian | 2,165 | 79.9% |
| Two or more Races | 125 | 4.6% |
| Some other Race | 40 | 1.5% |
| Total | 2,709 | 100.0% |
Ancestry in Highspire borough
The most populous ancestries reported in Highspire borough are American (613 | 22.6%), German (550 | 20.3%), Irish (299 | 11.0%), Italian (194 | 7.2%), and English (191 | 7.0%), together accounting for 68.2% of all Highspire borough residents.
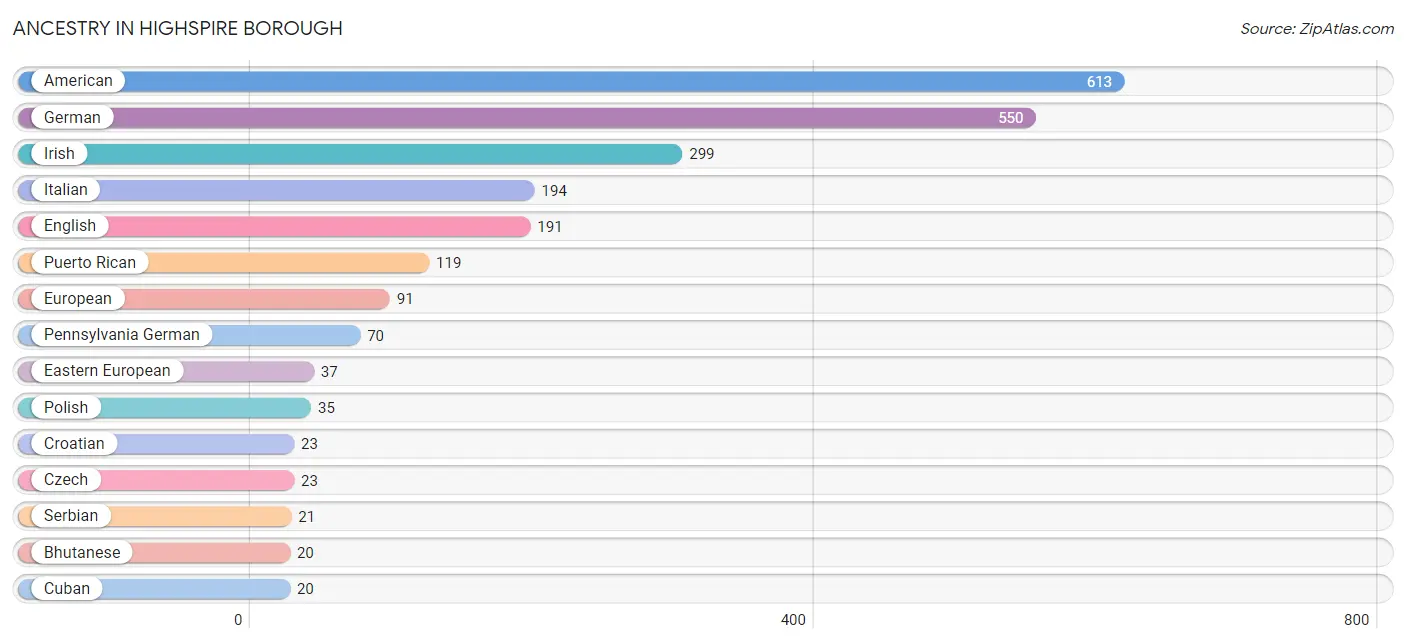
| Ancestry | # Population | % Population |
| American | 613 | 22.6% |
| Bhutanese | 20 | 0.7% |
| Burmese | 7 | 0.3% |
| Croatian | 23 | 0.9% |
| Cuban | 20 | 0.7% |
| Czech | 23 | 0.9% |
| Dutch | 7 | 0.3% |
| Eastern European | 37 | 1.4% |
| English | 191 | 7.0% |
| European | 91 | 3.4% |
| French Canadian | 6 | 0.2% |
| German | 550 | 20.3% |
| Hungarian | 13 | 0.5% |
| Irish | 299 | 11.0% |
| Italian | 194 | 7.2% |
| Jamaican | 10 | 0.4% |
| Laotian | 19 | 0.7% |
| Pennsylvania German | 70 | 2.6% |
| Polish | 35 | 1.3% |
| Puerto Rican | 119 | 4.4% |
| Scotch-Irish | 8 | 0.3% |
| Scottish | 17 | 0.6% |
| Serbian | 21 | 0.8% |
| Slovak | 6 | 0.2% |
| Slovene | 8 | 0.3% |
| Swiss | 13 | 0.5% |
| Welsh | 14 | 0.5% |
| Yugoslavian | 7 | 0.3% | View All 28 Rows |
Immigrants in Highspire borough
The most numerous immigrant groups reported in Highspire borough came from Asia (21 | 0.8%), Bosnia and Herzegovina (20 | 0.7%), Caribbean (20 | 0.7%), Cuba (20 | 0.7%), and Eastern Europe (20 | 0.7%), together accounting for 3.7% of all Highspire borough residents.
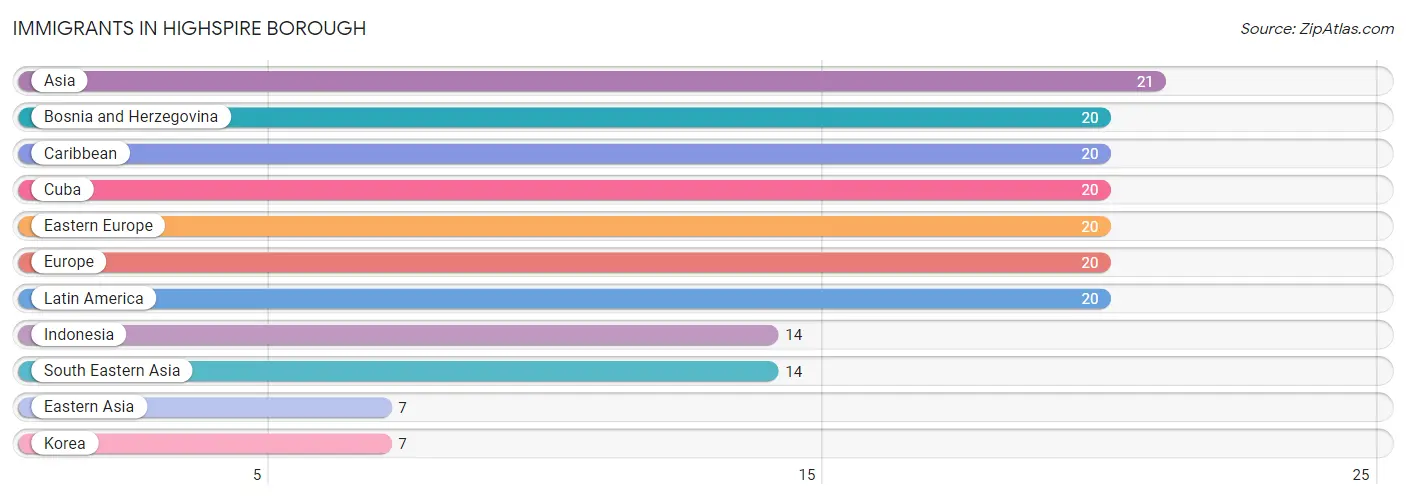
| Immigration Origin | # Population | % Population |
| Asia | 21 | 0.8% |
| Bosnia and Herzegovina | 20 | 0.7% |
| Caribbean | 20 | 0.7% |
| Cuba | 20 | 0.7% |
| Eastern Asia | 7 | 0.3% |
| Eastern Europe | 20 | 0.7% |
| Europe | 20 | 0.7% |
| Indonesia | 14 | 0.5% |
| Korea | 7 | 0.3% |
| Latin America | 20 | 0.7% |
| South Eastern Asia | 14 | 0.5% | View All 11 Rows |
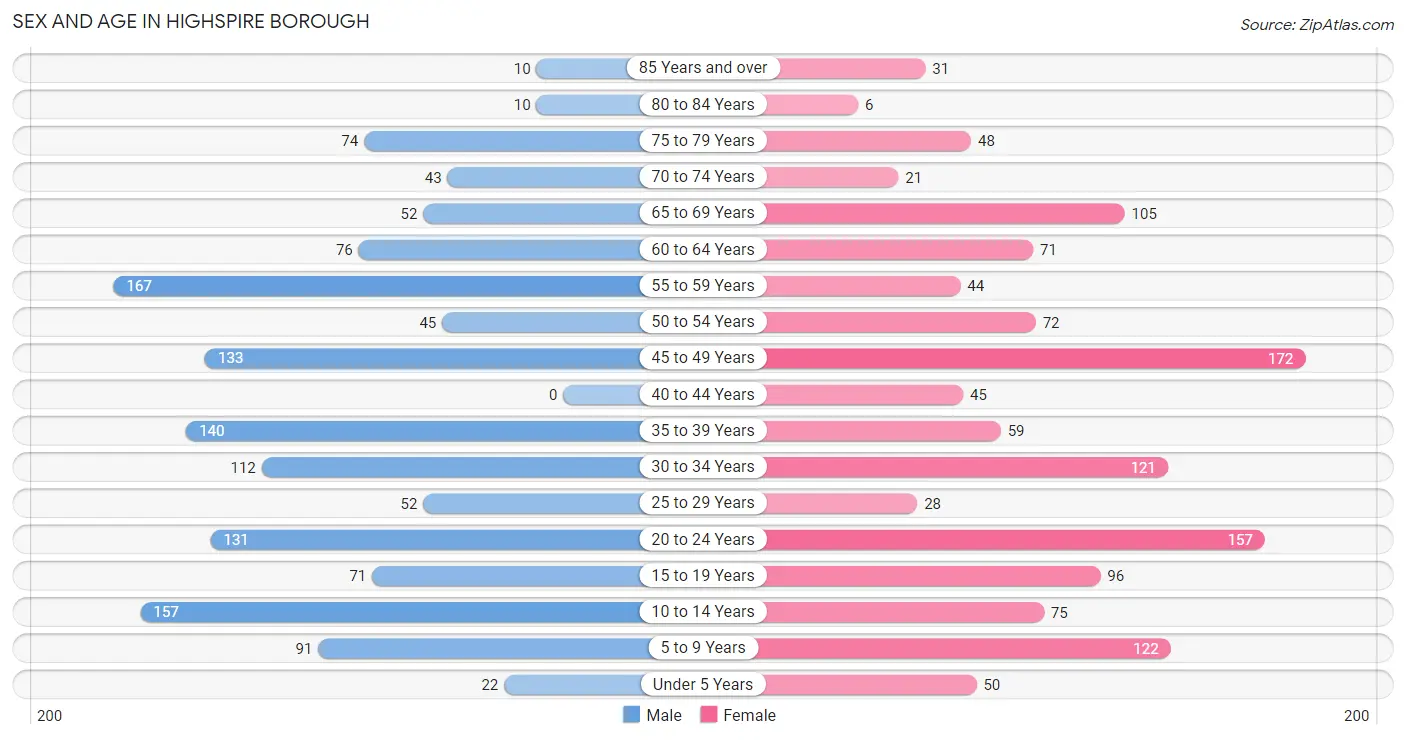
Sex and Age in Highspire borough
Sex and Age in Highspire borough
The most populous age groups in Highspire borough are 55 to 59 Years (167 | 12.0%) for men and 45 to 49 Years (172 | 13.0%) for women.
| Age Bracket | Male | Female |
| Under 5 Years | 22 (1.6%) | 50 (3.8%) |
| 5 to 9 Years | 91 (6.6%) | 122 (9.2%) |
| 10 to 14 Years | 157 (11.3%) | 75 (5.7%) |
| 15 to 19 Years | 71 (5.1%) | 96 (7.3%) |
| 20 to 24 Years | 131 (9.5%) | 157 (11.9%) |
| 25 to 29 Years | 52 (3.7%) | 28 (2.1%) |
| 30 to 34 Years | 112 (8.1%) | 121 (9.1%) |
| 35 to 39 Years | 140 (10.1%) | 59 (4.5%) |
| 40 to 44 Years | 0 (0.0%) | 45 (3.4%) |
| 45 to 49 Years | 133 (9.6%) | 172 (13.0%) |
| 50 to 54 Years | 45 (3.3%) | 72 (5.4%) |
| 55 to 59 Years | 167 (12.0%) | 44 (3.3%) |
| 60 to 64 Years | 76 (5.5%) | 71 (5.4%) |
| 65 to 69 Years | 52 (3.7%) | 105 (7.9%) |
| 70 to 74 Years | 43 (3.1%) | 21 (1.6%) |
| 75 to 79 Years | 74 (5.3%) | 48 (3.6%) |
| 80 to 84 Years | 10 (0.7%) | 6 (0.4%) |
| 85 Years and over | 10 (0.7%) | 31 (2.3%) |
| Total | 1,386 (100.0%) | 1,323 (100.0%) |
Families and Households in Highspire borough
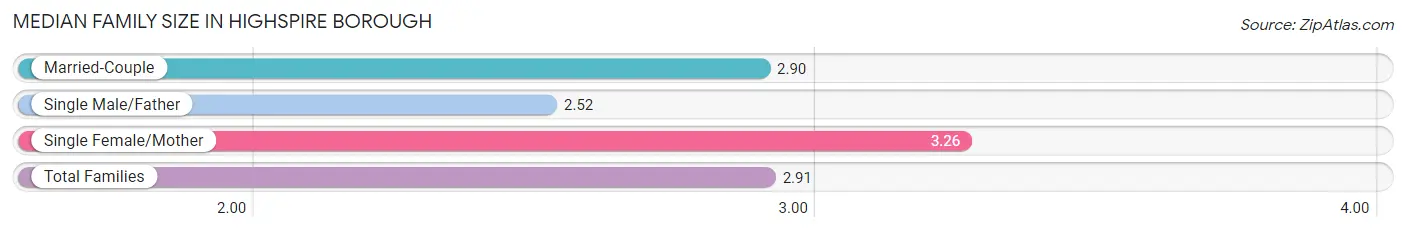
Median Family Size in Highspire borough
The median family size in Highspire borough is 2.91 persons per family, with single female/mother families (116 | 18.3%) accounting for the largest median family size of 3.26 persons per family. On the other hand, single male/father families (85 | 13.4%) represent the smallest median family size with 2.52 persons per family.
| Family Type | # Families | Family Size |
| Married-Couple | 433 (68.3%) | 2.90 |
| Single Male/Father | 85 (13.4%) | 2.52 |
| Single Female/Mother | 116 (18.3%) | 3.26 |
| Total Families | 634 (100.0%) | 2.91 |
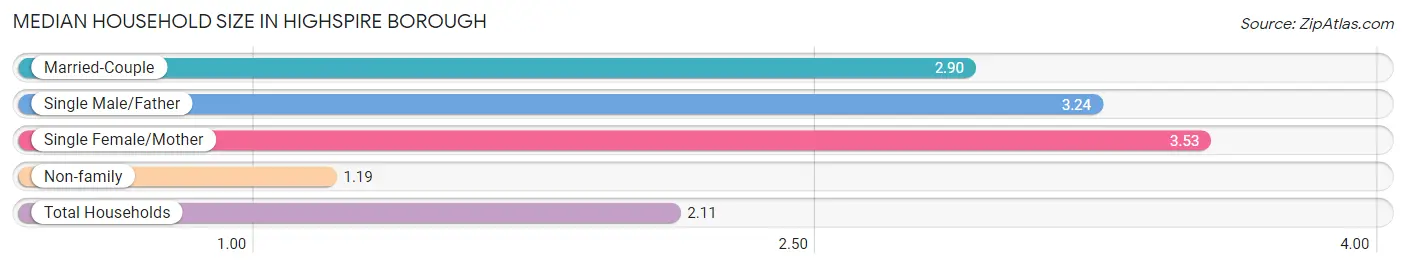
Median Household Size in Highspire borough
The median household size in Highspire borough is 2.11 persons per household, with single female/mother households (116 | 9.1%) accounting for the largest median household size of 3.53 persons per household. non-family households (647 | 50.5%) represent the smallest median household size with 1.19 persons per household.
| Household Type | # Households | Household Size |
| Married-Couple | 433 (33.8%) | 2.90 |
| Single Male/Father | 85 (6.6%) | 3.24 |
| Single Female/Mother | 116 (9.1%) | 3.53 |
| Non-family | 647 (50.5%) | 1.19 |
| Total Households | 1,281 (100.0%) | 2.11 |
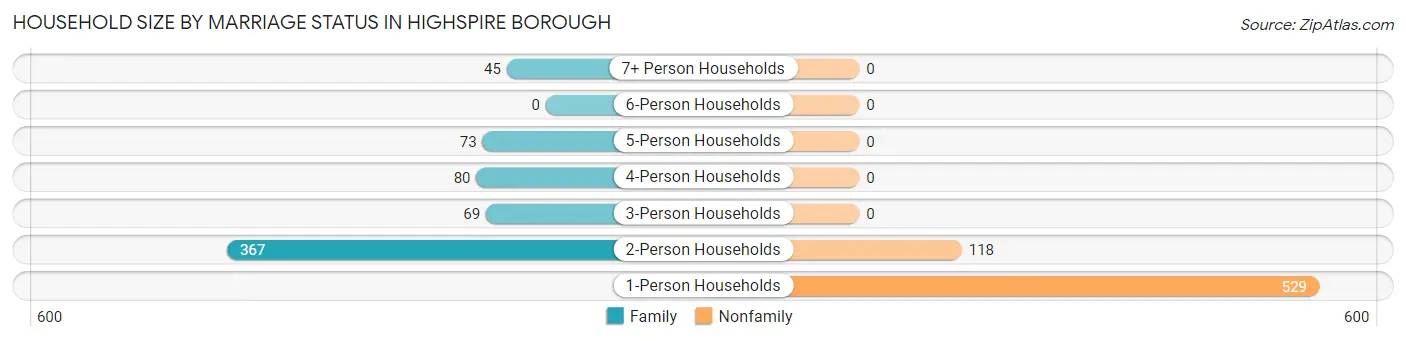
Household Size by Marriage Status in Highspire borough
Out of a total of 1,281 households in Highspire borough, 634 (49.5%) are family households, while 647 (50.5%) are nonfamily households. The most numerous type of family households are 2-person households, comprising 367, and the most common type of nonfamily households are 1-person households, comprising 529.
| Household Size | Family Households | Nonfamily Households |
| 1-Person Households | - | 529 (41.3%) |
| 2-Person Households | 367 (28.6%) | 118 (9.2%) |
| 3-Person Households | 69 (5.4%) | 0 (0.0%) |
| 4-Person Households | 80 (6.2%) | 0 (0.0%) |
| 5-Person Households | 73 (5.7%) | 0 (0.0%) |
| 6-Person Households | 0 (0.0%) | 0 (0.0%) |
| 7+ Person Households | 45 (3.5%) | 0 (0.0%) |
| Total | 634 (49.5%) | 647 (50.5%) |
Female Fertility in Highspire borough
Fertility by Age in Highspire borough
Average fertility rate in Highspire borough is 55.0 births per 1,000 women. Women in the age bracket of 35 to 50 years have the highest fertility rate with 95.0 births per 1,000 women. Women in the age bracket of 35 to 50 years acount for 71.1% of all women with births.
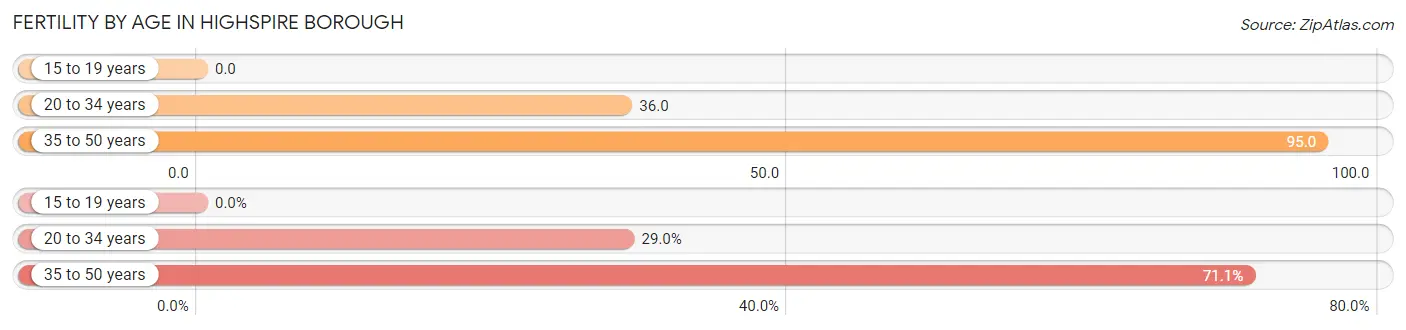
| Age Bracket | Women with Births | Births / 1,000 Women |
| 15 to 19 years | 0 (0.0%) | 0.0 |
| 20 to 34 years | 11 (28.9%) | 36.0 |
| 35 to 50 years | 27 (71.1%) | 95.0 |
| Total | 38 (100.0%) | 55.0 |
Fertility by Age by Marriage Status in Highspire borough
47.4% of women with births (38) in Highspire borough are married. The highest percentage of unmarried women with births falls into 35 to 50 years age bracket with 74.1% of them unmarried at the time of birth, while the lowest percentage of unmarried women with births belong to 20 to 34 years age bracket with 0.0% of them unmarried.
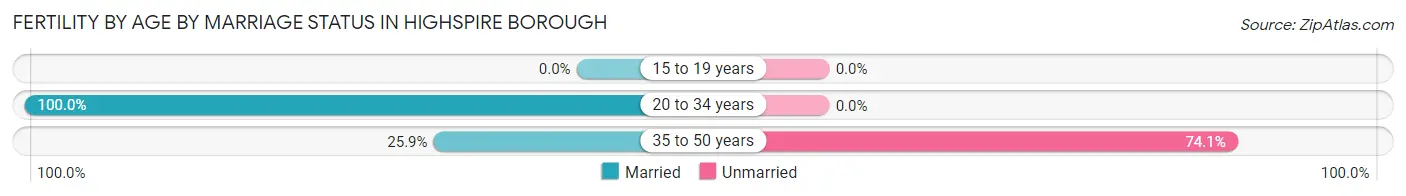
| Age Bracket | Married | Unmarried |
| 15 to 19 years | 0 (0.0%) | 0 (0.0%) |
| 20 to 34 years | 11 (100.0%) | 0 (0.0%) |
| 35 to 50 years | 7 (25.9%) | 20 (74.1%) |
| Total | 18 (47.4%) | 20 (52.6%) |
Fertility by Education in Highspire borough
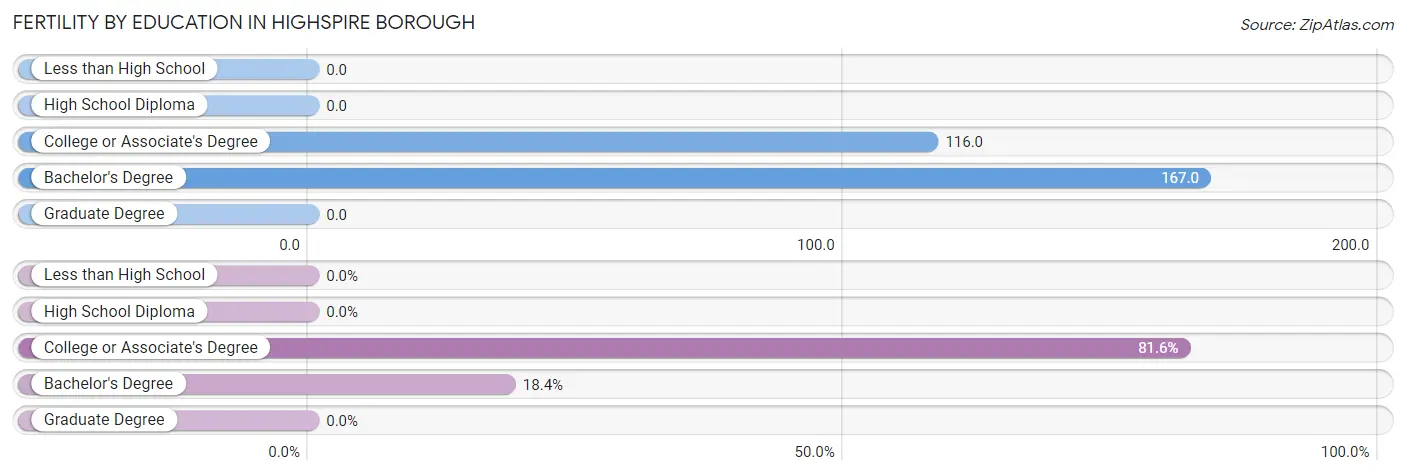
| Educational Attainment | Women with Births | Births / 1,000 Women |
| Less than High School | 0 (0.0%) | 0.0 |
| High School Diploma | 0 (0.0%) | 0.0 |
| College or Associate's Degree | 31 (81.6%) | 116.0 |
| Bachelor's Degree | 7 (18.4%) | 167.0 |
| Graduate Degree | 0 (0.0%) | 0.0 |
| Total | 38 (100.0%) | 55.0 |
Fertility by Education by Marriage Status in Highspire borough
52.6% of women with births in Highspire borough are unmarried. Women with the educational attainment of bachelor's degree are most likely to be married with 100.0% of them married at childbirth, while women with the educational attainment of college or associate's degree are least likely to be married with 64.5% of them unmarried at childbirth.
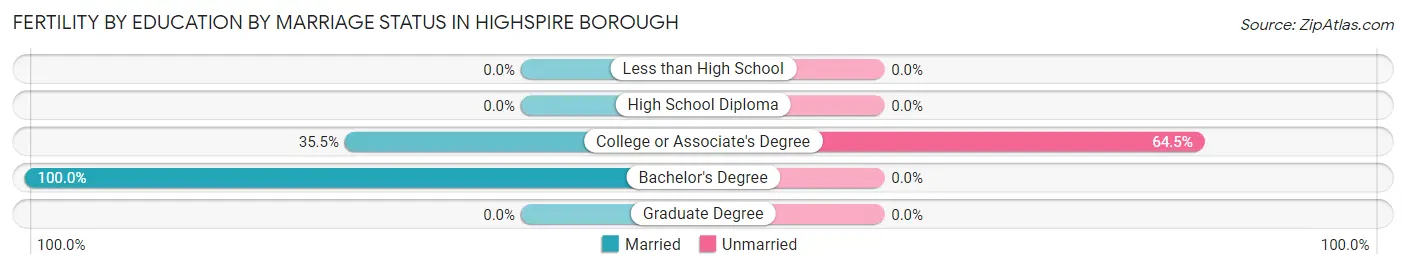
| Educational Attainment | Married | Unmarried |
| Less than High School | 0 (0.0%) | 0 (0.0%) |
| High School Diploma | 0 (0.0%) | 0 (0.0%) |
| College or Associate's Degree | 11 (35.5%) | 20 (64.5%) |
| Bachelor's Degree | 7 (100.0%) | 0 (0.0%) |
| Graduate Degree | 0 (0.0%) | 0 (0.0%) |
| Total | 18 (47.4%) | 20 (52.6%) |
Employment Characteristics in Highspire borough
Employment by Class of Employer in Highspire borough
Among the 1,291 employed individuals in Highspire borough, private company employees (1,029 | 79.7%), not-for-profit organizations (83 | 6.4%), and state government employees (68 | 5.3%) make up the most common classes of employment.
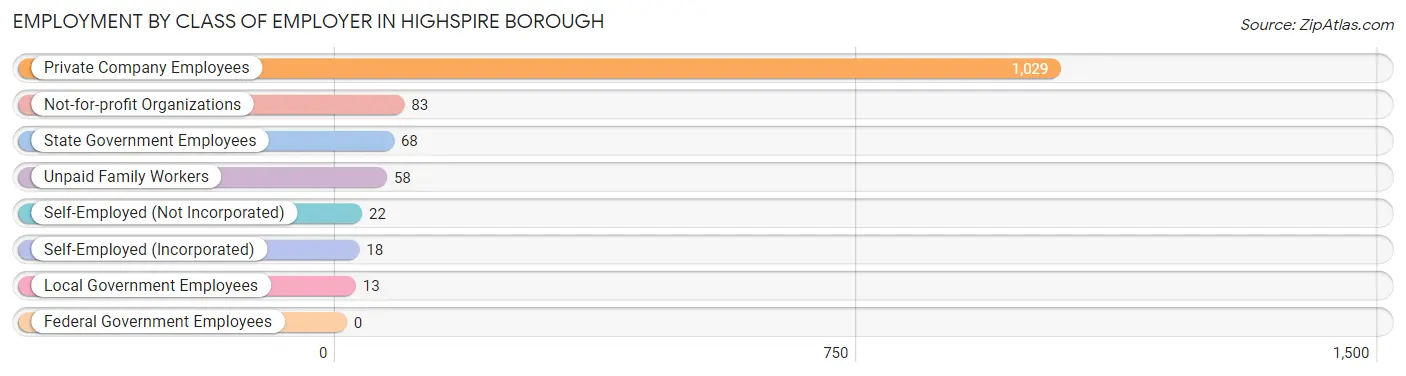
| Employer Class | # Employees | % Employees |
| Private Company Employees | 1,029 | 79.7% |
| Self-Employed (Incorporated) | 18 | 1.4% |
| Self-Employed (Not Incorporated) | 22 | 1.7% |
| Not-for-profit Organizations | 83 | 6.4% |
| Local Government Employees | 13 | 1.0% |
| State Government Employees | 68 | 5.3% |
| Federal Government Employees | 0 | 0.0% |
| Unpaid Family Workers | 58 | 4.5% |
| Total | 1,291 | 100.0% |
Employment Status by Age in Highspire borough
According to the labor force statistics for Highspire borough, out of the total population over 16 years of age (2,168), 63.9% or 1,385 individuals are in the labor force, with 5.8% or 80 of them unemployed. The age group with the highest labor force participation rate is 25 to 29 years, with 100.0% or 80 individuals in the labor force. Within the labor force, the 25 to 29 years age range has the highest percentage of unemployed individuals, with 42.5% or 34 of them being unemployed.
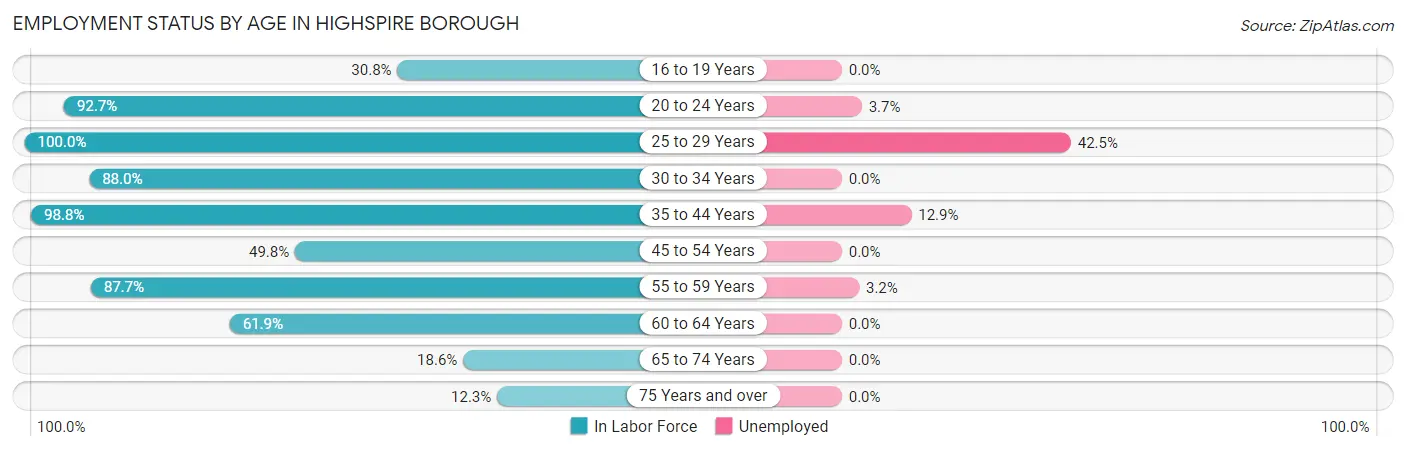
| Age Bracket | In Labor Force | Unemployed |
| 16 to 19 Years | 44 (30.8%) | 0 (0.0%) |
| 20 to 24 Years | 267 (92.7%) | 10 (3.7%) |
| 25 to 29 Years | 80 (100.0%) | 34 (42.5%) |
| 30 to 34 Years | 205 (88.0%) | 0 (0.0%) |
| 35 to 44 Years | 241 (98.8%) | 31 (12.9%) |
| 45 to 54 Years | 210 (49.8%) | 0 (0.0%) |
| 55 to 59 Years | 185 (87.7%) | 6 (3.2%) |
| 60 to 64 Years | 91 (61.9%) | 0 (0.0%) |
| 65 to 74 Years | 41 (18.6%) | 0 (0.0%) |
| 75 Years and over | 22 (12.3%) | 0 (0.0%) |
| Total | 1,385 (63.9%) | 80 (5.8%) |
Employment Status by Educational Attainment in Highspire borough
According to labor force statistics for Highspire borough, 75.7% of individuals (1,012) out of the total population between 25 and 64 years of age (1,337) are in the labor force, with 7.0% or 71 of them being unemployed. The group with the highest labor force participation rate are those with the educational attainment of college / associate degree, with 85.3% or 395 individuals in the labor force. Within the labor force, individuals with bachelor's degree or higher education have the highest percentage of unemployment, with 19.9% or 34 of them being unemployed.
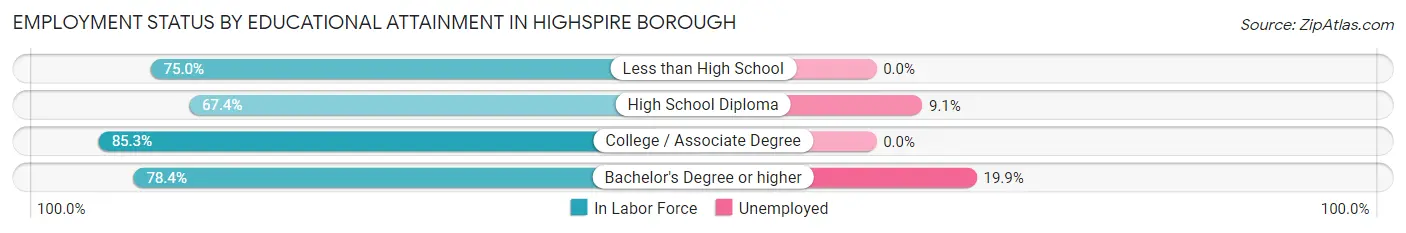
| Educational Attainment | In Labor Force | Unemployed |
| Less than High School | 39 (75.0%) | 0 (0.0%) |
| High School Diploma | 407 (67.4%) | 55 (9.1%) |
| College / Associate Degree | 395 (85.3%) | 0 (0.0%) |
| Bachelor's Degree or higher | 171 (78.4%) | 43 (19.9%) |
| Total | 1,012 (75.7%) | 94 (7.0%) |
Employment Occupations by Sex in Highspire borough
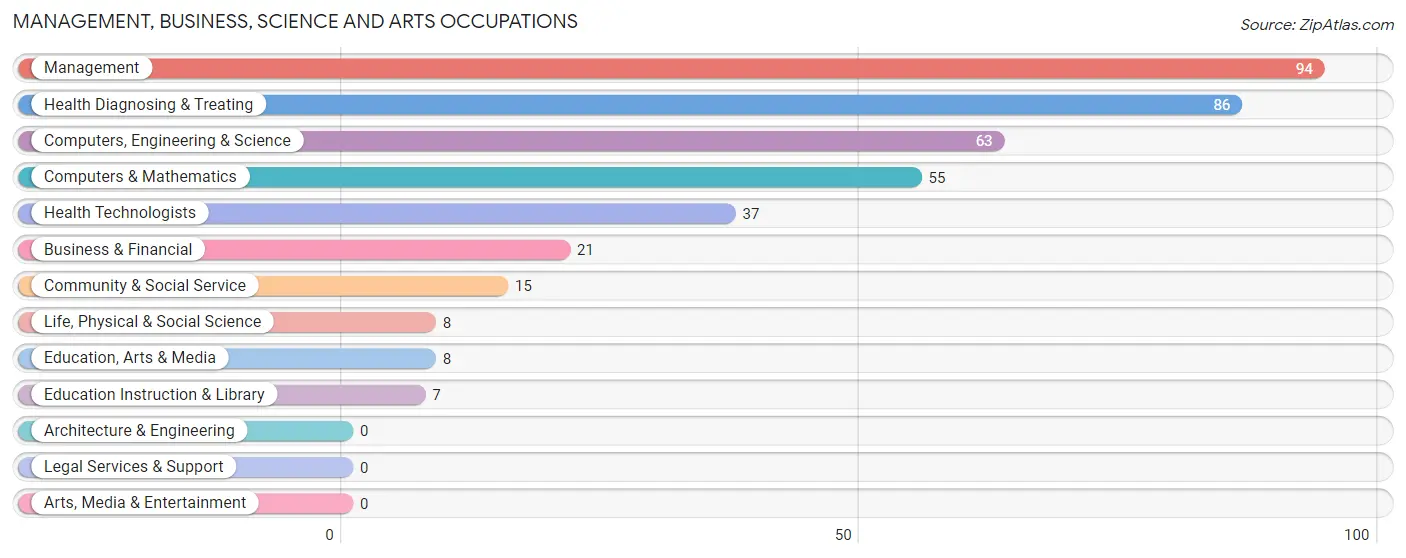
Management, Business, Science and Arts Occupations
The most common Management, Business, Science and Arts occupations in Highspire borough are Management (94 | 7.2%), Health Diagnosing & Treating (86 | 6.6%), Computers, Engineering & Science (63 | 4.8%), Computers & Mathematics (55 | 4.2%), and Health Technologists (37 | 2.8%).
Management, Business, Science and Arts Occupations by Sex
Within the Management, Business, Science and Arts occupations in Highspire borough, the most male-oriented occupations are Business & Financial (100.0%), Computers, Engineering & Science (100.0%), and Computers & Mathematics (100.0%), while the most female-oriented occupations are Community & Social Service (100.0%), Education, Arts & Media (100.0%), and Education Instruction & Library (100.0%).
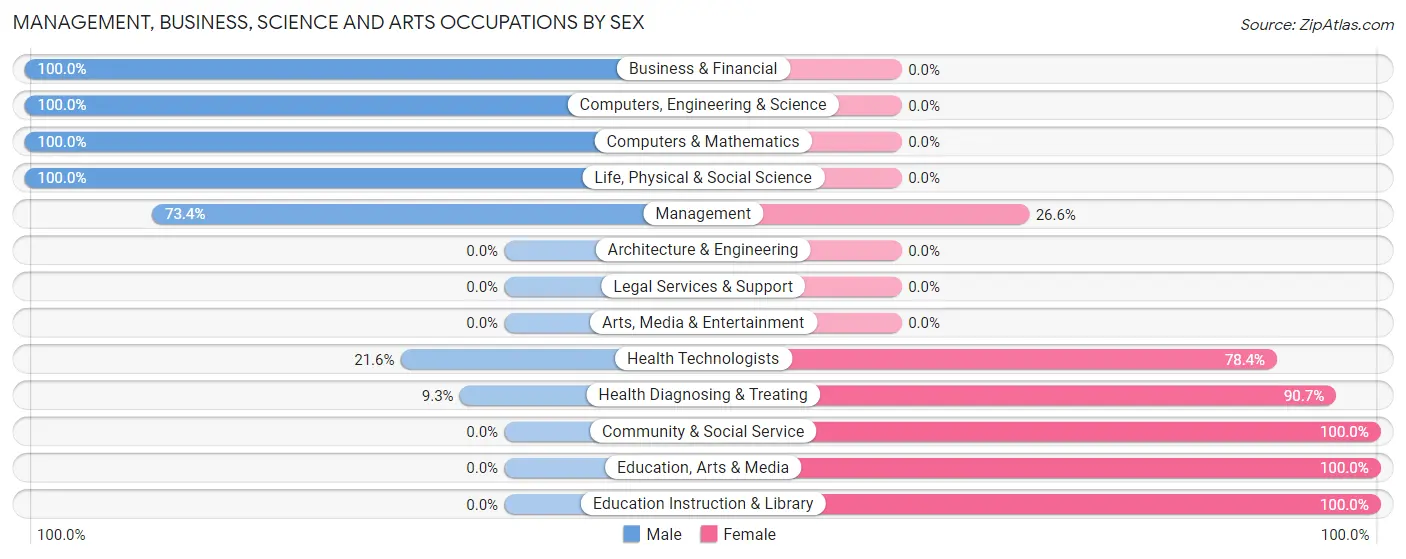
| Occupation | Male | Female |
| Management | 69 (73.4%) | 25 (26.6%) |
| Business & Financial | 21 (100.0%) | 0 (0.0%) |
| Computers, Engineering & Science | 63 (100.0%) | 0 (0.0%) |
| Computers & Mathematics | 55 (100.0%) | 0 (0.0%) |
| Architecture & Engineering | 0 (0.0%) | 0 (0.0%) |
| Life, Physical & Social Science | 8 (100.0%) | 0 (0.0%) |
| Community & Social Service | 0 (0.0%) | 15 (100.0%) |
| Education, Arts & Media | 0 (0.0%) | 8 (100.0%) |
| Legal Services & Support | 0 (0.0%) | 0 (0.0%) |
| Education Instruction & Library | 0 (0.0%) | 7 (100.0%) |
| Arts, Media & Entertainment | 0 (0.0%) | 0 (0.0%) |
| Health Diagnosing & Treating | 8 (9.3%) | 78 (90.7%) |
| Health Technologists | 8 (21.6%) | 29 (78.4%) |
| Total (Category) | 161 (57.7%) | 118 (42.3%) |
| Total (Overall) | 749 (57.4%) | 556 (42.6%) |
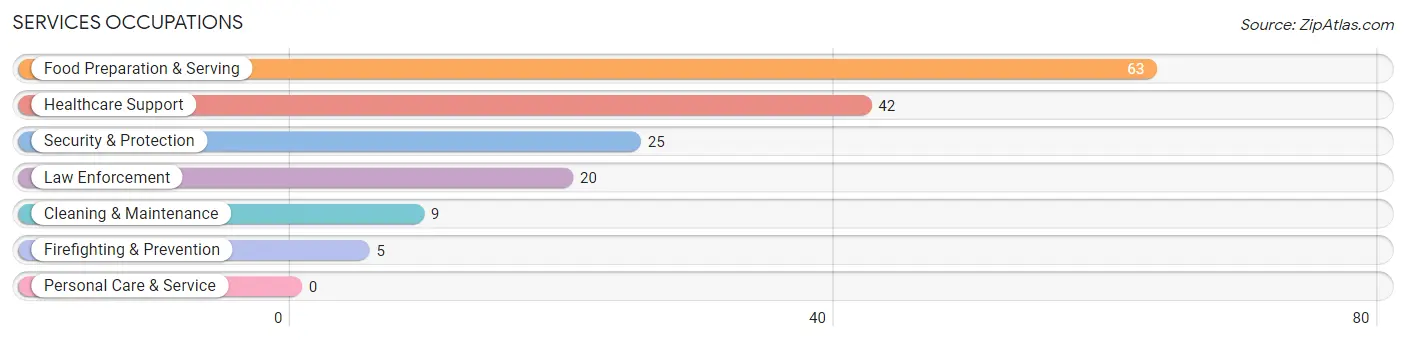
Services Occupations
The most common Services occupations in Highspire borough are Food Preparation & Serving (63 | 4.8%), Healthcare Support (42 | 3.2%), Security & Protection (25 | 1.9%), Law Enforcement (20 | 1.5%), and Cleaning & Maintenance (9 | 0.7%).
Services Occupations by Sex
Within the Services occupations in Highspire borough, the most male-oriented occupations are Security & Protection (100.0%), Firefighting & Prevention (100.0%), and Law Enforcement (100.0%), while the most female-oriented occupations are Healthcare Support (100.0%), Cleaning & Maintenance (100.0%), and Food Preparation & Serving (58.7%).
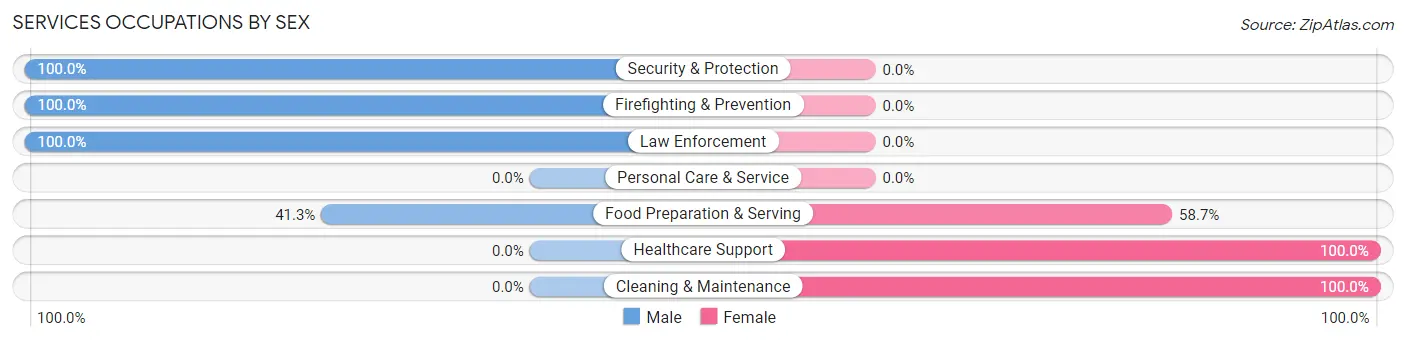
| Occupation | Male | Female |
| Healthcare Support | 0 (0.0%) | 42 (100.0%) |
| Security & Protection | 25 (100.0%) | 0 (0.0%) |
| Firefighting & Prevention | 5 (100.0%) | 0 (0.0%) |
| Law Enforcement | 20 (100.0%) | 0 (0.0%) |
| Food Preparation & Serving | 26 (41.3%) | 37 (58.7%) |
| Cleaning & Maintenance | 0 (0.0%) | 9 (100.0%) |
| Personal Care & Service | 0 (0.0%) | 0 (0.0%) |
| Total (Category) | 51 (36.7%) | 88 (63.3%) |
| Total (Overall) | 749 (57.4%) | 556 (42.6%) |
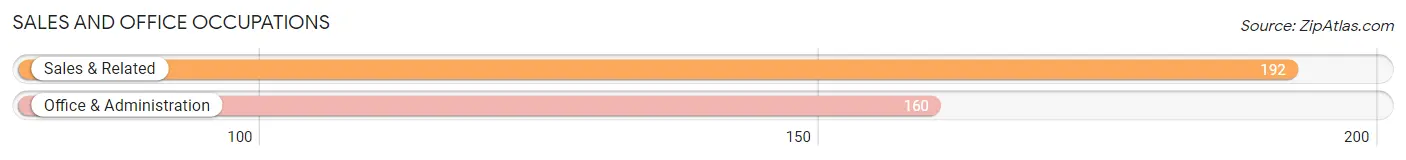
Sales and Office Occupations
The most common Sales and Office occupations in Highspire borough are Sales & Related (192 | 14.7%), and Office & Administration (160 | 12.3%).
Sales and Office Occupations by Sex
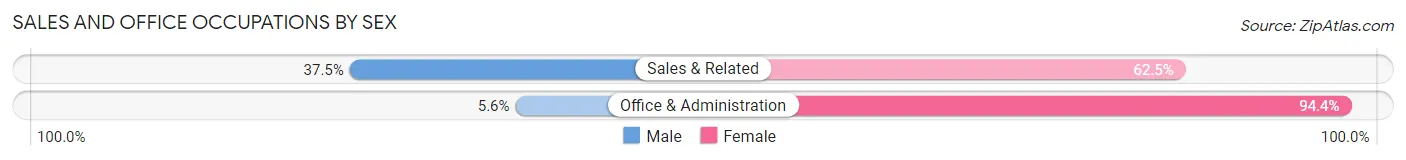
| Occupation | Male | Female |
| Sales & Related | 72 (37.5%) | 120 (62.5%) |
| Office & Administration | 9 (5.6%) | 151 (94.4%) |
| Total (Category) | 81 (23.0%) | 271 (77.0%) |
| Total (Overall) | 749 (57.4%) | 556 (42.6%) |
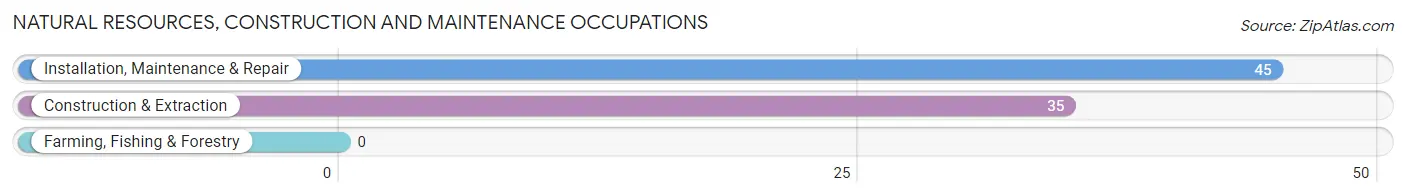
Natural Resources, Construction and Maintenance Occupations
The most common Natural Resources, Construction and Maintenance occupations in Highspire borough are Installation, Maintenance & Repair (45 | 3.5%), and Construction & Extraction (35 | 2.7%).
Natural Resources, Construction and Maintenance Occupations by Sex
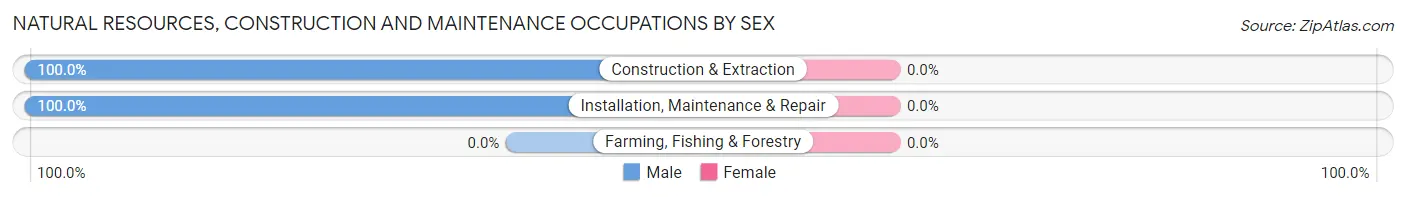
| Occupation | Male | Female |
| Farming, Fishing & Forestry | 0 (0.0%) | 0 (0.0%) |
| Construction & Extraction | 35 (100.0%) | 0 (0.0%) |
| Installation, Maintenance & Repair | 45 (100.0%) | 0 (0.0%) |
| Total (Category) | 80 (100.0%) | 0 (0.0%) |
| Total (Overall) | 749 (57.4%) | 556 (42.6%) |
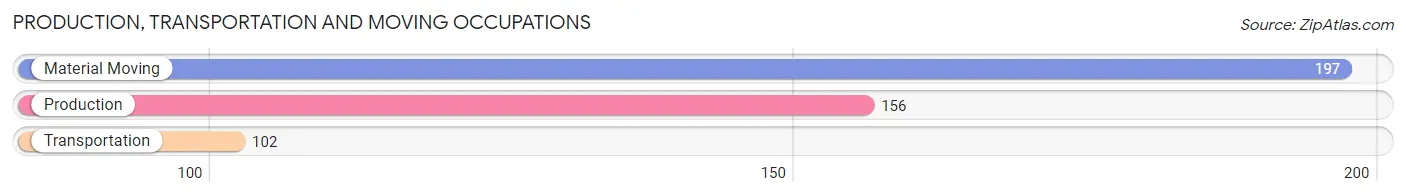
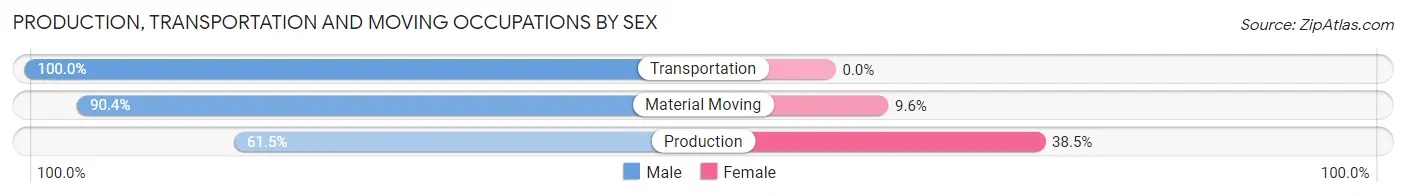
Production, Transportation and Moving Occupations
The most common Production, Transportation and Moving occupations in Highspire borough are Material Moving (197 | 15.1%), Production (156 | 11.9%), and Transportation (102 | 7.8%).
Production, Transportation and Moving Occupations by Sex
| Occupation | Male | Female |
| Production | 96 (61.5%) | 60 (38.5%) |
| Transportation | 102 (100.0%) | 0 (0.0%) |
| Material Moving | 178 (90.4%) | 19 (9.6%) |
| Total (Category) | 376 (82.6%) | 79 (17.4%) |
| Total (Overall) | 749 (57.4%) | 556 (42.6%) |
Employment Industries by Sex in Highspire borough
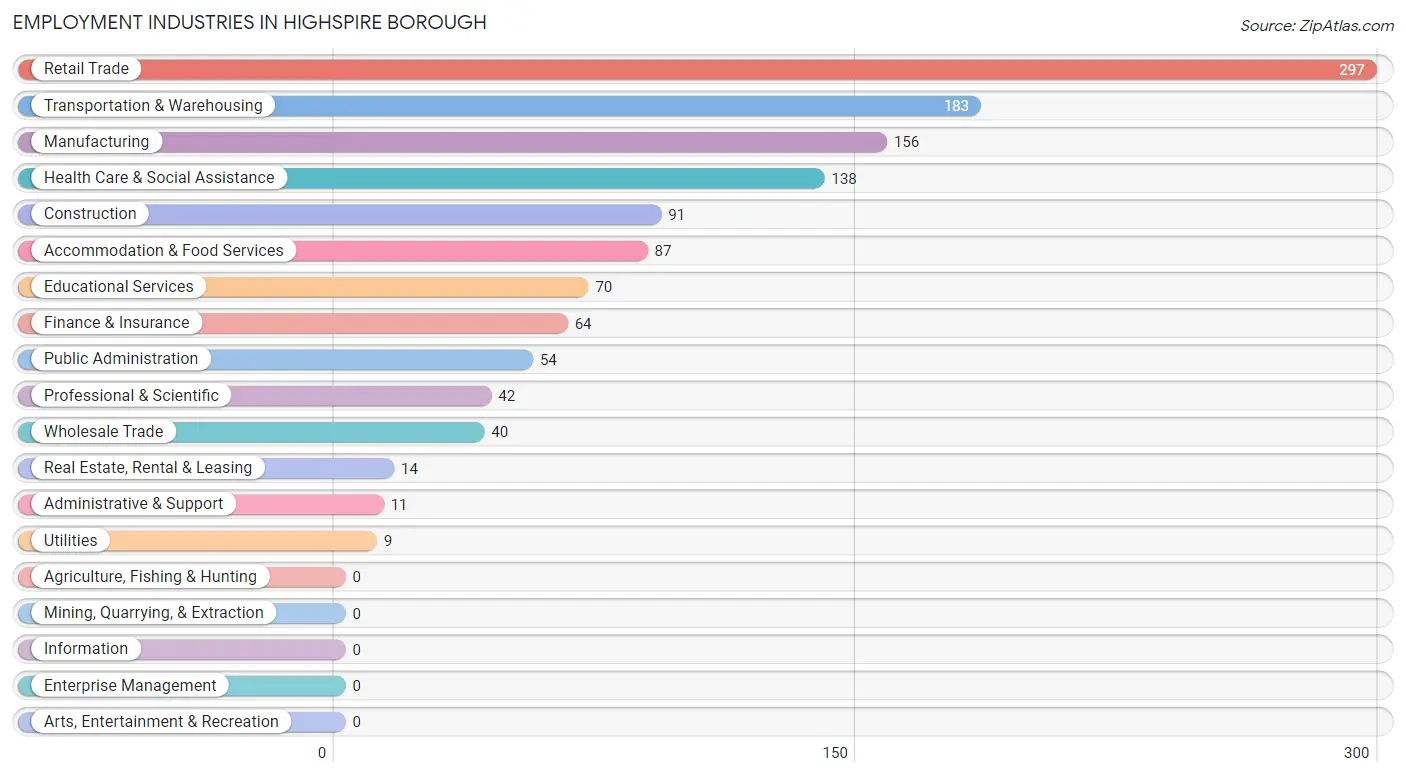
Employment Industries in Highspire borough
The major employment industries in Highspire borough include Retail Trade (297 | 22.8%), Transportation & Warehousing (183 | 14.0%), Manufacturing (156 | 11.9%), Health Care & Social Assistance (138 | 10.6%), and Construction (91 | 7.0%).
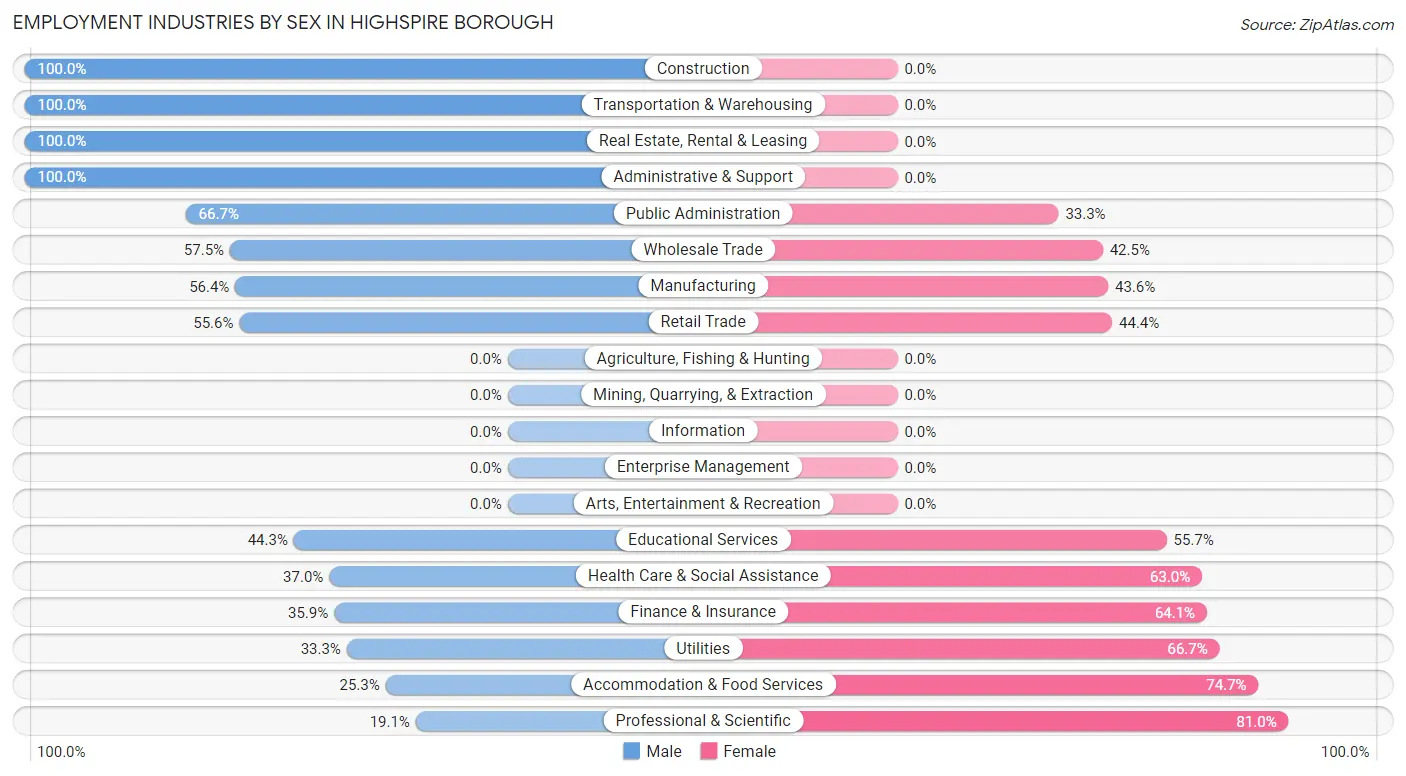
Employment Industries by Sex in Highspire borough
The Highspire borough industries that see more men than women are Construction (100.0%), Transportation & Warehousing (100.0%), and Real Estate, Rental & Leasing (100.0%), whereas the industries that tend to have a higher number of women are Professional & Scientific (80.9%), Accommodation & Food Services (74.7%), and Utilities (66.7%).
| Industry | Male | Female |
| Agriculture, Fishing & Hunting | 0 (0.0%) | 0 (0.0%) |
| Mining, Quarrying, & Extraction | 0 (0.0%) | 0 (0.0%) |
| Construction | 91 (100.0%) | 0 (0.0%) |
| Manufacturing | 88 (56.4%) | 68 (43.6%) |
| Wholesale Trade | 23 (57.5%) | 17 (42.5%) |
| Retail Trade | 165 (55.6%) | 132 (44.4%) |
| Transportation & Warehousing | 183 (100.0%) | 0 (0.0%) |
| Utilities | 3 (33.3%) | 6 (66.7%) |
| Information | 0 (0.0%) | 0 (0.0%) |
| Finance & Insurance | 23 (35.9%) | 41 (64.1%) |
| Real Estate, Rental & Leasing | 14 (100.0%) | 0 (0.0%) |
| Professional & Scientific | 8 (19.1%) | 34 (80.9%) |
| Enterprise Management | 0 (0.0%) | 0 (0.0%) |
| Administrative & Support | 11 (100.0%) | 0 (0.0%) |
| Educational Services | 31 (44.3%) | 39 (55.7%) |
| Health Care & Social Assistance | 51 (37.0%) | 87 (63.0%) |
| Arts, Entertainment & Recreation | 0 (0.0%) | 0 (0.0%) |
| Accommodation & Food Services | 22 (25.3%) | 65 (74.7%) |
| Public Administration | 36 (66.7%) | 18 (33.3%) |
| Total | 749 (57.4%) | 556 (42.6%) |
Education in Highspire borough
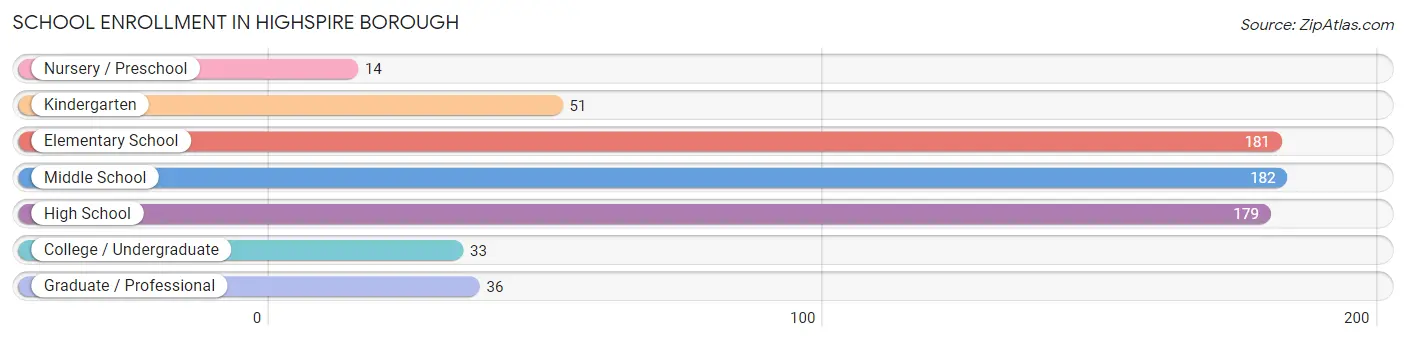
School Enrollment in Highspire borough
The most common levels of schooling among the 676 students in Highspire borough are middle school (182 | 26.9%), elementary school (181 | 26.8%), and high school (179 | 26.5%).
| School Level | # Students | % Students |
| Nursery / Preschool | 14 | 2.1% |
| Kindergarten | 51 | 7.5% |
| Elementary School | 181 | 26.8% |
| Middle School | 182 | 26.9% |
| High School | 179 | 26.5% |
| College / Undergraduate | 33 | 4.9% |
| Graduate / Professional | 36 | 5.3% |
| Total | 676 | 100.0% |
School Enrollment by Age by Funding Source in Highspire borough
Out of a total of 676 students who are enrolled in schools in Highspire borough, 229 (33.9%) attend a private institution, while the remaining 447 (66.1%) are enrolled in public schools. The age group of 3 to 4 year olds has the highest likelihood of being enrolled in private schools, with 14 (100.0% in the age bracket) enrolled. Conversely, the age group of 15 to 17 year olds has the lowest likelihood of being enrolled in a private school, with 120 (100.0% in the age bracket) attending a public institution.
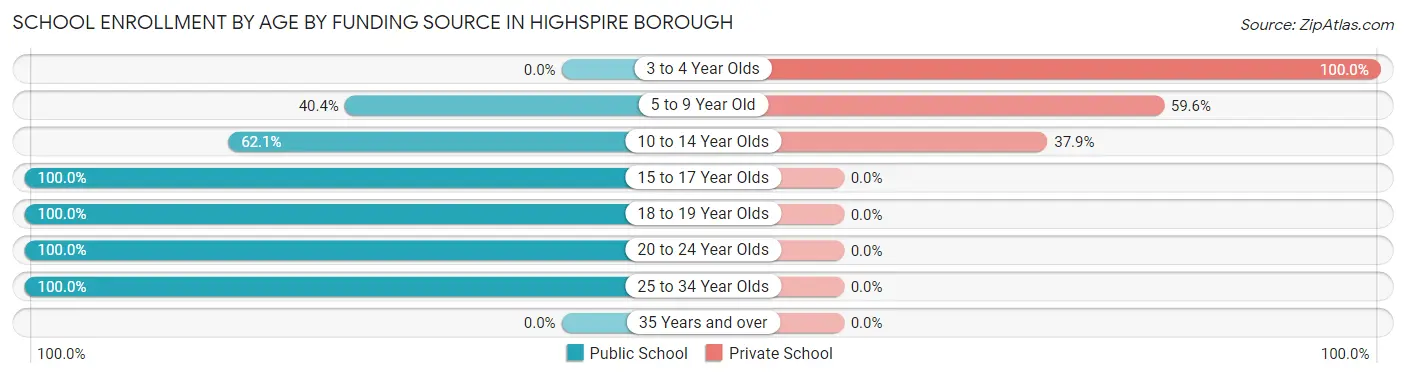
| Age Bracket | Public School | Private School |
| 3 to 4 Year Olds | 0 (0.0%) | 14 (100.0%) |
| 5 to 9 Year Old | 86 (40.4%) | 127 (59.6%) |
| 10 to 14 Year Olds | 144 (62.1%) | 88 (37.9%) |
| 15 to 17 Year Olds | 120 (100.0%) | 0 (0.0%) |
| 18 to 19 Year Olds | 28 (100.0%) | 0 (0.0%) |
| 20 to 24 Year Olds | 33 (100.0%) | 0 (0.0%) |
| 25 to 34 Year Olds | 36 (100.0%) | 0 (0.0%) |
| 35 Years and over | 0 (0.0%) | 0 (0.0%) |
| Total | 447 (66.1%) | 229 (33.9%) |
Educational Attainment by Field of Study in Highspire borough
Education (58 | 17.8%), social sciences (53 | 16.3%), engineering (38 | 11.7%), liberal arts & history (36 | 11.0%), and arts & humanities (31 | 9.5%) are the most common fields of study among 326 individuals in Highspire borough who have obtained a bachelor's degree or higher.
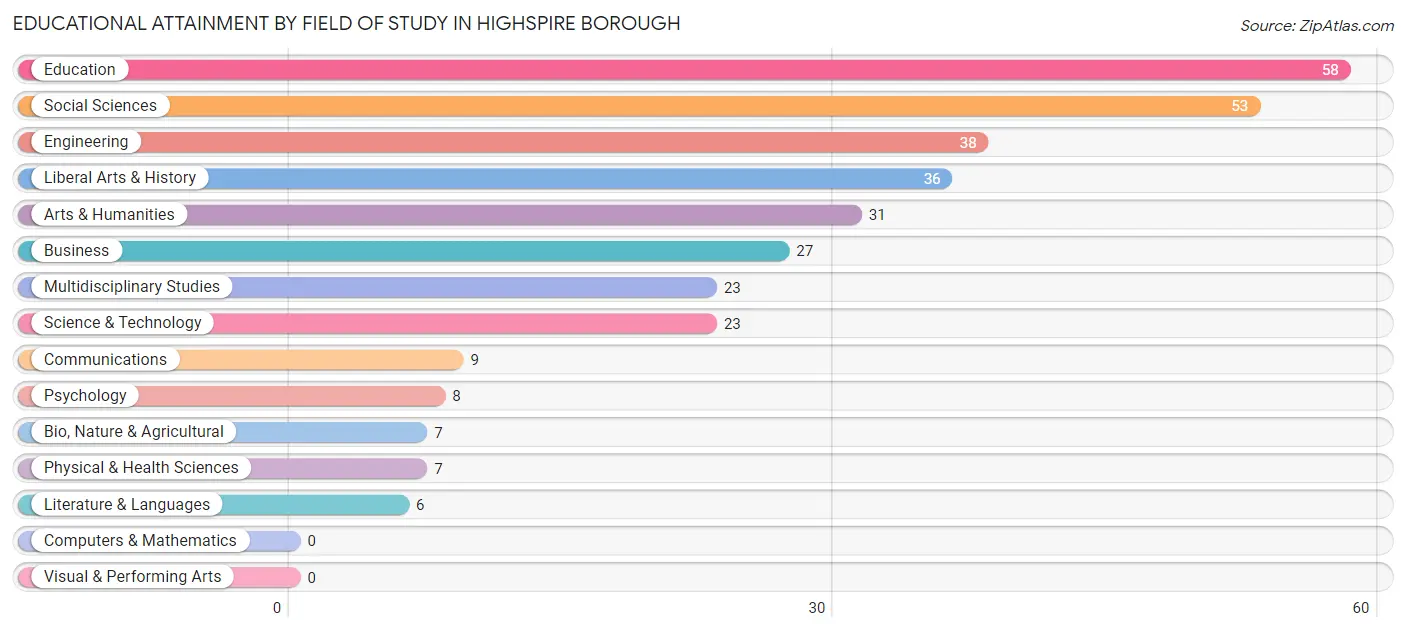
| Field of Study | # Graduates | % Graduates |
| Computers & Mathematics | 0 | 0.0% |
| Bio, Nature & Agricultural | 7 | 2.1% |
| Physical & Health Sciences | 7 | 2.1% |
| Psychology | 8 | 2.5% |
| Social Sciences | 53 | 16.3% |
| Engineering | 38 | 11.7% |
| Multidisciplinary Studies | 23 | 7.1% |
| Science & Technology | 23 | 7.1% |
| Business | 27 | 8.3% |
| Education | 58 | 17.8% |
| Literature & Languages | 6 | 1.8% |
| Liberal Arts & History | 36 | 11.0% |
| Visual & Performing Arts | 0 | 0.0% |
| Communications | 9 | 2.8% |
| Arts & Humanities | 31 | 9.5% |
| Total | 326 | 100.0% |
Transportation & Commute in Highspire borough
Vehicle Availability by Sex in Highspire borough
The most prevalent vehicle ownership categories in Highspire borough are males with 1 vehicle (396, accounting for 53.4%) and females with 1 vehicle (206, making up 72.0%).
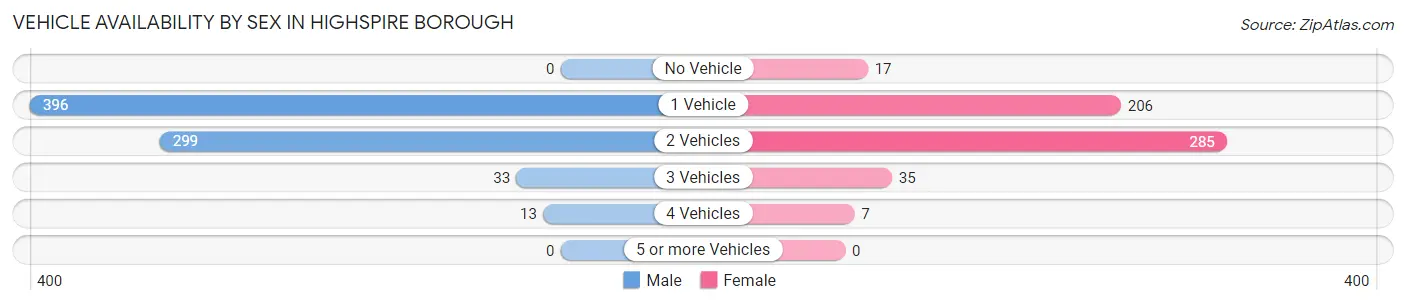
| Vehicles Available | Male | Female |
| No Vehicle | 0 (0.0%) | 17 (3.1%) |
| 1 Vehicle | 396 (53.4%) | 206 (37.4%) |
| 2 Vehicles | 299 (40.4%) | 285 (51.8%) |
| 3 Vehicles | 33 (4.4%) | 35 (6.4%) |
| 4 Vehicles | 13 (1.8%) | 7 (1.3%) |
| 5 or more Vehicles | 0 (0.0%) | 0 (0.0%) |
| Total | 741 (100.0%) | 550 (100.0%) |
Commute Time in Highspire borough
The most frequently occuring commute durations in Highspire borough are 20 to 24 minutes (388 commuters, 32.8%), 10 to 14 minutes (261 commuters, 22.1%), and 15 to 19 minutes (229 commuters, 19.4%).
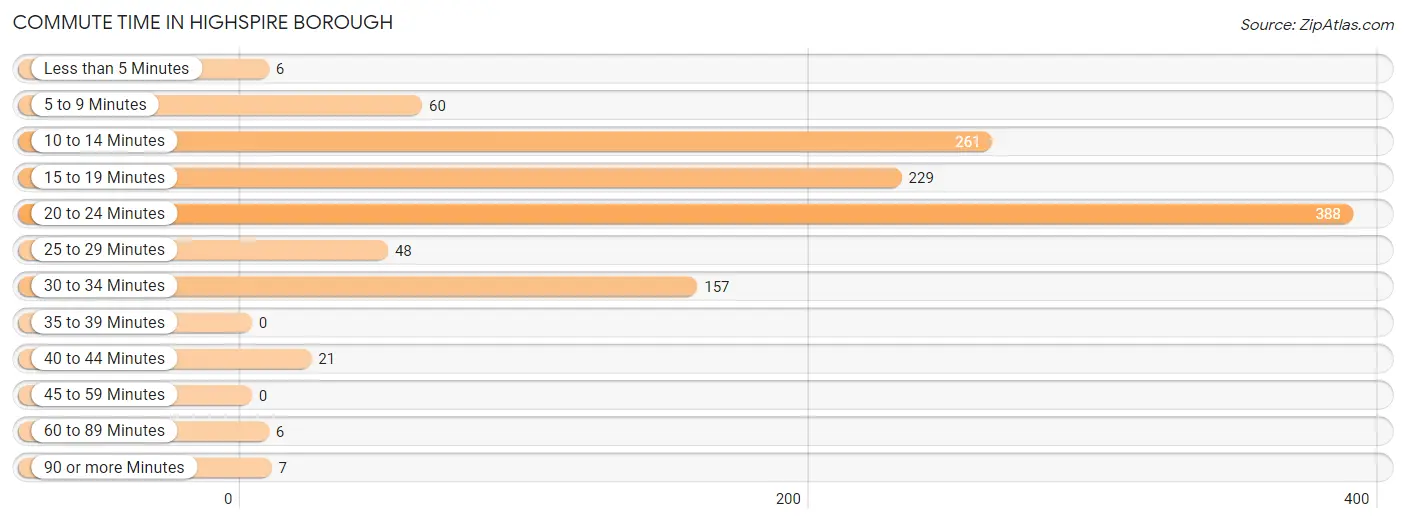
| Commute Time | # Commuters | % Commuters |
| Less than 5 Minutes | 6 | 0.5% |
| 5 to 9 Minutes | 60 | 5.1% |
| 10 to 14 Minutes | 261 | 22.1% |
| 15 to 19 Minutes | 229 | 19.4% |
| 20 to 24 Minutes | 388 | 32.8% |
| 25 to 29 Minutes | 48 | 4.1% |
| 30 to 34 Minutes | 157 | 13.3% |
| 35 to 39 Minutes | 0 | 0.0% |
| 40 to 44 Minutes | 21 | 1.8% |
| 45 to 59 Minutes | 0 | 0.0% |
| 60 to 89 Minutes | 6 | 0.5% |
| 90 or more Minutes | 7 | 0.6% |
Commute Time by Sex in Highspire borough
The most common commute times in Highspire borough are 10 to 14 minutes (177 commuters, 24.9%) for males and 20 to 24 minutes (214 commuters, 45.2%) for females.
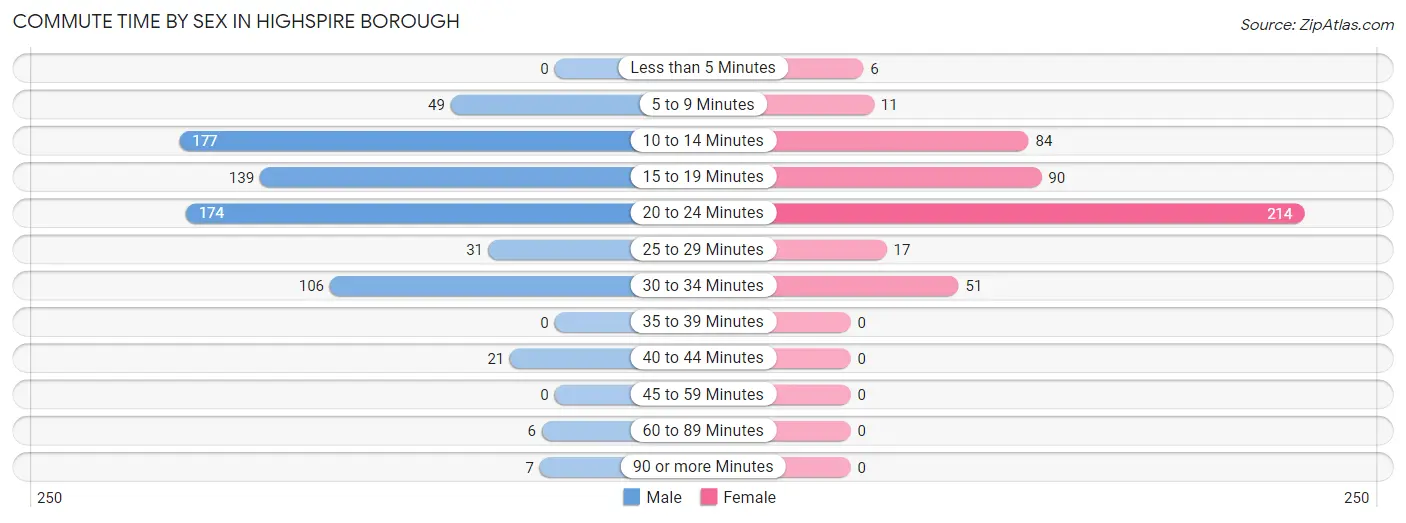
| Commute Time | Male | Female |
| Less than 5 Minutes | 0 (0.0%) | 6 (1.3%) |
| 5 to 9 Minutes | 49 (6.9%) | 11 (2.3%) |
| 10 to 14 Minutes | 177 (24.9%) | 84 (17.8%) |
| 15 to 19 Minutes | 139 (19.6%) | 90 (19.0%) |
| 20 to 24 Minutes | 174 (24.5%) | 214 (45.2%) |
| 25 to 29 Minutes | 31 (4.4%) | 17 (3.6%) |
| 30 to 34 Minutes | 106 (14.9%) | 51 (10.8%) |
| 35 to 39 Minutes | 0 (0.0%) | 0 (0.0%) |
| 40 to 44 Minutes | 21 (3.0%) | 0 (0.0%) |
| 45 to 59 Minutes | 0 (0.0%) | 0 (0.0%) |
| 60 to 89 Minutes | 6 (0.9%) | 0 (0.0%) |
| 90 or more Minutes | 7 (1.0%) | 0 (0.0%) |
Time of Departure to Work by Sex in Highspire borough
The most frequent times of departure to work in Highspire borough are 7:30 AM to 7:59 AM (141, 19.9%) for males and 7:00 AM to 7:29 AM (84, 17.8%) for females.
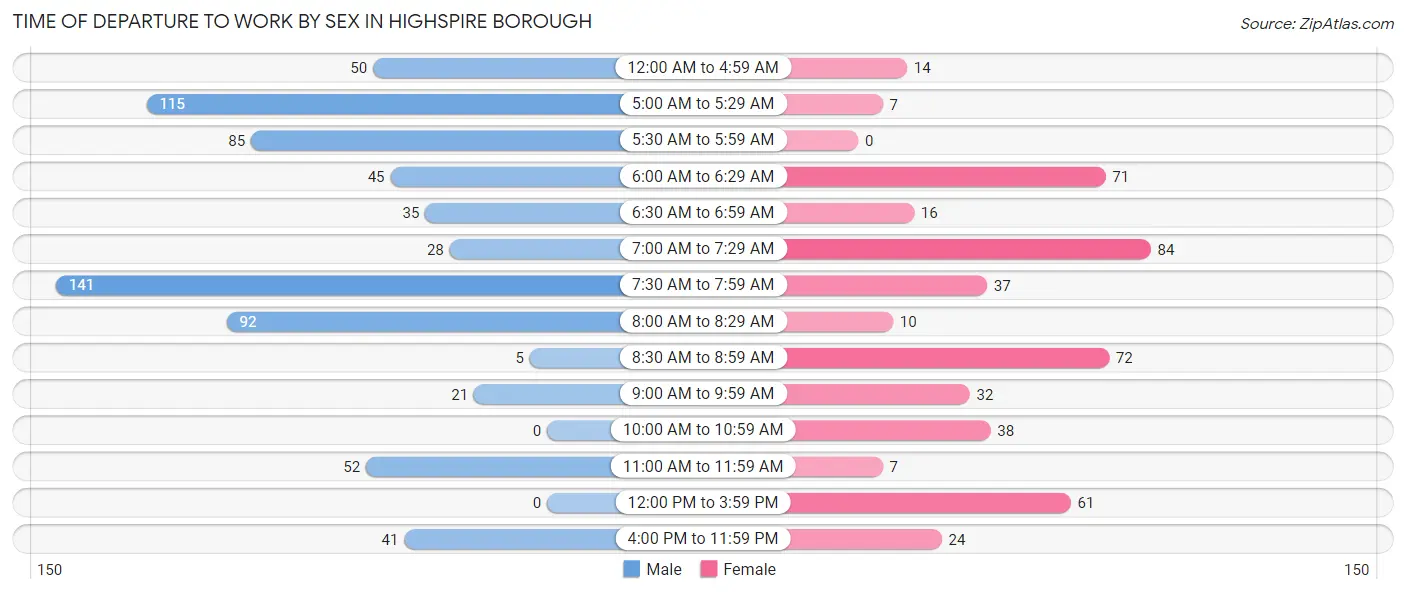
| Time of Departure | Male | Female |
| 12:00 AM to 4:59 AM | 50 (7.0%) | 14 (3.0%) |
| 5:00 AM to 5:29 AM | 115 (16.2%) | 7 (1.5%) |
| 5:30 AM to 5:59 AM | 85 (12.0%) | 0 (0.0%) |
| 6:00 AM to 6:29 AM | 45 (6.3%) | 71 (15.0%) |
| 6:30 AM to 6:59 AM | 35 (4.9%) | 16 (3.4%) |
| 7:00 AM to 7:29 AM | 28 (3.9%) | 84 (17.8%) |
| 7:30 AM to 7:59 AM | 141 (19.9%) | 37 (7.8%) |
| 8:00 AM to 8:29 AM | 92 (13.0%) | 10 (2.1%) |
| 8:30 AM to 8:59 AM | 5 (0.7%) | 72 (15.2%) |
| 9:00 AM to 9:59 AM | 21 (3.0%) | 32 (6.8%) |
| 10:00 AM to 10:59 AM | 0 (0.0%) | 38 (8.0%) |
| 11:00 AM to 11:59 AM | 52 (7.3%) | 7 (1.5%) |
| 12:00 PM to 3:59 PM | 0 (0.0%) | 61 (12.9%) |
| 4:00 PM to 11:59 PM | 41 (5.8%) | 24 (5.1%) |
| Total | 710 (100.0%) | 473 (100.0%) |
Housing Occupancy in Highspire borough
Occupancy by Ownership in Highspire borough
Of the total 1,281 dwellings in Highspire borough, owner-occupied units account for 614 (47.9%), while renter-occupied units make up 667 (52.1%).
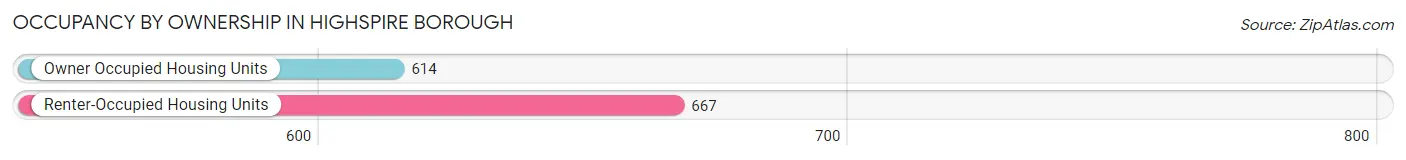
| Occupancy | # Housing Units | % Housing Units |
| Owner Occupied Housing Units | 614 | 47.9% |
| Renter-Occupied Housing Units | 667 | 52.1% |
| Total Occupied Housing Units | 1,281 | 100.0% |
Occupancy by Household Size in Highspire borough
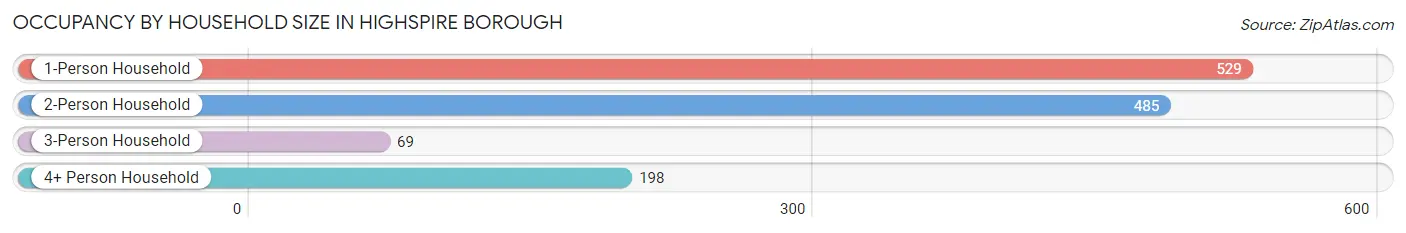
| Household Size | # Housing Units | % Housing Units |
| 1-Person Household | 529 | 41.3% |
| 2-Person Household | 485 | 37.9% |
| 3-Person Household | 69 | 5.4% |
| 4+ Person Household | 198 | 15.5% |
| Total Housing Units | 1,281 | 100.0% |
Occupancy by Ownership by Household Size in Highspire borough
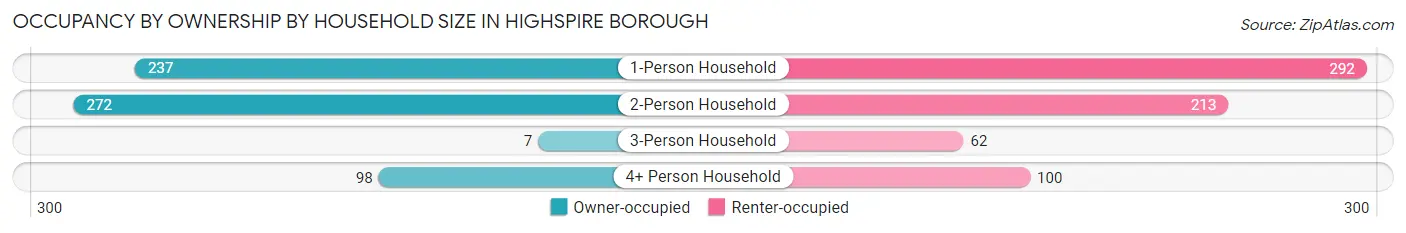
| Household Size | Owner-occupied | Renter-occupied |
| 1-Person Household | 237 (44.8%) | 292 (55.2%) |
| 2-Person Household | 272 (56.1%) | 213 (43.9%) |
| 3-Person Household | 7 (10.1%) | 62 (89.9%) |
| 4+ Person Household | 98 (49.5%) | 100 (50.5%) |
| Total Housing Units | 614 (47.9%) | 667 (52.1%) |
Occupancy by Educational Attainment in Highspire borough
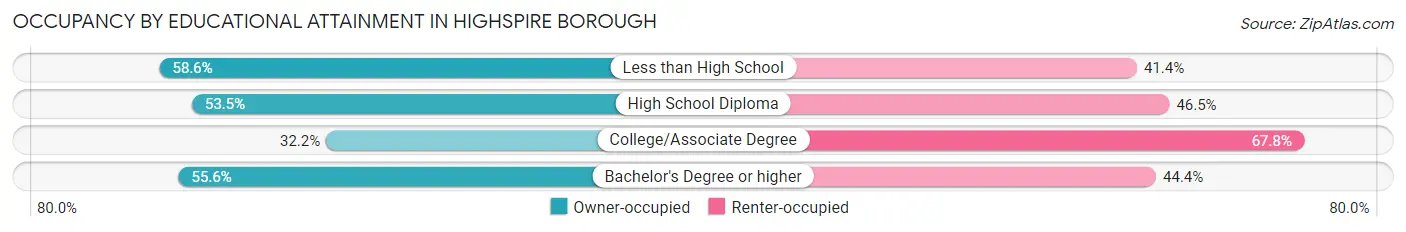
| Household Size | Owner-occupied | Renter-occupied |
| Less than High School | 51 (58.6%) | 36 (41.4%) |
| High School Diploma | 307 (53.5%) | 267 (46.5%) |
| College/Associate Degree | 122 (32.2%) | 257 (67.8%) |
| Bachelor's Degree or higher | 134 (55.6%) | 107 (44.4%) |
Occupancy by Age of Householder in Highspire borough
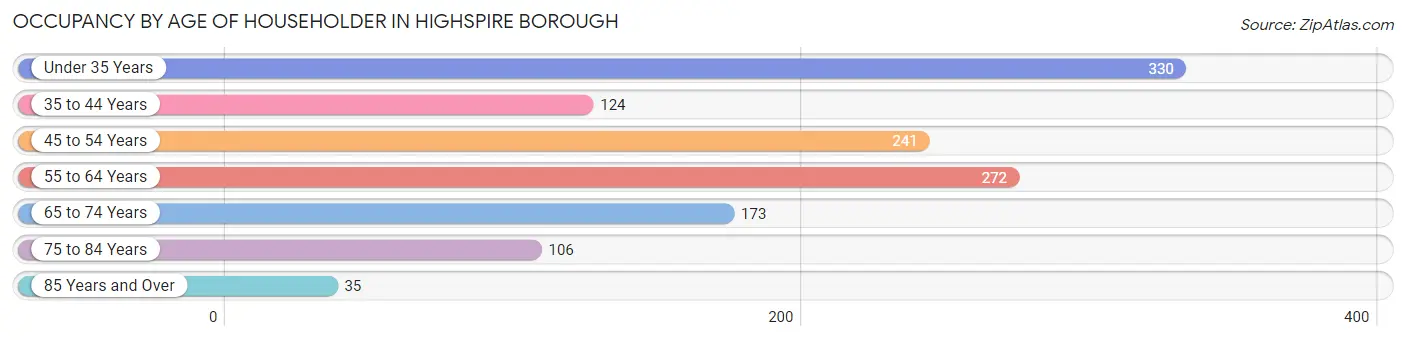
| Age Bracket | # Households | % Households |
| Under 35 Years | 330 | 25.8% |
| 35 to 44 Years | 124 | 9.7% |
| 45 to 54 Years | 241 | 18.8% |
| 55 to 64 Years | 272 | 21.2% |
| 65 to 74 Years | 173 | 13.5% |
| 75 to 84 Years | 106 | 8.3% |
| 85 Years and Over | 35 | 2.7% |
| Total | 1,281 | 100.0% |
Housing Finances in Highspire borough
Median Income by Occupancy in Highspire borough
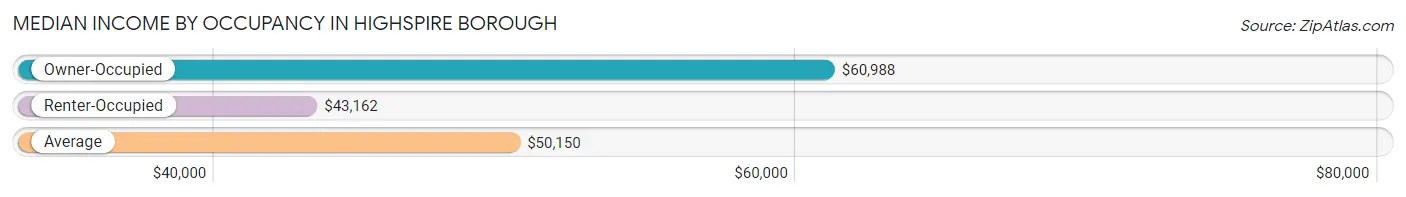
| Occupancy Type | # Households | Median Income |
| Owner-Occupied | 614 (47.9%) | $60,988 |
| Renter-Occupied | 667 (52.1%) | $43,162 |
| Average | 1,281 (100.0%) | $50,150 |
Occupancy by Householder Income Bracket in Highspire borough
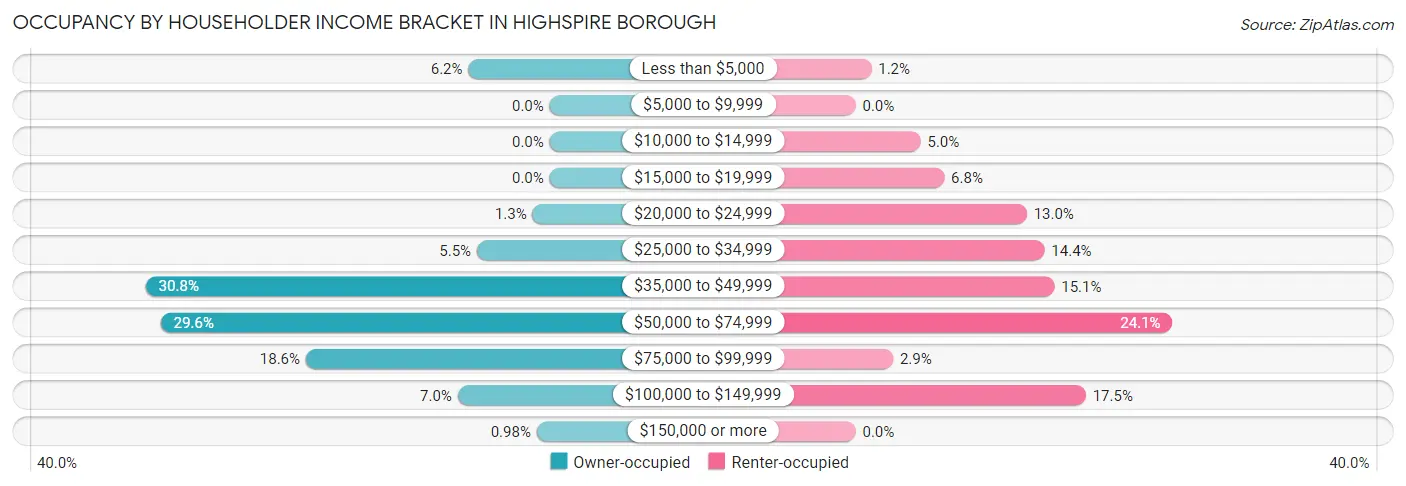
| Income Bracket | Owner-occupied | Renter-occupied |
| Less than $5,000 | 38 (6.2%) | 8 (1.2%) |
| $5,000 to $9,999 | 0 (0.0%) | 0 (0.0%) |
| $10,000 to $14,999 | 0 (0.0%) | 33 (5.0%) |
| $15,000 to $19,999 | 0 (0.0%) | 45 (6.8%) |
| $20,000 to $24,999 | 8 (1.3%) | 87 (13.0%) |
| $25,000 to $34,999 | 34 (5.5%) | 96 (14.4%) |
| $35,000 to $49,999 | 189 (30.8%) | 101 (15.1%) |
| $50,000 to $74,999 | 182 (29.6%) | 161 (24.1%) |
| $75,000 to $99,999 | 114 (18.6%) | 19 (2.9%) |
| $100,000 to $149,999 | 43 (7.0%) | 117 (17.5%) |
| $150,000 or more | 6 (1.0%) | 0 (0.0%) |
| Total | 614 (100.0%) | 667 (100.0%) |
Monthly Housing Cost Tiers in Highspire borough
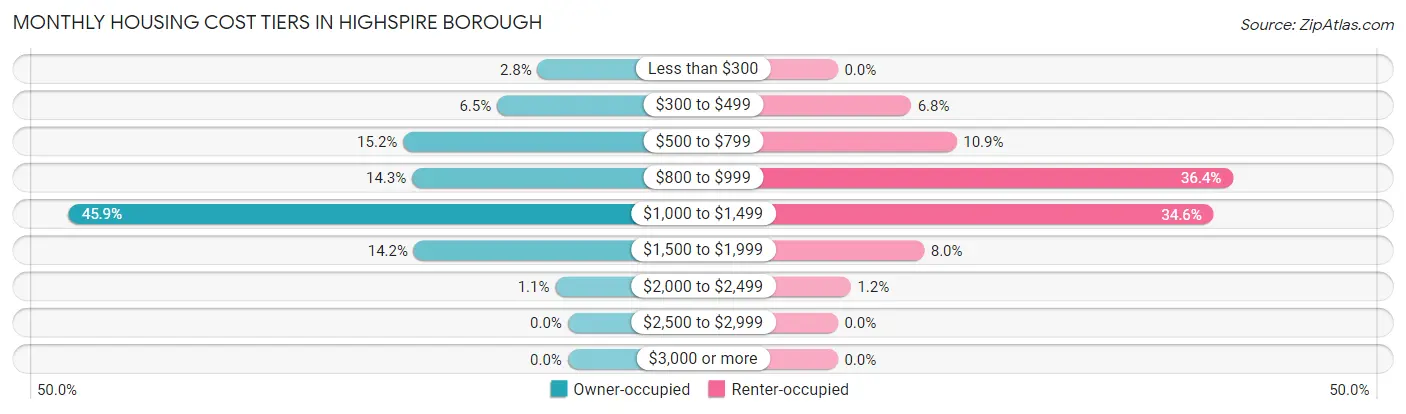
| Monthly Cost | Owner-occupied | Renter-occupied |
| Less than $300 | 17 (2.8%) | 0 (0.0%) |
| $300 to $499 | 40 (6.5%) | 45 (6.8%) |
| $500 to $799 | 93 (15.1%) | 73 (10.9%) |
| $800 to $999 | 88 (14.3%) | 243 (36.4%) |
| $1,000 to $1,499 | 282 (45.9%) | 231 (34.6%) |
| $1,500 to $1,999 | 87 (14.2%) | 53 (8.0%) |
| $2,000 to $2,499 | 7 (1.1%) | 8 (1.2%) |
| $2,500 to $2,999 | 0 (0.0%) | 0 (0.0%) |
| $3,000 or more | 0 (0.0%) | 0 (0.0%) |
| Total | 614 (100.0%) | 667 (100.0%) |
Physical Housing Characteristics in Highspire borough
Housing Structures in Highspire borough
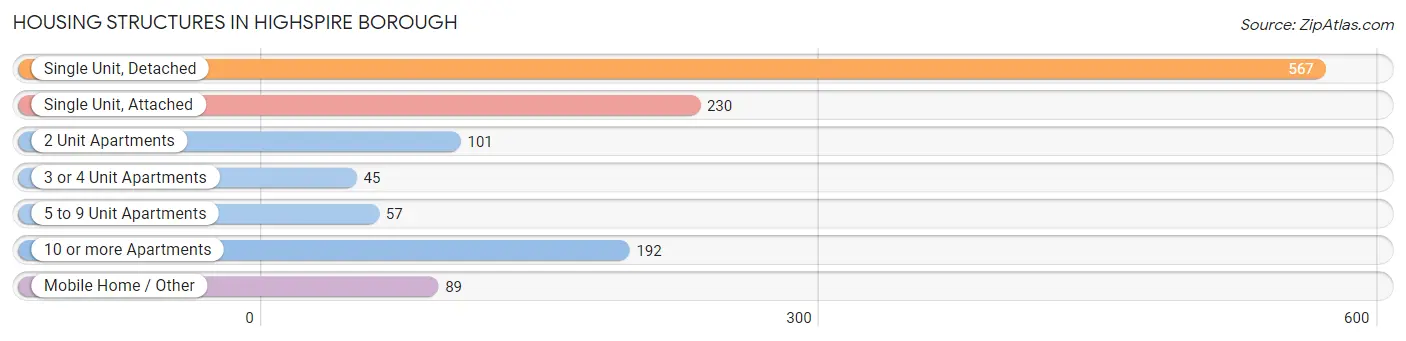
| Structure Type | # Housing Units | % Housing Units |
| Single Unit, Detached | 567 | 44.3% |
| Single Unit, Attached | 230 | 17.9% |
| 2 Unit Apartments | 101 | 7.9% |
| 3 or 4 Unit Apartments | 45 | 3.5% |
| 5 to 9 Unit Apartments | 57 | 4.4% |
| 10 or more Apartments | 192 | 15.0% |
| Mobile Home / Other | 89 | 7.0% |
| Total | 1,281 | 100.0% |
Housing Structures by Occupancy in Highspire borough
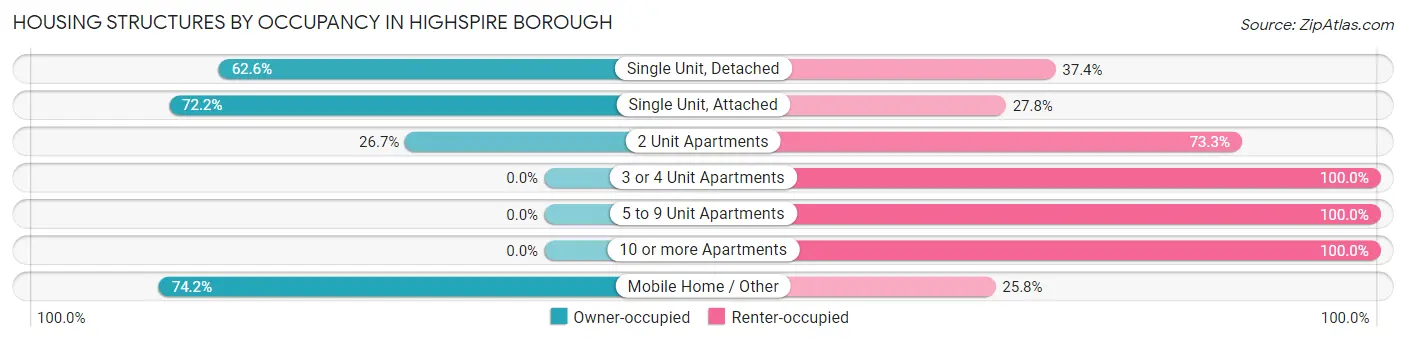
| Structure Type | Owner-occupied | Renter-occupied |
| Single Unit, Detached | 355 (62.6%) | 212 (37.4%) |
| Single Unit, Attached | 166 (72.2%) | 64 (27.8%) |
| 2 Unit Apartments | 27 (26.7%) | 74 (73.3%) |
| 3 or 4 Unit Apartments | 0 (0.0%) | 45 (100.0%) |
| 5 to 9 Unit Apartments | 0 (0.0%) | 57 (100.0%) |
| 10 or more Apartments | 0 (0.0%) | 192 (100.0%) |
| Mobile Home / Other | 66 (74.2%) | 23 (25.8%) |
| Total | 614 (47.9%) | 667 (52.1%) |
Housing Structures by Number of Rooms in Highspire borough
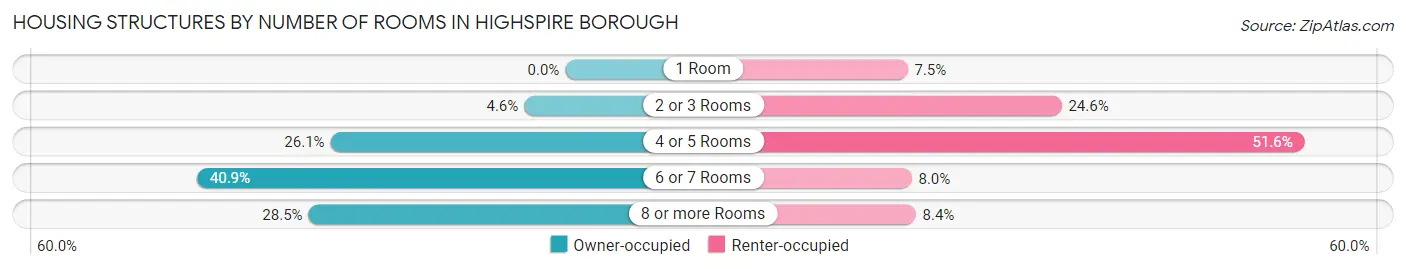
| Number of Rooms | Owner-occupied | Renter-occupied |
| 1 Room | 0 (0.0%) | 50 (7.5%) |
| 2 or 3 Rooms | 28 (4.6%) | 164 (24.6%) |
| 4 or 5 Rooms | 160 (26.1%) | 344 (51.6%) |
| 6 or 7 Rooms | 251 (40.9%) | 53 (8.0%) |
| 8 or more Rooms | 175 (28.5%) | 56 (8.4%) |
| Total | 614 (100.0%) | 667 (100.0%) |
Housing Structure by Heating Type in Highspire borough
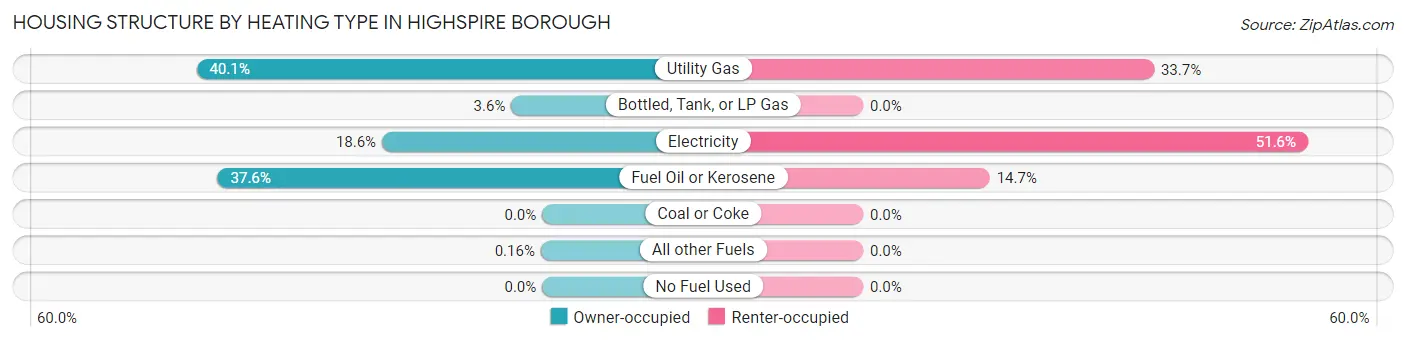
| Heating Type | Owner-occupied | Renter-occupied |
| Utility Gas | 246 (40.1%) | 225 (33.7%) |
| Bottled, Tank, or LP Gas | 22 (3.6%) | 0 (0.0%) |
| Electricity | 114 (18.6%) | 344 (51.6%) |
| Fuel Oil or Kerosene | 231 (37.6%) | 98 (14.7%) |
| Coal or Coke | 0 (0.0%) | 0 (0.0%) |
| All other Fuels | 1 (0.2%) | 0 (0.0%) |
| No Fuel Used | 0 (0.0%) | 0 (0.0%) |
| Total | 614 (100.0%) | 667 (100.0%) |
Household Vehicle Usage in Highspire borough
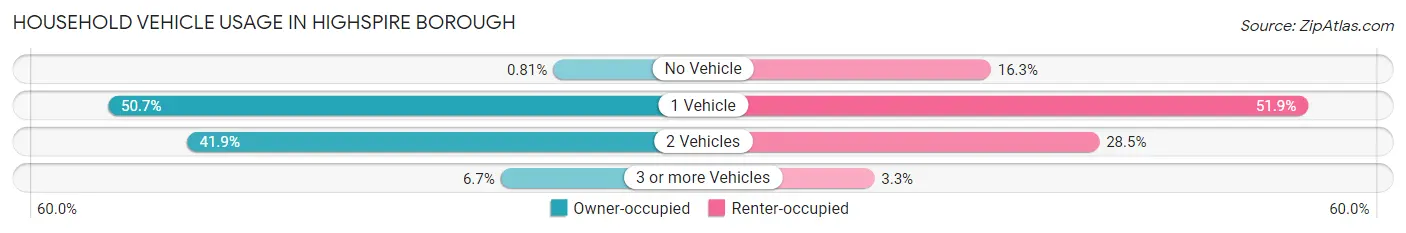
| Vehicles per Household | Owner-occupied | Renter-occupied |
| No Vehicle | 5 (0.8%) | 109 (16.3%) |
| 1 Vehicle | 311 (50.6%) | 346 (51.9%) |
| 2 Vehicles | 257 (41.9%) | 190 (28.5%) |
| 3 or more Vehicles | 41 (6.7%) | 22 (3.3%) |
| Total | 614 (100.0%) | 667 (100.0%) |
Real Estate & Mortgages in Highspire borough
Real Estate and Mortgage Overview in Highspire borough
| Characteristic | Without Mortgage | With Mortgage |
| Housing Units | 213 | 401 |
| Median Property Value | $105,100 | $111,000 |
| Median Household Income | $48,828 | $6 |
| Monthly Housing Costs | $756 | $0 |
| Real Estate Taxes | $2,583 | $0 |
Property Value by Mortgage Status in Highspire borough
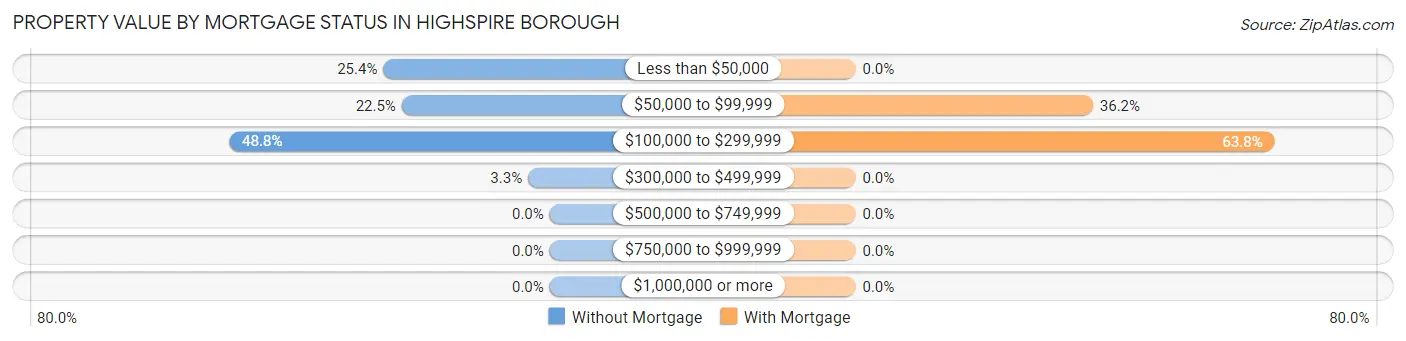
| Property Value | Without Mortgage | With Mortgage |
| Less than $50,000 | 54 (25.4%) | 0 (0.0%) |
| $50,000 to $99,999 | 48 (22.5%) | 145 (36.2%) |
| $100,000 to $299,999 | 104 (48.8%) | 256 (63.8%) |
| $300,000 to $499,999 | 7 (3.3%) | 0 (0.0%) |
| $500,000 to $749,999 | 0 (0.0%) | 0 (0.0%) |
| $750,000 to $999,999 | 0 (0.0%) | 0 (0.0%) |
| $1,000,000 or more | 0 (0.0%) | 0 (0.0%) |
| Total | 213 (100.0%) | 401 (100.0%) |
Household Income by Mortgage Status in Highspire borough
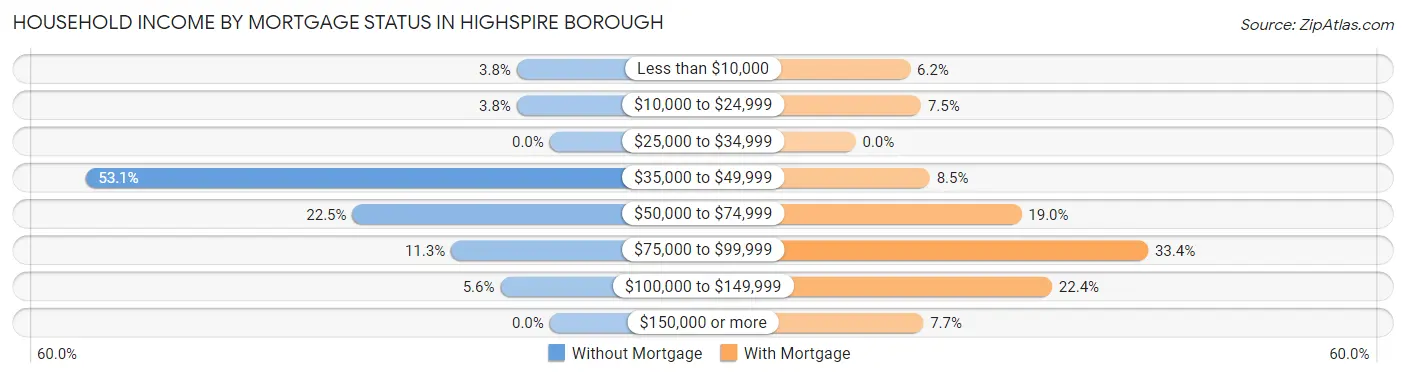
| Household Income | Without Mortgage | With Mortgage |
| Less than $10,000 | 8 (3.8%) | 25 (6.2%) |
| $10,000 to $24,999 | 8 (3.8%) | 30 (7.5%) |
| $25,000 to $34,999 | 0 (0.0%) | 0 (0.0%) |
| $35,000 to $49,999 | 113 (53.0%) | 34 (8.5%) |
| $50,000 to $74,999 | 48 (22.5%) | 76 (19.0%) |
| $75,000 to $99,999 | 24 (11.3%) | 134 (33.4%) |
| $100,000 to $149,999 | 12 (5.6%) | 90 (22.4%) |
| $150,000 or more | 0 (0.0%) | 31 (7.7%) |
| Total | 213 (100.0%) | 401 (100.0%) |
Property Value to Household Income Ratio in Highspire borough
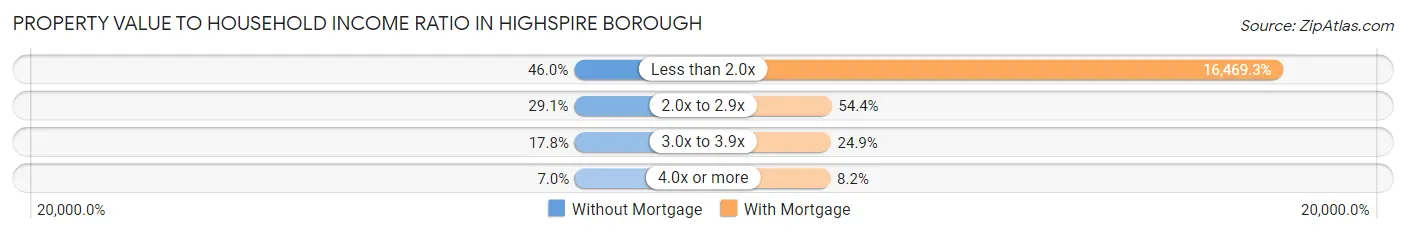
| Value-to-Income Ratio | Without Mortgage | With Mortgage |
| Less than 2.0x | 98 (46.0%) | 66,042 (16,469.3%) |
| 2.0x to 2.9x | 62 (29.1%) | 218 (54.4%) |
| 3.0x to 3.9x | 38 (17.8%) | 100 (24.9%) |
| 4.0x or more | 15 (7.0%) | 33 (8.2%) |
| Total | 213 (100.0%) | 401 (100.0%) |
Real Estate Taxes by Mortgage Status in Highspire borough
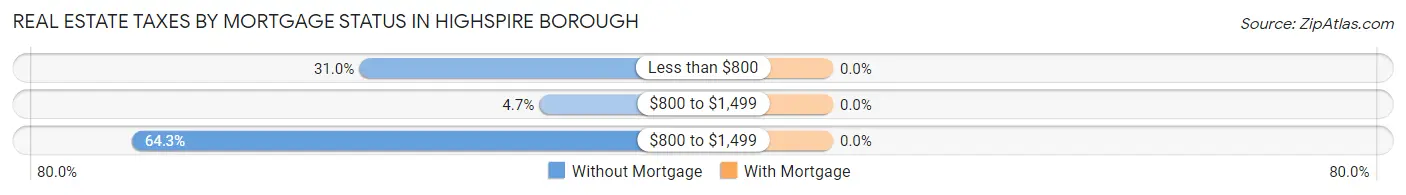
| Property Taxes | Without Mortgage | With Mortgage |
| Less than $800 | 66 (31.0%) | 0 (0.0%) |
| $800 to $1,499 | 10 (4.7%) | 0 (0.0%) |
| $800 to $1,499 | 137 (64.3%) | 0 (0.0%) |
| Total | 213 (100.0%) | 401 (100.0%) |
Health & Disability in Highspire borough
Health Insurance Coverage by Age in Highspire borough
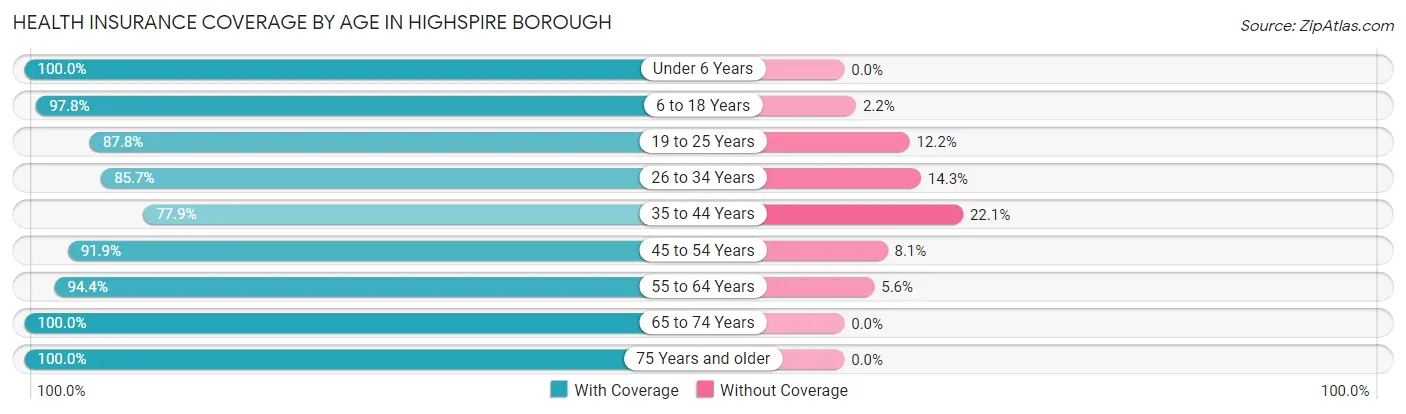
| Age Bracket | With Coverage | Without Coverage |
| Under 6 Years | 178 (100.0%) | 0 (0.0%) |
| 6 to 18 Years | 449 (97.8%) | 10 (2.2%) |
| 19 to 25 Years | 317 (87.8%) | 44 (12.2%) |
| 26 to 34 Years | 246 (85.7%) | 41 (14.3%) |
| 35 to 44 Years | 190 (77.9%) | 54 (22.1%) |
| 45 to 54 Years | 388 (91.9%) | 34 (8.1%) |
| 55 to 64 Years | 338 (94.4%) | 20 (5.6%) |
| 65 to 74 Years | 221 (100.0%) | 0 (0.0%) |
| 75 Years and older | 179 (100.0%) | 0 (0.0%) |
| Total | 2,506 (92.5%) | 203 (7.5%) |
Health Insurance Coverage by Citizenship Status in Highspire borough
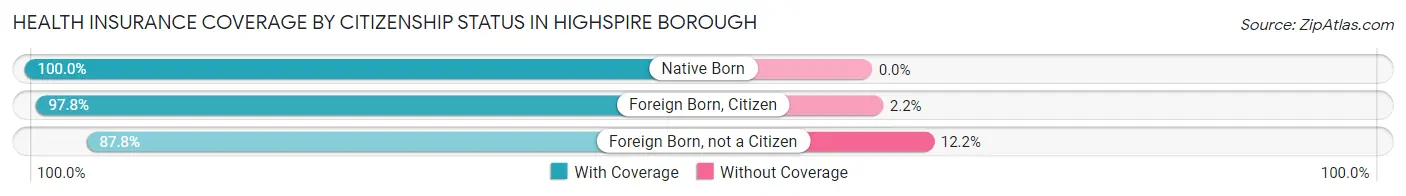
| Citizenship Status | With Coverage | Without Coverage |
| Native Born | 178 (100.0%) | 0 (0.0%) |
| Foreign Born, Citizen | 449 (97.8%) | 10 (2.2%) |
| Foreign Born, not a Citizen | 317 (87.8%) | 44 (12.2%) |
Health Insurance Coverage by Household Income in Highspire borough
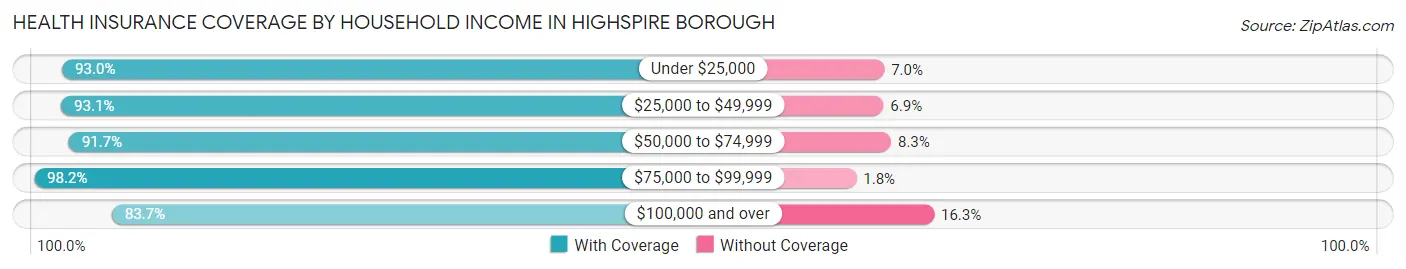
| Household Income | With Coverage | Without Coverage |
| Under $25,000 | 345 (93.0%) | 26 (7.0%) |
| $25,000 to $49,999 | 625 (93.1%) | 46 (6.9%) |
| $50,000 to $74,999 | 686 (91.7%) | 62 (8.3%) |
| $75,000 to $99,999 | 548 (98.2%) | 10 (1.8%) |
| $100,000 and over | 302 (83.7%) | 59 (16.3%) |
Public vs Private Health Insurance Coverage by Age in Highspire borough
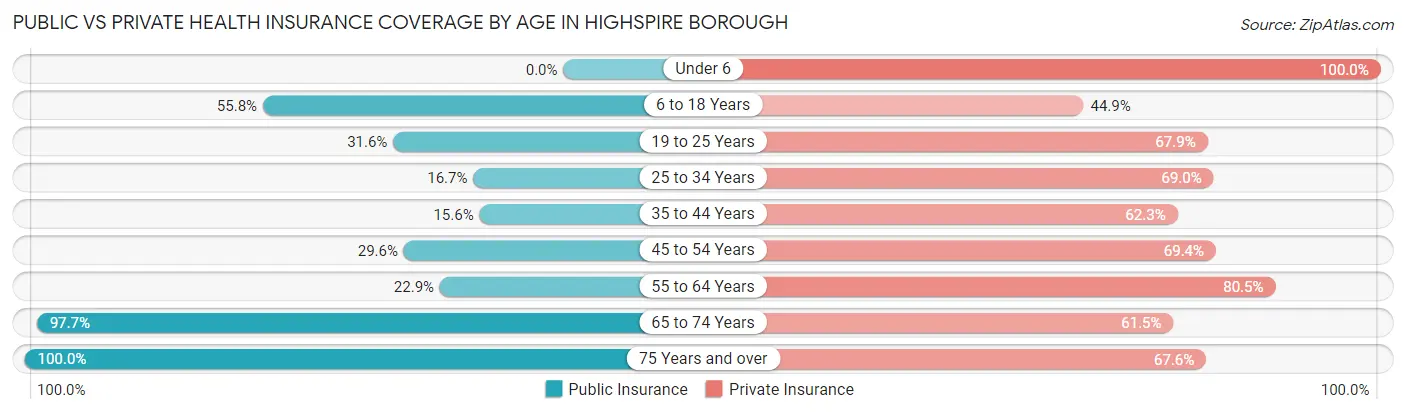
| Age Bracket | Public Insurance | Private Insurance |
| Under 6 | 0 (0.0%) | 178 (100.0%) |
| 6 to 18 Years | 256 (55.8%) | 206 (44.9%) |
| 19 to 25 Years | 114 (31.6%) | 245 (67.9%) |
| 25 to 34 Years | 48 (16.7%) | 198 (69.0%) |
| 35 to 44 Years | 38 (15.6%) | 152 (62.3%) |
| 45 to 54 Years | 125 (29.6%) | 293 (69.4%) |
| 55 to 64 Years | 82 (22.9%) | 288 (80.4%) |
| 65 to 74 Years | 216 (97.7%) | 136 (61.5%) |
| 75 Years and over | 179 (100.0%) | 121 (67.6%) |
| Total | 1,058 (39.1%) | 1,817 (67.1%) |
Disability Status by Sex by Age in Highspire borough
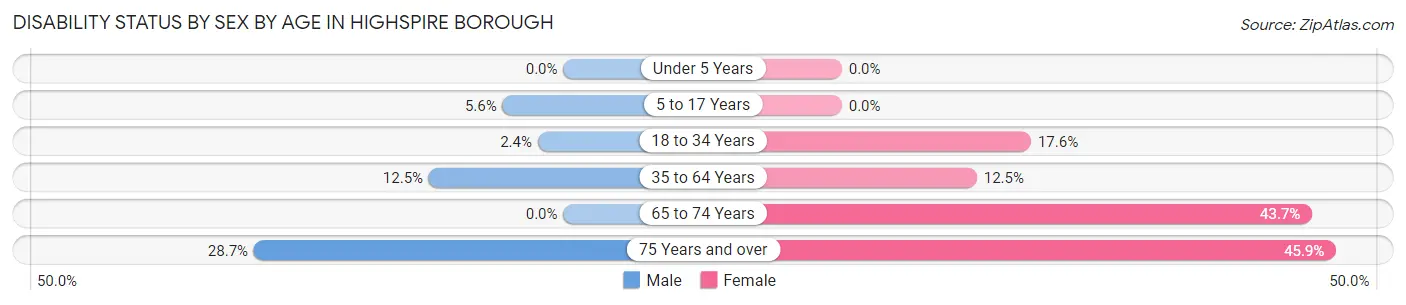
| Age Bracket | Male | Female |
| Under 5 Years | 0 (0.0%) | 0 (0.0%) |
| 5 to 17 Years | 18 (5.6%) | 0 (0.0%) |
| 18 to 34 Years | 7 (2.4%) | 62 (17.6%) |
| 35 to 64 Years | 70 (12.5%) | 58 (12.5%) |
| 65 to 74 Years | 0 (0.0%) | 55 (43.6%) |
| 75 Years and over | 27 (28.7%) | 39 (45.9%) |
Disability Class by Sex by Age in Highspire borough
Disability Class: Hearing Difficulty
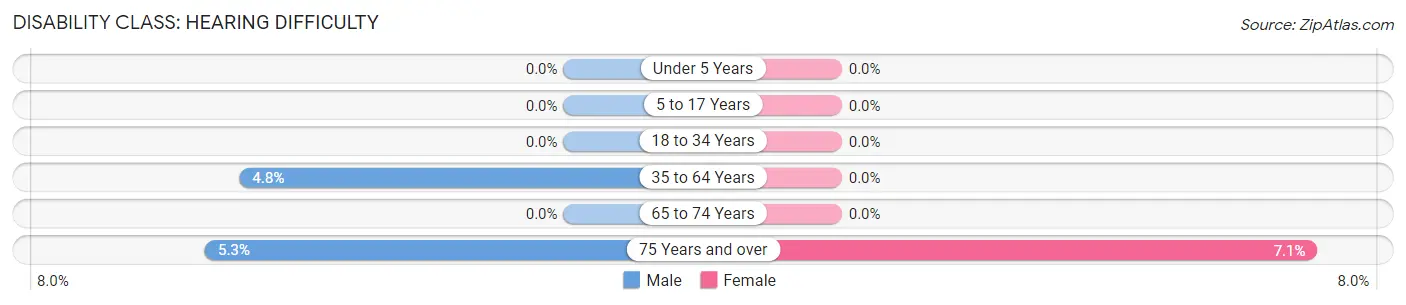
| Age Bracket | Male | Female |
| Under 5 Years | 0 (0.0%) | 0 (0.0%) |
| 5 to 17 Years | 0 (0.0%) | 0 (0.0%) |
| 18 to 34 Years | 0 (0.0%) | 0 (0.0%) |
| 35 to 64 Years | 27 (4.8%) | 0 (0.0%) |
| 65 to 74 Years | 0 (0.0%) | 0 (0.0%) |
| 75 Years and over | 5 (5.3%) | 6 (7.1%) |
Disability Class: Vision Difficulty
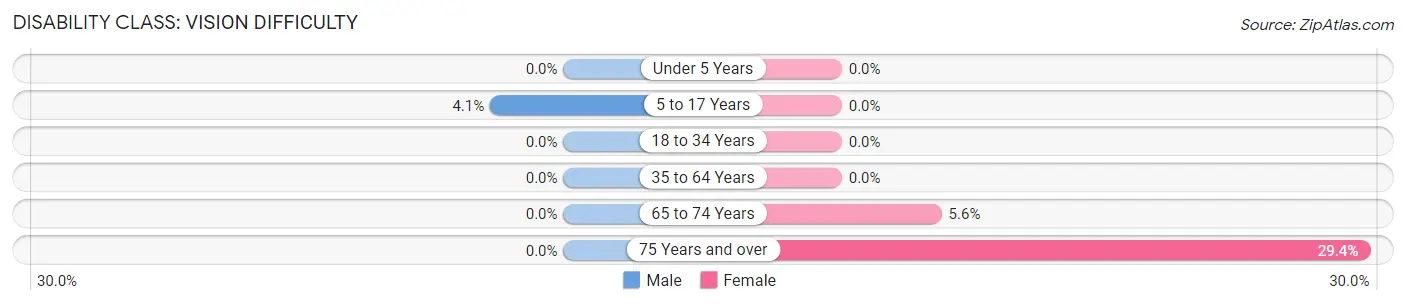
| Age Bracket | Male | Female |
| Under 5 Years | 0 (0.0%) | 0 (0.0%) |
| 5 to 17 Years | 13 (4.1%) | 0 (0.0%) |
| 18 to 34 Years | 0 (0.0%) | 0 (0.0%) |
| 35 to 64 Years | 0 (0.0%) | 0 (0.0%) |
| 65 to 74 Years | 0 (0.0%) | 7 (5.6%) |
| 75 Years and over | 0 (0.0%) | 25 (29.4%) |
Disability Class: Cognitive Difficulty
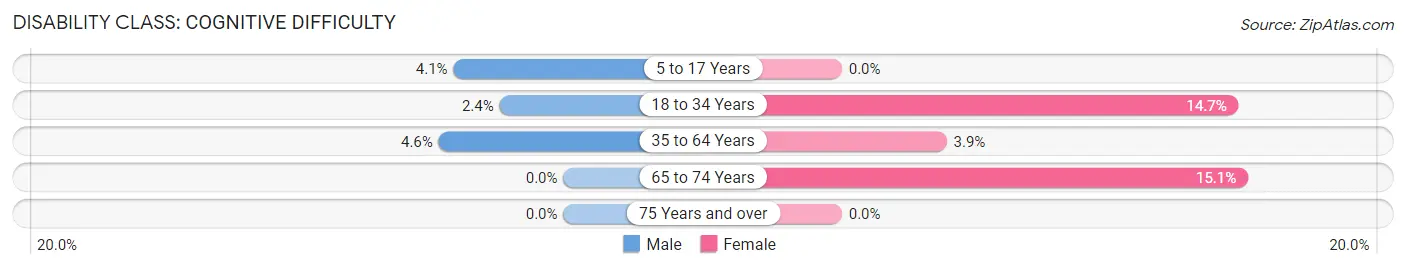
| Age Bracket | Male | Female |
| 5 to 17 Years | 13 (4.1%) | 0 (0.0%) |
| 18 to 34 Years | 7 (2.4%) | 52 (14.7%) |
| 35 to 64 Years | 26 (4.6%) | 18 (3.9%) |
| 65 to 74 Years | 0 (0.0%) | 19 (15.1%) |
| 75 Years and over | 0 (0.0%) | 0 (0.0%) |
Disability Class: Ambulatory Difficulty
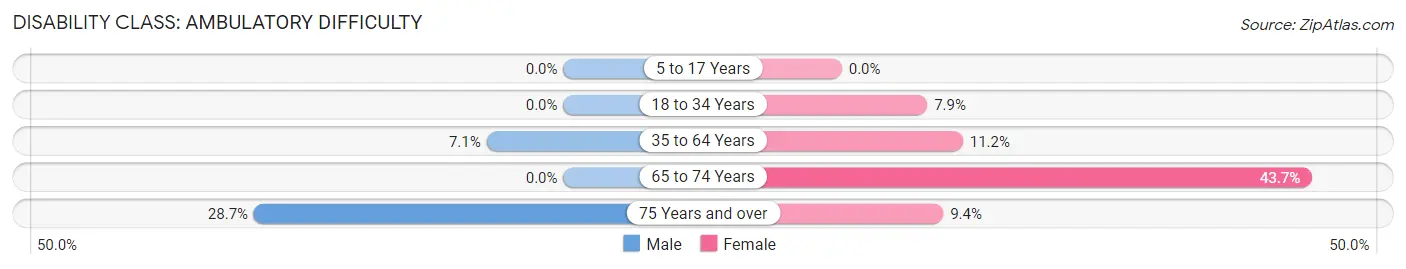
| Age Bracket | Male | Female |
| 5 to 17 Years | 0 (0.0%) | 0 (0.0%) |
| 18 to 34 Years | 0 (0.0%) | 28 (7.9%) |
| 35 to 64 Years | 40 (7.1%) | 52 (11.2%) |
| 65 to 74 Years | 0 (0.0%) | 55 (43.6%) |
| 75 Years and over | 27 (28.7%) | 8 (9.4%) |
Disability Class: Self-Care Difficulty
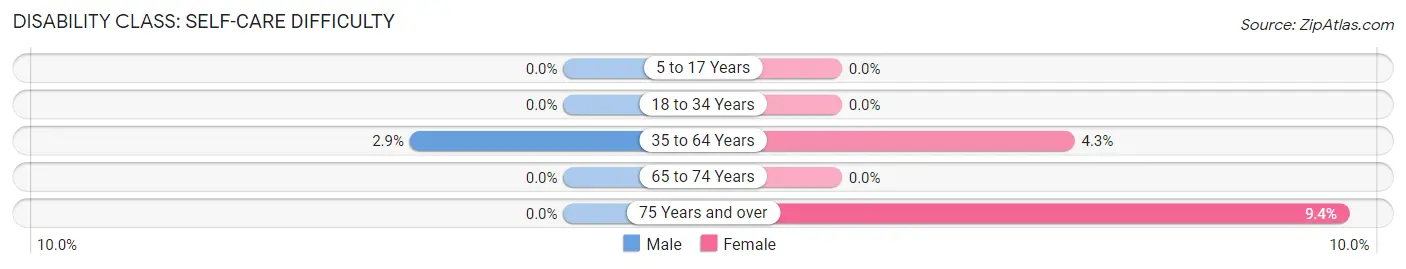
| Age Bracket | Male | Female |
| 5 to 17 Years | 0 (0.0%) | 0 (0.0%) |
| 18 to 34 Years | 0 (0.0%) | 0 (0.0%) |
| 35 to 64 Years | 16 (2.9%) | 20 (4.3%) |
| 65 to 74 Years | 0 (0.0%) | 0 (0.0%) |
| 75 Years and over | 0 (0.0%) | 8 (9.4%) |
Technology Access in Highspire borough
Computing Device Access in Highspire borough
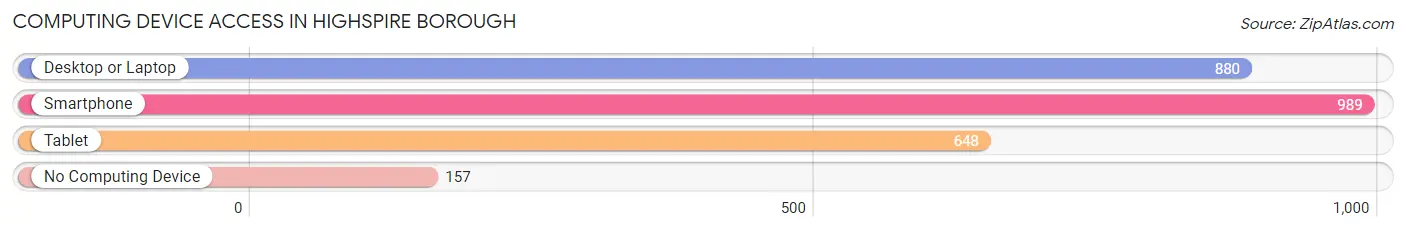
| Device Type | # Households | % Households |
| Desktop or Laptop | 880 | 68.7% |
| Smartphone | 989 | 77.2% |
| Tablet | 648 | 50.6% |
| No Computing Device | 157 | 12.3% |
| Total | 1,281 | 100.0% |
Internet Access in Highspire borough
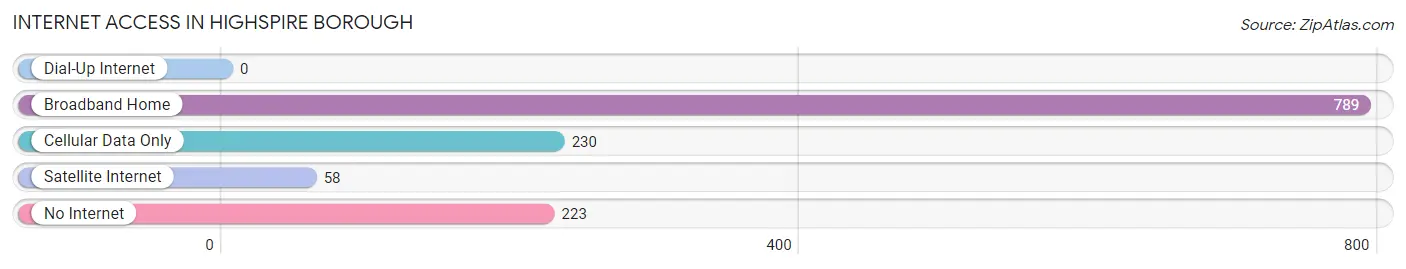
| Internet Type | # Households | % Households |
| Dial-Up Internet | 0 | 0.0% |
| Broadband Home | 789 | 61.6% |
| Cellular Data Only | 230 | 17.9% |
| Satellite Internet | 58 | 4.5% |
| No Internet | 223 | 17.4% |
| Total | 1,281 | 100.0% |
Highspire borough Summary
Highspire Borough is a small borough located in Dauphin County, Pennsylvania. It is situated along the Susquehanna River, just south of the city of Harrisburg. The borough was incorporated in 1872 and has a population of 1,845 as of the 2010 census.
Geography
Highspire Borough is located at 40°15'45" North, 76°52'45" West (40.2625, -76.8792). It is situated along the Susquehanna River, just south of the city of Harrisburg. The borough has a total area of 0.6 square miles, all of which is land.
History
Highspire Borough was first settled in the late 1700s by German immigrants. The borough was incorporated in 1872 and was named after the Highspire Iron Works, which was located in the area. The iron works was established in 1845 and was one of the largest iron works in the area. The iron works closed in 1876 and the borough has since become a residential community.
Economy
Highspire Borough is primarily a residential community, with most of its residents commuting to nearby cities for work. The borough does have a few small businesses, including a few restaurants, a convenience store, and a few other small shops.
Demographics
As of the 2010 census, Highspire Borough had a population of 1,845. The racial makeup of the borough was 94.3% White, 2.2% African American, 0.2% Native American, 0.7% Asian, 0.1% Pacific Islander, 0.9% from other races, and 1.6% from two or more races. Hispanic or Latino of any race were 2.2% of the population.
The median income for a household in the borough was $45,000, and the median income for a family was $50,000. The per capita income for the borough was $20,000. About 8.3% of families and 10.2% of the population were below the poverty line, including 14.3% of those under age 18 and 6.3% of those age 65 or over.
Highspire Borough is served by the Middletown Area School District. The borough has one elementary school, one middle school, and one high school. The borough also has a public library.
Highspire Borough is served by the Highspire Fire Company, which provides fire protection and emergency medical services to the borough. The borough is also served by the Highspire Police Department, which provides law enforcement services to the borough.
Common Questions
What is Per Capita Income in Highspire borough?
Per Capita income in Highspire borough is $26,747.
What is the Median Family Income in Highspire borough?
Median Family Income in Highspire borough is $60,288.
What is the Median Household income in Highspire borough?
Median Household Income in Highspire borough is $50,150.
What is Income or Wage Gap in Highspire borough?
Income or Wage Gap in Highspire borough is 34.7%.
Women in Highspire borough earn 65.3 cents for every dollar earned by a man.
What is Inequality or Gini Index in Highspire borough?
Inequality or Gini Index in Highspire borough is 0.33.
What is the Total Population of Highspire borough?
Total Population of Highspire borough is 2,709.
What is the Total Male Population of Highspire borough?
Total Male Population of Highspire borough is 1,386.
What is the Total Female Population of Highspire borough?
Total Female Population of Highspire borough is 1,323.
What is the Ratio of Males per 100 Females in Highspire borough?
There are 104.76 Males per 100 Females in Highspire borough.
What is the Ratio of Females per 100 Males in Highspire borough?
There are 95.45 Females per 100 Males in Highspire borough.
What is the Median Population Age in Highspire borough?
Median Population Age in Highspire borough is 36.3 Years.
What is the Average Family Size in Highspire borough
Average Family Size in Highspire borough is 2.9 People.
What is the Average Household Size in Highspire borough
Average Household Size in Highspire borough is 2.1 People.
How Large is the Labor Force in Highspire borough?
There are 1,385 People in the Labor Forcein in Highspire borough.
What is the Percentage of People in the Labor Force in Highspire borough?
63.9% of People are in the Labor Force in Highspire borough.
What is the Unemployment Rate in Highspire borough?
Unemployment Rate in Highspire borough is 5.8%.