Lock Haven, PA Map & Demographics
Lock Haven Map
Lock Haven Overview
$24,377
PER CAPITA INCOME
$52,304
AVG FAMILY INCOME
$42,930
AVG HOUSEHOLD INCOME
38.6%
WAGE / INCOME GAP [ % ]
61.4¢/ $1
WAGE / INCOME GAP [ $ ]
0.49
INEQUALITY / GINI INDEX
8,422
TOTAL POPULATION
4,043
MALE POPULATION
4,379
FEMALE POPULATION
92.33
MALES / 100 FEMALES
108.31
FEMALES / 100 MALES
27.3
MEDIAN AGE
2.7
AVG FAMILY SIZE
2.2
AVG HOUSEHOLD SIZE
4,283
LABOR FORCE [ PEOPLE ]
59.2%
PERCENT IN LABOR FORCE
7.3%
UNEMPLOYMENT RATE
Lock Haven Zip Codes
Lock Haven Area Codes
Income in Lock Haven
Income Overview in Lock Haven
Per Capita Income in Lock Haven is $24,377, while median incomes of families and households are $52,304 and $42,930 respectively.
| Characteristic | Number | Measure |
| Per Capita Income | 8,422 | $24,377 |
| Median Family Income | 1,646 | $52,304 |
| Mean Family Income | 1,646 | $73,906 |
| Median Household Income | 3,287 | $42,930 |
| Mean Household Income | 3,287 | $58,046 |
| Income Deficit | 1,646 | $0 |
| Wage / Income Gap (%) | 8,422 | 38.62% |
| Wage / Income Gap ($) | 8,422 | 61.38¢ per $1 |
| Gini / Inequality Index | 8,422 | 0.49 |
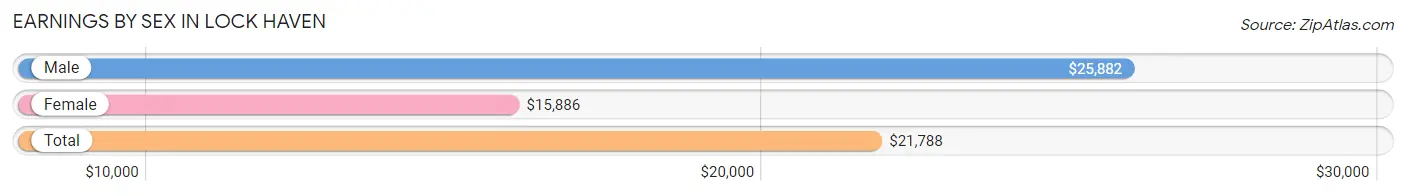
Earnings by Sex in Lock Haven
Average Earnings in Lock Haven are $21,788, $25,882 for men and $15,886 for women, a difference of 38.6%.
| Sex | Number | Average Earnings |
| Male | 2,517 (52.5%) | $25,882 |
| Female | 2,273 (47.4%) | $15,886 |
| Total | 4,790 (100.0%) | $21,788 |
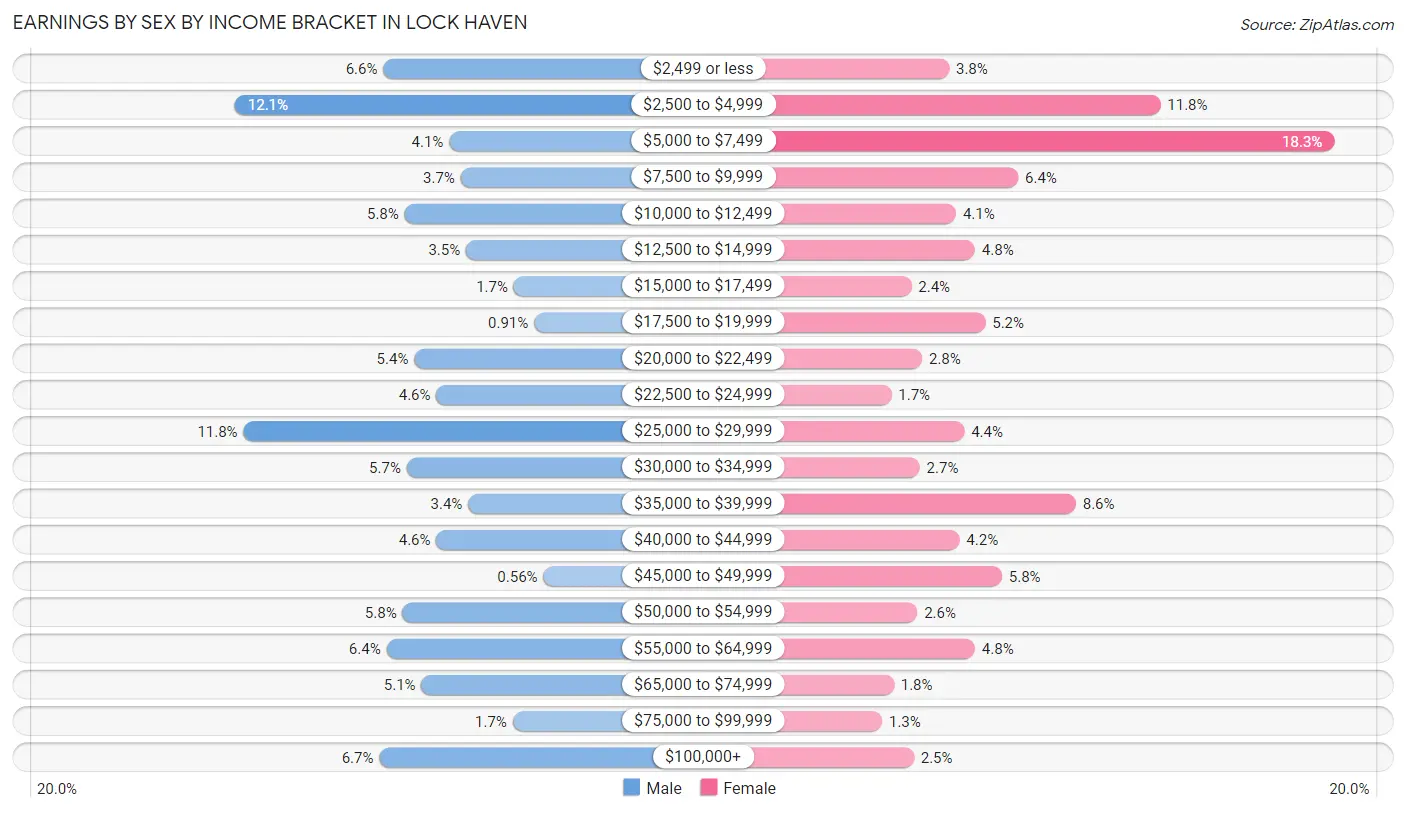
Earnings by Sex by Income Bracket in Lock Haven
The most common earnings brackets in Lock Haven are $2,500 to $4,999 for men (305 | 12.1%) and $5,000 to $7,499 for women (415 | 18.3%).
| Income | Male | Female |
| $2,499 or less | 165 (6.6%) | 87 (3.8%) |
| $2,500 to $4,999 | 305 (12.1%) | 267 (11.7%) |
| $5,000 to $7,499 | 103 (4.1%) | 415 (18.3%) |
| $7,500 to $9,999 | 92 (3.7%) | 146 (6.4%) |
| $10,000 to $12,499 | 145 (5.8%) | 93 (4.1%) |
| $12,500 to $14,999 | 87 (3.5%) | 109 (4.8%) |
| $15,000 to $17,499 | 42 (1.7%) | 55 (2.4%) |
| $17,500 to $19,999 | 23 (0.9%) | 118 (5.2%) |
| $20,000 to $22,499 | 136 (5.4%) | 64 (2.8%) |
| $22,500 to $24,999 | 115 (4.6%) | 38 (1.7%) |
| $25,000 to $29,999 | 297 (11.8%) | 100 (4.4%) |
| $30,000 to $34,999 | 143 (5.7%) | 62 (2.7%) |
| $35,000 to $39,999 | 85 (3.4%) | 195 (8.6%) |
| $40,000 to $44,999 | 115 (4.6%) | 96 (4.2%) |
| $45,000 to $49,999 | 14 (0.6%) | 132 (5.8%) |
| $50,000 to $54,999 | 147 (5.8%) | 60 (2.6%) |
| $55,000 to $64,999 | 162 (6.4%) | 109 (4.8%) |
| $65,000 to $74,999 | 129 (5.1%) | 40 (1.8%) |
| $75,000 to $99,999 | 43 (1.7%) | 30 (1.3%) |
| $100,000+ | 169 (6.7%) | 57 (2.5%) |
| Total | 2,517 (100.0%) | 2,273 (100.0%) |
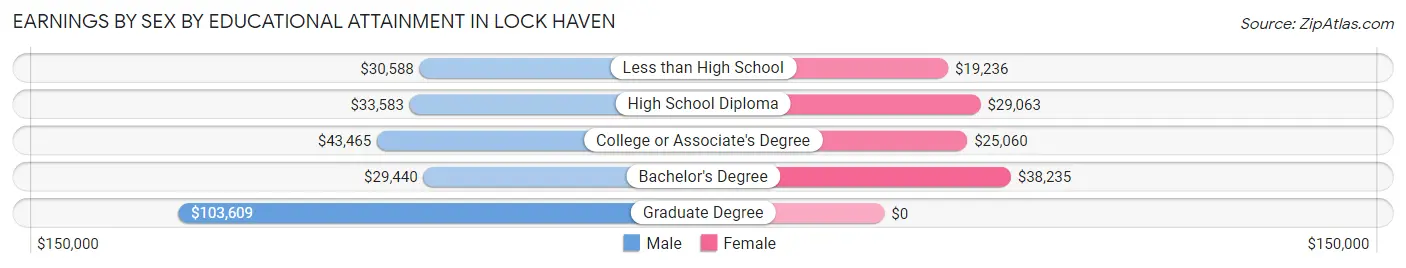
Earnings by Sex by Educational Attainment in Lock Haven
Average earnings in Lock Haven are $41,444 for men and $30,452 for women, a difference of 26.5%. Men with an educational attainment of graduate degree enjoy the highest average annual earnings of $103,609, while those with bachelor's degree education earn the least with $29,440. Women with an educational attainment of bachelor's degree earn the most with the average annual earnings of $38,235, while those with less than high school education have the smallest earnings of $19,236.
| Educational Attainment | Male Income | Female Income |
| Less than High School | $30,588 | $19,236 |
| High School Diploma | $33,583 | $29,063 |
| College or Associate's Degree | $43,465 | $25,060 |
| Bachelor's Degree | $29,440 | $38,235 |
| Graduate Degree | $103,609 | $0 |
| Total | $41,444 | $30,452 |
Family Income in Lock Haven
Family Income Brackets in Lock Haven
According to the Lock Haven family income data, there are 453 families falling into the $50,000 to $74,999 income range, which is the most common income bracket and makes up 27.5% of all families. Conversely, the $150,000 to $199,999 income bracket is the least frequent group with only 15 families (0.9%) belonging to this category.
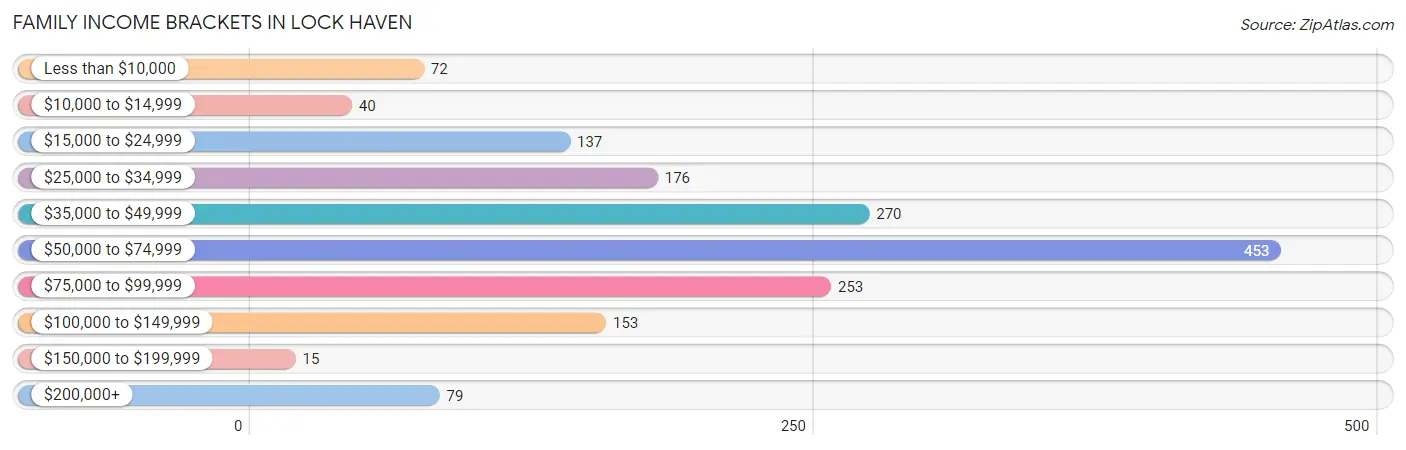
| Income Bracket | # Families | % Families |
| Less than $10,000 | 72 | 4.4% |
| $10,000 to $14,999 | 40 | 2.4% |
| $15,000 to $24,999 | 137 | 8.3% |
| $25,000 to $34,999 | 176 | 10.7% |
| $35,000 to $49,999 | 270 | 16.4% |
| $50,000 to $74,999 | 453 | 27.5% |
| $75,000 to $99,999 | 253 | 15.4% |
| $100,000 to $149,999 | 153 | 9.3% |
| $150,000 to $199,999 | 15 | 0.9% |
| $200,000+ | 79 | 4.8% |
Family Income by Famaliy Size in Lock Haven
7+ person families (21 | 1.3%) account for the highest median family income in Lock Haven with $250,001 per family, while 7+ person families (21 | 1.3%) have the highest median income of $35,714 per family member.
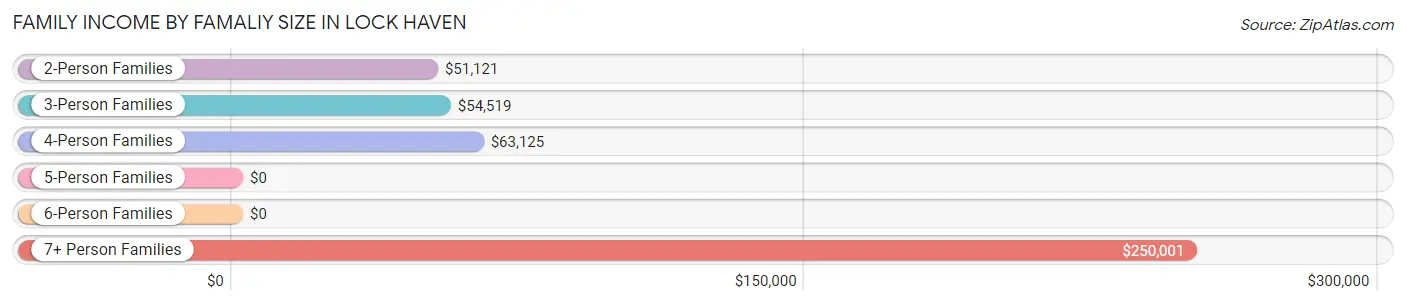
| Income Bracket | # Families | Median Income |
| 2-Person Families | 839 (51.0%) | $51,121 |
| 3-Person Families | 603 (36.6%) | $54,519 |
| 4-Person Families | 178 (10.8%) | $63,125 |
| 5-Person Families | 5 (0.3%) | $0 |
| 6-Person Families | 0 (0.0%) | $0 |
| 7+ Person Families | 21 (1.3%) | $250,001 |
| Total | 1,646 (100.0%) | $52,304 |
Family Income by Number of Earners in Lock Haven
The median family income in Lock Haven is $52,304, with families comprising 3+ earners (27) having the highest median family income of $250,001, while families with 1 earner (661) have the lowest median family income of $43,484, accounting for 1.6% and 40.2% of families, respectively.
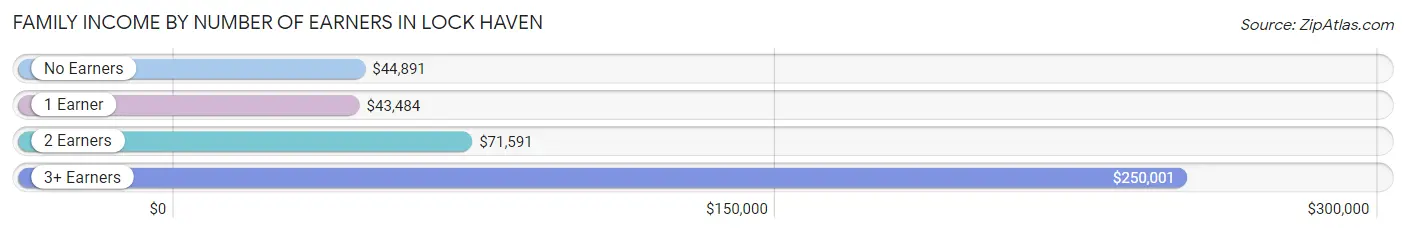
| Number of Earners | # Families | Median Income |
| No Earners | 330 (20.1%) | $44,891 |
| 1 Earner | 661 (40.2%) | $43,484 |
| 2 Earners | 628 (38.2%) | $71,591 |
| 3+ Earners | 27 (1.6%) | $250,001 |
| Total | 1,646 (100.0%) | $52,304 |
Household Income in Lock Haven
Household Income Brackets in Lock Haven
With 565 households falling in the category, the $50,000 to $74,999 income range is the most frequent in Lock Haven, accounting for 17.2% of all households. In contrast, only 39 households (1.2%) fall into the $150,000 to $199,999 income bracket, making it the least populous group.
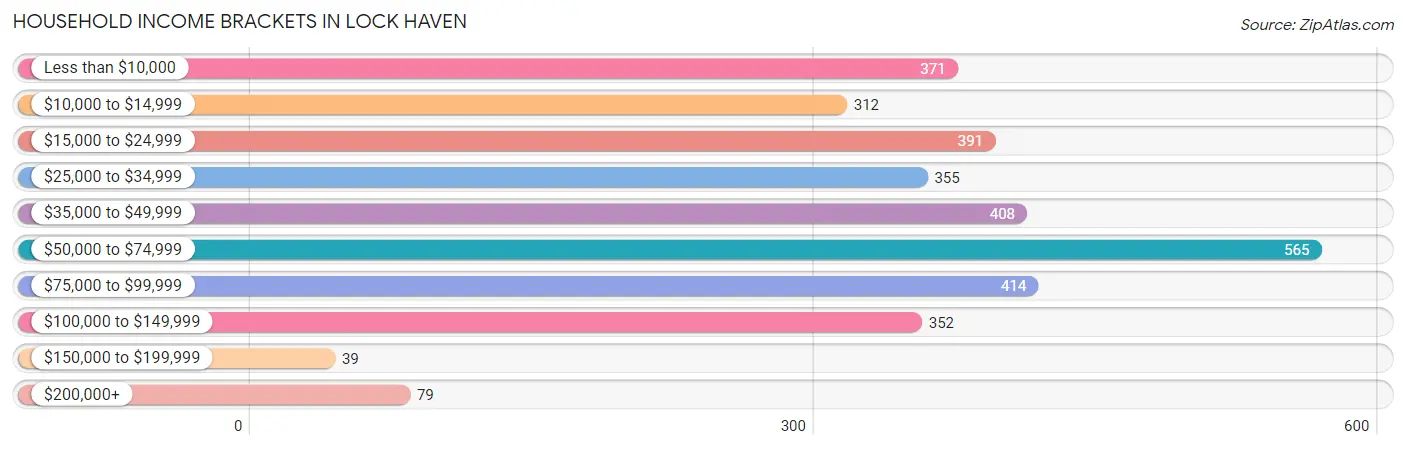
| Income Bracket | # Households | % Households |
| Less than $10,000 | 371 | 11.3% |
| $10,000 to $14,999 | 312 | 9.5% |
| $15,000 to $24,999 | 391 | 11.9% |
| $25,000 to $34,999 | 355 | 10.8% |
| $35,000 to $49,999 | 408 | 12.4% |
| $50,000 to $74,999 | 565 | 17.2% |
| $75,000 to $99,999 | 414 | 12.6% |
| $100,000 to $149,999 | 352 | 10.7% |
| $150,000 to $199,999 | 39 | 1.2% |
| $200,000+ | 79 | 2.4% |
Household Income by Householder Age in Lock Haven
The median household income in Lock Haven is $42,930, with the highest median household income of $65,833 found in the 25 to 44 years age bracket for the primary householder. A total of 1,082 households (32.9%) fall into this category. Meanwhile, the 65+ years age bracket for the primary householder has the lowest median household income of $24,688, with 720 households (21.9%) in this group.
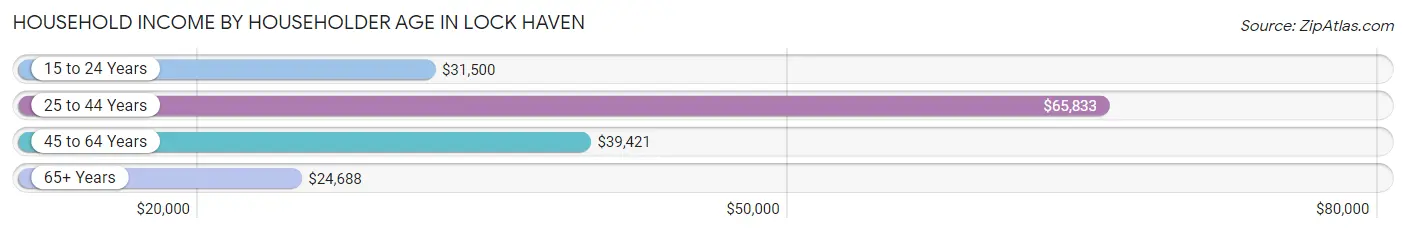
| Income Bracket | # Households | Median Income |
| 15 to 24 Years | 614 (18.7%) | $31,500 |
| 25 to 44 Years | 1,082 (32.9%) | $65,833 |
| 45 to 64 Years | 871 (26.5%) | $39,421 |
| 65+ Years | 720 (21.9%) | $24,688 |
| Total | 3,287 (100.0%) | $42,930 |
Poverty in Lock Haven
Income Below Poverty by Sex and Age in Lock Haven
With 23.4% poverty level for males and 26.7% for females among the residents of Lock Haven, 18 to 24 year old males and 15 year old females are the most vulnerable to poverty, with 323 males (50.5%) and 21 females (87.5%) in their respective age groups living below the poverty level.
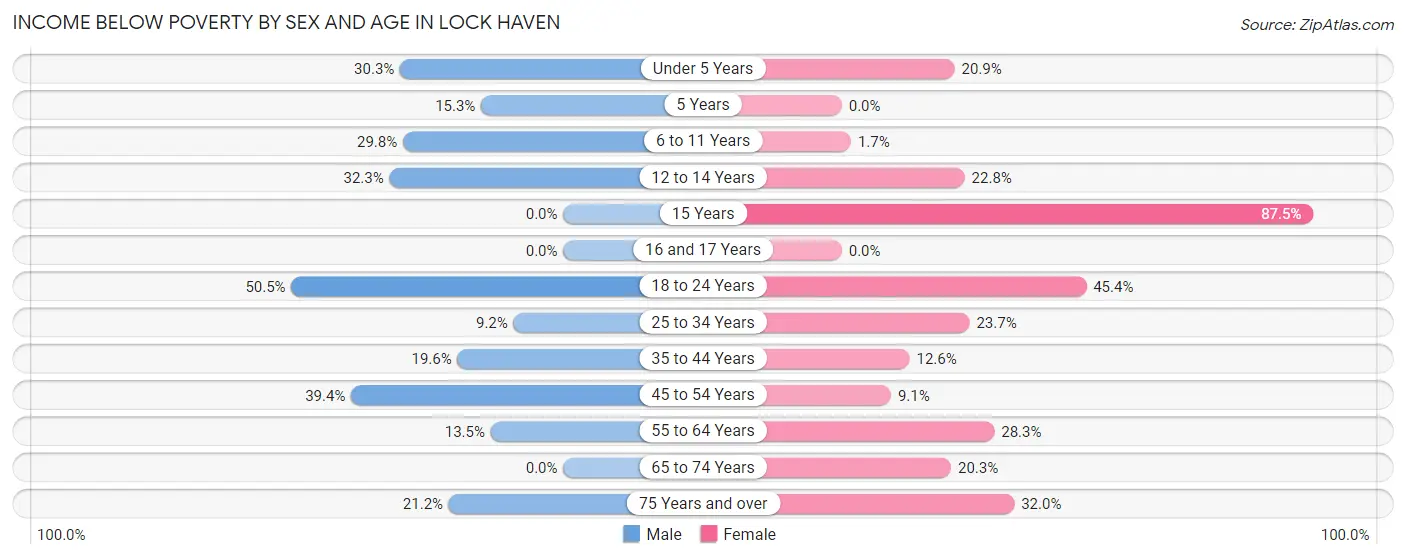
| Age Bracket | Male | Female |
| Under 5 Years | 53 (30.3%) | 54 (20.9%) |
| 5 Years | 18 (15.2%) | 0 (0.0%) |
| 6 to 11 Years | 61 (29.8%) | 4 (1.7%) |
| 12 to 14 Years | 30 (32.3%) | 13 (22.8%) |
| 15 Years | 0 (0.0%) | 21 (87.5%) |
| 16 and 17 Years | 0 (0.0%) | 0 (0.0%) |
| 18 to 24 Years | 323 (50.5%) | 421 (45.4%) |
| 25 to 34 Years | 70 (9.2%) | 123 (23.7%) |
| 35 to 44 Years | 88 (19.6%) | 40 (12.6%) |
| 45 to 54 Years | 100 (39.4%) | 22 (9.1%) |
| 55 to 64 Years | 59 (13.5%) | 109 (28.3%) |
| 65 to 74 Years | 0 (0.0%) | 88 (20.3%) |
| 75 Years and over | 24 (21.2%) | 89 (32.0%) |
| Total | 826 (23.4%) | 984 (26.7%) |
Income Above Poverty by Sex and Age in Lock Haven
According to the poverty statistics in Lock Haven, males aged 15 years and females aged 16 and 17 years are the age groups that are most secure financially, with 100.0% of males and 100.0% of females in these age groups living above the poverty line.
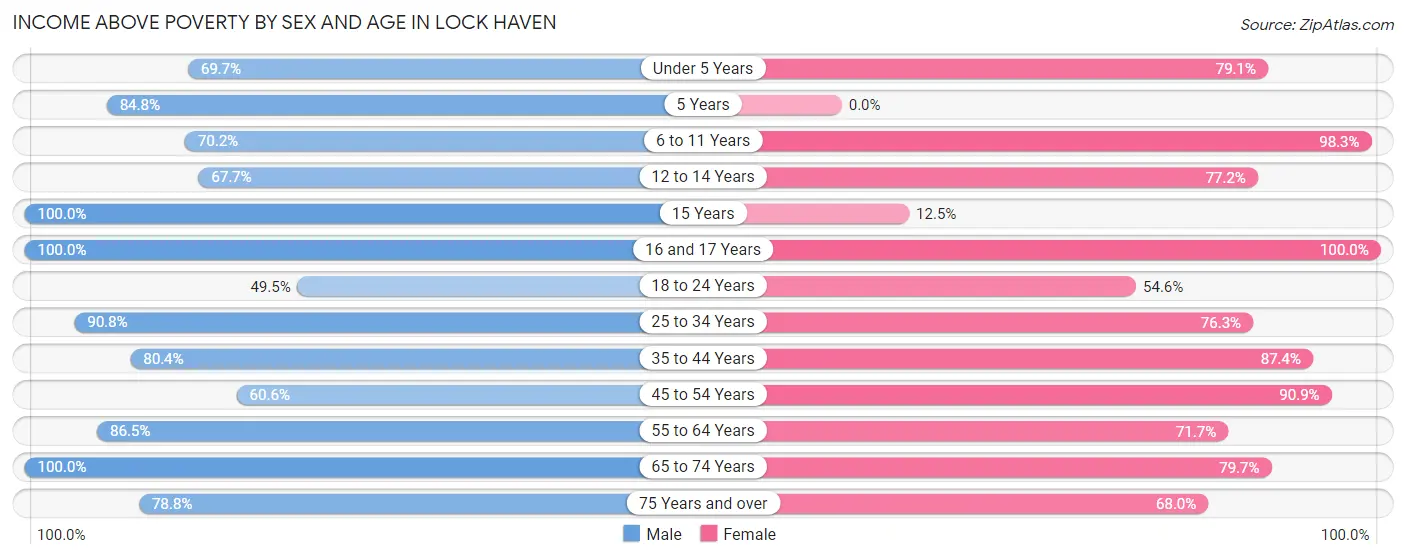
| Age Bracket | Male | Female |
| Under 5 Years | 122 (69.7%) | 204 (79.1%) |
| 5 Years | 100 (84.8%) | 0 (0.0%) |
| 6 to 11 Years | 144 (70.2%) | 230 (98.3%) |
| 12 to 14 Years | 63 (67.7%) | 44 (77.2%) |
| 15 Years | 19 (100.0%) | 3 (12.5%) |
| 16 and 17 Years | 34 (100.0%) | 5 (100.0%) |
| 18 to 24 Years | 317 (49.5%) | 507 (54.6%) |
| 25 to 34 Years | 688 (90.8%) | 396 (76.3%) |
| 35 to 44 Years | 360 (80.4%) | 278 (87.4%) |
| 45 to 54 Years | 154 (60.6%) | 219 (90.9%) |
| 55 to 64 Years | 379 (86.5%) | 276 (71.7%) |
| 65 to 74 Years | 229 (100.0%) | 346 (79.7%) |
| 75 Years and over | 89 (78.8%) | 189 (68.0%) |
| Total | 2,698 (76.6%) | 2,697 (73.3%) |
Income Below Poverty Among Married-Couple Families in Lock Haven
The poverty statistics for married-couple families in Lock Haven show that 0.8% or 8 of the total 980 families live below the poverty line. Families with no children have the highest poverty rate of 1.2%, comprising of 8 families. On the other hand, families with 1 or 2 children have the lowest poverty rate of 0.0%, which includes 0 families.
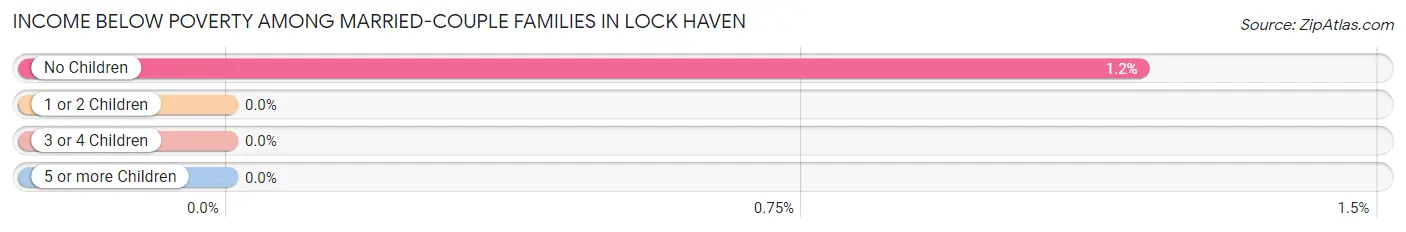
| Children | Above Poverty | Below Poverty |
| No Children | 664 (98.8%) | 8 (1.2%) |
| 1 or 2 Children | 305 (100.0%) | 0 (0.0%) |
| 3 or 4 Children | 3 (100.0%) | 0 (0.0%) |
| 5 or more Children | 0 (0.0%) | 0 (0.0%) |
| Total | 972 (99.2%) | 8 (0.8%) |
Income Below Poverty Among Single-Parent Households in Lock Haven
According to the poverty data in Lock Haven, 10.7% or 18 single-father households and 34.1% or 170 single-mother households are living below the poverty line. Among single-father households, those with no children have the highest poverty rate, with 18 households (51.4%) experiencing poverty. Likewise, among single-mother households, those with 1 or 2 children have the highest poverty rate, with 166 households (37.7%) falling below the poverty line.
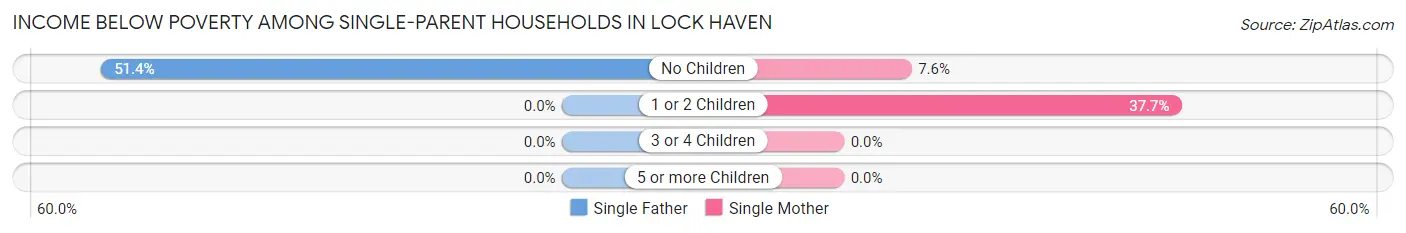
| Children | Single Father | Single Mother |
| No Children | 18 (51.4%) | 4 (7.5%) |
| 1 or 2 Children | 0 (0.0%) | 166 (37.7%) |
| 3 or 4 Children | 0 (0.0%) | 0 (0.0%) |
| 5 or more Children | 0 (0.0%) | 0 (0.0%) |
| Total | 18 (10.7%) | 170 (34.1%) |
Income Below Poverty Among Married-Couple vs Single-Parent Households in Lock Haven
The poverty data for Lock Haven shows that 8 of the married-couple family households (0.8%) and 188 of the single-parent households (28.2%) are living below the poverty level. Within the married-couple family households, those with no children have the highest poverty rate, with 8 households (1.2%) falling below the poverty line. Among the single-parent households, those with 1 or 2 children have the highest poverty rate, with 166 household (29.0%) living below poverty.
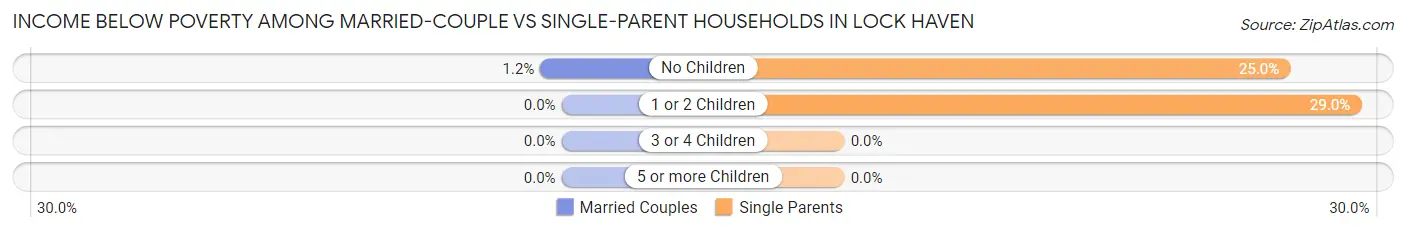
| Children | Married-Couple Families | Single-Parent Households |
| No Children | 8 (1.2%) | 22 (25.0%) |
| 1 or 2 Children | 0 (0.0%) | 166 (29.0%) |
| 3 or 4 Children | 0 (0.0%) | 0 (0.0%) |
| 5 or more Children | 0 (0.0%) | 0 (0.0%) |
| Total | 8 (0.8%) | 188 (28.2%) |
Race in Lock Haven
The most populous races in Lock Haven are White / Caucasian (7,660 | 90.9%), Black / African American (313 | 3.7%), and Two or more Races (269 | 3.2%).
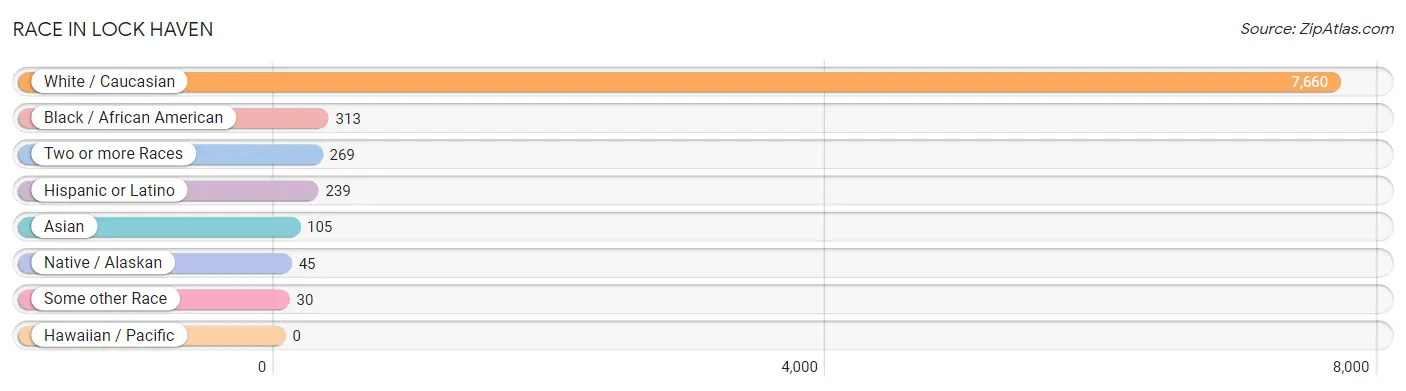
| Race | # Population | % Population |
| Asian | 105 | 1.3% |
| Black / African American | 313 | 3.7% |
| Hawaiian / Pacific | 0 | 0.0% |
| Hispanic or Latino | 239 | 2.8% |
| Native / Alaskan | 45 | 0.5% |
| White / Caucasian | 7,660 | 90.9% |
| Two or more Races | 269 | 3.2% |
| Some other Race | 30 | 0.4% |
| Total | 8,422 | 100.0% |
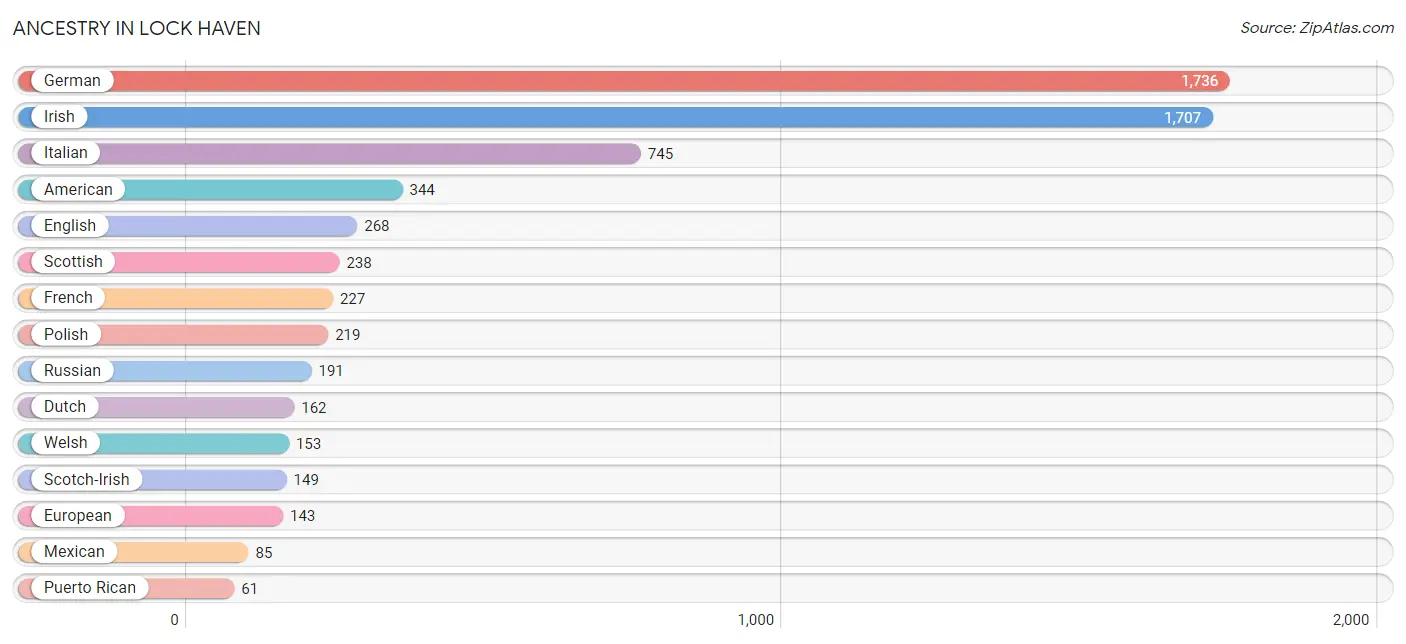
Ancestry in Lock Haven
The most populous ancestries reported in Lock Haven are German (1,736 | 20.6%), Irish (1,707 | 20.3%), Italian (745 | 8.8%), American (344 | 4.1%), and English (268 | 3.2%), together accounting for 57.0% of all Lock Haven residents.
| Ancestry | # Population | % Population |
| Albanian | 3 | 0.0% |
| American | 344 | 4.1% |
| Austrian | 10 | 0.1% |
| Burmese | 3 | 0.0% |
| Central American | 32 | 0.4% |
| Cherokee | 22 | 0.3% |
| Chickasaw | 33 | 0.4% |
| Czechoslovakian | 22 | 0.3% |
| Dominican | 38 | 0.4% |
| Dutch | 162 | 1.9% |
| Eastern European | 20 | 0.2% |
| English | 268 | 3.2% |
| Estonian | 6 | 0.1% |
| European | 143 | 1.7% |
| Finnish | 22 | 0.3% |
| French | 227 | 2.7% |
| French Canadian | 15 | 0.2% |
| German | 1,736 | 20.6% |
| Guatemalan | 32 | 0.4% |
| Hungarian | 30 | 0.4% |
| Indian (Asian) | 26 | 0.3% |
| Indonesian | 21 | 0.3% |
| Irish | 1,707 | 20.3% |
| Italian | 745 | 8.8% |
| Jamaican | 28 | 0.3% |
| Korean | 17 | 0.2% |
| Lithuanian | 18 | 0.2% |
| Mexican | 85 | 1.0% |
| Norwegian | 23 | 0.3% |
| Pennsylvania German | 56 | 0.7% |
| Polish | 219 | 2.6% |
| Puerto Rican | 61 | 0.7% |
| Russian | 191 | 2.3% |
| Scotch-Irish | 149 | 1.8% |
| Scottish | 238 | 2.8% |
| Slavic | 8 | 0.1% |
| Slovak | 7 | 0.1% |
| Spaniard | 20 | 0.2% |
| Sri Lankan | 7 | 0.1% |
| Swedish | 40 | 0.5% |
| Swiss | 25 | 0.3% |
| Thai | 3 | 0.0% |
| Trinidadian and Tobagonian | 41 | 0.5% |
| Ukrainian | 31 | 0.4% |
| Welsh | 153 | 1.8% | View All 45 Rows |
Immigrants in Lock Haven
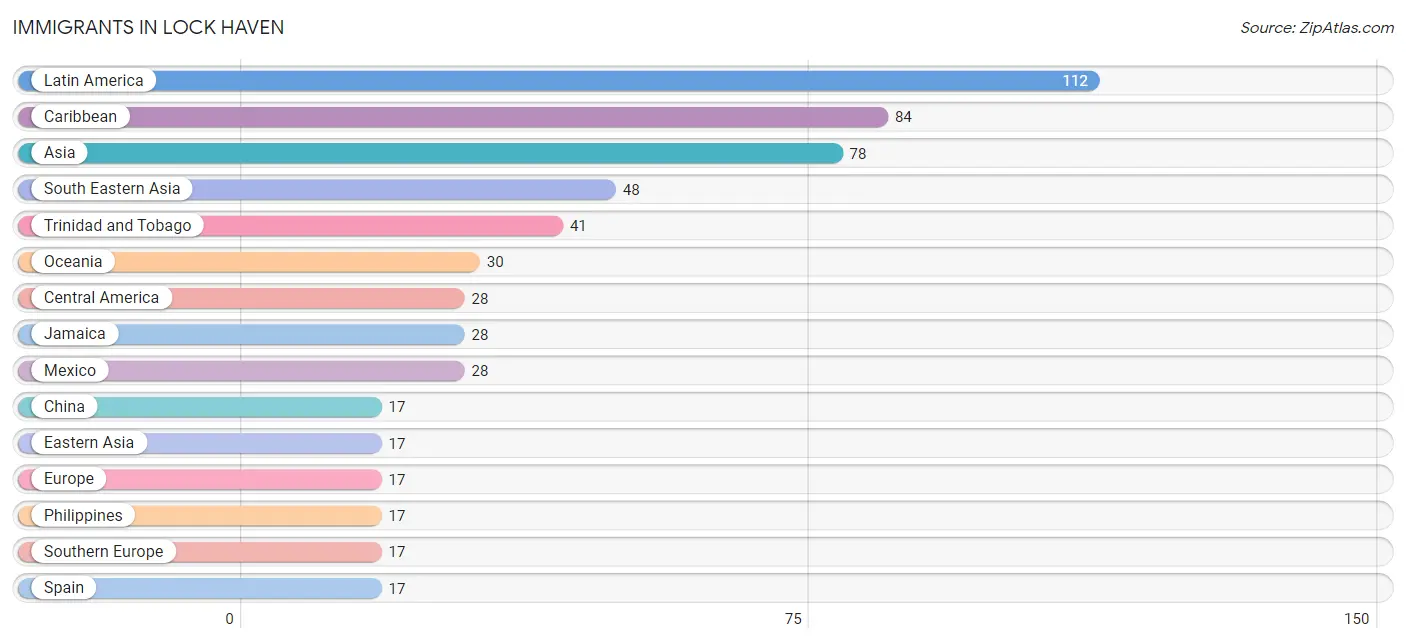
The most numerous immigrant groups reported in Lock Haven came from Latin America (112 | 1.3%), Caribbean (84 | 1.0%), Asia (78 | 0.9%), South Eastern Asia (48 | 0.6%), and Trinidad and Tobago (41 | 0.5%), together accounting for 4.3% of all Lock Haven residents.
| Immigration Origin | # Population | % Population |
| Asia | 78 | 0.9% |
| Caribbean | 84 | 1.0% |
| Central America | 28 | 0.3% |
| China | 17 | 0.2% |
| Dominica | 15 | 0.2% |
| Eastern Asia | 17 | 0.2% |
| Europe | 17 | 0.2% |
| India | 13 | 0.2% |
| Jamaica | 28 | 0.3% |
| Latin America | 112 | 1.3% |
| Mexico | 28 | 0.3% |
| Oceania | 30 | 0.4% |
| Philippines | 17 | 0.2% |
| South Central Asia | 13 | 0.2% |
| South Eastern Asia | 48 | 0.6% |
| Southern Europe | 17 | 0.2% |
| Spain | 17 | 0.2% |
| Trinidad and Tobago | 41 | 0.5% |
| Vietnam | 10 | 0.1% | View All 19 Rows |
Sex and Age in Lock Haven
Sex and Age in Lock Haven
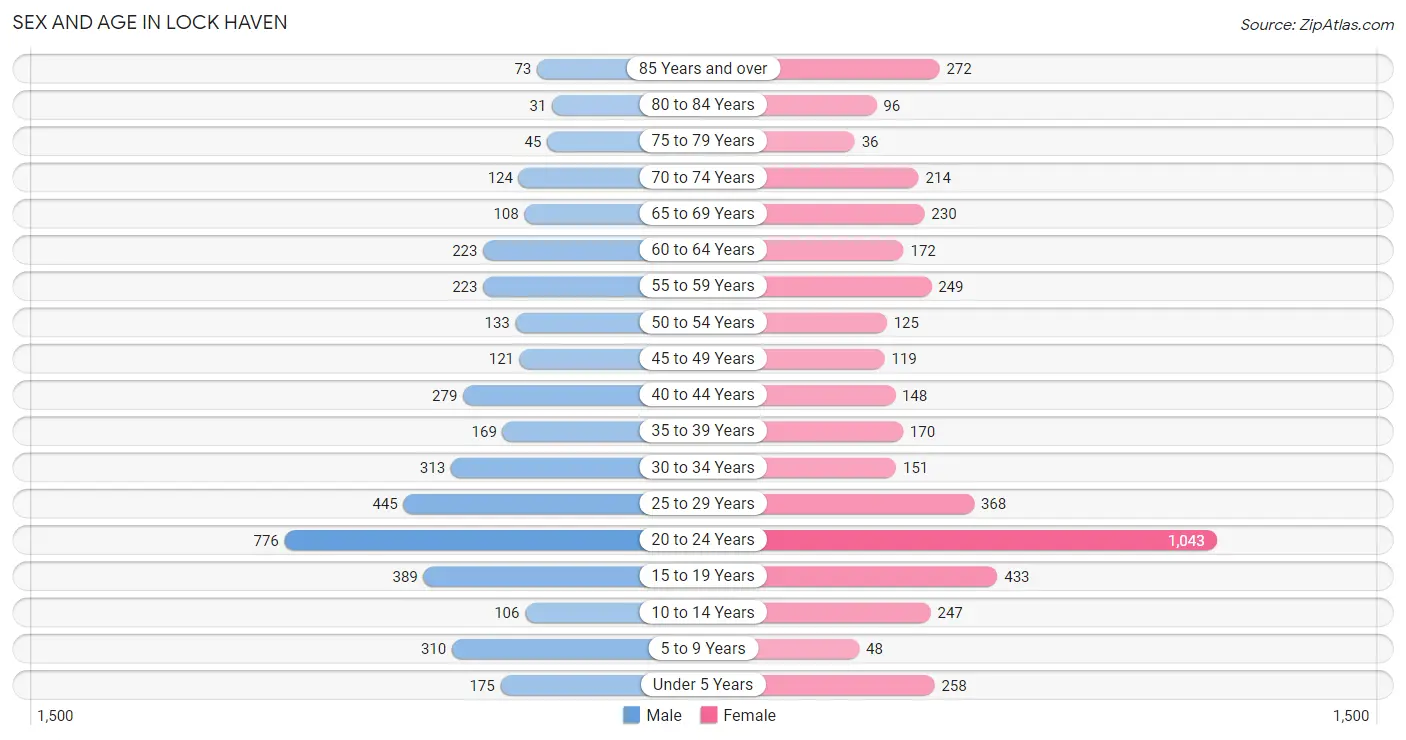
The most populous age groups in Lock Haven are 20 to 24 Years (776 | 19.2%) for men and 20 to 24 Years (1,043 | 23.8%) for women.
| Age Bracket | Male | Female |
| Under 5 Years | 175 (4.3%) | 258 (5.9%) |
| 5 to 9 Years | 310 (7.7%) | 48 (1.1%) |
| 10 to 14 Years | 106 (2.6%) | 247 (5.6%) |
| 15 to 19 Years | 389 (9.6%) | 433 (9.9%) |
| 20 to 24 Years | 776 (19.2%) | 1,043 (23.8%) |
| 25 to 29 Years | 445 (11.0%) | 368 (8.4%) |
| 30 to 34 Years | 313 (7.7%) | 151 (3.5%) |
| 35 to 39 Years | 169 (4.2%) | 170 (3.9%) |
| 40 to 44 Years | 279 (6.9%) | 148 (3.4%) |
| 45 to 49 Years | 121 (3.0%) | 119 (2.7%) |
| 50 to 54 Years | 133 (3.3%) | 125 (2.9%) |
| 55 to 59 Years | 223 (5.5%) | 249 (5.7%) |
| 60 to 64 Years | 223 (5.5%) | 172 (3.9%) |
| 65 to 69 Years | 108 (2.7%) | 230 (5.2%) |
| 70 to 74 Years | 124 (3.1%) | 214 (4.9%) |
| 75 to 79 Years | 45 (1.1%) | 36 (0.8%) |
| 80 to 84 Years | 31 (0.8%) | 96 (2.2%) |
| 85 Years and over | 73 (1.8%) | 272 (6.2%) |
| Total | 4,043 (100.0%) | 4,379 (100.0%) |
Families and Households in Lock Haven
Median Family Size in Lock Haven
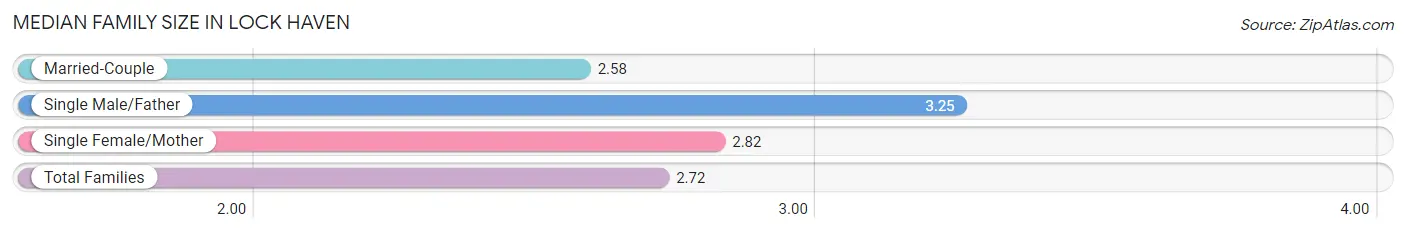
The median family size in Lock Haven is 2.72 persons per family, with single male/father families (168 | 10.2%) accounting for the largest median family size of 3.25 persons per family. On the other hand, married-couple families (980 | 59.5%) represent the smallest median family size with 2.58 persons per family.
| Family Type | # Families | Family Size |
| Married-Couple | 980 (59.5%) | 2.58 |
| Single Male/Father | 168 (10.2%) | 3.25 |
| Single Female/Mother | 498 (30.3%) | 2.82 |
| Total Families | 1,646 (100.0%) | 2.72 |
Median Household Size in Lock Haven
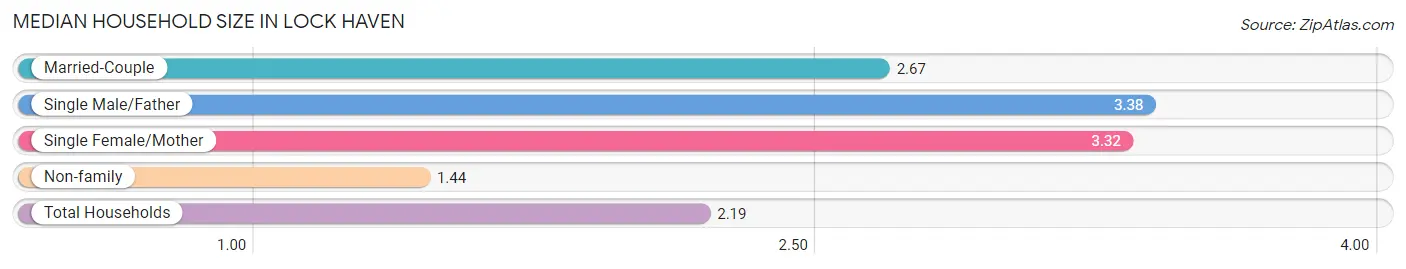
The median household size in Lock Haven is 2.19 persons per household, with single male/father households (168 | 5.1%) accounting for the largest median household size of 3.38 persons per household. non-family households (1,641 | 49.9%) represent the smallest median household size with 1.44 persons per household.
| Household Type | # Households | Household Size |
| Married-Couple | 980 (29.8%) | 2.67 |
| Single Male/Father | 168 (5.1%) | 3.38 |
| Single Female/Mother | 498 (15.1%) | 3.32 |
| Non-family | 1,641 (49.9%) | 1.44 |
| Total Households | 3,287 (100.0%) | 2.19 |
Household Size by Marriage Status in Lock Haven
Out of a total of 3,287 households in Lock Haven, 1,646 (50.1%) are family households, while 1,641 (49.9%) are nonfamily households. The most numerous type of family households are 2-person households, comprising 722, and the most common type of nonfamily households are 1-person households, comprising 1,083.
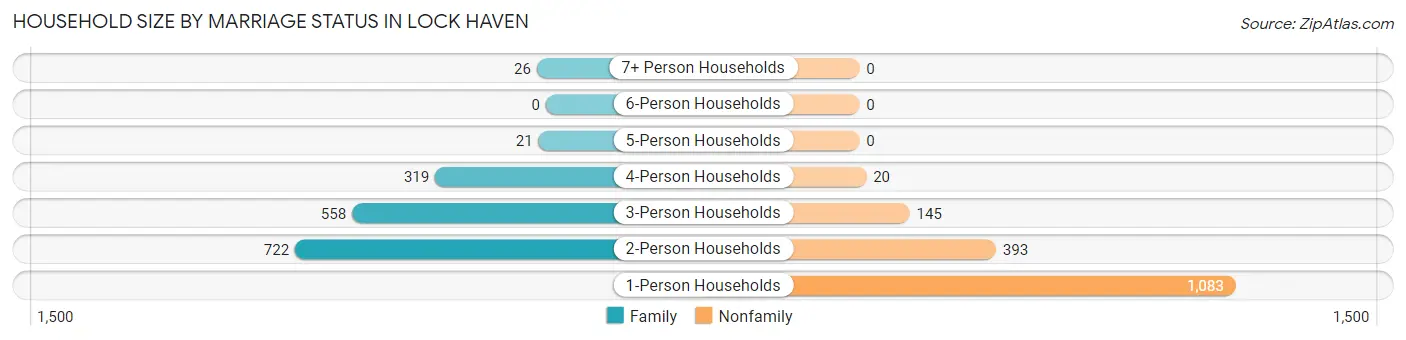
| Household Size | Family Households | Nonfamily Households |
| 1-Person Households | - | 1,083 (33.0%) |
| 2-Person Households | 722 (22.0%) | 393 (12.0%) |
| 3-Person Households | 558 (17.0%) | 145 (4.4%) |
| 4-Person Households | 319 (9.7%) | 20 (0.6%) |
| 5-Person Households | 21 (0.6%) | 0 (0.0%) |
| 6-Person Households | 0 (0.0%) | 0 (0.0%) |
| 7+ Person Households | 26 (0.8%) | 0 (0.0%) |
| Total | 1,646 (50.1%) | 1,641 (49.9%) |
Female Fertility in Lock Haven
Fertility by Age in Lock Haven
Average fertility rate in Lock Haven is 86.0 births per 1,000 women. Women in the age bracket of 15 to 19 years have the highest fertility rate with 118.0 births per 1,000 women. Women in the age bracket of 20 to 34 years acount for 75.8% of all women with births.
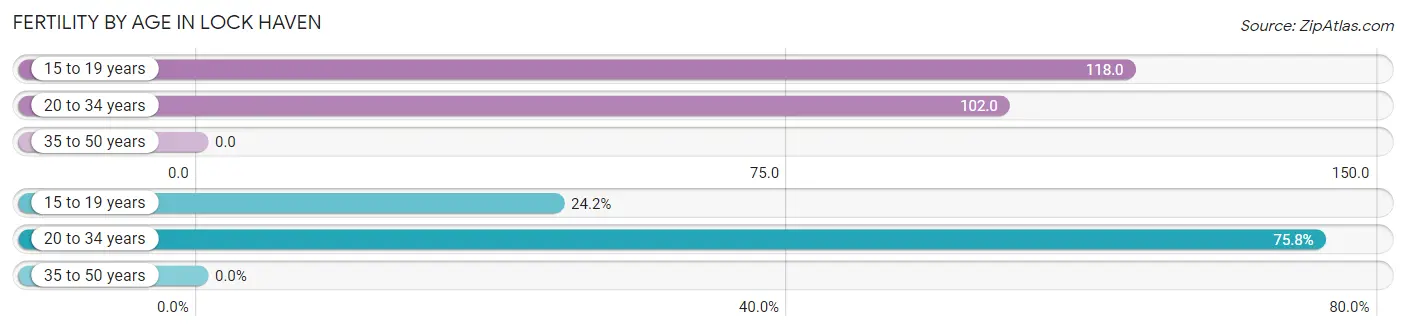
| Age Bracket | Women with Births | Births / 1,000 Women |
| 15 to 19 years | 51 (24.2%) | 118.0 |
| 20 to 34 years | 160 (75.8%) | 102.0 |
| 35 to 50 years | 0 (0.0%) | 0.0 |
| Total | 211 (100.0%) | 86.0 |
Fertility by Age by Marriage Status in Lock Haven
33.2% of women with births (211) in Lock Haven are married. The highest percentage of unmarried women with births falls into 15 to 19 years age bracket with 100.0% of them unmarried at the time of birth, while the lowest percentage of unmarried women with births belong to 20 to 34 years age bracket with 56.2% of them unmarried.
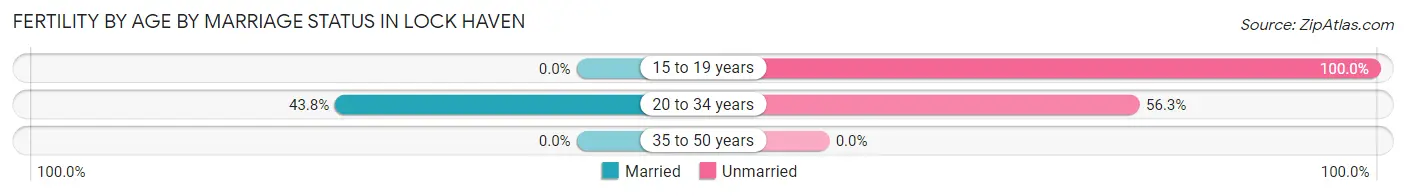
| Age Bracket | Married | Unmarried |
| 15 to 19 years | 0 (0.0%) | 51 (100.0%) |
| 20 to 34 years | 70 (43.8%) | 90 (56.2%) |
| 35 to 50 years | 0 (0.0%) | 0 (0.0%) |
| Total | 70 (33.2%) | 141 (66.8%) |
Fertility by Education in Lock Haven
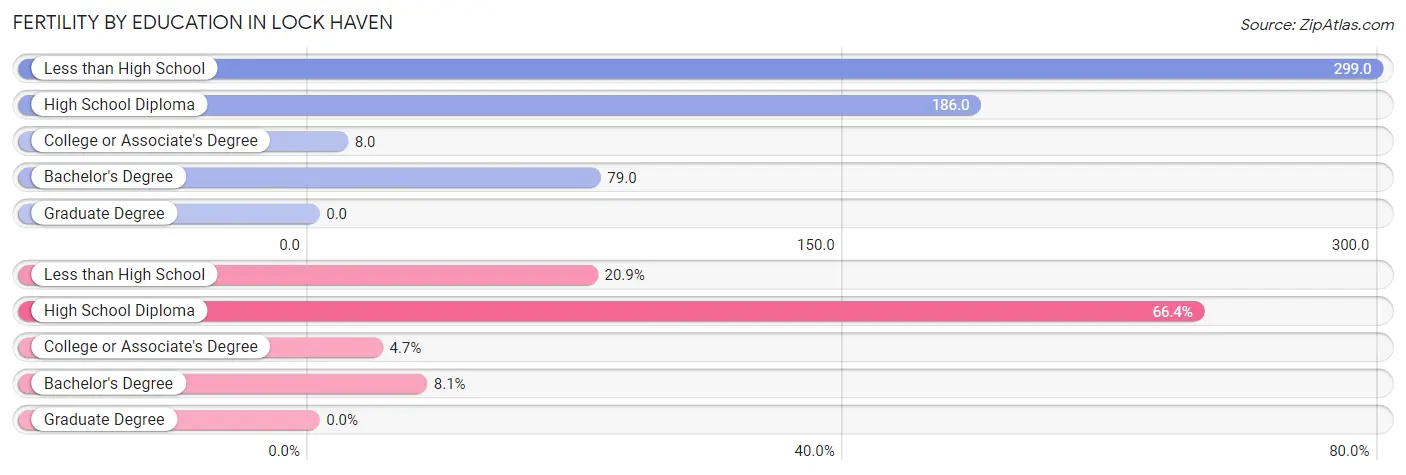
| Educational Attainment | Women with Births | Births / 1,000 Women |
| Less than High School | 44 (20.8%) | 299.0 |
| High School Diploma | 140 (66.3%) | 186.0 |
| College or Associate's Degree | 10 (4.7%) | 8.0 |
| Bachelor's Degree | 17 (8.1%) | 79.0 |
| Graduate Degree | 0 (0.0%) | 0.0 |
| Total | 211 (100.0%) | 86.0 |
Fertility by Education by Marriage Status in Lock Haven
66.8% of women with births in Lock Haven are unmarried. Women with the educational attainment of college or associate's degree are most likely to be married with 100.0% of them married at childbirth, while women with the educational attainment of less than high school are least likely to be married with 100.0% of them unmarried at childbirth.
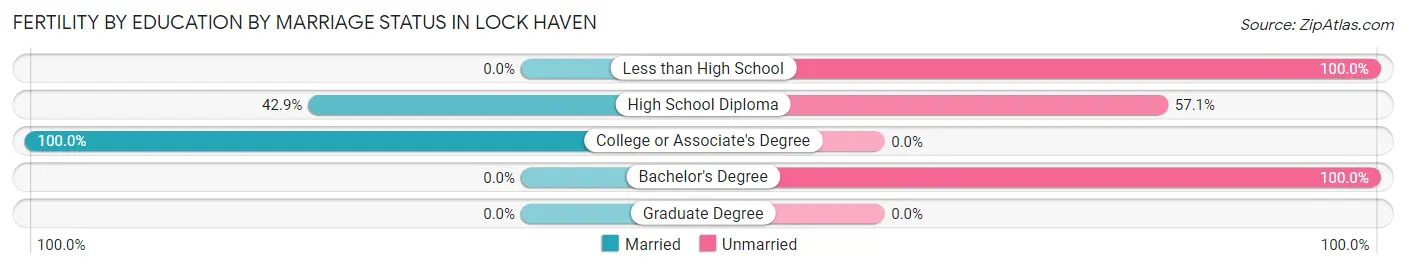
| Educational Attainment | Married | Unmarried |
| Less than High School | 0 (0.0%) | 44 (100.0%) |
| High School Diploma | 60 (42.9%) | 80 (57.1%) |
| College or Associate's Degree | 10 (100.0%) | 0 (0.0%) |
| Bachelor's Degree | 0 (0.0%) | 17 (100.0%) |
| Graduate Degree | 0 (0.0%) | 0 (0.0%) |
| Total | 70 (33.2%) | 141 (66.8%) |
Employment Characteristics in Lock Haven
Employment by Class of Employer in Lock Haven
Among the 3,823 employed individuals in Lock Haven, private company employees (2,770 | 72.5%), state government employees (412 | 10.8%), and not-for-profit organizations (305 | 8.0%) make up the most common classes of employment.
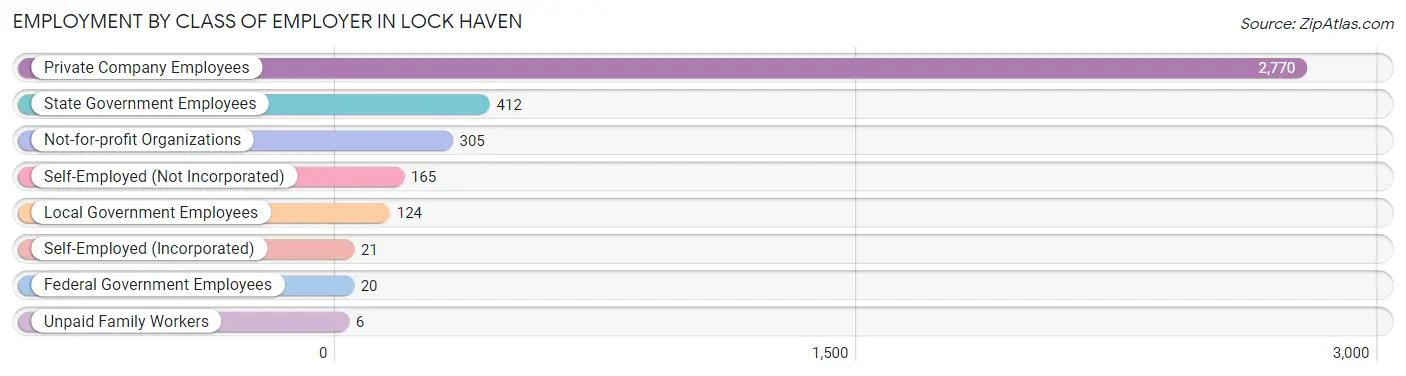
| Employer Class | # Employees | % Employees |
| Private Company Employees | 2,770 | 72.5% |
| Self-Employed (Incorporated) | 21 | 0.5% |
| Self-Employed (Not Incorporated) | 165 | 4.3% |
| Not-for-profit Organizations | 305 | 8.0% |
| Local Government Employees | 124 | 3.2% |
| State Government Employees | 412 | 10.8% |
| Federal Government Employees | 20 | 0.5% |
| Unpaid Family Workers | 6 | 0.2% |
| Total | 3,823 | 100.0% |
Employment Status by Age in Lock Haven
According to the labor force statistics for Lock Haven, out of the total population over 16 years of age (7,235), 59.2% or 4,283 individuals are in the labor force, with 7.3% or 313 of them unemployed. The age group with the highest labor force participation rate is 25 to 29 years, with 94.8% or 771 individuals in the labor force. Within the labor force, the 45 to 54 years age range has the highest percentage of unemployed individuals, with 37.3% or 136 of them being unemployed.
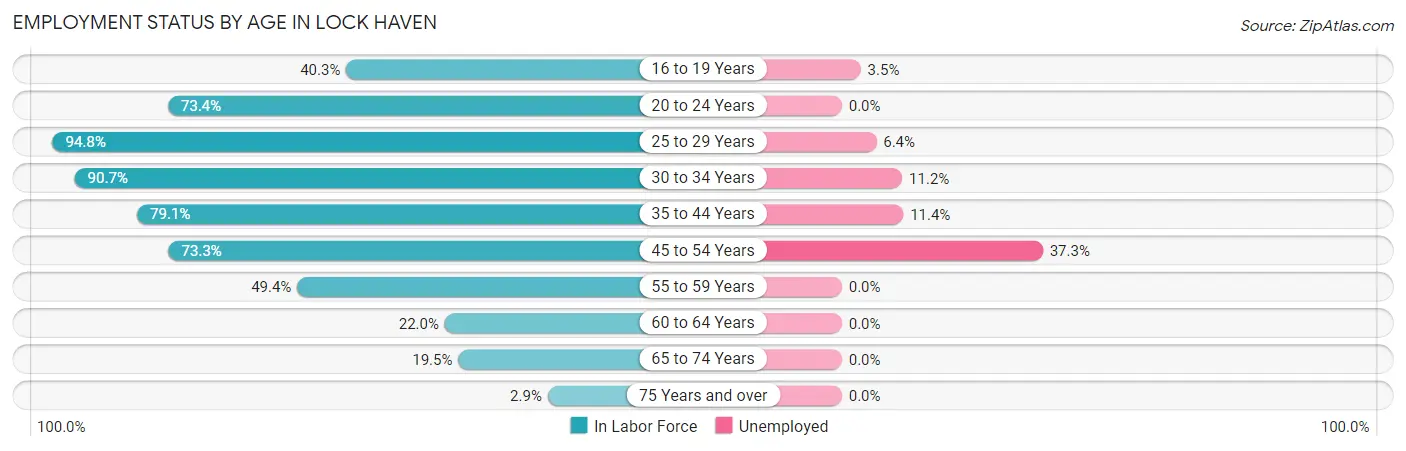
| Age Bracket | In Labor Force | Unemployed |
| 16 to 19 Years | 314 (40.3%) | 11 (3.5%) |
| 20 to 24 Years | 1,335 (73.4%) | 0 (0.0%) |
| 25 to 29 Years | 771 (94.8%) | 49 (6.4%) |
| 30 to 34 Years | 421 (90.7%) | 47 (11.2%) |
| 35 to 44 Years | 606 (79.1%) | 69 (11.4%) |
| 45 to 54 Years | 365 (73.3%) | 136 (37.3%) |
| 55 to 59 Years | 233 (49.4%) | 0 (0.0%) |
| 60 to 64 Years | 87 (22.0%) | 0 (0.0%) |
| 65 to 74 Years | 132 (19.5%) | 0 (0.0%) |
| 75 Years and over | 16 (2.9%) | 0 (0.0%) |
| Total | 4,283 (59.2%) | 313 (7.3%) |
Employment Status by Educational Attainment in Lock Haven
According to labor force statistics for Lock Haven, 72.9% of individuals (2,484) out of the total population between 25 and 64 years of age (3,408) are in the labor force, with 12.1% or 301 of them being unemployed. The group with the highest labor force participation rate are those with the educational attainment of bachelor's degree or higher, with 83.1% or 638 individuals in the labor force. Within the labor force, individuals with less than high school education have the highest percentage of unemployment, with 20.4% or 46 of them being unemployed.
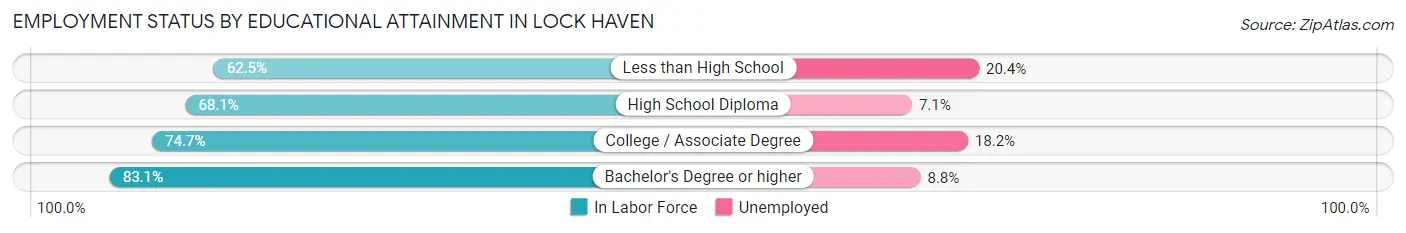
| Educational Attainment | In Labor Force | Unemployed |
| Less than High School | 225 (62.5%) | 73 (20.4%) |
| High School Diploma | 863 (68.1%) | 90 (7.1%) |
| College / Associate Degree | 757 (74.7%) | 184 (18.2%) |
| Bachelor's Degree or higher | 638 (83.1%) | 68 (8.8%) |
| Total | 2,484 (72.9%) | 412 (12.1%) |
Employment Occupations by Sex in Lock Haven
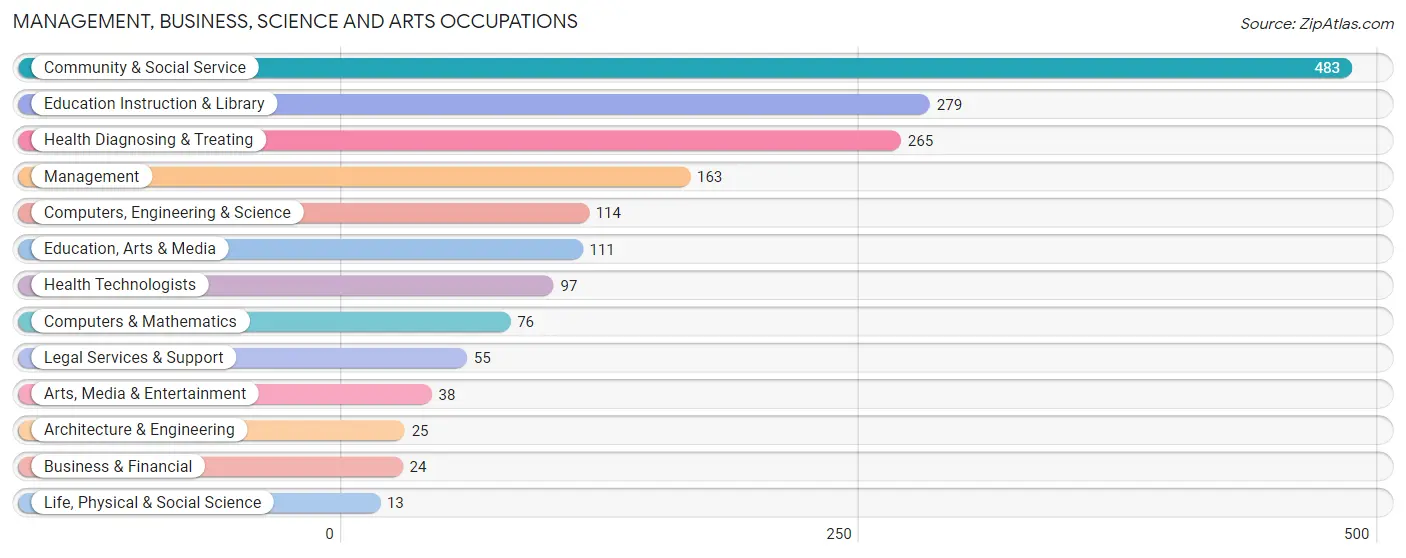
Management, Business, Science and Arts Occupations
The most common Management, Business, Science and Arts occupations in Lock Haven are Community & Social Service (483 | 12.2%), Education Instruction & Library (279 | 7.0%), Health Diagnosing & Treating (265 | 6.7%), Management (163 | 4.1%), and Computers, Engineering & Science (114 | 2.9%).
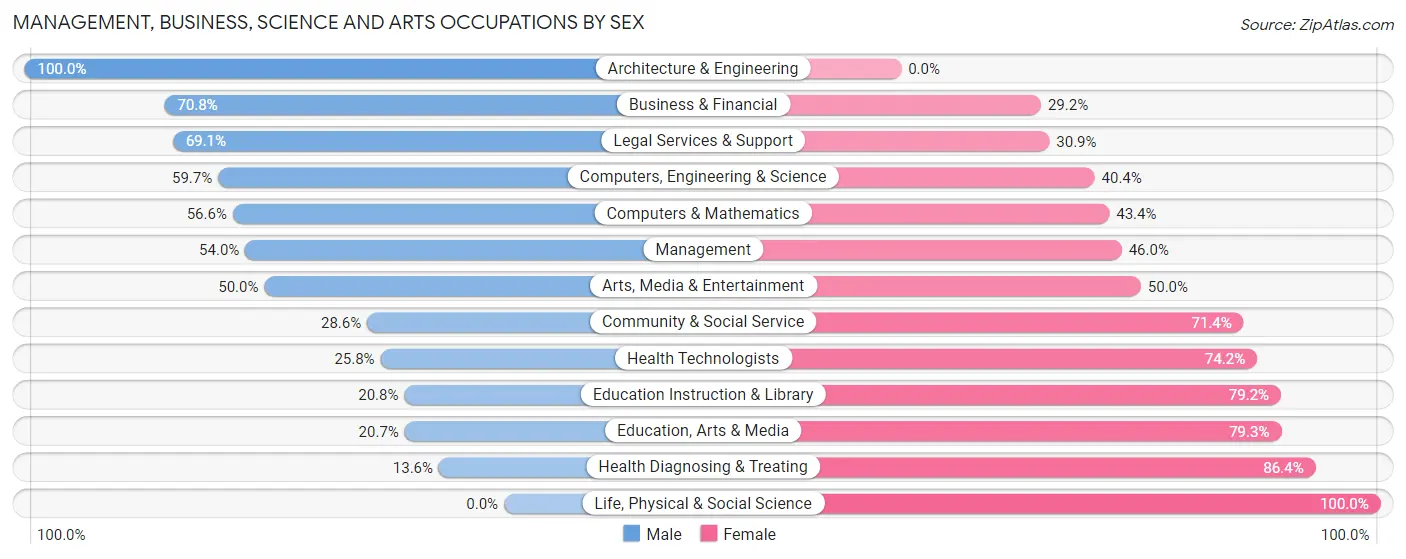
Management, Business, Science and Arts Occupations by Sex
Within the Management, Business, Science and Arts occupations in Lock Haven, the most male-oriented occupations are Architecture & Engineering (100.0%), Business & Financial (70.8%), and Legal Services & Support (69.1%), while the most female-oriented occupations are Life, Physical & Social Science (100.0%), Health Diagnosing & Treating (86.4%), and Education, Arts & Media (79.3%).
| Occupation | Male | Female |
| Management | 88 (54.0%) | 75 (46.0%) |
| Business & Financial | 17 (70.8%) | 7 (29.2%) |
| Computers, Engineering & Science | 68 (59.7%) | 46 (40.4%) |
| Computers & Mathematics | 43 (56.6%) | 33 (43.4%) |
| Architecture & Engineering | 25 (100.0%) | 0 (0.0%) |
| Life, Physical & Social Science | 0 (0.0%) | 13 (100.0%) |
| Community & Social Service | 138 (28.6%) | 345 (71.4%) |
| Education, Arts & Media | 23 (20.7%) | 88 (79.3%) |
| Legal Services & Support | 38 (69.1%) | 17 (30.9%) |
| Education Instruction & Library | 58 (20.8%) | 221 (79.2%) |
| Arts, Media & Entertainment | 19 (50.0%) | 19 (50.0%) |
| Health Diagnosing & Treating | 36 (13.6%) | 229 (86.4%) |
| Health Technologists | 25 (25.8%) | 72 (74.2%) |
| Total (Category) | 347 (33.1%) | 702 (66.9%) |
| Total (Overall) | 1,934 (48.7%) | 2,033 (51.2%) |
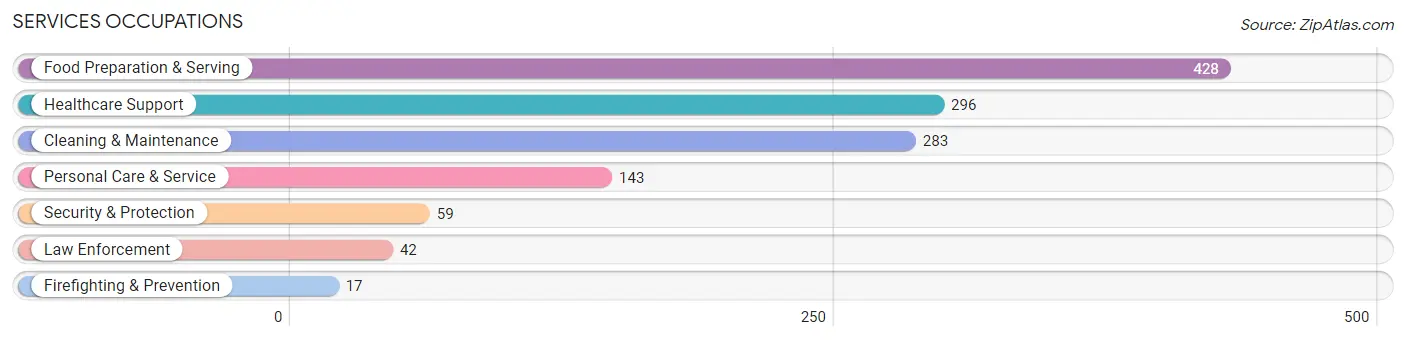
Services Occupations
The most common Services occupations in Lock Haven are Food Preparation & Serving (428 | 10.8%), Healthcare Support (296 | 7.5%), Cleaning & Maintenance (283 | 7.1%), Personal Care & Service (143 | 3.6%), and Security & Protection (59 | 1.5%).
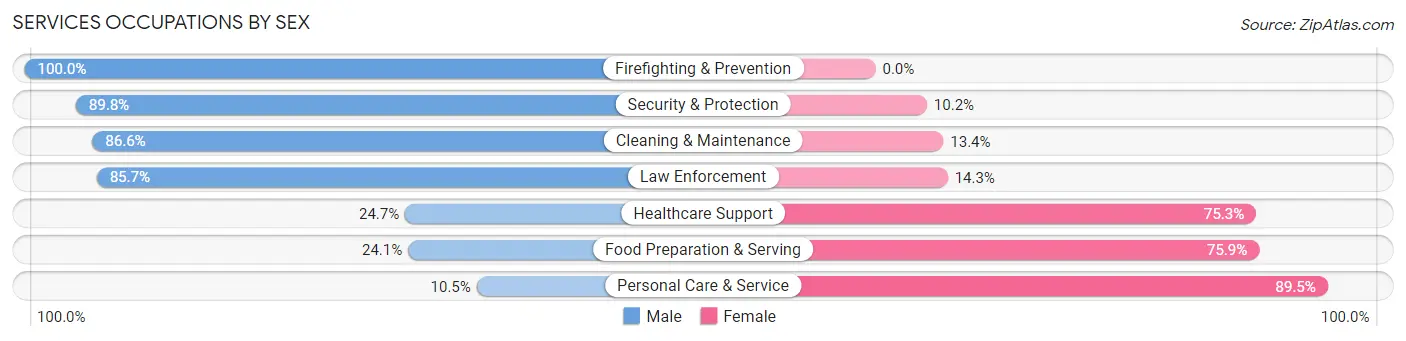
Services Occupations by Sex
Within the Services occupations in Lock Haven, the most male-oriented occupations are Firefighting & Prevention (100.0%), Security & Protection (89.8%), and Cleaning & Maintenance (86.6%), while the most female-oriented occupations are Personal Care & Service (89.5%), Food Preparation & Serving (75.9%), and Healthcare Support (75.3%).
| Occupation | Male | Female |
| Healthcare Support | 73 (24.7%) | 223 (75.3%) |
| Security & Protection | 53 (89.8%) | 6 (10.2%) |
| Firefighting & Prevention | 17 (100.0%) | 0 (0.0%) |
| Law Enforcement | 36 (85.7%) | 6 (14.3%) |
| Food Preparation & Serving | 103 (24.1%) | 325 (75.9%) |
| Cleaning & Maintenance | 245 (86.6%) | 38 (13.4%) |
| Personal Care & Service | 15 (10.5%) | 128 (89.5%) |
| Total (Category) | 489 (40.5%) | 720 (59.6%) |
| Total (Overall) | 1,934 (48.7%) | 2,033 (51.2%) |
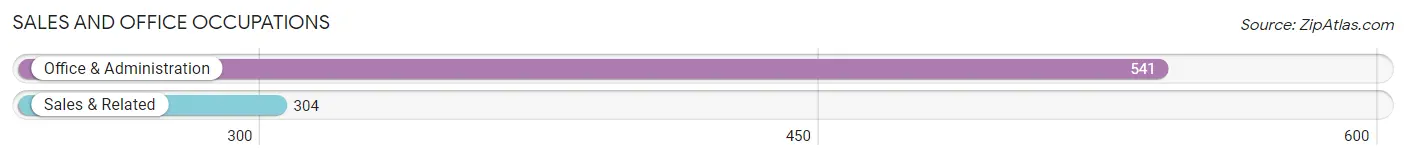
Sales and Office Occupations
The most common Sales and Office occupations in Lock Haven are Office & Administration (541 | 13.6%), and Sales & Related (304 | 7.7%).
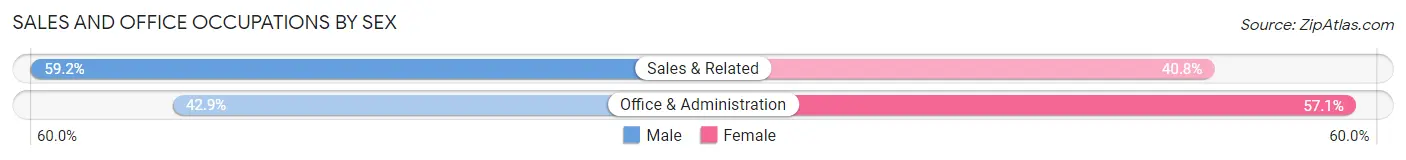
Sales and Office Occupations by Sex
| Occupation | Male | Female |
| Sales & Related | 180 (59.2%) | 124 (40.8%) |
| Office & Administration | 232 (42.9%) | 309 (57.1%) |
| Total (Category) | 412 (48.8%) | 433 (51.2%) |
| Total (Overall) | 1,934 (48.7%) | 2,033 (51.2%) |
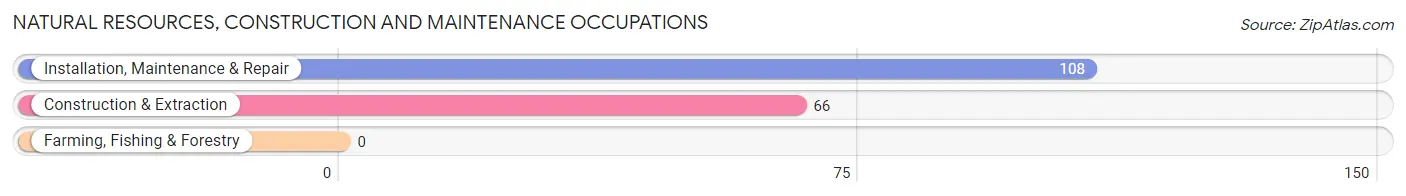
Natural Resources, Construction and Maintenance Occupations
The most common Natural Resources, Construction and Maintenance occupations in Lock Haven are Installation, Maintenance & Repair (108 | 2.7%), and Construction & Extraction (66 | 1.7%).
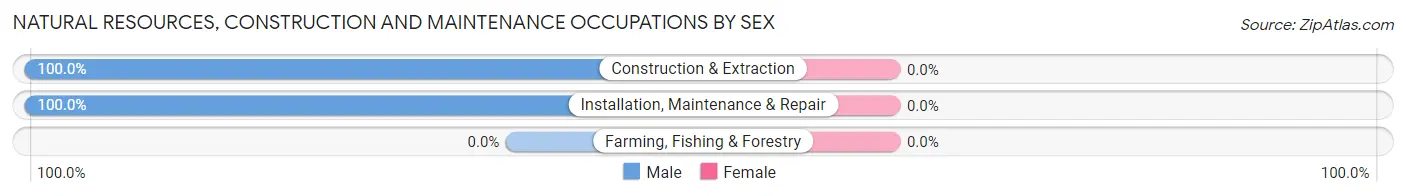
Natural Resources, Construction and Maintenance Occupations by Sex
| Occupation | Male | Female |
| Farming, Fishing & Forestry | 0 (0.0%) | 0 (0.0%) |
| Construction & Extraction | 66 (100.0%) | 0 (0.0%) |
| Installation, Maintenance & Repair | 108 (100.0%) | 0 (0.0%) |
| Total (Category) | 174 (100.0%) | 0 (0.0%) |
| Total (Overall) | 1,934 (48.7%) | 2,033 (51.2%) |
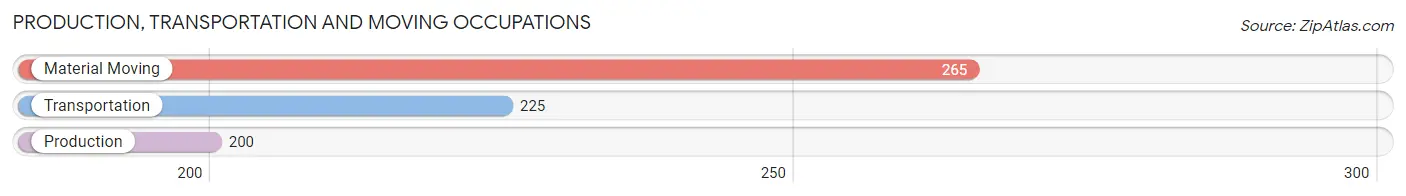
Production, Transportation and Moving Occupations
The most common Production, Transportation and Moving occupations in Lock Haven are Material Moving (265 | 6.7%), Transportation (225 | 5.7%), and Production (200 | 5.0%).
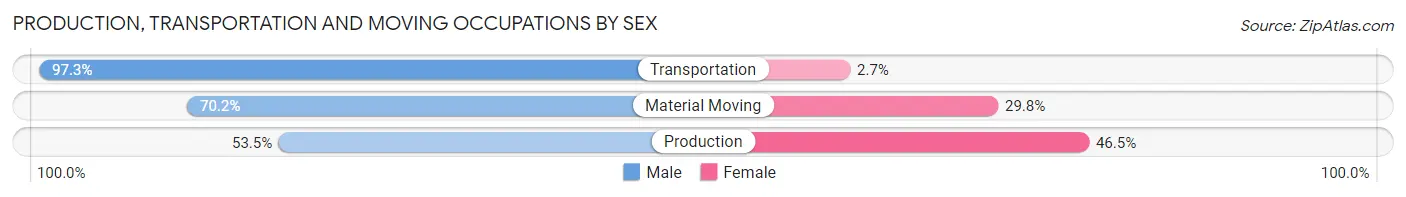
Production, Transportation and Moving Occupations by Sex
| Occupation | Male | Female |
| Production | 107 (53.5%) | 93 (46.5%) |
| Transportation | 219 (97.3%) | 6 (2.7%) |
| Material Moving | 186 (70.2%) | 79 (29.8%) |
| Total (Category) | 512 (74.2%) | 178 (25.8%) |
| Total (Overall) | 1,934 (48.7%) | 2,033 (51.2%) |
Employment Industries by Sex in Lock Haven
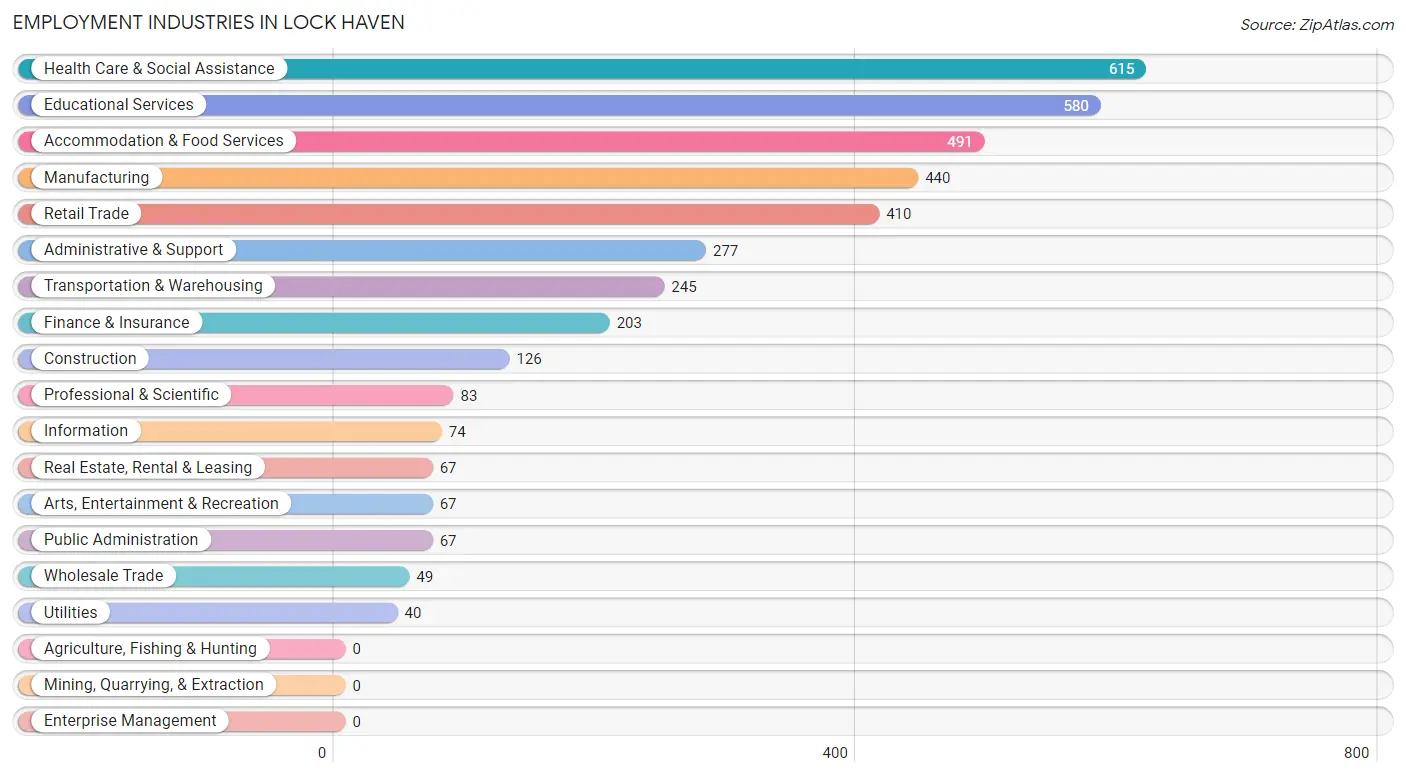
Employment Industries in Lock Haven
The major employment industries in Lock Haven include Health Care & Social Assistance (615 | 15.5%), Educational Services (580 | 14.6%), Accommodation & Food Services (491 | 12.4%), Manufacturing (440 | 11.1%), and Retail Trade (410 | 10.3%).
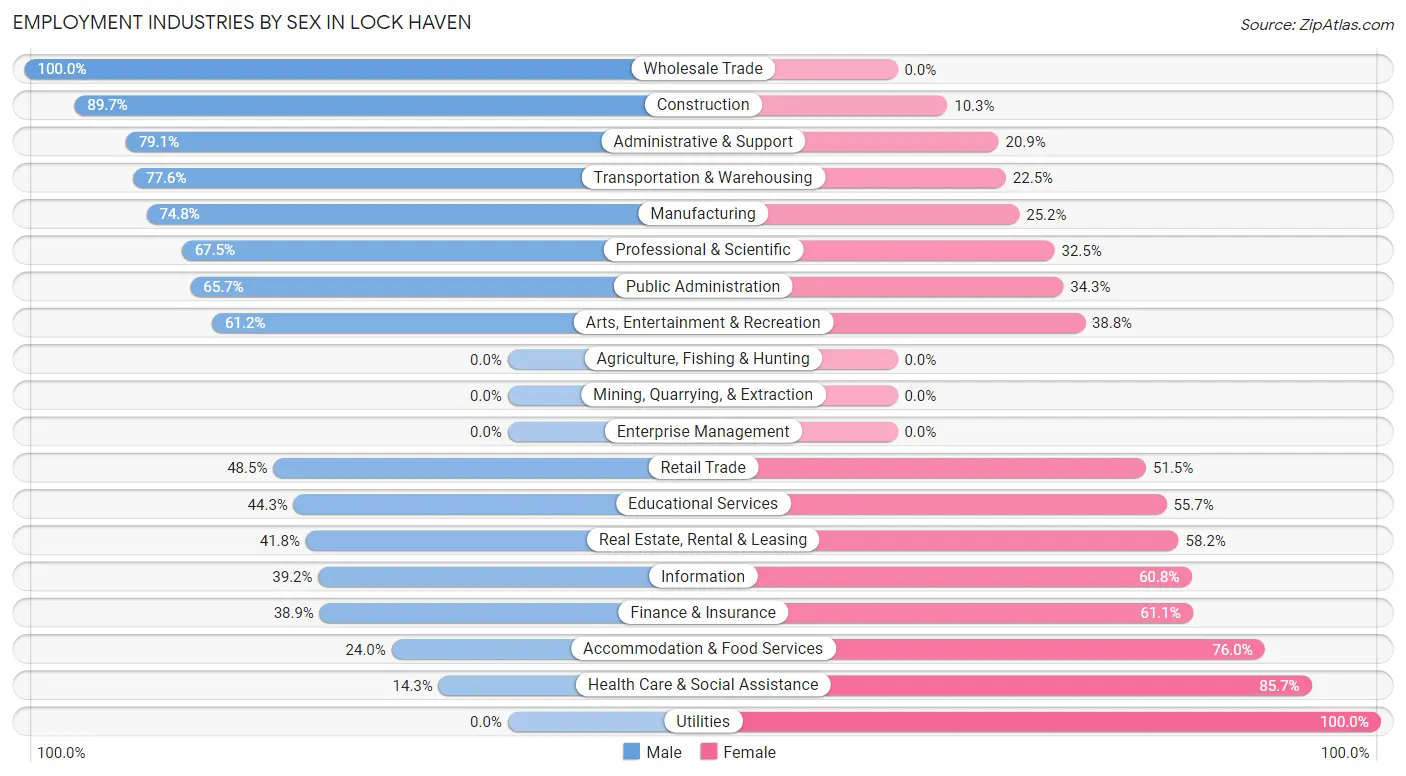
Employment Industries by Sex in Lock Haven
The Lock Haven industries that see more men than women are Wholesale Trade (100.0%), Construction (89.7%), and Administrative & Support (79.1%), whereas the industries that tend to have a higher number of women are Utilities (100.0%), Health Care & Social Assistance (85.7%), and Accommodation & Food Services (76.0%).
| Industry | Male | Female |
| Agriculture, Fishing & Hunting | 0 (0.0%) | 0 (0.0%) |
| Mining, Quarrying, & Extraction | 0 (0.0%) | 0 (0.0%) |
| Construction | 113 (89.7%) | 13 (10.3%) |
| Manufacturing | 329 (74.8%) | 111 (25.2%) |
| Wholesale Trade | 49 (100.0%) | 0 (0.0%) |
| Retail Trade | 199 (48.5%) | 211 (51.5%) |
| Transportation & Warehousing | 190 (77.5%) | 55 (22.5%) |
| Utilities | 0 (0.0%) | 40 (100.0%) |
| Information | 29 (39.2%) | 45 (60.8%) |
| Finance & Insurance | 79 (38.9%) | 124 (61.1%) |
| Real Estate, Rental & Leasing | 28 (41.8%) | 39 (58.2%) |
| Professional & Scientific | 56 (67.5%) | 27 (32.5%) |
| Enterprise Management | 0 (0.0%) | 0 (0.0%) |
| Administrative & Support | 219 (79.1%) | 58 (20.9%) |
| Educational Services | 257 (44.3%) | 323 (55.7%) |
| Health Care & Social Assistance | 88 (14.3%) | 527 (85.7%) |
| Arts, Entertainment & Recreation | 41 (61.2%) | 26 (38.8%) |
| Accommodation & Food Services | 118 (24.0%) | 373 (76.0%) |
| Public Administration | 44 (65.7%) | 23 (34.3%) |
| Total | 1,934 (48.7%) | 2,033 (51.2%) |
Education in Lock Haven
School Enrollment in Lock Haven
The most common levels of schooling among the 2,523 students in Lock Haven are college / undergraduate (1,565 | 62.0%), middle school (347 | 13.8%), and elementary school (235 | 9.3%).
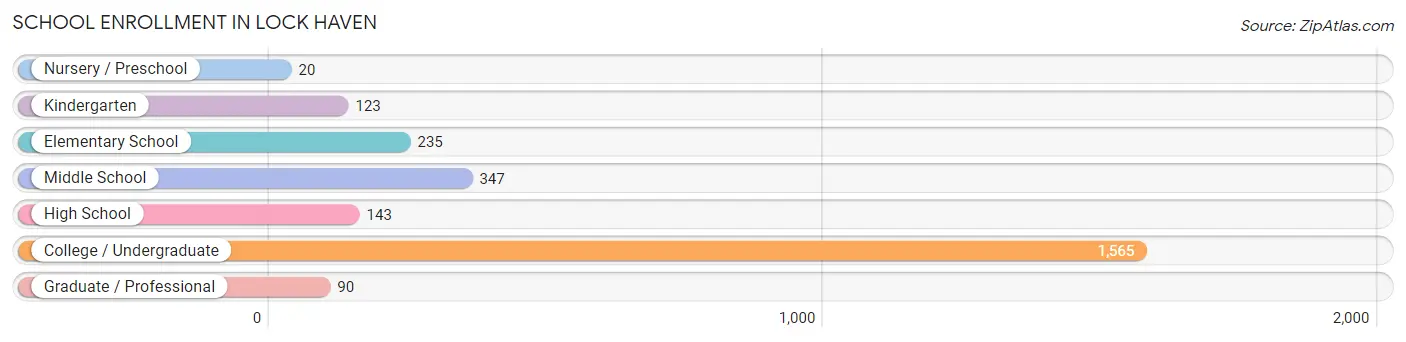
| School Level | # Students | % Students |
| Nursery / Preschool | 20 | 0.8% |
| Kindergarten | 123 | 4.9% |
| Elementary School | 235 | 9.3% |
| Middle School | 347 | 13.8% |
| High School | 143 | 5.7% |
| College / Undergraduate | 1,565 | 62.0% |
| Graduate / Professional | 90 | 3.6% |
| Total | 2,523 | 100.0% |
School Enrollment by Age by Funding Source in Lock Haven
Out of a total of 2,523 students who are enrolled in schools in Lock Haven, 283 (11.2%) attend a private institution, while the remaining 2,240 (88.8%) are enrolled in public schools. The age group of 15 to 17 year olds has the highest likelihood of being enrolled in private schools, with 34 (41.5% in the age bracket) enrolled. Conversely, the age group of 3 to 4 year olds has the lowest likelihood of being enrolled in a private school, with 20 (100.0% in the age bracket) attending a public institution.
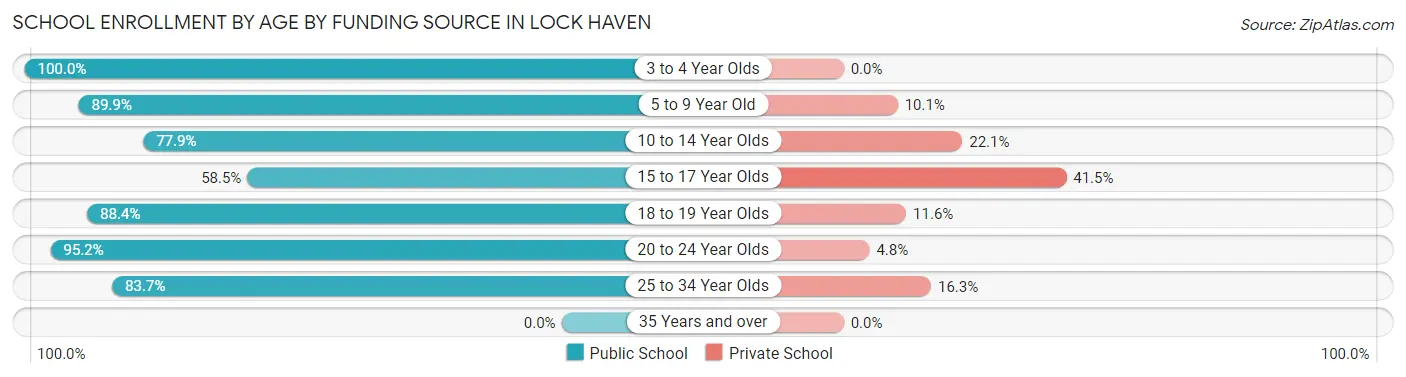
| Age Bracket | Public School | Private School |
| 3 to 4 Year Olds | 20 (100.0%) | 0 (0.0%) |
| 5 to 9 Year Old | 322 (89.9%) | 36 (10.1%) |
| 10 to 14 Year Olds | 275 (77.9%) | 78 (22.1%) |
| 15 to 17 Year Olds | 48 (58.5%) | 34 (41.5%) |
| 18 to 19 Year Olds | 607 (88.4%) | 80 (11.6%) |
| 20 to 24 Year Olds | 933 (95.2%) | 47 (4.8%) |
| 25 to 34 Year Olds | 36 (83.7%) | 7 (16.3%) |
| 35 Years and over | 0 (0.0%) | 0 (0.0%) |
| Total | 2,240 (88.8%) | 283 (11.2%) |
Educational Attainment by Field of Study in Lock Haven
Arts & humanities (276 | 21.4%), education (245 | 19.0%), bio, nature & agricultural (150 | 11.6%), business (134 | 10.4%), and liberal arts & history (113 | 8.8%) are the most common fields of study among 1,289 individuals in Lock Haven who have obtained a bachelor's degree or higher.
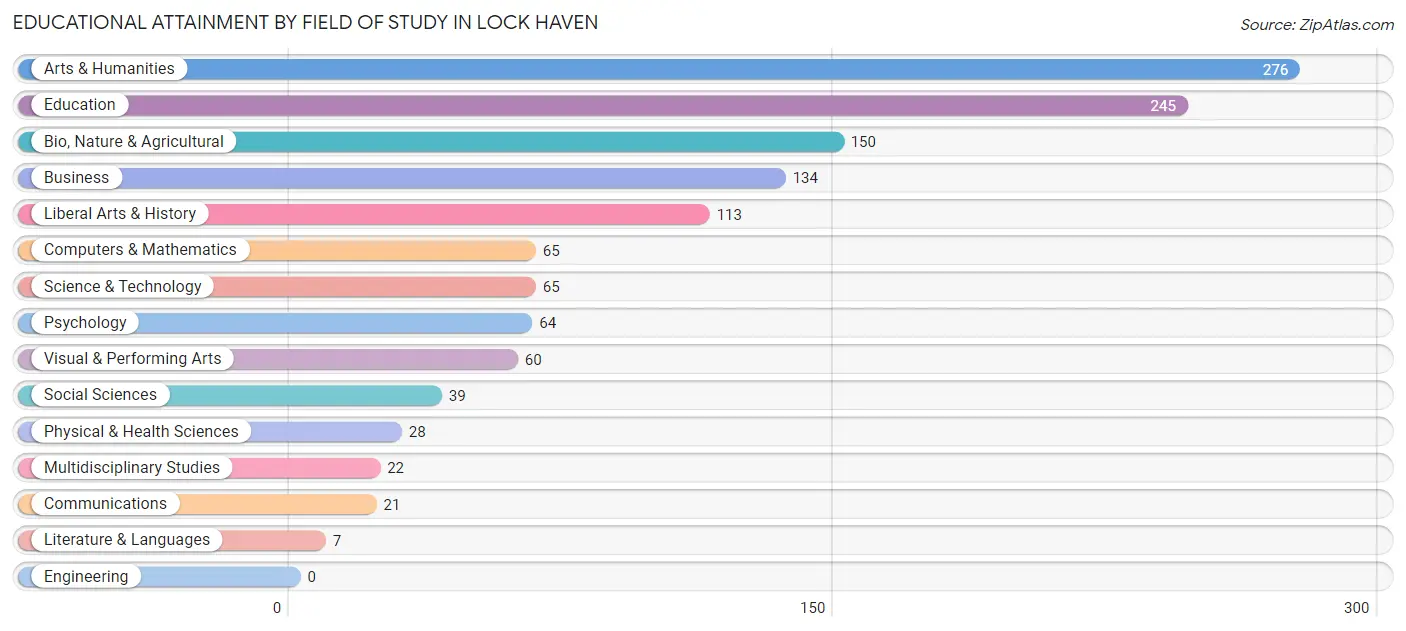
| Field of Study | # Graduates | % Graduates |
| Computers & Mathematics | 65 | 5.0% |
| Bio, Nature & Agricultural | 150 | 11.6% |
| Physical & Health Sciences | 28 | 2.2% |
| Psychology | 64 | 5.0% |
| Social Sciences | 39 | 3.0% |
| Engineering | 0 | 0.0% |
| Multidisciplinary Studies | 22 | 1.7% |
| Science & Technology | 65 | 5.0% |
| Business | 134 | 10.4% |
| Education | 245 | 19.0% |
| Literature & Languages | 7 | 0.5% |
| Liberal Arts & History | 113 | 8.8% |
| Visual & Performing Arts | 60 | 4.6% |
| Communications | 21 | 1.6% |
| Arts & Humanities | 276 | 21.4% |
| Total | 1,289 | 100.0% |
Transportation & Commute in Lock Haven
Vehicle Availability by Sex in Lock Haven
The most prevalent vehicle ownership categories in Lock Haven are males with 2 vehicles (625, accounting for 35.2%) and females with 2 vehicles (624, making up 38.8%).
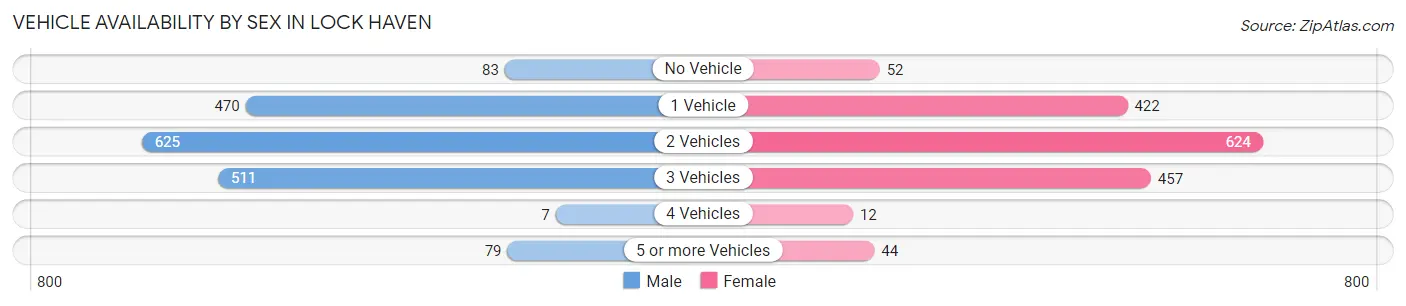
| Vehicles Available | Male | Female |
| No Vehicle | 83 (4.7%) | 52 (3.2%) |
| 1 Vehicle | 470 (26.5%) | 422 (26.2%) |
| 2 Vehicles | 625 (35.2%) | 624 (38.7%) |
| 3 Vehicles | 511 (28.8%) | 457 (28.4%) |
| 4 Vehicles | 7 (0.4%) | 12 (0.7%) |
| 5 or more Vehicles | 79 (4.4%) | 44 (2.7%) |
| Total | 1,775 (100.0%) | 1,611 (100.0%) |
Commute Time in Lock Haven
The most frequently occuring commute durations in Lock Haven are 5 to 9 minutes (937 commuters, 26.8%), 10 to 14 minutes (652 commuters, 18.6%), and 15 to 19 minutes (487 commuters, 13.9%).
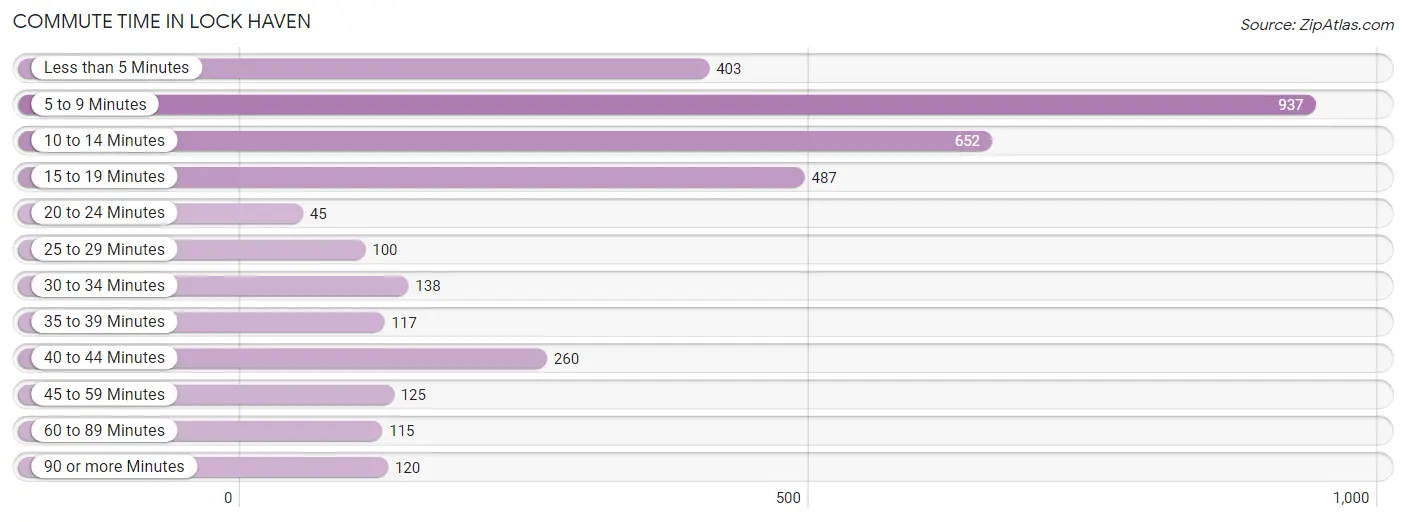
| Commute Time | # Commuters | % Commuters |
| Less than 5 Minutes | 403 | 11.5% |
| 5 to 9 Minutes | 937 | 26.8% |
| 10 to 14 Minutes | 652 | 18.6% |
| 15 to 19 Minutes | 487 | 13.9% |
| 20 to 24 Minutes | 45 | 1.3% |
| 25 to 29 Minutes | 100 | 2.9% |
| 30 to 34 Minutes | 138 | 3.9% |
| 35 to 39 Minutes | 117 | 3.3% |
| 40 to 44 Minutes | 260 | 7.4% |
| 45 to 59 Minutes | 125 | 3.6% |
| 60 to 89 Minutes | 115 | 3.3% |
| 90 or more Minutes | 120 | 3.4% |
Commute Time by Sex in Lock Haven
The most common commute times in Lock Haven are 5 to 9 minutes (516 commuters, 28.4%) for males and 5 to 9 minutes (421 commuters, 25.0%) for females.
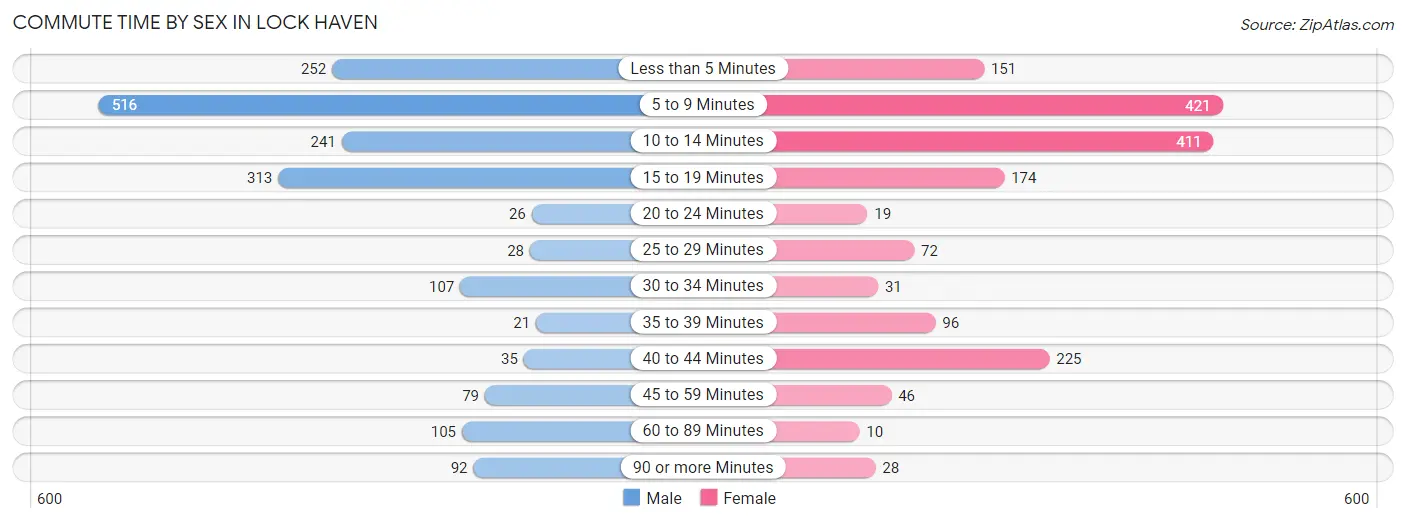
| Commute Time | Male | Female |
| Less than 5 Minutes | 252 (13.9%) | 151 (9.0%) |
| 5 to 9 Minutes | 516 (28.4%) | 421 (25.0%) |
| 10 to 14 Minutes | 241 (13.3%) | 411 (24.4%) |
| 15 to 19 Minutes | 313 (17.2%) | 174 (10.3%) |
| 20 to 24 Minutes | 26 (1.4%) | 19 (1.1%) |
| 25 to 29 Minutes | 28 (1.5%) | 72 (4.3%) |
| 30 to 34 Minutes | 107 (5.9%) | 31 (1.8%) |
| 35 to 39 Minutes | 21 (1.2%) | 96 (5.7%) |
| 40 to 44 Minutes | 35 (1.9%) | 225 (13.4%) |
| 45 to 59 Minutes | 79 (4.3%) | 46 (2.7%) |
| 60 to 89 Minutes | 105 (5.8%) | 10 (0.6%) |
| 90 or more Minutes | 92 (5.1%) | 28 (1.7%) |
Time of Departure to Work by Sex in Lock Haven
The most frequent times of departure to work in Lock Haven are 4:00 PM to 11:59 PM (421, 23.2%) for males and 4:00 PM to 11:59 PM (341, 20.3%) for females.
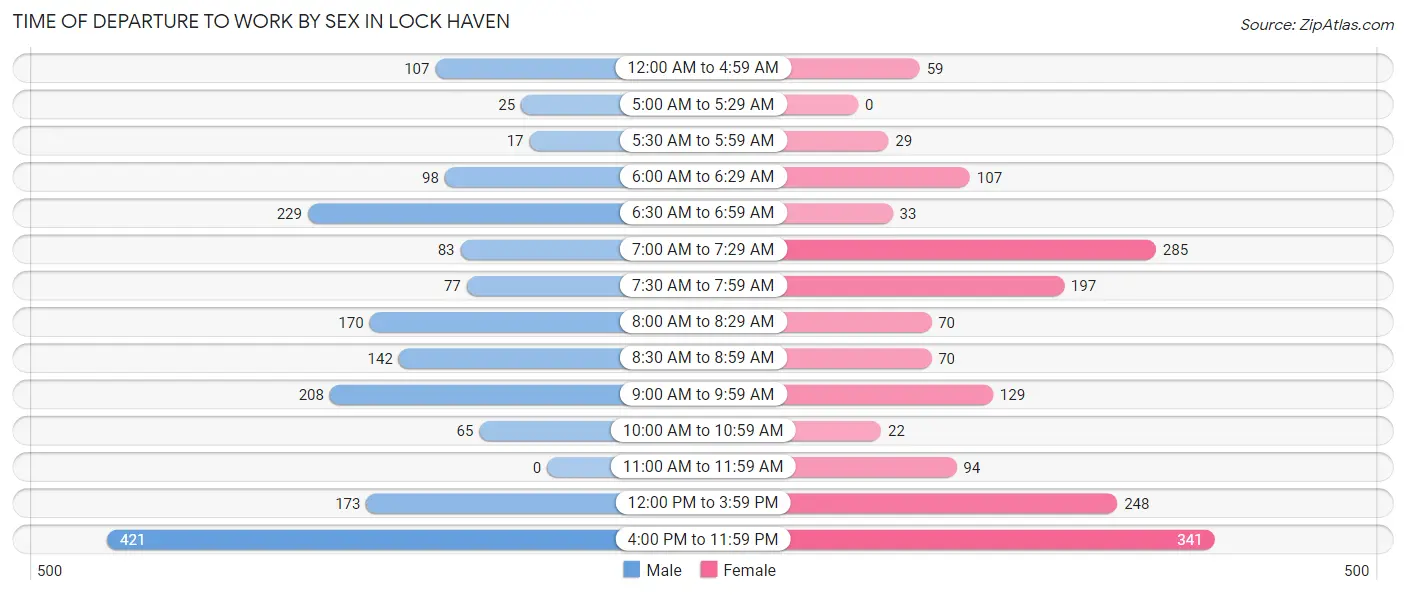
| Time of Departure | Male | Female |
| 12:00 AM to 4:59 AM | 107 (5.9%) | 59 (3.5%) |
| 5:00 AM to 5:29 AM | 25 (1.4%) | 0 (0.0%) |
| 5:30 AM to 5:59 AM | 17 (0.9%) | 29 (1.7%) |
| 6:00 AM to 6:29 AM | 98 (5.4%) | 107 (6.4%) |
| 6:30 AM to 6:59 AM | 229 (12.6%) | 33 (2.0%) |
| 7:00 AM to 7:29 AM | 83 (4.6%) | 285 (16.9%) |
| 7:30 AM to 7:59 AM | 77 (4.2%) | 197 (11.7%) |
| 8:00 AM to 8:29 AM | 170 (9.4%) | 70 (4.2%) |
| 8:30 AM to 8:59 AM | 142 (7.8%) | 70 (4.2%) |
| 9:00 AM to 9:59 AM | 208 (11.5%) | 129 (7.7%) |
| 10:00 AM to 10:59 AM | 65 (3.6%) | 22 (1.3%) |
| 11:00 AM to 11:59 AM | 0 (0.0%) | 94 (5.6%) |
| 12:00 PM to 3:59 PM | 173 (9.5%) | 248 (14.7%) |
| 4:00 PM to 11:59 PM | 421 (23.2%) | 341 (20.3%) |
| Total | 1,815 (100.0%) | 1,684 (100.0%) |
Housing Occupancy in Lock Haven
Occupancy by Ownership in Lock Haven
Of the total 3,287 dwellings in Lock Haven, owner-occupied units account for 1,107 (33.7%), while renter-occupied units make up 2,180 (66.3%).
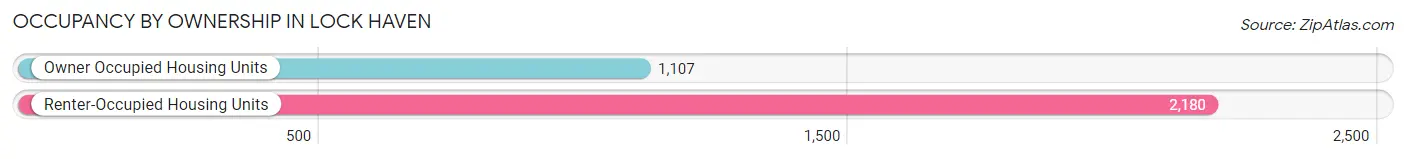
| Occupancy | # Housing Units | % Housing Units |
| Owner Occupied Housing Units | 1,107 | 33.7% |
| Renter-Occupied Housing Units | 2,180 | 66.3% |
| Total Occupied Housing Units | 3,287 | 100.0% |
Occupancy by Household Size in Lock Haven
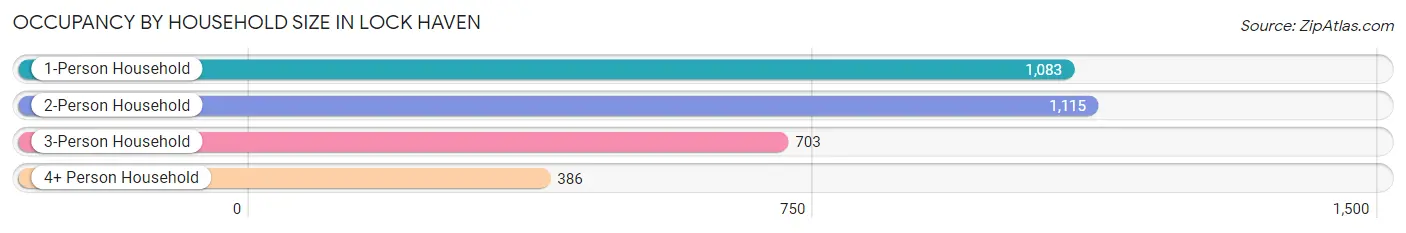
| Household Size | # Housing Units | % Housing Units |
| 1-Person Household | 1,083 | 33.0% |
| 2-Person Household | 1,115 | 33.9% |
| 3-Person Household | 703 | 21.4% |
| 4+ Person Household | 386 | 11.7% |
| Total Housing Units | 3,287 | 100.0% |
Occupancy by Ownership by Household Size in Lock Haven
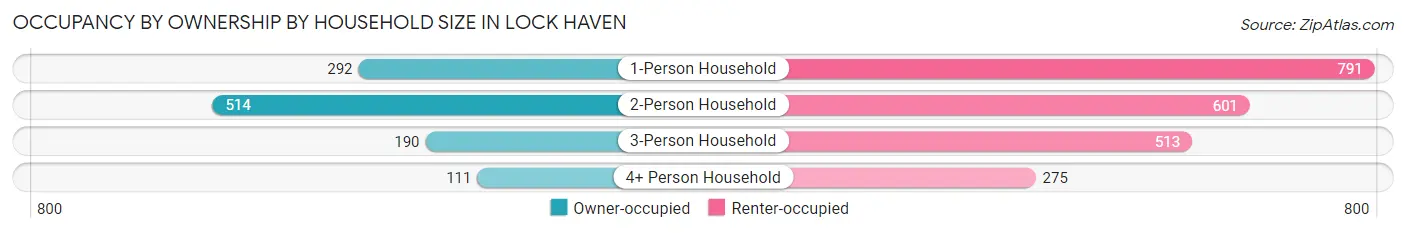
| Household Size | Owner-occupied | Renter-occupied |
| 1-Person Household | 292 (27.0%) | 791 (73.0%) |
| 2-Person Household | 514 (46.1%) | 601 (53.9%) |
| 3-Person Household | 190 (27.0%) | 513 (73.0%) |
| 4+ Person Household | 111 (28.8%) | 275 (71.2%) |
| Total Housing Units | 1,107 (33.7%) | 2,180 (66.3%) |
Occupancy by Educational Attainment in Lock Haven
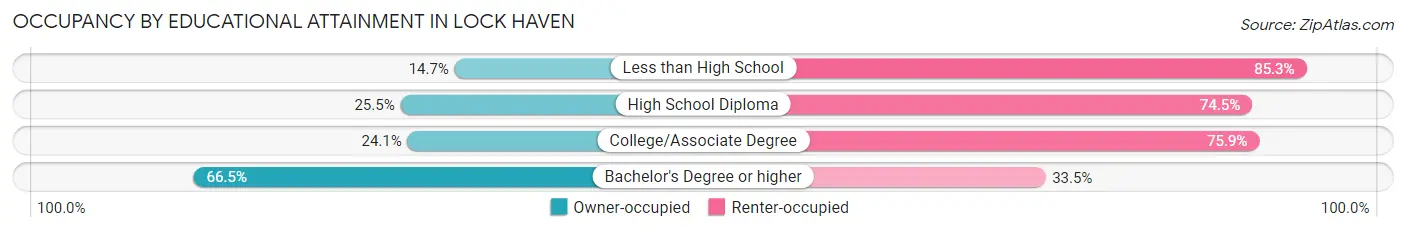
| Household Size | Owner-occupied | Renter-occupied |
| Less than High School | 47 (14.7%) | 272 (85.3%) |
| High School Diploma | 342 (25.5%) | 1,000 (74.5%) |
| College/Associate Degree | 206 (24.1%) | 650 (75.9%) |
| Bachelor's Degree or higher | 512 (66.5%) | 258 (33.5%) |
Occupancy by Age of Householder in Lock Haven
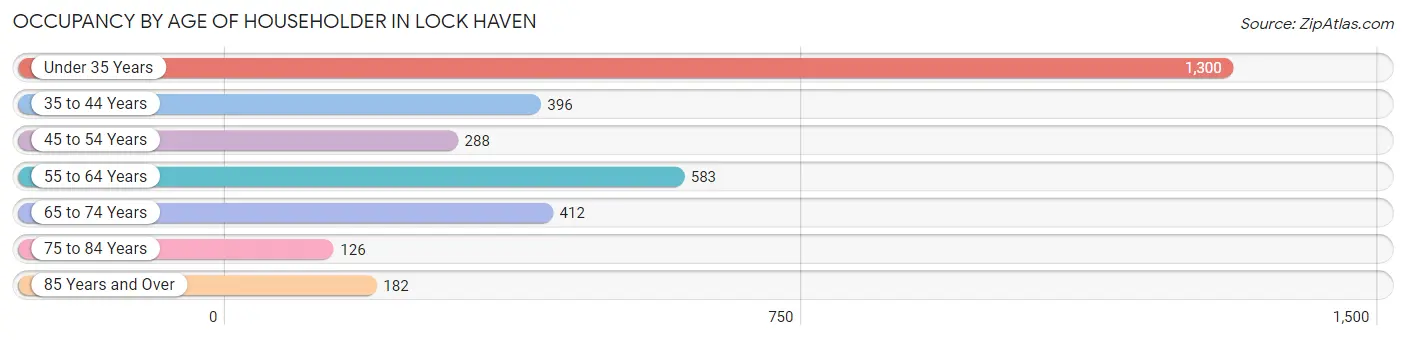
| Age Bracket | # Households | % Households |
| Under 35 Years | 1,300 | 39.6% |
| 35 to 44 Years | 396 | 12.0% |
| 45 to 54 Years | 288 | 8.8% |
| 55 to 64 Years | 583 | 17.7% |
| 65 to 74 Years | 412 | 12.5% |
| 75 to 84 Years | 126 | 3.8% |
| 85 Years and Over | 182 | 5.5% |
| Total | 3,287 | 100.0% |
Housing Finances in Lock Haven
Median Income by Occupancy in Lock Haven
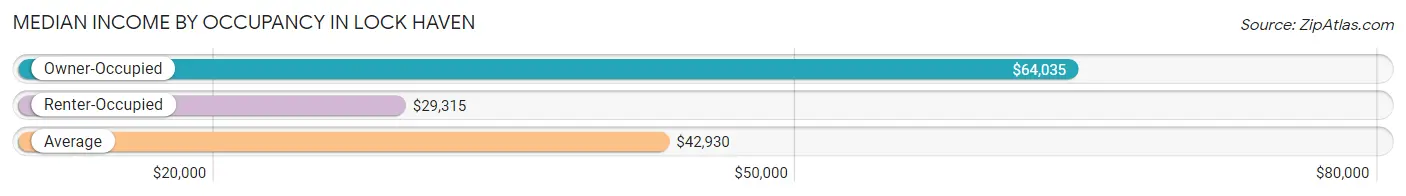
| Occupancy Type | # Households | Median Income |
| Owner-Occupied | 1,107 (33.7%) | $64,035 |
| Renter-Occupied | 2,180 (66.3%) | $29,315 |
| Average | 3,287 (100.0%) | $42,930 |
Occupancy by Householder Income Bracket in Lock Haven
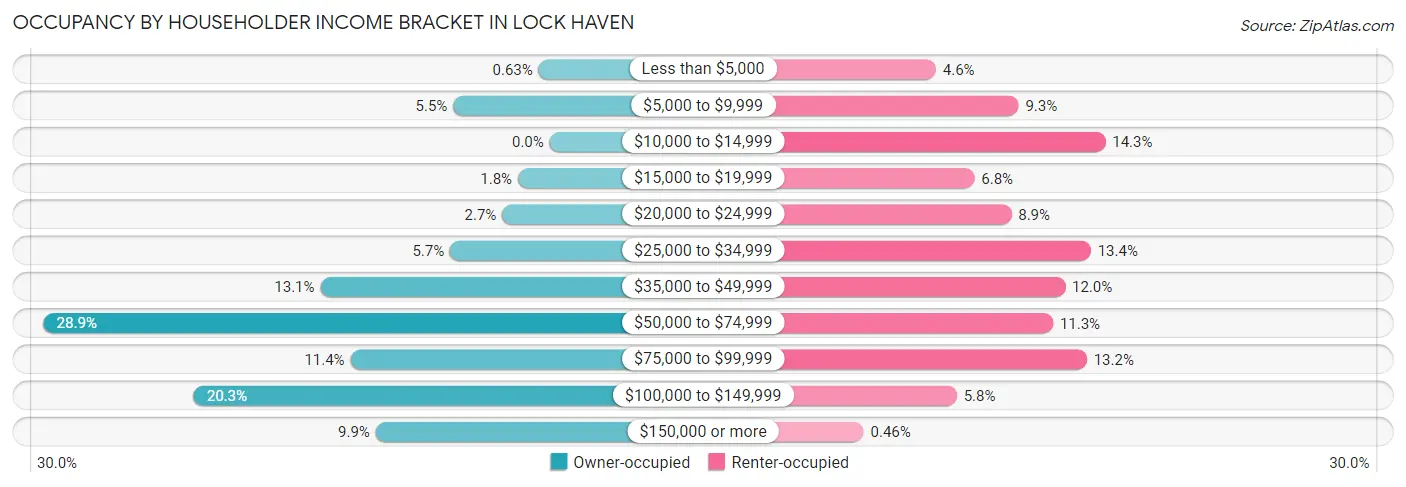
| Income Bracket | Owner-occupied | Renter-occupied |
| Less than $5,000 | 7 (0.6%) | 100 (4.6%) |
| $5,000 to $9,999 | 61 (5.5%) | 203 (9.3%) |
| $10,000 to $14,999 | 0 (0.0%) | 311 (14.3%) |
| $15,000 to $19,999 | 20 (1.8%) | 148 (6.8%) |
| $20,000 to $24,999 | 30 (2.7%) | 194 (8.9%) |
| $25,000 to $34,999 | 63 (5.7%) | 293 (13.4%) |
| $35,000 to $49,999 | 145 (13.1%) | 261 (12.0%) |
| $50,000 to $74,999 | 320 (28.9%) | 246 (11.3%) |
| $75,000 to $99,999 | 126 (11.4%) | 288 (13.2%) |
| $100,000 to $149,999 | 225 (20.3%) | 126 (5.8%) |
| $150,000 or more | 110 (9.9%) | 10 (0.5%) |
| Total | 1,107 (100.0%) | 2,180 (100.0%) |
Monthly Housing Cost Tiers in Lock Haven
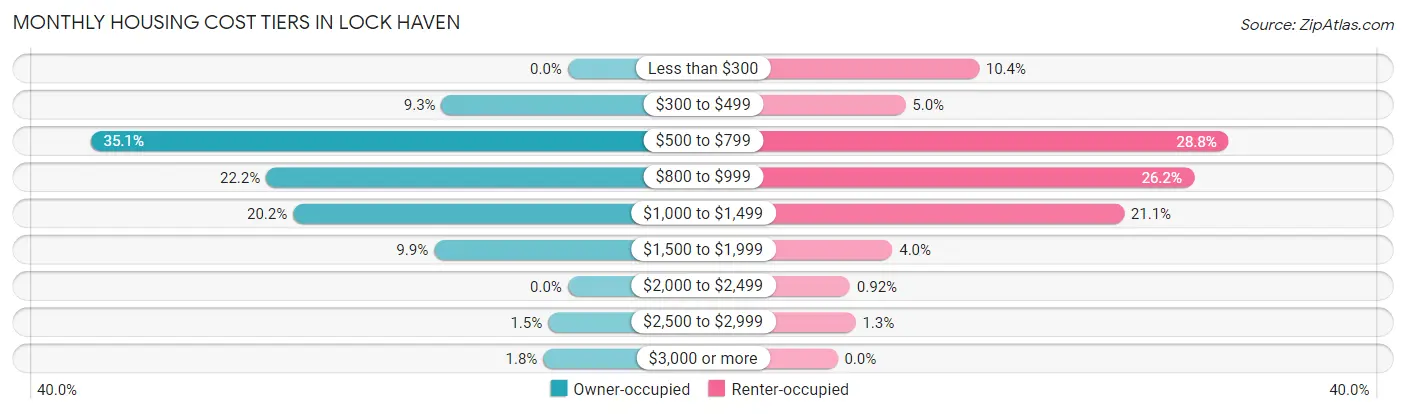
| Monthly Cost | Owner-occupied | Renter-occupied |
| Less than $300 | 0 (0.0%) | 227 (10.4%) |
| $300 to $499 | 103 (9.3%) | 109 (5.0%) |
| $500 to $799 | 389 (35.1%) | 628 (28.8%) |
| $800 to $999 | 246 (22.2%) | 572 (26.2%) |
| $1,000 to $1,499 | 224 (20.2%) | 460 (21.1%) |
| $1,500 to $1,999 | 109 (9.9%) | 88 (4.0%) |
| $2,000 to $2,499 | 0 (0.0%) | 20 (0.9%) |
| $2,500 to $2,999 | 16 (1.5%) | 29 (1.3%) |
| $3,000 or more | 20 (1.8%) | 0 (0.0%) |
| Total | 1,107 (100.0%) | 2,180 (100.0%) |
Physical Housing Characteristics in Lock Haven
Housing Structures in Lock Haven
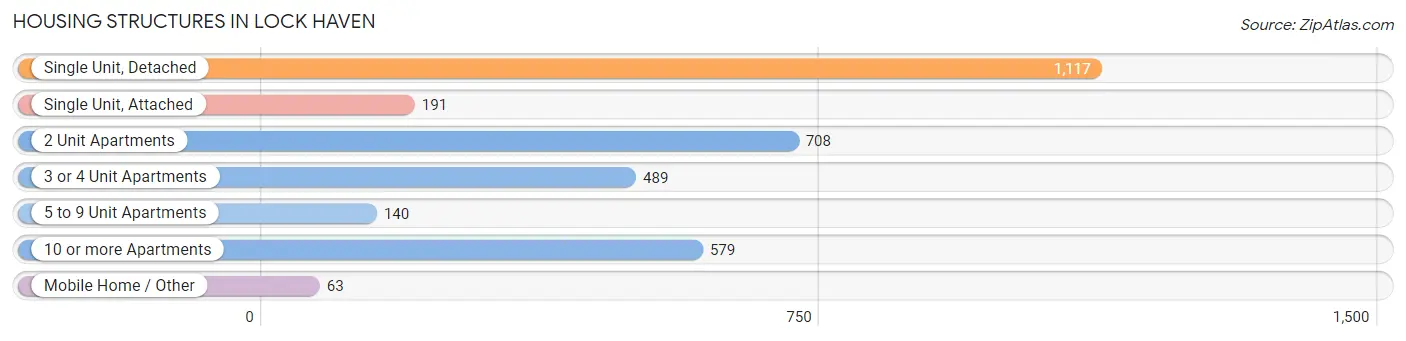
| Structure Type | # Housing Units | % Housing Units |
| Single Unit, Detached | 1,117 | 34.0% |
| Single Unit, Attached | 191 | 5.8% |
| 2 Unit Apartments | 708 | 21.5% |
| 3 or 4 Unit Apartments | 489 | 14.9% |
| 5 to 9 Unit Apartments | 140 | 4.3% |
| 10 or more Apartments | 579 | 17.6% |
| Mobile Home / Other | 63 | 1.9% |
| Total | 3,287 | 100.0% |
Housing Structures by Occupancy in Lock Haven
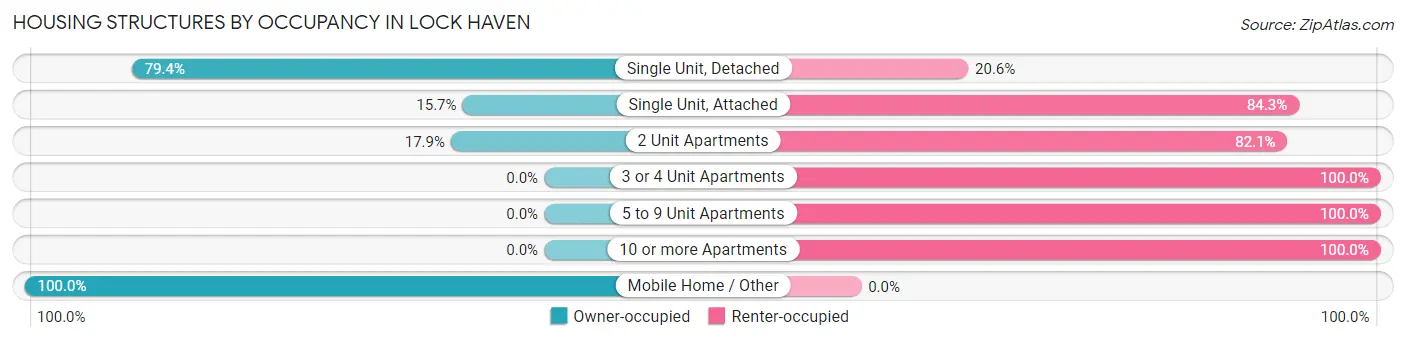
| Structure Type | Owner-occupied | Renter-occupied |
| Single Unit, Detached | 887 (79.4%) | 230 (20.6%) |
| Single Unit, Attached | 30 (15.7%) | 161 (84.3%) |
| 2 Unit Apartments | 127 (17.9%) | 581 (82.1%) |
| 3 or 4 Unit Apartments | 0 (0.0%) | 489 (100.0%) |
| 5 to 9 Unit Apartments | 0 (0.0%) | 140 (100.0%) |
| 10 or more Apartments | 0 (0.0%) | 579 (100.0%) |
| Mobile Home / Other | 63 (100.0%) | 0 (0.0%) |
| Total | 1,107 (33.7%) | 2,180 (66.3%) |
Housing Structures by Number of Rooms in Lock Haven
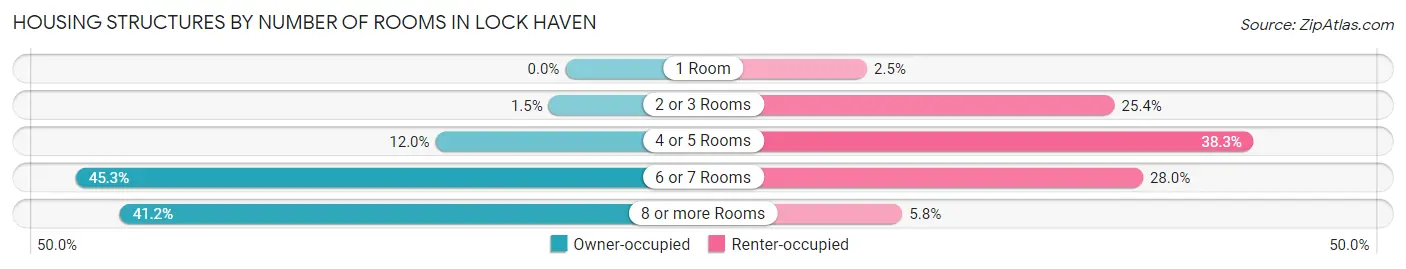
| Number of Rooms | Owner-occupied | Renter-occupied |
| 1 Room | 0 (0.0%) | 55 (2.5%) |
| 2 or 3 Rooms | 17 (1.5%) | 554 (25.4%) |
| 4 or 5 Rooms | 133 (12.0%) | 834 (38.3%) |
| 6 or 7 Rooms | 501 (45.3%) | 611 (28.0%) |
| 8 or more Rooms | 456 (41.2%) | 126 (5.8%) |
| Total | 1,107 (100.0%) | 2,180 (100.0%) |
Housing Structure by Heating Type in Lock Haven
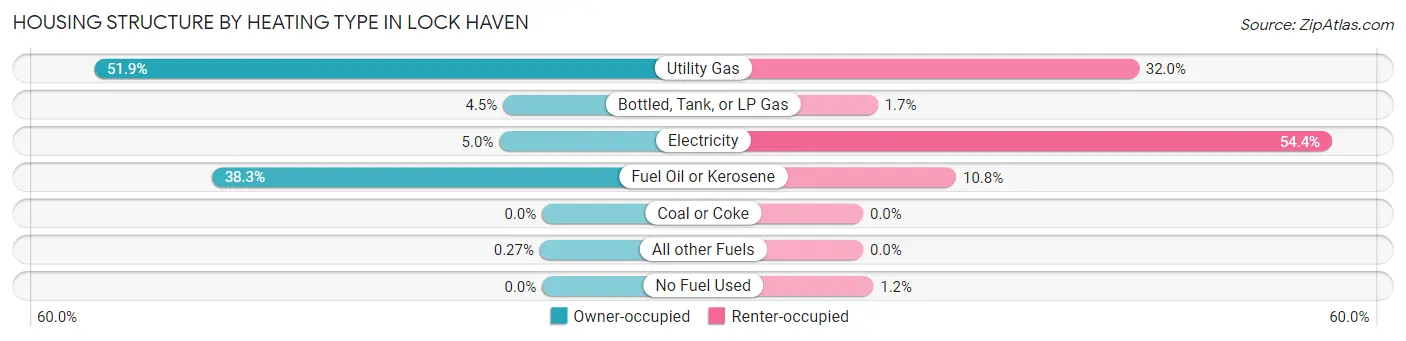
| Heating Type | Owner-occupied | Renter-occupied |
| Utility Gas | 575 (51.9%) | 697 (32.0%) |
| Bottled, Tank, or LP Gas | 50 (4.5%) | 37 (1.7%) |
| Electricity | 55 (5.0%) | 1,185 (54.4%) |
| Fuel Oil or Kerosene | 424 (38.3%) | 235 (10.8%) |
| Coal or Coke | 0 (0.0%) | 0 (0.0%) |
| All other Fuels | 3 (0.3%) | 0 (0.0%) |
| No Fuel Used | 0 (0.0%) | 26 (1.2%) |
| Total | 1,107 (100.0%) | 2,180 (100.0%) |
Household Vehicle Usage in Lock Haven
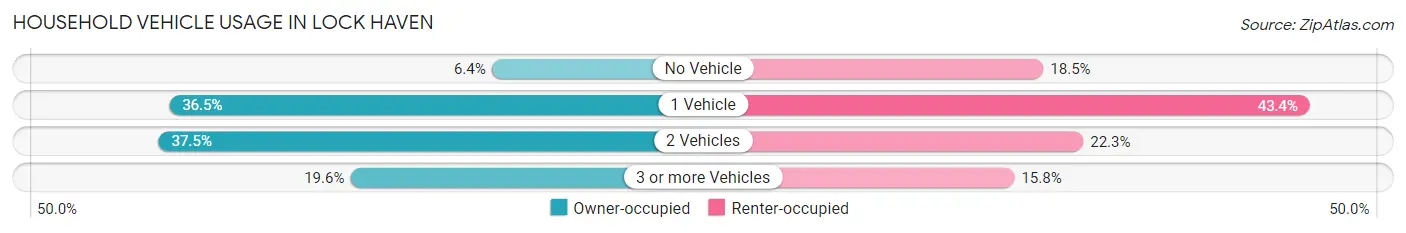
| Vehicles per Household | Owner-occupied | Renter-occupied |
| No Vehicle | 71 (6.4%) | 404 (18.5%) |
| 1 Vehicle | 404 (36.5%) | 946 (43.4%) |
| 2 Vehicles | 415 (37.5%) | 485 (22.3%) |
| 3 or more Vehicles | 217 (19.6%) | 345 (15.8%) |
| Total | 1,107 (100.0%) | 2,180 (100.0%) |
Real Estate & Mortgages in Lock Haven
Real Estate and Mortgage Overview in Lock Haven
| Characteristic | Without Mortgage | With Mortgage |
| Housing Units | 449 | 658 |
| Median Property Value | $121,100 | $142,600 |
| Median Household Income | $45,718 | $67 |
| Monthly Housing Costs | $676 | $20 |
| Real Estate Taxes | $3,206 | $0 |
Property Value by Mortgage Status in Lock Haven
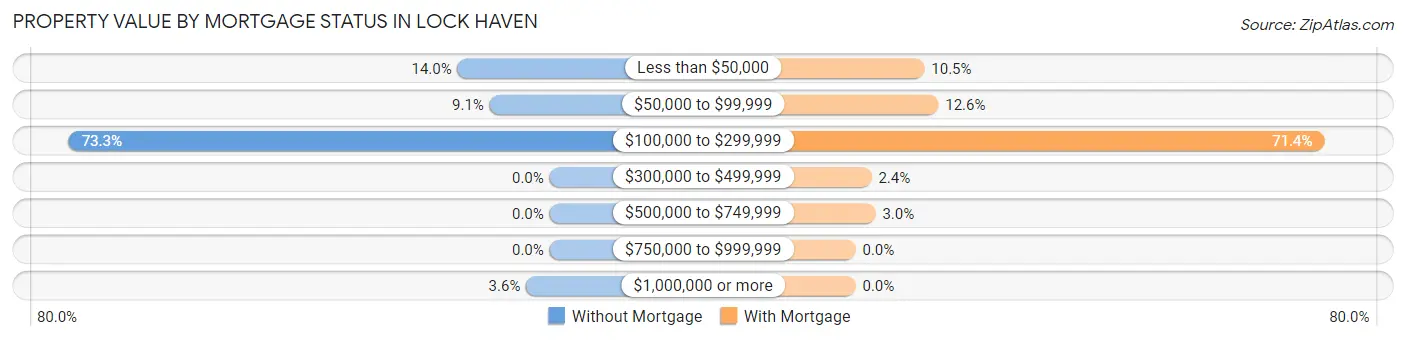
| Property Value | Without Mortgage | With Mortgage |
| Less than $50,000 | 63 (14.0%) | 69 (10.5%) |
| $50,000 to $99,999 | 41 (9.1%) | 83 (12.6%) |
| $100,000 to $299,999 | 329 (73.3%) | 470 (71.4%) |
| $300,000 to $499,999 | 0 (0.0%) | 16 (2.4%) |
| $500,000 to $749,999 | 0 (0.0%) | 20 (3.0%) |
| $750,000 to $999,999 | 0 (0.0%) | 0 (0.0%) |
| $1,000,000 or more | 16 (3.6%) | 0 (0.0%) |
| Total | 449 (100.0%) | 658 (100.0%) |
Household Income by Mortgage Status in Lock Haven
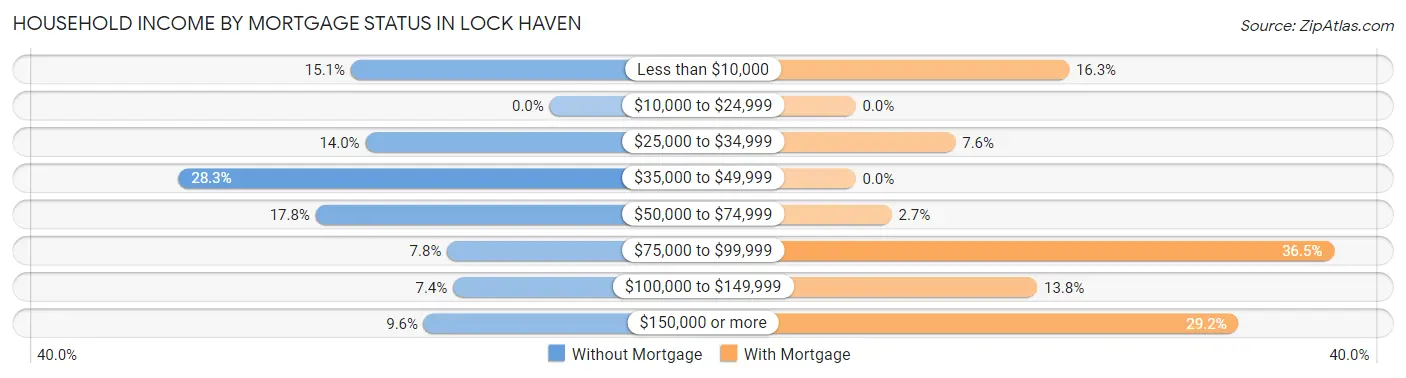
| Household Income | Without Mortgage | With Mortgage |
| Less than $10,000 | 68 (15.1%) | 107 (16.3%) |
| $10,000 to $24,999 | 0 (0.0%) | 0 (0.0%) |
| $25,000 to $34,999 | 63 (14.0%) | 50 (7.6%) |
| $35,000 to $49,999 | 127 (28.3%) | 0 (0.0%) |
| $50,000 to $74,999 | 80 (17.8%) | 18 (2.7%) |
| $75,000 to $99,999 | 35 (7.8%) | 240 (36.5%) |
| $100,000 to $149,999 | 33 (7.3%) | 91 (13.8%) |
| $150,000 or more | 43 (9.6%) | 192 (29.2%) |
| Total | 449 (100.0%) | 658 (100.0%) |
Property Value to Household Income Ratio in Lock Haven
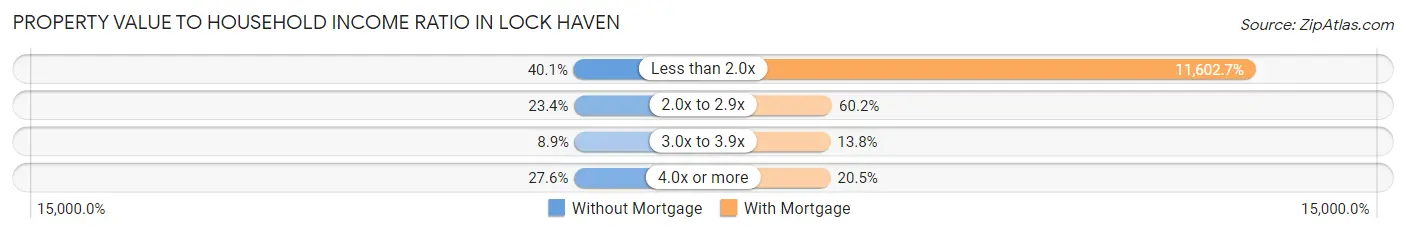
| Value-to-Income Ratio | Without Mortgage | With Mortgage |
| Less than 2.0x | 180 (40.1%) | 76,346 (11,602.7%) |
| 2.0x to 2.9x | 105 (23.4%) | 396 (60.2%) |
| 3.0x to 3.9x | 40 (8.9%) | 91 (13.8%) |
| 4.0x or more | 124 (27.6%) | 135 (20.5%) |
| Total | 449 (100.0%) | 658 (100.0%) |
Real Estate Taxes by Mortgage Status in Lock Haven
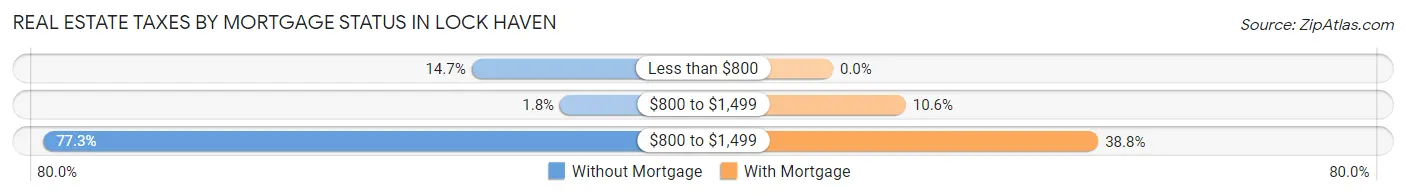
| Property Taxes | Without Mortgage | With Mortgage |
| Less than $800 | 66 (14.7%) | 0 (0.0%) |
| $800 to $1,499 | 8 (1.8%) | 70 (10.6%) |
| $800 to $1,499 | 347 (77.3%) | 255 (38.8%) |
| Total | 449 (100.0%) | 658 (100.0%) |
Health & Disability in Lock Haven
Health Insurance Coverage by Age in Lock Haven
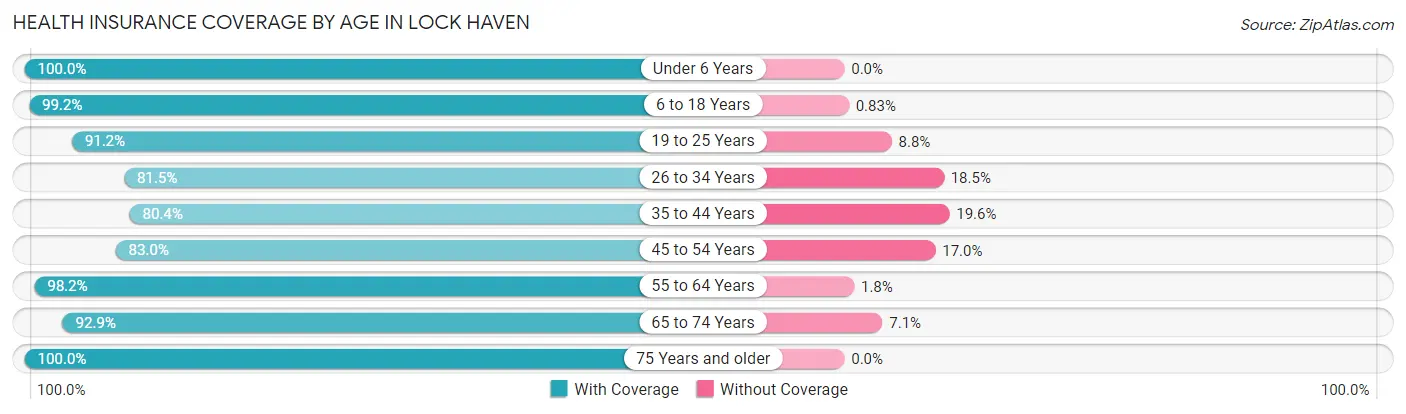
| Age Bracket | With Coverage | Without Coverage |
| Under 6 Years | 551 (100.0%) | 0 (0.0%) |
| 6 to 18 Years | 1,192 (99.2%) | 10 (0.8%) |
| 19 to 25 Years | 1,944 (91.2%) | 188 (8.8%) |
| 26 to 34 Years | 958 (81.5%) | 218 (18.5%) |
| 35 to 44 Years | 616 (80.4%) | 150 (19.6%) |
| 45 to 54 Years | 411 (83.0%) | 84 (17.0%) |
| 55 to 64 Years | 808 (98.2%) | 15 (1.8%) |
| 65 to 74 Years | 616 (92.9%) | 47 (7.1%) |
| 75 Years and older | 391 (100.0%) | 0 (0.0%) |
| Total | 7,487 (91.3%) | 712 (8.7%) |
Health Insurance Coverage by Citizenship Status in Lock Haven
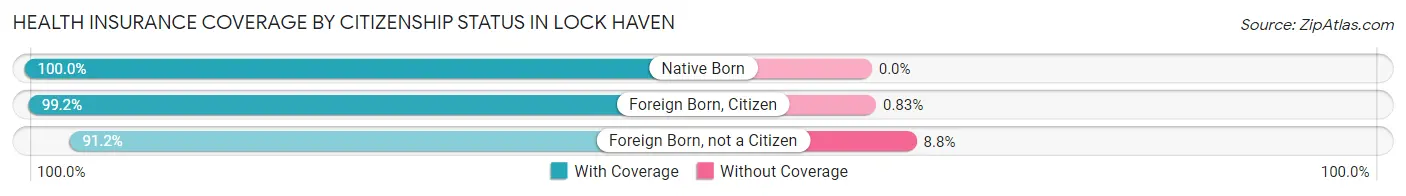
| Citizenship Status | With Coverage | Without Coverage |
| Native Born | 551 (100.0%) | 0 (0.0%) |
| Foreign Born, Citizen | 1,192 (99.2%) | 10 (0.8%) |
| Foreign Born, not a Citizen | 1,944 (91.2%) | 188 (8.8%) |
Health Insurance Coverage by Household Income in Lock Haven
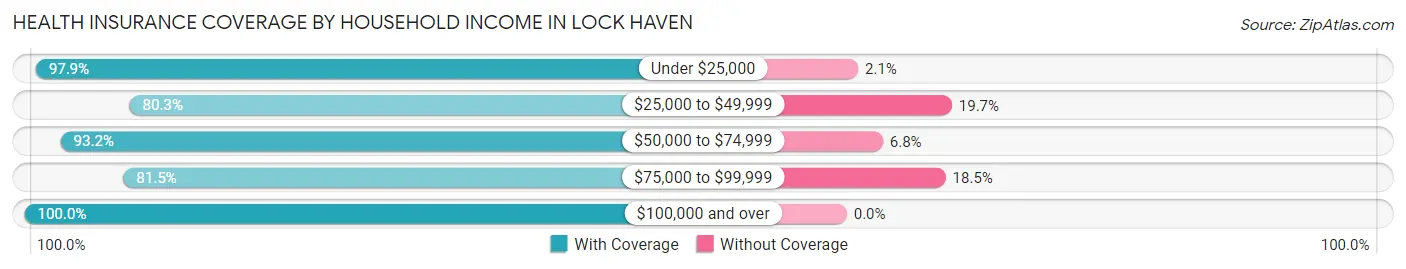
| Household Income | With Coverage | Without Coverage |
| Under $25,000 | 1,664 (97.9%) | 36 (2.1%) |
| $25,000 to $49,999 | 1,404 (80.3%) | 344 (19.7%) |
| $50,000 to $74,999 | 1,159 (93.2%) | 84 (6.8%) |
| $75,000 to $99,999 | 968 (81.5%) | 220 (18.5%) |
| $100,000 and over | 1,319 (100.0%) | 0 (0.0%) |
Public vs Private Health Insurance Coverage by Age in Lock Haven
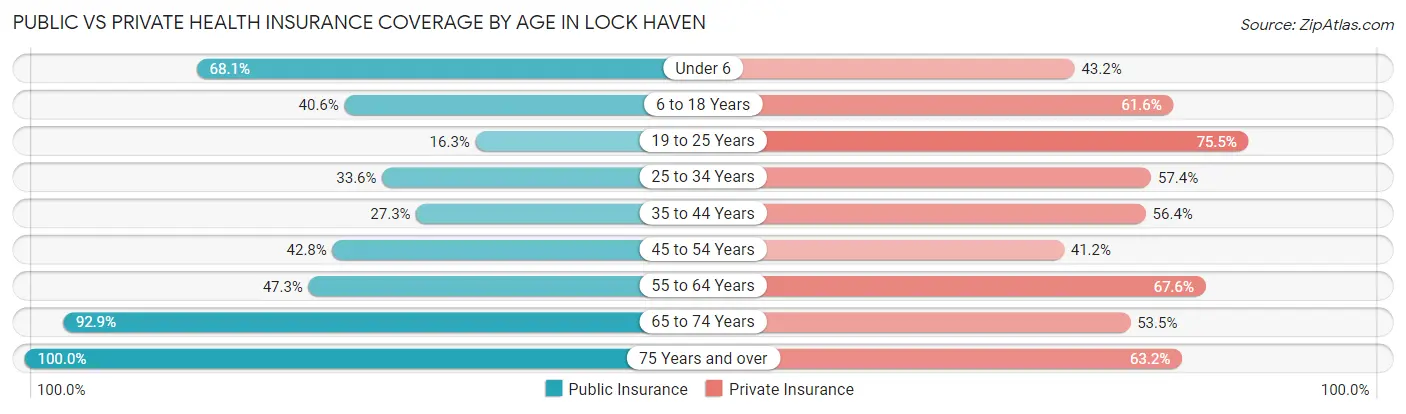
| Age Bracket | Public Insurance | Private Insurance |
| Under 6 | 375 (68.1%) | 238 (43.2%) |
| 6 to 18 Years | 488 (40.6%) | 740 (61.6%) |
| 19 to 25 Years | 347 (16.3%) | 1,610 (75.5%) |
| 25 to 34 Years | 395 (33.6%) | 675 (57.4%) |
| 35 to 44 Years | 209 (27.3%) | 432 (56.4%) |
| 45 to 54 Years | 212 (42.8%) | 204 (41.2%) |
| 55 to 64 Years | 389 (47.3%) | 556 (67.6%) |
| 65 to 74 Years | 616 (92.9%) | 355 (53.5%) |
| 75 Years and over | 391 (100.0%) | 247 (63.2%) |
| Total | 3,422 (41.7%) | 5,057 (61.7%) |
Disability Status by Sex by Age in Lock Haven
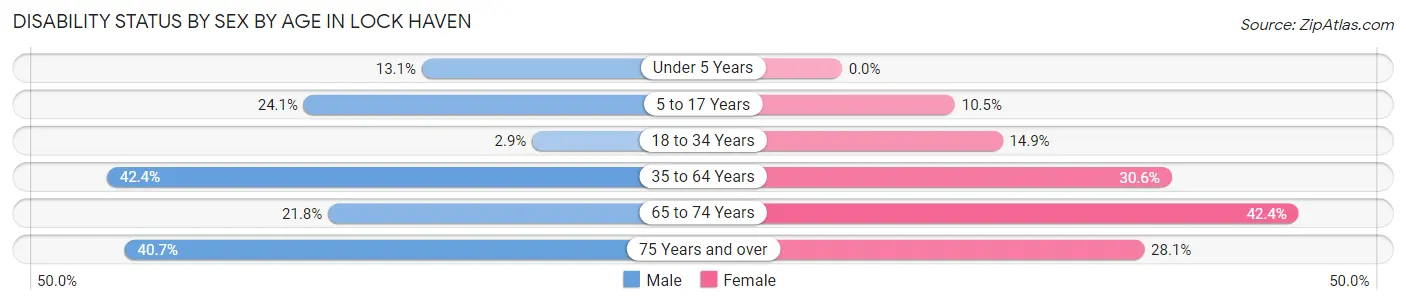
| Age Bracket | Male | Female |
| Under 5 Years | 23 (13.1%) | 0 (0.0%) |
| 5 to 17 Years | 113 (24.1%) | 34 (10.5%) |
| 18 to 34 Years | 54 (2.9%) | 293 (14.9%) |
| 35 to 64 Years | 483 (42.4%) | 289 (30.6%) |
| 65 to 74 Years | 50 (21.8%) | 184 (42.4%) |
| 75 Years and over | 46 (40.7%) | 78 (28.1%) |
Disability Class by Sex by Age in Lock Haven
Disability Class: Hearing Difficulty
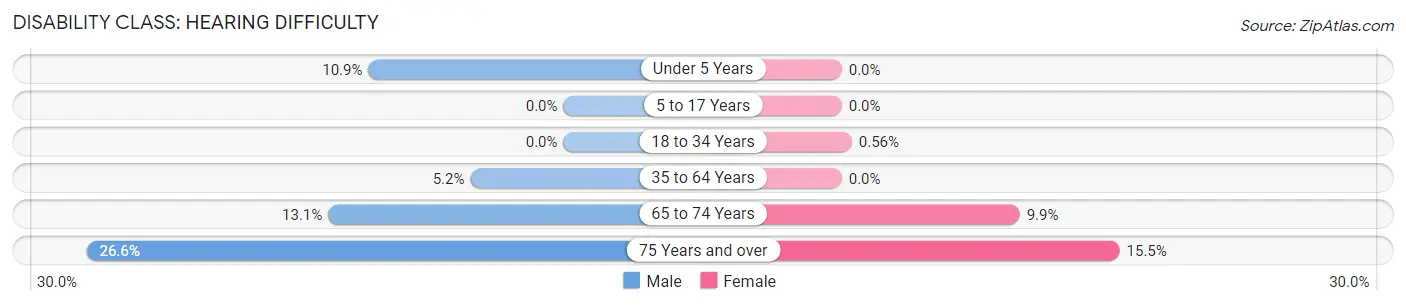
| Age Bracket | Male | Female |
| Under 5 Years | 19 (10.9%) | 0 (0.0%) |
| 5 to 17 Years | 0 (0.0%) | 0 (0.0%) |
| 18 to 34 Years | 0 (0.0%) | 11 (0.6%) |
| 35 to 64 Years | 59 (5.2%) | 0 (0.0%) |
| 65 to 74 Years | 30 (13.1%) | 43 (9.9%) |
| 75 Years and over | 30 (26.6%) | 43 (15.5%) |
Disability Class: Vision Difficulty
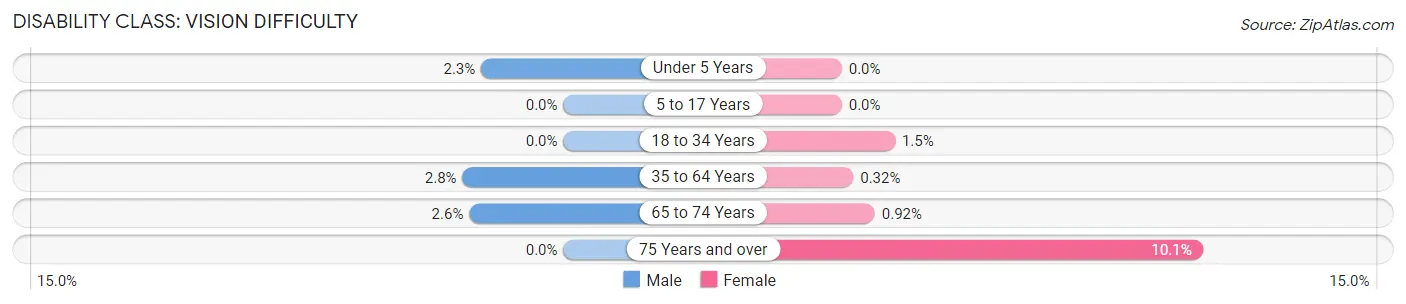
| Age Bracket | Male | Female |
| Under 5 Years | 4 (2.3%) | 0 (0.0%) |
| 5 to 17 Years | 0 (0.0%) | 0 (0.0%) |
| 18 to 34 Years | 0 (0.0%) | 29 (1.5%) |
| 35 to 64 Years | 32 (2.8%) | 3 (0.3%) |
| 65 to 74 Years | 6 (2.6%) | 4 (0.9%) |
| 75 Years and over | 0 (0.0%) | 28 (10.1%) |
Disability Class: Cognitive Difficulty
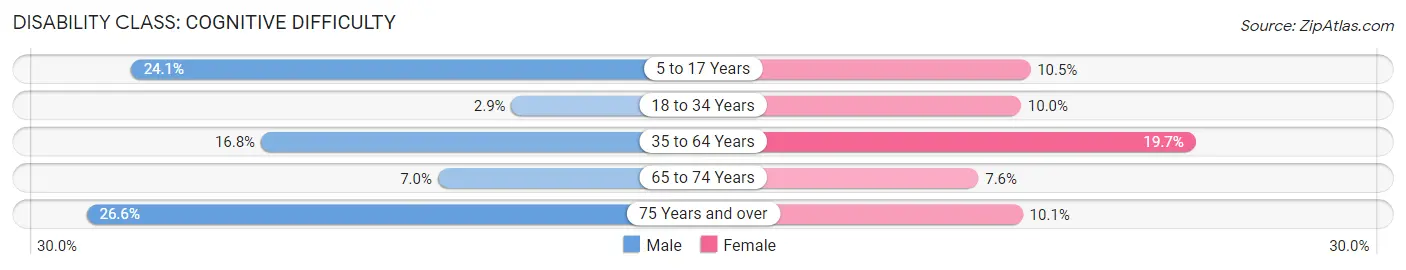
| Age Bracket | Male | Female |
| 5 to 17 Years | 113 (24.1%) | 34 (10.5%) |
| 18 to 34 Years | 54 (2.9%) | 196 (10.0%) |
| 35 to 64 Years | 192 (16.8%) | 186 (19.7%) |
| 65 to 74 Years | 16 (7.0%) | 33 (7.6%) |
| 75 Years and over | 30 (26.6%) | 28 (10.1%) |
Disability Class: Ambulatory Difficulty
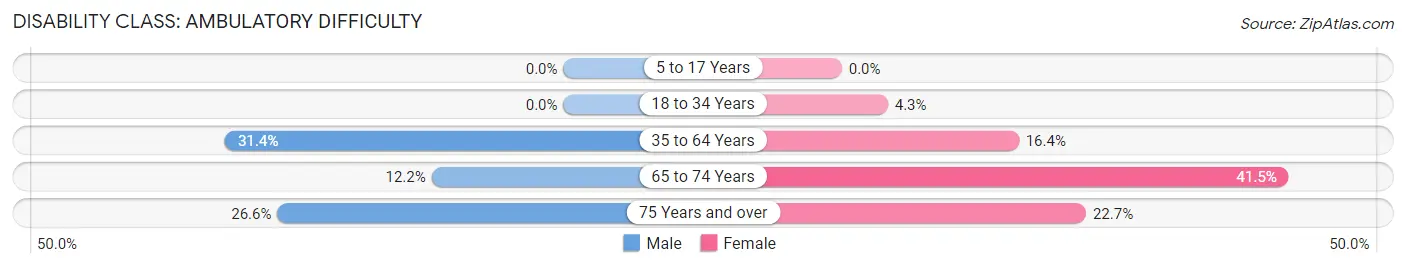
| Age Bracket | Male | Female |
| 5 to 17 Years | 0 (0.0%) | 0 (0.0%) |
| 18 to 34 Years | 0 (0.0%) | 84 (4.3%) |
| 35 to 64 Years | 358 (31.4%) | 155 (16.4%) |
| 65 to 74 Years | 28 (12.2%) | 180 (41.5%) |
| 75 Years and over | 30 (26.6%) | 63 (22.7%) |
Disability Class: Self-Care Difficulty
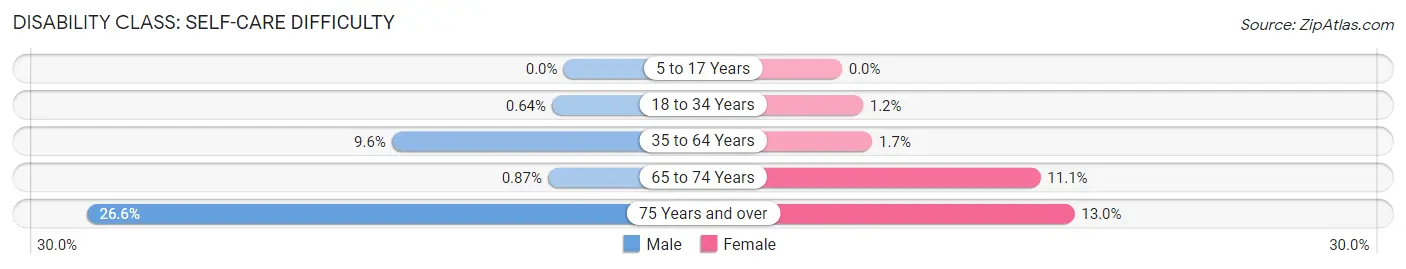
| Age Bracket | Male | Female |
| 5 to 17 Years | 0 (0.0%) | 0 (0.0%) |
| 18 to 34 Years | 12 (0.6%) | 23 (1.2%) |
| 35 to 64 Years | 109 (9.6%) | 16 (1.7%) |
| 65 to 74 Years | 2 (0.9%) | 48 (11.1%) |
| 75 Years and over | 30 (26.6%) | 36 (13.0%) |
Technology Access in Lock Haven
Computing Device Access in Lock Haven
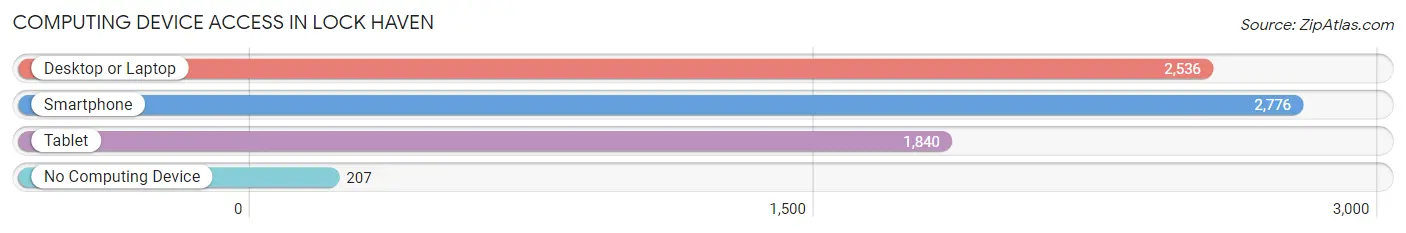
| Device Type | # Households | % Households |
| Desktop or Laptop | 2,536 | 77.1% |
| Smartphone | 2,776 | 84.5% |
| Tablet | 1,840 | 56.0% |
| No Computing Device | 207 | 6.3% |
| Total | 3,287 | 100.0% |
Internet Access in Lock Haven
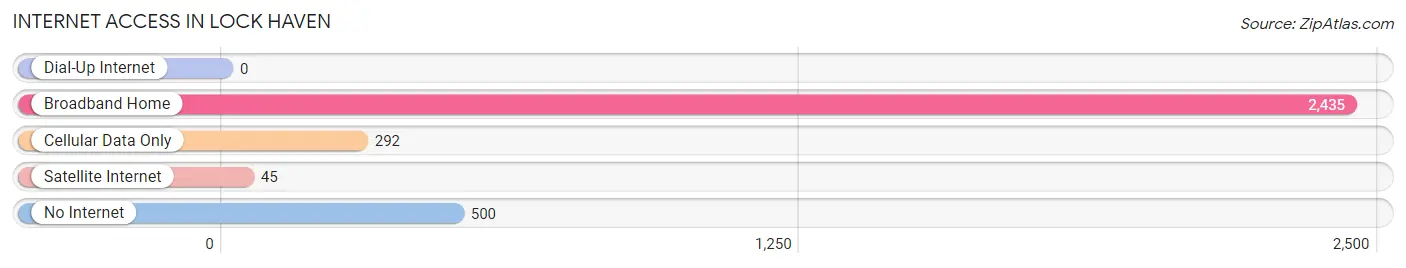
| Internet Type | # Households | % Households |
| Dial-Up Internet | 0 | 0.0% |
| Broadband Home | 2,435 | 74.1% |
| Cellular Data Only | 292 | 8.9% |
| Satellite Internet | 45 | 1.4% |
| No Internet | 500 | 15.2% |
| Total | 3,287 | 100.0% |
Lock Haven Summary
History
Lock Haven is a city located in Clinton County, Pennsylvania. It is situated along the West Branch Susquehanna River and is the county seat of Clinton County. The city was founded in 1833 and was originally known as “Locksport” due to the locks that were built along the river. The locks were used to control the flow of the river and to facilitate the transportation of goods and people. The city was renamed Lock Haven in 1839.
The city was an important transportation hub in the 19th century. The West Branch Canal was built in 1834 and connected Lock Haven to the Susquehanna River. The canal was used to transport coal, lumber, and other goods. The Pennsylvania Railroad also ran through the city, connecting it to other cities in the region.
The city was also an important industrial center in the 19th century. The first industry in the city was a sawmill, which was built in 1833. Other industries included a paper mill, a tannery, and a brewery. The city was also home to several factories that produced furniture, clothing, and other goods.
Geography
Lock Haven is located in the central part of Pennsylvania, along the West Branch Susquehanna River. The city is situated at an elevation of 645 feet above sea level. The city covers an area of 4.2 square miles and has a population of 9,772 people, according to the 2010 census.
The city is located in a valley surrounded by mountains. The Bald Eagle Mountain is located to the north of the city and the Nittany Mountain is located to the south. The city is located in a humid continental climate zone and experiences cold winters and hot summers.
Economy
The economy of Lock Haven is largely based on manufacturing and services. The city is home to several factories that produce furniture, clothing, and other goods. The city is also home to several service-based businesses, such as restaurants, hotels, and retail stores.
The city is also home to several educational institutions, including Lock Haven University and Lock Haven High School. The city is also home to several healthcare facilities, including Lock Haven Hospital and Lock Haven Medical Center.
Demographics
According to the 2010 census, the population of Lock Haven was 9,772 people. The population is largely white (90.2%) and the median age is 39.7 years. The median household income is $35,945 and the median home value is $90,400.
The city is home to several religious denominations, including Catholic (25.2%), Protestant (19.2%), and Other (5.3%). The city is also home to several ethnic groups, including German (17.2%), Irish (14.2%), and Italian (7.2%).
Conclusion
Lock Haven is a city located in Clinton County, Pennsylvania. It is situated along the West Branch Susquehanna River and is the county seat of Clinton County. The city was founded in 1833 and was originally known as “Locksport” due to the locks that were built along the river. The city was renamed Lock Haven in 1839. The city was an important transportation hub in the 19th century and was also an important industrial center. The economy of Lock Haven is largely based on manufacturing and services. The population of Lock Haven is largely white and the median age is 39.7 years. The city is home to several religious denominations and ethnic groups.
Common Questions
What is Per Capita Income in Lock Haven?
Per Capita income in Lock Haven is $24,377.
What is the Median Family Income in Lock Haven?
Median Family Income in Lock Haven is $52,304.
What is the Median Household income in Lock Haven?
Median Household Income in Lock Haven is $42,930.
What is Income or Wage Gap in Lock Haven?
Income or Wage Gap in Lock Haven is 38.6%.
Women in Lock Haven earn 61.4 cents for every dollar earned by a man.
What is Inequality or Gini Index in Lock Haven?
Inequality or Gini Index in Lock Haven is 0.49.
What is the Total Population of Lock Haven?
Total Population of Lock Haven is 8,422.
What is the Total Male Population of Lock Haven?
Total Male Population of Lock Haven is 4,043.
What is the Total Female Population of Lock Haven?
Total Female Population of Lock Haven is 4,379.
What is the Ratio of Males per 100 Females in Lock Haven?
There are 92.33 Males per 100 Females in Lock Haven.
What is the Ratio of Females per 100 Males in Lock Haven?
There are 108.31 Females per 100 Males in Lock Haven.
What is the Median Population Age in Lock Haven?
Median Population Age in Lock Haven is 27.3 Years.
What is the Average Family Size in Lock Haven
Average Family Size in Lock Haven is 2.7 People.
What is the Average Household Size in Lock Haven
Average Household Size in Lock Haven is 2.2 People.
How Large is the Labor Force in Lock Haven?
There are 4,283 People in the Labor Forcein in Lock Haven.
What is the Percentage of People in the Labor Force in Lock Haven?
59.2% of People are in the Labor Force in Lock Haven.
What is the Unemployment Rate in Lock Haven?
Unemployment Rate in Lock Haven is 7.3%.