Folsom, PA Map & Demographics
Folsom Map
Folsom Overview
$40,266
PER CAPITA INCOME
$114,432
AVG FAMILY INCOME
$95,048
AVG HOUSEHOLD INCOME
36.0%
WAGE / INCOME GAP [ % ]
64.0¢/ $1
WAGE / INCOME GAP [ $ ]
$7,875
FAMILY INCOME DEFICIT
0.38
INEQUALITY / GINI INDEX
8,535
TOTAL POPULATION
4,065
MALE POPULATION
4,470
FEMALE POPULATION
90.94
MALES / 100 FEMALES
109.96
FEMALES / 100 MALES
37.5
MEDIAN AGE
3.3
AVG FAMILY SIZE
2.8
AVG HOUSEHOLD SIZE
4,531
LABOR FORCE [ PEOPLE ]
71.0%
PERCENT IN LABOR FORCE
2.0%
UNEMPLOYMENT RATE
Folsom Zip Codes
Folsom Area Codes
Income in Folsom
Income Overview in Folsom
Per Capita Income in Folsom is $40,266, while median incomes of families and households are $114,432 and $95,048 respectively.
| Characteristic | Number | Measure |
| Per Capita Income | 8,535 | $40,266 |
| Median Family Income | 2,247 | $114,432 |
| Mean Family Income | 2,247 | $126,108 |
| Median Household Income | 3,093 | $95,048 |
| Mean Household Income | 3,093 | $108,266 |
| Income Deficit | 2,247 | $7,875 |
| Wage / Income Gap (%) | 8,535 | 36.03% |
| Wage / Income Gap ($) | 8,535 | 63.97¢ per $1 |
| Gini / Inequality Index | 8,535 | 0.38 |
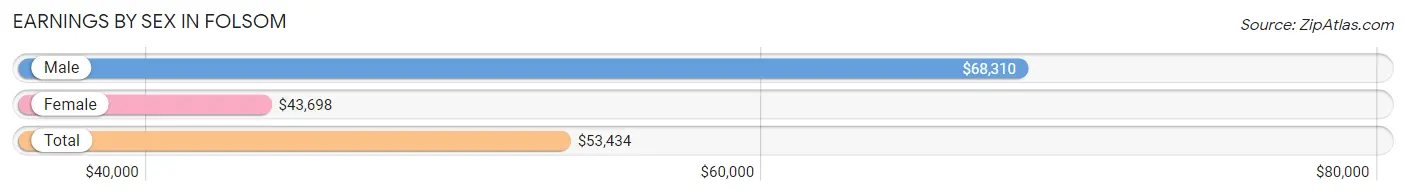
Earnings by Sex in Folsom
Average Earnings in Folsom are $53,434, $68,310 for men and $43,698 for women, a difference of 36.0%.
| Sex | Number | Average Earnings |
| Male | 2,359 (50.5%) | $68,310 |
| Female | 2,315 (49.5%) | $43,698 |
| Total | 4,674 (100.0%) | $53,434 |
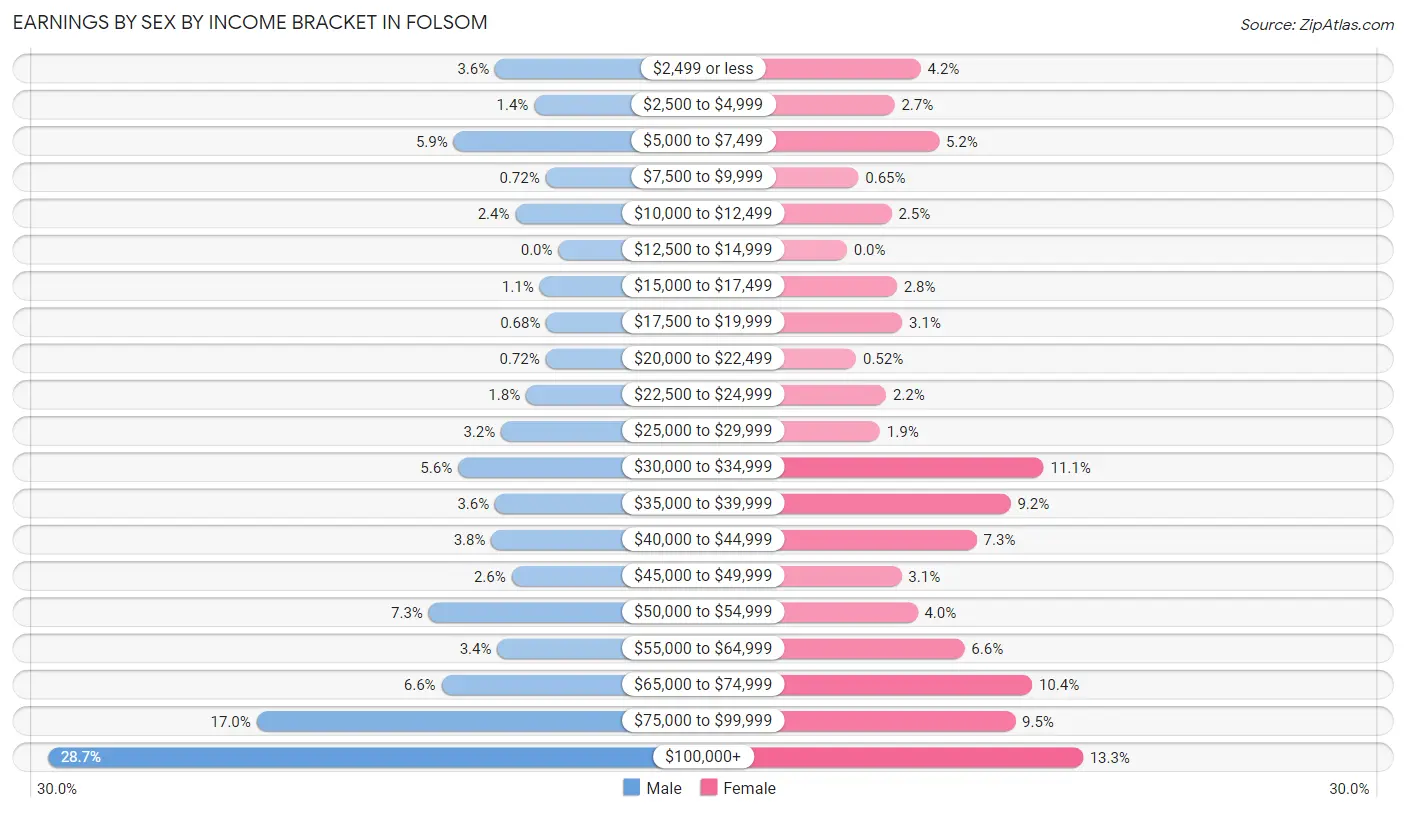
Earnings by Sex by Income Bracket in Folsom
The most common earnings brackets in Folsom are $100,000+ for men (677 | 28.7%) and $100,000+ for women (307 | 13.3%).
| Income | Male | Female |
| $2,499 or less | 84 (3.6%) | 96 (4.2%) |
| $2,500 to $4,999 | 32 (1.4%) | 62 (2.7%) |
| $5,000 to $7,499 | 139 (5.9%) | 120 (5.2%) |
| $7,500 to $9,999 | 17 (0.7%) | 15 (0.6%) |
| $10,000 to $12,499 | 57 (2.4%) | 58 (2.5%) |
| $12,500 to $14,999 | 0 (0.0%) | 0 (0.0%) |
| $15,000 to $17,499 | 25 (1.1%) | 65 (2.8%) |
| $17,500 to $19,999 | 16 (0.7%) | 72 (3.1%) |
| $20,000 to $22,499 | 17 (0.7%) | 12 (0.5%) |
| $22,500 to $24,999 | 43 (1.8%) | 51 (2.2%) |
| $25,000 to $29,999 | 76 (3.2%) | 43 (1.9%) |
| $30,000 to $34,999 | 133 (5.6%) | 256 (11.1%) |
| $35,000 to $39,999 | 84 (3.6%) | 213 (9.2%) |
| $40,000 to $44,999 | 89 (3.8%) | 169 (7.3%) |
| $45,000 to $49,999 | 62 (2.6%) | 71 (3.1%) |
| $50,000 to $54,999 | 172 (7.3%) | 92 (4.0%) |
| $55,000 to $64,999 | 81 (3.4%) | 153 (6.6%) |
| $65,000 to $74,999 | 155 (6.6%) | 241 (10.4%) |
| $75,000 to $99,999 | 400 (17.0%) | 219 (9.5%) |
| $100,000+ | 677 (28.7%) | 307 (13.3%) |
| Total | 2,359 (100.0%) | 2,315 (100.0%) |
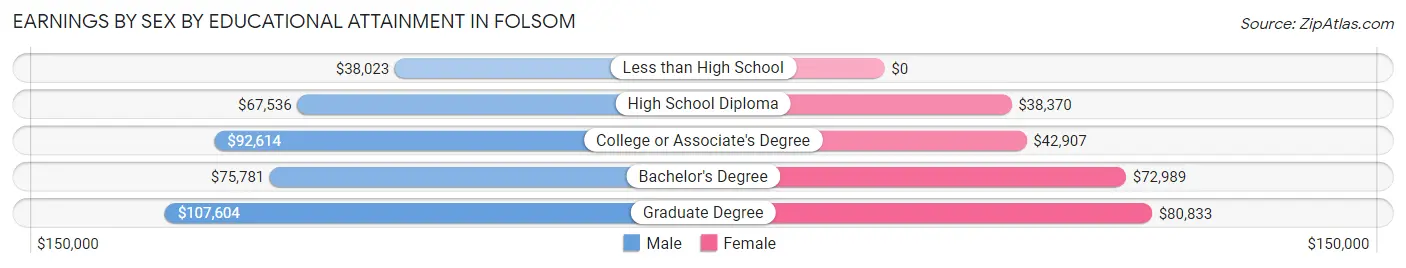
Earnings by Sex by Educational Attainment in Folsom
Average earnings in Folsom are $76,855 for men and $44,948 for women, a difference of 41.5%. Men with an educational attainment of graduate degree enjoy the highest average annual earnings of $107,604, while those with less than high school education earn the least with $38,023. Women with an educational attainment of graduate degree earn the most with the average annual earnings of $80,833, while those with high school diploma education have the smallest earnings of $38,370.
| Educational Attainment | Male Income | Female Income |
| Less than High School | $38,023 | $0 |
| High School Diploma | $67,536 | $38,370 |
| College or Associate's Degree | $92,614 | $42,907 |
| Bachelor's Degree | $75,781 | $72,989 |
| Graduate Degree | $107,604 | $80,833 |
| Total | $76,855 | $44,948 |
Family Income in Folsom
Family Income Brackets in Folsom
According to the Folsom family income data, there are 573 families falling into the $100,000 to $149,999 income range, which is the most common income bracket and makes up 25.5% of all families. Conversely, the $15,000 to $24,999 income bracket is the least frequent group with only 11 families (0.5%) belonging to this category.
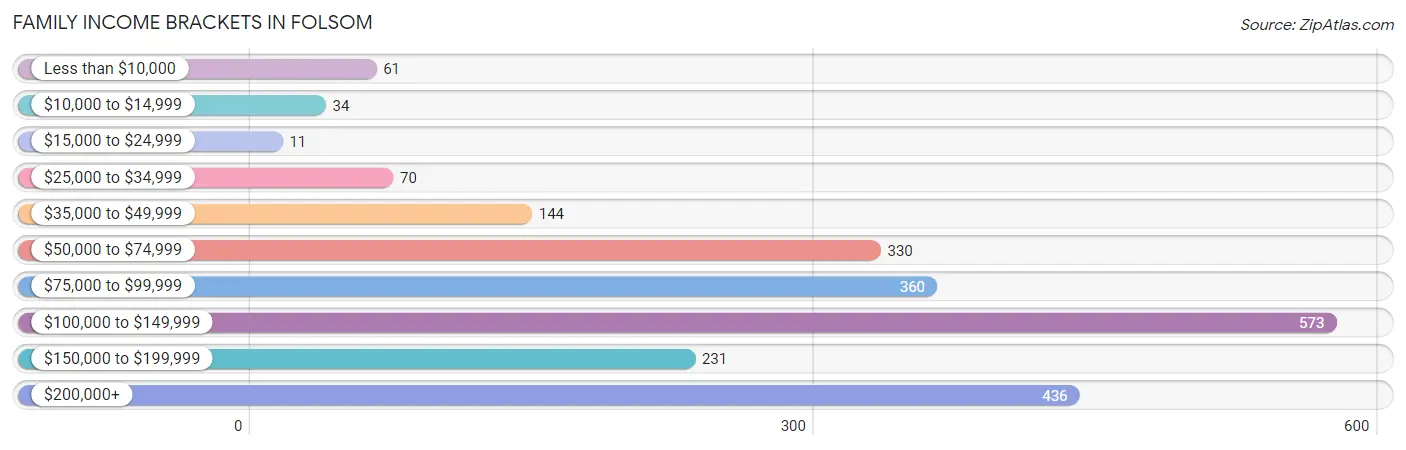
| Income Bracket | # Families | % Families |
| Less than $10,000 | 61 | 2.7% |
| $10,000 to $14,999 | 34 | 1.5% |
| $15,000 to $24,999 | 11 | 0.5% |
| $25,000 to $34,999 | 70 | 3.1% |
| $35,000 to $49,999 | 144 | 6.4% |
| $50,000 to $74,999 | 330 | 14.7% |
| $75,000 to $99,999 | 360 | 16.0% |
| $100,000 to $149,999 | 573 | 25.5% |
| $150,000 to $199,999 | 231 | 10.3% |
| $200,000+ | 436 | 19.4% |
Family Income by Famaliy Size in Folsom
6-person families (46 | 2.1%) account for the highest median family income in Folsom with $173,145 per family, while 2-person families (968 | 43.1%) have the highest median income of $47,740 per family member.
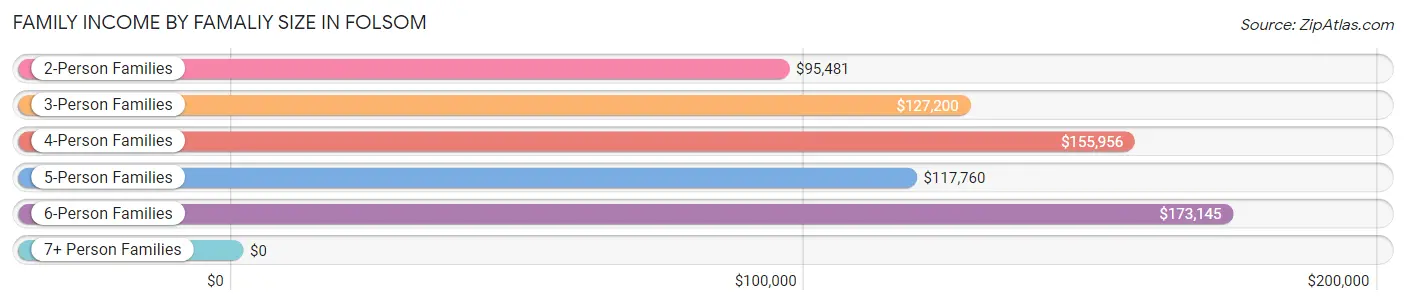
| Income Bracket | # Families | Median Income |
| 2-Person Families | 968 (43.1%) | $95,481 |
| 3-Person Families | 462 (20.6%) | $127,200 |
| 4-Person Families | 379 (16.9%) | $155,956 |
| 5-Person Families | 363 (16.2%) | $117,760 |
| 6-Person Families | 46 (2.1%) | $173,145 |
| 7+ Person Families | 29 (1.3%) | $0 |
| Total | 2,247 (100.0%) | $114,432 |
Family Income by Number of Earners in Folsom
The median family income in Folsom is $114,432, with families comprising 3+ earners (215) having the highest median family income of $179,191, while families with no earners (215) have the lowest median family income of $62,596, accounting for 9.6% and 9.6% of families, respectively.
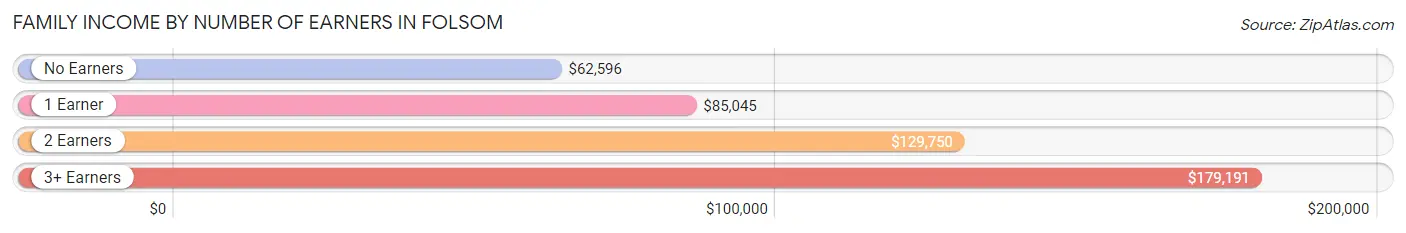
| Number of Earners | # Families | Median Income |
| No Earners | 215 (9.6%) | $62,596 |
| 1 Earner | 657 (29.2%) | $85,045 |
| 2 Earners | 1,160 (51.6%) | $129,750 |
| 3+ Earners | 215 (9.6%) | $179,191 |
| Total | 2,247 (100.0%) | $114,432 |
Household Income in Folsom
Household Income Brackets in Folsom
With 690 households falling in the category, the $100,000 to $149,999 income range is the most frequent in Folsom, accounting for 22.3% of all households. In contrast, only 43 households (1.4%) fall into the $10,000 to $14,999 income bracket, making it the least populous group.
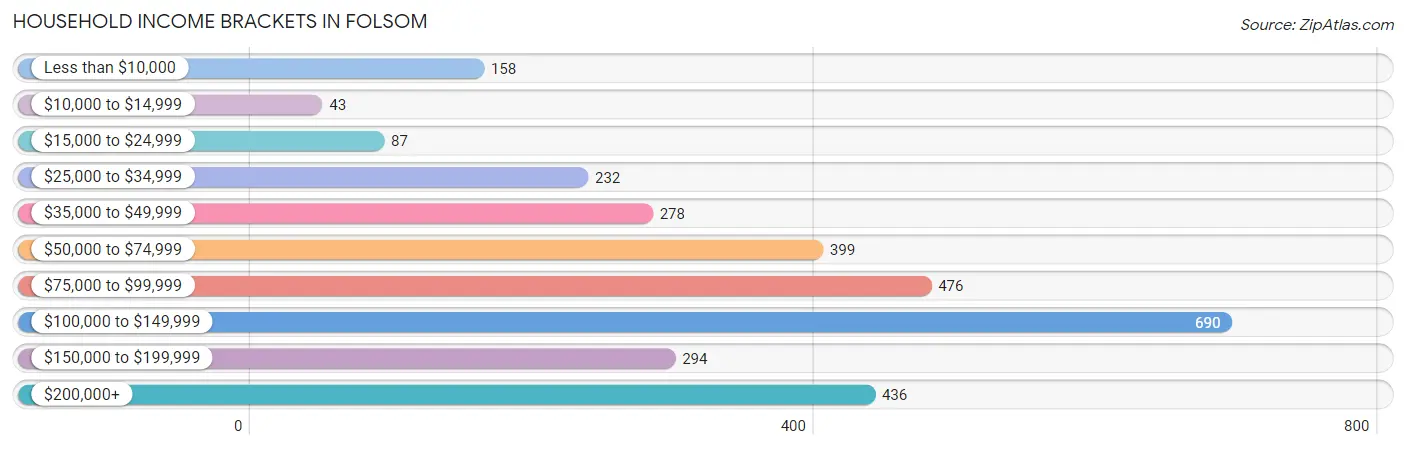
| Income Bracket | # Households | % Households |
| Less than $10,000 | 158 | 5.1% |
| $10,000 to $14,999 | 43 | 1.4% |
| $15,000 to $24,999 | 87 | 2.8% |
| $25,000 to $34,999 | 232 | 7.5% |
| $35,000 to $49,999 | 278 | 9.0% |
| $50,000 to $74,999 | 399 | 12.9% |
| $75,000 to $99,999 | 476 | 15.4% |
| $100,000 to $149,999 | 690 | 22.3% |
| $150,000 to $199,999 | 294 | 9.5% |
| $200,000+ | 436 | 14.1% |
Household Income by Householder Age in Folsom
The median household income in Folsom is $95,048, with the highest median household income of $125,900 found in the 25 to 44 years age bracket for the primary householder. A total of 1,060 households (34.3%) fall into this category. Meanwhile, the 15 to 24 years age bracket for the primary householder has the lowest median household income of $0, with 87 households (2.8%) in this group.
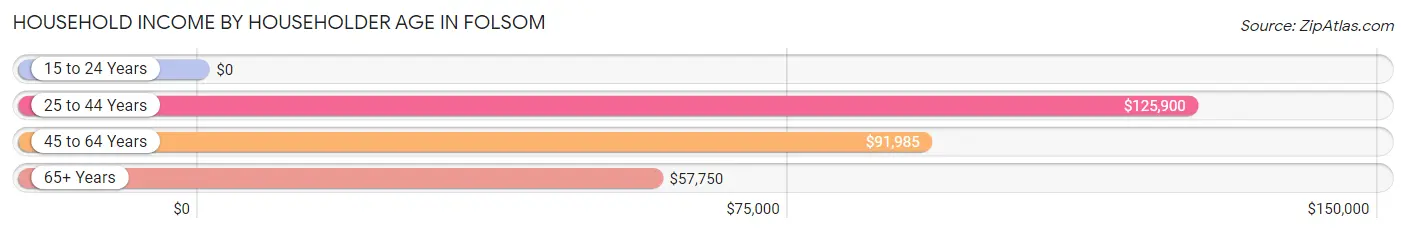
| Income Bracket | # Households | Median Income |
| 15 to 24 Years | 87 (2.8%) | $0 |
| 25 to 44 Years | 1,060 (34.3%) | $125,900 |
| 45 to 64 Years | 1,214 (39.3%) | $91,985 |
| 65+ Years | 732 (23.7%) | $57,750 |
| Total | 3,093 (100.0%) | $95,048 |
Poverty in Folsom
Income Below Poverty by Sex and Age in Folsom
With 8.2% poverty level for males and 10.7% for females among the residents of Folsom, 18 to 24 year old males and 12 to 14 year old females are the most vulnerable to poverty, with 81 males (24.9%) and 56 females (28.0%) in their respective age groups living below the poverty level.
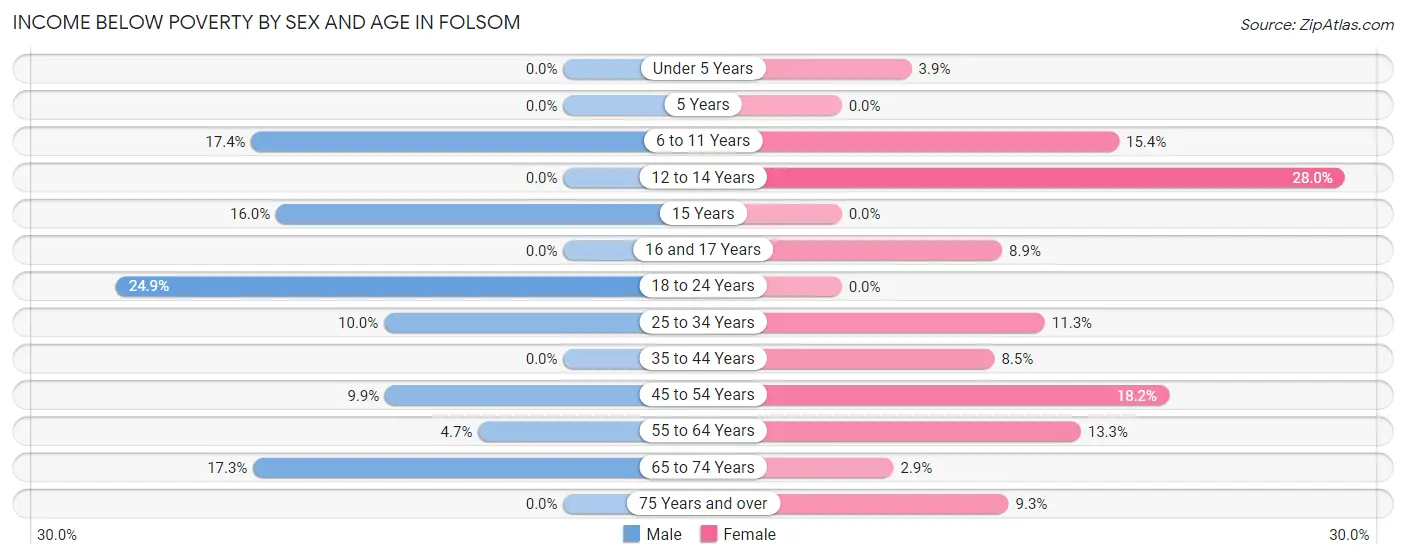
| Age Bracket | Male | Female |
| Under 5 Years | 0 (0.0%) | 13 (3.9%) |
| 5 Years | 0 (0.0%) | 0 (0.0%) |
| 6 to 11 Years | 86 (17.4%) | 63 (15.4%) |
| 12 to 14 Years | 0 (0.0%) | 56 (28.0%) |
| 15 Years | 4 (16.0%) | 0 (0.0%) |
| 16 and 17 Years | 0 (0.0%) | 10 (8.9%) |
| 18 to 24 Years | 81 (24.9%) | 0 (0.0%) |
| 25 to 34 Years | 44 (10.0%) | 56 (11.3%) |
| 35 to 44 Years | 0 (0.0%) | 72 (8.5%) |
| 45 to 54 Years | 55 (9.9%) | 67 (18.2%) |
| 55 to 64 Years | 25 (4.7%) | 94 (13.3%) |
| 65 to 74 Years | 38 (17.3%) | 9 (2.9%) |
| 75 Years and over | 0 (0.0%) | 38 (9.3%) |
| Total | 333 (8.2%) | 478 (10.7%) |
Income Above Poverty by Sex and Age in Folsom
According to the poverty statistics in Folsom, males aged under 5 years and females aged 5 years are the age groups that are most secure financially, with 100.0% of males and 100.0% of females in these age groups living above the poverty line.
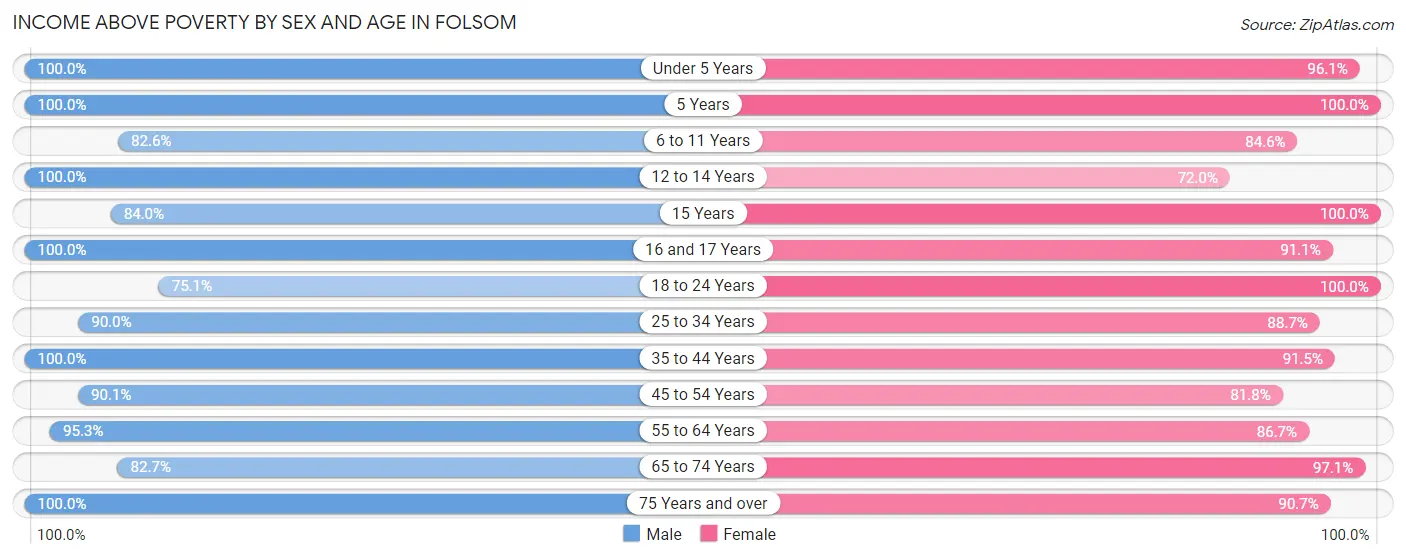
| Age Bracket | Male | Female |
| Under 5 Years | 280 (100.0%) | 321 (96.1%) |
| 5 Years | 198 (100.0%) | 30 (100.0%) |
| 6 to 11 Years | 409 (82.6%) | 345 (84.6%) |
| 12 to 14 Years | 119 (100.0%) | 144 (72.0%) |
| 15 Years | 21 (84.0%) | 65 (100.0%) |
| 16 and 17 Years | 60 (100.0%) | 102 (91.1%) |
| 18 to 24 Years | 244 (75.1%) | 183 (100.0%) |
| 25 to 34 Years | 397 (90.0%) | 439 (88.7%) |
| 35 to 44 Years | 647 (100.0%) | 775 (91.5%) |
| 45 to 54 Years | 499 (90.1%) | 301 (81.8%) |
| 55 to 64 Years | 502 (95.3%) | 612 (86.7%) |
| 65 to 74 Years | 182 (82.7%) | 304 (97.1%) |
| 75 Years and over | 174 (100.0%) | 371 (90.7%) |
| Total | 3,732 (91.8%) | 3,992 (89.3%) |
Income Below Poverty Among Married-Couple Families in Folsom
The poverty statistics for married-couple families in Folsom show that 3.9% or 64 of the total 1,657 families live below the poverty line. Families with 3 or 4 children have the highest poverty rate of 17.3%, comprising of 58 families. On the other hand, families with 1 or 2 children have the lowest poverty rate of 0.0%, which includes 0 families.
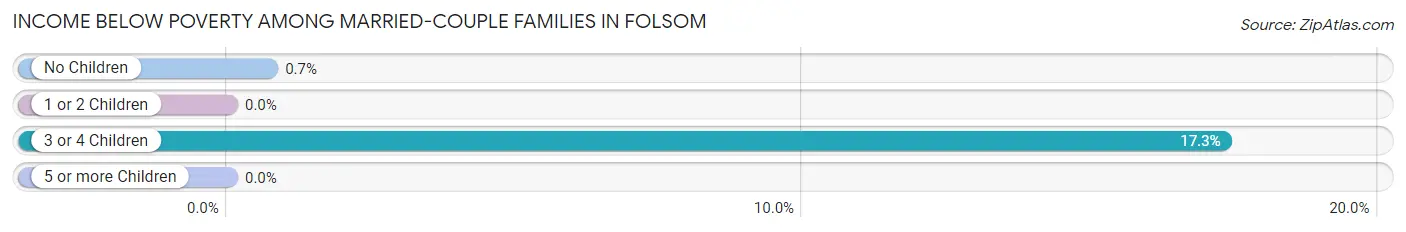
| Children | Above Poverty | Below Poverty |
| No Children | 848 (99.3%) | 6 (0.7%) |
| 1 or 2 Children | 468 (100.0%) | 0 (0.0%) |
| 3 or 4 Children | 277 (82.7%) | 58 (17.3%) |
| 5 or more Children | 0 (0.0%) | 0 (0.0%) |
| Total | 1,593 (96.1%) | 64 (3.9%) |
Income Below Poverty Among Single-Parent Households in Folsom
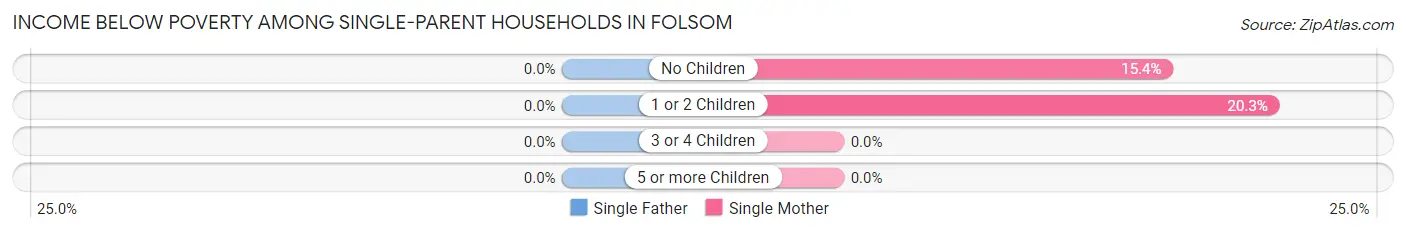
| Children | Single Father | Single Mother |
| No Children | 0 (0.0%) | 33 (15.3%) |
| 1 or 2 Children | 0 (0.0%) | 55 (20.3%) |
| 3 or 4 Children | 0 (0.0%) | 0 (0.0%) |
| 5 or more Children | 0 (0.0%) | 0 (0.0%) |
| Total | 0 (0.0%) | 88 (18.1%) |
Income Below Poverty Among Married-Couple vs Single-Parent Households in Folsom
The poverty data for Folsom shows that 64 of the married-couple family households (3.9%) and 88 of the single-parent households (14.9%) are living below the poverty level. Within the married-couple family households, those with 3 or 4 children have the highest poverty rate, with 58 households (17.3%) falling below the poverty line. Among the single-parent households, those with 1 or 2 children have the highest poverty rate, with 55 household (16.4%) living below poverty.
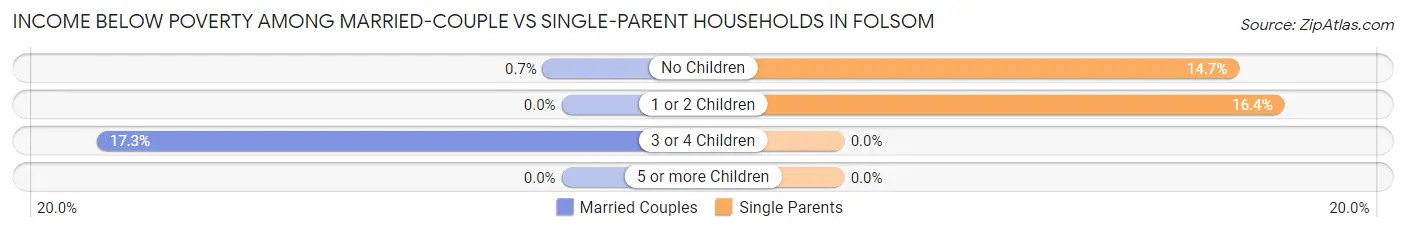
| Children | Married-Couple Families | Single-Parent Households |
| No Children | 6 (0.7%) | 33 (14.7%) |
| 1 or 2 Children | 0 (0.0%) | 55 (16.4%) |
| 3 or 4 Children | 58 (17.3%) | 0 (0.0%) |
| 5 or more Children | 0 (0.0%) | 0 (0.0%) |
| Total | 64 (3.9%) | 88 (14.9%) |
Race in Folsom
The most populous races in Folsom are White / Caucasian (7,808 | 91.5%), Black / African American (430 | 5.0%), and Hispanic or Latino (304 | 3.6%).
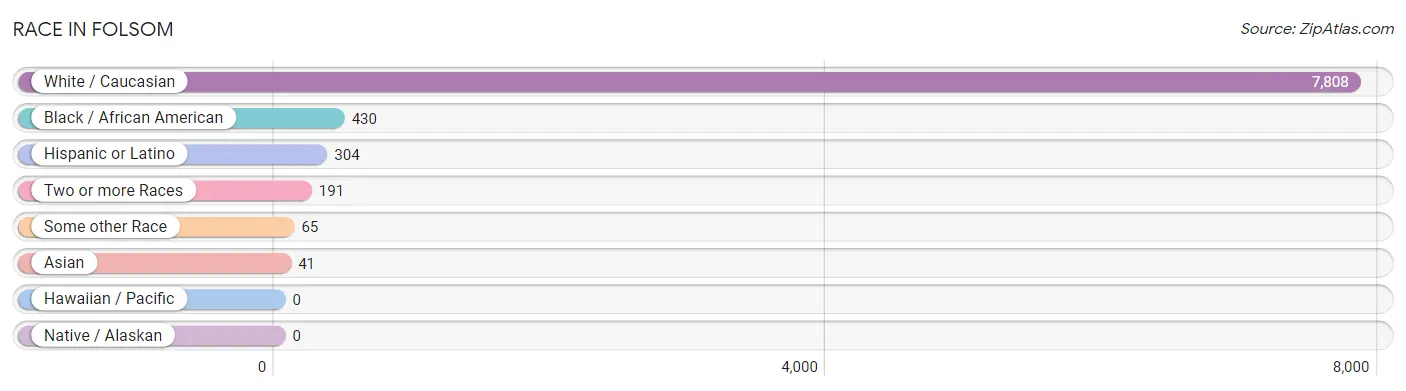
| Race | # Population | % Population |
| Asian | 41 | 0.5% |
| Black / African American | 430 | 5.0% |
| Hawaiian / Pacific | 0 | 0.0% |
| Hispanic or Latino | 304 | 3.6% |
| Native / Alaskan | 0 | 0.0% |
| White / Caucasian | 7,808 | 91.5% |
| Two or more Races | 191 | 2.2% |
| Some other Race | 65 | 0.8% |
| Total | 8,535 | 100.0% |
Ancestry in Folsom
The most populous ancestries reported in Folsom are Irish (3,261 | 38.2%), Italian (2,063 | 24.2%), German (1,513 | 17.7%), English (533 | 6.2%), and Arab (399 | 4.7%), together accounting for 91.0% of all Folsom residents.
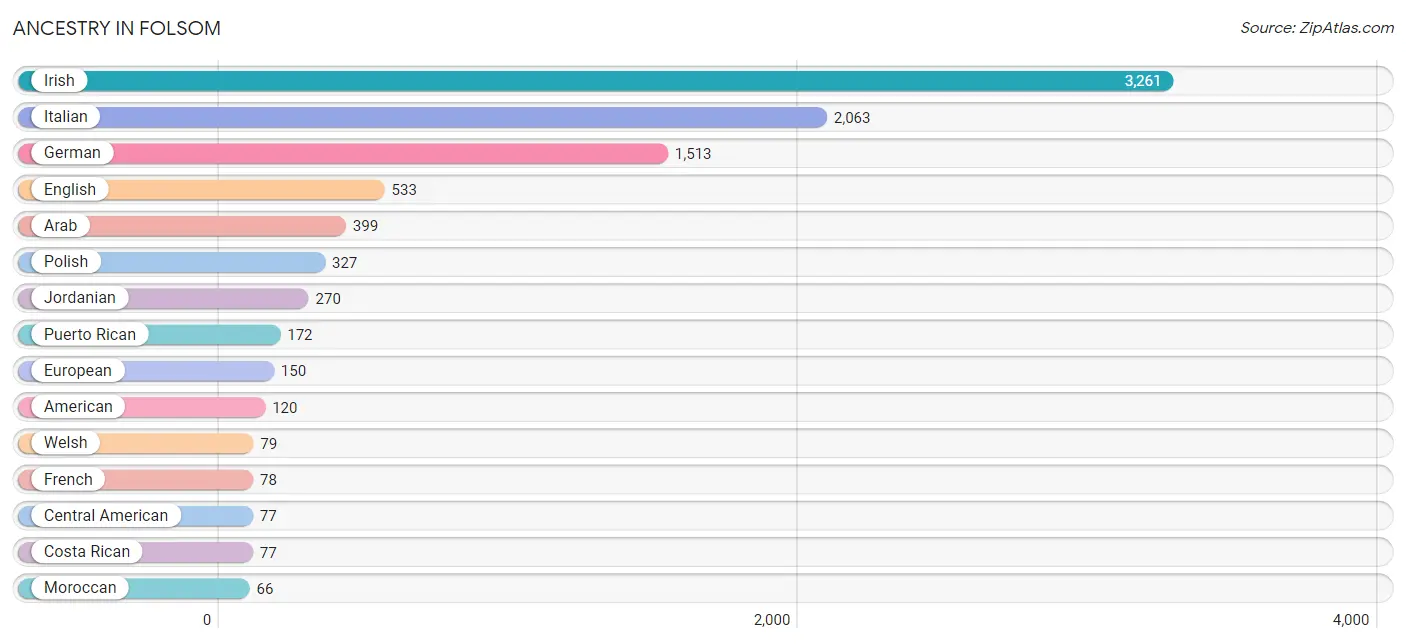
| Ancestry | # Population | % Population |
| Albanian | 12 | 0.1% |
| American | 120 | 1.4% |
| Arab | 399 | 4.7% |
| Armenian | 13 | 0.2% |
| Austrian | 16 | 0.2% |
| British | 25 | 0.3% |
| Central American | 77 | 0.9% |
| Cherokee | 35 | 0.4% |
| Colombian | 18 | 0.2% |
| Costa Rican | 77 | 0.9% |
| Cuban | 23 | 0.3% |
| Dutch | 18 | 0.2% |
| English | 533 | 6.2% |
| European | 150 | 1.8% |
| French | 78 | 0.9% |
| German | 1,513 | 17.7% |
| Greek | 13 | 0.2% |
| Hungarian | 33 | 0.4% |
| Indian (Asian) | 57 | 0.7% |
| Irish | 3,261 | 38.2% |
| Italian | 2,063 | 24.2% |
| Jordanian | 270 | 3.2% |
| Korean | 17 | 0.2% |
| Lithuanian | 61 | 0.7% |
| Moroccan | 66 | 0.8% |
| Norwegian | 5 | 0.1% |
| Polish | 327 | 3.8% |
| Puerto Rican | 172 | 2.0% |
| Russian | 18 | 0.2% |
| Scandinavian | 10 | 0.1% |
| Scottish | 59 | 0.7% |
| Slavic | 11 | 0.1% |
| Slovak | 22 | 0.3% |
| South American | 18 | 0.2% |
| Spanish | 14 | 0.2% |
| Swedish | 47 | 0.5% |
| Ukrainian | 24 | 0.3% |
| Welsh | 79 | 0.9% | View All 38 Rows |
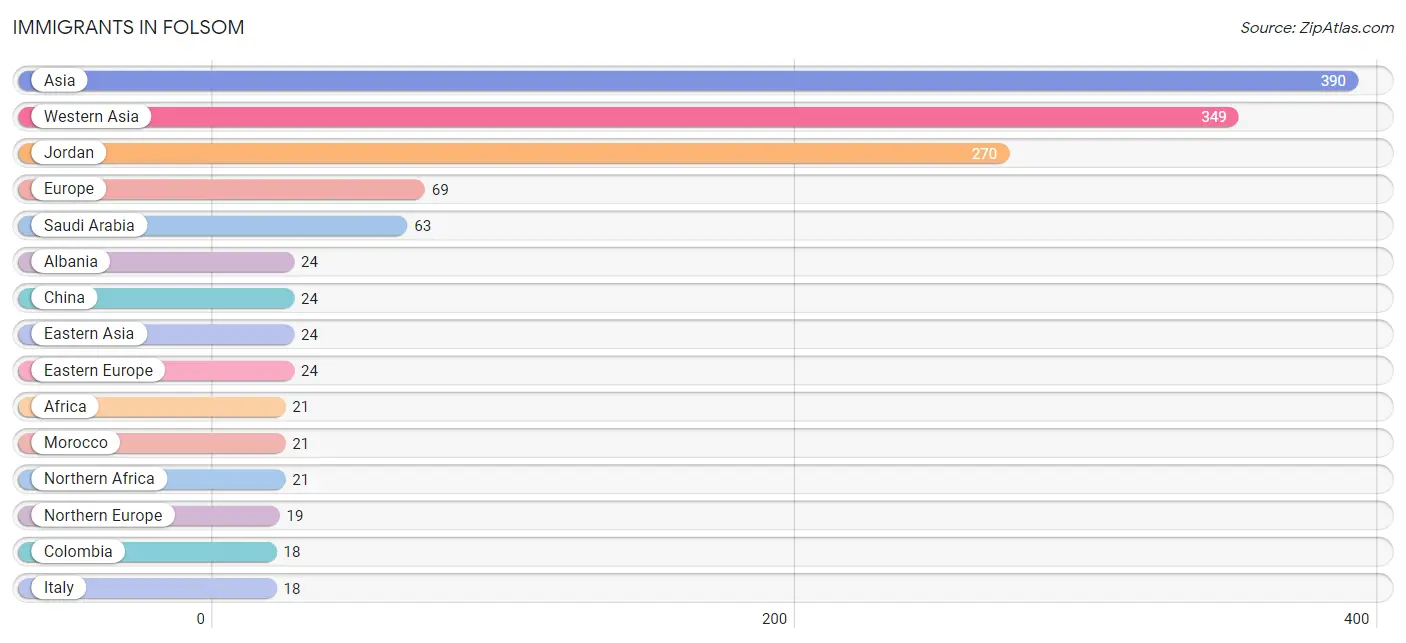
Immigrants in Folsom
The most numerous immigrant groups reported in Folsom came from Asia (390 | 4.6%), Western Asia (349 | 4.1%), Jordan (270 | 3.2%), Europe (69 | 0.8%), and Saudi Arabia (63 | 0.7%), together accounting for 13.4% of all Folsom residents.
| Immigration Origin | # Population | % Population |
| Africa | 21 | 0.3% |
| Albania | 24 | 0.3% |
| Asia | 390 | 4.6% |
| China | 24 | 0.3% |
| Colombia | 18 | 0.2% |
| Eastern Asia | 24 | 0.3% |
| Eastern Europe | 24 | 0.3% |
| Europe | 69 | 0.8% |
| Germany | 8 | 0.1% |
| Italy | 18 | 0.2% |
| Jordan | 270 | 3.2% |
| Latin America | 18 | 0.2% |
| Morocco | 21 | 0.3% |
| Northern Africa | 21 | 0.3% |
| Northern Europe | 19 | 0.2% |
| Philippines | 17 | 0.2% |
| Saudi Arabia | 63 | 0.7% |
| South America | 18 | 0.2% |
| South Eastern Asia | 17 | 0.2% |
| Southern Europe | 18 | 0.2% |
| Syria | 16 | 0.2% |
| Taiwan | 12 | 0.1% |
| Western Asia | 349 | 4.1% |
| Western Europe | 8 | 0.1% | View All 24 Rows |
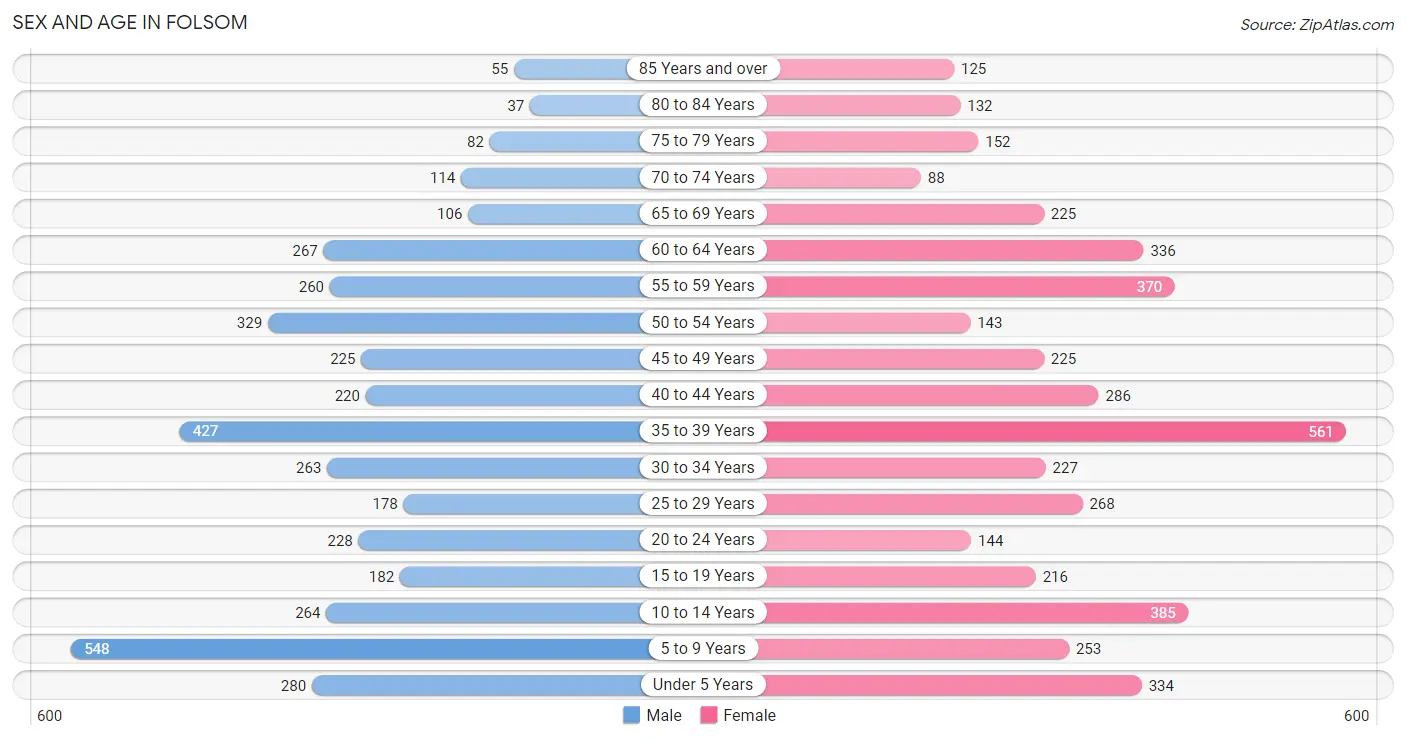
Sex and Age in Folsom
Sex and Age in Folsom
The most populous age groups in Folsom are 5 to 9 Years (548 | 13.5%) for men and 35 to 39 Years (561 | 12.6%) for women.
| Age Bracket | Male | Female |
| Under 5 Years | 280 (6.9%) | 334 (7.5%) |
| 5 to 9 Years | 548 (13.5%) | 253 (5.7%) |
| 10 to 14 Years | 264 (6.5%) | 385 (8.6%) |
| 15 to 19 Years | 182 (4.5%) | 216 (4.8%) |
| 20 to 24 Years | 228 (5.6%) | 144 (3.2%) |
| 25 to 29 Years | 178 (4.4%) | 268 (6.0%) |
| 30 to 34 Years | 263 (6.5%) | 227 (5.1%) |
| 35 to 39 Years | 427 (10.5%) | 561 (12.6%) |
| 40 to 44 Years | 220 (5.4%) | 286 (6.4%) |
| 45 to 49 Years | 225 (5.5%) | 225 (5.0%) |
| 50 to 54 Years | 329 (8.1%) | 143 (3.2%) |
| 55 to 59 Years | 260 (6.4%) | 370 (8.3%) |
| 60 to 64 Years | 267 (6.6%) | 336 (7.5%) |
| 65 to 69 Years | 106 (2.6%) | 225 (5.0%) |
| 70 to 74 Years | 114 (2.8%) | 88 (2.0%) |
| 75 to 79 Years | 82 (2.0%) | 152 (3.4%) |
| 80 to 84 Years | 37 (0.9%) | 132 (2.9%) |
| 85 Years and over | 55 (1.3%) | 125 (2.8%) |
| Total | 4,065 (100.0%) | 4,470 (100.0%) |
Families and Households in Folsom
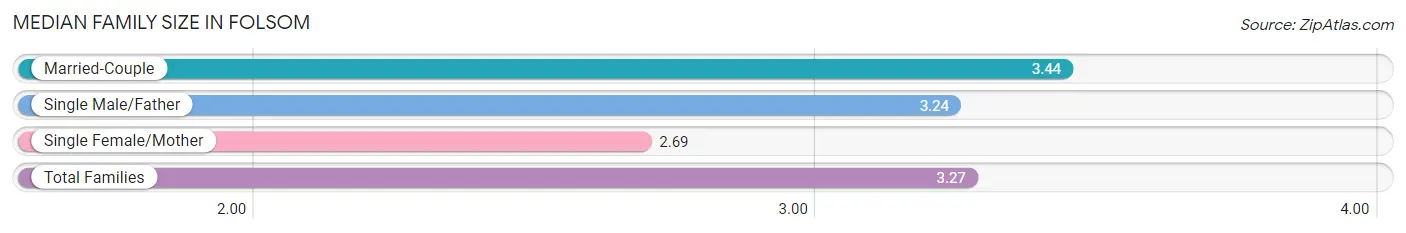
Median Family Size in Folsom
The median family size in Folsom is 3.27 persons per family, with married-couple families (1,657 | 73.7%) accounting for the largest median family size of 3.44 persons per family. On the other hand, single female/mother families (486 | 21.6%) represent the smallest median family size with 2.69 persons per family.
| Family Type | # Families | Family Size |
| Married-Couple | 1,657 (73.7%) | 3.44 |
| Single Male/Father | 104 (4.6%) | 3.24 |
| Single Female/Mother | 486 (21.6%) | 2.69 |
| Total Families | 2,247 (100.0%) | 3.27 |
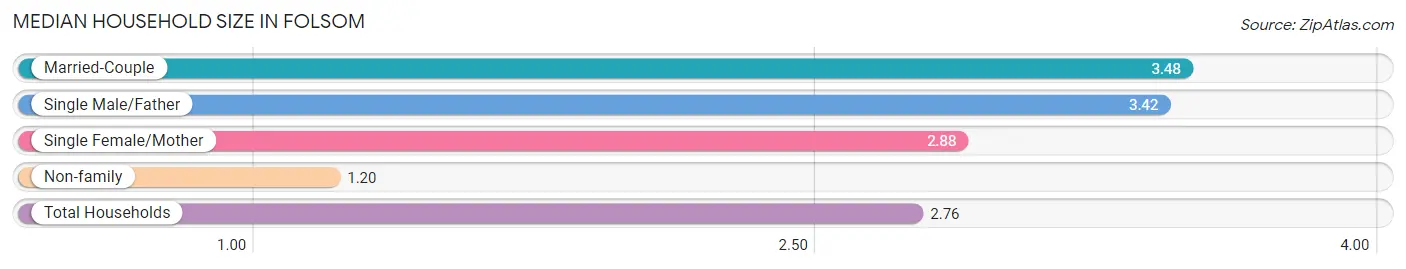
Median Household Size in Folsom
The median household size in Folsom is 2.76 persons per household, with married-couple households (1,657 | 53.6%) accounting for the largest median household size of 3.48 persons per household. non-family households (846 | 27.4%) represent the smallest median household size with 1.20 persons per household.
| Household Type | # Households | Household Size |
| Married-Couple | 1,657 (53.6%) | 3.48 |
| Single Male/Father | 104 (3.4%) | 3.42 |
| Single Female/Mother | 486 (15.7%) | 2.88 |
| Non-family | 846 (27.4%) | 1.20 |
| Total Households | 3,093 (100.0%) | 2.76 |
Household Size by Marriage Status in Folsom
Out of a total of 3,093 households in Folsom, 2,247 (72.7%) are family households, while 846 (27.4%) are nonfamily households. The most numerous type of family households are 2-person households, comprising 906, and the most common type of nonfamily households are 1-person households, comprising 684.
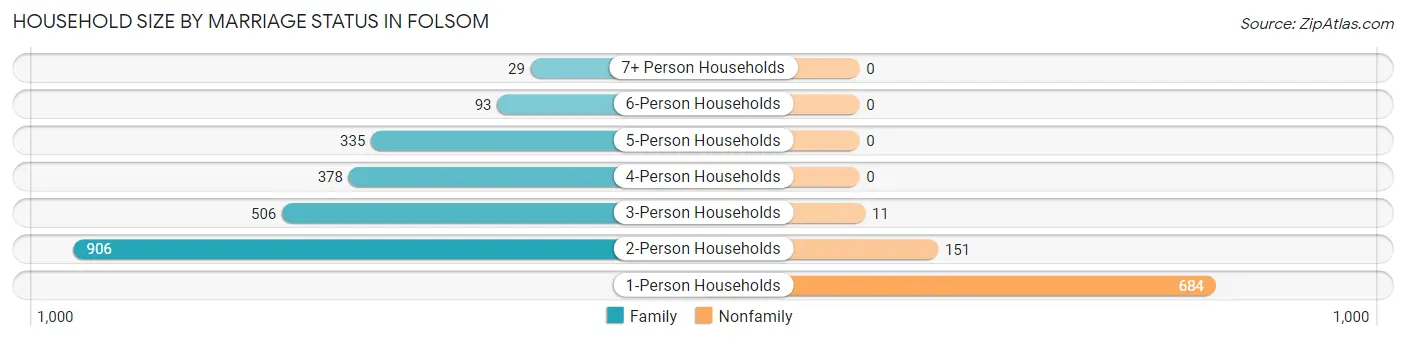
| Household Size | Family Households | Nonfamily Households |
| 1-Person Households | - | 684 (22.1%) |
| 2-Person Households | 906 (29.3%) | 151 (4.9%) |
| 3-Person Households | 506 (16.4%) | 11 (0.4%) |
| 4-Person Households | 378 (12.2%) | 0 (0.0%) |
| 5-Person Households | 335 (10.8%) | 0 (0.0%) |
| 6-Person Households | 93 (3.0%) | 0 (0.0%) |
| 7+ Person Households | 29 (0.9%) | 0 (0.0%) |
| Total | 2,247 (72.7%) | 846 (27.4%) |
Female Fertility in Folsom
Fertility by Age in Folsom
Average fertility rate in Folsom is 35.0 births per 1,000 women. Women in the age bracket of 20 to 34 years have the highest fertility rate with 72.0 births per 1,000 women. Women in the age bracket of 20 to 34 years acount for 67.6% of all women with births.
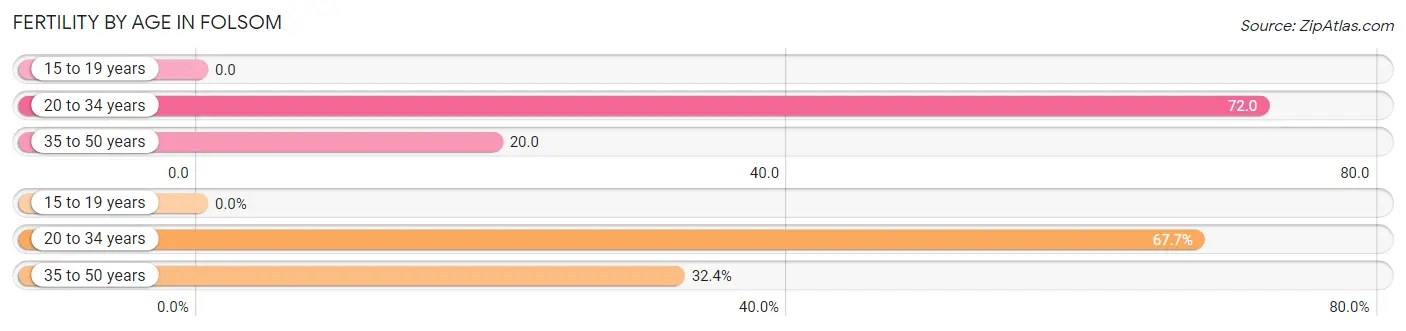
| Age Bracket | Women with Births | Births / 1,000 Women |
| 15 to 19 years | 0 (0.0%) | 0.0 |
| 20 to 34 years | 46 (67.6%) | 72.0 |
| 35 to 50 years | 22 (32.4%) | 20.0 |
| Total | 68 (100.0%) | 35.0 |
Fertility by Age by Marriage Status in Folsom
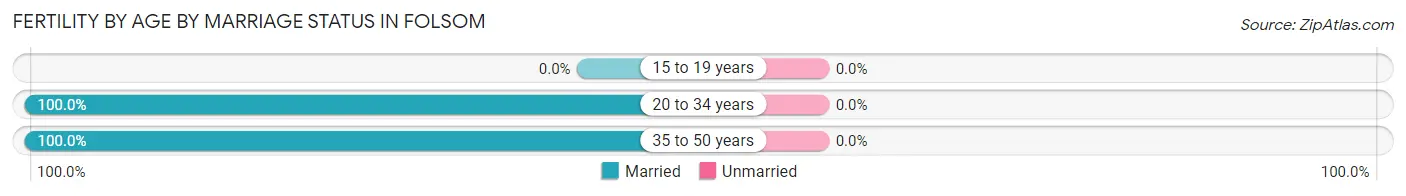
| Age Bracket | Married | Unmarried |
| 15 to 19 years | 0 (0.0%) | 0 (0.0%) |
| 20 to 34 years | 46 (100.0%) | 0 (0.0%) |
| 35 to 50 years | 22 (100.0%) | 0 (0.0%) |
| Total | 68 (100.0%) | 0 (0.0%) |
Fertility by Education in Folsom
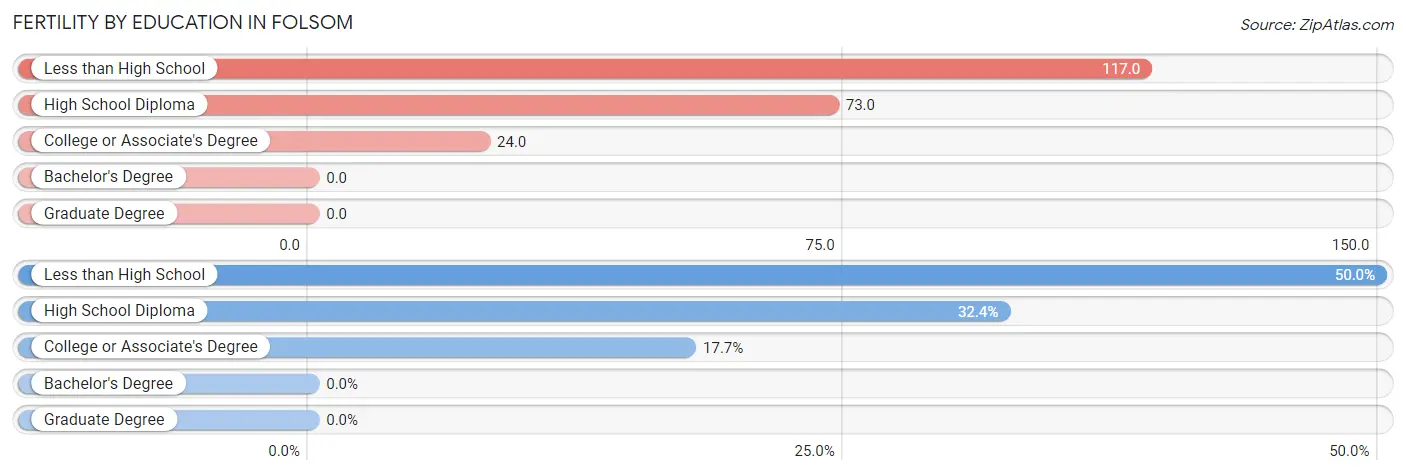
| Educational Attainment | Women with Births | Births / 1,000 Women |
| Less than High School | 34 (50.0%) | 117.0 |
| High School Diploma | 22 (32.4%) | 73.0 |
| College or Associate's Degree | 12 (17.6%) | 24.0 |
| Bachelor's Degree | 0 (0.0%) | 0.0 |
| Graduate Degree | 0 (0.0%) | 0.0 |
| Total | 68 (100.0%) | 35.0 |
Fertility by Education by Marriage Status in Folsom
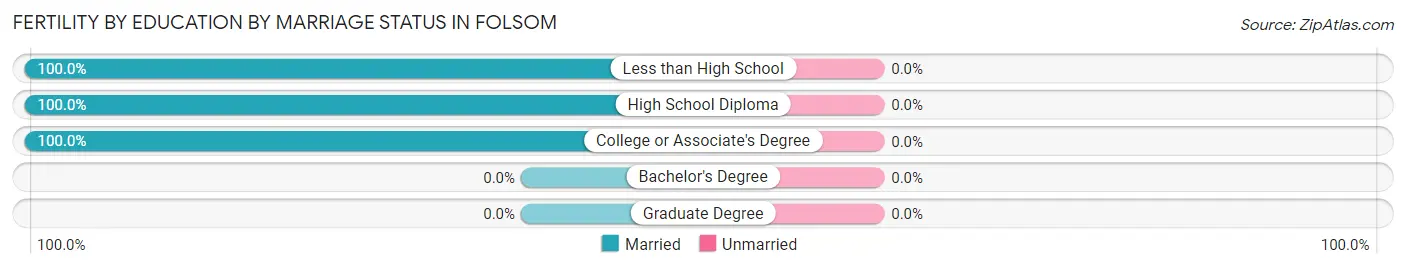
| Educational Attainment | Married | Unmarried |
| Less than High School | 34 (100.0%) | 0 (0.0%) |
| High School Diploma | 22 (100.0%) | 0 (0.0%) |
| College or Associate's Degree | 12 (100.0%) | 0 (0.0%) |
| Bachelor's Degree | 0 (0.0%) | 0 (0.0%) |
| Graduate Degree | 0 (0.0%) | 0 (0.0%) |
| Total | 68 (100.0%) | 0 (0.0%) |
Employment Characteristics in Folsom
Employment by Class of Employer in Folsom
Among the 4,345 employed individuals in Folsom, private company employees (3,051 | 70.2%), local government employees (528 | 12.1%), and not-for-profit organizations (373 | 8.6%) make up the most common classes of employment.
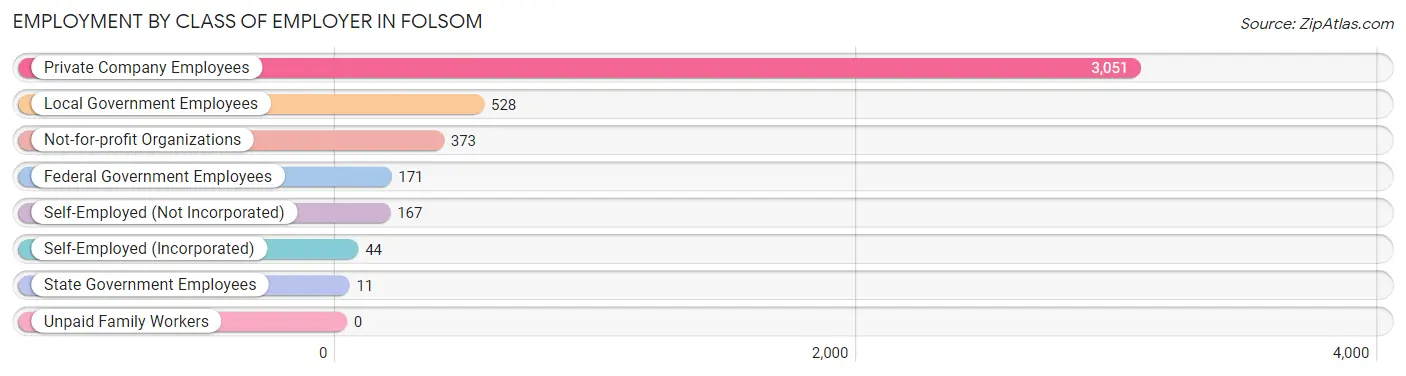
| Employer Class | # Employees | % Employees |
| Private Company Employees | 3,051 | 70.2% |
| Self-Employed (Incorporated) | 44 | 1.0% |
| Self-Employed (Not Incorporated) | 167 | 3.8% |
| Not-for-profit Organizations | 373 | 8.6% |
| Local Government Employees | 528 | 12.1% |
| State Government Employees | 11 | 0.3% |
| Federal Government Employees | 171 | 3.9% |
| Unpaid Family Workers | 0 | 0.0% |
| Total | 4,345 | 100.0% |
Employment Status by Age in Folsom
According to the labor force statistics for Folsom, out of the total population over 16 years of age (6,381), 71.0% or 4,531 individuals are in the labor force, with 2.0% or 91 of them unemployed. The age group with the highest labor force participation rate is 35 to 44 years, with 90.9% or 1,358 individuals in the labor force. Within the labor force, the 16 to 19 years age range has the highest percentage of unemployed individuals, with 5.6% or 8 of them being unemployed.
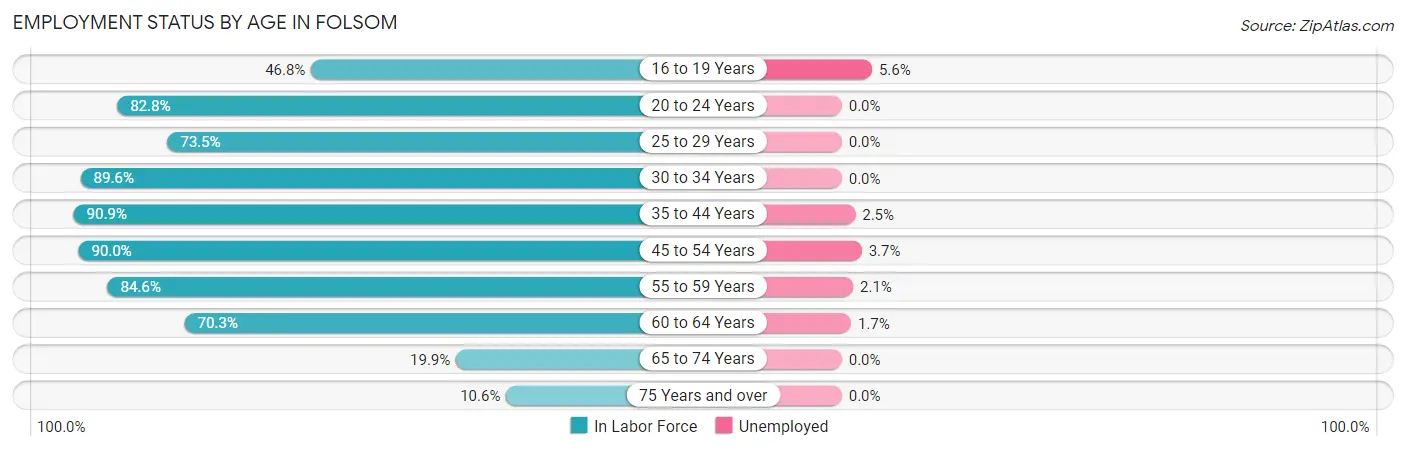
| Age Bracket | In Labor Force | Unemployed |
| 16 to 19 Years | 144 (46.8%) | 8 (5.6%) |
| 20 to 24 Years | 308 (82.8%) | 0 (0.0%) |
| 25 to 29 Years | 328 (73.5%) | 0 (0.0%) |
| 30 to 34 Years | 439 (89.6%) | 0 (0.0%) |
| 35 to 44 Years | 1,358 (90.9%) | 34 (2.5%) |
| 45 to 54 Years | 830 (90.0%) | 31 (3.7%) |
| 55 to 59 Years | 533 (84.6%) | 11 (2.1%) |
| 60 to 64 Years | 424 (70.3%) | 7 (1.7%) |
| 65 to 74 Years | 106 (19.9%) | 0 (0.0%) |
| 75 Years and over | 62 (10.6%) | 0 (0.0%) |
| Total | 4,531 (71.0%) | 91 (2.0%) |
Employment Status by Educational Attainment in Folsom
According to labor force statistics for Folsom, 85.3% of individuals (3,911) out of the total population between 25 and 64 years of age (4,585) are in the labor force, with 2.1% or 82 of them being unemployed. The group with the highest labor force participation rate are those with the educational attainment of bachelor's degree or higher, with 95.0% or 1,508 individuals in the labor force. Within the labor force, individuals with less than high school education have the highest percentage of unemployment, with 15.9% or 29 of them being unemployed.
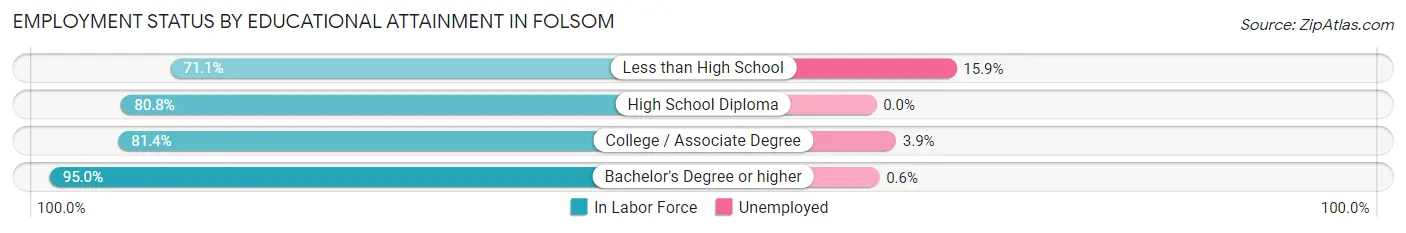
| Educational Attainment | In Labor Force | Unemployed |
| Less than High School | 182 (71.1%) | 41 (15.9%) |
| High School Diploma | 1,080 (80.8%) | 0 (0.0%) |
| College / Associate Degree | 1,144 (81.4%) | 55 (3.9%) |
| Bachelor's Degree or higher | 1,508 (95.0%) | 10 (0.6%) |
| Total | 3,911 (85.3%) | 96 (2.1%) |
Employment Occupations by Sex in Folsom
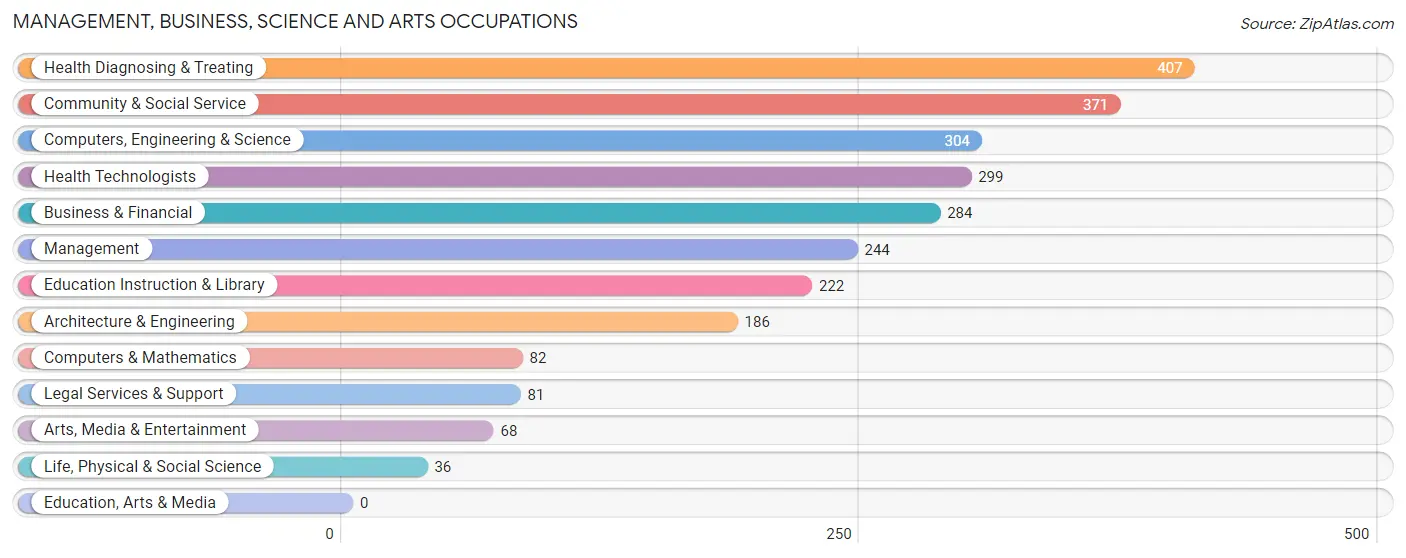
Management, Business, Science and Arts Occupations
The most common Management, Business, Science and Arts occupations in Folsom are Health Diagnosing & Treating (407 | 9.2%), Community & Social Service (371 | 8.4%), Computers, Engineering & Science (304 | 6.9%), Health Technologists (299 | 6.7%), and Business & Financial (284 | 6.4%).
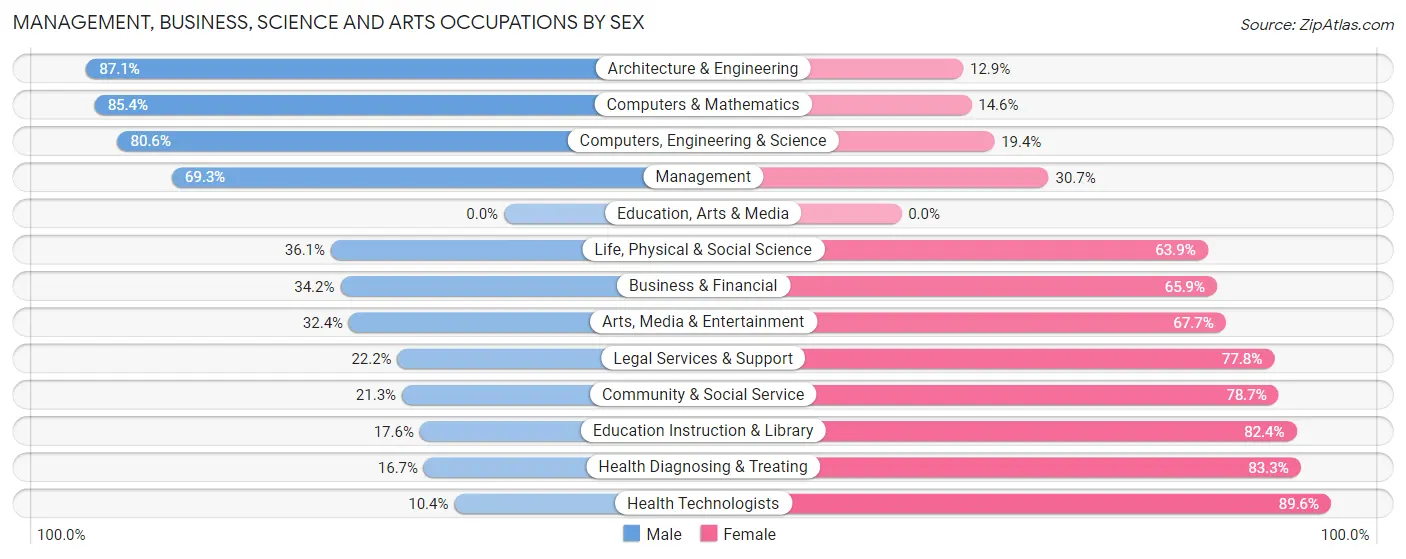
Management, Business, Science and Arts Occupations by Sex
Within the Management, Business, Science and Arts occupations in Folsom, the most male-oriented occupations are Architecture & Engineering (87.1%), Computers & Mathematics (85.4%), and Computers, Engineering & Science (80.6%), while the most female-oriented occupations are Health Technologists (89.6%), Health Diagnosing & Treating (83.3%), and Education Instruction & Library (82.4%).
| Occupation | Male | Female |
| Management | 169 (69.3%) | 75 (30.7%) |
| Business & Financial | 97 (34.2%) | 187 (65.8%) |
| Computers, Engineering & Science | 245 (80.6%) | 59 (19.4%) |
| Computers & Mathematics | 70 (85.4%) | 12 (14.6%) |
| Architecture & Engineering | 162 (87.1%) | 24 (12.9%) |
| Life, Physical & Social Science | 13 (36.1%) | 23 (63.9%) |
| Community & Social Service | 79 (21.3%) | 292 (78.7%) |
| Education, Arts & Media | 0 (0.0%) | 0 (0.0%) |
| Legal Services & Support | 18 (22.2%) | 63 (77.8%) |
| Education Instruction & Library | 39 (17.6%) | 183 (82.4%) |
| Arts, Media & Entertainment | 22 (32.4%) | 46 (67.6%) |
| Health Diagnosing & Treating | 68 (16.7%) | 339 (83.3%) |
| Health Technologists | 31 (10.4%) | 268 (89.6%) |
| Total (Category) | 658 (40.9%) | 952 (59.1%) |
| Total (Overall) | 2,230 (50.3%) | 2,204 (49.7%) |
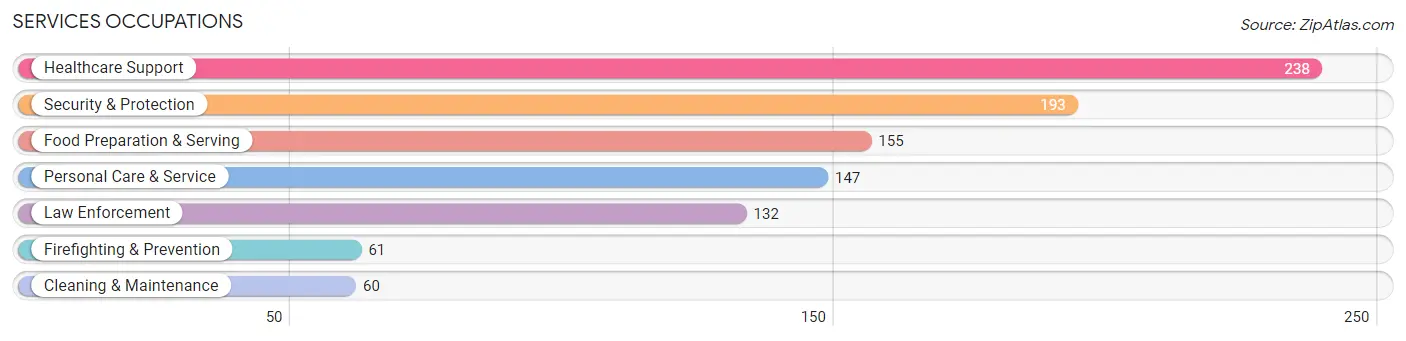
Services Occupations
The most common Services occupations in Folsom are Healthcare Support (238 | 5.4%), Security & Protection (193 | 4.3%), Food Preparation & Serving (155 | 3.5%), Personal Care & Service (147 | 3.3%), and Law Enforcement (132 | 3.0%).
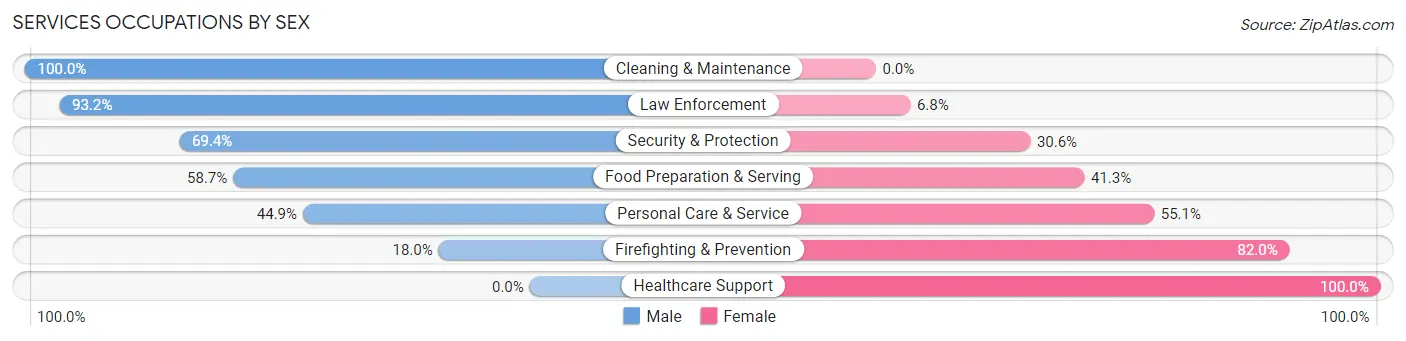
Services Occupations by Sex
Within the Services occupations in Folsom, the most male-oriented occupations are Cleaning & Maintenance (100.0%), Law Enforcement (93.2%), and Security & Protection (69.4%), while the most female-oriented occupations are Healthcare Support (100.0%), Firefighting & Prevention (82.0%), and Personal Care & Service (55.1%).
| Occupation | Male | Female |
| Healthcare Support | 0 (0.0%) | 238 (100.0%) |
| Security & Protection | 134 (69.4%) | 59 (30.6%) |
| Firefighting & Prevention | 11 (18.0%) | 50 (82.0%) |
| Law Enforcement | 123 (93.2%) | 9 (6.8%) |
| Food Preparation & Serving | 91 (58.7%) | 64 (41.3%) |
| Cleaning & Maintenance | 60 (100.0%) | 0 (0.0%) |
| Personal Care & Service | 66 (44.9%) | 81 (55.1%) |
| Total (Category) | 351 (44.3%) | 442 (55.7%) |
| Total (Overall) | 2,230 (50.3%) | 2,204 (49.7%) |
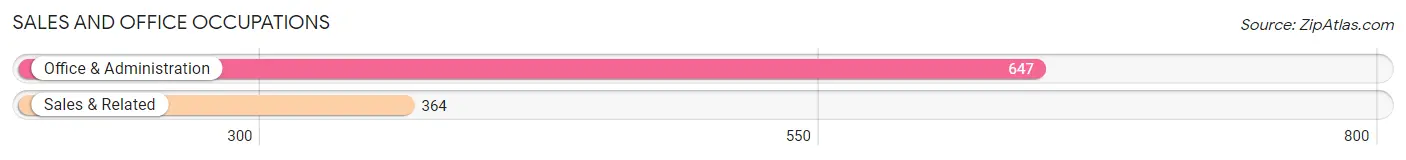
Sales and Office Occupations
The most common Sales and Office occupations in Folsom are Office & Administration (647 | 14.6%), and Sales & Related (364 | 8.2%).
Sales and Office Occupations by Sex
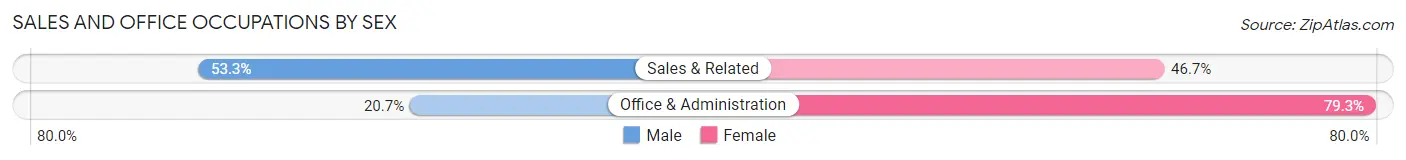
| Occupation | Male | Female |
| Sales & Related | 194 (53.3%) | 170 (46.7%) |
| Office & Administration | 134 (20.7%) | 513 (79.3%) |
| Total (Category) | 328 (32.4%) | 683 (67.6%) |
| Total (Overall) | 2,230 (50.3%) | 2,204 (49.7%) |
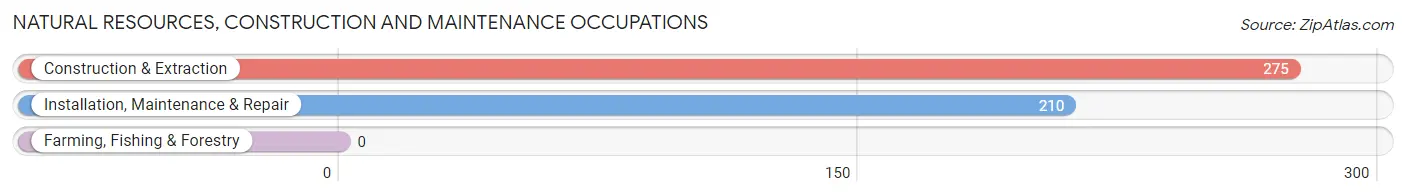
Natural Resources, Construction and Maintenance Occupations
The most common Natural Resources, Construction and Maintenance occupations in Folsom are Construction & Extraction (275 | 6.2%), and Installation, Maintenance & Repair (210 | 4.7%).
Natural Resources, Construction and Maintenance Occupations by Sex
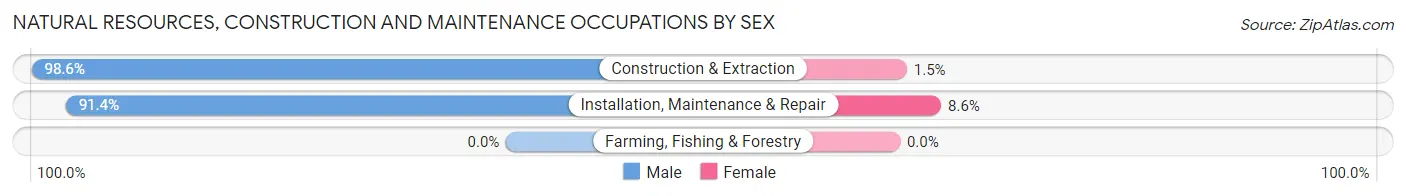
| Occupation | Male | Female |
| Farming, Fishing & Forestry | 0 (0.0%) | 0 (0.0%) |
| Construction & Extraction | 271 (98.6%) | 4 (1.5%) |
| Installation, Maintenance & Repair | 192 (91.4%) | 18 (8.6%) |
| Total (Category) | 463 (95.5%) | 22 (4.5%) |
| Total (Overall) | 2,230 (50.3%) | 2,204 (49.7%) |
Production, Transportation and Moving Occupations
The most common Production, Transportation and Moving occupations in Folsom are Production (238 | 5.4%), Transportation (150 | 3.4%), and Material Moving (147 | 3.3%).
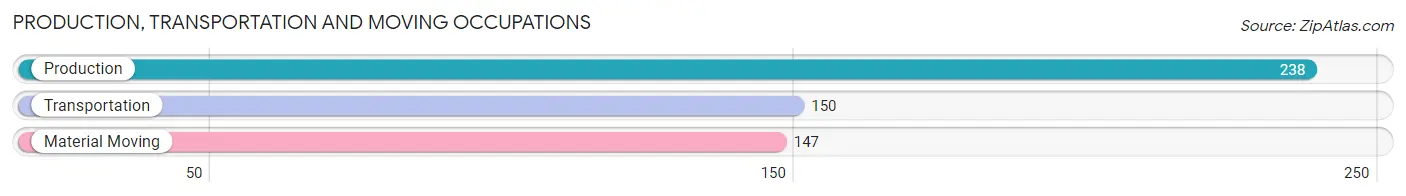
Production, Transportation and Moving Occupations by Sex
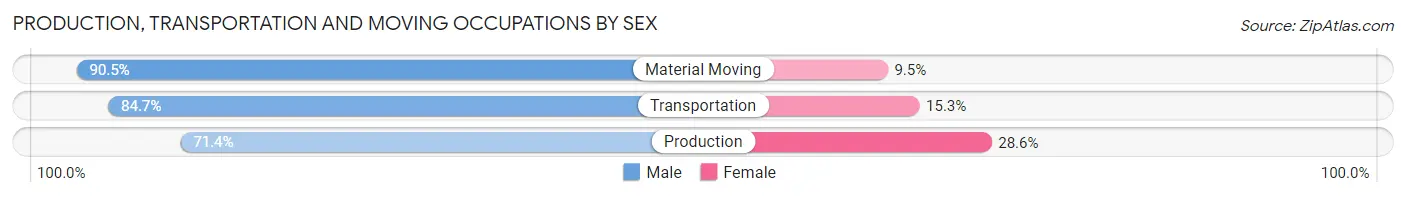
| Occupation | Male | Female |
| Production | 170 (71.4%) | 68 (28.6%) |
| Transportation | 127 (84.7%) | 23 (15.3%) |
| Material Moving | 133 (90.5%) | 14 (9.5%) |
| Total (Category) | 430 (80.4%) | 105 (19.6%) |
| Total (Overall) | 2,230 (50.3%) | 2,204 (49.7%) |
Employment Industries by Sex in Folsom
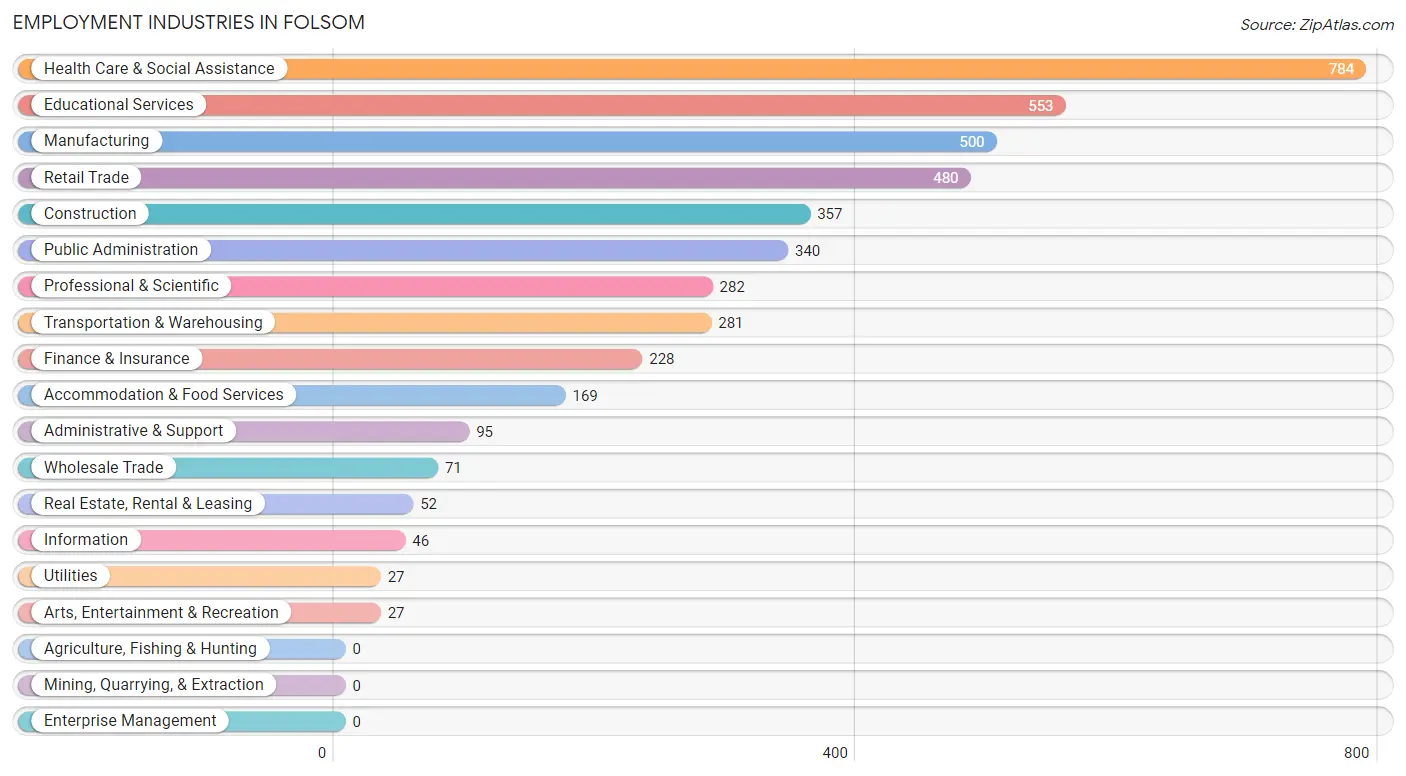
Employment Industries in Folsom
The major employment industries in Folsom include Health Care & Social Assistance (784 | 17.7%), Educational Services (553 | 12.5%), Manufacturing (500 | 11.3%), Retail Trade (480 | 10.8%), and Construction (357 | 8.1%).
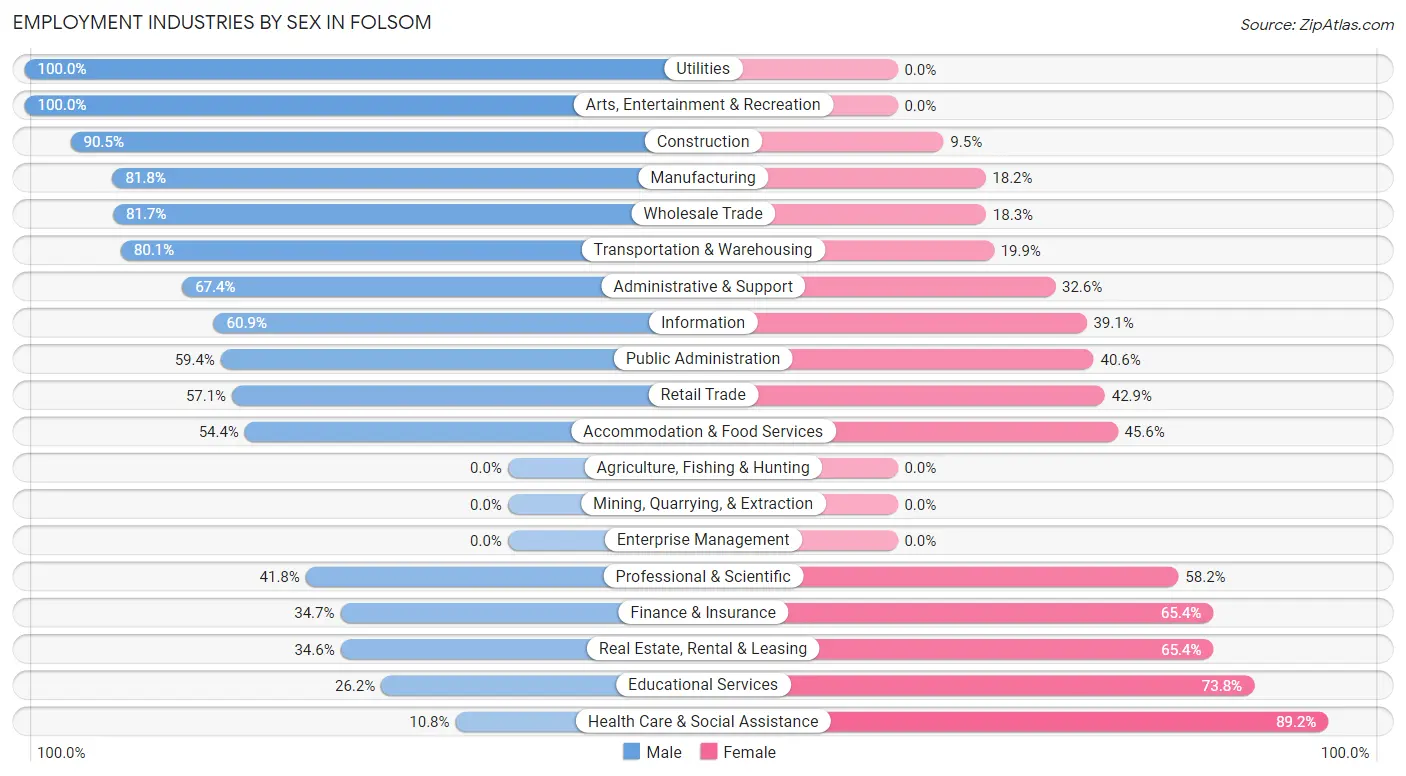
Employment Industries by Sex in Folsom
The Folsom industries that see more men than women are Utilities (100.0%), Arts, Entertainment & Recreation (100.0%), and Construction (90.5%), whereas the industries that tend to have a higher number of women are Health Care & Social Assistance (89.2%), Educational Services (73.8%), and Real Estate, Rental & Leasing (65.4%).
| Industry | Male | Female |
| Agriculture, Fishing & Hunting | 0 (0.0%) | 0 (0.0%) |
| Mining, Quarrying, & Extraction | 0 (0.0%) | 0 (0.0%) |
| Construction | 323 (90.5%) | 34 (9.5%) |
| Manufacturing | 409 (81.8%) | 91 (18.2%) |
| Wholesale Trade | 58 (81.7%) | 13 (18.3%) |
| Retail Trade | 274 (57.1%) | 206 (42.9%) |
| Transportation & Warehousing | 225 (80.1%) | 56 (19.9%) |
| Utilities | 27 (100.0%) | 0 (0.0%) |
| Information | 28 (60.9%) | 18 (39.1%) |
| Finance & Insurance | 79 (34.6%) | 149 (65.3%) |
| Real Estate, Rental & Leasing | 18 (34.6%) | 34 (65.4%) |
| Professional & Scientific | 118 (41.8%) | 164 (58.2%) |
| Enterprise Management | 0 (0.0%) | 0 (0.0%) |
| Administrative & Support | 64 (67.4%) | 31 (32.6%) |
| Educational Services | 145 (26.2%) | 408 (73.8%) |
| Health Care & Social Assistance | 85 (10.8%) | 699 (89.2%) |
| Arts, Entertainment & Recreation | 27 (100.0%) | 0 (0.0%) |
| Accommodation & Food Services | 92 (54.4%) | 77 (45.6%) |
| Public Administration | 202 (59.4%) | 138 (40.6%) |
| Total | 2,230 (50.3%) | 2,204 (49.7%) |
Education in Folsom
School Enrollment in Folsom
The most common levels of schooling among the 2,105 students in Folsom are elementary school (672 | 31.9%), middle school (467 | 22.2%), and nursery / preschool (321 | 15.2%).
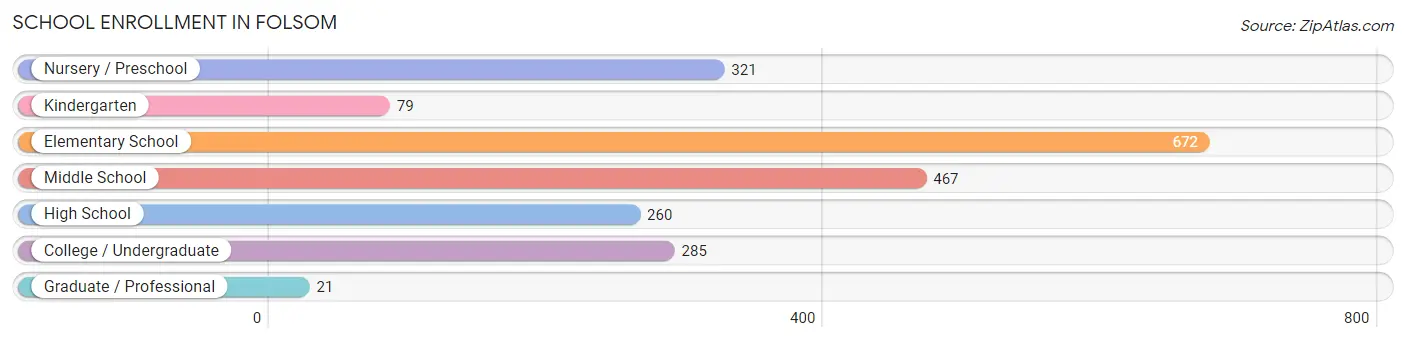
| School Level | # Students | % Students |
| Nursery / Preschool | 321 | 15.2% |
| Kindergarten | 79 | 3.7% |
| Elementary School | 672 | 31.9% |
| Middle School | 467 | 22.2% |
| High School | 260 | 12.3% |
| College / Undergraduate | 285 | 13.5% |
| Graduate / Professional | 21 | 1.0% |
| Total | 2,105 | 100.0% |
School Enrollment by Age by Funding Source in Folsom
Out of a total of 2,105 students who are enrolled in schools in Folsom, 364 (17.3%) attend a private institution, while the remaining 1,741 (82.7%) are enrolled in public schools. The age group of 25 to 34 year olds has the highest likelihood of being enrolled in private schools, with 60 (82.2% in the age bracket) enrolled. Conversely, the age group of 15 to 17 year olds has the lowest likelihood of being enrolled in a private school, with 199 (100.0% in the age bracket) attending a public institution.
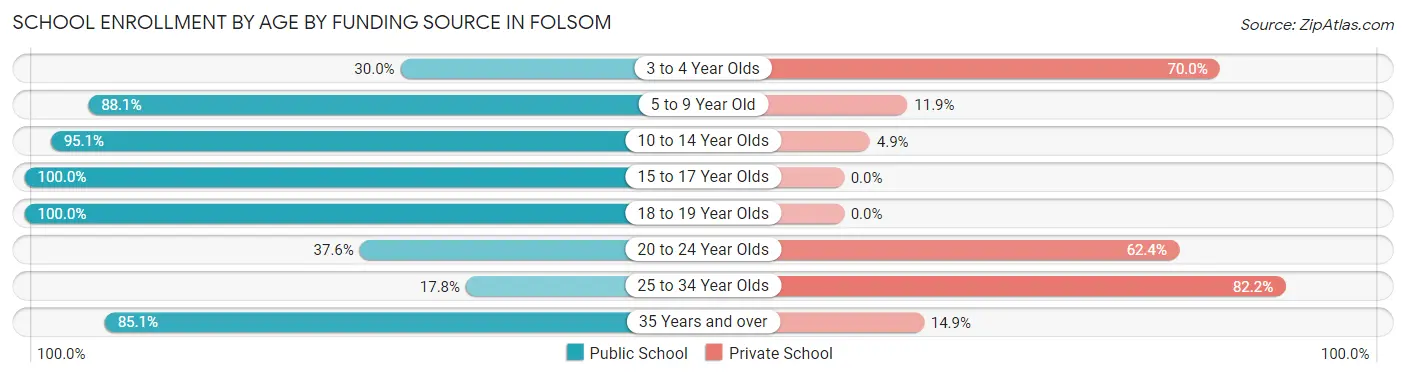
| Age Bracket | Public School | Private School |
| 3 to 4 Year Olds | 39 (30.0%) | 91 (70.0%) |
| 5 to 9 Year Old | 706 (88.1%) | 95 (11.9%) |
| 10 to 14 Year Olds | 606 (95.1%) | 31 (4.9%) |
| 15 to 17 Year Olds | 199 (100.0%) | 0 (0.0%) |
| 18 to 19 Year Olds | 73 (100.0%) | 0 (0.0%) |
| 20 to 24 Year Olds | 47 (37.6%) | 78 (62.4%) |
| 25 to 34 Year Olds | 13 (17.8%) | 60 (82.2%) |
| 35 Years and over | 57 (85.1%) | 10 (14.9%) |
| Total | 1,741 (82.7%) | 364 (17.3%) |
Educational Attainment by Field of Study in Folsom
Business (454 | 25.0%), science & technology (371 | 20.4%), education (224 | 12.3%), arts & humanities (156 | 8.6%), and engineering (118 | 6.5%) are the most common fields of study among 1,818 individuals in Folsom who have obtained a bachelor's degree or higher.
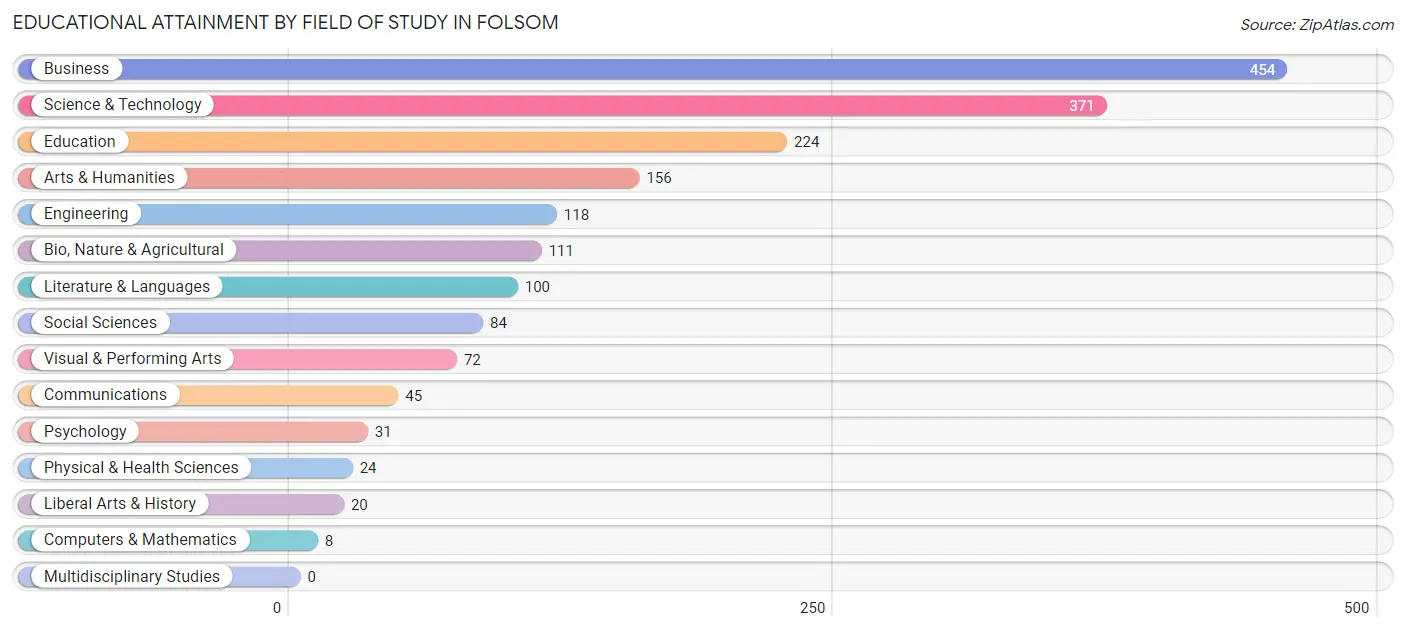
| Field of Study | # Graduates | % Graduates |
| Computers & Mathematics | 8 | 0.4% |
| Bio, Nature & Agricultural | 111 | 6.1% |
| Physical & Health Sciences | 24 | 1.3% |
| Psychology | 31 | 1.7% |
| Social Sciences | 84 | 4.6% |
| Engineering | 118 | 6.5% |
| Multidisciplinary Studies | 0 | 0.0% |
| Science & Technology | 371 | 20.4% |
| Business | 454 | 25.0% |
| Education | 224 | 12.3% |
| Literature & Languages | 100 | 5.5% |
| Liberal Arts & History | 20 | 1.1% |
| Visual & Performing Arts | 72 | 4.0% |
| Communications | 45 | 2.5% |
| Arts & Humanities | 156 | 8.6% |
| Total | 1,818 | 100.0% |
Transportation & Commute in Folsom
Vehicle Availability by Sex in Folsom
The most prevalent vehicle ownership categories in Folsom are males with 2 vehicles (1,055, accounting for 48.8%) and females with 2 vehicles (1,138, making up 48.3%).
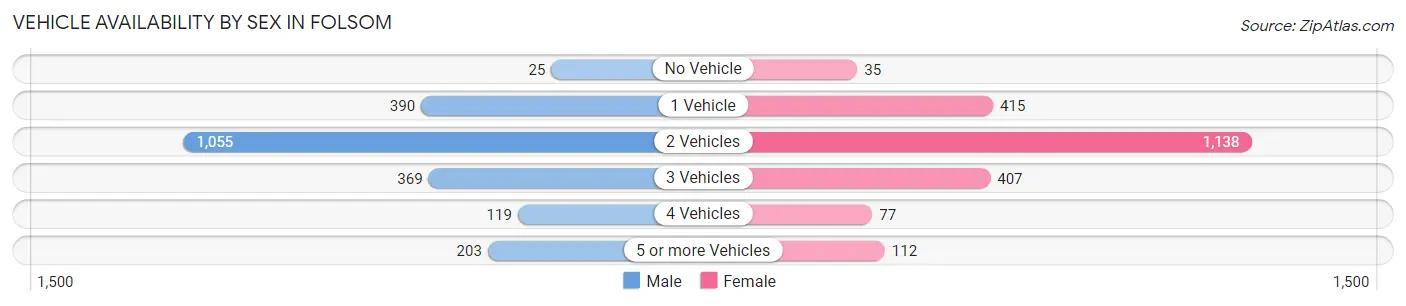
| Vehicles Available | Male | Female |
| No Vehicle | 25 (1.2%) | 35 (1.6%) |
| 1 Vehicle | 390 (18.0%) | 415 (19.0%) |
| 2 Vehicles | 1,055 (48.8%) | 1,138 (52.1%) |
| 3 Vehicles | 369 (17.1%) | 407 (18.6%) |
| 4 Vehicles | 119 (5.5%) | 77 (3.5%) |
| 5 or more Vehicles | 203 (9.4%) | 112 (5.1%) |
| Total | 2,161 (100.0%) | 2,184 (100.0%) |
Commute Time in Folsom
The most frequently occuring commute durations in Folsom are 30 to 34 minutes (661 commuters, 15.9%), 20 to 24 minutes (600 commuters, 14.4%), and 15 to 19 minutes (553 commuters, 13.3%).
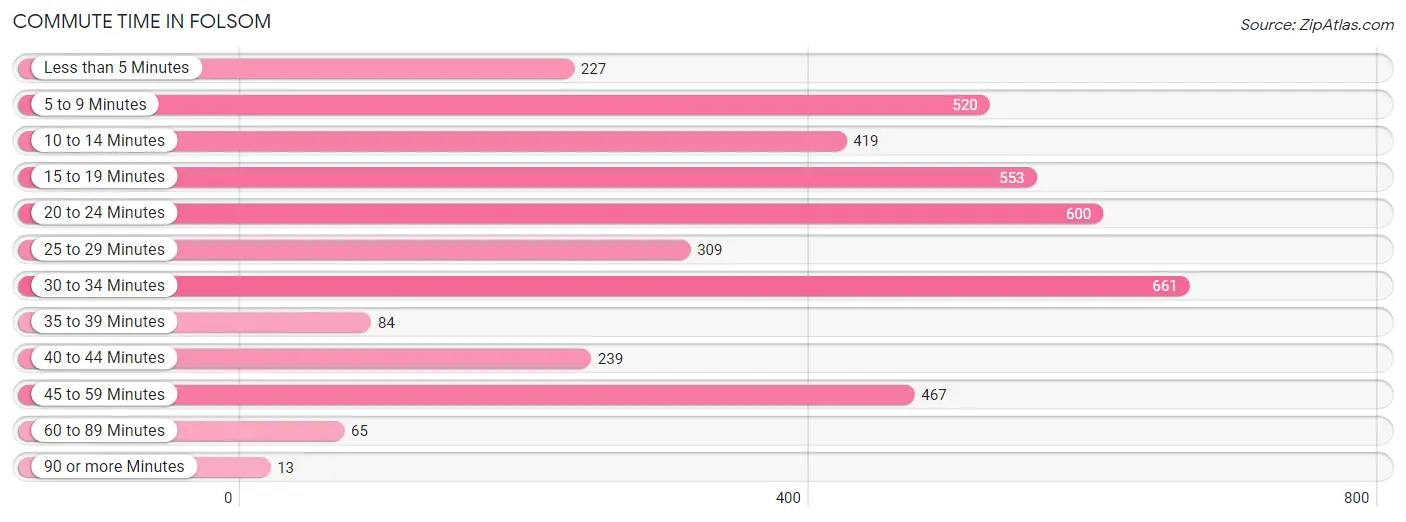
| Commute Time | # Commuters | % Commuters |
| Less than 5 Minutes | 227 | 5.5% |
| 5 to 9 Minutes | 520 | 12.5% |
| 10 to 14 Minutes | 419 | 10.1% |
| 15 to 19 Minutes | 553 | 13.3% |
| 20 to 24 Minutes | 600 | 14.4% |
| 25 to 29 Minutes | 309 | 7.4% |
| 30 to 34 Minutes | 661 | 15.9% |
| 35 to 39 Minutes | 84 | 2.0% |
| 40 to 44 Minutes | 239 | 5.8% |
| 45 to 59 Minutes | 467 | 11.2% |
| 60 to 89 Minutes | 65 | 1.6% |
| 90 or more Minutes | 13 | 0.3% |
Commute Time by Sex in Folsom
The most common commute times in Folsom are 15 to 19 minutes (399 commuters, 19.3%) for males and 20 to 24 minutes (496 commuters, 23.7%) for females.
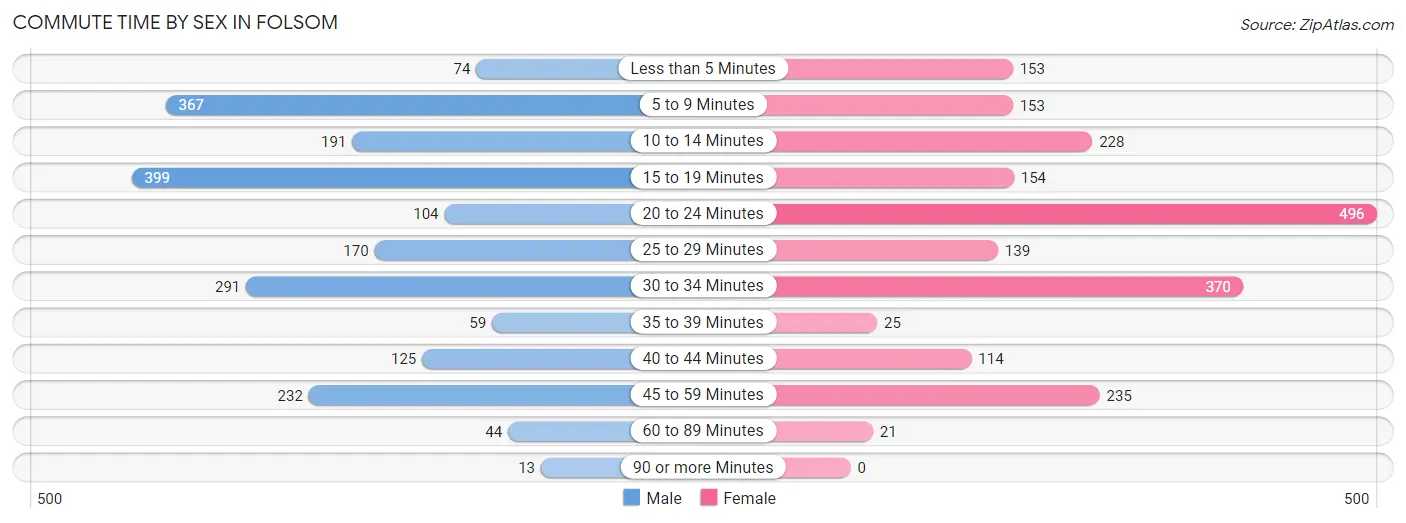
| Commute Time | Male | Female |
| Less than 5 Minutes | 74 (3.6%) | 153 (7.3%) |
| 5 to 9 Minutes | 367 (17.7%) | 153 (7.3%) |
| 10 to 14 Minutes | 191 (9.2%) | 228 (10.9%) |
| 15 to 19 Minutes | 399 (19.3%) | 154 (7.4%) |
| 20 to 24 Minutes | 104 (5.0%) | 496 (23.7%) |
| 25 to 29 Minutes | 170 (8.2%) | 139 (6.7%) |
| 30 to 34 Minutes | 291 (14.1%) | 370 (17.7%) |
| 35 to 39 Minutes | 59 (2.9%) | 25 (1.2%) |
| 40 to 44 Minutes | 125 (6.0%) | 114 (5.5%) |
| 45 to 59 Minutes | 232 (11.2%) | 235 (11.3%) |
| 60 to 89 Minutes | 44 (2.1%) | 21 (1.0%) |
| 90 or more Minutes | 13 (0.6%) | 0 (0.0%) |
Time of Departure to Work by Sex in Folsom
The most frequent times of departure to work in Folsom are 6:00 AM to 6:29 AM (370, 17.9%) for males and 8:00 AM to 8:29 AM (402, 19.3%) for females.
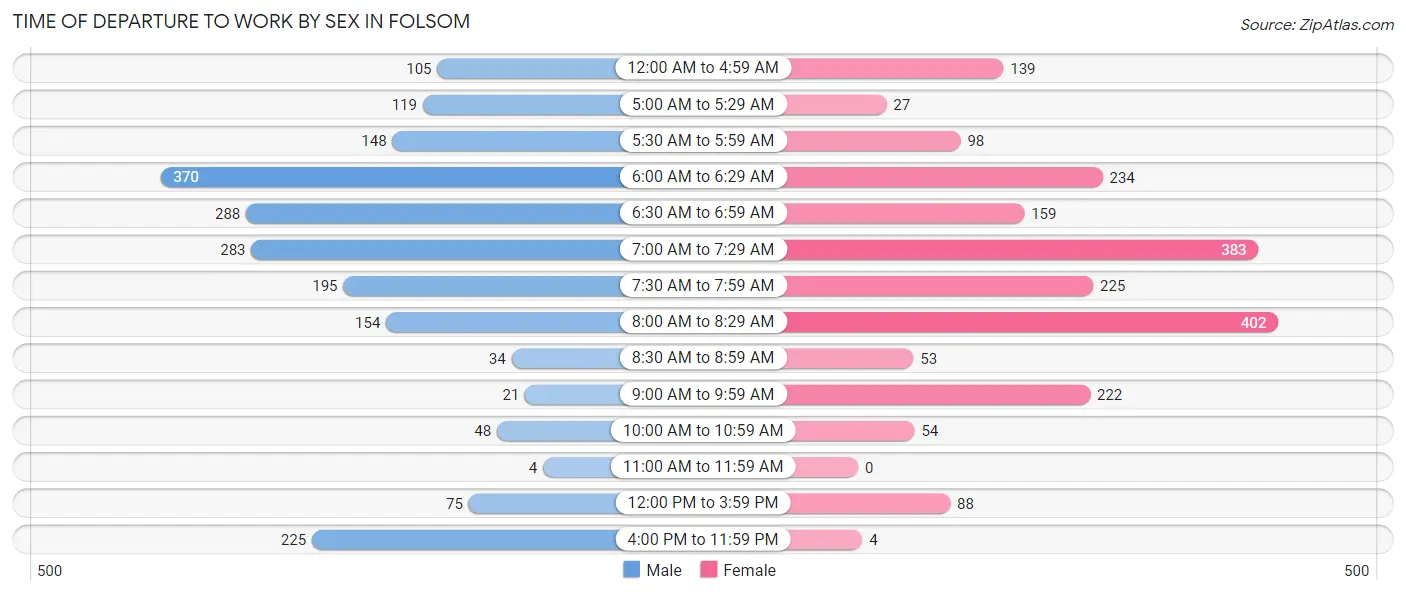
| Time of Departure | Male | Female |
| 12:00 AM to 4:59 AM | 105 (5.1%) | 139 (6.7%) |
| 5:00 AM to 5:29 AM | 119 (5.8%) | 27 (1.3%) |
| 5:30 AM to 5:59 AM | 148 (7.1%) | 98 (4.7%) |
| 6:00 AM to 6:29 AM | 370 (17.9%) | 234 (11.2%) |
| 6:30 AM to 6:59 AM | 288 (13.9%) | 159 (7.6%) |
| 7:00 AM to 7:29 AM | 283 (13.7%) | 383 (18.3%) |
| 7:30 AM to 7:59 AM | 195 (9.4%) | 225 (10.8%) |
| 8:00 AM to 8:29 AM | 154 (7.4%) | 402 (19.3%) |
| 8:30 AM to 8:59 AM | 34 (1.6%) | 53 (2.5%) |
| 9:00 AM to 9:59 AM | 21 (1.0%) | 222 (10.6%) |
| 10:00 AM to 10:59 AM | 48 (2.3%) | 54 (2.6%) |
| 11:00 AM to 11:59 AM | 4 (0.2%) | 0 (0.0%) |
| 12:00 PM to 3:59 PM | 75 (3.6%) | 88 (4.2%) |
| 4:00 PM to 11:59 PM | 225 (10.9%) | 4 (0.2%) |
| Total | 2,069 (100.0%) | 2,088 (100.0%) |
Housing Occupancy in Folsom
Occupancy by Ownership in Folsom
Of the total 3,093 dwellings in Folsom, owner-occupied units account for 2,434 (78.7%), while renter-occupied units make up 659 (21.3%).
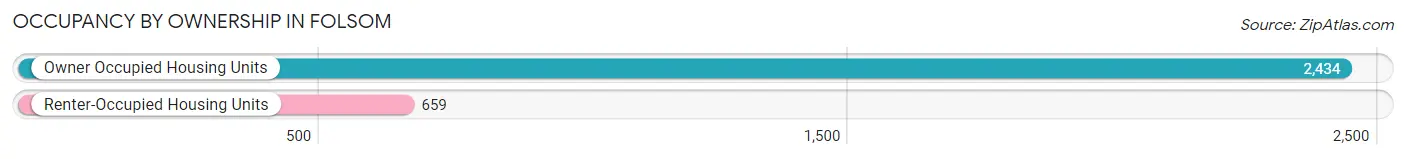
| Occupancy | # Housing Units | % Housing Units |
| Owner Occupied Housing Units | 2,434 | 78.7% |
| Renter-Occupied Housing Units | 659 | 21.3% |
| Total Occupied Housing Units | 3,093 | 100.0% |
Occupancy by Household Size in Folsom
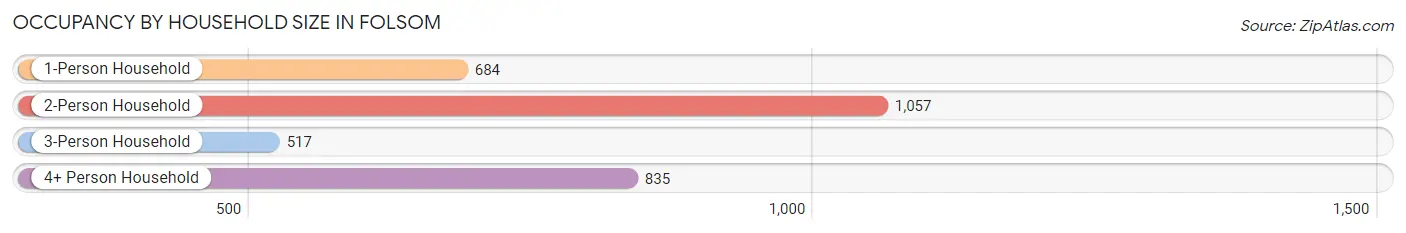
| Household Size | # Housing Units | % Housing Units |
| 1-Person Household | 684 | 22.1% |
| 2-Person Household | 1,057 | 34.2% |
| 3-Person Household | 517 | 16.7% |
| 4+ Person Household | 835 | 27.0% |
| Total Housing Units | 3,093 | 100.0% |
Occupancy by Ownership by Household Size in Folsom
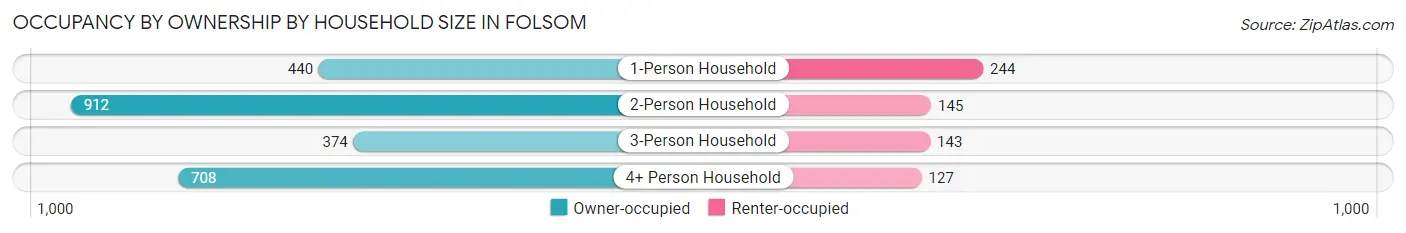
| Household Size | Owner-occupied | Renter-occupied |
| 1-Person Household | 440 (64.3%) | 244 (35.7%) |
| 2-Person Household | 912 (86.3%) | 145 (13.7%) |
| 3-Person Household | 374 (72.3%) | 143 (27.7%) |
| 4+ Person Household | 708 (84.8%) | 127 (15.2%) |
| Total Housing Units | 2,434 (78.7%) | 659 (21.3%) |
Occupancy by Educational Attainment in Folsom
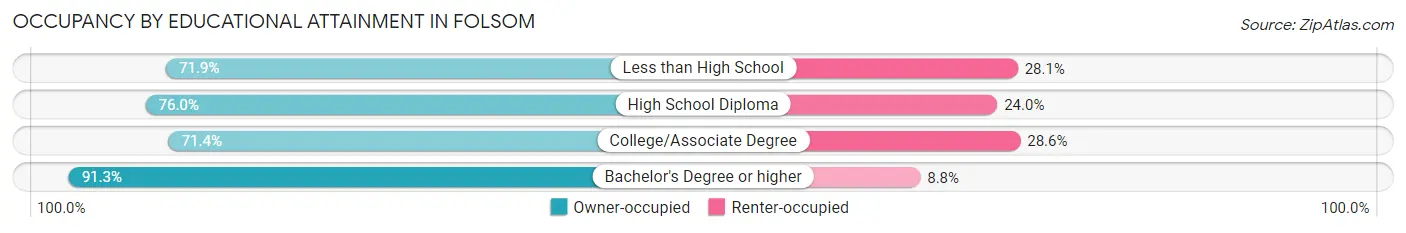
| Household Size | Owner-occupied | Renter-occupied |
| Less than High School | 182 (71.9%) | 71 (28.1%) |
| High School Diploma | 779 (76.0%) | 246 (24.0%) |
| College/Associate Degree | 660 (71.4%) | 264 (28.6%) |
| Bachelor's Degree or higher | 813 (91.2%) | 78 (8.7%) |
Occupancy by Age of Householder in Folsom
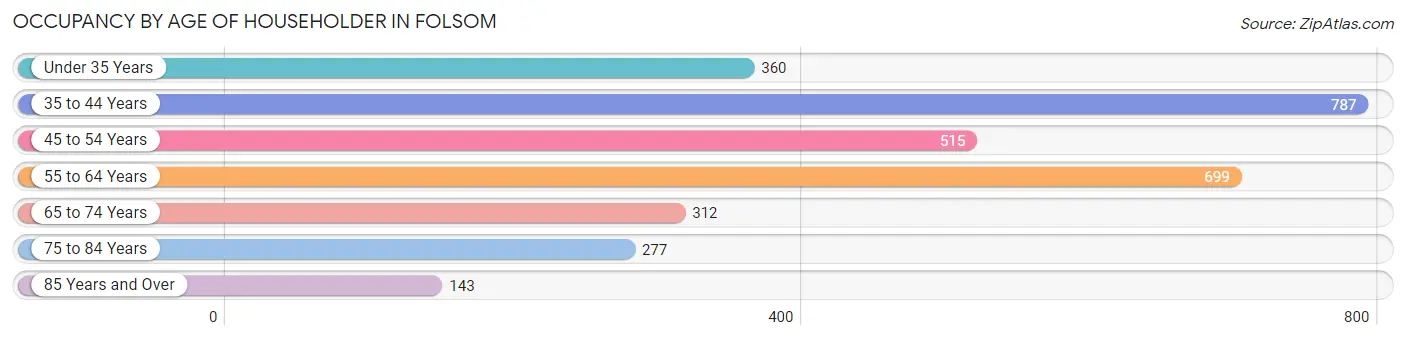
| Age Bracket | # Households | % Households |
| Under 35 Years | 360 | 11.6% |
| 35 to 44 Years | 787 | 25.4% |
| 45 to 54 Years | 515 | 16.7% |
| 55 to 64 Years | 699 | 22.6% |
| 65 to 74 Years | 312 | 10.1% |
| 75 to 84 Years | 277 | 9.0% |
| 85 Years and Over | 143 | 4.6% |
| Total | 3,093 | 100.0% |
Housing Finances in Folsom
Median Income by Occupancy in Folsom
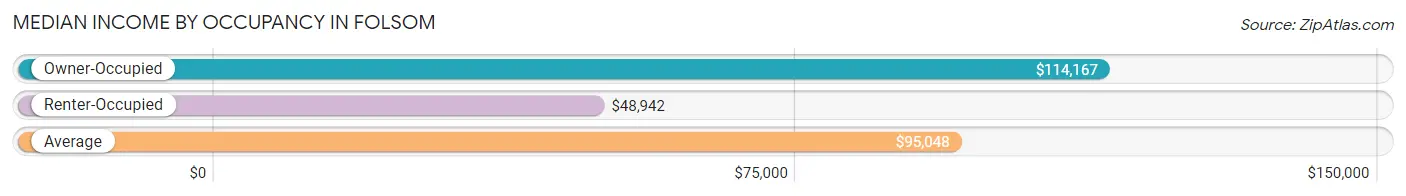
| Occupancy Type | # Households | Median Income |
| Owner-Occupied | 2,434 (78.7%) | $114,167 |
| Renter-Occupied | 659 (21.3%) | $48,942 |
| Average | 3,093 (100.0%) | $95,048 |
Occupancy by Householder Income Bracket in Folsom
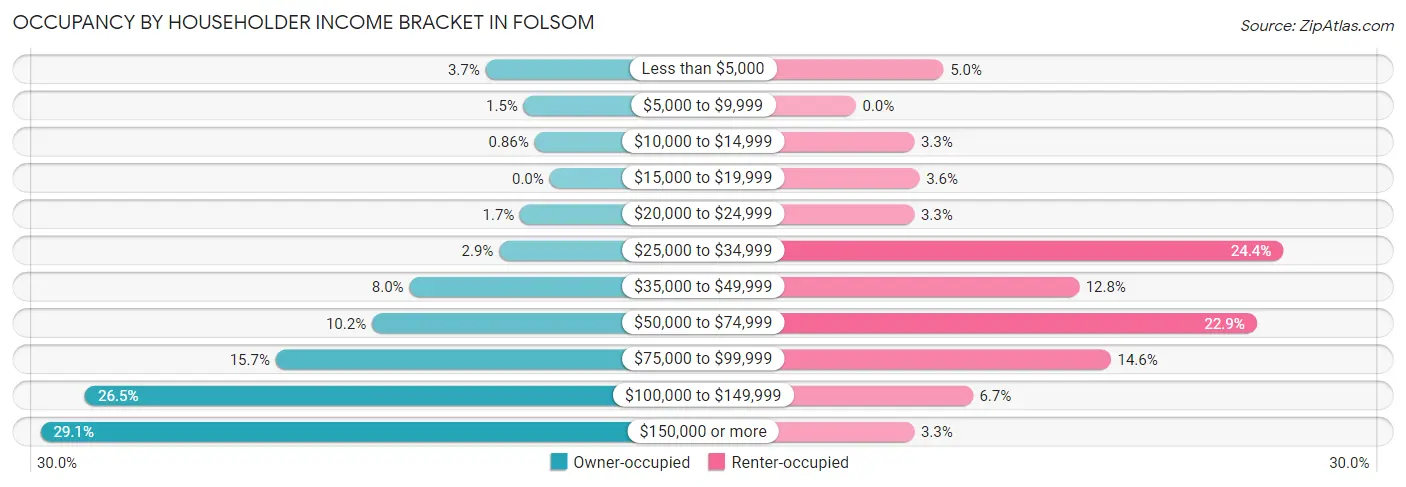
| Income Bracket | Owner-occupied | Renter-occupied |
| Less than $5,000 | 89 (3.7%) | 33 (5.0%) |
| $5,000 to $9,999 | 36 (1.5%) | 0 (0.0%) |
| $10,000 to $14,999 | 21 (0.9%) | 22 (3.3%) |
| $15,000 to $19,999 | 0 (0.0%) | 24 (3.6%) |
| $20,000 to $24,999 | 41 (1.7%) | 22 (3.3%) |
| $25,000 to $34,999 | 70 (2.9%) | 161 (24.4%) |
| $35,000 to $49,999 | 195 (8.0%) | 84 (12.8%) |
| $50,000 to $74,999 | 247 (10.2%) | 151 (22.9%) |
| $75,000 to $99,999 | 381 (15.7%) | 96 (14.6%) |
| $100,000 to $149,999 | 646 (26.5%) | 44 (6.7%) |
| $150,000 or more | 708 (29.1%) | 22 (3.3%) |
| Total | 2,434 (100.0%) | 659 (100.0%) |
Monthly Housing Cost Tiers in Folsom
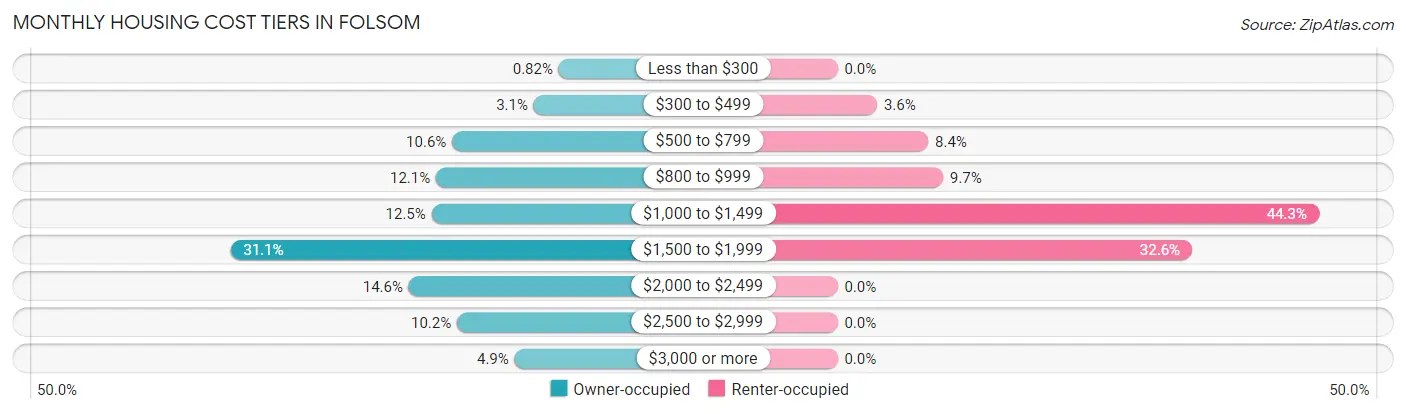
| Monthly Cost | Owner-occupied | Renter-occupied |
| Less than $300 | 20 (0.8%) | 0 (0.0%) |
| $300 to $499 | 76 (3.1%) | 24 (3.6%) |
| $500 to $799 | 259 (10.6%) | 55 (8.4%) |
| $800 to $999 | 295 (12.1%) | 64 (9.7%) |
| $1,000 to $1,499 | 305 (12.5%) | 292 (44.3%) |
| $1,500 to $1,999 | 756 (31.1%) | 215 (32.6%) |
| $2,000 to $2,499 | 356 (14.6%) | 0 (0.0%) |
| $2,500 to $2,999 | 248 (10.2%) | 0 (0.0%) |
| $3,000 or more | 119 (4.9%) | 0 (0.0%) |
| Total | 2,434 (100.0%) | 659 (100.0%) |
Physical Housing Characteristics in Folsom
Housing Structures in Folsom
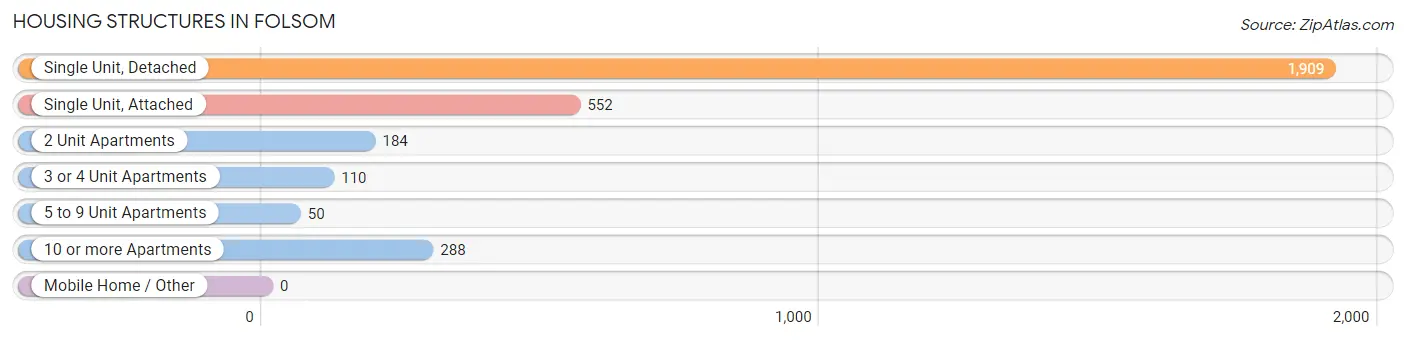
| Structure Type | # Housing Units | % Housing Units |
| Single Unit, Detached | 1,909 | 61.7% |
| Single Unit, Attached | 552 | 17.8% |
| 2 Unit Apartments | 184 | 5.9% |
| 3 or 4 Unit Apartments | 110 | 3.6% |
| 5 to 9 Unit Apartments | 50 | 1.6% |
| 10 or more Apartments | 288 | 9.3% |
| Mobile Home / Other | 0 | 0.0% |
| Total | 3,093 | 100.0% |
Housing Structures by Occupancy in Folsom
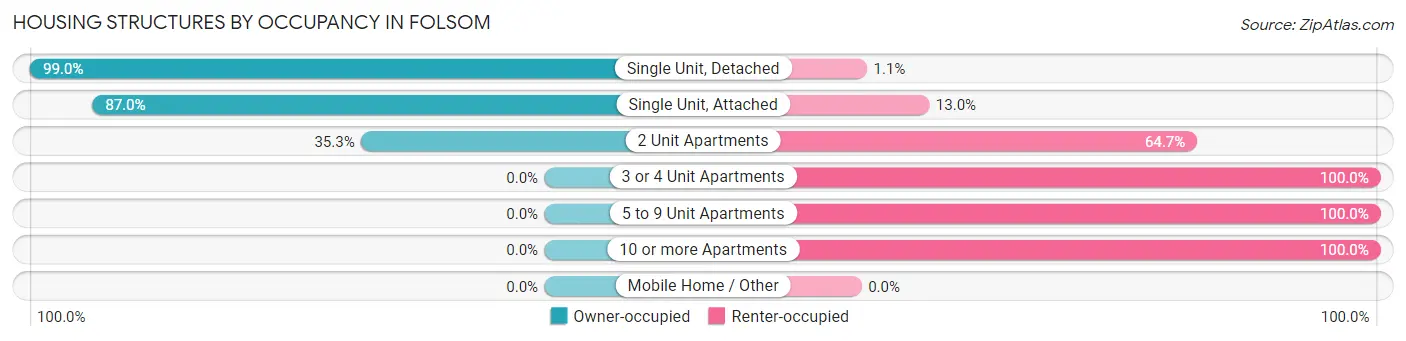
| Structure Type | Owner-occupied | Renter-occupied |
| Single Unit, Detached | 1,889 (99.0%) | 20 (1.1%) |
| Single Unit, Attached | 480 (87.0%) | 72 (13.0%) |
| 2 Unit Apartments | 65 (35.3%) | 119 (64.7%) |
| 3 or 4 Unit Apartments | 0 (0.0%) | 110 (100.0%) |
| 5 to 9 Unit Apartments | 0 (0.0%) | 50 (100.0%) |
| 10 or more Apartments | 0 (0.0%) | 288 (100.0%) |
| Mobile Home / Other | 0 (0.0%) | 0 (0.0%) |
| Total | 2,434 (78.7%) | 659 (21.3%) |
Housing Structures by Number of Rooms in Folsom
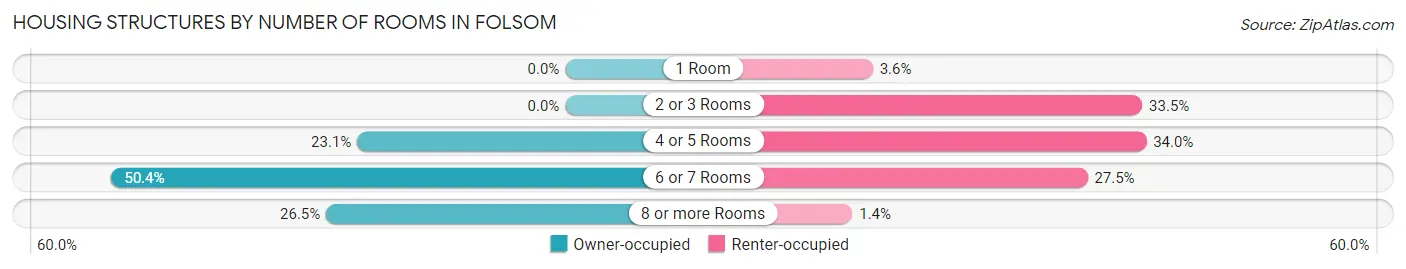
| Number of Rooms | Owner-occupied | Renter-occupied |
| 1 Room | 0 (0.0%) | 24 (3.6%) |
| 2 or 3 Rooms | 0 (0.0%) | 221 (33.5%) |
| 4 or 5 Rooms | 562 (23.1%) | 224 (34.0%) |
| 6 or 7 Rooms | 1,226 (50.4%) | 181 (27.5%) |
| 8 or more Rooms | 646 (26.5%) | 9 (1.4%) |
| Total | 2,434 (100.0%) | 659 (100.0%) |
Housing Structure by Heating Type in Folsom
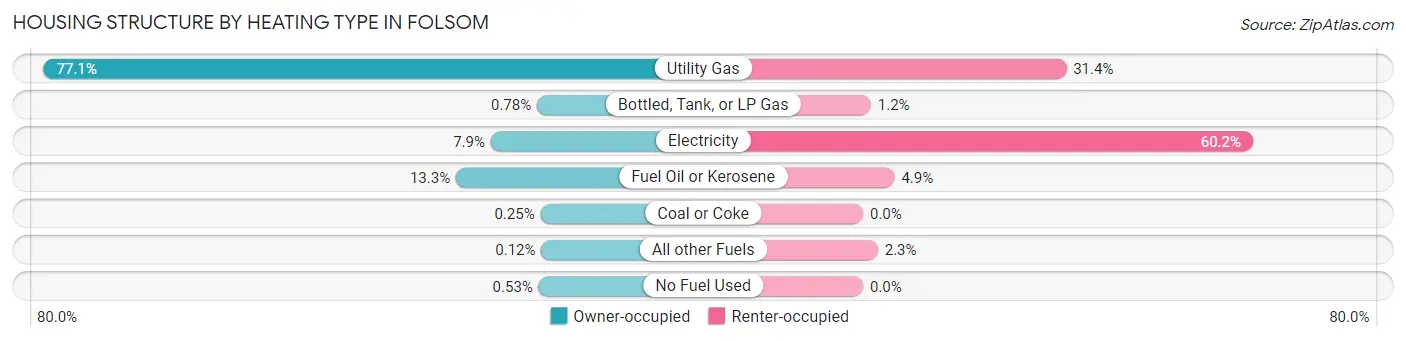
| Heating Type | Owner-occupied | Renter-occupied |
| Utility Gas | 1,876 (77.1%) | 207 (31.4%) |
| Bottled, Tank, or LP Gas | 19 (0.8%) | 8 (1.2%) |
| Electricity | 193 (7.9%) | 397 (60.2%) |
| Fuel Oil or Kerosene | 324 (13.3%) | 32 (4.9%) |
| Coal or Coke | 6 (0.3%) | 0 (0.0%) |
| All other Fuels | 3 (0.1%) | 15 (2.3%) |
| No Fuel Used | 13 (0.5%) | 0 (0.0%) |
| Total | 2,434 (100.0%) | 659 (100.0%) |
Household Vehicle Usage in Folsom
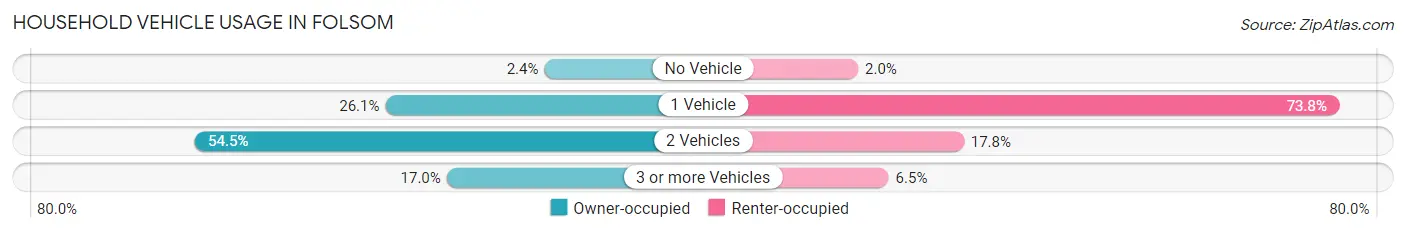
| Vehicles per Household | Owner-occupied | Renter-occupied |
| No Vehicle | 58 (2.4%) | 13 (2.0%) |
| 1 Vehicle | 636 (26.1%) | 486 (73.8%) |
| 2 Vehicles | 1,327 (54.5%) | 117 (17.7%) |
| 3 or more Vehicles | 413 (17.0%) | 43 (6.5%) |
| Total | 2,434 (100.0%) | 659 (100.0%) |
Real Estate & Mortgages in Folsom
Real Estate and Mortgage Overview in Folsom
| Characteristic | Without Mortgage | With Mortgage |
| Housing Units | 822 | 1,612 |
| Median Property Value | $235,000 | $253,700 |
| Median Household Income | $75,086 | $587 |
| Monthly Housing Costs | $878 | $119 |
| Real Estate Taxes | $6,018 | $5 |
Property Value by Mortgage Status in Folsom
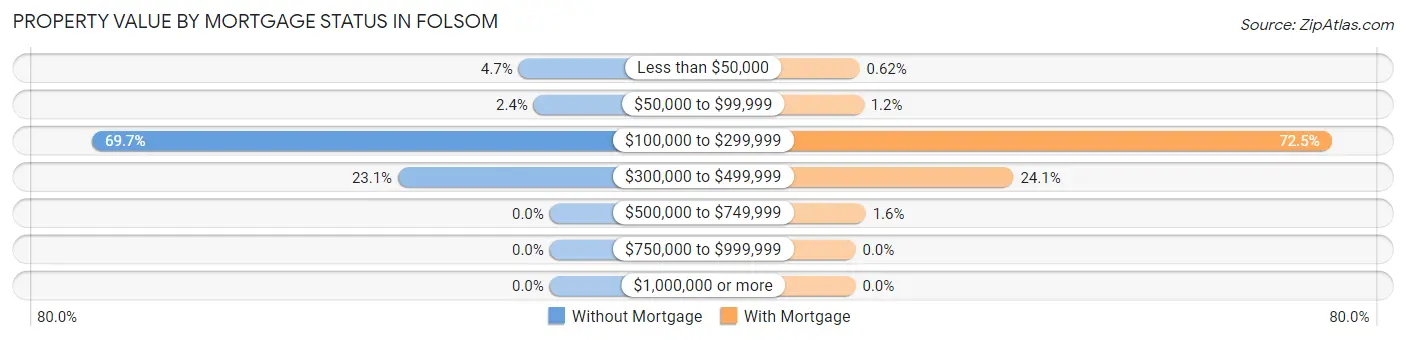
| Property Value | Without Mortgage | With Mortgage |
| Less than $50,000 | 39 (4.7%) | 10 (0.6%) |
| $50,000 to $99,999 | 20 (2.4%) | 20 (1.2%) |
| $100,000 to $299,999 | 573 (69.7%) | 1,169 (72.5%) |
| $300,000 to $499,999 | 190 (23.1%) | 388 (24.1%) |
| $500,000 to $749,999 | 0 (0.0%) | 25 (1.5%) |
| $750,000 to $999,999 | 0 (0.0%) | 0 (0.0%) |
| $1,000,000 or more | 0 (0.0%) | 0 (0.0%) |
| Total | 822 (100.0%) | 1,612 (100.0%) |
Household Income by Mortgage Status in Folsom
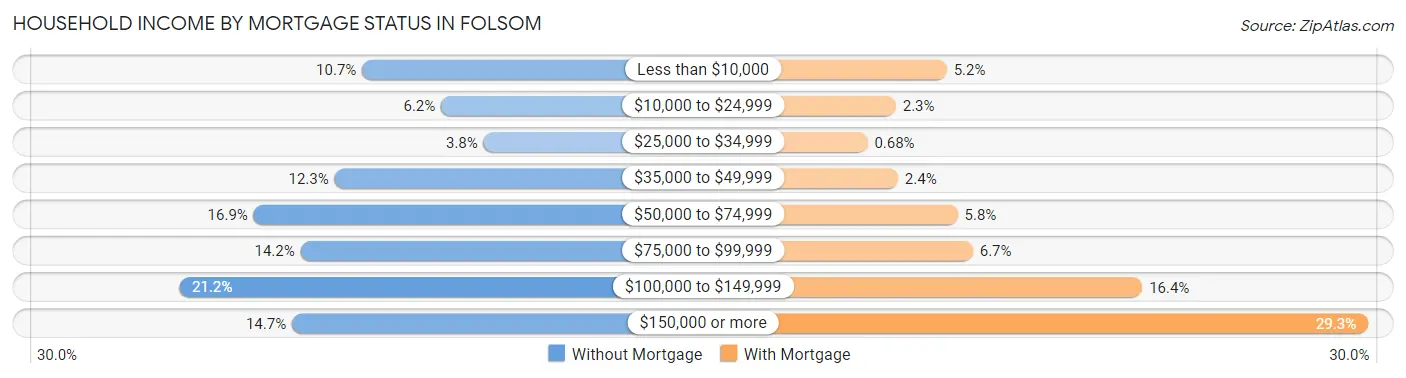
| Household Income | Without Mortgage | With Mortgage |
| Less than $10,000 | 88 (10.7%) | 84 (5.2%) |
| $10,000 to $24,999 | 51 (6.2%) | 37 (2.3%) |
| $25,000 to $34,999 | 31 (3.8%) | 11 (0.7%) |
| $35,000 to $49,999 | 101 (12.3%) | 39 (2.4%) |
| $50,000 to $74,999 | 139 (16.9%) | 94 (5.8%) |
| $75,000 to $99,999 | 117 (14.2%) | 108 (6.7%) |
| $100,000 to $149,999 | 174 (21.2%) | 264 (16.4%) |
| $150,000 or more | 121 (14.7%) | 472 (29.3%) |
| Total | 822 (100.0%) | 1,612 (100.0%) |
Property Value to Household Income Ratio in Folsom
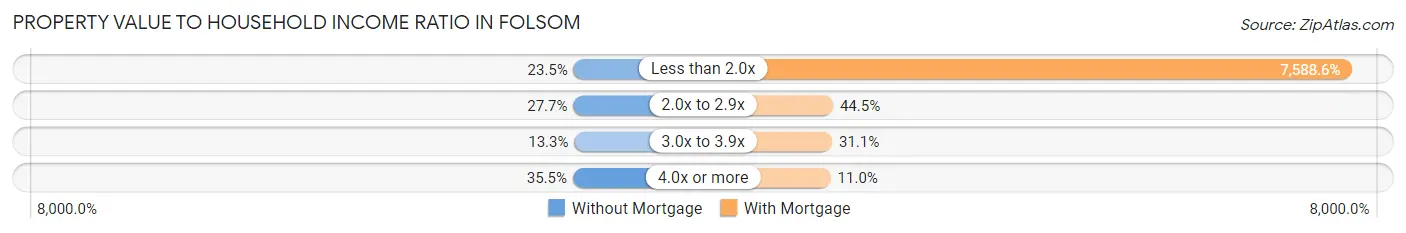
| Value-to-Income Ratio | Without Mortgage | With Mortgage |
| Less than 2.0x | 193 (23.5%) | 122,328 (7,588.6%) |
| 2.0x to 2.9x | 228 (27.7%) | 717 (44.5%) |
| 3.0x to 3.9x | 109 (13.3%) | 501 (31.1%) |
| 4.0x or more | 292 (35.5%) | 178 (11.0%) |
| Total | 822 (100.0%) | 1,612 (100.0%) |
Real Estate Taxes by Mortgage Status in Folsom
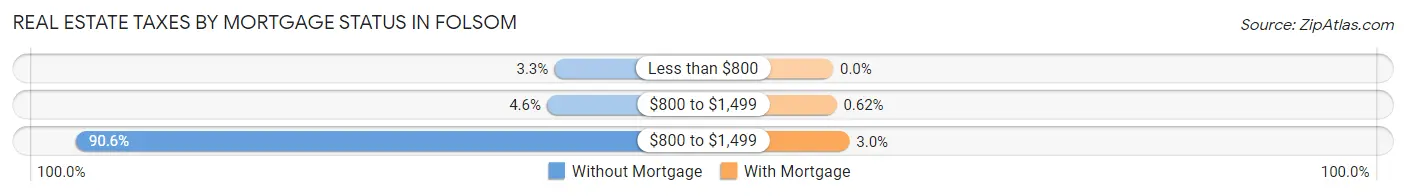
| Property Taxes | Without Mortgage | With Mortgage |
| Less than $800 | 27 (3.3%) | 0 (0.0%) |
| $800 to $1,499 | 38 (4.6%) | 10 (0.6%) |
| $800 to $1,499 | 745 (90.6%) | 48 (3.0%) |
| Total | 822 (100.0%) | 1,612 (100.0%) |
Health & Disability in Folsom
Health Insurance Coverage by Age in Folsom
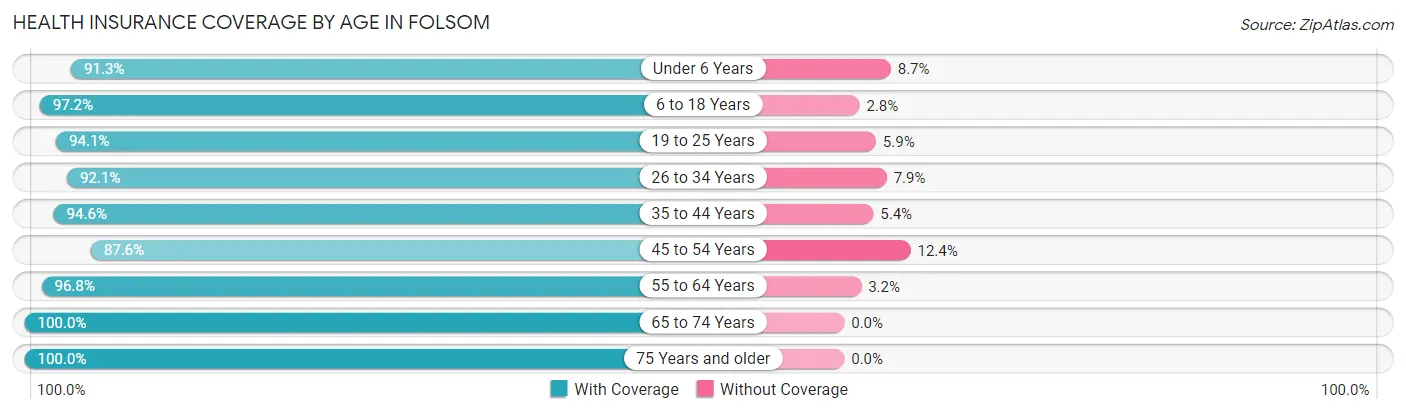
| Age Bracket | With Coverage | Without Coverage |
| Under 6 Years | 769 (91.3%) | 73 (8.7%) |
| 6 to 18 Years | 1,504 (97.2%) | 44 (2.8%) |
| 19 to 25 Years | 447 (94.1%) | 28 (5.9%) |
| 26 to 34 Years | 827 (92.1%) | 71 (7.9%) |
| 35 to 44 Years | 1,413 (94.6%) | 81 (5.4%) |
| 45 to 54 Years | 808 (87.6%) | 114 (12.4%) |
| 55 to 64 Years | 1,194 (96.8%) | 39 (3.2%) |
| 65 to 74 Years | 533 (100.0%) | 0 (0.0%) |
| 75 Years and older | 583 (100.0%) | 0 (0.0%) |
| Total | 8,078 (94.7%) | 450 (5.3%) |
Health Insurance Coverage by Citizenship Status in Folsom
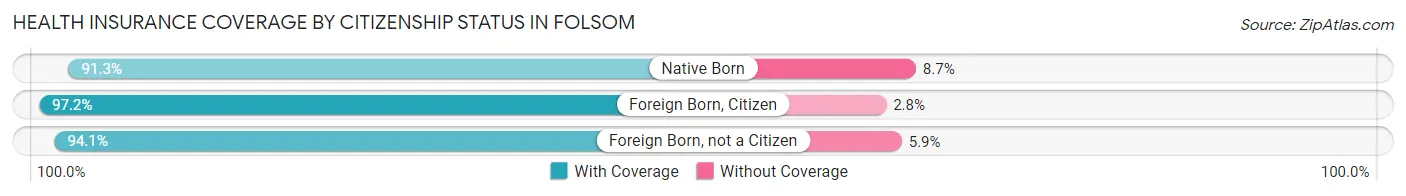
| Citizenship Status | With Coverage | Without Coverage |
| Native Born | 769 (91.3%) | 73 (8.7%) |
| Foreign Born, Citizen | 1,504 (97.2%) | 44 (2.8%) |
| Foreign Born, not a Citizen | 447 (94.1%) | 28 (5.9%) |
Health Insurance Coverage by Household Income in Folsom
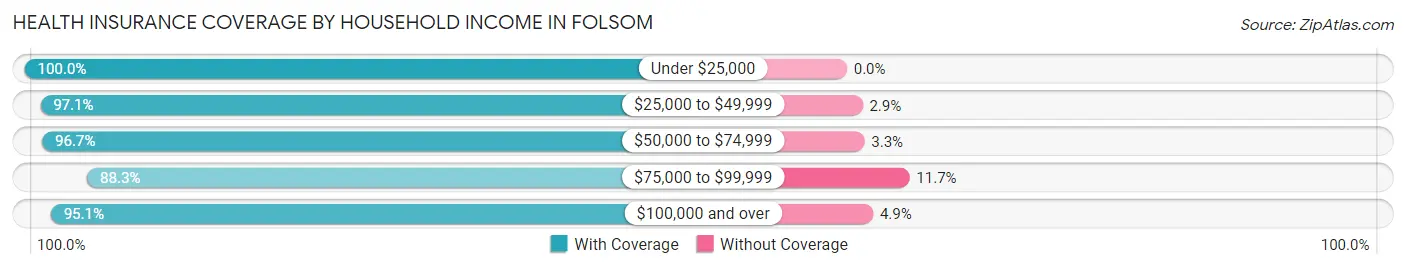
| Household Income | With Coverage | Without Coverage |
| Under $25,000 | 399 (100.0%) | 0 (0.0%) |
| $25,000 to $49,999 | 928 (97.1%) | 28 (2.9%) |
| $50,000 to $74,999 | 1,087 (96.7%) | 37 (3.3%) |
| $75,000 to $99,999 | 1,144 (88.3%) | 152 (11.7%) |
| $100,000 and over | 4,520 (95.1%) | 233 (4.9%) |
Public vs Private Health Insurance Coverage by Age in Folsom
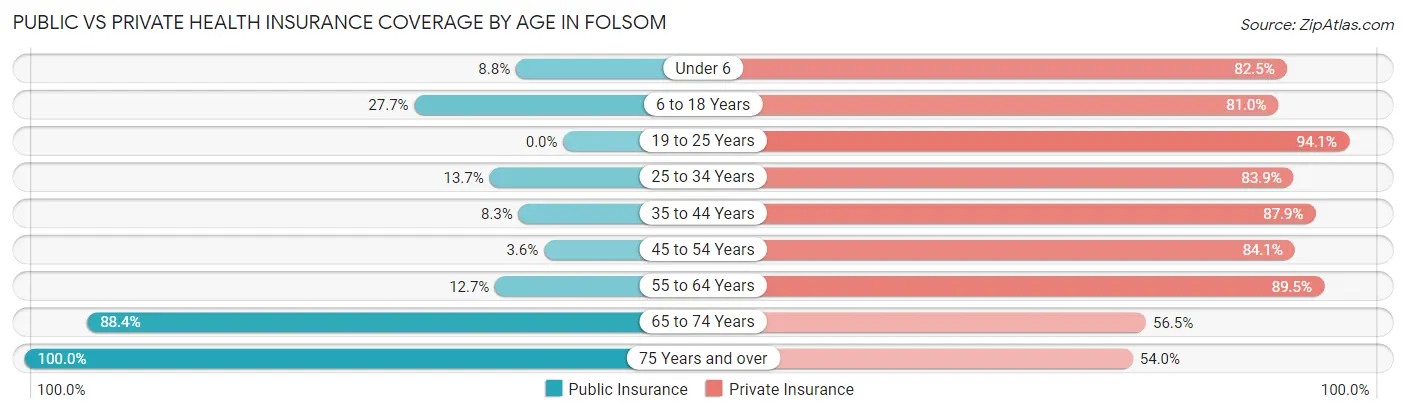
| Age Bracket | Public Insurance | Private Insurance |
| Under 6 | 74 (8.8%) | 695 (82.5%) |
| 6 to 18 Years | 428 (27.7%) | 1,254 (81.0%) |
| 19 to 25 Years | 0 (0.0%) | 447 (94.1%) |
| 25 to 34 Years | 123 (13.7%) | 753 (83.9%) |
| 35 to 44 Years | 124 (8.3%) | 1,313 (87.9%) |
| 45 to 54 Years | 33 (3.6%) | 775 (84.1%) |
| 55 to 64 Years | 156 (12.7%) | 1,103 (89.5%) |
| 65 to 74 Years | 471 (88.4%) | 301 (56.5%) |
| 75 Years and over | 583 (100.0%) | 315 (54.0%) |
| Total | 1,992 (23.4%) | 6,956 (81.6%) |
Disability Status by Sex by Age in Folsom
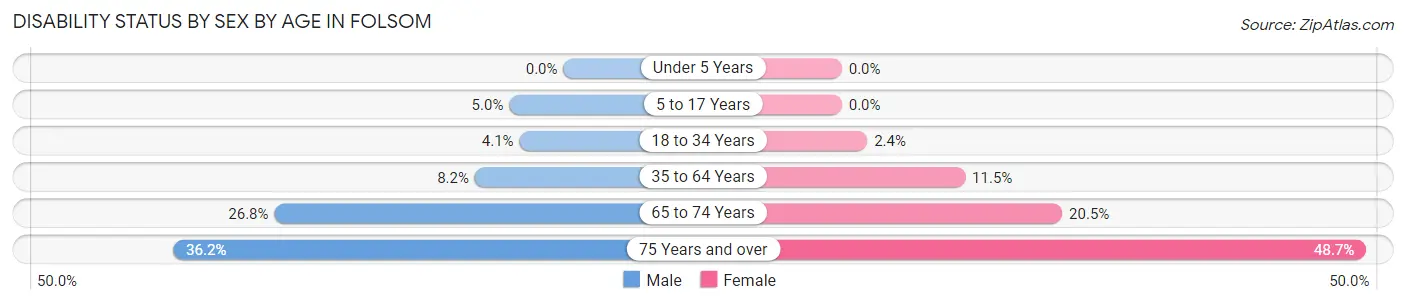
| Age Bracket | Male | Female |
| Under 5 Years | 0 (0.0%) | 0 (0.0%) |
| 5 to 17 Years | 45 (5.0%) | 0 (0.0%) |
| 18 to 34 Years | 31 (4.1%) | 16 (2.4%) |
| 35 to 64 Years | 142 (8.2%) | 220 (11.5%) |
| 65 to 74 Years | 59 (26.8%) | 64 (20.4%) |
| 75 Years and over | 63 (36.2%) | 199 (48.7%) |
Disability Class by Sex by Age in Folsom
Disability Class: Hearing Difficulty
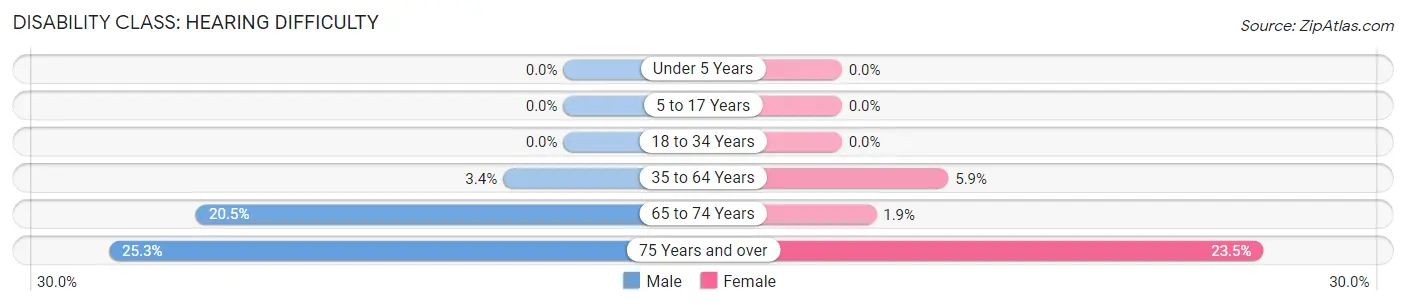
| Age Bracket | Male | Female |
| Under 5 Years | 0 (0.0%) | 0 (0.0%) |
| 5 to 17 Years | 0 (0.0%) | 0 (0.0%) |
| 18 to 34 Years | 0 (0.0%) | 0 (0.0%) |
| 35 to 64 Years | 58 (3.4%) | 114 (5.9%) |
| 65 to 74 Years | 45 (20.4%) | 6 (1.9%) |
| 75 Years and over | 44 (25.3%) | 96 (23.5%) |
Disability Class: Vision Difficulty
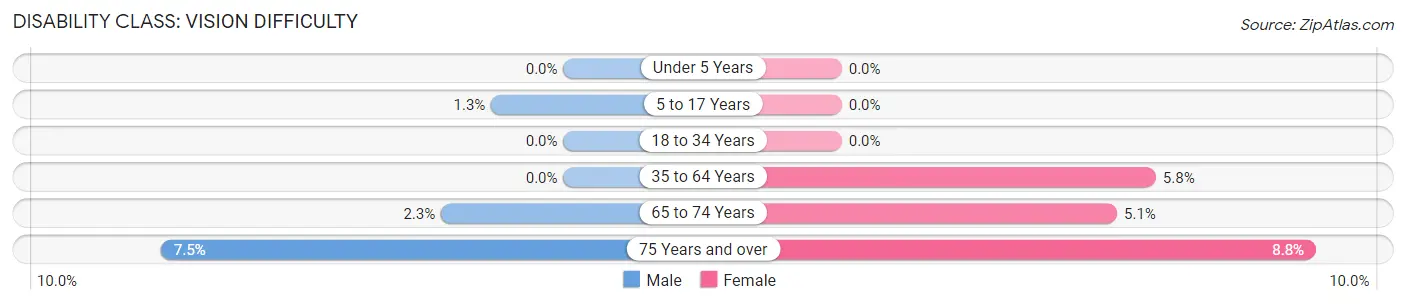
| Age Bracket | Male | Female |
| Under 5 Years | 0 (0.0%) | 0 (0.0%) |
| 5 to 17 Years | 12 (1.3%) | 0 (0.0%) |
| 18 to 34 Years | 0 (0.0%) | 0 (0.0%) |
| 35 to 64 Years | 0 (0.0%) | 112 (5.8%) |
| 65 to 74 Years | 5 (2.3%) | 16 (5.1%) |
| 75 Years and over | 13 (7.5%) | 36 (8.8%) |
Disability Class: Cognitive Difficulty
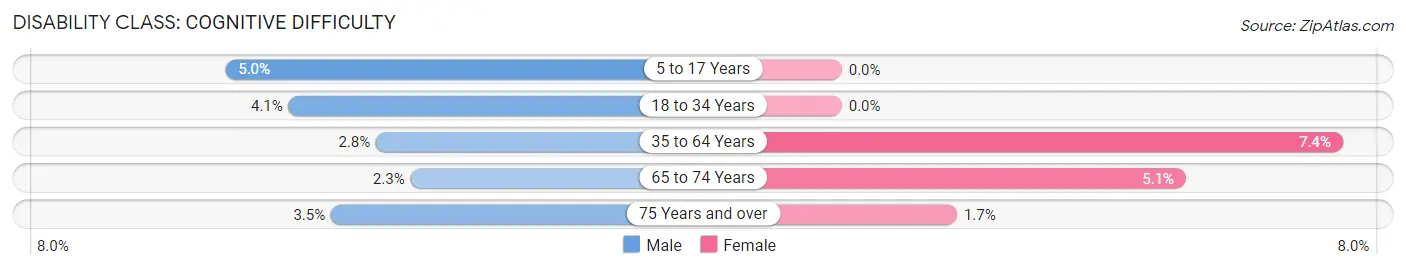
| Age Bracket | Male | Female |
| 5 to 17 Years | 45 (5.0%) | 0 (0.0%) |
| 18 to 34 Years | 31 (4.1%) | 0 (0.0%) |
| 35 to 64 Years | 48 (2.8%) | 143 (7.4%) |
| 65 to 74 Years | 5 (2.3%) | 16 (5.1%) |
| 75 Years and over | 6 (3.5%) | 7 (1.7%) |
Disability Class: Ambulatory Difficulty
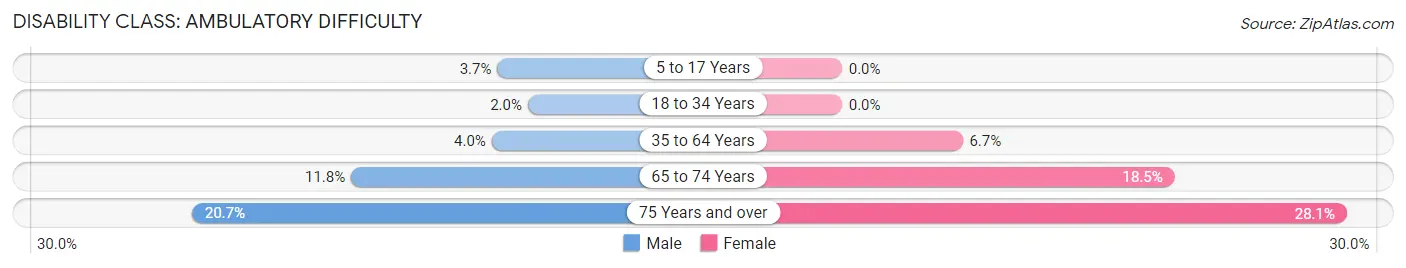
| Age Bracket | Male | Female |
| 5 to 17 Years | 33 (3.7%) | 0 (0.0%) |
| 18 to 34 Years | 15 (2.0%) | 0 (0.0%) |
| 35 to 64 Years | 69 (4.0%) | 129 (6.7%) |
| 65 to 74 Years | 26 (11.8%) | 58 (18.5%) |
| 75 Years and over | 36 (20.7%) | 115 (28.1%) |
Disability Class: Self-Care Difficulty
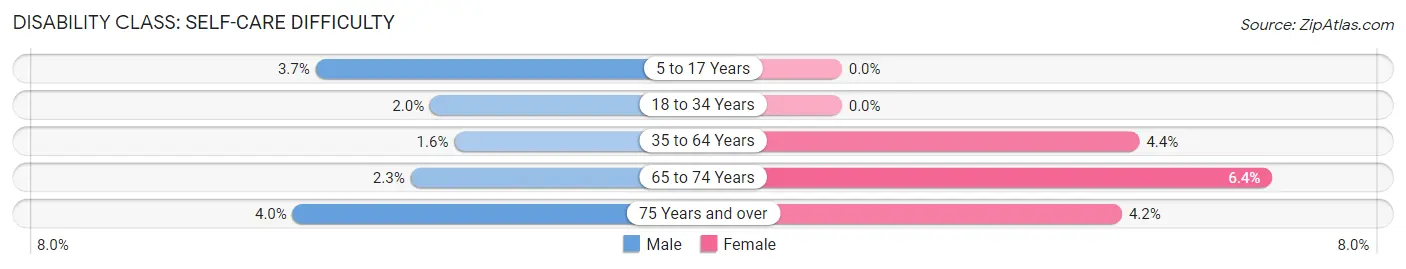
| Age Bracket | Male | Female |
| 5 to 17 Years | 33 (3.7%) | 0 (0.0%) |
| 18 to 34 Years | 15 (2.0%) | 0 (0.0%) |
| 35 to 64 Years | 28 (1.6%) | 85 (4.4%) |
| 65 to 74 Years | 5 (2.3%) | 20 (6.4%) |
| 75 Years and over | 7 (4.0%) | 17 (4.2%) |
Technology Access in Folsom
Computing Device Access in Folsom
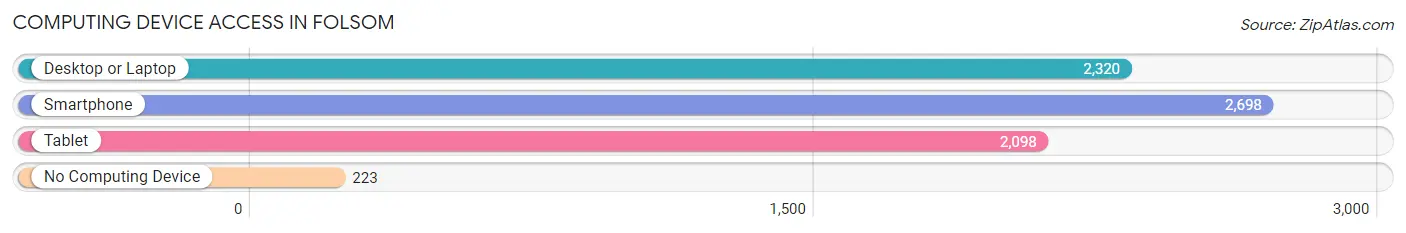
| Device Type | # Households | % Households |
| Desktop or Laptop | 2,320 | 75.0% |
| Smartphone | 2,698 | 87.2% |
| Tablet | 2,098 | 67.8% |
| No Computing Device | 223 | 7.2% |
| Total | 3,093 | 100.0% |
Internet Access in Folsom
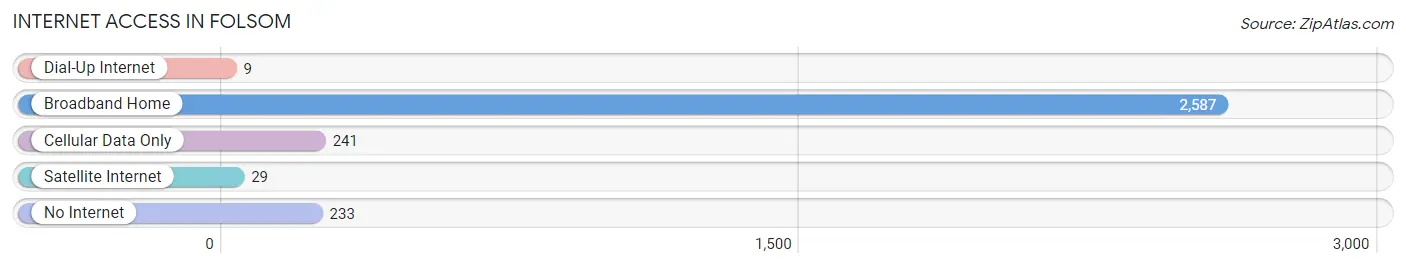
| Internet Type | # Households | % Households |
| Dial-Up Internet | 9 | 0.3% |
| Broadband Home | 2,587 | 83.6% |
| Cellular Data Only | 241 | 7.8% |
| Satellite Internet | 29 | 0.9% |
| No Internet | 233 | 7.5% |
| Total | 3,093 | 100.0% |
Folsom Summary
Folsom, Pennsylvania is a small borough located in Delaware County, Pennsylvania. It is located approximately 15 miles southwest of Philadelphia and is part of the Philadelphia metropolitan area. The population of Folsom was 4,845 at the 2010 census.
History
Folsom was founded in 1851 by William F. Folsom, a Philadelphia businessman. The town was originally known as Folsomville, but the name was changed to Folsom in 1872. Folsom was incorporated as a borough in 1876.
The town was originally a farming community, but it began to grow in the late 19th century with the development of the Pennsylvania Railroad. The railroad brought new industry to the area, including a paper mill, a brickyard, and a canning factory.
Geography
Folsom is located at 39°51'17" North, 75°14'45" West (39.854722, -75.245833). It is situated in the Delaware Valley, approximately 15 miles southwest of Philadelphia. The borough is bordered by Ridley Township to the north, Ridley Park to the east, and Nether Providence Township to the south and west.
The borough has a total area of 0.9 square miles, all of which is land. The borough is located in the Piedmont region of Pennsylvania, and is characterized by rolling hills and valleys.
Economy
Folsom's economy is largely based on its proximity to Philadelphia. The borough is home to several small businesses, including restaurants, retail stores, and professional services. The borough also has a number of industrial and manufacturing businesses, including a paper mill, a brickyard, and a canning factory.
Demographics
As of the 2010 census, the population of Folsom was 4,845. The racial makeup of the borough was 87.3% White, 8.2% African American, 0.5% Native American, 1.2% Asian, 0.1% Pacific Islander, 0.7% from other races, and 2.1% from two or more races. Hispanic or Latino of any race were 2.7% of the population.
The median household income in Folsom was $60,938, and the median family income was $71,917. The per capita income for the borough was $27,945. About 4.3% of families and 5.7% of the population were below the poverty line, including 7.2% of those under age 18 and 4.2% of those age 65 or over.
Common Questions
What is Per Capita Income in Folsom?
Per Capita income in Folsom is $40,266.
What is the Median Family Income in Folsom?
Median Family Income in Folsom is $114,432.
What is the Median Household income in Folsom?
Median Household Income in Folsom is $95,048.
What is Income or Wage Gap in Folsom?
Income or Wage Gap in Folsom is 36.0%.
Women in Folsom earn 64.0 cents for every dollar earned by a man.
What is Family Income Deficit in Folsom?
Family Income Deficit in Folsom is $7,875.
Families that are below poverty line in Folsom earn $7,875 less on average than the poverty threshold level.
What is Inequality or Gini Index in Folsom?
Inequality or Gini Index in Folsom is 0.38.
What is the Total Population of Folsom?
Total Population of Folsom is 8,535.
What is the Total Male Population of Folsom?
Total Male Population of Folsom is 4,065.
What is the Total Female Population of Folsom?
Total Female Population of Folsom is 4,470.
What is the Ratio of Males per 100 Females in Folsom?
There are 90.94 Males per 100 Females in Folsom.
What is the Ratio of Females per 100 Males in Folsom?
There are 109.96 Females per 100 Males in Folsom.
What is the Median Population Age in Folsom?
Median Population Age in Folsom is 37.5 Years.
What is the Average Family Size in Folsom
Average Family Size in Folsom is 3.3 People.
What is the Average Household Size in Folsom
Average Household Size in Folsom is 2.8 People.
How Large is the Labor Force in Folsom?
There are 4,531 People in the Labor Forcein in Folsom.
What is the Percentage of People in the Labor Force in Folsom?
71.0% of People are in the Labor Force in Folsom.
What is the Unemployment Rate in Folsom?
Unemployment Rate in Folsom is 2.0%.