Hermitage, PA Map & Demographics
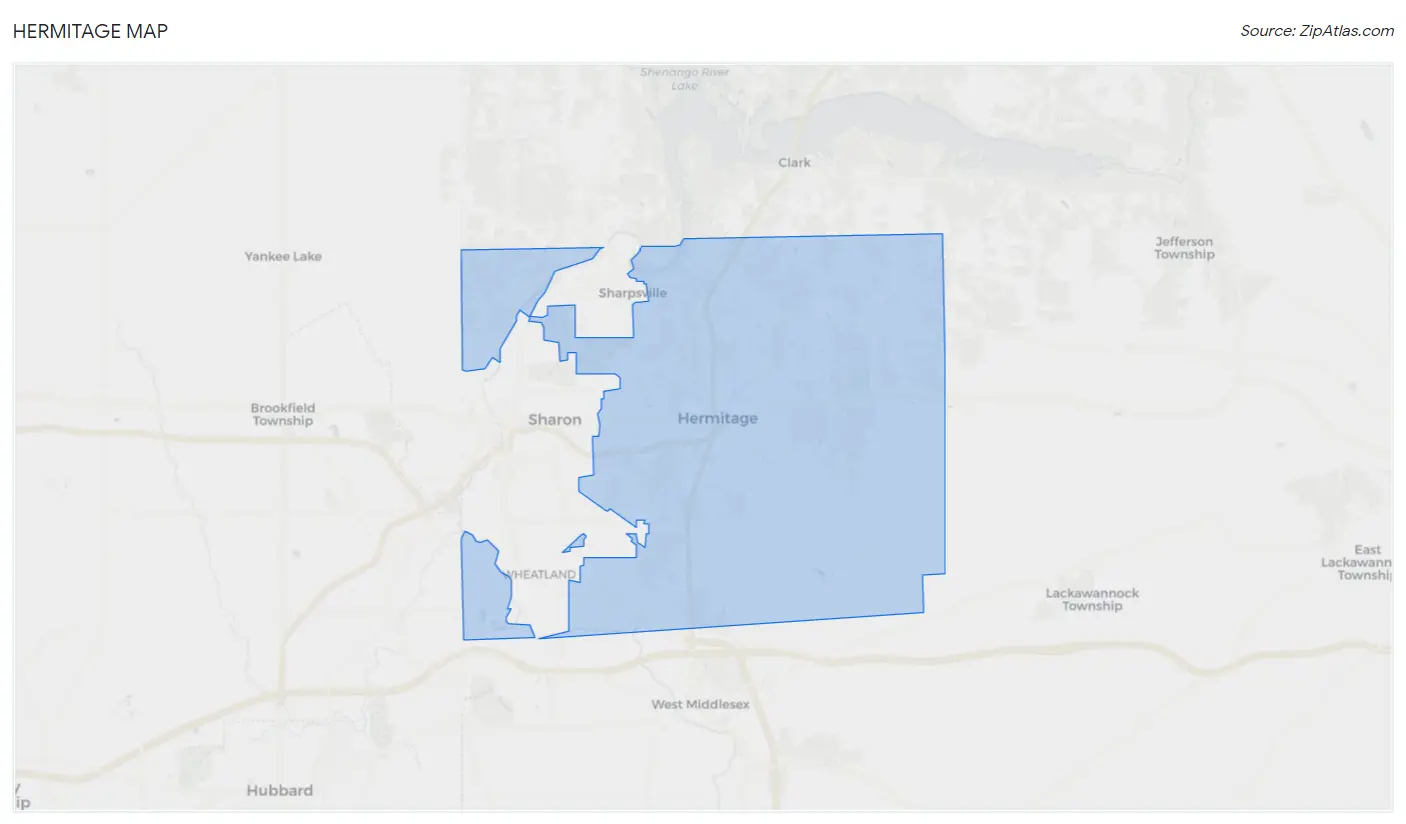
Hermitage Map
Hermitage Overview
$43,003
PER CAPITA INCOME
$88,644
AVG FAMILY INCOME
$66,922
AVG HOUSEHOLD INCOME
42.4%
WAGE / INCOME GAP [ % ]
57.6¢/ $1
WAGE / INCOME GAP [ $ ]
0.47
INEQUALITY / GINI INDEX
16,216
TOTAL POPULATION
7,903
MALE POPULATION
8,313
FEMALE POPULATION
95.07
MALES / 100 FEMALES
105.19
FEMALES / 100 MALES
49.2
MEDIAN AGE
2.7
AVG FAMILY SIZE
2.1
AVG HOUSEHOLD SIZE
7,575
LABOR FORCE [ PEOPLE ]
55.3%
PERCENT IN LABOR FORCE
5.1%
UNEMPLOYMENT RATE
Hermitage Zip Codes
Income in Hermitage
Income Overview in Hermitage
Per Capita Income in Hermitage is $43,003, while median incomes of families and households are $88,644 and $66,922 respectively.
| Characteristic | Number | Measure |
| Per Capita Income | 16,216 | $43,003 |
| Median Family Income | 4,633 | $88,644 |
| Mean Family Income | 4,633 | $113,540 |
| Median Household Income | 7,631 | $66,922 |
| Mean Household Income | 7,631 | $90,304 |
| Income Deficit | 4,633 | $0 |
| Wage / Income Gap (%) | 16,216 | 42.39% |
| Wage / Income Gap ($) | 16,216 | 57.61¢ per $1 |
| Gini / Inequality Index | 16,216 | 0.47 |
Earnings by Sex in Hermitage
Average Earnings in Hermitage are $45,743, $62,126 for men and $35,790 for women, a difference of 42.4%.
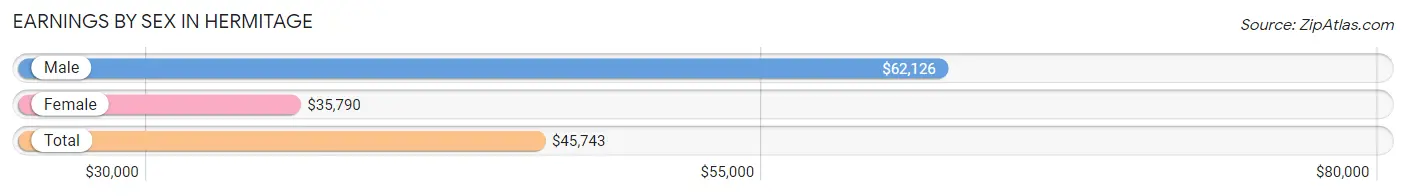
| Sex | Number | Average Earnings |
| Male | 3,913 (49.2%) | $62,126 |
| Female | 4,041 (50.8%) | $35,790 |
| Total | 7,954 (100.0%) | $45,743 |
Earnings by Sex by Income Bracket in Hermitage
The most common earnings brackets in Hermitage are $100,000+ for men (770 | 19.7%) and $75,000 to $99,999 for women (411 | 10.2%).
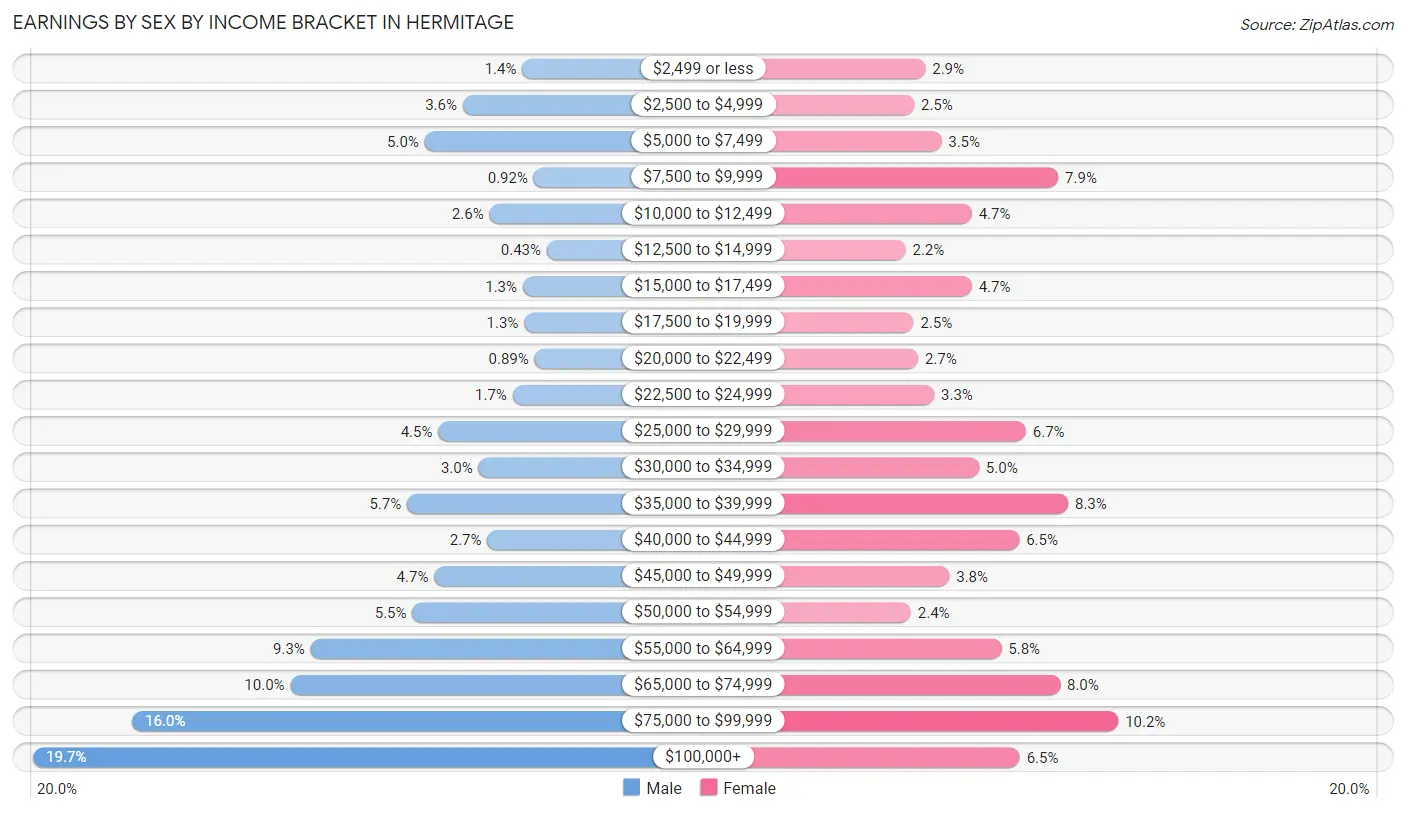
| Income | Male | Female |
| $2,499 or less | 53 (1.3%) | 119 (2.9%) |
| $2,500 to $4,999 | 140 (3.6%) | 102 (2.5%) |
| $5,000 to $7,499 | 196 (5.0%) | 143 (3.5%) |
| $7,500 to $9,999 | 36 (0.9%) | 320 (7.9%) |
| $10,000 to $12,499 | 101 (2.6%) | 189 (4.7%) |
| $12,500 to $14,999 | 17 (0.4%) | 89 (2.2%) |
| $15,000 to $17,499 | 52 (1.3%) | 189 (4.7%) |
| $17,500 to $19,999 | 50 (1.3%) | 101 (2.5%) |
| $20,000 to $22,499 | 35 (0.9%) | 108 (2.7%) |
| $22,500 to $24,999 | 67 (1.7%) | 132 (3.3%) |
| $25,000 to $29,999 | 176 (4.5%) | 271 (6.7%) |
| $30,000 to $34,999 | 117 (3.0%) | 200 (5.0%) |
| $35,000 to $39,999 | 222 (5.7%) | 335 (8.3%) |
| $40,000 to $44,999 | 104 (2.7%) | 261 (6.5%) |
| $45,000 to $49,999 | 182 (4.6%) | 155 (3.8%) |
| $50,000 to $54,999 | 214 (5.5%) | 97 (2.4%) |
| $55,000 to $64,999 | 363 (9.3%) | 234 (5.8%) |
| $65,000 to $74,999 | 393 (10.0%) | 323 (8.0%) |
| $75,000 to $99,999 | 625 (16.0%) | 411 (10.2%) |
| $100,000+ | 770 (19.7%) | 262 (6.5%) |
| Total | 3,913 (100.0%) | 4,041 (100.0%) |
Earnings by Sex by Educational Attainment in Hermitage
Average earnings in Hermitage are $65,379 for men and $38,456 for women, a difference of 41.2%. Men with an educational attainment of graduate degree enjoy the highest average annual earnings of $102,588, while those with high school diploma education earn the least with $42,150. Women with an educational attainment of graduate degree earn the most with the average annual earnings of $71,567, while those with less than high school education have the smallest earnings of $16,044.
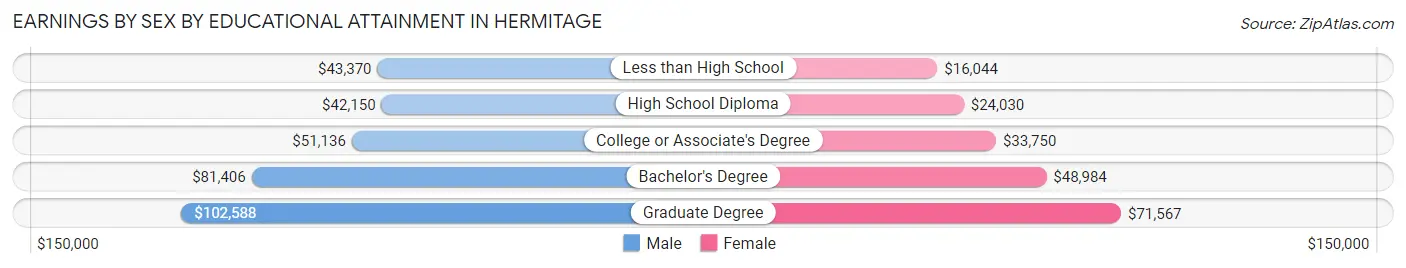
| Educational Attainment | Male Income | Female Income |
| Less than High School | $43,370 | $16,044 |
| High School Diploma | $42,150 | $24,030 |
| College or Associate's Degree | $51,136 | $33,750 |
| Bachelor's Degree | $81,406 | $48,984 |
| Graduate Degree | $102,588 | $71,567 |
| Total | $65,379 | $38,456 |
Family Income in Hermitage
Family Income Brackets in Hermitage
According to the Hermitage family income data, there are 1,015 families falling into the $100,000 to $149,999 income range, which is the most common income bracket and makes up 21.9% of all families. Conversely, the less than $10,000 income bracket is the least frequent group with only 74 families (1.6%) belonging to this category.
| Income Bracket | # Families | % Families |
| Less than $10,000 | 74 | 1.6% |
| $10,000 to $14,999 | 232 | 5.0% |
| $15,000 to $24,999 | 324 | 7.0% |
| $25,000 to $34,999 | 347 | 7.5% |
| $35,000 to $49,999 | 408 | 8.8% |
| $50,000 to $74,999 | 505 | 10.9% |
| $75,000 to $99,999 | 676 | 14.6% |
| $100,000 to $149,999 | 1,015 | 21.9% |
| $150,000 to $199,999 | 635 | 13.7% |
| $200,000+ | 422 | 9.1% |
Family Income by Famaliy Size in Hermitage
5-person families (236 | 5.1%) account for the highest median family income in Hermitage with $139,545 per family, while 2-person families (2,885 | 62.3%) have the highest median income of $35,828 per family member.
| Income Bracket | # Families | Median Income |
| 2-Person Families | 2,885 (62.3%) | $71,655 |
| 3-Person Families | 804 (17.3%) | $104,777 |
| 4-Person Families | 628 (13.6%) | $109,375 |
| 5-Person Families | 236 (5.1%) | $139,545 |
| 6-Person Families | 22 (0.5%) | $0 |
| 7+ Person Families | 58 (1.3%) | $0 |
| Total | 4,633 (100.0%) | $88,644 |
Family Income by Number of Earners in Hermitage
The median family income in Hermitage is $88,644, with families comprising 2 earners (1,827) having the highest median family income of $137,150, while families with 1 earner (1,395) have the lowest median family income of $44,698, accounting for 39.4% and 30.1% of families, respectively.
| Number of Earners | # Families | Median Income |
| No Earners | 1,045 (22.6%) | $48,208 |
| 1 Earner | 1,395 (30.1%) | $44,698 |
| 2 Earners | 1,827 (39.4%) | $137,150 |
| 3+ Earners | 366 (7.9%) | $131,525 |
| Total | 4,633 (100.0%) | $88,644 |
Household Income in Hermitage
Household Income Brackets in Hermitage
With 1,419 households falling in the category, the $100,000 to $149,999 income range is the most frequent in Hermitage, accounting for 18.6% of all households. In contrast, only 351 households (4.6%) fall into the less than $10,000 income bracket, making it the least populous group.
| Income Bracket | # Households | % Households |
| Less than $10,000 | 351 | 4.6% |
| $10,000 to $14,999 | 366 | 4.8% |
| $15,000 to $24,999 | 549 | 7.2% |
| $25,000 to $34,999 | 962 | 12.6% |
| $35,000 to $49,999 | 832 | 10.9% |
| $50,000 to $74,999 | 1,068 | 14.0% |
| $75,000 to $99,999 | 962 | 12.6% |
| $100,000 to $149,999 | 1,419 | 18.6% |
| $150,000 to $199,999 | 672 | 8.8% |
| $200,000+ | 443 | 5.8% |
Household Income by Householder Age in Hermitage
The median household income in Hermitage is $66,922, with the highest median household income of $89,049 found in the 45 to 64 years age bracket for the primary householder. A total of 2,703 households (35.4%) fall into this category. Meanwhile, the 15 to 24 years age bracket for the primary householder has the lowest median household income of $29,075, with 177 households (2.3%) in this group.

| Income Bracket | # Households | Median Income |
| 15 to 24 Years | 177 (2.3%) | $29,075 |
| 25 to 44 Years | 1,895 (24.8%) | $85,133 |
| 45 to 64 Years | 2,703 (35.4%) | $89,049 |
| 65+ Years | 2,856 (37.4%) | $48,902 |
| Total | 7,631 (100.0%) | $66,922 |
Poverty in Hermitage
Income Below Poverty by Sex and Age in Hermitage
With 9.2% poverty level for males and 15.4% for females among the residents of Hermitage, 12 to 14 year old males and 6 to 11 year old females are the most vulnerable to poverty, with 89 males (28.2%) and 205 females (47.7%) in their respective age groups living below the poverty level.
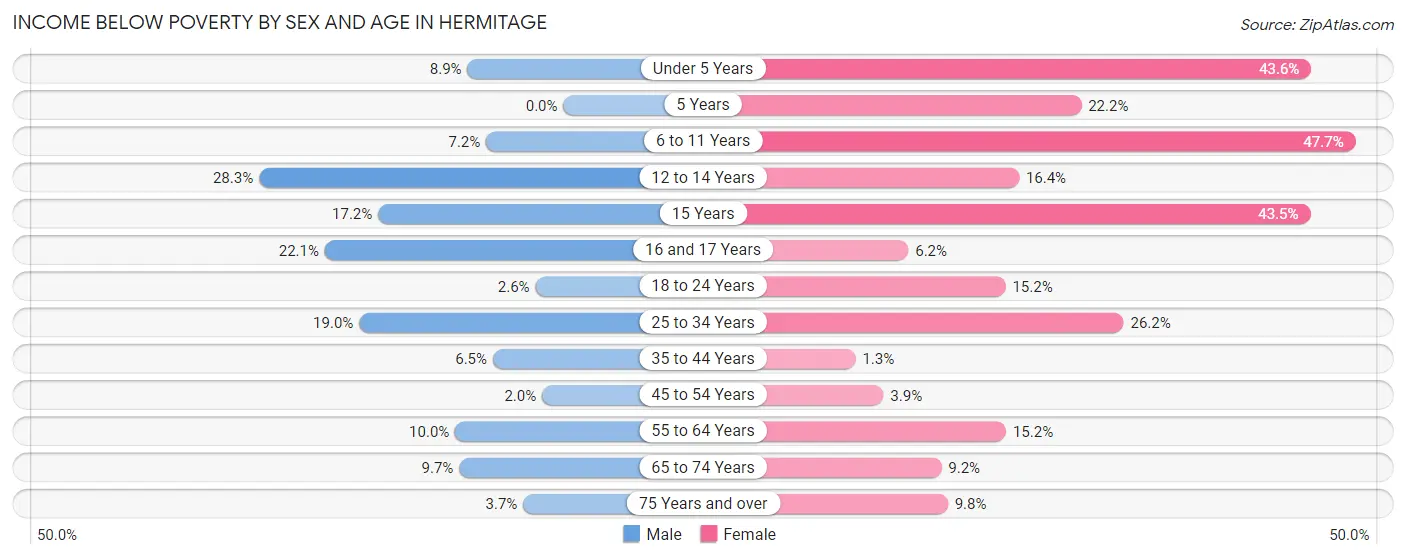
| Age Bracket | Male | Female |
| Under 5 Years | 25 (8.9%) | 142 (43.6%) |
| 5 Years | 0 (0.0%) | 6 (22.2%) |
| 6 to 11 Years | 36 (7.2%) | 205 (47.7%) |
| 12 to 14 Years | 89 (28.2%) | 49 (16.4%) |
| 15 Years | 22 (17.2%) | 60 (43.5%) |
| 16 and 17 Years | 31 (22.1%) | 15 (6.2%) |
| 18 to 24 Years | 13 (2.6%) | 53 (15.2%) |
| 25 to 34 Years | 162 (19.0%) | 261 (26.2%) |
| 35 to 44 Years | 60 (6.5%) | 9 (1.3%) |
| 45 to 54 Years | 18 (2.0%) | 42 (3.9%) |
| 55 to 64 Years | 133 (10.0%) | 193 (15.2%) |
| 65 to 74 Years | 91 (9.7%) | 101 (9.2%) |
| 75 Years and over | 37 (3.7%) | 113 (9.8%) |
| Total | 717 (9.2%) | 1,249 (15.4%) |
Income Above Poverty by Sex and Age in Hermitage
According to the poverty statistics in Hermitage, males aged 5 years and females aged 35 to 44 years are the age groups that are most secure financially, with 100.0% of males and 98.7% of females in these age groups living above the poverty line.
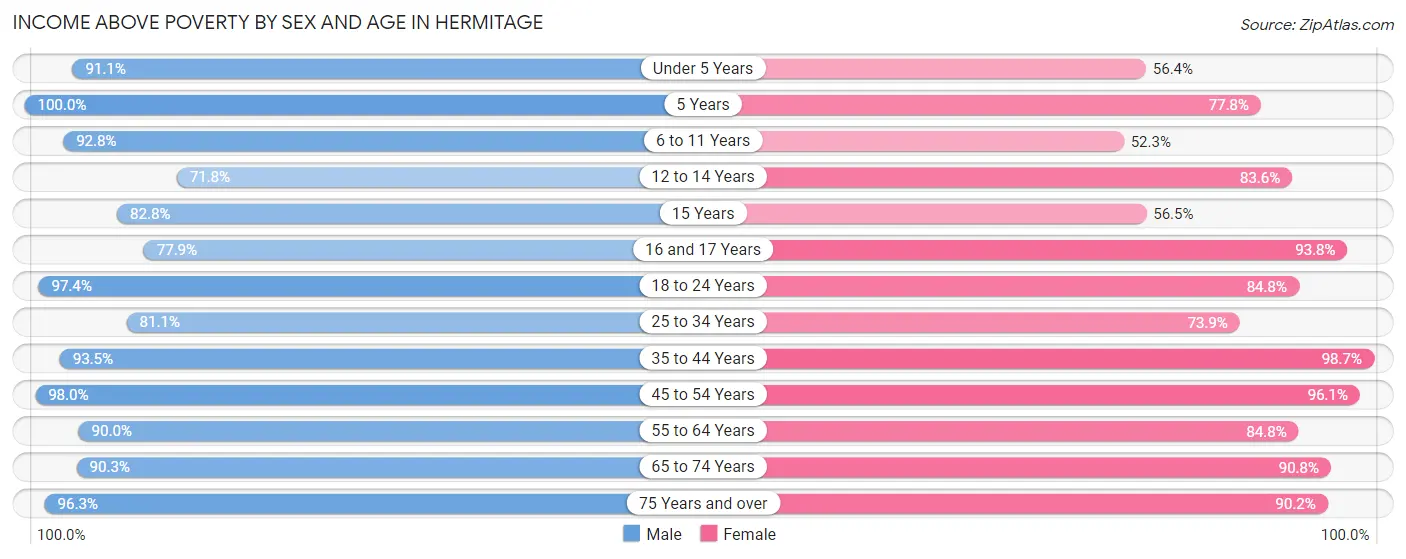
| Age Bracket | Male | Female |
| Under 5 Years | 256 (91.1%) | 184 (56.4%) |
| 5 Years | 14 (100.0%) | 21 (77.8%) |
| 6 to 11 Years | 466 (92.8%) | 225 (52.3%) |
| 12 to 14 Years | 226 (71.8%) | 249 (83.6%) |
| 15 Years | 106 (82.8%) | 78 (56.5%) |
| 16 and 17 Years | 109 (77.9%) | 228 (93.8%) |
| 18 to 24 Years | 489 (97.4%) | 296 (84.8%) |
| 25 to 34 Years | 693 (81.0%) | 737 (73.9%) |
| 35 to 44 Years | 857 (93.5%) | 702 (98.7%) |
| 45 to 54 Years | 893 (98.0%) | 1,046 (96.1%) |
| 55 to 64 Years | 1,192 (90.0%) | 1,073 (84.8%) |
| 65 to 74 Years | 850 (90.3%) | 992 (90.8%) |
| 75 Years and over | 954 (96.3%) | 1,036 (90.2%) |
| Total | 7,105 (90.8%) | 6,867 (84.6%) |
Income Below Poverty Among Married-Couple Families in Hermitage
The poverty statistics for married-couple families in Hermitage show that 5.2% or 192 of the total 3,702 families live below the poverty line. Families with 5 or more children have the highest poverty rate of 65.5%, comprising of 38 families. On the other hand, families with 3 or 4 children have the lowest poverty rate of 0.0%, which includes 0 families.
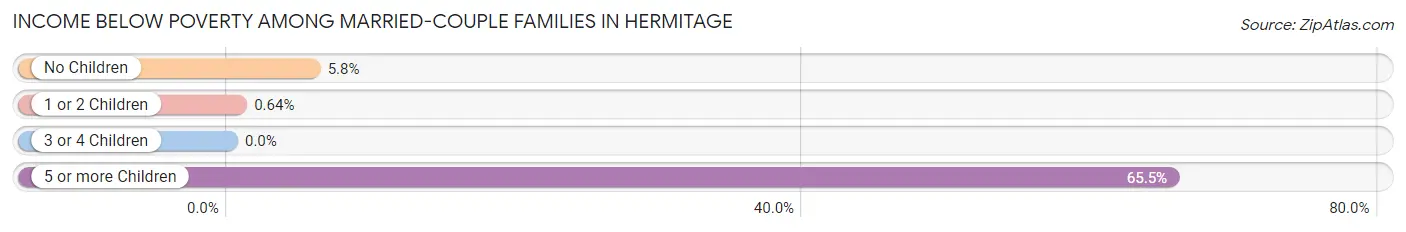
| Children | Above Poverty | Below Poverty |
| No Children | 2,420 (94.2%) | 148 (5.8%) |
| 1 or 2 Children | 928 (99.4%) | 6 (0.6%) |
| 3 or 4 Children | 142 (100.0%) | 0 (0.0%) |
| 5 or more Children | 20 (34.5%) | 38 (65.5%) |
| Total | 3,510 (94.8%) | 192 (5.2%) |
Income Below Poverty Among Single-Parent Households in Hermitage
According to the poverty data in Hermitage, 9.0% or 19 single-father households and 41.4% or 298 single-mother households are living below the poverty line. Among single-father households, those with 1 or 2 children have the highest poverty rate, with 19 households (12.4%) experiencing poverty. Likewise, among single-mother households, those with 3 or 4 children have the highest poverty rate, with 89 households (100.0%) falling below the poverty line.
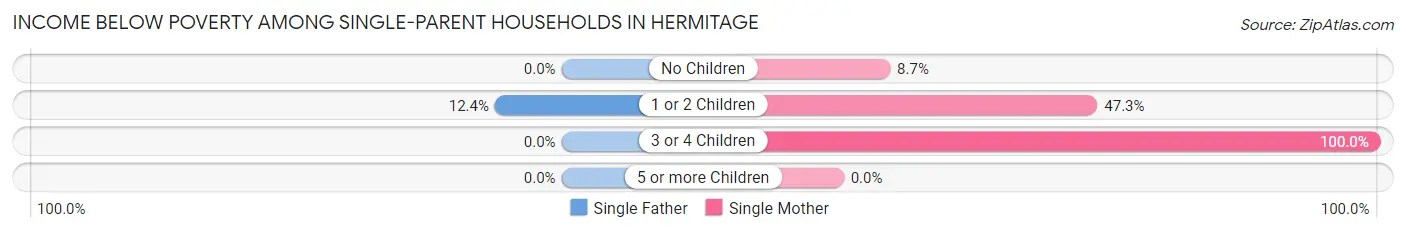
| Children | Single Father | Single Mother |
| No Children | 0 (0.0%) | 20 (8.7%) |
| 1 or 2 Children | 19 (12.4%) | 189 (47.2%) |
| 3 or 4 Children | 0 (0.0%) | 89 (100.0%) |
| 5 or more Children | 0 (0.0%) | 0 (0.0%) |
| Total | 19 (9.0%) | 298 (41.4%) |
Income Below Poverty Among Married-Couple vs Single-Parent Households in Hermitage
The poverty data for Hermitage shows that 192 of the married-couple family households (5.2%) and 317 of the single-parent households (34.1%) are living below the poverty level. Within the married-couple family households, those with 5 or more children have the highest poverty rate, with 38 households (65.5%) falling below the poverty line. Among the single-parent households, those with 3 or 4 children have the highest poverty rate, with 89 household (100.0%) living below poverty.
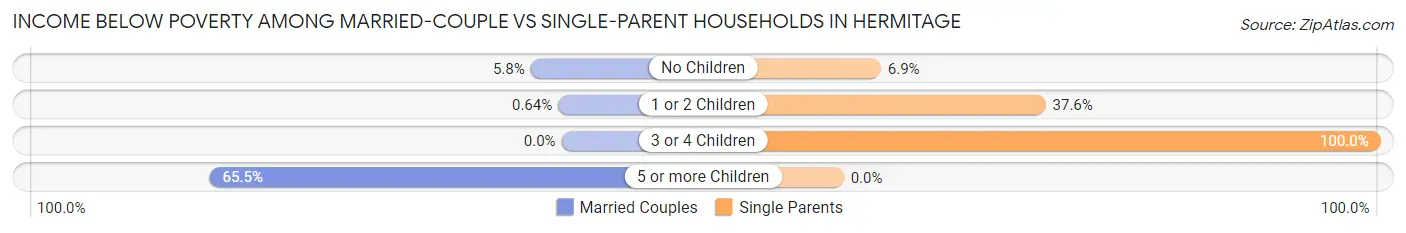
| Children | Married-Couple Families | Single-Parent Households |
| No Children | 148 (5.8%) | 20 (6.9%) |
| 1 or 2 Children | 6 (0.6%) | 208 (37.6%) |
| 3 or 4 Children | 0 (0.0%) | 89 (100.0%) |
| 5 or more Children | 38 (65.5%) | 0 (0.0%) |
| Total | 192 (5.2%) | 317 (34.1%) |
Race in Hermitage
The most populous races in Hermitage are White / Caucasian (14,280 | 88.1%), Black / African American (806 | 5.0%), and Two or more Races (660 | 4.1%).
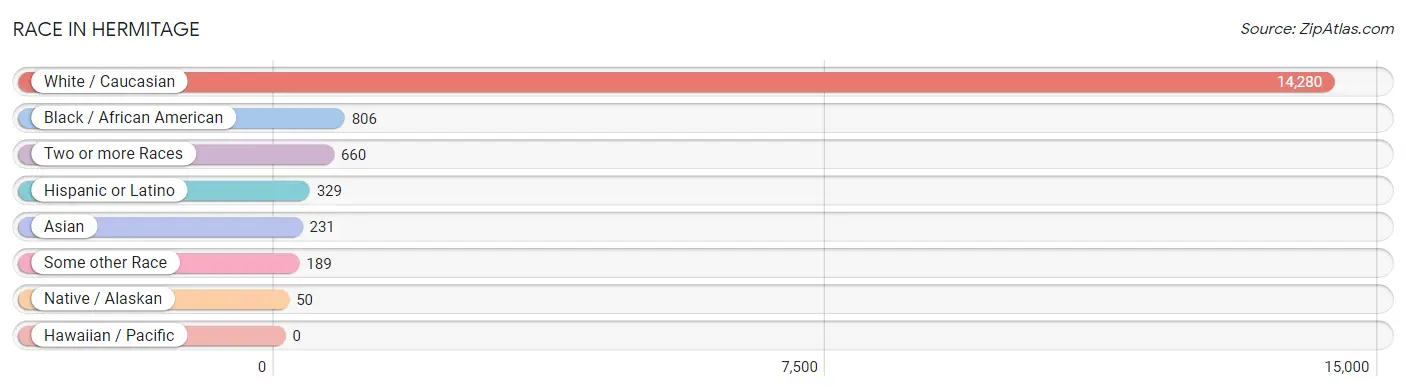
| Race | # Population | % Population |
| Asian | 231 | 1.4% |
| Black / African American | 806 | 5.0% |
| Hawaiian / Pacific | 0 | 0.0% |
| Hispanic or Latino | 329 | 2.0% |
| Native / Alaskan | 50 | 0.3% |
| White / Caucasian | 14,280 | 88.1% |
| Two or more Races | 660 | 4.1% |
| Some other Race | 189 | 1.2% |
| Total | 16,216 | 100.0% |
Ancestry in Hermitage
The most populous ancestries reported in Hermitage are German (3,377 | 20.8%), Italian (2,725 | 16.8%), Irish (1,997 | 12.3%), English (1,385 | 8.5%), and Polish (1,328 | 8.2%), together accounting for 66.7% of all Hermitage residents.
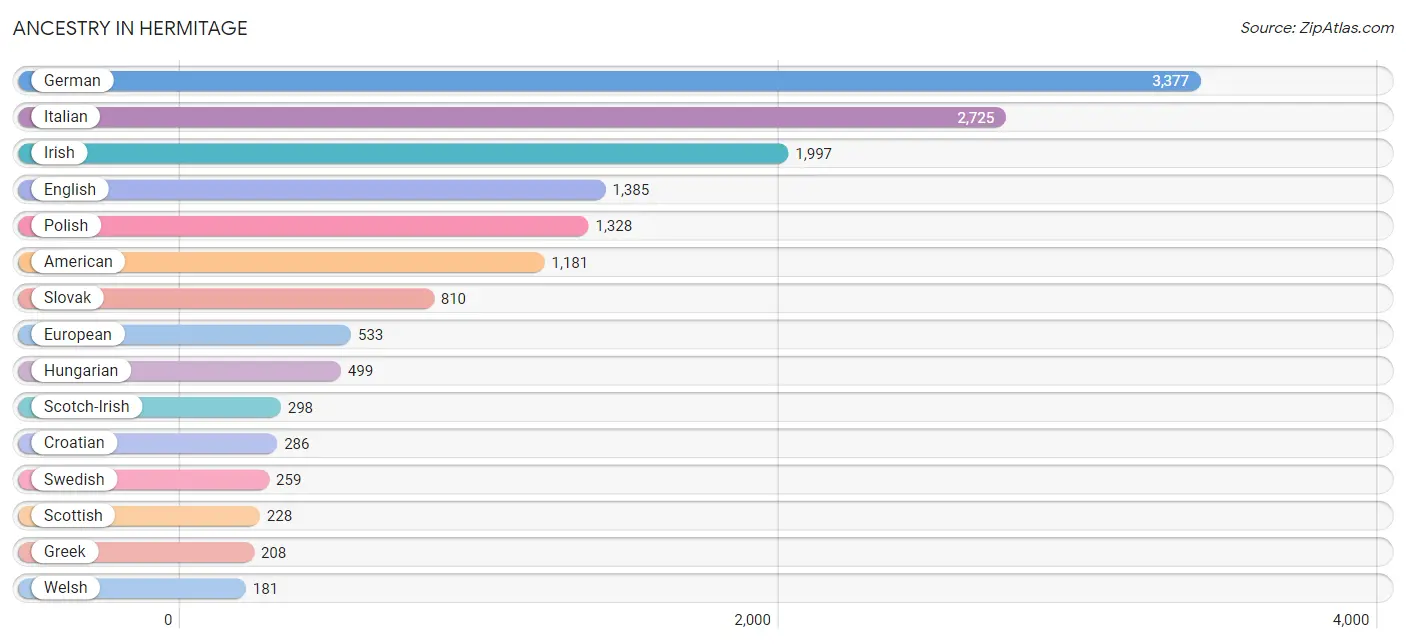
| Ancestry | # Population | % Population |
| African | 34 | 0.2% |
| American | 1,181 | 7.3% |
| Arab | 58 | 0.4% |
| Austrian | 93 | 0.6% |
| Belgian | 30 | 0.2% |
| Bhutanese | 35 | 0.2% |
| British | 73 | 0.4% |
| Central American | 45 | 0.3% |
| Central American Indian | 23 | 0.1% |
| Croatian | 286 | 1.8% |
| Czech | 48 | 0.3% |
| Czechoslovakian | 17 | 0.1% |
| Danish | 9 | 0.1% |
| Delaware | 5 | 0.0% |
| Dominican | 57 | 0.4% |
| Dutch | 176 | 1.1% |
| Eastern European | 55 | 0.3% |
| English | 1,385 | 8.5% |
| European | 533 | 3.3% |
| Filipino | 8 | 0.1% |
| Finnish | 19 | 0.1% |
| French | 160 | 1.0% |
| French Canadian | 42 | 0.3% |
| German | 3,377 | 20.8% |
| Greek | 208 | 1.3% |
| Guatemalan | 45 | 0.3% |
| Hungarian | 499 | 3.1% |
| Indian (Asian) | 114 | 0.7% |
| Iranian | 17 | 0.1% |
| Irish | 1,997 | 12.3% |
| Iroquois | 33 | 0.2% |
| Italian | 2,725 | 16.8% |
| Korean | 44 | 0.3% |
| Laotian | 21 | 0.1% |
| Latvian | 31 | 0.2% |
| Lebanese | 25 | 0.2% |
| Mexican | 91 | 0.6% |
| Moroccan | 3 | 0.0% |
| Norwegian | 17 | 0.1% |
| Pakistani | 26 | 0.2% |
| Polish | 1,328 | 8.2% |
| Puerto Rican | 121 | 0.7% |
| Romanian | 126 | 0.8% |
| Russian | 144 | 0.9% |
| Scandinavian | 44 | 0.3% |
| Scotch-Irish | 298 | 1.8% |
| Scottish | 228 | 1.4% |
| Senegalese | 4 | 0.0% |
| Serbian | 118 | 0.7% |
| Sioux | 43 | 0.3% |
| Slavic | 21 | 0.1% |
| Slovak | 810 | 5.0% |
| Slovene | 43 | 0.3% |
| Spaniard | 2 | 0.0% |
| Spanish | 12 | 0.1% |
| Sri Lankan | 39 | 0.2% |
| Subsaharan African | 34 | 0.2% |
| Swedish | 259 | 1.6% |
| Swiss | 5 | 0.0% |
| Syrian | 30 | 0.2% |
| Ukrainian | 41 | 0.3% |
| Welsh | 181 | 1.1% |
| Yugoslavian | 18 | 0.1% | View All 63 Rows |
Immigrants in Hermitage
The most numerous immigrant groups reported in Hermitage came from Asia (221 | 1.4%), South Eastern Asia (120 | 0.7%), Europe (105 | 0.6%), Latin America (101 | 0.6%), and China (88 | 0.5%), together accounting for 3.9% of all Hermitage residents.
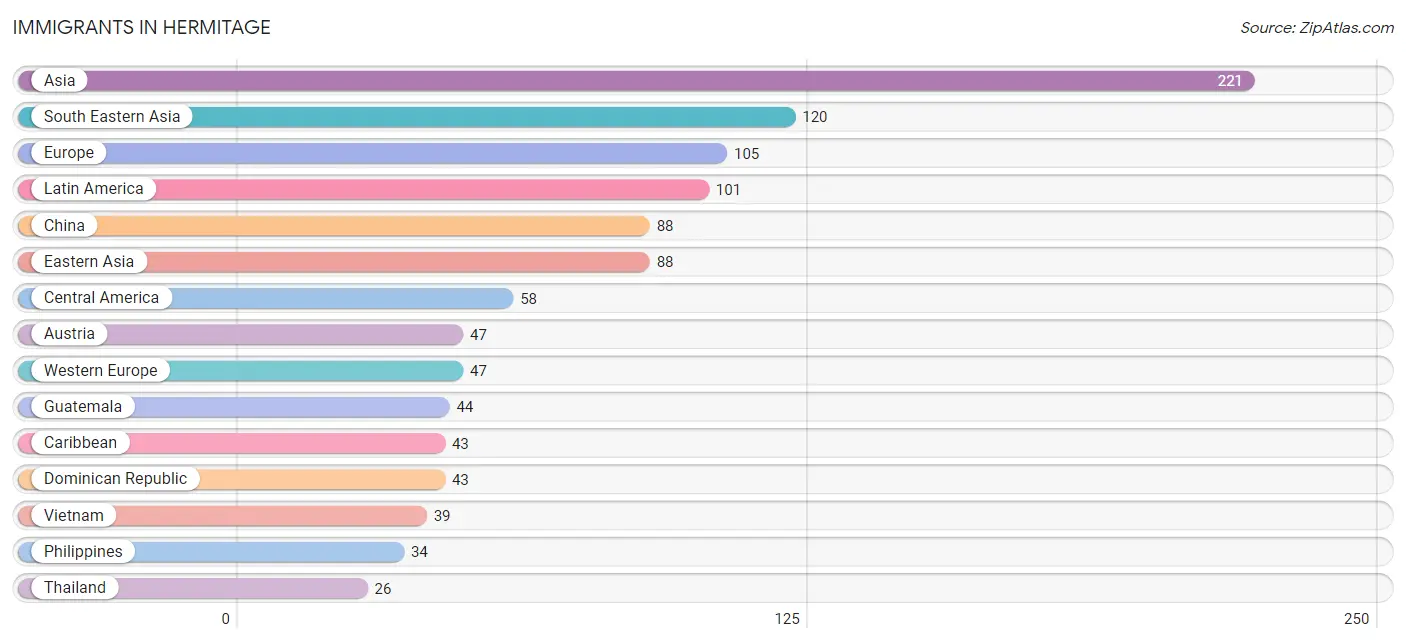
| Immigration Origin | # Population | % Population |
| Africa | 4 | 0.0% |
| Asia | 221 | 1.4% |
| Austria | 47 | 0.3% |
| Canada | 9 | 0.1% |
| Caribbean | 43 | 0.3% |
| Central America | 58 | 0.4% |
| China | 88 | 0.5% |
| Costa Rica | 14 | 0.1% |
| Dominican Republic | 43 | 0.3% |
| Eastern Asia | 88 | 0.5% |
| Eastern Europe | 21 | 0.1% |
| Europe | 105 | 0.6% |
| Greece | 13 | 0.1% |
| Guatemala | 44 | 0.3% |
| Indonesia | 21 | 0.1% |
| Ireland | 16 | 0.1% |
| Italy | 6 | 0.0% |
| Latin America | 101 | 0.6% |
| Northern Europe | 18 | 0.1% |
| Pakistan | 13 | 0.1% |
| Philippines | 34 | 0.2% |
| Poland | 21 | 0.1% |
| Scotland | 2 | 0.0% |
| Senegal | 4 | 0.0% |
| South Central Asia | 13 | 0.1% |
| South Eastern Asia | 120 | 0.7% |
| Southern Europe | 19 | 0.1% |
| Taiwan | 20 | 0.1% |
| Thailand | 26 | 0.2% |
| Vietnam | 39 | 0.2% |
| Western Africa | 4 | 0.0% |
| Western Europe | 47 | 0.3% | View All 32 Rows |
Sex and Age in Hermitage
Sex and Age in Hermitage
The most populous age groups in Hermitage are 55 to 59 Years (694 | 8.8%) for men and 65 to 69 Years (697 | 8.4%) for women.
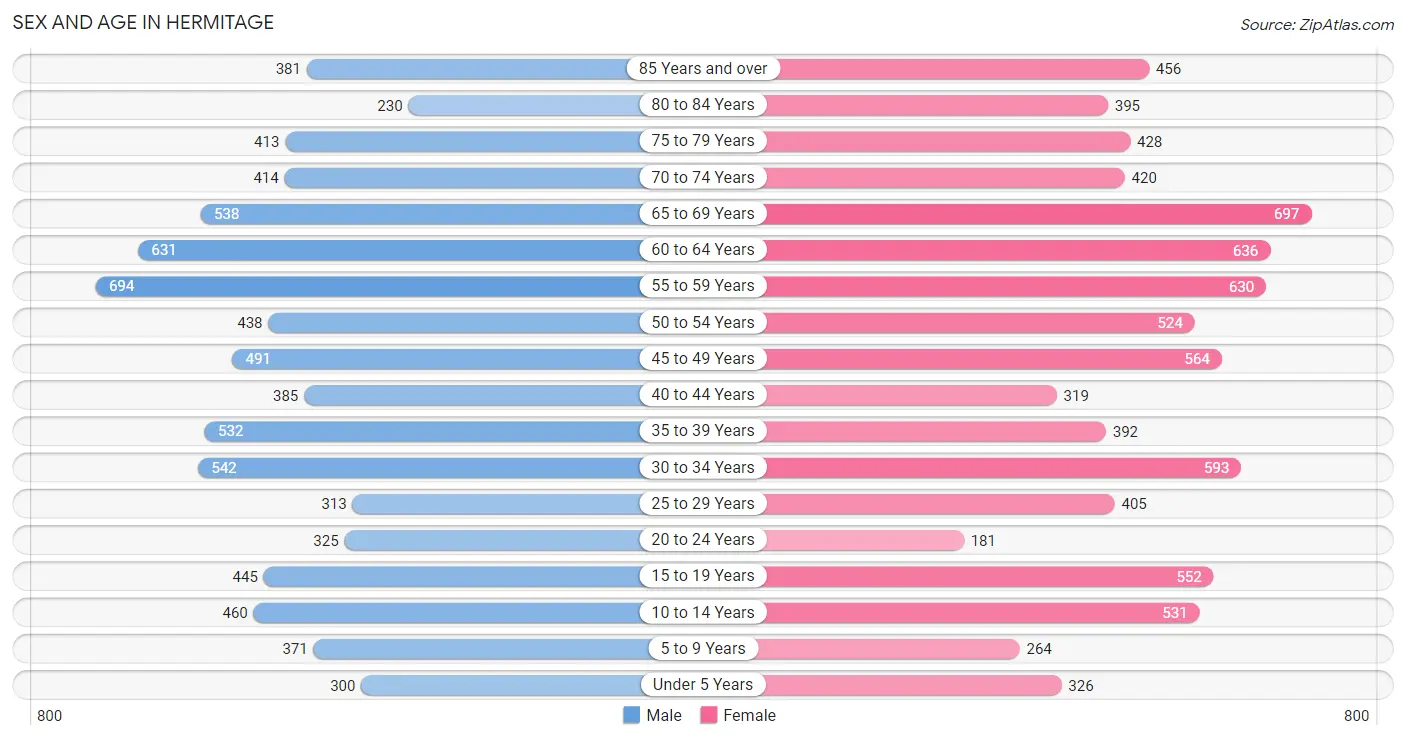
| Age Bracket | Male | Female |
| Under 5 Years | 300 (3.8%) | 326 (3.9%) |
| 5 to 9 Years | 371 (4.7%) | 264 (3.2%) |
| 10 to 14 Years | 460 (5.8%) | 531 (6.4%) |
| 15 to 19 Years | 445 (5.6%) | 552 (6.6%) |
| 20 to 24 Years | 325 (4.1%) | 181 (2.2%) |
| 25 to 29 Years | 313 (4.0%) | 405 (4.9%) |
| 30 to 34 Years | 542 (6.9%) | 593 (7.1%) |
| 35 to 39 Years | 532 (6.7%) | 392 (4.7%) |
| 40 to 44 Years | 385 (4.9%) | 319 (3.8%) |
| 45 to 49 Years | 491 (6.2%) | 564 (6.8%) |
| 50 to 54 Years | 438 (5.5%) | 524 (6.3%) |
| 55 to 59 Years | 694 (8.8%) | 630 (7.6%) |
| 60 to 64 Years | 631 (8.0%) | 636 (7.6%) |
| 65 to 69 Years | 538 (6.8%) | 697 (8.4%) |
| 70 to 74 Years | 414 (5.2%) | 420 (5.1%) |
| 75 to 79 Years | 413 (5.2%) | 428 (5.1%) |
| 80 to 84 Years | 230 (2.9%) | 395 (4.8%) |
| 85 Years and over | 381 (4.8%) | 456 (5.5%) |
| Total | 7,903 (100.0%) | 8,313 (100.0%) |
Families and Households in Hermitage
Median Family Size in Hermitage
The median family size in Hermitage is 2.68 persons per family, with married-couple families (3,702 | 79.9%) accounting for the largest median family size of 2.75 persons per family. On the other hand, single male/father families (211 | 4.5%) represent the smallest median family size with 2.35 persons per family.
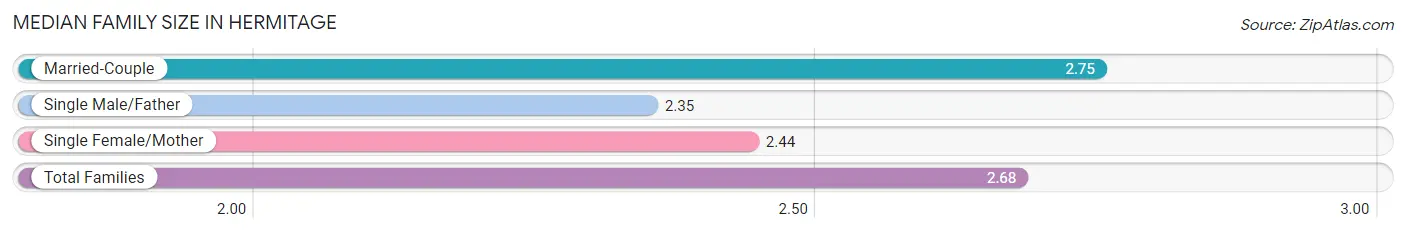
| Family Type | # Families | Family Size |
| Married-Couple | 3,702 (79.9%) | 2.75 |
| Single Male/Father | 211 (4.5%) | 2.35 |
| Single Female/Mother | 720 (15.5%) | 2.44 |
| Total Families | 4,633 (100.0%) | 2.68 |
Median Household Size in Hermitage
The median household size in Hermitage is 2.09 persons per household, with single male/father households (211 | 2.8%) accounting for the largest median household size of 2.82 persons per household. non-family households (2,998 | 39.3%) represent the smallest median household size with 1.05 persons per household.
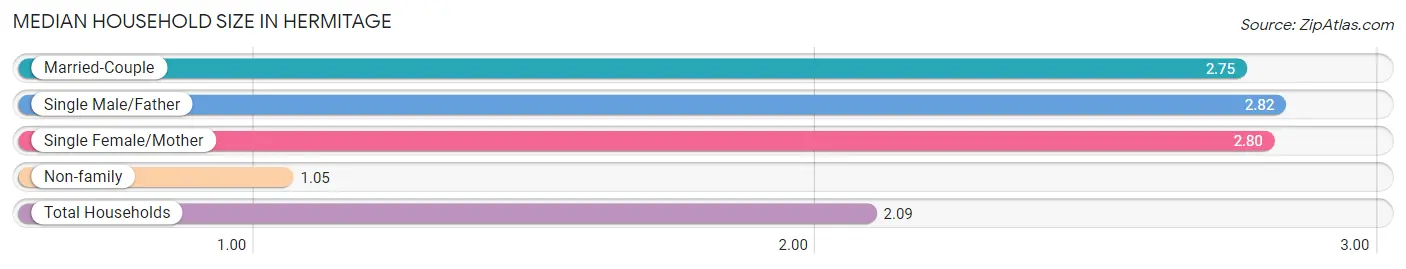
| Household Type | # Households | Household Size |
| Married-Couple | 3,702 (48.5%) | 2.75 |
| Single Male/Father | 211 (2.8%) | 2.82 |
| Single Female/Mother | 720 (9.4%) | 2.80 |
| Non-family | 2,998 (39.3%) | 1.05 |
| Total Households | 7,631 (100.0%) | 2.09 |
Household Size by Marriage Status in Hermitage
Out of a total of 7,631 households in Hermitage, 4,633 (60.7%) are family households, while 2,998 (39.3%) are nonfamily households. The most numerous type of family households are 2-person households, comprising 2,729, and the most common type of nonfamily households are 1-person households, comprising 2,834.
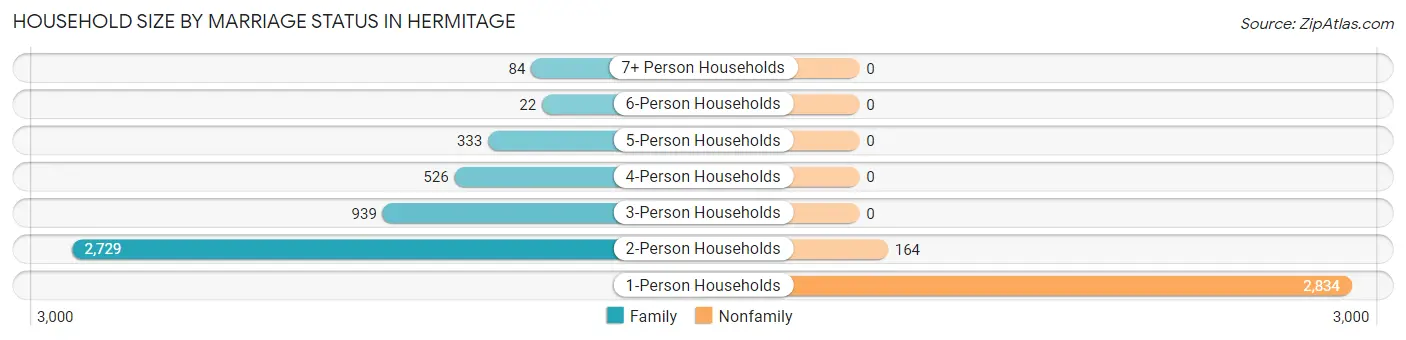
| Household Size | Family Households | Nonfamily Households |
| 1-Person Households | - | 2,834 (37.1%) |
| 2-Person Households | 2,729 (35.8%) | 164 (2.1%) |
| 3-Person Households | 939 (12.3%) | 0 (0.0%) |
| 4-Person Households | 526 (6.9%) | 0 (0.0%) |
| 5-Person Households | 333 (4.4%) | 0 (0.0%) |
| 6-Person Households | 22 (0.3%) | 0 (0.0%) |
| 7+ Person Households | 84 (1.1%) | 0 (0.0%) |
| Total | 4,633 (60.7%) | 2,998 (39.3%) |
Female Fertility in Hermitage
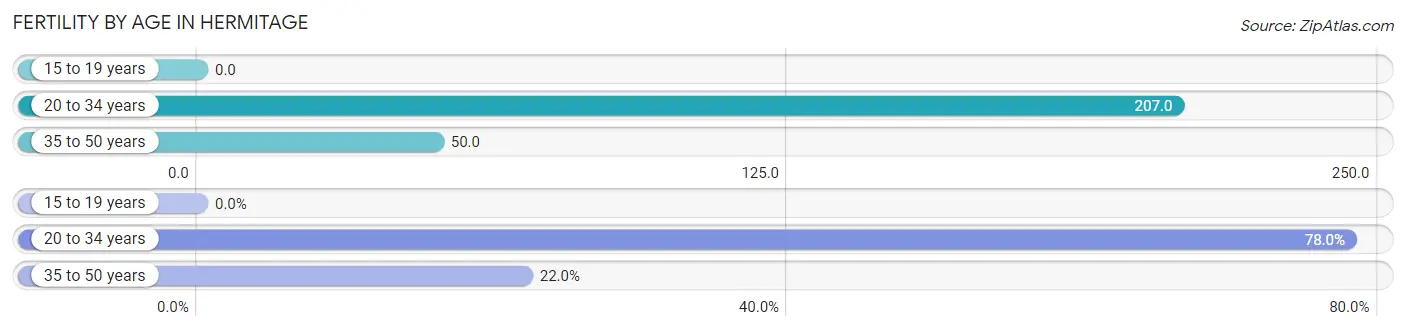
Fertility by Age in Hermitage
Average fertility rate in Hermitage is 101.0 births per 1,000 women. Women in the age bracket of 20 to 34 years have the highest fertility rate with 207.0 births per 1,000 women. Women in the age bracket of 20 to 34 years acount for 78.0% of all women with births.
| Age Bracket | Women with Births | Births / 1,000 Women |
| 15 to 19 years | 0 (0.0%) | 0.0 |
| 20 to 34 years | 244 (78.0%) | 207.0 |
| 35 to 50 years | 69 (22.0%) | 50.0 |
| Total | 313 (100.0%) | 101.0 |
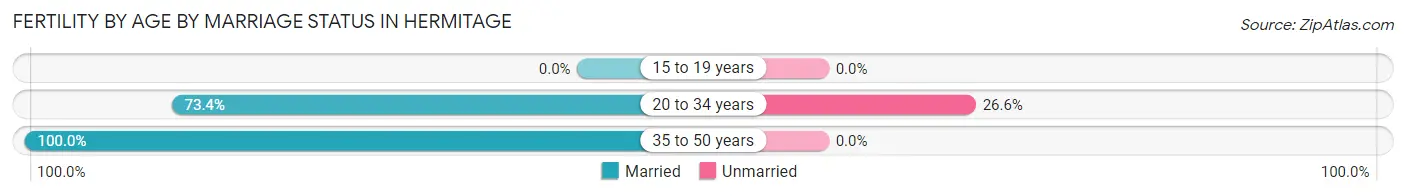
Fertility by Age by Marriage Status in Hermitage
79.2% of women with births (313) in Hermitage are married. The highest percentage of unmarried women with births falls into 20 to 34 years age bracket with 26.6% of them unmarried at the time of birth, while the lowest percentage of unmarried women with births belong to 35 to 50 years age bracket with 0.0% of them unmarried.
| Age Bracket | Married | Unmarried |
| 15 to 19 years | 0 (0.0%) | 0 (0.0%) |
| 20 to 34 years | 179 (73.4%) | 65 (26.6%) |
| 35 to 50 years | 69 (100.0%) | 0 (0.0%) |
| Total | 248 (79.2%) | 65 (20.8%) |
Fertility by Education in Hermitage
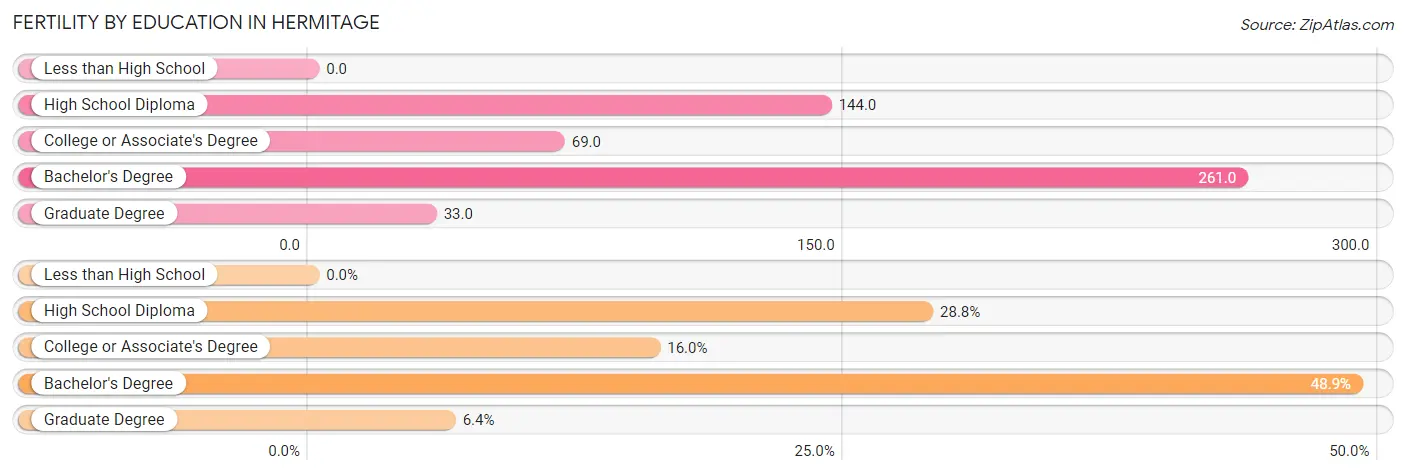
| Educational Attainment | Women with Births | Births / 1,000 Women |
| Less than High School | 0 (0.0%) | 0.0 |
| High School Diploma | 90 (28.7%) | 144.0 |
| College or Associate's Degree | 50 (16.0%) | 69.0 |
| Bachelor's Degree | 153 (48.9%) | 261.0 |
| Graduate Degree | 20 (6.4%) | 33.0 |
| Total | 313 (100.0%) | 101.0 |
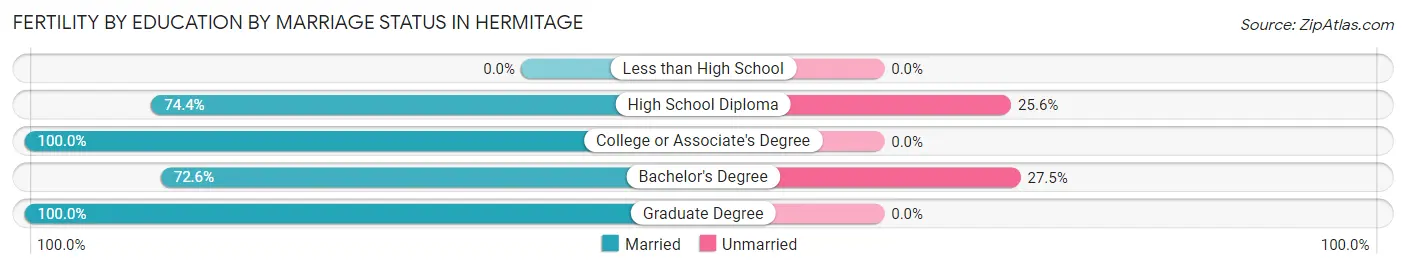
Fertility by Education by Marriage Status in Hermitage
20.8% of women with births in Hermitage are unmarried. Women with the educational attainment of college or associate's degree are most likely to be married with 100.0% of them married at childbirth, while women with the educational attainment of bachelor's degree are least likely to be married with 27.5% of them unmarried at childbirth.
| Educational Attainment | Married | Unmarried |
| Less than High School | 0 (0.0%) | 0 (0.0%) |
| High School Diploma | 67 (74.4%) | 23 (25.6%) |
| College or Associate's Degree | 50 (100.0%) | 0 (0.0%) |
| Bachelor's Degree | 111 (72.6%) | 42 (27.5%) |
| Graduate Degree | 20 (100.0%) | 0 (0.0%) |
| Total | 248 (79.2%) | 65 (20.8%) |
Employment Characteristics in Hermitage
Employment by Class of Employer in Hermitage
Among the 7,083 employed individuals in Hermitage, private company employees (4,792 | 67.6%), not-for-profit organizations (894 | 12.6%), and local government employees (551 | 7.8%) make up the most common classes of employment.
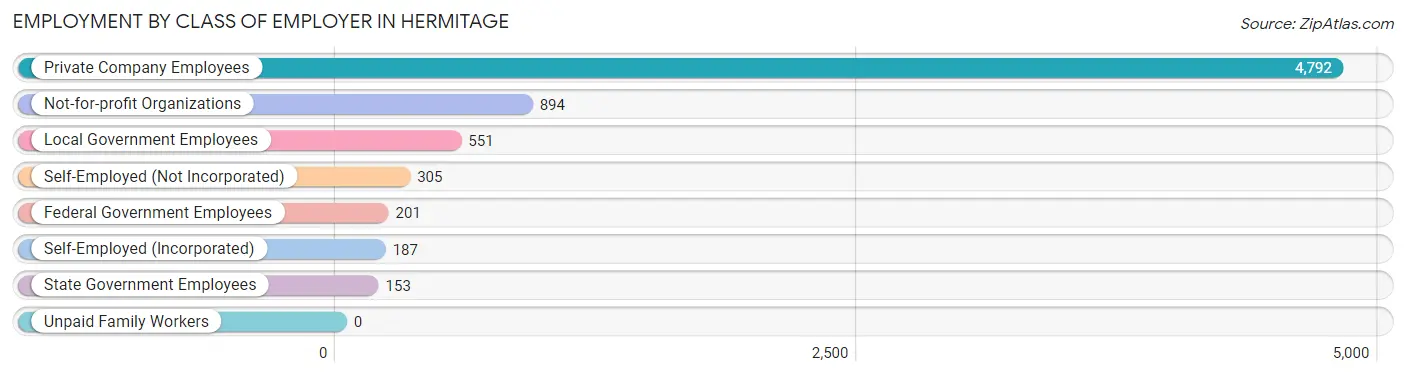
| Employer Class | # Employees | % Employees |
| Private Company Employees | 4,792 | 67.6% |
| Self-Employed (Incorporated) | 187 | 2.6% |
| Self-Employed (Not Incorporated) | 305 | 4.3% |
| Not-for-profit Organizations | 894 | 12.6% |
| Local Government Employees | 551 | 7.8% |
| State Government Employees | 153 | 2.2% |
| Federal Government Employees | 201 | 2.8% |
| Unpaid Family Workers | 0 | 0.0% |
| Total | 7,083 | 100.0% |
Employment Status by Age in Hermitage
According to the labor force statistics for Hermitage, out of the total population over 16 years of age (13,698), 55.3% or 7,575 individuals are in the labor force, with 5.1% or 386 of them unemployed. The age group with the highest labor force participation rate is 30 to 34 years, with 90.8% or 1,031 individuals in the labor force. Within the labor force, the 75 years and over age range has the highest percentage of unemployed individuals, with 10.9% or 13 of them being unemployed.
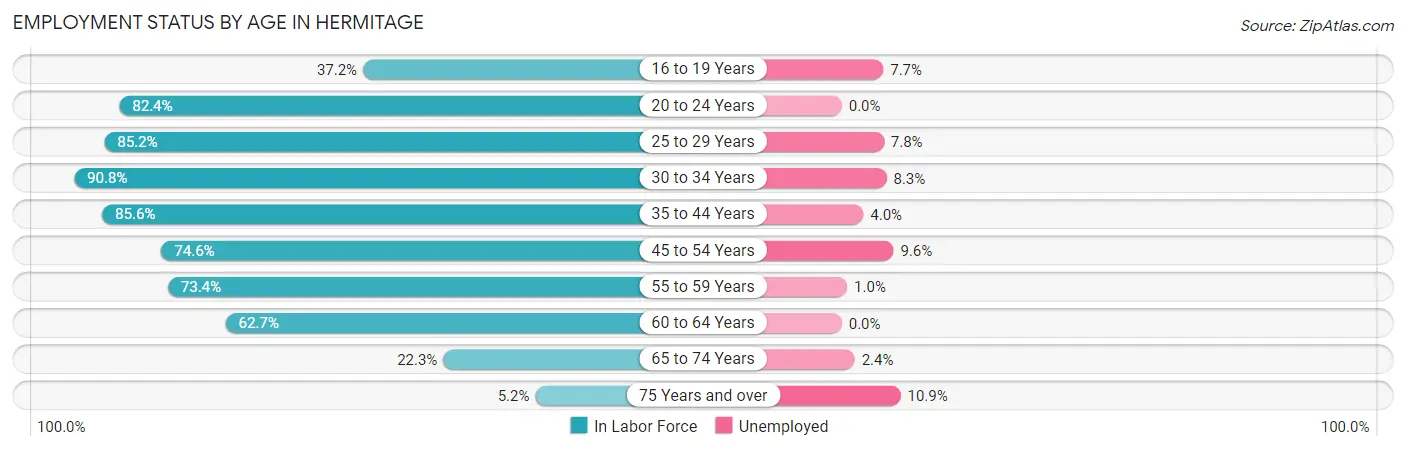
| Age Bracket | In Labor Force | Unemployed |
| 16 to 19 Years | 272 (37.2%) | 21 (7.7%) |
| 20 to 24 Years | 417 (82.4%) | 0 (0.0%) |
| 25 to 29 Years | 612 (85.2%) | 48 (7.8%) |
| 30 to 34 Years | 1,031 (90.8%) | 86 (8.3%) |
| 35 to 44 Years | 1,394 (85.6%) | 56 (4.0%) |
| 45 to 54 Years | 1,505 (74.6%) | 144 (9.6%) |
| 55 to 59 Years | 972 (73.4%) | 10 (1.0%) |
| 60 to 64 Years | 794 (62.7%) | 0 (0.0%) |
| 65 to 74 Years | 461 (22.3%) | 11 (2.4%) |
| 75 Years and over | 120 (5.2%) | 13 (10.9%) |
| Total | 7,575 (55.3%) | 386 (5.1%) |
Employment Status by Educational Attainment in Hermitage
According to labor force statistics for Hermitage, 78.0% of individuals (6,309) out of the total population between 25 and 64 years of age (8,089) are in the labor force, with 5.4% or 341 of them being unemployed. The group with the highest labor force participation rate are those with the educational attainment of bachelor's degree or higher, with 92.6% or 3,137 individuals in the labor force. Within the labor force, individuals with less than high school education have the highest percentage of unemployment, with 40.4% or 97 of them being unemployed.
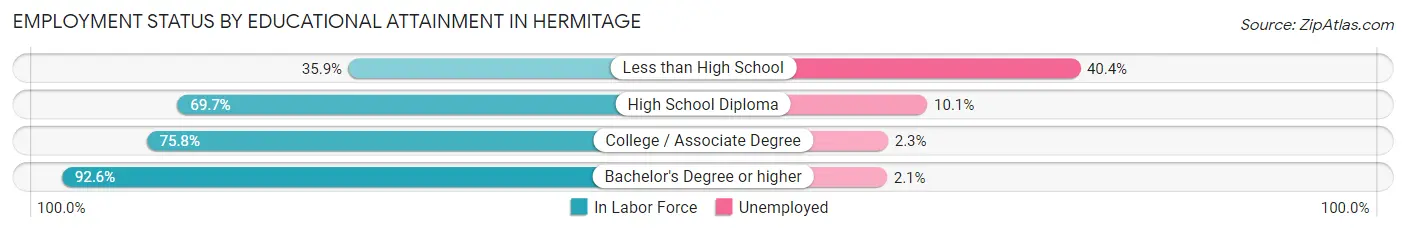
| Educational Attainment | In Labor Force | Unemployed |
| Less than High School | 240 (35.9%) | 270 (40.4%) |
| High School Diploma | 1,458 (69.7%) | 211 (10.1%) |
| College / Associate Degree | 1,471 (75.8%) | 45 (2.3%) |
| Bachelor's Degree or higher | 3,137 (92.6%) | 71 (2.1%) |
| Total | 6,309 (78.0%) | 437 (5.4%) |
Employment Occupations by Sex in Hermitage
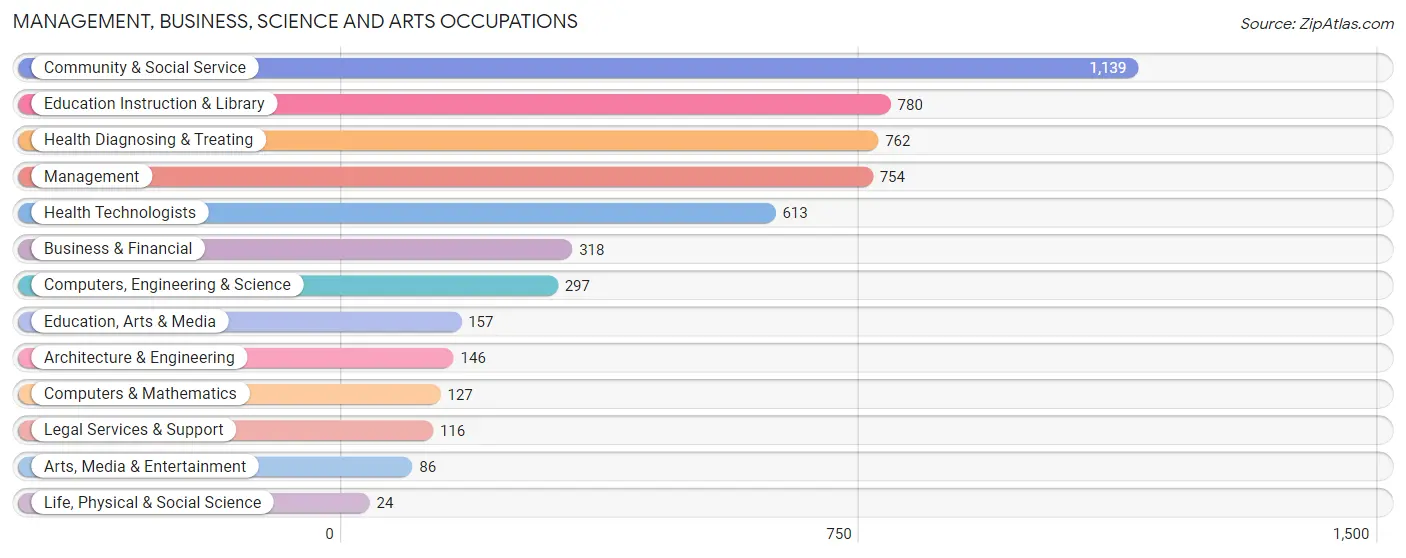
Management, Business, Science and Arts Occupations
The most common Management, Business, Science and Arts occupations in Hermitage are Community & Social Service (1,139 | 16.1%), Education Instruction & Library (780 | 11.0%), Health Diagnosing & Treating (762 | 10.8%), Management (754 | 10.6%), and Health Technologists (613 | 8.7%).
Management, Business, Science and Arts Occupations by Sex
Within the Management, Business, Science and Arts occupations in Hermitage, the most male-oriented occupations are Architecture & Engineering (94.5%), Computers, Engineering & Science (84.9%), and Computers & Mathematics (84.3%), while the most female-oriented occupations are Legal Services & Support (72.4%), Education Instruction & Library (70.9%), and Life, Physical & Social Science (70.8%).
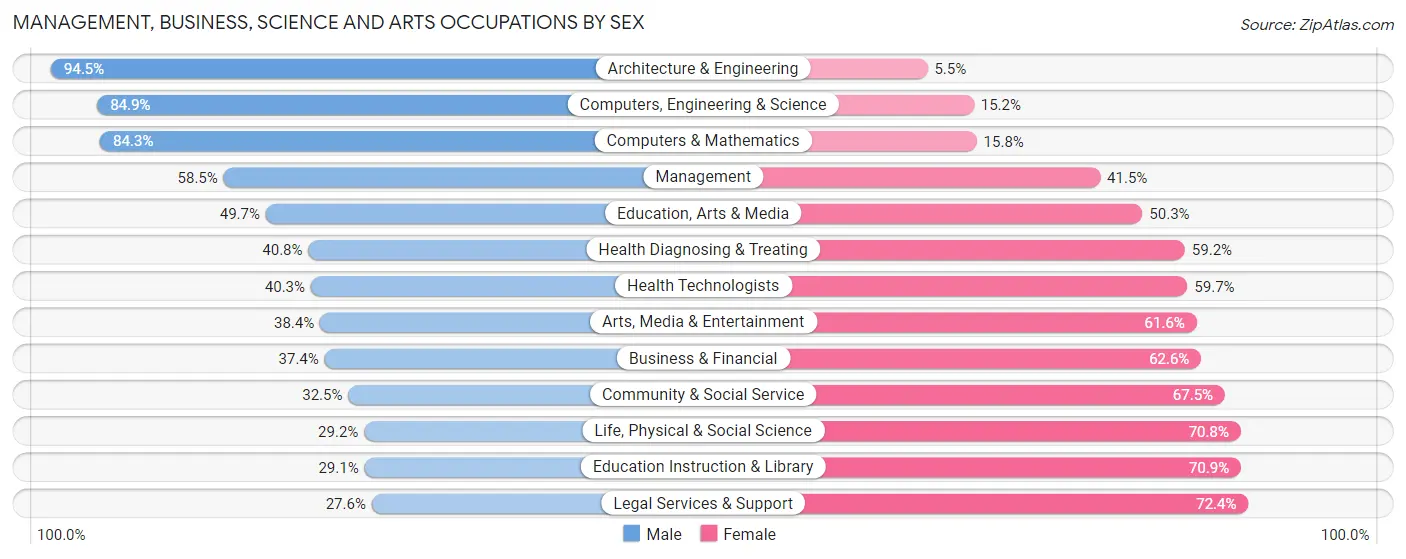
| Occupation | Male | Female |
| Management | 441 (58.5%) | 313 (41.5%) |
| Business & Financial | 119 (37.4%) | 199 (62.6%) |
| Computers, Engineering & Science | 252 (84.9%) | 45 (15.1%) |
| Computers & Mathematics | 107 (84.3%) | 20 (15.8%) |
| Architecture & Engineering | 138 (94.5%) | 8 (5.5%) |
| Life, Physical & Social Science | 7 (29.2%) | 17 (70.8%) |
| Community & Social Service | 370 (32.5%) | 769 (67.5%) |
| Education, Arts & Media | 78 (49.7%) | 79 (50.3%) |
| Legal Services & Support | 32 (27.6%) | 84 (72.4%) |
| Education Instruction & Library | 227 (29.1%) | 553 (70.9%) |
| Arts, Media & Entertainment | 33 (38.4%) | 53 (61.6%) |
| Health Diagnosing & Treating | 311 (40.8%) | 451 (59.2%) |
| Health Technologists | 247 (40.3%) | 366 (59.7%) |
| Total (Category) | 1,493 (45.7%) | 1,777 (54.3%) |
| Total (Overall) | 3,349 (47.3%) | 3,733 (52.7%) |
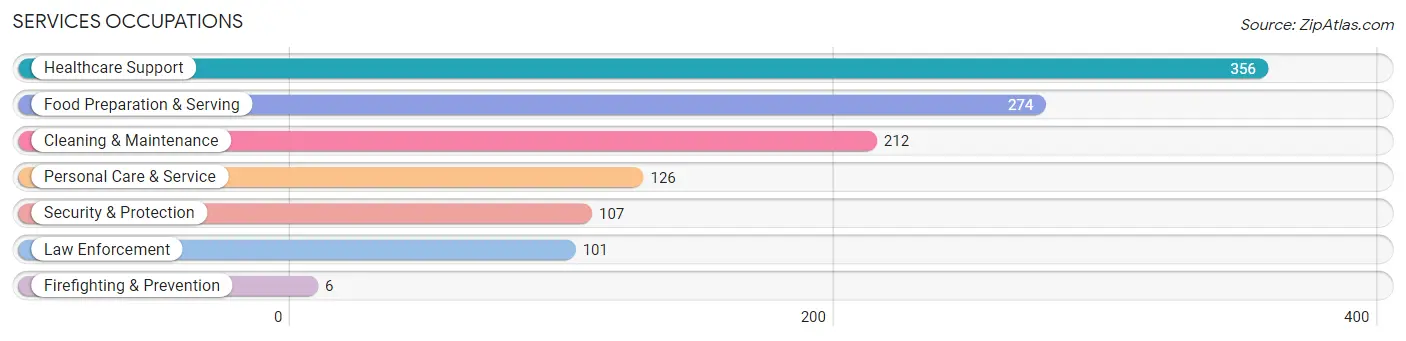
Services Occupations
The most common Services occupations in Hermitage are Healthcare Support (356 | 5.0%), Food Preparation & Serving (274 | 3.9%), Cleaning & Maintenance (212 | 3.0%), Personal Care & Service (126 | 1.8%), and Security & Protection (107 | 1.5%).
Services Occupations by Sex
Within the Services occupations in Hermitage, the most male-oriented occupations are Security & Protection (100.0%), Firefighting & Prevention (100.0%), and Law Enforcement (100.0%), while the most female-oriented occupations are Personal Care & Service (92.9%), Healthcare Support (77.8%), and Food Preparation & Serving (56.6%).
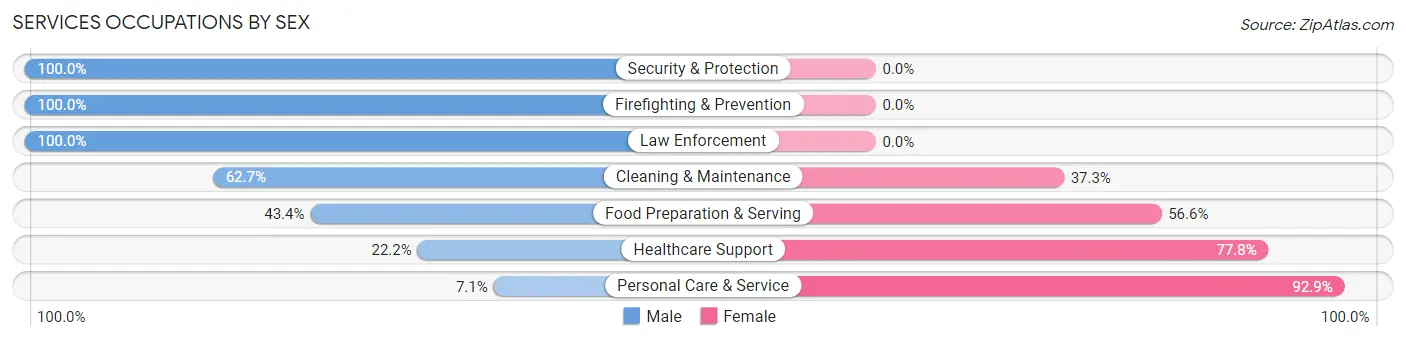
| Occupation | Male | Female |
| Healthcare Support | 79 (22.2%) | 277 (77.8%) |
| Security & Protection | 107 (100.0%) | 0 (0.0%) |
| Firefighting & Prevention | 6 (100.0%) | 0 (0.0%) |
| Law Enforcement | 101 (100.0%) | 0 (0.0%) |
| Food Preparation & Serving | 119 (43.4%) | 155 (56.6%) |
| Cleaning & Maintenance | 133 (62.7%) | 79 (37.3%) |
| Personal Care & Service | 9 (7.1%) | 117 (92.9%) |
| Total (Category) | 447 (41.6%) | 628 (58.4%) |
| Total (Overall) | 3,349 (47.3%) | 3,733 (52.7%) |
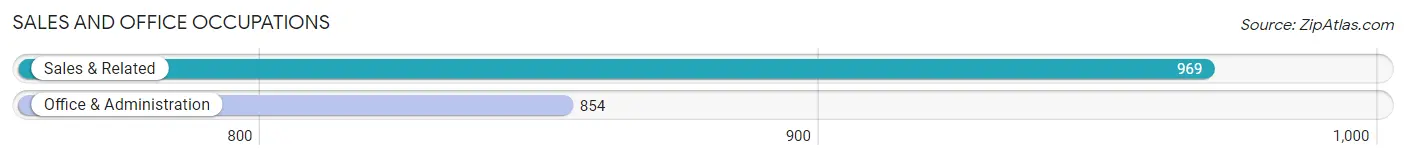
Sales and Office Occupations
The most common Sales and Office occupations in Hermitage are Sales & Related (969 | 13.7%), and Office & Administration (854 | 12.1%).
Sales and Office Occupations by Sex
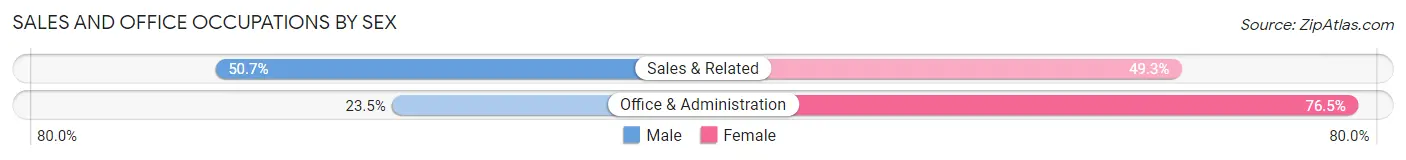
| Occupation | Male | Female |
| Sales & Related | 491 (50.7%) | 478 (49.3%) |
| Office & Administration | 201 (23.5%) | 653 (76.5%) |
| Total (Category) | 692 (38.0%) | 1,131 (62.0%) |
| Total (Overall) | 3,349 (47.3%) | 3,733 (52.7%) |
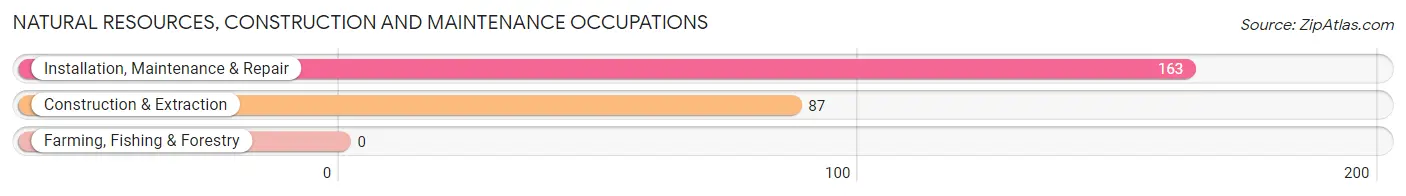
Natural Resources, Construction and Maintenance Occupations
The most common Natural Resources, Construction and Maintenance occupations in Hermitage are Installation, Maintenance & Repair (163 | 2.3%), and Construction & Extraction (87 | 1.2%).
Natural Resources, Construction and Maintenance Occupations by Sex
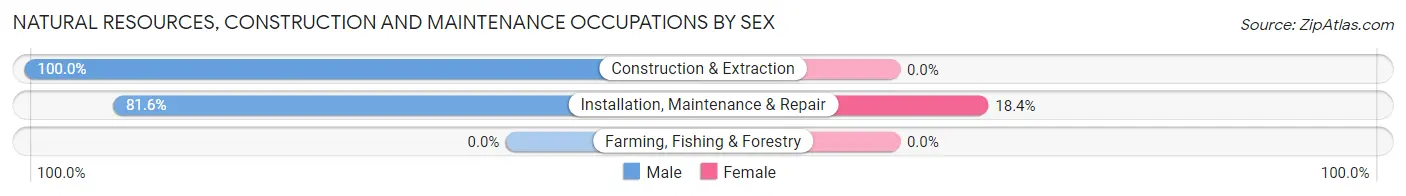
| Occupation | Male | Female |
| Farming, Fishing & Forestry | 0 (0.0%) | 0 (0.0%) |
| Construction & Extraction | 87 (100.0%) | 0 (0.0%) |
| Installation, Maintenance & Repair | 133 (81.6%) | 30 (18.4%) |
| Total (Category) | 220 (88.0%) | 30 (12.0%) |
| Total (Overall) | 3,349 (47.3%) | 3,733 (52.7%) |
Production, Transportation and Moving Occupations
The most common Production, Transportation and Moving occupations in Hermitage are Material Moving (286 | 4.0%), Production (266 | 3.8%), and Transportation (112 | 1.6%).
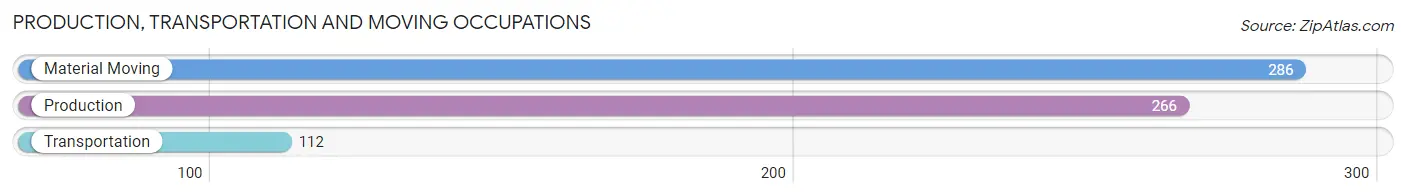
Production, Transportation and Moving Occupations by Sex
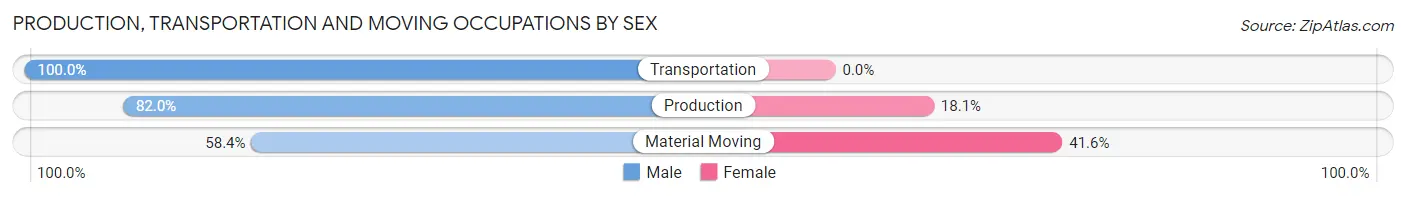
| Occupation | Male | Female |
| Production | 218 (82.0%) | 48 (18.0%) |
| Transportation | 112 (100.0%) | 0 (0.0%) |
| Material Moving | 167 (58.4%) | 119 (41.6%) |
| Total (Category) | 497 (74.9%) | 167 (25.2%) |
| Total (Overall) | 3,349 (47.3%) | 3,733 (52.7%) |
Employment Industries by Sex in Hermitage
Employment Industries in Hermitage
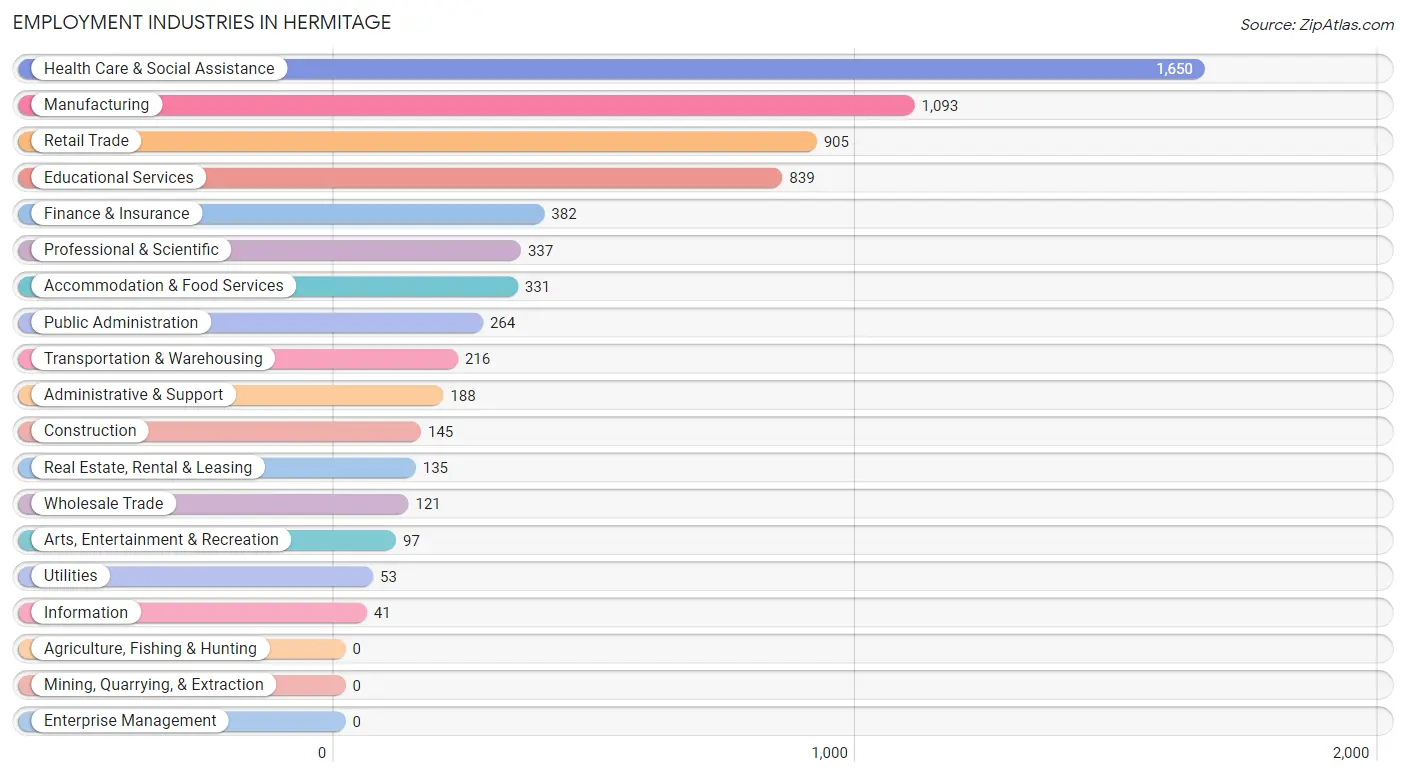
The major employment industries in Hermitage include Health Care & Social Assistance (1,650 | 23.3%), Manufacturing (1,093 | 15.4%), Retail Trade (905 | 12.8%), Educational Services (839 | 11.8%), and Finance & Insurance (382 | 5.4%).
Employment Industries by Sex in Hermitage
The Hermitage industries that see more men than women are Information (100.0%), Construction (89.0%), and Manufacturing (80.1%), whereas the industries that tend to have a higher number of women are Real Estate, Rental & Leasing (100.0%), Finance & Insurance (76.4%), and Administrative & Support (72.9%).
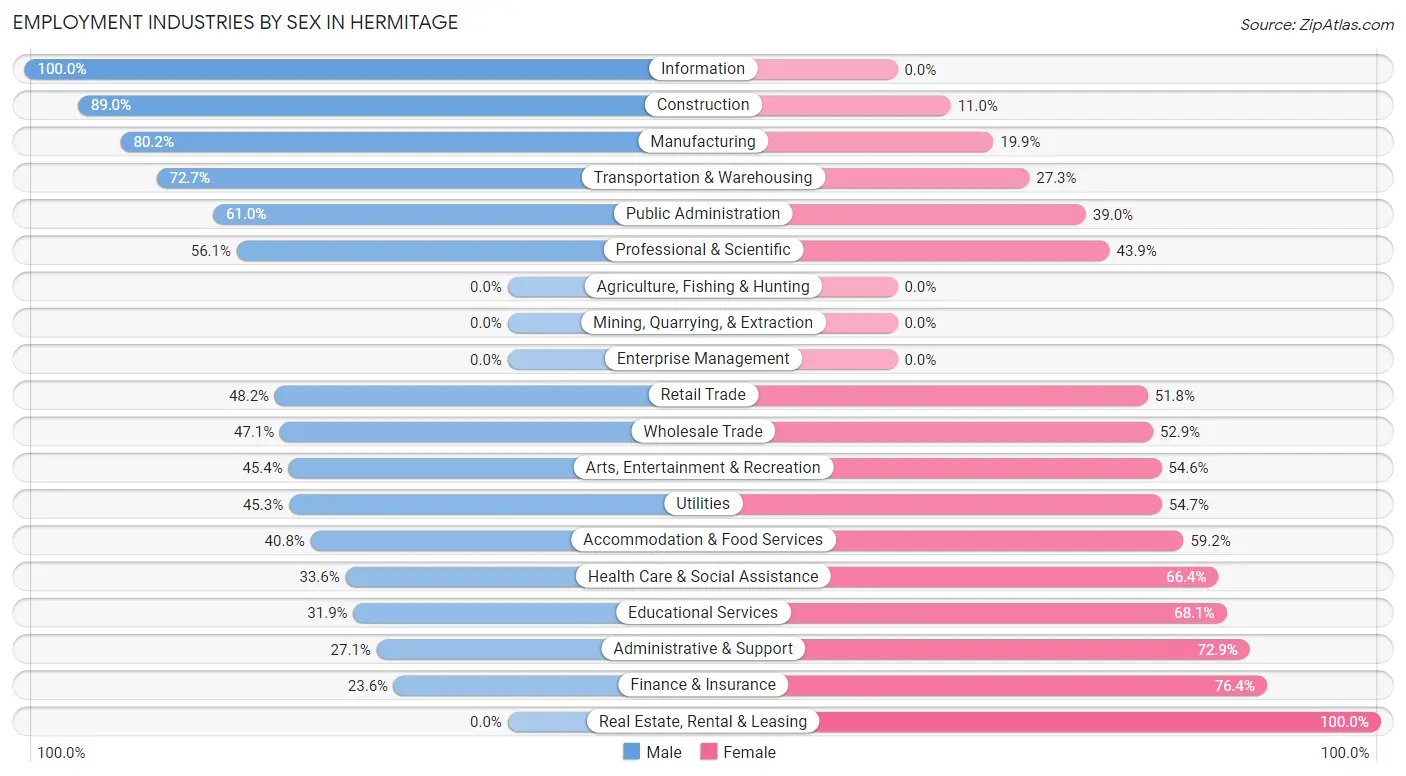
| Industry | Male | Female |
| Agriculture, Fishing & Hunting | 0 (0.0%) | 0 (0.0%) |
| Mining, Quarrying, & Extraction | 0 (0.0%) | 0 (0.0%) |
| Construction | 129 (89.0%) | 16 (11.0%) |
| Manufacturing | 876 (80.1%) | 217 (19.9%) |
| Wholesale Trade | 57 (47.1%) | 64 (52.9%) |
| Retail Trade | 436 (48.2%) | 469 (51.8%) |
| Transportation & Warehousing | 157 (72.7%) | 59 (27.3%) |
| Utilities | 24 (45.3%) | 29 (54.7%) |
| Information | 41 (100.0%) | 0 (0.0%) |
| Finance & Insurance | 90 (23.6%) | 292 (76.4%) |
| Real Estate, Rental & Leasing | 0 (0.0%) | 135 (100.0%) |
| Professional & Scientific | 189 (56.1%) | 148 (43.9%) |
| Enterprise Management | 0 (0.0%) | 0 (0.0%) |
| Administrative & Support | 51 (27.1%) | 137 (72.9%) |
| Educational Services | 268 (31.9%) | 571 (68.1%) |
| Health Care & Social Assistance | 554 (33.6%) | 1,096 (66.4%) |
| Arts, Entertainment & Recreation | 44 (45.4%) | 53 (54.6%) |
| Accommodation & Food Services | 135 (40.8%) | 196 (59.2%) |
| Public Administration | 161 (61.0%) | 103 (39.0%) |
| Total | 3,349 (47.3%) | 3,733 (52.7%) |
Education in Hermitage
School Enrollment in Hermitage
The most common levels of schooling among the 3,113 students in Hermitage are middle school (823 | 26.4%), high school (767 | 24.6%), and college / undergraduate (638 | 20.5%).
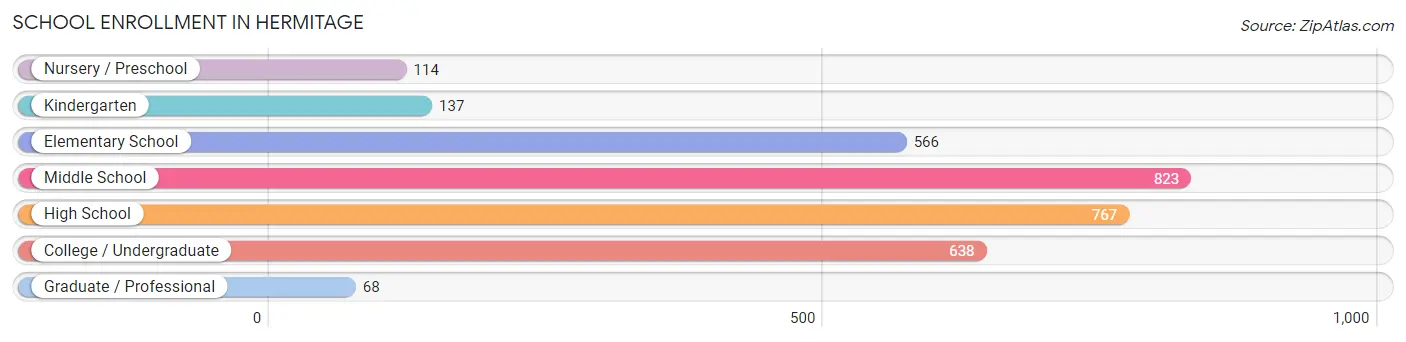
| School Level | # Students | % Students |
| Nursery / Preschool | 114 | 3.7% |
| Kindergarten | 137 | 4.4% |
| Elementary School | 566 | 18.2% |
| Middle School | 823 | 26.4% |
| High School | 767 | 24.6% |
| College / Undergraduate | 638 | 20.5% |
| Graduate / Professional | 68 | 2.2% |
| Total | 3,113 | 100.0% |
School Enrollment by Age by Funding Source in Hermitage
Out of a total of 3,113 students who are enrolled in schools in Hermitage, 395 (12.7%) attend a private institution, while the remaining 2,718 (87.3%) are enrolled in public schools. The age group of 3 to 4 year olds has the highest likelihood of being enrolled in private schools, with 68 (68.0% in the age bracket) enrolled. Conversely, the age group of 5 to 9 year old has the lowest likelihood of being enrolled in a private school, with 617 (98.1% in the age bracket) attending a public institution.
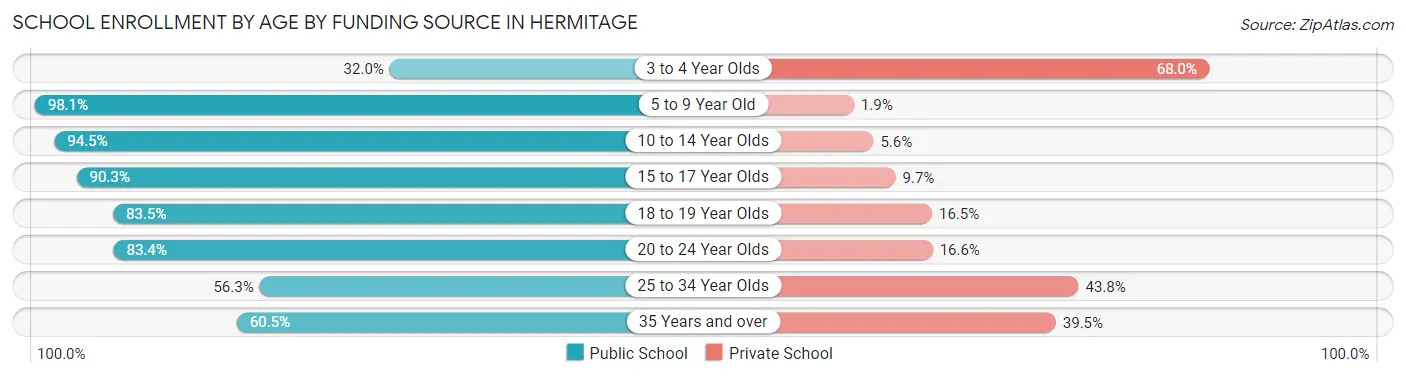
| Age Bracket | Public School | Private School |
| 3 to 4 Year Olds | 32 (32.0%) | 68 (68.0%) |
| 5 to 9 Year Old | 617 (98.1%) | 12 (1.9%) |
| 10 to 14 Year Olds | 936 (94.5%) | 55 (5.6%) |
| 15 to 17 Year Olds | 588 (90.3%) | 63 (9.7%) |
| 18 to 19 Year Olds | 208 (83.5%) | 41 (16.5%) |
| 20 to 24 Year Olds | 156 (83.4%) | 31 (16.6%) |
| 25 to 34 Year Olds | 54 (56.2%) | 42 (43.8%) |
| 35 Years and over | 127 (60.5%) | 83 (39.5%) |
| Total | 2,718 (87.3%) | 395 (12.7%) |
Educational Attainment by Field of Study in Hermitage
Education (944 | 20.2%), business (899 | 19.3%), science & technology (797 | 17.1%), arts & humanities (400 | 8.6%), and social sciences (295 | 6.3%) are the most common fields of study among 4,666 individuals in Hermitage who have obtained a bachelor's degree or higher.
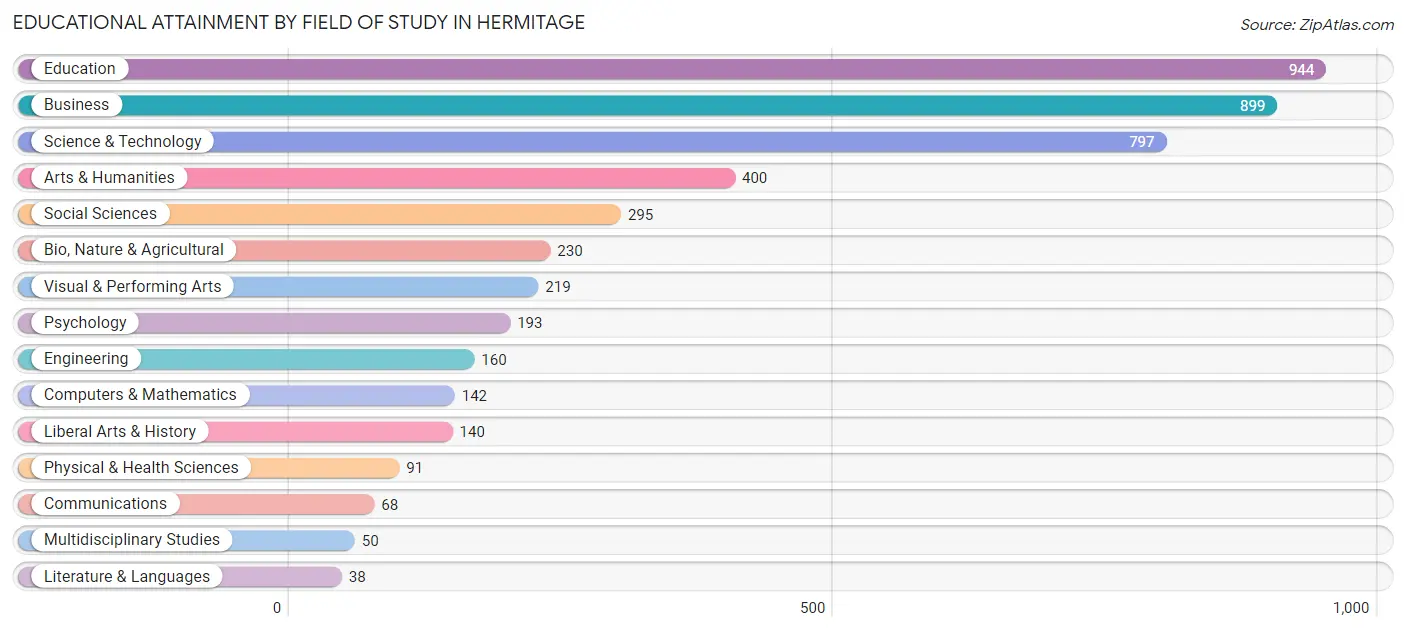
| Field of Study | # Graduates | % Graduates |
| Computers & Mathematics | 142 | 3.0% |
| Bio, Nature & Agricultural | 230 | 4.9% |
| Physical & Health Sciences | 91 | 1.9% |
| Psychology | 193 | 4.1% |
| Social Sciences | 295 | 6.3% |
| Engineering | 160 | 3.4% |
| Multidisciplinary Studies | 50 | 1.1% |
| Science & Technology | 797 | 17.1% |
| Business | 899 | 19.3% |
| Education | 944 | 20.2% |
| Literature & Languages | 38 | 0.8% |
| Liberal Arts & History | 140 | 3.0% |
| Visual & Performing Arts | 219 | 4.7% |
| Communications | 68 | 1.5% |
| Arts & Humanities | 400 | 8.6% |
| Total | 4,666 | 100.0% |
Transportation & Commute in Hermitage
Vehicle Availability by Sex in Hermitage
The most prevalent vehicle ownership categories in Hermitage are males with 2 vehicles (1,777, accounting for 52.6%) and females with 2 vehicles (1,737, making up 48.4%).
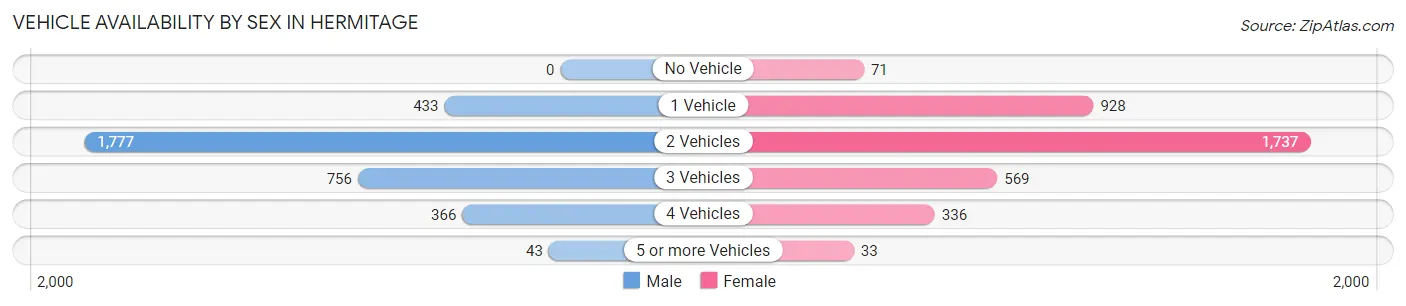
| Vehicles Available | Male | Female |
| No Vehicle | 0 (0.0%) | 71 (1.9%) |
| 1 Vehicle | 433 (12.8%) | 928 (25.3%) |
| 2 Vehicles | 1,777 (52.6%) | 1,737 (47.3%) |
| 3 Vehicles | 756 (22.4%) | 569 (15.5%) |
| 4 Vehicles | 366 (10.8%) | 336 (9.1%) |
| 5 or more Vehicles | 43 (1.3%) | 33 (0.9%) |
| Total | 3,375 (100.0%) | 3,674 (100.0%) |
Commute Time in Hermitage
The most frequently occuring commute durations in Hermitage are 10 to 14 minutes (1,531 commuters, 23.4%), 5 to 9 minutes (1,334 commuters, 20.4%), and 15 to 19 minutes (1,049 commuters, 16.0%).
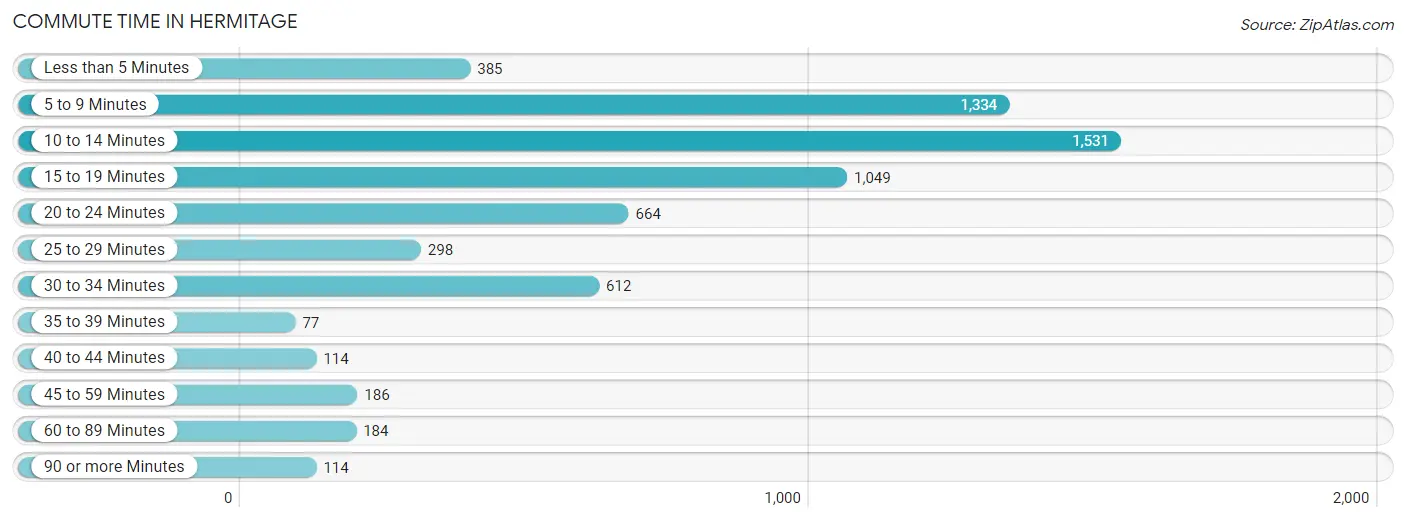
| Commute Time | # Commuters | % Commuters |
| Less than 5 Minutes | 385 | 5.9% |
| 5 to 9 Minutes | 1,334 | 20.4% |
| 10 to 14 Minutes | 1,531 | 23.4% |
| 15 to 19 Minutes | 1,049 | 16.0% |
| 20 to 24 Minutes | 664 | 10.1% |
| 25 to 29 Minutes | 298 | 4.5% |
| 30 to 34 Minutes | 612 | 9.3% |
| 35 to 39 Minutes | 77 | 1.2% |
| 40 to 44 Minutes | 114 | 1.7% |
| 45 to 59 Minutes | 186 | 2.8% |
| 60 to 89 Minutes | 184 | 2.8% |
| 90 or more Minutes | 114 | 1.7% |
Commute Time by Sex in Hermitage
The most common commute times in Hermitage are 10 to 14 minutes (687 commuters, 21.3%) for males and 10 to 14 minutes (844 commuters, 25.4%) for females.
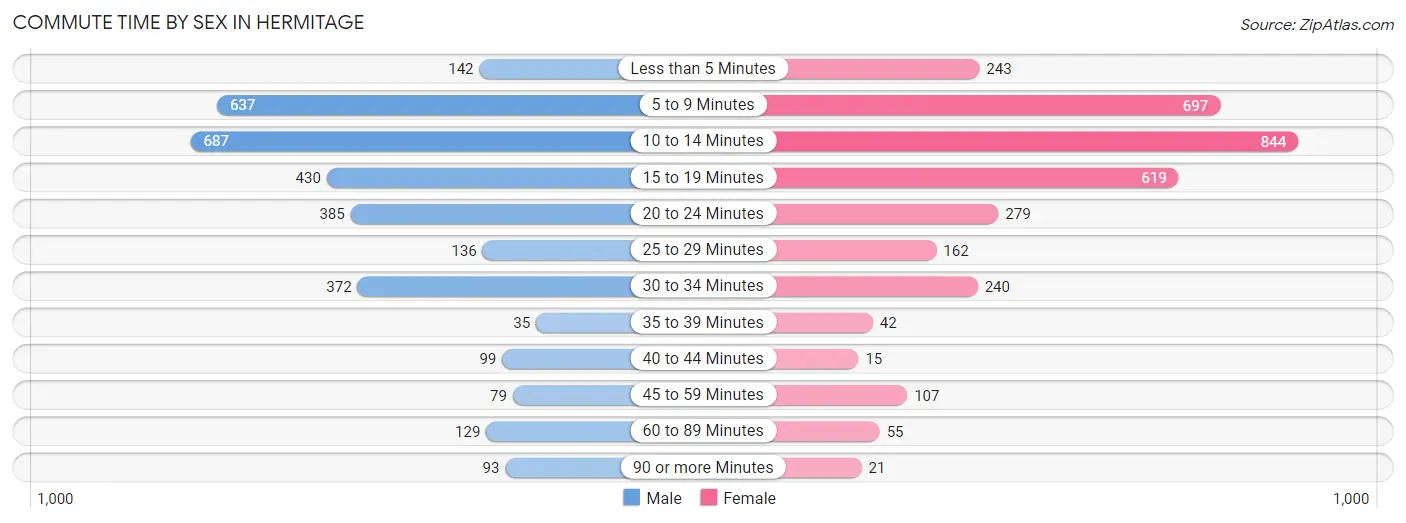
| Commute Time | Male | Female |
| Less than 5 Minutes | 142 (4.4%) | 243 (7.3%) |
| 5 to 9 Minutes | 637 (19.8%) | 697 (21.0%) |
| 10 to 14 Minutes | 687 (21.3%) | 844 (25.4%) |
| 15 to 19 Minutes | 430 (13.3%) | 619 (18.6%) |
| 20 to 24 Minutes | 385 (11.9%) | 279 (8.4%) |
| 25 to 29 Minutes | 136 (4.2%) | 162 (4.9%) |
| 30 to 34 Minutes | 372 (11.5%) | 240 (7.2%) |
| 35 to 39 Minutes | 35 (1.1%) | 42 (1.3%) |
| 40 to 44 Minutes | 99 (3.1%) | 15 (0.4%) |
| 45 to 59 Minutes | 79 (2.5%) | 107 (3.2%) |
| 60 to 89 Minutes | 129 (4.0%) | 55 (1.7%) |
| 90 or more Minutes | 93 (2.9%) | 21 (0.6%) |
Time of Departure to Work by Sex in Hermitage
The most frequent times of departure to work in Hermitage are 7:30 AM to 7:59 AM (508, 15.8%) for males and 7:30 AM to 7:59 AM (950, 28.6%) for females.
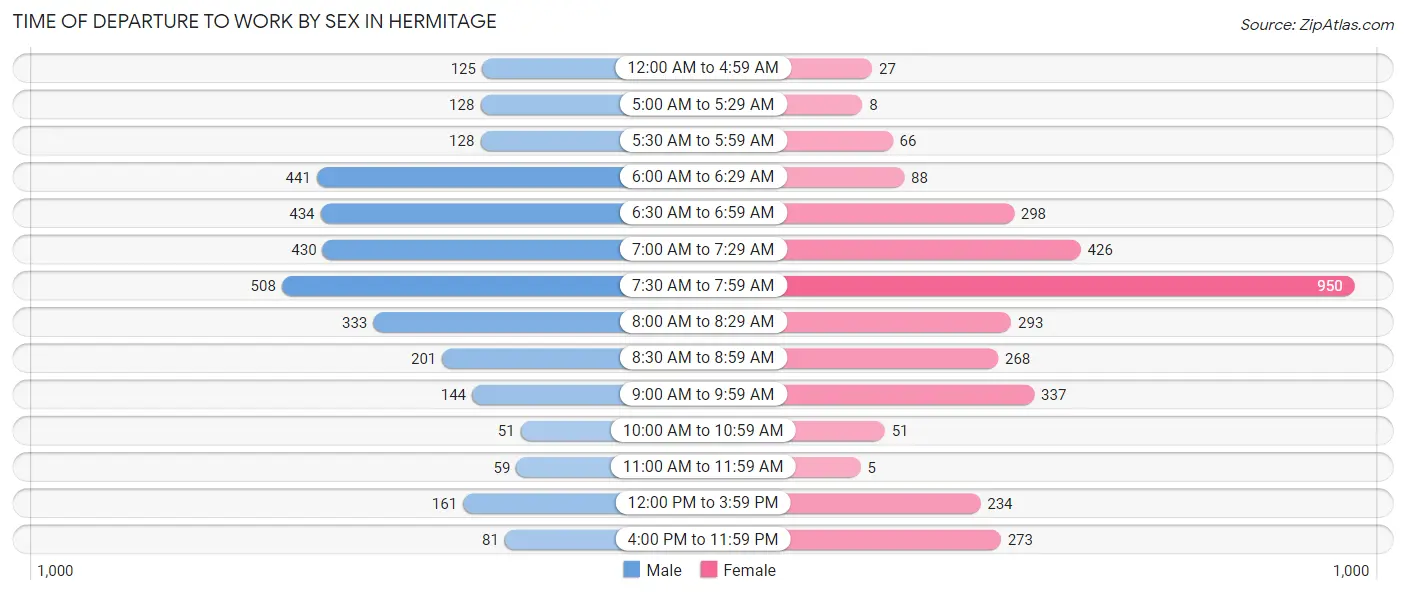
| Time of Departure | Male | Female |
| 12:00 AM to 4:59 AM | 125 (3.9%) | 27 (0.8%) |
| 5:00 AM to 5:29 AM | 128 (4.0%) | 8 (0.2%) |
| 5:30 AM to 5:59 AM | 128 (4.0%) | 66 (2.0%) |
| 6:00 AM to 6:29 AM | 441 (13.7%) | 88 (2.6%) |
| 6:30 AM to 6:59 AM | 434 (13.5%) | 298 (9.0%) |
| 7:00 AM to 7:29 AM | 430 (13.3%) | 426 (12.8%) |
| 7:30 AM to 7:59 AM | 508 (15.8%) | 950 (28.6%) |
| 8:00 AM to 8:29 AM | 333 (10.3%) | 293 (8.8%) |
| 8:30 AM to 8:59 AM | 201 (6.2%) | 268 (8.1%) |
| 9:00 AM to 9:59 AM | 144 (4.5%) | 337 (10.1%) |
| 10:00 AM to 10:59 AM | 51 (1.6%) | 51 (1.5%) |
| 11:00 AM to 11:59 AM | 59 (1.8%) | 5 (0.2%) |
| 12:00 PM to 3:59 PM | 161 (5.0%) | 234 (7.0%) |
| 4:00 PM to 11:59 PM | 81 (2.5%) | 273 (8.2%) |
| Total | 3,224 (100.0%) | 3,324 (100.0%) |
Housing Occupancy in Hermitage
Occupancy by Ownership in Hermitage
Of the total 7,631 dwellings in Hermitage, owner-occupied units account for 5,515 (72.3%), while renter-occupied units make up 2,116 (27.7%).
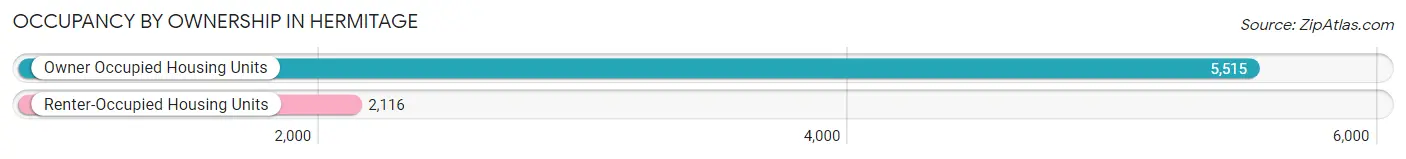
| Occupancy | # Housing Units | % Housing Units |
| Owner Occupied Housing Units | 5,515 | 72.3% |
| Renter-Occupied Housing Units | 2,116 | 27.7% |
| Total Occupied Housing Units | 7,631 | 100.0% |
Occupancy by Household Size in Hermitage
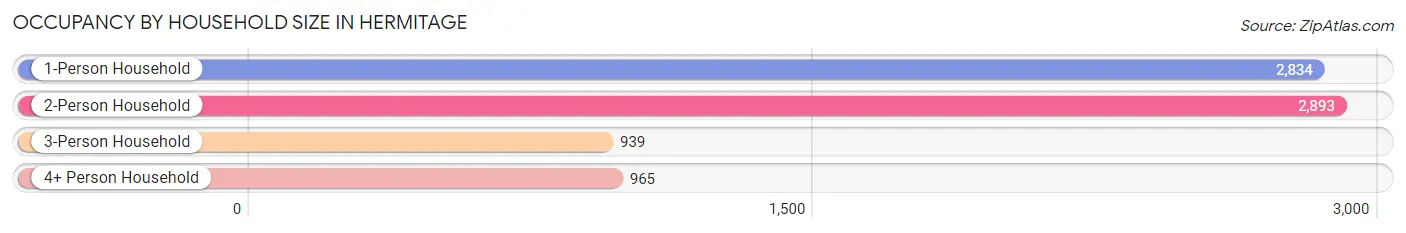
| Household Size | # Housing Units | % Housing Units |
| 1-Person Household | 2,834 | 37.1% |
| 2-Person Household | 2,893 | 37.9% |
| 3-Person Household | 939 | 12.3% |
| 4+ Person Household | 965 | 12.7% |
| Total Housing Units | 7,631 | 100.0% |
Occupancy by Ownership by Household Size in Hermitage
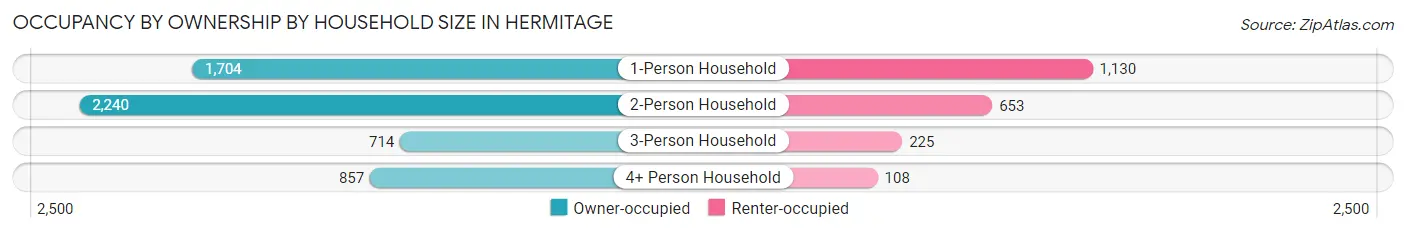
| Household Size | Owner-occupied | Renter-occupied |
| 1-Person Household | 1,704 (60.1%) | 1,130 (39.9%) |
| 2-Person Household | 2,240 (77.4%) | 653 (22.6%) |
| 3-Person Household | 714 (76.0%) | 225 (24.0%) |
| 4+ Person Household | 857 (88.8%) | 108 (11.2%) |
| Total Housing Units | 5,515 (72.3%) | 2,116 (27.7%) |
Occupancy by Educational Attainment in Hermitage
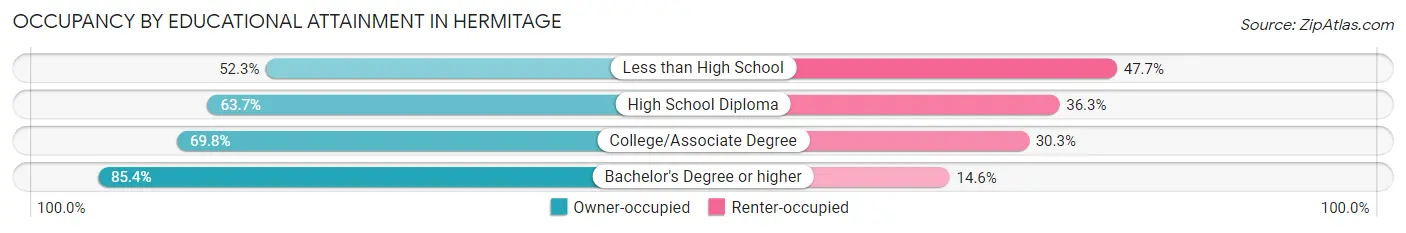
| Household Size | Owner-occupied | Renter-occupied |
| Less than High School | 263 (52.3%) | 240 (47.7%) |
| High School Diploma | 1,551 (63.7%) | 884 (36.3%) |
| College/Associate Degree | 1,372 (69.8%) | 595 (30.2%) |
| Bachelor's Degree or higher | 2,329 (85.4%) | 397 (14.6%) |
Occupancy by Age of Householder in Hermitage
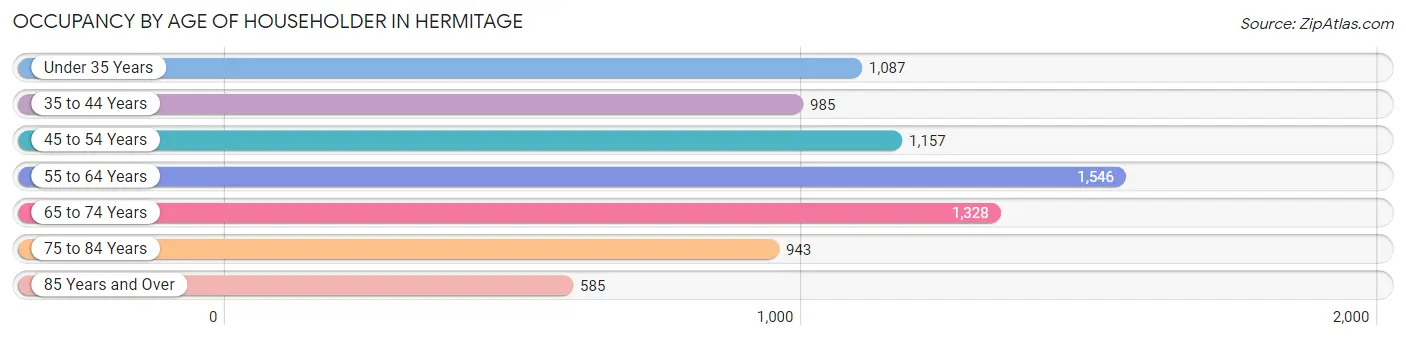
| Age Bracket | # Households | % Households |
| Under 35 Years | 1,087 | 14.2% |
| 35 to 44 Years | 985 | 12.9% |
| 45 to 54 Years | 1,157 | 15.2% |
| 55 to 64 Years | 1,546 | 20.3% |
| 65 to 74 Years | 1,328 | 17.4% |
| 75 to 84 Years | 943 | 12.4% |
| 85 Years and Over | 585 | 7.7% |
| Total | 7,631 | 100.0% |
Housing Finances in Hermitage
Median Income by Occupancy in Hermitage
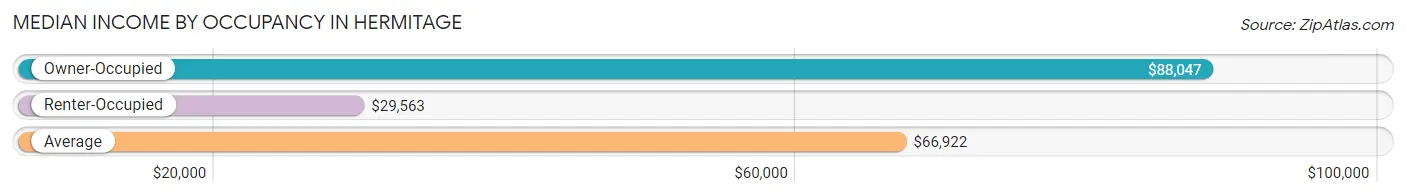
| Occupancy Type | # Households | Median Income |
| Owner-Occupied | 5,515 (72.3%) | $88,047 |
| Renter-Occupied | 2,116 (27.7%) | $29,563 |
| Average | 7,631 (100.0%) | $66,922 |
Occupancy by Householder Income Bracket in Hermitage
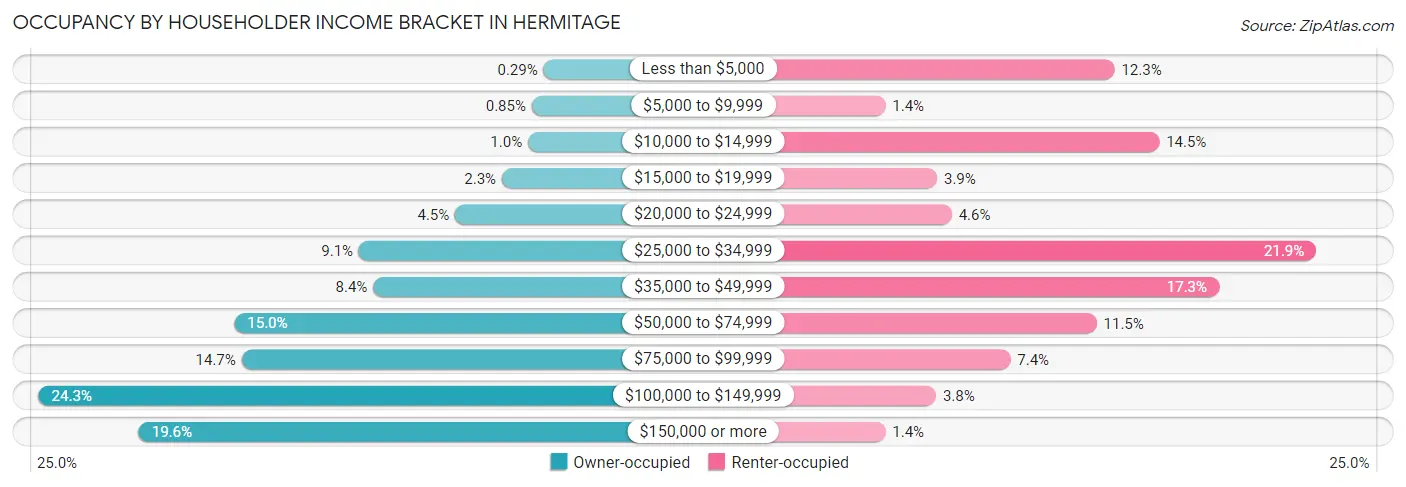
| Income Bracket | Owner-occupied | Renter-occupied |
| Less than $5,000 | 16 (0.3%) | 261 (12.3%) |
| $5,000 to $9,999 | 47 (0.9%) | 30 (1.4%) |
| $10,000 to $14,999 | 57 (1.0%) | 306 (14.5%) |
| $15,000 to $19,999 | 125 (2.3%) | 82 (3.9%) |
| $20,000 to $24,999 | 248 (4.5%) | 97 (4.6%) |
| $25,000 to $34,999 | 501 (9.1%) | 464 (21.9%) |
| $35,000 to $49,999 | 463 (8.4%) | 366 (17.3%) |
| $50,000 to $74,999 | 828 (15.0%) | 243 (11.5%) |
| $75,000 to $99,999 | 809 (14.7%) | 156 (7.4%) |
| $100,000 to $149,999 | 1,342 (24.3%) | 81 (3.8%) |
| $150,000 or more | 1,079 (19.6%) | 30 (1.4%) |
| Total | 5,515 (100.0%) | 2,116 (100.0%) |
Monthly Housing Cost Tiers in Hermitage
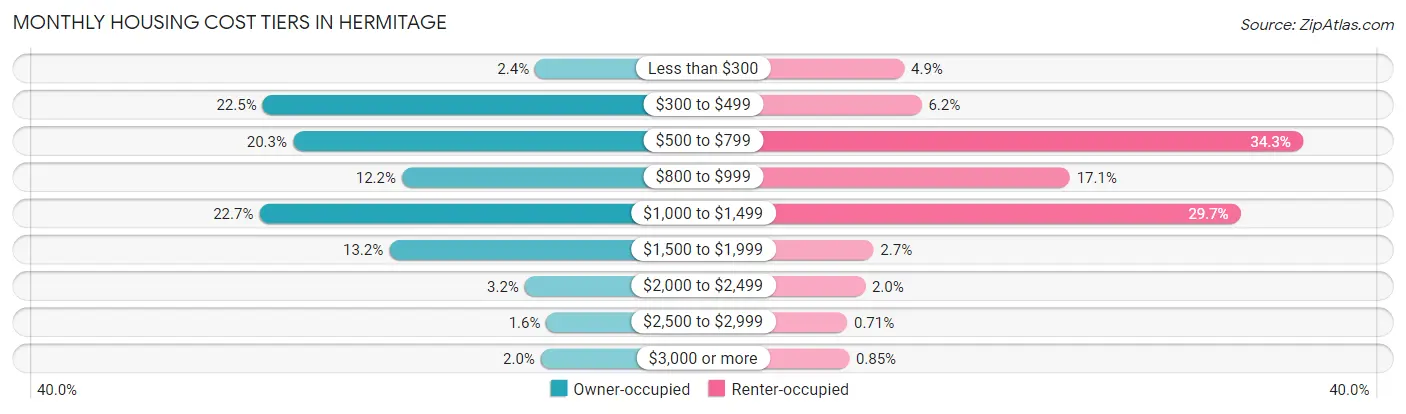
| Monthly Cost | Owner-occupied | Renter-occupied |
| Less than $300 | 133 (2.4%) | 104 (4.9%) |
| $300 to $499 | 1,240 (22.5%) | 131 (6.2%) |
| $500 to $799 | 1,117 (20.3%) | 725 (34.3%) |
| $800 to $999 | 674 (12.2%) | 362 (17.1%) |
| $1,000 to $1,499 | 1,253 (22.7%) | 628 (29.7%) |
| $1,500 to $1,999 | 726 (13.2%) | 56 (2.6%) |
| $2,000 to $2,499 | 175 (3.2%) | 43 (2.0%) |
| $2,500 to $2,999 | 87 (1.6%) | 15 (0.7%) |
| $3,000 or more | 110 (2.0%) | 18 (0.9%) |
| Total | 5,515 (100.0%) | 2,116 (100.0%) |
Physical Housing Characteristics in Hermitage
Housing Structures in Hermitage
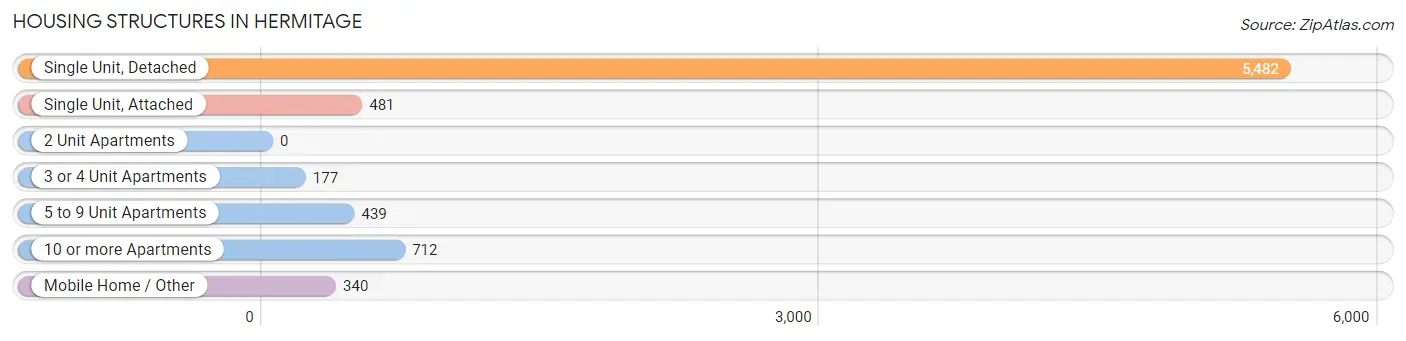
| Structure Type | # Housing Units | % Housing Units |
| Single Unit, Detached | 5,482 | 71.8% |
| Single Unit, Attached | 481 | 6.3% |
| 2 Unit Apartments | 0 | 0.0% |
| 3 or 4 Unit Apartments | 177 | 2.3% |
| 5 to 9 Unit Apartments | 439 | 5.8% |
| 10 or more Apartments | 712 | 9.3% |
| Mobile Home / Other | 340 | 4.5% |
| Total | 7,631 | 100.0% |
Housing Structures by Occupancy in Hermitage
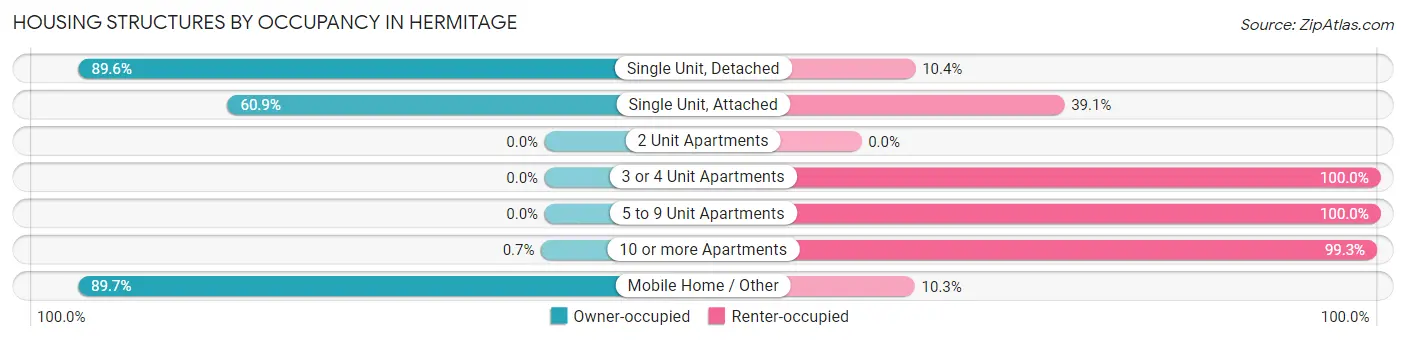
| Structure Type | Owner-occupied | Renter-occupied |
| Single Unit, Detached | 4,912 (89.6%) | 570 (10.4%) |
| Single Unit, Attached | 293 (60.9%) | 188 (39.1%) |
| 2 Unit Apartments | 0 (0.0%) | 0 (0.0%) |
| 3 or 4 Unit Apartments | 0 (0.0%) | 177 (100.0%) |
| 5 to 9 Unit Apartments | 0 (0.0%) | 439 (100.0%) |
| 10 or more Apartments | 5 (0.7%) | 707 (99.3%) |
| Mobile Home / Other | 305 (89.7%) | 35 (10.3%) |
| Total | 5,515 (72.3%) | 2,116 (27.7%) |
Housing Structures by Number of Rooms in Hermitage
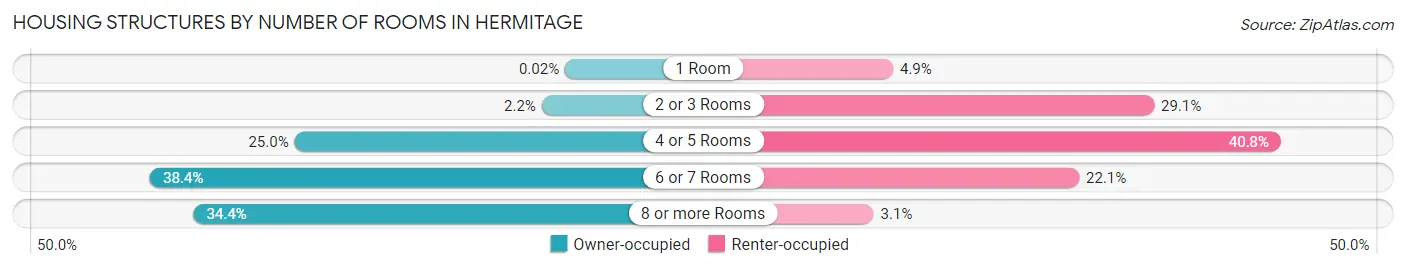
| Number of Rooms | Owner-occupied | Renter-occupied |
| 1 Room | 1 (0.0%) | 104 (4.9%) |
| 2 or 3 Rooms | 120 (2.2%) | 615 (29.1%) |
| 4 or 5 Rooms | 1,381 (25.0%) | 863 (40.8%) |
| 6 or 7 Rooms | 2,117 (38.4%) | 468 (22.1%) |
| 8 or more Rooms | 1,896 (34.4%) | 66 (3.1%) |
| Total | 5,515 (100.0%) | 2,116 (100.0%) |
Housing Structure by Heating Type in Hermitage
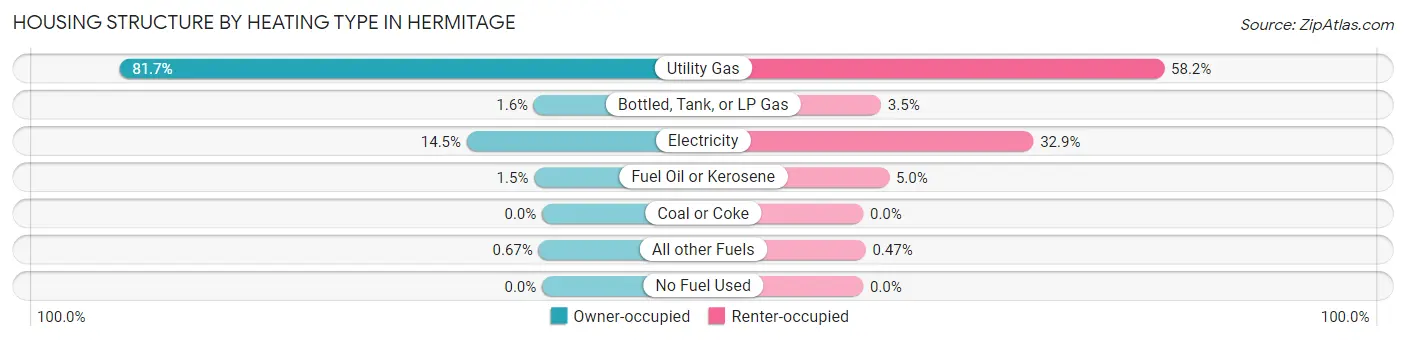
| Heating Type | Owner-occupied | Renter-occupied |
| Utility Gas | 4,505 (81.7%) | 1,231 (58.2%) |
| Bottled, Tank, or LP Gas | 87 (1.6%) | 73 (3.5%) |
| Electricity | 802 (14.5%) | 696 (32.9%) |
| Fuel Oil or Kerosene | 84 (1.5%) | 106 (5.0%) |
| Coal or Coke | 0 (0.0%) | 0 (0.0%) |
| All other Fuels | 37 (0.7%) | 10 (0.5%) |
| No Fuel Used | 0 (0.0%) | 0 (0.0%) |
| Total | 5,515 (100.0%) | 2,116 (100.0%) |
Household Vehicle Usage in Hermitage
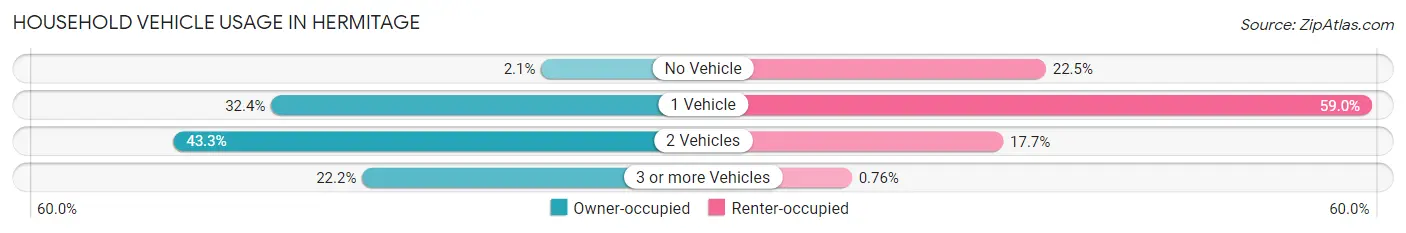
| Vehicles per Household | Owner-occupied | Renter-occupied |
| No Vehicle | 117 (2.1%) | 476 (22.5%) |
| 1 Vehicle | 1,785 (32.4%) | 1,249 (59.0%) |
| 2 Vehicles | 2,390 (43.3%) | 375 (17.7%) |
| 3 or more Vehicles | 1,223 (22.2%) | 16 (0.8%) |
| Total | 5,515 (100.0%) | 2,116 (100.0%) |
Real Estate & Mortgages in Hermitage
Real Estate and Mortgage Overview in Hermitage
| Characteristic | Without Mortgage | With Mortgage |
| Housing Units | 2,819 | 2,696 |
| Median Property Value | $167,100 | $183,100 |
| Median Household Income | $67,266 | $739 |
| Monthly Housing Costs | $515 | $101 |
| Real Estate Taxes | $2,230 | $38 |
Property Value by Mortgage Status in Hermitage
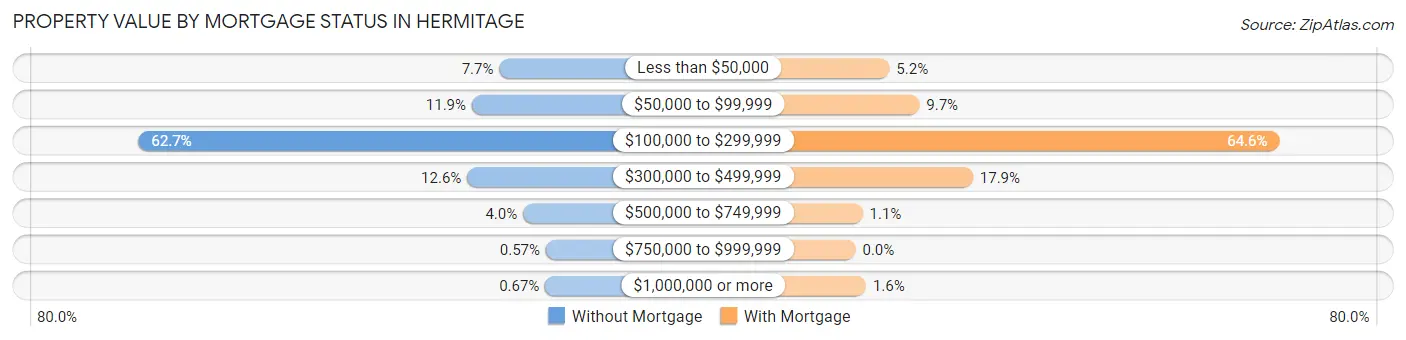
| Property Value | Without Mortgage | With Mortgage |
| Less than $50,000 | 216 (7.7%) | 139 (5.2%) |
| $50,000 to $99,999 | 334 (11.8%) | 262 (9.7%) |
| $100,000 to $299,999 | 1,766 (62.6%) | 1,741 (64.6%) |
| $300,000 to $499,999 | 354 (12.6%) | 482 (17.9%) |
| $500,000 to $749,999 | 114 (4.0%) | 29 (1.1%) |
| $750,000 to $999,999 | 16 (0.6%) | 0 (0.0%) |
| $1,000,000 or more | 19 (0.7%) | 43 (1.6%) |
| Total | 2,819 (100.0%) | 2,696 (100.0%) |
Household Income by Mortgage Status in Hermitage
| Household Income | Without Mortgage | With Mortgage |
| Less than $10,000 | 53 (1.9%) | 129 (4.8%) |
| $10,000 to $24,999 | 264 (9.4%) | 10 (0.4%) |
| $25,000 to $34,999 | 424 (15.0%) | 166 (6.2%) |
| $35,000 to $49,999 | 314 (11.1%) | 77 (2.9%) |
| $50,000 to $74,999 | 492 (17.4%) | 149 (5.5%) |
| $75,000 to $99,999 | 442 (15.7%) | 336 (12.5%) |
| $100,000 to $149,999 | 490 (17.4%) | 367 (13.6%) |
| $150,000 or more | 340 (12.1%) | 852 (31.6%) |
| Total | 2,819 (100.0%) | 2,696 (100.0%) |
Property Value to Household Income Ratio in Hermitage
| Value-to-Income Ratio | Without Mortgage | With Mortgage |
| Less than 2.0x | 1,128 (40.0%) | 114,038 (4,229.9%) |
| 2.0x to 2.9x | 484 (17.2%) | 1,730 (64.2%) |
| 3.0x to 3.9x | 244 (8.7%) | 462 (17.1%) |
| 4.0x or more | 954 (33.8%) | 207 (7.7%) |
| Total | 2,819 (100.0%) | 2,696 (100.0%) |
Real Estate Taxes by Mortgage Status in Hermitage
| Property Taxes | Without Mortgage | With Mortgage |
| Less than $800 | 266 (9.4%) | 0 (0.0%) |
| $800 to $1,499 | 546 (19.4%) | 126 (4.7%) |
| $800 to $1,499 | 1,995 (70.8%) | 537 (19.9%) |
| Total | 2,819 (100.0%) | 2,696 (100.0%) |
Health & Disability in Hermitage
Health Insurance Coverage by Age in Hermitage
| Age Bracket | With Coverage | Without Coverage |
| Under 6 Years | 667 (100.0%) | 0 (0.0%) |
| 6 to 18 Years | 2,453 (99.8%) | 5 (0.2%) |
| 19 to 25 Years | 675 (97.4%) | 18 (2.6%) |
| 26 to 34 Years | 1,700 (98.5%) | 26 (1.5%) |
| 35 to 44 Years | 1,538 (96.5%) | 56 (3.5%) |
| 45 to 54 Years | 1,871 (94.5%) | 110 (5.6%) |
| 55 to 64 Years | 2,521 (97.3%) | 70 (2.7%) |
| 65 to 74 Years | 2,034 (100.0%) | 0 (0.0%) |
| 75 Years and older | 2,132 (99.6%) | 8 (0.4%) |
| Total | 15,591 (98.2%) | 293 (1.8%) |
Health Insurance Coverage by Citizenship Status in Hermitage
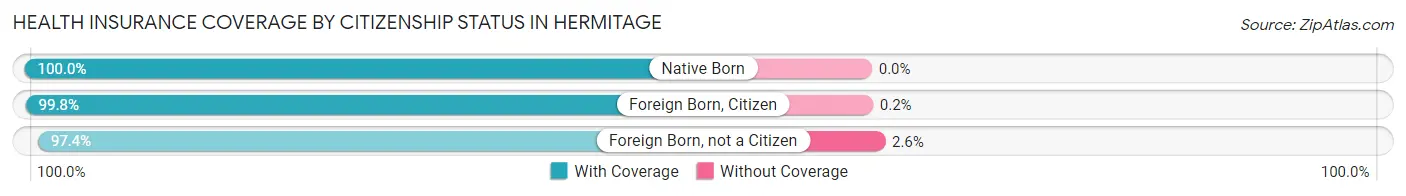
| Citizenship Status | With Coverage | Without Coverage |
| Native Born | 667 (100.0%) | 0 (0.0%) |
| Foreign Born, Citizen | 2,453 (99.8%) | 5 (0.2%) |
| Foreign Born, not a Citizen | 675 (97.4%) | 18 (2.6%) |
Health Insurance Coverage by Household Income in Hermitage
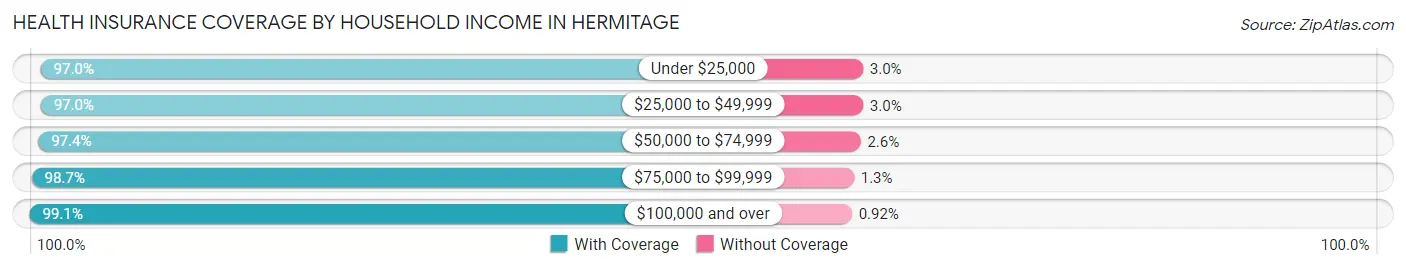
| Household Income | With Coverage | Without Coverage |
| Under $25,000 | 1,866 (97.0%) | 58 (3.0%) |
| $25,000 to $49,999 | 2,926 (97.0%) | 91 (3.0%) |
| $50,000 to $74,999 | 2,092 (97.4%) | 55 (2.6%) |
| $75,000 to $99,999 | 2,113 (98.7%) | 28 (1.3%) |
| $100,000 and over | 6,534 (99.1%) | 61 (0.9%) |
Public vs Private Health Insurance Coverage by Age in Hermitage
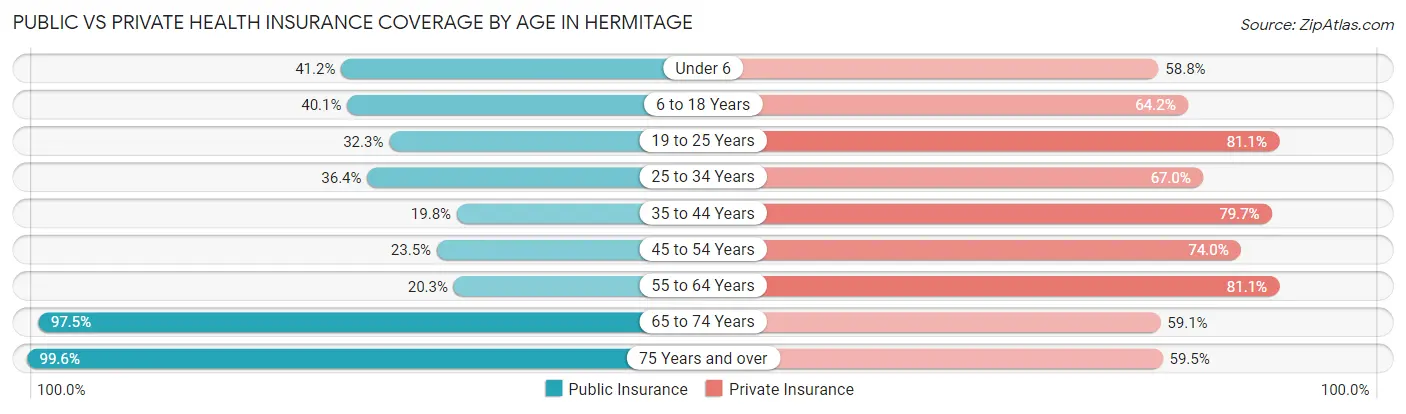
| Age Bracket | Public Insurance | Private Insurance |
| Under 6 | 275 (41.2%) | 392 (58.8%) |
| 6 to 18 Years | 986 (40.1%) | 1,577 (64.2%) |
| 19 to 25 Years | 224 (32.3%) | 562 (81.1%) |
| 25 to 34 Years | 628 (36.4%) | 1,156 (67.0%) |
| 35 to 44 Years | 315 (19.8%) | 1,271 (79.7%) |
| 45 to 54 Years | 465 (23.5%) | 1,466 (74.0%) |
| 55 to 64 Years | 527 (20.3%) | 2,102 (81.1%) |
| 65 to 74 Years | 1,984 (97.5%) | 1,203 (59.1%) |
| 75 Years and over | 2,132 (99.6%) | 1,274 (59.5%) |
| Total | 7,536 (47.4%) | 11,003 (69.3%) |
Disability Status by Sex by Age in Hermitage
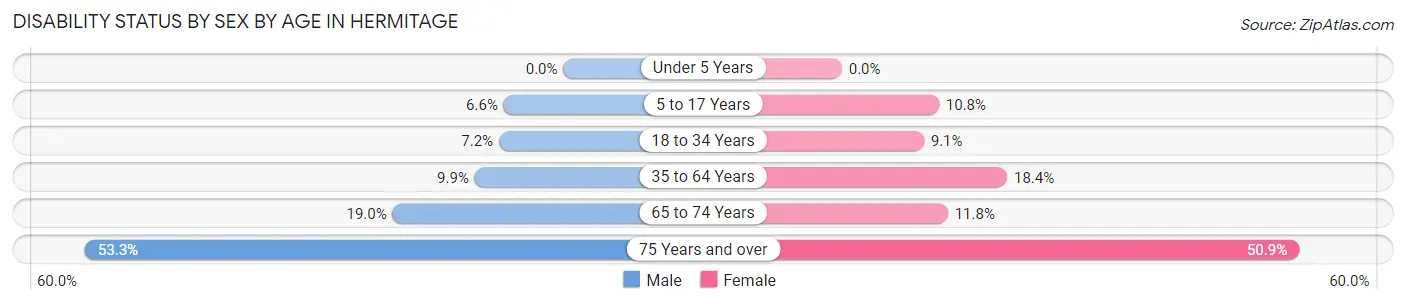
| Age Bracket | Male | Female |
| Under 5 Years | 0 (0.0%) | 0 (0.0%) |
| 5 to 17 Years | 73 (6.6%) | 127 (10.8%) |
| 18 to 34 Years | 93 (7.2%) | 123 (9.1%) |
| 35 to 64 Years | 308 (9.9%) | 560 (18.4%) |
| 65 to 74 Years | 179 (19.0%) | 129 (11.8%) |
| 75 Years and over | 528 (53.3%) | 585 (50.9%) |
Disability Class by Sex by Age in Hermitage
Disability Class: Hearing Difficulty
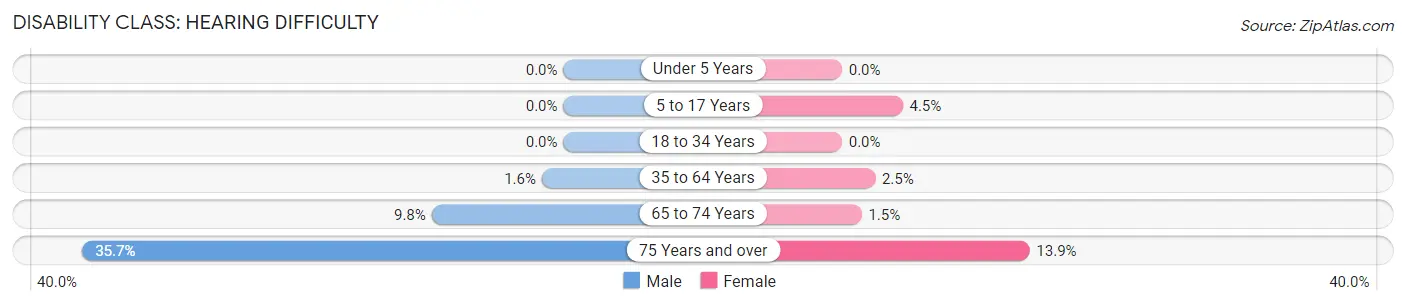
| Age Bracket | Male | Female |
| Under 5 Years | 0 (0.0%) | 0 (0.0%) |
| 5 to 17 Years | 0 (0.0%) | 53 (4.5%) |
| 18 to 34 Years | 0 (0.0%) | 0 (0.0%) |
| 35 to 64 Years | 50 (1.6%) | 75 (2.5%) |
| 65 to 74 Years | 92 (9.8%) | 16 (1.5%) |
| 75 Years and over | 354 (35.7%) | 160 (13.9%) |
Disability Class: Vision Difficulty
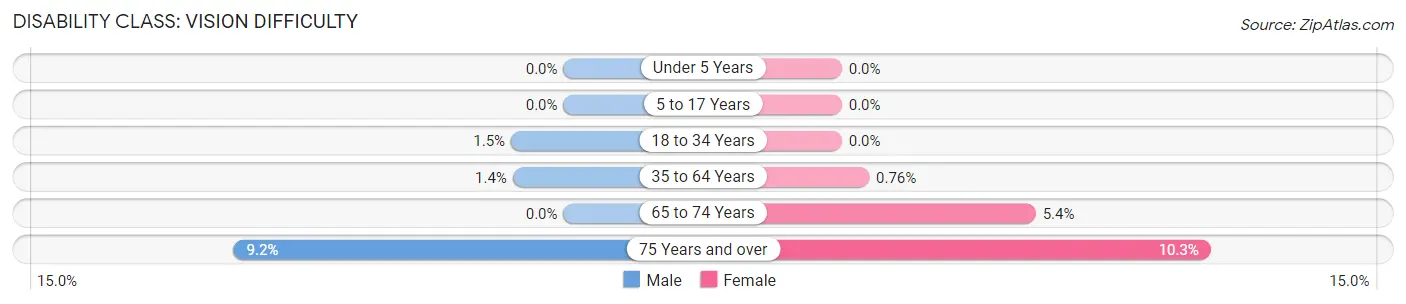
| Age Bracket | Male | Female |
| Under 5 Years | 0 (0.0%) | 0 (0.0%) |
| 5 to 17 Years | 0 (0.0%) | 0 (0.0%) |
| 18 to 34 Years | 19 (1.5%) | 0 (0.0%) |
| 35 to 64 Years | 44 (1.4%) | 23 (0.8%) |
| 65 to 74 Years | 0 (0.0%) | 59 (5.4%) |
| 75 Years and over | 91 (9.2%) | 118 (10.3%) |
Disability Class: Cognitive Difficulty
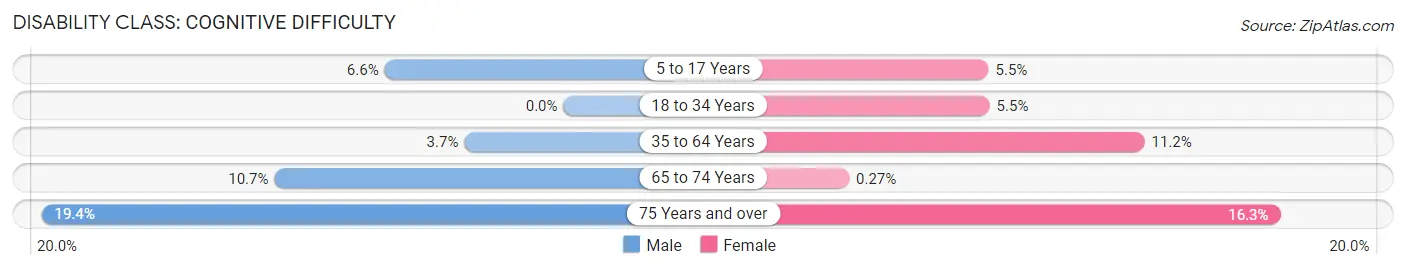
| Age Bracket | Male | Female |
| 5 to 17 Years | 73 (6.6%) | 64 (5.4%) |
| 18 to 34 Years | 0 (0.0%) | 74 (5.5%) |
| 35 to 64 Years | 115 (3.7%) | 342 (11.2%) |
| 65 to 74 Years | 101 (10.7%) | 3 (0.3%) |
| 75 Years and over | 192 (19.4%) | 187 (16.3%) |
Disability Class: Ambulatory Difficulty
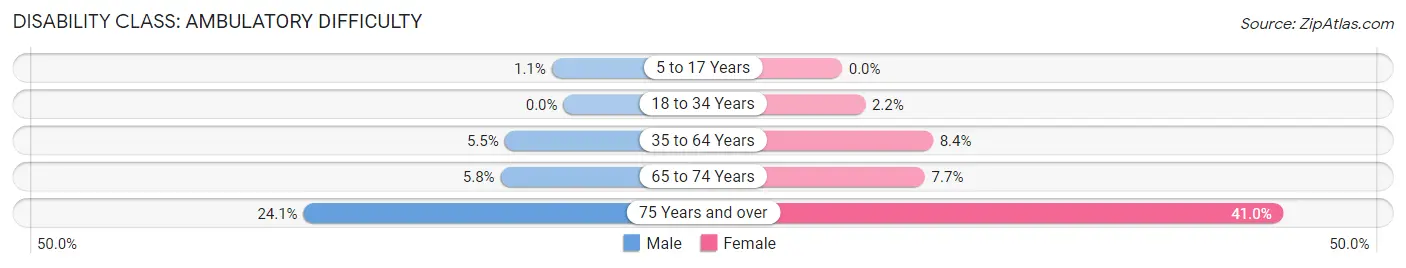
| Age Bracket | Male | Female |
| 5 to 17 Years | 12 (1.1%) | 0 (0.0%) |
| 18 to 34 Years | 0 (0.0%) | 29 (2.1%) |
| 35 to 64 Years | 170 (5.4%) | 257 (8.4%) |
| 65 to 74 Years | 55 (5.8%) | 84 (7.7%) |
| 75 Years and over | 239 (24.1%) | 471 (41.0%) |
Disability Class: Self-Care Difficulty
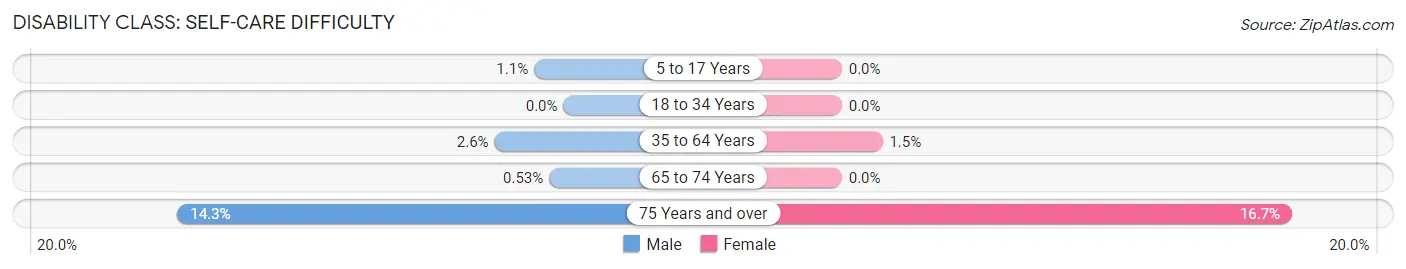
| Age Bracket | Male | Female |
| 5 to 17 Years | 12 (1.1%) | 0 (0.0%) |
| 18 to 34 Years | 0 (0.0%) | 0 (0.0%) |
| 35 to 64 Years | 80 (2.6%) | 46 (1.5%) |
| 65 to 74 Years | 5 (0.5%) | 0 (0.0%) |
| 75 Years and over | 142 (14.3%) | 192 (16.7%) |
Technology Access in Hermitage
Computing Device Access in Hermitage
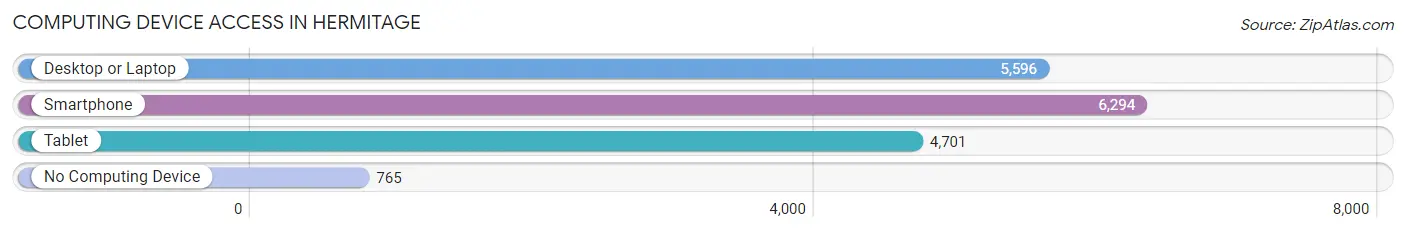
| Device Type | # Households | % Households |
| Desktop or Laptop | 5,596 | 73.3% |
| Smartphone | 6,294 | 82.5% |
| Tablet | 4,701 | 61.6% |
| No Computing Device | 765 | 10.0% |
| Total | 7,631 | 100.0% |
Internet Access in Hermitage
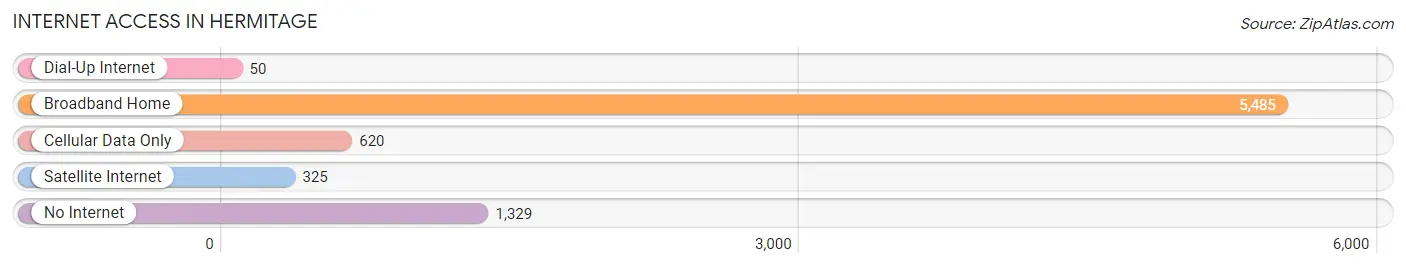
| Internet Type | # Households | % Households |
| Dial-Up Internet | 50 | 0.7% |
| Broadband Home | 5,485 | 71.9% |
| Cellular Data Only | 620 | 8.1% |
| Satellite Internet | 325 | 4.3% |
| No Internet | 1,329 | 17.4% |
| Total | 7,631 | 100.0% |
Hermitage Summary
Hermitage, Pennsylvania is a small city located in Mercer County, Pennsylvania. It is situated along the Shenango River, approximately 20 miles northwest of Youngstown, Ohio. The city has a population of 16,220 as of the 2010 census, making it the largest city in Mercer County.
History
The area that is now Hermitage was first settled in 1795 by a group of settlers from Connecticut. The settlers named the area “Hermitage” after the nearby Hermitage Inn, which was built in 1797. The inn was a popular stop for travelers on the Shenango River.
In 1803, the first post office was established in Hermitage. The town was officially incorporated in 1845.
In the late 19th century, Hermitage experienced a period of growth and development. The Shenango Valley Railroad was built in 1871, connecting Hermitage to Youngstown, Ohio. This allowed for the transportation of goods and people between the two cities.
In the early 20th century, Hermitage experienced a period of industrialization. The Shenango Valley Steel Company was established in 1906, and the Shenango Pottery Company was established in 1910. These companies provided employment opportunities for many of the city’s residents.
Geography
Hermitage is located in Mercer County, Pennsylvania. It is situated along the Shenango River, approximately 20 miles northwest of Youngstown, Ohio. The city has a total area of 4.3 square miles, all of which is land.
The city is located in the humid continental climate zone, with hot summers and cold winters. The average annual temperature is 50.2°F, and the average annual precipitation is 39.3 inches.
Economy
Hermitage’s economy is largely based on manufacturing and retail. The city is home to several large manufacturing companies, including the Shenango Valley Steel Company and the Shenango Pottery Company.
Retail is also an important part of the city’s economy. Hermitage is home to several large shopping centers, including the Hermitage Mall and the Shenango Valley Mall.
Demographics
As of the 2010 census, Hermitage had a population of 16,220. The racial makeup of the city was 92.3% White, 4.2% African American, 0.5% Native American, 0.7% Asian, 0.1% Pacific Islander, and 1.2% from other races. Hispanic or Latino of any race were 1.7% of the population.
The median household income in Hermitage was $41,945, and the median family income was $50,945. The per capita income was $20,945. About 11.2% of the population was below the poverty line.
Common Questions
What is Per Capita Income in Hermitage?
Per Capita income in Hermitage is $43,003.
What is the Median Family Income in Hermitage?
Median Family Income in Hermitage is $88,644.
What is the Median Household income in Hermitage?
Median Household Income in Hermitage is $66,922.
What is Income or Wage Gap in Hermitage?
Income or Wage Gap in Hermitage is 42.4%.
Women in Hermitage earn 57.6 cents for every dollar earned by a man.
What is Inequality or Gini Index in Hermitage?
Inequality or Gini Index in Hermitage is 0.47.
What is the Total Population of Hermitage?
Total Population of Hermitage is 16,216.
What is the Total Male Population of Hermitage?
Total Male Population of Hermitage is 7,903.
What is the Total Female Population of Hermitage?
Total Female Population of Hermitage is 8,313.
What is the Ratio of Males per 100 Females in Hermitage?
There are 95.07 Males per 100 Females in Hermitage.
What is the Ratio of Females per 100 Males in Hermitage?
There are 105.19 Females per 100 Males in Hermitage.
What is the Median Population Age in Hermitage?
Median Population Age in Hermitage is 49.2 Years.
What is the Average Family Size in Hermitage
Average Family Size in Hermitage is 2.7 People.
What is the Average Household Size in Hermitage
Average Household Size in Hermitage is 2.1 People.
How Large is the Labor Force in Hermitage?
There are 7,575 People in the Labor Forcein in Hermitage.
What is the Percentage of People in the Labor Force in Hermitage?
55.3% of People are in the Labor Force in Hermitage.
What is the Unemployment Rate in Hermitage?
Unemployment Rate in Hermitage is 5.1%.