Bellefonte borough, PA Map & Demographics
Bellefonte borough Overview
$35,961
PER CAPITA INCOME
$96,250
AVG FAMILY INCOME
$56,008
AVG HOUSEHOLD INCOME
26.7%
WAGE / INCOME GAP [ % ]
73.3¢/ $1
WAGE / INCOME GAP [ $ ]
0.42
INEQUALITY / GINI INDEX
6,071
TOTAL POPULATION
3,020
MALE POPULATION
3,051
FEMALE POPULATION
98.98
MALES / 100 FEMALES
101.03
FEMALES / 100 MALES
43.0
MEDIAN AGE
2.6
AVG FAMILY SIZE
2.0
AVG HOUSEHOLD SIZE
3,418
LABOR FORCE [ PEOPLE ]
65.9%
PERCENT IN LABOR FORCE
1.1%
UNEMPLOYMENT RATE
Income in Bellefonte borough
Income Overview in Bellefonte borough
Per Capita Income in Bellefonte borough is $35,961, while median incomes of families and households are $96,250 and $56,008 respectively.
| Characteristic | Number | Measure |
| Per Capita Income | 6,071 | $35,961 |
| Median Family Income | 1,537 | $96,250 |
| Mean Family Income | 1,537 | $100,242 |
| Median Household Income | 2,884 | $56,008 |
| Mean Household Income | 2,884 | $74,000 |
| Income Deficit | 1,537 | $0 |
| Wage / Income Gap (%) | 6,071 | 26.65% |
| Wage / Income Gap ($) | 6,071 | 73.35¢ per $1 |
| Gini / Inequality Index | 6,071 | 0.42 |
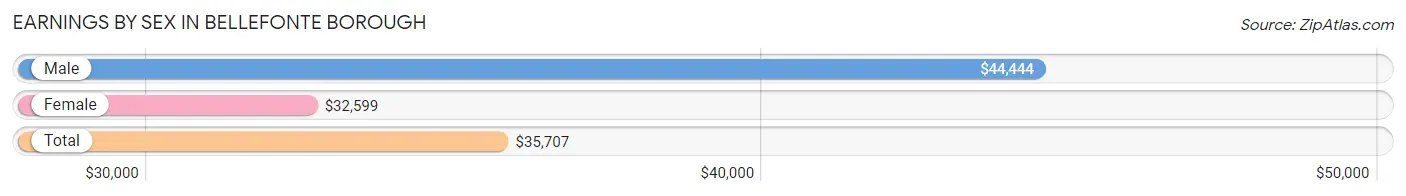
Earnings by Sex in Bellefonte borough
Average Earnings in Bellefonte borough are $35,707, $44,444 for men and $32,599 for women, a difference of 26.7%.
| Sex | Number | Average Earnings |
| Male | 1,876 (52.2%) | $44,444 |
| Female | 1,716 (47.8%) | $32,599 |
| Total | 3,592 (100.0%) | $35,707 |
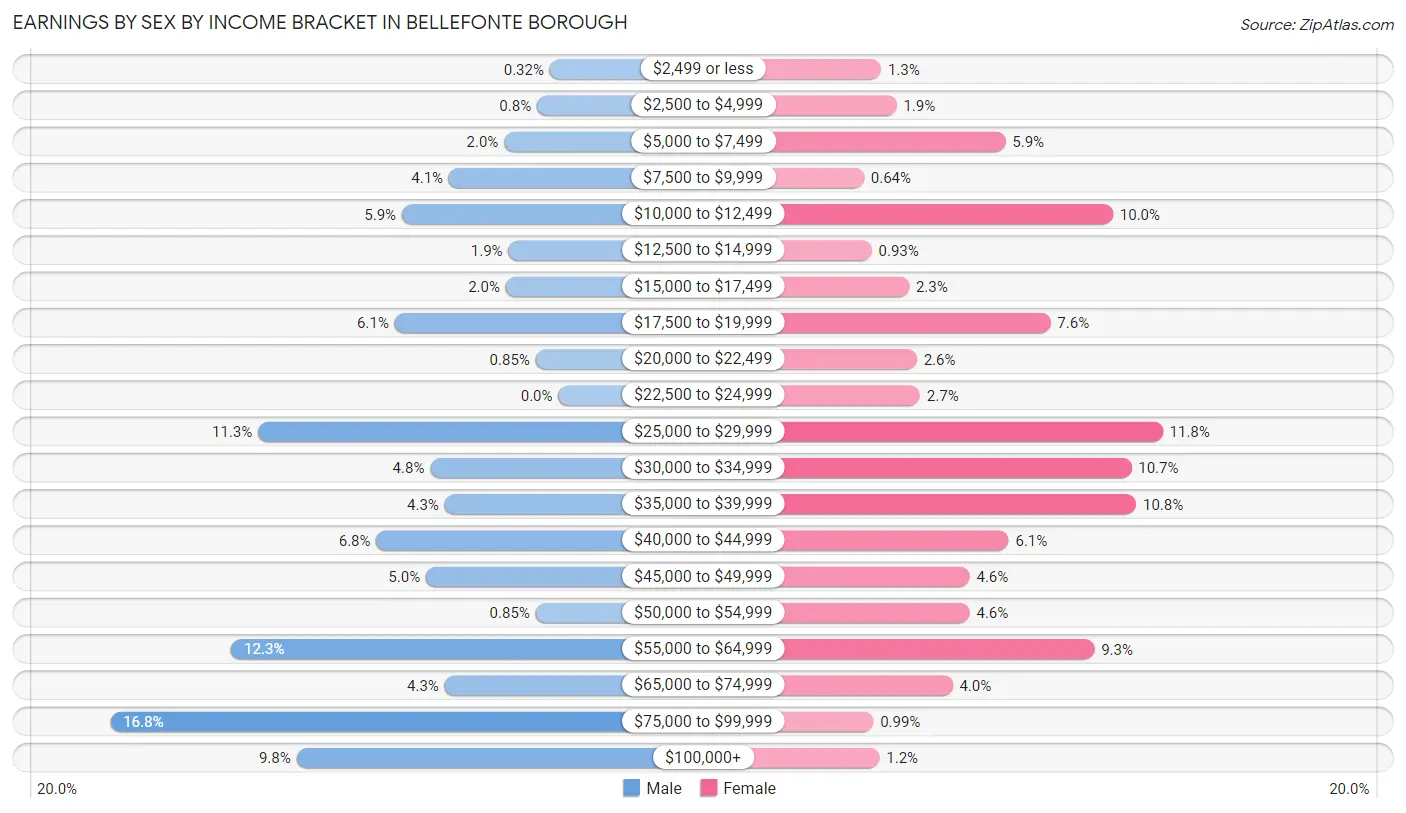
Earnings by Sex by Income Bracket in Bellefonte borough
The most common earnings brackets in Bellefonte borough are $75,000 to $99,999 for men (315 | 16.8%) and $25,000 to $29,999 for women (203 | 11.8%).
| Income | Male | Female |
| $2,499 or less | 6 (0.3%) | 22 (1.3%) |
| $2,500 to $4,999 | 15 (0.8%) | 32 (1.9%) |
| $5,000 to $7,499 | 38 (2.0%) | 102 (5.9%) |
| $7,500 to $9,999 | 77 (4.1%) | 11 (0.6%) |
| $10,000 to $12,499 | 110 (5.9%) | 171 (10.0%) |
| $12,500 to $14,999 | 35 (1.9%) | 16 (0.9%) |
| $15,000 to $17,499 | 37 (2.0%) | 40 (2.3%) |
| $17,500 to $19,999 | 115 (6.1%) | 131 (7.6%) |
| $20,000 to $22,499 | 16 (0.9%) | 45 (2.6%) |
| $22,500 to $24,999 | 0 (0.0%) | 47 (2.7%) |
| $25,000 to $29,999 | 211 (11.3%) | 203 (11.8%) |
| $30,000 to $34,999 | 90 (4.8%) | 183 (10.7%) |
| $35,000 to $39,999 | 80 (4.3%) | 186 (10.8%) |
| $40,000 to $44,999 | 128 (6.8%) | 104 (6.1%) |
| $45,000 to $49,999 | 93 (5.0%) | 79 (4.6%) |
| $50,000 to $54,999 | 16 (0.9%) | 79 (4.6%) |
| $55,000 to $64,999 | 230 (12.3%) | 159 (9.3%) |
| $65,000 to $74,999 | 80 (4.3%) | 68 (4.0%) |
| $75,000 to $99,999 | 315 (16.8%) | 17 (1.0%) |
| $100,000+ | 184 (9.8%) | 21 (1.2%) |
| Total | 1,876 (100.0%) | 1,716 (100.0%) |
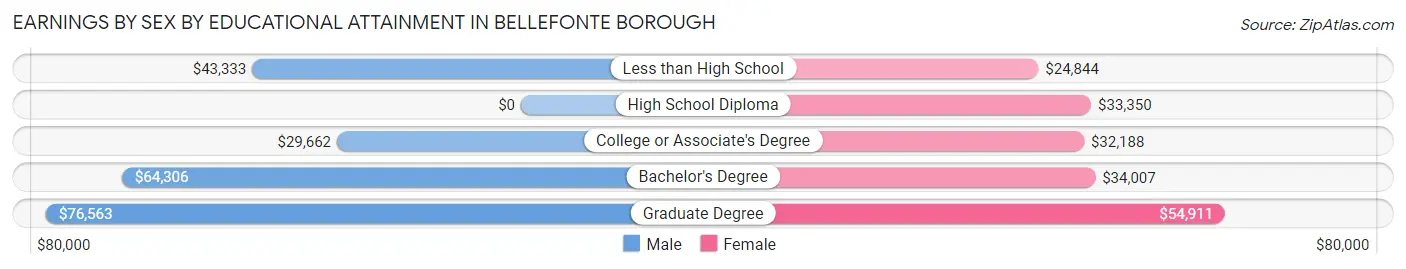
Earnings by Sex by Educational Attainment in Bellefonte borough
Average earnings in Bellefonte borough are $45,766 for men and $34,412 for women, a difference of 24.8%. Men with an educational attainment of graduate degree enjoy the highest average annual earnings of $76,563, while those with college or associate's degree education earn the least with $29,662. Women with an educational attainment of graduate degree earn the most with the average annual earnings of $54,911, while those with less than high school education have the smallest earnings of $24,844.
| Educational Attainment | Male Income | Female Income |
| Less than High School | $43,333 | $24,844 |
| High School Diploma | - | - |
| College or Associate's Degree | $29,662 | $32,188 |
| Bachelor's Degree | $64,306 | $34,007 |
| Graduate Degree | $76,563 | $54,911 |
| Total | $45,766 | $34,412 |
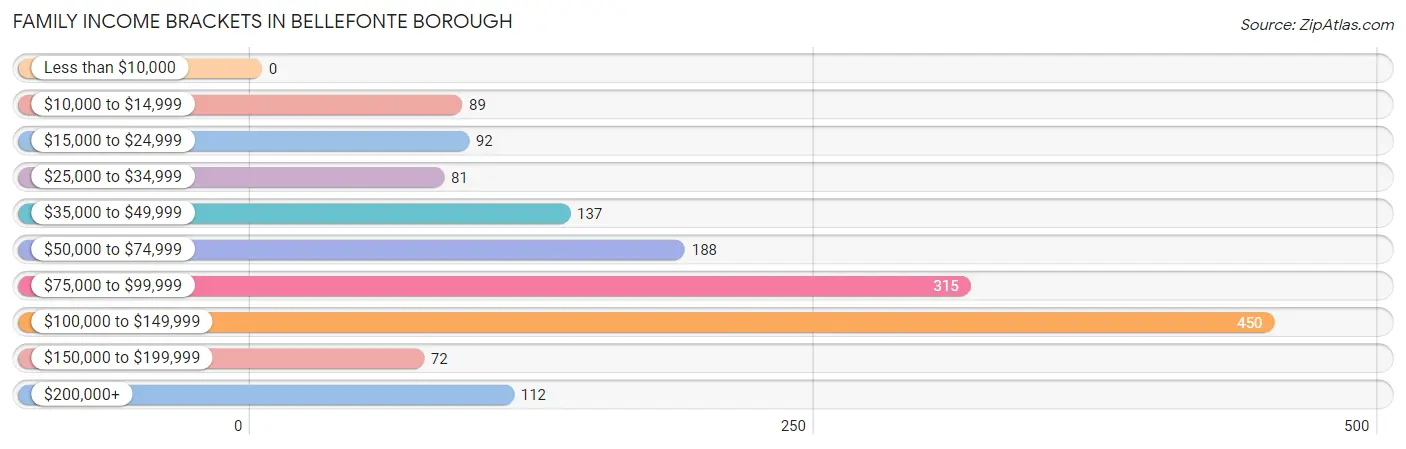
Family Income in Bellefonte borough
Family Income Brackets in Bellefonte borough
According to the Bellefonte borough family income data, there are 450 families falling into the $100,000 to $149,999 income range, which is the most common income bracket and makes up 29.3% of all families.
| Income Bracket | # Families | % Families |
| Less than $10,000 | 0 | 0.0% |
| $10,000 to $14,999 | 89 | 5.8% |
| $15,000 to $24,999 | 92 | 6.0% |
| $25,000 to $34,999 | 81 | 5.3% |
| $35,000 to $49,999 | 137 | 8.9% |
| $50,000 to $74,999 | 188 | 12.2% |
| $75,000 to $99,999 | 315 | 20.5% |
| $100,000 to $149,999 | 450 | 29.3% |
| $150,000 to $199,999 | 72 | 4.7% |
| $200,000+ | 112 | 7.3% |
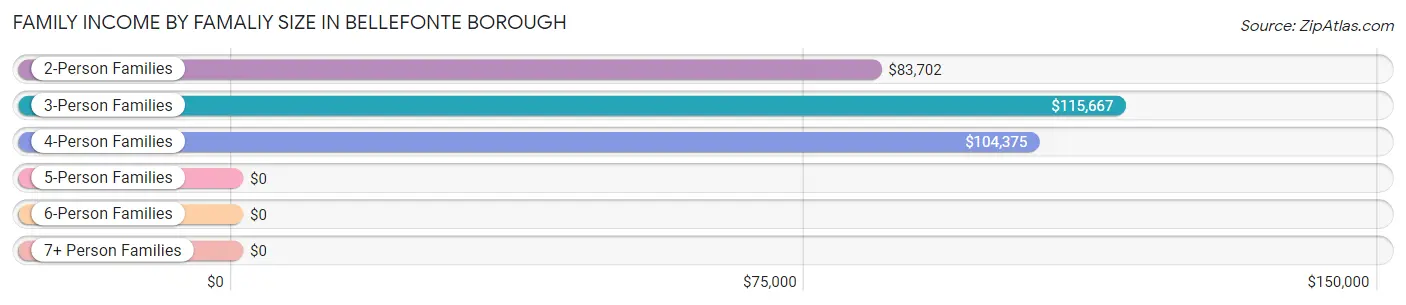
Family Income by Famaliy Size in Bellefonte borough
3-person families (404 | 26.3%) account for the highest median family income in Bellefonte borough with $115,667 per family, while 2-person families (819 | 53.3%) have the highest median income of $41,851 per family member.
| Income Bracket | # Families | Median Income |
| 2-Person Families | 819 (53.3%) | $83,702 |
| 3-Person Families | 404 (26.3%) | $115,667 |
| 4-Person Families | 245 (15.9%) | $104,375 |
| 5-Person Families | 69 (4.5%) | $0 |
| 6-Person Families | 0 (0.0%) | $0 |
| 7+ Person Families | 0 (0.0%) | $0 |
| Total | 1,537 (100.0%) | $96,250 |
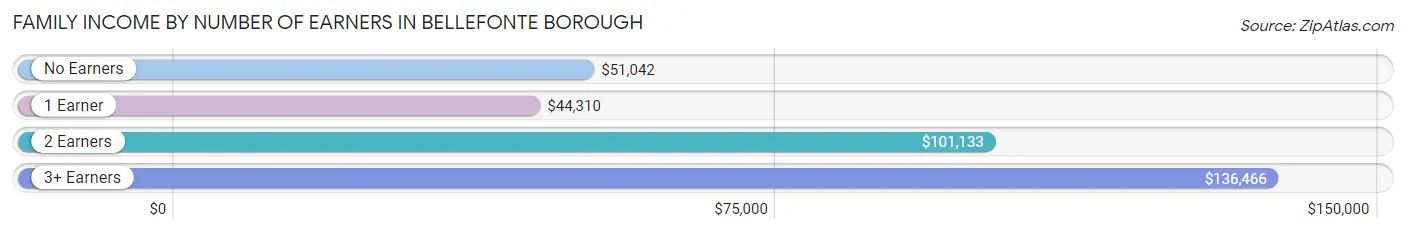
Family Income by Number of Earners in Bellefonte borough
The median family income in Bellefonte borough is $96,250, with families comprising 3+ earners (126) having the highest median family income of $136,466, while families with 1 earner (430) have the lowest median family income of $44,310, accounting for 8.2% and 28.0% of families, respectively.
| Number of Earners | # Families | Median Income |
| No Earners | 194 (12.6%) | $51,042 |
| 1 Earner | 430 (28.0%) | $44,310 |
| 2 Earners | 787 (51.2%) | $101,133 |
| 3+ Earners | 126 (8.2%) | $136,466 |
| Total | 1,537 (100.0%) | $96,250 |
Household Income in Bellefonte borough
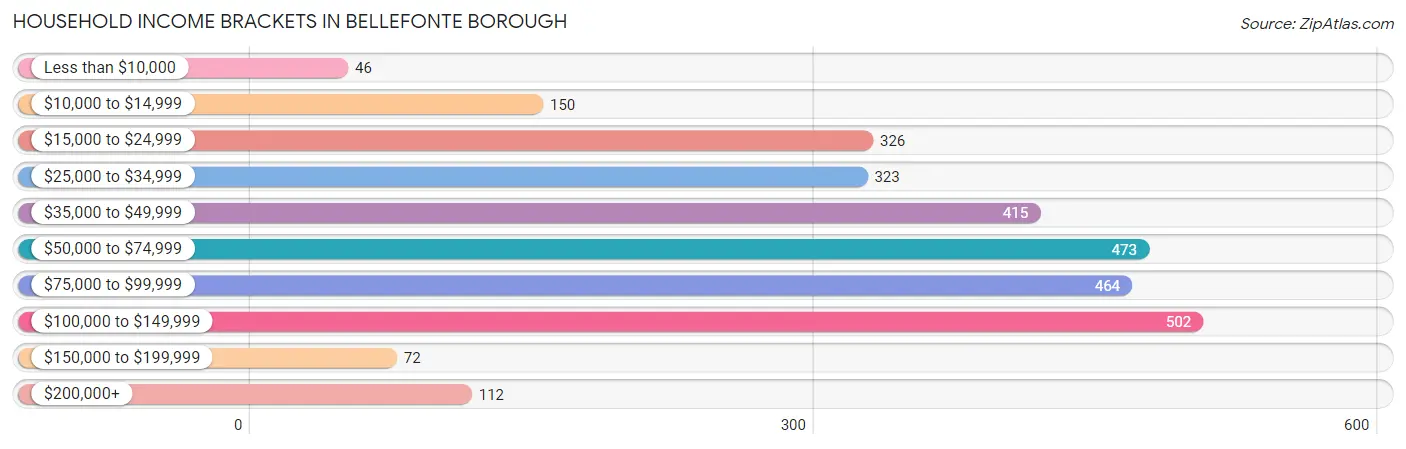
Household Income Brackets in Bellefonte borough
With 502 households falling in the category, the $100,000 to $149,999 income range is the most frequent in Bellefonte borough, accounting for 17.4% of all households. In contrast, only 46 households (1.6%) fall into the less than $10,000 income bracket, making it the least populous group.
| Income Bracket | # Households | % Households |
| Less than $10,000 | 46 | 1.6% |
| $10,000 to $14,999 | 150 | 5.2% |
| $15,000 to $24,999 | 326 | 11.3% |
| $25,000 to $34,999 | 323 | 11.2% |
| $35,000 to $49,999 | 415 | 14.4% |
| $50,000 to $74,999 | 473 | 16.4% |
| $75,000 to $99,999 | 464 | 16.1% |
| $100,000 to $149,999 | 502 | 17.4% |
| $150,000 to $199,999 | 72 | 2.5% |
| $200,000+ | 112 | 3.9% |
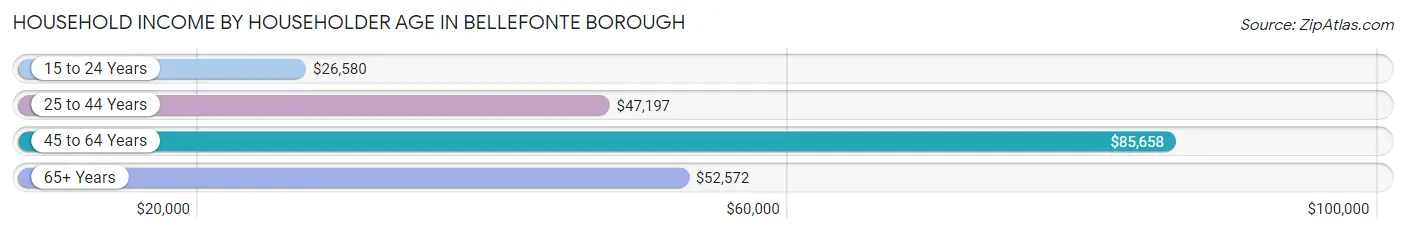
Household Income by Householder Age in Bellefonte borough
The median household income in Bellefonte borough is $56,008, with the highest median household income of $85,658 found in the 45 to 64 years age bracket for the primary householder. A total of 1,038 households (36.0%) fall into this category. Meanwhile, the 15 to 24 years age bracket for the primary householder has the lowest median household income of $26,580, with 205 households (7.1%) in this group.
| Income Bracket | # Households | Median Income |
| 15 to 24 Years | 205 (7.1%) | $26,580 |
| 25 to 44 Years | 912 (31.6%) | $47,197 |
| 45 to 64 Years | 1,038 (36.0%) | $85,658 |
| 65+ Years | 729 (25.3%) | $52,572 |
| Total | 2,884 (100.0%) | $56,008 |
Poverty in Bellefonte borough
Income Below Poverty by Sex and Age in Bellefonte borough
With 11.4% poverty level for males and 13.7% for females among the residents of Bellefonte borough, 6 to 11 year old males and 6 to 11 year old females are the most vulnerable to poverty, with 66 males (51.6%) and 107 females (33.5%) in their respective age groups living below the poverty level.
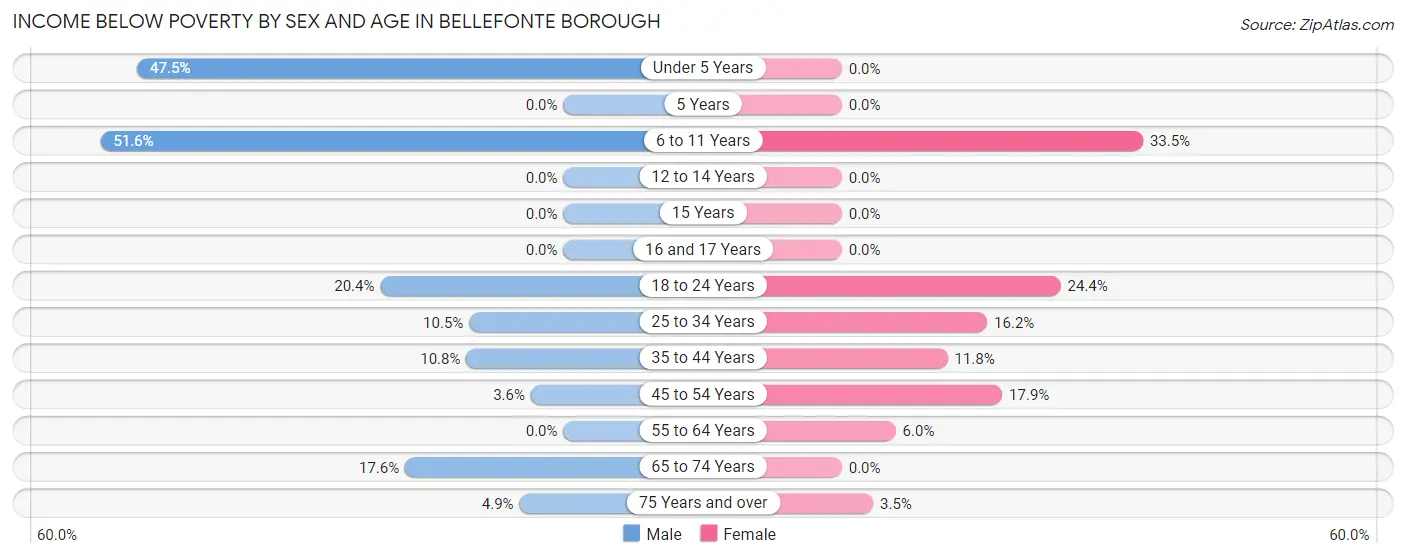
| Age Bracket | Male | Female |
| Under 5 Years | 56 (47.5%) | 0 (0.0%) |
| 5 Years | 0 (0.0%) | 0 (0.0%) |
| 6 to 11 Years | 66 (51.6%) | 107 (33.5%) |
| 12 to 14 Years | 0 (0.0%) | 0 (0.0%) |
| 15 Years | 0 (0.0%) | 0 (0.0%) |
| 16 and 17 Years | 0 (0.0%) | 0 (0.0%) |
| 18 to 24 Years | 21 (20.4%) | 68 (24.4%) |
| 25 to 34 Years | 56 (10.5%) | 79 (16.2%) |
| 35 to 44 Years | 51 (10.8%) | 37 (11.8%) |
| 45 to 54 Years | 17 (3.6%) | 65 (17.9%) |
| 55 to 64 Years | 0 (0.0%) | 30 (6.0%) |
| 65 to 74 Years | 61 (17.6%) | 0 (0.0%) |
| 75 Years and over | 9 (4.9%) | 9 (3.5%) |
| Total | 337 (11.4%) | 395 (13.7%) |
Income Above Poverty by Sex and Age in Bellefonte borough
According to the poverty statistics in Bellefonte borough, males aged 5 years and females aged under 5 years are the age groups that are most secure financially, with 100.0% of males and 100.0% of females in these age groups living above the poverty line.
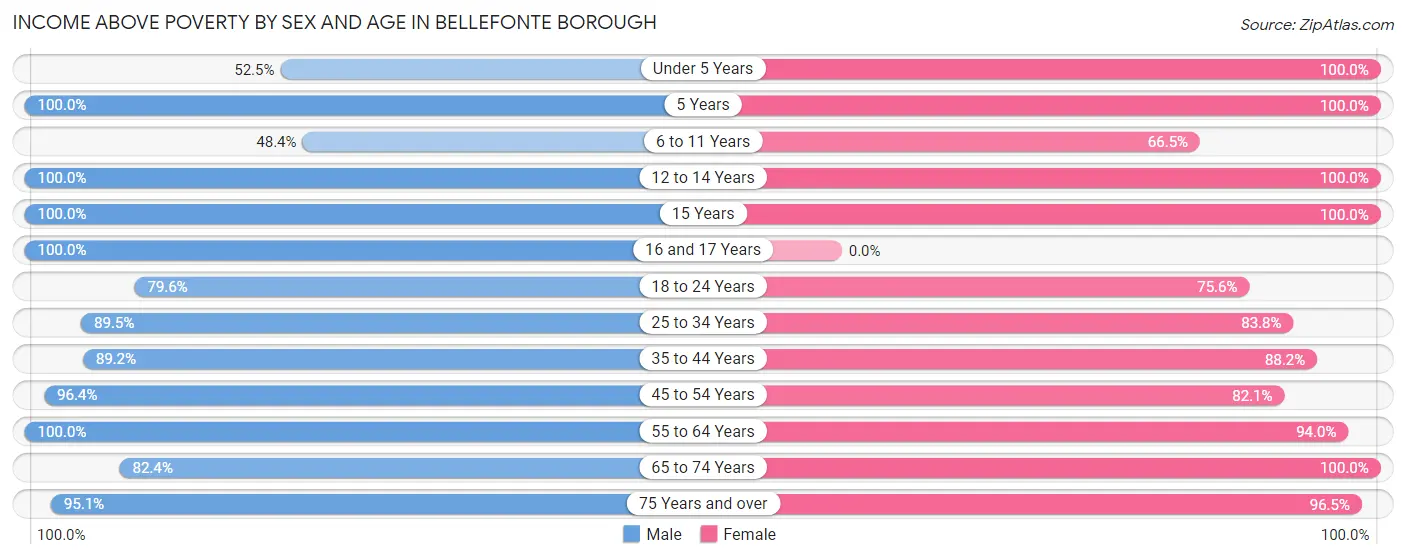
| Age Bracket | Male | Female |
| Under 5 Years | 62 (52.5%) | 56 (100.0%) |
| 5 Years | 14 (100.0%) | 15 (100.0%) |
| 6 to 11 Years | 62 (48.4%) | 212 (66.5%) |
| 12 to 14 Years | 150 (100.0%) | 42 (100.0%) |
| 15 Years | 34 (100.0%) | 9 (100.0%) |
| 16 and 17 Years | 28 (100.0%) | 0 (0.0%) |
| 18 to 24 Years | 82 (79.6%) | 211 (75.6%) |
| 25 to 34 Years | 478 (89.5%) | 409 (83.8%) |
| 35 to 44 Years | 421 (89.2%) | 277 (88.2%) |
| 45 to 54 Years | 451 (96.4%) | 299 (82.1%) |
| 55 to 64 Years | 373 (100.0%) | 470 (94.0%) |
| 65 to 74 Years | 285 (82.4%) | 230 (100.0%) |
| 75 Years and over | 175 (95.1%) | 249 (96.5%) |
| Total | 2,615 (88.6%) | 2,479 (86.3%) |
Income Below Poverty Among Married-Couple Families in Bellefonte borough
The poverty statistics for married-couple families in Bellefonte borough show that 1.9% or 24 of the total 1,231 families live below the poverty line. Families with no children have the highest poverty rate of 2.9%, comprising of 24 families. On the other hand, families with 1 or 2 children have the lowest poverty rate of 0.0%, which includes 0 families.
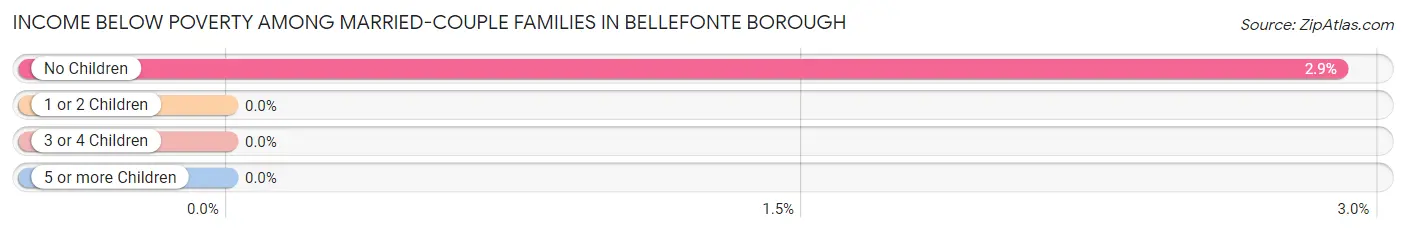
| Children | Above Poverty | Below Poverty |
| No Children | 805 (97.1%) | 24 (2.9%) |
| 1 or 2 Children | 345 (100.0%) | 0 (0.0%) |
| 3 or 4 Children | 57 (100.0%) | 0 (0.0%) |
| 5 or more Children | 0 (0.0%) | 0 (0.0%) |
| Total | 1,207 (98.1%) | 24 (1.9%) |
Income Below Poverty Among Single-Parent Households in Bellefonte borough
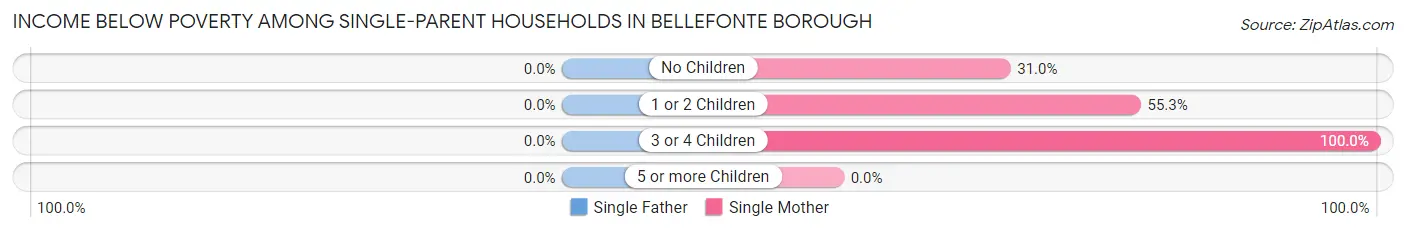
| Children | Single Father | Single Mother |
| No Children | 0 (0.0%) | 18 (31.0%) |
| 1 or 2 Children | 0 (0.0%) | 47 (55.3%) |
| 3 or 4 Children | 0 (0.0%) | 79 (100.0%) |
| 5 or more Children | 0 (0.0%) | 0 (0.0%) |
| Total | 0 (0.0%) | 144 (64.9%) |
Income Below Poverty Among Married-Couple vs Single-Parent Households in Bellefonte borough
The poverty data for Bellefonte borough shows that 24 of the married-couple family households (1.9%) and 144 of the single-parent households (47.1%) are living below the poverty level. Within the married-couple family households, those with no children have the highest poverty rate, with 24 households (2.9%) falling below the poverty line. Among the single-parent households, those with 3 or 4 children have the highest poverty rate, with 79 household (100.0%) living below poverty.
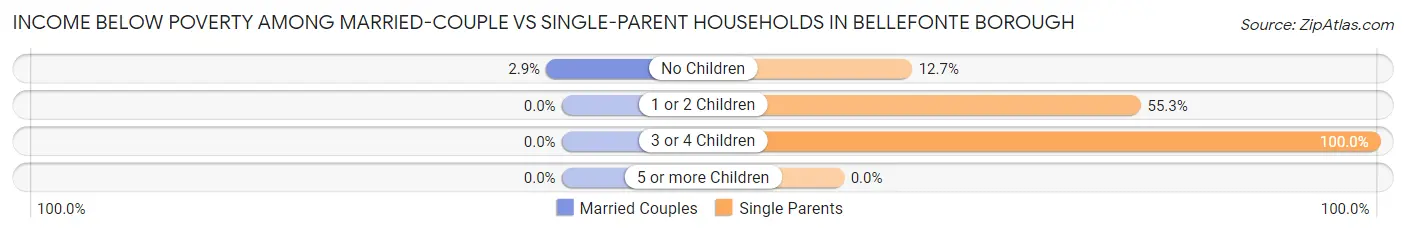
| Children | Married-Couple Families | Single-Parent Households |
| No Children | 24 (2.9%) | 18 (12.7%) |
| 1 or 2 Children | 0 (0.0%) | 47 (55.3%) |
| 3 or 4 Children | 0 (0.0%) | 79 (100.0%) |
| 5 or more Children | 0 (0.0%) | 0 (0.0%) |
| Total | 24 (1.9%) | 144 (47.1%) |
Race in Bellefonte borough
The most populous races in Bellefonte borough are White / Caucasian (5,553 | 91.5%), Two or more Races (221 | 3.6%), and Asian (162 | 2.7%).
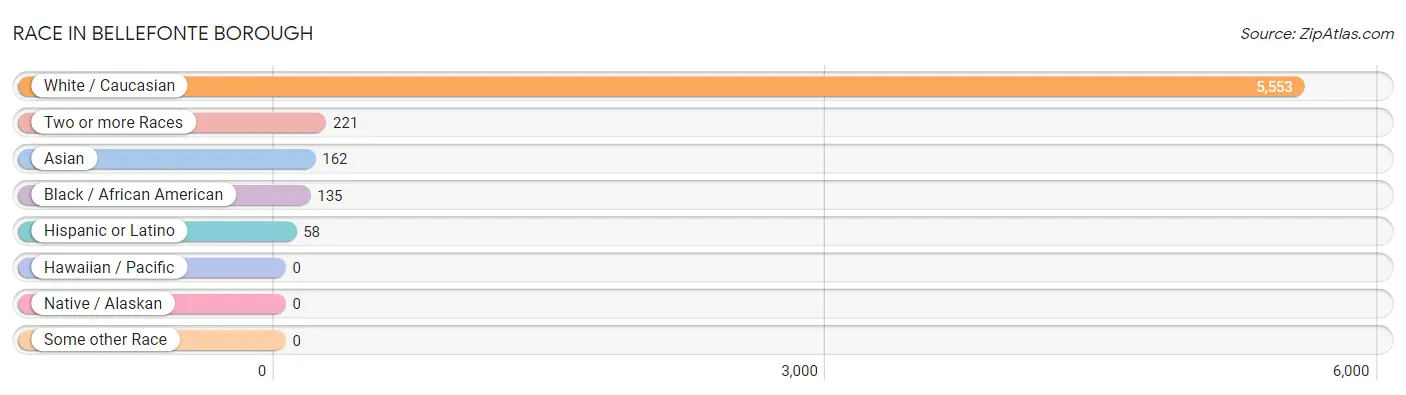
| Race | # Population | % Population |
| Asian | 162 | 2.7% |
| Black / African American | 135 | 2.2% |
| Hawaiian / Pacific | 0 | 0.0% |
| Hispanic or Latino | 58 | 1.0% |
| Native / Alaskan | 0 | 0.0% |
| White / Caucasian | 5,553 | 91.5% |
| Two or more Races | 221 | 3.6% |
| Some other Race | 0 | 0.0% |
| Total | 6,071 | 100.0% |
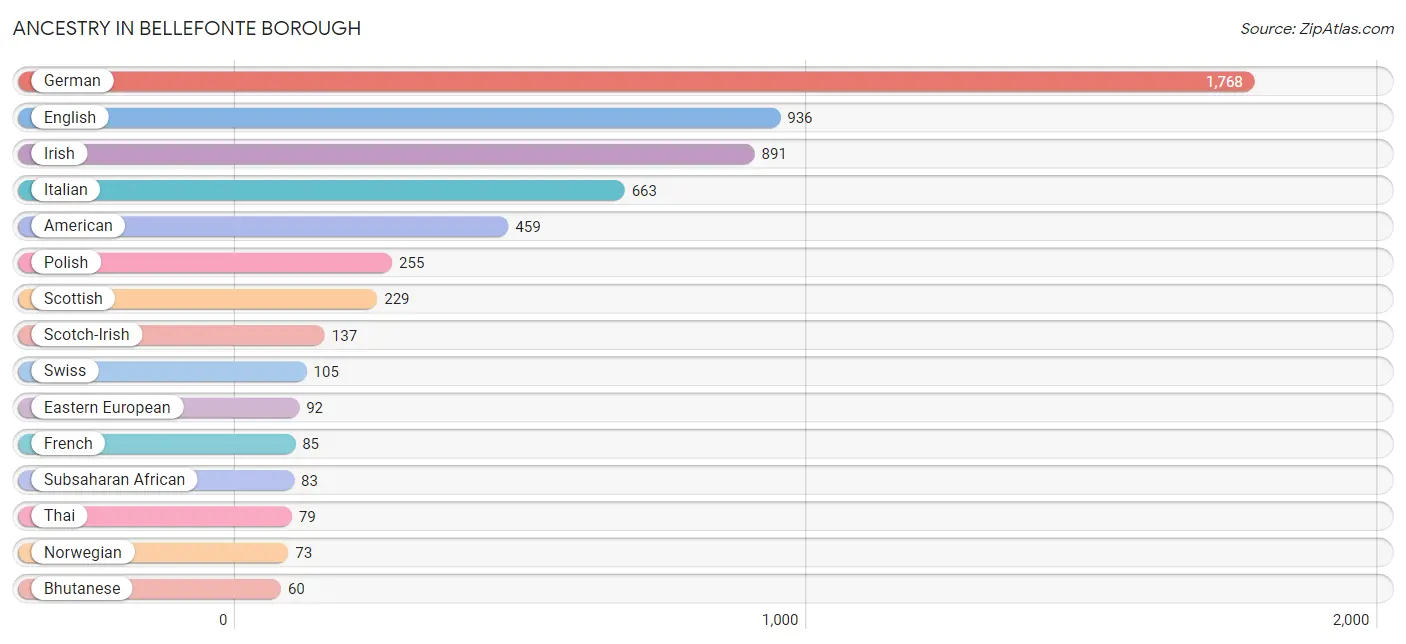
Ancestry in Bellefonte borough
The most populous ancestries reported in Bellefonte borough are German (1,768 | 29.1%), English (936 | 15.4%), Irish (891 | 14.7%), Italian (663 | 10.9%), and American (459 | 7.6%), together accounting for 77.7% of all Bellefonte borough residents.
| Ancestry | # Population | % Population |
| American | 459 | 7.6% |
| Bhutanese | 60 | 1.0% |
| Brazilian | 14 | 0.2% |
| Burmese | 21 | 0.4% |
| Croatian | 13 | 0.2% |
| Czech | 14 | 0.2% |
| Czechoslovakian | 17 | 0.3% |
| Danish | 7 | 0.1% |
| Dutch | 46 | 0.8% |
| Eastern European | 92 | 1.5% |
| English | 936 | 15.4% |
| French | 85 | 1.4% |
| French Canadian | 26 | 0.4% |
| German | 1,768 | 29.1% |
| Greek | 16 | 0.3% |
| Hungarian | 8 | 0.1% |
| Indian (Asian) | 55 | 0.9% |
| Irish | 891 | 14.7% |
| Italian | 663 | 10.9% |
| Jamaican | 51 | 0.8% |
| Korean | 18 | 0.3% |
| Lithuanian | 33 | 0.5% |
| Mexican | 6 | 0.1% |
| Norwegian | 73 | 1.2% |
| Pakistani | 17 | 0.3% |
| Pennsylvania German | 20 | 0.3% |
| Peruvian | 22 | 0.4% |
| Polish | 255 | 4.2% |
| Romanian | 37 | 0.6% |
| Russian | 32 | 0.5% |
| Scotch-Irish | 137 | 2.3% |
| Scottish | 229 | 3.8% |
| Sioux | 8 | 0.1% |
| Slovak | 14 | 0.2% |
| South American | 22 | 0.4% |
| Spaniard | 30 | 0.5% |
| Subsaharan African | 83 | 1.4% |
| Swedish | 14 | 0.2% |
| Swiss | 105 | 1.7% |
| Thai | 79 | 1.3% |
| Turkish | 10 | 0.2% |
| Ugandan | 1 | 0.0% |
| Ukrainian | 56 | 0.9% |
| Welsh | 41 | 0.7% |
| West Indian | 13 | 0.2% |
| Yugoslavian | 8 | 0.1% | View All 46 Rows |
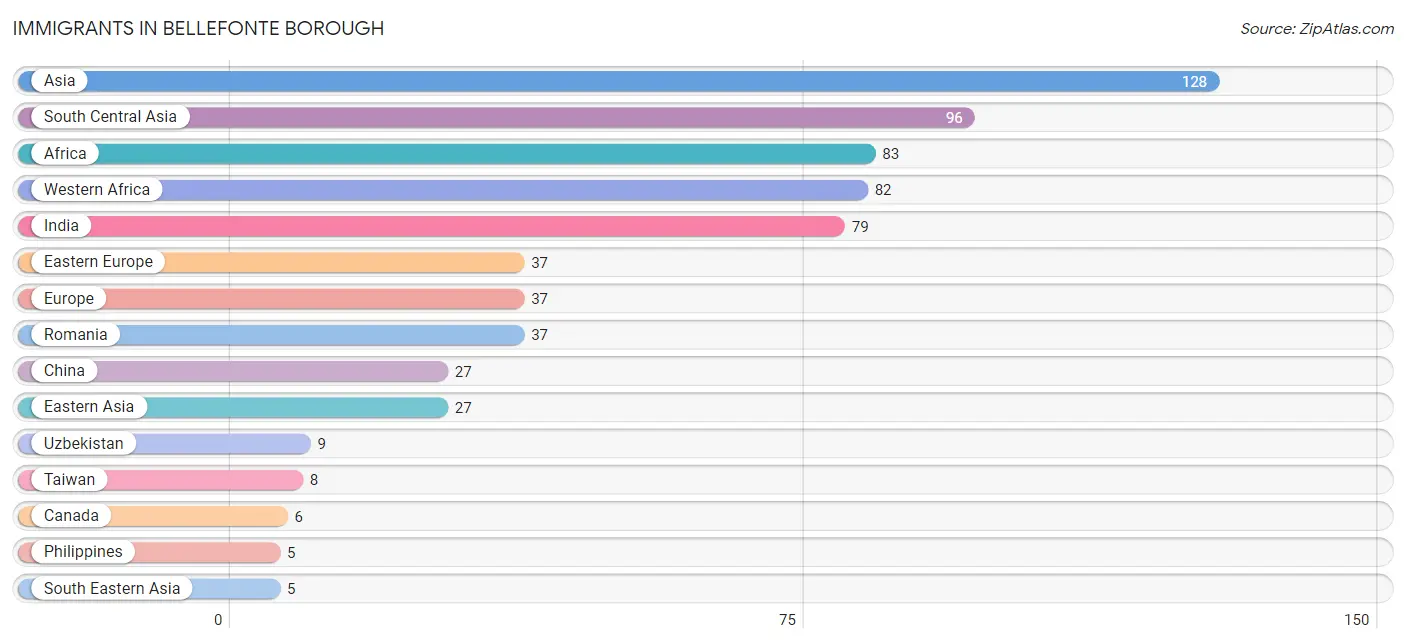
Immigrants in Bellefonte borough
The most numerous immigrant groups reported in Bellefonte borough came from Asia (128 | 2.1%), South Central Asia (96 | 1.6%), Africa (83 | 1.4%), Western Africa (82 | 1.3%), and India (79 | 1.3%), together accounting for 7.7% of all Bellefonte borough residents.
| Immigration Origin | # Population | % Population |
| Africa | 83 | 1.4% |
| Asia | 128 | 2.1% |
| Brazil | 4 | 0.1% |
| Canada | 6 | 0.1% |
| China | 27 | 0.4% |
| Eastern Africa | 1 | 0.0% |
| Eastern Asia | 27 | 0.4% |
| Eastern Europe | 37 | 0.6% |
| Europe | 37 | 0.6% |
| India | 79 | 1.3% |
| Latin America | 4 | 0.1% |
| Philippines | 5 | 0.1% |
| Romania | 37 | 0.6% |
| South America | 4 | 0.1% |
| South Central Asia | 96 | 1.6% |
| South Eastern Asia | 5 | 0.1% |
| Taiwan | 8 | 0.1% |
| Uganda | 1 | 0.0% |
| Uzbekistan | 9 | 0.2% |
| Western Africa | 82 | 1.3% | View All 20 Rows |
Sex and Age in Bellefonte borough
Sex and Age in Bellefonte borough
The most populous age groups in Bellefonte borough are 35 to 39 Years (329 | 10.9%) for men and 55 to 59 Years (360 | 11.8%) for women.
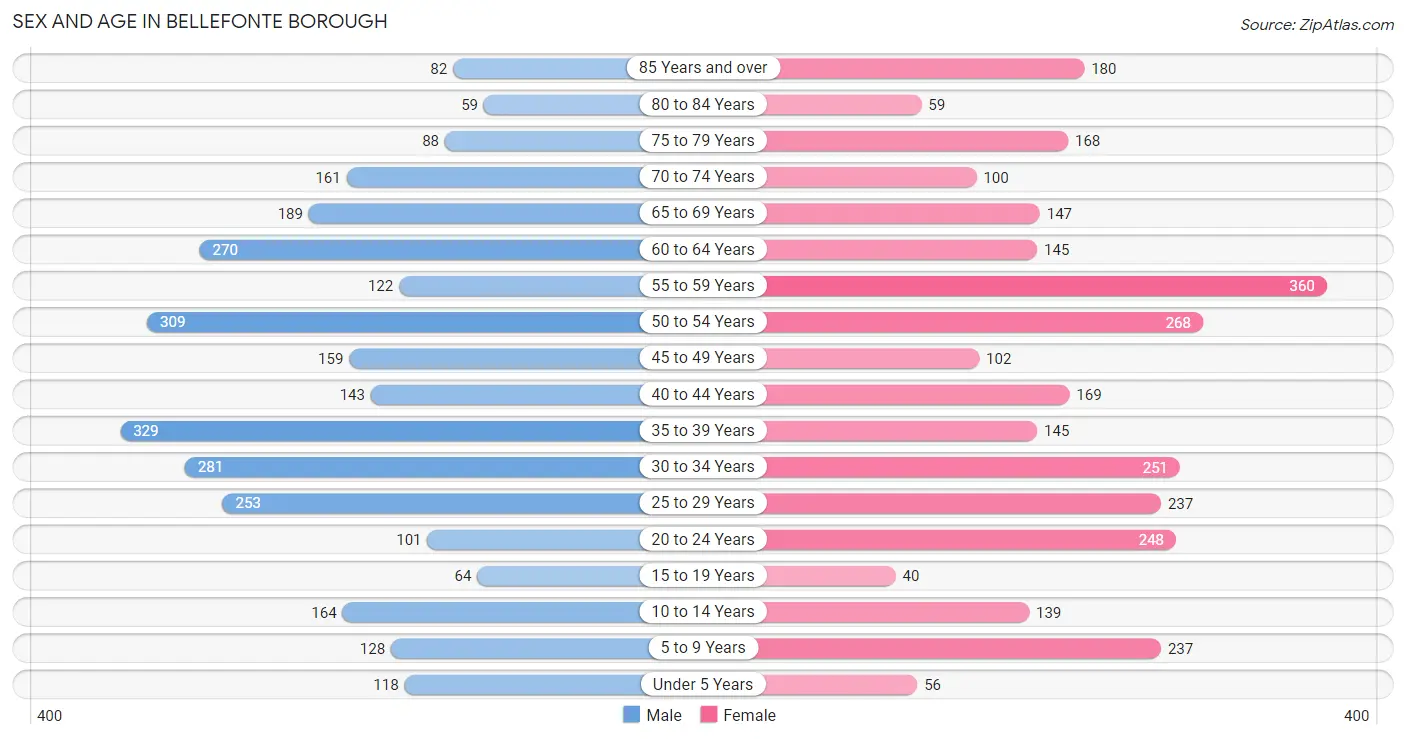
| Age Bracket | Male | Female |
| Under 5 Years | 118 (3.9%) | 56 (1.8%) |
| 5 to 9 Years | 128 (4.2%) | 237 (7.8%) |
| 10 to 14 Years | 164 (5.4%) | 139 (4.6%) |
| 15 to 19 Years | 64 (2.1%) | 40 (1.3%) |
| 20 to 24 Years | 101 (3.3%) | 248 (8.1%) |
| 25 to 29 Years | 253 (8.4%) | 237 (7.8%) |
| 30 to 34 Years | 281 (9.3%) | 251 (8.2%) |
| 35 to 39 Years | 329 (10.9%) | 145 (4.8%) |
| 40 to 44 Years | 143 (4.7%) | 169 (5.5%) |
| 45 to 49 Years | 159 (5.3%) | 102 (3.3%) |
| 50 to 54 Years | 309 (10.2%) | 268 (8.8%) |
| 55 to 59 Years | 122 (4.0%) | 360 (11.8%) |
| 60 to 64 Years | 270 (8.9%) | 145 (4.8%) |
| 65 to 69 Years | 189 (6.3%) | 147 (4.8%) |
| 70 to 74 Years | 161 (5.3%) | 100 (3.3%) |
| 75 to 79 Years | 88 (2.9%) | 168 (5.5%) |
| 80 to 84 Years | 59 (1.9%) | 59 (1.9%) |
| 85 Years and over | 82 (2.7%) | 180 (5.9%) |
| Total | 3,020 (100.0%) | 3,051 (100.0%) |
Families and Households in Bellefonte borough
Median Family Size in Bellefonte borough
The median family size in Bellefonte borough is 2.65 persons per family, with single female/mother families (222 | 14.4%) accounting for the largest median family size of 2.86 persons per family. On the other hand, single male/father families (84 | 5.5%) represent the smallest median family size with 2.48 persons per family.
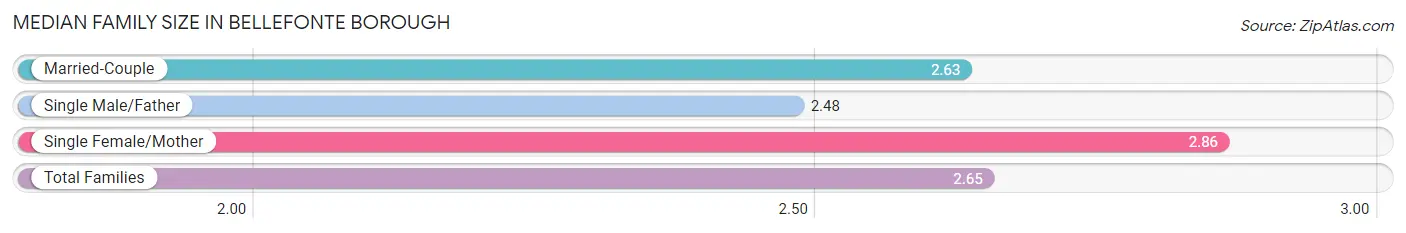
| Family Type | # Families | Family Size |
| Married-Couple | 1,231 (80.1%) | 2.63 |
| Single Male/Father | 84 (5.5%) | 2.48 |
| Single Female/Mother | 222 (14.4%) | 2.86 |
| Total Families | 1,537 (100.0%) | 2.65 |
Median Household Size in Bellefonte borough
The median household size in Bellefonte borough is 2.02 persons per household, with single female/mother households (222 | 7.7%) accounting for the largest median household size of 3.3 persons per household. non-family households (1,347 | 46.7%) represent the smallest median household size with 1.15 persons per household.
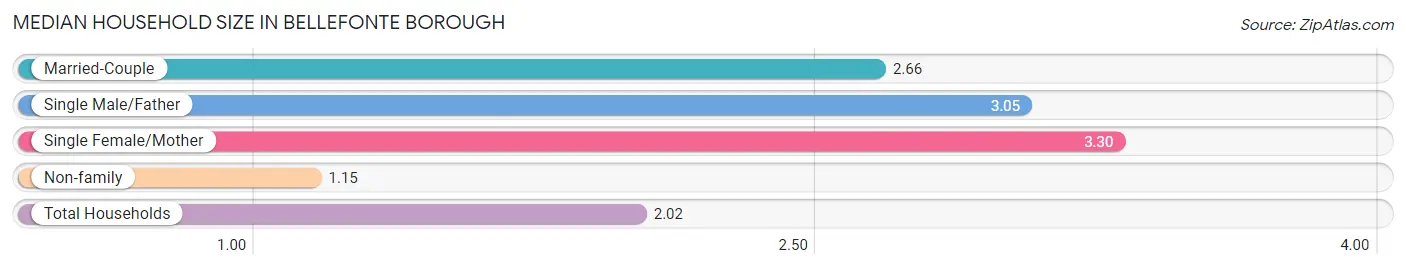
| Household Type | # Households | Household Size |
| Married-Couple | 1,231 (42.7%) | 2.66 |
| Single Male/Father | 84 (2.9%) | 3.05 |
| Single Female/Mother | 222 (7.7%) | 3.30 |
| Non-family | 1,347 (46.7%) | 1.15 |
| Total Households | 2,884 (100.0%) | 2.02 |
Household Size by Marriage Status in Bellefonte borough
Out of a total of 2,884 households in Bellefonte borough, 1,537 (53.3%) are family households, while 1,347 (46.7%) are nonfamily households. The most numerous type of family households are 2-person households, comprising 748, and the most common type of nonfamily households are 1-person households, comprising 1,201.
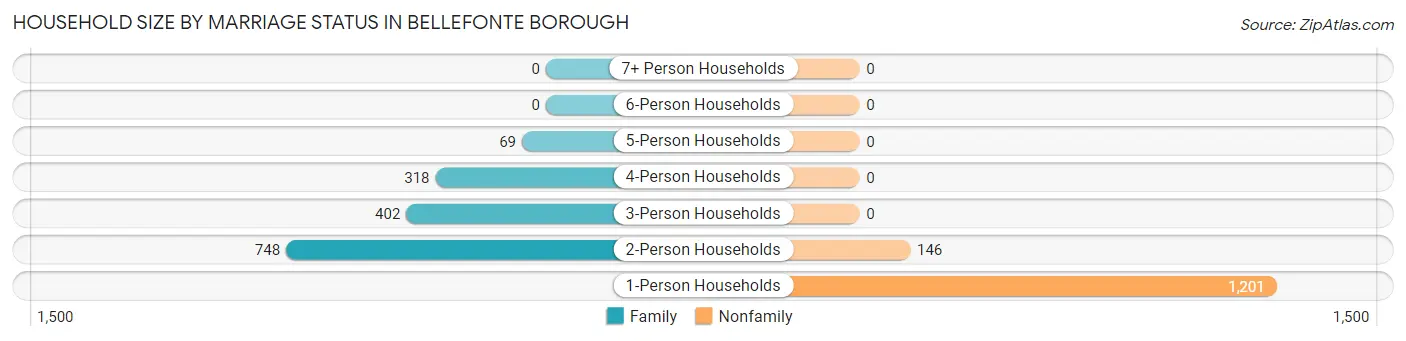
| Household Size | Family Households | Nonfamily Households |
| 1-Person Households | - | 1,201 (41.6%) |
| 2-Person Households | 748 (25.9%) | 146 (5.1%) |
| 3-Person Households | 402 (13.9%) | 0 (0.0%) |
| 4-Person Households | 318 (11.0%) | 0 (0.0%) |
| 5-Person Households | 69 (2.4%) | 0 (0.0%) |
| 6-Person Households | 0 (0.0%) | 0 (0.0%) |
| 7+ Person Households | 0 (0.0%) | 0 (0.0%) |
| Total | 1,537 (53.3%) | 1,347 (46.7%) |
Female Fertility in Bellefonte borough
Fertility by Age in Bellefonte borough
Average fertility rate in Bellefonte borough is 65.0 births per 1,000 women. Women in the age bracket of 20 to 34 years have the highest fertility rate with 95.0 births per 1,000 women. Women in the age bracket of 20 to 34 years acount for 87.5% of all women with births.
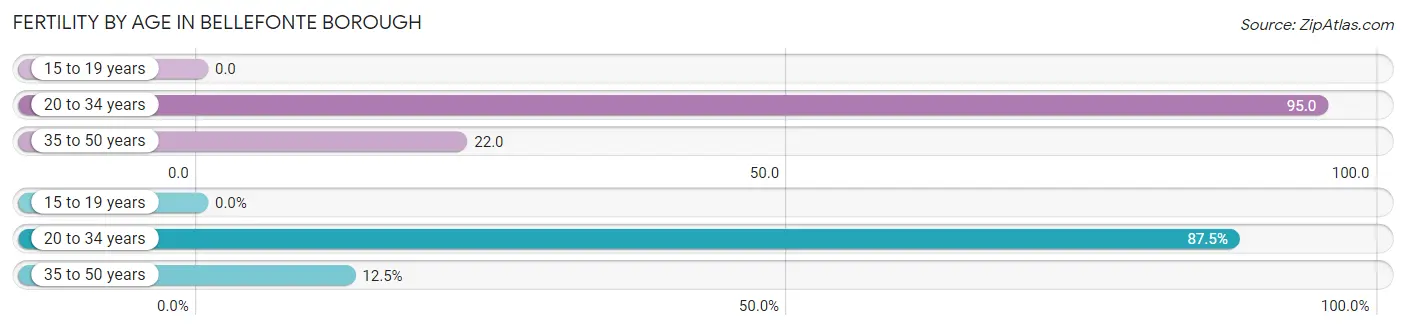
| Age Bracket | Women with Births | Births / 1,000 Women |
| 15 to 19 years | 0 (0.0%) | 0.0 |
| 20 to 34 years | 70 (87.5%) | 95.0 |
| 35 to 50 years | 10 (12.5%) | 22.0 |
| Total | 80 (100.0%) | 65.0 |
Fertility by Age by Marriage Status in Bellefonte borough
41.2% of women with births (80) in Bellefonte borough are married. The highest percentage of unmarried women with births falls into 20 to 34 years age bracket with 67.1% of them unmarried at the time of birth, while the lowest percentage of unmarried women with births belong to 35 to 50 years age bracket with 0.0% of them unmarried.
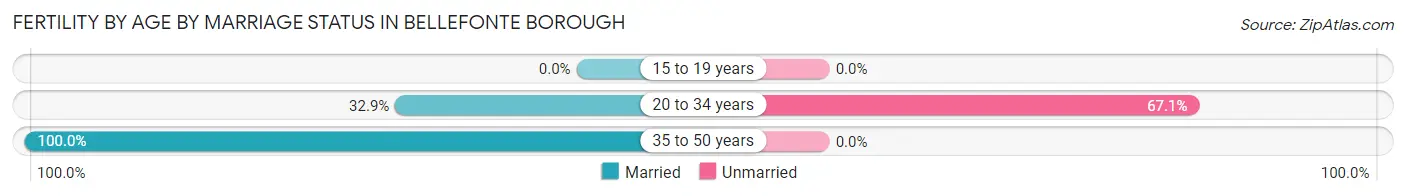
| Age Bracket | Married | Unmarried |
| 15 to 19 years | 0 (0.0%) | 0 (0.0%) |
| 20 to 34 years | 23 (32.9%) | 47 (67.1%) |
| 35 to 50 years | 10 (100.0%) | 0 (0.0%) |
| Total | 33 (41.2%) | 47 (58.8%) |
Fertility by Education in Bellefonte borough
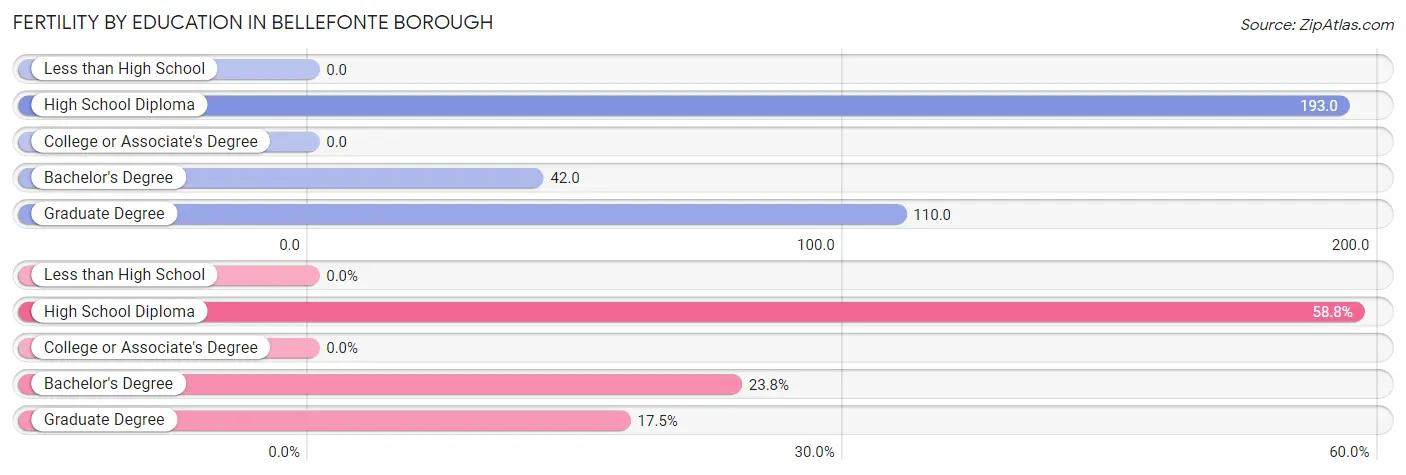
| Educational Attainment | Women with Births | Births / 1,000 Women |
| Less than High School | 0 (0.0%) | 0.0 |
| High School Diploma | 47 (58.8%) | 193.0 |
| College or Associate's Degree | 0 (0.0%) | 0.0 |
| Bachelor's Degree | 19 (23.7%) | 42.0 |
| Graduate Degree | 14 (17.5%) | 110.0 |
| Total | 80 (100.0%) | 65.0 |
Fertility by Education by Marriage Status in Bellefonte borough
58.8% of women with births in Bellefonte borough are unmarried. Women with the educational attainment of bachelor's degree are most likely to be married with 100.0% of them married at childbirth, while women with the educational attainment of high school diploma are least likely to be married with 100.0% of them unmarried at childbirth.
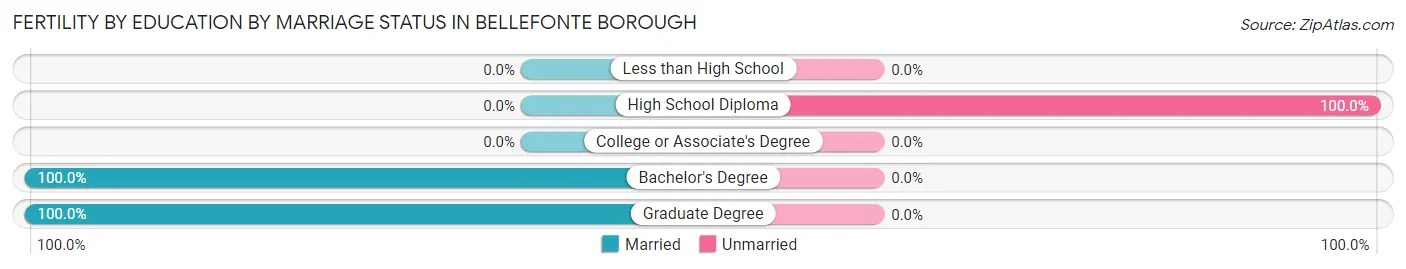
| Educational Attainment | Married | Unmarried |
| Less than High School | 0 (0.0%) | 0 (0.0%) |
| High School Diploma | 0 (0.0%) | 47 (100.0%) |
| College or Associate's Degree | 0 (0.0%) | 0 (0.0%) |
| Bachelor's Degree | 19 (100.0%) | 0 (0.0%) |
| Graduate Degree | 14 (100.0%) | 0 (0.0%) |
| Total | 33 (41.2%) | 47 (58.8%) |
Employment Characteristics in Bellefonte borough
Employment by Class of Employer in Bellefonte borough
Among the 3,311 employed individuals in Bellefonte borough, private company employees (1,895 | 57.2%), not-for-profit organizations (591 | 17.8%), and state government employees (442 | 13.4%) make up the most common classes of employment.
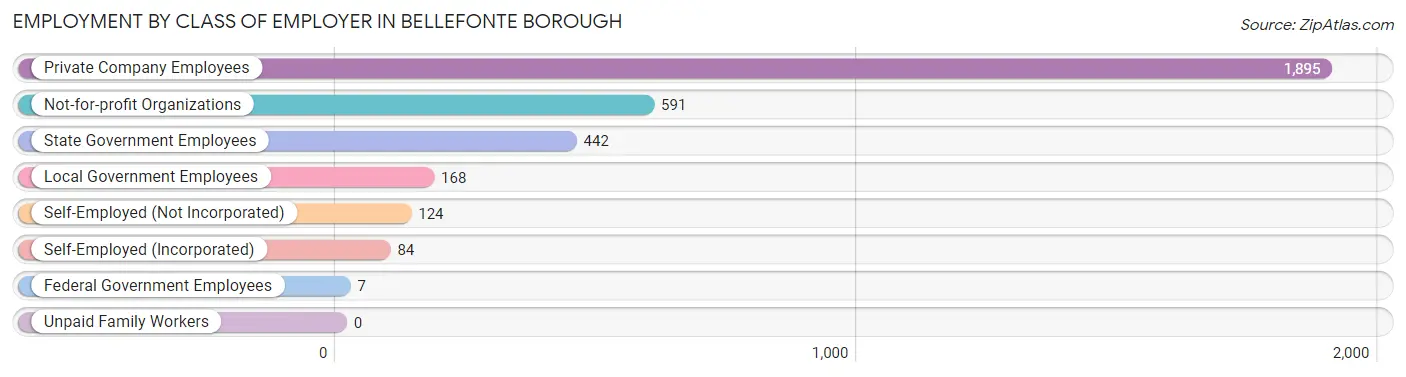
| Employer Class | # Employees | % Employees |
| Private Company Employees | 1,895 | 57.2% |
| Self-Employed (Incorporated) | 84 | 2.5% |
| Self-Employed (Not Incorporated) | 124 | 3.7% |
| Not-for-profit Organizations | 591 | 17.8% |
| Local Government Employees | 168 | 5.1% |
| State Government Employees | 442 | 13.4% |
| Federal Government Employees | 7 | 0.2% |
| Unpaid Family Workers | 0 | 0.0% |
| Total | 3,311 | 100.0% |
Employment Status by Age in Bellefonte borough
According to the labor force statistics for Bellefonte borough, out of the total population over 16 years of age (5,186), 65.9% or 3,418 individuals are in the labor force, with 1.1% or 38 of them unemployed. The age group with the highest labor force participation rate is 25 to 29 years, with 97.8% or 479 individuals in the labor force. Within the labor force, the 16 to 19 years age range has the highest percentage of unemployed individuals, with 36.0% or 9 of them being unemployed.
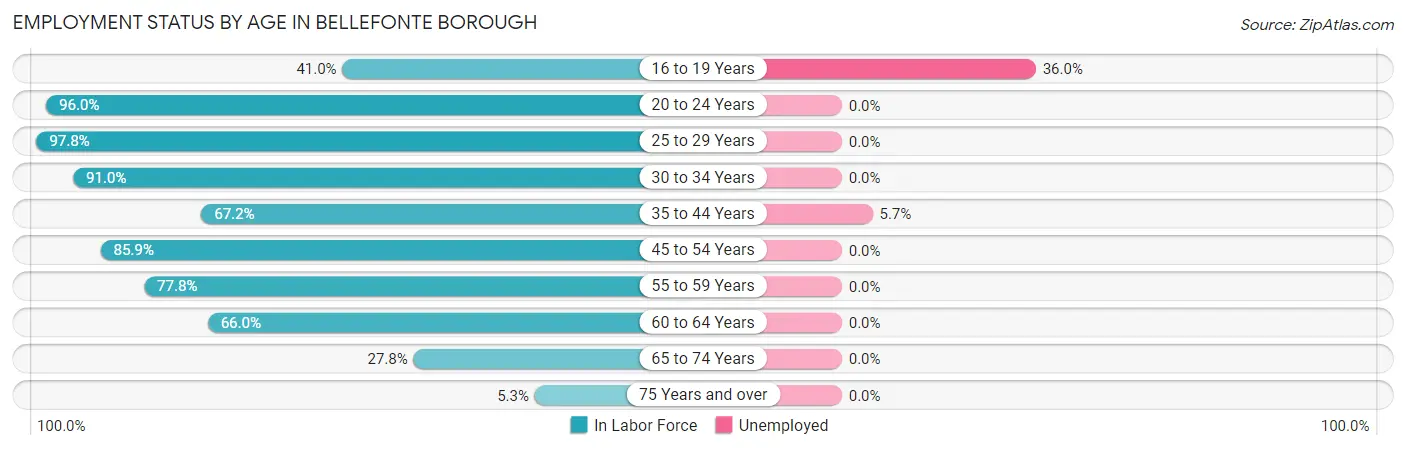
| Age Bracket | In Labor Force | Unemployed |
| 16 to 19 Years | 25 (41.0%) | 9 (36.0%) |
| 20 to 24 Years | 335 (96.0%) | 0 (0.0%) |
| 25 to 29 Years | 479 (97.8%) | 0 (0.0%) |
| 30 to 34 Years | 484 (91.0%) | 0 (0.0%) |
| 35 to 44 Years | 528 (67.2%) | 30 (5.7%) |
| 45 to 54 Years | 720 (85.9%) | 0 (0.0%) |
| 55 to 59 Years | 375 (77.8%) | 0 (0.0%) |
| 60 to 64 Years | 274 (66.0%) | 0 (0.0%) |
| 65 to 74 Years | 166 (27.8%) | 0 (0.0%) |
| 75 Years and over | 34 (5.3%) | 0 (0.0%) |
| Total | 3,418 (65.9%) | 38 (1.1%) |
Employment Status by Educational Attainment in Bellefonte borough
According to labor force statistics for Bellefonte borough, 80.7% of individuals (2,859) out of the total population between 25 and 64 years of age (3,543) are in the labor force, with 1.0% or 29 of them being unemployed. The group with the highest labor force participation rate are those with the educational attainment of bachelor's degree or higher, with 88.7% or 1,354 individuals in the labor force. Within the labor force, individuals with high school diploma education have the highest percentage of unemployment, with 4.9% or 30 of them being unemployed.
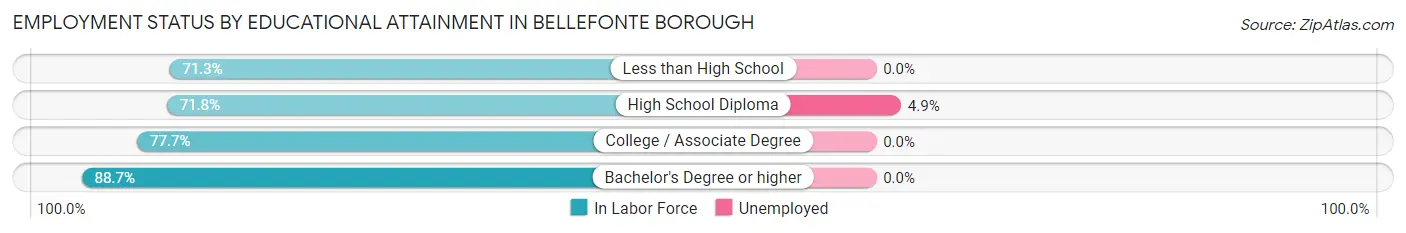
| Educational Attainment | In Labor Force | Unemployed |
| Less than High School | 114 (71.3%) | 0 (0.0%) |
| High School Diploma | 618 (71.8%) | 42 (4.9%) |
| College / Associate Degree | 773 (77.7%) | 0 (0.0%) |
| Bachelor's Degree or higher | 1,354 (88.7%) | 0 (0.0%) |
| Total | 2,859 (80.7%) | 35 (1.0%) |
Employment Occupations by Sex in Bellefonte borough
Management, Business, Science and Arts Occupations
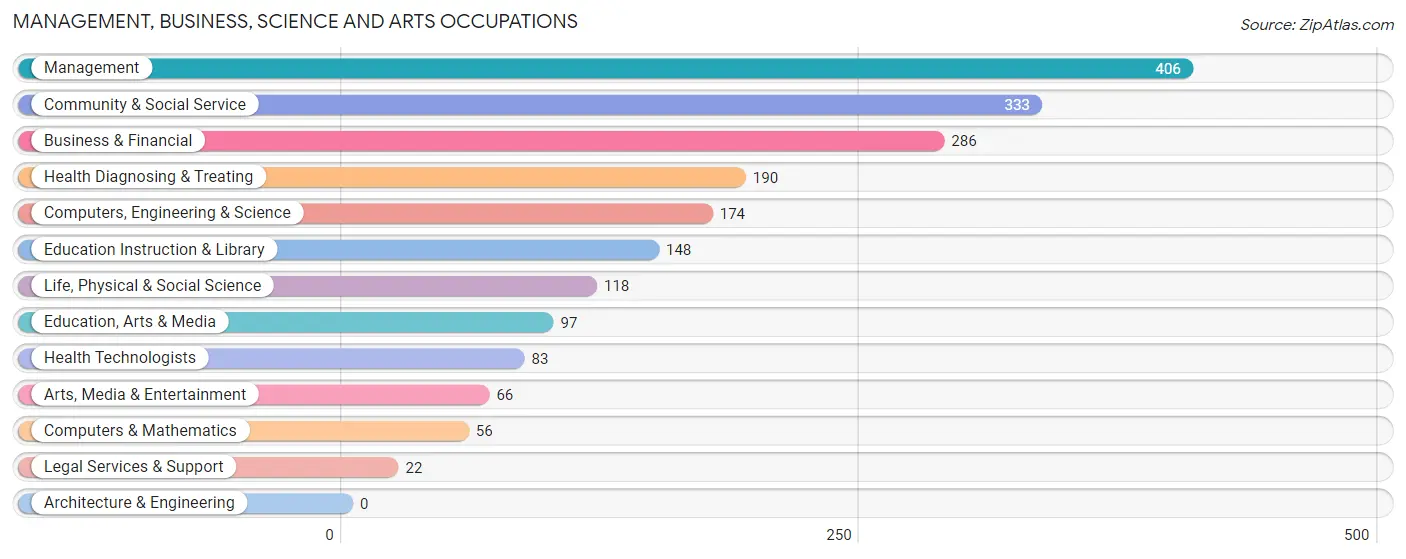
The most common Management, Business, Science and Arts occupations in Bellefonte borough are Management (406 | 12.0%), Community & Social Service (333 | 9.9%), Business & Financial (286 | 8.5%), Health Diagnosing & Treating (190 | 5.6%), and Computers, Engineering & Science (174 | 5.1%).
Management, Business, Science and Arts Occupations by Sex
Within the Management, Business, Science and Arts occupations in Bellefonte borough, the most male-oriented occupations are Computers & Mathematics (100.0%), Legal Services & Support (100.0%), and Computers, Engineering & Science (79.9%), while the most female-oriented occupations are Education, Arts & Media (86.6%), Health Diagnosing & Treating (83.2%), and Education Instruction & Library (81.1%).
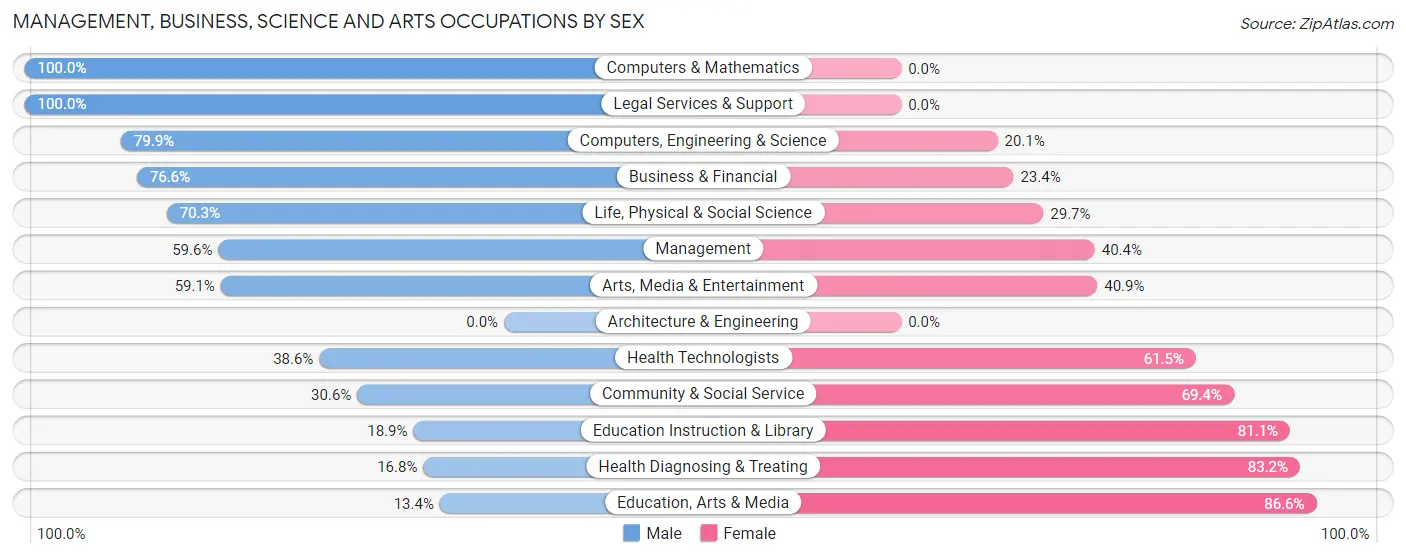
| Occupation | Male | Female |
| Management | 242 (59.6%) | 164 (40.4%) |
| Business & Financial | 219 (76.6%) | 67 (23.4%) |
| Computers, Engineering & Science | 139 (79.9%) | 35 (20.1%) |
| Computers & Mathematics | 56 (100.0%) | 0 (0.0%) |
| Architecture & Engineering | 0 (0.0%) | 0 (0.0%) |
| Life, Physical & Social Science | 83 (70.3%) | 35 (29.7%) |
| Community & Social Service | 102 (30.6%) | 231 (69.4%) |
| Education, Arts & Media | 13 (13.4%) | 84 (86.6%) |
| Legal Services & Support | 22 (100.0%) | 0 (0.0%) |
| Education Instruction & Library | 28 (18.9%) | 120 (81.1%) |
| Arts, Media & Entertainment | 39 (59.1%) | 27 (40.9%) |
| Health Diagnosing & Treating | 32 (16.8%) | 158 (83.2%) |
| Health Technologists | 32 (38.6%) | 51 (61.5%) |
| Total (Category) | 734 (52.8%) | 655 (47.2%) |
| Total (Overall) | 1,696 (50.2%) | 1,685 (49.8%) |
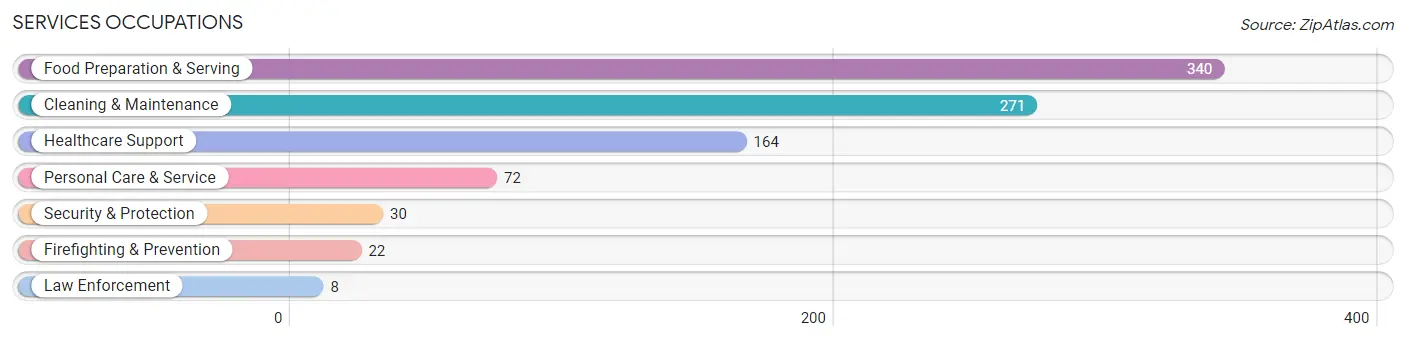
Services Occupations
The most common Services occupations in Bellefonte borough are Food Preparation & Serving (340 | 10.1%), Cleaning & Maintenance (271 | 8.0%), Healthcare Support (164 | 4.9%), Personal Care & Service (72 | 2.1%), and Security & Protection (30 | 0.9%).
Services Occupations by Sex
Within the Services occupations in Bellefonte borough, the most male-oriented occupations are Security & Protection (100.0%), Firefighting & Prevention (100.0%), and Law Enforcement (100.0%), while the most female-oriented occupations are Personal Care & Service (100.0%), Healthcare Support (89.0%), and Food Preparation & Serving (40.0%).
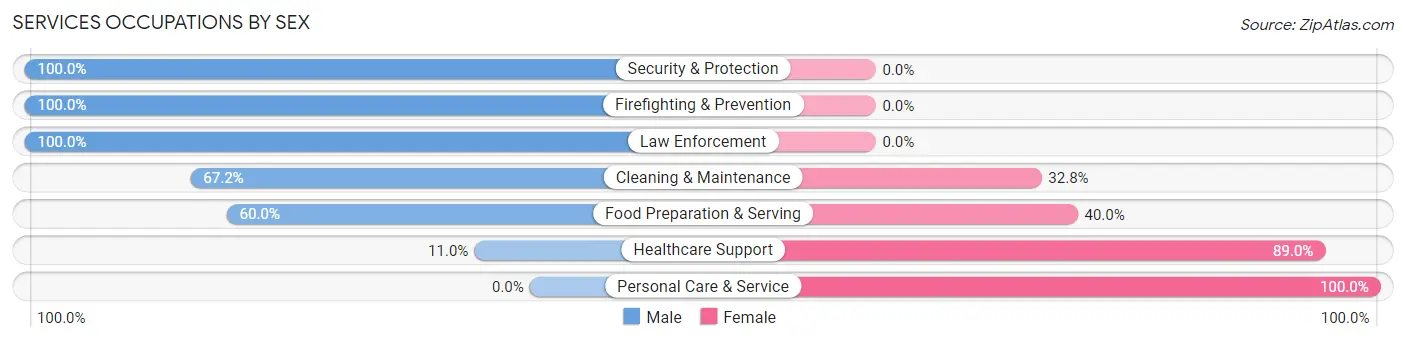
| Occupation | Male | Female |
| Healthcare Support | 18 (11.0%) | 146 (89.0%) |
| Security & Protection | 30 (100.0%) | 0 (0.0%) |
| Firefighting & Prevention | 22 (100.0%) | 0 (0.0%) |
| Law Enforcement | 8 (100.0%) | 0 (0.0%) |
| Food Preparation & Serving | 204 (60.0%) | 136 (40.0%) |
| Cleaning & Maintenance | 182 (67.2%) | 89 (32.8%) |
| Personal Care & Service | 0 (0.0%) | 72 (100.0%) |
| Total (Category) | 434 (49.5%) | 443 (50.5%) |
| Total (Overall) | 1,696 (50.2%) | 1,685 (49.8%) |
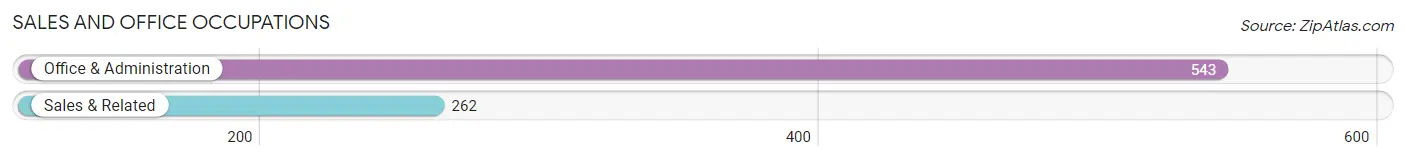
Sales and Office Occupations
The most common Sales and Office occupations in Bellefonte borough are Office & Administration (543 | 16.1%), and Sales & Related (262 | 7.7%).
Sales and Office Occupations by Sex
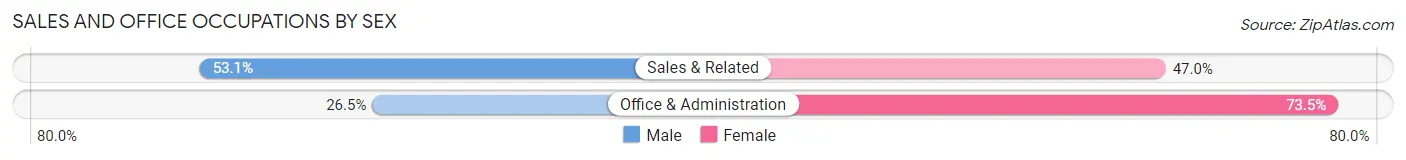
| Occupation | Male | Female |
| Sales & Related | 139 (53.0%) | 123 (46.9%) |
| Office & Administration | 144 (26.5%) | 399 (73.5%) |
| Total (Category) | 283 (35.2%) | 522 (64.8%) |
| Total (Overall) | 1,696 (50.2%) | 1,685 (49.8%) |
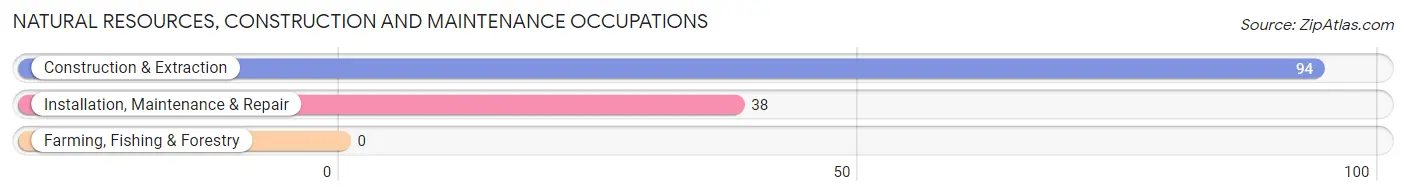
Natural Resources, Construction and Maintenance Occupations
The most common Natural Resources, Construction and Maintenance occupations in Bellefonte borough are Construction & Extraction (94 | 2.8%), and Installation, Maintenance & Repair (38 | 1.1%).
Natural Resources, Construction and Maintenance Occupations by Sex
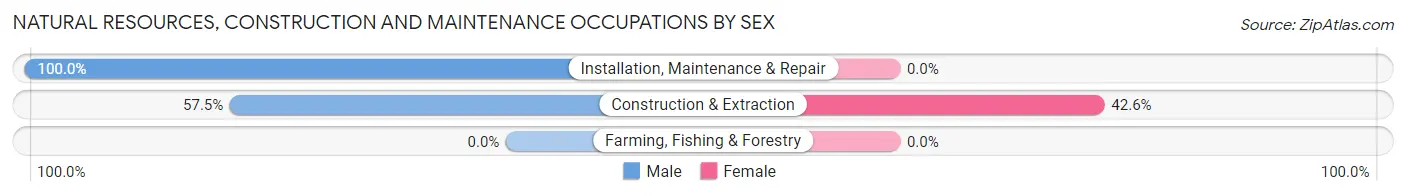
| Occupation | Male | Female |
| Farming, Fishing & Forestry | 0 (0.0%) | 0 (0.0%) |
| Construction & Extraction | 54 (57.5%) | 40 (42.5%) |
| Installation, Maintenance & Repair | 38 (100.0%) | 0 (0.0%) |
| Total (Category) | 92 (69.7%) | 40 (30.3%) |
| Total (Overall) | 1,696 (50.2%) | 1,685 (49.8%) |
Production, Transportation and Moving Occupations
The most common Production, Transportation and Moving occupations in Bellefonte borough are Production (118 | 3.5%), Transportation (47 | 1.4%), and Material Moving (13 | 0.4%).
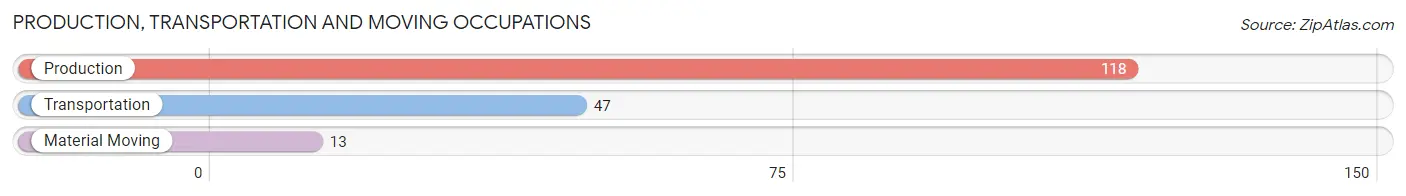
Production, Transportation and Moving Occupations by Sex
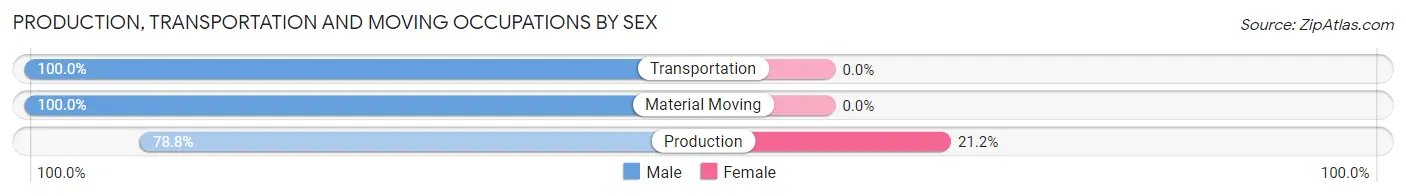
| Occupation | Male | Female |
| Production | 93 (78.8%) | 25 (21.2%) |
| Transportation | 47 (100.0%) | 0 (0.0%) |
| Material Moving | 13 (100.0%) | 0 (0.0%) |
| Total (Category) | 153 (86.0%) | 25 (14.0%) |
| Total (Overall) | 1,696 (50.2%) | 1,685 (49.8%) |
Employment Industries by Sex in Bellefonte borough
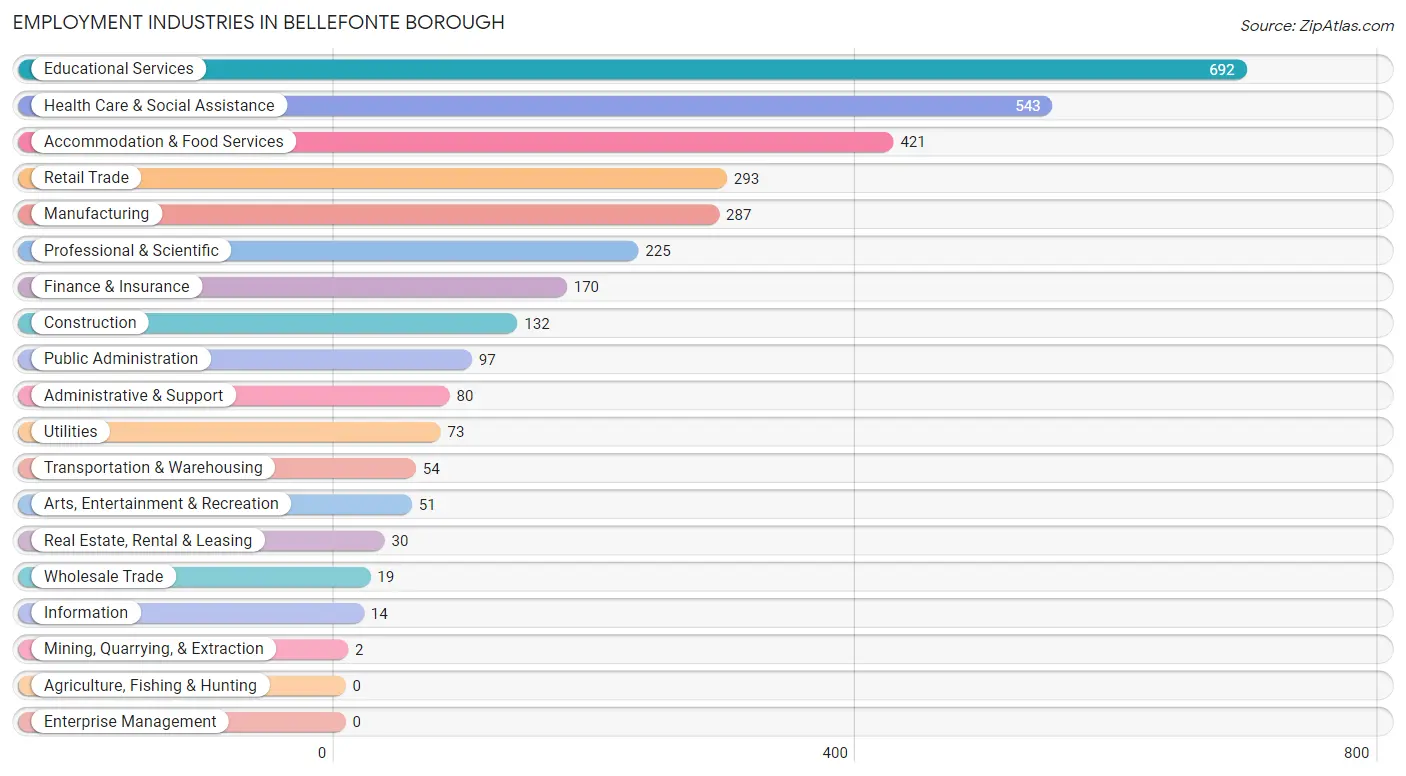
Employment Industries in Bellefonte borough
The major employment industries in Bellefonte borough include Educational Services (692 | 20.5%), Health Care & Social Assistance (543 | 16.1%), Accommodation & Food Services (421 | 12.4%), Retail Trade (293 | 8.7%), and Manufacturing (287 | 8.5%).
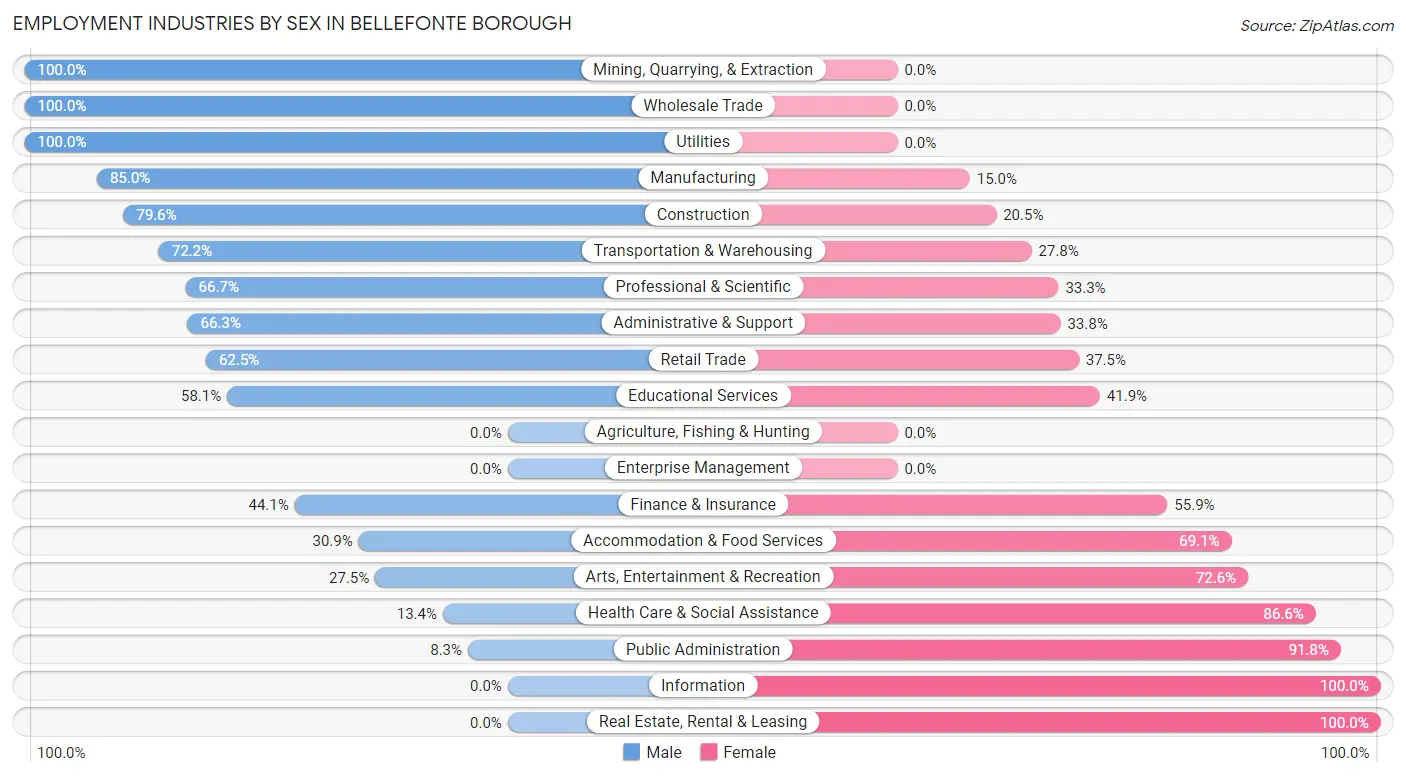
Employment Industries by Sex in Bellefonte borough
The Bellefonte borough industries that see more men than women are Mining, Quarrying, & Extraction (100.0%), Wholesale Trade (100.0%), and Utilities (100.0%), whereas the industries that tend to have a higher number of women are Information (100.0%), Real Estate, Rental & Leasing (100.0%), and Public Administration (91.7%).
| Industry | Male | Female |
| Agriculture, Fishing & Hunting | 0 (0.0%) | 0 (0.0%) |
| Mining, Quarrying, & Extraction | 2 (100.0%) | 0 (0.0%) |
| Construction | 105 (79.5%) | 27 (20.4%) |
| Manufacturing | 244 (85.0%) | 43 (15.0%) |
| Wholesale Trade | 19 (100.0%) | 0 (0.0%) |
| Retail Trade | 183 (62.5%) | 110 (37.5%) |
| Transportation & Warehousing | 39 (72.2%) | 15 (27.8%) |
| Utilities | 73 (100.0%) | 0 (0.0%) |
| Information | 0 (0.0%) | 14 (100.0%) |
| Finance & Insurance | 75 (44.1%) | 95 (55.9%) |
| Real Estate, Rental & Leasing | 0 (0.0%) | 30 (100.0%) |
| Professional & Scientific | 150 (66.7%) | 75 (33.3%) |
| Enterprise Management | 0 (0.0%) | 0 (0.0%) |
| Administrative & Support | 53 (66.2%) | 27 (33.8%) |
| Educational Services | 402 (58.1%) | 290 (41.9%) |
| Health Care & Social Assistance | 73 (13.4%) | 470 (86.6%) |
| Arts, Entertainment & Recreation | 14 (27.5%) | 37 (72.6%) |
| Accommodation & Food Services | 130 (30.9%) | 291 (69.1%) |
| Public Administration | 8 (8.3%) | 89 (91.7%) |
| Total | 1,696 (50.2%) | 1,685 (49.8%) |
Education in Bellefonte borough
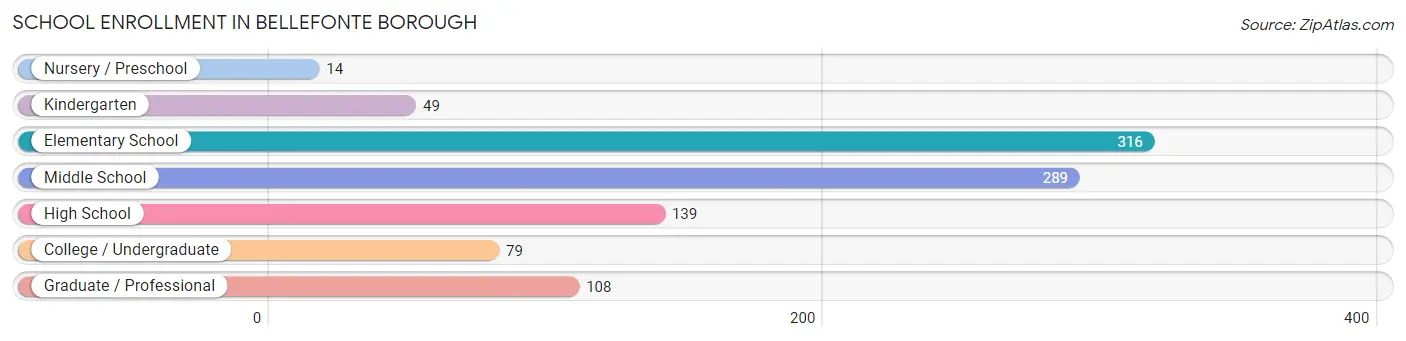
School Enrollment in Bellefonte borough
The most common levels of schooling among the 994 students in Bellefonte borough are elementary school (316 | 31.8%), middle school (289 | 29.1%), and high school (139 | 14.0%).
| School Level | # Students | % Students |
| Nursery / Preschool | 14 | 1.4% |
| Kindergarten | 49 | 4.9% |
| Elementary School | 316 | 31.8% |
| Middle School | 289 | 29.1% |
| High School | 139 | 14.0% |
| College / Undergraduate | 79 | 8.0% |
| Graduate / Professional | 108 | 10.9% |
| Total | 994 | 100.0% |
School Enrollment by Age by Funding Source in Bellefonte borough
Out of a total of 994 students who are enrolled in schools in Bellefonte borough, 121 (12.2%) attend a private institution, while the remaining 873 (87.8%) are enrolled in public schools. The age group of 25 to 34 year olds has the highest likelihood of being enrolled in private schools, with 26 (46.4% in the age bracket) enrolled. Conversely, the age group of 10 to 14 year olds has the lowest likelihood of being enrolled in a private school, with 303 (100.0% in the age bracket) attending a public institution.
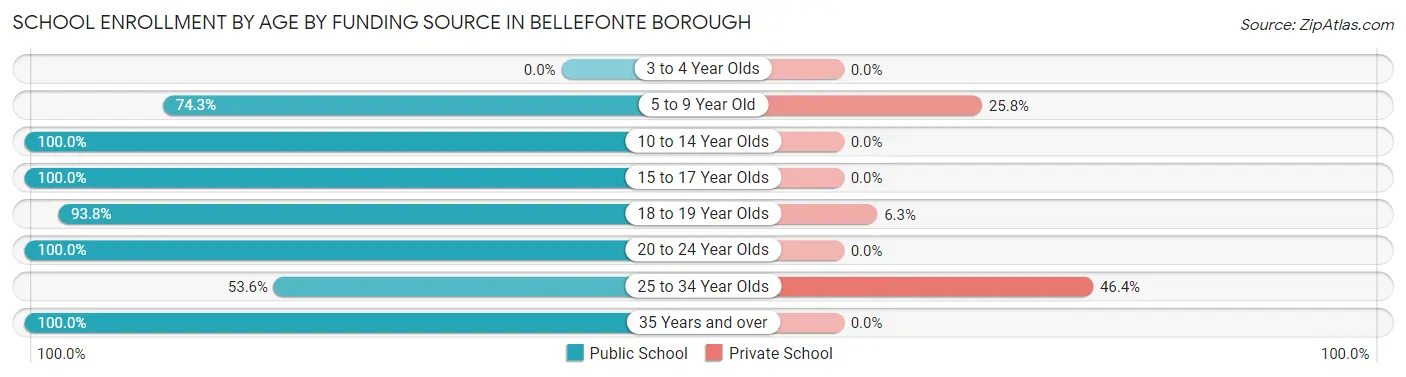
| Age Bracket | Public School | Private School |
| 3 to 4 Year Olds | 0 (0.0%) | 0 (0.0%) |
| 5 to 9 Year Old | 271 (74.3%) | 94 (25.8%) |
| 10 to 14 Year Olds | 303 (100.0%) | 0 (0.0%) |
| 15 to 17 Year Olds | 71 (100.0%) | 0 (0.0%) |
| 18 to 19 Year Olds | 15 (93.8%) | 1 (6.2%) |
| 20 to 24 Year Olds | 69 (100.0%) | 0 (0.0%) |
| 25 to 34 Year Olds | 30 (53.6%) | 26 (46.4%) |
| 35 Years and over | 114 (100.0%) | 0 (0.0%) |
| Total | 873 (87.8%) | 121 (12.2%) |
Educational Attainment by Field of Study in Bellefonte borough
Education (258 | 12.1%), science & technology (255 | 12.0%), bio, nature & agricultural (237 | 11.2%), business (232 | 10.9%), and communications (169 | 8.0%) are the most common fields of study among 2,125 individuals in Bellefonte borough who have obtained a bachelor's degree or higher.
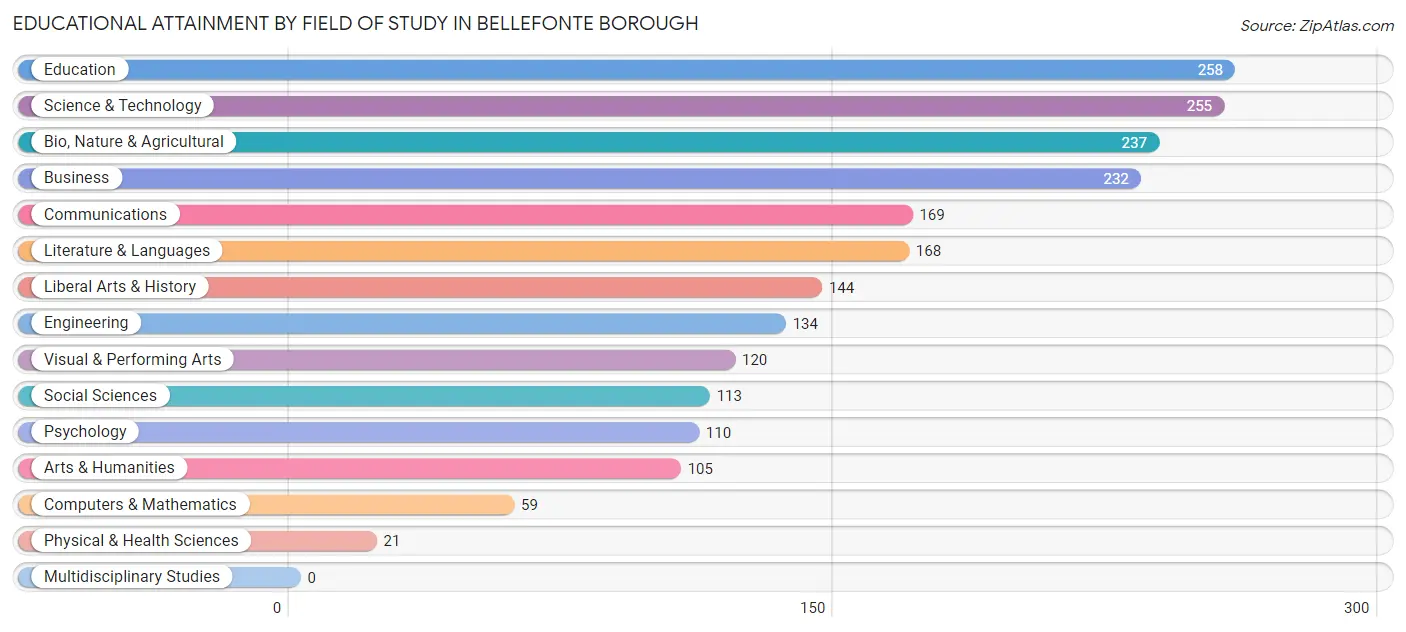
| Field of Study | # Graduates | % Graduates |
| Computers & Mathematics | 59 | 2.8% |
| Bio, Nature & Agricultural | 237 | 11.2% |
| Physical & Health Sciences | 21 | 1.0% |
| Psychology | 110 | 5.2% |
| Social Sciences | 113 | 5.3% |
| Engineering | 134 | 6.3% |
| Multidisciplinary Studies | 0 | 0.0% |
| Science & Technology | 255 | 12.0% |
| Business | 232 | 10.9% |
| Education | 258 | 12.1% |
| Literature & Languages | 168 | 7.9% |
| Liberal Arts & History | 144 | 6.8% |
| Visual & Performing Arts | 120 | 5.7% |
| Communications | 169 | 8.0% |
| Arts & Humanities | 105 | 4.9% |
| Total | 2,125 | 100.0% |
Transportation & Commute in Bellefonte borough
Vehicle Availability by Sex in Bellefonte borough
The most prevalent vehicle ownership categories in Bellefonte borough are males with 2 vehicles (781, accounting for 46.1%) and females with 2 vehicles (686, making up 48.4%).
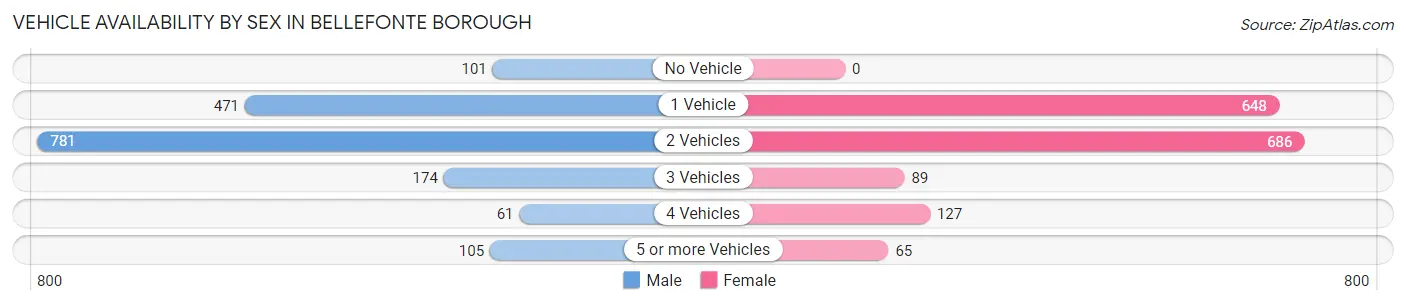
| Vehicles Available | Male | Female |
| No Vehicle | 101 (6.0%) | 0 (0.0%) |
| 1 Vehicle | 471 (27.8%) | 648 (40.1%) |
| 2 Vehicles | 781 (46.1%) | 686 (42.5%) |
| 3 Vehicles | 174 (10.3%) | 89 (5.5%) |
| 4 Vehicles | 61 (3.6%) | 127 (7.9%) |
| 5 or more Vehicles | 105 (6.2%) | 65 (4.0%) |
| Total | 1,693 (100.0%) | 1,615 (100.0%) |
Commute Time in Bellefonte borough
The most frequently occuring commute durations in Bellefonte borough are 20 to 24 minutes (655 commuters, 22.0%), 10 to 14 minutes (538 commuters, 18.0%), and 15 to 19 minutes (493 commuters, 16.5%).
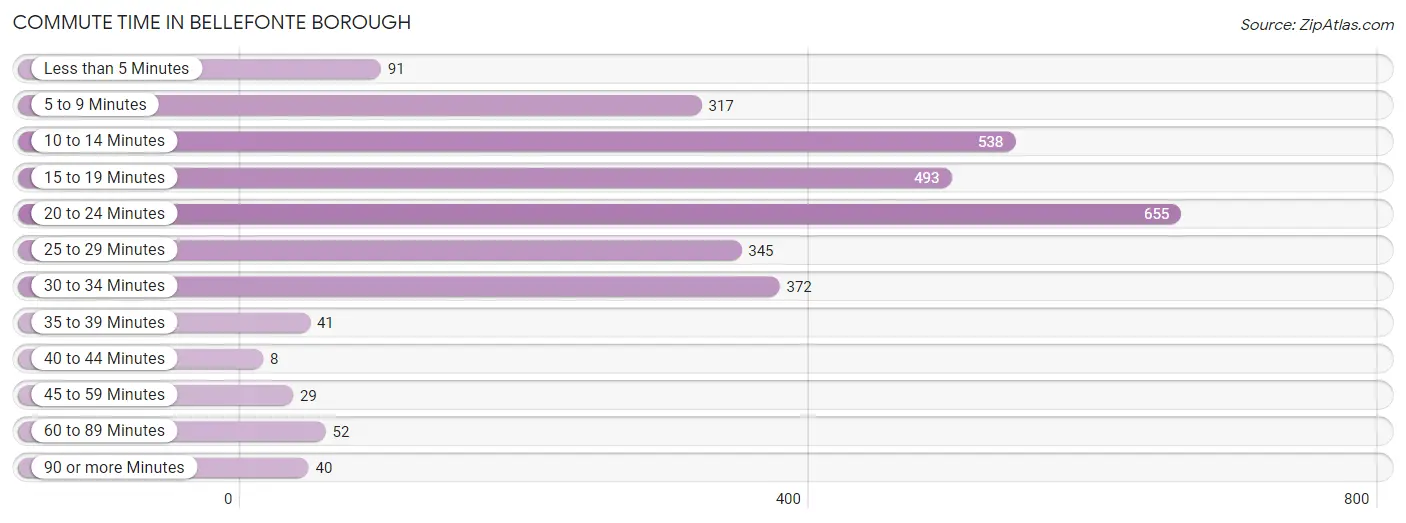
| Commute Time | # Commuters | % Commuters |
| Less than 5 Minutes | 91 | 3.0% |
| 5 to 9 Minutes | 317 | 10.6% |
| 10 to 14 Minutes | 538 | 18.0% |
| 15 to 19 Minutes | 493 | 16.5% |
| 20 to 24 Minutes | 655 | 22.0% |
| 25 to 29 Minutes | 345 | 11.6% |
| 30 to 34 Minutes | 372 | 12.5% |
| 35 to 39 Minutes | 41 | 1.4% |
| 40 to 44 Minutes | 8 | 0.3% |
| 45 to 59 Minutes | 29 | 1.0% |
| 60 to 89 Minutes | 52 | 1.7% |
| 90 or more Minutes | 40 | 1.3% |
Commute Time by Sex in Bellefonte borough
The most common commute times in Bellefonte borough are 30 to 34 minutes (331 commuters, 22.8%) for males and 20 to 24 minutes (424 commuters, 27.8%) for females.
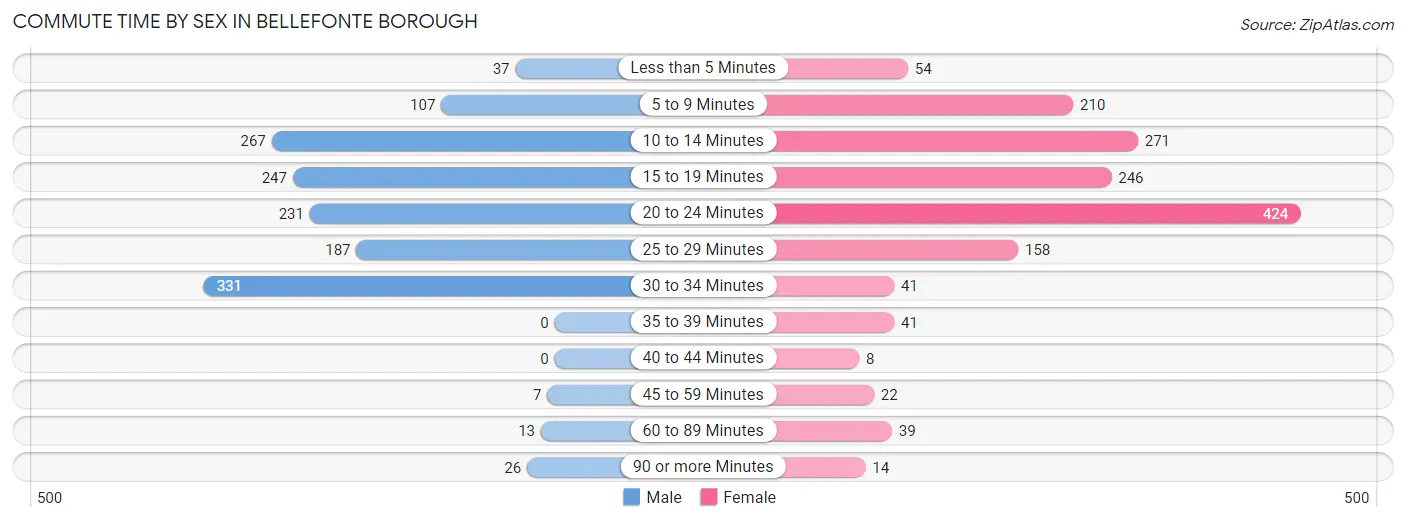
| Commute Time | Male | Female |
| Less than 5 Minutes | 37 (2.5%) | 54 (3.5%) |
| 5 to 9 Minutes | 107 (7.4%) | 210 (13.7%) |
| 10 to 14 Minutes | 267 (18.4%) | 271 (17.7%) |
| 15 to 19 Minutes | 247 (17.0%) | 246 (16.1%) |
| 20 to 24 Minutes | 231 (15.9%) | 424 (27.8%) |
| 25 to 29 Minutes | 187 (12.9%) | 158 (10.3%) |
| 30 to 34 Minutes | 331 (22.8%) | 41 (2.7%) |
| 35 to 39 Minutes | 0 (0.0%) | 41 (2.7%) |
| 40 to 44 Minutes | 0 (0.0%) | 8 (0.5%) |
| 45 to 59 Minutes | 7 (0.5%) | 22 (1.4%) |
| 60 to 89 Minutes | 13 (0.9%) | 39 (2.5%) |
| 90 or more Minutes | 26 (1.8%) | 14 (0.9%) |
Time of Departure to Work by Sex in Bellefonte borough
The most frequent times of departure to work in Bellefonte borough are 7:30 AM to 7:59 AM (257, 17.7%) for males and 7:30 AM to 7:59 AM (378, 24.7%) for females.
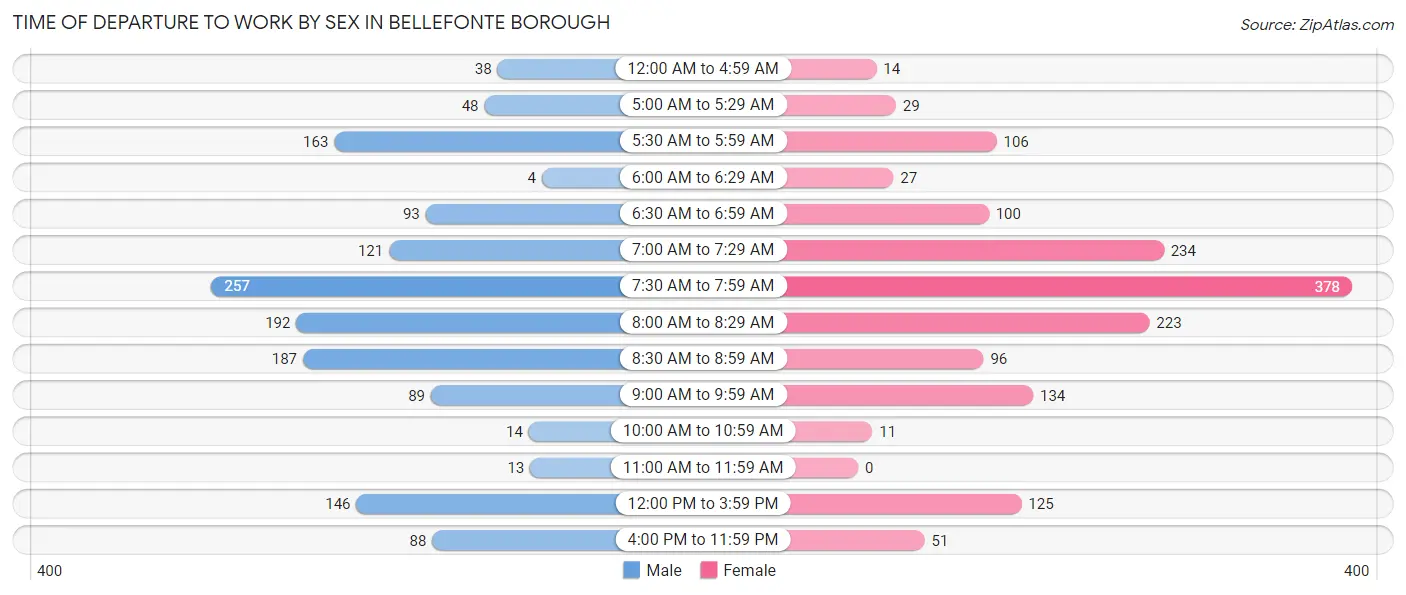
| Time of Departure | Male | Female |
| 12:00 AM to 4:59 AM | 38 (2.6%) | 14 (0.9%) |
| 5:00 AM to 5:29 AM | 48 (3.3%) | 29 (1.9%) |
| 5:30 AM to 5:59 AM | 163 (11.2%) | 106 (6.9%) |
| 6:00 AM to 6:29 AM | 4 (0.3%) | 27 (1.8%) |
| 6:30 AM to 6:59 AM | 93 (6.4%) | 100 (6.5%) |
| 7:00 AM to 7:29 AM | 121 (8.3%) | 234 (15.3%) |
| 7:30 AM to 7:59 AM | 257 (17.7%) | 378 (24.7%) |
| 8:00 AM to 8:29 AM | 192 (13.2%) | 223 (14.6%) |
| 8:30 AM to 8:59 AM | 187 (12.9%) | 96 (6.3%) |
| 9:00 AM to 9:59 AM | 89 (6.1%) | 134 (8.8%) |
| 10:00 AM to 10:59 AM | 14 (1.0%) | 11 (0.7%) |
| 11:00 AM to 11:59 AM | 13 (0.9%) | 0 (0.0%) |
| 12:00 PM to 3:59 PM | 146 (10.1%) | 125 (8.2%) |
| 4:00 PM to 11:59 PM | 88 (6.1%) | 51 (3.3%) |
| Total | 1,453 (100.0%) | 1,528 (100.0%) |
Housing Occupancy in Bellefonte borough
Occupancy by Ownership in Bellefonte borough
Of the total 2,884 dwellings in Bellefonte borough, owner-occupied units account for 1,476 (51.2%), while renter-occupied units make up 1,408 (48.8%).
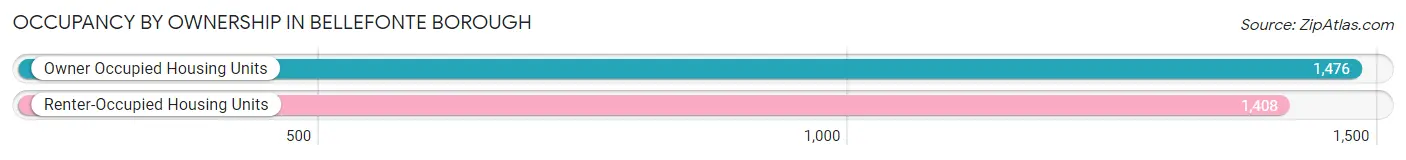
| Occupancy | # Housing Units | % Housing Units |
| Owner Occupied Housing Units | 1,476 | 51.2% |
| Renter-Occupied Housing Units | 1,408 | 48.8% |
| Total Occupied Housing Units | 2,884 | 100.0% |
Occupancy by Household Size in Bellefonte borough
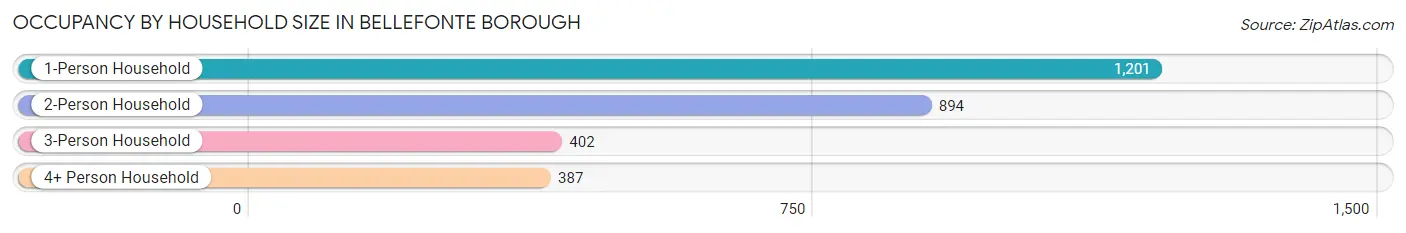
| Household Size | # Housing Units | % Housing Units |
| 1-Person Household | 1,201 | 41.6% |
| 2-Person Household | 894 | 31.0% |
| 3-Person Household | 402 | 13.9% |
| 4+ Person Household | 387 | 13.4% |
| Total Housing Units | 2,884 | 100.0% |
Occupancy by Ownership by Household Size in Bellefonte borough
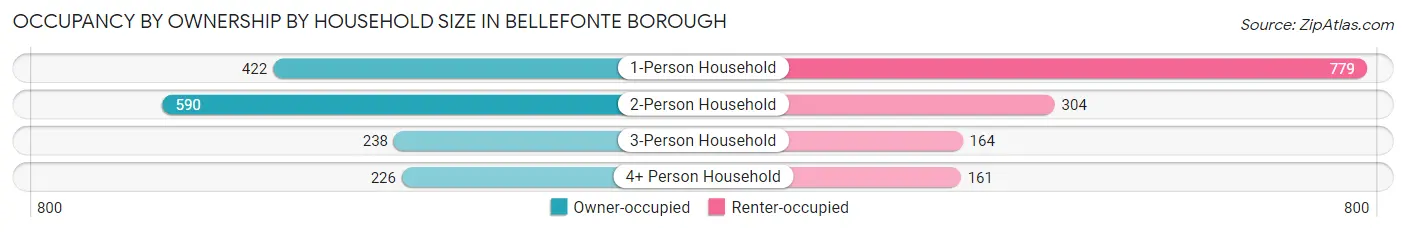
| Household Size | Owner-occupied | Renter-occupied |
| 1-Person Household | 422 (35.1%) | 779 (64.9%) |
| 2-Person Household | 590 (66.0%) | 304 (34.0%) |
| 3-Person Household | 238 (59.2%) | 164 (40.8%) |
| 4+ Person Household | 226 (58.4%) | 161 (41.6%) |
| Total Housing Units | 1,476 (51.2%) | 1,408 (48.8%) |
Occupancy by Educational Attainment in Bellefonte borough
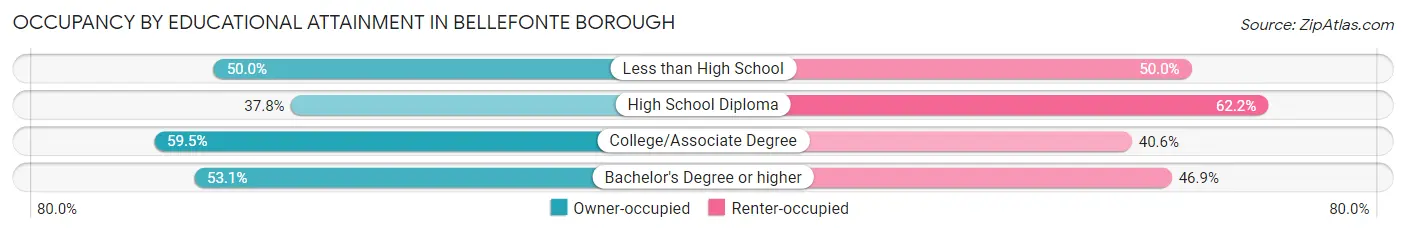
| Household Size | Owner-occupied | Renter-occupied |
| Less than High School | 24 (50.0%) | 24 (50.0%) |
| High School Diploma | 266 (37.8%) | 437 (62.2%) |
| College/Associate Degree | 497 (59.5%) | 339 (40.6%) |
| Bachelor's Degree or higher | 689 (53.1%) | 608 (46.9%) |
Occupancy by Age of Householder in Bellefonte borough
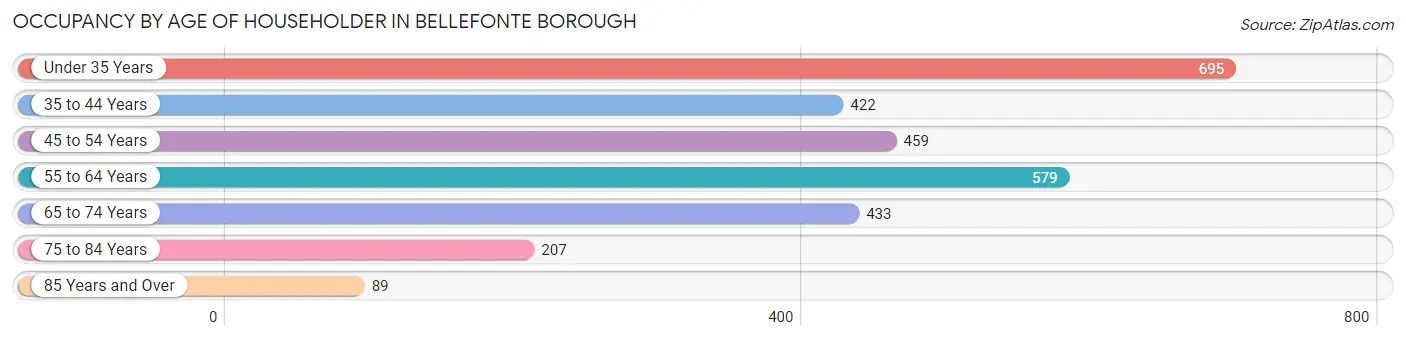
| Age Bracket | # Households | % Households |
| Under 35 Years | 695 | 24.1% |
| 35 to 44 Years | 422 | 14.6% |
| 45 to 54 Years | 459 | 15.9% |
| 55 to 64 Years | 579 | 20.1% |
| 65 to 74 Years | 433 | 15.0% |
| 75 to 84 Years | 207 | 7.2% |
| 85 Years and Over | 89 | 3.1% |
| Total | 2,884 | 100.0% |
Housing Finances in Bellefonte borough
Median Income by Occupancy in Bellefonte borough
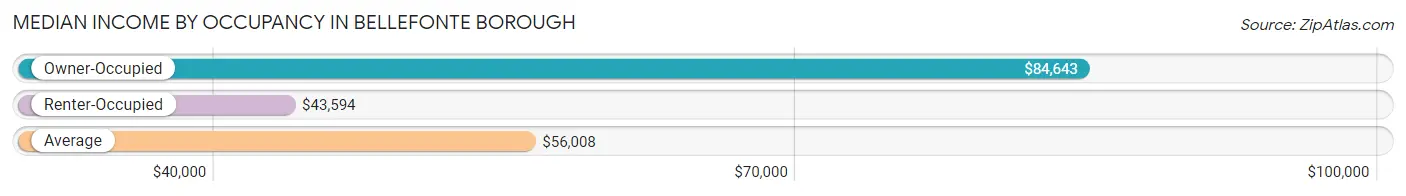
| Occupancy Type | # Households | Median Income |
| Owner-Occupied | 1,476 (51.2%) | $84,643 |
| Renter-Occupied | 1,408 (48.8%) | $43,594 |
| Average | 2,884 (100.0%) | $56,008 |
Occupancy by Householder Income Bracket in Bellefonte borough
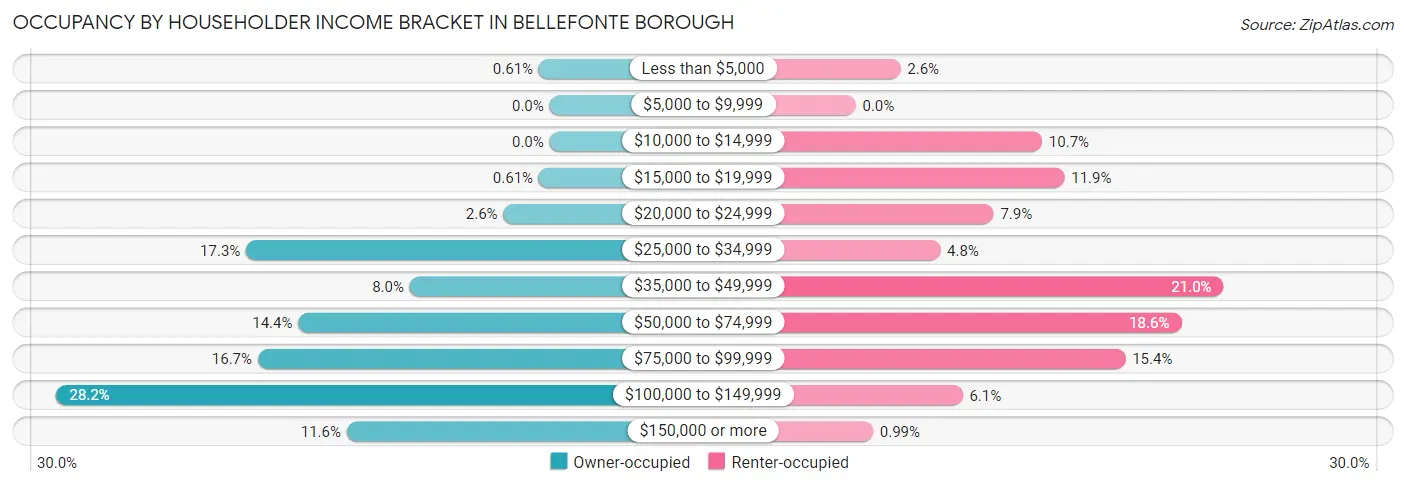
| Income Bracket | Owner-occupied | Renter-occupied |
| Less than $5,000 | 9 (0.6%) | 36 (2.6%) |
| $5,000 to $9,999 | 0 (0.0%) | 0 (0.0%) |
| $10,000 to $14,999 | 0 (0.0%) | 150 (10.6%) |
| $15,000 to $19,999 | 9 (0.6%) | 168 (11.9%) |
| $20,000 to $24,999 | 39 (2.6%) | 111 (7.9%) |
| $25,000 to $34,999 | 256 (17.3%) | 68 (4.8%) |
| $35,000 to $49,999 | 118 (8.0%) | 296 (21.0%) |
| $50,000 to $74,999 | 212 (14.4%) | 262 (18.6%) |
| $75,000 to $99,999 | 246 (16.7%) | 217 (15.4%) |
| $100,000 to $149,999 | 416 (28.2%) | 86 (6.1%) |
| $150,000 or more | 171 (11.6%) | 14 (1.0%) |
| Total | 1,476 (100.0%) | 1,408 (100.0%) |
Monthly Housing Cost Tiers in Bellefonte borough
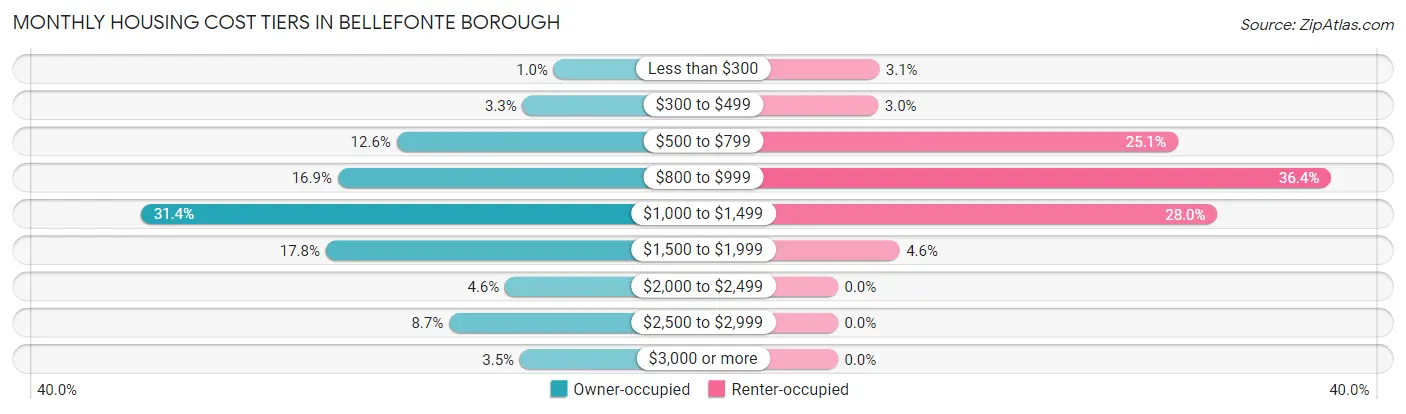
| Monthly Cost | Owner-occupied | Renter-occupied |
| Less than $300 | 15 (1.0%) | 43 (3.0%) |
| $300 to $499 | 49 (3.3%) | 42 (3.0%) |
| $500 to $799 | 186 (12.6%) | 353 (25.1%) |
| $800 to $999 | 250 (16.9%) | 512 (36.4%) |
| $1,000 to $1,499 | 464 (31.4%) | 394 (28.0%) |
| $1,500 to $1,999 | 263 (17.8%) | 64 (4.5%) |
| $2,000 to $2,499 | 68 (4.6%) | 0 (0.0%) |
| $2,500 to $2,999 | 129 (8.7%) | 0 (0.0%) |
| $3,000 or more | 52 (3.5%) | 0 (0.0%) |
| Total | 1,476 (100.0%) | 1,408 (100.0%) |
Physical Housing Characteristics in Bellefonte borough
Housing Structures in Bellefonte borough
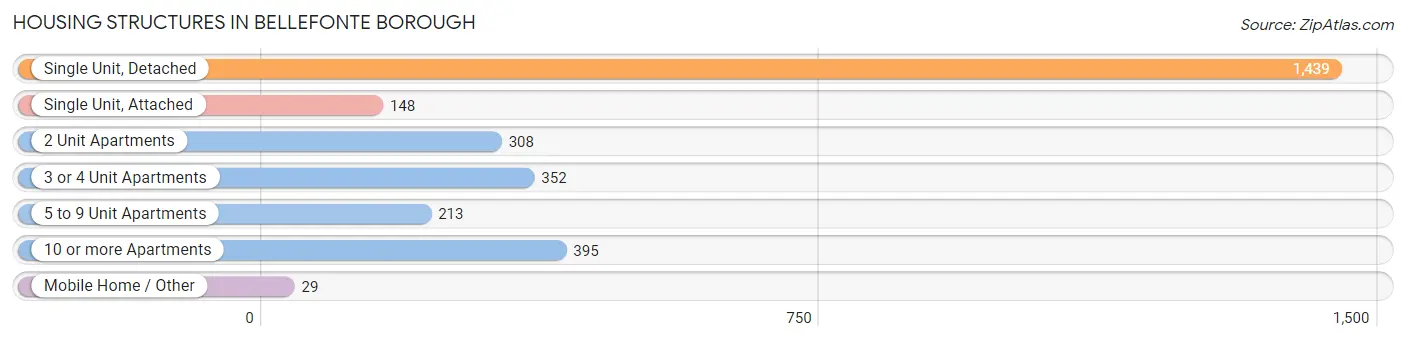
| Structure Type | # Housing Units | % Housing Units |
| Single Unit, Detached | 1,439 | 49.9% |
| Single Unit, Attached | 148 | 5.1% |
| 2 Unit Apartments | 308 | 10.7% |
| 3 or 4 Unit Apartments | 352 | 12.2% |
| 5 to 9 Unit Apartments | 213 | 7.4% |
| 10 or more Apartments | 395 | 13.7% |
| Mobile Home / Other | 29 | 1.0% |
| Total | 2,884 | 100.0% |
Housing Structures by Occupancy in Bellefonte borough
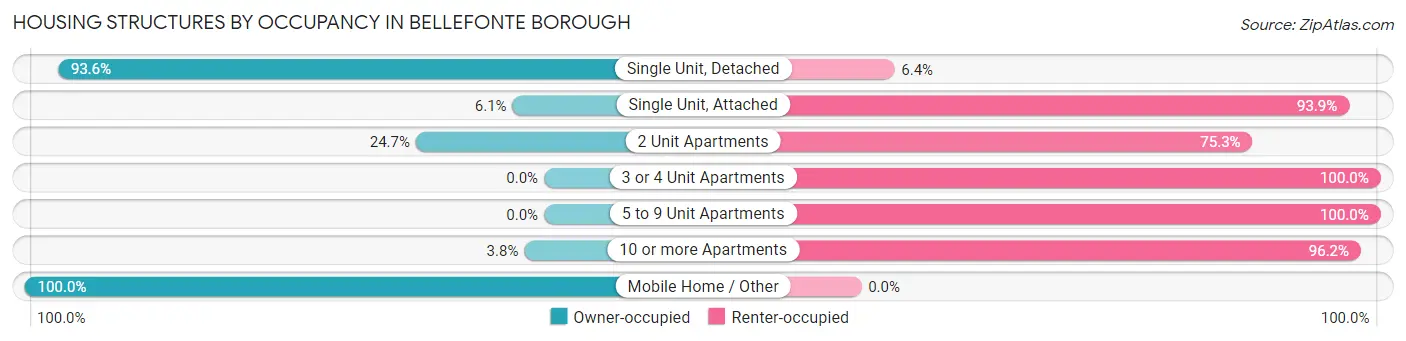
| Structure Type | Owner-occupied | Renter-occupied |
| Single Unit, Detached | 1,347 (93.6%) | 92 (6.4%) |
| Single Unit, Attached | 9 (6.1%) | 139 (93.9%) |
| 2 Unit Apartments | 76 (24.7%) | 232 (75.3%) |
| 3 or 4 Unit Apartments | 0 (0.0%) | 352 (100.0%) |
| 5 to 9 Unit Apartments | 0 (0.0%) | 213 (100.0%) |
| 10 or more Apartments | 15 (3.8%) | 380 (96.2%) |
| Mobile Home / Other | 29 (100.0%) | 0 (0.0%) |
| Total | 1,476 (51.2%) | 1,408 (48.8%) |
Housing Structures by Number of Rooms in Bellefonte borough
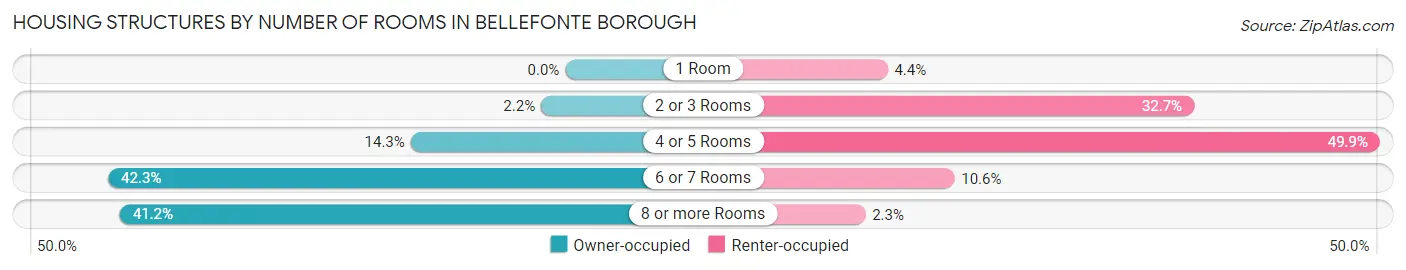
| Number of Rooms | Owner-occupied | Renter-occupied |
| 1 Room | 0 (0.0%) | 62 (4.4%) |
| 2 or 3 Rooms | 33 (2.2%) | 461 (32.7%) |
| 4 or 5 Rooms | 211 (14.3%) | 703 (49.9%) |
| 6 or 7 Rooms | 624 (42.3%) | 149 (10.6%) |
| 8 or more Rooms | 608 (41.2%) | 33 (2.3%) |
| Total | 1,476 (100.0%) | 1,408 (100.0%) |
Housing Structure by Heating Type in Bellefonte borough
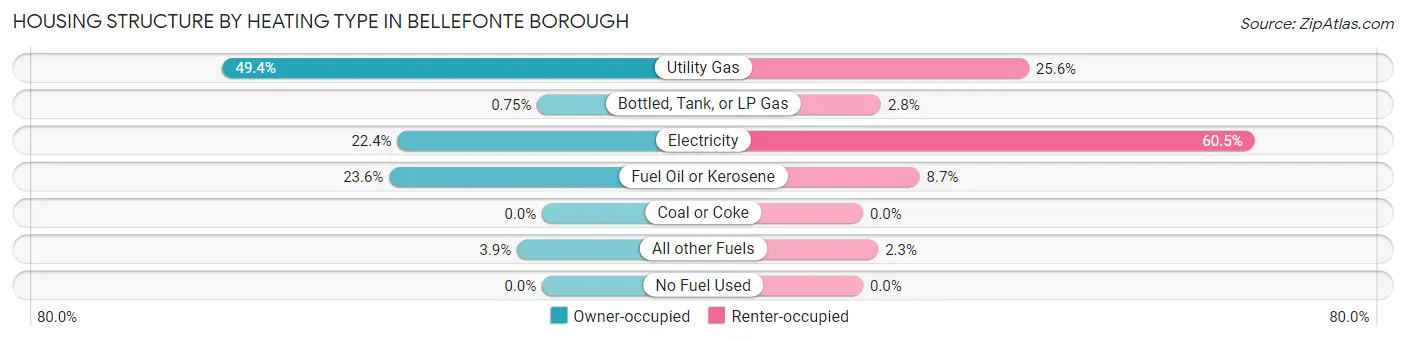
| Heating Type | Owner-occupied | Renter-occupied |
| Utility Gas | 729 (49.4%) | 361 (25.6%) |
| Bottled, Tank, or LP Gas | 11 (0.7%) | 39 (2.8%) |
| Electricity | 330 (22.4%) | 852 (60.5%) |
| Fuel Oil or Kerosene | 349 (23.6%) | 123 (8.7%) |
| Coal or Coke | 0 (0.0%) | 0 (0.0%) |
| All other Fuels | 57 (3.9%) | 33 (2.3%) |
| No Fuel Used | 0 (0.0%) | 0 (0.0%) |
| Total | 1,476 (100.0%) | 1,408 (100.0%) |
Household Vehicle Usage in Bellefonte borough
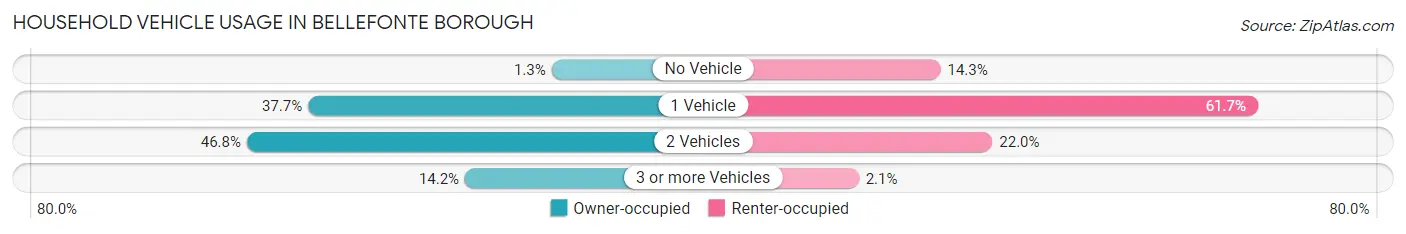
| Vehicles per Household | Owner-occupied | Renter-occupied |
| No Vehicle | 19 (1.3%) | 201 (14.3%) |
| 1 Vehicle | 556 (37.7%) | 868 (61.7%) |
| 2 Vehicles | 691 (46.8%) | 310 (22.0%) |
| 3 or more Vehicles | 210 (14.2%) | 29 (2.1%) |
| Total | 1,476 (100.0%) | 1,408 (100.0%) |
Real Estate & Mortgages in Bellefonte borough
Real Estate and Mortgage Overview in Bellefonte borough
| Characteristic | Without Mortgage | With Mortgage |
| Housing Units | 472 | 1,004 |
| Median Property Value | $250,000 | $221,300 |
| Median Household Income | $68,500 | $127 |
| Monthly Housing Costs | $809 | $52 |
| Real Estate Taxes | $3,711 | $0 |
Property Value by Mortgage Status in Bellefonte borough
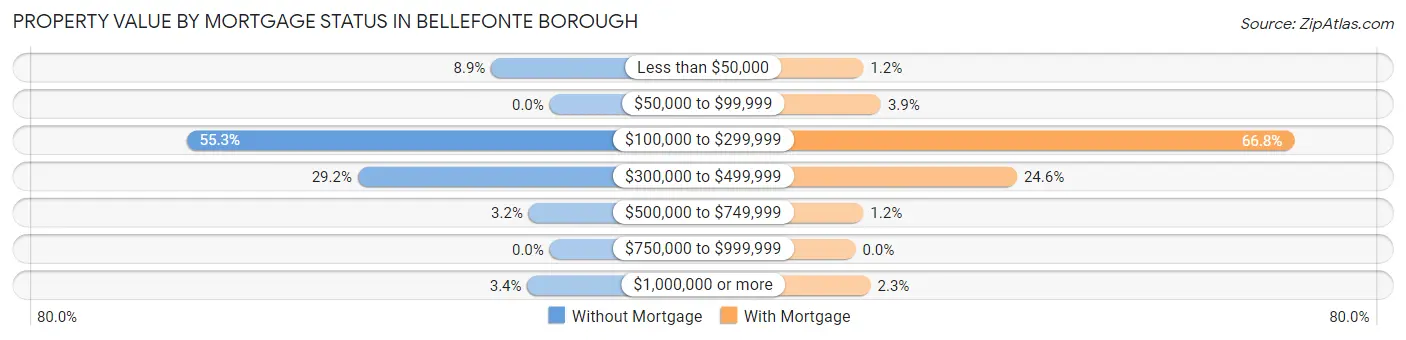
| Property Value | Without Mortgage | With Mortgage |
| Less than $50,000 | 42 (8.9%) | 12 (1.2%) |
| $50,000 to $99,999 | 0 (0.0%) | 39 (3.9%) |
| $100,000 to $299,999 | 261 (55.3%) | 671 (66.8%) |
| $300,000 to $499,999 | 138 (29.2%) | 247 (24.6%) |
| $500,000 to $749,999 | 15 (3.2%) | 12 (1.2%) |
| $750,000 to $999,999 | 0 (0.0%) | 0 (0.0%) |
| $1,000,000 or more | 16 (3.4%) | 23 (2.3%) |
| Total | 472 (100.0%) | 1,004 (100.0%) |
Household Income by Mortgage Status in Bellefonte borough
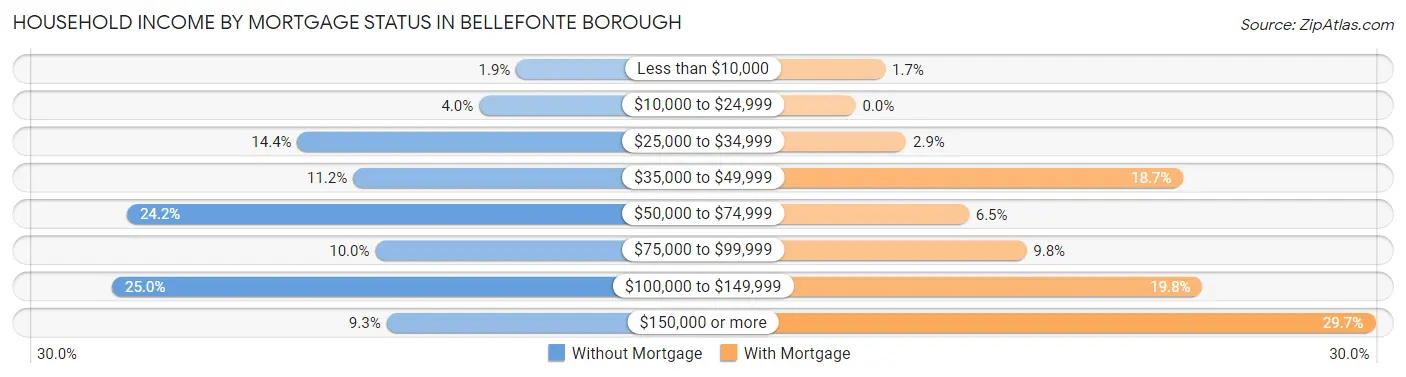
| Household Income | Without Mortgage | With Mortgage |
| Less than $10,000 | 9 (1.9%) | 17 (1.7%) |
| $10,000 to $24,999 | 19 (4.0%) | 0 (0.0%) |
| $25,000 to $34,999 | 68 (14.4%) | 29 (2.9%) |
| $35,000 to $49,999 | 53 (11.2%) | 188 (18.7%) |
| $50,000 to $74,999 | 114 (24.1%) | 65 (6.5%) |
| $75,000 to $99,999 | 47 (10.0%) | 98 (9.8%) |
| $100,000 to $149,999 | 118 (25.0%) | 199 (19.8%) |
| $150,000 or more | 44 (9.3%) | 298 (29.7%) |
| Total | 472 (100.0%) | 1,004 (100.0%) |
Property Value to Household Income Ratio in Bellefonte borough
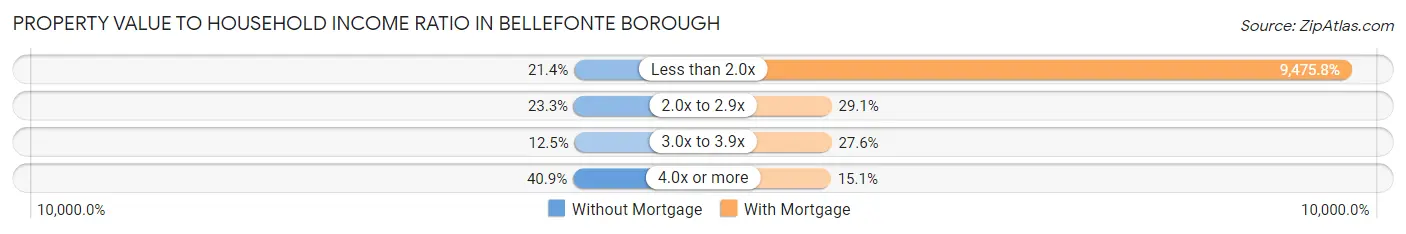
| Value-to-Income Ratio | Without Mortgage | With Mortgage |
| Less than 2.0x | 101 (21.4%) | 95,137 (9,475.8%) |
| 2.0x to 2.9x | 110 (23.3%) | 292 (29.1%) |
| 3.0x to 3.9x | 59 (12.5%) | 277 (27.6%) |
| 4.0x or more | 193 (40.9%) | 152 (15.1%) |
| Total | 472 (100.0%) | 1,004 (100.0%) |
Real Estate Taxes by Mortgage Status in Bellefonte borough
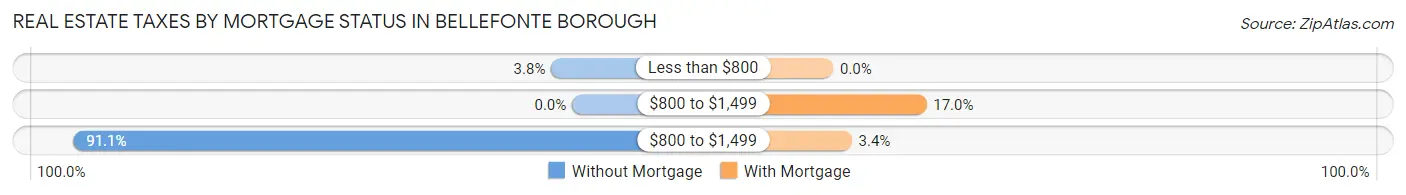
| Property Taxes | Without Mortgage | With Mortgage |
| Less than $800 | 18 (3.8%) | 0 (0.0%) |
| $800 to $1,499 | 0 (0.0%) | 171 (17.0%) |
| $800 to $1,499 | 430 (91.1%) | 34 (3.4%) |
| Total | 472 (100.0%) | 1,004 (100.0%) |
Health & Disability in Bellefonte borough
Health Insurance Coverage by Age in Bellefonte borough
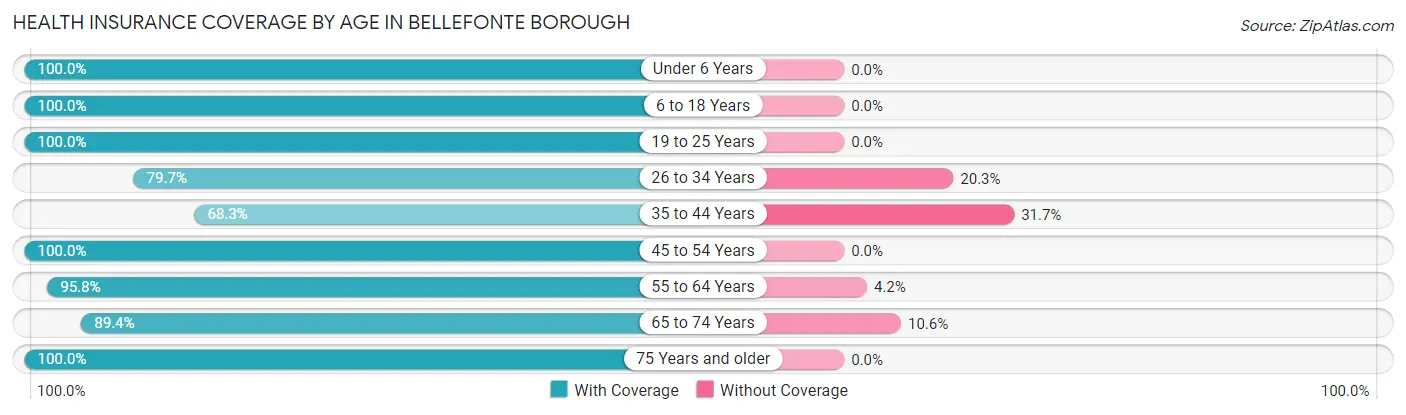
| Age Bracket | With Coverage | Without Coverage |
| Under 6 Years | 203 (100.0%) | 0 (0.0%) |
| 6 to 18 Years | 728 (100.0%) | 0 (0.0%) |
| 19 to 25 Years | 437 (100.0%) | 0 (0.0%) |
| 26 to 34 Years | 756 (79.7%) | 193 (20.3%) |
| 35 to 44 Years | 537 (68.3%) | 249 (31.7%) |
| 45 to 54 Years | 832 (100.0%) | 0 (0.0%) |
| 55 to 64 Years | 836 (95.8%) | 37 (4.2%) |
| 65 to 74 Years | 515 (89.4%) | 61 (10.6%) |
| 75 Years and older | 442 (100.0%) | 0 (0.0%) |
| Total | 5,286 (90.7%) | 540 (9.3%) |
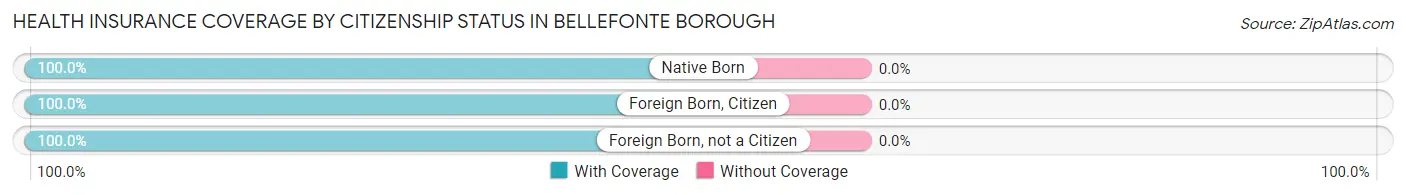
Health Insurance Coverage by Citizenship Status in Bellefonte borough
| Citizenship Status | With Coverage | Without Coverage |
| Native Born | 203 (100.0%) | 0 (0.0%) |
| Foreign Born, Citizen | 728 (100.0%) | 0 (0.0%) |
| Foreign Born, not a Citizen | 437 (100.0%) | 0 (0.0%) |
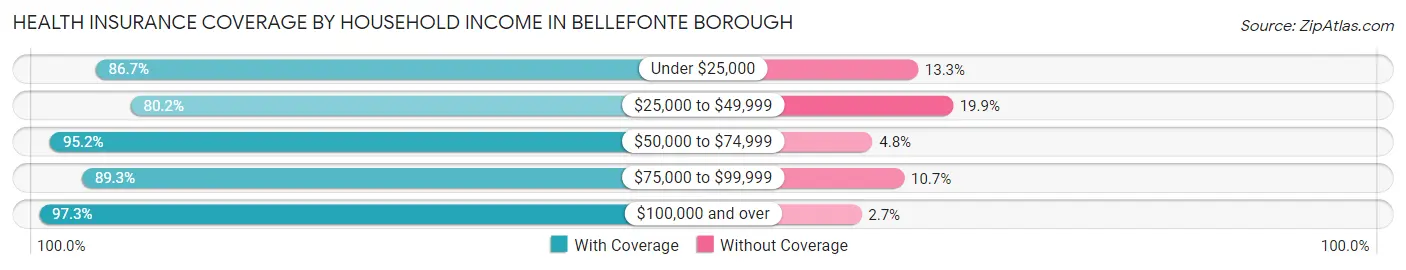
Health Insurance Coverage by Household Income in Bellefonte borough
| Household Income | With Coverage | Without Coverage |
| Under $25,000 | 762 (86.7%) | 117 (13.3%) |
| $25,000 to $49,999 | 957 (80.1%) | 237 (19.9%) |
| $50,000 to $74,999 | 735 (95.2%) | 37 (4.8%) |
| $75,000 to $99,999 | 758 (89.3%) | 91 (10.7%) |
| $100,000 and over | 2,068 (97.3%) | 58 (2.7%) |
Public vs Private Health Insurance Coverage by Age in Bellefonte borough
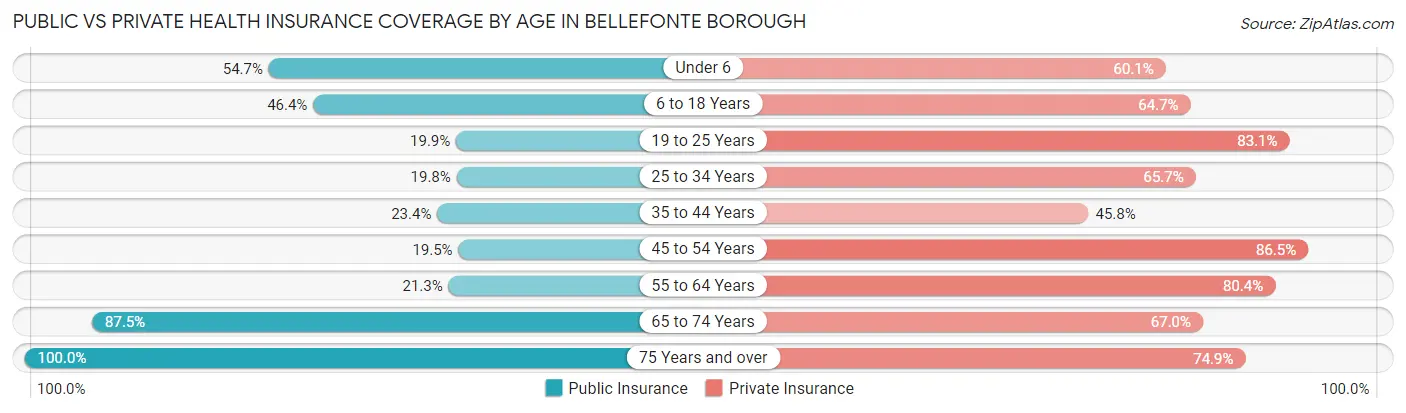
| Age Bracket | Public Insurance | Private Insurance |
| Under 6 | 111 (54.7%) | 122 (60.1%) |
| 6 to 18 Years | 338 (46.4%) | 471 (64.7%) |
| 19 to 25 Years | 87 (19.9%) | 363 (83.1%) |
| 25 to 34 Years | 188 (19.8%) | 623 (65.6%) |
| 35 to 44 Years | 184 (23.4%) | 360 (45.8%) |
| 45 to 54 Years | 162 (19.5%) | 720 (86.5%) |
| 55 to 64 Years | 186 (21.3%) | 702 (80.4%) |
| 65 to 74 Years | 504 (87.5%) | 386 (67.0%) |
| 75 Years and over | 442 (100.0%) | 331 (74.9%) |
| Total | 2,202 (37.8%) | 4,078 (70.0%) |
Disability Status by Sex by Age in Bellefonte borough
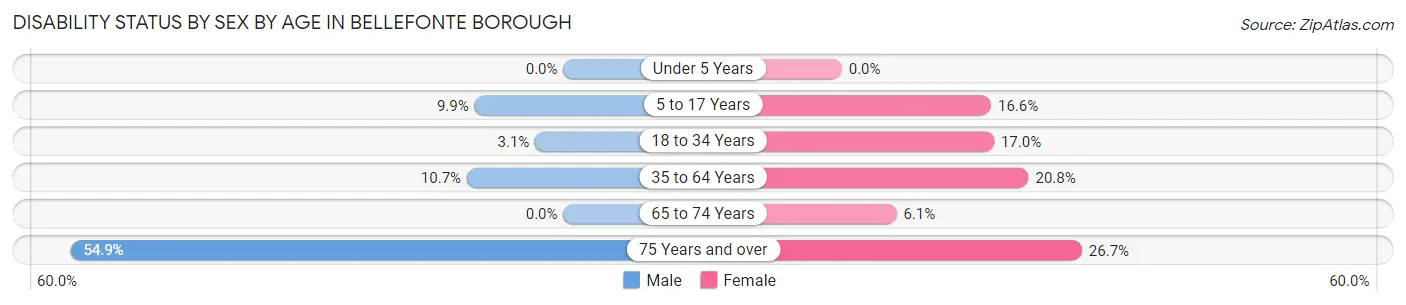
| Age Bracket | Male | Female |
| Under 5 Years | 0 (0.0%) | 0 (0.0%) |
| 5 to 17 Years | 35 (9.9%) | 64 (16.6%) |
| 18 to 34 Years | 20 (3.1%) | 130 (17.0%) |
| 35 to 64 Years | 141 (10.7%) | 245 (20.8%) |
| 65 to 74 Years | 0 (0.0%) | 14 (6.1%) |
| 75 Years and over | 101 (54.9%) | 69 (26.7%) |
Disability Class by Sex by Age in Bellefonte borough
Disability Class: Hearing Difficulty
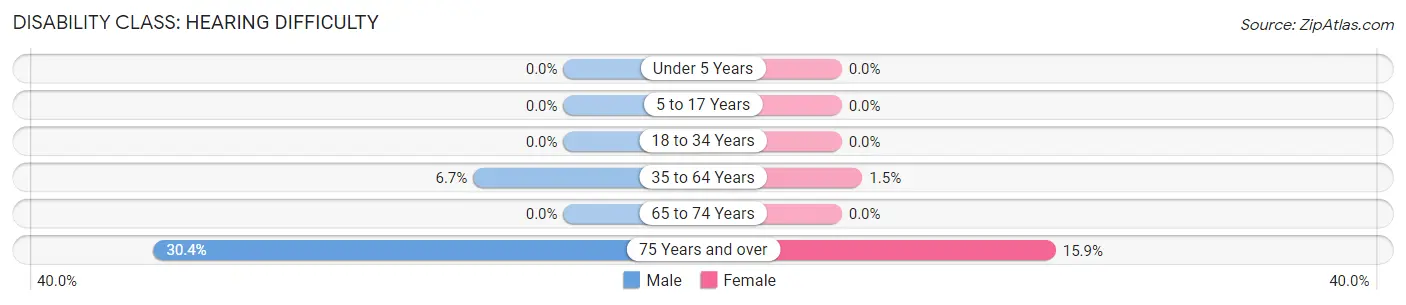
| Age Bracket | Male | Female |
| Under 5 Years | 0 (0.0%) | 0 (0.0%) |
| 5 to 17 Years | 0 (0.0%) | 0 (0.0%) |
| 18 to 34 Years | 0 (0.0%) | 0 (0.0%) |
| 35 to 64 Years | 88 (6.7%) | 18 (1.5%) |
| 65 to 74 Years | 0 (0.0%) | 0 (0.0%) |
| 75 Years and over | 56 (30.4%) | 41 (15.9%) |
Disability Class: Vision Difficulty
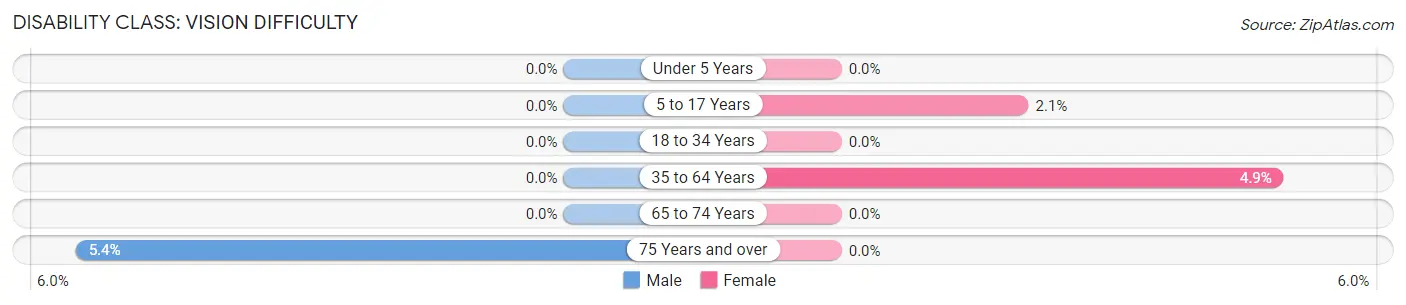
| Age Bracket | Male | Female |
| Under 5 Years | 0 (0.0%) | 0 (0.0%) |
| 5 to 17 Years | 0 (0.0%) | 8 (2.1%) |
| 18 to 34 Years | 0 (0.0%) | 0 (0.0%) |
| 35 to 64 Years | 0 (0.0%) | 58 (4.9%) |
| 65 to 74 Years | 0 (0.0%) | 0 (0.0%) |
| 75 Years and over | 10 (5.4%) | 0 (0.0%) |
Disability Class: Cognitive Difficulty
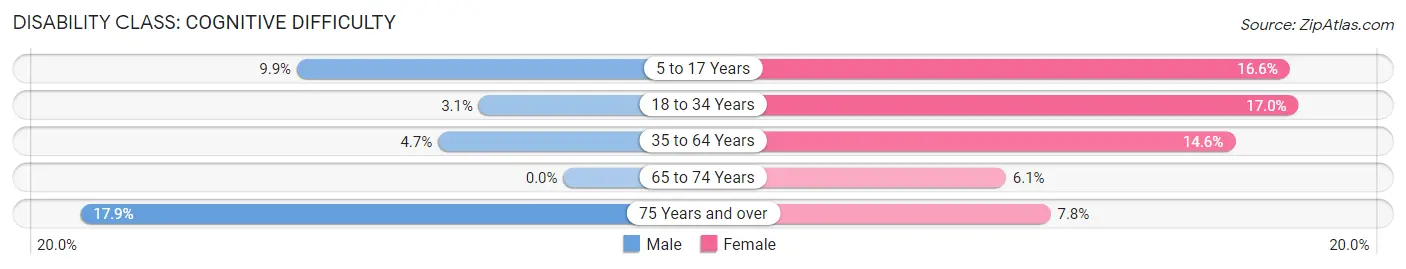
| Age Bracket | Male | Female |
| 5 to 17 Years | 35 (9.9%) | 64 (16.6%) |
| 18 to 34 Years | 20 (3.1%) | 130 (17.0%) |
| 35 to 64 Years | 61 (4.6%) | 172 (14.6%) |
| 65 to 74 Years | 0 (0.0%) | 14 (6.1%) |
| 75 Years and over | 33 (17.9%) | 20 (7.7%) |
Disability Class: Ambulatory Difficulty
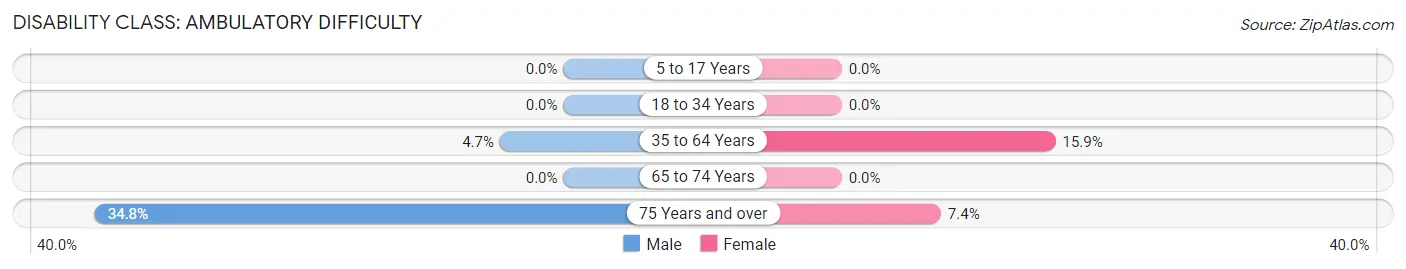
| Age Bracket | Male | Female |
| 5 to 17 Years | 0 (0.0%) | 0 (0.0%) |
| 18 to 34 Years | 0 (0.0%) | 0 (0.0%) |
| 35 to 64 Years | 62 (4.7%) | 187 (15.9%) |
| 65 to 74 Years | 0 (0.0%) | 0 (0.0%) |
| 75 Years and over | 64 (34.8%) | 19 (7.4%) |
Disability Class: Self-Care Difficulty
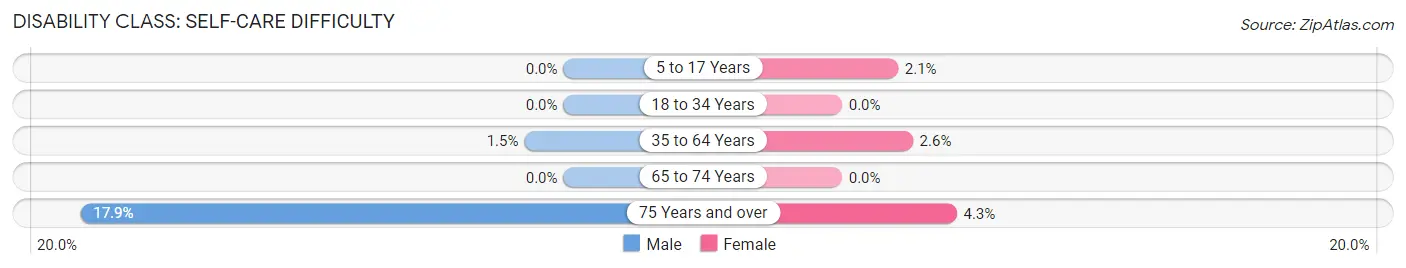
| Age Bracket | Male | Female |
| 5 to 17 Years | 0 (0.0%) | 8 (2.1%) |
| 18 to 34 Years | 0 (0.0%) | 0 (0.0%) |
| 35 to 64 Years | 19 (1.5%) | 31 (2.6%) |
| 65 to 74 Years | 0 (0.0%) | 0 (0.0%) |
| 75 Years and over | 33 (17.9%) | 11 (4.3%) |
Technology Access in Bellefonte borough
Computing Device Access in Bellefonte borough
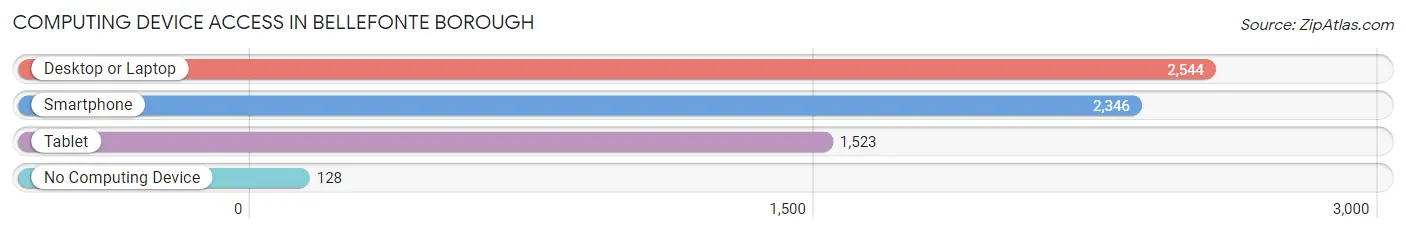
| Device Type | # Households | % Households |
| Desktop or Laptop | 2,544 | 88.2% |
| Smartphone | 2,346 | 81.4% |
| Tablet | 1,523 | 52.8% |
| No Computing Device | 128 | 4.4% |
| Total | 2,884 | 100.0% |
Internet Access in Bellefonte borough
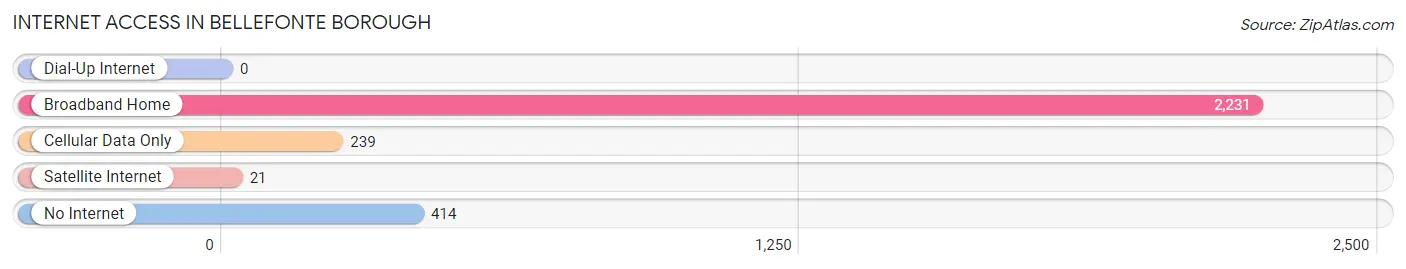
| Internet Type | # Households | % Households |
| Dial-Up Internet | 0 | 0.0% |
| Broadband Home | 2,231 | 77.4% |
| Cellular Data Only | 239 | 8.3% |
| Satellite Internet | 21 | 0.7% |
| No Internet | 414 | 14.4% |
| Total | 2,884 | 100.0% |
Bellefonte borough Summary
Bellefonte Borough is a borough located in Centre County, Pennsylvania, United States. It is the county seat of Centre County and is located about 12 miles northeast of State College. As of the 2010 census, the borough had a population of 6,187.
History
Bellefonte was founded in 1795 by James Dunlop, a settler from Scotland. The town was named after the French word for “beautiful fountain” and was originally intended to be a resort town. The town was laid out in a grid pattern with wide streets and public squares. The town quickly grew and by 1810, it had become the county seat of Centre County.
In the 19th century, Bellefonte was a major industrial center. It was home to several iron furnaces, a rolling mill, and a large tannery. The town also had several hotels, a bank, and a newspaper. In 1851, the Pennsylvania Railroad arrived in Bellefonte, connecting it to the rest of the state.
In the 20th century, Bellefonte’s economy shifted away from industry and towards tourism. The town became a popular destination for visitors from around the state and the country. The town also became a popular filming location for movies and television shows.
Geography
Bellefonte is located in central Pennsylvania at 40°51'N 77°47'W. It is situated in the Nittany Valley, a valley in the Appalachian Mountains. The borough is bordered by Spring Township to the north, Walker Township to the east, and Miles Township to the south.
The borough covers an area of 1.7 square miles and is located at an elevation of 1,068 feet. The borough is located in the humid continental climate zone and has four distinct seasons. The average annual temperature is 48°F and the average annual precipitation is 40 inches.
Economy
Bellefonte’s economy is largely based on tourism. The town is home to several historic sites, including the Talleyrand Park, the Bellefonte Historic District, and the Bellefonte Art Museum. The town also hosts several annual festivals, including the Bellefonte Cruise, the Bellefonte Arts and Crafts Festival, and the Bellefonte Victorian Christmas.
The borough is also home to several businesses, including restaurants, retail stores, and professional services. The borough is home to several manufacturing companies, including a paper mill and a metal fabrication plant.
Demographics
As of the 2010 census, there were 6,187 people, 2,541 households, and 1,541 families living in the borough. The population density was 3,619.3 people per square mile. The racial makeup of the borough was 95.3% White, 1.2% African American, 0.2% Native American, 0.7% Asian, 0.1% Pacific Islander, 0.7% from other races, and 1.9% from two or more races. Hispanic or Latino of any race were 2.2% of the population.
The median age in the borough was 39.2 years. 22.2% of residents were under the age of 18; 8.2% were between the ages of 18 and 24; 25.2% were from 25 to 44; 28.2% were from 45 to 64; and 16.2% were 65 years of age or older. The gender makeup of the borough was 48.2% male and 51.8% female.
The median income for a household in the borough was $41,945 and the median income for a family was $51,945. The per capita income for the borough was $21,945. About 8.2% of families and 11.2% of the population were below the poverty line, including 16.2% of those under age 18 and 8.2% of those age 65 or over.
Common Questions
What is Per Capita Income in Bellefonte borough?
Per Capita income in Bellefonte borough is $35,961.
What is the Median Family Income in Bellefonte borough?
Median Family Income in Bellefonte borough is $96,250.
What is the Median Household income in Bellefonte borough?
Median Household Income in Bellefonte borough is $56,008.
What is Income or Wage Gap in Bellefonte borough?
Income or Wage Gap in Bellefonte borough is 26.7%.
Women in Bellefonte borough earn 73.3 cents for every dollar earned by a man.
What is Inequality or Gini Index in Bellefonte borough?
Inequality or Gini Index in Bellefonte borough is 0.42.
What is the Total Population of Bellefonte borough?
Total Population of Bellefonte borough is 6,071.
What is the Total Male Population of Bellefonte borough?
Total Male Population of Bellefonte borough is 3,020.
What is the Total Female Population of Bellefonte borough?
Total Female Population of Bellefonte borough is 3,051.
What is the Ratio of Males per 100 Females in Bellefonte borough?
There are 98.98 Males per 100 Females in Bellefonte borough.
What is the Ratio of Females per 100 Males in Bellefonte borough?
There are 101.03 Females per 100 Males in Bellefonte borough.
What is the Median Population Age in Bellefonte borough?
Median Population Age in Bellefonte borough is 43.0 Years.
What is the Average Family Size in Bellefonte borough
Average Family Size in Bellefonte borough is 2.6 People.
What is the Average Household Size in Bellefonte borough
Average Household Size in Bellefonte borough is 2.0 People.
How Large is the Labor Force in Bellefonte borough?
There are 3,418 People in the Labor Forcein in Bellefonte borough.
What is the Percentage of People in the Labor Force in Bellefonte borough?
65.9% of People are in the Labor Force in Bellefonte borough.
What is the Unemployment Rate in Bellefonte borough?
Unemployment Rate in Bellefonte borough is 1.1%.