Westmont borough, PA Map & Demographics
Westmont borough Overview
$48,706
PER CAPITA INCOME
$125,080
AVG FAMILY INCOME
$94,173
AVG HOUSEHOLD INCOME
21.9%
WAGE / INCOME GAP [ % ]
78.1¢/ $1
WAGE / INCOME GAP [ $ ]
0.42
INEQUALITY / GINI INDEX
4,964
TOTAL POPULATION
2,385
MALE POPULATION
2,579
FEMALE POPULATION
92.48
MALES / 100 FEMALES
108.13
FEMALES / 100 MALES
45.4
MEDIAN AGE
2.8
AVG FAMILY SIZE
2.5
AVG HOUSEHOLD SIZE
2,415
LABOR FORCE [ PEOPLE ]
59.8%
PERCENT IN LABOR FORCE
9.9%
UNEMPLOYMENT RATE
Income in Westmont borough
Income Overview in Westmont borough
Per Capita Income in Westmont borough is $48,706, while median incomes of families and households are $125,080 and $94,173 respectively.
| Characteristic | Number | Measure |
| Per Capita Income | 4,964 | $48,706 |
| Median Family Income | 1,477 | $125,080 |
| Mean Family Income | 1,477 | $140,752 |
| Median Household Income | 2,020 | $94,173 |
| Mean Household Income | 2,020 | $118,674 |
| Income Deficit | 1,477 | $0 |
| Wage / Income Gap (%) | 4,964 | 21.92% |
| Wage / Income Gap ($) | 4,964 | 78.08¢ per $1 |
| Gini / Inequality Index | 4,964 | 0.42 |
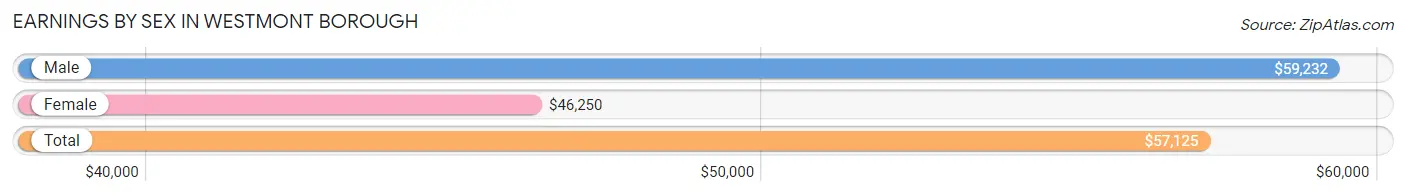
Earnings by Sex in Westmont borough
Average Earnings in Westmont borough are $57,125, $59,232 for men and $46,250 for women, a difference of 21.9%.
| Sex | Number | Average Earnings |
| Male | 1,229 (52.3%) | $59,232 |
| Female | 1,121 (47.7%) | $46,250 |
| Total | 2,350 (100.0%) | $57,125 |
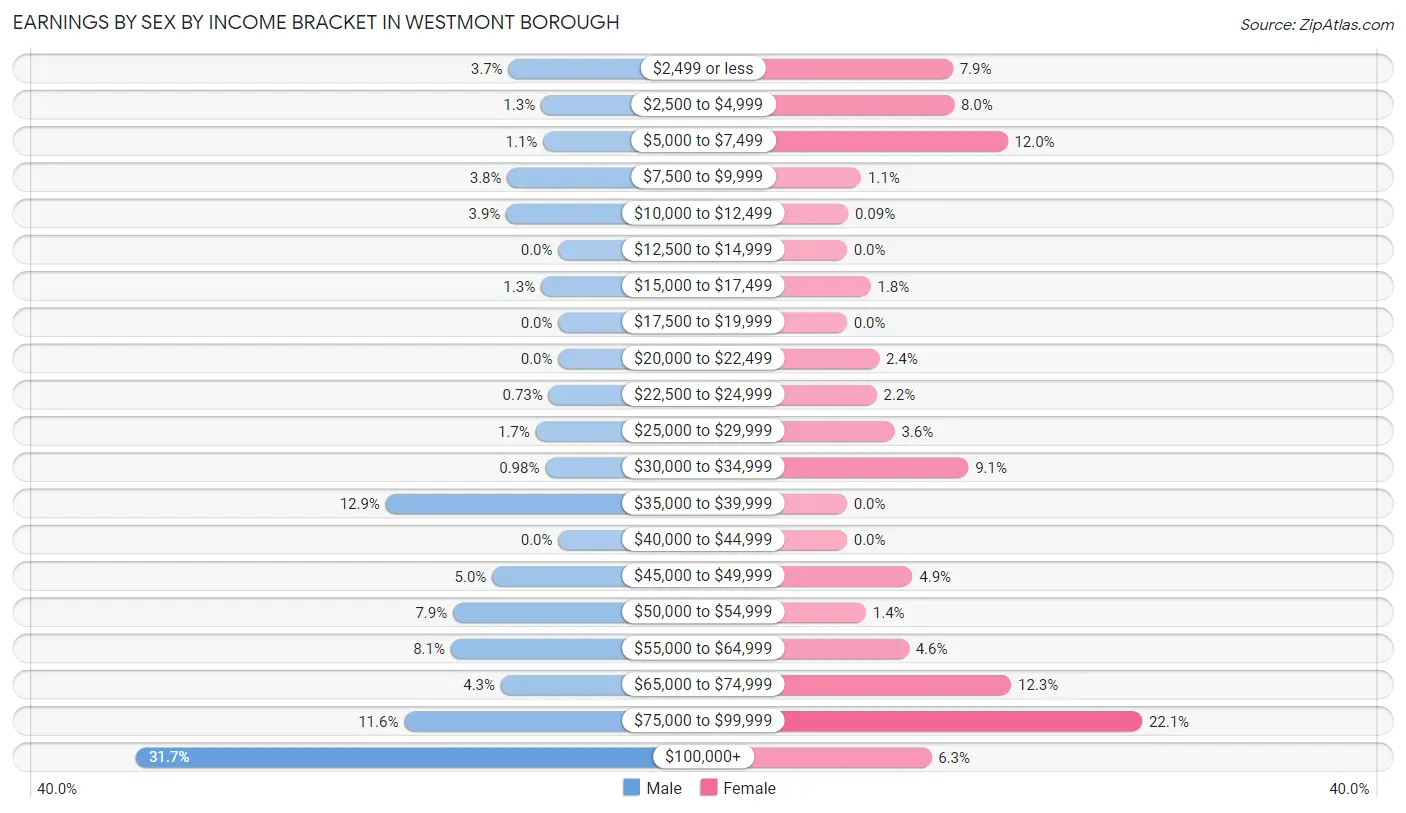
Earnings by Sex by Income Bracket in Westmont borough
The most common earnings brackets in Westmont borough are $100,000+ for men (389 | 31.7%) and $75,000 to $99,999 for women (248 | 22.1%).
| Income | Male | Female |
| $2,499 or less | 46 (3.7%) | 89 (7.9%) |
| $2,500 to $4,999 | 16 (1.3%) | 90 (8.0%) |
| $5,000 to $7,499 | 14 (1.1%) | 135 (12.0%) |
| $7,500 to $9,999 | 47 (3.8%) | 12 (1.1%) |
| $10,000 to $12,499 | 48 (3.9%) | 1 (0.1%) |
| $12,500 to $14,999 | 0 (0.0%) | 0 (0.0%) |
| $15,000 to $17,499 | 16 (1.3%) | 20 (1.8%) |
| $17,500 to $19,999 | 0 (0.0%) | 0 (0.0%) |
| $20,000 to $22,499 | 0 (0.0%) | 27 (2.4%) |
| $22,500 to $24,999 | 9 (0.7%) | 25 (2.2%) |
| $25,000 to $29,999 | 21 (1.7%) | 40 (3.6%) |
| $30,000 to $34,999 | 12 (1.0%) | 102 (9.1%) |
| $35,000 to $39,999 | 159 (12.9%) | 0 (0.0%) |
| $40,000 to $44,999 | 0 (0.0%) | 0 (0.0%) |
| $45,000 to $49,999 | 61 (5.0%) | 55 (4.9%) |
| $50,000 to $54,999 | 97 (7.9%) | 16 (1.4%) |
| $55,000 to $64,999 | 99 (8.1%) | 52 (4.6%) |
| $65,000 to $74,999 | 53 (4.3%) | 138 (12.3%) |
| $75,000 to $99,999 | 142 (11.6%) | 248 (22.1%) |
| $100,000+ | 389 (31.7%) | 71 (6.3%) |
| Total | 1,229 (100.0%) | 1,121 (100.0%) |
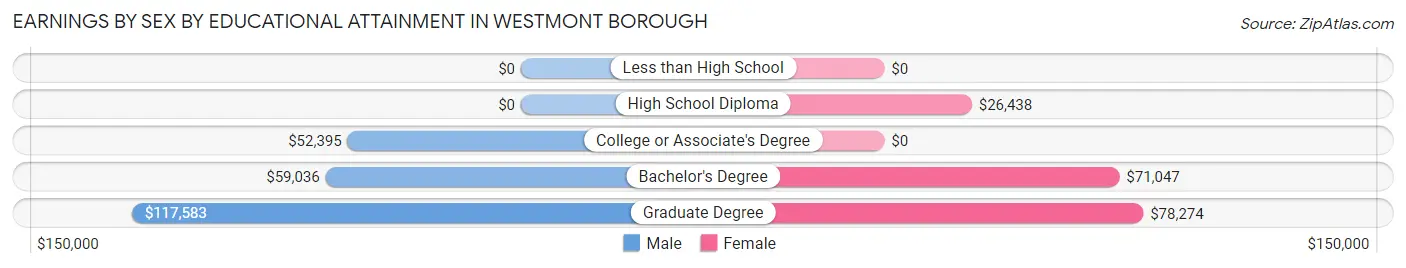
Earnings by Sex by Educational Attainment in Westmont borough
Average earnings in Westmont borough are $59,518 for men and $63,029 for women, a difference of 5.6%. Men with an educational attainment of graduate degree enjoy the highest average annual earnings of $117,583, while those with college or associate's degree education earn the least with $52,395. Women with an educational attainment of graduate degree earn the most with the average annual earnings of $78,274, while those with high school diploma education have the smallest earnings of $26,438.
| Educational Attainment | Male Income | Female Income |
| Less than High School | - | - |
| High School Diploma | - | - |
| College or Associate's Degree | $52,395 | $0 |
| Bachelor's Degree | $59,036 | $71,047 |
| Graduate Degree | $117,583 | $78,274 |
| Total | $59,518 | $63,029 |
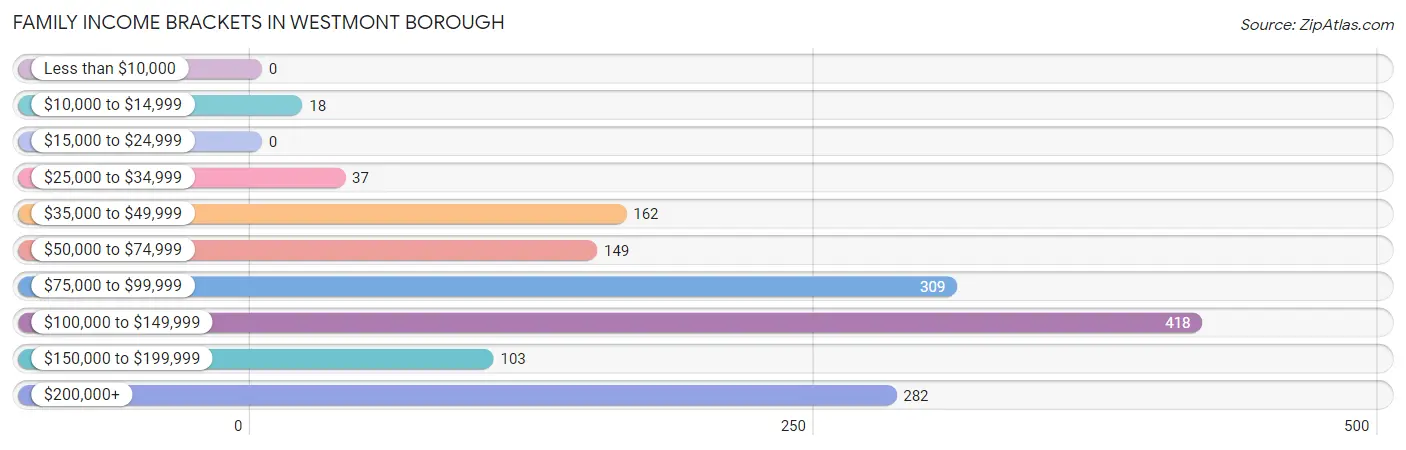
Family Income in Westmont borough
Family Income Brackets in Westmont borough
According to the Westmont borough family income data, there are 418 families falling into the $100,000 to $149,999 income range, which is the most common income bracket and makes up 28.3% of all families.
| Income Bracket | # Families | % Families |
| Less than $10,000 | 0 | 0.0% |
| $10,000 to $14,999 | 18 | 1.2% |
| $15,000 to $24,999 | 0 | 0.0% |
| $25,000 to $34,999 | 37 | 2.5% |
| $35,000 to $49,999 | 162 | 11.0% |
| $50,000 to $74,999 | 149 | 10.1% |
| $75,000 to $99,999 | 309 | 20.9% |
| $100,000 to $149,999 | 418 | 28.3% |
| $150,000 to $199,999 | 103 | 7.0% |
| $200,000+ | 282 | 19.1% |
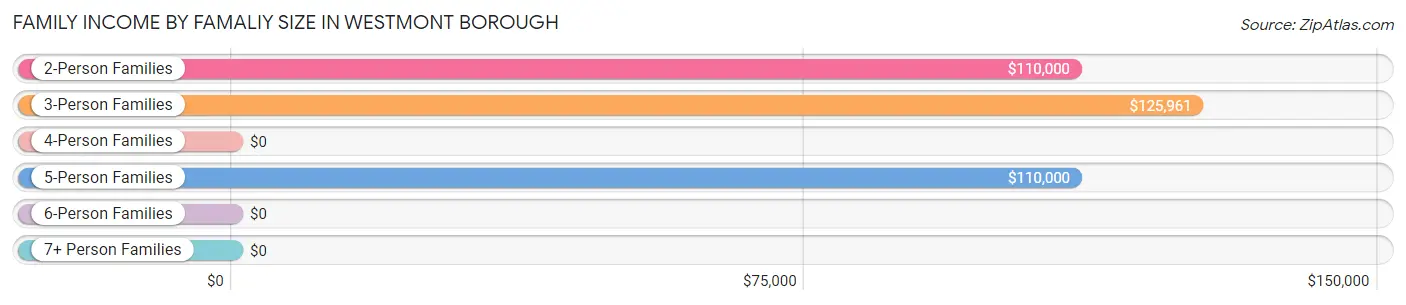
Family Income by Famaliy Size in Westmont borough
3-person families (253 | 17.1%) account for the highest median family income in Westmont borough with $125,961 per family, while 2-person families (926 | 62.7%) have the highest median income of $55,000 per family member.
| Income Bracket | # Families | Median Income |
| 2-Person Families | 926 (62.7%) | $110,000 |
| 3-Person Families | 253 (17.1%) | $125,961 |
| 4-Person Families | 130 (8.8%) | $0 |
| 5-Person Families | 96 (6.5%) | $110,000 |
| 6-Person Families | 32 (2.2%) | $0 |
| 7+ Person Families | 40 (2.7%) | $0 |
| Total | 1,477 (100.0%) | $125,080 |
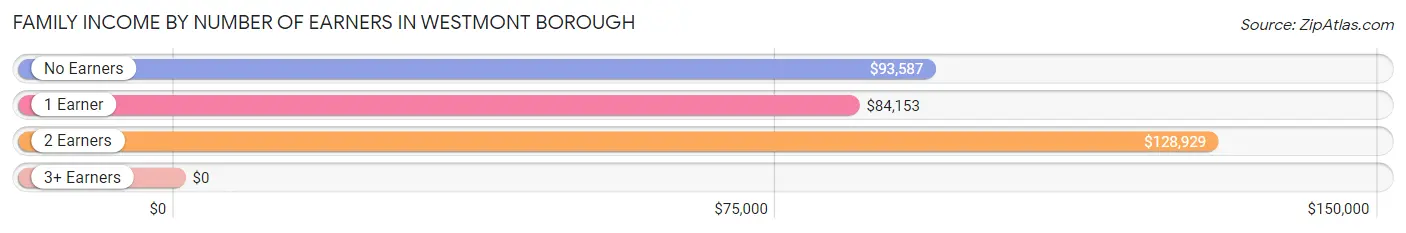
Family Income by Number of Earners in Westmont borough
| Number of Earners | # Families | Median Income |
| No Earners | 256 (17.3%) | $93,587 |
| 1 Earner | 413 (28.0%) | $84,153 |
| 2 Earners | 762 (51.6%) | $128,929 |
| 3+ Earners | 46 (3.1%) | $0 |
| Total | 1,477 (100.0%) | $125,080 |
Household Income in Westmont borough
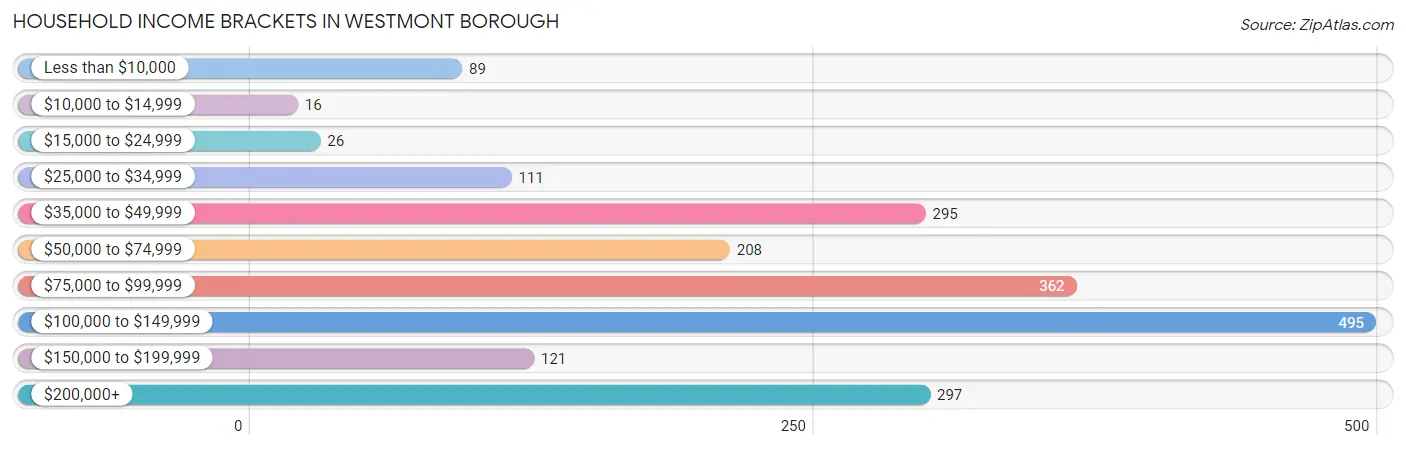
Household Income Brackets in Westmont borough
With 495 households falling in the category, the $100,000 to $149,999 income range is the most frequent in Westmont borough, accounting for 24.5% of all households. In contrast, only 16 households (0.8%) fall into the $10,000 to $14,999 income bracket, making it the least populous group.
| Income Bracket | # Households | % Households |
| Less than $10,000 | 89 | 4.4% |
| $10,000 to $14,999 | 16 | 0.8% |
| $15,000 to $24,999 | 26 | 1.3% |
| $25,000 to $34,999 | 111 | 5.5% |
| $35,000 to $49,999 | 295 | 14.6% |
| $50,000 to $74,999 | 208 | 10.3% |
| $75,000 to $99,999 | 362 | 17.9% |
| $100,000 to $149,999 | 495 | 24.5% |
| $150,000 to $199,999 | 121 | 6.0% |
| $200,000+ | 297 | 14.7% |
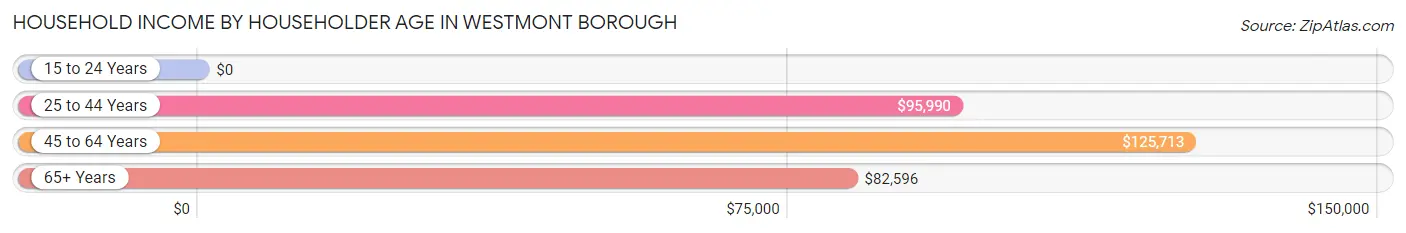
Household Income by Householder Age in Westmont borough
The median household income in Westmont borough is $94,173, with the highest median household income of $125,713 found in the 45 to 64 years age bracket for the primary householder. A total of 801 households (39.7%) fall into this category.
| Income Bracket | # Households | Median Income |
| 15 to 24 Years | 0 (0.0%) | $0 |
| 25 to 44 Years | 555 (27.5%) | $95,990 |
| 45 to 64 Years | 801 (39.7%) | $125,713 |
| 65+ Years | 664 (32.9%) | $82,596 |
| Total | 2,020 (100.0%) | $94,173 |
Poverty in Westmont borough
Income Below Poverty by Sex and Age in Westmont borough
With 10.3% poverty level for males and 13.3% for females among the residents of Westmont borough, 18 to 24 year old males and 18 to 24 year old females are the most vulnerable to poverty, with 123 males (88.5%) and 100 females (58.5%) in their respective age groups living below the poverty level.
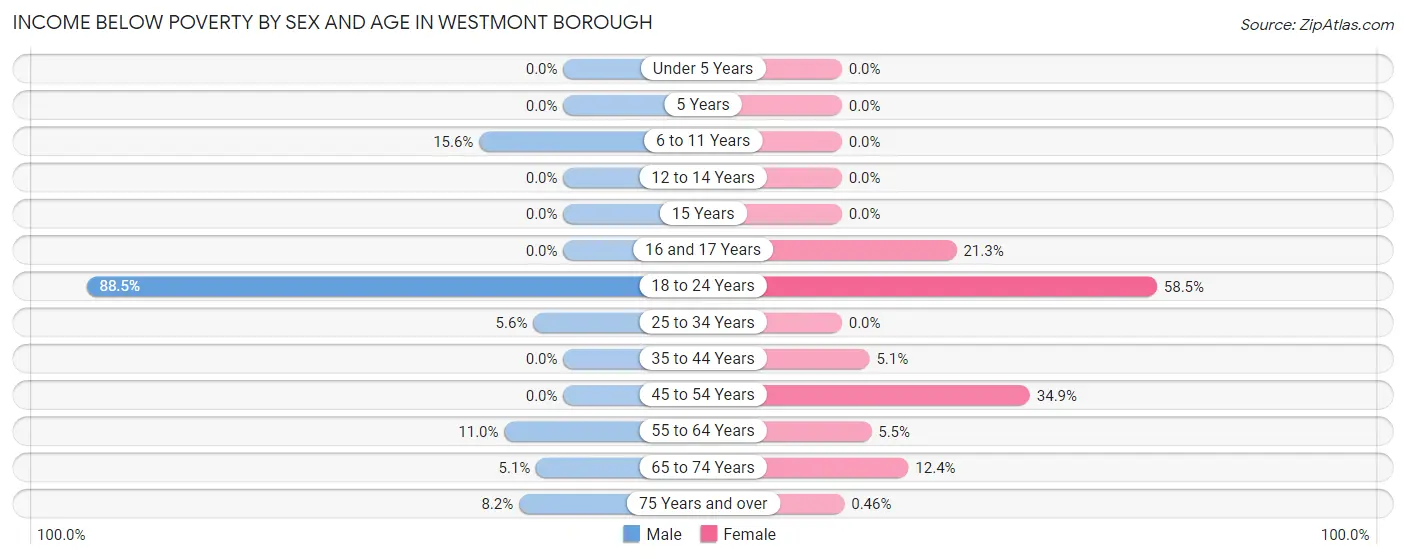
| Age Bracket | Male | Female |
| Under 5 Years | 0 (0.0%) | 0 (0.0%) |
| 5 Years | 0 (0.0%) | 0 (0.0%) |
| 6 to 11 Years | 30 (15.6%) | 0 (0.0%) |
| 12 to 14 Years | 0 (0.0%) | 0 (0.0%) |
| 15 Years | 0 (0.0%) | 0 (0.0%) |
| 16 and 17 Years | 0 (0.0%) | 33 (21.3%) |
| 18 to 24 Years | 123 (88.5%) | 100 (58.5%) |
| 25 to 34 Years | 17 (5.6%) | 0 (0.0%) |
| 35 to 44 Years | 0 (0.0%) | 16 (5.1%) |
| 45 to 54 Years | 0 (0.0%) | 140 (34.9%) |
| 55 to 64 Years | 45 (11.0%) | 21 (5.5%) |
| 65 to 74 Years | 19 (5.1%) | 32 (12.4%) |
| 75 Years and over | 12 (8.2%) | 1 (0.5%) |
| Total | 246 (10.3%) | 343 (13.3%) |
Income Above Poverty by Sex and Age in Westmont borough
According to the poverty statistics in Westmont borough, males aged under 5 years and females aged under 5 years are the age groups that are most secure financially, with 100.0% of males and 100.0% of females in these age groups living above the poverty line.
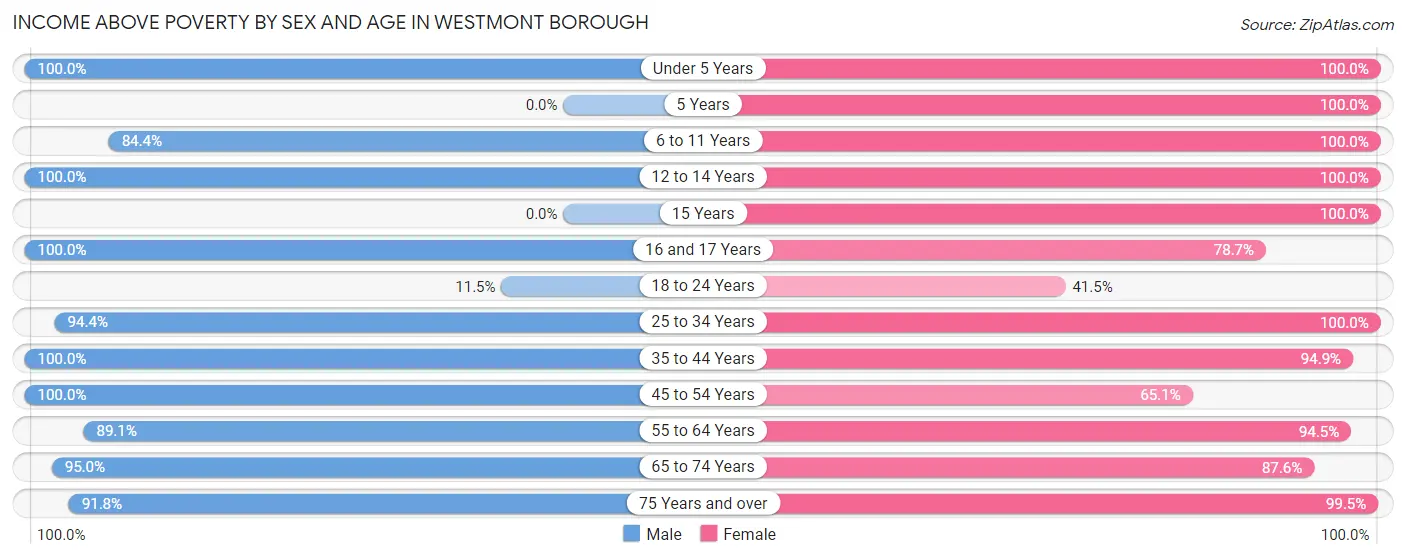
| Age Bracket | Male | Female |
| Under 5 Years | 95 (100.0%) | 140 (100.0%) |
| 5 Years | 0 (0.0%) | 25 (100.0%) |
| 6 to 11 Years | 162 (84.4%) | 194 (100.0%) |
| 12 to 14 Years | 127 (100.0%) | 41 (100.0%) |
| 15 Years | 0 (0.0%) | 111 (100.0%) |
| 16 and 17 Years | 58 (100.0%) | 122 (78.7%) |
| 18 to 24 Years | 16 (11.5%) | 71 (41.5%) |
| 25 to 34 Years | 287 (94.4%) | 168 (100.0%) |
| 35 to 44 Years | 187 (100.0%) | 295 (94.9%) |
| 45 to 54 Years | 350 (100.0%) | 261 (65.1%) |
| 55 to 64 Years | 366 (89.0%) | 363 (94.5%) |
| 65 to 74 Years | 357 (95.0%) | 227 (87.6%) |
| 75 Years and over | 134 (91.8%) | 218 (99.5%) |
| Total | 2,139 (89.7%) | 2,236 (86.7%) |
Income Below Poverty Among Married-Couple Families in Westmont borough
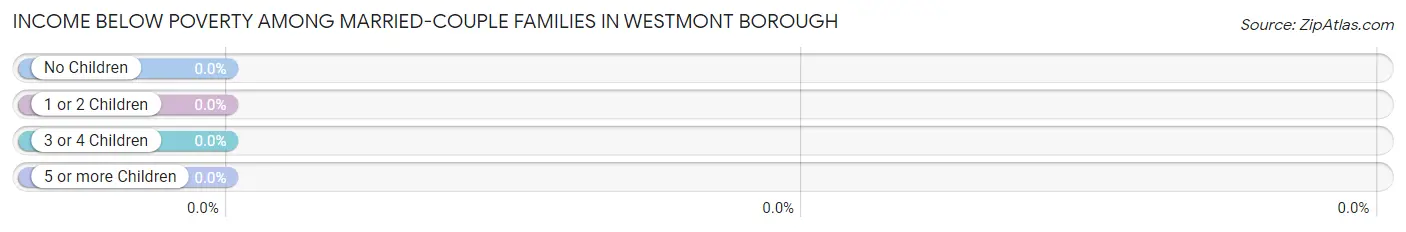
| Children | Above Poverty | Below Poverty |
| No Children | 740 (100.0%) | 0 (0.0%) |
| 1 or 2 Children | 304 (100.0%) | 0 (0.0%) |
| 3 or 4 Children | 81 (100.0%) | 0 (0.0%) |
| 5 or more Children | 40 (100.0%) | 0 (0.0%) |
| Total | 1,165 (100.0%) | 0 (0.0%) |
Income Below Poverty Among Single-Parent Households in Westmont borough
According to the poverty data in Westmont borough, 11.7% or 17 single-father households and 19.2% or 32 single-mother households are living below the poverty line. Among single-father households, those with no children have the highest poverty rate, with 17 households (100.0%) experiencing poverty. Likewise, among single-mother households, those with 1 or 2 children have the highest poverty rate, with 32 households (62.7%) falling below the poverty line.
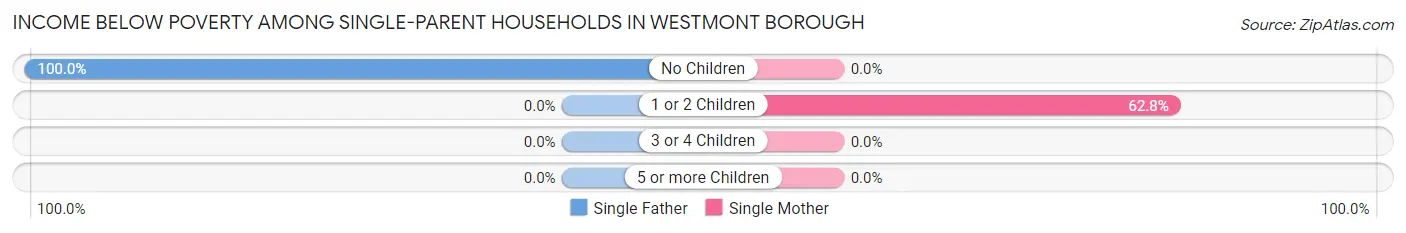
| Children | Single Father | Single Mother |
| No Children | 17 (100.0%) | 0 (0.0%) |
| 1 or 2 Children | 0 (0.0%) | 32 (62.7%) |
| 3 or 4 Children | 0 (0.0%) | 0 (0.0%) |
| 5 or more Children | 0 (0.0%) | 0 (0.0%) |
| Total | 17 (11.7%) | 32 (19.2%) |
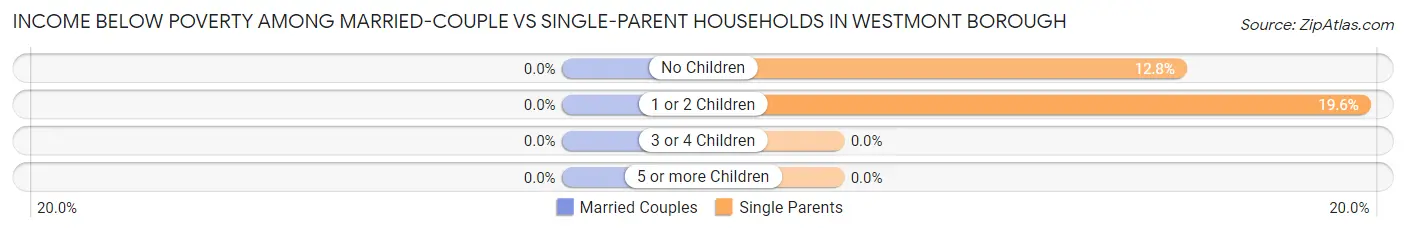
Income Below Poverty Among Married-Couple vs Single-Parent Households in Westmont borough
| Children | Married-Couple Families | Single-Parent Households |
| No Children | 0 (0.0%) | 17 (12.8%) |
| 1 or 2 Children | 0 (0.0%) | 32 (19.6%) |
| 3 or 4 Children | 0 (0.0%) | 0 (0.0%) |
| 5 or more Children | 0 (0.0%) | 0 (0.0%) |
| Total | 0 (0.0%) | 49 (15.7%) |
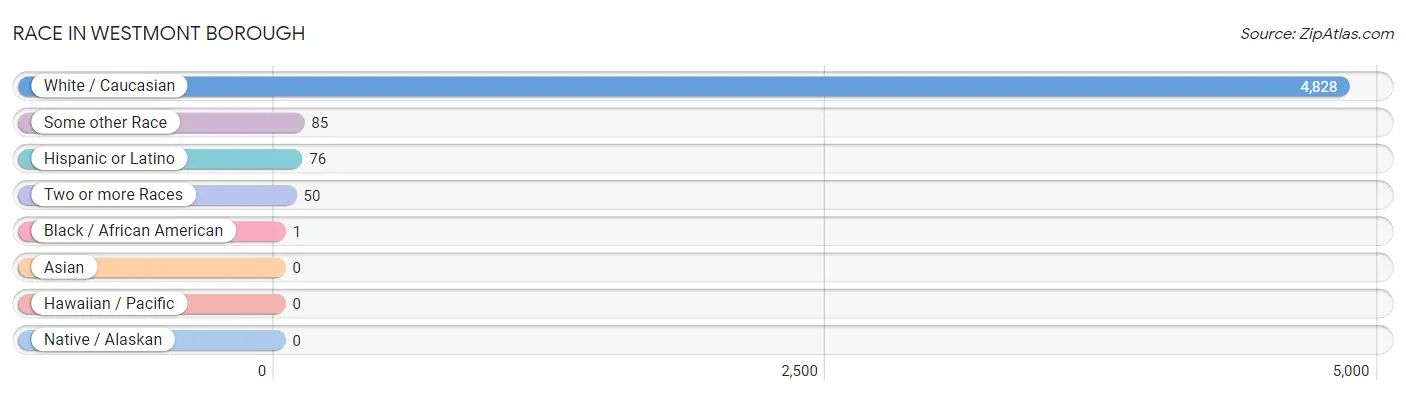
Race in Westmont borough
The most populous races in Westmont borough are White / Caucasian (4,828 | 97.3%), Some other Race (85 | 1.7%), and Hispanic or Latino (76 | 1.5%).
| Race | # Population | % Population |
| Asian | 0 | 0.0% |
| Black / African American | 1 | 0.0% |
| Hawaiian / Pacific | 0 | 0.0% |
| Hispanic or Latino | 76 | 1.5% |
| Native / Alaskan | 0 | 0.0% |
| White / Caucasian | 4,828 | 97.3% |
| Two or more Races | 50 | 1.0% |
| Some other Race | 85 | 1.7% |
| Total | 4,964 | 100.0% |
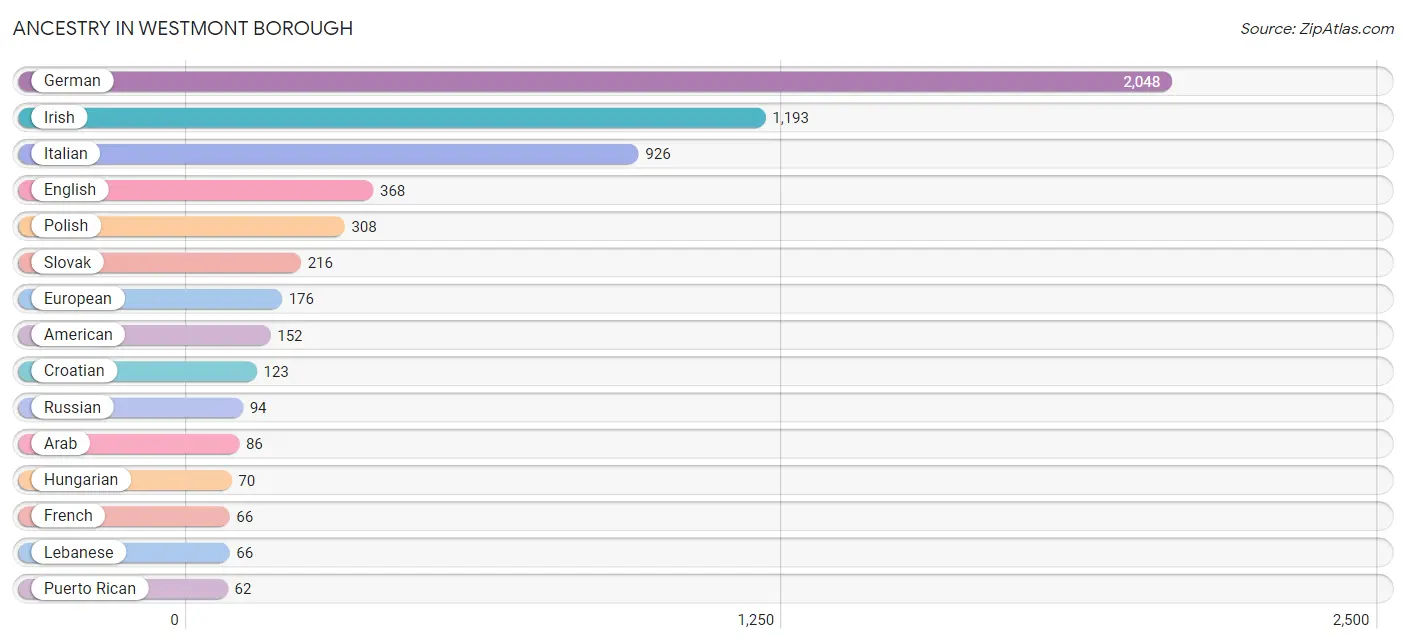
Ancestry in Westmont borough
The most populous ancestries reported in Westmont borough are German (2,048 | 41.3%), Irish (1,193 | 24.0%), Italian (926 | 18.6%), English (368 | 7.4%), and Polish (308 | 6.2%), together accounting for 97.6% of all Westmont borough residents.
| Ancestry | # Population | % Population |
| African | 1 | 0.0% |
| American | 152 | 3.1% |
| Arab | 86 | 1.7% |
| Armenian | 11 | 0.2% |
| Austrian | 15 | 0.3% |
| British | 14 | 0.3% |
| Croatian | 123 | 2.5% |
| Dutch | 10 | 0.2% |
| Eastern European | 28 | 0.6% |
| Egyptian | 10 | 0.2% |
| English | 368 | 7.4% |
| European | 176 | 3.5% |
| French | 66 | 1.3% |
| German | 2,048 | 41.3% |
| Hungarian | 70 | 1.4% |
| Irish | 1,193 | 24.0% |
| Italian | 926 | 18.6% |
| Lebanese | 66 | 1.3% |
| Mexican | 14 | 0.3% |
| Pennsylvania German | 7 | 0.1% |
| Polish | 308 | 6.2% |
| Puerto Rican | 62 | 1.3% |
| Russian | 94 | 1.9% |
| Scandinavian | 14 | 0.3% |
| Scotch-Irish | 55 | 1.1% |
| Scottish | 6 | 0.1% |
| Serbian | 16 | 0.3% |
| Slavic | 50 | 1.0% |
| Slovak | 216 | 4.3% |
| Slovene | 23 | 0.5% |
| Subsaharan African | 1 | 0.0% |
| Swedish | 31 | 0.6% |
| Syrian | 10 | 0.2% |
| Ukrainian | 27 | 0.5% |
| Welsh | 10 | 0.2% | View All 35 Rows |
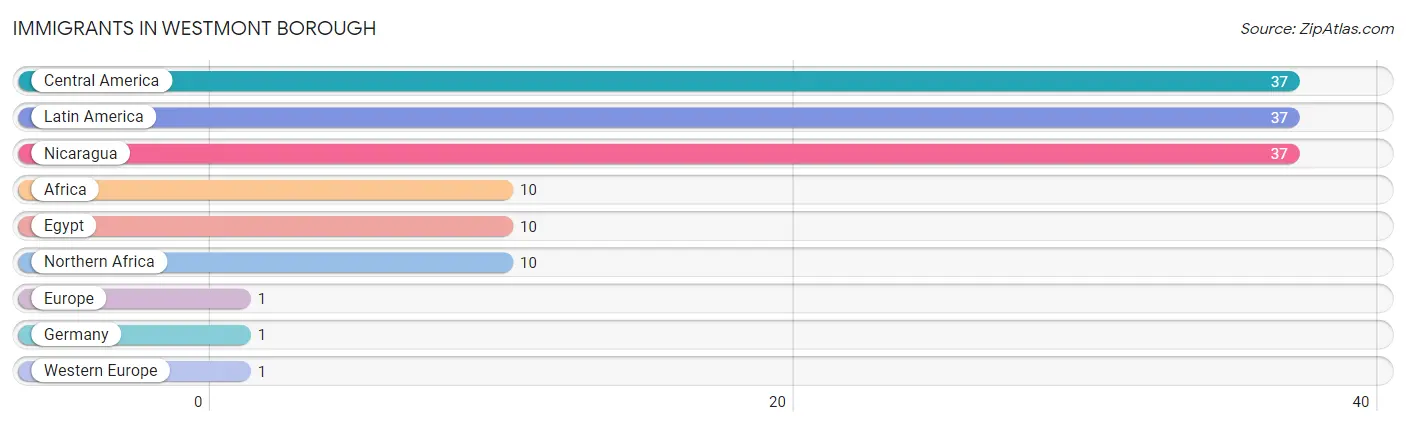
Immigrants in Westmont borough
The most numerous immigrant groups reported in Westmont borough came from Central America (37 | 0.7%), Latin America (37 | 0.7%), Nicaragua (37 | 0.7%), Africa (10 | 0.2%), and Egypt (10 | 0.2%), together accounting for 2.7% of all Westmont borough residents.
| Immigration Origin | # Population | % Population |
| Africa | 10 | 0.2% |
| Central America | 37 | 0.7% |
| Egypt | 10 | 0.2% |
| Europe | 1 | 0.0% |
| Germany | 1 | 0.0% |
| Latin America | 37 | 0.7% |
| Nicaragua | 37 | 0.7% |
| Northern Africa | 10 | 0.2% |
| Western Europe | 1 | 0.0% | View All 9 Rows |
Sex and Age in Westmont borough
Sex and Age in Westmont borough
The most populous age groups in Westmont borough are 10 to 14 Years (272 | 11.4%) for men and 45 to 49 Years (290 | 11.2%) for women.
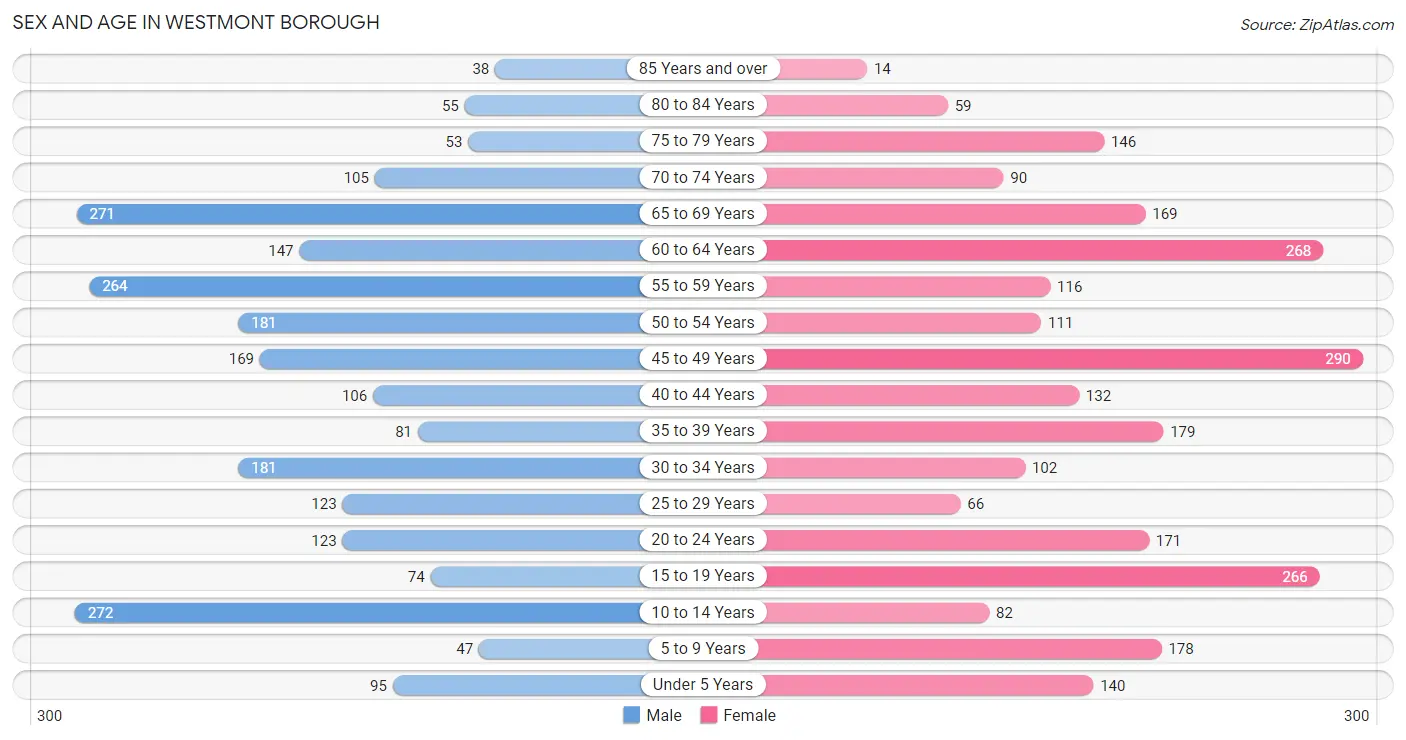
| Age Bracket | Male | Female |
| Under 5 Years | 95 (4.0%) | 140 (5.4%) |
| 5 to 9 Years | 47 (2.0%) | 178 (6.9%) |
| 10 to 14 Years | 272 (11.4%) | 82 (3.2%) |
| 15 to 19 Years | 74 (3.1%) | 266 (10.3%) |
| 20 to 24 Years | 123 (5.2%) | 171 (6.6%) |
| 25 to 29 Years | 123 (5.2%) | 66 (2.6%) |
| 30 to 34 Years | 181 (7.6%) | 102 (4.0%) |
| 35 to 39 Years | 81 (3.4%) | 179 (6.9%) |
| 40 to 44 Years | 106 (4.4%) | 132 (5.1%) |
| 45 to 49 Years | 169 (7.1%) | 290 (11.2%) |
| 50 to 54 Years | 181 (7.6%) | 111 (4.3%) |
| 55 to 59 Years | 264 (11.1%) | 116 (4.5%) |
| 60 to 64 Years | 147 (6.2%) | 268 (10.4%) |
| 65 to 69 Years | 271 (11.4%) | 169 (6.6%) |
| 70 to 74 Years | 105 (4.4%) | 90 (3.5%) |
| 75 to 79 Years | 53 (2.2%) | 146 (5.7%) |
| 80 to 84 Years | 55 (2.3%) | 59 (2.3%) |
| 85 Years and over | 38 (1.6%) | 14 (0.5%) |
| Total | 2,385 (100.0%) | 2,579 (100.0%) |
Families and Households in Westmont borough
Median Family Size in Westmont borough
The median family size in Westmont borough is 2.80 persons per family, with single female/mother families (167 | 11.3%) accounting for the largest median family size of 3.28 persons per family. On the other hand, single male/father families (145 | 9.8%) represent the smallest median family size with 2.21 persons per family.
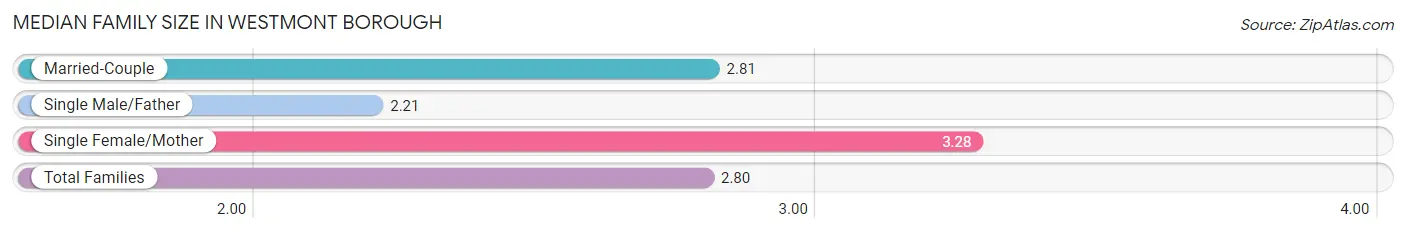
| Family Type | # Families | Family Size |
| Married-Couple | 1,165 (78.9%) | 2.81 |
| Single Male/Father | 145 (9.8%) | 2.21 |
| Single Female/Mother | 167 (11.3%) | 3.28 |
| Total Families | 1,477 (100.0%) | 2.80 |
Median Household Size in Westmont borough
The median household size in Westmont borough is 2.45 persons per household, with single male/father households (145 | 7.2%) accounting for the largest median household size of 3.73 persons per household. non-family households (543 | 26.9%) represent the smallest median household size with 1.10 persons per household.
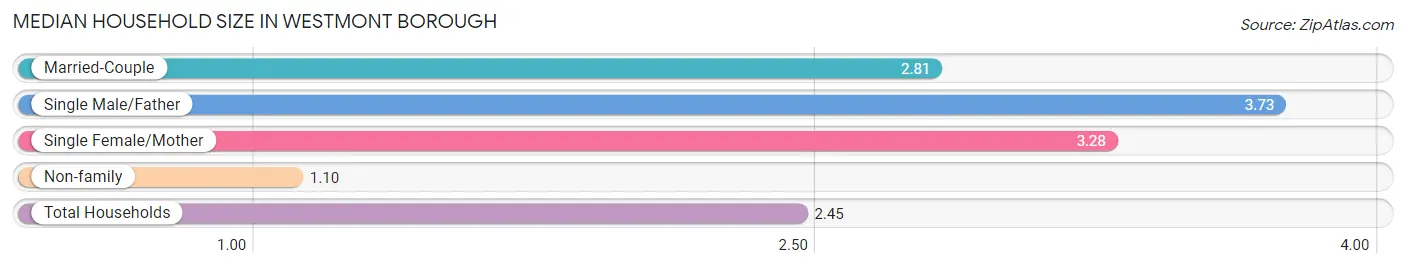
| Household Type | # Households | Household Size |
| Married-Couple | 1,165 (57.7%) | 2.81 |
| Single Male/Father | 145 (7.2%) | 3.73 |
| Single Female/Mother | 167 (8.3%) | 3.28 |
| Non-family | 543 (26.9%) | 1.10 |
| Total Households | 2,020 (100.0%) | 2.45 |
Household Size by Marriage Status in Westmont borough
Out of a total of 2,020 households in Westmont borough, 1,477 (73.1%) are family households, while 543 (26.9%) are nonfamily households. The most numerous type of family households are 2-person households, comprising 831, and the most common type of nonfamily households are 1-person households, comprising 482.
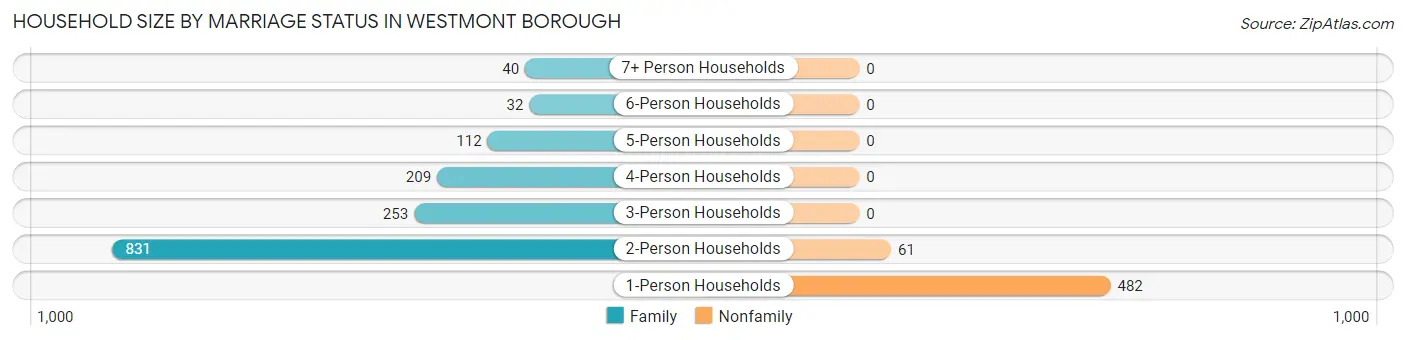
| Household Size | Family Households | Nonfamily Households |
| 1-Person Households | - | 482 (23.9%) |
| 2-Person Households | 831 (41.1%) | 61 (3.0%) |
| 3-Person Households | 253 (12.5%) | 0 (0.0%) |
| 4-Person Households | 209 (10.3%) | 0 (0.0%) |
| 5-Person Households | 112 (5.5%) | 0 (0.0%) |
| 6-Person Households | 32 (1.6%) | 0 (0.0%) |
| 7+ Person Households | 40 (2.0%) | 0 (0.0%) |
| Total | 1,477 (73.1%) | 543 (26.9%) |
Female Fertility in Westmont borough
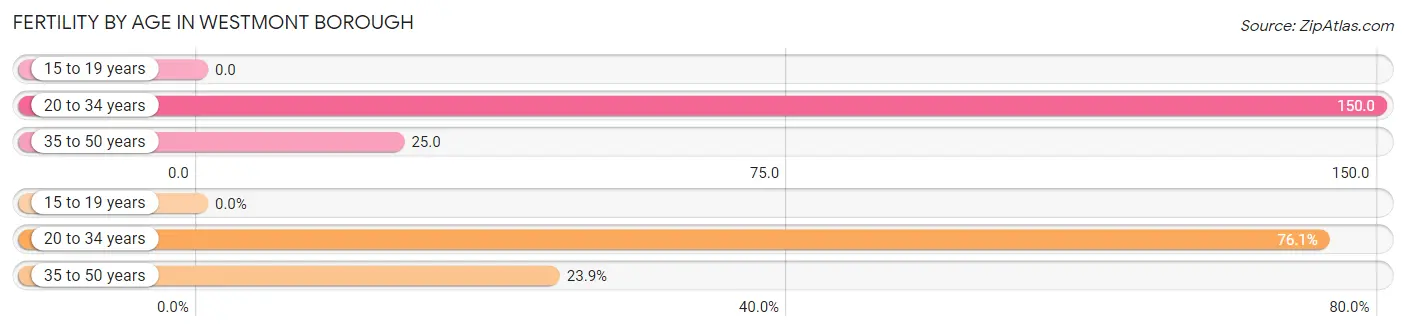
Fertility by Age in Westmont borough
Average fertility rate in Westmont borough is 54.0 births per 1,000 women. Women in the age bracket of 20 to 34 years have the highest fertility rate with 150.0 births per 1,000 women. Women in the age bracket of 20 to 34 years acount for 76.1% of all women with births.
| Age Bracket | Women with Births | Births / 1,000 Women |
| 15 to 19 years | 0 (0.0%) | 0.0 |
| 20 to 34 years | 51 (76.1%) | 150.0 |
| 35 to 50 years | 16 (23.9%) | 25.0 |
| Total | 67 (100.0%) | 54.0 |
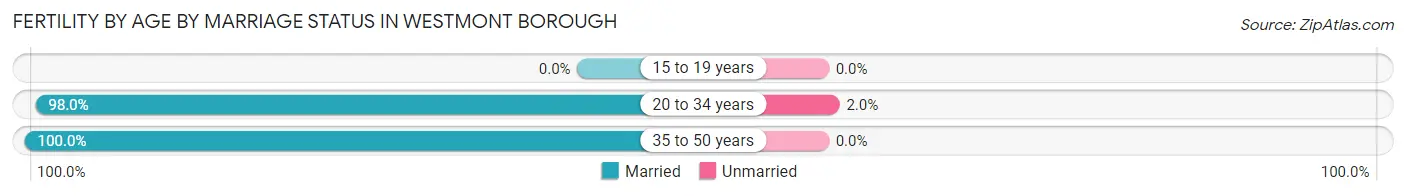
Fertility by Age by Marriage Status in Westmont borough
98.5% of women with births (67) in Westmont borough are married. The highest percentage of unmarried women with births falls into 20 to 34 years age bracket with 2.0% of them unmarried at the time of birth, while the lowest percentage of unmarried women with births belong to 35 to 50 years age bracket with 0.0% of them unmarried.
| Age Bracket | Married | Unmarried |
| 15 to 19 years | 0 (0.0%) | 0 (0.0%) |
| 20 to 34 years | 50 (98.0%) | 1 (2.0%) |
| 35 to 50 years | 16 (100.0%) | 0 (0.0%) |
| Total | 66 (98.5%) | 1 (1.5%) |
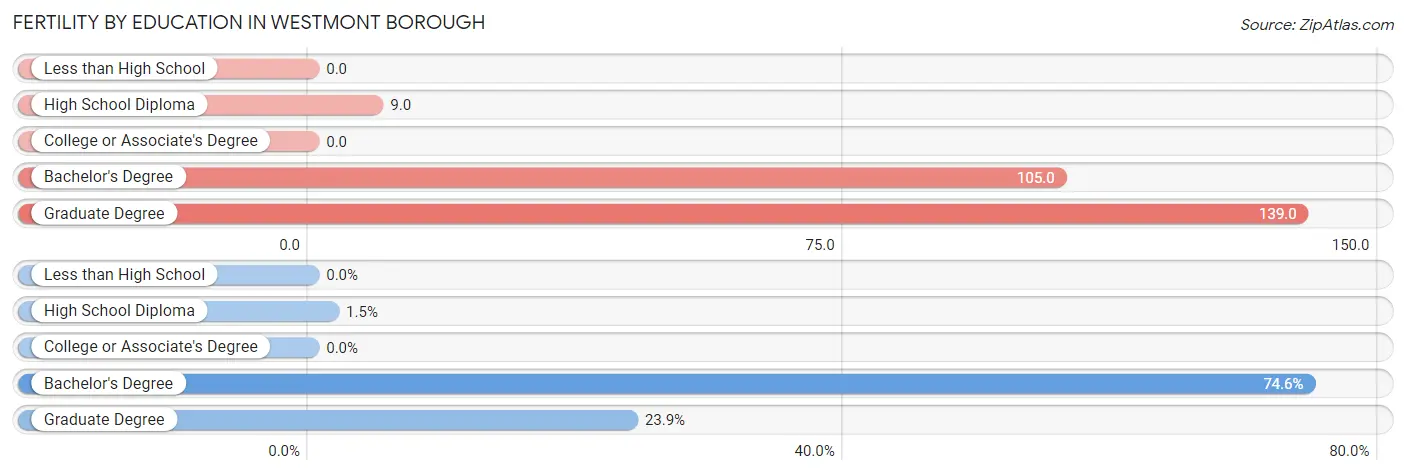
Fertility by Education in Westmont borough
| Educational Attainment | Women with Births | Births / 1,000 Women |
| Less than High School | 0 (0.0%) | 0.0 |
| High School Diploma | 1 (1.5%) | 9.0 |
| College or Associate's Degree | 0 (0.0%) | 0.0 |
| Bachelor's Degree | 50 (74.6%) | 105.0 |
| Graduate Degree | 16 (23.9%) | 139.0 |
| Total | 67 (100.0%) | 54.0 |
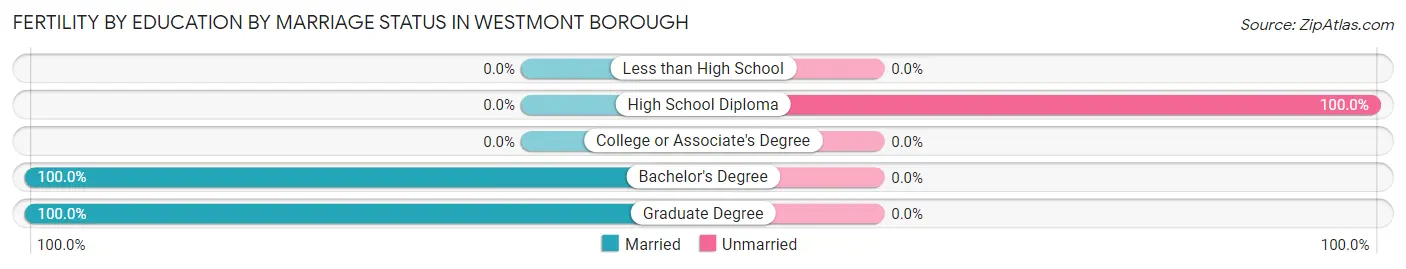
Fertility by Education by Marriage Status in Westmont borough
1.5% of women with births in Westmont borough are unmarried. Women with the educational attainment of bachelor's degree are most likely to be married with 100.0% of them married at childbirth, while women with the educational attainment of high school diploma are least likely to be married with 100.0% of them unmarried at childbirth.
| Educational Attainment | Married | Unmarried |
| Less than High School | 0 (0.0%) | 0 (0.0%) |
| High School Diploma | 0 (0.0%) | 1 (100.0%) |
| College or Associate's Degree | 0 (0.0%) | 0 (0.0%) |
| Bachelor's Degree | 50 (100.0%) | 0 (0.0%) |
| Graduate Degree | 16 (100.0%) | 0 (0.0%) |
| Total | 66 (98.5%) | 1 (1.5%) |
Employment Characteristics in Westmont borough
Employment by Class of Employer in Westmont borough
Among the 2,148 employed individuals in Westmont borough, private company employees (1,157 | 53.9%), not-for-profit organizations (395 | 18.4%), and self-employed (incorporated) (188 | 8.7%) make up the most common classes of employment.
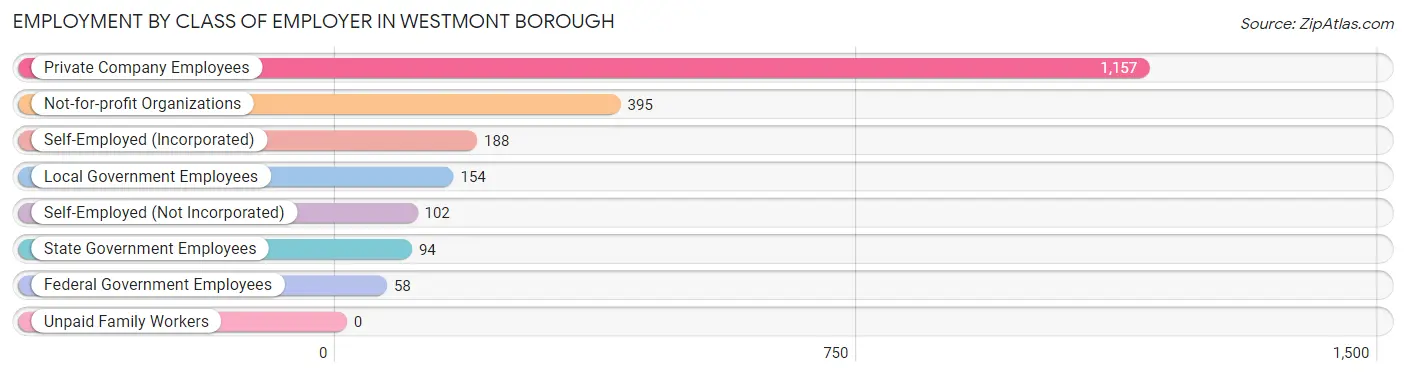
| Employer Class | # Employees | % Employees |
| Private Company Employees | 1,157 | 53.9% |
| Self-Employed (Incorporated) | 188 | 8.7% |
| Self-Employed (Not Incorporated) | 102 | 4.8% |
| Not-for-profit Organizations | 395 | 18.4% |
| Local Government Employees | 154 | 7.2% |
| State Government Employees | 94 | 4.4% |
| Federal Government Employees | 58 | 2.7% |
| Unpaid Family Workers | 0 | 0.0% |
| Total | 2,148 | 100.0% |
Employment Status by Age in Westmont borough
According to the labor force statistics for Westmont borough, out of the total population over 16 years of age (4,039), 59.8% or 2,415 individuals are in the labor force, with 9.9% or 239 of them unemployed. The age group with the highest labor force participation rate is 30 to 34 years, with 94.7% or 268 individuals in the labor force. Within the labor force, the 60 to 64 years age range has the highest percentage of unemployed individuals, with 39.1% or 99 of them being unemployed.
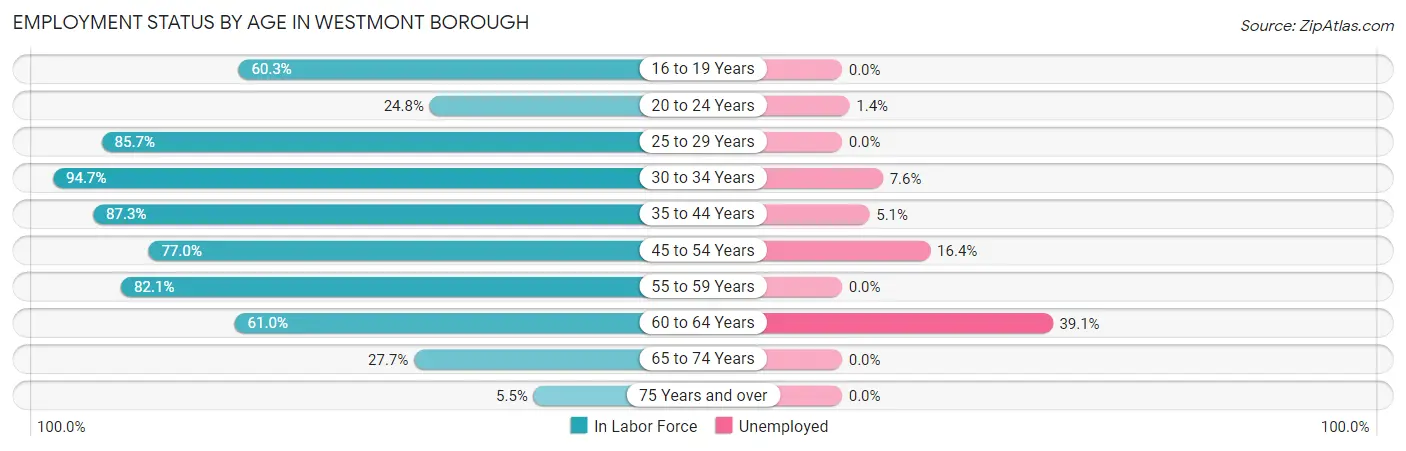
| Age Bracket | In Labor Force | Unemployed |
| 16 to 19 Years | 138 (60.3%) | 0 (0.0%) |
| 20 to 24 Years | 73 (24.8%) | 1 (1.4%) |
| 25 to 29 Years | 162 (85.7%) | 0 (0.0%) |
| 30 to 34 Years | 268 (94.7%) | 20 (7.6%) |
| 35 to 44 Years | 435 (87.3%) | 22 (5.1%) |
| 45 to 54 Years | 578 (77.0%) | 95 (16.4%) |
| 55 to 59 Years | 312 (82.1%) | 0 (0.0%) |
| 60 to 64 Years | 253 (61.0%) | 99 (39.1%) |
| 65 to 74 Years | 176 (27.7%) | 0 (0.0%) |
| 75 Years and over | 20 (5.5%) | 0 (0.0%) |
| Total | 2,415 (59.8%) | 239 (9.9%) |
Employment Status by Educational Attainment in Westmont borough
According to labor force statistics for Westmont borough, 79.8% of individuals (2,008) out of the total population between 25 and 64 years of age (2,516) are in the labor force, with 11.9% or 239 of them being unemployed. The group with the highest labor force participation rate are those with the educational attainment of less than high school, with 100.0% or 16 individuals in the labor force. Within the labor force, individuals with high school diploma education have the highest percentage of unemployment, with 20.0% or 47 of them being unemployed.
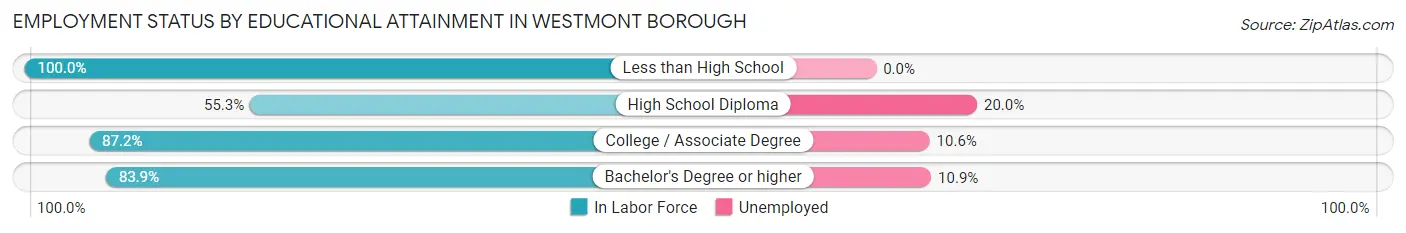
| Educational Attainment | In Labor Force | Unemployed |
| Less than High School | 16 (100.0%) | 0 (0.0%) |
| High School Diploma | 235 (55.3%) | 85 (20.0%) |
| College / Associate Degree | 422 (87.2%) | 51 (10.6%) |
| Bachelor's Degree or higher | 1,335 (83.9%) | 173 (10.9%) |
| Total | 2,008 (79.8%) | 299 (11.9%) |
Employment Occupations by Sex in Westmont borough
Management, Business, Science and Arts Occupations
The most common Management, Business, Science and Arts occupations in Westmont borough are Community & Social Service (547 | 25.6%), Education Instruction & Library (515 | 24.1%), Management (289 | 13.5%), Health Diagnosing & Treating (198 | 9.3%), and Health Technologists (169 | 7.9%).
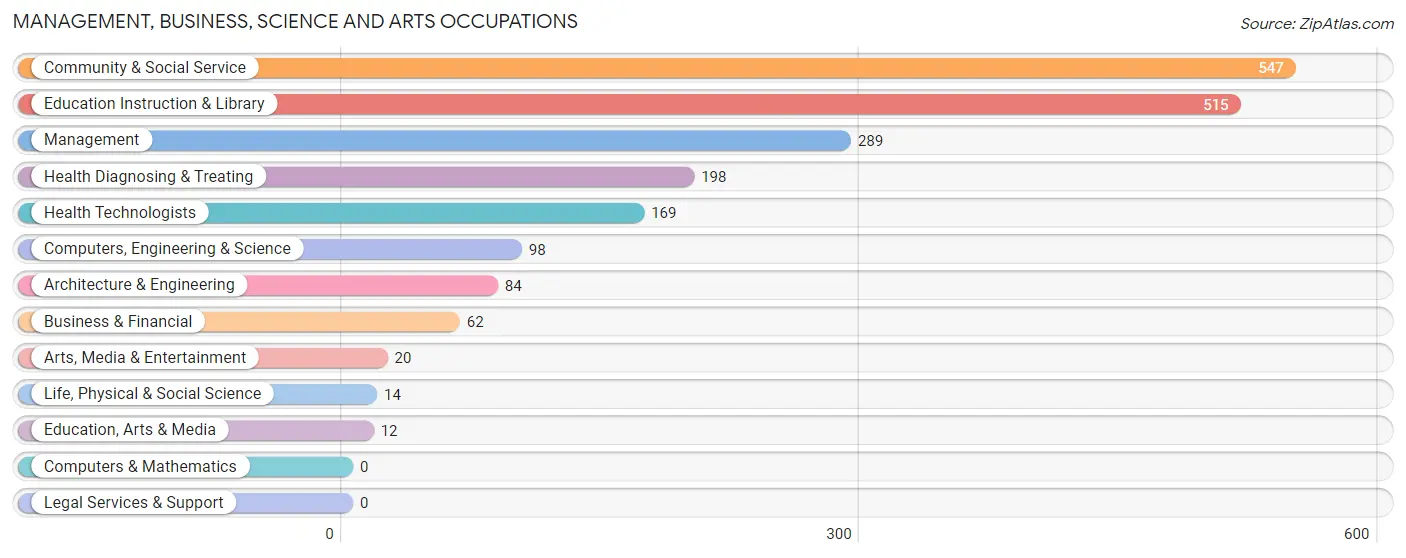
Management, Business, Science and Arts Occupations by Sex
Within the Management, Business, Science and Arts occupations in Westmont borough, the most male-oriented occupations are Architecture & Engineering (100.0%), Education, Arts & Media (100.0%), and Computers, Engineering & Science (85.7%), while the most female-oriented occupations are Life, Physical & Social Science (100.0%), Arts, Media & Entertainment (100.0%), and Health Technologists (89.9%).
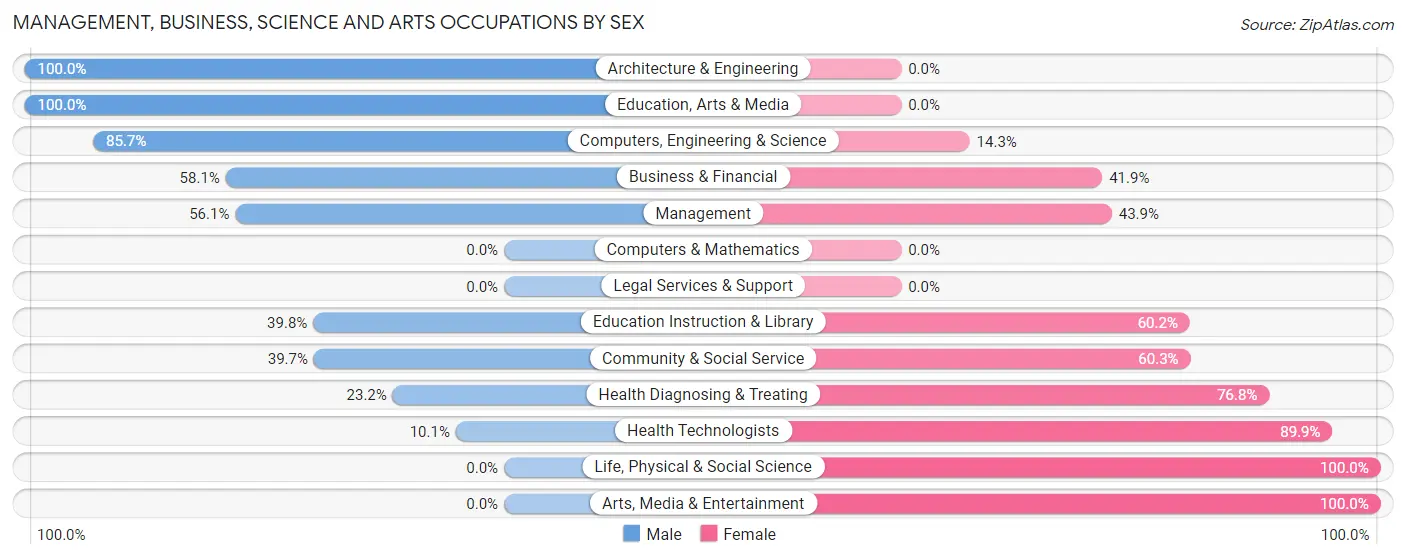
| Occupation | Male | Female |
| Management | 162 (56.1%) | 127 (43.9%) |
| Business & Financial | 36 (58.1%) | 26 (41.9%) |
| Computers, Engineering & Science | 84 (85.7%) | 14 (14.3%) |
| Computers & Mathematics | 0 (0.0%) | 0 (0.0%) |
| Architecture & Engineering | 84 (100.0%) | 0 (0.0%) |
| Life, Physical & Social Science | 0 (0.0%) | 14 (100.0%) |
| Community & Social Service | 217 (39.7%) | 330 (60.3%) |
| Education, Arts & Media | 12 (100.0%) | 0 (0.0%) |
| Legal Services & Support | 0 (0.0%) | 0 (0.0%) |
| Education Instruction & Library | 205 (39.8%) | 310 (60.2%) |
| Arts, Media & Entertainment | 0 (0.0%) | 20 (100.0%) |
| Health Diagnosing & Treating | 46 (23.2%) | 152 (76.8%) |
| Health Technologists | 17 (10.1%) | 152 (89.9%) |
| Total (Category) | 545 (45.6%) | 649 (54.4%) |
| Total (Overall) | 1,095 (51.2%) | 1,042 (48.8%) |
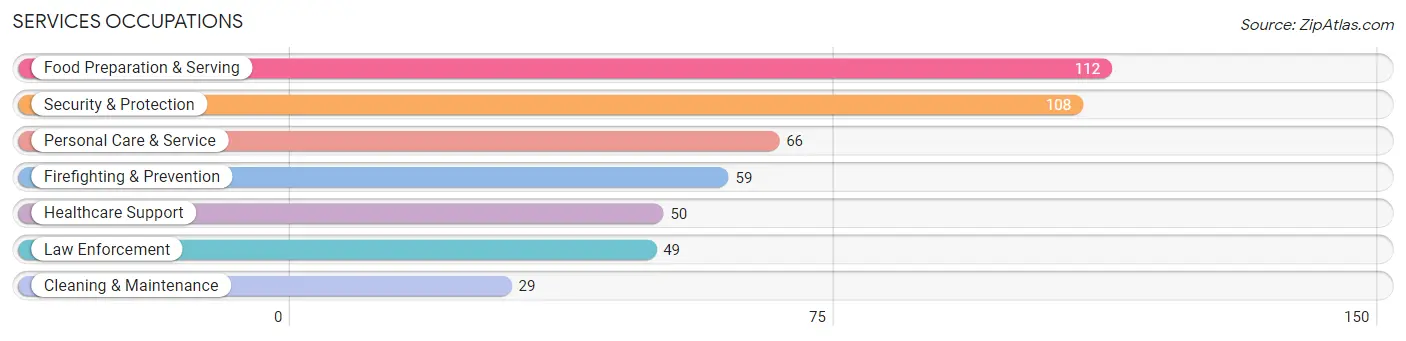
Services Occupations
The most common Services occupations in Westmont borough are Food Preparation & Serving (112 | 5.2%), Security & Protection (108 | 5.1%), Personal Care & Service (66 | 3.1%), Firefighting & Prevention (59 | 2.8%), and Healthcare Support (50 | 2.3%).
Services Occupations by Sex
Within the Services occupations in Westmont borough, the most male-oriented occupations are Law Enforcement (100.0%), Security & Protection (60.2%), and Cleaning & Maintenance (48.3%), while the most female-oriented occupations are Personal Care & Service (100.0%), Food Preparation & Serving (93.8%), and Healthcare Support (78.0%).
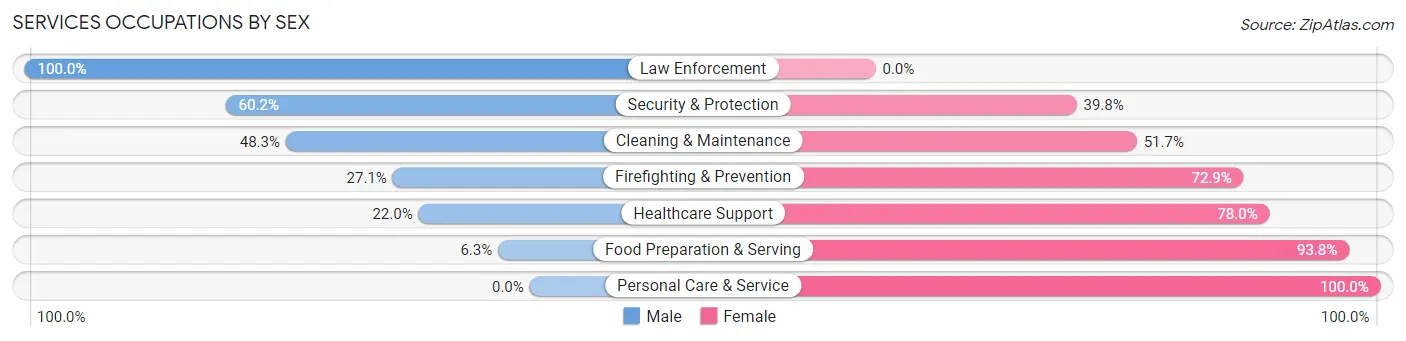
| Occupation | Male | Female |
| Healthcare Support | 11 (22.0%) | 39 (78.0%) |
| Security & Protection | 65 (60.2%) | 43 (39.8%) |
| Firefighting & Prevention | 16 (27.1%) | 43 (72.9%) |
| Law Enforcement | 49 (100.0%) | 0 (0.0%) |
| Food Preparation & Serving | 7 (6.2%) | 105 (93.8%) |
| Cleaning & Maintenance | 14 (48.3%) | 15 (51.7%) |
| Personal Care & Service | 0 (0.0%) | 66 (100.0%) |
| Total (Category) | 97 (26.6%) | 268 (73.4%) |
| Total (Overall) | 1,095 (51.2%) | 1,042 (48.8%) |
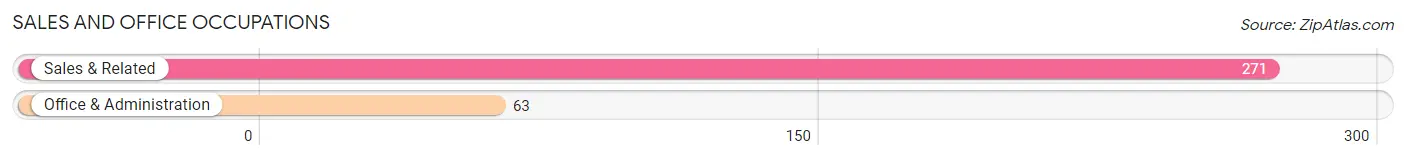
Sales and Office Occupations
The most common Sales and Office occupations in Westmont borough are Sales & Related (271 | 12.7%), and Office & Administration (63 | 2.9%).
Sales and Office Occupations by Sex
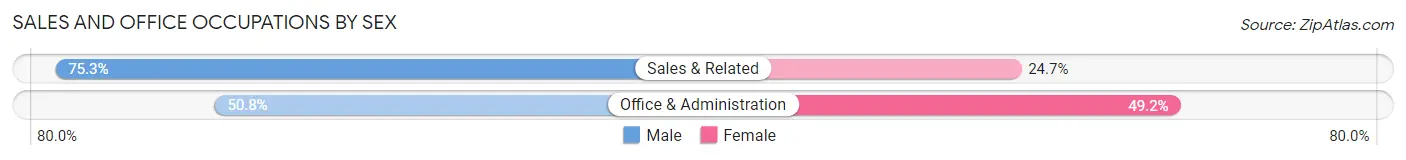
| Occupation | Male | Female |
| Sales & Related | 204 (75.3%) | 67 (24.7%) |
| Office & Administration | 32 (50.8%) | 31 (49.2%) |
| Total (Category) | 236 (70.7%) | 98 (29.3%) |
| Total (Overall) | 1,095 (51.2%) | 1,042 (48.8%) |
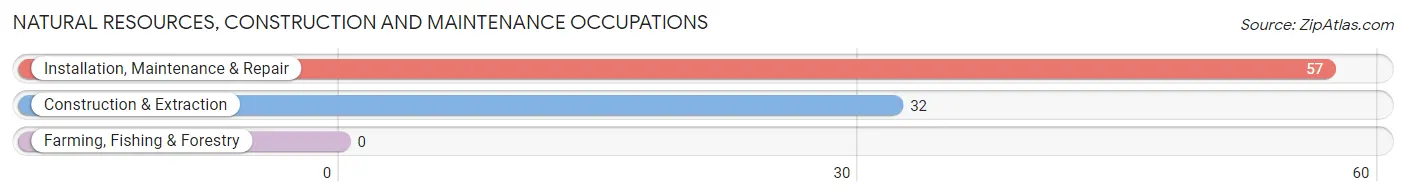
Natural Resources, Construction and Maintenance Occupations
The most common Natural Resources, Construction and Maintenance occupations in Westmont borough are Installation, Maintenance & Repair (57 | 2.7%), and Construction & Extraction (32 | 1.5%).
Natural Resources, Construction and Maintenance Occupations by Sex
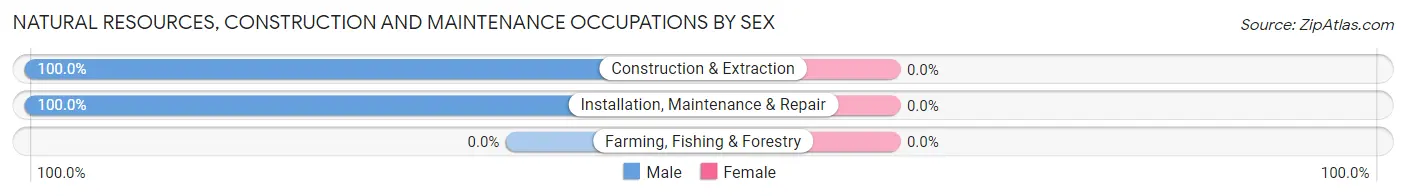
| Occupation | Male | Female |
| Farming, Fishing & Forestry | 0 (0.0%) | 0 (0.0%) |
| Construction & Extraction | 32 (100.0%) | 0 (0.0%) |
| Installation, Maintenance & Repair | 57 (100.0%) | 0 (0.0%) |
| Total (Category) | 89 (100.0%) | 0 (0.0%) |
| Total (Overall) | 1,095 (51.2%) | 1,042 (48.8%) |
Production, Transportation and Moving Occupations
The most common Production, Transportation and Moving occupations in Westmont borough are Production (71 | 3.3%), Transportation (70 | 3.3%), and Material Moving (14 | 0.7%).
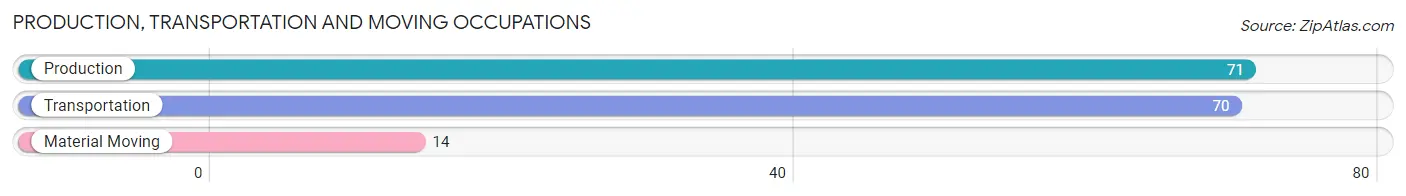
Production, Transportation and Moving Occupations by Sex
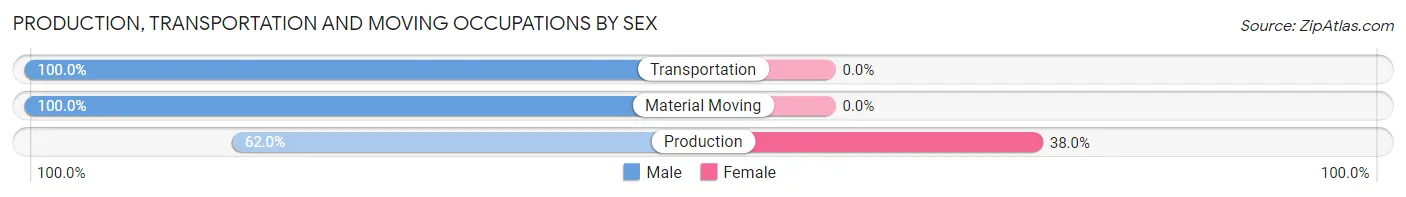
| Occupation | Male | Female |
| Production | 44 (62.0%) | 27 (38.0%) |
| Transportation | 70 (100.0%) | 0 (0.0%) |
| Material Moving | 14 (100.0%) | 0 (0.0%) |
| Total (Category) | 128 (82.6%) | 27 (17.4%) |
| Total (Overall) | 1,095 (51.2%) | 1,042 (48.8%) |
Employment Industries by Sex in Westmont borough
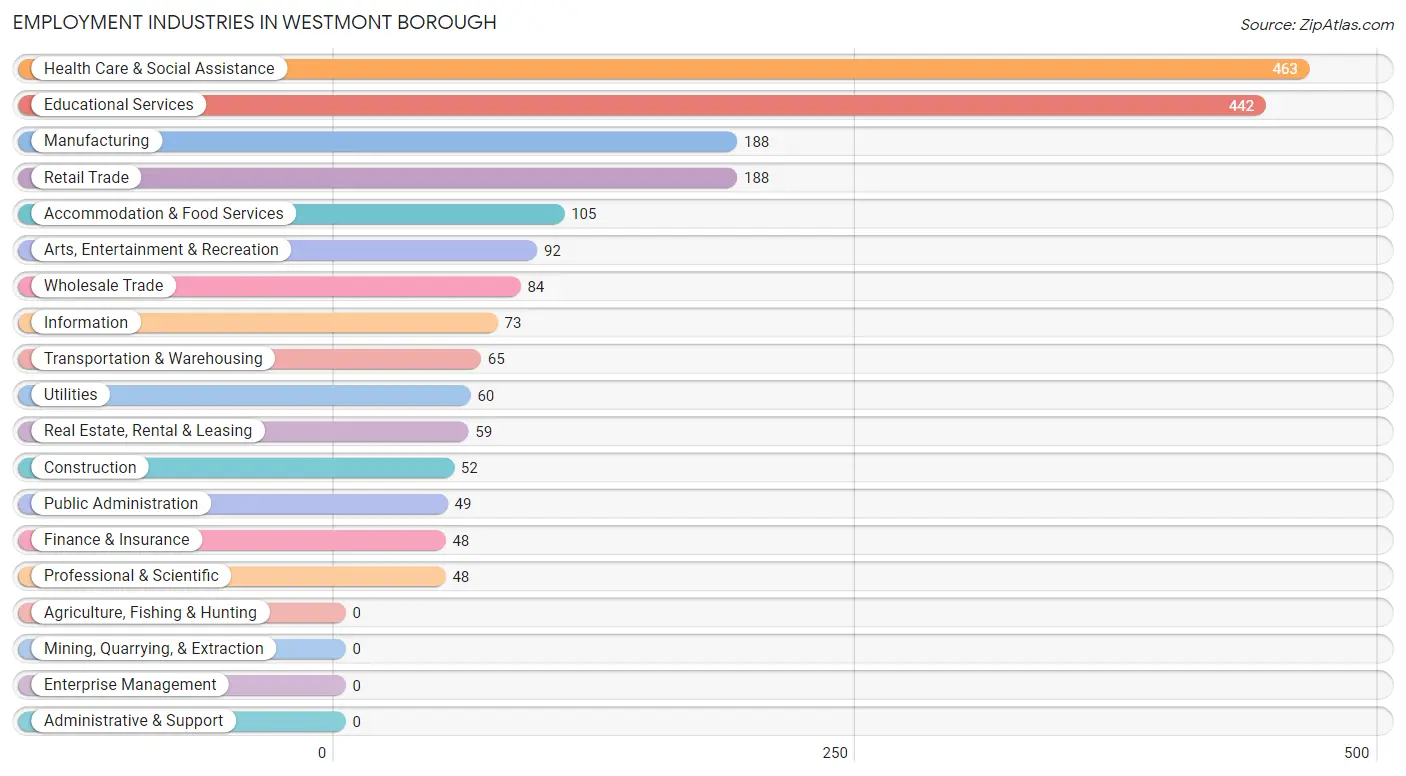
Employment Industries in Westmont borough
The major employment industries in Westmont borough include Health Care & Social Assistance (463 | 21.7%), Educational Services (442 | 20.7%), Manufacturing (188 | 8.8%), Retail Trade (188 | 8.8%), and Accommodation & Food Services (105 | 4.9%).
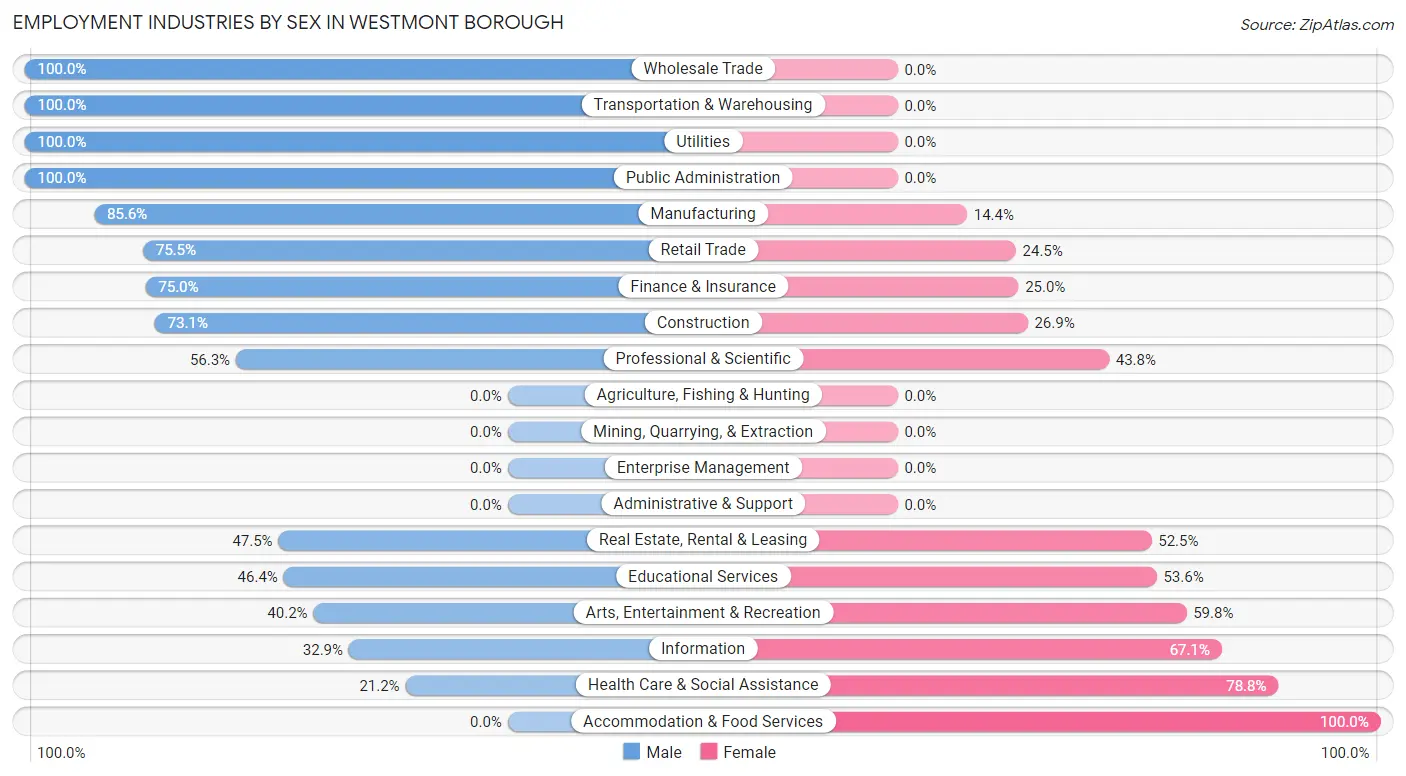
Employment Industries by Sex in Westmont borough
The Westmont borough industries that see more men than women are Wholesale Trade (100.0%), Transportation & Warehousing (100.0%), and Utilities (100.0%), whereas the industries that tend to have a higher number of women are Accommodation & Food Services (100.0%), Health Care & Social Assistance (78.8%), and Information (67.1%).
| Industry | Male | Female |
| Agriculture, Fishing & Hunting | 0 (0.0%) | 0 (0.0%) |
| Mining, Quarrying, & Extraction | 0 (0.0%) | 0 (0.0%) |
| Construction | 38 (73.1%) | 14 (26.9%) |
| Manufacturing | 161 (85.6%) | 27 (14.4%) |
| Wholesale Trade | 84 (100.0%) | 0 (0.0%) |
| Retail Trade | 142 (75.5%) | 46 (24.5%) |
| Transportation & Warehousing | 65 (100.0%) | 0 (0.0%) |
| Utilities | 60 (100.0%) | 0 (0.0%) |
| Information | 24 (32.9%) | 49 (67.1%) |
| Finance & Insurance | 36 (75.0%) | 12 (25.0%) |
| Real Estate, Rental & Leasing | 28 (47.5%) | 31 (52.5%) |
| Professional & Scientific | 27 (56.2%) | 21 (43.8%) |
| Enterprise Management | 0 (0.0%) | 0 (0.0%) |
| Administrative & Support | 0 (0.0%) | 0 (0.0%) |
| Educational Services | 205 (46.4%) | 237 (53.6%) |
| Health Care & Social Assistance | 98 (21.2%) | 365 (78.8%) |
| Arts, Entertainment & Recreation | 37 (40.2%) | 55 (59.8%) |
| Accommodation & Food Services | 0 (0.0%) | 105 (100.0%) |
| Public Administration | 49 (100.0%) | 0 (0.0%) |
| Total | 1,095 (51.2%) | 1,042 (48.8%) |
Education in Westmont borough
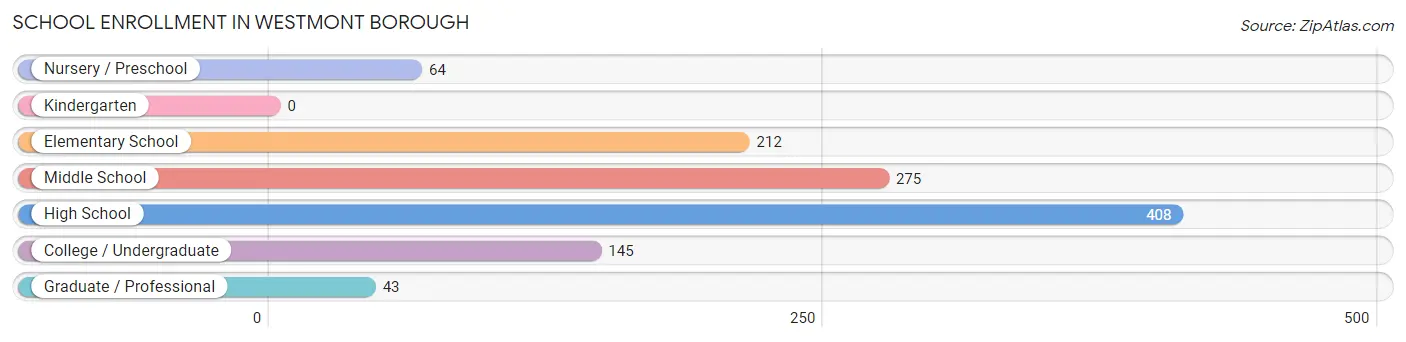
School Enrollment in Westmont borough
The most common levels of schooling among the 1,147 students in Westmont borough are high school (408 | 35.6%), middle school (275 | 24.0%), and elementary school (212 | 18.5%).
| School Level | # Students | % Students |
| Nursery / Preschool | 64 | 5.6% |
| Kindergarten | 0 | 0.0% |
| Elementary School | 212 | 18.5% |
| Middle School | 275 | 24.0% |
| High School | 408 | 35.6% |
| College / Undergraduate | 145 | 12.6% |
| Graduate / Professional | 43 | 3.7% |
| Total | 1,147 | 100.0% |
School Enrollment by Age by Funding Source in Westmont borough
Out of a total of 1,147 students who are enrolled in schools in Westmont borough, 188 (16.4%) attend a private institution, while the remaining 959 (83.6%) are enrolled in public schools. The age group of 25 to 34 year olds has the highest likelihood of being enrolled in private schools, with 12 (100.0% in the age bracket) enrolled. Conversely, the age group of 15 to 17 year olds has the lowest likelihood of being enrolled in a private school, with 324 (100.0% in the age bracket) attending a public institution.
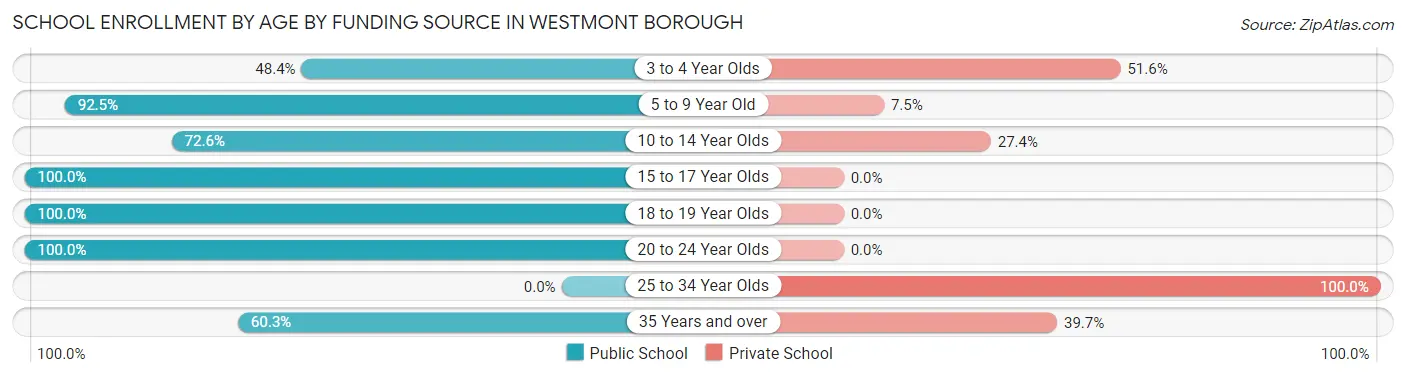
| Age Bracket | Public School | Private School |
| 3 to 4 Year Olds | 31 (48.4%) | 33 (51.6%) |
| 5 to 9 Year Old | 185 (92.5%) | 15 (7.5%) |
| 10 to 14 Year Olds | 257 (72.6%) | 97 (27.4%) |
| 15 to 17 Year Olds | 324 (100.0%) | 0 (0.0%) |
| 18 to 19 Year Olds | 16 (100.0%) | 0 (0.0%) |
| 20 to 24 Year Olds | 99 (100.0%) | 0 (0.0%) |
| 25 to 34 Year Olds | 0 (0.0%) | 12 (100.0%) |
| 35 Years and over | 47 (60.3%) | 31 (39.7%) |
| Total | 959 (83.6%) | 188 (16.4%) |
Educational Attainment by Field of Study in Westmont borough
Business (485 | 20.8%), science & technology (429 | 18.4%), education (369 | 15.8%), social sciences (309 | 13.2%), and arts & humanities (174 | 7.4%) are the most common fields of study among 2,335 individuals in Westmont borough who have obtained a bachelor's degree or higher.
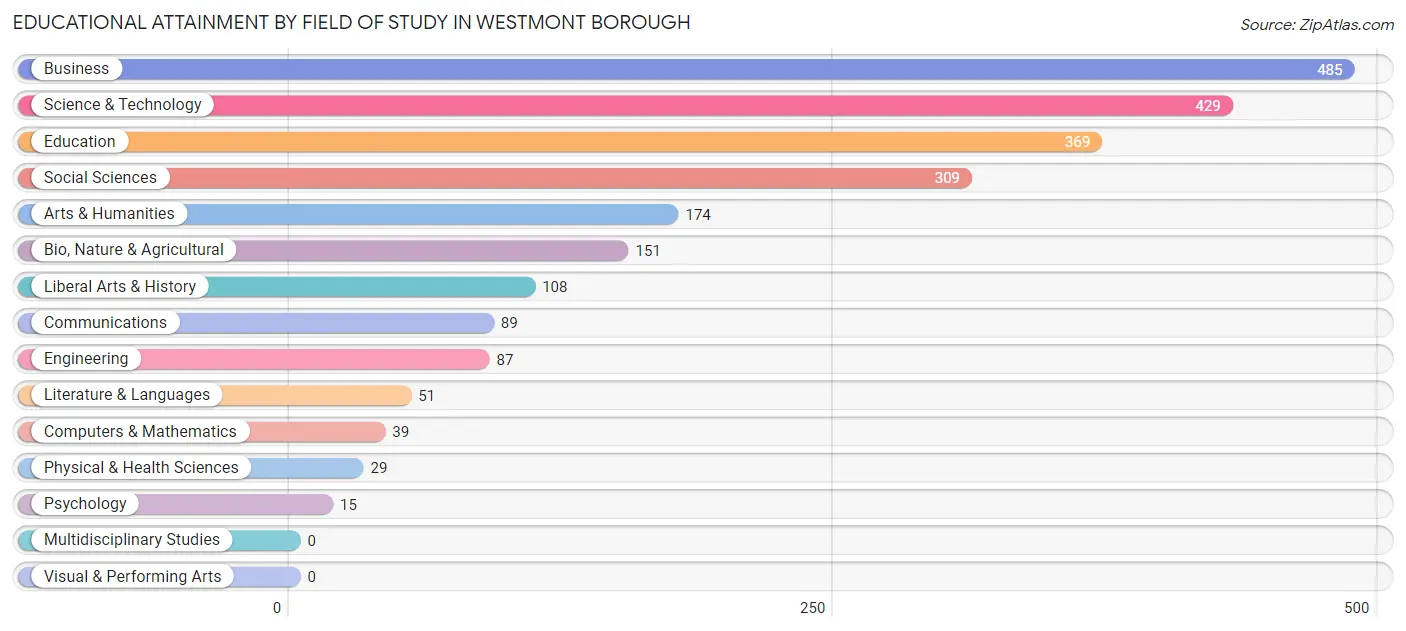
| Field of Study | # Graduates | % Graduates |
| Computers & Mathematics | 39 | 1.7% |
| Bio, Nature & Agricultural | 151 | 6.5% |
| Physical & Health Sciences | 29 | 1.2% |
| Psychology | 15 | 0.6% |
| Social Sciences | 309 | 13.2% |
| Engineering | 87 | 3.7% |
| Multidisciplinary Studies | 0 | 0.0% |
| Science & Technology | 429 | 18.4% |
| Business | 485 | 20.8% |
| Education | 369 | 15.8% |
| Literature & Languages | 51 | 2.2% |
| Liberal Arts & History | 108 | 4.6% |
| Visual & Performing Arts | 0 | 0.0% |
| Communications | 89 | 3.8% |
| Arts & Humanities | 174 | 7.4% |
| Total | 2,335 | 100.0% |
Transportation & Commute in Westmont borough
Vehicle Availability by Sex in Westmont borough
The most prevalent vehicle ownership categories in Westmont borough are males with 2 vehicles (668, accounting for 59.0%) and females with 2 vehicles (526, making up 65.8%).
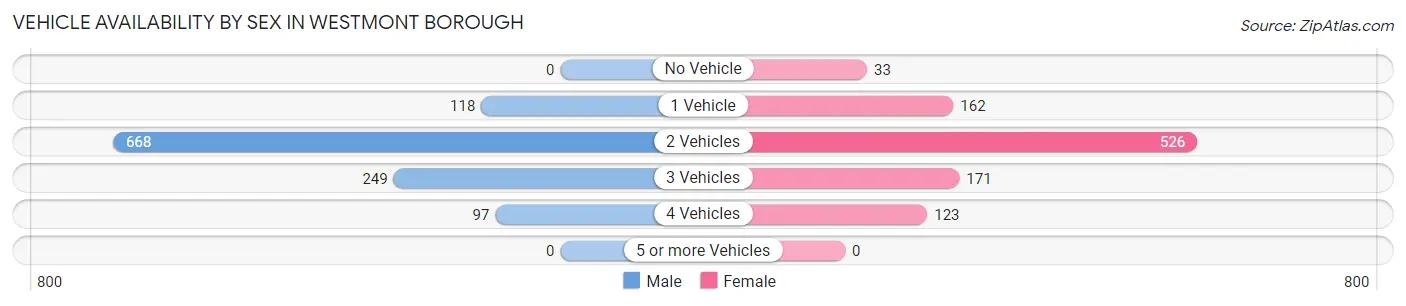
| Vehicles Available | Male | Female |
| No Vehicle | 0 (0.0%) | 33 (3.3%) |
| 1 Vehicle | 118 (10.4%) | 162 (16.0%) |
| 2 Vehicles | 668 (59.0%) | 526 (51.8%) |
| 3 Vehicles | 249 (22.0%) | 171 (16.9%) |
| 4 Vehicles | 97 (8.6%) | 123 (12.1%) |
| 5 or more Vehicles | 0 (0.0%) | 0 (0.0%) |
| Total | 1,132 (100.0%) | 1,015 (100.0%) |
Commute Time in Westmont borough
The most frequently occuring commute durations in Westmont borough are 15 to 19 minutes (410 commuters, 22.6%), 10 to 14 minutes (345 commuters, 19.0%), and 5 to 9 minutes (271 commuters, 14.9%).
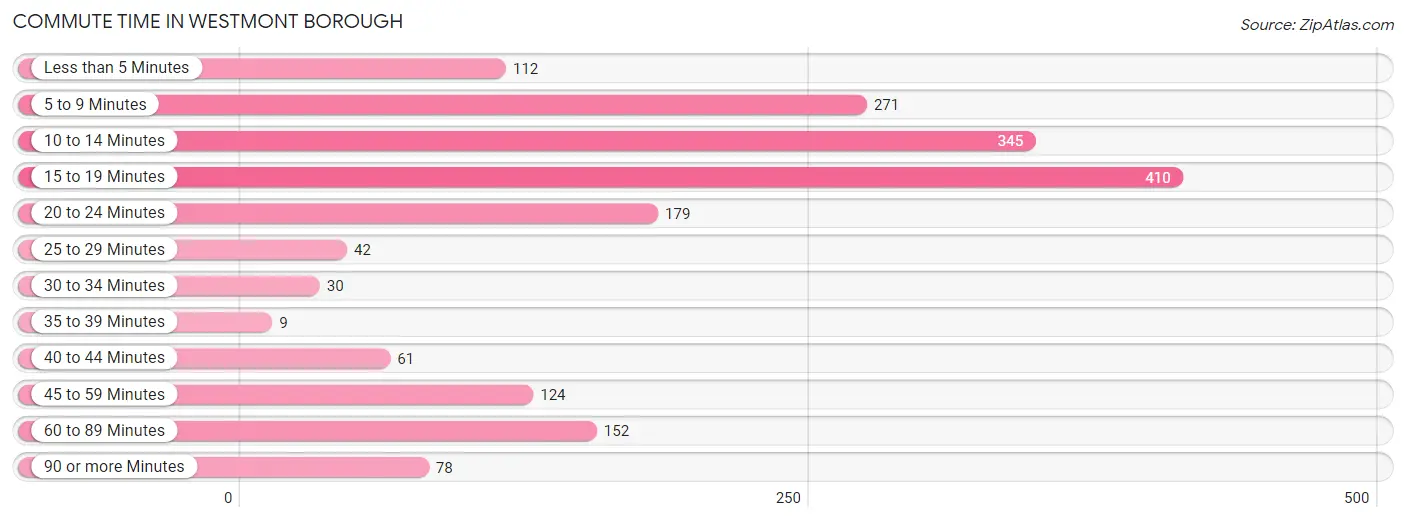
| Commute Time | # Commuters | % Commuters |
| Less than 5 Minutes | 112 | 6.2% |
| 5 to 9 Minutes | 271 | 14.9% |
| 10 to 14 Minutes | 345 | 19.0% |
| 15 to 19 Minutes | 410 | 22.6% |
| 20 to 24 Minutes | 179 | 9.9% |
| 25 to 29 Minutes | 42 | 2.3% |
| 30 to 34 Minutes | 30 | 1.7% |
| 35 to 39 Minutes | 9 | 0.5% |
| 40 to 44 Minutes | 61 | 3.4% |
| 45 to 59 Minutes | 124 | 6.8% |
| 60 to 89 Minutes | 152 | 8.4% |
| 90 or more Minutes | 78 | 4.3% |
Commute Time by Sex in Westmont borough
The most common commute times in Westmont borough are 5 to 9 minutes (180 commuters, 20.2%) for males and 15 to 19 minutes (302 commuters, 32.8%) for females.
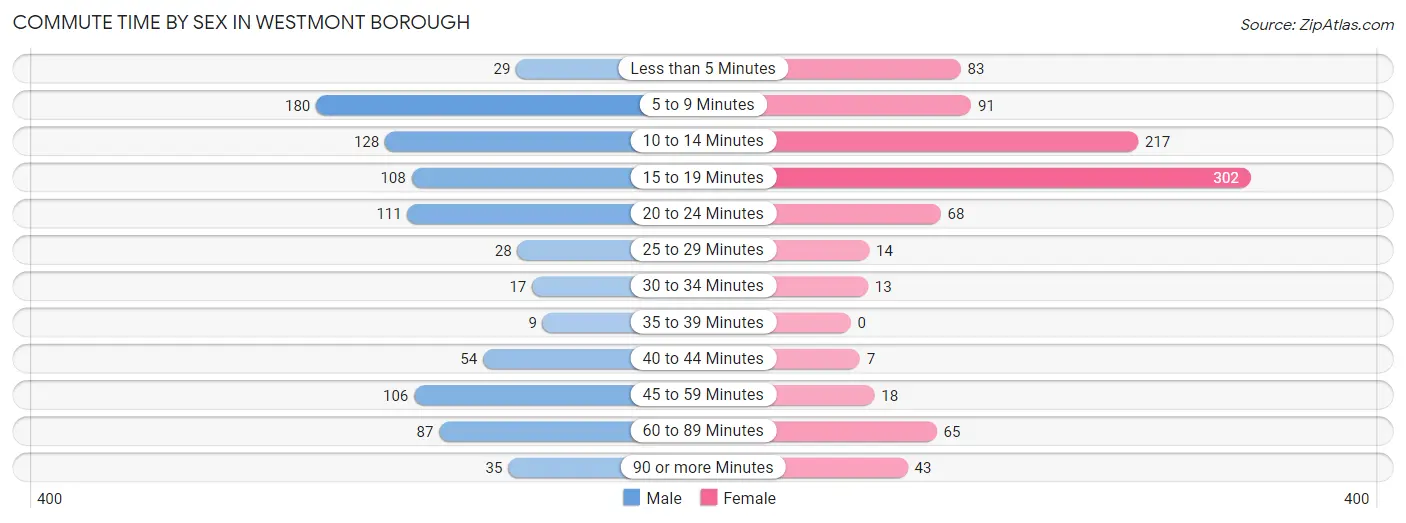
| Commute Time | Male | Female |
| Less than 5 Minutes | 29 (3.3%) | 83 (9.0%) |
| 5 to 9 Minutes | 180 (20.2%) | 91 (9.9%) |
| 10 to 14 Minutes | 128 (14.3%) | 217 (23.6%) |
| 15 to 19 Minutes | 108 (12.1%) | 302 (32.8%) |
| 20 to 24 Minutes | 111 (12.4%) | 68 (7.4%) |
| 25 to 29 Minutes | 28 (3.1%) | 14 (1.5%) |
| 30 to 34 Minutes | 17 (1.9%) | 13 (1.4%) |
| 35 to 39 Minutes | 9 (1.0%) | 0 (0.0%) |
| 40 to 44 Minutes | 54 (6.0%) | 7 (0.8%) |
| 45 to 59 Minutes | 106 (11.9%) | 18 (1.9%) |
| 60 to 89 Minutes | 87 (9.8%) | 65 (7.1%) |
| 90 or more Minutes | 35 (3.9%) | 43 (4.7%) |
Time of Departure to Work by Sex in Westmont borough
The most frequent times of departure to work in Westmont borough are 6:30 AM to 6:59 AM (179, 20.1%) for males and 7:00 AM to 7:29 AM (190, 20.6%) for females.
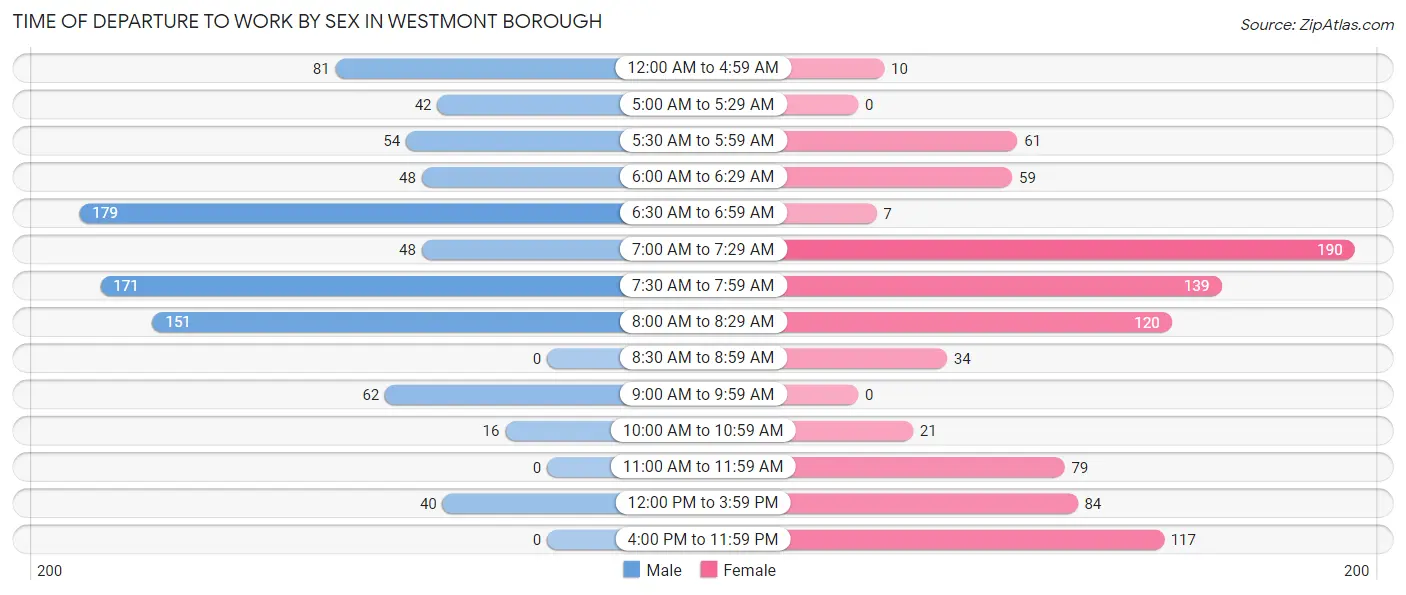
| Time of Departure | Male | Female |
| 12:00 AM to 4:59 AM | 81 (9.1%) | 10 (1.1%) |
| 5:00 AM to 5:29 AM | 42 (4.7%) | 0 (0.0%) |
| 5:30 AM to 5:59 AM | 54 (6.0%) | 61 (6.6%) |
| 6:00 AM to 6:29 AM | 48 (5.4%) | 59 (6.4%) |
| 6:30 AM to 6:59 AM | 179 (20.1%) | 7 (0.8%) |
| 7:00 AM to 7:29 AM | 48 (5.4%) | 190 (20.6%) |
| 7:30 AM to 7:59 AM | 171 (19.2%) | 139 (15.1%) |
| 8:00 AM to 8:29 AM | 151 (16.9%) | 120 (13.0%) |
| 8:30 AM to 8:59 AM | 0 (0.0%) | 34 (3.7%) |
| 9:00 AM to 9:59 AM | 62 (7.0%) | 0 (0.0%) |
| 10:00 AM to 10:59 AM | 16 (1.8%) | 21 (2.3%) |
| 11:00 AM to 11:59 AM | 0 (0.0%) | 79 (8.6%) |
| 12:00 PM to 3:59 PM | 40 (4.5%) | 84 (9.1%) |
| 4:00 PM to 11:59 PM | 0 (0.0%) | 117 (12.7%) |
| Total | 892 (100.0%) | 921 (100.0%) |
Housing Occupancy in Westmont borough
Occupancy by Ownership in Westmont borough
Of the total 2,020 dwellings in Westmont borough, owner-occupied units account for 1,654 (81.9%), while renter-occupied units make up 366 (18.1%).
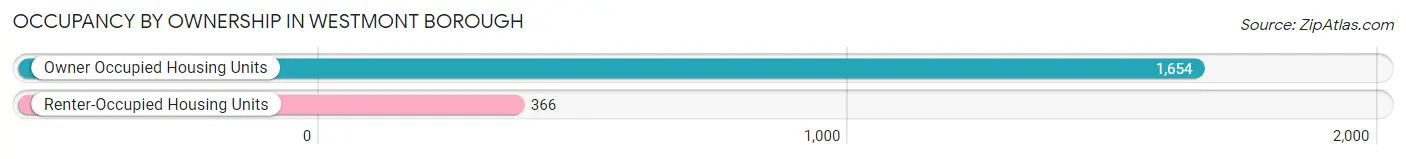
| Occupancy | # Housing Units | % Housing Units |
| Owner Occupied Housing Units | 1,654 | 81.9% |
| Renter-Occupied Housing Units | 366 | 18.1% |
| Total Occupied Housing Units | 2,020 | 100.0% |
Occupancy by Household Size in Westmont borough
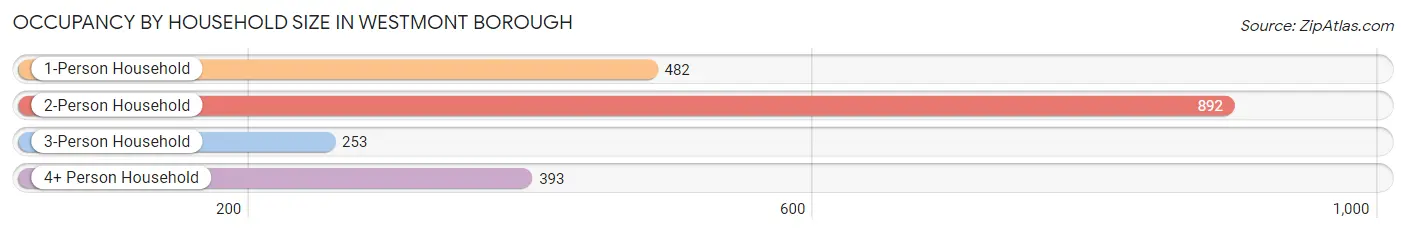
| Household Size | # Housing Units | % Housing Units |
| 1-Person Household | 482 | 23.9% |
| 2-Person Household | 892 | 44.2% |
| 3-Person Household | 253 | 12.5% |
| 4+ Person Household | 393 | 19.5% |
| Total Housing Units | 2,020 | 100.0% |
Occupancy by Ownership by Household Size in Westmont borough
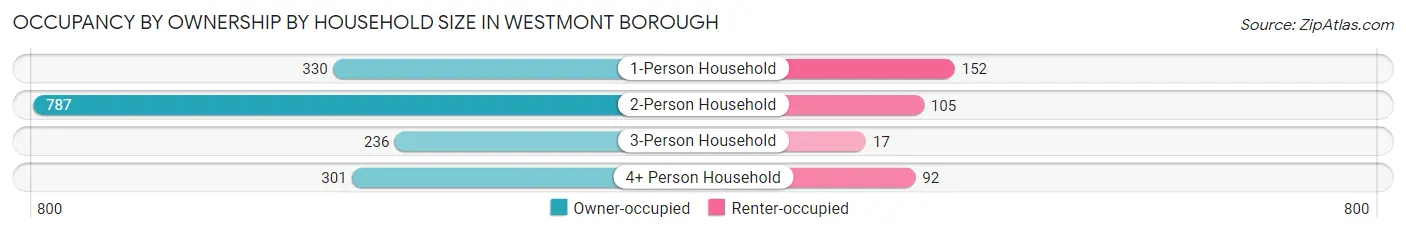
| Household Size | Owner-occupied | Renter-occupied |
| 1-Person Household | 330 (68.5%) | 152 (31.5%) |
| 2-Person Household | 787 (88.2%) | 105 (11.8%) |
| 3-Person Household | 236 (93.3%) | 17 (6.7%) |
| 4+ Person Household | 301 (76.6%) | 92 (23.4%) |
| Total Housing Units | 1,654 (81.9%) | 366 (18.1%) |
Occupancy by Educational Attainment in Westmont borough
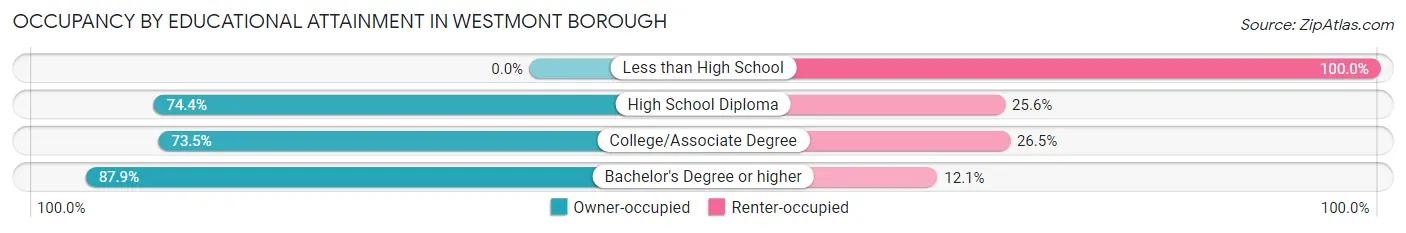
| Household Size | Owner-occupied | Renter-occupied |
| Less than High School | 0 (0.0%) | 14 (100.0%) |
| High School Diploma | 262 (74.4%) | 90 (25.6%) |
| College/Associate Degree | 313 (73.5%) | 113 (26.5%) |
| Bachelor's Degree or higher | 1,079 (87.9%) | 149 (12.1%) |
Occupancy by Age of Householder in Westmont borough
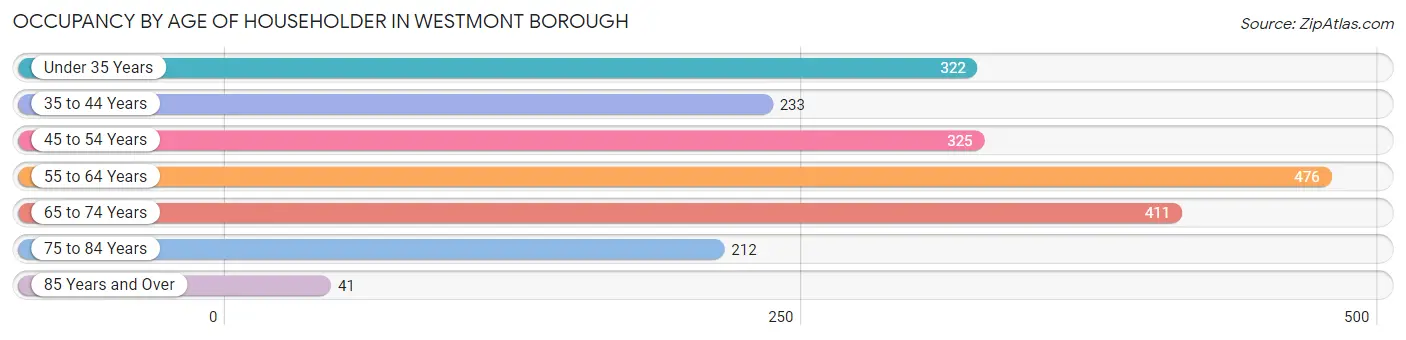
| Age Bracket | # Households | % Households |
| Under 35 Years | 322 | 15.9% |
| 35 to 44 Years | 233 | 11.5% |
| 45 to 54 Years | 325 | 16.1% |
| 55 to 64 Years | 476 | 23.6% |
| 65 to 74 Years | 411 | 20.3% |
| 75 to 84 Years | 212 | 10.5% |
| 85 Years and Over | 41 | 2.0% |
| Total | 2,020 | 100.0% |
Housing Finances in Westmont borough
Median Income by Occupancy in Westmont borough
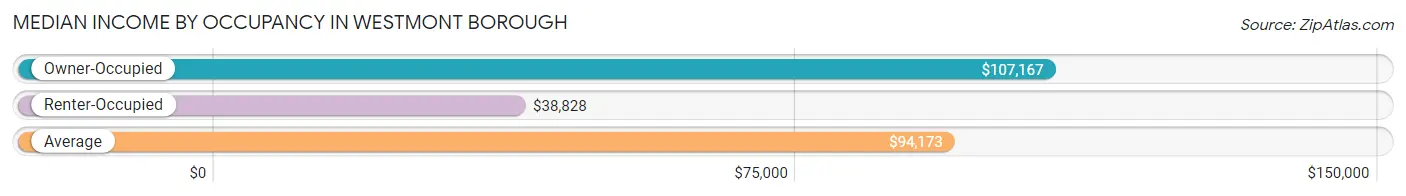
| Occupancy Type | # Households | Median Income |
| Owner-Occupied | 1,654 (81.9%) | $107,167 |
| Renter-Occupied | 366 (18.1%) | $38,828 |
| Average | 2,020 (100.0%) | $94,173 |
Occupancy by Householder Income Bracket in Westmont borough
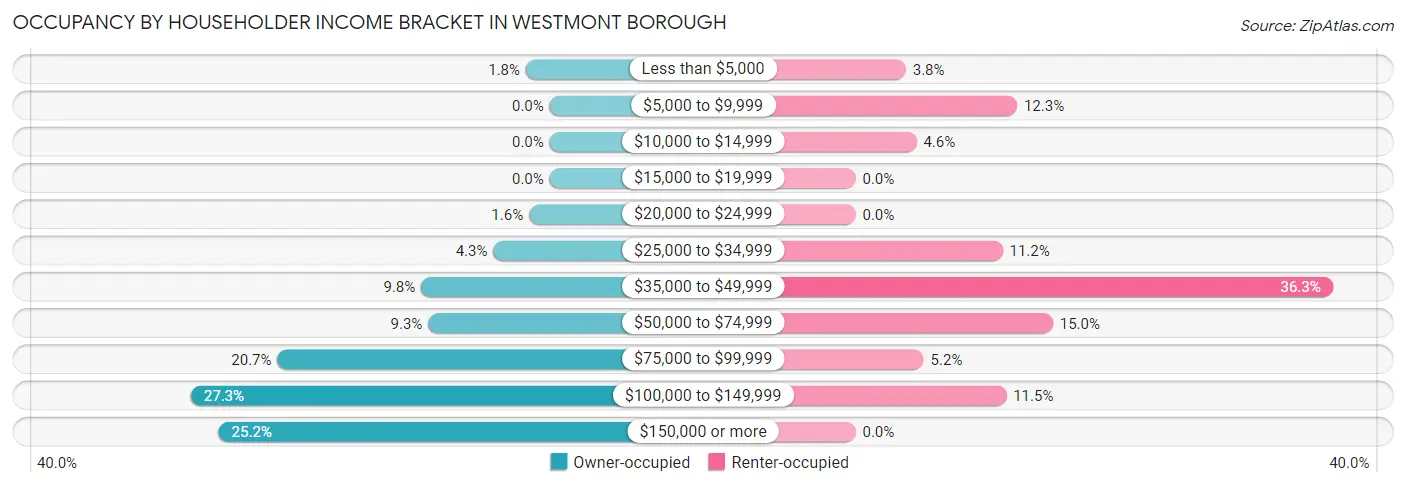
| Income Bracket | Owner-occupied | Renter-occupied |
| Less than $5,000 | 30 (1.8%) | 14 (3.8%) |
| $5,000 to $9,999 | 0 (0.0%) | 45 (12.3%) |
| $10,000 to $14,999 | 0 (0.0%) | 17 (4.6%) |
| $15,000 to $19,999 | 0 (0.0%) | 0 (0.0%) |
| $20,000 to $24,999 | 26 (1.6%) | 0 (0.0%) |
| $25,000 to $34,999 | 71 (4.3%) | 41 (11.2%) |
| $35,000 to $49,999 | 162 (9.8%) | 133 (36.3%) |
| $50,000 to $74,999 | 153 (9.2%) | 55 (15.0%) |
| $75,000 to $99,999 | 343 (20.7%) | 19 (5.2%) |
| $100,000 to $149,999 | 452 (27.3%) | 42 (11.5%) |
| $150,000 or more | 417 (25.2%) | 0 (0.0%) |
| Total | 1,654 (100.0%) | 366 (100.0%) |
Monthly Housing Cost Tiers in Westmont borough
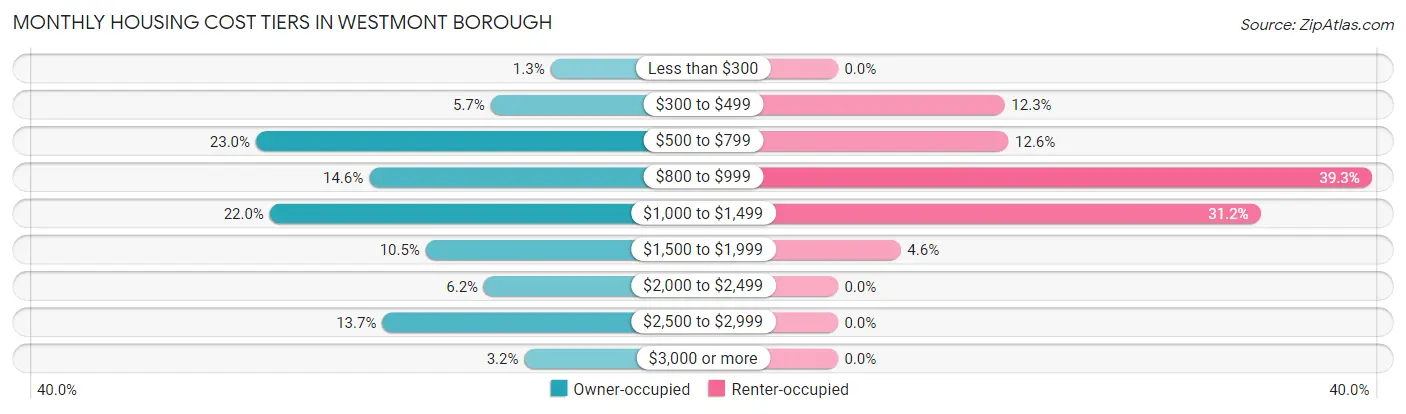
| Monthly Cost | Owner-occupied | Renter-occupied |
| Less than $300 | 21 (1.3%) | 0 (0.0%) |
| $300 to $499 | 94 (5.7%) | 45 (12.3%) |
| $500 to $799 | 380 (23.0%) | 46 (12.6%) |
| $800 to $999 | 242 (14.6%) | 144 (39.3%) |
| $1,000 to $1,499 | 363 (22.0%) | 114 (31.1%) |
| $1,500 to $1,999 | 173 (10.5%) | 17 (4.6%) |
| $2,000 to $2,499 | 102 (6.2%) | 0 (0.0%) |
| $2,500 to $2,999 | 226 (13.7%) | 0 (0.0%) |
| $3,000 or more | 53 (3.2%) | 0 (0.0%) |
| Total | 1,654 (100.0%) | 366 (100.0%) |
Physical Housing Characteristics in Westmont borough
Housing Structures in Westmont borough
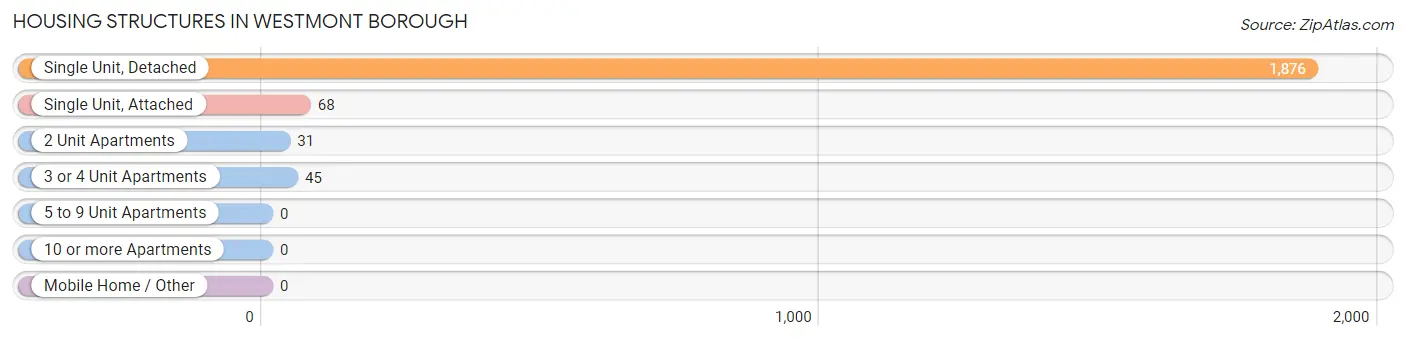
| Structure Type | # Housing Units | % Housing Units |
| Single Unit, Detached | 1,876 | 92.9% |
| Single Unit, Attached | 68 | 3.4% |
| 2 Unit Apartments | 31 | 1.5% |
| 3 or 4 Unit Apartments | 45 | 2.2% |
| 5 to 9 Unit Apartments | 0 | 0.0% |
| 10 or more Apartments | 0 | 0.0% |
| Mobile Home / Other | 0 | 0.0% |
| Total | 2,020 | 100.0% |
Housing Structures by Occupancy in Westmont borough
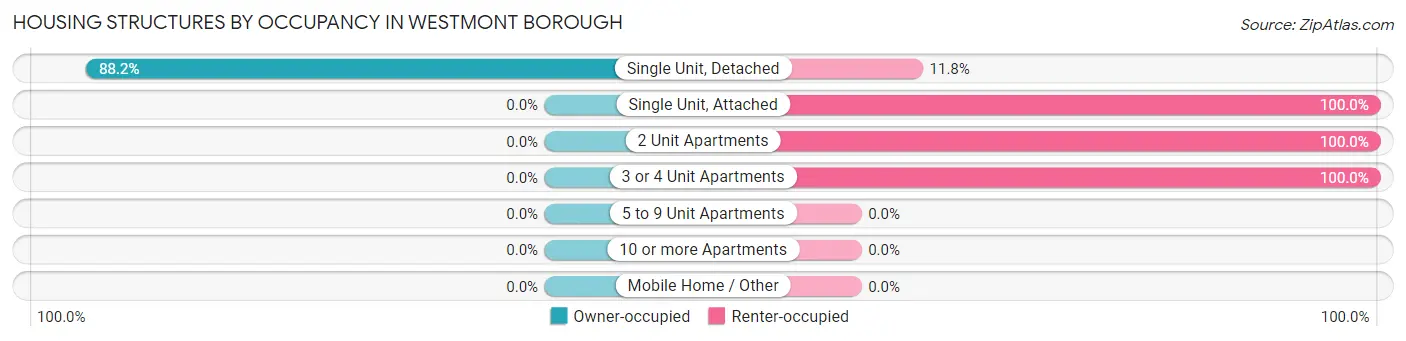
| Structure Type | Owner-occupied | Renter-occupied |
| Single Unit, Detached | 1,654 (88.2%) | 222 (11.8%) |
| Single Unit, Attached | 0 (0.0%) | 68 (100.0%) |
| 2 Unit Apartments | 0 (0.0%) | 31 (100.0%) |
| 3 or 4 Unit Apartments | 0 (0.0%) | 45 (100.0%) |
| 5 to 9 Unit Apartments | 0 (0.0%) | 0 (0.0%) |
| 10 or more Apartments | 0 (0.0%) | 0 (0.0%) |
| Mobile Home / Other | 0 (0.0%) | 0 (0.0%) |
| Total | 1,654 (81.9%) | 366 (18.1%) |
Housing Structures by Number of Rooms in Westmont borough
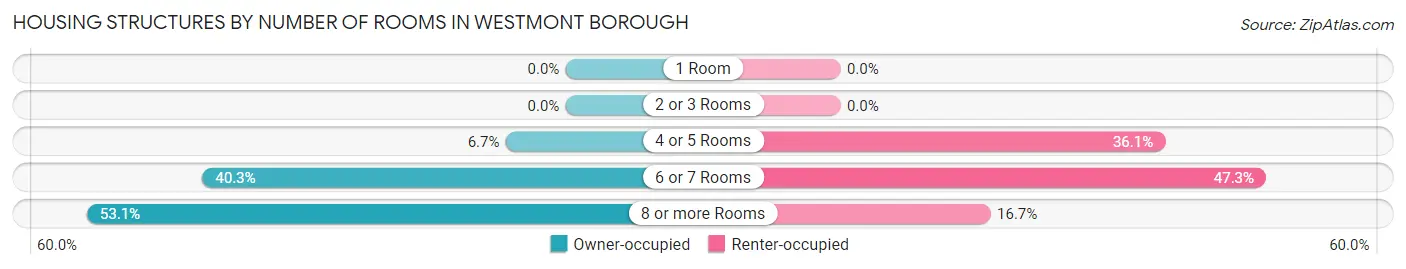
| Number of Rooms | Owner-occupied | Renter-occupied |
| 1 Room | 0 (0.0%) | 0 (0.0%) |
| 2 or 3 Rooms | 0 (0.0%) | 0 (0.0%) |
| 4 or 5 Rooms | 110 (6.7%) | 132 (36.1%) |
| 6 or 7 Rooms | 666 (40.3%) | 173 (47.3%) |
| 8 or more Rooms | 878 (53.1%) | 61 (16.7%) |
| Total | 1,654 (100.0%) | 366 (100.0%) |
Housing Structure by Heating Type in Westmont borough
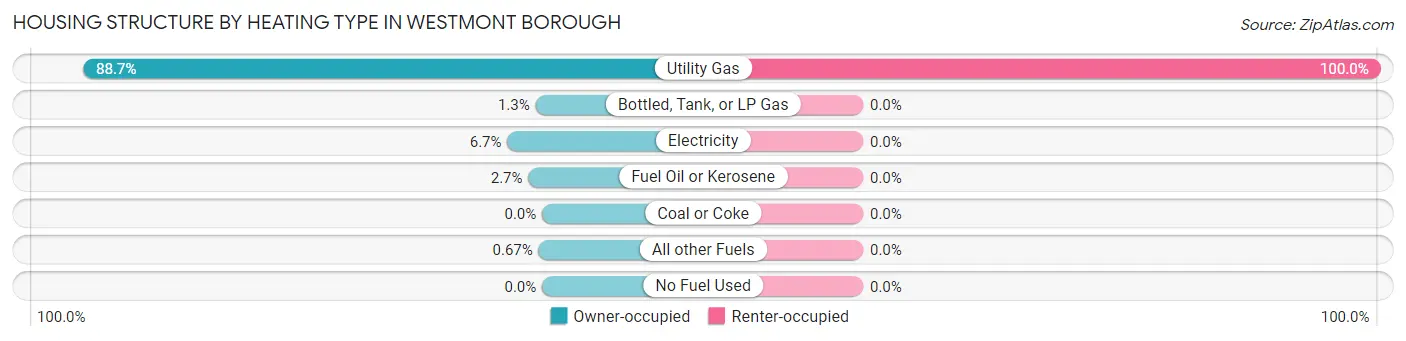
| Heating Type | Owner-occupied | Renter-occupied |
| Utility Gas | 1,467 (88.7%) | 366 (100.0%) |
| Bottled, Tank, or LP Gas | 21 (1.3%) | 0 (0.0%) |
| Electricity | 111 (6.7%) | 0 (0.0%) |
| Fuel Oil or Kerosene | 44 (2.7%) | 0 (0.0%) |
| Coal or Coke | 0 (0.0%) | 0 (0.0%) |
| All other Fuels | 11 (0.7%) | 0 (0.0%) |
| No Fuel Used | 0 (0.0%) | 0 (0.0%) |
| Total | 1,654 (100.0%) | 366 (100.0%) |
Household Vehicle Usage in Westmont borough
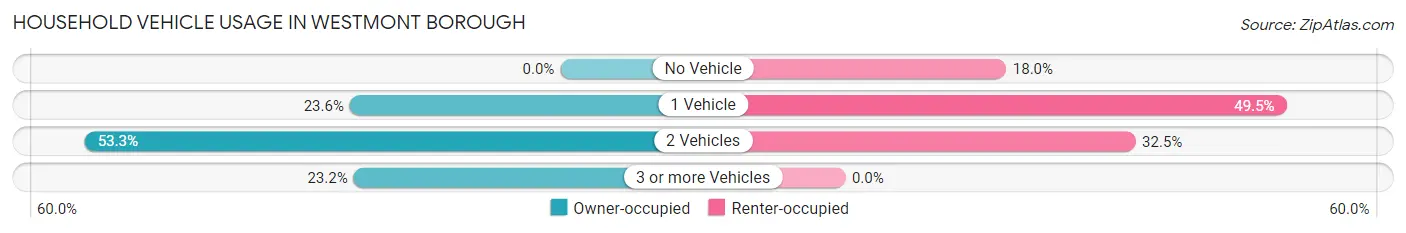
| Vehicles per Household | Owner-occupied | Renter-occupied |
| No Vehicle | 0 (0.0%) | 66 (18.0%) |
| 1 Vehicle | 390 (23.6%) | 181 (49.4%) |
| 2 Vehicles | 881 (53.3%) | 119 (32.5%) |
| 3 or more Vehicles | 383 (23.2%) | 0 (0.0%) |
| Total | 1,654 (100.0%) | 366 (100.0%) |
Real Estate & Mortgages in Westmont borough
Real Estate and Mortgage Overview in Westmont borough
| Characteristic | Without Mortgage | With Mortgage |
| Housing Units | 661 | 993 |
| Median Property Value | $138,800 | $175,300 |
| Median Household Income | $83,447 | $292 |
| Monthly Housing Costs | $705 | $53 |
| Real Estate Taxes | $3,693 | $0 |
Property Value by Mortgage Status in Westmont borough
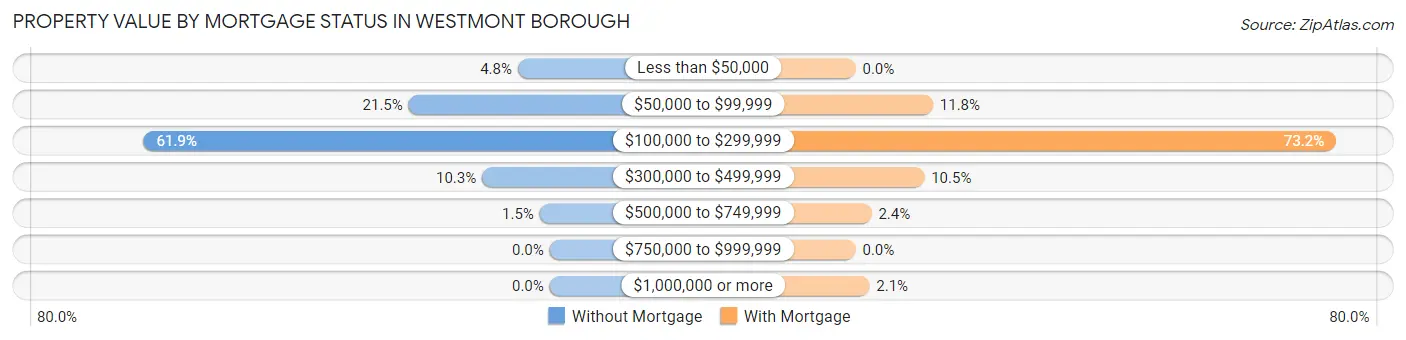
| Property Value | Without Mortgage | With Mortgage |
| Less than $50,000 | 32 (4.8%) | 0 (0.0%) |
| $50,000 to $99,999 | 142 (21.5%) | 117 (11.8%) |
| $100,000 to $299,999 | 409 (61.9%) | 727 (73.2%) |
| $300,000 to $499,999 | 68 (10.3%) | 104 (10.5%) |
| $500,000 to $749,999 | 10 (1.5%) | 24 (2.4%) |
| $750,000 to $999,999 | 0 (0.0%) | 0 (0.0%) |
| $1,000,000 or more | 0 (0.0%) | 21 (2.1%) |
| Total | 661 (100.0%) | 993 (100.0%) |
Household Income by Mortgage Status in Westmont borough
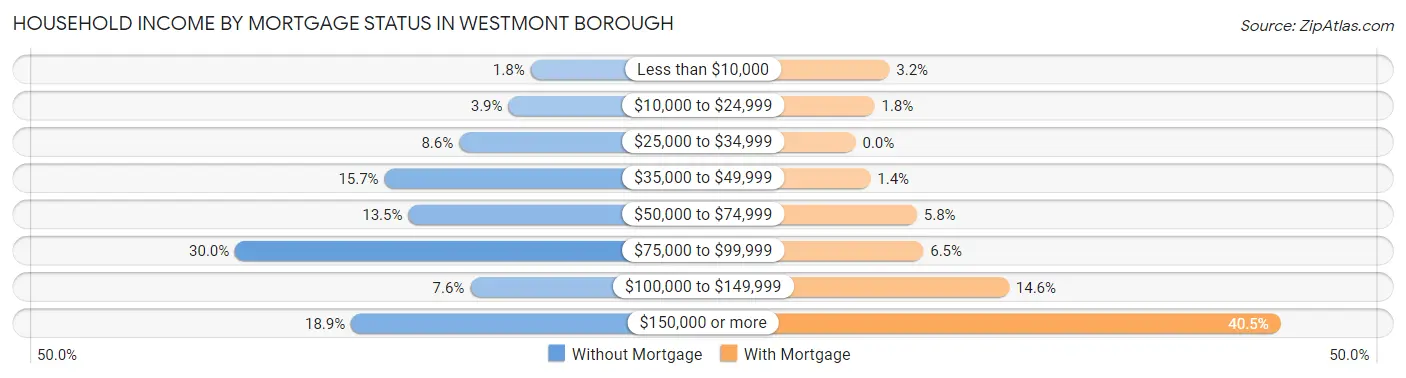
| Household Income | Without Mortgage | With Mortgage |
| Less than $10,000 | 12 (1.8%) | 32 (3.2%) |
| $10,000 to $24,999 | 26 (3.9%) | 18 (1.8%) |
| $25,000 to $34,999 | 57 (8.6%) | 0 (0.0%) |
| $35,000 to $49,999 | 104 (15.7%) | 14 (1.4%) |
| $50,000 to $74,999 | 89 (13.5%) | 58 (5.8%) |
| $75,000 to $99,999 | 198 (29.9%) | 64 (6.5%) |
| $100,000 to $149,999 | 50 (7.6%) | 145 (14.6%) |
| $150,000 or more | 125 (18.9%) | 402 (40.5%) |
| Total | 661 (100.0%) | 993 (100.0%) |
Property Value to Household Income Ratio in Westmont borough
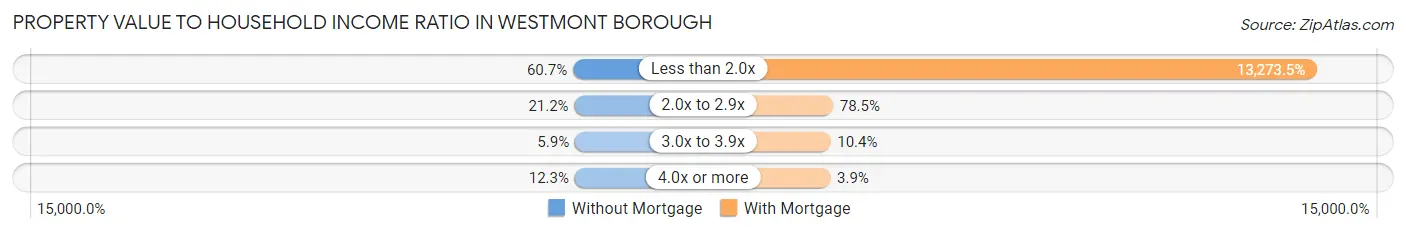
| Value-to-Income Ratio | Without Mortgage | With Mortgage |
| Less than 2.0x | 401 (60.7%) | 131,806 (13,273.5%) |
| 2.0x to 2.9x | 140 (21.2%) | 779 (78.4%) |
| 3.0x to 3.9x | 39 (5.9%) | 103 (10.4%) |
| 4.0x or more | 81 (12.2%) | 39 (3.9%) |
| Total | 661 (100.0%) | 993 (100.0%) |
Real Estate Taxes by Mortgage Status in Westmont borough
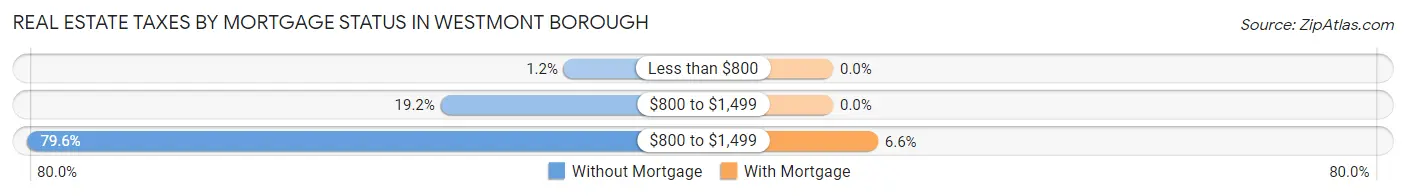
| Property Taxes | Without Mortgage | With Mortgage |
| Less than $800 | 8 (1.2%) | 0 (0.0%) |
| $800 to $1,499 | 127 (19.2%) | 0 (0.0%) |
| $800 to $1,499 | 526 (79.6%) | 65 (6.6%) |
| Total | 661 (100.0%) | 993 (100.0%) |
Health & Disability in Westmont borough
Health Insurance Coverage by Age in Westmont borough
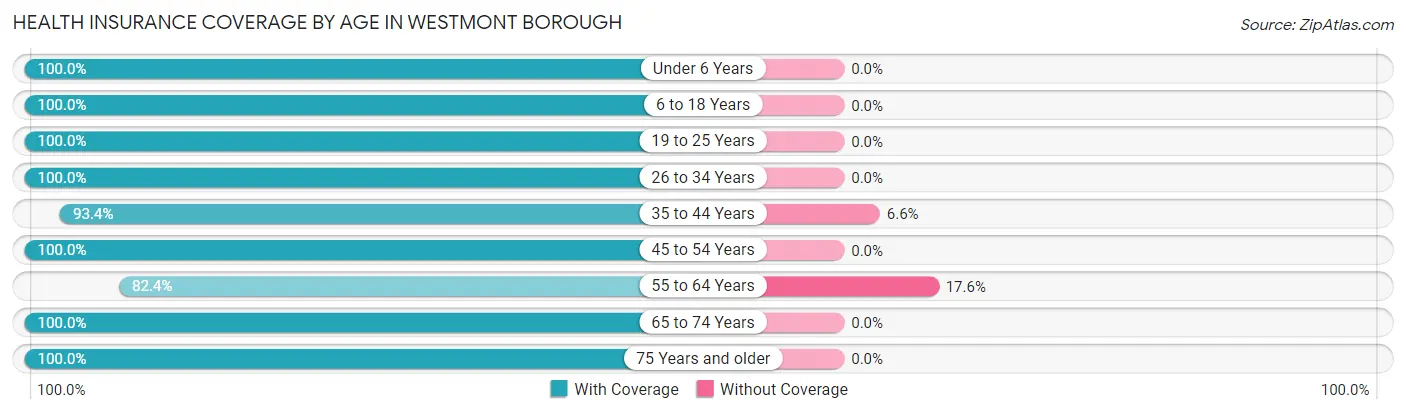
| Age Bracket | With Coverage | Without Coverage |
| Under 6 Years | 260 (100.0%) | 0 (0.0%) |
| 6 to 18 Years | 894 (100.0%) | 0 (0.0%) |
| 19 to 25 Years | 294 (100.0%) | 0 (0.0%) |
| 26 to 34 Years | 428 (100.0%) | 0 (0.0%) |
| 35 to 44 Years | 465 (93.4%) | 33 (6.6%) |
| 45 to 54 Years | 751 (100.0%) | 0 (0.0%) |
| 55 to 64 Years | 655 (82.4%) | 140 (17.6%) |
| 65 to 74 Years | 635 (100.0%) | 0 (0.0%) |
| 75 Years and older | 365 (100.0%) | 0 (0.0%) |
| Total | 4,747 (96.5%) | 173 (3.5%) |
Health Insurance Coverage by Citizenship Status in Westmont borough
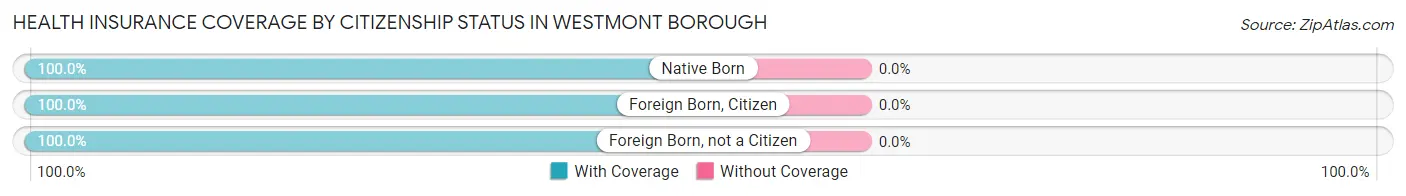
| Citizenship Status | With Coverage | Without Coverage |
| Native Born | 260 (100.0%) | 0 (0.0%) |
| Foreign Born, Citizen | 894 (100.0%) | 0 (0.0%) |
| Foreign Born, not a Citizen | 294 (100.0%) | 0 (0.0%) |
Health Insurance Coverage by Household Income in Westmont borough
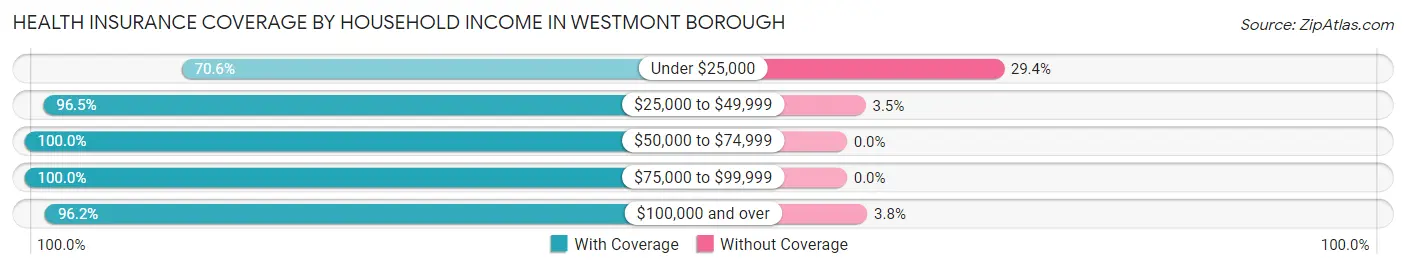
| Household Income | With Coverage | Without Coverage |
| Under $25,000 | 108 (70.6%) | 45 (29.4%) |
| $25,000 to $49,999 | 908 (96.5%) | 33 (3.5%) |
| $50,000 to $74,999 | 372 (100.0%) | 0 (0.0%) |
| $75,000 to $99,999 | 962 (100.0%) | 0 (0.0%) |
| $100,000 and over | 2,392 (96.2%) | 95 (3.8%) |
Public vs Private Health Insurance Coverage by Age in Westmont borough
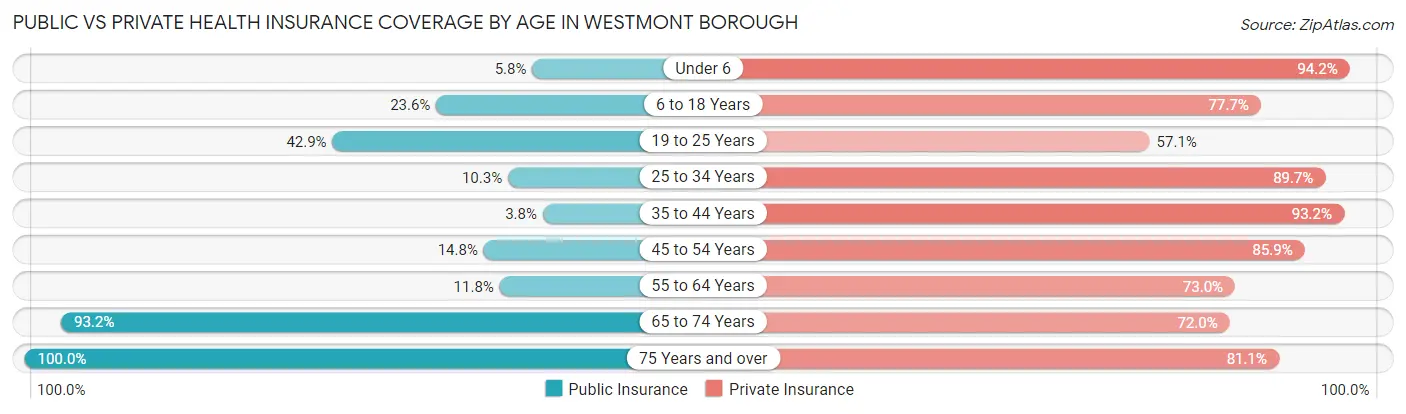
| Age Bracket | Public Insurance | Private Insurance |
| Under 6 | 15 (5.8%) | 245 (94.2%) |
| 6 to 18 Years | 211 (23.6%) | 695 (77.7%) |
| 19 to 25 Years | 126 (42.9%) | 168 (57.1%) |
| 25 to 34 Years | 44 (10.3%) | 384 (89.7%) |
| 35 to 44 Years | 19 (3.8%) | 464 (93.2%) |
| 45 to 54 Years | 111 (14.8%) | 645 (85.9%) |
| 55 to 64 Years | 94 (11.8%) | 580 (73.0%) |
| 65 to 74 Years | 592 (93.2%) | 457 (72.0%) |
| 75 Years and over | 365 (100.0%) | 296 (81.1%) |
| Total | 1,577 (32.1%) | 3,934 (80.0%) |
Disability Status by Sex by Age in Westmont borough
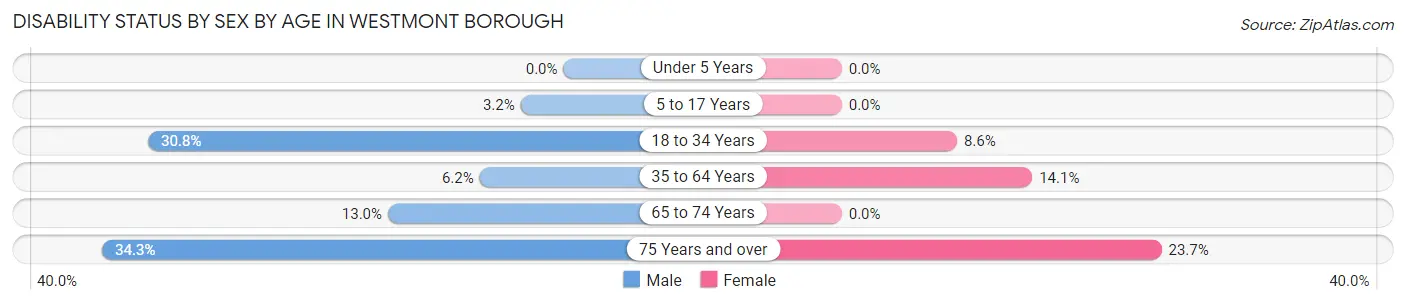
| Age Bracket | Male | Female |
| Under 5 Years | 0 (0.0%) | 0 (0.0%) |
| 5 to 17 Years | 12 (3.2%) | 0 (0.0%) |
| 18 to 34 Years | 123 (30.8%) | 29 (8.6%) |
| 35 to 64 Years | 59 (6.2%) | 155 (14.1%) |
| 65 to 74 Years | 49 (13.0%) | 0 (0.0%) |
| 75 Years and over | 50 (34.3%) | 52 (23.7%) |
Disability Class by Sex by Age in Westmont borough
Disability Class: Hearing Difficulty
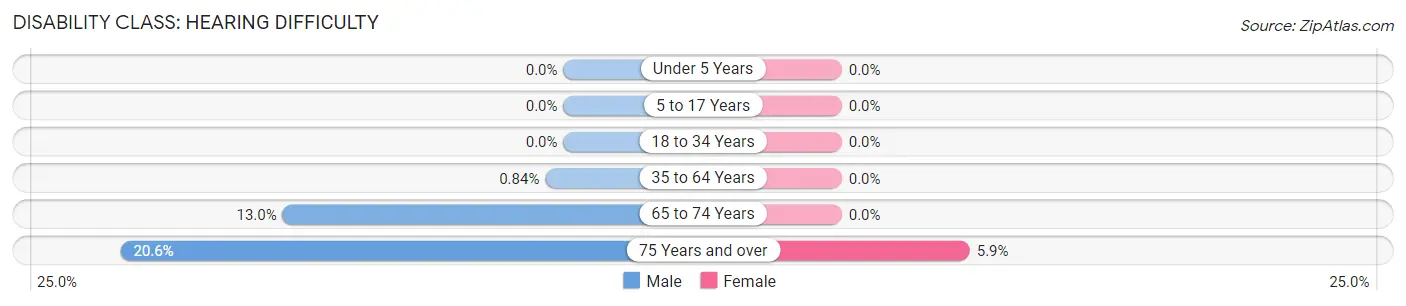
| Age Bracket | Male | Female |
| Under 5 Years | 0 (0.0%) | 0 (0.0%) |
| 5 to 17 Years | 0 (0.0%) | 0 (0.0%) |
| 18 to 34 Years | 0 (0.0%) | 0 (0.0%) |
| 35 to 64 Years | 8 (0.8%) | 0 (0.0%) |
| 65 to 74 Years | 49 (13.0%) | 0 (0.0%) |
| 75 Years and over | 30 (20.5%) | 13 (5.9%) |
Disability Class: Vision Difficulty
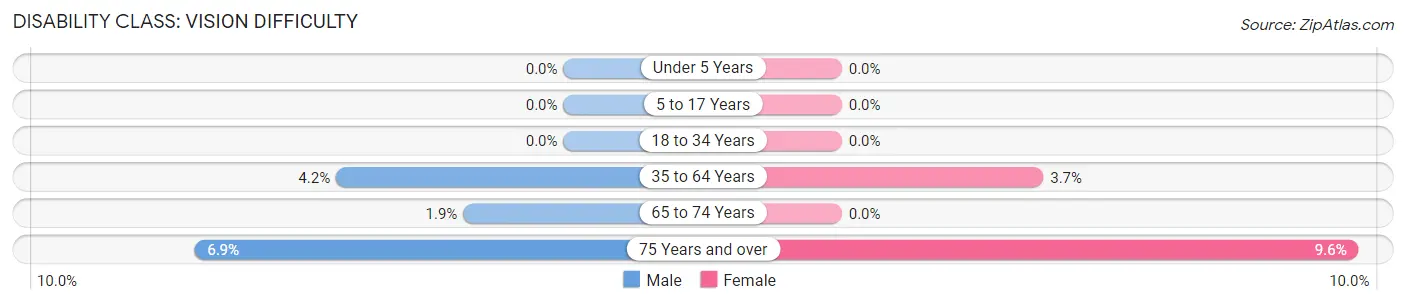
| Age Bracket | Male | Female |
| Under 5 Years | 0 (0.0%) | 0 (0.0%) |
| 5 to 17 Years | 0 (0.0%) | 0 (0.0%) |
| 18 to 34 Years | 0 (0.0%) | 0 (0.0%) |
| 35 to 64 Years | 40 (4.2%) | 41 (3.7%) |
| 65 to 74 Years | 7 (1.9%) | 0 (0.0%) |
| 75 Years and over | 10 (6.9%) | 21 (9.6%) |
Disability Class: Cognitive Difficulty
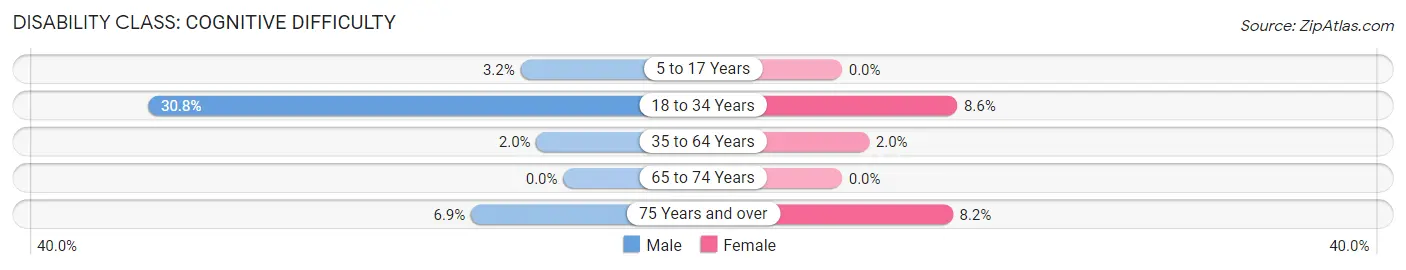
| Age Bracket | Male | Female |
| 5 to 17 Years | 12 (3.2%) | 0 (0.0%) |
| 18 to 34 Years | 123 (30.8%) | 29 (8.6%) |
| 35 to 64 Years | 19 (2.0%) | 22 (2.0%) |
| 65 to 74 Years | 0 (0.0%) | 0 (0.0%) |
| 75 Years and over | 10 (6.9%) | 18 (8.2%) |
Disability Class: Ambulatory Difficulty
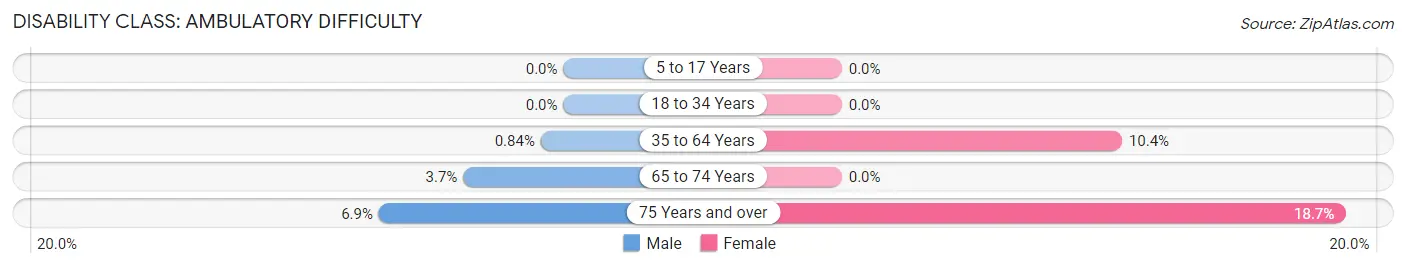
| Age Bracket | Male | Female |
| 5 to 17 Years | 0 (0.0%) | 0 (0.0%) |
| 18 to 34 Years | 0 (0.0%) | 0 (0.0%) |
| 35 to 64 Years | 8 (0.8%) | 114 (10.4%) |
| 65 to 74 Years | 14 (3.7%) | 0 (0.0%) |
| 75 Years and over | 10 (6.9%) | 41 (18.7%) |
Disability Class: Self-Care Difficulty
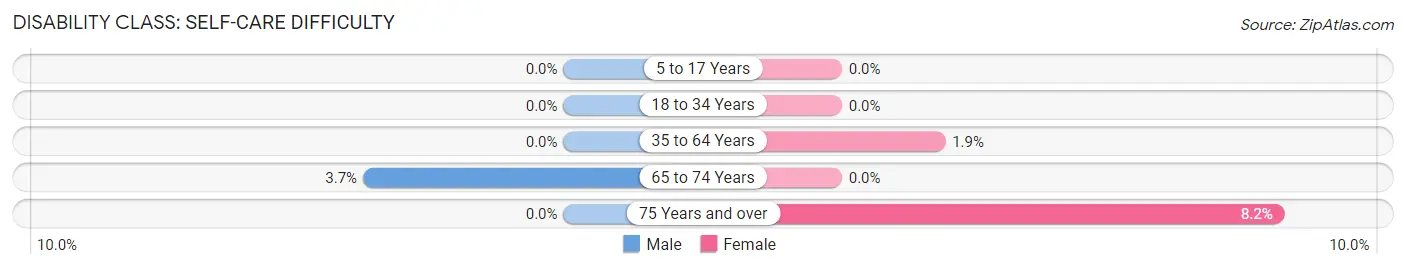
| Age Bracket | Male | Female |
| 5 to 17 Years | 0 (0.0%) | 0 (0.0%) |
| 18 to 34 Years | 0 (0.0%) | 0 (0.0%) |
| 35 to 64 Years | 0 (0.0%) | 21 (1.9%) |
| 65 to 74 Years | 14 (3.7%) | 0 (0.0%) |
| 75 Years and over | 0 (0.0%) | 18 (8.2%) |
Technology Access in Westmont borough
Computing Device Access in Westmont borough
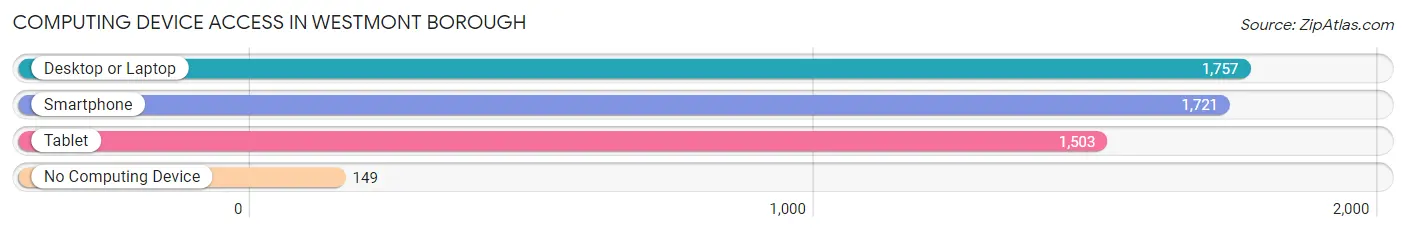
| Device Type | # Households | % Households |
| Desktop or Laptop | 1,757 | 87.0% |
| Smartphone | 1,721 | 85.2% |
| Tablet | 1,503 | 74.4% |
| No Computing Device | 149 | 7.4% |
| Total | 2,020 | 100.0% |
Internet Access in Westmont borough
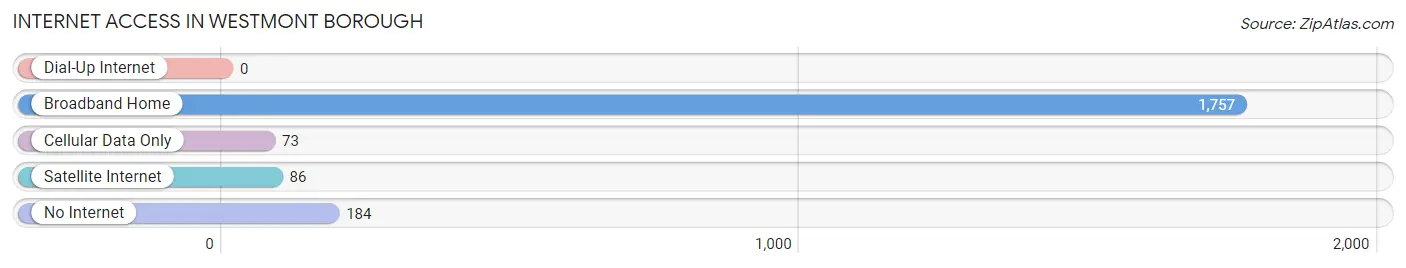
| Internet Type | # Households | % Households |
| Dial-Up Internet | 0 | 0.0% |
| Broadband Home | 1,757 | 87.0% |
| Cellular Data Only | 73 | 3.6% |
| Satellite Internet | 86 | 4.3% |
| No Internet | 184 | 9.1% |
| Total | 2,020 | 100.0% |
Westmont borough Summary
Westmont Borough is a small borough located in Cambria County, Pennsylvania. It is situated in the foothills of the Allegheny Mountains, approximately seven miles east of Johnstown. The borough was incorporated in 1891 and has a population of approximately 2,500 people.
Geography
Westmont Borough is located in the foothills of the Allegheny Mountains, approximately seven miles east of Johnstown. The borough is situated in a valley between two mountain ridges, the Allegheny Front and the Chestnut Ridge. The borough is bordered by the townships of Conemaugh, Upper Yoder, and Lower Yoder. The borough is located at an elevation of 1,400 feet above sea level. The borough is approximately 1.5 square miles in size and is located in the Eastern Standard Time Zone.
The climate in Westmont Borough is classified as humid continental. The average annual temperature is approximately 50 degrees Fahrenheit. The average annual precipitation is approximately 40 inches.
Economy
The economy of Westmont Borough is largely based on the service industry. The borough is home to several small businesses, including restaurants, retail stores, and professional services. The borough also has a number of manufacturing companies, including a steel mill and a paper mill. The borough is also home to a number of small farms.
Demographics
As of the 2010 census, the population of Westmont Borough was 2,521. The racial makeup of the borough was 97.3% White, 0.7% African American, 0.2% Native American, 0.3% Asian, 0.2% from other races, and 1.3% from two or more races. Hispanic or Latino of any race were 0.7% of the population.
The median income for a household in the borough was $37,917, and the median income for a family was $45,000. The per capita income for the borough was $18,945. About 11.2% of families and 13.2% of the population were below the poverty line, including 17.2% of those under age 18 and 8.2% of those age 65 or over.
History
Westmont Borough was first settled in the late 1700s by German immigrants. The borough was officially incorporated in 1891. The borough was named after the Westmont Coal Company, which was founded in the area in 1883.
The borough was home to a number of coal mines in the late 19th and early 20th centuries. The coal industry was the primary source of employment for the borough's residents. The coal industry declined in the mid-20th century, and the borough's economy shifted to the service industry.
Westmont Borough is home to a number of historic sites, including the Westmont Presbyterian Church, which was built in 1891, and the Westmont Fire Hall, which was built in 1895. The borough is also home to a number of parks and recreational areas, including the Westmont Park, which was established in the early 20th century.
Common Questions
What is Per Capita Income in Westmont borough?
Per Capita income in Westmont borough is $48,706.
What is the Median Family Income in Westmont borough?
Median Family Income in Westmont borough is $125,080.
What is the Median Household income in Westmont borough?
Median Household Income in Westmont borough is $94,173.
What is Income or Wage Gap in Westmont borough?
Income or Wage Gap in Westmont borough is 21.9%.
Women in Westmont borough earn 78.1 cents for every dollar earned by a man.
What is Inequality or Gini Index in Westmont borough?
Inequality or Gini Index in Westmont borough is 0.42.
What is the Total Population of Westmont borough?
Total Population of Westmont borough is 4,964.
What is the Total Male Population of Westmont borough?
Total Male Population of Westmont borough is 2,385.
What is the Total Female Population of Westmont borough?
Total Female Population of Westmont borough is 2,579.
What is the Ratio of Males per 100 Females in Westmont borough?
There are 92.48 Males per 100 Females in Westmont borough.
What is the Ratio of Females per 100 Males in Westmont borough?
There are 108.13 Females per 100 Males in Westmont borough.
What is the Median Population Age in Westmont borough?
Median Population Age in Westmont borough is 45.4 Years.
What is the Average Family Size in Westmont borough
Average Family Size in Westmont borough is 2.8 People.
What is the Average Household Size in Westmont borough
Average Household Size in Westmont borough is 2.5 People.
How Large is the Labor Force in Westmont borough?
There are 2,415 People in the Labor Forcein in Westmont borough.
What is the Percentage of People in the Labor Force in Westmont borough?
59.8% of People are in the Labor Force in Westmont borough.
What is the Unemployment Rate in Westmont borough?
Unemployment Rate in Westmont borough is 9.9%.