Bridgewater borough, PA Map & Demographics
Bridgewater borough Overview
$37,630
PER CAPITA INCOME
$84,375
AVG FAMILY INCOME
$59,271
AVG HOUSEHOLD INCOME
35.0%
WAGE / INCOME GAP [ % ]
65.0¢/ $1
WAGE / INCOME GAP [ $ ]
0.46
INEQUALITY / GINI INDEX
788
TOTAL POPULATION
371
MALE POPULATION
417
FEMALE POPULATION
88.97
MALES / 100 FEMALES
112.40
FEMALES / 100 MALES
47.7
MEDIAN AGE
2.9
AVG FAMILY SIZE
2.1
AVG HOUSEHOLD SIZE
429
LABOR FORCE [ PEOPLE ]
64.7%
PERCENT IN LABOR FORCE
5.4%
UNEMPLOYMENT RATE
Income in Bridgewater borough
Income Overview in Bridgewater borough
Per Capita Income in Bridgewater borough is $37,630, while median incomes of families and households are $84,375 and $59,271 respectively.
| Characteristic | Number | Measure |
| Per Capita Income | 788 | $37,630 |
| Median Family Income | 203 | $84,375 |
| Mean Family Income | 203 | $92,292 |
| Median Household Income | 379 | $59,271 |
| Mean Household Income | 379 | $78,148 |
| Income Deficit | 203 | $0 |
| Wage / Income Gap (%) | 788 | 34.98% |
| Wage / Income Gap ($) | 788 | 65.02¢ per $1 |
| Gini / Inequality Index | 788 | 0.46 |
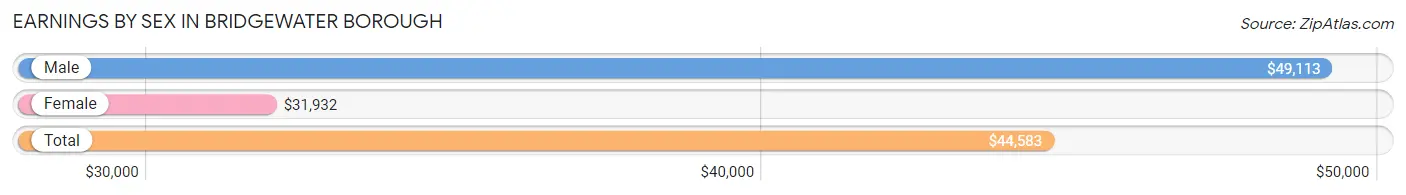
Earnings by Sex in Bridgewater borough
Average Earnings in Bridgewater borough are $44,583, $49,113 for men and $31,932 for women, a difference of 35.0%.
| Sex | Number | Average Earnings |
| Male | 240 (54.7%) | $49,113 |
| Female | 199 (45.3%) | $31,932 |
| Total | 439 (100.0%) | $44,583 |
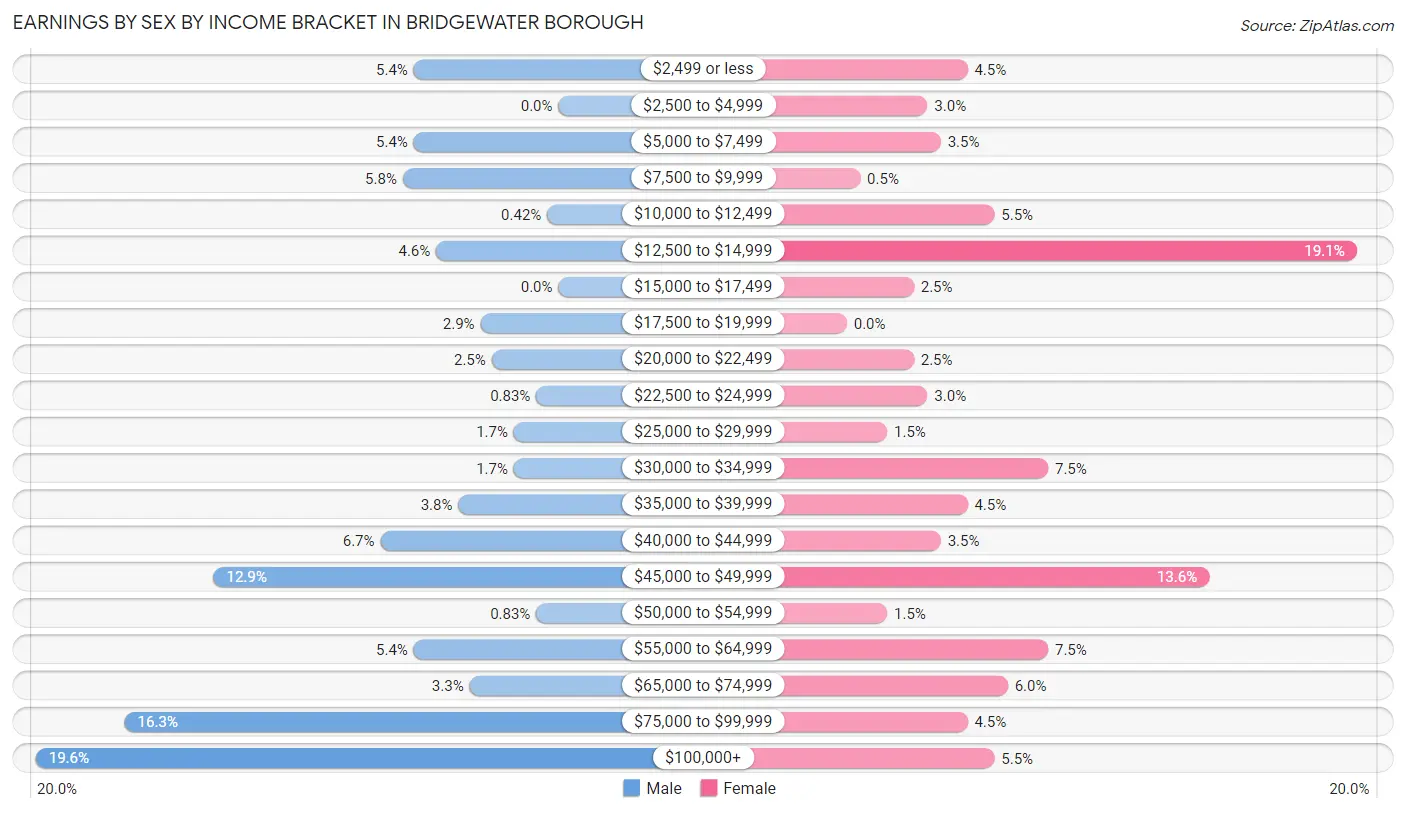
Earnings by Sex by Income Bracket in Bridgewater borough
The most common earnings brackets in Bridgewater borough are $100,000+ for men (47 | 19.6%) and $12,500 to $14,999 for women (38 | 19.1%).
| Income | Male | Female |
| $2,499 or less | 13 (5.4%) | 9 (4.5%) |
| $2,500 to $4,999 | 0 (0.0%) | 6 (3.0%) |
| $5,000 to $7,499 | 13 (5.4%) | 7 (3.5%) |
| $7,500 to $9,999 | 14 (5.8%) | 1 (0.5%) |
| $10,000 to $12,499 | 1 (0.4%) | 11 (5.5%) |
| $12,500 to $14,999 | 11 (4.6%) | 38 (19.1%) |
| $15,000 to $17,499 | 0 (0.0%) | 5 (2.5%) |
| $17,500 to $19,999 | 7 (2.9%) | 0 (0.0%) |
| $20,000 to $22,499 | 6 (2.5%) | 5 (2.5%) |
| $22,500 to $24,999 | 2 (0.8%) | 6 (3.0%) |
| $25,000 to $29,999 | 4 (1.7%) | 3 (1.5%) |
| $30,000 to $34,999 | 4 (1.7%) | 15 (7.5%) |
| $35,000 to $39,999 | 9 (3.7%) | 9 (4.5%) |
| $40,000 to $44,999 | 16 (6.7%) | 7 (3.5%) |
| $45,000 to $49,999 | 31 (12.9%) | 27 (13.6%) |
| $50,000 to $54,999 | 2 (0.8%) | 3 (1.5%) |
| $55,000 to $64,999 | 13 (5.4%) | 15 (7.5%) |
| $65,000 to $74,999 | 8 (3.3%) | 12 (6.0%) |
| $75,000 to $99,999 | 39 (16.3%) | 9 (4.5%) |
| $100,000+ | 47 (19.6%) | 11 (5.5%) |
| Total | 240 (100.0%) | 199 (100.0%) |
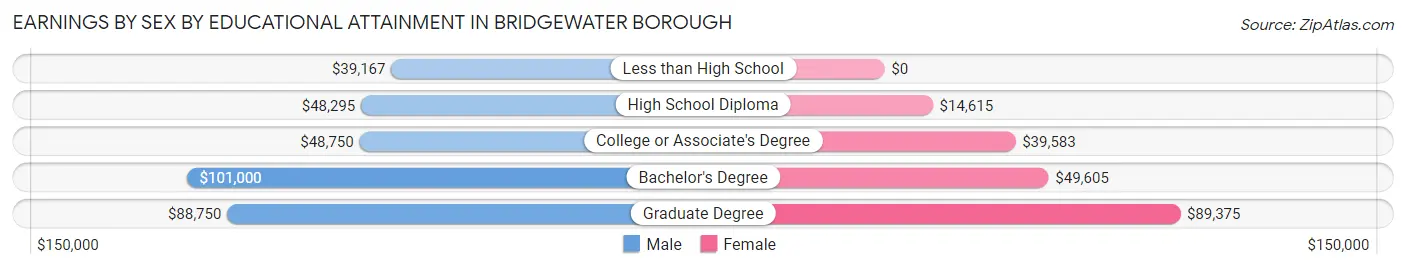
Earnings by Sex by Educational Attainment in Bridgewater borough
Average earnings in Bridgewater borough are $56,042 for men and $37,188 for women, a difference of 33.6%. Men with an educational attainment of bachelor's degree enjoy the highest average annual earnings of $101,000, while those with less than high school education earn the least with $39,167. Women with an educational attainment of graduate degree earn the most with the average annual earnings of $89,375, while those with high school diploma education have the smallest earnings of $14,615.
| Educational Attainment | Male Income | Female Income |
| Less than High School | $39,167 | $0 |
| High School Diploma | $48,295 | $14,615 |
| College or Associate's Degree | $48,750 | $39,583 |
| Bachelor's Degree | $101,000 | $49,605 |
| Graduate Degree | $88,750 | $89,375 |
| Total | $56,042 | $37,188 |
Family Income in Bridgewater borough
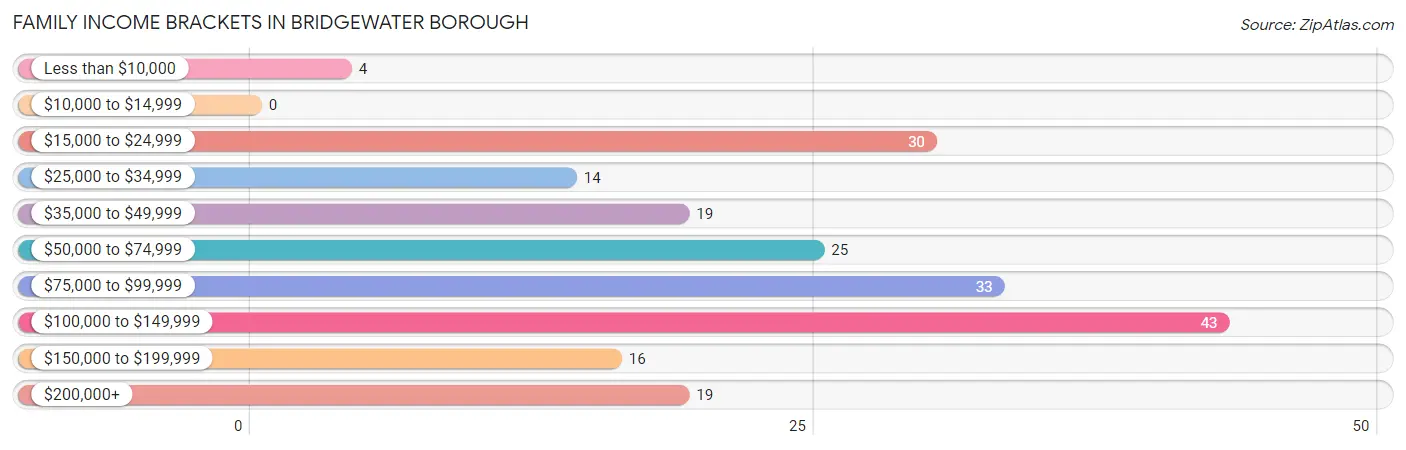
Family Income Brackets in Bridgewater borough
According to the Bridgewater borough family income data, there are 43 families falling into the $100,000 to $149,999 income range, which is the most common income bracket and makes up 21.2% of all families.
| Income Bracket | # Families | % Families |
| Less than $10,000 | 4 | 2.0% |
| $10,000 to $14,999 | 0 | 0.0% |
| $15,000 to $24,999 | 30 | 14.8% |
| $25,000 to $34,999 | 14 | 6.9% |
| $35,000 to $49,999 | 19 | 9.4% |
| $50,000 to $74,999 | 25 | 12.3% |
| $75,000 to $99,999 | 33 | 16.3% |
| $100,000 to $149,999 | 43 | 21.2% |
| $150,000 to $199,999 | 16 | 7.9% |
| $200,000+ | 19 | 9.4% |
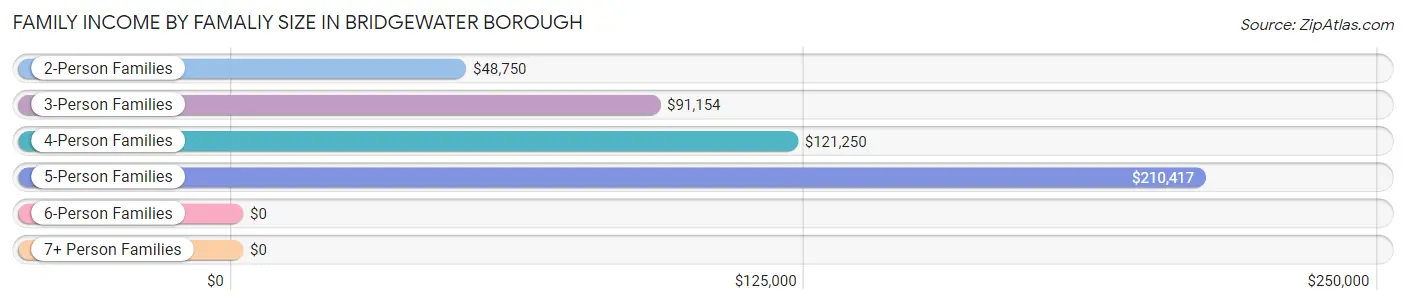
Family Income by Famaliy Size in Bridgewater borough
5-person families (14 | 6.9%) account for the highest median family income in Bridgewater borough with $210,417 per family, while 5-person families (14 | 6.9%) have the highest median income of $42,083 per family member.
| Income Bracket | # Families | Median Income |
| 2-Person Families | 111 (54.7%) | $48,750 |
| 3-Person Families | 30 (14.8%) | $91,154 |
| 4-Person Families | 42 (20.7%) | $121,250 |
| 5-Person Families | 14 (6.9%) | $210,417 |
| 6-Person Families | 2 (1.0%) | $0 |
| 7+ Person Families | 4 (2.0%) | $0 |
| Total | 203 (100.0%) | $84,375 |
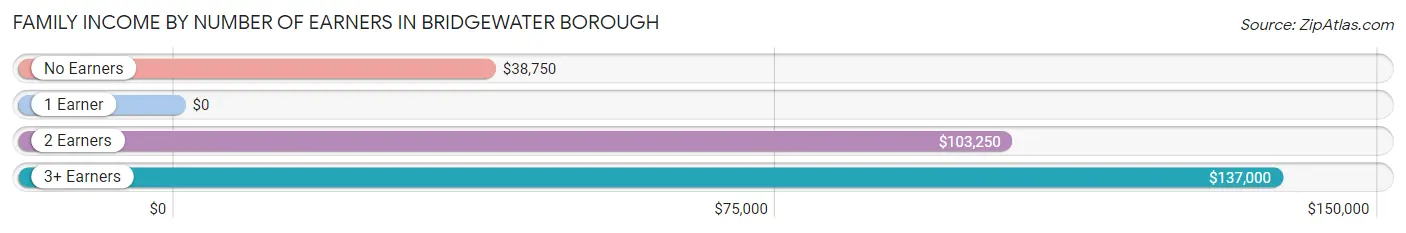
Family Income by Number of Earners in Bridgewater borough
| Number of Earners | # Families | Median Income |
| No Earners | 34 (16.8%) | $38,750 |
| 1 Earner | 65 (32.0%) | $0 |
| 2 Earners | 70 (34.5%) | $103,250 |
| 3+ Earners | 34 (16.8%) | $137,000 |
| Total | 203 (100.0%) | $84,375 |
Household Income in Bridgewater borough
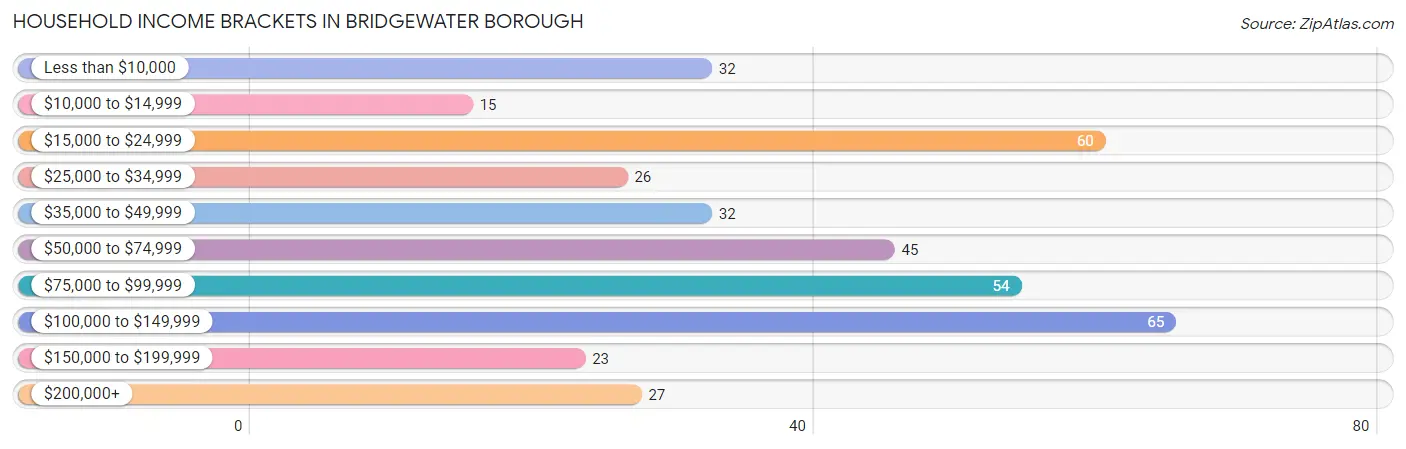
Household Income Brackets in Bridgewater borough
With 65 households falling in the category, the $100,000 to $149,999 income range is the most frequent in Bridgewater borough, accounting for 17.2% of all households. In contrast, only 15 households (4.0%) fall into the $10,000 to $14,999 income bracket, making it the least populous group.
| Income Bracket | # Households | % Households |
| Less than $10,000 | 32 | 8.4% |
| $10,000 to $14,999 | 15 | 4.0% |
| $15,000 to $24,999 | 60 | 15.8% |
| $25,000 to $34,999 | 26 | 6.9% |
| $35,000 to $49,999 | 32 | 8.4% |
| $50,000 to $74,999 | 45 | 11.9% |
| $75,000 to $99,999 | 54 | 14.2% |
| $100,000 to $149,999 | 65 | 17.2% |
| $150,000 to $199,999 | 23 | 6.1% |
| $200,000+ | 27 | 7.1% |
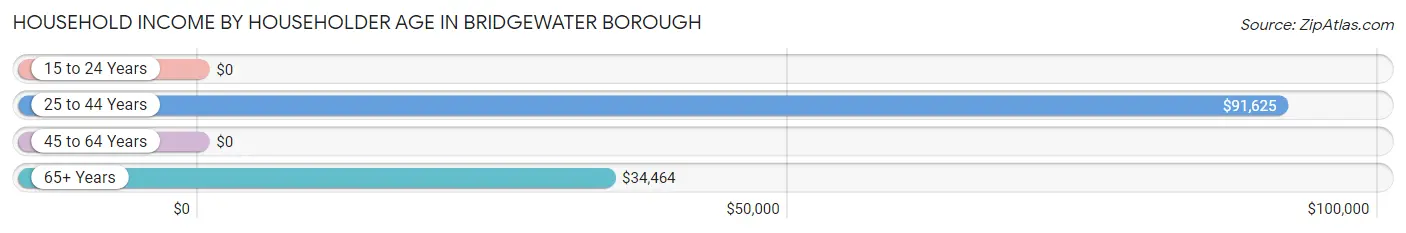
Household Income by Householder Age in Bridgewater borough
The median household income in Bridgewater borough is $59,271, with the highest median household income of $91,625 found in the 25 to 44 years age bracket for the primary householder. A total of 109 households (28.8%) fall into this category.
| Income Bracket | # Households | Median Income |
| 15 to 24 Years | 0 (0.0%) | $0 |
| 25 to 44 Years | 109 (28.8%) | $91,625 |
| 45 to 64 Years | 131 (34.6%) | $0 |
| 65+ Years | 139 (36.7%) | $34,464 |
| Total | 379 (100.0%) | $59,271 |
Poverty in Bridgewater borough
Income Below Poverty by Sex and Age in Bridgewater borough
With 11.6% poverty level for males and 8.9% for females among the residents of Bridgewater borough, 6 to 11 year old males and 55 to 64 year old females are the most vulnerable to poverty, with 8 males (38.1%) and 17 females (39.5%) in their respective age groups living below the poverty level.
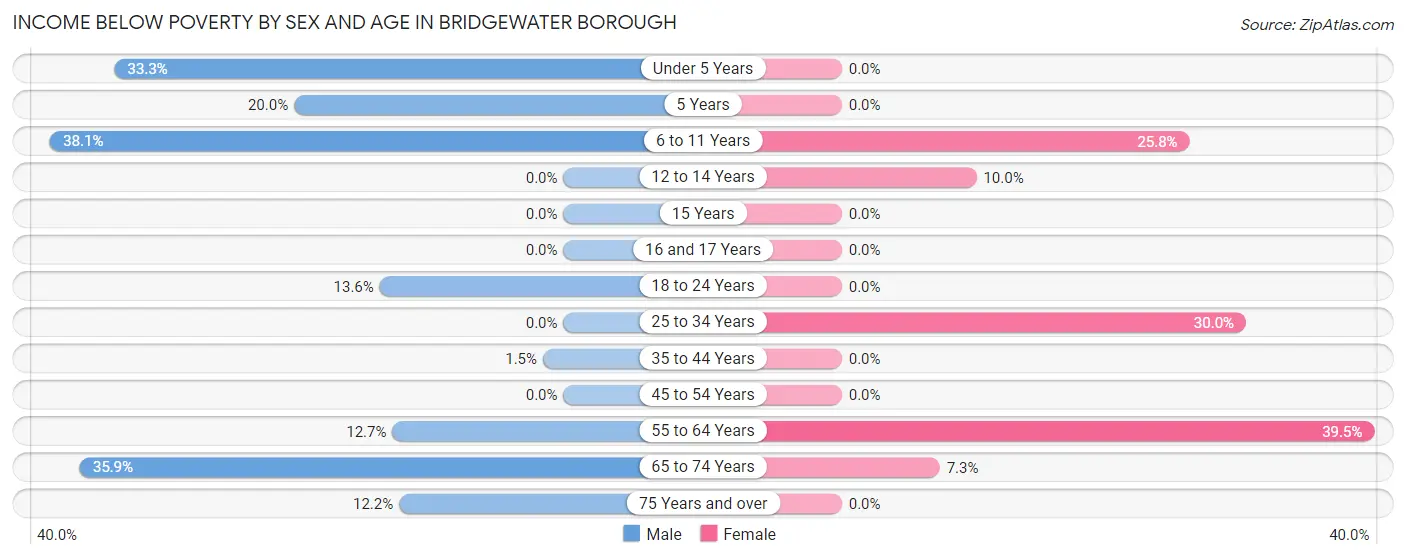
| Age Bracket | Male | Female |
| Under 5 Years | 3 (33.3%) | 0 (0.0%) |
| 5 Years | 1 (20.0%) | 0 (0.0%) |
| 6 to 11 Years | 8 (38.1%) | 8 (25.8%) |
| 12 to 14 Years | 0 (0.0%) | 2 (10.0%) |
| 15 Years | 0 (0.0%) | 0 (0.0%) |
| 16 and 17 Years | 0 (0.0%) | 0 (0.0%) |
| 18 to 24 Years | 3 (13.6%) | 0 (0.0%) |
| 25 to 34 Years | 0 (0.0%) | 6 (30.0%) |
| 35 to 44 Years | 1 (1.5%) | 0 (0.0%) |
| 45 to 54 Years | 0 (0.0%) | 0 (0.0%) |
| 55 to 64 Years | 8 (12.7%) | 17 (39.5%) |
| 65 to 74 Years | 14 (35.9%) | 4 (7.3%) |
| 75 Years and over | 5 (12.2%) | 0 (0.0%) |
| Total | 43 (11.6%) | 37 (8.9%) |
Income Above Poverty by Sex and Age in Bridgewater borough
According to the poverty statistics in Bridgewater borough, males aged 15 years and females aged under 5 years are the age groups that are most secure financially, with 100.0% of males and 100.0% of females in these age groups living above the poverty line.
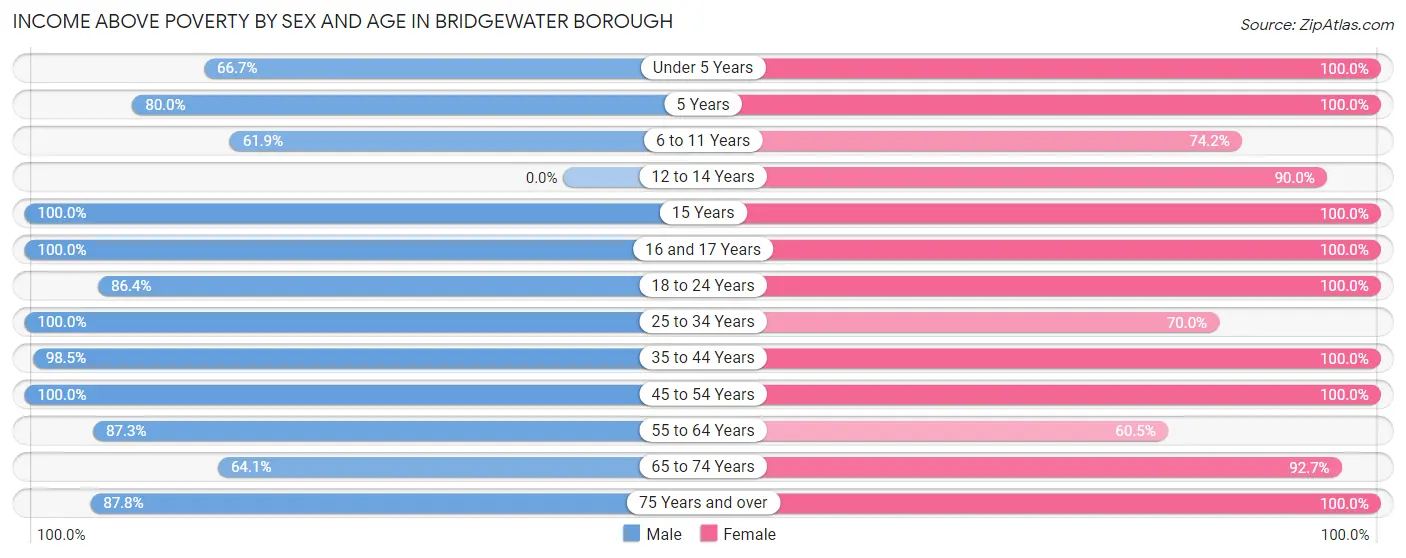
| Age Bracket | Male | Female |
| Under 5 Years | 6 (66.7%) | 25 (100.0%) |
| 5 Years | 4 (80.0%) | 8 (100.0%) |
| 6 to 11 Years | 13 (61.9%) | 23 (74.2%) |
| 12 to 14 Years | 0 (0.0%) | 18 (90.0%) |
| 15 Years | 4 (100.0%) | 2 (100.0%) |
| 16 and 17 Years | 20 (100.0%) | 3 (100.0%) |
| 18 to 24 Years | 19 (86.4%) | 21 (100.0%) |
| 25 to 34 Years | 33 (100.0%) | 14 (70.0%) |
| 35 to 44 Years | 65 (98.5%) | 58 (100.0%) |
| 45 to 54 Years | 48 (100.0%) | 71 (100.0%) |
| 55 to 64 Years | 55 (87.3%) | 26 (60.5%) |
| 65 to 74 Years | 25 (64.1%) | 51 (92.7%) |
| 75 Years and over | 36 (87.8%) | 60 (100.0%) |
| Total | 328 (88.4%) | 380 (91.1%) |
Income Below Poverty Among Married-Couple Families in Bridgewater borough
The poverty statistics for married-couple families in Bridgewater borough show that 1.3% or 2 of the total 148 families live below the poverty line. Families with no children have the highest poverty rate of 2.0%, comprising of 2 families. On the other hand, families with 1 or 2 children have the lowest poverty rate of 0.0%, which includes 0 families.
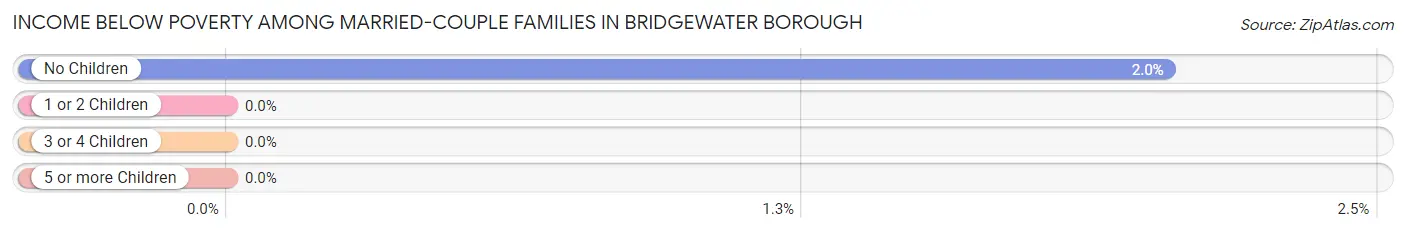
| Children | Above Poverty | Below Poverty |
| No Children | 96 (98.0%) | 2 (2.0%) |
| 1 or 2 Children | 44 (100.0%) | 0 (0.0%) |
| 3 or 4 Children | 4 (100.0%) | 0 (0.0%) |
| 5 or more Children | 2 (100.0%) | 0 (0.0%) |
| Total | 146 (98.7%) | 2 (1.3%) |
Income Below Poverty Among Single-Parent Households in Bridgewater borough
According to the poverty data in Bridgewater borough, 11.8% or 2 single-father households and 5.3% or 2 single-mother households are living below the poverty line. Among single-father households, those with 1 or 2 children have the highest poverty rate, with 2 households (33.3%) experiencing poverty. Likewise, among single-mother households, those with 5 or more children have the highest poverty rate, with 2 households (100.0%) falling below the poverty line.
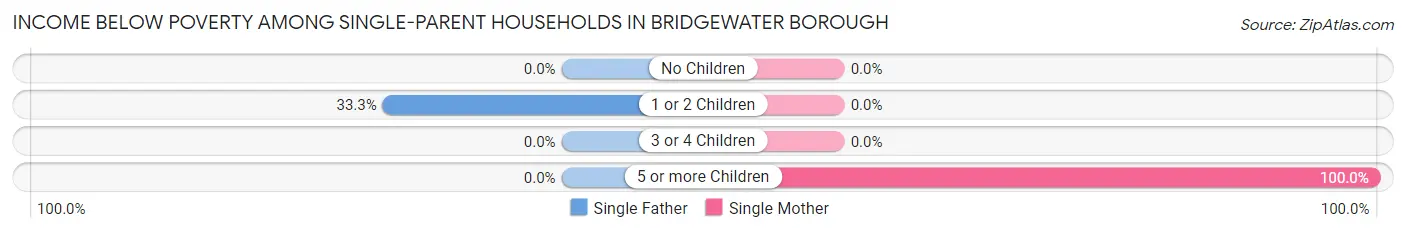
| Children | Single Father | Single Mother |
| No Children | 0 (0.0%) | 0 (0.0%) |
| 1 or 2 Children | 2 (33.3%) | 0 (0.0%) |
| 3 or 4 Children | 0 (0.0%) | 0 (0.0%) |
| 5 or more Children | 0 (0.0%) | 2 (100.0%) |
| Total | 2 (11.8%) | 2 (5.3%) |
Income Below Poverty Among Married-Couple vs Single-Parent Households in Bridgewater borough
The poverty data for Bridgewater borough shows that 2 of the married-couple family households (1.3%) and 4 of the single-parent households (7.3%) are living below the poverty level. Within the married-couple family households, those with no children have the highest poverty rate, with 2 households (2.0%) falling below the poverty line. Among the single-parent households, those with 5 or more children have the highest poverty rate, with 2 household (100.0%) living below poverty.
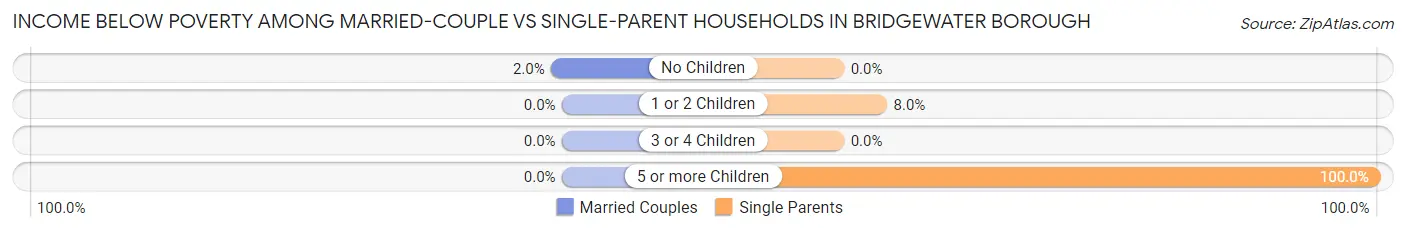
| Children | Married-Couple Families | Single-Parent Households |
| No Children | 2 (2.0%) | 0 (0.0%) |
| 1 or 2 Children | 0 (0.0%) | 2 (8.0%) |
| 3 or 4 Children | 0 (0.0%) | 0 (0.0%) |
| 5 or more Children | 0 (0.0%) | 2 (100.0%) |
| Total | 2 (1.3%) | 4 (7.3%) |
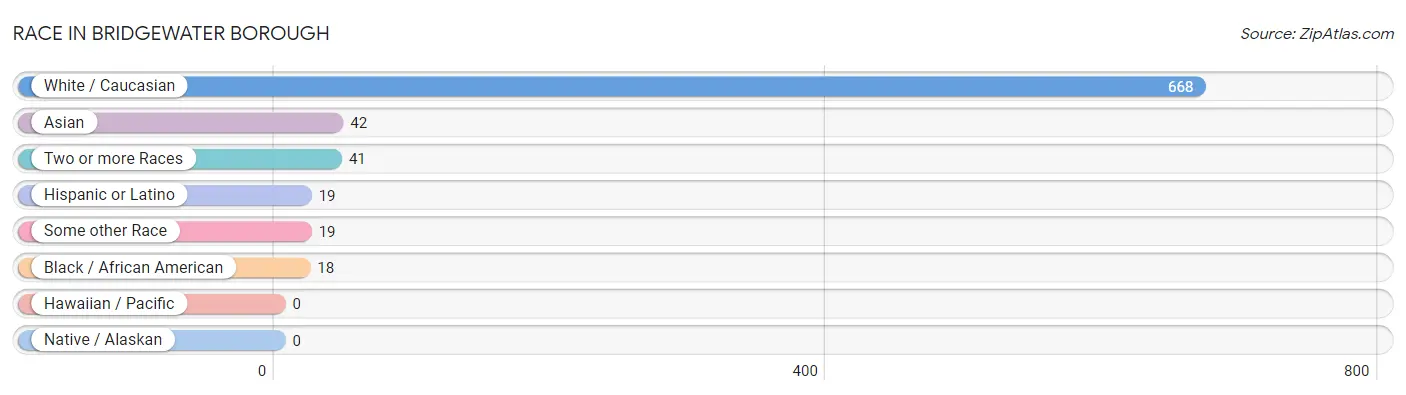
Race in Bridgewater borough
The most populous races in Bridgewater borough are White / Caucasian (668 | 84.8%), Asian (42 | 5.3%), and Two or more Races (41 | 5.2%).
| Race | # Population | % Population |
| Asian | 42 | 5.3% |
| Black / African American | 18 | 2.3% |
| Hawaiian / Pacific | 0 | 0.0% |
| Hispanic or Latino | 19 | 2.4% |
| Native / Alaskan | 0 | 0.0% |
| White / Caucasian | 668 | 84.8% |
| Two or more Races | 41 | 5.2% |
| Some other Race | 19 | 2.4% |
| Total | 788 | 100.0% |
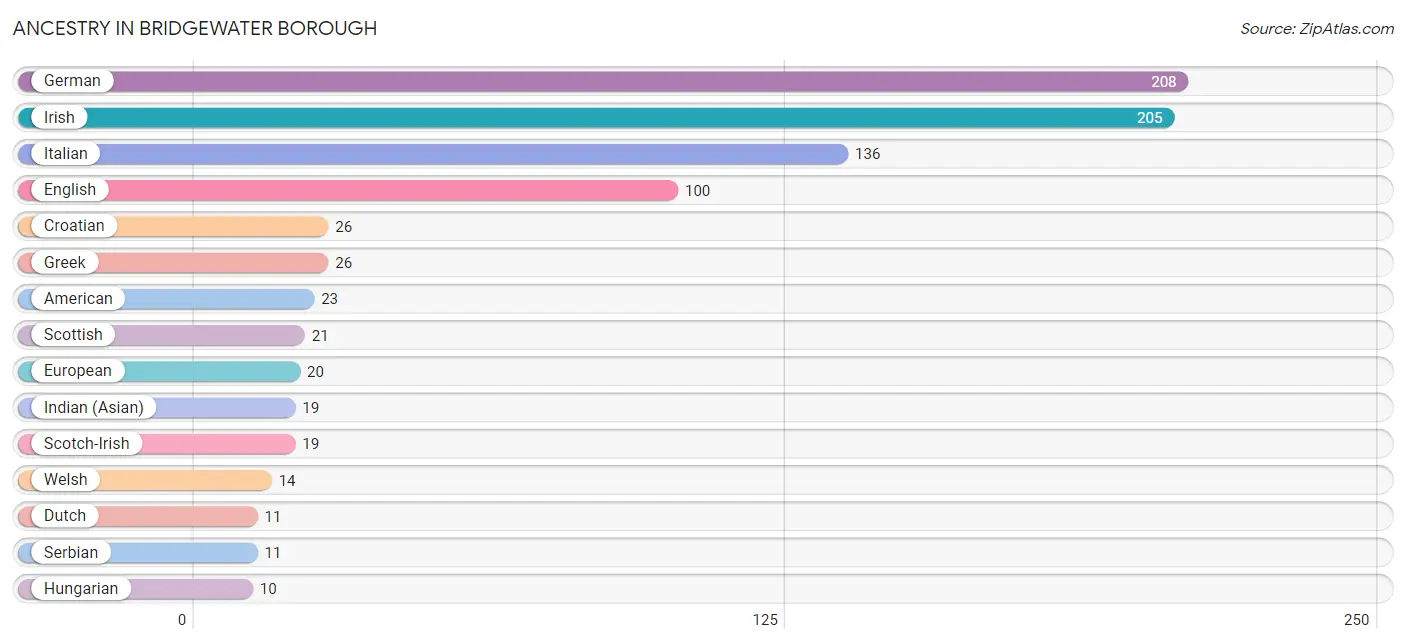
Ancestry in Bridgewater borough
The most populous ancestries reported in Bridgewater borough are German (208 | 26.4%), Irish (205 | 26.0%), Italian (136 | 17.3%), English (100 | 12.7%), and Croatian (26 | 3.3%), together accounting for 85.7% of all Bridgewater borough residents.
| Ancestry | # Population | % Population |
| American | 23 | 2.9% |
| Austrian | 3 | 0.4% |
| Brazilian | 2 | 0.3% |
| British | 2 | 0.3% |
| Cherokee | 2 | 0.3% |
| Croatian | 26 | 3.3% |
| Dutch | 11 | 1.4% |
| English | 100 | 12.7% |
| European | 20 | 2.5% |
| Finnish | 2 | 0.3% |
| French | 4 | 0.5% |
| French Canadian | 6 | 0.8% |
| German | 208 | 26.4% |
| Greek | 26 | 3.3% |
| Hungarian | 10 | 1.3% |
| Indian (Asian) | 19 | 2.4% |
| Irish | 205 | 26.0% |
| Italian | 136 | 17.3% |
| Lithuanian | 3 | 0.4% |
| Macedonian | 2 | 0.3% |
| Norwegian | 2 | 0.3% |
| Polish | 3 | 0.4% |
| Russian | 2 | 0.3% |
| Scotch-Irish | 19 | 2.4% |
| Scottish | 21 | 2.7% |
| Serbian | 11 | 1.4% |
| Slovak | 10 | 1.3% |
| South American | 7 | 0.9% |
| Swedish | 5 | 0.6% |
| Ukrainian | 6 | 0.8% |
| Venezuelan | 7 | 0.9% |
| Welsh | 14 | 1.8% | View All 32 Rows |
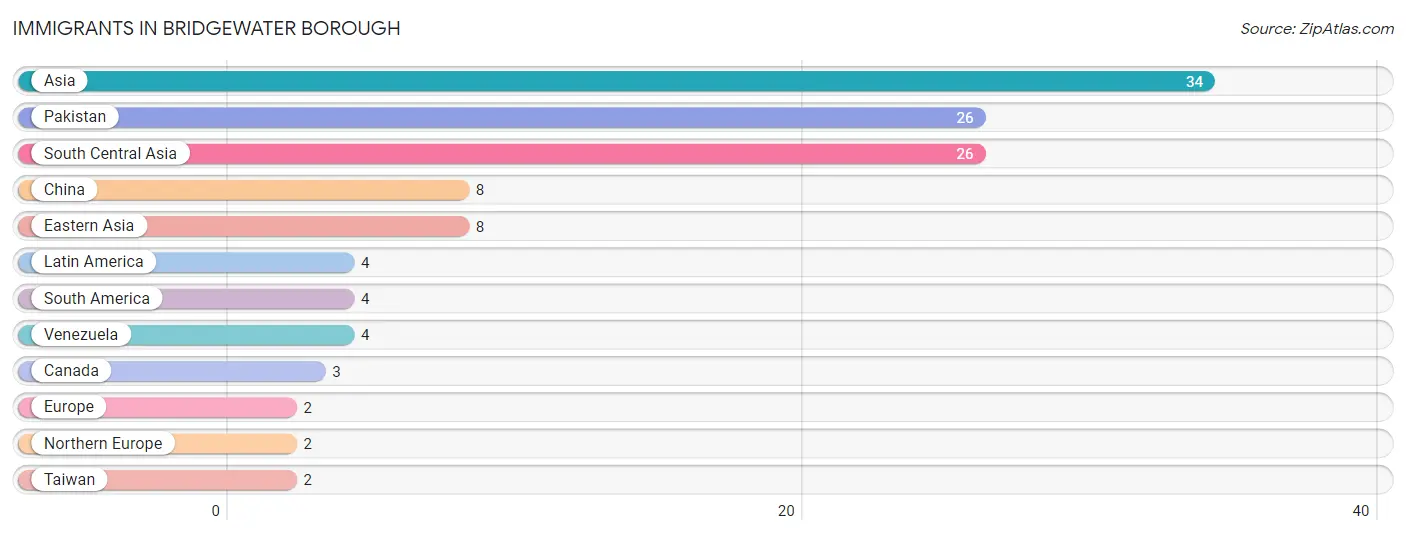
Immigrants in Bridgewater borough
The most numerous immigrant groups reported in Bridgewater borough came from Asia (34 | 4.3%), Pakistan (26 | 3.3%), South Central Asia (26 | 3.3%), China (8 | 1.0%), and Eastern Asia (8 | 1.0%), together accounting for 13.0% of all Bridgewater borough residents.
| Immigration Origin | # Population | % Population |
| Asia | 34 | 4.3% |
| Canada | 3 | 0.4% |
| China | 8 | 1.0% |
| Eastern Asia | 8 | 1.0% |
| Europe | 2 | 0.3% |
| Latin America | 4 | 0.5% |
| Northern Europe | 2 | 0.3% |
| Pakistan | 26 | 3.3% |
| South America | 4 | 0.5% |
| South Central Asia | 26 | 3.3% |
| Taiwan | 2 | 0.3% |
| Venezuela | 4 | 0.5% | View All 12 Rows |
Sex and Age in Bridgewater borough
Sex and Age in Bridgewater borough
The most populous age groups in Bridgewater borough are 40 to 44 Years (38 | 10.2%) for men and 50 to 54 Years (40 | 9.6%) for women.
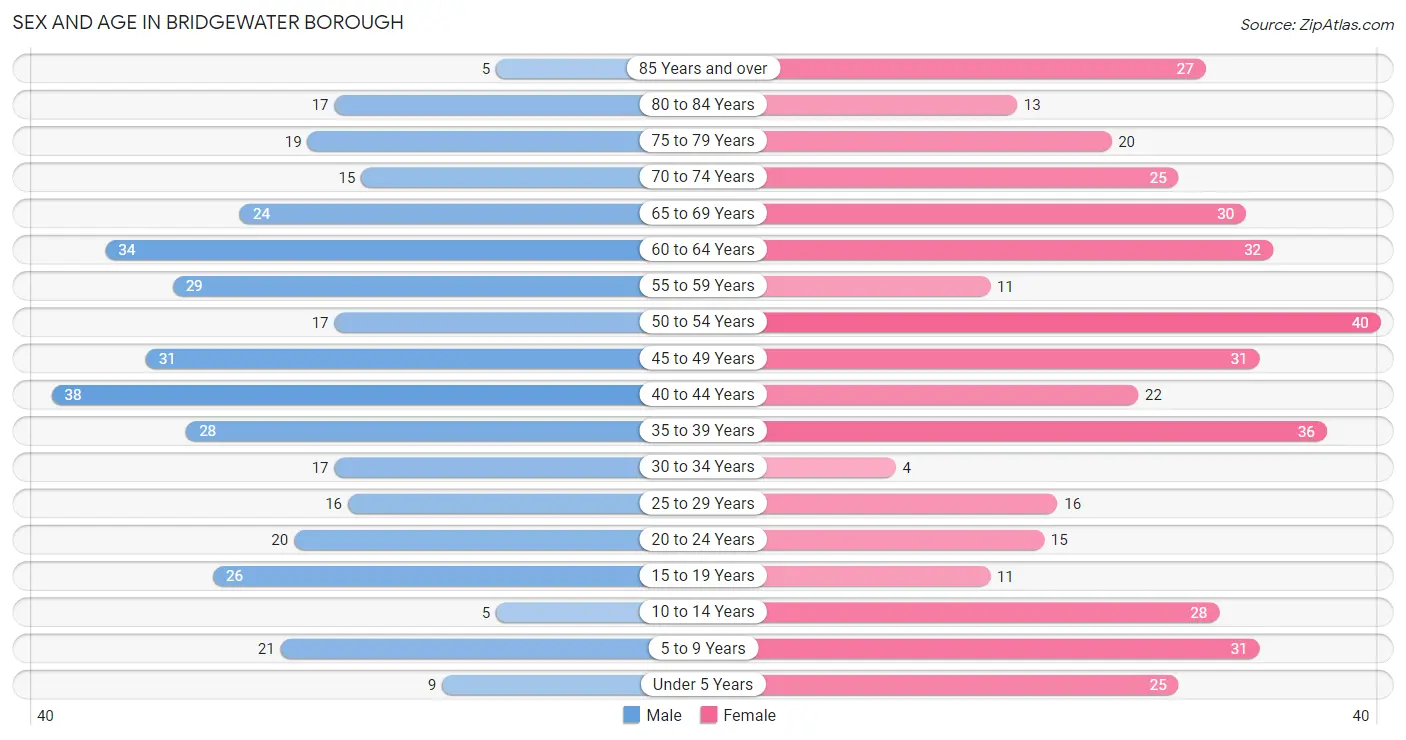
| Age Bracket | Male | Female |
| Under 5 Years | 9 (2.4%) | 25 (6.0%) |
| 5 to 9 Years | 21 (5.7%) | 31 (7.4%) |
| 10 to 14 Years | 5 (1.3%) | 28 (6.7%) |
| 15 to 19 Years | 26 (7.0%) | 11 (2.6%) |
| 20 to 24 Years | 20 (5.4%) | 15 (3.6%) |
| 25 to 29 Years | 16 (4.3%) | 16 (3.8%) |
| 30 to 34 Years | 17 (4.6%) | 4 (1.0%) |
| 35 to 39 Years | 28 (7.5%) | 36 (8.6%) |
| 40 to 44 Years | 38 (10.2%) | 22 (5.3%) |
| 45 to 49 Years | 31 (8.4%) | 31 (7.4%) |
| 50 to 54 Years | 17 (4.6%) | 40 (9.6%) |
| 55 to 59 Years | 29 (7.8%) | 11 (2.6%) |
| 60 to 64 Years | 34 (9.2%) | 32 (7.7%) |
| 65 to 69 Years | 24 (6.5%) | 30 (7.2%) |
| 70 to 74 Years | 15 (4.0%) | 25 (6.0%) |
| 75 to 79 Years | 19 (5.1%) | 20 (4.8%) |
| 80 to 84 Years | 17 (4.6%) | 13 (3.1%) |
| 85 Years and over | 5 (1.3%) | 27 (6.5%) |
| Total | 371 (100.0%) | 417 (100.0%) |
Families and Households in Bridgewater borough
Median Family Size in Bridgewater borough
The median family size in Bridgewater borough is 2.91 persons per family, with married-couple families (148 | 72.9%) accounting for the largest median family size of 3.02 persons per family. On the other hand, single female/mother families (38 | 18.7%) represent the smallest median family size with 2.50 persons per family.
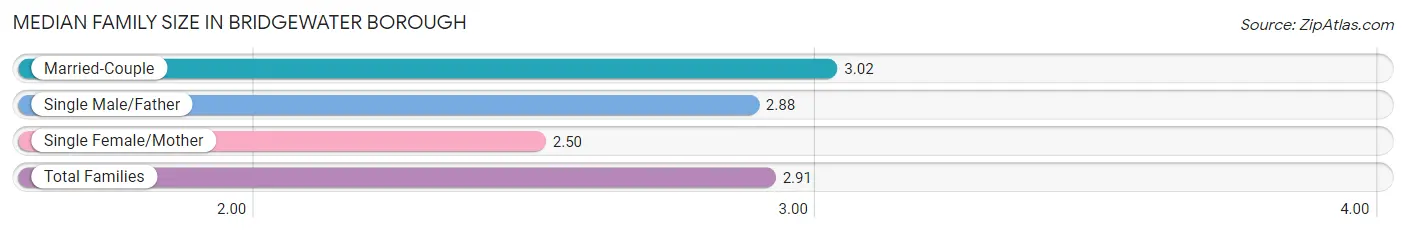
| Family Type | # Families | Family Size |
| Married-Couple | 148 (72.9%) | 3.02 |
| Single Male/Father | 17 (8.4%) | 2.88 |
| Single Female/Mother | 38 (18.7%) | 2.50 |
| Total Families | 203 (100.0%) | 2.91 |
Median Household Size in Bridgewater borough
The median household size in Bridgewater borough is 2.08 persons per household, with married-couple households (148 | 39.1%) accounting for the largest median household size of 3.04 persons per household. non-family households (176 | 46.4%) represent the smallest median household size with 1.05 persons per household.
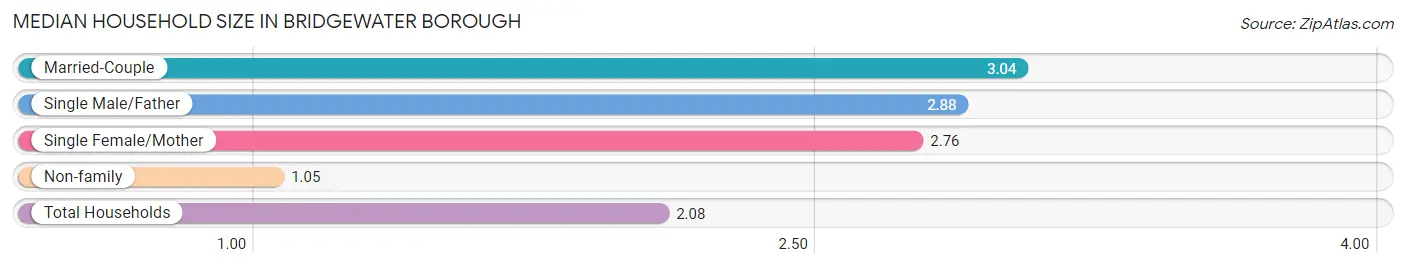
| Household Type | # Households | Household Size |
| Married-Couple | 148 (39.1%) | 3.04 |
| Single Male/Father | 17 (4.5%) | 2.88 |
| Single Female/Mother | 38 (10.0%) | 2.76 |
| Non-family | 176 (46.4%) | 1.05 |
| Total Households | 379 (100.0%) | 2.08 |
Household Size by Marriage Status in Bridgewater borough
Out of a total of 379 households in Bridgewater borough, 203 (53.6%) are family households, while 176 (46.4%) are nonfamily households. The most numerous type of family households are 2-person households, comprising 104, and the most common type of nonfamily households are 1-person households, comprising 169.
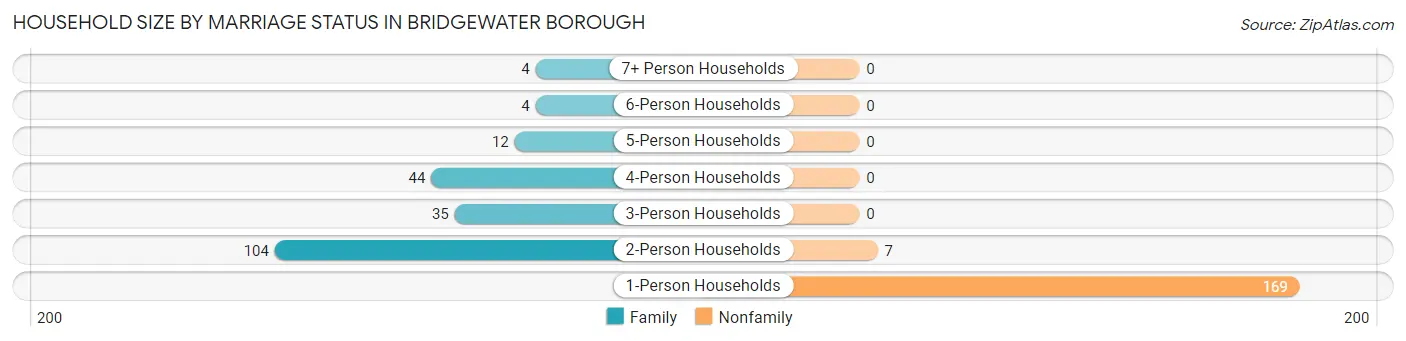
| Household Size | Family Households | Nonfamily Households |
| 1-Person Households | - | 169 (44.6%) |
| 2-Person Households | 104 (27.4%) | 7 (1.8%) |
| 3-Person Households | 35 (9.2%) | 0 (0.0%) |
| 4-Person Households | 44 (11.6%) | 0 (0.0%) |
| 5-Person Households | 12 (3.2%) | 0 (0.0%) |
| 6-Person Households | 4 (1.1%) | 0 (0.0%) |
| 7+ Person Households | 4 (1.1%) | 0 (0.0%) |
| Total | 203 (53.6%) | 176 (46.4%) |
Female Fertility in Bridgewater borough
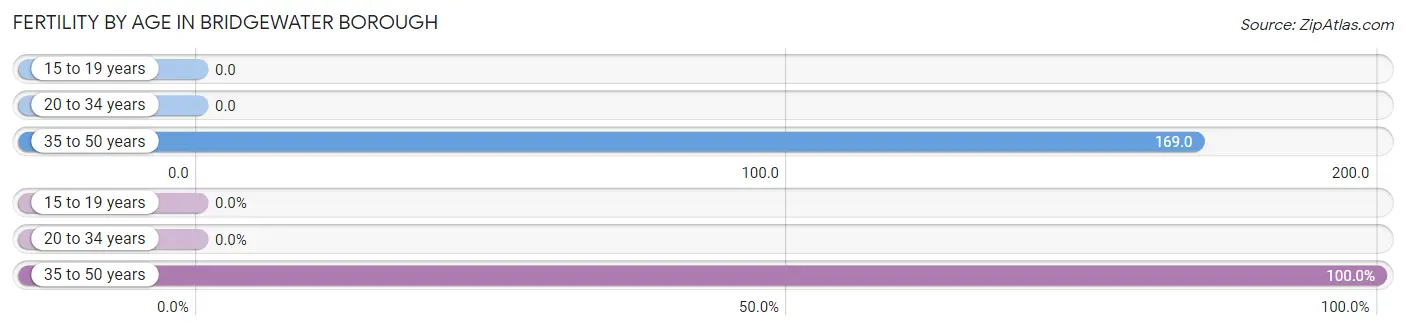
Fertility by Age in Bridgewater borough
Average fertility rate in Bridgewater borough is 111.0 births per 1,000 women. Women in the age bracket of 35 to 50 years have the highest fertility rate with 169.0 births per 1,000 women. Women in the age bracket of 35 to 50 years acount for 100.0% of all women with births.
| Age Bracket | Women with Births | Births / 1,000 Women |
| 15 to 19 years | 0 (0.0%) | 0.0 |
| 20 to 34 years | 0 (0.0%) | 0.0 |
| 35 to 50 years | 15 (100.0%) | 169.0 |
| Total | 15 (100.0%) | 111.0 |
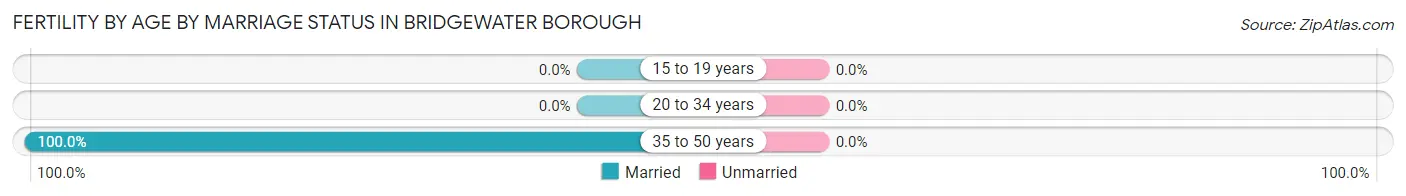
Fertility by Age by Marriage Status in Bridgewater borough
| Age Bracket | Married | Unmarried |
| 15 to 19 years | 0 (0.0%) | 0 (0.0%) |
| 20 to 34 years | 0 (0.0%) | 0 (0.0%) |
| 35 to 50 years | 15 (100.0%) | 0 (0.0%) |
| Total | 15 (100.0%) | 0 (0.0%) |
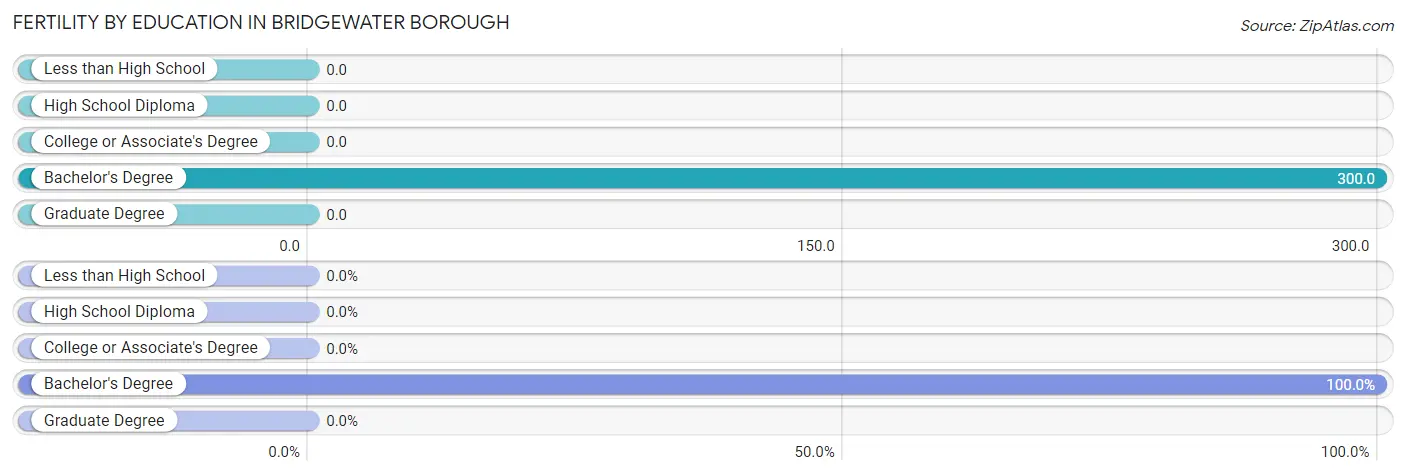
Fertility by Education in Bridgewater borough
| Educational Attainment | Women with Births | Births / 1,000 Women |
| Less than High School | 0 (0.0%) | 0.0 |
| High School Diploma | 0 (0.0%) | 0.0 |
| College or Associate's Degree | 0 (0.0%) | 0.0 |
| Bachelor's Degree | 15 (100.0%) | 300.0 |
| Graduate Degree | 0 (0.0%) | 0.0 |
| Total | 15 (100.0%) | 111.0 |
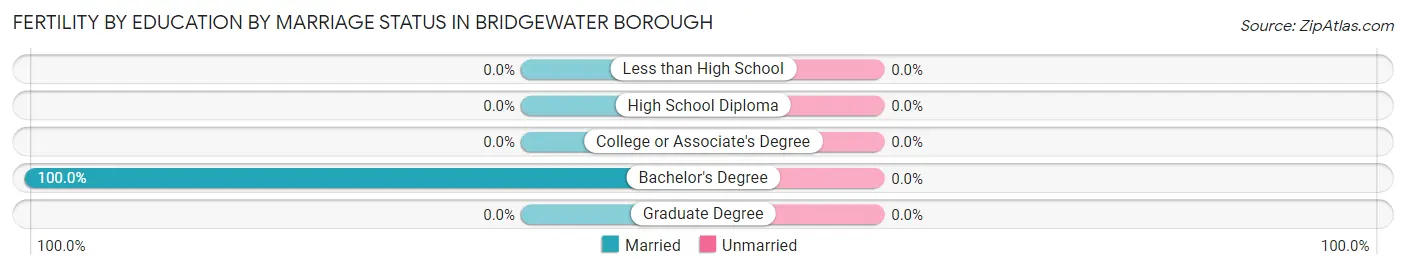
Fertility by Education by Marriage Status in Bridgewater borough
| Educational Attainment | Married | Unmarried |
| Less than High School | 0 (0.0%) | 0 (0.0%) |
| High School Diploma | 0 (0.0%) | 0 (0.0%) |
| College or Associate's Degree | 0 (0.0%) | 0 (0.0%) |
| Bachelor's Degree | 15 (100.0%) | 0 (0.0%) |
| Graduate Degree | 0 (0.0%) | 0 (0.0%) |
| Total | 15 (100.0%) | 0 (0.0%) |
Employment Characteristics in Bridgewater borough
Employment by Class of Employer in Bridgewater borough
Among the 355 employed individuals in Bridgewater borough, private company employees (238 | 67.0%), self-employed (incorporated) (39 | 11.0%), and not-for-profit organizations (34 | 9.6%) make up the most common classes of employment.
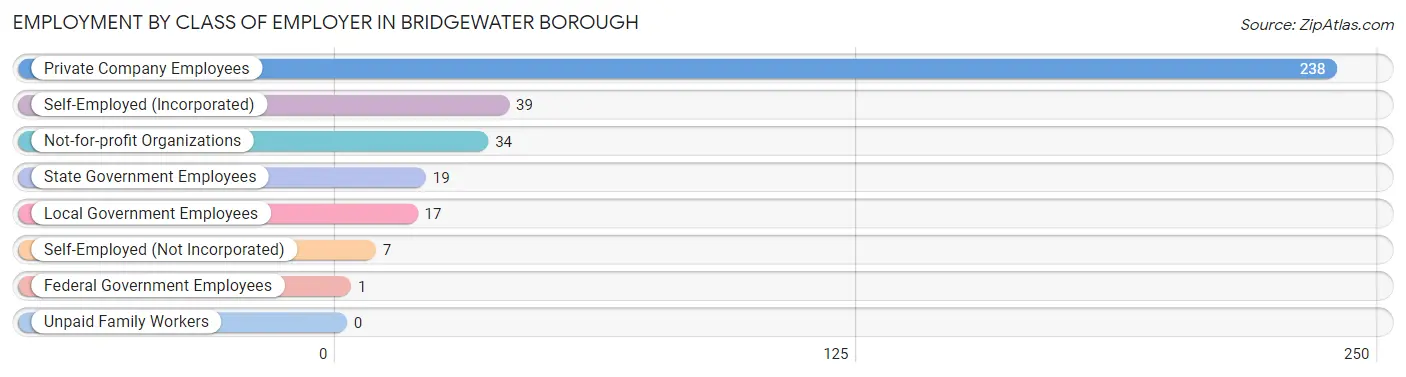
| Employer Class | # Employees | % Employees |
| Private Company Employees | 238 | 67.0% |
| Self-Employed (Incorporated) | 39 | 11.0% |
| Self-Employed (Not Incorporated) | 7 | 2.0% |
| Not-for-profit Organizations | 34 | 9.6% |
| Local Government Employees | 17 | 4.8% |
| State Government Employees | 19 | 5.3% |
| Federal Government Employees | 1 | 0.3% |
| Unpaid Family Workers | 0 | 0.0% |
| Total | 355 | 100.0% |
Employment Status by Age in Bridgewater borough
According to the labor force statistics for Bridgewater borough, out of the total population over 16 years of age (663), 64.7% or 429 individuals are in the labor force, with 5.4% or 23 of them unemployed. The age group with the highest labor force participation rate is 20 to 24 years, with 100.0% or 35 individuals in the labor force. Within the labor force, the 30 to 34 years age range has the highest percentage of unemployed individuals, with 26.3% or 5 of them being unemployed.
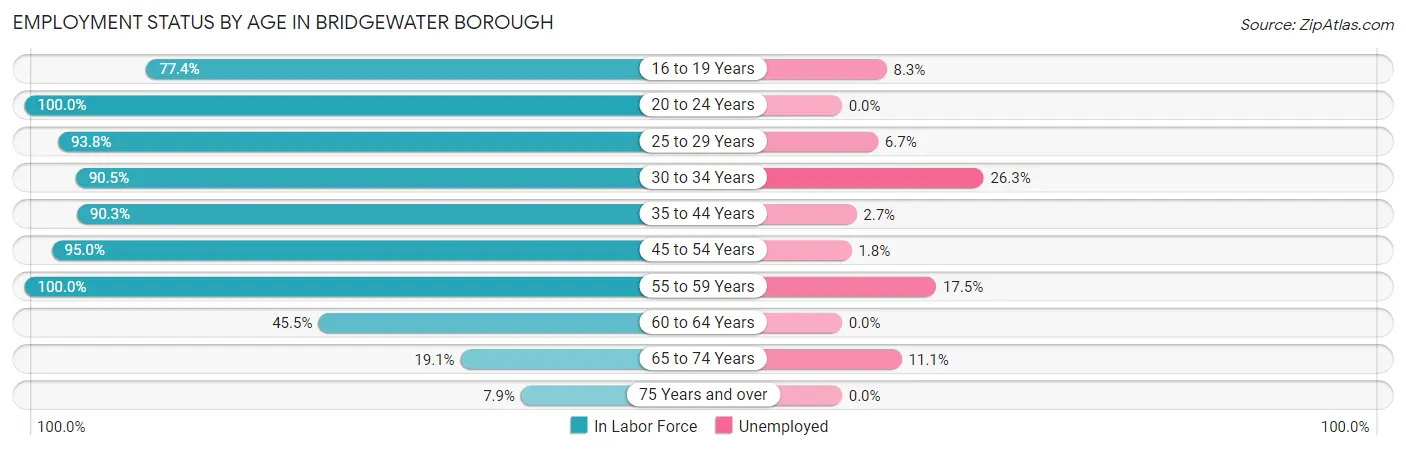
| Age Bracket | In Labor Force | Unemployed |
| 16 to 19 Years | 24 (77.4%) | 2 (8.3%) |
| 20 to 24 Years | 35 (100.0%) | 0 (0.0%) |
| 25 to 29 Years | 30 (93.8%) | 2 (6.7%) |
| 30 to 34 Years | 19 (90.5%) | 5 (26.3%) |
| 35 to 44 Years | 112 (90.3%) | 3 (2.7%) |
| 45 to 54 Years | 113 (95.0%) | 2 (1.8%) |
| 55 to 59 Years | 40 (100.0%) | 7 (17.5%) |
| 60 to 64 Years | 30 (45.5%) | 0 (0.0%) |
| 65 to 74 Years | 18 (19.1%) | 2 (11.1%) |
| 75 Years and over | 8 (7.9%) | 0 (0.0%) |
| Total | 429 (64.7%) | 23 (5.4%) |
Employment Status by Educational Attainment in Bridgewater borough
According to labor force statistics for Bridgewater borough, 85.6% of individuals (344) out of the total population between 25 and 64 years of age (402) are in the labor force, with 5.5% or 19 of them being unemployed. The group with the highest labor force participation rate are those with the educational attainment of less than high school, with 92.3% or 12 individuals in the labor force. Within the labor force, individuals with less than high school education have the highest percentage of unemployment, with 16.7% or 2 of them being unemployed.
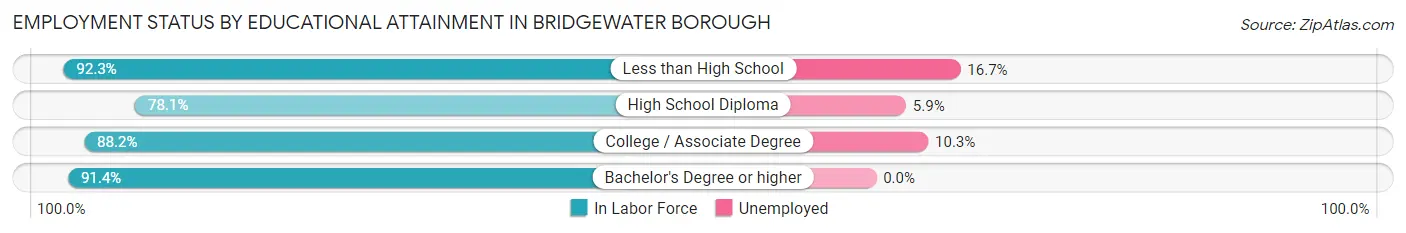
| Educational Attainment | In Labor Force | Unemployed |
| Less than High School | 12 (92.3%) | 2 (16.7%) |
| High School Diploma | 118 (78.1%) | 9 (5.9%) |
| College / Associate Degree | 97 (88.2%) | 11 (10.3%) |
| Bachelor's Degree or higher | 117 (91.4%) | 0 (0.0%) |
| Total | 344 (85.6%) | 22 (5.5%) |
Employment Occupations by Sex in Bridgewater borough
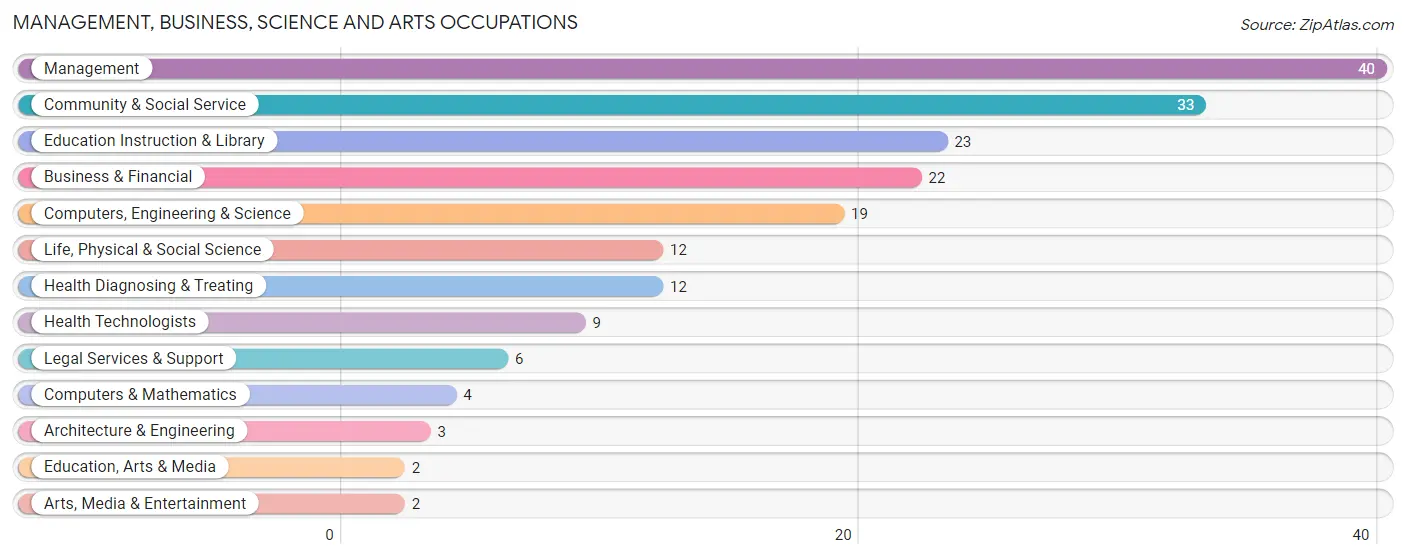
Management, Business, Science and Arts Occupations
The most common Management, Business, Science and Arts occupations in Bridgewater borough are Management (40 | 9.9%), Community & Social Service (33 | 8.1%), Education Instruction & Library (23 | 5.7%), Business & Financial (22 | 5.4%), and Computers, Engineering & Science (19 | 4.7%).
Management, Business, Science and Arts Occupations by Sex
Within the Management, Business, Science and Arts occupations in Bridgewater borough, the most male-oriented occupations are Computers & Mathematics (100.0%), Architecture & Engineering (100.0%), and Legal Services & Support (66.7%), while the most female-oriented occupations are Education, Arts & Media (100.0%), Arts, Media & Entertainment (100.0%), and Business & Financial (90.9%).
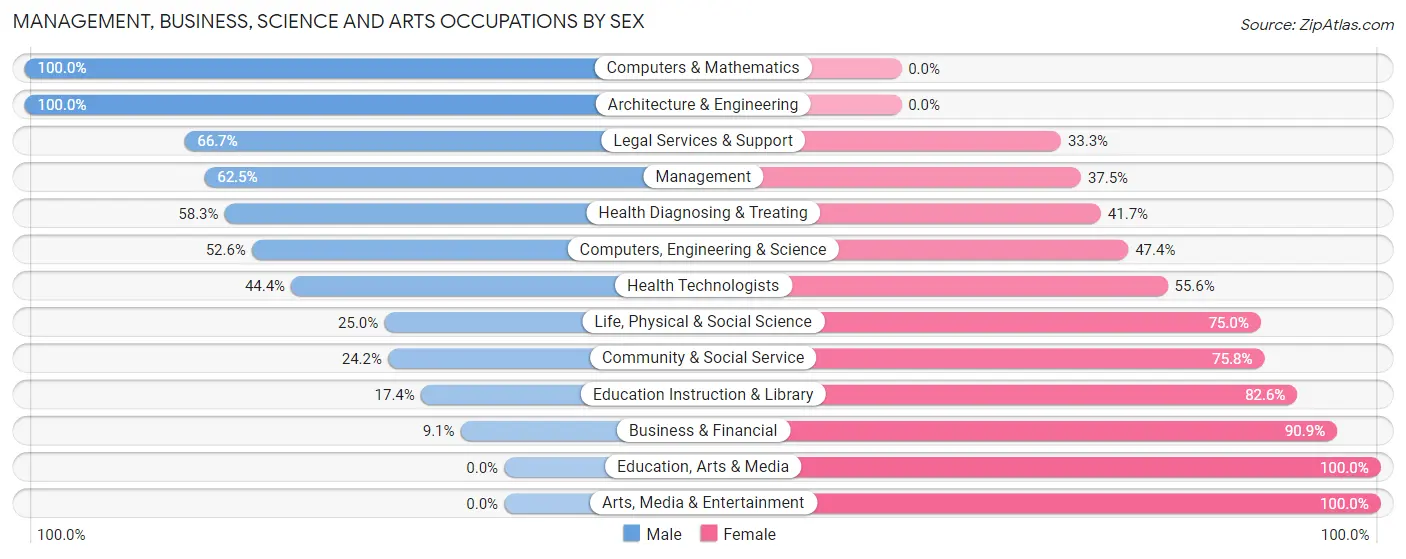
| Occupation | Male | Female |
| Management | 25 (62.5%) | 15 (37.5%) |
| Business & Financial | 2 (9.1%) | 20 (90.9%) |
| Computers, Engineering & Science | 10 (52.6%) | 9 (47.4%) |
| Computers & Mathematics | 4 (100.0%) | 0 (0.0%) |
| Architecture & Engineering | 3 (100.0%) | 0 (0.0%) |
| Life, Physical & Social Science | 3 (25.0%) | 9 (75.0%) |
| Community & Social Service | 8 (24.2%) | 25 (75.8%) |
| Education, Arts & Media | 0 (0.0%) | 2 (100.0%) |
| Legal Services & Support | 4 (66.7%) | 2 (33.3%) |
| Education Instruction & Library | 4 (17.4%) | 19 (82.6%) |
| Arts, Media & Entertainment | 0 (0.0%) | 2 (100.0%) |
| Health Diagnosing & Treating | 7 (58.3%) | 5 (41.7%) |
| Health Technologists | 4 (44.4%) | 5 (55.6%) |
| Total (Category) | 52 (41.3%) | 74 (58.7%) |
| Total (Overall) | 217 (53.4%) | 189 (46.6%) |
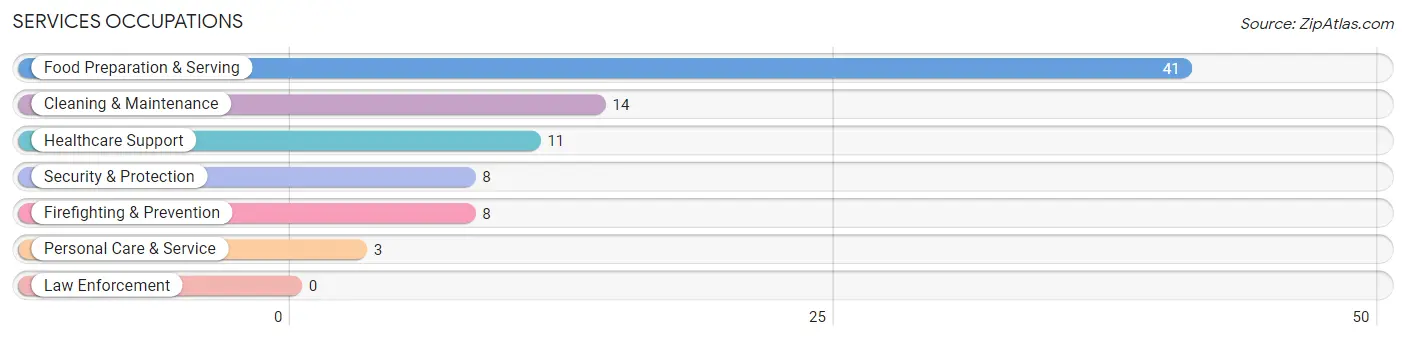
Services Occupations
The most common Services occupations in Bridgewater borough are Food Preparation & Serving (41 | 10.1%), Cleaning & Maintenance (14 | 3.5%), Healthcare Support (11 | 2.7%), Security & Protection (8 | 2.0%), and Firefighting & Prevention (8 | 2.0%).
Services Occupations by Sex
Within the Services occupations in Bridgewater borough, the most male-oriented occupations are Cleaning & Maintenance (78.6%), Security & Protection (62.5%), and Firefighting & Prevention (62.5%), while the most female-oriented occupations are Healthcare Support (100.0%), Personal Care & Service (100.0%), and Food Preparation & Serving (51.2%).
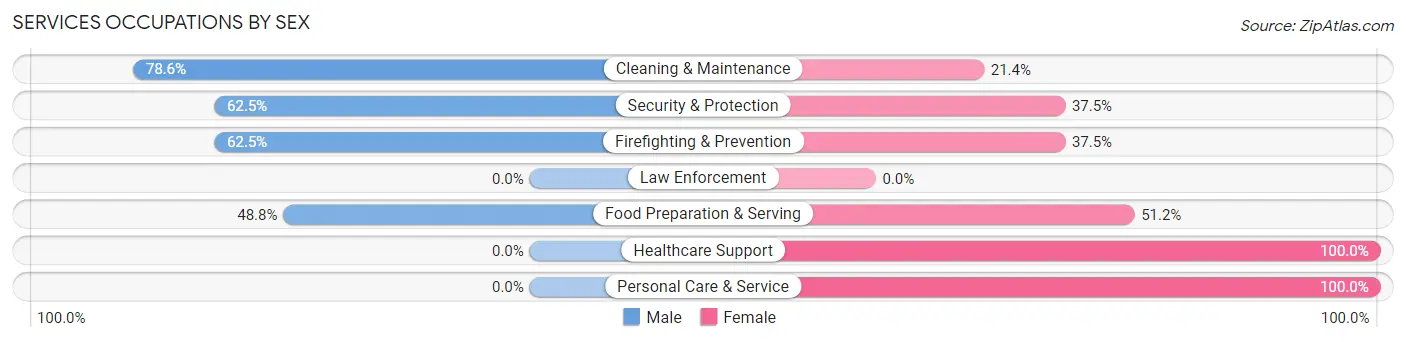
| Occupation | Male | Female |
| Healthcare Support | 0 (0.0%) | 11 (100.0%) |
| Security & Protection | 5 (62.5%) | 3 (37.5%) |
| Firefighting & Prevention | 5 (62.5%) | 3 (37.5%) |
| Law Enforcement | 0 (0.0%) | 0 (0.0%) |
| Food Preparation & Serving | 20 (48.8%) | 21 (51.2%) |
| Cleaning & Maintenance | 11 (78.6%) | 3 (21.4%) |
| Personal Care & Service | 0 (0.0%) | 3 (100.0%) |
| Total (Category) | 36 (46.8%) | 41 (53.2%) |
| Total (Overall) | 217 (53.4%) | 189 (46.6%) |
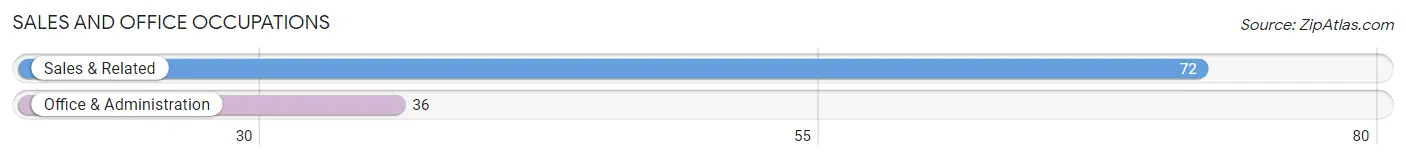
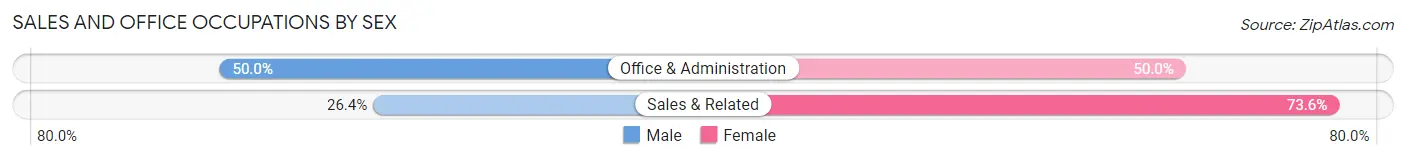
Sales and Office Occupations
The most common Sales and Office occupations in Bridgewater borough are Sales & Related (72 | 17.7%), and Office & Administration (36 | 8.9%).
Sales and Office Occupations by Sex
| Occupation | Male | Female |
| Sales & Related | 19 (26.4%) | 53 (73.6%) |
| Office & Administration | 18 (50.0%) | 18 (50.0%) |
| Total (Category) | 37 (34.3%) | 71 (65.7%) |
| Total (Overall) | 217 (53.4%) | 189 (46.6%) |
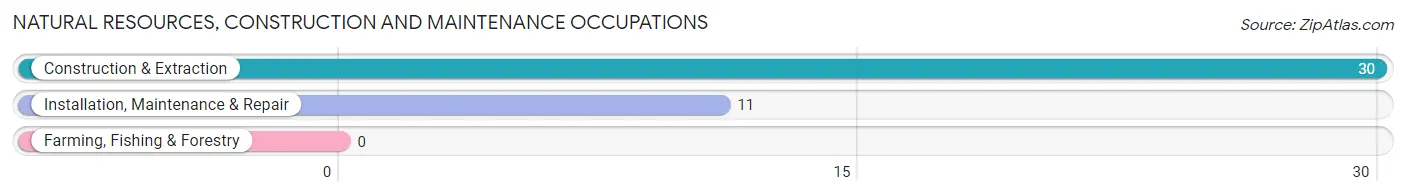
Natural Resources, Construction and Maintenance Occupations
The most common Natural Resources, Construction and Maintenance occupations in Bridgewater borough are Construction & Extraction (30 | 7.4%), and Installation, Maintenance & Repair (11 | 2.7%).
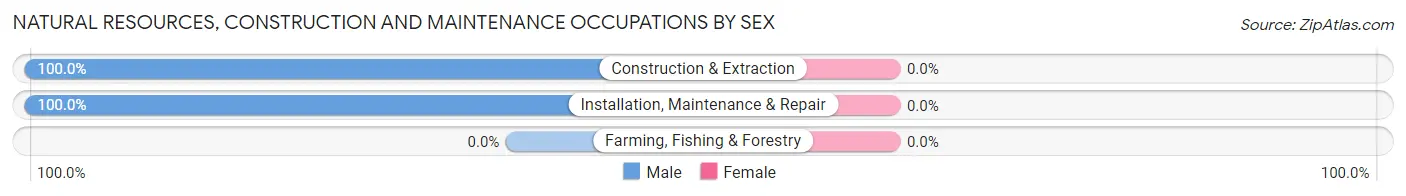
Natural Resources, Construction and Maintenance Occupations by Sex
| Occupation | Male | Female |
| Farming, Fishing & Forestry | 0 (0.0%) | 0 (0.0%) |
| Construction & Extraction | 30 (100.0%) | 0 (0.0%) |
| Installation, Maintenance & Repair | 11 (100.0%) | 0 (0.0%) |
| Total (Category) | 41 (100.0%) | 0 (0.0%) |
| Total (Overall) | 217 (53.4%) | 189 (46.6%) |
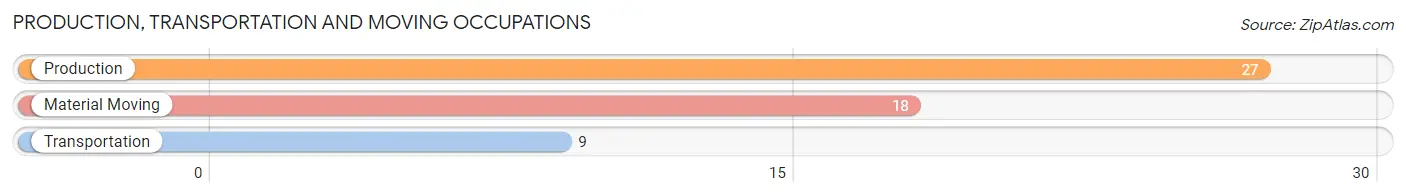
Production, Transportation and Moving Occupations
The most common Production, Transportation and Moving occupations in Bridgewater borough are Production (27 | 6.7%), Material Moving (18 | 4.4%), and Transportation (9 | 2.2%).
Production, Transportation and Moving Occupations by Sex
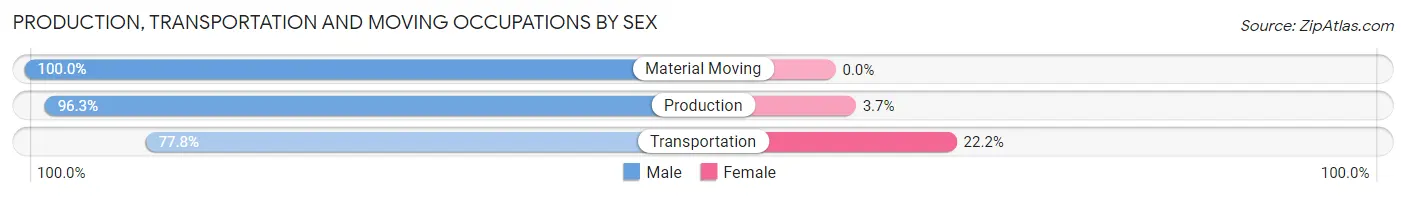
| Occupation | Male | Female |
| Production | 26 (96.3%) | 1 (3.7%) |
| Transportation | 7 (77.8%) | 2 (22.2%) |
| Material Moving | 18 (100.0%) | 0 (0.0%) |
| Total (Category) | 51 (94.4%) | 3 (5.6%) |
| Total (Overall) | 217 (53.4%) | 189 (46.6%) |
Employment Industries by Sex in Bridgewater borough
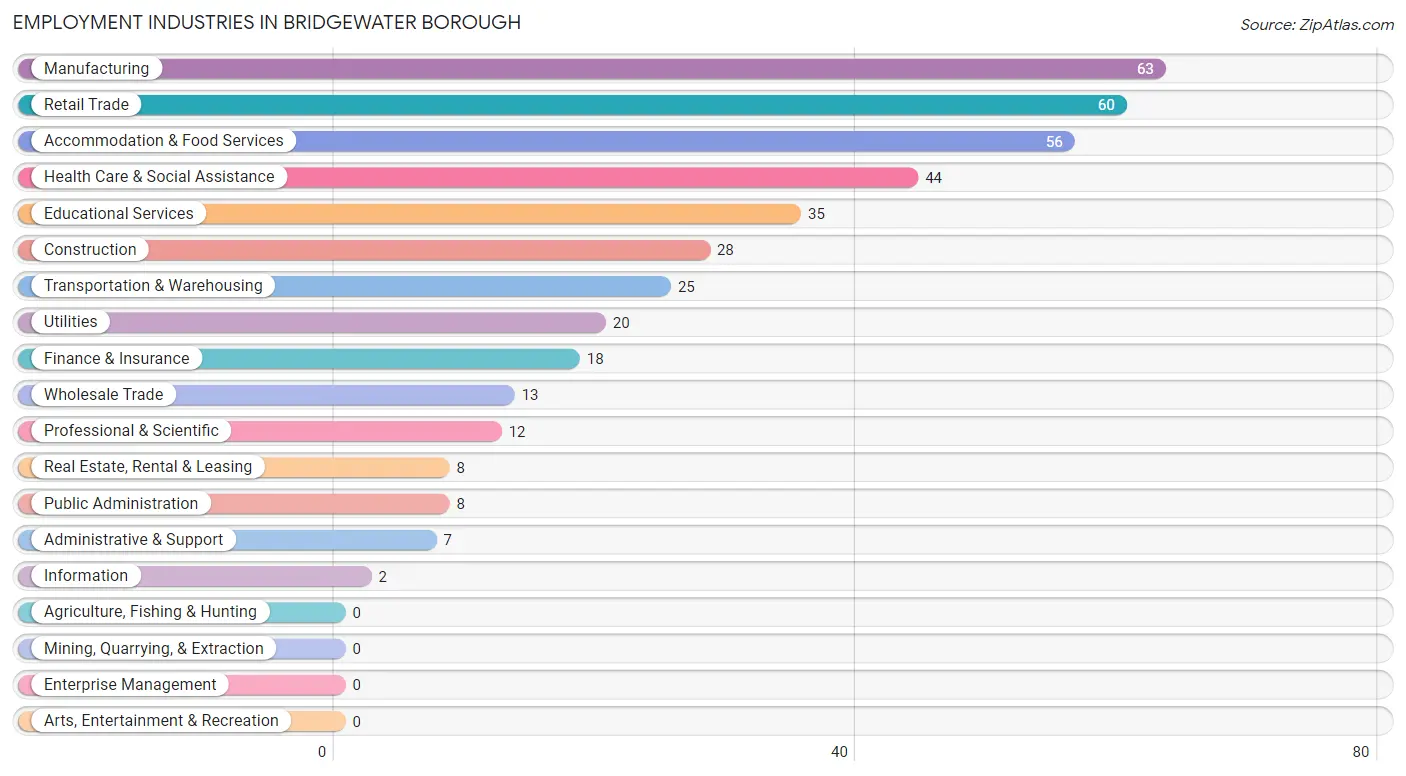
Employment Industries in Bridgewater borough
The major employment industries in Bridgewater borough include Manufacturing (63 | 15.5%), Retail Trade (60 | 14.8%), Accommodation & Food Services (56 | 13.8%), Health Care & Social Assistance (44 | 10.8%), and Educational Services (35 | 8.6%).
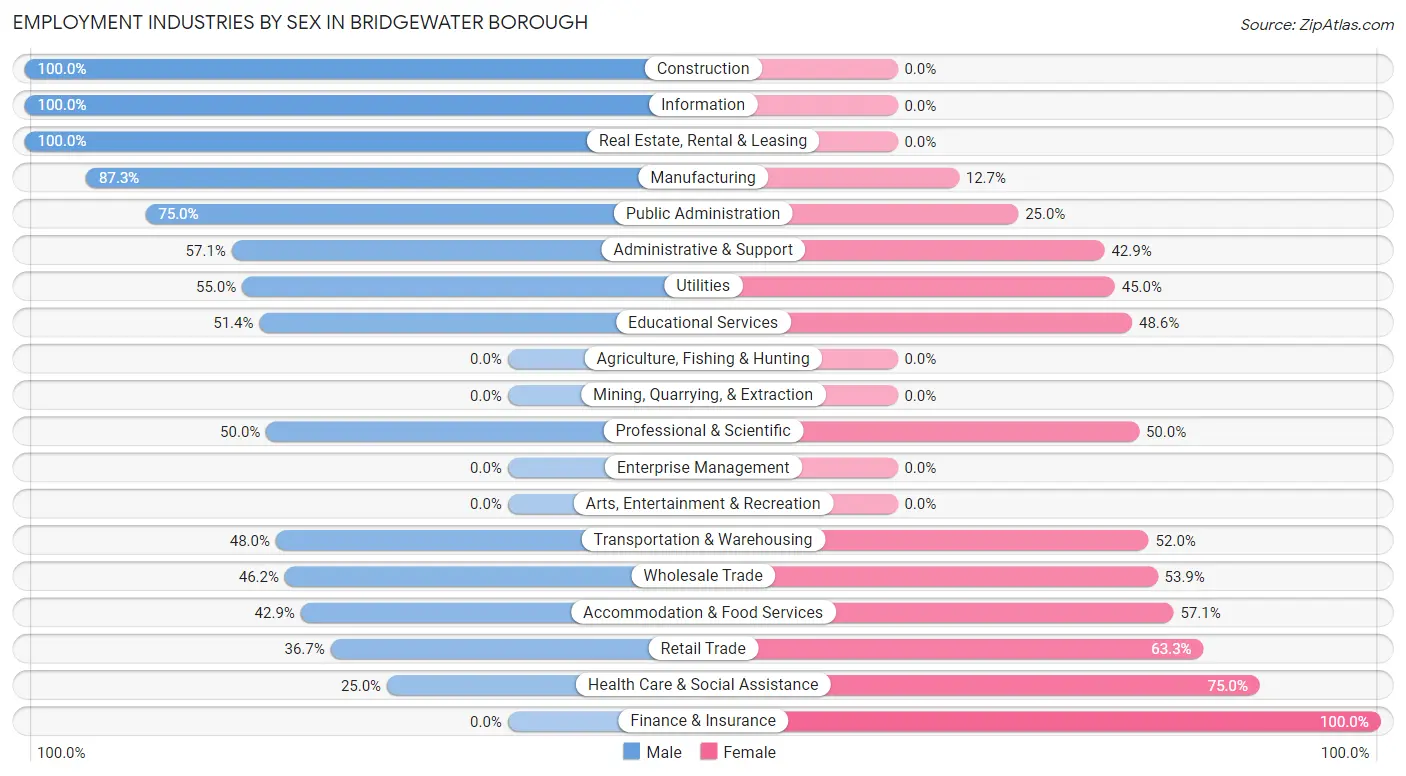
Employment Industries by Sex in Bridgewater borough
The Bridgewater borough industries that see more men than women are Construction (100.0%), Information (100.0%), and Real Estate, Rental & Leasing (100.0%), whereas the industries that tend to have a higher number of women are Finance & Insurance (100.0%), Health Care & Social Assistance (75.0%), and Retail Trade (63.3%).
| Industry | Male | Female |
| Agriculture, Fishing & Hunting | 0 (0.0%) | 0 (0.0%) |
| Mining, Quarrying, & Extraction | 0 (0.0%) | 0 (0.0%) |
| Construction | 28 (100.0%) | 0 (0.0%) |
| Manufacturing | 55 (87.3%) | 8 (12.7%) |
| Wholesale Trade | 6 (46.2%) | 7 (53.8%) |
| Retail Trade | 22 (36.7%) | 38 (63.3%) |
| Transportation & Warehousing | 12 (48.0%) | 13 (52.0%) |
| Utilities | 11 (55.0%) | 9 (45.0%) |
| Information | 2 (100.0%) | 0 (0.0%) |
| Finance & Insurance | 0 (0.0%) | 18 (100.0%) |
| Real Estate, Rental & Leasing | 8 (100.0%) | 0 (0.0%) |
| Professional & Scientific | 6 (50.0%) | 6 (50.0%) |
| Enterprise Management | 0 (0.0%) | 0 (0.0%) |
| Administrative & Support | 4 (57.1%) | 3 (42.9%) |
| Educational Services | 18 (51.4%) | 17 (48.6%) |
| Health Care & Social Assistance | 11 (25.0%) | 33 (75.0%) |
| Arts, Entertainment & Recreation | 0 (0.0%) | 0 (0.0%) |
| Accommodation & Food Services | 24 (42.9%) | 32 (57.1%) |
| Public Administration | 6 (75.0%) | 2 (25.0%) |
| Total | 217 (53.4%) | 189 (46.6%) |
Education in Bridgewater borough
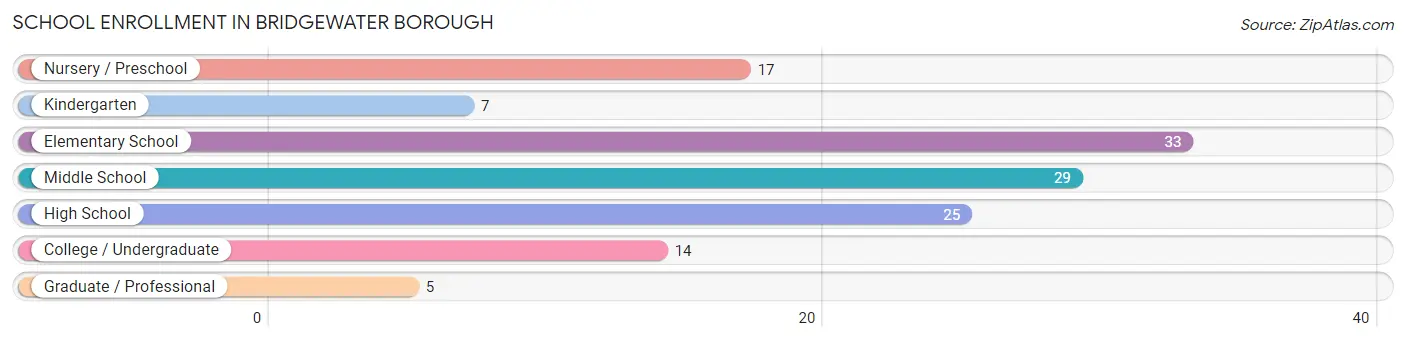
School Enrollment in Bridgewater borough
The most common levels of schooling among the 130 students in Bridgewater borough are elementary school (33 | 25.4%), middle school (29 | 22.3%), and high school (25 | 19.2%).
| School Level | # Students | % Students |
| Nursery / Preschool | 17 | 13.1% |
| Kindergarten | 7 | 5.4% |
| Elementary School | 33 | 25.4% |
| Middle School | 29 | 22.3% |
| High School | 25 | 19.2% |
| College / Undergraduate | 14 | 10.8% |
| Graduate / Professional | 5 | 3.8% |
| Total | 130 | 100.0% |
School Enrollment by Age by Funding Source in Bridgewater borough
Out of a total of 130 students who are enrolled in schools in Bridgewater borough, 3 (2.3%) attend a private institution, while the remaining 127 (97.7%) are enrolled in public schools. The age group of 3 to 4 year olds has the highest likelihood of being enrolled in private schools, with 2 (50.0% in the age bracket) enrolled. Conversely, the age group of 10 to 14 year olds has the lowest likelihood of being enrolled in a private school, with 30 (100.0% in the age bracket) attending a public institution.
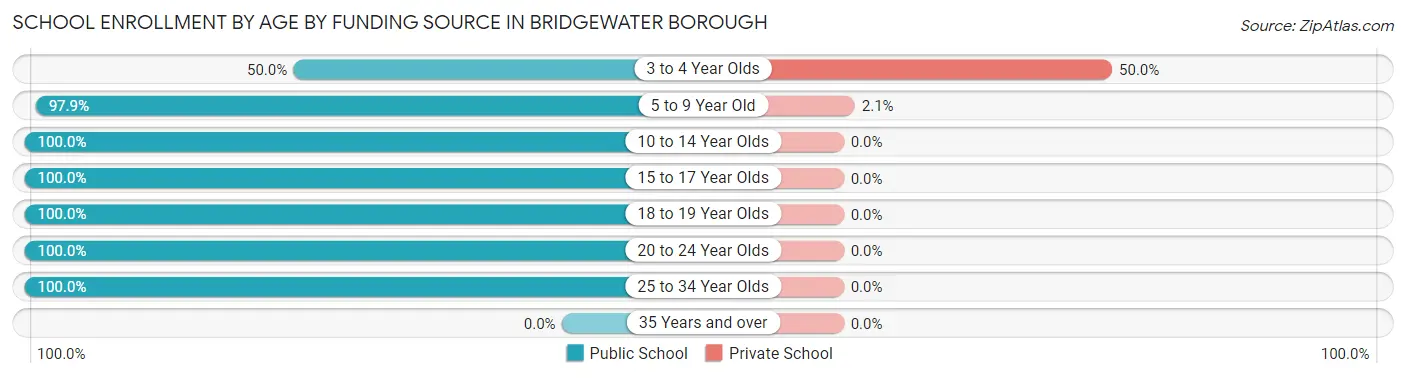
| Age Bracket | Public School | Private School |
| 3 to 4 Year Olds | 2 (50.0%) | 2 (50.0%) |
| 5 to 9 Year Old | 47 (97.9%) | 1 (2.1%) |
| 10 to 14 Year Olds | 30 (100.0%) | 0 (0.0%) |
| 15 to 17 Year Olds | 26 (100.0%) | 0 (0.0%) |
| 18 to 19 Year Olds | 3 (100.0%) | 0 (0.0%) |
| 20 to 24 Year Olds | 16 (100.0%) | 0 (0.0%) |
| 25 to 34 Year Olds | 3 (100.0%) | 0 (0.0%) |
| 35 Years and over | 0 (0.0%) | 0 (0.0%) |
| Total | 127 (97.7%) | 3 (2.3%) |
Educational Attainment by Field of Study in Bridgewater borough
Education (37 | 21.0%), business (24 | 13.6%), social sciences (21 | 11.9%), computers & mathematics (19 | 10.8%), and communications (16 | 9.1%) are the most common fields of study among 176 individuals in Bridgewater borough who have obtained a bachelor's degree or higher.
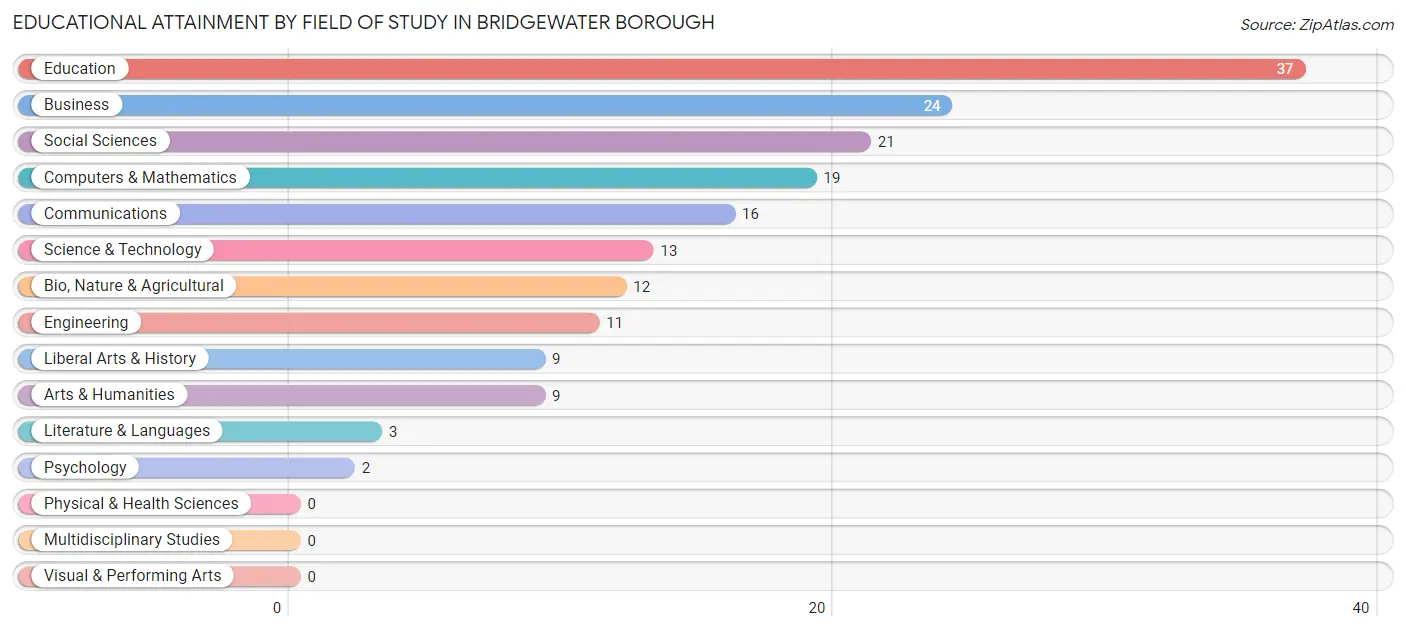
| Field of Study | # Graduates | % Graduates |
| Computers & Mathematics | 19 | 10.8% |
| Bio, Nature & Agricultural | 12 | 6.8% |
| Physical & Health Sciences | 0 | 0.0% |
| Psychology | 2 | 1.1% |
| Social Sciences | 21 | 11.9% |
| Engineering | 11 | 6.2% |
| Multidisciplinary Studies | 0 | 0.0% |
| Science & Technology | 13 | 7.4% |
| Business | 24 | 13.6% |
| Education | 37 | 21.0% |
| Literature & Languages | 3 | 1.7% |
| Liberal Arts & History | 9 | 5.1% |
| Visual & Performing Arts | 0 | 0.0% |
| Communications | 16 | 9.1% |
| Arts & Humanities | 9 | 5.1% |
| Total | 176 | 100.0% |
Transportation & Commute in Bridgewater borough
Vehicle Availability by Sex in Bridgewater borough
The most prevalent vehicle ownership categories in Bridgewater borough are males with 1 vehicle (52, accounting for 29.0%) and females with 1 vehicle (37, making up 29.5%).
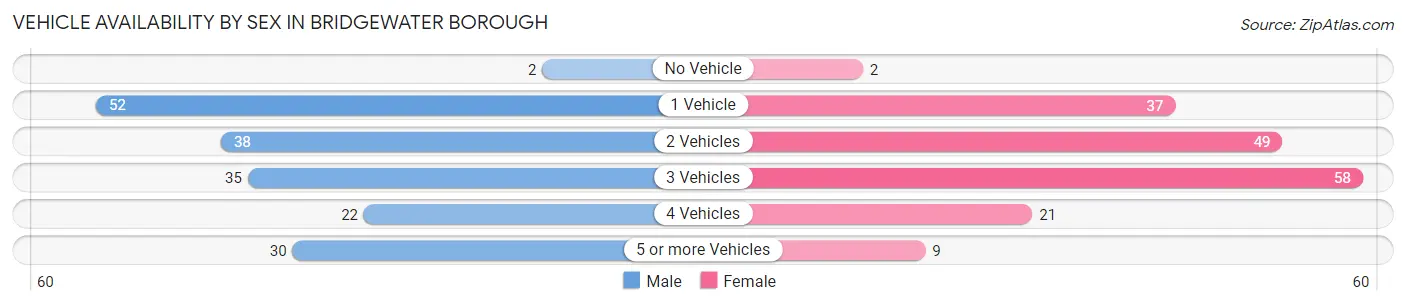
| Vehicles Available | Male | Female |
| No Vehicle | 2 (1.1%) | 2 (1.1%) |
| 1 Vehicle | 52 (29.0%) | 37 (21.0%) |
| 2 Vehicles | 38 (21.2%) | 49 (27.8%) |
| 3 Vehicles | 35 (19.6%) | 58 (33.0%) |
| 4 Vehicles | 22 (12.3%) | 21 (11.9%) |
| 5 or more Vehicles | 30 (16.8%) | 9 (5.1%) |
| Total | 179 (100.0%) | 176 (100.0%) |
Commute Time in Bridgewater borough
The most frequently occuring commute durations in Bridgewater borough are 5 to 9 minutes (87 commuters, 27.0%), 10 to 14 minutes (76 commuters, 23.6%), and 20 to 24 minutes (53 commuters, 16.5%).
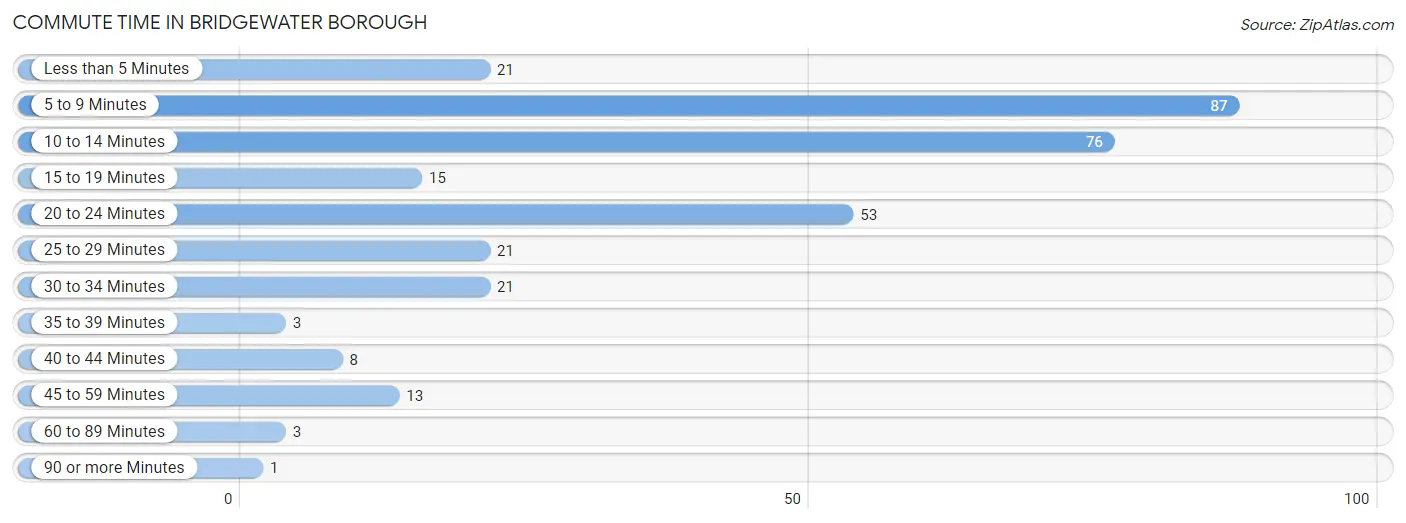
| Commute Time | # Commuters | % Commuters |
| Less than 5 Minutes | 21 | 6.5% |
| 5 to 9 Minutes | 87 | 27.0% |
| 10 to 14 Minutes | 76 | 23.6% |
| 15 to 19 Minutes | 15 | 4.7% |
| 20 to 24 Minutes | 53 | 16.5% |
| 25 to 29 Minutes | 21 | 6.5% |
| 30 to 34 Minutes | 21 | 6.5% |
| 35 to 39 Minutes | 3 | 0.9% |
| 40 to 44 Minutes | 8 | 2.5% |
| 45 to 59 Minutes | 13 | 4.0% |
| 60 to 89 Minutes | 3 | 0.9% |
| 90 or more Minutes | 1 | 0.3% |
Commute Time by Sex in Bridgewater borough
The most common commute times in Bridgewater borough are 20 to 24 minutes (49 commuters, 29.7%) for males and 5 to 9 minutes (66 commuters, 42.0%) for females.
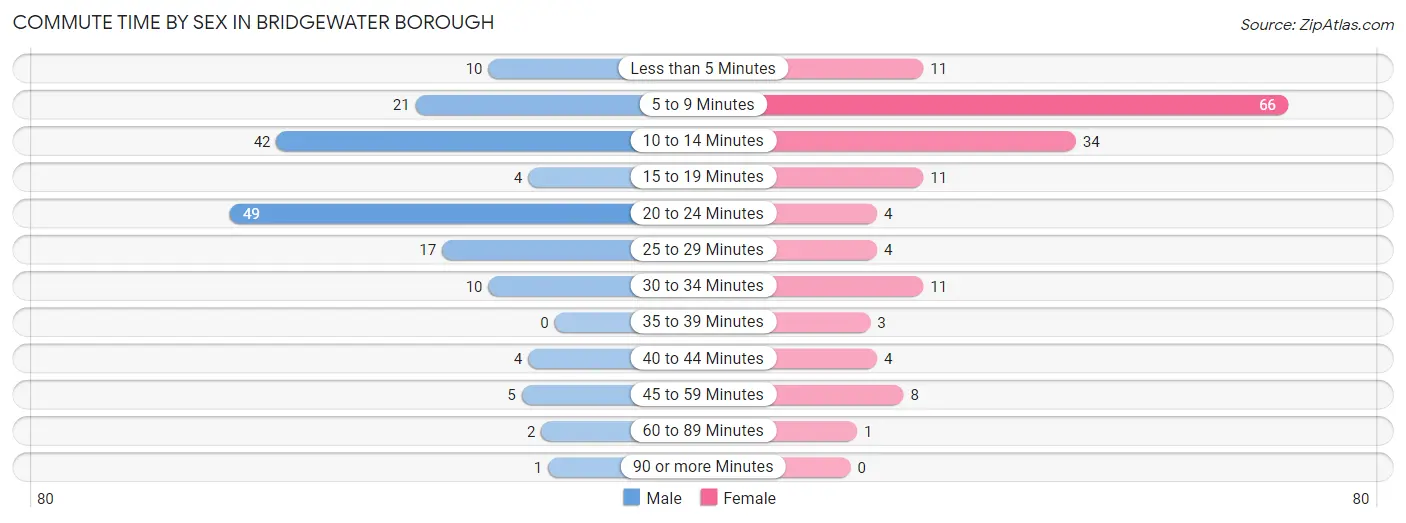
| Commute Time | Male | Female |
| Less than 5 Minutes | 10 (6.1%) | 11 (7.0%) |
| 5 to 9 Minutes | 21 (12.7%) | 66 (42.0%) |
| 10 to 14 Minutes | 42 (25.5%) | 34 (21.7%) |
| 15 to 19 Minutes | 4 (2.4%) | 11 (7.0%) |
| 20 to 24 Minutes | 49 (29.7%) | 4 (2.5%) |
| 25 to 29 Minutes | 17 (10.3%) | 4 (2.5%) |
| 30 to 34 Minutes | 10 (6.1%) | 11 (7.0%) |
| 35 to 39 Minutes | 0 (0.0%) | 3 (1.9%) |
| 40 to 44 Minutes | 4 (2.4%) | 4 (2.5%) |
| 45 to 59 Minutes | 5 (3.0%) | 8 (5.1%) |
| 60 to 89 Minutes | 2 (1.2%) | 1 (0.6%) |
| 90 or more Minutes | 1 (0.6%) | 0 (0.0%) |
Time of Departure to Work by Sex in Bridgewater borough
The most frequent times of departure to work in Bridgewater borough are 6:00 AM to 6:29 AM (28, 17.0%) for males and 9:00 AM to 9:59 AM (49, 31.2%) for females.
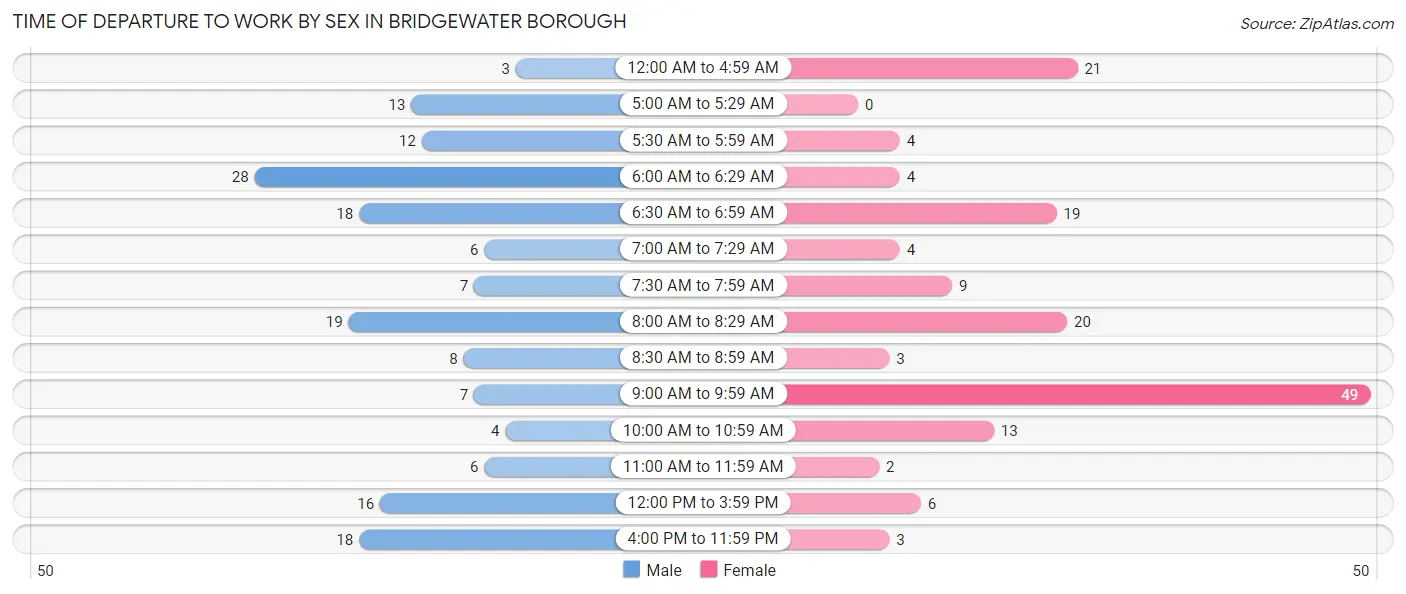
| Time of Departure | Male | Female |
| 12:00 AM to 4:59 AM | 3 (1.8%) | 21 (13.4%) |
| 5:00 AM to 5:29 AM | 13 (7.9%) | 0 (0.0%) |
| 5:30 AM to 5:59 AM | 12 (7.3%) | 4 (2.5%) |
| 6:00 AM to 6:29 AM | 28 (17.0%) | 4 (2.5%) |
| 6:30 AM to 6:59 AM | 18 (10.9%) | 19 (12.1%) |
| 7:00 AM to 7:29 AM | 6 (3.6%) | 4 (2.5%) |
| 7:30 AM to 7:59 AM | 7 (4.2%) | 9 (5.7%) |
| 8:00 AM to 8:29 AM | 19 (11.5%) | 20 (12.7%) |
| 8:30 AM to 8:59 AM | 8 (4.9%) | 3 (1.9%) |
| 9:00 AM to 9:59 AM | 7 (4.2%) | 49 (31.2%) |
| 10:00 AM to 10:59 AM | 4 (2.4%) | 13 (8.3%) |
| 11:00 AM to 11:59 AM | 6 (3.6%) | 2 (1.3%) |
| 12:00 PM to 3:59 PM | 16 (9.7%) | 6 (3.8%) |
| 4:00 PM to 11:59 PM | 18 (10.9%) | 3 (1.9%) |
| Total | 165 (100.0%) | 157 (100.0%) |
Housing Occupancy in Bridgewater borough
Occupancy by Ownership in Bridgewater borough
Of the total 379 dwellings in Bridgewater borough, owner-occupied units account for 265 (69.9%), while renter-occupied units make up 114 (30.1%).
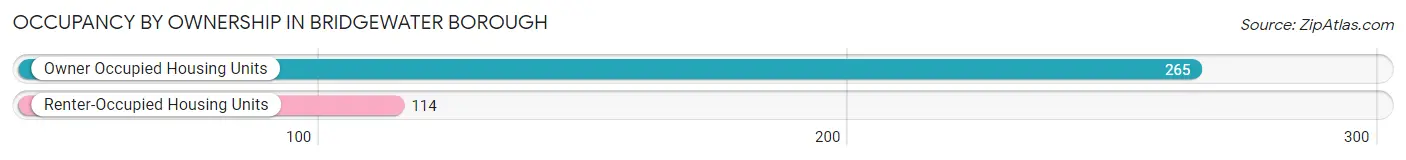
| Occupancy | # Housing Units | % Housing Units |
| Owner Occupied Housing Units | 265 | 69.9% |
| Renter-Occupied Housing Units | 114 | 30.1% |
| Total Occupied Housing Units | 379 | 100.0% |
Occupancy by Household Size in Bridgewater borough
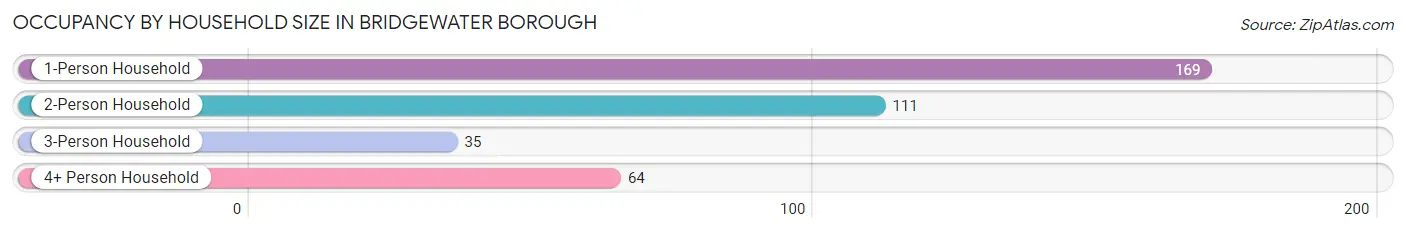
| Household Size | # Housing Units | % Housing Units |
| 1-Person Household | 169 | 44.6% |
| 2-Person Household | 111 | 29.3% |
| 3-Person Household | 35 | 9.2% |
| 4+ Person Household | 64 | 16.9% |
| Total Housing Units | 379 | 100.0% |
Occupancy by Ownership by Household Size in Bridgewater borough
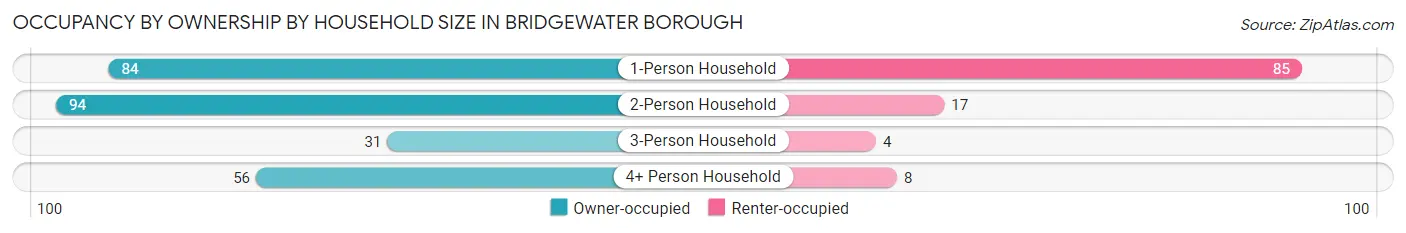
| Household Size | Owner-occupied | Renter-occupied |
| 1-Person Household | 84 (49.7%) | 85 (50.3%) |
| 2-Person Household | 94 (84.7%) | 17 (15.3%) |
| 3-Person Household | 31 (88.6%) | 4 (11.4%) |
| 4+ Person Household | 56 (87.5%) | 8 (12.5%) |
| Total Housing Units | 265 (69.9%) | 114 (30.1%) |
Occupancy by Educational Attainment in Bridgewater borough
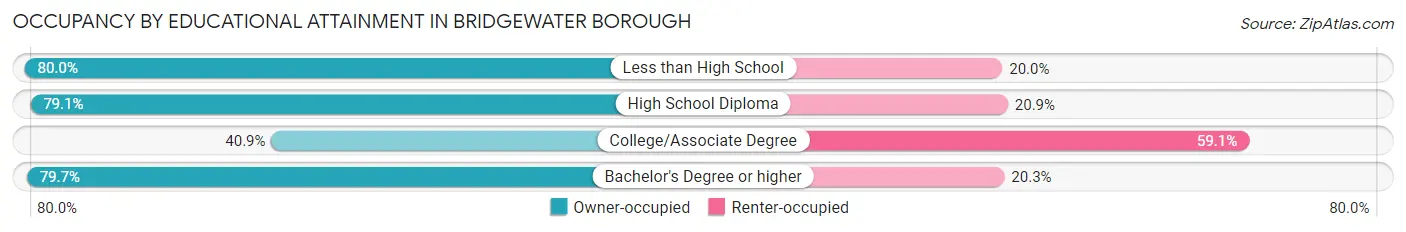
| Household Size | Owner-occupied | Renter-occupied |
| Less than High School | 8 (80.0%) | 2 (20.0%) |
| High School Diploma | 125 (79.1%) | 33 (20.9%) |
| College/Associate Degree | 38 (40.9%) | 55 (59.1%) |
| Bachelor's Degree or higher | 94 (79.7%) | 24 (20.3%) |
Occupancy by Age of Householder in Bridgewater borough
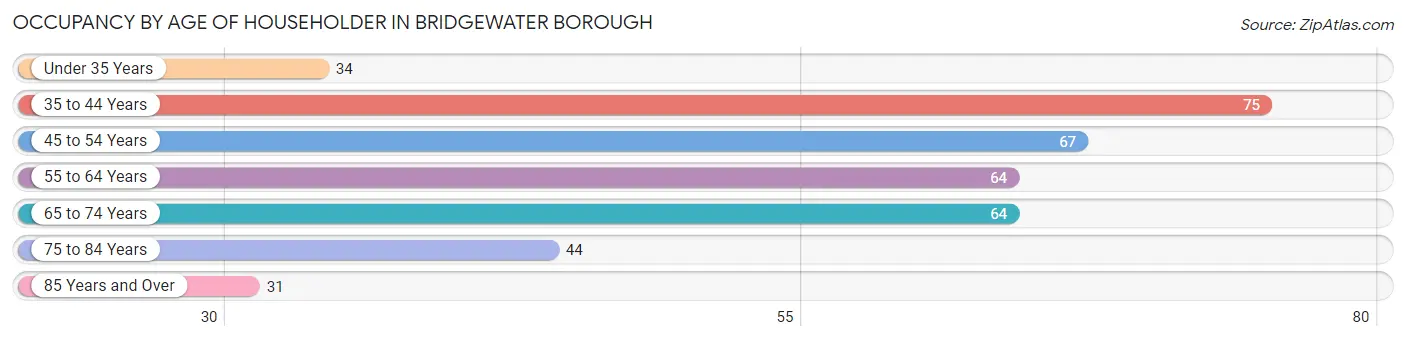
| Age Bracket | # Households | % Households |
| Under 35 Years | 34 | 9.0% |
| 35 to 44 Years | 75 | 19.8% |
| 45 to 54 Years | 67 | 17.7% |
| 55 to 64 Years | 64 | 16.9% |
| 65 to 74 Years | 64 | 16.9% |
| 75 to 84 Years | 44 | 11.6% |
| 85 Years and Over | 31 | 8.2% |
| Total | 379 | 100.0% |
Housing Finances in Bridgewater borough
Median Income by Occupancy in Bridgewater borough
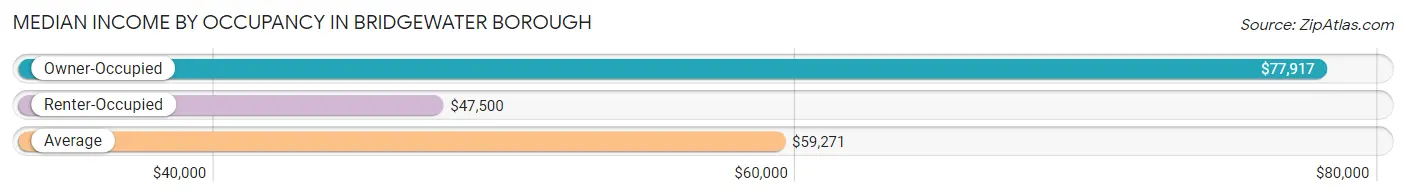
| Occupancy Type | # Households | Median Income |
| Owner-Occupied | 265 (69.9%) | $77,917 |
| Renter-Occupied | 114 (30.1%) | $47,500 |
| Average | 379 (100.0%) | $59,271 |
Occupancy by Householder Income Bracket in Bridgewater borough
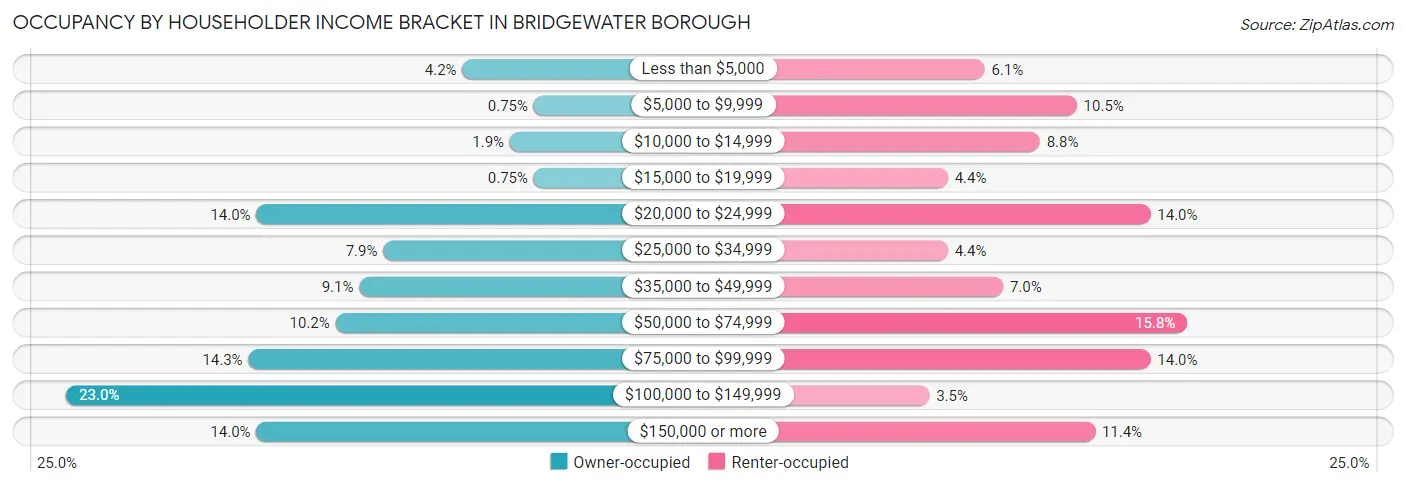
| Income Bracket | Owner-occupied | Renter-occupied |
| Less than $5,000 | 11 (4.2%) | 7 (6.1%) |
| $5,000 to $9,999 | 2 (0.7%) | 12 (10.5%) |
| $10,000 to $14,999 | 5 (1.9%) | 10 (8.8%) |
| $15,000 to $19,999 | 2 (0.7%) | 5 (4.4%) |
| $20,000 to $24,999 | 37 (14.0%) | 16 (14.0%) |
| $25,000 to $34,999 | 21 (7.9%) | 5 (4.4%) |
| $35,000 to $49,999 | 24 (9.1%) | 8 (7.0%) |
| $50,000 to $74,999 | 27 (10.2%) | 18 (15.8%) |
| $75,000 to $99,999 | 38 (14.3%) | 16 (14.0%) |
| $100,000 to $149,999 | 61 (23.0%) | 4 (3.5%) |
| $150,000 or more | 37 (14.0%) | 13 (11.4%) |
| Total | 265 (100.0%) | 114 (100.0%) |
Monthly Housing Cost Tiers in Bridgewater borough
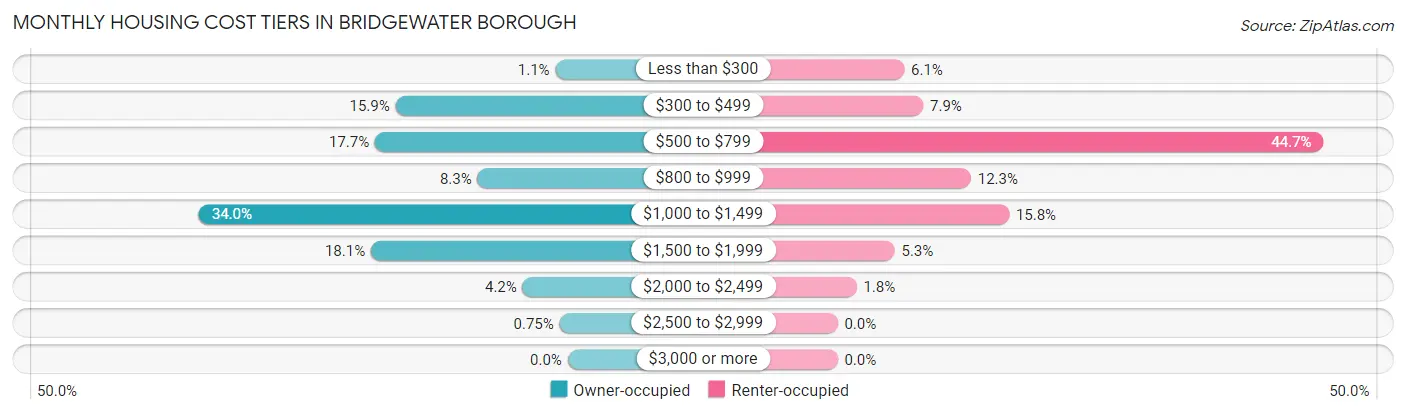
| Monthly Cost | Owner-occupied | Renter-occupied |
| Less than $300 | 3 (1.1%) | 7 (6.1%) |
| $300 to $499 | 42 (15.9%) | 9 (7.9%) |
| $500 to $799 | 47 (17.7%) | 51 (44.7%) |
| $800 to $999 | 22 (8.3%) | 14 (12.3%) |
| $1,000 to $1,499 | 90 (34.0%) | 18 (15.8%) |
| $1,500 to $1,999 | 48 (18.1%) | 6 (5.3%) |
| $2,000 to $2,499 | 11 (4.2%) | 2 (1.8%) |
| $2,500 to $2,999 | 2 (0.7%) | 0 (0.0%) |
| $3,000 or more | 0 (0.0%) | 0 (0.0%) |
| Total | 265 (100.0%) | 114 (100.0%) |
Physical Housing Characteristics in Bridgewater borough
Housing Structures in Bridgewater borough
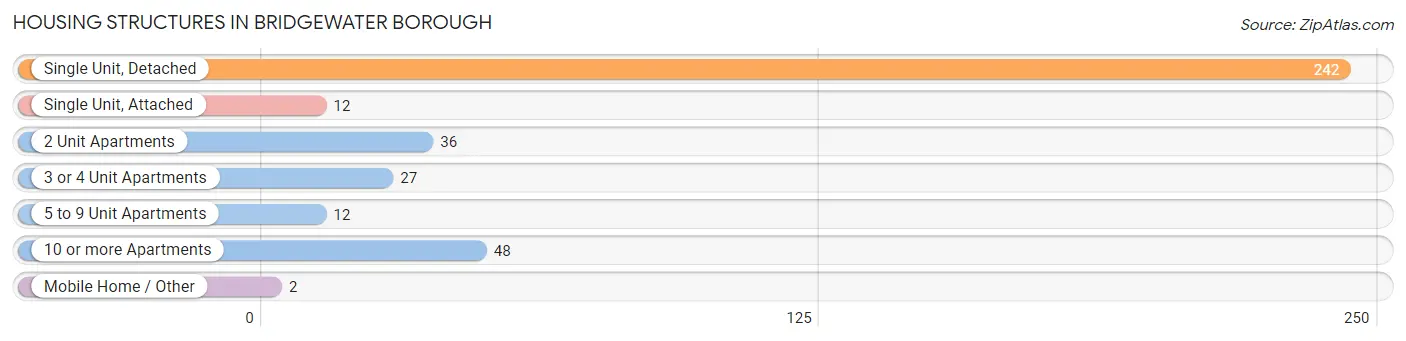
| Structure Type | # Housing Units | % Housing Units |
| Single Unit, Detached | 242 | 63.8% |
| Single Unit, Attached | 12 | 3.2% |
| 2 Unit Apartments | 36 | 9.5% |
| 3 or 4 Unit Apartments | 27 | 7.1% |
| 5 to 9 Unit Apartments | 12 | 3.2% |
| 10 or more Apartments | 48 | 12.7% |
| Mobile Home / Other | 2 | 0.5% |
| Total | 379 | 100.0% |
Housing Structures by Occupancy in Bridgewater borough
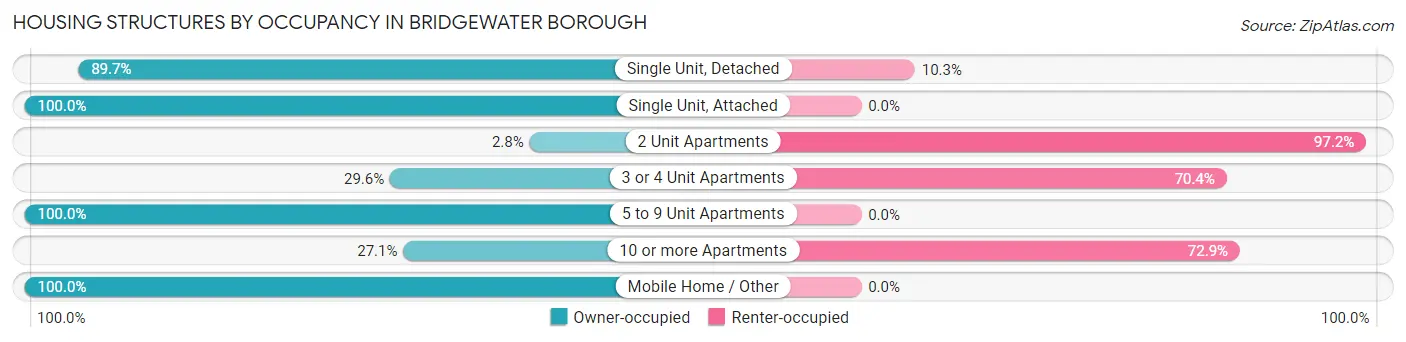
| Structure Type | Owner-occupied | Renter-occupied |
| Single Unit, Detached | 217 (89.7%) | 25 (10.3%) |
| Single Unit, Attached | 12 (100.0%) | 0 (0.0%) |
| 2 Unit Apartments | 1 (2.8%) | 35 (97.2%) |
| 3 or 4 Unit Apartments | 8 (29.6%) | 19 (70.4%) |
| 5 to 9 Unit Apartments | 12 (100.0%) | 0 (0.0%) |
| 10 or more Apartments | 13 (27.1%) | 35 (72.9%) |
| Mobile Home / Other | 2 (100.0%) | 0 (0.0%) |
| Total | 265 (69.9%) | 114 (30.1%) |
Housing Structures by Number of Rooms in Bridgewater borough
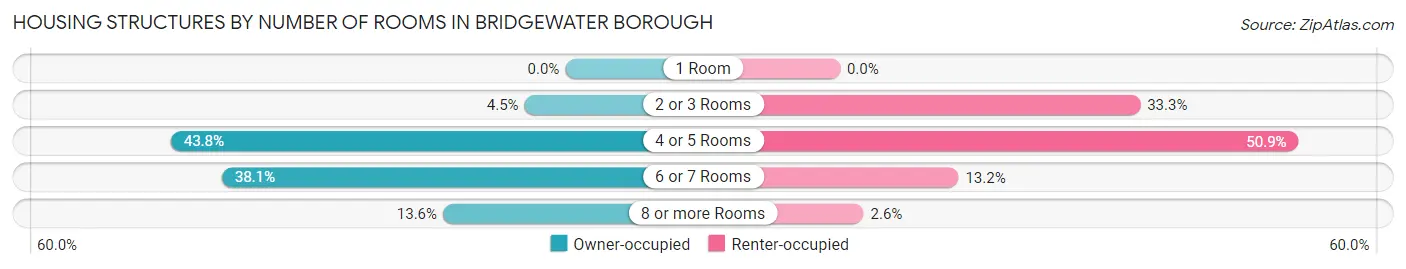
| Number of Rooms | Owner-occupied | Renter-occupied |
| 1 Room | 0 (0.0%) | 0 (0.0%) |
| 2 or 3 Rooms | 12 (4.5%) | 38 (33.3%) |
| 4 or 5 Rooms | 116 (43.8%) | 58 (50.9%) |
| 6 or 7 Rooms | 101 (38.1%) | 15 (13.2%) |
| 8 or more Rooms | 36 (13.6%) | 3 (2.6%) |
| Total | 265 (100.0%) | 114 (100.0%) |
Housing Structure by Heating Type in Bridgewater borough
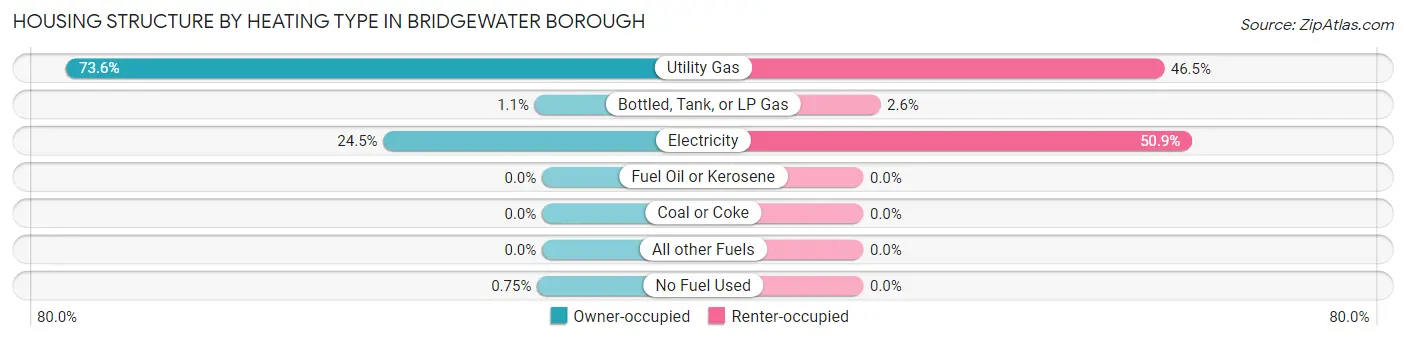
| Heating Type | Owner-occupied | Renter-occupied |
| Utility Gas | 195 (73.6%) | 53 (46.5%) |
| Bottled, Tank, or LP Gas | 3 (1.1%) | 3 (2.6%) |
| Electricity | 65 (24.5%) | 58 (50.9%) |
| Fuel Oil or Kerosene | 0 (0.0%) | 0 (0.0%) |
| Coal or Coke | 0 (0.0%) | 0 (0.0%) |
| All other Fuels | 0 (0.0%) | 0 (0.0%) |
| No Fuel Used | 2 (0.7%) | 0 (0.0%) |
| Total | 265 (100.0%) | 114 (100.0%) |
Household Vehicle Usage in Bridgewater borough
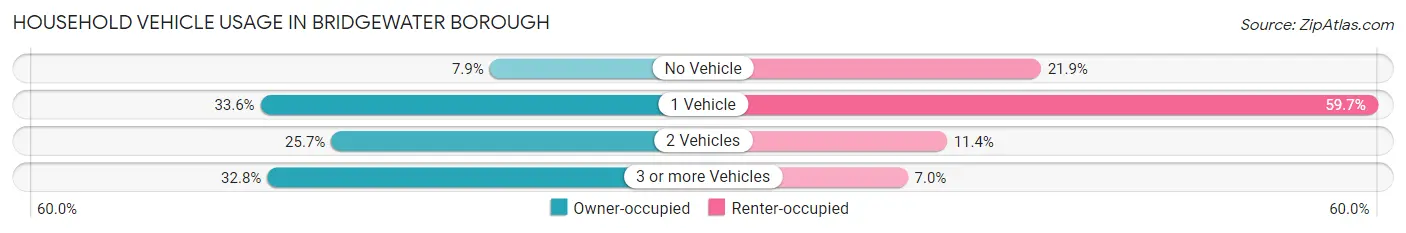
| Vehicles per Household | Owner-occupied | Renter-occupied |
| No Vehicle | 21 (7.9%) | 25 (21.9%) |
| 1 Vehicle | 89 (33.6%) | 68 (59.7%) |
| 2 Vehicles | 68 (25.7%) | 13 (11.4%) |
| 3 or more Vehicles | 87 (32.8%) | 8 (7.0%) |
| Total | 265 (100.0%) | 114 (100.0%) |
Real Estate & Mortgages in Bridgewater borough
Real Estate and Mortgage Overview in Bridgewater borough
| Characteristic | Without Mortgage | With Mortgage |
| Housing Units | 90 | 175 |
| Median Property Value | $161,800 | $188,200 |
| Median Household Income | $58,750 | $34 |
| Monthly Housing Costs | $500 | $0 |
| Real Estate Taxes | $2,065 | $4 |
Property Value by Mortgage Status in Bridgewater borough
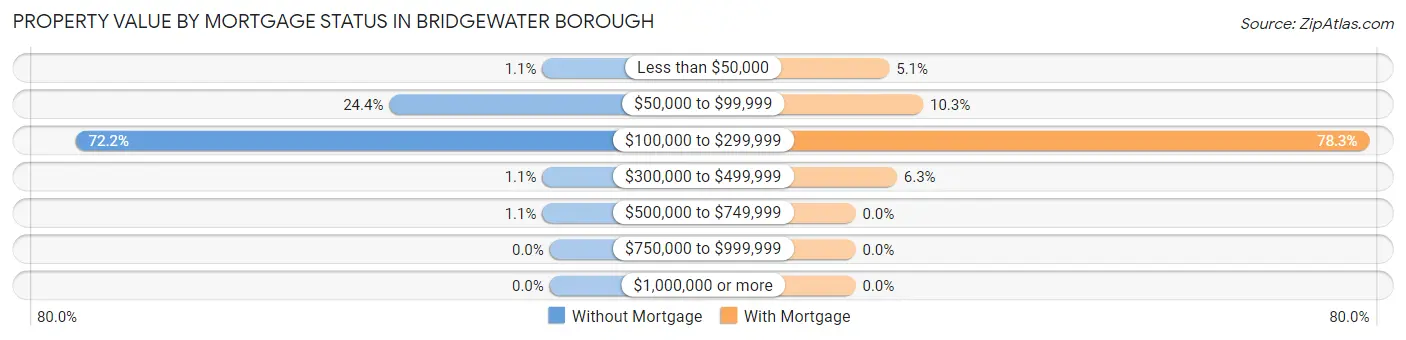
| Property Value | Without Mortgage | With Mortgage |
| Less than $50,000 | 1 (1.1%) | 9 (5.1%) |
| $50,000 to $99,999 | 22 (24.4%) | 18 (10.3%) |
| $100,000 to $299,999 | 65 (72.2%) | 137 (78.3%) |
| $300,000 to $499,999 | 1 (1.1%) | 11 (6.3%) |
| $500,000 to $749,999 | 1 (1.1%) | 0 (0.0%) |
| $750,000 to $999,999 | 0 (0.0%) | 0 (0.0%) |
| $1,000,000 or more | 0 (0.0%) | 0 (0.0%) |
| Total | 90 (100.0%) | 175 (100.0%) |
Household Income by Mortgage Status in Bridgewater borough
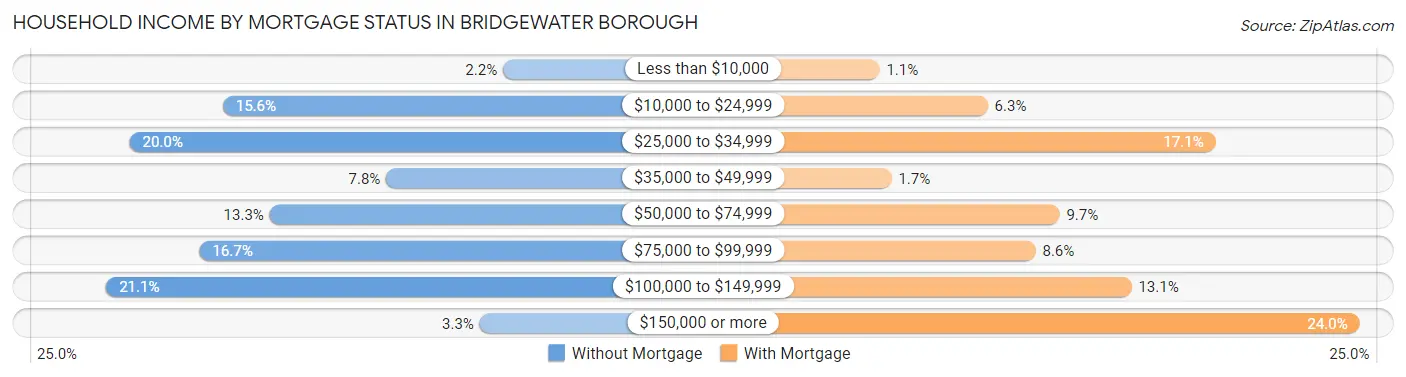
| Household Income | Without Mortgage | With Mortgage |
| Less than $10,000 | 2 (2.2%) | 2 (1.1%) |
| $10,000 to $24,999 | 14 (15.6%) | 11 (6.3%) |
| $25,000 to $34,999 | 18 (20.0%) | 30 (17.1%) |
| $35,000 to $49,999 | 7 (7.8%) | 3 (1.7%) |
| $50,000 to $74,999 | 12 (13.3%) | 17 (9.7%) |
| $75,000 to $99,999 | 15 (16.7%) | 15 (8.6%) |
| $100,000 to $149,999 | 19 (21.1%) | 23 (13.1%) |
| $150,000 or more | 3 (3.3%) | 42 (24.0%) |
| Total | 90 (100.0%) | 175 (100.0%) |
Property Value to Household Income Ratio in Bridgewater borough
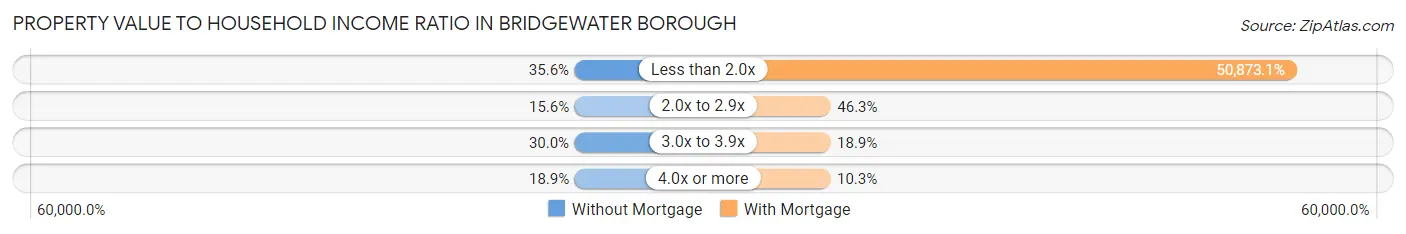
| Value-to-Income Ratio | Without Mortgage | With Mortgage |
| Less than 2.0x | 32 (35.6%) | 89,028 (50,873.1%) |
| 2.0x to 2.9x | 14 (15.6%) | 81 (46.3%) |
| 3.0x to 3.9x | 27 (30.0%) | 33 (18.9%) |
| 4.0x or more | 17 (18.9%) | 18 (10.3%) |
| Total | 90 (100.0%) | 175 (100.0%) |
Real Estate Taxes by Mortgage Status in Bridgewater borough
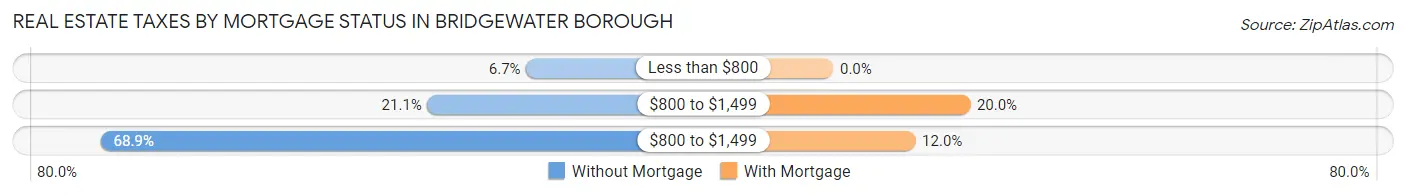
| Property Taxes | Without Mortgage | With Mortgage |
| Less than $800 | 6 (6.7%) | 0 (0.0%) |
| $800 to $1,499 | 19 (21.1%) | 35 (20.0%) |
| $800 to $1,499 | 62 (68.9%) | 21 (12.0%) |
| Total | 90 (100.0%) | 175 (100.0%) |
Health & Disability in Bridgewater borough
Health Insurance Coverage by Age in Bridgewater borough
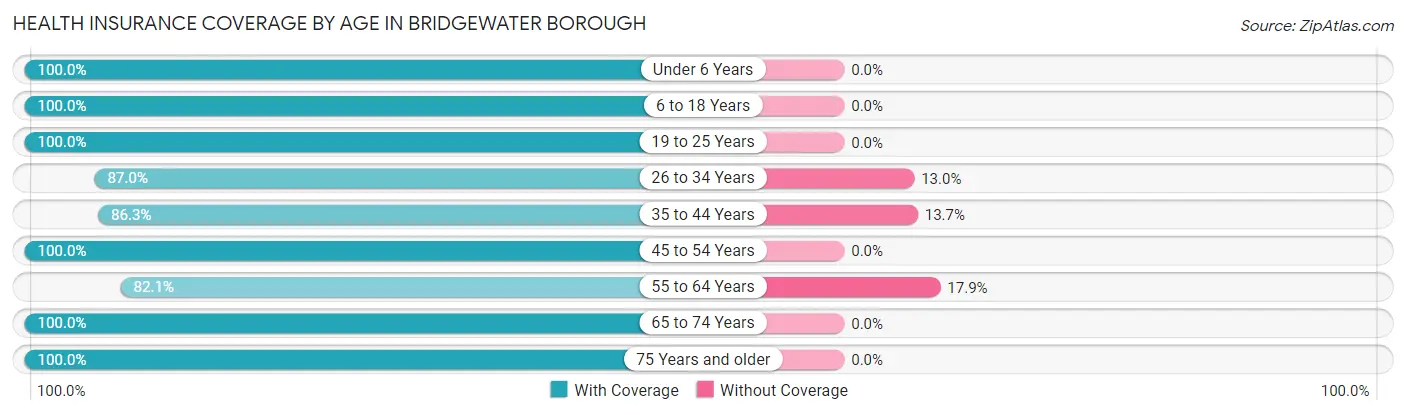
| Age Bracket | With Coverage | Without Coverage |
| Under 6 Years | 47 (100.0%) | 0 (0.0%) |
| 6 to 18 Years | 102 (100.0%) | 0 (0.0%) |
| 19 to 25 Years | 49 (100.0%) | 0 (0.0%) |
| 26 to 34 Years | 40 (87.0%) | 6 (13.0%) |
| 35 to 44 Years | 107 (86.3%) | 17 (13.7%) |
| 45 to 54 Years | 119 (100.0%) | 0 (0.0%) |
| 55 to 64 Years | 87 (82.1%) | 19 (17.9%) |
| 65 to 74 Years | 94 (100.0%) | 0 (0.0%) |
| 75 Years and older | 101 (100.0%) | 0 (0.0%) |
| Total | 746 (94.7%) | 42 (5.3%) |
Health Insurance Coverage by Citizenship Status in Bridgewater borough
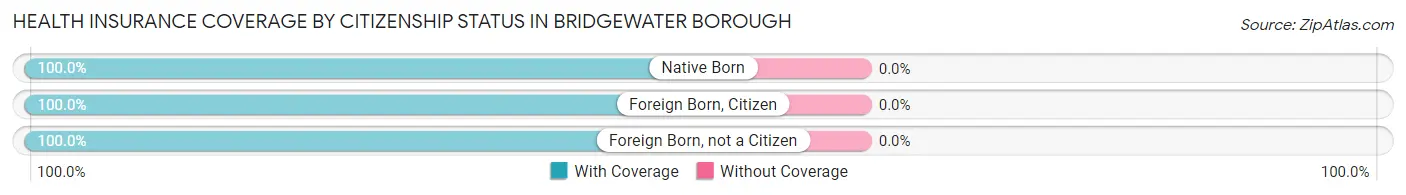
| Citizenship Status | With Coverage | Without Coverage |
| Native Born | 47 (100.0%) | 0 (0.0%) |
| Foreign Born, Citizen | 102 (100.0%) | 0 (0.0%) |
| Foreign Born, not a Citizen | 49 (100.0%) | 0 (0.0%) |
Health Insurance Coverage by Household Income in Bridgewater borough
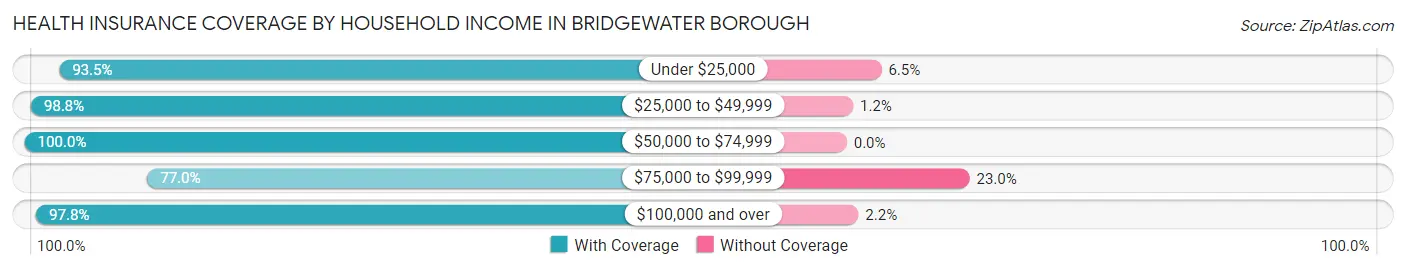
| Household Income | With Coverage | Without Coverage |
| Under $25,000 | 144 (93.5%) | 10 (6.5%) |
| $25,000 to $49,999 | 84 (98.8%) | 1 (1.2%) |
| $50,000 to $74,999 | 81 (100.0%) | 0 (0.0%) |
| $75,000 to $99,999 | 77 (77.0%) | 23 (23.0%) |
| $100,000 and over | 360 (97.8%) | 8 (2.2%) |
Public vs Private Health Insurance Coverage by Age in Bridgewater borough
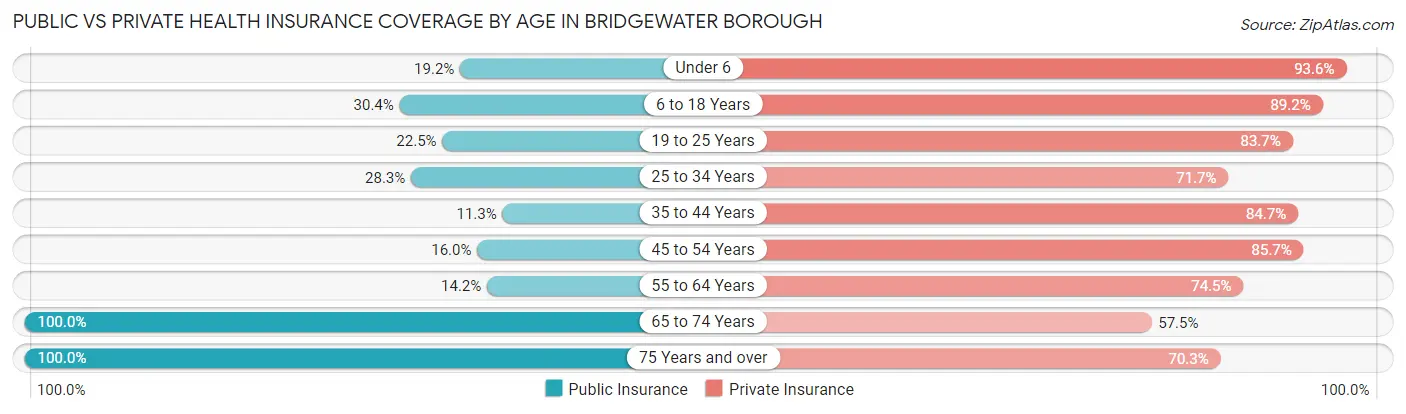
| Age Bracket | Public Insurance | Private Insurance |
| Under 6 | 9 (19.2%) | 44 (93.6%) |
| 6 to 18 Years | 31 (30.4%) | 91 (89.2%) |
| 19 to 25 Years | 11 (22.5%) | 41 (83.7%) |
| 25 to 34 Years | 13 (28.3%) | 33 (71.7%) |
| 35 to 44 Years | 14 (11.3%) | 105 (84.7%) |
| 45 to 54 Years | 19 (16.0%) | 102 (85.7%) |
| 55 to 64 Years | 15 (14.1%) | 79 (74.5%) |
| 65 to 74 Years | 94 (100.0%) | 54 (57.5%) |
| 75 Years and over | 101 (100.0%) | 71 (70.3%) |
| Total | 307 (39.0%) | 620 (78.7%) |
Disability Status by Sex by Age in Bridgewater borough
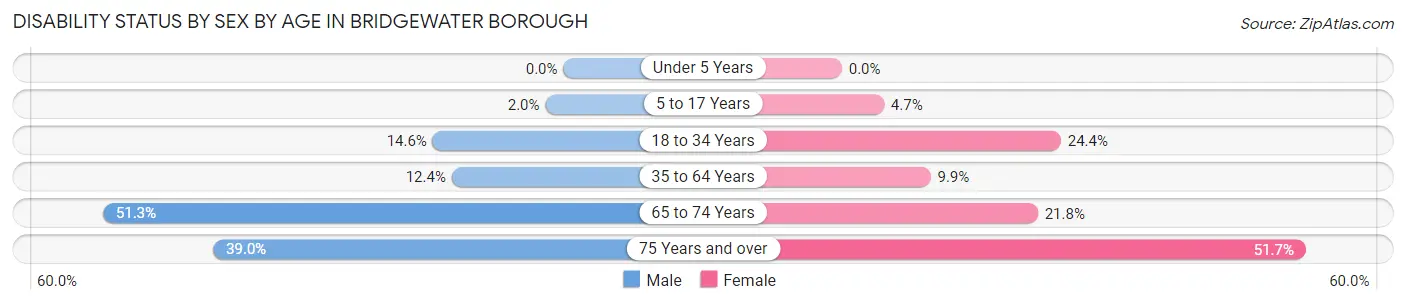
| Age Bracket | Male | Female |
| Under 5 Years | 0 (0.0%) | 0 (0.0%) |
| 5 to 17 Years | 1 (2.0%) | 3 (4.7%) |
| 18 to 34 Years | 8 (14.5%) | 10 (24.4%) |
| 35 to 64 Years | 22 (12.4%) | 17 (9.9%) |
| 65 to 74 Years | 20 (51.3%) | 12 (21.8%) |
| 75 Years and over | 16 (39.0%) | 31 (51.7%) |
Disability Class by Sex by Age in Bridgewater borough
Disability Class: Hearing Difficulty
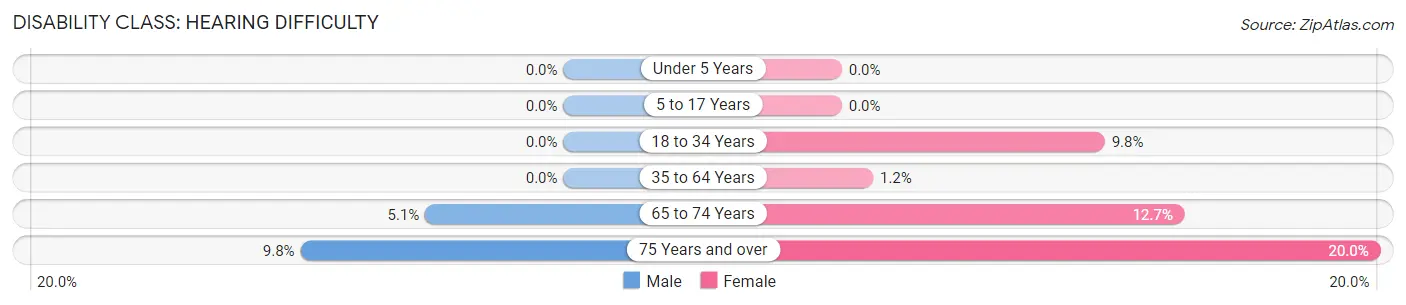
| Age Bracket | Male | Female |
| Under 5 Years | 0 (0.0%) | 0 (0.0%) |
| 5 to 17 Years | 0 (0.0%) | 0 (0.0%) |
| 18 to 34 Years | 0 (0.0%) | 4 (9.8%) |
| 35 to 64 Years | 0 (0.0%) | 2 (1.2%) |
| 65 to 74 Years | 2 (5.1%) | 7 (12.7%) |
| 75 Years and over | 4 (9.8%) | 12 (20.0%) |
Disability Class: Vision Difficulty
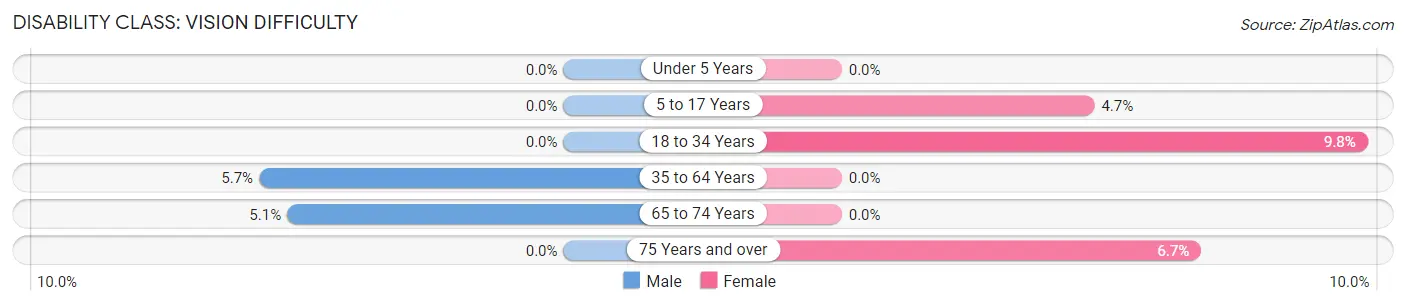
| Age Bracket | Male | Female |
| Under 5 Years | 0 (0.0%) | 0 (0.0%) |
| 5 to 17 Years | 0 (0.0%) | 3 (4.7%) |
| 18 to 34 Years | 0 (0.0%) | 4 (9.8%) |
| 35 to 64 Years | 10 (5.7%) | 0 (0.0%) |
| 65 to 74 Years | 2 (5.1%) | 0 (0.0%) |
| 75 Years and over | 0 (0.0%) | 4 (6.7%) |
Disability Class: Cognitive Difficulty
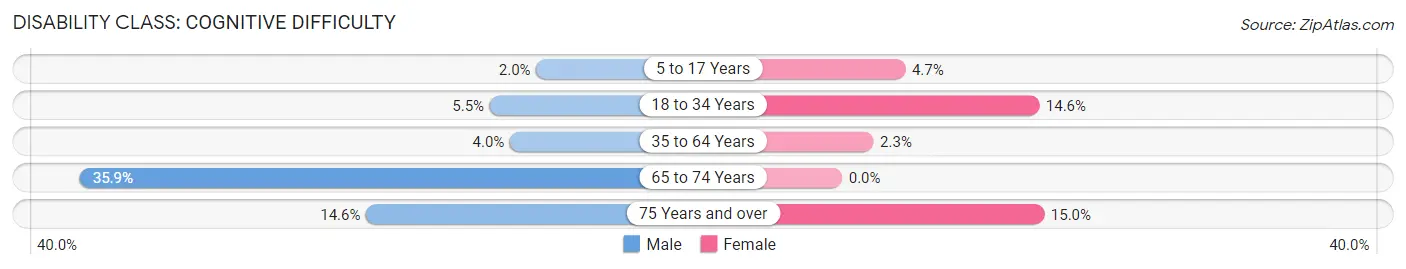
| Age Bracket | Male | Female |
| 5 to 17 Years | 1 (2.0%) | 3 (4.7%) |
| 18 to 34 Years | 3 (5.4%) | 6 (14.6%) |
| 35 to 64 Years | 7 (4.0%) | 4 (2.3%) |
| 65 to 74 Years | 14 (35.9%) | 0 (0.0%) |
| 75 Years and over | 6 (14.6%) | 9 (15.0%) |
Disability Class: Ambulatory Difficulty
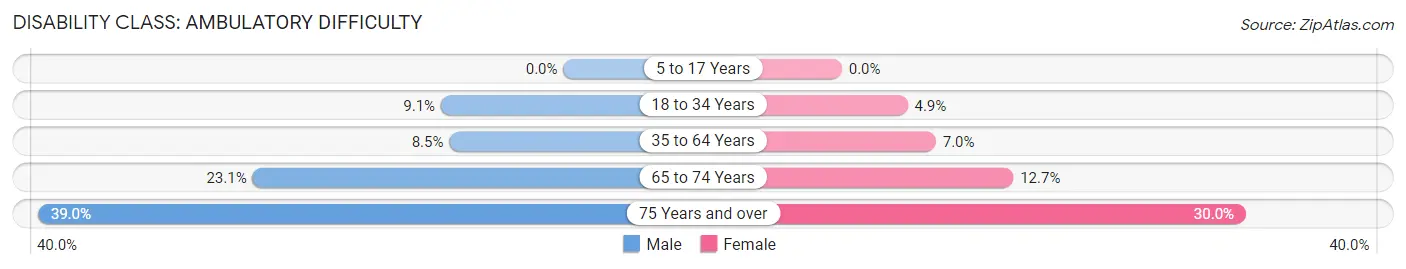
| Age Bracket | Male | Female |
| 5 to 17 Years | 0 (0.0%) | 0 (0.0%) |
| 18 to 34 Years | 5 (9.1%) | 2 (4.9%) |
| 35 to 64 Years | 15 (8.5%) | 12 (7.0%) |
| 65 to 74 Years | 9 (23.1%) | 7 (12.7%) |
| 75 Years and over | 16 (39.0%) | 18 (30.0%) |
Disability Class: Self-Care Difficulty
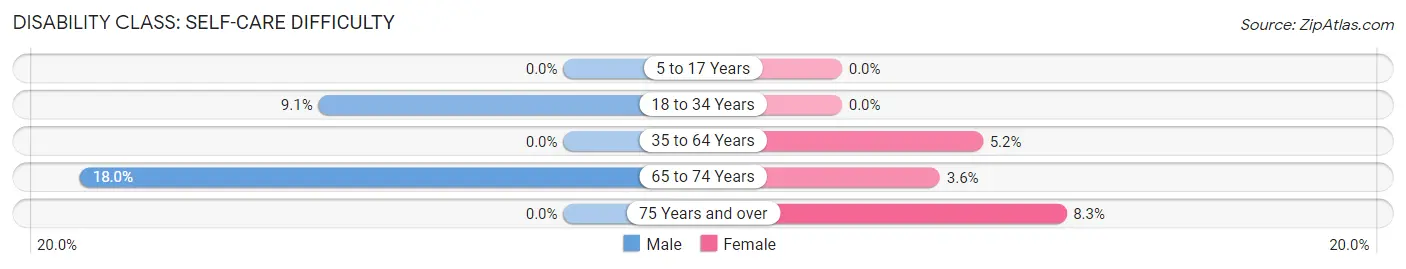
| Age Bracket | Male | Female |
| 5 to 17 Years | 0 (0.0%) | 0 (0.0%) |
| 18 to 34 Years | 5 (9.1%) | 0 (0.0%) |
| 35 to 64 Years | 0 (0.0%) | 9 (5.2%) |
| 65 to 74 Years | 7 (17.9%) | 2 (3.6%) |
| 75 Years and over | 0 (0.0%) | 5 (8.3%) |
Technology Access in Bridgewater borough
Computing Device Access in Bridgewater borough
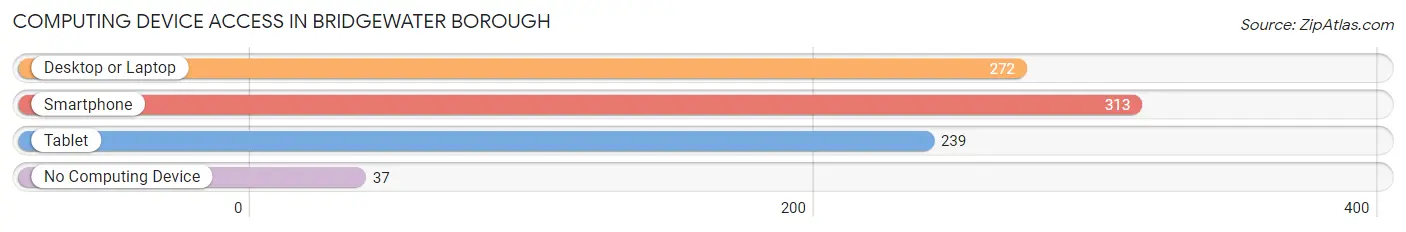
| Device Type | # Households | % Households |
| Desktop or Laptop | 272 | 71.8% |
| Smartphone | 313 | 82.6% |
| Tablet | 239 | 63.1% |
| No Computing Device | 37 | 9.8% |
| Total | 379 | 100.0% |
Internet Access in Bridgewater borough
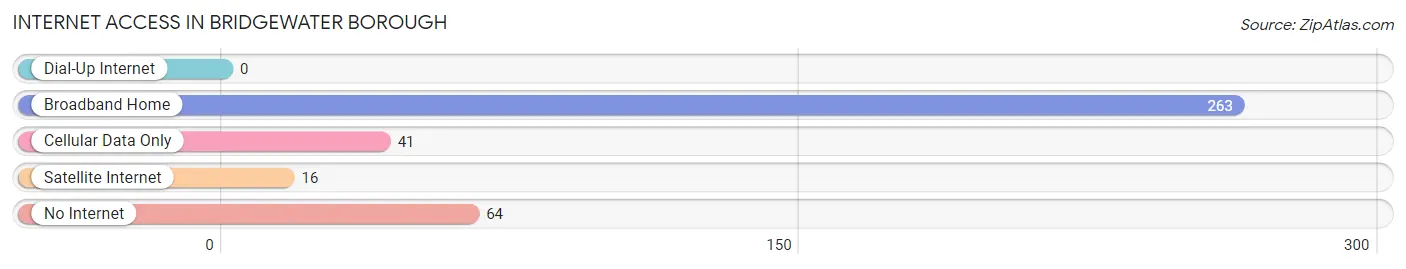
| Internet Type | # Households | % Households |
| Dial-Up Internet | 0 | 0.0% |
| Broadband Home | 263 | 69.4% |
| Cellular Data Only | 41 | 10.8% |
| Satellite Internet | 16 | 4.2% |
| No Internet | 64 | 16.9% |
| Total | 379 | 100.0% |
Bridgewater borough Summary
Bridgewater Borough is a borough located in Somerset County, Pennsylvania, United States. The population was 1,845 at the 2010 census. Bridgewater Borough is located in the heart of the Laurel Highlands, a region of the Allegheny Mountains. It is situated along the Stonycreek River, which is a tributary of the Conemaugh River.
History
The area that is now Bridgewater Borough was first settled in 1762 by John and Mary Miller. The Millers were among the first settlers in the area and established a small farmstead. The area was known as Millerstown until 1836 when it was renamed Bridgewater. The name was chosen to honor the Bridgewater family, who had been prominent in the area since the late 1700s.
The borough was officially incorporated in 1872. At the time, Bridgewater was a small farming community with a population of just over 500 people. The town was home to several small businesses, including a grist mill, a saw mill, a blacksmith shop, and a general store.
In the late 1800s, Bridgewater began to experience a period of growth and development. The town was connected to the Pennsylvania Railroad in 1883, which allowed for increased trade and commerce. The town also saw the construction of several new buildings, including a school, a post office, and a bank.
By the early 1900s, Bridgewater had become a popular tourist destination. The town was home to several resorts, including the Bridgewater Inn and the Bridgewater Hotel. The town also had several churches, a library, and a movie theater.
Geography
Bridgewater Borough is located at 40°7'25" North, 78°59'45" West (40.123611, -78.995833). According to the United States Census Bureau, the borough has a total area of 0.7 square miles (1.8 km2), all of it land.
The borough is located in the heart of the Laurel Highlands, a region of the Allegheny Mountains. It is situated along the Stonycreek River, which is a tributary of the Conemaugh River.
Economy
Bridgewater Borough is a small, rural community with a population of just over 1,800 people. The town is home to several small businesses, including a grocery store, a hardware store, a pharmacy, and several restaurants.
The town is also home to several manufacturing companies, including a plastics manufacturer and a metal fabrication company. The town is also home to a small airport, which is used for private and corporate aircraft.
Demographics
As of the 2010 census, there were 1,845 people, 745 households, and 486 families residing in the borough. The population density was 2,637.5 people per square mile (1,017.2/km2). There were 809 housing units at an average density of 1,150.7 per square mile (444.3/km2). The racial makeup of the borough was 97.7% White, 0.3% African American, 0.2% Native American, 0.2% Asian, 0.2% from other races, and 1.4% from two or more races. Hispanic or Latino of any race were 0.9% of the population.
There were 745 households, out of which 28.2% had children under the age of 18 living with them, 48.2% were married couples living together, 11.7% had a female householder with no husband present, and 35.2% were non-families. 30.2% of all households were made up of individuals, and 14.2% had someone living alone who was 65 years of age or older. The average household size was 2.41 and the average family size was 3.00.
In the borough, the population was spread out, with 24.2% under the age of 18, 7.2% from 18 to 24, 28.2% from 25 to 44, 22.7% from 45 to 64, and 17.7% who were 65 years of age or older. The median age was 38 years. For every 100 females, there were 92.2 males. For every 100 females age 18 and over, there were 88.2 males.
The median income for a household in the borough was $35,000, and the median income for a family was $41,250. Males had a median income of $30,000 versus $21,250 for females. The per capita income for the borough was $17,845. About 8.2% of families and 10.2% of the population were below the poverty line, including 14.2% of those under age 18 and 8.2% of those age 65 or over.
Common Questions
What is Per Capita Income in Bridgewater borough?
Per Capita income in Bridgewater borough is $37,630.
What is the Median Family Income in Bridgewater borough?
Median Family Income in Bridgewater borough is $84,375.
What is the Median Household income in Bridgewater borough?
Median Household Income in Bridgewater borough is $59,271.
What is Income or Wage Gap in Bridgewater borough?
Income or Wage Gap in Bridgewater borough is 35.0%.
Women in Bridgewater borough earn 65.0 cents for every dollar earned by a man.
What is Inequality or Gini Index in Bridgewater borough?
Inequality or Gini Index in Bridgewater borough is 0.46.
What is the Total Population of Bridgewater borough?
Total Population of Bridgewater borough is 788.
What is the Total Male Population of Bridgewater borough?
Total Male Population of Bridgewater borough is 371.
What is the Total Female Population of Bridgewater borough?
Total Female Population of Bridgewater borough is 417.
What is the Ratio of Males per 100 Females in Bridgewater borough?
There are 88.97 Males per 100 Females in Bridgewater borough.
What is the Ratio of Females per 100 Males in Bridgewater borough?
There are 112.40 Females per 100 Males in Bridgewater borough.
What is the Median Population Age in Bridgewater borough?
Median Population Age in Bridgewater borough is 47.7 Years.
What is the Average Family Size in Bridgewater borough
Average Family Size in Bridgewater borough is 2.9 People.
What is the Average Household Size in Bridgewater borough
Average Household Size in Bridgewater borough is 2.1 People.
How Large is the Labor Force in Bridgewater borough?
There are 429 People in the Labor Forcein in Bridgewater borough.
What is the Percentage of People in the Labor Force in Bridgewater borough?
64.7% of People are in the Labor Force in Bridgewater borough.
What is the Unemployment Rate in Bridgewater borough?
Unemployment Rate in Bridgewater borough is 5.4%.