Elizabethville borough, PA Map & Demographics
Elizabethville borough Overview
$28,861
PER CAPITA INCOME
$81,250
AVG FAMILY INCOME
$65,000
AVG HOUSEHOLD INCOME
7.8%
WAGE / INCOME GAP [ % ]
92.2¢/ $1
WAGE / INCOME GAP [ $ ]
$5,147
FAMILY INCOME DEFICIT
0.35
INEQUALITY / GINI INDEX
1,491
TOTAL POPULATION
724
MALE POPULATION
767
FEMALE POPULATION
94.39
MALES / 100 FEMALES
105.94
FEMALES / 100 MALES
36.6
MEDIAN AGE
3.2
AVG FAMILY SIZE
2.6
AVG HOUSEHOLD SIZE
833
LABOR FORCE [ PEOPLE ]
69.8%
PERCENT IN LABOR FORCE
1.3%
UNEMPLOYMENT RATE
Income in Elizabethville borough
Income Overview in Elizabethville borough
Per Capita Income in Elizabethville borough is $28,861, while median incomes of families and households are $81,250 and $65,000 respectively.
| Characteristic | Number | Measure |
| Per Capita Income | 1,491 | $28,861 |
| Median Family Income | 373 | $81,250 |
| Mean Family Income | 373 | $89,274 |
| Median Household Income | 550 | $65,000 |
| Mean Household Income | 550 | $74,976 |
| Income Deficit | 373 | $5,147 |
| Wage / Income Gap (%) | 1,491 | 7.75% |
| Wage / Income Gap ($) | 1,491 | 92.25¢ per $1 |
| Gini / Inequality Index | 1,491 | 0.35 |
Earnings by Sex in Elizabethville borough
Average Earnings in Elizabethville borough are $36,771, $37,941 for men and $35,000 for women, a difference of 7.7%.
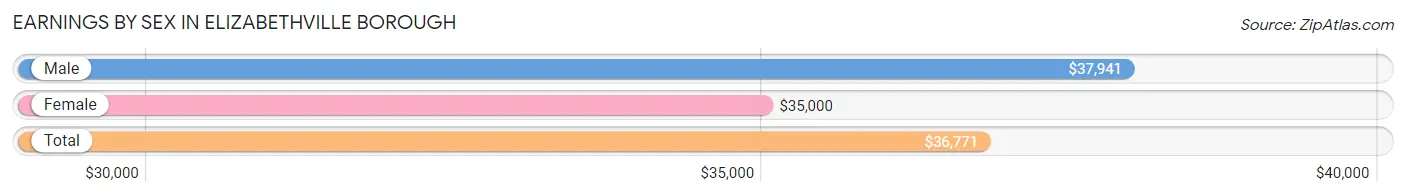
| Sex | Number | Average Earnings |
| Male | 424 (51.0%) | $37,941 |
| Female | 408 (49.0%) | $35,000 |
| Total | 832 (100.0%) | $36,771 |
Earnings by Sex by Income Bracket in Elizabethville borough
The most common earnings brackets in Elizabethville borough are $2,499 or less for men (60 | 14.1%) and $40,000 to $44,999 for women (66 | 16.2%).
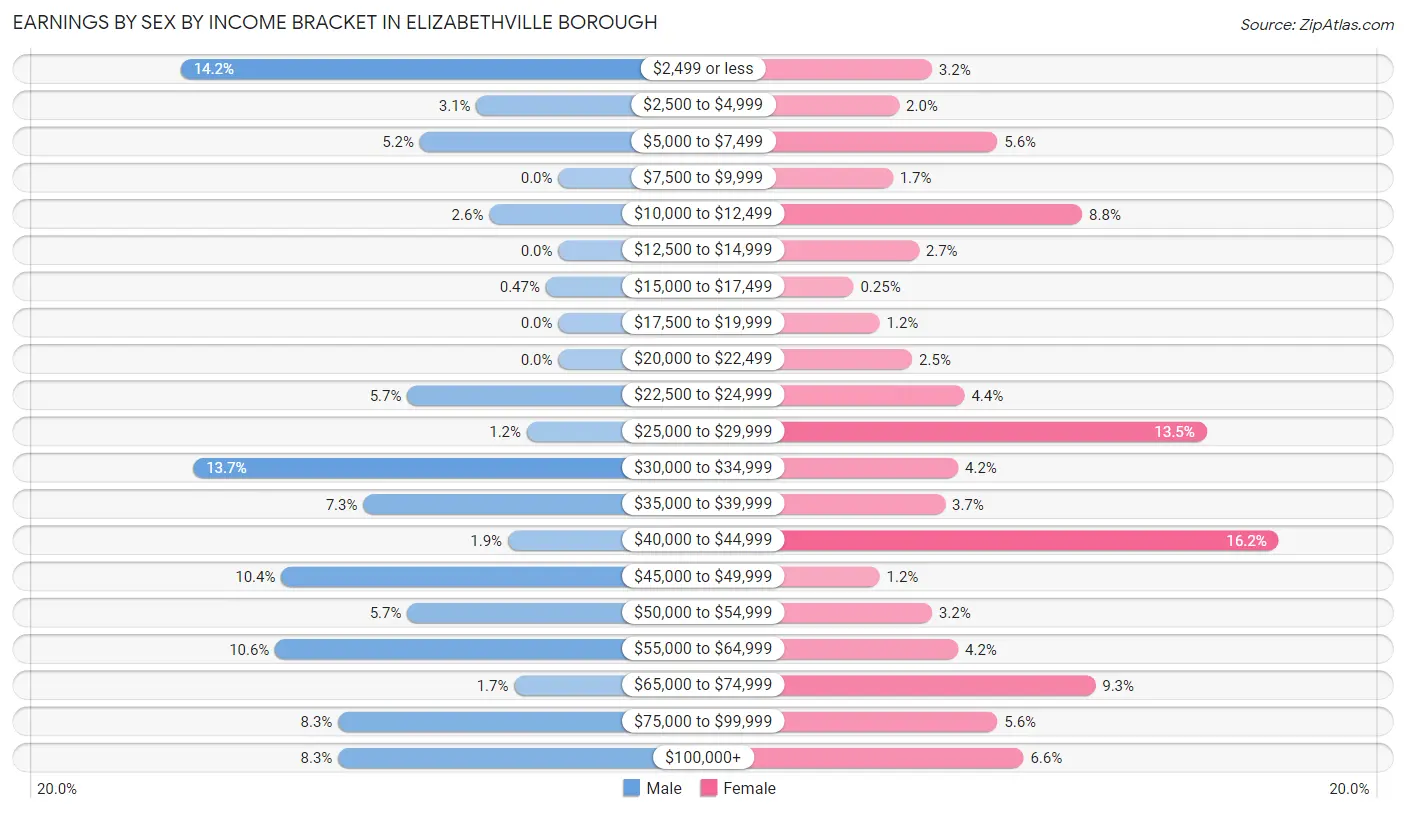
| Income | Male | Female |
| $2,499 or less | 60 (14.1%) | 13 (3.2%) |
| $2,500 to $4,999 | 13 (3.1%) | 8 (2.0%) |
| $5,000 to $7,499 | 22 (5.2%) | 23 (5.6%) |
| $7,500 to $9,999 | 0 (0.0%) | 7 (1.7%) |
| $10,000 to $12,499 | 11 (2.6%) | 36 (8.8%) |
| $12,500 to $14,999 | 0 (0.0%) | 11 (2.7%) |
| $15,000 to $17,499 | 2 (0.5%) | 1 (0.3%) |
| $17,500 to $19,999 | 0 (0.0%) | 5 (1.2%) |
| $20,000 to $22,499 | 0 (0.0%) | 10 (2.5%) |
| $22,500 to $24,999 | 24 (5.7%) | 18 (4.4%) |
| $25,000 to $29,999 | 5 (1.2%) | 55 (13.5%) |
| $30,000 to $34,999 | 58 (13.7%) | 17 (4.2%) |
| $35,000 to $39,999 | 31 (7.3%) | 15 (3.7%) |
| $40,000 to $44,999 | 8 (1.9%) | 66 (16.2%) |
| $45,000 to $49,999 | 44 (10.4%) | 5 (1.2%) |
| $50,000 to $54,999 | 24 (5.7%) | 13 (3.2%) |
| $55,000 to $64,999 | 45 (10.6%) | 17 (4.2%) |
| $65,000 to $74,999 | 7 (1.7%) | 38 (9.3%) |
| $75,000 to $99,999 | 35 (8.3%) | 23 (5.6%) |
| $100,000+ | 35 (8.3%) | 27 (6.6%) |
| Total | 424 (100.0%) | 408 (100.0%) |
Earnings by Sex by Educational Attainment in Elizabethville borough
Average earnings in Elizabethville borough are $48,750 for men and $43,371 for women, a difference of 11.0%. Men with an educational attainment of graduate degree enjoy the highest average annual earnings of $110,882, while those with college or associate's degree education earn the least with $37,250. Women with an educational attainment of graduate degree earn the most with the average annual earnings of $68,750, while those with less than high school education have the smallest earnings of $13,056.
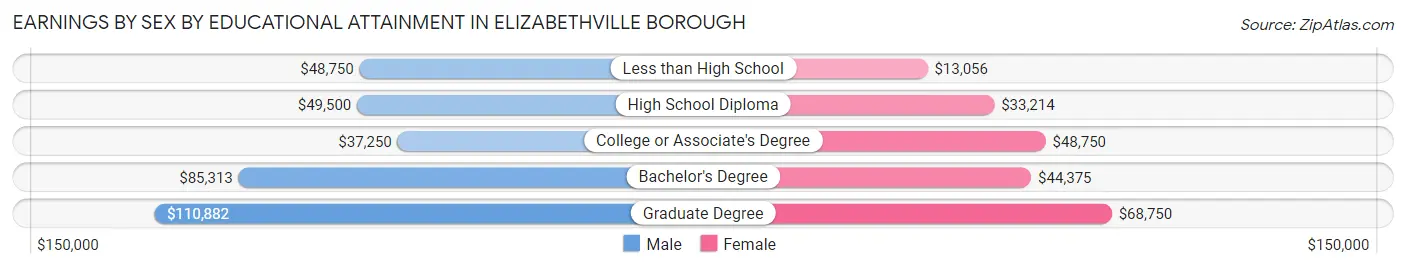
| Educational Attainment | Male Income | Female Income |
| Less than High School | $48,750 | $13,056 |
| High School Diploma | $49,500 | $33,214 |
| College or Associate's Degree | $37,250 | $48,750 |
| Bachelor's Degree | $85,313 | $44,375 |
| Graduate Degree | $110,882 | $68,750 |
| Total | $48,750 | $43,371 |
Family Income in Elizabethville borough
Family Income Brackets in Elizabethville borough
According to the Elizabethville borough family income data, there are 103 families falling into the $100,000 to $149,999 income range, which is the most common income bracket and makes up 27.6% of all families.
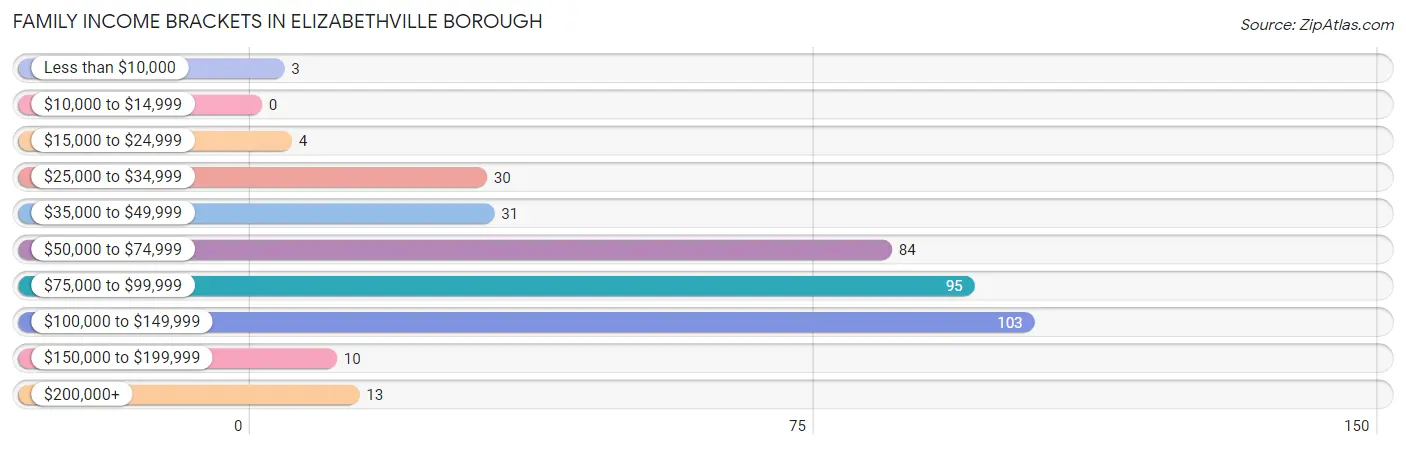
| Income Bracket | # Families | % Families |
| Less than $10,000 | 3 | 0.8% |
| $10,000 to $14,999 | 0 | 0.0% |
| $15,000 to $24,999 | 4 | 1.1% |
| $25,000 to $34,999 | 30 | 8.0% |
| $35,000 to $49,999 | 31 | 8.3% |
| $50,000 to $74,999 | 84 | 22.5% |
| $75,000 to $99,999 | 95 | 25.5% |
| $100,000 to $149,999 | 103 | 27.6% |
| $150,000 to $199,999 | 10 | 2.7% |
| $200,000+ | 13 | 3.5% |
Family Income by Famaliy Size in Elizabethville borough
3-person families (75 | 20.1%) account for the highest median family income in Elizabethville borough with $95,580 per family, while 2-person families (178 | 47.7%) have the highest median income of $34,375 per family member.
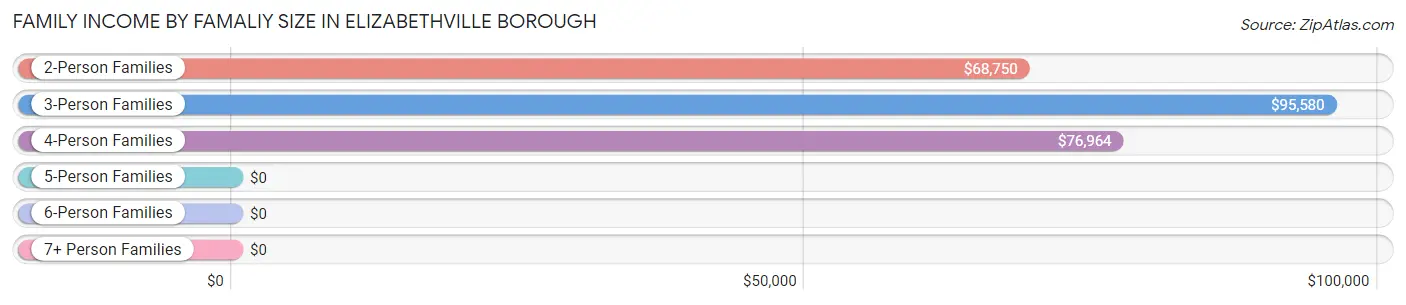
| Income Bracket | # Families | Median Income |
| 2-Person Families | 178 (47.7%) | $68,750 |
| 3-Person Families | 75 (20.1%) | $95,580 |
| 4-Person Families | 62 (16.6%) | $76,964 |
| 5-Person Families | 32 (8.6%) | $0 |
| 6-Person Families | 14 (3.7%) | $0 |
| 7+ Person Families | 12 (3.2%) | $0 |
| Total | 373 (100.0%) | $81,250 |
Family Income by Number of Earners in Elizabethville borough
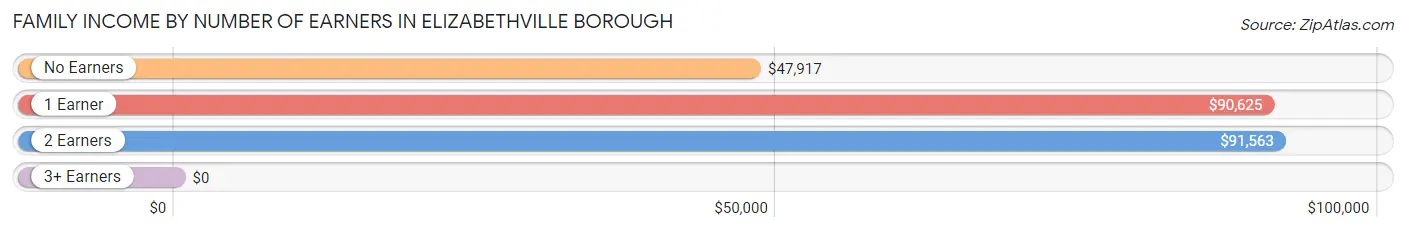
| Number of Earners | # Families | Median Income |
| No Earners | 39 (10.5%) | $47,917 |
| 1 Earner | 149 (40.0%) | $90,625 |
| 2 Earners | 119 (31.9%) | $91,563 |
| 3+ Earners | 66 (17.7%) | $0 |
| Total | 373 (100.0%) | $81,250 |
Household Income in Elizabethville borough
Household Income Brackets in Elizabethville borough
With 131 households falling in the category, the $100,000 to $149,999 income range is the most frequent in Elizabethville borough, accounting for 23.8% of all households. In contrast, only 13 households (2.4%) fall into the $200,000+ income bracket, making it the least populous group.
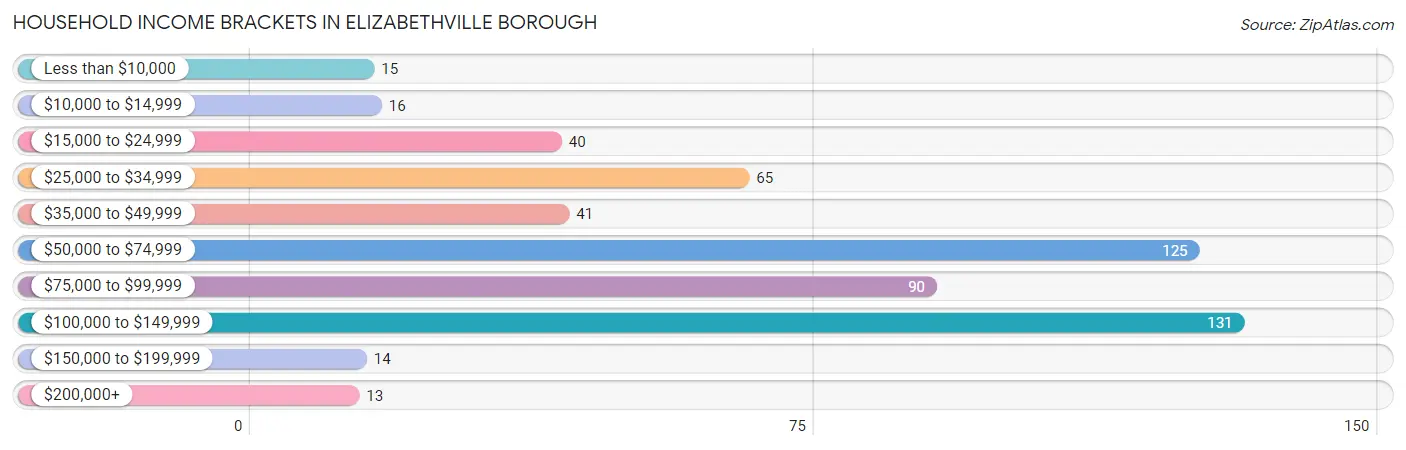
| Income Bracket | # Households | % Households |
| Less than $10,000 | 15 | 2.7% |
| $10,000 to $14,999 | 16 | 2.9% |
| $15,000 to $24,999 | 40 | 7.3% |
| $25,000 to $34,999 | 65 | 11.8% |
| $35,000 to $49,999 | 41 | 7.5% |
| $50,000 to $74,999 | 125 | 22.7% |
| $75,000 to $99,999 | 90 | 16.4% |
| $100,000 to $149,999 | 131 | 23.8% |
| $150,000 to $199,999 | 14 | 2.5% |
| $200,000+ | 13 | 2.4% |
Household Income by Householder Age in Elizabethville borough
The median household income in Elizabethville borough is $65,000, with the highest median household income of $80,833 found in the 45 to 64 years age bracket for the primary householder. A total of 242 households (44.0%) fall into this category. Meanwhile, the 15 to 24 years age bracket for the primary householder has the lowest median household income of $0, with 13 households (2.4%) in this group.
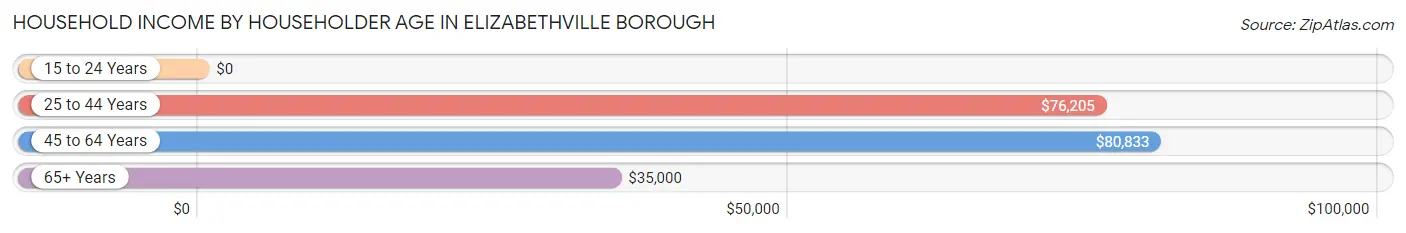
| Income Bracket | # Households | Median Income |
| 15 to 24 Years | 13 (2.4%) | $0 |
| 25 to 44 Years | 197 (35.8%) | $76,205 |
| 45 to 64 Years | 242 (44.0%) | $80,833 |
| 65+ Years | 98 (17.8%) | $35,000 |
| Total | 550 (100.0%) | $65,000 |
Poverty in Elizabethville borough
Income Below Poverty by Sex and Age in Elizabethville borough
With 7.9% poverty level for males and 9.9% for females among the residents of Elizabethville borough, 6 to 11 year old males and under 5 year old females are the most vulnerable to poverty, with 22 males (30.1%) and 10 females (23.8%) in their respective age groups living below the poverty level.
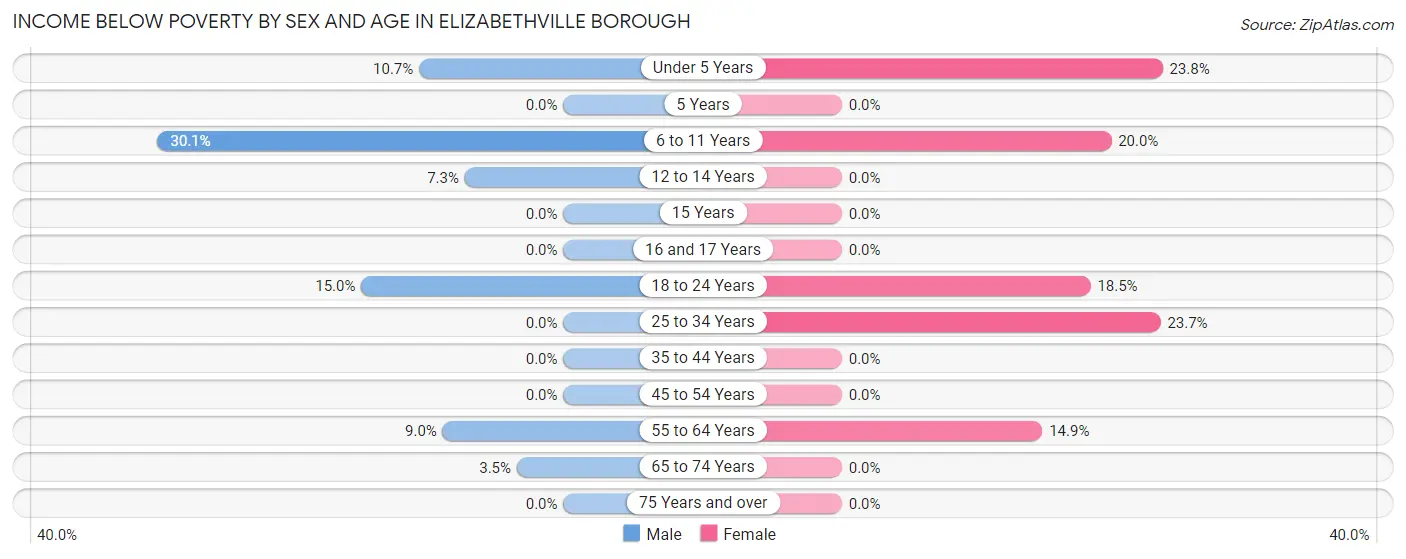
| Age Bracket | Male | Female |
| Under 5 Years | 3 (10.7%) | 10 (23.8%) |
| 5 Years | 0 (0.0%) | 0 (0.0%) |
| 6 to 11 Years | 22 (30.1%) | 10 (20.0%) |
| 12 to 14 Years | 3 (7.3%) | 0 (0.0%) |
| 15 Years | 0 (0.0%) | 0 (0.0%) |
| 16 and 17 Years | 0 (0.0%) | 0 (0.0%) |
| 18 to 24 Years | 21 (15.0%) | 12 (18.5%) |
| 25 to 34 Years | 0 (0.0%) | 22 (23.7%) |
| 35 to 44 Years | 0 (0.0%) | 0 (0.0%) |
| 45 to 54 Years | 0 (0.0%) | 0 (0.0%) |
| 55 to 64 Years | 6 (9.0%) | 18 (14.9%) |
| 65 to 74 Years | 2 (3.5%) | 0 (0.0%) |
| 75 Years and over | 0 (0.0%) | 0 (0.0%) |
| Total | 57 (7.9%) | 72 (9.9%) |
Income Above Poverty by Sex and Age in Elizabethville borough
According to the poverty statistics in Elizabethville borough, males aged 5 years and females aged 5 years are the age groups that are most secure financially, with 100.0% of males and 100.0% of females in these age groups living above the poverty line.
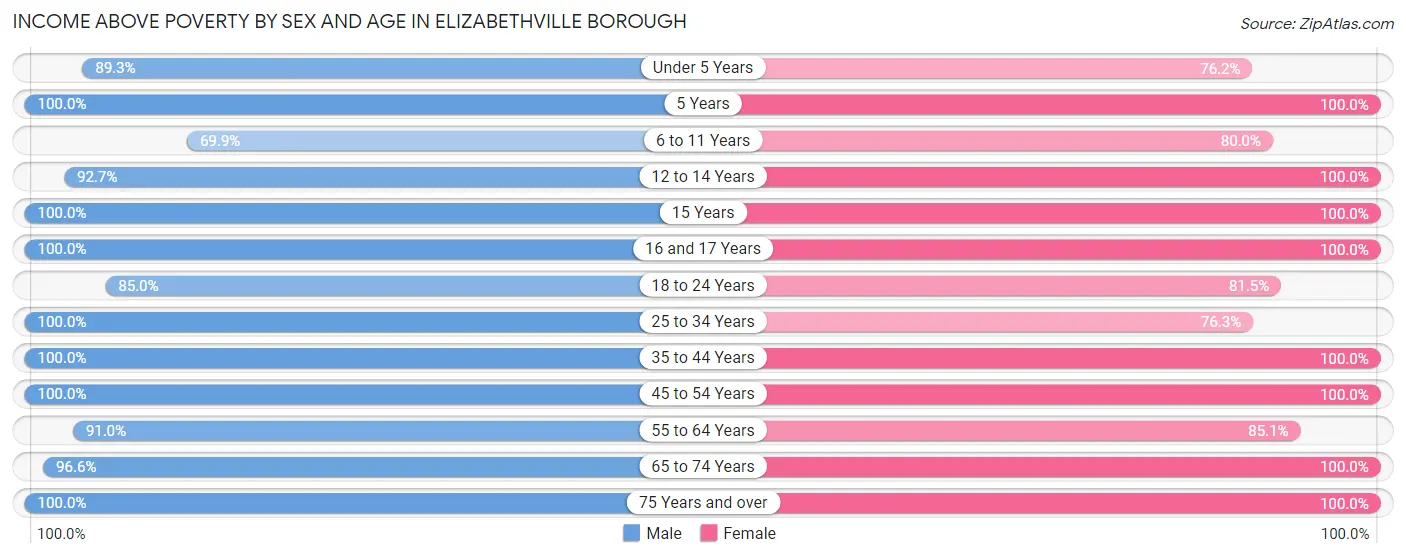
| Age Bracket | Male | Female |
| Under 5 Years | 25 (89.3%) | 32 (76.2%) |
| 5 Years | 4 (100.0%) | 10 (100.0%) |
| 6 to 11 Years | 51 (69.9%) | 40 (80.0%) |
| 12 to 14 Years | 38 (92.7%) | 28 (100.0%) |
| 15 Years | 11 (100.0%) | 7 (100.0%) |
| 16 and 17 Years | 11 (100.0%) | 30 (100.0%) |
| 18 to 24 Years | 119 (85.0%) | 53 (81.5%) |
| 25 to 34 Years | 92 (100.0%) | 71 (76.3%) |
| 35 to 44 Years | 94 (100.0%) | 107 (100.0%) |
| 45 to 54 Years | 71 (100.0%) | 104 (100.0%) |
| 55 to 64 Years | 61 (91.0%) | 103 (85.1%) |
| 65 to 74 Years | 56 (96.6%) | 54 (100.0%) |
| 75 Years and over | 34 (100.0%) | 20 (100.0%) |
| Total | 667 (92.1%) | 659 (90.1%) |
Income Below Poverty Among Married-Couple Families in Elizabethville borough
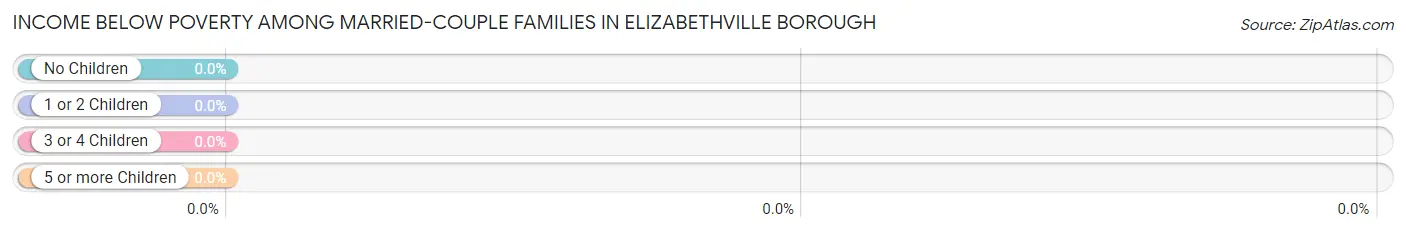
| Children | Above Poverty | Below Poverty |
| No Children | 164 (100.0%) | 0 (0.0%) |
| 1 or 2 Children | 59 (100.0%) | 0 (0.0%) |
| 3 or 4 Children | 19 (100.0%) | 0 (0.0%) |
| 5 or more Children | 12 (100.0%) | 0 (0.0%) |
| Total | 254 (100.0%) | 0 (0.0%) |
Income Below Poverty Among Single-Parent Households in Elizabethville borough
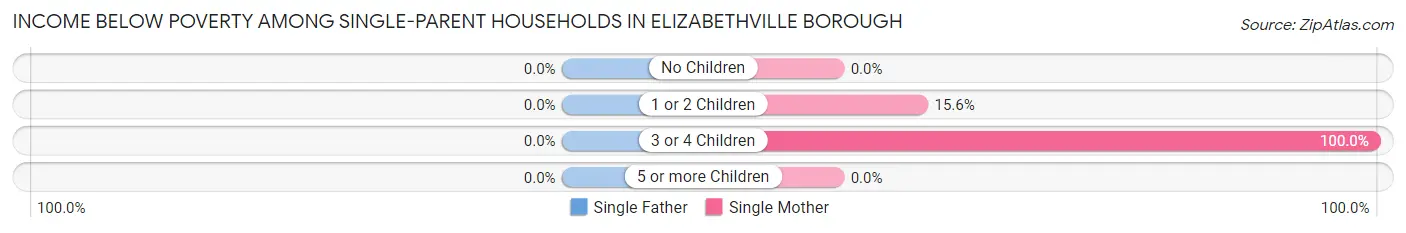
| Children | Single Father | Single Mother |
| No Children | 0 (0.0%) | 0 (0.0%) |
| 1 or 2 Children | 0 (0.0%) | 5 (15.6%) |
| 3 or 4 Children | 0 (0.0%) | 10 (100.0%) |
| 5 or more Children | 0 (0.0%) | 0 (0.0%) |
| Total | 0 (0.0%) | 15 (25.4%) |
Income Below Poverty Among Married-Couple vs Single-Parent Households in Elizabethville borough
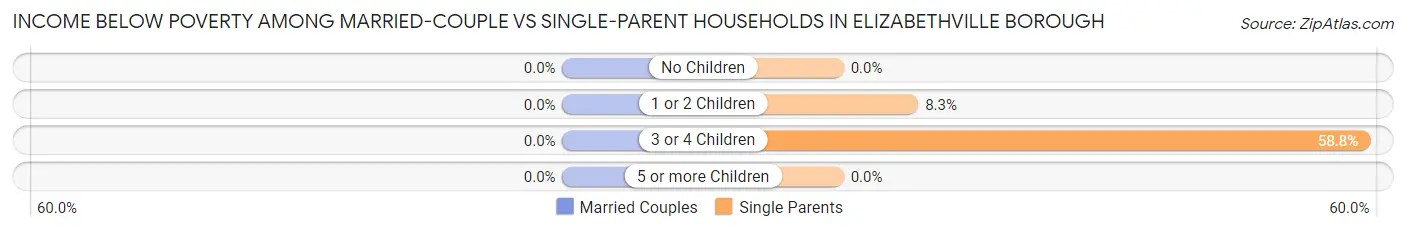
| Children | Married-Couple Families | Single-Parent Households |
| No Children | 0 (0.0%) | 0 (0.0%) |
| 1 or 2 Children | 0 (0.0%) | 5 (8.3%) |
| 3 or 4 Children | 0 (0.0%) | 10 (58.8%) |
| 5 or more Children | 0 (0.0%) | 0 (0.0%) |
| Total | 0 (0.0%) | 15 (12.6%) |
Race in Elizabethville borough
The most populous races in Elizabethville borough are White / Caucasian (1,298 | 87.1%), Two or more Races (184 | 12.3%), and Hispanic or Latino (47 | 3.2%).
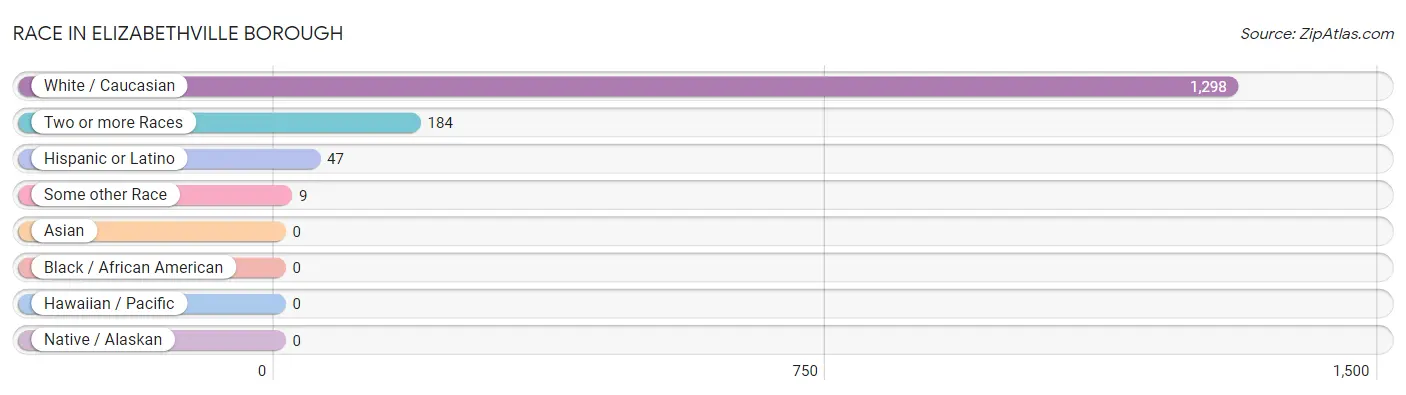
| Race | # Population | % Population |
| Asian | 0 | 0.0% |
| Black / African American | 0 | 0.0% |
| Hawaiian / Pacific | 0 | 0.0% |
| Hispanic or Latino | 47 | 3.2% |
| Native / Alaskan | 0 | 0.0% |
| White / Caucasian | 1,298 | 87.1% |
| Two or more Races | 184 | 12.3% |
| Some other Race | 9 | 0.6% |
| Total | 1,491 | 100.0% |
Ancestry in Elizabethville borough
The most populous ancestries reported in Elizabethville borough are German (528 | 35.4%), Irish (178 | 11.9%), Dutch (80 | 5.4%), Italian (55 | 3.7%), and Polish (53 | 3.5%), together accounting for 60.0% of all Elizabethville borough residents.
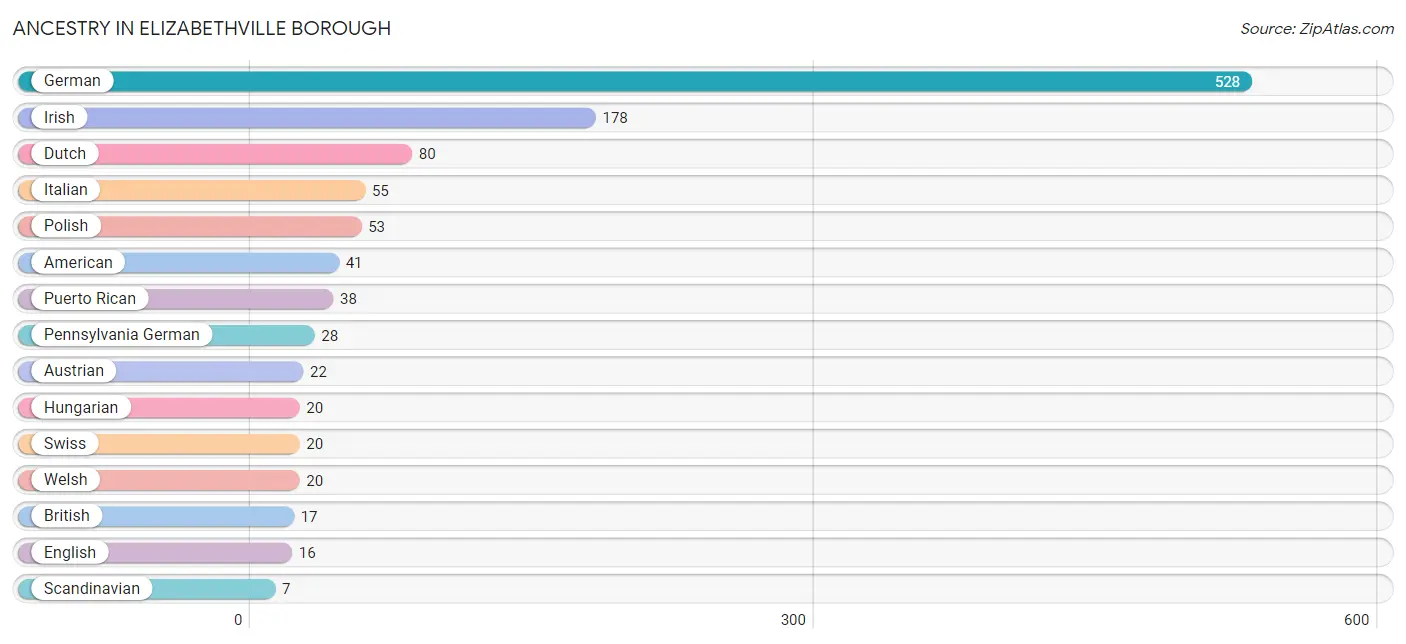
| Ancestry | # Population | % Population |
| American | 41 | 2.8% |
| Austrian | 22 | 1.5% |
| British | 17 | 1.1% |
| Czechoslovakian | 2 | 0.1% |
| Dutch | 80 | 5.4% |
| English | 16 | 1.1% |
| European | 3 | 0.2% |
| French | 3 | 0.2% |
| German | 528 | 35.4% |
| Hungarian | 20 | 1.3% |
| Irish | 178 | 11.9% |
| Italian | 55 | 3.7% |
| Lithuanian | 1 | 0.1% |
| Native Hawaiian | 4 | 0.3% |
| Pennsylvania German | 28 | 1.9% |
| Polish | 53 | 3.5% |
| Puerto Rican | 38 | 2.5% |
| Scandinavian | 7 | 0.5% |
| Scotch-Irish | 3 | 0.2% |
| Swiss | 20 | 1.3% |
| Welsh | 20 | 1.3% | View All 21 Rows |
Immigrants in Elizabethville borough
The most numerous immigrant groups reported in Elizabethville borough came from Eastern Europe (11 | 0.7%), Europe (11 | 0.7%), and Hungary (11 | 0.7%), together accounting for 2.2% of all Elizabethville borough residents.
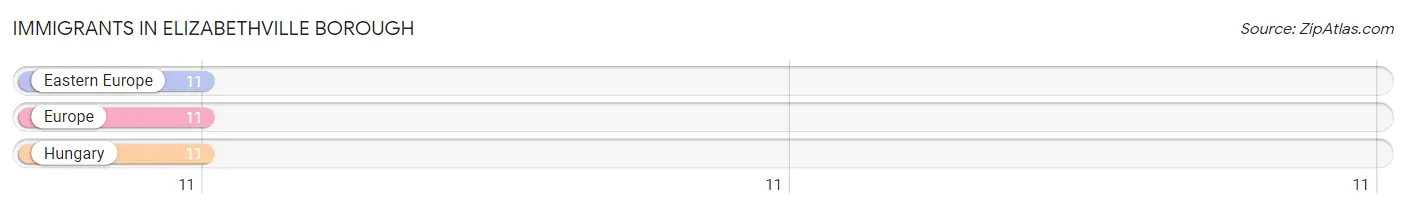
| Immigration Origin | # Population | % Population |
| Eastern Europe | 11 | 0.7% |
| Europe | 11 | 0.7% |
| Hungary | 11 | 0.7% | View All 3 Rows |
Sex and Age in Elizabethville borough
Sex and Age in Elizabethville borough
The most populous age groups in Elizabethville borough are 20 to 24 Years (106 | 14.6%) for men and 40 to 44 Years (94 | 12.3%) for women.
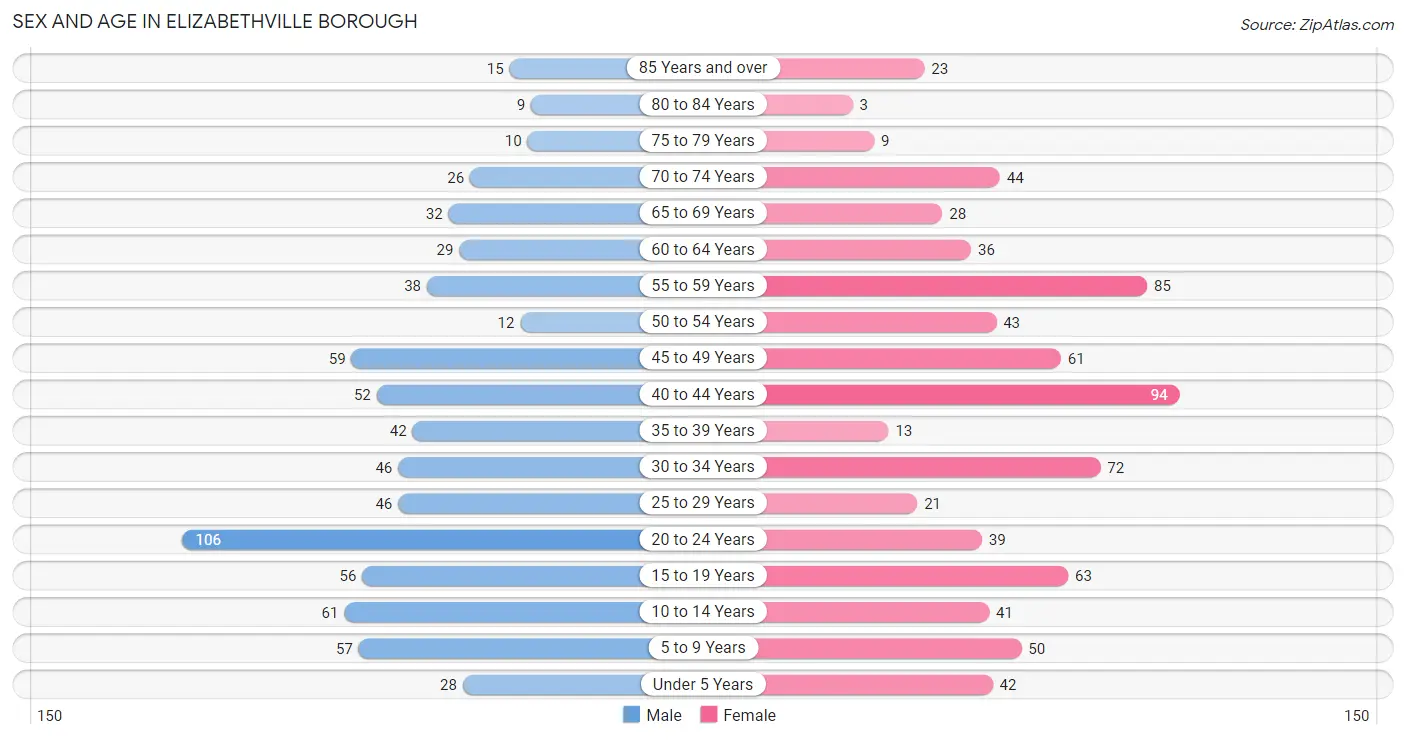
| Age Bracket | Male | Female |
| Under 5 Years | 28 (3.9%) | 42 (5.5%) |
| 5 to 9 Years | 57 (7.9%) | 50 (6.5%) |
| 10 to 14 Years | 61 (8.4%) | 41 (5.3%) |
| 15 to 19 Years | 56 (7.7%) | 63 (8.2%) |
| 20 to 24 Years | 106 (14.6%) | 39 (5.1%) |
| 25 to 29 Years | 46 (6.4%) | 21 (2.7%) |
| 30 to 34 Years | 46 (6.4%) | 72 (9.4%) |
| 35 to 39 Years | 42 (5.8%) | 13 (1.7%) |
| 40 to 44 Years | 52 (7.2%) | 94 (12.3%) |
| 45 to 49 Years | 59 (8.2%) | 61 (8.0%) |
| 50 to 54 Years | 12 (1.7%) | 43 (5.6%) |
| 55 to 59 Years | 38 (5.2%) | 85 (11.1%) |
| 60 to 64 Years | 29 (4.0%) | 36 (4.7%) |
| 65 to 69 Years | 32 (4.4%) | 28 (3.6%) |
| 70 to 74 Years | 26 (3.6%) | 44 (5.7%) |
| 75 to 79 Years | 10 (1.4%) | 9 (1.2%) |
| 80 to 84 Years | 9 (1.2%) | 3 (0.4%) |
| 85 Years and over | 15 (2.1%) | 23 (3.0%) |
| Total | 724 (100.0%) | 767 (100.0%) |
Families and Households in Elizabethville borough
Median Family Size in Elizabethville borough
The median family size in Elizabethville borough is 3.21 persons per family, with single female/mother families (59 | 15.8%) accounting for the largest median family size of 3.63 persons per family. On the other hand, single male/father families (60 | 16.1%) represent the smallest median family size with 2.67 persons per family.
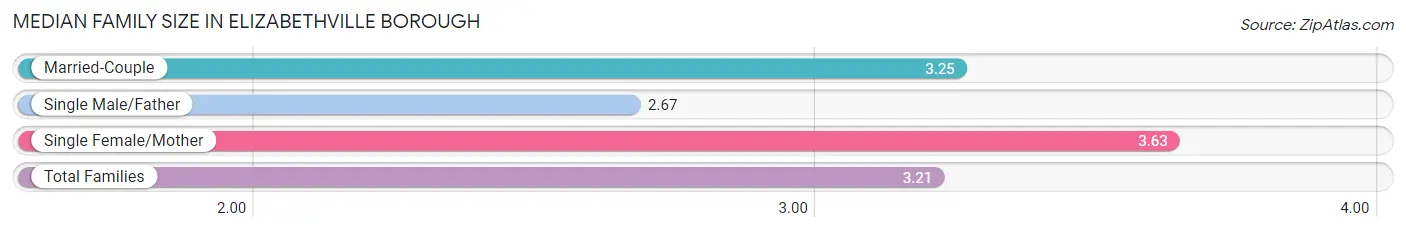
| Family Type | # Families | Family Size |
| Married-Couple | 254 (68.1%) | 3.25 |
| Single Male/Father | 60 (16.1%) | 2.67 |
| Single Female/Mother | 59 (15.8%) | 3.63 |
| Total Families | 373 (100.0%) | 3.21 |
Median Household Size in Elizabethville borough
The median household size in Elizabethville borough is 2.65 persons per household, with single female/mother households (59 | 10.7%) accounting for the largest median household size of 3.69 persons per household. non-family households (177 | 32.2%) represent the smallest median household size with 1.26 persons per household.
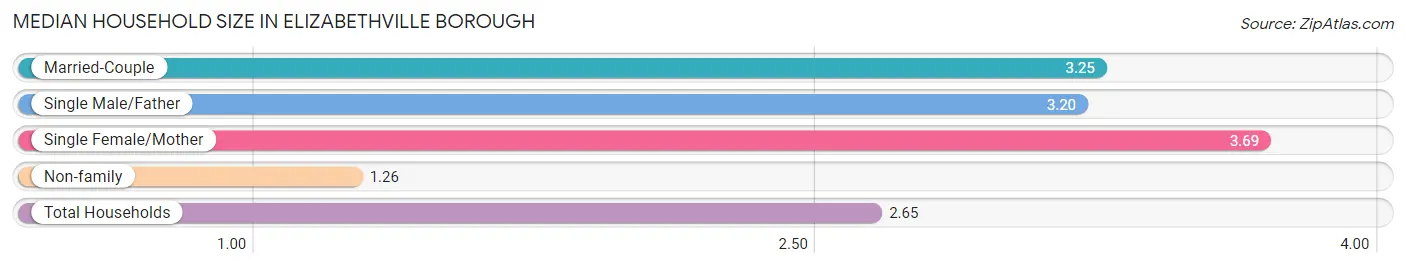
| Household Type | # Households | Household Size |
| Married-Couple | 254 (46.2%) | 3.25 |
| Single Male/Father | 60 (10.9%) | 3.20 |
| Single Female/Mother | 59 (10.7%) | 3.69 |
| Non-family | 177 (32.2%) | 1.26 |
| Total Households | 550 (100.0%) | 2.65 |
Household Size by Marriage Status in Elizabethville borough
Out of a total of 550 households in Elizabethville borough, 373 (67.8%) are family households, while 177 (32.2%) are nonfamily households. The most numerous type of family households are 2-person households, comprising 165, and the most common type of nonfamily households are 1-person households, comprising 156.
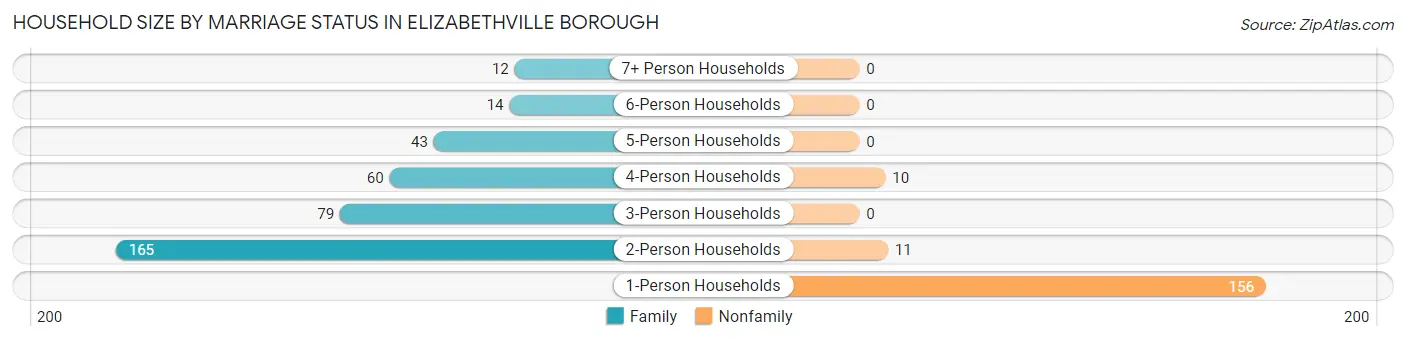
| Household Size | Family Households | Nonfamily Households |
| 1-Person Households | - | 156 (28.4%) |
| 2-Person Households | 165 (30.0%) | 11 (2.0%) |
| 3-Person Households | 79 (14.4%) | 0 (0.0%) |
| 4-Person Households | 60 (10.9%) | 10 (1.8%) |
| 5-Person Households | 43 (7.8%) | 0 (0.0%) |
| 6-Person Households | 14 (2.5%) | 0 (0.0%) |
| 7+ Person Households | 12 (2.2%) | 0 (0.0%) |
| Total | 373 (67.8%) | 177 (32.2%) |
Female Fertility in Elizabethville borough
Fertility by Age in Elizabethville borough
Average fertility rate in Elizabethville borough is 40.0 births per 1,000 women. Women in the age bracket of 20 to 34 years have the highest fertility rate with 114.0 births per 1,000 women. Women in the age bracket of 20 to 34 years acount for 100.0% of all women with births.
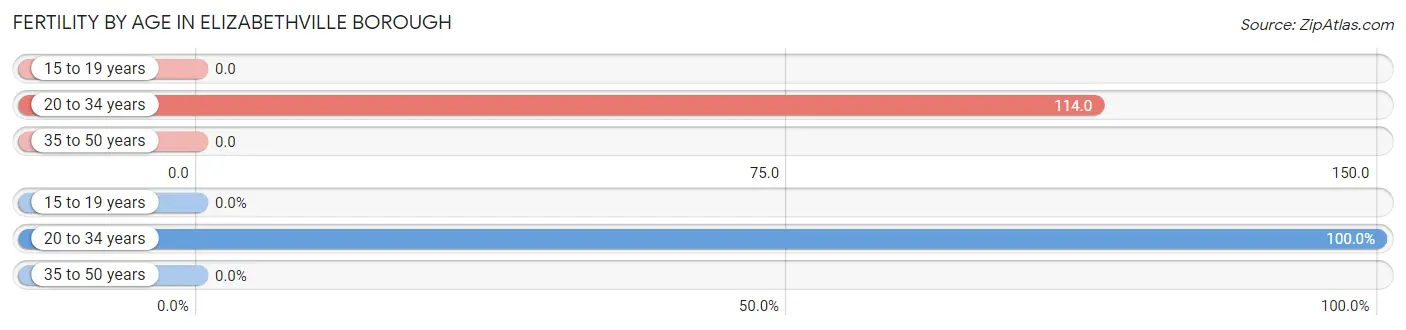
| Age Bracket | Women with Births | Births / 1,000 Women |
| 15 to 19 years | 0 (0.0%) | 0.0 |
| 20 to 34 years | 15 (100.0%) | 114.0 |
| 35 to 50 years | 0 (0.0%) | 0.0 |
| Total | 15 (100.0%) | 40.0 |
Fertility by Age by Marriage Status in Elizabethville borough
33.3% of women with births (15) in Elizabethville borough are married. The highest percentage of unmarried women with births falls into 20 to 34 years age bracket with 66.7% of them unmarried at the time of birth, while the lowest percentage of unmarried women with births belong to 20 to 34 years age bracket with 66.7% of them unmarried.
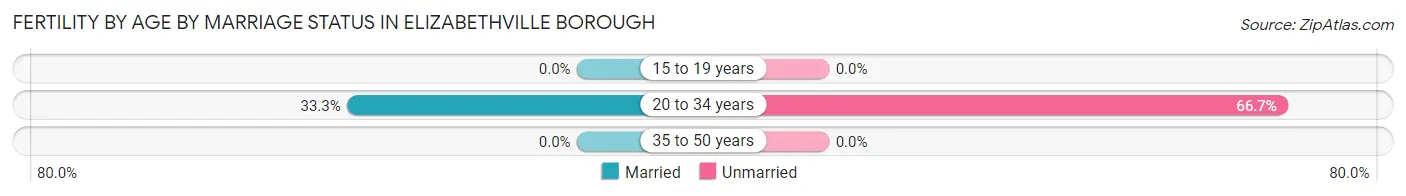
| Age Bracket | Married | Unmarried |
| 15 to 19 years | 0 (0.0%) | 0 (0.0%) |
| 20 to 34 years | 5 (33.3%) | 10 (66.7%) |
| 35 to 50 years | 0 (0.0%) | 0 (0.0%) |
| Total | 5 (33.3%) | 10 (66.7%) |
Fertility by Education in Elizabethville borough
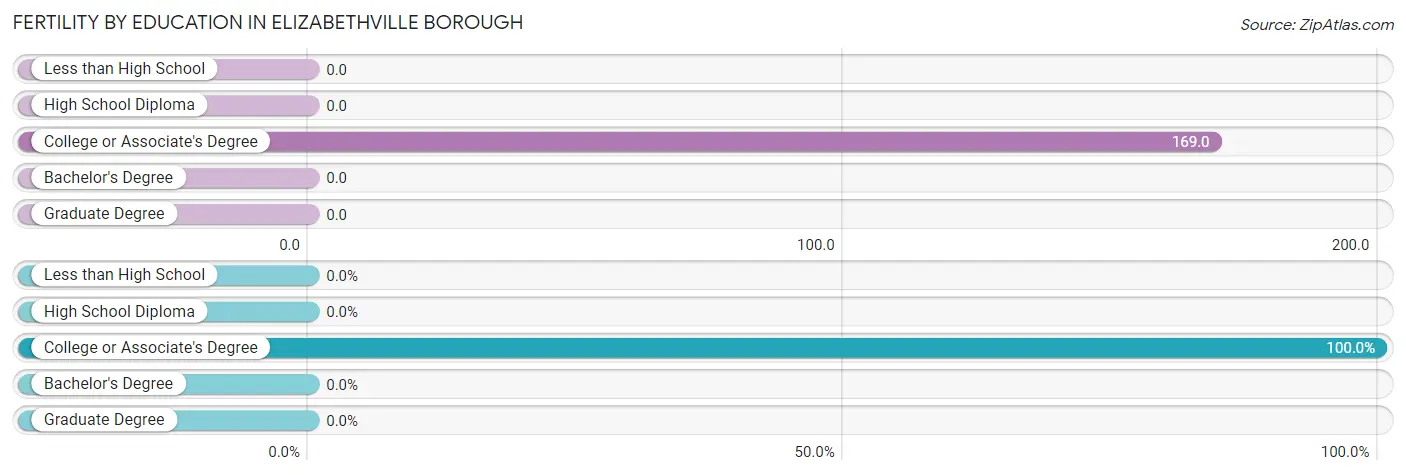
| Educational Attainment | Women with Births | Births / 1,000 Women |
| Less than High School | 0 (0.0%) | 0.0 |
| High School Diploma | 0 (0.0%) | 0.0 |
| College or Associate's Degree | 15 (100.0%) | 169.0 |
| Bachelor's Degree | 0 (0.0%) | 0.0 |
| Graduate Degree | 0 (0.0%) | 0.0 |
| Total | 15 (100.0%) | 40.0 |
Fertility by Education by Marriage Status in Elizabethville borough
66.7% of women with births in Elizabethville borough are unmarried. Women with the educational attainment of college or associate's degree are most likely to be married with 33.3% of them married at childbirth, while women with the educational attainment of college or associate's degree are least likely to be married with 66.7% of them unmarried at childbirth.
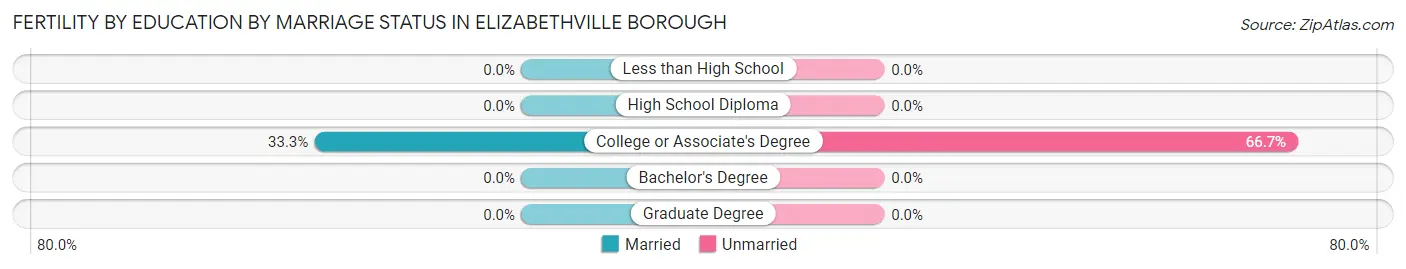
| Educational Attainment | Married | Unmarried |
| Less than High School | 0 (0.0%) | 0 (0.0%) |
| High School Diploma | 0 (0.0%) | 0 (0.0%) |
| College or Associate's Degree | 5 (33.3%) | 10 (66.7%) |
| Bachelor's Degree | 0 (0.0%) | 0 (0.0%) |
| Graduate Degree | 0 (0.0%) | 0 (0.0%) |
| Total | 5 (33.3%) | 10 (66.7%) |
Employment Characteristics in Elizabethville borough
Employment by Class of Employer in Elizabethville borough
Among the 819 employed individuals in Elizabethville borough, private company employees (572 | 69.8%), not-for-profit organizations (86 | 10.5%), and state government employees (47 | 5.7%) make up the most common classes of employment.
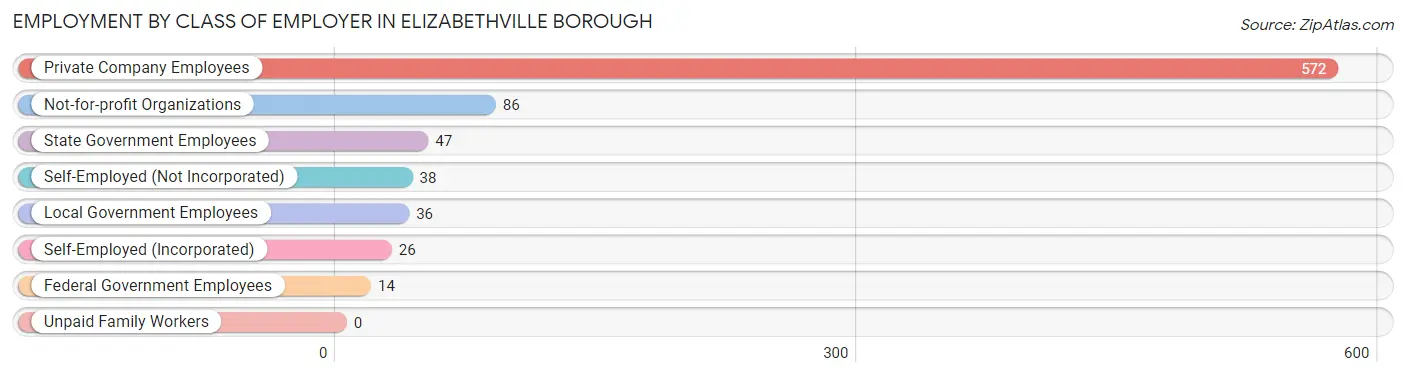
| Employer Class | # Employees | % Employees |
| Private Company Employees | 572 | 69.8% |
| Self-Employed (Incorporated) | 26 | 3.2% |
| Self-Employed (Not Incorporated) | 38 | 4.6% |
| Not-for-profit Organizations | 86 | 10.5% |
| Local Government Employees | 36 | 4.4% |
| State Government Employees | 47 | 5.7% |
| Federal Government Employees | 14 | 1.7% |
| Unpaid Family Workers | 0 | 0.0% |
| Total | 819 | 100.0% |
Employment Status by Age in Elizabethville borough
According to the labor force statistics for Elizabethville borough, out of the total population over 16 years of age (1,194), 69.8% or 833 individuals are in the labor force, with 1.3% or 11 of them unemployed. The age group with the highest labor force participation rate is 20 to 24 years, with 98.6% or 143 individuals in the labor force. Within the labor force, the 25 to 29 years age range has the highest percentage of unemployed individuals, with 8.2% or 5 of them being unemployed.
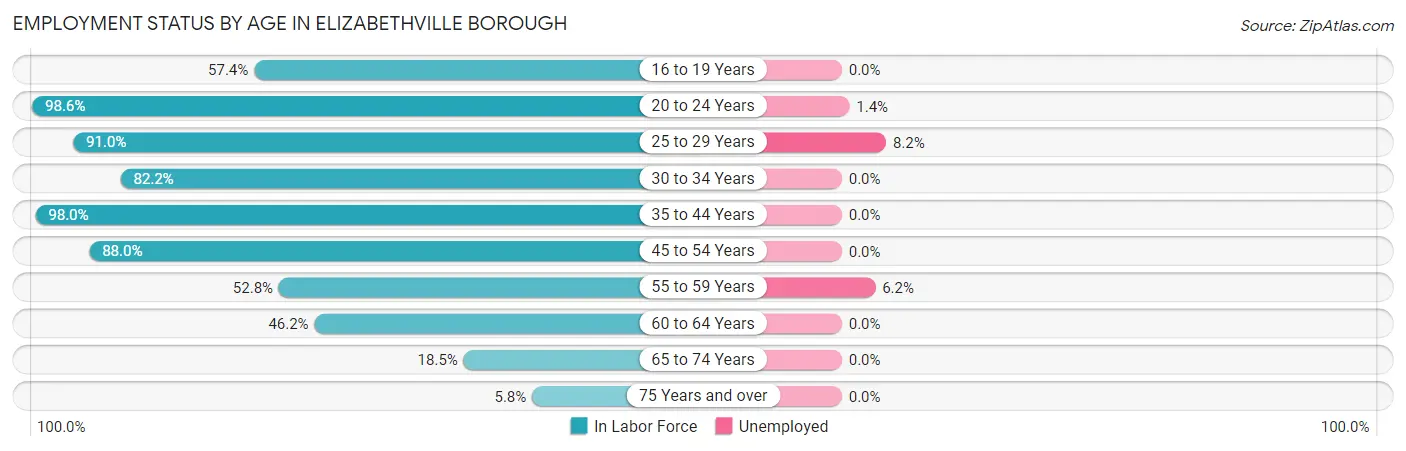
| Age Bracket | In Labor Force | Unemployed |
| 16 to 19 Years | 58 (57.4%) | 0 (0.0%) |
| 20 to 24 Years | 143 (98.6%) | 2 (1.4%) |
| 25 to 29 Years | 61 (91.0%) | 5 (8.2%) |
| 30 to 34 Years | 97 (82.2%) | 0 (0.0%) |
| 35 to 44 Years | 197 (98.0%) | 0 (0.0%) |
| 45 to 54 Years | 154 (88.0%) | 0 (0.0%) |
| 55 to 59 Years | 65 (52.8%) | 4 (6.2%) |
| 60 to 64 Years | 30 (46.2%) | 0 (0.0%) |
| 65 to 74 Years | 24 (18.5%) | 0 (0.0%) |
| 75 Years and over | 4 (5.8%) | 0 (0.0%) |
| Total | 833 (69.8%) | 11 (1.3%) |
Employment Status by Educational Attainment in Elizabethville borough
According to labor force statistics for Elizabethville borough, 80.6% of individuals (604) out of the total population between 25 and 64 years of age (749) are in the labor force, with 1.5% or 9 of them being unemployed. The group with the highest labor force participation rate are those with the educational attainment of bachelor's degree or higher, with 100.0% or 172 individuals in the labor force. Within the labor force, individuals with high school diploma education have the highest percentage of unemployment, with 2.5% or 4 of them being unemployed.
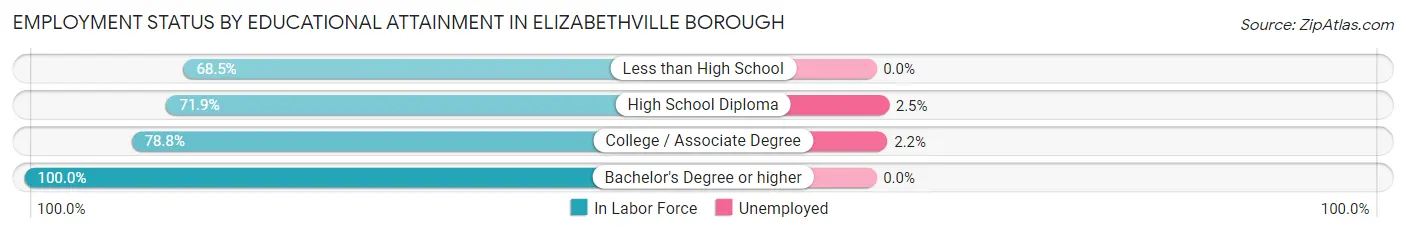
| Educational Attainment | In Labor Force | Unemployed |
| Less than High School | 50 (68.5%) | 0 (0.0%) |
| High School Diploma | 159 (71.9%) | 6 (2.5%) |
| College / Associate Degree | 223 (78.8%) | 6 (2.2%) |
| Bachelor's Degree or higher | 172 (100.0%) | 0 (0.0%) |
| Total | 604 (80.6%) | 11 (1.5%) |
Employment Occupations by Sex in Elizabethville borough
Management, Business, Science and Arts Occupations
The most common Management, Business, Science and Arts occupations in Elizabethville borough are Community & Social Service (75 | 9.1%), Management (53 | 6.5%), Arts, Media & Entertainment (39 | 4.7%), Business & Financial (36 | 4.4%), and Computers, Engineering & Science (35 | 4.3%).
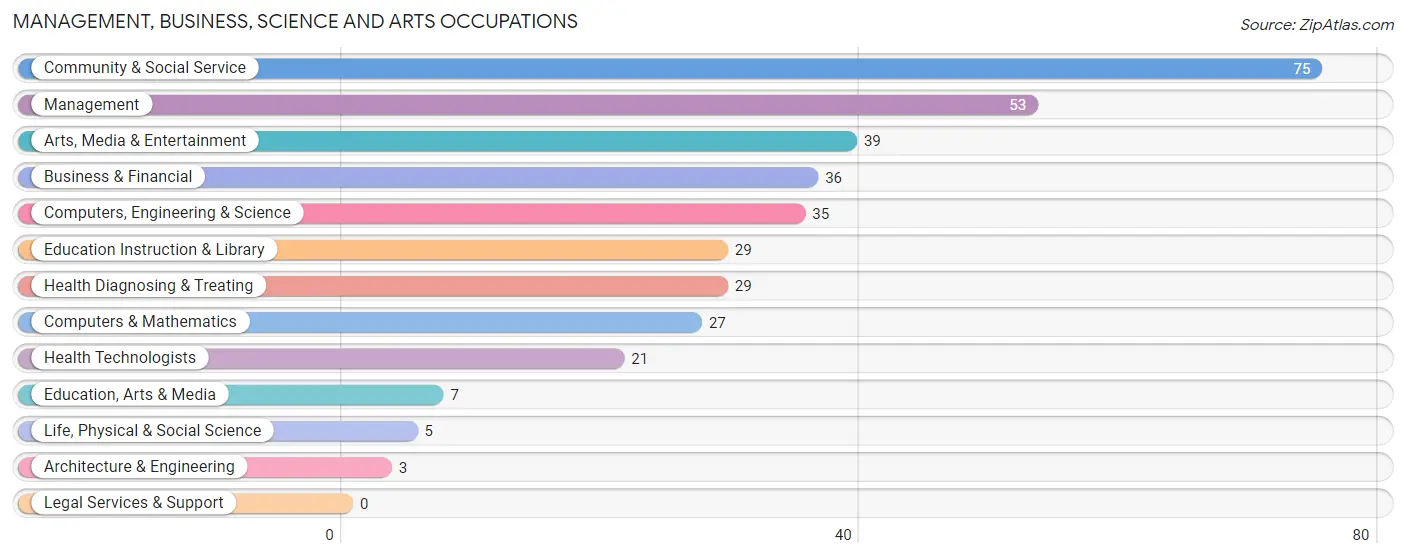
Management, Business, Science and Arts Occupations by Sex
Within the Management, Business, Science and Arts occupations in Elizabethville borough, the most male-oriented occupations are Architecture & Engineering (100.0%), Arts, Media & Entertainment (84.6%), and Management (83.0%), while the most female-oriented occupations are Life, Physical & Social Science (100.0%), Education Instruction & Library (100.0%), and Health Technologists (90.5%).
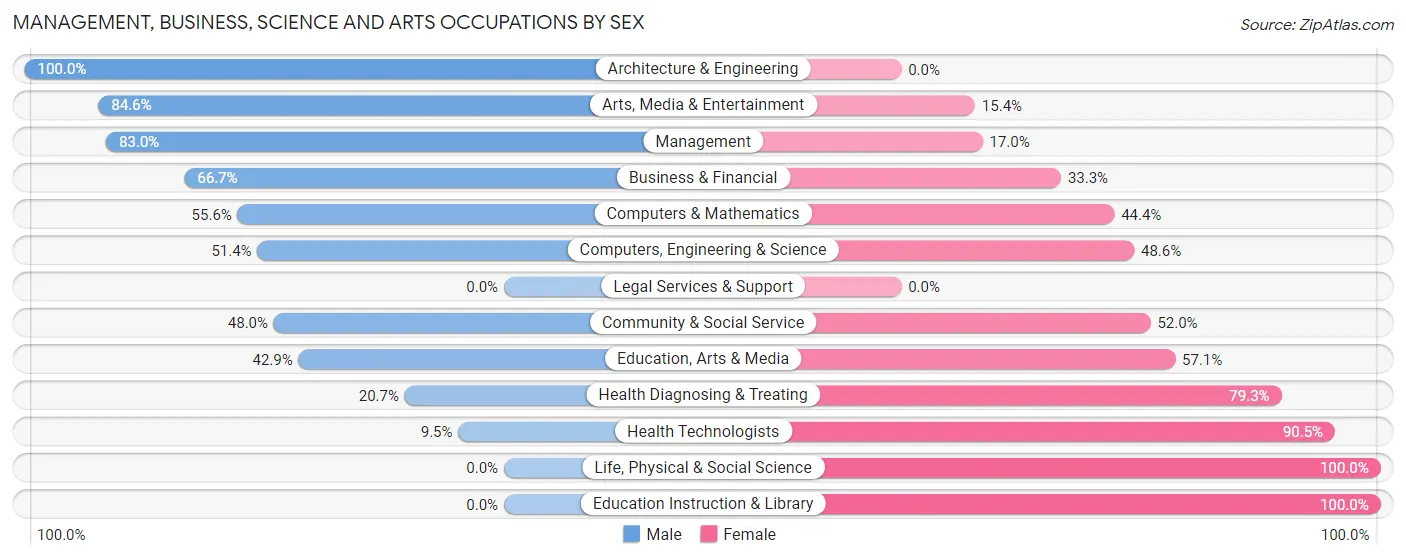
| Occupation | Male | Female |
| Management | 44 (83.0%) | 9 (17.0%) |
| Business & Financial | 24 (66.7%) | 12 (33.3%) |
| Computers, Engineering & Science | 18 (51.4%) | 17 (48.6%) |
| Computers & Mathematics | 15 (55.6%) | 12 (44.4%) |
| Architecture & Engineering | 3 (100.0%) | 0 (0.0%) |
| Life, Physical & Social Science | 0 (0.0%) | 5 (100.0%) |
| Community & Social Service | 36 (48.0%) | 39 (52.0%) |
| Education, Arts & Media | 3 (42.9%) | 4 (57.1%) |
| Legal Services & Support | 0 (0.0%) | 0 (0.0%) |
| Education Instruction & Library | 0 (0.0%) | 29 (100.0%) |
| Arts, Media & Entertainment | 33 (84.6%) | 6 (15.4%) |
| Health Diagnosing & Treating | 6 (20.7%) | 23 (79.3%) |
| Health Technologists | 2 (9.5%) | 19 (90.5%) |
| Total (Category) | 128 (56.1%) | 100 (43.9%) |
| Total (Overall) | 414 (50.4%) | 408 (49.6%) |
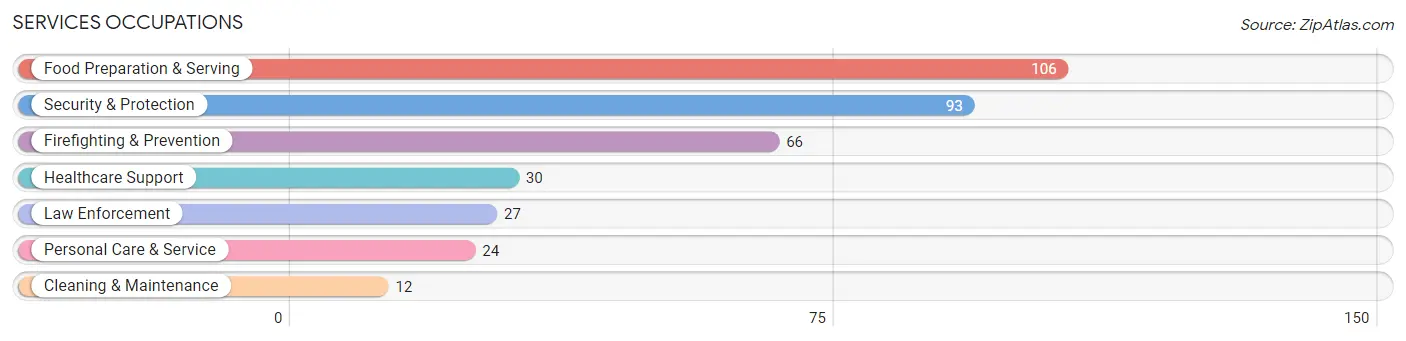
Services Occupations
The most common Services occupations in Elizabethville borough are Food Preparation & Serving (106 | 12.9%), Security & Protection (93 | 11.3%), Firefighting & Prevention (66 | 8.0%), Healthcare Support (30 | 3.6%), and Law Enforcement (27 | 3.3%).
Services Occupations by Sex
Within the Services occupations in Elizabethville borough, the most male-oriented occupations are Law Enforcement (88.9%), Food Preparation & Serving (73.6%), and Security & Protection (25.8%), while the most female-oriented occupations are Healthcare Support (100.0%), Firefighting & Prevention (100.0%), and Cleaning & Maintenance (100.0%).
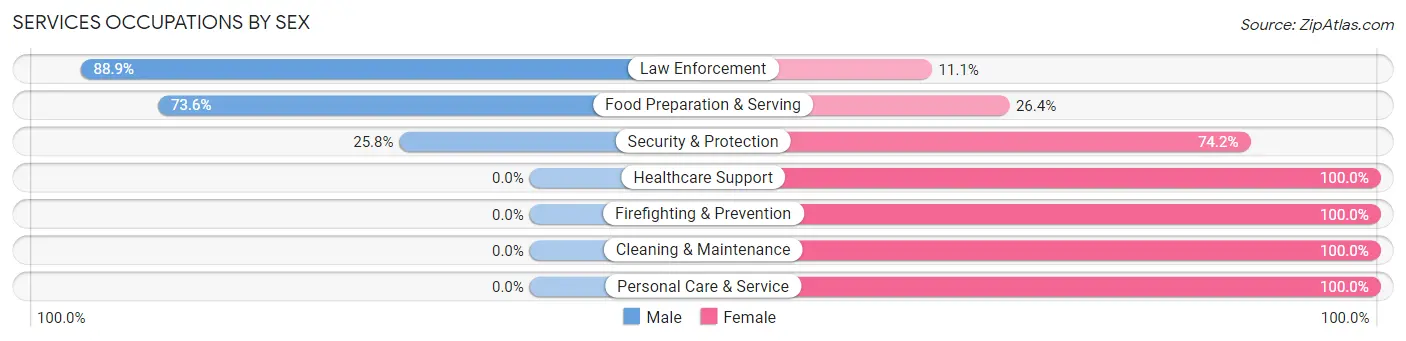
| Occupation | Male | Female |
| Healthcare Support | 0 (0.0%) | 30 (100.0%) |
| Security & Protection | 24 (25.8%) | 69 (74.2%) |
| Firefighting & Prevention | 0 (0.0%) | 66 (100.0%) |
| Law Enforcement | 24 (88.9%) | 3 (11.1%) |
| Food Preparation & Serving | 78 (73.6%) | 28 (26.4%) |
| Cleaning & Maintenance | 0 (0.0%) | 12 (100.0%) |
| Personal Care & Service | 0 (0.0%) | 24 (100.0%) |
| Total (Category) | 102 (38.5%) | 163 (61.5%) |
| Total (Overall) | 414 (50.4%) | 408 (49.6%) |
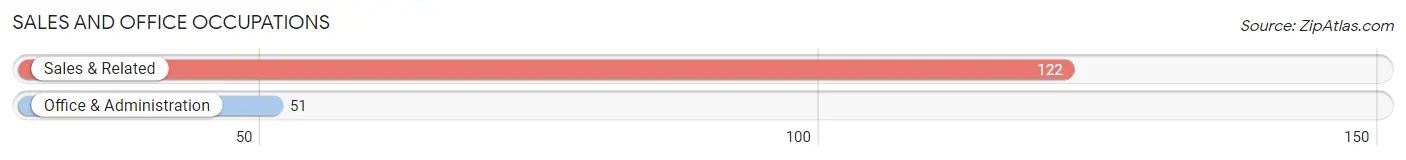
Sales and Office Occupations
The most common Sales and Office occupations in Elizabethville borough are Sales & Related (122 | 14.8%), and Office & Administration (51 | 6.2%).
Sales and Office Occupations by Sex
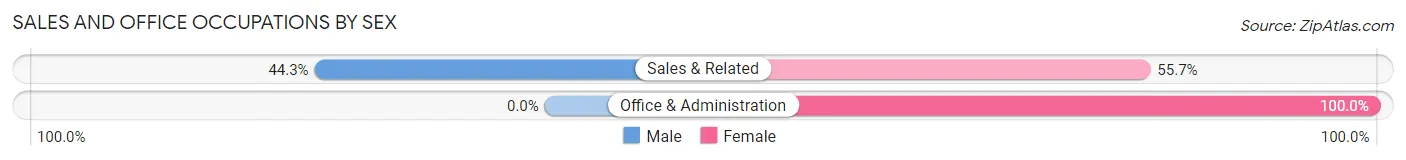
| Occupation | Male | Female |
| Sales & Related | 54 (44.3%) | 68 (55.7%) |
| Office & Administration | 0 (0.0%) | 51 (100.0%) |
| Total (Category) | 54 (31.2%) | 119 (68.8%) |
| Total (Overall) | 414 (50.4%) | 408 (49.6%) |
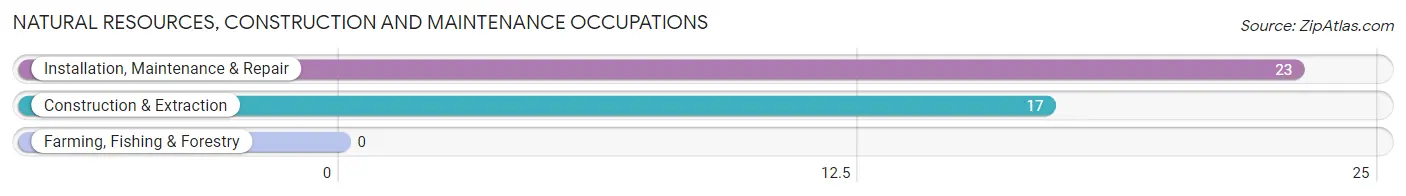
Natural Resources, Construction and Maintenance Occupations
The most common Natural Resources, Construction and Maintenance occupations in Elizabethville borough are Installation, Maintenance & Repair (23 | 2.8%), and Construction & Extraction (17 | 2.1%).
Natural Resources, Construction and Maintenance Occupations by Sex
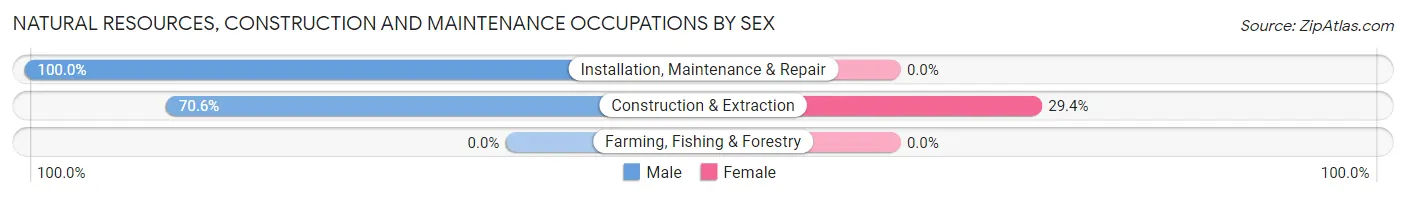
| Occupation | Male | Female |
| Farming, Fishing & Forestry | 0 (0.0%) | 0 (0.0%) |
| Construction & Extraction | 12 (70.6%) | 5 (29.4%) |
| Installation, Maintenance & Repair | 23 (100.0%) | 0 (0.0%) |
| Total (Category) | 35 (87.5%) | 5 (12.5%) |
| Total (Overall) | 414 (50.4%) | 408 (49.6%) |
Production, Transportation and Moving Occupations
The most common Production, Transportation and Moving occupations in Elizabethville borough are Production (66 | 8.0%), Material Moving (45 | 5.5%), and Transportation (5 | 0.6%).
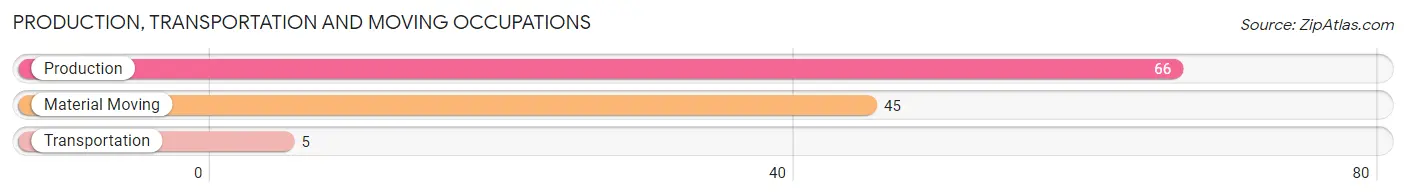
Production, Transportation and Moving Occupations by Sex
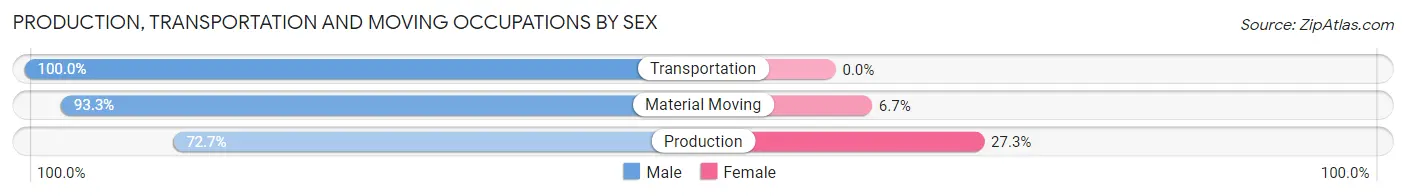
| Occupation | Male | Female |
| Production | 48 (72.7%) | 18 (27.3%) |
| Transportation | 5 (100.0%) | 0 (0.0%) |
| Material Moving | 42 (93.3%) | 3 (6.7%) |
| Total (Category) | 95 (81.9%) | 21 (18.1%) |
| Total (Overall) | 414 (50.4%) | 408 (49.6%) |
Employment Industries by Sex in Elizabethville borough
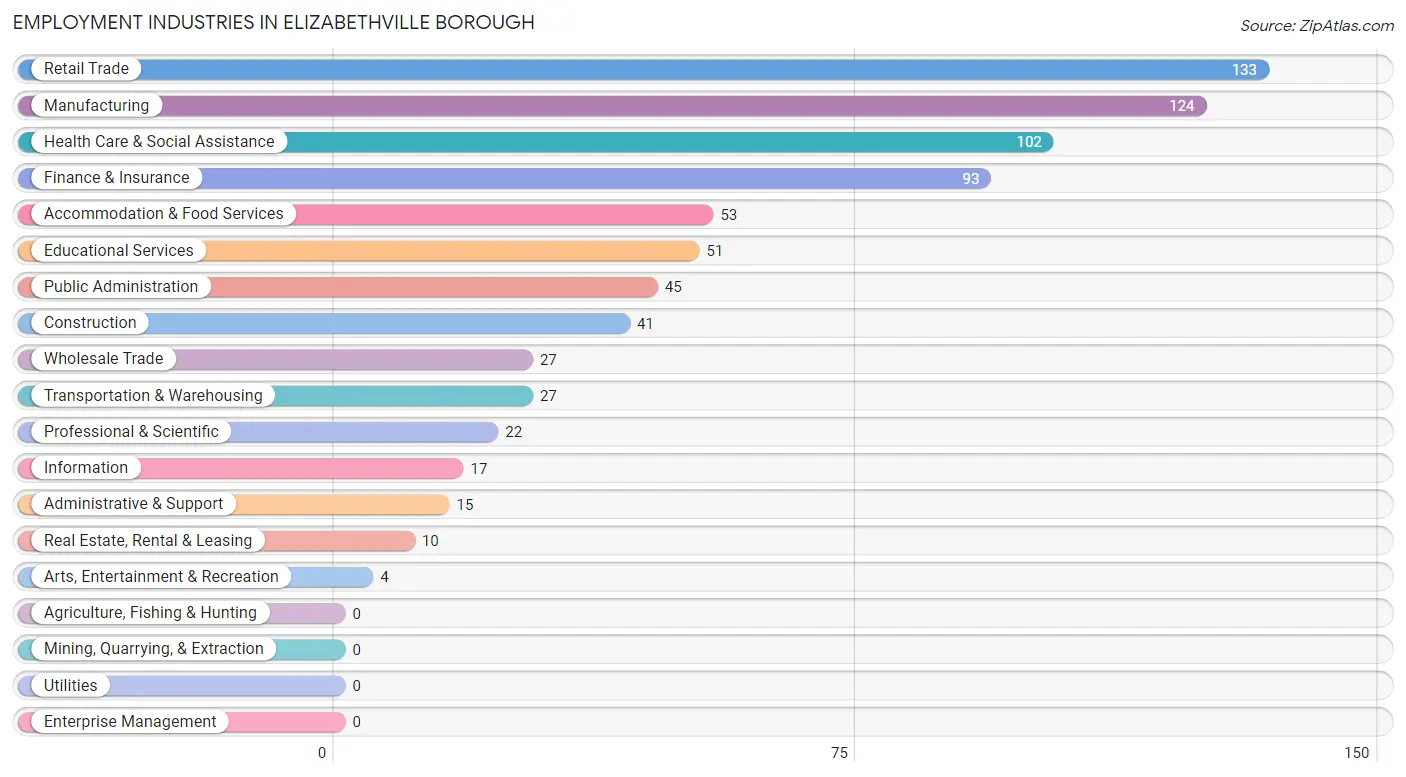
Employment Industries in Elizabethville borough
The major employment industries in Elizabethville borough include Retail Trade (133 | 16.2%), Manufacturing (124 | 15.1%), Health Care & Social Assistance (102 | 12.4%), Finance & Insurance (93 | 11.3%), and Accommodation & Food Services (53 | 6.5%).
Employment Industries by Sex in Elizabethville borough
The Elizabethville borough industries that see more men than women are Transportation & Warehousing (100.0%), Construction (87.8%), and Manufacturing (76.6%), whereas the industries that tend to have a higher number of women are Administrative & Support (100.0%), Educational Services (100.0%), and Arts, Entertainment & Recreation (100.0%).
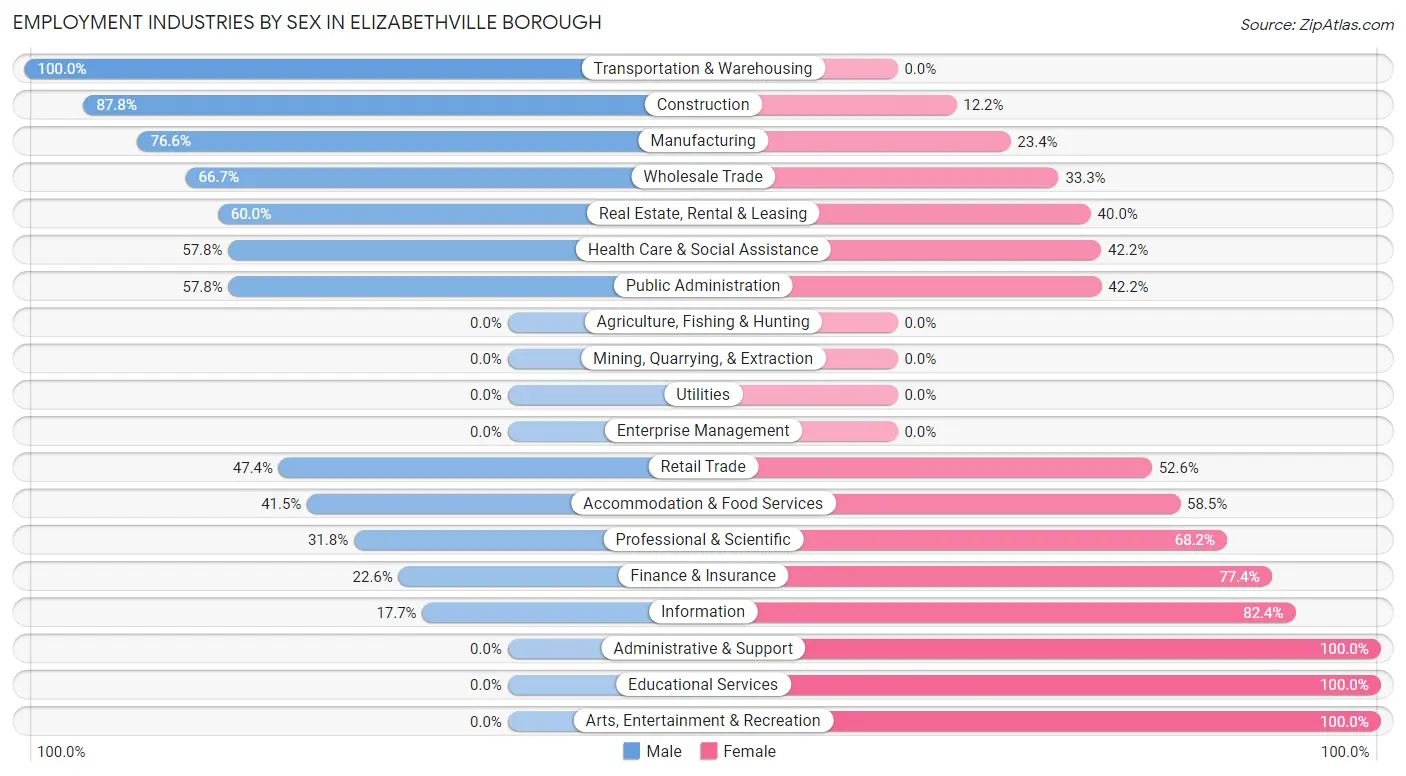
| Industry | Male | Female |
| Agriculture, Fishing & Hunting | 0 (0.0%) | 0 (0.0%) |
| Mining, Quarrying, & Extraction | 0 (0.0%) | 0 (0.0%) |
| Construction | 36 (87.8%) | 5 (12.2%) |
| Manufacturing | 95 (76.6%) | 29 (23.4%) |
| Wholesale Trade | 18 (66.7%) | 9 (33.3%) |
| Retail Trade | 63 (47.4%) | 70 (52.6%) |
| Transportation & Warehousing | 27 (100.0%) | 0 (0.0%) |
| Utilities | 0 (0.0%) | 0 (0.0%) |
| Information | 3 (17.6%) | 14 (82.4%) |
| Finance & Insurance | 21 (22.6%) | 72 (77.4%) |
| Real Estate, Rental & Leasing | 6 (60.0%) | 4 (40.0%) |
| Professional & Scientific | 7 (31.8%) | 15 (68.2%) |
| Enterprise Management | 0 (0.0%) | 0 (0.0%) |
| Administrative & Support | 0 (0.0%) | 15 (100.0%) |
| Educational Services | 0 (0.0%) | 51 (100.0%) |
| Health Care & Social Assistance | 59 (57.8%) | 43 (42.2%) |
| Arts, Entertainment & Recreation | 0 (0.0%) | 4 (100.0%) |
| Accommodation & Food Services | 22 (41.5%) | 31 (58.5%) |
| Public Administration | 26 (57.8%) | 19 (42.2%) |
| Total | 414 (50.4%) | 408 (49.6%) |
Education in Elizabethville borough
School Enrollment in Elizabethville borough
The most common levels of schooling among the 356 students in Elizabethville borough are elementary school (109 | 30.6%), middle school (77 | 21.6%), and high school (74 | 20.8%).
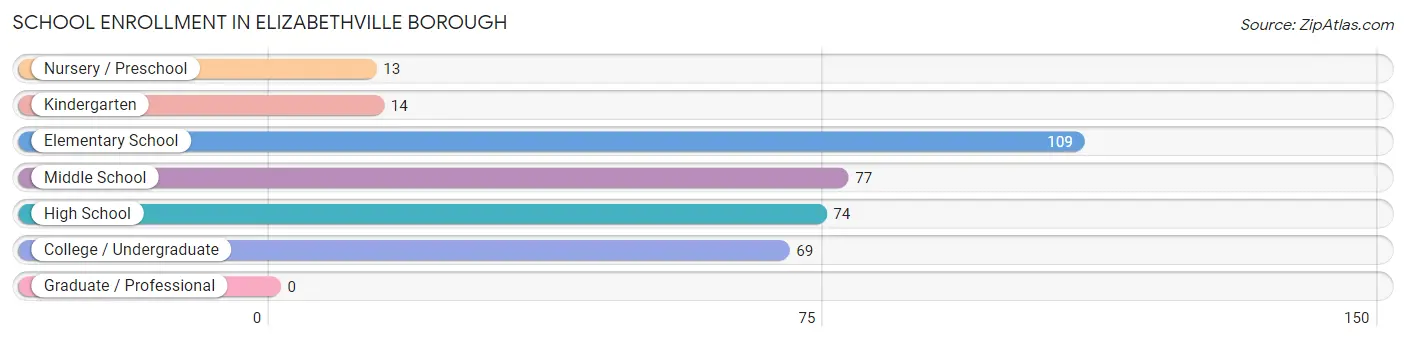
| School Level | # Students | % Students |
| Nursery / Preschool | 13 | 3.6% |
| Kindergarten | 14 | 3.9% |
| Elementary School | 109 | 30.6% |
| Middle School | 77 | 21.6% |
| High School | 74 | 20.8% |
| College / Undergraduate | 69 | 19.4% |
| Graduate / Professional | 0 | 0.0% |
| Total | 356 | 100.0% |
School Enrollment by Age by Funding Source in Elizabethville borough
Out of a total of 356 students who are enrolled in schools in Elizabethville borough, 30 (8.4%) attend a private institution, while the remaining 326 (91.6%) are enrolled in public schools. The age group of 3 to 4 year olds has the highest likelihood of being enrolled in private schools, with 9 (100.0% in the age bracket) enrolled. Conversely, the age group of 15 to 17 year olds has the lowest likelihood of being enrolled in a private school, with 56 (100.0% in the age bracket) attending a public institution.
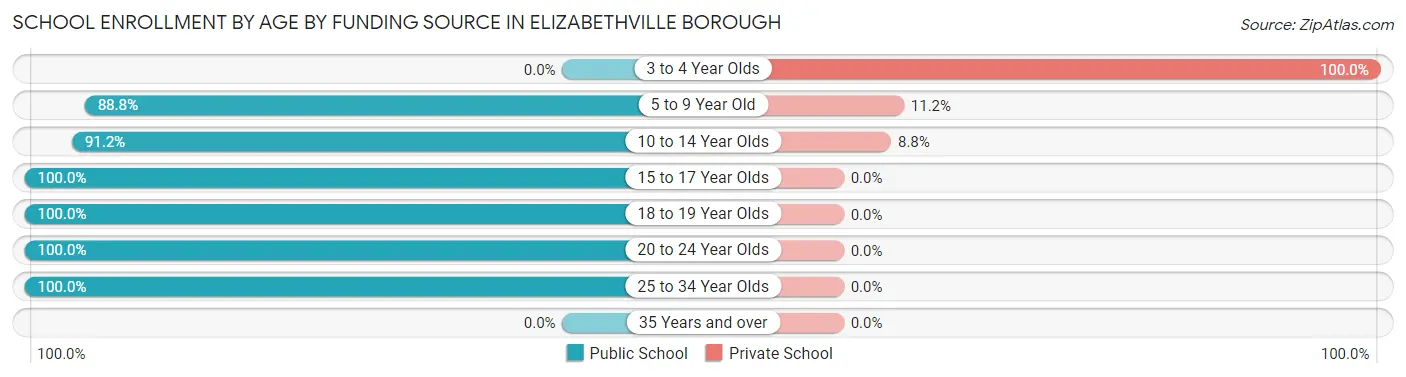
| Age Bracket | Public School | Private School |
| 3 to 4 Year Olds | 0 (0.0%) | 9 (100.0%) |
| 5 to 9 Year Old | 95 (88.8%) | 12 (11.2%) |
| 10 to 14 Year Olds | 93 (91.2%) | 9 (8.8%) |
| 15 to 17 Year Olds | 56 (100.0%) | 0 (0.0%) |
| 18 to 19 Year Olds | 50 (100.0%) | 0 (0.0%) |
| 20 to 24 Year Olds | 14 (100.0%) | 0 (0.0%) |
| 25 to 34 Year Olds | 18 (100.0%) | 0 (0.0%) |
| 35 Years and over | 0 (0.0%) | 0 (0.0%) |
| Total | 326 (91.6%) | 30 (8.4%) |
Educational Attainment by Field of Study in Elizabethville borough
Arts & humanities (83 | 35.0%), liberal arts & history (56 | 23.6%), business (38 | 16.0%), education (20 | 8.4%), and literature & languages (11 | 4.6%) are the most common fields of study among 237 individuals in Elizabethville borough who have obtained a bachelor's degree or higher.
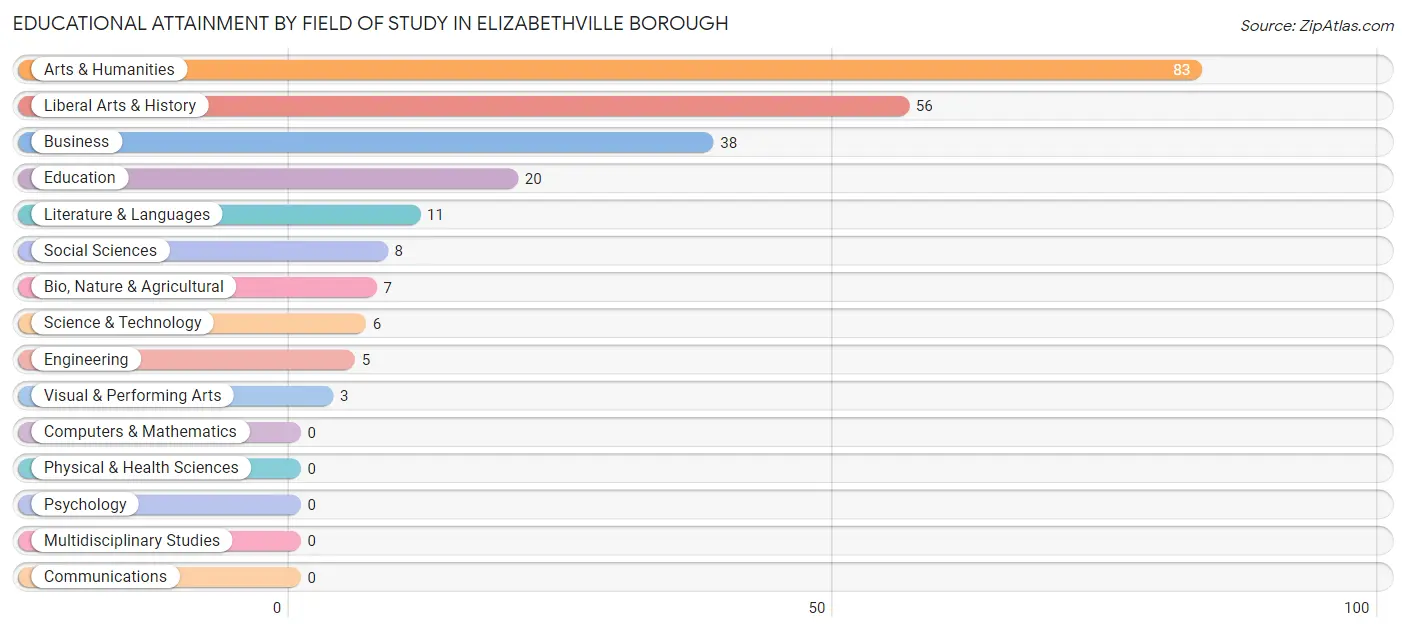
| Field of Study | # Graduates | % Graduates |
| Computers & Mathematics | 0 | 0.0% |
| Bio, Nature & Agricultural | 7 | 2.9% |
| Physical & Health Sciences | 0 | 0.0% |
| Psychology | 0 | 0.0% |
| Social Sciences | 8 | 3.4% |
| Engineering | 5 | 2.1% |
| Multidisciplinary Studies | 0 | 0.0% |
| Science & Technology | 6 | 2.5% |
| Business | 38 | 16.0% |
| Education | 20 | 8.4% |
| Literature & Languages | 11 | 4.6% |
| Liberal Arts & History | 56 | 23.6% |
| Visual & Performing Arts | 3 | 1.3% |
| Communications | 0 | 0.0% |
| Arts & Humanities | 83 | 35.0% |
| Total | 237 | 100.0% |
Transportation & Commute in Elizabethville borough
Vehicle Availability by Sex in Elizabethville borough
The most prevalent vehicle ownership categories in Elizabethville borough are males with 2 vehicles (218, accounting for 53.0%) and females with 2 vehicles (162, making up 53.4%).
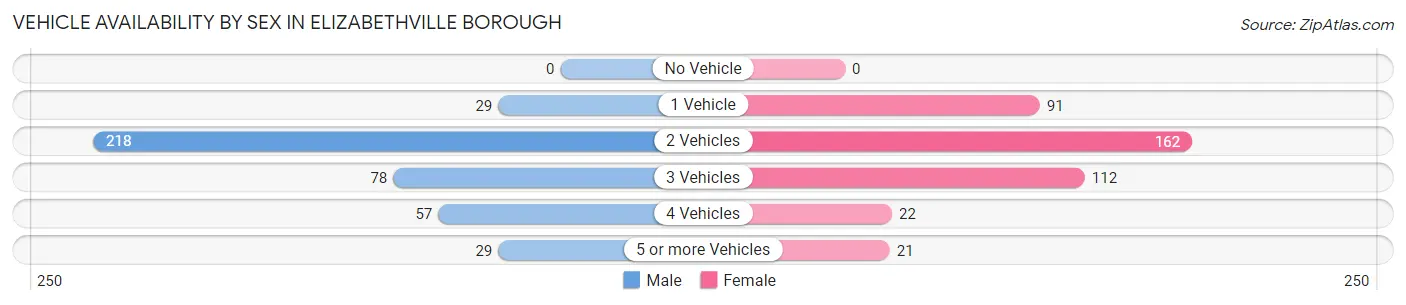
| Vehicles Available | Male | Female |
| No Vehicle | 0 (0.0%) | 0 (0.0%) |
| 1 Vehicle | 29 (7.1%) | 91 (22.3%) |
| 2 Vehicles | 218 (53.0%) | 162 (39.7%) |
| 3 Vehicles | 78 (19.0%) | 112 (27.5%) |
| 4 Vehicles | 57 (13.9%) | 22 (5.4%) |
| 5 or more Vehicles | 29 (7.1%) | 21 (5.1%) |
| Total | 411 (100.0%) | 408 (100.0%) |
Commute Time in Elizabethville borough
The most frequently occuring commute durations in Elizabethville borough are 15 to 19 minutes (137 commuters, 18.7%), 5 to 9 minutes (129 commuters, 17.6%), and 45 to 59 minutes (123 commuters, 16.8%).
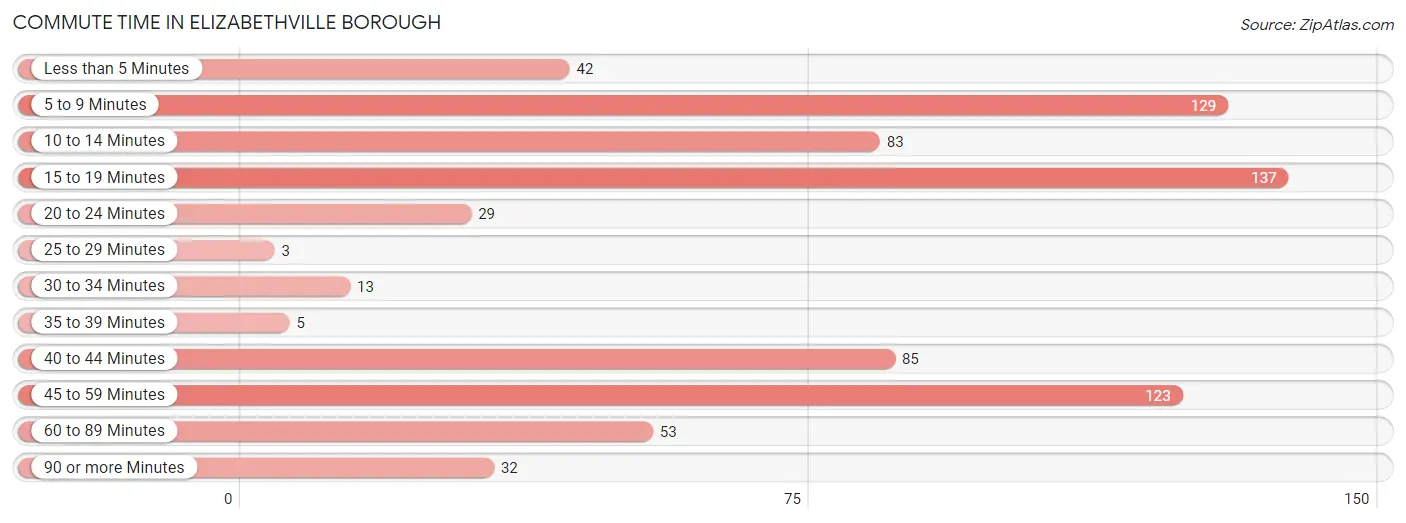
| Commute Time | # Commuters | % Commuters |
| Less than 5 Minutes | 42 | 5.7% |
| 5 to 9 Minutes | 129 | 17.6% |
| 10 to 14 Minutes | 83 | 11.3% |
| 15 to 19 Minutes | 137 | 18.7% |
| 20 to 24 Minutes | 29 | 4.0% |
| 25 to 29 Minutes | 3 | 0.4% |
| 30 to 34 Minutes | 13 | 1.8% |
| 35 to 39 Minutes | 5 | 0.7% |
| 40 to 44 Minutes | 85 | 11.6% |
| 45 to 59 Minutes | 123 | 16.8% |
| 60 to 89 Minutes | 53 | 7.2% |
| 90 or more Minutes | 32 | 4.4% |
Commute Time by Sex in Elizabethville borough
The most common commute times in Elizabethville borough are 15 to 19 minutes (99 commuters, 27.5%) for males and 5 to 9 minutes (101 commuters, 27.0%) for females.
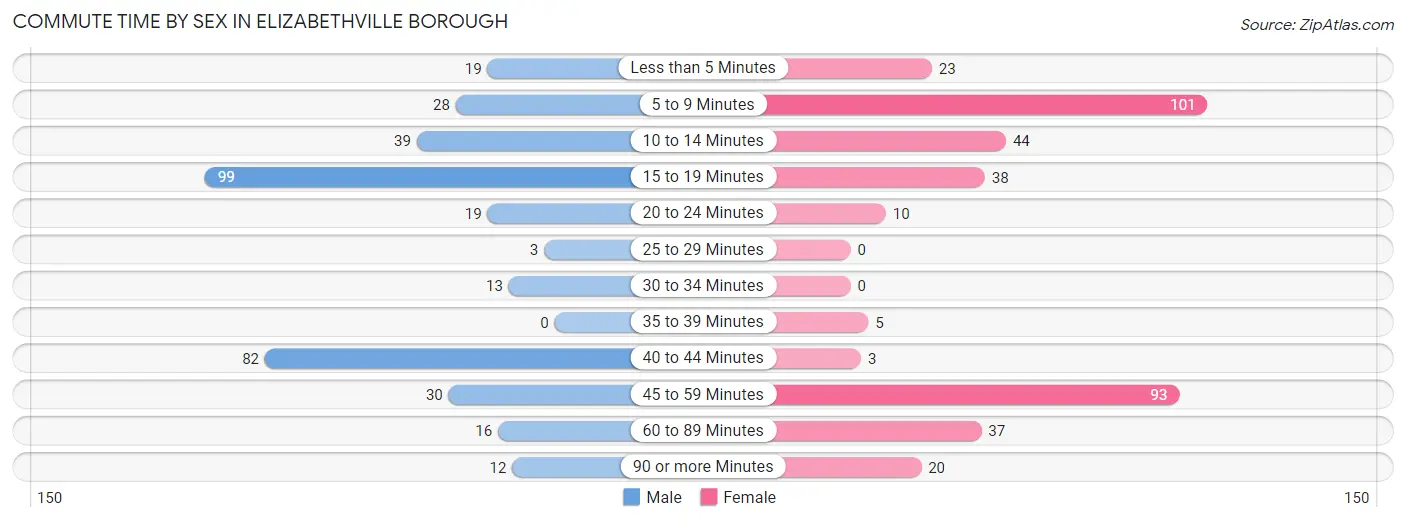
| Commute Time | Male | Female |
| Less than 5 Minutes | 19 (5.3%) | 23 (6.1%) |
| 5 to 9 Minutes | 28 (7.8%) | 101 (27.0%) |
| 10 to 14 Minutes | 39 (10.8%) | 44 (11.8%) |
| 15 to 19 Minutes | 99 (27.5%) | 38 (10.2%) |
| 20 to 24 Minutes | 19 (5.3%) | 10 (2.7%) |
| 25 to 29 Minutes | 3 (0.8%) | 0 (0.0%) |
| 30 to 34 Minutes | 13 (3.6%) | 0 (0.0%) |
| 35 to 39 Minutes | 0 (0.0%) | 5 (1.3%) |
| 40 to 44 Minutes | 82 (22.8%) | 3 (0.8%) |
| 45 to 59 Minutes | 30 (8.3%) | 93 (24.9%) |
| 60 to 89 Minutes | 16 (4.4%) | 37 (9.9%) |
| 90 or more Minutes | 12 (3.3%) | 20 (5.3%) |
Time of Departure to Work by Sex in Elizabethville borough
The most frequent times of departure to work in Elizabethville borough are 7:00 AM to 7:29 AM (98, 27.2%) for males and 4:00 PM to 11:59 PM (74, 19.8%) for females.
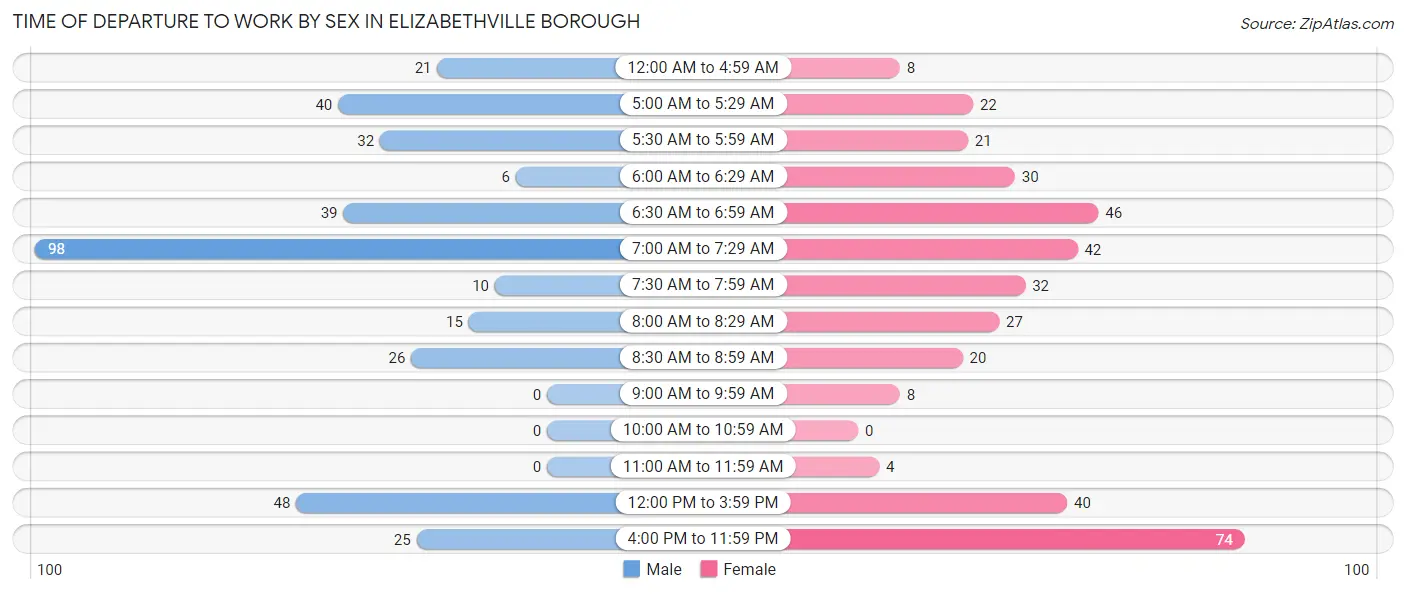
| Time of Departure | Male | Female |
| 12:00 AM to 4:59 AM | 21 (5.8%) | 8 (2.1%) |
| 5:00 AM to 5:29 AM | 40 (11.1%) | 22 (5.9%) |
| 5:30 AM to 5:59 AM | 32 (8.9%) | 21 (5.6%) |
| 6:00 AM to 6:29 AM | 6 (1.7%) | 30 (8.0%) |
| 6:30 AM to 6:59 AM | 39 (10.8%) | 46 (12.3%) |
| 7:00 AM to 7:29 AM | 98 (27.2%) | 42 (11.2%) |
| 7:30 AM to 7:59 AM | 10 (2.8%) | 32 (8.6%) |
| 8:00 AM to 8:29 AM | 15 (4.2%) | 27 (7.2%) |
| 8:30 AM to 8:59 AM | 26 (7.2%) | 20 (5.3%) |
| 9:00 AM to 9:59 AM | 0 (0.0%) | 8 (2.1%) |
| 10:00 AM to 10:59 AM | 0 (0.0%) | 0 (0.0%) |
| 11:00 AM to 11:59 AM | 0 (0.0%) | 4 (1.1%) |
| 12:00 PM to 3:59 PM | 48 (13.3%) | 40 (10.7%) |
| 4:00 PM to 11:59 PM | 25 (6.9%) | 74 (19.8%) |
| Total | 360 (100.0%) | 374 (100.0%) |
Housing Occupancy in Elizabethville borough
Occupancy by Ownership in Elizabethville borough
Of the total 550 dwellings in Elizabethville borough, owner-occupied units account for 360 (65.4%), while renter-occupied units make up 190 (34.5%).
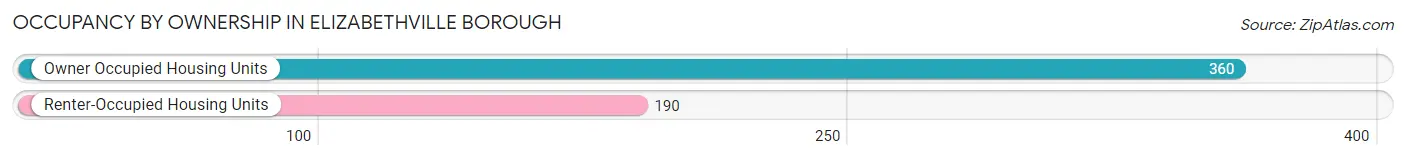
| Occupancy | # Housing Units | % Housing Units |
| Owner Occupied Housing Units | 360 | 65.4% |
| Renter-Occupied Housing Units | 190 | 34.5% |
| Total Occupied Housing Units | 550 | 100.0% |
Occupancy by Household Size in Elizabethville borough
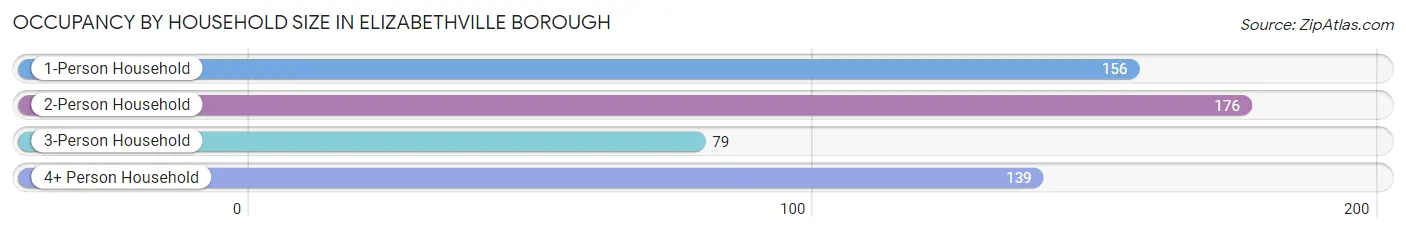
| Household Size | # Housing Units | % Housing Units |
| 1-Person Household | 156 | 28.4% |
| 2-Person Household | 176 | 32.0% |
| 3-Person Household | 79 | 14.4% |
| 4+ Person Household | 139 | 25.3% |
| Total Housing Units | 550 | 100.0% |
Occupancy by Ownership by Household Size in Elizabethville borough
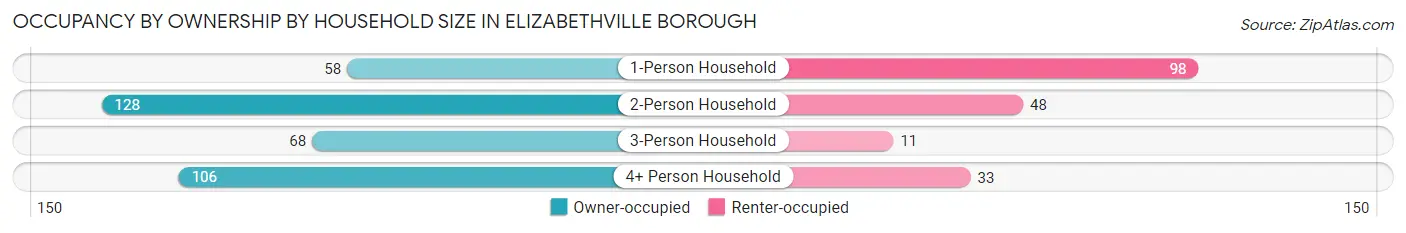
| Household Size | Owner-occupied | Renter-occupied |
| 1-Person Household | 58 (37.2%) | 98 (62.8%) |
| 2-Person Household | 128 (72.7%) | 48 (27.3%) |
| 3-Person Household | 68 (86.1%) | 11 (13.9%) |
| 4+ Person Household | 106 (76.3%) | 33 (23.7%) |
| Total Housing Units | 360 (65.4%) | 190 (34.5%) |
Occupancy by Educational Attainment in Elizabethville borough
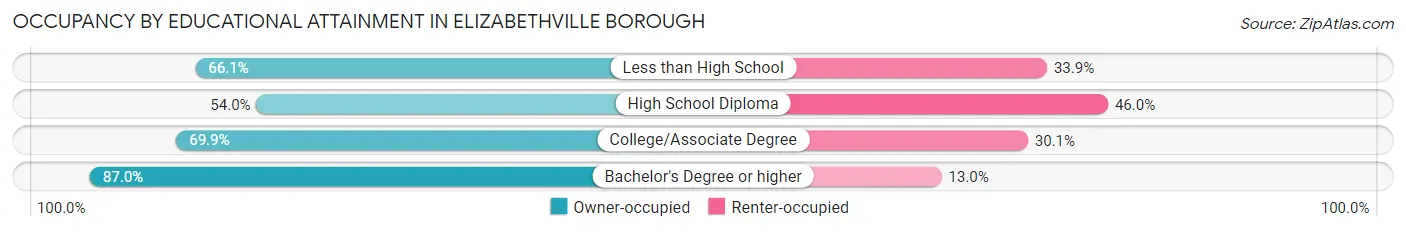
| Household Size | Owner-occupied | Renter-occupied |
| Less than High School | 41 (66.1%) | 21 (33.9%) |
| High School Diploma | 107 (54.0%) | 91 (46.0%) |
| College/Associate Degree | 165 (69.9%) | 71 (30.1%) |
| Bachelor's Degree or higher | 47 (87.0%) | 7 (13.0%) |
Occupancy by Age of Householder in Elizabethville borough
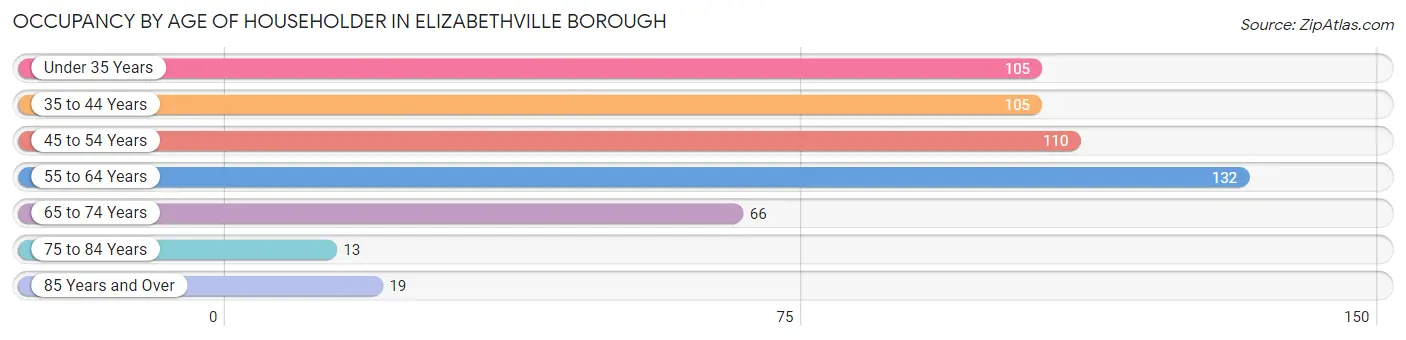
| Age Bracket | # Households | % Households |
| Under 35 Years | 105 | 19.1% |
| 35 to 44 Years | 105 | 19.1% |
| 45 to 54 Years | 110 | 20.0% |
| 55 to 64 Years | 132 | 24.0% |
| 65 to 74 Years | 66 | 12.0% |
| 75 to 84 Years | 13 | 2.4% |
| 85 Years and Over | 19 | 3.5% |
| Total | 550 | 100.0% |
Housing Finances in Elizabethville borough
Median Income by Occupancy in Elizabethville borough
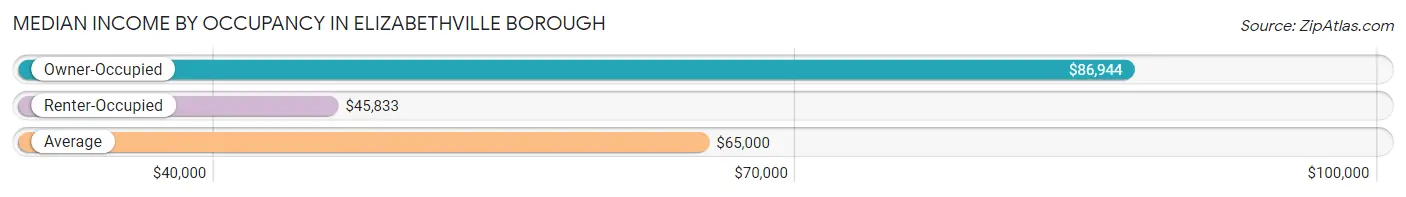
| Occupancy Type | # Households | Median Income |
| Owner-Occupied | 360 (65.4%) | $86,944 |
| Renter-Occupied | 190 (34.5%) | $45,833 |
| Average | 550 (100.0%) | $65,000 |
Occupancy by Householder Income Bracket in Elizabethville borough
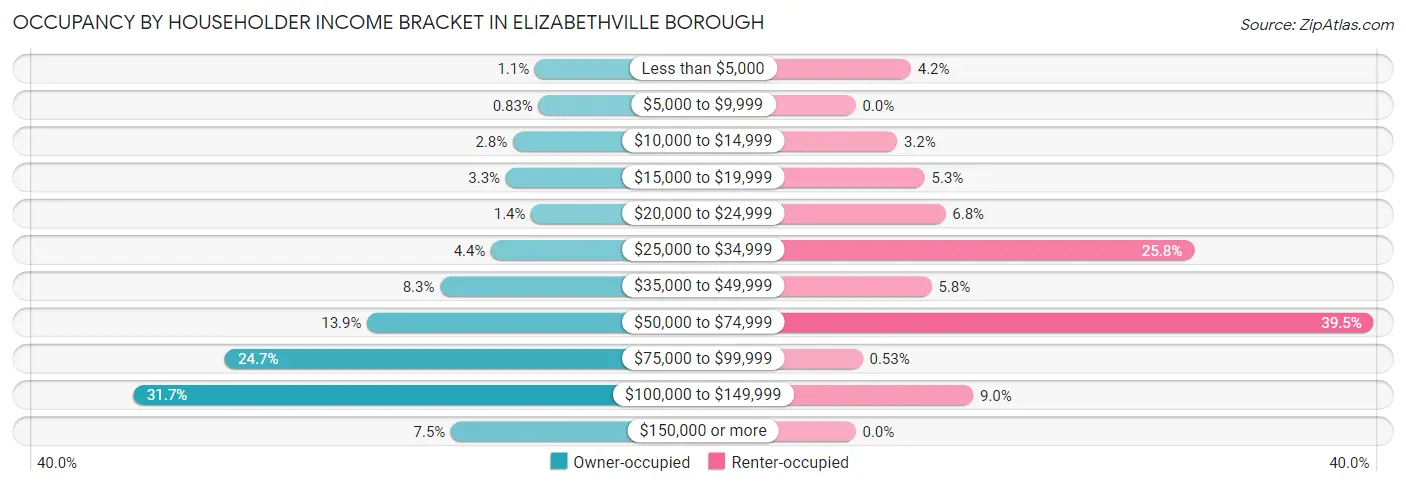
| Income Bracket | Owner-occupied | Renter-occupied |
| Less than $5,000 | 4 (1.1%) | 8 (4.2%) |
| $5,000 to $9,999 | 3 (0.8%) | 0 (0.0%) |
| $10,000 to $14,999 | 10 (2.8%) | 6 (3.2%) |
| $15,000 to $19,999 | 12 (3.3%) | 10 (5.3%) |
| $20,000 to $24,999 | 5 (1.4%) | 13 (6.8%) |
| $25,000 to $34,999 | 16 (4.4%) | 49 (25.8%) |
| $35,000 to $49,999 | 30 (8.3%) | 11 (5.8%) |
| $50,000 to $74,999 | 50 (13.9%) | 75 (39.5%) |
| $75,000 to $99,999 | 89 (24.7%) | 1 (0.5%) |
| $100,000 to $149,999 | 114 (31.7%) | 17 (8.9%) |
| $150,000 or more | 27 (7.5%) | 0 (0.0%) |
| Total | 360 (100.0%) | 190 (100.0%) |
Monthly Housing Cost Tiers in Elizabethville borough
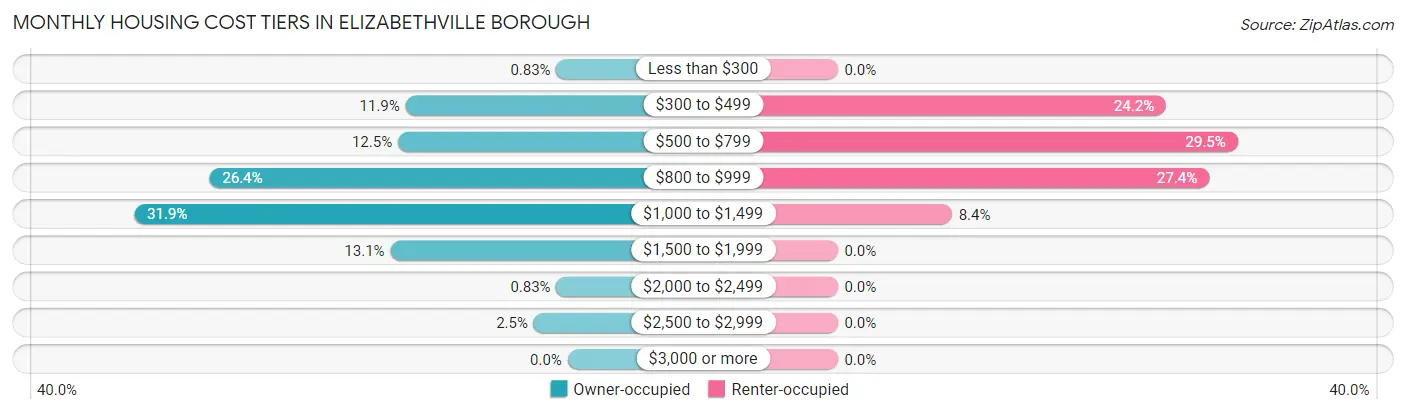
| Monthly Cost | Owner-occupied | Renter-occupied |
| Less than $300 | 3 (0.8%) | 0 (0.0%) |
| $300 to $499 | 43 (11.9%) | 46 (24.2%) |
| $500 to $799 | 45 (12.5%) | 56 (29.5%) |
| $800 to $999 | 95 (26.4%) | 52 (27.4%) |
| $1,000 to $1,499 | 115 (31.9%) | 16 (8.4%) |
| $1,500 to $1,999 | 47 (13.1%) | 0 (0.0%) |
| $2,000 to $2,499 | 3 (0.8%) | 0 (0.0%) |
| $2,500 to $2,999 | 9 (2.5%) | 0 (0.0%) |
| $3,000 or more | 0 (0.0%) | 0 (0.0%) |
| Total | 360 (100.0%) | 190 (100.0%) |
Physical Housing Characteristics in Elizabethville borough
Housing Structures in Elizabethville borough
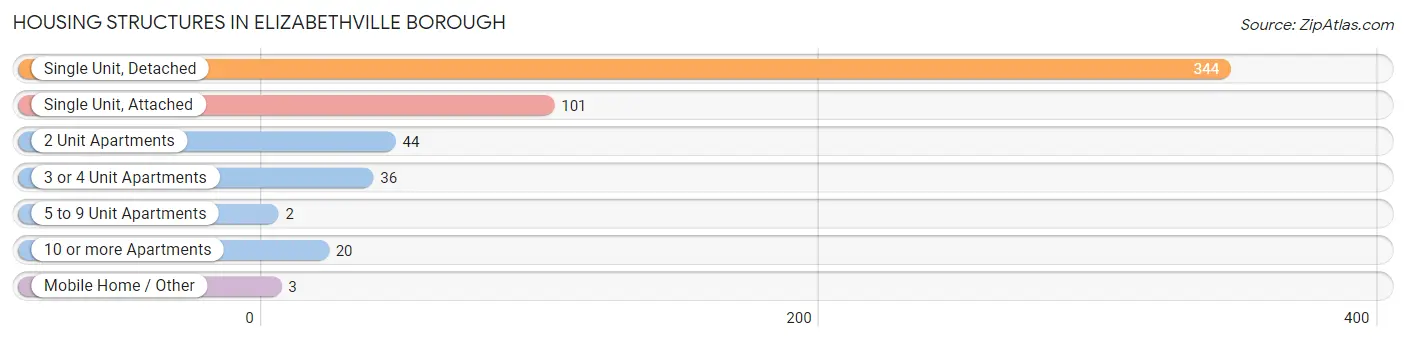
| Structure Type | # Housing Units | % Housing Units |
| Single Unit, Detached | 344 | 62.5% |
| Single Unit, Attached | 101 | 18.4% |
| 2 Unit Apartments | 44 | 8.0% |
| 3 or 4 Unit Apartments | 36 | 6.6% |
| 5 to 9 Unit Apartments | 2 | 0.4% |
| 10 or more Apartments | 20 | 3.6% |
| Mobile Home / Other | 3 | 0.5% |
| Total | 550 | 100.0% |
Housing Structures by Occupancy in Elizabethville borough
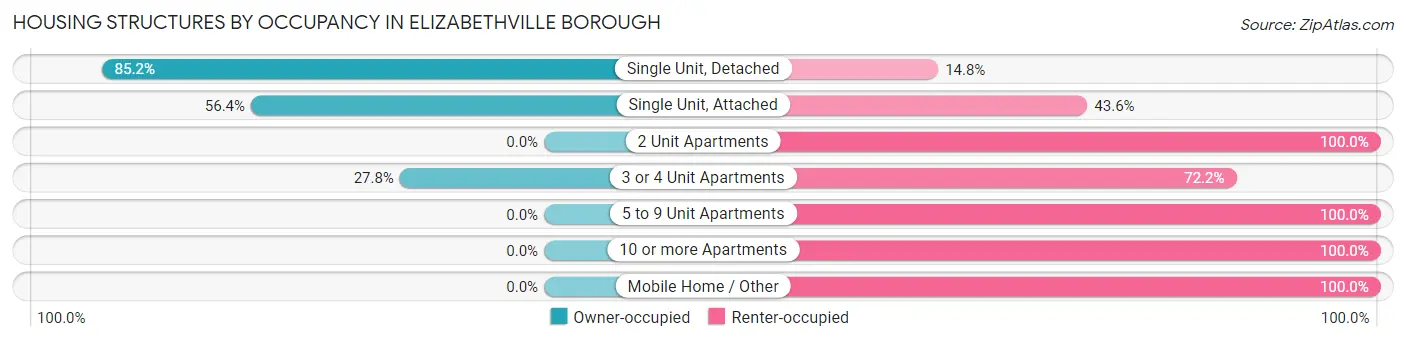
| Structure Type | Owner-occupied | Renter-occupied |
| Single Unit, Detached | 293 (85.2%) | 51 (14.8%) |
| Single Unit, Attached | 57 (56.4%) | 44 (43.6%) |
| 2 Unit Apartments | 0 (0.0%) | 44 (100.0%) |
| 3 or 4 Unit Apartments | 10 (27.8%) | 26 (72.2%) |
| 5 to 9 Unit Apartments | 0 (0.0%) | 2 (100.0%) |
| 10 or more Apartments | 0 (0.0%) | 20 (100.0%) |
| Mobile Home / Other | 0 (0.0%) | 3 (100.0%) |
| Total | 360 (65.4%) | 190 (34.5%) |
Housing Structures by Number of Rooms in Elizabethville borough
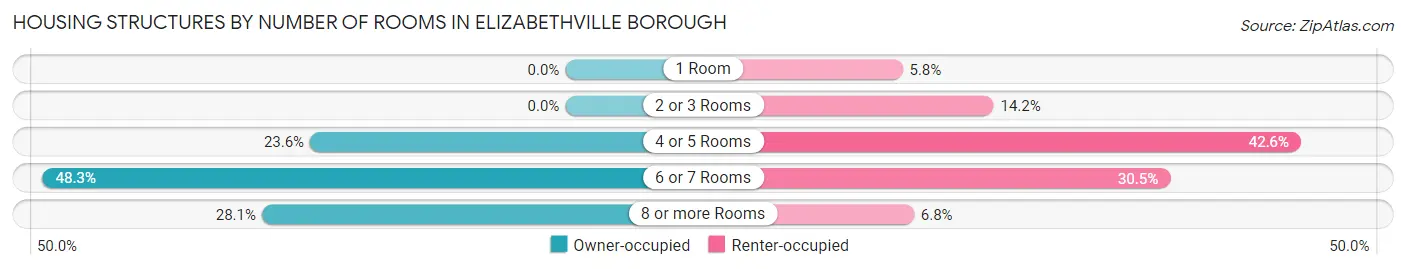
| Number of Rooms | Owner-occupied | Renter-occupied |
| 1 Room | 0 (0.0%) | 11 (5.8%) |
| 2 or 3 Rooms | 0 (0.0%) | 27 (14.2%) |
| 4 or 5 Rooms | 85 (23.6%) | 81 (42.6%) |
| 6 or 7 Rooms | 174 (48.3%) | 58 (30.5%) |
| 8 or more Rooms | 101 (28.1%) | 13 (6.8%) |
| Total | 360 (100.0%) | 190 (100.0%) |
Housing Structure by Heating Type in Elizabethville borough
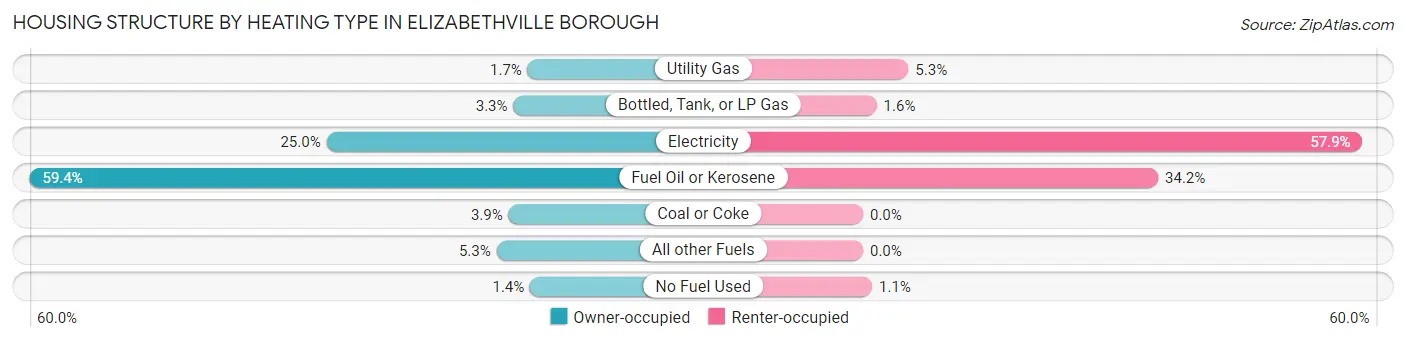
| Heating Type | Owner-occupied | Renter-occupied |
| Utility Gas | 6 (1.7%) | 10 (5.3%) |
| Bottled, Tank, or LP Gas | 12 (3.3%) | 3 (1.6%) |
| Electricity | 90 (25.0%) | 110 (57.9%) |
| Fuel Oil or Kerosene | 214 (59.4%) | 65 (34.2%) |
| Coal or Coke | 14 (3.9%) | 0 (0.0%) |
| All other Fuels | 19 (5.3%) | 0 (0.0%) |
| No Fuel Used | 5 (1.4%) | 2 (1.1%) |
| Total | 360 (100.0%) | 190 (100.0%) |
Household Vehicle Usage in Elizabethville borough
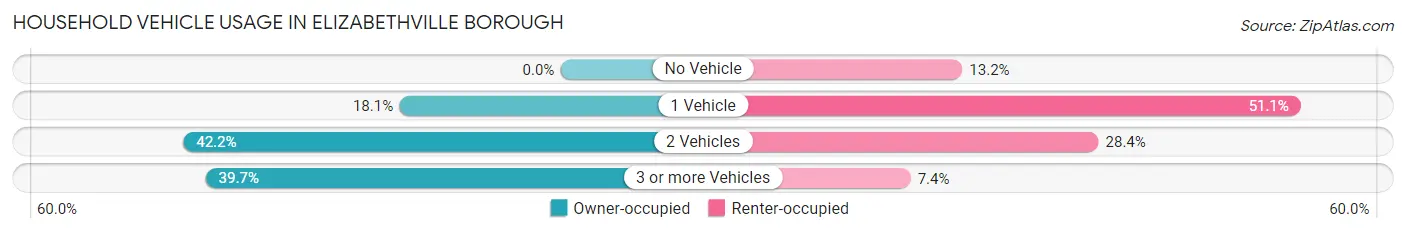
| Vehicles per Household | Owner-occupied | Renter-occupied |
| No Vehicle | 0 (0.0%) | 25 (13.2%) |
| 1 Vehicle | 65 (18.1%) | 97 (51.0%) |
| 2 Vehicles | 152 (42.2%) | 54 (28.4%) |
| 3 or more Vehicles | 143 (39.7%) | 14 (7.4%) |
| Total | 360 (100.0%) | 190 (100.0%) |
Real Estate & Mortgages in Elizabethville borough
Real Estate and Mortgage Overview in Elizabethville borough
| Characteristic | Without Mortgage | With Mortgage |
| Housing Units | 98 | 262 |
| Median Property Value | $134,400 | $157,200 |
| Median Household Income | $55,208 | $20 |
| Monthly Housing Costs | $527 | $0 |
| Real Estate Taxes | $1,931 | $3 |
Property Value by Mortgage Status in Elizabethville borough
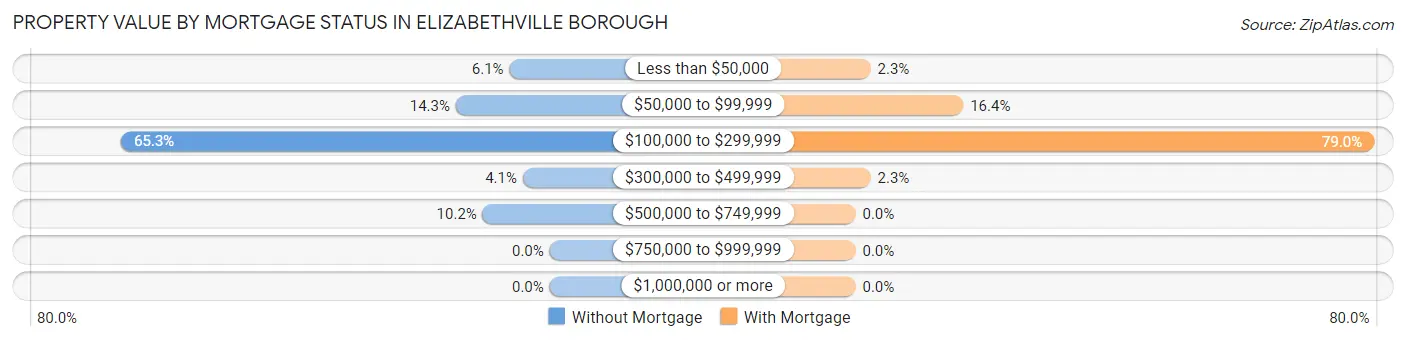
| Property Value | Without Mortgage | With Mortgage |
| Less than $50,000 | 6 (6.1%) | 6 (2.3%) |
| $50,000 to $99,999 | 14 (14.3%) | 43 (16.4%) |
| $100,000 to $299,999 | 64 (65.3%) | 207 (79.0%) |
| $300,000 to $499,999 | 4 (4.1%) | 6 (2.3%) |
| $500,000 to $749,999 | 10 (10.2%) | 0 (0.0%) |
| $750,000 to $999,999 | 0 (0.0%) | 0 (0.0%) |
| $1,000,000 or more | 0 (0.0%) | 0 (0.0%) |
| Total | 98 (100.0%) | 262 (100.0%) |
Household Income by Mortgage Status in Elizabethville borough
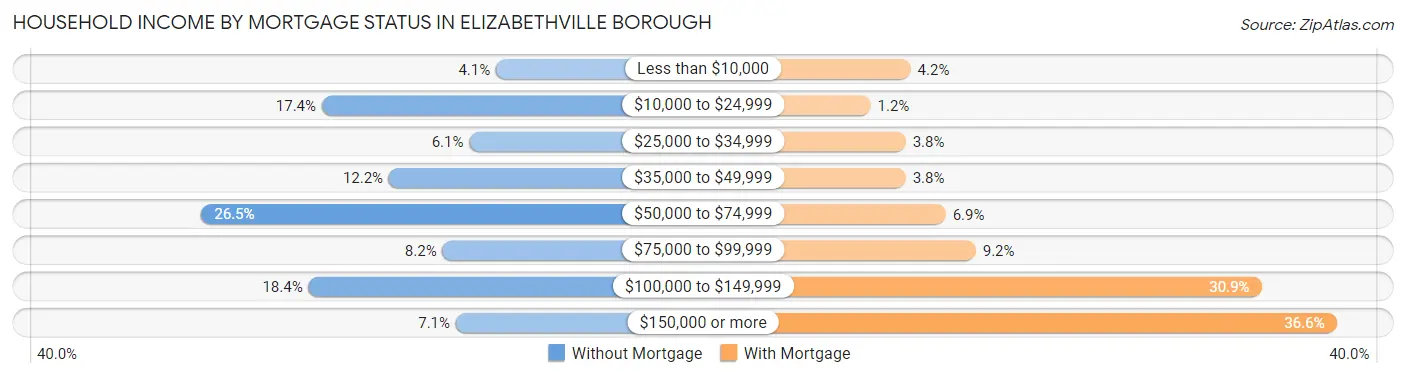
| Household Income | Without Mortgage | With Mortgage |
| Less than $10,000 | 4 (4.1%) | 11 (4.2%) |
| $10,000 to $24,999 | 17 (17.3%) | 3 (1.1%) |
| $25,000 to $34,999 | 6 (6.1%) | 10 (3.8%) |
| $35,000 to $49,999 | 12 (12.2%) | 10 (3.8%) |
| $50,000 to $74,999 | 26 (26.5%) | 18 (6.9%) |
| $75,000 to $99,999 | 8 (8.2%) | 24 (9.2%) |
| $100,000 to $149,999 | 18 (18.4%) | 81 (30.9%) |
| $150,000 or more | 7 (7.1%) | 96 (36.6%) |
| Total | 98 (100.0%) | 262 (100.0%) |
Property Value to Household Income Ratio in Elizabethville borough
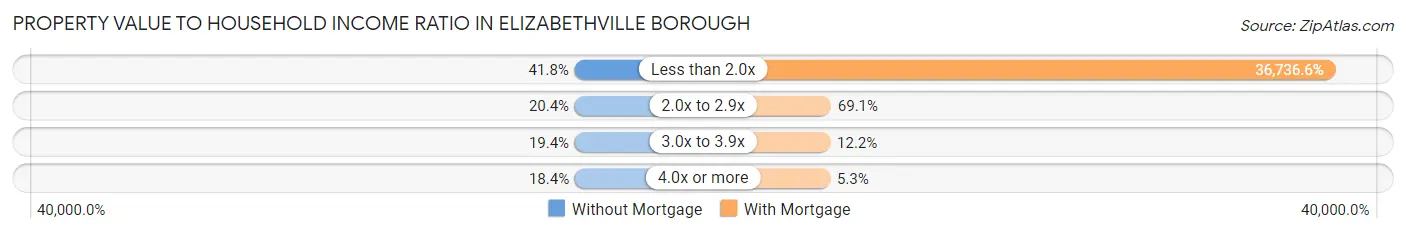
| Value-to-Income Ratio | Without Mortgage | With Mortgage |
| Less than 2.0x | 41 (41.8%) | 96,250 (36,736.6%) |
| 2.0x to 2.9x | 20 (20.4%) | 181 (69.1%) |
| 3.0x to 3.9x | 19 (19.4%) | 32 (12.2%) |
| 4.0x or more | 18 (18.4%) | 14 (5.3%) |
| Total | 98 (100.0%) | 262 (100.0%) |
Real Estate Taxes by Mortgage Status in Elizabethville borough
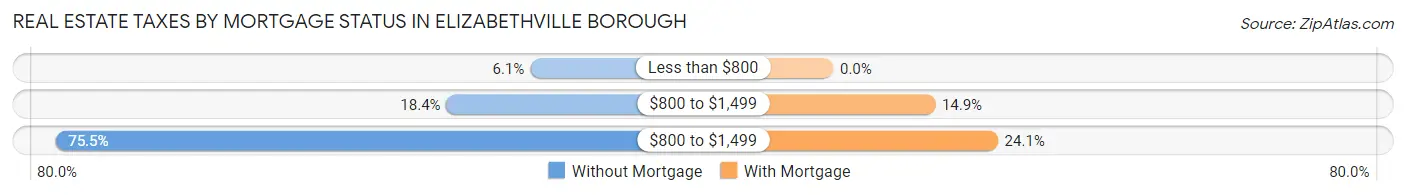
| Property Taxes | Without Mortgage | With Mortgage |
| Less than $800 | 6 (6.1%) | 0 (0.0%) |
| $800 to $1,499 | 18 (18.4%) | 39 (14.9%) |
| $800 to $1,499 | 74 (75.5%) | 63 (24.0%) |
| Total | 98 (100.0%) | 262 (100.0%) |
Health & Disability in Elizabethville borough
Health Insurance Coverage by Age in Elizabethville borough
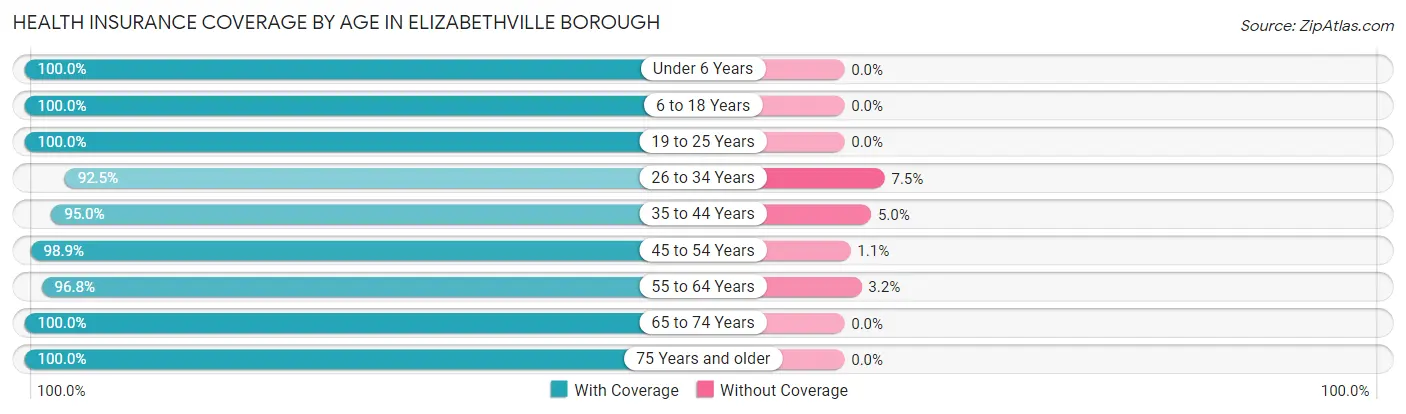
| Age Bracket | With Coverage | Without Coverage |
| Under 6 Years | 84 (100.0%) | 0 (0.0%) |
| 6 to 18 Years | 275 (100.0%) | 0 (0.0%) |
| 19 to 25 Years | 209 (100.0%) | 0 (0.0%) |
| 26 to 34 Years | 148 (92.5%) | 12 (7.5%) |
| 35 to 44 Years | 191 (95.0%) | 10 (5.0%) |
| 45 to 54 Years | 173 (98.9%) | 2 (1.1%) |
| 55 to 64 Years | 182 (96.8%) | 6 (3.2%) |
| 65 to 74 Years | 112 (100.0%) | 0 (0.0%) |
| 75 Years and older | 54 (100.0%) | 0 (0.0%) |
| Total | 1,428 (97.9%) | 30 (2.1%) |
Health Insurance Coverage by Citizenship Status in Elizabethville borough
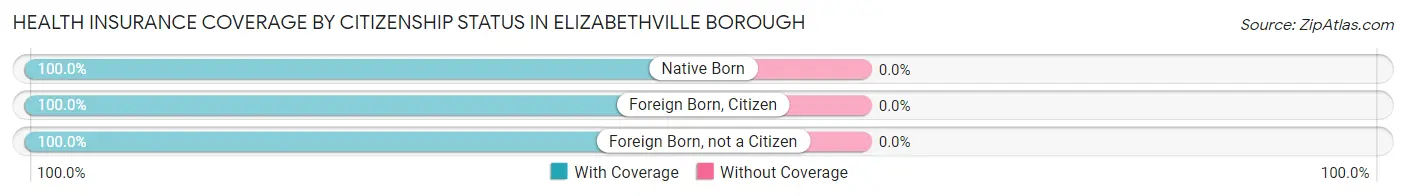
| Citizenship Status | With Coverage | Without Coverage |
| Native Born | 84 (100.0%) | 0 (0.0%) |
| Foreign Born, Citizen | 275 (100.0%) | 0 (0.0%) |
| Foreign Born, not a Citizen | 209 (100.0%) | 0 (0.0%) |
Health Insurance Coverage by Household Income in Elizabethville borough
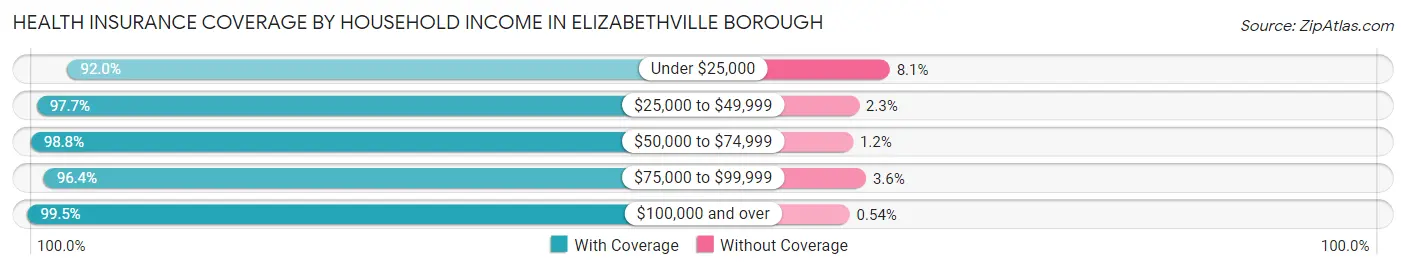
| Household Income | With Coverage | Without Coverage |
| Under $25,000 | 80 (91.9%) | 7 (8.1%) |
| $25,000 to $49,999 | 215 (97.7%) | 5 (2.3%) |
| $50,000 to $74,999 | 255 (98.8%) | 3 (1.2%) |
| $75,000 to $99,999 | 321 (96.4%) | 12 (3.6%) |
| $100,000 and over | 557 (99.5%) | 3 (0.5%) |
Public vs Private Health Insurance Coverage by Age in Elizabethville borough
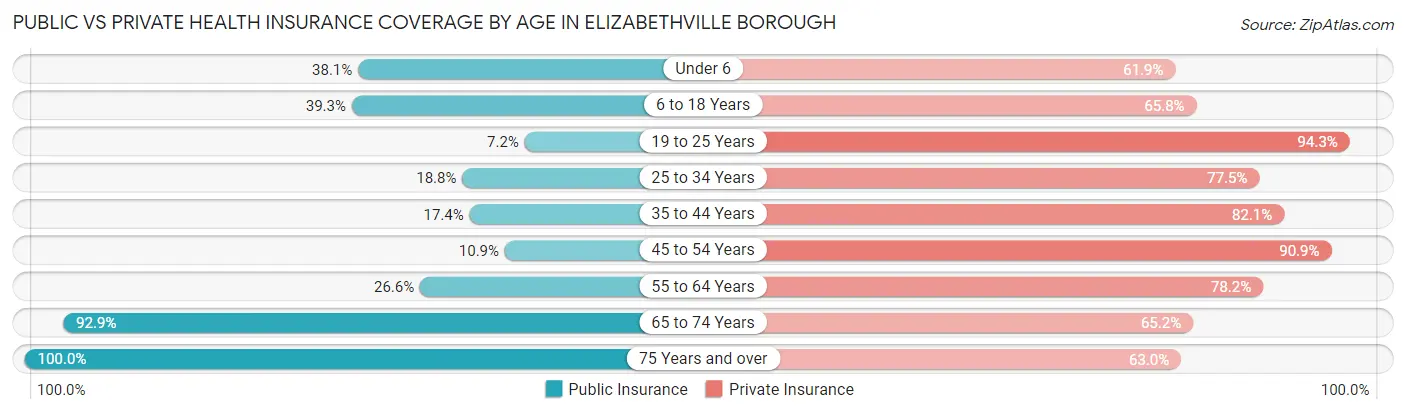
| Age Bracket | Public Insurance | Private Insurance |
| Under 6 | 32 (38.1%) | 52 (61.9%) |
| 6 to 18 Years | 108 (39.3%) | 181 (65.8%) |
| 19 to 25 Years | 15 (7.2%) | 197 (94.3%) |
| 25 to 34 Years | 30 (18.8%) | 124 (77.5%) |
| 35 to 44 Years | 35 (17.4%) | 165 (82.1%) |
| 45 to 54 Years | 19 (10.9%) | 159 (90.9%) |
| 55 to 64 Years | 50 (26.6%) | 147 (78.2%) |
| 65 to 74 Years | 104 (92.9%) | 73 (65.2%) |
| 75 Years and over | 54 (100.0%) | 34 (63.0%) |
| Total | 447 (30.7%) | 1,132 (77.6%) |
Disability Status by Sex by Age in Elizabethville borough
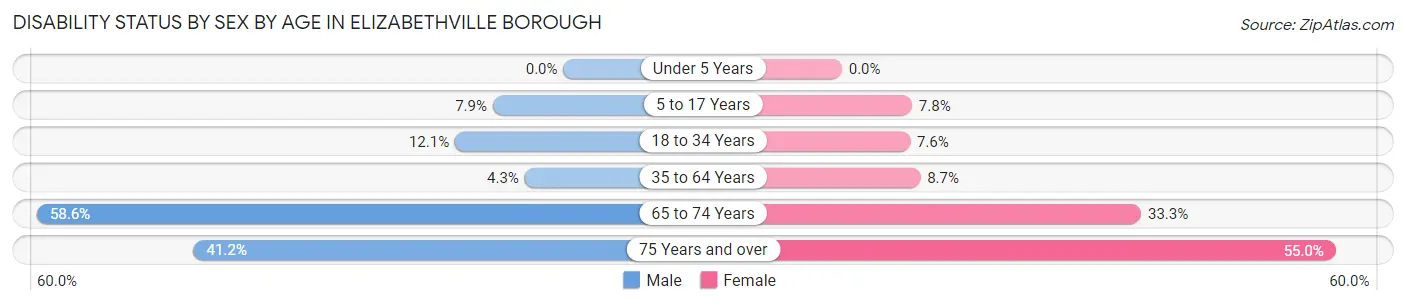
| Age Bracket | Male | Female |
| Under 5 Years | 0 (0.0%) | 0 (0.0%) |
| 5 to 17 Years | 11 (7.9%) | 10 (7.8%) |
| 18 to 34 Years | 28 (12.1%) | 12 (7.6%) |
| 35 to 64 Years | 10 (4.3%) | 29 (8.7%) |
| 65 to 74 Years | 34 (58.6%) | 18 (33.3%) |
| 75 Years and over | 14 (41.2%) | 11 (55.0%) |
Disability Class by Sex by Age in Elizabethville borough
Disability Class: Hearing Difficulty
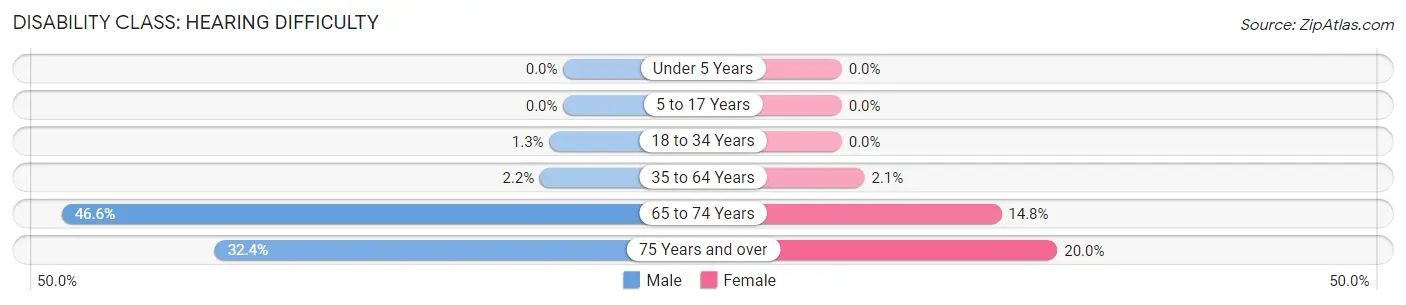
| Age Bracket | Male | Female |
| Under 5 Years | 0 (0.0%) | 0 (0.0%) |
| 5 to 17 Years | 0 (0.0%) | 0 (0.0%) |
| 18 to 34 Years | 3 (1.3%) | 0 (0.0%) |
| 35 to 64 Years | 5 (2.2%) | 7 (2.1%) |
| 65 to 74 Years | 27 (46.6%) | 8 (14.8%) |
| 75 Years and over | 11 (32.4%) | 4 (20.0%) |
Disability Class: Vision Difficulty
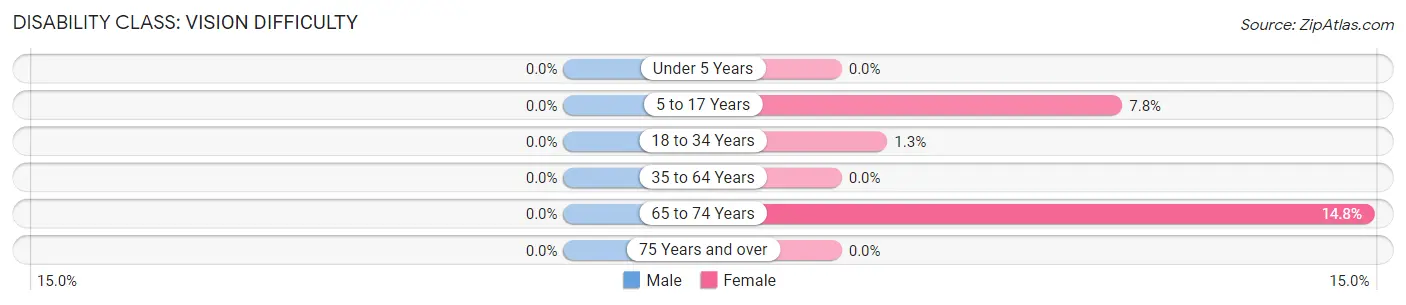
| Age Bracket | Male | Female |
| Under 5 Years | 0 (0.0%) | 0 (0.0%) |
| 5 to 17 Years | 0 (0.0%) | 10 (7.8%) |
| 18 to 34 Years | 0 (0.0%) | 2 (1.3%) |
| 35 to 64 Years | 0 (0.0%) | 0 (0.0%) |
| 65 to 74 Years | 0 (0.0%) | 8 (14.8%) |
| 75 Years and over | 0 (0.0%) | 0 (0.0%) |
Disability Class: Cognitive Difficulty
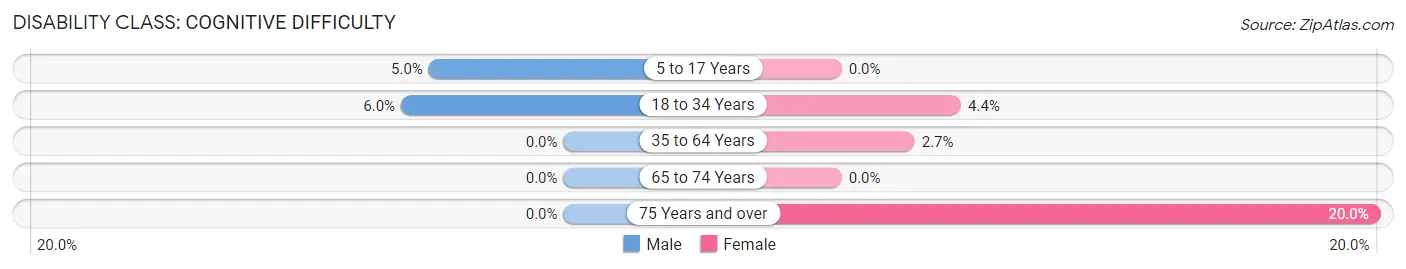
| Age Bracket | Male | Female |
| 5 to 17 Years | 7 (5.0%) | 0 (0.0%) |
| 18 to 34 Years | 14 (6.0%) | 7 (4.4%) |
| 35 to 64 Years | 0 (0.0%) | 9 (2.7%) |
| 65 to 74 Years | 0 (0.0%) | 0 (0.0%) |
| 75 Years and over | 0 (0.0%) | 4 (20.0%) |
Disability Class: Ambulatory Difficulty
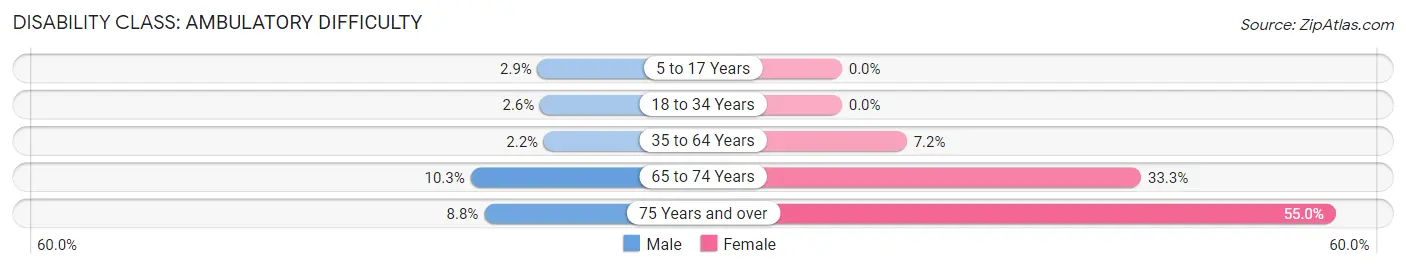
| Age Bracket | Male | Female |
| 5 to 17 Years | 4 (2.9%) | 0 (0.0%) |
| 18 to 34 Years | 6 (2.6%) | 0 (0.0%) |
| 35 to 64 Years | 5 (2.2%) | 24 (7.2%) |
| 65 to 74 Years | 6 (10.3%) | 18 (33.3%) |
| 75 Years and over | 3 (8.8%) | 11 (55.0%) |
Disability Class: Self-Care Difficulty
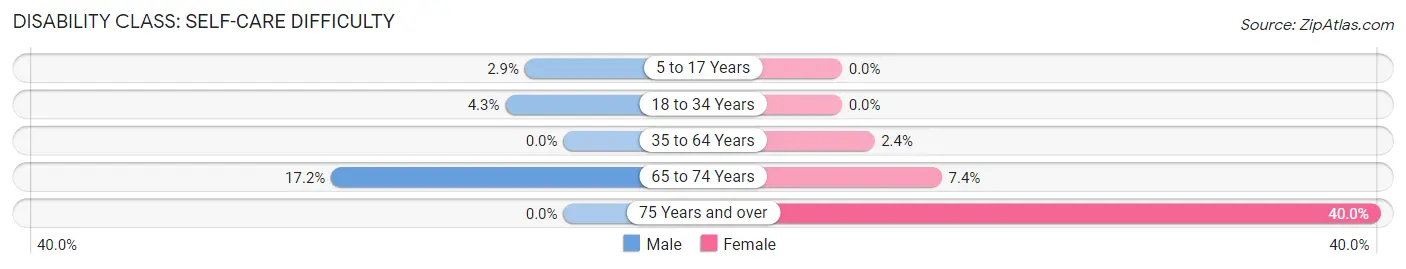
| Age Bracket | Male | Female |
| 5 to 17 Years | 4 (2.9%) | 0 (0.0%) |
| 18 to 34 Years | 10 (4.3%) | 0 (0.0%) |
| 35 to 64 Years | 0 (0.0%) | 8 (2.4%) |
| 65 to 74 Years | 10 (17.2%) | 4 (7.4%) |
| 75 Years and over | 0 (0.0%) | 8 (40.0%) |
Technology Access in Elizabethville borough
Computing Device Access in Elizabethville borough
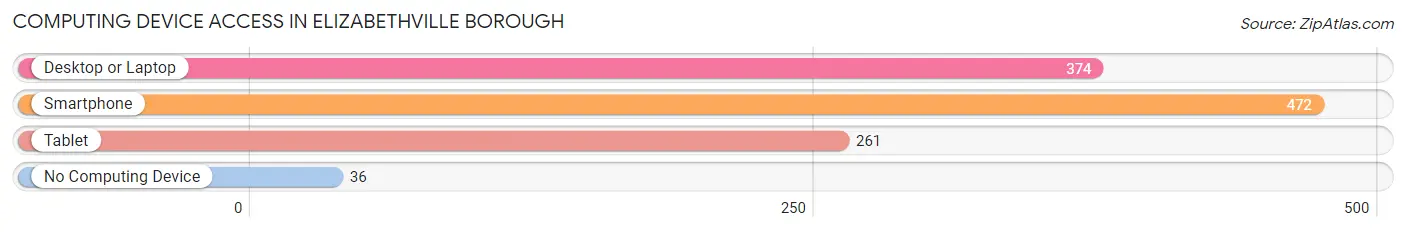
| Device Type | # Households | % Households |
| Desktop or Laptop | 374 | 68.0% |
| Smartphone | 472 | 85.8% |
| Tablet | 261 | 47.4% |
| No Computing Device | 36 | 6.6% |
| Total | 550 | 100.0% |
Internet Access in Elizabethville borough
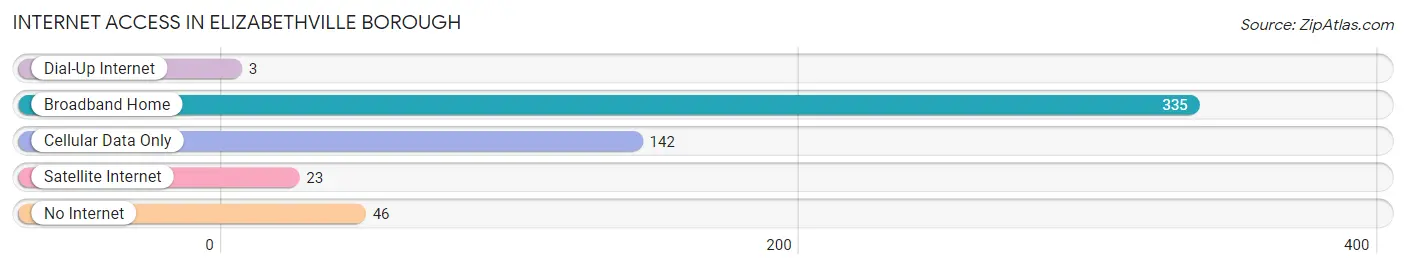
| Internet Type | # Households | % Households |
| Dial-Up Internet | 3 | 0.5% |
| Broadband Home | 335 | 60.9% |
| Cellular Data Only | 142 | 25.8% |
| Satellite Internet | 23 | 4.2% |
| No Internet | 46 | 8.4% |
| Total | 550 | 100.0% |
Elizabethville borough Summary
Elizabethville Borough is a small borough located in Dauphin County, Pennsylvania. It is situated in the Appalachian Mountains and is part of the Harrisburg-Carlisle Metropolitan Statistical Area. The borough has a population of 1,845 as of the 2010 census.
History
Elizabethville Borough was founded in 1845 by John and Elizabeth Kline. The Klines were German immigrants who had settled in the area in the early 1800s. The town was named after Elizabeth Kline and was originally known as Elizabethtown. The town was incorporated as a borough in 1875.
The town was a major center for the coal mining industry in the late 19th and early 20th centuries. The coal mines provided employment for many of the town's residents. The town also had a number of other industries, including a brickyard, a tannery, and a sawmill.
In the late 19th century, the town was home to a number of churches, including the United Brethren Church, the Lutheran Church, and the Methodist Episcopal Church. The town also had a number of schools, including the Elizabethville High School, which was established in 1891.
Geography
Elizabethville Borough is located in the Appalachian Mountains of Dauphin County, Pennsylvania. It is situated at an elevation of 1,068 feet (326 m) above sea level. The borough is located in the Susquehanna River Valley and is bordered by the towns of Lykens to the north, Gratz to the east, and Berrysburg to the south.
The borough has a total area of 0.7 square miles (1.8 km2), all of which is land. The borough is located in the humid continental climate zone, with cold, snowy winters and warm, humid summers.
Economy
The economy of Elizabethville Borough is largely based on agriculture and tourism. The town is home to a number of farms, including dairy farms, beef farms, and vegetable farms. The town also has a number of tourist attractions, including the Elizabethville Historical Society Museum, the Elizabethville Railroad Museum, and the Elizabethville Community Park.
The town also has a number of small businesses, including restaurants, retail stores, and service businesses. The town is also home to a number of manufacturing businesses, including a furniture factory and a metal fabrication plant.
Demographics
As of the 2010 census, the population of Elizabethville Borough was 1,845. The racial makeup of the borough was 97.2% White, 0.9% African American, 0.2% Native American, 0.2% Asian, 0.2% from other races, and 1.3% from two or more races. Hispanic or Latino of any race were 0.9% of the population.
The median household income in the borough was $41,250, and the median family income was $50,000. The per capita income in the borough was $20,945. About 8.3% of families and 10.2% of the population were below the poverty line, including 14.3% of those under age 18 and 8.2% of those age 65 or over.
Common Questions
What is Per Capita Income in Elizabethville borough?
Per Capita income in Elizabethville borough is $28,861.
What is the Median Family Income in Elizabethville borough?
Median Family Income in Elizabethville borough is $81,250.
What is the Median Household income in Elizabethville borough?
Median Household Income in Elizabethville borough is $65,000.
What is Income or Wage Gap in Elizabethville borough?
Income or Wage Gap in Elizabethville borough is 7.8%.
Women in Elizabethville borough earn 92.2 cents for every dollar earned by a man.
What is Family Income Deficit in Elizabethville borough?
Family Income Deficit in Elizabethville borough is $5,147.
Families that are below poverty line in Elizabethville borough earn $5,147 less on average than the poverty threshold level.
What is Inequality or Gini Index in Elizabethville borough?
Inequality or Gini Index in Elizabethville borough is 0.35.
What is the Total Population of Elizabethville borough?
Total Population of Elizabethville borough is 1,491.
What is the Total Male Population of Elizabethville borough?
Total Male Population of Elizabethville borough is 724.
What is the Total Female Population of Elizabethville borough?
Total Female Population of Elizabethville borough is 767.
What is the Ratio of Males per 100 Females in Elizabethville borough?
There are 94.39 Males per 100 Females in Elizabethville borough.
What is the Ratio of Females per 100 Males in Elizabethville borough?
There are 105.94 Females per 100 Males in Elizabethville borough.
What is the Median Population Age in Elizabethville borough?
Median Population Age in Elizabethville borough is 36.6 Years.
What is the Average Family Size in Elizabethville borough
Average Family Size in Elizabethville borough is 3.2 People.
What is the Average Household Size in Elizabethville borough
Average Household Size in Elizabethville borough is 2.6 People.
How Large is the Labor Force in Elizabethville borough?
There are 833 People in the Labor Forcein in Elizabethville borough.
What is the Percentage of People in the Labor Force in Elizabethville borough?
69.8% of People are in the Labor Force in Elizabethville borough.
What is the Unemployment Rate in Elizabethville borough?
Unemployment Rate in Elizabethville borough is 1.3%.