Flourtown, PA Map & Demographics
Flourtown Map
Flourtown Overview
$66,694
PER CAPITA INCOME
$172,083
AVG FAMILY INCOME
$139,360
AVG HOUSEHOLD INCOME
26.7%
WAGE / INCOME GAP [ % ]
73.3¢/ $1
WAGE / INCOME GAP [ $ ]
0.42
INEQUALITY / GINI INDEX
4,599
TOTAL POPULATION
2,213
MALE POPULATION
2,386
FEMALE POPULATION
92.75
MALES / 100 FEMALES
107.82
FEMALES / 100 MALES
41.4
MEDIAN AGE
3.0
AVG FAMILY SIZE
2.5
AVG HOUSEHOLD SIZE
2,656
LABOR FORCE [ PEOPLE ]
72.3%
PERCENT IN LABOR FORCE
3.2%
UNEMPLOYMENT RATE
Flourtown Zip Codes
Income in Flourtown
Income Overview in Flourtown
Per Capita Income in Flourtown is $66,694, while median incomes of families and households are $172,083 and $139,360 respectively.
| Characteristic | Number | Measure |
| Per Capita Income | 4,599 | $66,694 |
| Median Family Income | 1,237 | $172,083 |
| Mean Family Income | 1,237 | $177,595 |
| Median Household Income | 1,792 | $139,360 |
| Mean Household Income | 1,792 | $171,428 |
| Income Deficit | 1,237 | $0 |
| Wage / Income Gap (%) | 4,599 | 26.65% |
| Wage / Income Gap ($) | 4,599 | 73.35¢ per $1 |
| Gini / Inequality Index | 4,599 | 0.42 |
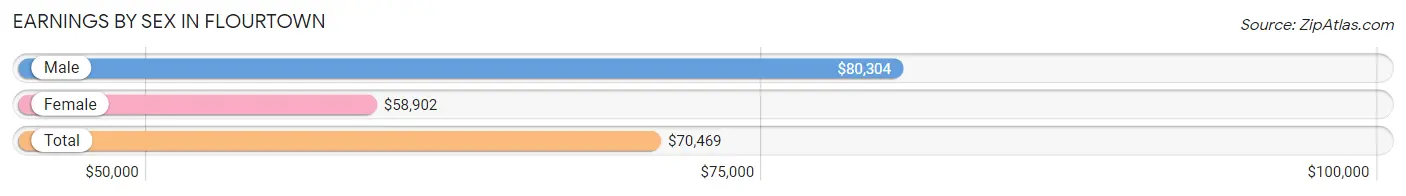
Earnings by Sex in Flourtown
Average Earnings in Flourtown are $70,469, $80,304 for men and $58,902 for women, a difference of 26.7%.
| Sex | Number | Average Earnings |
| Male | 1,357 (49.0%) | $80,304 |
| Female | 1,412 (51.0%) | $58,902 |
| Total | 2,769 (100.0%) | $70,469 |
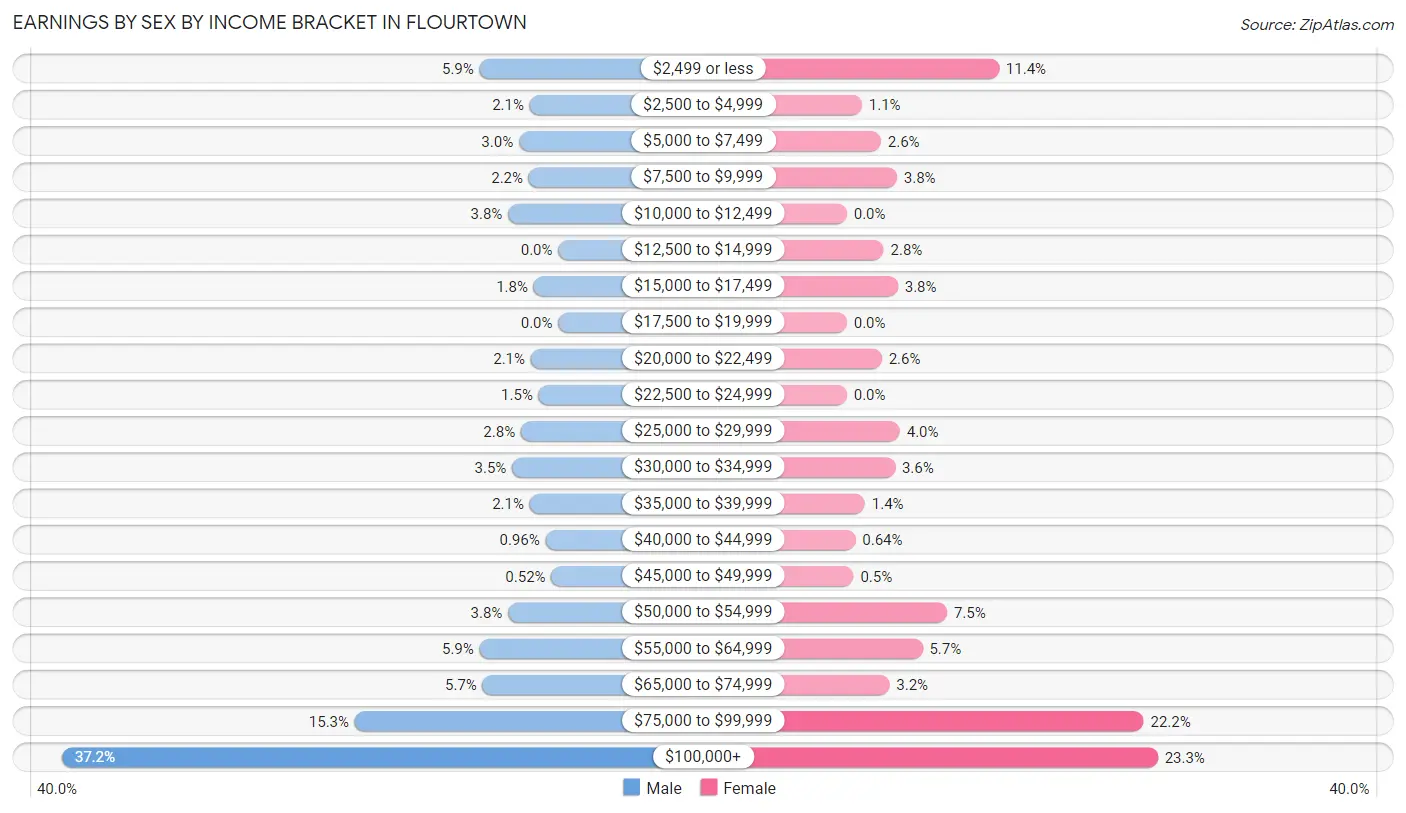
Earnings by Sex by Income Bracket in Flourtown
The most common earnings brackets in Flourtown are $100,000+ for men (505 | 37.2%) and $100,000+ for women (329 | 23.3%).
| Income | Male | Female |
| $2,499 or less | 80 (5.9%) | 161 (11.4%) |
| $2,500 to $4,999 | 29 (2.1%) | 16 (1.1%) |
| $5,000 to $7,499 | 40 (2.9%) | 36 (2.5%) |
| $7,500 to $9,999 | 30 (2.2%) | 53 (3.7%) |
| $10,000 to $12,499 | 51 (3.8%) | 0 (0.0%) |
| $12,500 to $14,999 | 0 (0.0%) | 39 (2.8%) |
| $15,000 to $17,499 | 25 (1.8%) | 54 (3.8%) |
| $17,500 to $19,999 | 0 (0.0%) | 0 (0.0%) |
| $20,000 to $22,499 | 28 (2.1%) | 37 (2.6%) |
| $22,500 to $24,999 | 20 (1.5%) | 0 (0.0%) |
| $25,000 to $29,999 | 38 (2.8%) | 56 (4.0%) |
| $30,000 to $34,999 | 47 (3.5%) | 51 (3.6%) |
| $35,000 to $39,999 | 29 (2.1%) | 19 (1.3%) |
| $40,000 to $44,999 | 13 (1.0%) | 9 (0.6%) |
| $45,000 to $49,999 | 7 (0.5%) | 7 (0.5%) |
| $50,000 to $54,999 | 51 (3.8%) | 106 (7.5%) |
| $55,000 to $64,999 | 80 (5.9%) | 80 (5.7%) |
| $65,000 to $74,999 | 77 (5.7%) | 45 (3.2%) |
| $75,000 to $99,999 | 207 (15.2%) | 314 (22.2%) |
| $100,000+ | 505 (37.2%) | 329 (23.3%) |
| Total | 1,357 (100.0%) | 1,412 (100.0%) |
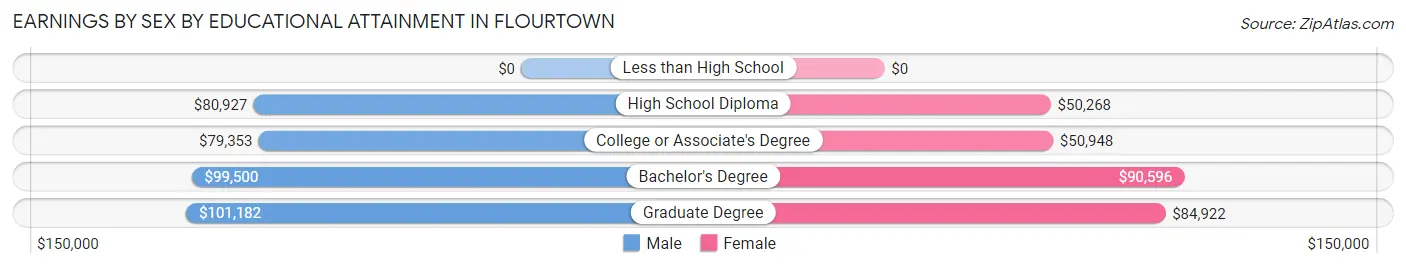
Earnings by Sex by Educational Attainment in Flourtown
Average earnings in Flourtown are $90,500 for men and $76,283 for women, a difference of 15.7%. Men with an educational attainment of graduate degree enjoy the highest average annual earnings of $101,182, while those with college or associate's degree education earn the least with $79,353. Women with an educational attainment of bachelor's degree earn the most with the average annual earnings of $90,596, while those with high school diploma education have the smallest earnings of $50,268.
| Educational Attainment | Male Income | Female Income |
| Less than High School | - | - |
| High School Diploma | $80,927 | $50,268 |
| College or Associate's Degree | $79,353 | $50,948 |
| Bachelor's Degree | $99,500 | $90,596 |
| Graduate Degree | $101,182 | $84,922 |
| Total | $90,500 | $76,283 |
Family Income in Flourtown
Family Income Brackets in Flourtown
According to the Flourtown family income data, there are 438 families falling into the $200,000+ income range, which is the most common income bracket and makes up 35.4% of all families.
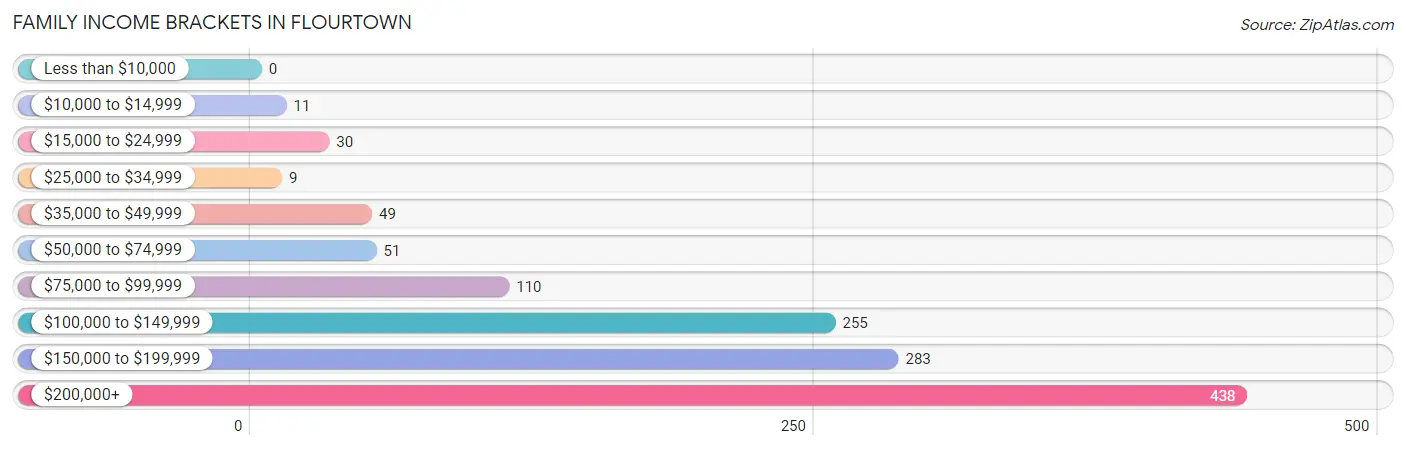
| Income Bracket | # Families | % Families |
| Less than $10,000 | 0 | 0.0% |
| $10,000 to $14,999 | 11 | 0.9% |
| $15,000 to $24,999 | 30 | 2.4% |
| $25,000 to $34,999 | 9 | 0.7% |
| $35,000 to $49,999 | 49 | 4.0% |
| $50,000 to $74,999 | 51 | 4.1% |
| $75,000 to $99,999 | 110 | 8.9% |
| $100,000 to $149,999 | 255 | 20.6% |
| $150,000 to $199,999 | 283 | 22.9% |
| $200,000+ | 438 | 35.4% |
Family Income by Famaliy Size in Flourtown
3-person families (186 | 15.0%) account for the highest median family income in Flourtown with $219,265 per family, while 3-person families (186 | 15.0%) have the highest median income of $73,088 per family member.
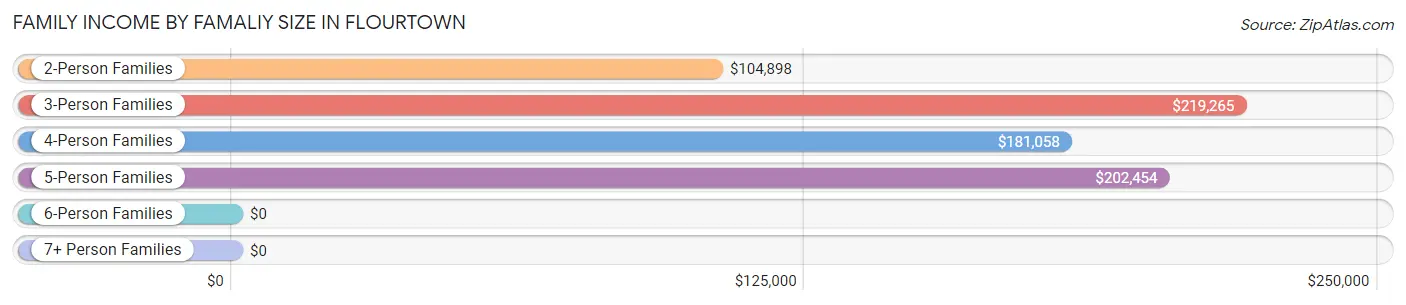
| Income Bracket | # Families | Median Income |
| 2-Person Families | 533 (43.1%) | $104,898 |
| 3-Person Families | 186 (15.0%) | $219,265 |
| 4-Person Families | 393 (31.8%) | $181,058 |
| 5-Person Families | 109 (8.8%) | $202,454 |
| 6-Person Families | 16 (1.3%) | $0 |
| 7+ Person Families | 0 (0.0%) | $0 |
| Total | 1,237 (100.0%) | $172,083 |
Family Income by Number of Earners in Flourtown
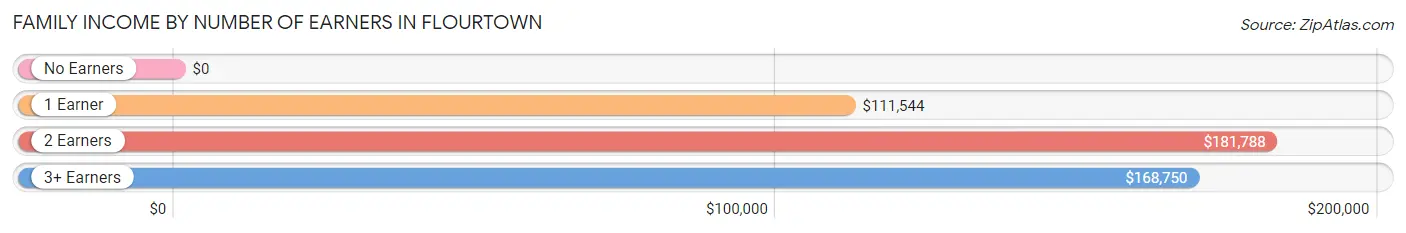
| Number of Earners | # Families | Median Income |
| No Earners | 29 (2.3%) | $0 |
| 1 Earner | 335 (27.1%) | $111,544 |
| 2 Earners | 683 (55.2%) | $181,788 |
| 3+ Earners | 190 (15.4%) | $168,750 |
| Total | 1,237 (100.0%) | $172,083 |
Household Income in Flourtown
Household Income Brackets in Flourtown
With 568 households falling in the category, the $200,000+ income range is the most frequent in Flourtown, accounting for 31.7% of all households.
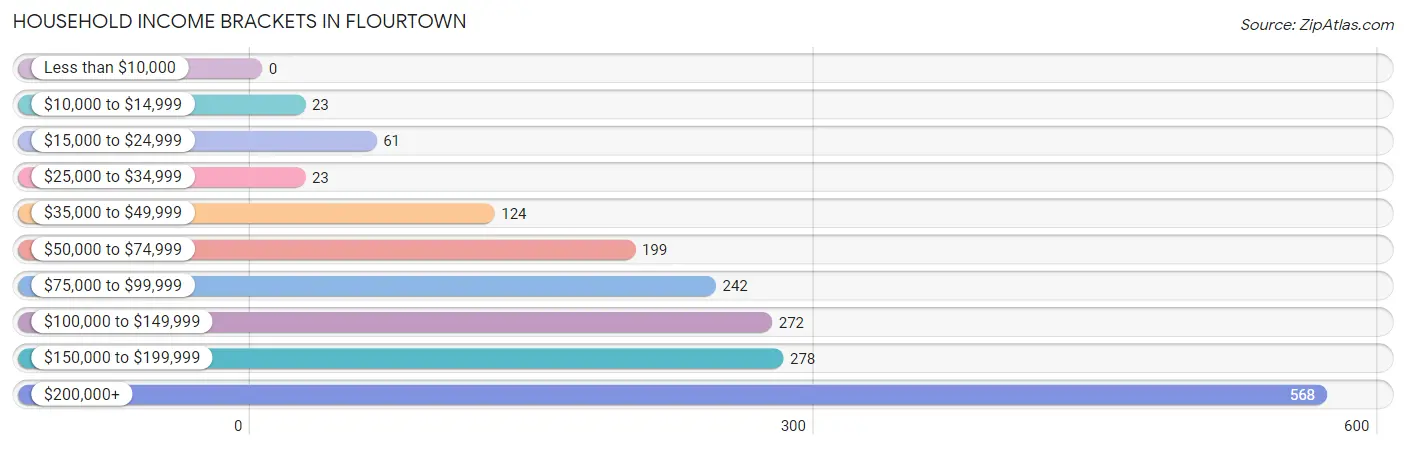
| Income Bracket | # Households | % Households |
| Less than $10,000 | 0 | 0.0% |
| $10,000 to $14,999 | 23 | 1.3% |
| $15,000 to $24,999 | 61 | 3.4% |
| $25,000 to $34,999 | 23 | 1.3% |
| $35,000 to $49,999 | 124 | 6.9% |
| $50,000 to $74,999 | 199 | 11.1% |
| $75,000 to $99,999 | 242 | 13.5% |
| $100,000 to $149,999 | 272 | 15.2% |
| $150,000 to $199,999 | 278 | 15.5% |
| $200,000+ | 568 | 31.7% |
Household Income by Householder Age in Flourtown
The median household income in Flourtown is $139,360, with the highest median household income of $202,976 found in the 25 to 44 years age bracket for the primary householder. A total of 500 households (27.9%) fall into this category.
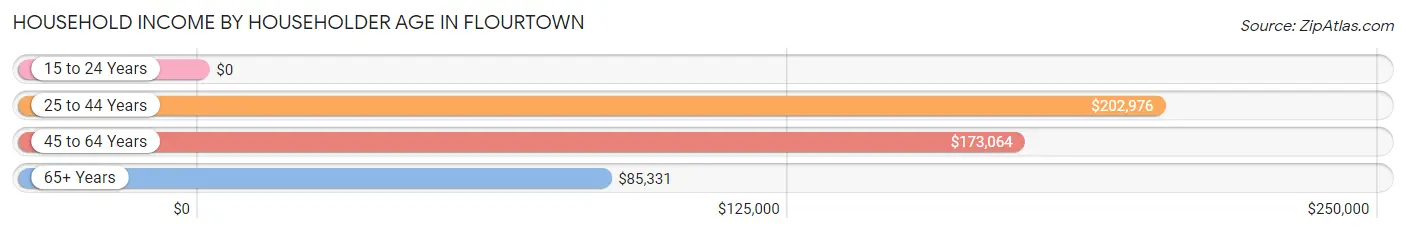
| Income Bracket | # Households | Median Income |
| 15 to 24 Years | 0 (0.0%) | $0 |
| 25 to 44 Years | 500 (27.9%) | $202,976 |
| 45 to 64 Years | 745 (41.6%) | $173,064 |
| 65+ Years | 547 (30.5%) | $85,331 |
| Total | 1,792 (100.0%) | $139,360 |
Poverty in Flourtown
Income Below Poverty by Sex and Age in Flourtown
With 1.0% poverty level for males and 1.2% for females among the residents of Flourtown, 35 to 44 year old males and 75 year old and over females are the most vulnerable to poverty, with 21 males (7.0%) and 15 females (7.3%) in their respective age groups living below the poverty level.
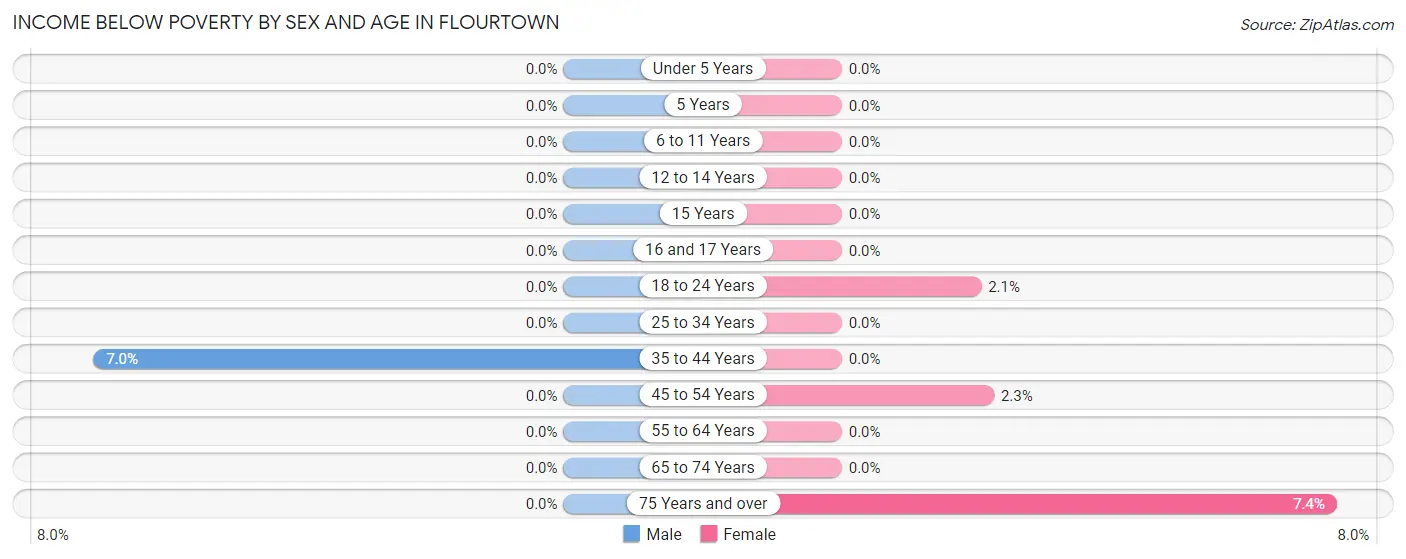
| Age Bracket | Male | Female |
| Under 5 Years | 0 (0.0%) | 0 (0.0%) |
| 5 Years | 0 (0.0%) | 0 (0.0%) |
| 6 to 11 Years | 0 (0.0%) | 0 (0.0%) |
| 12 to 14 Years | 0 (0.0%) | 0 (0.0%) |
| 15 Years | 0 (0.0%) | 0 (0.0%) |
| 16 and 17 Years | 0 (0.0%) | 0 (0.0%) |
| 18 to 24 Years | 0 (0.0%) | 3 (2.1%) |
| 25 to 34 Years | 0 (0.0%) | 0 (0.0%) |
| 35 to 44 Years | 21 (7.0%) | 0 (0.0%) |
| 45 to 54 Years | 0 (0.0%) | 9 (2.3%) |
| 55 to 64 Years | 0 (0.0%) | 0 (0.0%) |
| 65 to 74 Years | 0 (0.0%) | 0 (0.0%) |
| 75 Years and over | 0 (0.0%) | 15 (7.3%) |
| Total | 21 (1.0%) | 27 (1.2%) |
Income Above Poverty by Sex and Age in Flourtown
According to the poverty statistics in Flourtown, males aged under 5 years and females aged under 5 years are the age groups that are most secure financially, with 100.0% of males and 100.0% of females in these age groups living above the poverty line.
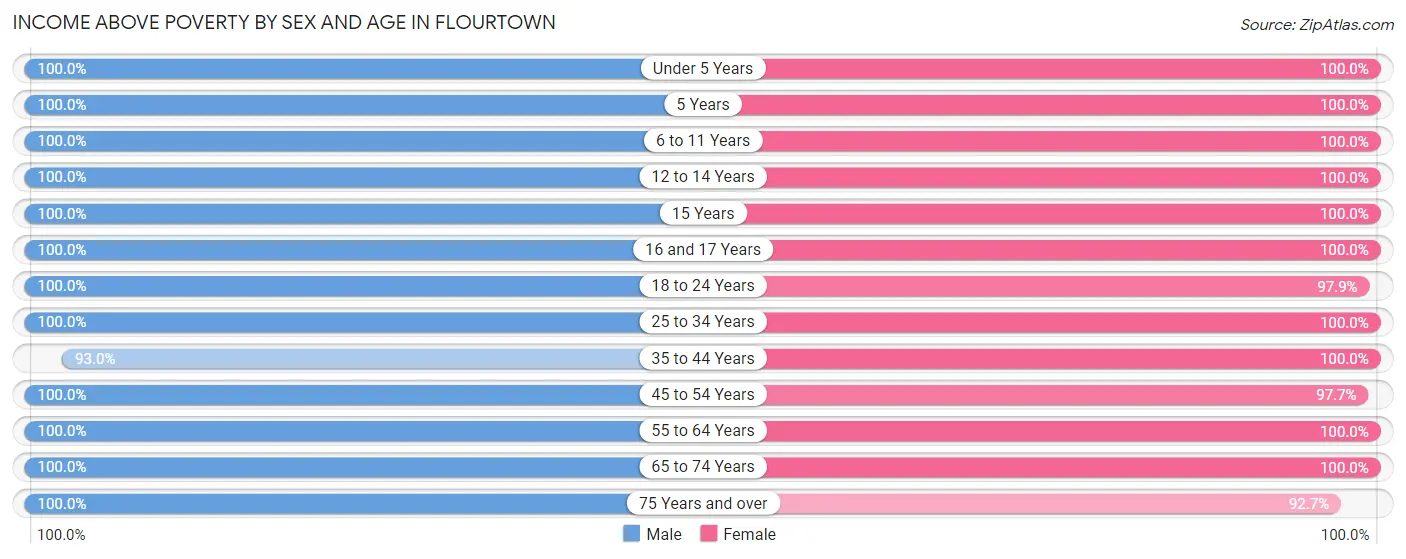
| Age Bracket | Male | Female |
| Under 5 Years | 132 (100.0%) | 123 (100.0%) |
| 5 Years | 35 (100.0%) | 17 (100.0%) |
| 6 to 11 Years | 133 (100.0%) | 97 (100.0%) |
| 12 to 14 Years | 139 (100.0%) | 51 (100.0%) |
| 15 Years | 43 (100.0%) | 89 (100.0%) |
| 16 and 17 Years | 113 (100.0%) | 61 (100.0%) |
| 18 to 24 Years | 145 (100.0%) | 142 (97.9%) |
| 25 to 34 Years | 212 (100.0%) | 259 (100.0%) |
| 35 to 44 Years | 280 (93.0%) | 286 (100.0%) |
| 45 to 54 Years | 324 (100.0%) | 390 (97.7%) |
| 55 to 64 Years | 238 (100.0%) | 294 (100.0%) |
| 65 to 74 Years | 263 (100.0%) | 294 (100.0%) |
| 75 Years and over | 62 (100.0%) | 189 (92.6%) |
| Total | 2,119 (99.0%) | 2,292 (98.8%) |
Income Below Poverty Among Married-Couple Families in Flourtown
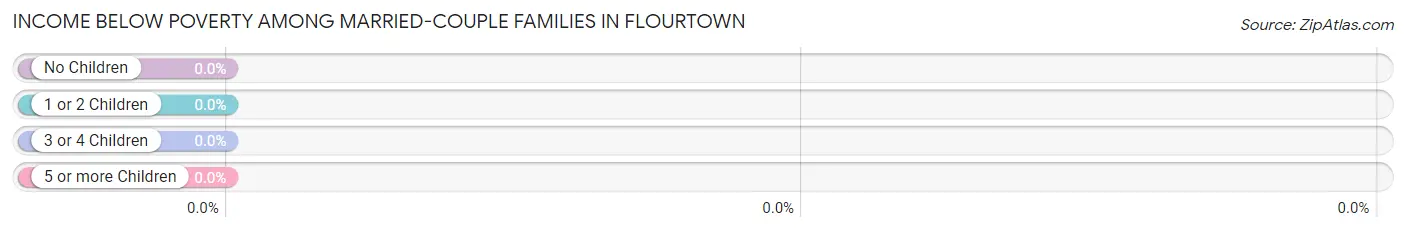
| Children | Above Poverty | Below Poverty |
| No Children | 468 (100.0%) | 0 (0.0%) |
| 1 or 2 Children | 496 (100.0%) | 0 (0.0%) |
| 3 or 4 Children | 78 (100.0%) | 0 (0.0%) |
| 5 or more Children | 0 (0.0%) | 0 (0.0%) |
| Total | 1,042 (100.0%) | 0 (0.0%) |
Income Below Poverty Among Single-Parent Households in Flourtown
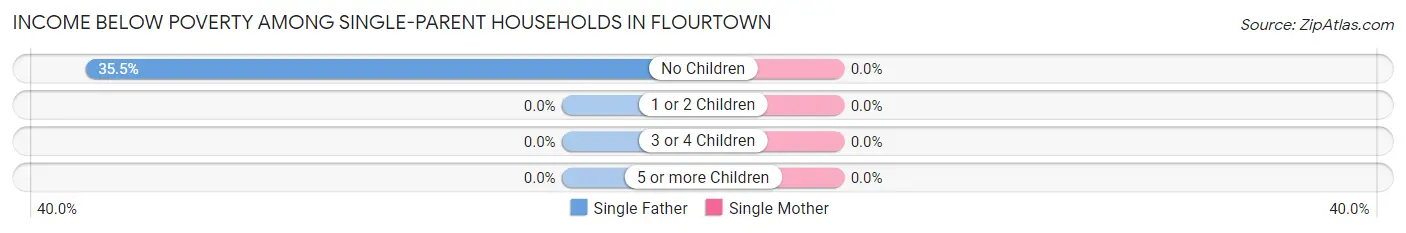
| Children | Single Father | Single Mother |
| No Children | 11 (35.5%) | 0 (0.0%) |
| 1 or 2 Children | 0 (0.0%) | 0 (0.0%) |
| 3 or 4 Children | 0 (0.0%) | 0 (0.0%) |
| 5 or more Children | 0 (0.0%) | 0 (0.0%) |
| Total | 11 (10.9%) | 0 (0.0%) |
Income Below Poverty Among Married-Couple vs Single-Parent Households in Flourtown
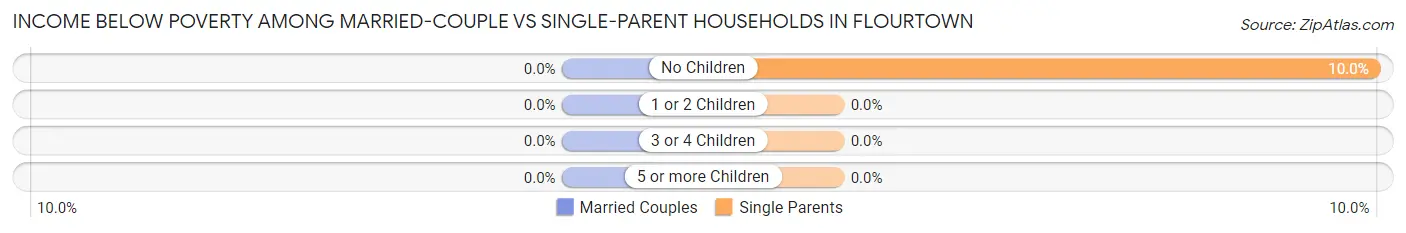
| Children | Married-Couple Families | Single-Parent Households |
| No Children | 0 (0.0%) | 11 (10.0%) |
| 1 or 2 Children | 0 (0.0%) | 0 (0.0%) |
| 3 or 4 Children | 0 (0.0%) | 0 (0.0%) |
| 5 or more Children | 0 (0.0%) | 0 (0.0%) |
| Total | 0 (0.0%) | 11 (5.6%) |
Race in Flourtown
The most populous races in Flourtown are White / Caucasian (3,813 | 82.9%), Black / African American (400 | 8.7%), and Two or more Races (191 | 4.2%).
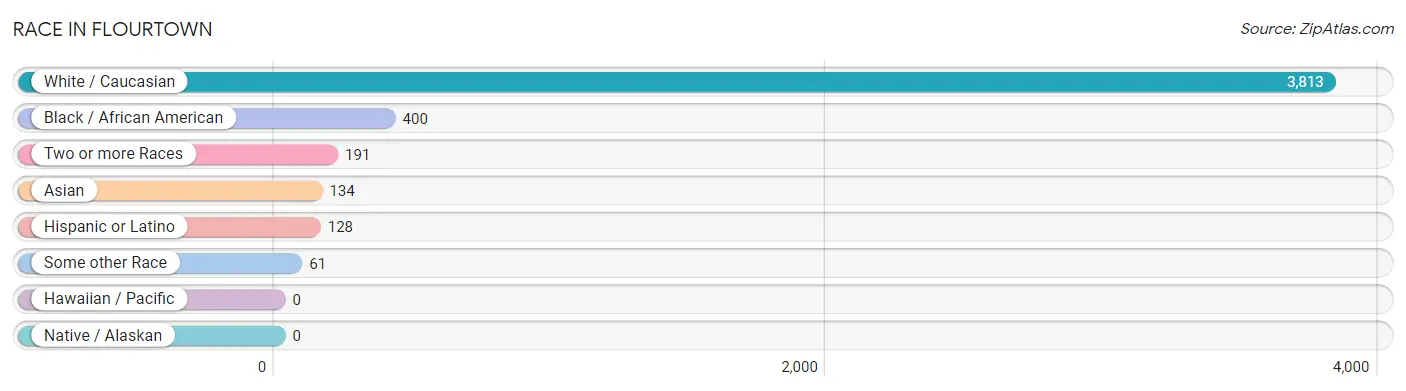
| Race | # Population | % Population |
| Asian | 134 | 2.9% |
| Black / African American | 400 | 8.7% |
| Hawaiian / Pacific | 0 | 0.0% |
| Hispanic or Latino | 128 | 2.8% |
| Native / Alaskan | 0 | 0.0% |
| White / Caucasian | 3,813 | 82.9% |
| Two or more Races | 191 | 4.2% |
| Some other Race | 61 | 1.3% |
| Total | 4,599 | 100.0% |
Ancestry in Flourtown
The most populous ancestries reported in Flourtown are Irish (1,395 | 30.3%), Italian (942 | 20.5%), German (939 | 20.4%), English (506 | 11.0%), and Polish (245 | 5.3%), together accounting for 87.6% of all Flourtown residents.
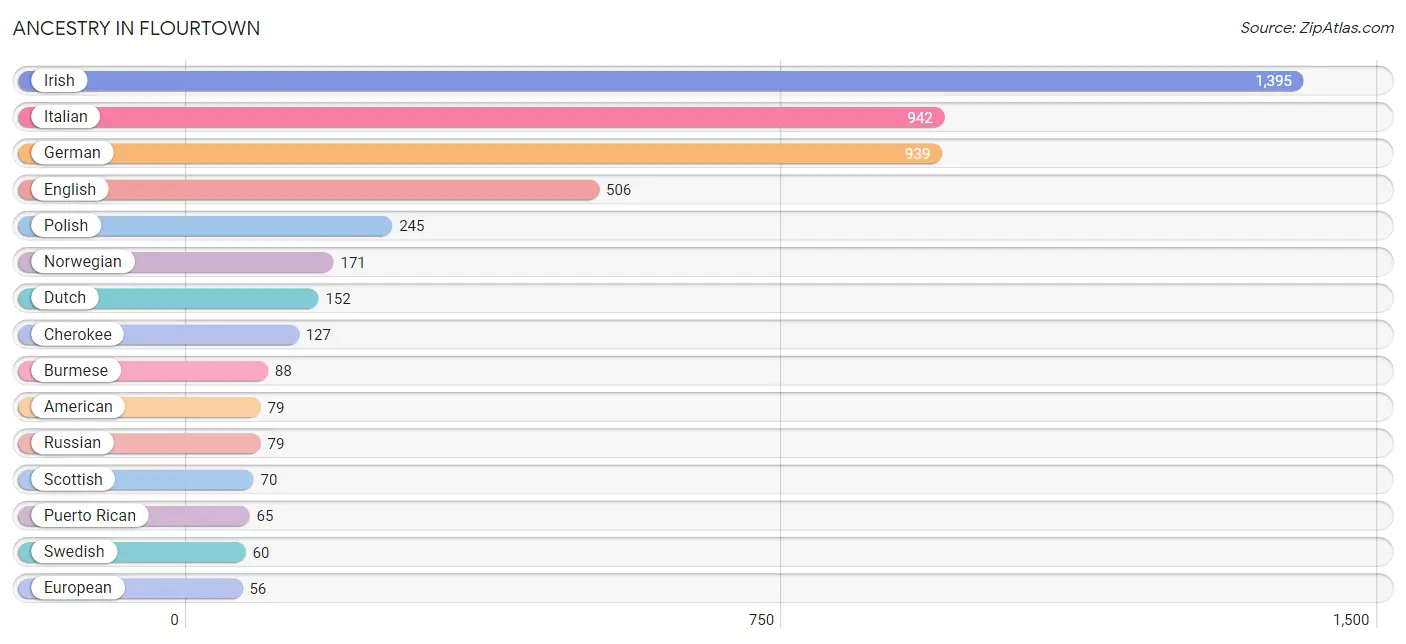
| Ancestry | # Population | % Population |
| American | 79 | 1.7% |
| Assyrian / Chaldean / Syriac | 14 | 0.3% |
| Austrian | 8 | 0.2% |
| British | 23 | 0.5% |
| Burmese | 88 | 1.9% |
| Cherokee | 127 | 2.8% |
| Czech | 13 | 0.3% |
| Czechoslovakian | 18 | 0.4% |
| Dominican | 11 | 0.2% |
| Dutch | 152 | 3.3% |
| Eastern European | 36 | 0.8% |
| English | 506 | 11.0% |
| European | 56 | 1.2% |
| French | 13 | 0.3% |
| French Canadian | 13 | 0.3% |
| German | 939 | 20.4% |
| Greek | 13 | 0.3% |
| Hungarian | 7 | 0.2% |
| Indian (Asian) | 48 | 1.0% |
| Irish | 1,395 | 30.3% |
| Italian | 942 | 20.5% |
| Jamaican | 45 | 1.0% |
| Korean | 39 | 0.9% |
| Latvian | 35 | 0.8% |
| Lithuanian | 42 | 0.9% |
| Norwegian | 171 | 3.7% |
| Polish | 245 | 5.3% |
| Puerto Rican | 65 | 1.4% |
| Romanian | 33 | 0.7% |
| Russian | 79 | 1.7% |
| Scotch-Irish | 38 | 0.8% |
| Scottish | 70 | 1.5% |
| Slovak | 37 | 0.8% |
| Spaniard | 52 | 1.1% |
| Swedish | 60 | 1.3% |
| Swiss | 26 | 0.6% |
| Thai | 7 | 0.2% |
| Turkish | 7 | 0.2% |
| Ukrainian | 43 | 0.9% | View All 39 Rows |
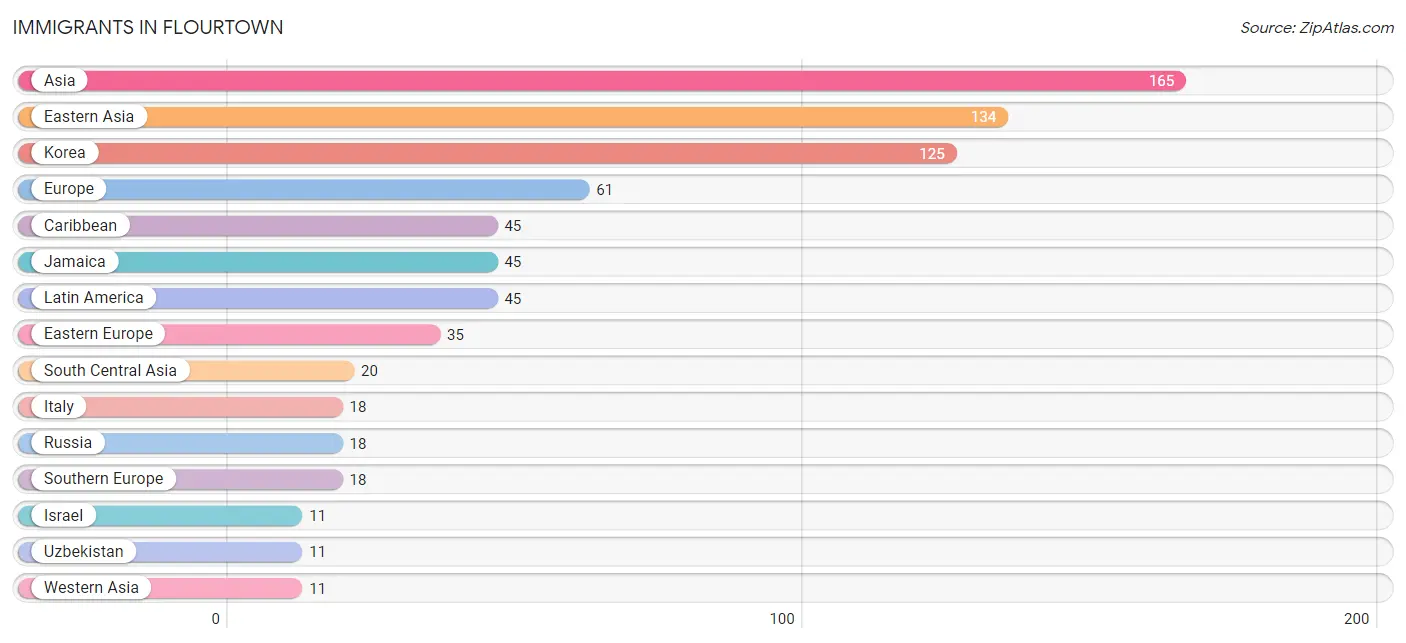
Immigrants in Flourtown
The most numerous immigrant groups reported in Flourtown came from Asia (165 | 3.6%), Eastern Asia (134 | 2.9%), Korea (125 | 2.7%), Europe (61 | 1.3%), and Caribbean (45 | 1.0%), together accounting for 11.5% of all Flourtown residents.
| Immigration Origin | # Population | % Population |
| Asia | 165 | 3.6% |
| Canada | 8 | 0.2% |
| Caribbean | 45 | 1.0% |
| China | 9 | 0.2% |
| Czechoslovakia | 9 | 0.2% |
| Eastern Asia | 134 | 2.9% |
| Eastern Europe | 35 | 0.8% |
| Europe | 61 | 1.3% |
| Israel | 11 | 0.2% |
| Italy | 18 | 0.4% |
| Jamaica | 45 | 1.0% |
| Kazakhstan | 9 | 0.2% |
| Korea | 125 | 2.7% |
| Latin America | 45 | 1.0% |
| Northern Europe | 8 | 0.2% |
| Poland | 8 | 0.2% |
| Russia | 18 | 0.4% |
| South Central Asia | 20 | 0.4% |
| Southern Europe | 18 | 0.4% |
| Uzbekistan | 11 | 0.2% |
| Western Asia | 11 | 0.2% | View All 21 Rows |
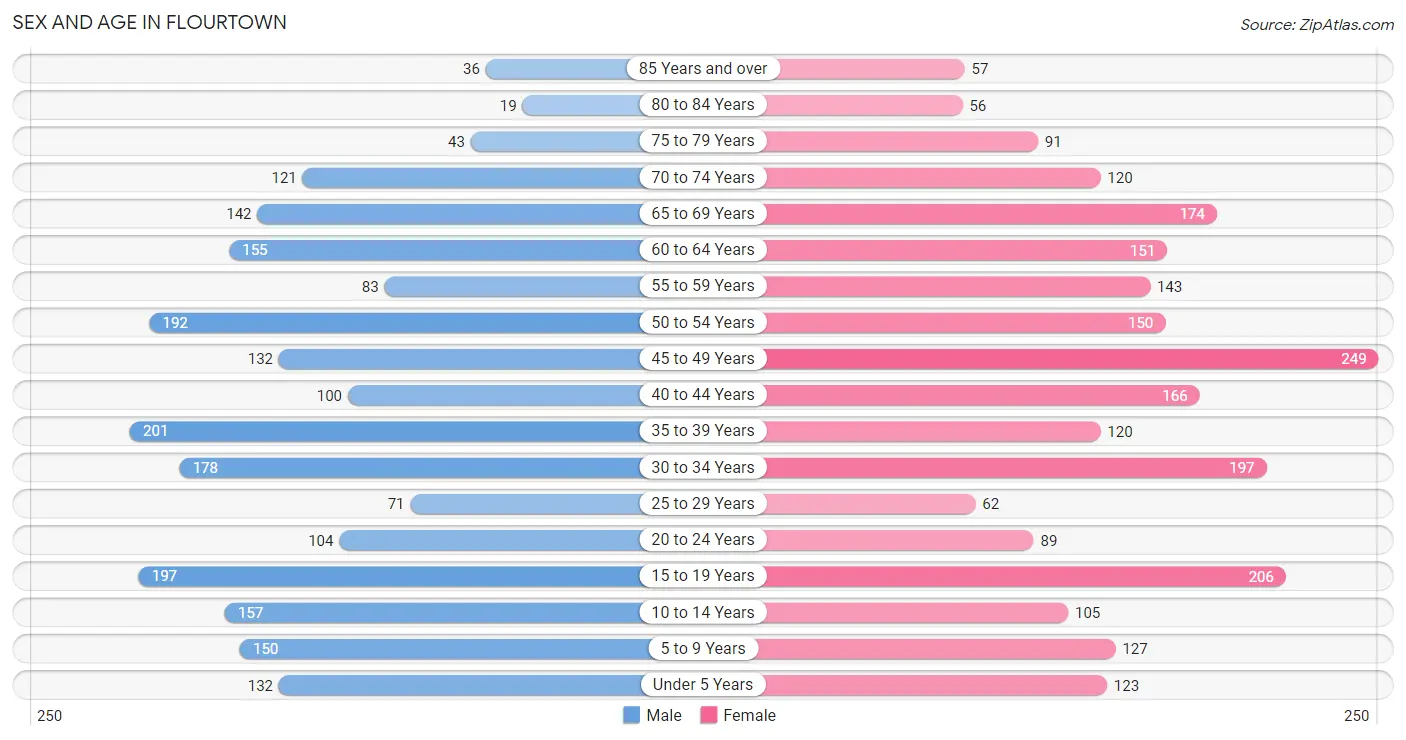
Sex and Age in Flourtown
Sex and Age in Flourtown
The most populous age groups in Flourtown are 35 to 39 Years (201 | 9.1%) for men and 45 to 49 Years (249 | 10.4%) for women.
| Age Bracket | Male | Female |
| Under 5 Years | 132 (6.0%) | 123 (5.2%) |
| 5 to 9 Years | 150 (6.8%) | 127 (5.3%) |
| 10 to 14 Years | 157 (7.1%) | 105 (4.4%) |
| 15 to 19 Years | 197 (8.9%) | 206 (8.6%) |
| 20 to 24 Years | 104 (4.7%) | 89 (3.7%) |
| 25 to 29 Years | 71 (3.2%) | 62 (2.6%) |
| 30 to 34 Years | 178 (8.0%) | 197 (8.3%) |
| 35 to 39 Years | 201 (9.1%) | 120 (5.0%) |
| 40 to 44 Years | 100 (4.5%) | 166 (7.0%) |
| 45 to 49 Years | 132 (6.0%) | 249 (10.4%) |
| 50 to 54 Years | 192 (8.7%) | 150 (6.3%) |
| 55 to 59 Years | 83 (3.7%) | 143 (6.0%) |
| 60 to 64 Years | 155 (7.0%) | 151 (6.3%) |
| 65 to 69 Years | 142 (6.4%) | 174 (7.3%) |
| 70 to 74 Years | 121 (5.5%) | 120 (5.0%) |
| 75 to 79 Years | 43 (1.9%) | 91 (3.8%) |
| 80 to 84 Years | 19 (0.9%) | 56 (2.4%) |
| 85 Years and over | 36 (1.6%) | 57 (2.4%) |
| Total | 2,213 (100.0%) | 2,386 (100.0%) |
Families and Households in Flourtown
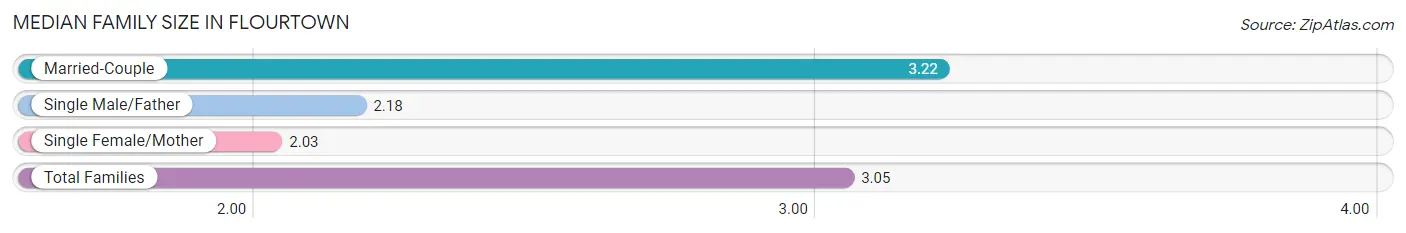
Median Family Size in Flourtown
The median family size in Flourtown is 3.05 persons per family, with married-couple families (1,042 | 84.2%) accounting for the largest median family size of 3.22 persons per family. On the other hand, single female/mother families (94 | 7.6%) represent the smallest median family size with 2.03 persons per family.
| Family Type | # Families | Family Size |
| Married-Couple | 1,042 (84.2%) | 3.22 |
| Single Male/Father | 101 (8.2%) | 2.18 |
| Single Female/Mother | 94 (7.6%) | 2.03 |
| Total Families | 1,237 (100.0%) | 3.05 |
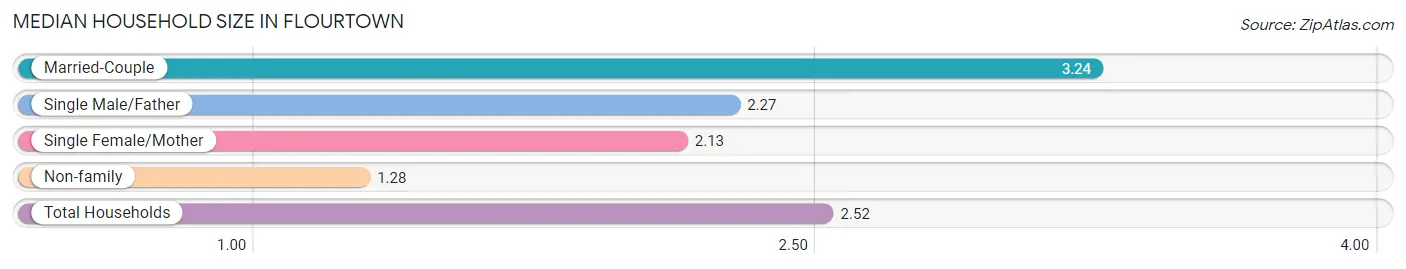
Median Household Size in Flourtown
The median household size in Flourtown is 2.52 persons per household, with married-couple households (1,042 | 58.2%) accounting for the largest median household size of 3.24 persons per household. non-family households (555 | 31.0%) represent the smallest median household size with 1.28 persons per household.
| Household Type | # Households | Household Size |
| Married-Couple | 1,042 (58.2%) | 3.24 |
| Single Male/Father | 101 (5.6%) | 2.27 |
| Single Female/Mother | 94 (5.2%) | 2.13 |
| Non-family | 555 (31.0%) | 1.28 |
| Total Households | 1,792 (100.0%) | 2.52 |
Household Size by Marriage Status in Flourtown
Out of a total of 1,792 households in Flourtown, 1,237 (69.0%) are family households, while 555 (31.0%) are nonfamily households. The most numerous type of family households are 2-person households, comprising 514, and the most common type of nonfamily households are 1-person households, comprising 466.
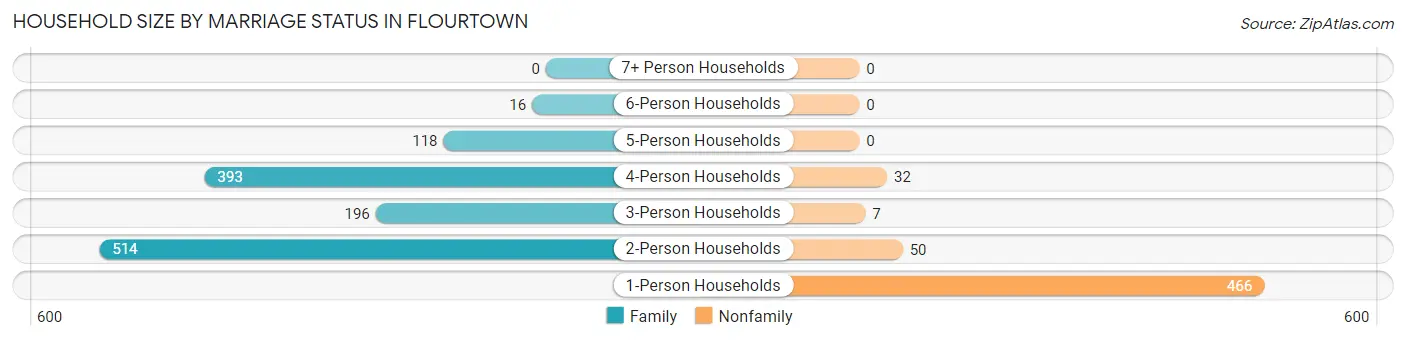
| Household Size | Family Households | Nonfamily Households |
| 1-Person Households | - | 466 (26.0%) |
| 2-Person Households | 514 (28.7%) | 50 (2.8%) |
| 3-Person Households | 196 (10.9%) | 7 (0.4%) |
| 4-Person Households | 393 (21.9%) | 32 (1.8%) |
| 5-Person Households | 118 (6.6%) | 0 (0.0%) |
| 6-Person Households | 16 (0.9%) | 0 (0.0%) |
| 7+ Person Households | 0 (0.0%) | 0 (0.0%) |
| Total | 1,237 (69.0%) | 555 (31.0%) |
Female Fertility in Flourtown
Fertility by Age in Flourtown
Average fertility rate in Flourtown is 30.0 births per 1,000 women. Women in the age bracket of 20 to 34 years have the highest fertility rate with 72.0 births per 1,000 women. Women in the age bracket of 20 to 34 years acount for 75.8% of all women with births.
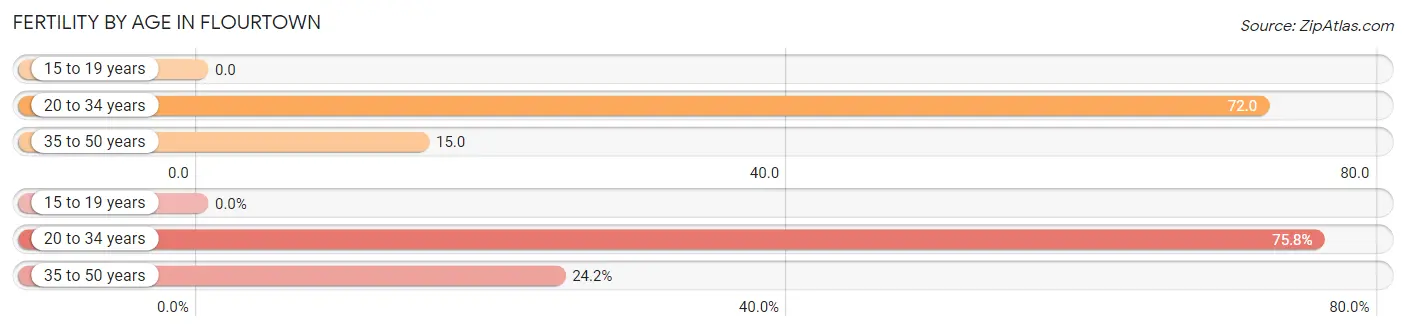
| Age Bracket | Women with Births | Births / 1,000 Women |
| 15 to 19 years | 0 (0.0%) | 0.0 |
| 20 to 34 years | 25 (75.8%) | 72.0 |
| 35 to 50 years | 8 (24.2%) | 15.0 |
| Total | 33 (100.0%) | 30.0 |
Fertility by Age by Marriage Status in Flourtown
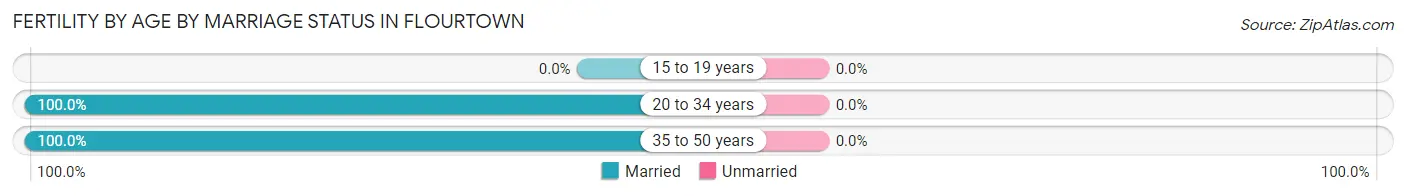
| Age Bracket | Married | Unmarried |
| 15 to 19 years | 0 (0.0%) | 0 (0.0%) |
| 20 to 34 years | 25 (100.0%) | 0 (0.0%) |
| 35 to 50 years | 8 (100.0%) | 0 (0.0%) |
| Total | 33 (100.0%) | 0 (0.0%) |
Fertility by Education in Flourtown
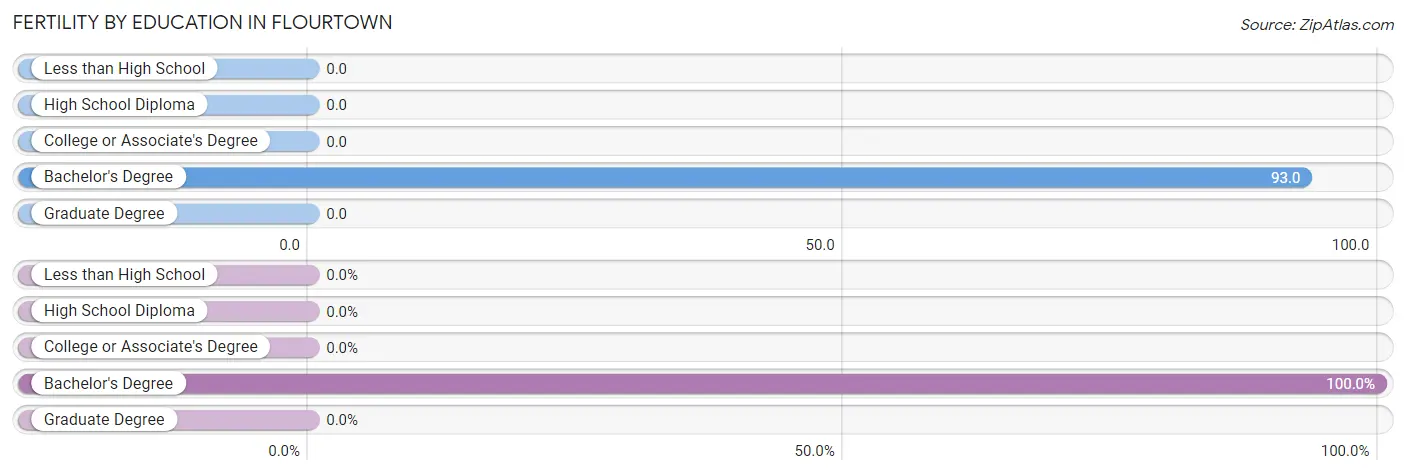
| Educational Attainment | Women with Births | Births / 1,000 Women |
| Less than High School | 0 (0.0%) | 0.0 |
| High School Diploma | 0 (0.0%) | 0.0 |
| College or Associate's Degree | 0 (0.0%) | 0.0 |
| Bachelor's Degree | 33 (100.0%) | 93.0 |
| Graduate Degree | 0 (0.0%) | 0.0 |
| Total | 33 (100.0%) | 30.0 |
Fertility by Education by Marriage Status in Flourtown
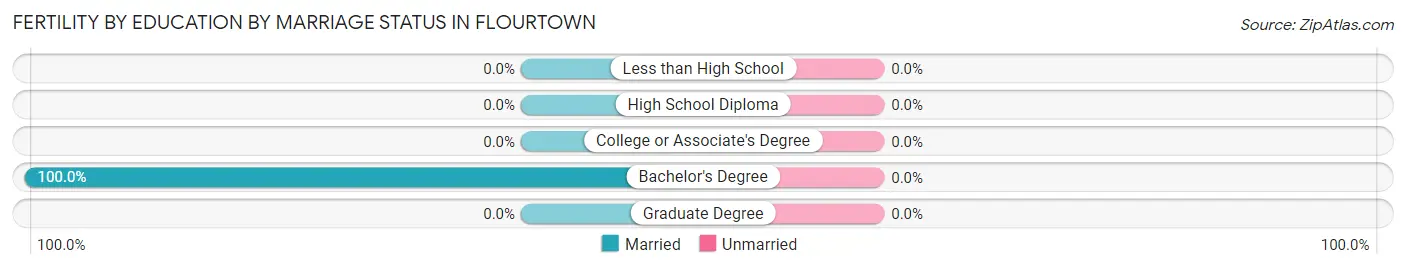
| Educational Attainment | Married | Unmarried |
| Less than High School | 0 (0.0%) | 0 (0.0%) |
| High School Diploma | 0 (0.0%) | 0 (0.0%) |
| College or Associate's Degree | 0 (0.0%) | 0 (0.0%) |
| Bachelor's Degree | 33 (100.0%) | 0 (0.0%) |
| Graduate Degree | 0 (0.0%) | 0 (0.0%) |
| Total | 33 (100.0%) | 0 (0.0%) |
Employment Characteristics in Flourtown
Employment by Class of Employer in Flourtown
Among the 2,407 employed individuals in Flourtown, private company employees (1,607 | 66.8%), not-for-profit organizations (361 | 15.0%), and self-employed (not incorporated) (139 | 5.8%) make up the most common classes of employment.
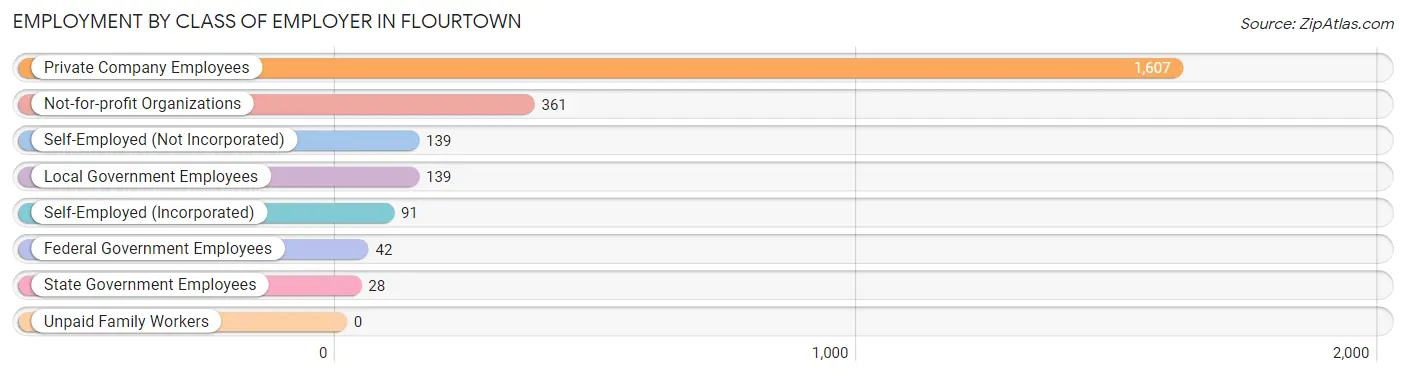
| Employer Class | # Employees | % Employees |
| Private Company Employees | 1,607 | 66.8% |
| Self-Employed (Incorporated) | 91 | 3.8% |
| Self-Employed (Not Incorporated) | 139 | 5.8% |
| Not-for-profit Organizations | 361 | 15.0% |
| Local Government Employees | 139 | 5.8% |
| State Government Employees | 28 | 1.2% |
| Federal Government Employees | 42 | 1.7% |
| Unpaid Family Workers | 0 | 0.0% |
| Total | 2,407 | 100.0% |
Employment Status by Age in Flourtown
According to the labor force statistics for Flourtown, out of the total population over 16 years of age (3,673), 72.3% or 2,656 individuals are in the labor force, with 3.2% or 85 of them unemployed. The age group with the highest labor force participation rate is 30 to 34 years, with 95.7% or 359 individuals in the labor force. Within the labor force, the 20 to 24 years age range has the highest percentage of unemployed individuals, with 6.2% or 10 of them being unemployed.
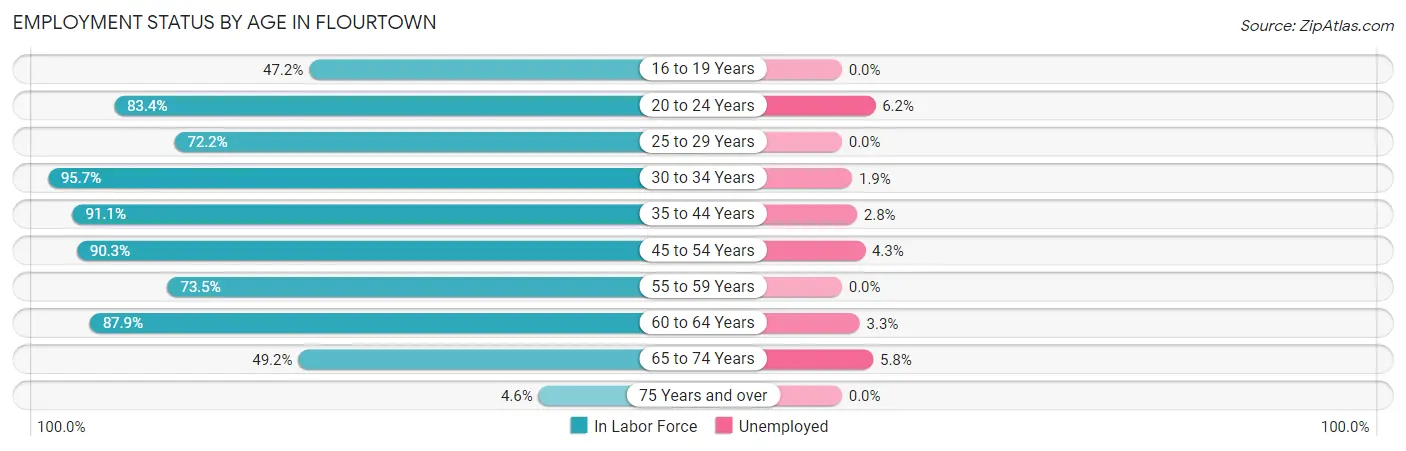
| Age Bracket | In Labor Force | Unemployed |
| 16 to 19 Years | 128 (47.2%) | 0 (0.0%) |
| 20 to 24 Years | 161 (83.4%) | 10 (6.2%) |
| 25 to 29 Years | 96 (72.2%) | 0 (0.0%) |
| 30 to 34 Years | 359 (95.7%) | 7 (1.9%) |
| 35 to 44 Years | 535 (91.1%) | 15 (2.8%) |
| 45 to 54 Years | 653 (90.3%) | 28 (4.3%) |
| 55 to 59 Years | 166 (73.5%) | 0 (0.0%) |
| 60 to 64 Years | 269 (87.9%) | 9 (3.3%) |
| 65 to 74 Years | 274 (49.2%) | 16 (5.8%) |
| 75 Years and over | 14 (4.6%) | 0 (0.0%) |
| Total | 2,656 (72.3%) | 85 (3.2%) |
Employment Status by Educational Attainment in Flourtown
According to labor force statistics for Flourtown, 88.4% of individuals (2,077) out of the total population between 25 and 64 years of age (2,350) are in the labor force, with 2.8% or 58 of them being unemployed. The group with the highest labor force participation rate are those with the educational attainment of bachelor's degree or higher, with 90.1% or 1,427 individuals in the labor force. Within the labor force, individuals with less than high school education have the highest percentage of unemployment, with 12.7% or 7 of them being unemployed.
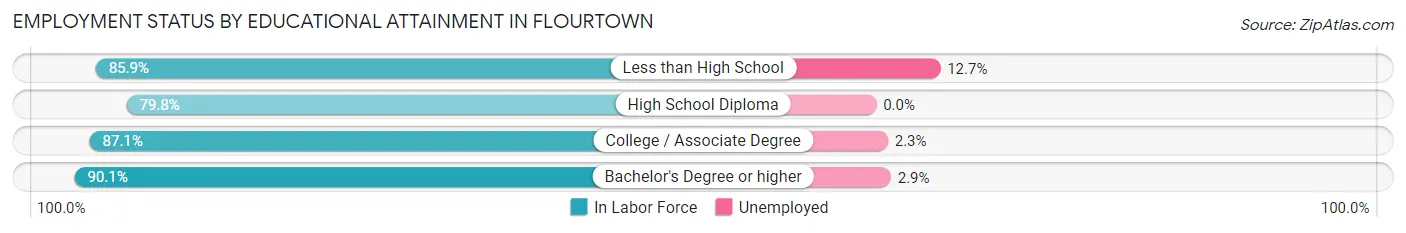
| Educational Attainment | In Labor Force | Unemployed |
| Less than High School | 55 (85.9%) | 8 (12.7%) |
| High School Diploma | 170 (79.8%) | 0 (0.0%) |
| College / Associate Degree | 426 (87.1%) | 11 (2.3%) |
| Bachelor's Degree or higher | 1,427 (90.1%) | 46 (2.9%) |
| Total | 2,077 (88.4%) | 66 (2.8%) |
Employment Occupations by Sex in Flourtown
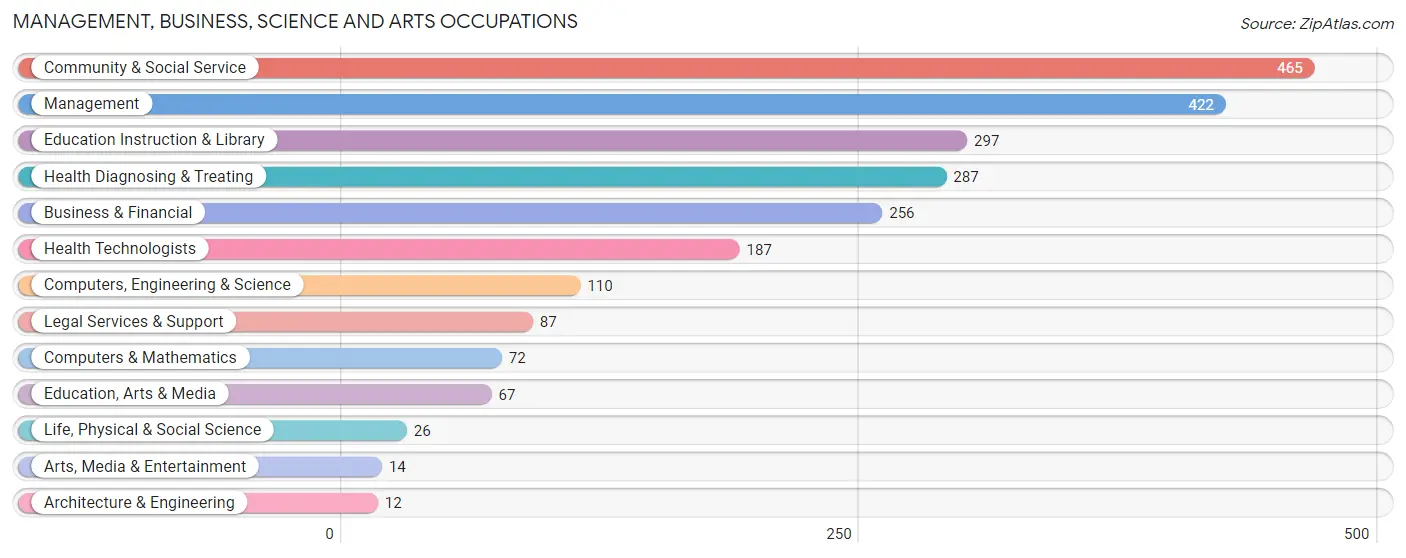
Management, Business, Science and Arts Occupations
The most common Management, Business, Science and Arts occupations in Flourtown are Community & Social Service (465 | 18.1%), Management (422 | 16.4%), Education Instruction & Library (297 | 11.6%), Health Diagnosing & Treating (287 | 11.2%), and Business & Financial (256 | 10.0%).
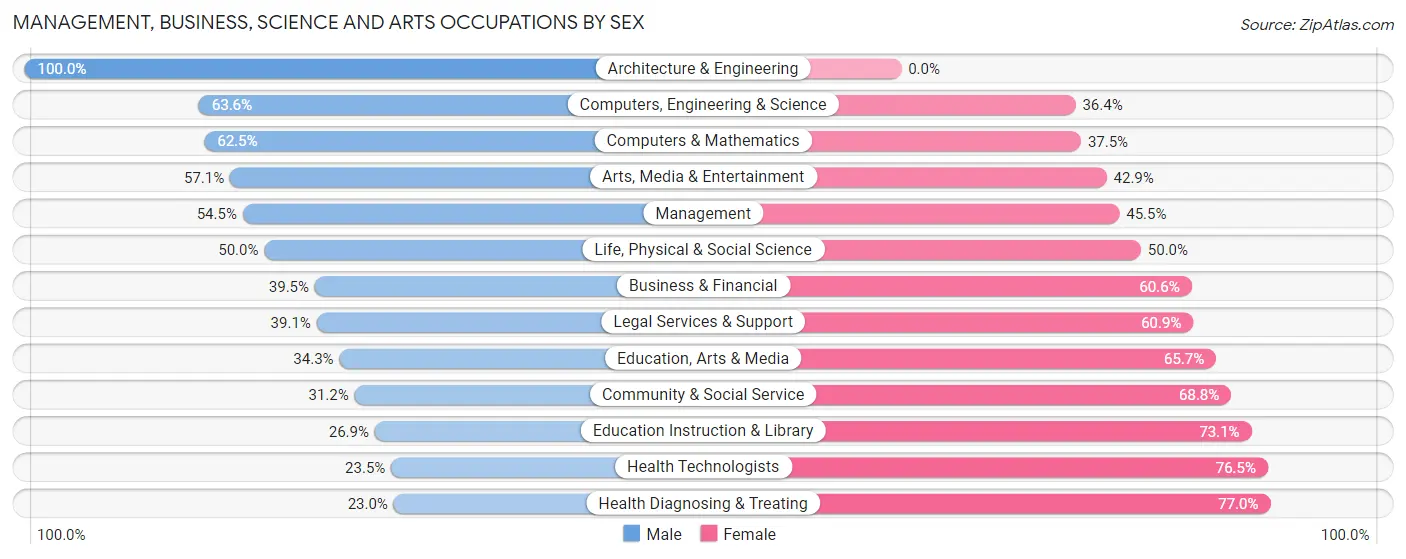
Management, Business, Science and Arts Occupations by Sex
Within the Management, Business, Science and Arts occupations in Flourtown, the most male-oriented occupations are Architecture & Engineering (100.0%), Computers, Engineering & Science (63.6%), and Computers & Mathematics (62.5%), while the most female-oriented occupations are Health Diagnosing & Treating (77.0%), Health Technologists (76.5%), and Education Instruction & Library (73.1%).
| Occupation | Male | Female |
| Management | 230 (54.5%) | 192 (45.5%) |
| Business & Financial | 101 (39.5%) | 155 (60.6%) |
| Computers, Engineering & Science | 70 (63.6%) | 40 (36.4%) |
| Computers & Mathematics | 45 (62.5%) | 27 (37.5%) |
| Architecture & Engineering | 12 (100.0%) | 0 (0.0%) |
| Life, Physical & Social Science | 13 (50.0%) | 13 (50.0%) |
| Community & Social Service | 145 (31.2%) | 320 (68.8%) |
| Education, Arts & Media | 23 (34.3%) | 44 (65.7%) |
| Legal Services & Support | 34 (39.1%) | 53 (60.9%) |
| Education Instruction & Library | 80 (26.9%) | 217 (73.1%) |
| Arts, Media & Entertainment | 8 (57.1%) | 6 (42.9%) |
| Health Diagnosing & Treating | 66 (23.0%) | 221 (77.0%) |
| Health Technologists | 44 (23.5%) | 143 (76.5%) |
| Total (Category) | 612 (39.7%) | 928 (60.3%) |
| Total (Overall) | 1,204 (46.9%) | 1,366 (53.1%) |
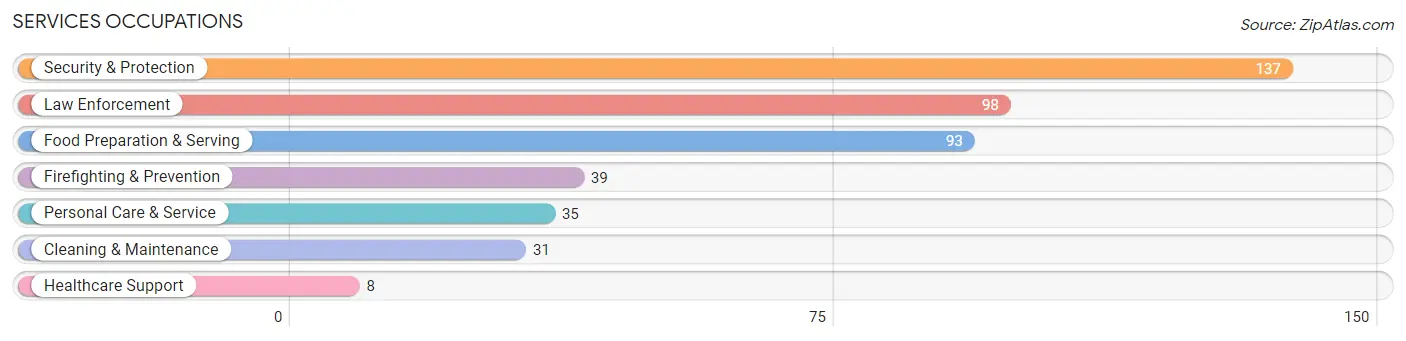
Services Occupations
The most common Services occupations in Flourtown are Security & Protection (137 | 5.3%), Law Enforcement (98 | 3.8%), Food Preparation & Serving (93 | 3.6%), Firefighting & Prevention (39 | 1.5%), and Personal Care & Service (35 | 1.4%).
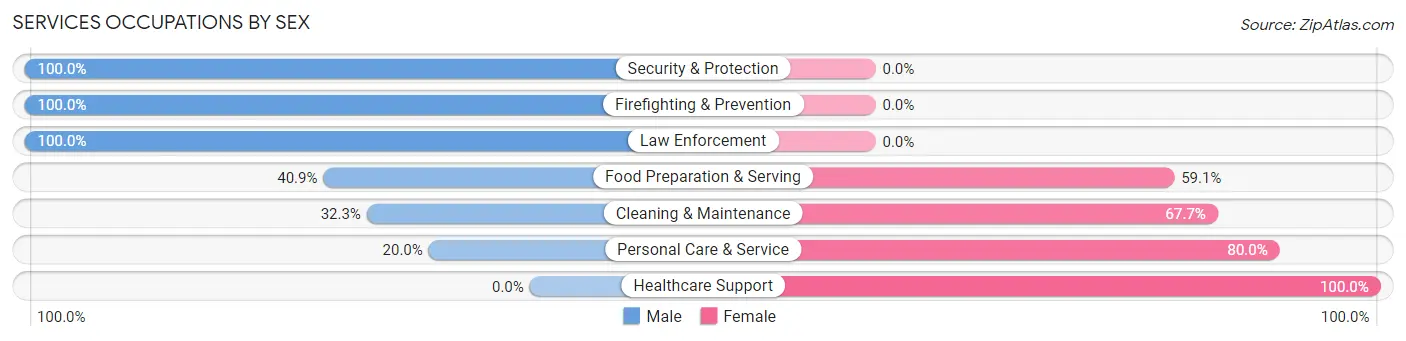
Services Occupations by Sex
Within the Services occupations in Flourtown, the most male-oriented occupations are Security & Protection (100.0%), Firefighting & Prevention (100.0%), and Law Enforcement (100.0%), while the most female-oriented occupations are Healthcare Support (100.0%), Personal Care & Service (80.0%), and Cleaning & Maintenance (67.7%).
| Occupation | Male | Female |
| Healthcare Support | 0 (0.0%) | 8 (100.0%) |
| Security & Protection | 137 (100.0%) | 0 (0.0%) |
| Firefighting & Prevention | 39 (100.0%) | 0 (0.0%) |
| Law Enforcement | 98 (100.0%) | 0 (0.0%) |
| Food Preparation & Serving | 38 (40.9%) | 55 (59.1%) |
| Cleaning & Maintenance | 10 (32.3%) | 21 (67.7%) |
| Personal Care & Service | 7 (20.0%) | 28 (80.0%) |
| Total (Category) | 192 (63.2%) | 112 (36.8%) |
| Total (Overall) | 1,204 (46.9%) | 1,366 (53.1%) |
Sales and Office Occupations
The most common Sales and Office occupations in Flourtown are Sales & Related (316 | 12.3%), and Office & Administration (186 | 7.2%).

Sales and Office Occupations by Sex
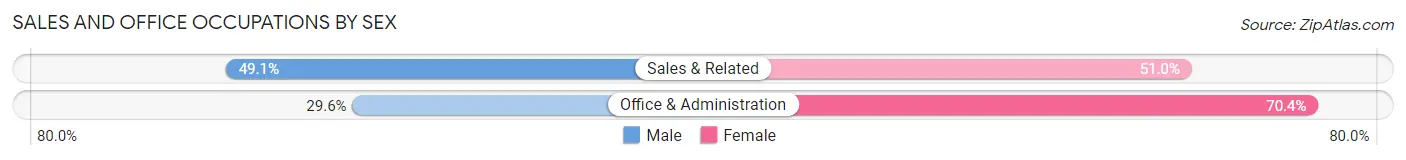
| Occupation | Male | Female |
| Sales & Related | 155 (49.0%) | 161 (50.9%) |
| Office & Administration | 55 (29.6%) | 131 (70.4%) |
| Total (Category) | 210 (41.8%) | 292 (58.2%) |
| Total (Overall) | 1,204 (46.9%) | 1,366 (53.1%) |
Natural Resources, Construction and Maintenance Occupations
The most common Natural Resources, Construction and Maintenance occupations in Flourtown are Construction & Extraction (48 | 1.9%), and Installation, Maintenance & Repair (28 | 1.1%).
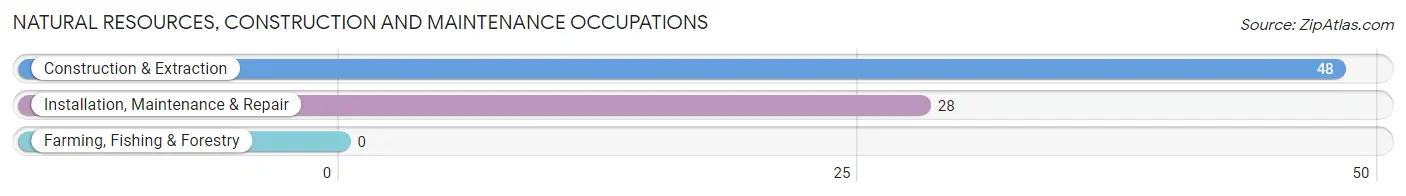
Natural Resources, Construction and Maintenance Occupations by Sex

| Occupation | Male | Female |
| Farming, Fishing & Forestry | 0 (0.0%) | 0 (0.0%) |
| Construction & Extraction | 48 (100.0%) | 0 (0.0%) |
| Installation, Maintenance & Repair | 28 (100.0%) | 0 (0.0%) |
| Total (Category) | 76 (100.0%) | 0 (0.0%) |
| Total (Overall) | 1,204 (46.9%) | 1,366 (53.1%) |
Production, Transportation and Moving Occupations
The most common Production, Transportation and Moving occupations in Flourtown are Transportation (61 | 2.4%), Production (54 | 2.1%), and Material Moving (33 | 1.3%).
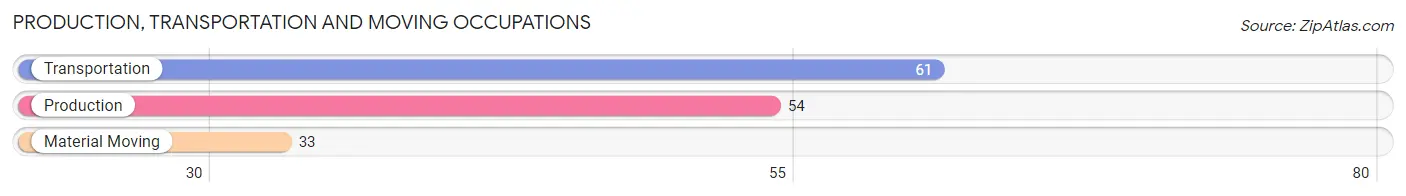
Production, Transportation and Moving Occupations by Sex
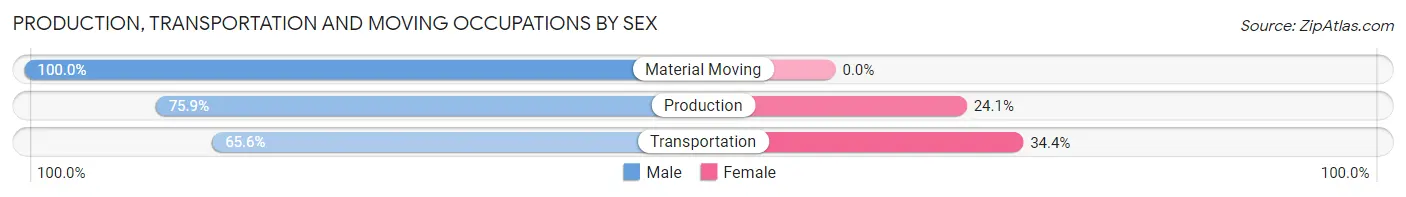
| Occupation | Male | Female |
| Production | 41 (75.9%) | 13 (24.1%) |
| Transportation | 40 (65.6%) | 21 (34.4%) |
| Material Moving | 33 (100.0%) | 0 (0.0%) |
| Total (Category) | 114 (77.0%) | 34 (23.0%) |
| Total (Overall) | 1,204 (46.9%) | 1,366 (53.1%) |
Employment Industries by Sex in Flourtown
Employment Industries in Flourtown
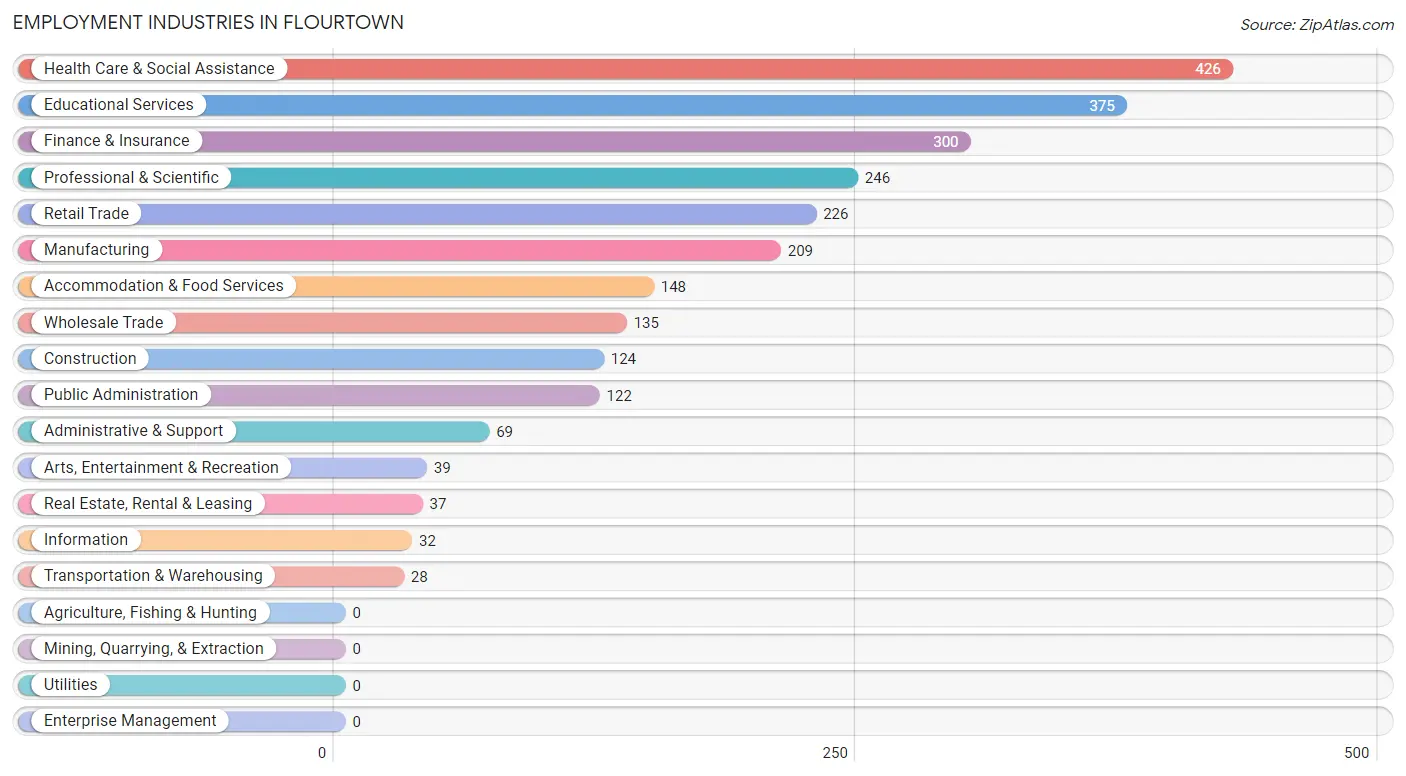
The major employment industries in Flourtown include Health Care & Social Assistance (426 | 16.6%), Educational Services (375 | 14.6%), Finance & Insurance (300 | 11.7%), Professional & Scientific (246 | 9.6%), and Retail Trade (226 | 8.8%).
Employment Industries by Sex in Flourtown
The Flourtown industries that see more men than women are Arts, Entertainment & Recreation (87.2%), Public Administration (86.9%), and Professional & Scientific (70.7%), whereas the industries that tend to have a higher number of women are Information (78.1%), Transportation & Warehousing (75.0%), and Accommodation & Food Services (74.3%).
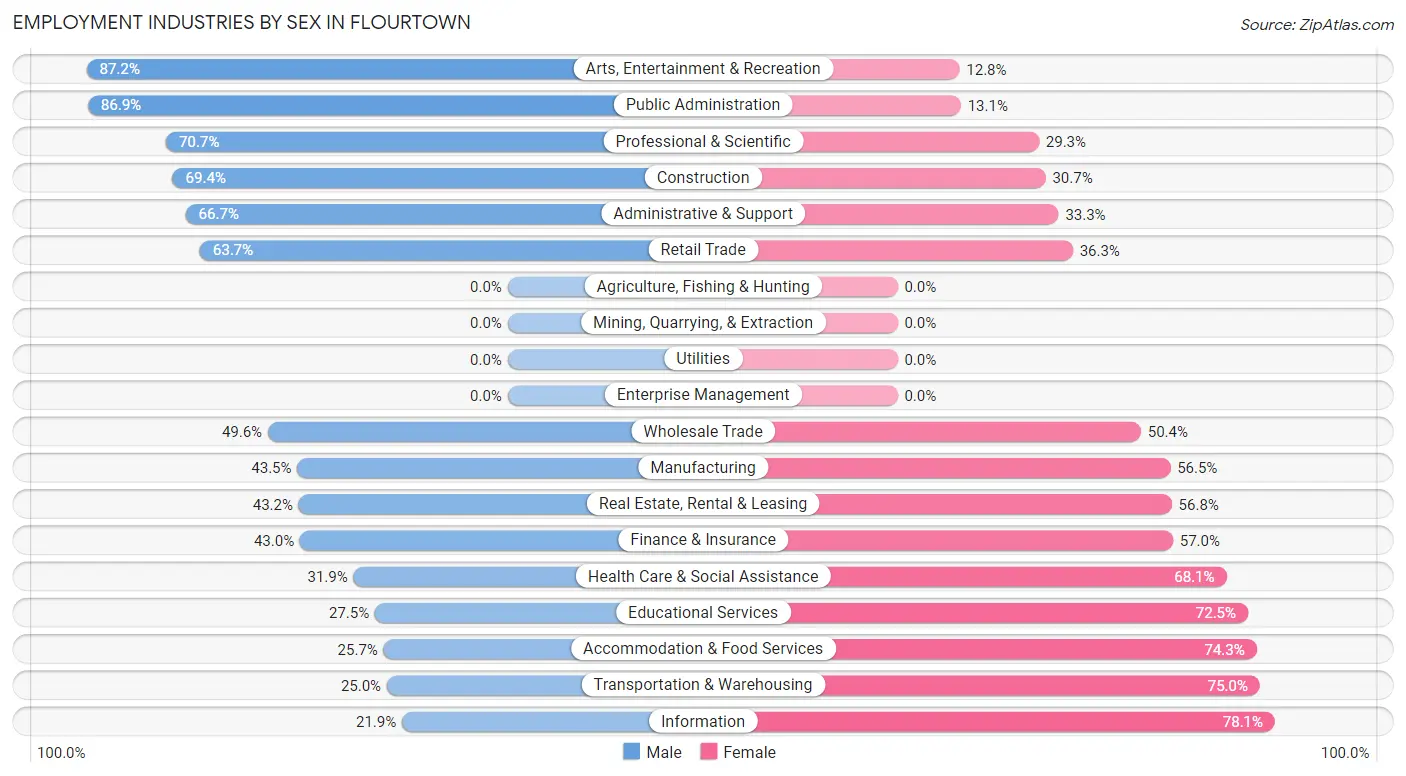
| Industry | Male | Female |
| Agriculture, Fishing & Hunting | 0 (0.0%) | 0 (0.0%) |
| Mining, Quarrying, & Extraction | 0 (0.0%) | 0 (0.0%) |
| Construction | 86 (69.4%) | 38 (30.6%) |
| Manufacturing | 91 (43.5%) | 118 (56.5%) |
| Wholesale Trade | 67 (49.6%) | 68 (50.4%) |
| Retail Trade | 144 (63.7%) | 82 (36.3%) |
| Transportation & Warehousing | 7 (25.0%) | 21 (75.0%) |
| Utilities | 0 (0.0%) | 0 (0.0%) |
| Information | 7 (21.9%) | 25 (78.1%) |
| Finance & Insurance | 129 (43.0%) | 171 (57.0%) |
| Real Estate, Rental & Leasing | 16 (43.2%) | 21 (56.8%) |
| Professional & Scientific | 174 (70.7%) | 72 (29.3%) |
| Enterprise Management | 0 (0.0%) | 0 (0.0%) |
| Administrative & Support | 46 (66.7%) | 23 (33.3%) |
| Educational Services | 103 (27.5%) | 272 (72.5%) |
| Health Care & Social Assistance | 136 (31.9%) | 290 (68.1%) |
| Arts, Entertainment & Recreation | 34 (87.2%) | 5 (12.8%) |
| Accommodation & Food Services | 38 (25.7%) | 110 (74.3%) |
| Public Administration | 106 (86.9%) | 16 (13.1%) |
| Total | 1,204 (46.9%) | 1,366 (53.1%) |
Education in Flourtown
School Enrollment in Flourtown
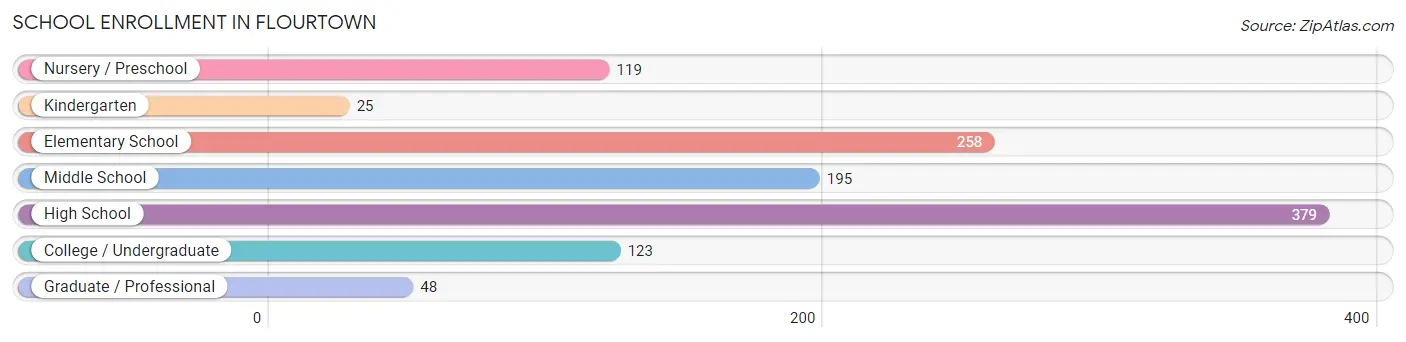
The most common levels of schooling among the 1,147 students in Flourtown are high school (379 | 33.0%), elementary school (258 | 22.5%), and middle school (195 | 17.0%).
| School Level | # Students | % Students |
| Nursery / Preschool | 119 | 10.4% |
| Kindergarten | 25 | 2.2% |
| Elementary School | 258 | 22.5% |
| Middle School | 195 | 17.0% |
| High School | 379 | 33.0% |
| College / Undergraduate | 123 | 10.7% |
| Graduate / Professional | 48 | 4.2% |
| Total | 1,147 | 100.0% |
School Enrollment by Age by Funding Source in Flourtown
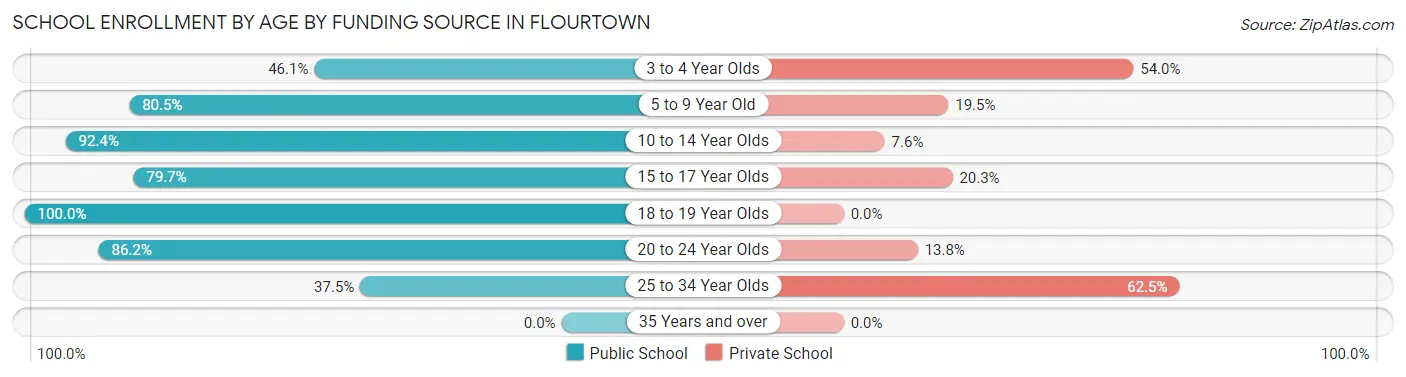
Out of a total of 1,147 students who are enrolled in schools in Flourtown, 219 (19.1%) attend a private institution, while the remaining 928 (80.9%) are enrolled in public schools. The age group of 25 to 34 year olds has the highest likelihood of being enrolled in private schools, with 30 (62.5% in the age bracket) enrolled. Conversely, the age group of 18 to 19 year olds has the lowest likelihood of being enrolled in a private school, with 91 (100.0% in the age bracket) attending a public institution.
| Age Bracket | Public School | Private School |
| 3 to 4 Year Olds | 35 (46.1%) | 41 (53.9%) |
| 5 to 9 Year Old | 223 (80.5%) | 54 (19.5%) |
| 10 to 14 Year Olds | 242 (92.4%) | 20 (7.6%) |
| 15 to 17 Year Olds | 244 (79.7%) | 62 (20.3%) |
| 18 to 19 Year Olds | 91 (100.0%) | 0 (0.0%) |
| 20 to 24 Year Olds | 75 (86.2%) | 12 (13.8%) |
| 25 to 34 Year Olds | 18 (37.5%) | 30 (62.5%) |
| 35 Years and over | 0 (0.0%) | 0 (0.0%) |
| Total | 928 (80.9%) | 219 (19.1%) |
Educational Attainment by Field of Study in Flourtown
Business (443 | 20.0%), education (266 | 12.0%), science & technology (238 | 10.7%), bio, nature & agricultural (165 | 7.4%), and liberal arts & history (160 | 7.2%) are the most common fields of study among 2,221 individuals in Flourtown who have obtained a bachelor's degree or higher.
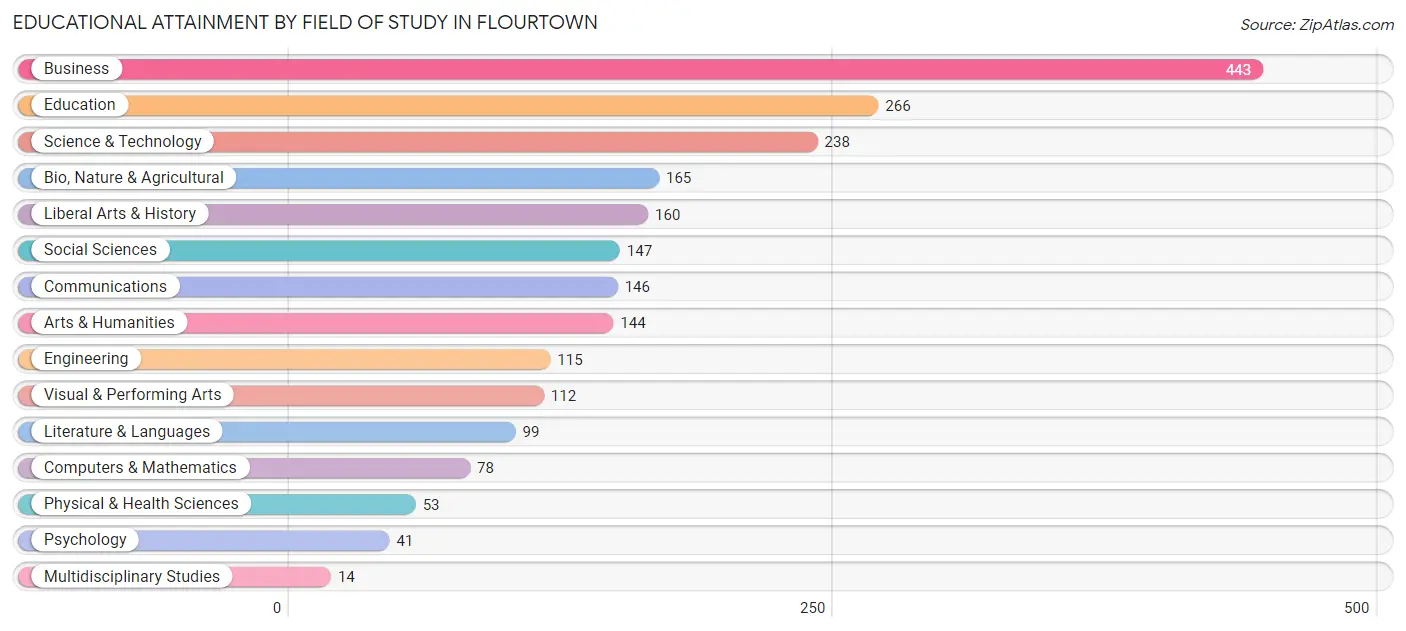
| Field of Study | # Graduates | % Graduates |
| Computers & Mathematics | 78 | 3.5% |
| Bio, Nature & Agricultural | 165 | 7.4% |
| Physical & Health Sciences | 53 | 2.4% |
| Psychology | 41 | 1.8% |
| Social Sciences | 147 | 6.6% |
| Engineering | 115 | 5.2% |
| Multidisciplinary Studies | 14 | 0.6% |
| Science & Technology | 238 | 10.7% |
| Business | 443 | 20.0% |
| Education | 266 | 12.0% |
| Literature & Languages | 99 | 4.5% |
| Liberal Arts & History | 160 | 7.2% |
| Visual & Performing Arts | 112 | 5.0% |
| Communications | 146 | 6.6% |
| Arts & Humanities | 144 | 6.5% |
| Total | 2,221 | 100.0% |
Transportation & Commute in Flourtown
Vehicle Availability by Sex in Flourtown
The most prevalent vehicle ownership categories in Flourtown are males with 2 vehicles (602, accounting for 51.4%) and females with 2 vehicles (790, making up 48.8%).
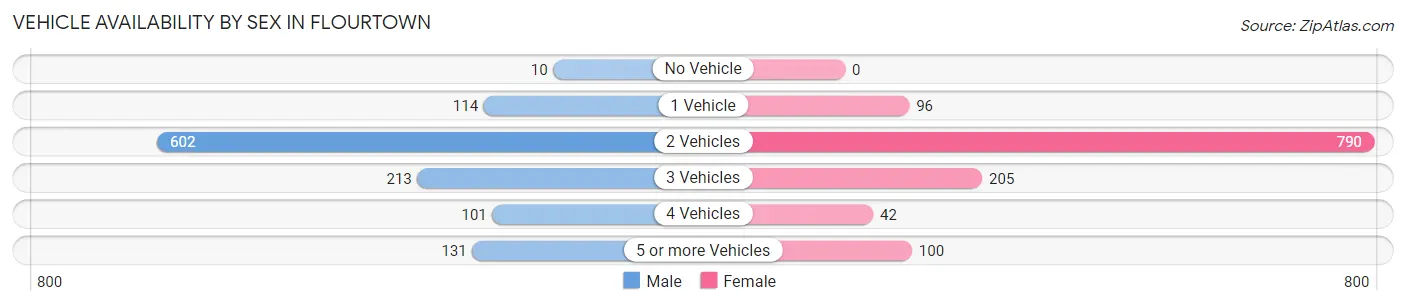
| Vehicles Available | Male | Female |
| No Vehicle | 10 (0.9%) | 0 (0.0%) |
| 1 Vehicle | 114 (9.7%) | 96 (7.8%) |
| 2 Vehicles | 602 (51.4%) | 790 (64.1%) |
| 3 Vehicles | 213 (18.2%) | 205 (16.6%) |
| 4 Vehicles | 101 (8.6%) | 42 (3.4%) |
| 5 or more Vehicles | 131 (11.2%) | 100 (8.1%) |
| Total | 1,171 (100.0%) | 1,233 (100.0%) |
Commute Time in Flourtown
The most frequently occuring commute durations in Flourtown are 15 to 19 minutes (245 commuters, 14.0%), 20 to 24 minutes (237 commuters, 13.5%), and 45 to 59 minutes (228 commuters, 13.0%).
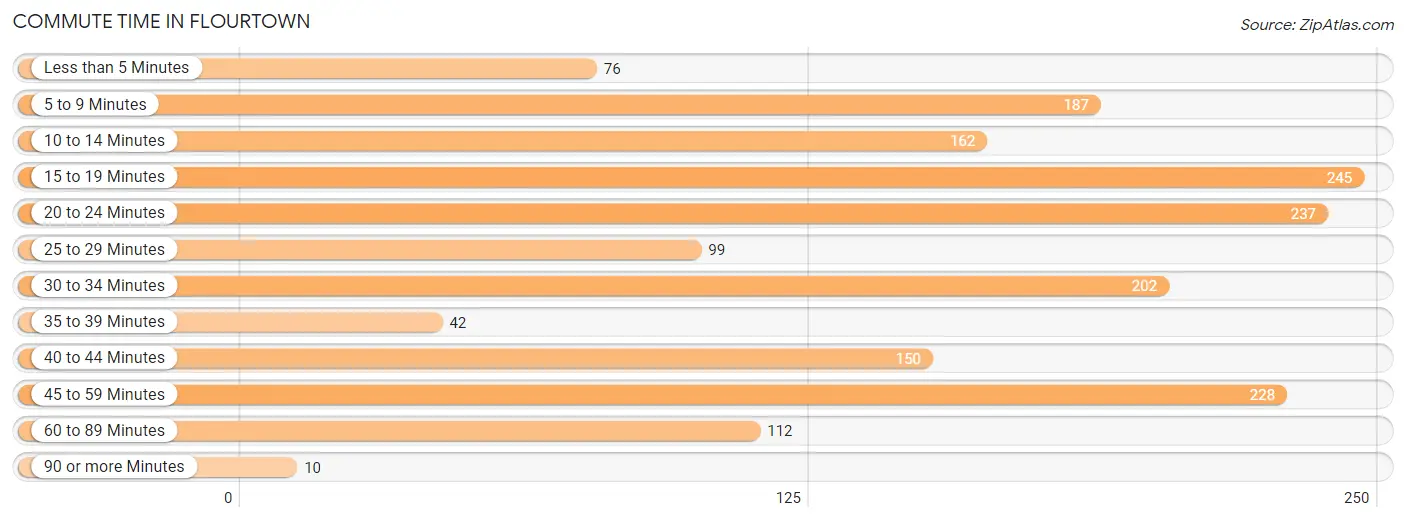
| Commute Time | # Commuters | % Commuters |
| Less than 5 Minutes | 76 | 4.3% |
| 5 to 9 Minutes | 187 | 10.7% |
| 10 to 14 Minutes | 162 | 9.3% |
| 15 to 19 Minutes | 245 | 14.0% |
| 20 to 24 Minutes | 237 | 13.5% |
| 25 to 29 Minutes | 99 | 5.7% |
| 30 to 34 Minutes | 202 | 11.5% |
| 35 to 39 Minutes | 42 | 2.4% |
| 40 to 44 Minutes | 150 | 8.6% |
| 45 to 59 Minutes | 228 | 13.0% |
| 60 to 89 Minutes | 112 | 6.4% |
| 90 or more Minutes | 10 | 0.6% |
Commute Time by Sex in Flourtown
The most common commute times in Flourtown are 30 to 34 minutes (137 commuters, 16.0%) for males and 20 to 24 minutes (203 commuters, 22.7%) for females.
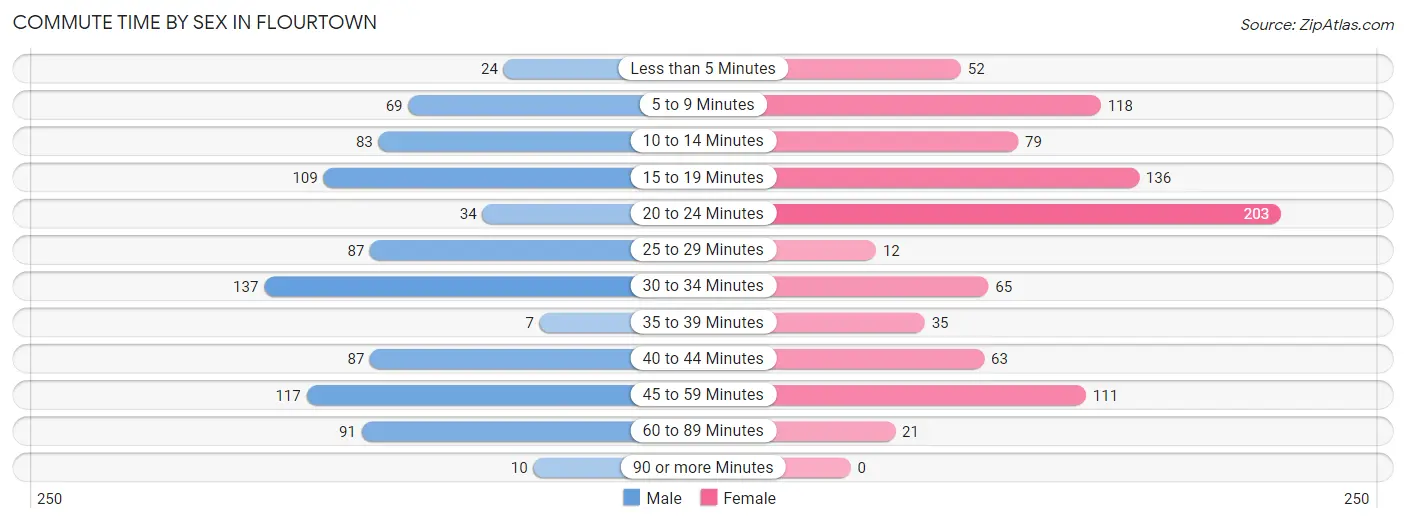
| Commute Time | Male | Female |
| Less than 5 Minutes | 24 (2.8%) | 52 (5.8%) |
| 5 to 9 Minutes | 69 (8.1%) | 118 (13.2%) |
| 10 to 14 Minutes | 83 (9.7%) | 79 (8.8%) |
| 15 to 19 Minutes | 109 (12.8%) | 136 (15.2%) |
| 20 to 24 Minutes | 34 (4.0%) | 203 (22.7%) |
| 25 to 29 Minutes | 87 (10.2%) | 12 (1.3%) |
| 30 to 34 Minutes | 137 (16.0%) | 65 (7.3%) |
| 35 to 39 Minutes | 7 (0.8%) | 35 (3.9%) |
| 40 to 44 Minutes | 87 (10.2%) | 63 (7.0%) |
| 45 to 59 Minutes | 117 (13.7%) | 111 (12.4%) |
| 60 to 89 Minutes | 91 (10.6%) | 21 (2.4%) |
| 90 or more Minutes | 10 (1.2%) | 0 (0.0%) |
Time of Departure to Work by Sex in Flourtown
The most frequent times of departure to work in Flourtown are 7:00 AM to 7:29 AM (215, 25.2%) for males and 7:00 AM to 7:29 AM (171, 19.1%) for females.
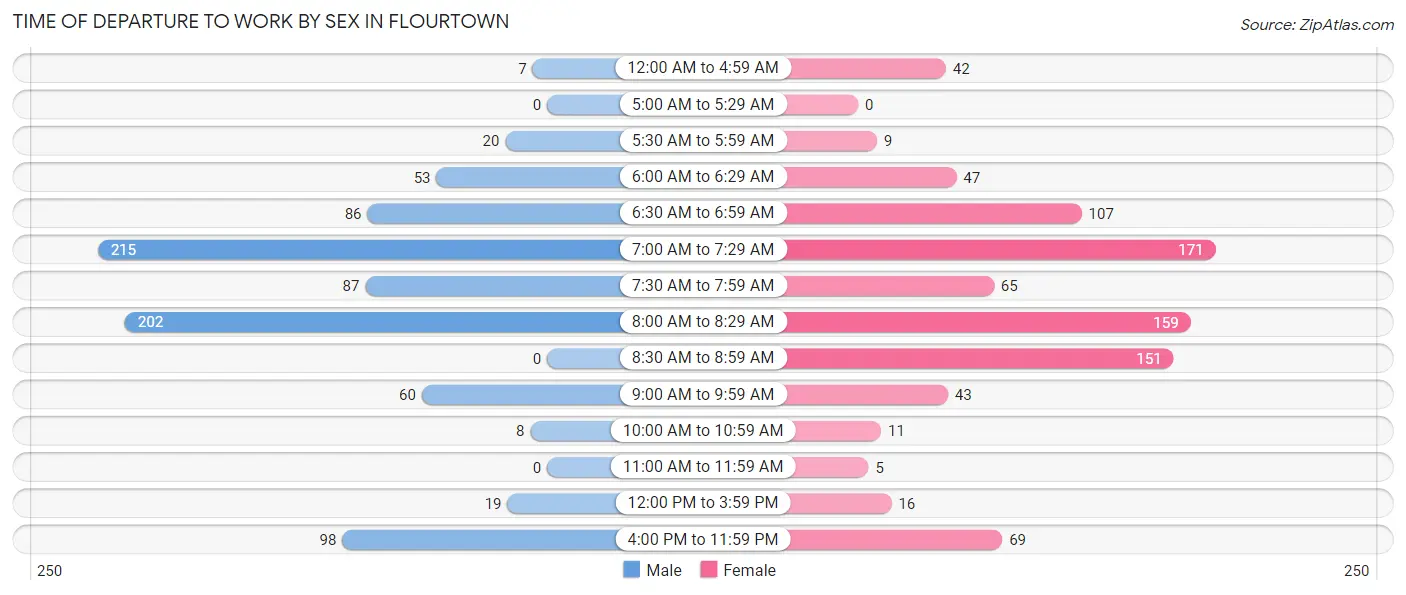
| Time of Departure | Male | Female |
| 12:00 AM to 4:59 AM | 7 (0.8%) | 42 (4.7%) |
| 5:00 AM to 5:29 AM | 0 (0.0%) | 0 (0.0%) |
| 5:30 AM to 5:59 AM | 20 (2.3%) | 9 (1.0%) |
| 6:00 AM to 6:29 AM | 53 (6.2%) | 47 (5.2%) |
| 6:30 AM to 6:59 AM | 86 (10.1%) | 107 (12.0%) |
| 7:00 AM to 7:29 AM | 215 (25.2%) | 171 (19.1%) |
| 7:30 AM to 7:59 AM | 87 (10.2%) | 65 (7.3%) |
| 8:00 AM to 8:29 AM | 202 (23.6%) | 159 (17.8%) |
| 8:30 AM to 8:59 AM | 0 (0.0%) | 151 (16.9%) |
| 9:00 AM to 9:59 AM | 60 (7.0%) | 43 (4.8%) |
| 10:00 AM to 10:59 AM | 8 (0.9%) | 11 (1.2%) |
| 11:00 AM to 11:59 AM | 0 (0.0%) | 5 (0.6%) |
| 12:00 PM to 3:59 PM | 19 (2.2%) | 16 (1.8%) |
| 4:00 PM to 11:59 PM | 98 (11.5%) | 69 (7.7%) |
| Total | 855 (100.0%) | 895 (100.0%) |
Housing Occupancy in Flourtown
Occupancy by Ownership in Flourtown
Of the total 1,792 dwellings in Flourtown, owner-occupied units account for 1,569 (87.6%), while renter-occupied units make up 223 (12.4%).
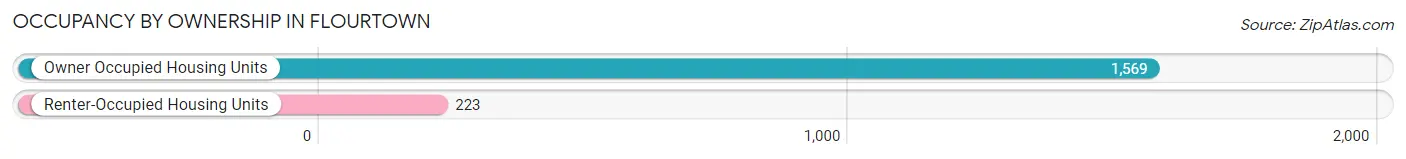
| Occupancy | # Housing Units | % Housing Units |
| Owner Occupied Housing Units | 1,569 | 87.6% |
| Renter-Occupied Housing Units | 223 | 12.4% |
| Total Occupied Housing Units | 1,792 | 100.0% |
Occupancy by Household Size in Flourtown
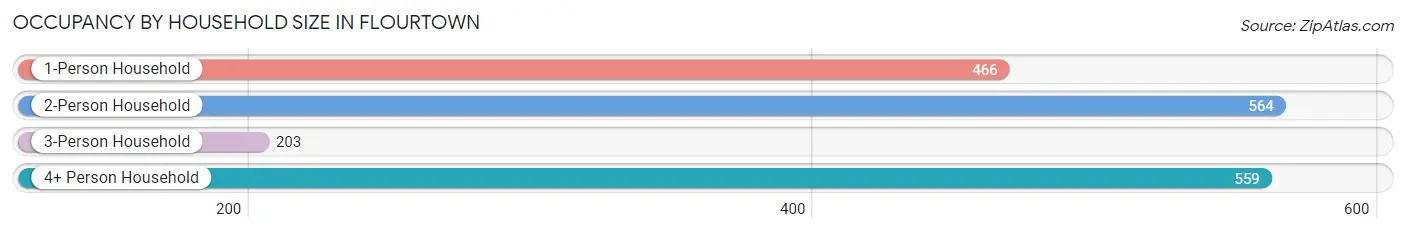
| Household Size | # Housing Units | % Housing Units |
| 1-Person Household | 466 | 26.0% |
| 2-Person Household | 564 | 31.5% |
| 3-Person Household | 203 | 11.3% |
| 4+ Person Household | 559 | 31.2% |
| Total Housing Units | 1,792 | 100.0% |
Occupancy by Ownership by Household Size in Flourtown
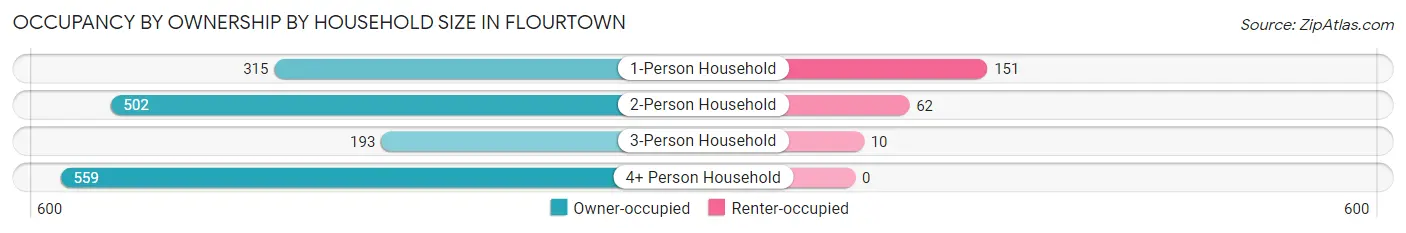
| Household Size | Owner-occupied | Renter-occupied |
| 1-Person Household | 315 (67.6%) | 151 (32.4%) |
| 2-Person Household | 502 (89.0%) | 62 (11.0%) |
| 3-Person Household | 193 (95.1%) | 10 (4.9%) |
| 4+ Person Household | 559 (100.0%) | 0 (0.0%) |
| Total Housing Units | 1,569 (87.6%) | 223 (12.4%) |
Occupancy by Educational Attainment in Flourtown
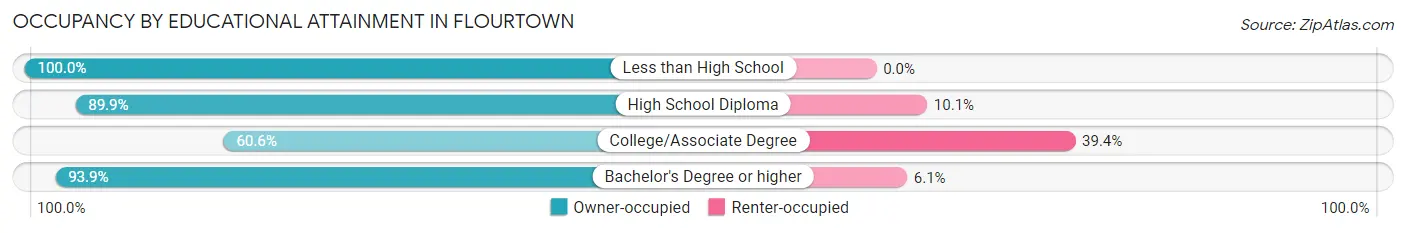
| Household Size | Owner-occupied | Renter-occupied |
| Less than High School | 8 (100.0%) | 0 (0.0%) |
| High School Diploma | 161 (89.9%) | 18 (10.1%) |
| College/Associate Degree | 195 (60.6%) | 127 (39.4%) |
| Bachelor's Degree or higher | 1,205 (93.9%) | 78 (6.1%) |
Occupancy by Age of Householder in Flourtown
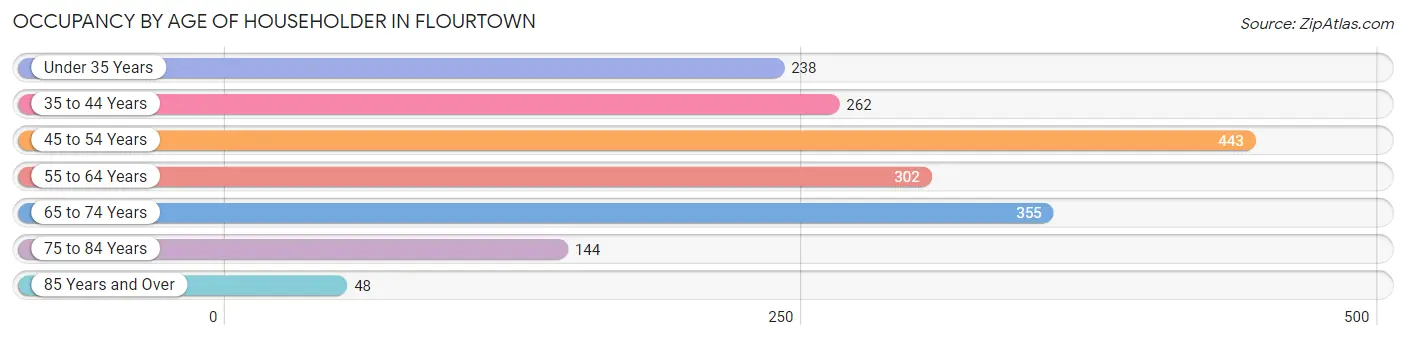
| Age Bracket | # Households | % Households |
| Under 35 Years | 238 | 13.3% |
| 35 to 44 Years | 262 | 14.6% |
| 45 to 54 Years | 443 | 24.7% |
| 55 to 64 Years | 302 | 16.9% |
| 65 to 74 Years | 355 | 19.8% |
| 75 to 84 Years | 144 | 8.0% |
| 85 Years and Over | 48 | 2.7% |
| Total | 1,792 | 100.0% |
Housing Finances in Flourtown
Median Income by Occupancy in Flourtown
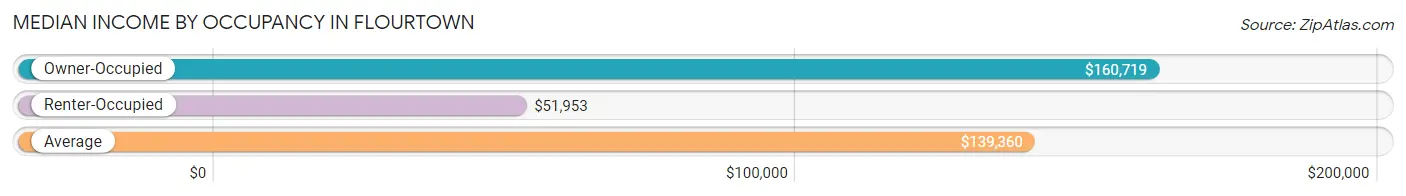
| Occupancy Type | # Households | Median Income |
| Owner-Occupied | 1,569 (87.6%) | $160,719 |
| Renter-Occupied | 223 (12.4%) | $51,953 |
| Average | 1,792 (100.0%) | $139,360 |
Occupancy by Householder Income Bracket in Flourtown
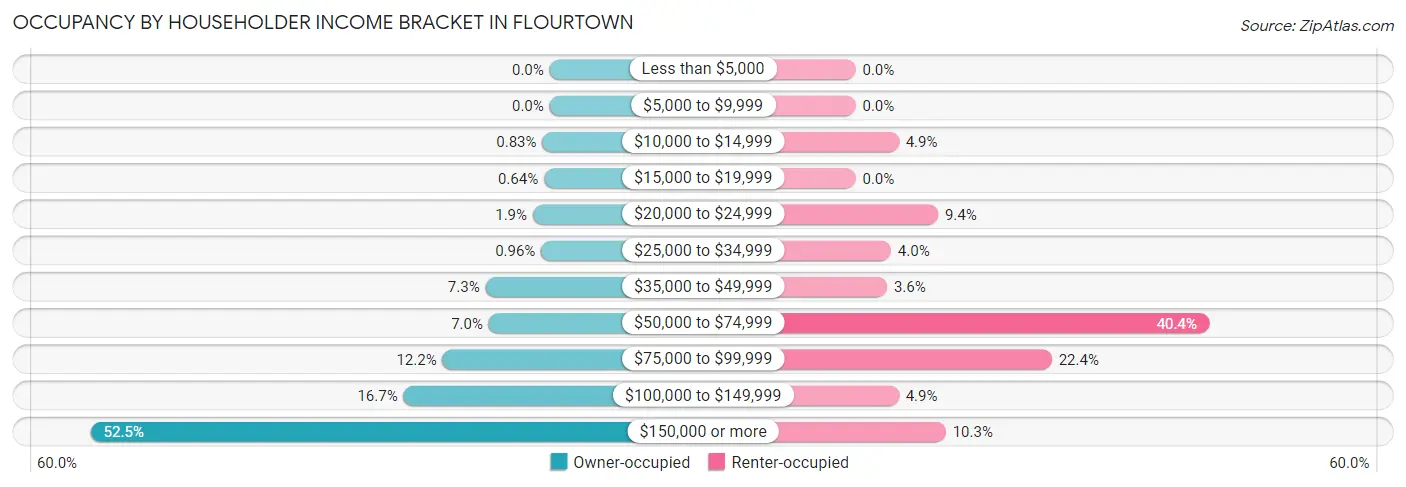
| Income Bracket | Owner-occupied | Renter-occupied |
| Less than $5,000 | 0 (0.0%) | 0 (0.0%) |
| $5,000 to $9,999 | 0 (0.0%) | 0 (0.0%) |
| $10,000 to $14,999 | 13 (0.8%) | 11 (4.9%) |
| $15,000 to $19,999 | 10 (0.6%) | 0 (0.0%) |
| $20,000 to $24,999 | 30 (1.9%) | 21 (9.4%) |
| $25,000 to $34,999 | 15 (1.0%) | 9 (4.0%) |
| $35,000 to $49,999 | 115 (7.3%) | 8 (3.6%) |
| $50,000 to $74,999 | 109 (7.0%) | 90 (40.4%) |
| $75,000 to $99,999 | 192 (12.2%) | 50 (22.4%) |
| $100,000 to $149,999 | 262 (16.7%) | 11 (4.9%) |
| $150,000 or more | 823 (52.4%) | 23 (10.3%) |
| Total | 1,569 (100.0%) | 223 (100.0%) |
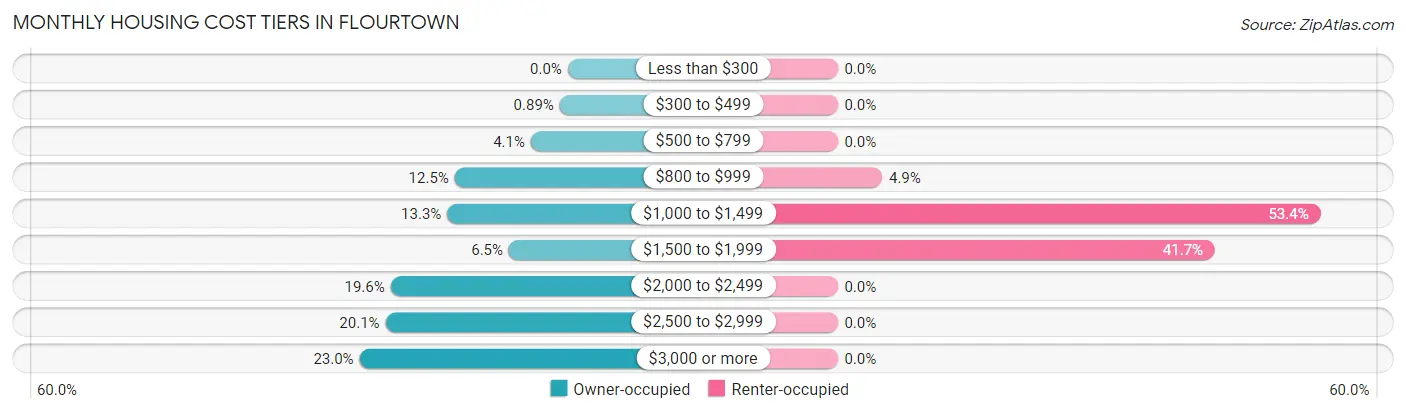
Monthly Housing Cost Tiers in Flourtown
| Monthly Cost | Owner-occupied | Renter-occupied |
| Less than $300 | 0 (0.0%) | 0 (0.0%) |
| $300 to $499 | 14 (0.9%) | 0 (0.0%) |
| $500 to $799 | 64 (4.1%) | 0 (0.0%) |
| $800 to $999 | 196 (12.5%) | 11 (4.9%) |
| $1,000 to $1,499 | 209 (13.3%) | 119 (53.4%) |
| $1,500 to $1,999 | 102 (6.5%) | 93 (41.7%) |
| $2,000 to $2,499 | 307 (19.6%) | 0 (0.0%) |
| $2,500 to $2,999 | 316 (20.1%) | 0 (0.0%) |
| $3,000 or more | 361 (23.0%) | 0 (0.0%) |
| Total | 1,569 (100.0%) | 223 (100.0%) |
Physical Housing Characteristics in Flourtown
Housing Structures in Flourtown
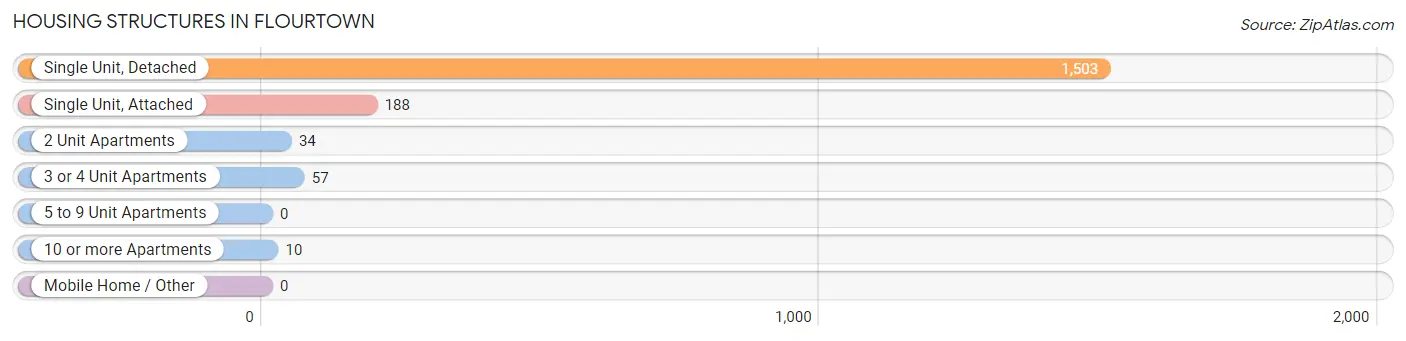
| Structure Type | # Housing Units | % Housing Units |
| Single Unit, Detached | 1,503 | 83.9% |
| Single Unit, Attached | 188 | 10.5% |
| 2 Unit Apartments | 34 | 1.9% |
| 3 or 4 Unit Apartments | 57 | 3.2% |
| 5 to 9 Unit Apartments | 0 | 0.0% |
| 10 or more Apartments | 10 | 0.6% |
| Mobile Home / Other | 0 | 0.0% |
| Total | 1,792 | 100.0% |
Housing Structures by Occupancy in Flourtown
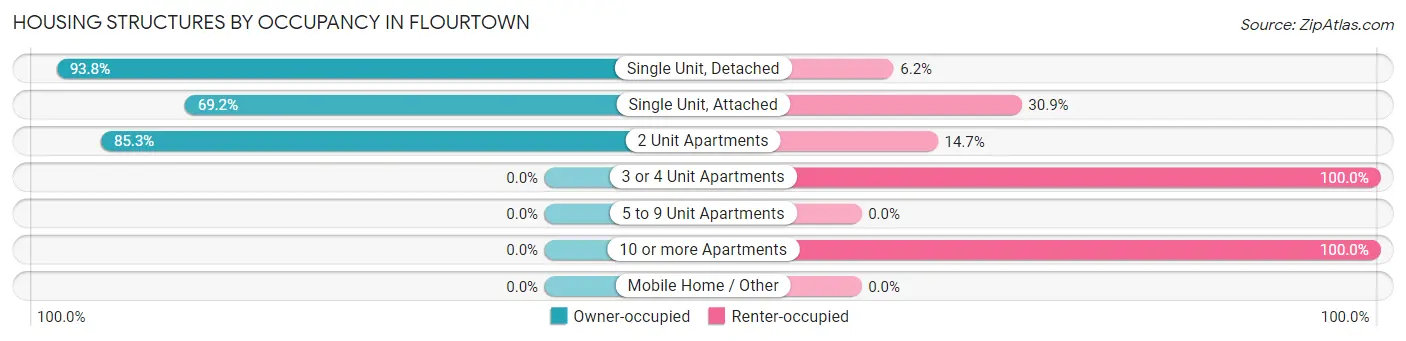
| Structure Type | Owner-occupied | Renter-occupied |
| Single Unit, Detached | 1,410 (93.8%) | 93 (6.2%) |
| Single Unit, Attached | 130 (69.2%) | 58 (30.8%) |
| 2 Unit Apartments | 29 (85.3%) | 5 (14.7%) |
| 3 or 4 Unit Apartments | 0 (0.0%) | 57 (100.0%) |
| 5 to 9 Unit Apartments | 0 (0.0%) | 0 (0.0%) |
| 10 or more Apartments | 0 (0.0%) | 10 (100.0%) |
| Mobile Home / Other | 0 (0.0%) | 0 (0.0%) |
| Total | 1,569 (87.6%) | 223 (12.4%) |
Housing Structures by Number of Rooms in Flourtown
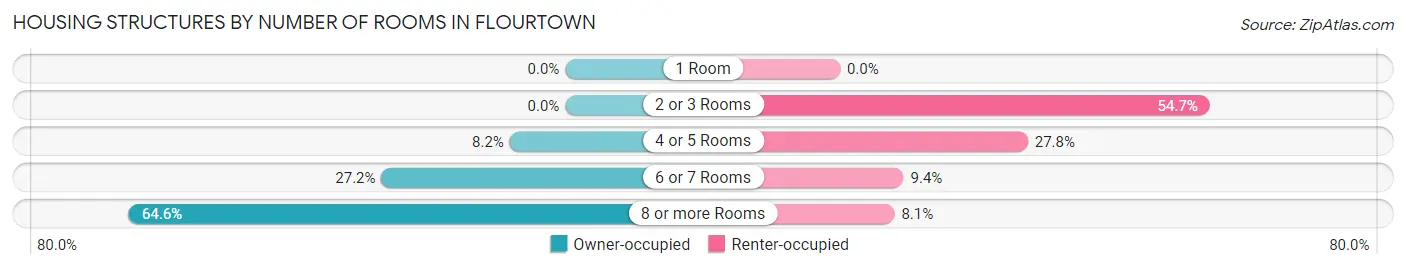
| Number of Rooms | Owner-occupied | Renter-occupied |
| 1 Room | 0 (0.0%) | 0 (0.0%) |
| 2 or 3 Rooms | 0 (0.0%) | 122 (54.7%) |
| 4 or 5 Rooms | 129 (8.2%) | 62 (27.8%) |
| 6 or 7 Rooms | 427 (27.2%) | 21 (9.4%) |
| 8 or more Rooms | 1,013 (64.6%) | 18 (8.1%) |
| Total | 1,569 (100.0%) | 223 (100.0%) |
Housing Structure by Heating Type in Flourtown
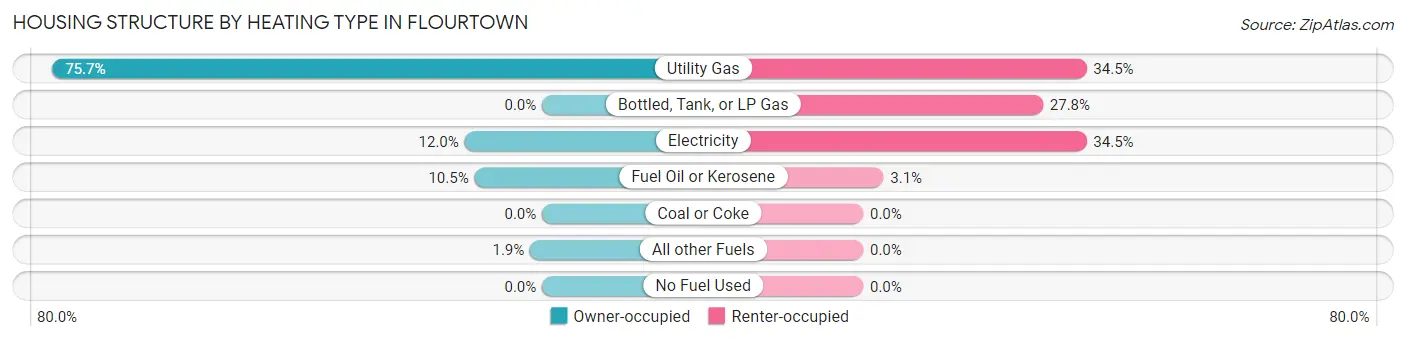
| Heating Type | Owner-occupied | Renter-occupied |
| Utility Gas | 1,188 (75.7%) | 77 (34.5%) |
| Bottled, Tank, or LP Gas | 0 (0.0%) | 62 (27.8%) |
| Electricity | 188 (12.0%) | 77 (34.5%) |
| Fuel Oil or Kerosene | 164 (10.4%) | 7 (3.1%) |
| Coal or Coke | 0 (0.0%) | 0 (0.0%) |
| All other Fuels | 29 (1.8%) | 0 (0.0%) |
| No Fuel Used | 0 (0.0%) | 0 (0.0%) |
| Total | 1,569 (100.0%) | 223 (100.0%) |
Household Vehicle Usage in Flourtown
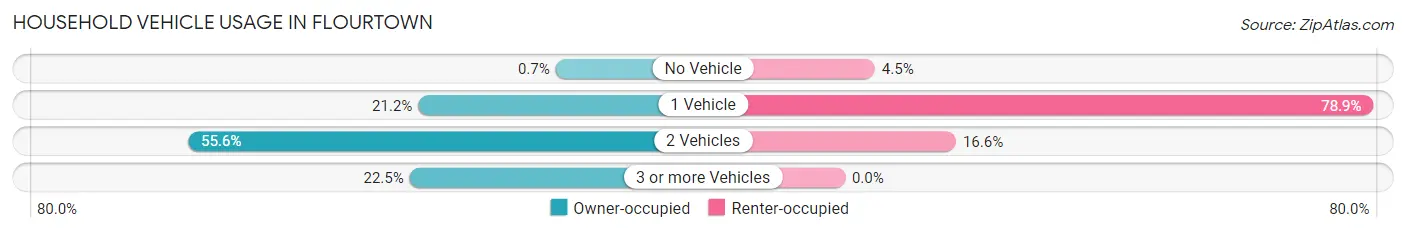
| Vehicles per Household | Owner-occupied | Renter-occupied |
| No Vehicle | 11 (0.7%) | 10 (4.5%) |
| 1 Vehicle | 333 (21.2%) | 176 (78.9%) |
| 2 Vehicles | 872 (55.6%) | 37 (16.6%) |
| 3 or more Vehicles | 353 (22.5%) | 0 (0.0%) |
| Total | 1,569 (100.0%) | 223 (100.0%) |
Real Estate & Mortgages in Flourtown
Real Estate and Mortgage Overview in Flourtown
| Characteristic | Without Mortgage | With Mortgage |
| Housing Units | 433 | 1,136 |
| Median Property Value | $417,100 | $457,800 |
| Median Household Income | $86,066 | $685 |
| Monthly Housing Costs | $968 | $361 |
| Real Estate Taxes | $6,410 | $0 |
Property Value by Mortgage Status in Flourtown
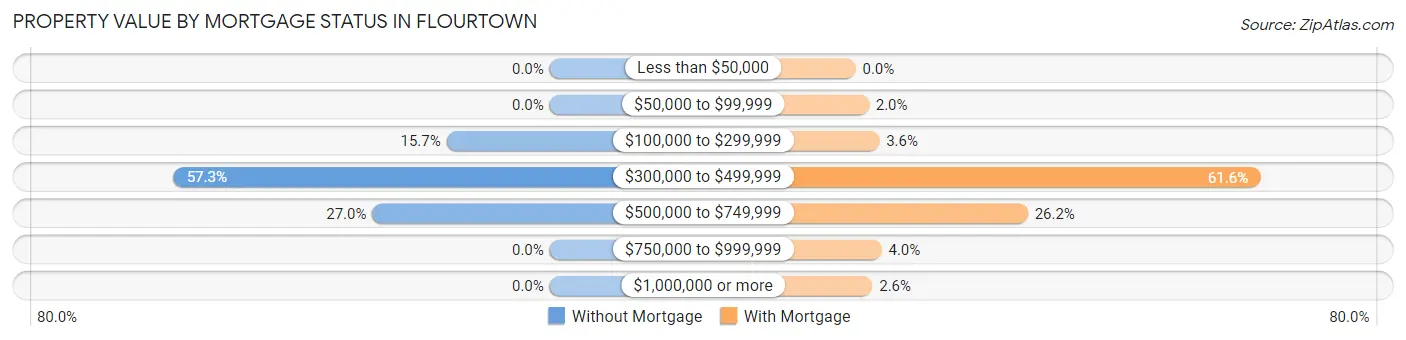
| Property Value | Without Mortgage | With Mortgage |
| Less than $50,000 | 0 (0.0%) | 0 (0.0%) |
| $50,000 to $99,999 | 0 (0.0%) | 23 (2.0%) |
| $100,000 to $299,999 | 68 (15.7%) | 41 (3.6%) |
| $300,000 to $499,999 | 248 (57.3%) | 700 (61.6%) |
| $500,000 to $749,999 | 117 (27.0%) | 298 (26.2%) |
| $750,000 to $999,999 | 0 (0.0%) | 45 (4.0%) |
| $1,000,000 or more | 0 (0.0%) | 29 (2.5%) |
| Total | 433 (100.0%) | 1,136 (100.0%) |
Household Income by Mortgage Status in Flourtown
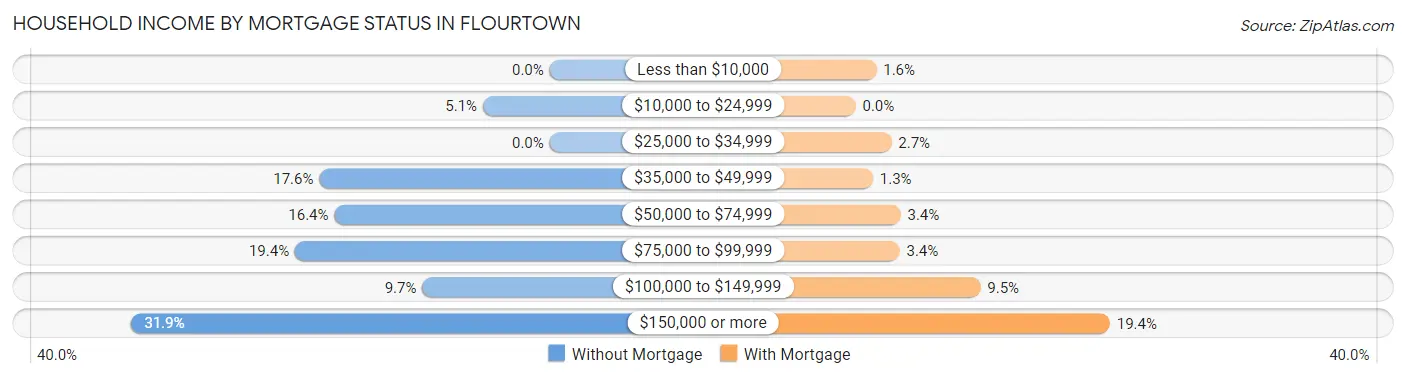
| Household Income | Without Mortgage | With Mortgage |
| Less than $10,000 | 0 (0.0%) | 18 (1.6%) |
| $10,000 to $24,999 | 22 (5.1%) | 0 (0.0%) |
| $25,000 to $34,999 | 0 (0.0%) | 31 (2.7%) |
| $35,000 to $49,999 | 76 (17.5%) | 15 (1.3%) |
| $50,000 to $74,999 | 71 (16.4%) | 39 (3.4%) |
| $75,000 to $99,999 | 84 (19.4%) | 38 (3.4%) |
| $100,000 to $149,999 | 42 (9.7%) | 108 (9.5%) |
| $150,000 or more | 138 (31.9%) | 220 (19.4%) |
| Total | 433 (100.0%) | 1,136 (100.0%) |
Property Value to Household Income Ratio in Flourtown
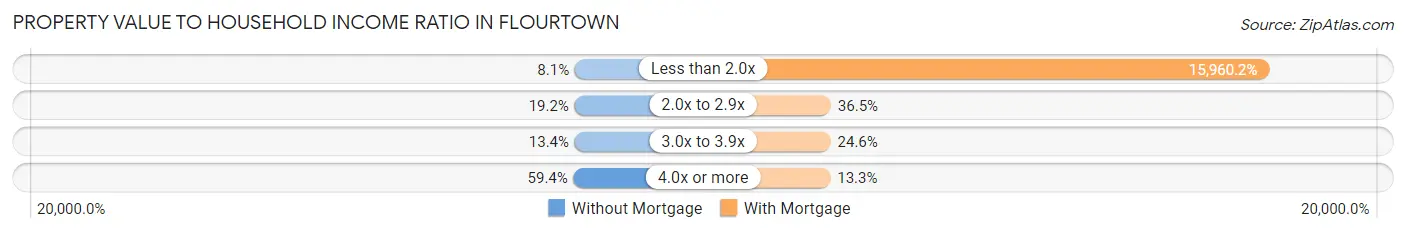
| Value-to-Income Ratio | Without Mortgage | With Mortgage |
| Less than 2.0x | 35 (8.1%) | 181,308 (15,960.2%) |
| 2.0x to 2.9x | 83 (19.2%) | 415 (36.5%) |
| 3.0x to 3.9x | 58 (13.4%) | 279 (24.6%) |
| 4.0x or more | 257 (59.4%) | 151 (13.3%) |
| Total | 433 (100.0%) | 1,136 (100.0%) |
Real Estate Taxes by Mortgage Status in Flourtown
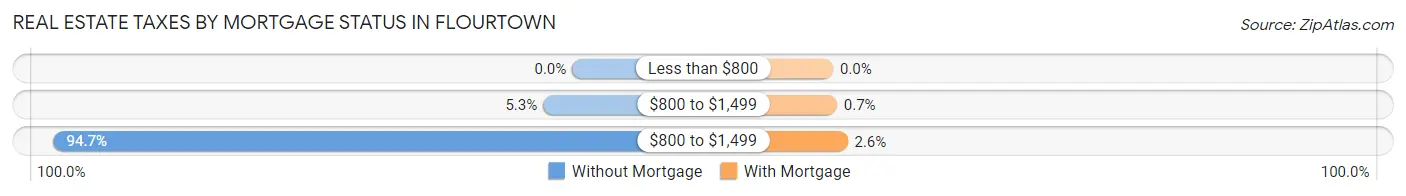
| Property Taxes | Without Mortgage | With Mortgage |
| Less than $800 | 0 (0.0%) | 0 (0.0%) |
| $800 to $1,499 | 23 (5.3%) | 8 (0.7%) |
| $800 to $1,499 | 410 (94.7%) | 30 (2.6%) |
| Total | 433 (100.0%) | 1,136 (100.0%) |
Health & Disability in Flourtown
Health Insurance Coverage by Age in Flourtown
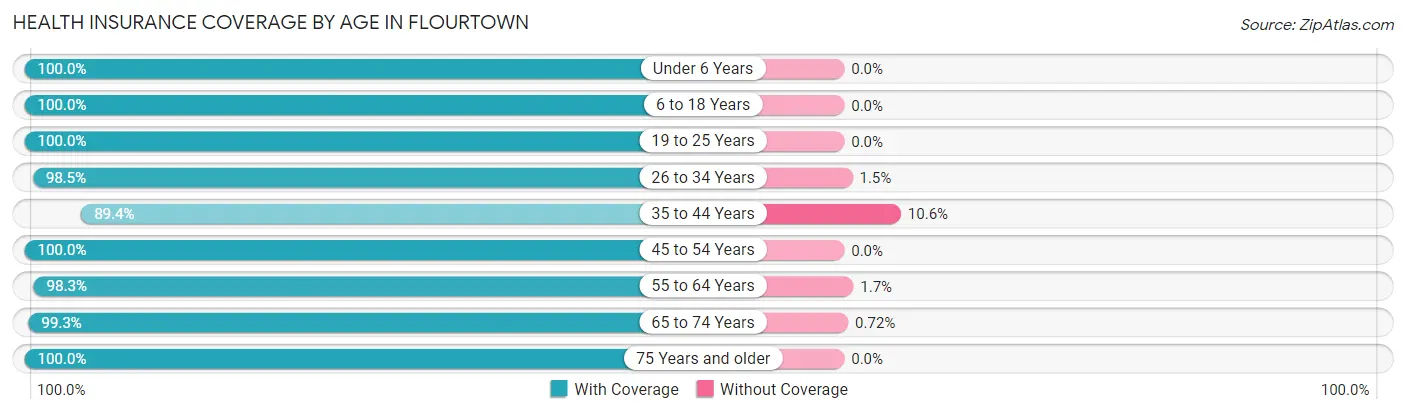
| Age Bracket | With Coverage | Without Coverage |
| Under 6 Years | 311 (100.0%) | 0 (0.0%) |
| 6 to 18 Years | 886 (100.0%) | 0 (0.0%) |
| 19 to 25 Years | 207 (100.0%) | 0 (0.0%) |
| 26 to 34 Years | 450 (98.5%) | 7 (1.5%) |
| 35 to 44 Years | 525 (89.4%) | 62 (10.6%) |
| 45 to 54 Years | 723 (100.0%) | 0 (0.0%) |
| 55 to 64 Years | 523 (98.3%) | 9 (1.7%) |
| 65 to 74 Years | 553 (99.3%) | 4 (0.7%) |
| 75 Years and older | 266 (100.0%) | 0 (0.0%) |
| Total | 4,444 (98.2%) | 82 (1.8%) |
Health Insurance Coverage by Citizenship Status in Flourtown
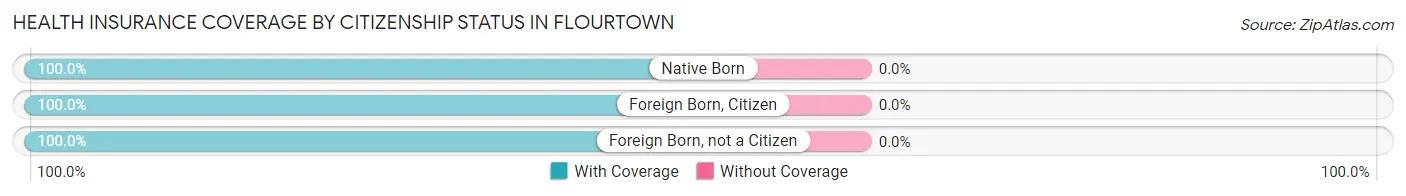
| Citizenship Status | With Coverage | Without Coverage |
| Native Born | 311 (100.0%) | 0 (0.0%) |
| Foreign Born, Citizen | 886 (100.0%) | 0 (0.0%) |
| Foreign Born, not a Citizen | 207 (100.0%) | 0 (0.0%) |
Health Insurance Coverage by Household Income in Flourtown
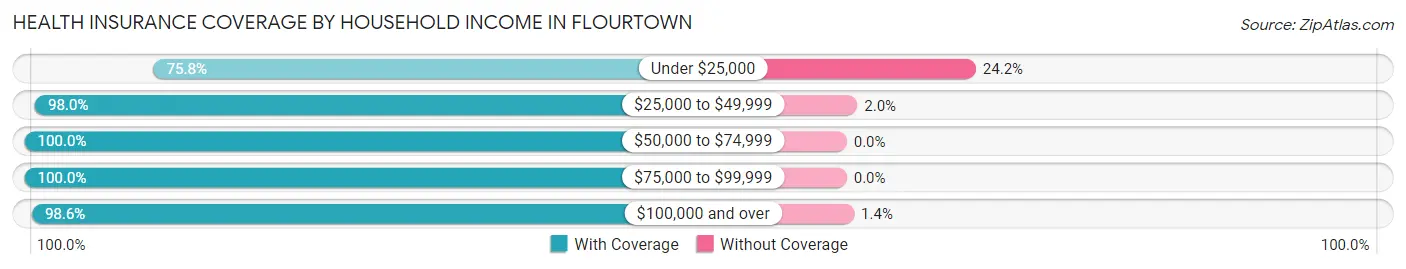
| Household Income | With Coverage | Without Coverage |
| Under $25,000 | 94 (75.8%) | 30 (24.2%) |
| $25,000 to $49,999 | 199 (98.0%) | 4 (2.0%) |
| $50,000 to $74,999 | 243 (100.0%) | 0 (0.0%) |
| $75,000 to $99,999 | 467 (100.0%) | 0 (0.0%) |
| $100,000 and over | 3,432 (98.6%) | 48 (1.4%) |
Public vs Private Health Insurance Coverage by Age in Flourtown
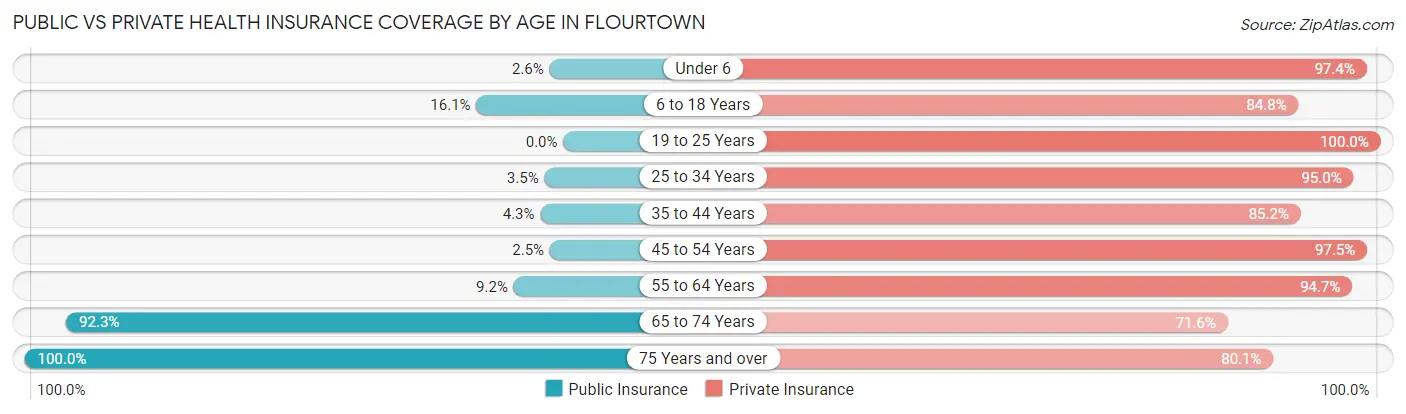
| Age Bracket | Public Insurance | Private Insurance |
| Under 6 | 8 (2.6%) | 303 (97.4%) |
| 6 to 18 Years | 143 (16.1%) | 751 (84.8%) |
| 19 to 25 Years | 0 (0.0%) | 207 (100.0%) |
| 25 to 34 Years | 16 (3.5%) | 434 (95.0%) |
| 35 to 44 Years | 25 (4.3%) | 500 (85.2%) |
| 45 to 54 Years | 18 (2.5%) | 705 (97.5%) |
| 55 to 64 Years | 49 (9.2%) | 504 (94.7%) |
| 65 to 74 Years | 514 (92.3%) | 399 (71.6%) |
| 75 Years and over | 266 (100.0%) | 213 (80.1%) |
| Total | 1,039 (23.0%) | 4,016 (88.7%) |
Disability Status by Sex by Age in Flourtown
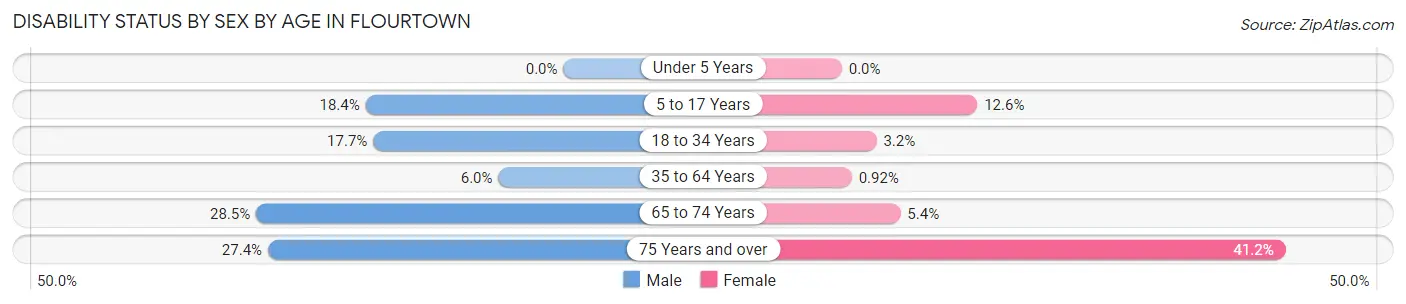
| Age Bracket | Male | Female |
| Under 5 Years | 0 (0.0%) | 0 (0.0%) |
| 5 to 17 Years | 85 (18.4%) | 48 (12.6%) |
| 18 to 34 Years | 63 (17.6%) | 13 (3.2%) |
| 35 to 64 Years | 52 (6.0%) | 9 (0.9%) |
| 65 to 74 Years | 75 (28.5%) | 16 (5.4%) |
| 75 Years and over | 17 (27.4%) | 84 (41.2%) |
Disability Class by Sex by Age in Flourtown
Disability Class: Hearing Difficulty
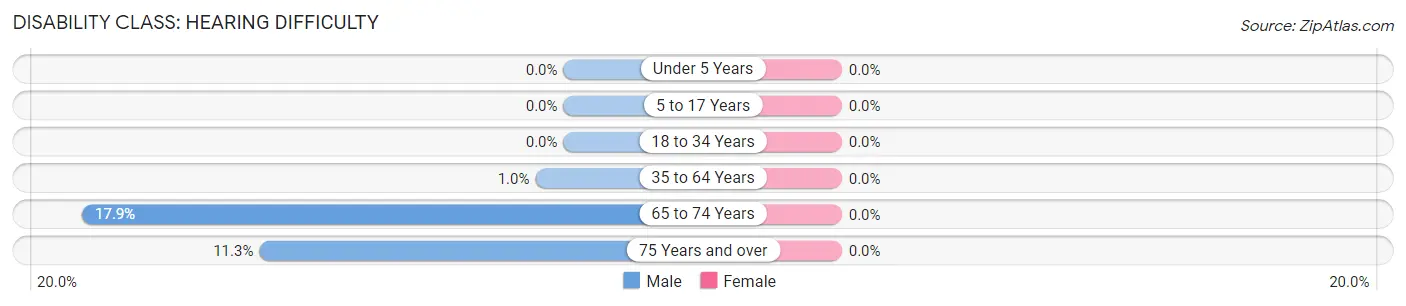
| Age Bracket | Male | Female |
| Under 5 Years | 0 (0.0%) | 0 (0.0%) |
| 5 to 17 Years | 0 (0.0%) | 0 (0.0%) |
| 18 to 34 Years | 0 (0.0%) | 0 (0.0%) |
| 35 to 64 Years | 9 (1.0%) | 0 (0.0%) |
| 65 to 74 Years | 47 (17.9%) | 0 (0.0%) |
| 75 Years and over | 7 (11.3%) | 0 (0.0%) |
Disability Class: Vision Difficulty
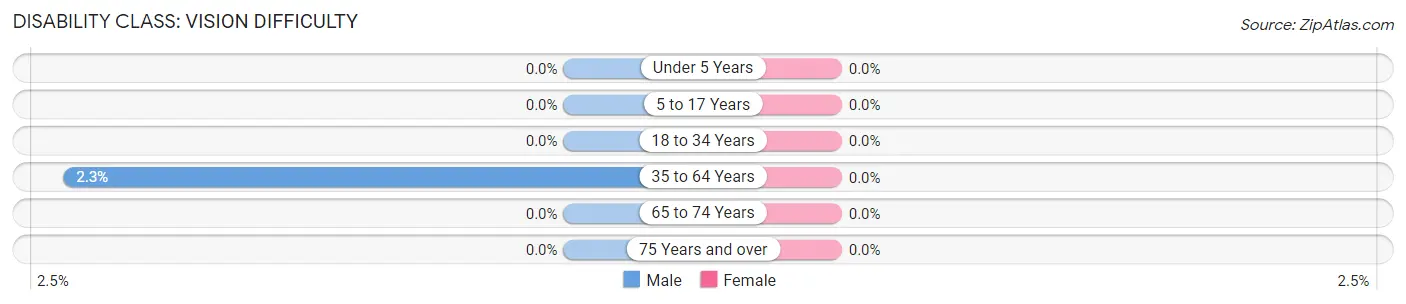
| Age Bracket | Male | Female |
| Under 5 Years | 0 (0.0%) | 0 (0.0%) |
| 5 to 17 Years | 0 (0.0%) | 0 (0.0%) |
| 18 to 34 Years | 0 (0.0%) | 0 (0.0%) |
| 35 to 64 Years | 20 (2.3%) | 0 (0.0%) |
| 65 to 74 Years | 0 (0.0%) | 0 (0.0%) |
| 75 Years and over | 0 (0.0%) | 0 (0.0%) |
Disability Class: Cognitive Difficulty
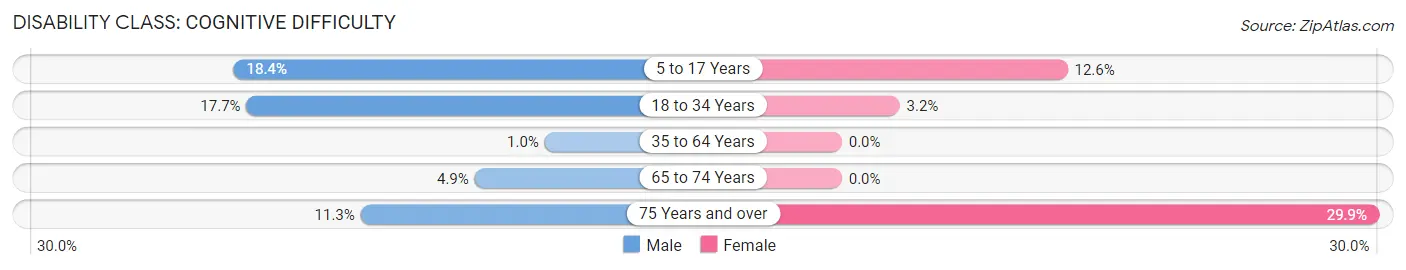
| Age Bracket | Male | Female |
| 5 to 17 Years | 85 (18.4%) | 48 (12.6%) |
| 18 to 34 Years | 63 (17.6%) | 13 (3.2%) |
| 35 to 64 Years | 9 (1.0%) | 0 (0.0%) |
| 65 to 74 Years | 13 (4.9%) | 0 (0.0%) |
| 75 Years and over | 7 (11.3%) | 61 (29.9%) |
Disability Class: Ambulatory Difficulty
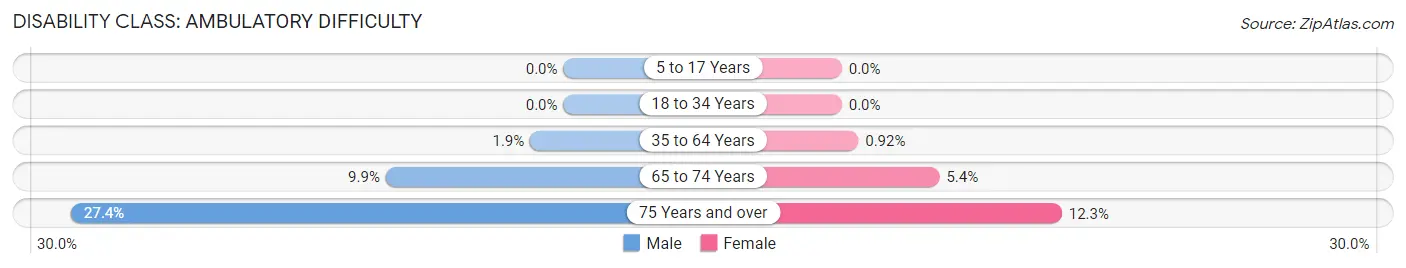
| Age Bracket | Male | Female |
| 5 to 17 Years | 0 (0.0%) | 0 (0.0%) |
| 18 to 34 Years | 0 (0.0%) | 0 (0.0%) |
| 35 to 64 Years | 16 (1.8%) | 9 (0.9%) |
| 65 to 74 Years | 26 (9.9%) | 16 (5.4%) |
| 75 Years and over | 17 (27.4%) | 25 (12.2%) |
Disability Class: Self-Care Difficulty
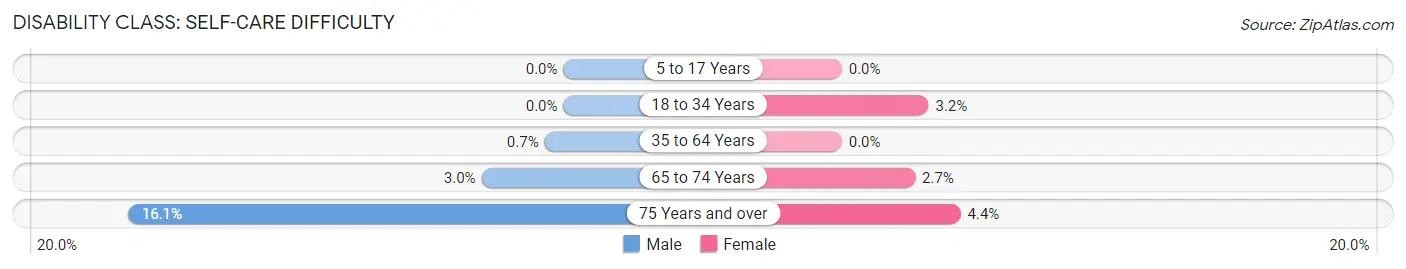
| Age Bracket | Male | Female |
| 5 to 17 Years | 0 (0.0%) | 0 (0.0%) |
| 18 to 34 Years | 0 (0.0%) | 13 (3.2%) |
| 35 to 64 Years | 6 (0.7%) | 0 (0.0%) |
| 65 to 74 Years | 8 (3.0%) | 8 (2.7%) |
| 75 Years and over | 10 (16.1%) | 9 (4.4%) |
Technology Access in Flourtown
Computing Device Access in Flourtown
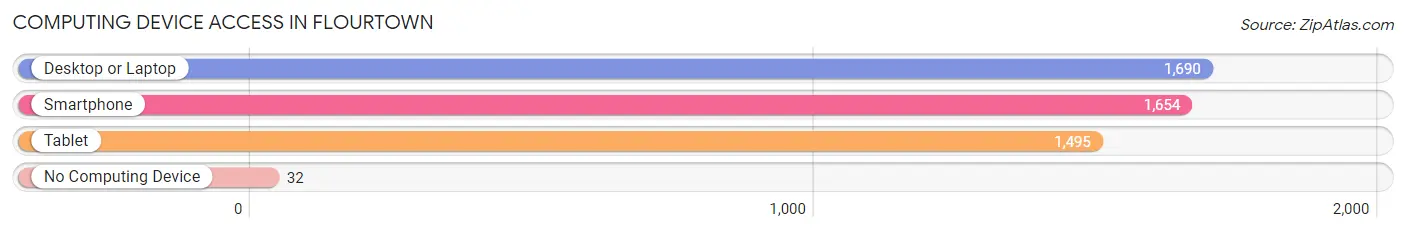
| Device Type | # Households | % Households |
| Desktop or Laptop | 1,690 | 94.3% |
| Smartphone | 1,654 | 92.3% |
| Tablet | 1,495 | 83.4% |
| No Computing Device | 32 | 1.8% |
| Total | 1,792 | 100.0% |
Internet Access in Flourtown
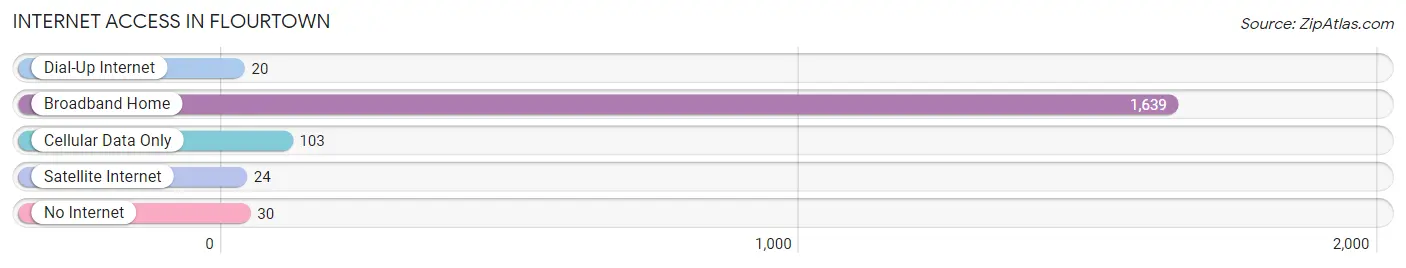
| Internet Type | # Households | % Households |
| Dial-Up Internet | 20 | 1.1% |
| Broadband Home | 1,639 | 91.5% |
| Cellular Data Only | 103 | 5.8% |
| Satellite Internet | 24 | 1.3% |
| No Internet | 30 | 1.7% |
| Total | 1,792 | 100.0% |
Flourtown Summary
Flourtown is a small, unincorporated community located in Montgomery County, Pennsylvania. It is situated approximately 15 miles northwest of Philadelphia and is part of the larger Chestnut Hill area. The population of Flourtown was estimated to be 3,845 in 2019.
History
Flourtown was originally part of Springfield Township, which was established in 1686. The area was first settled in the early 1700s by German immigrants, who named it Flourtown due to the abundance of grain mills in the area. The first mill was built in 1730 by John Foulke, and the area quickly became known for its flour production.
In 1854, the area was incorporated as a borough, and the name was changed to Flourtown. The borough was dissolved in 1895, and the area was annexed to Springfield Township.
Geography
Flourtown is located in the southeastern part of Montgomery County, Pennsylvania. It is situated approximately 15 miles northwest of Philadelphia and is part of the larger Chestnut Hill area. The community is bordered by the Wissahickon Creek to the east, and by the townships of Whitemarsh and Springfield to the north, west, and south, respectively.
The terrain of Flourtown is mostly flat, with some rolling hills. The area is mostly residential, with some commercial and industrial areas.
Economy
Flourtown is primarily a residential community, with some commercial and industrial areas. The main industries in the area are retail, healthcare, and education.
The largest employers in the area are the Chestnut Hill Hospital, the Flourtown Shopping Center, and the Flourtown Country Club. Other major employers include the Flourtown Fire Company, the Flourtown Police Department, and the Flourtown Public Library.
Demographics
As of 2019, the population of Flourtown was estimated to be 3,845. The racial makeup of the community was 87.3% White, 5.2% African American, 2.2% Asian, and 1.3% Hispanic or Latino. The median household income was $90,945, and the median home value was $521,000.
Flourtown is served by the Wissahickon School District. The area is home to several private schools, including the Flourtown Country Day School, the Flourtown Academy, and the Flourtown Friends School.
Conclusion
Flourtown is a small, unincorporated community located in Montgomery County, Pennsylvania. It is situated approximately 15 miles northwest of Philadelphia and is part of the larger Chestnut Hill area. The population of Flourtown was estimated to be 3,845 in 2019. The area is primarily residential, with some commercial and industrial areas. The main industries in the area are retail, healthcare, and education. The racial makeup of the community was 87.3% White, 5.2% African American, 2.2% Asian, and 1.3% Hispanic or Latino. The median household income was $90,945, and the median home value was $521,000. Flourtown is served by the Wissahickon School District, and is home to several private schools.
Common Questions
What is Per Capita Income in Flourtown?
Per Capita income in Flourtown is $66,694.
What is the Median Family Income in Flourtown?
Median Family Income in Flourtown is $172,083.
What is the Median Household income in Flourtown?
Median Household Income in Flourtown is $139,360.
What is Income or Wage Gap in Flourtown?
Income or Wage Gap in Flourtown is 26.7%.
Women in Flourtown earn 73.3 cents for every dollar earned by a man.
What is Inequality or Gini Index in Flourtown?
Inequality or Gini Index in Flourtown is 0.42.
What is the Total Population of Flourtown?
Total Population of Flourtown is 4,599.
What is the Total Male Population of Flourtown?
Total Male Population of Flourtown is 2,213.
What is the Total Female Population of Flourtown?
Total Female Population of Flourtown is 2,386.
What is the Ratio of Males per 100 Females in Flourtown?
There are 92.75 Males per 100 Females in Flourtown.
What is the Ratio of Females per 100 Males in Flourtown?
There are 107.82 Females per 100 Males in Flourtown.
What is the Median Population Age in Flourtown?
Median Population Age in Flourtown is 41.4 Years.
What is the Average Family Size in Flourtown
Average Family Size in Flourtown is 3.0 People.
What is the Average Household Size in Flourtown
Average Household Size in Flourtown is 2.5 People.
How Large is the Labor Force in Flourtown?
There are 2,656 People in the Labor Forcein in Flourtown.
What is the Percentage of People in the Labor Force in Flourtown?
72.3% of People are in the Labor Force in Flourtown.
What is the Unemployment Rate in Flourtown?
Unemployment Rate in Flourtown is 3.2%.