Blooming Valley borough, PA Map & Demographics
Blooming Valley borough Overview
$40,570
PER CAPITA INCOME
$89,167
AVG FAMILY INCOME
$71,875
AVG HOUSEHOLD INCOME
57.0%
WAGE / INCOME GAP [ % ]
43.0¢/ $1
WAGE / INCOME GAP [ $ ]
0.38
INEQUALITY / GINI INDEX
374
TOTAL POPULATION
197
MALE POPULATION
177
FEMALE POPULATION
111.30
MALES / 100 FEMALES
89.85
FEMALES / 100 MALES
53.0
MEDIAN AGE
2.4
AVG FAMILY SIZE
2.2
AVG HOUSEHOLD SIZE
222
LABOR FORCE [ PEOPLE ]
66.7%
PERCENT IN LABOR FORCE
1.4%
UNEMPLOYMENT RATE
Income in Blooming Valley borough
Income Overview in Blooming Valley borough
Per Capita Income in Blooming Valley borough is $40,570, while median incomes of families and households are $89,167 and $71,875 respectively.
| Characteristic | Number | Measure |
| Per Capita Income | 374 | $40,570 |
| Median Family Income | 128 | $89,167 |
| Mean Family Income | 128 | $110,875 |
| Median Household Income | 166 | $71,875 |
| Mean Household Income | 166 | $97,242 |
| Income Deficit | 128 | $0 |
| Wage / Income Gap (%) | 374 | 56.98% |
| Wage / Income Gap ($) | 374 | 43.02¢ per $1 |
| Gini / Inequality Index | 374 | 0.38 |
Earnings by Sex in Blooming Valley borough
Average Earnings in Blooming Valley borough are $40,714, $57,344 for men and $24,669 for women, a difference of 57.0%.
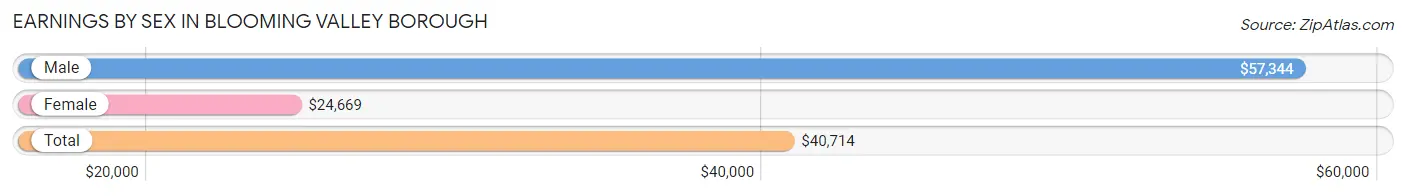
| Sex | Number | Average Earnings |
| Male | 119 (52.6%) | $57,344 |
| Female | 107 (47.3%) | $24,669 |
| Total | 226 (100.0%) | $40,714 |
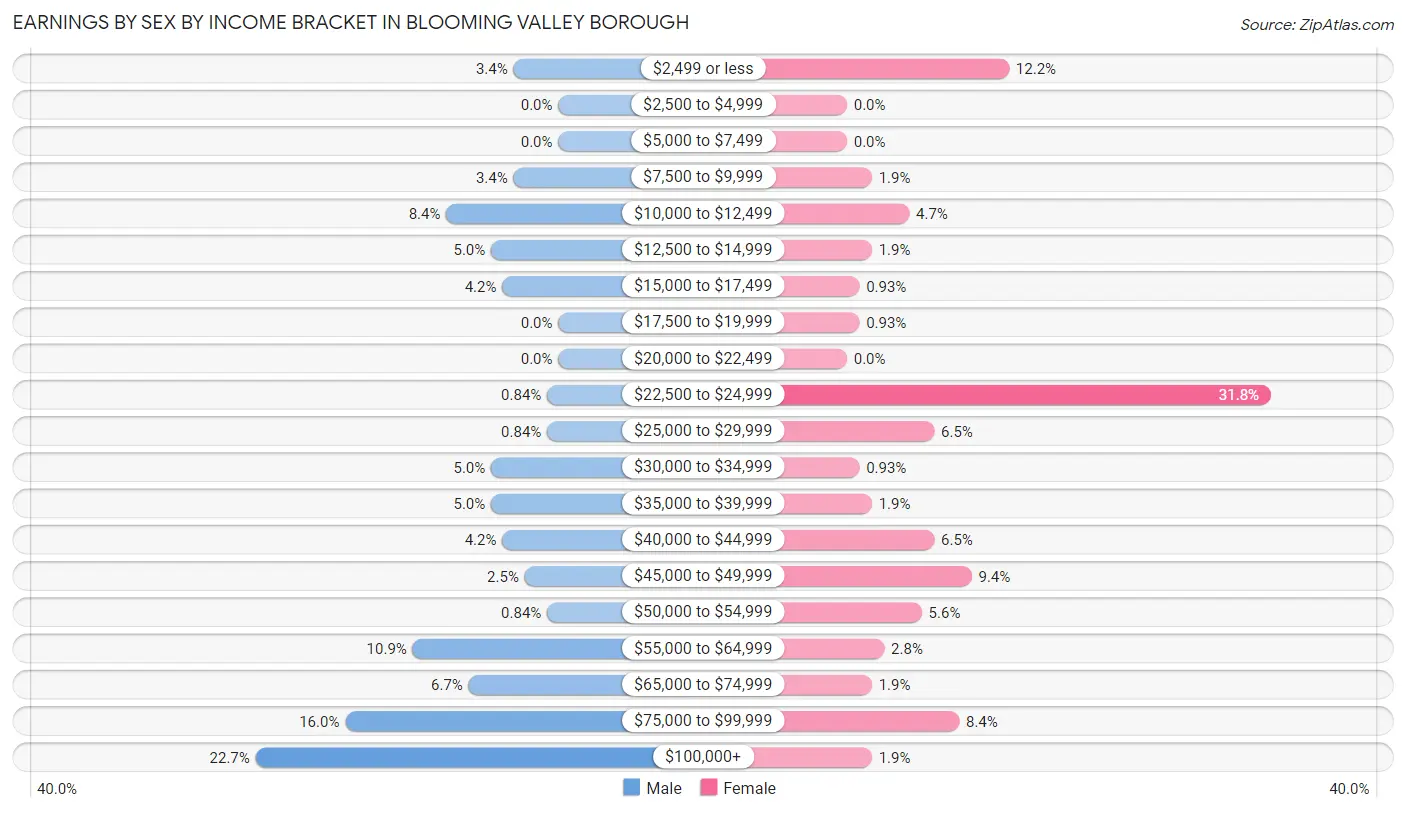
Earnings by Sex by Income Bracket in Blooming Valley borough
The most common earnings brackets in Blooming Valley borough are $100,000+ for men (27 | 22.7%) and $22,500 to $24,999 for women (34 | 31.8%).
| Income | Male | Female |
| $2,499 or less | 4 (3.4%) | 13 (12.1%) |
| $2,500 to $4,999 | 0 (0.0%) | 0 (0.0%) |
| $5,000 to $7,499 | 0 (0.0%) | 0 (0.0%) |
| $7,500 to $9,999 | 4 (3.4%) | 2 (1.9%) |
| $10,000 to $12,499 | 10 (8.4%) | 5 (4.7%) |
| $12,500 to $14,999 | 6 (5.0%) | 2 (1.9%) |
| $15,000 to $17,499 | 5 (4.2%) | 1 (0.9%) |
| $17,500 to $19,999 | 0 (0.0%) | 1 (0.9%) |
| $20,000 to $22,499 | 0 (0.0%) | 0 (0.0%) |
| $22,500 to $24,999 | 1 (0.8%) | 34 (31.8%) |
| $25,000 to $29,999 | 1 (0.8%) | 7 (6.5%) |
| $30,000 to $34,999 | 6 (5.0%) | 1 (0.9%) |
| $35,000 to $39,999 | 6 (5.0%) | 2 (1.9%) |
| $40,000 to $44,999 | 5 (4.2%) | 7 (6.5%) |
| $45,000 to $49,999 | 3 (2.5%) | 10 (9.3%) |
| $50,000 to $54,999 | 1 (0.8%) | 6 (5.6%) |
| $55,000 to $64,999 | 13 (10.9%) | 3 (2.8%) |
| $65,000 to $74,999 | 8 (6.7%) | 2 (1.9%) |
| $75,000 to $99,999 | 19 (16.0%) | 9 (8.4%) |
| $100,000+ | 27 (22.7%) | 2 (1.9%) |
| Total | 119 (100.0%) | 107 (100.0%) |
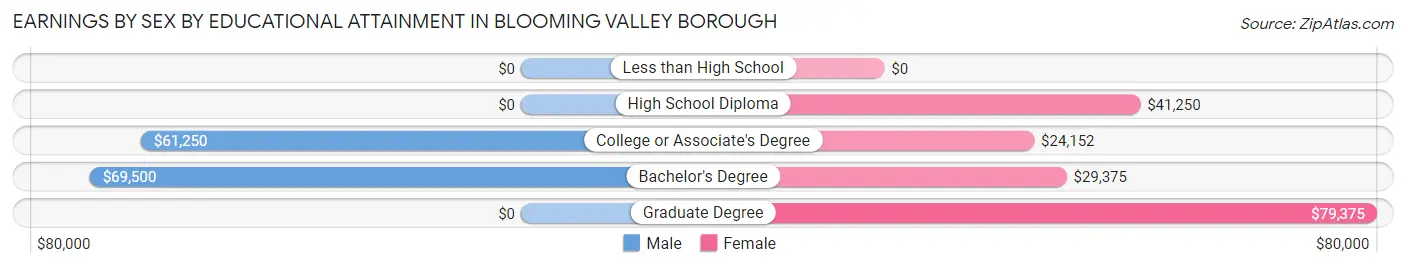
Earnings by Sex by Educational Attainment in Blooming Valley borough
Average earnings in Blooming Valley borough are $68,125 for men and $24,890 for women, a difference of 63.5%. Men with an educational attainment of bachelor's degree enjoy the highest average annual earnings of $69,500, while those with college or associate's degree education earn the least with $61,250. Women with an educational attainment of graduate degree earn the most with the average annual earnings of $79,375, while those with college or associate's degree education have the smallest earnings of $24,152.
| Educational Attainment | Male Income | Female Income |
| Less than High School | - | - |
| High School Diploma | - | - |
| College or Associate's Degree | $61,250 | $24,152 |
| Bachelor's Degree | $69,500 | $29,375 |
| Graduate Degree | - | - |
| Total | $68,125 | $24,890 |
Family Income in Blooming Valley borough
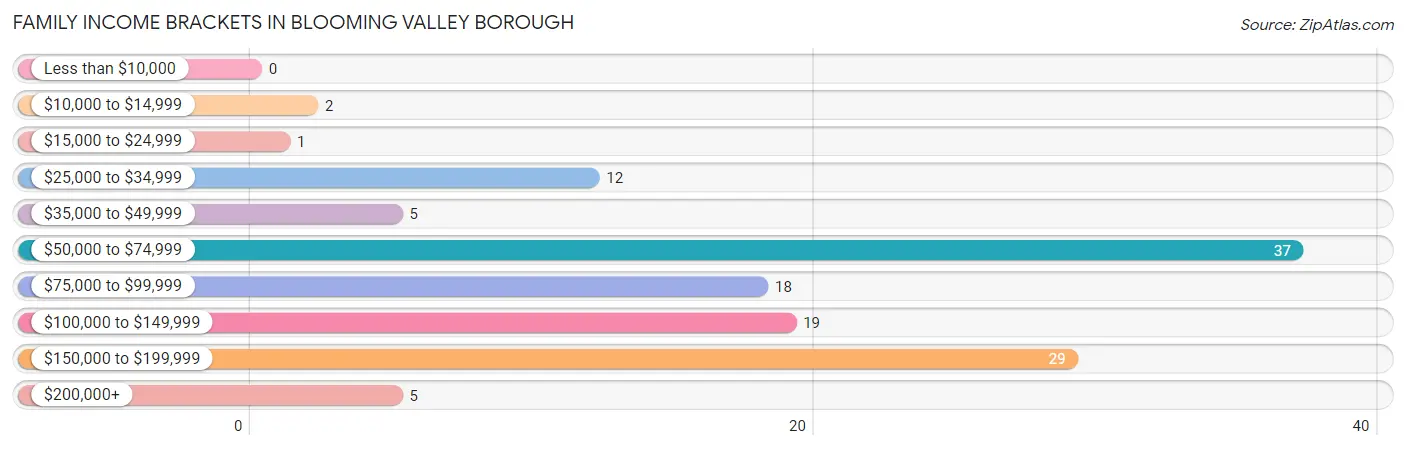
Family Income Brackets in Blooming Valley borough
According to the Blooming Valley borough family income data, there are 37 families falling into the $50,000 to $74,999 income range, which is the most common income bracket and makes up 28.9% of all families.
| Income Bracket | # Families | % Families |
| Less than $10,000 | 0 | 0.0% |
| $10,000 to $14,999 | 2 | 1.6% |
| $15,000 to $24,999 | 1 | 0.8% |
| $25,000 to $34,999 | 12 | 9.4% |
| $35,000 to $49,999 | 5 | 3.9% |
| $50,000 to $74,999 | 37 | 28.9% |
| $75,000 to $99,999 | 18 | 14.1% |
| $100,000 to $149,999 | 19 | 14.8% |
| $150,000 to $199,999 | 29 | 22.7% |
| $200,000+ | 5 | 3.9% |
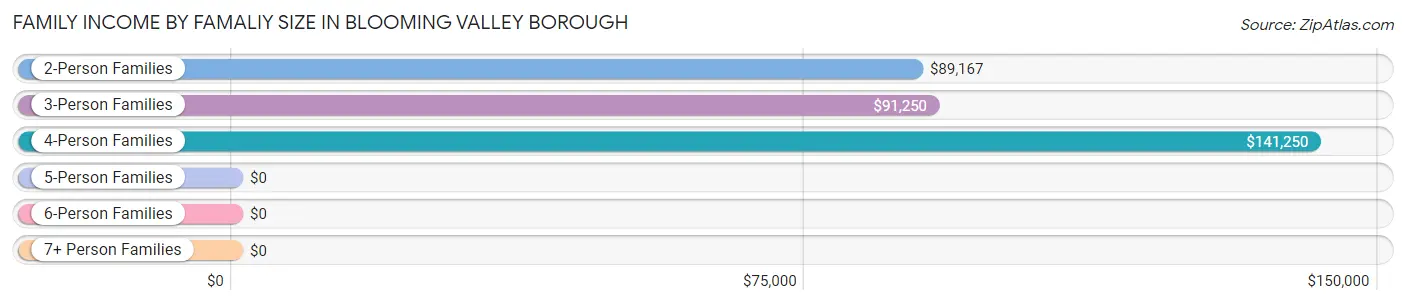
Family Income by Famaliy Size in Blooming Valley borough
4-person families (10 | 7.8%) account for the highest median family income in Blooming Valley borough with $141,250 per family, while 2-person families (94 | 73.4%) have the highest median income of $44,584 per family member.
| Income Bracket | # Families | Median Income |
| 2-Person Families | 94 (73.4%) | $89,167 |
| 3-Person Families | 16 (12.5%) | $91,250 |
| 4-Person Families | 10 (7.8%) | $141,250 |
| 5-Person Families | 8 (6.2%) | $0 |
| 6-Person Families | 0 (0.0%) | $0 |
| 7+ Person Families | 0 (0.0%) | $0 |
| Total | 128 (100.0%) | $89,167 |
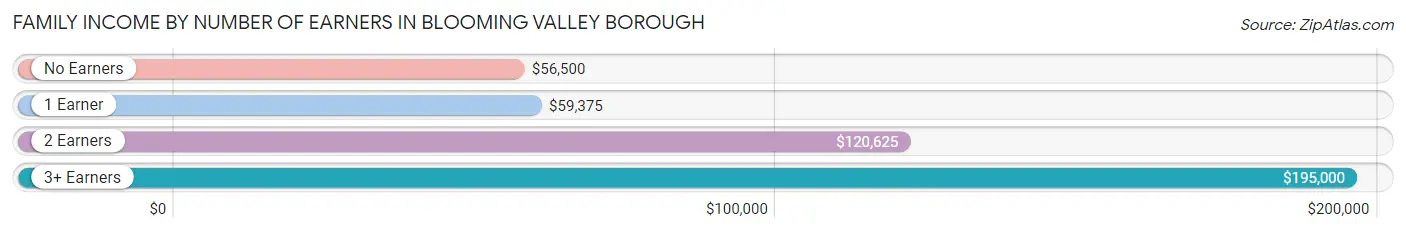
Family Income by Number of Earners in Blooming Valley borough
The median family income in Blooming Valley borough is $89,167, with families comprising 3+ earners (6) having the highest median family income of $195,000, while families with no earners (16) have the lowest median family income of $56,500, accounting for 4.7% and 12.5% of families, respectively.
| Number of Earners | # Families | Median Income |
| No Earners | 16 (12.5%) | $56,500 |
| 1 Earner | 35 (27.3%) | $59,375 |
| 2 Earners | 71 (55.5%) | $120,625 |
| 3+ Earners | 6 (4.7%) | $195,000 |
| Total | 128 (100.0%) | $89,167 |
Household Income in Blooming Valley borough
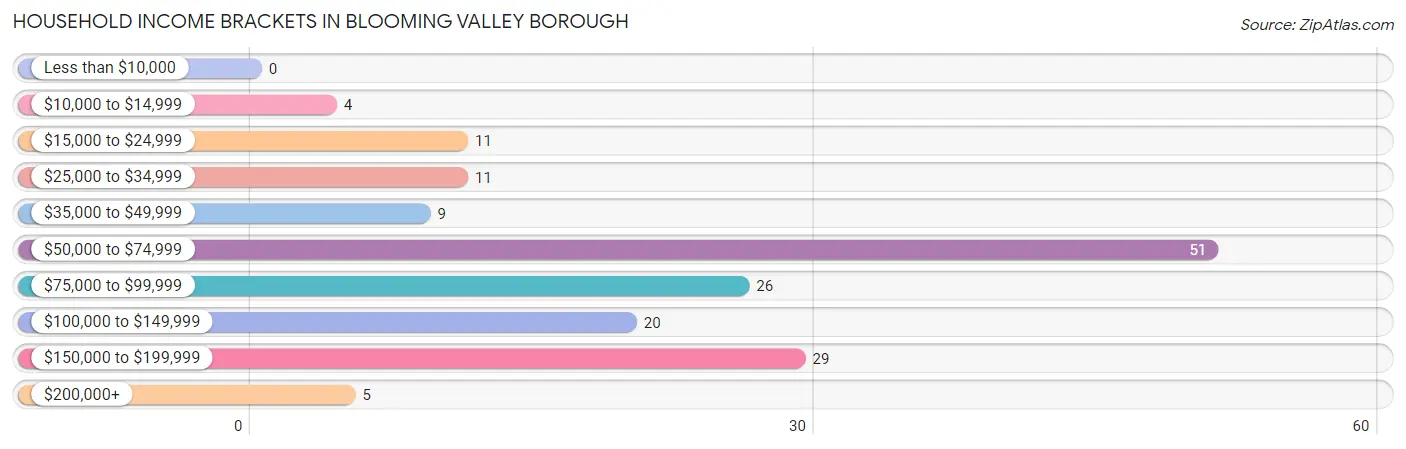
Household Income Brackets in Blooming Valley borough
With 51 households falling in the category, the $50,000 to $74,999 income range is the most frequent in Blooming Valley borough, accounting for 30.7% of all households.
| Income Bracket | # Households | % Households |
| Less than $10,000 | 0 | 0.0% |
| $10,000 to $14,999 | 4 | 2.4% |
| $15,000 to $24,999 | 11 | 6.6% |
| $25,000 to $34,999 | 11 | 6.6% |
| $35,000 to $49,999 | 9 | 5.4% |
| $50,000 to $74,999 | 51 | 30.7% |
| $75,000 to $99,999 | 26 | 15.7% |
| $100,000 to $149,999 | 20 | 12.0% |
| $150,000 to $199,999 | 29 | 17.5% |
| $200,000+ | 5 | 3.0% |
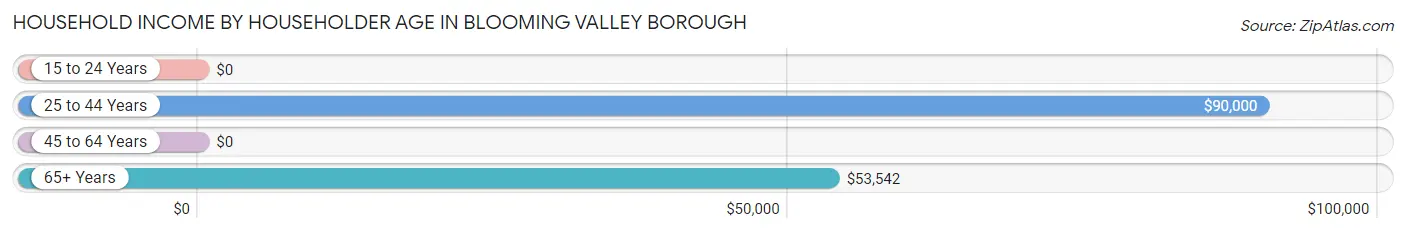
Household Income by Householder Age in Blooming Valley borough
The median household income in Blooming Valley borough is $71,875, with the highest median household income of $90,000 found in the 25 to 44 years age bracket for the primary householder. A total of 26 households (15.7%) fall into this category.
| Income Bracket | # Households | Median Income |
| 15 to 24 Years | 0 (0.0%) | $0 |
| 25 to 44 Years | 26 (15.7%) | $90,000 |
| 45 to 64 Years | 85 (51.2%) | $0 |
| 65+ Years | 55 (33.1%) | $53,542 |
| Total | 166 (100.0%) | $71,875 |
Poverty in Blooming Valley borough
Income Below Poverty by Sex and Age in Blooming Valley borough
With 2.0% poverty level for males and 6.2% for females among the residents of Blooming Valley borough, 15 year old males and 18 to 24 year old females are the most vulnerable to poverty, with 2 males (40.0%) and 7 females (70.0%) in their respective age groups living below the poverty level.
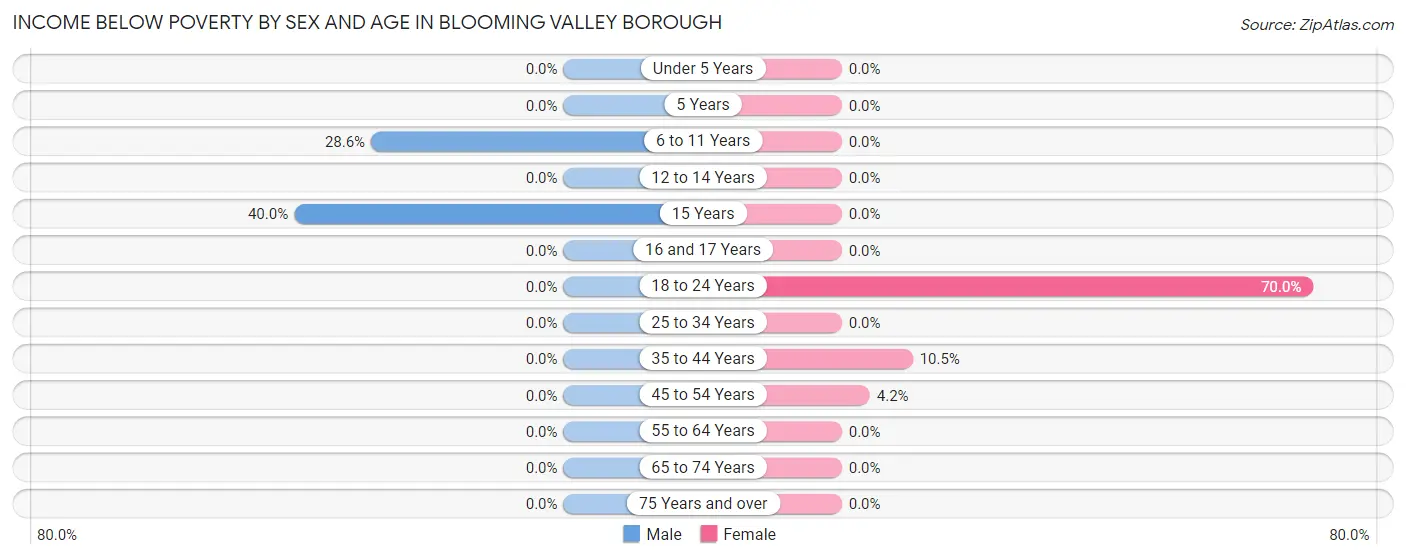
| Age Bracket | Male | Female |
| Under 5 Years | 0 (0.0%) | 0 (0.0%) |
| 5 Years | 0 (0.0%) | 0 (0.0%) |
| 6 to 11 Years | 2 (28.6%) | 0 (0.0%) |
| 12 to 14 Years | 0 (0.0%) | 0 (0.0%) |
| 15 Years | 2 (40.0%) | 0 (0.0%) |
| 16 and 17 Years | 0 (0.0%) | 0 (0.0%) |
| 18 to 24 Years | 0 (0.0%) | 7 (70.0%) |
| 25 to 34 Years | 0 (0.0%) | 0 (0.0%) |
| 35 to 44 Years | 0 (0.0%) | 2 (10.5%) |
| 45 to 54 Years | 0 (0.0%) | 2 (4.2%) |
| 55 to 64 Years | 0 (0.0%) | 0 (0.0%) |
| 65 to 74 Years | 0 (0.0%) | 0 (0.0%) |
| 75 Years and over | 0 (0.0%) | 0 (0.0%) |
| Total | 4 (2.0%) | 11 (6.2%) |
Income Above Poverty by Sex and Age in Blooming Valley borough
According to the poverty statistics in Blooming Valley borough, males aged under 5 years and females aged under 5 years are the age groups that are most secure financially, with 100.0% of males and 100.0% of females in these age groups living above the poverty line.
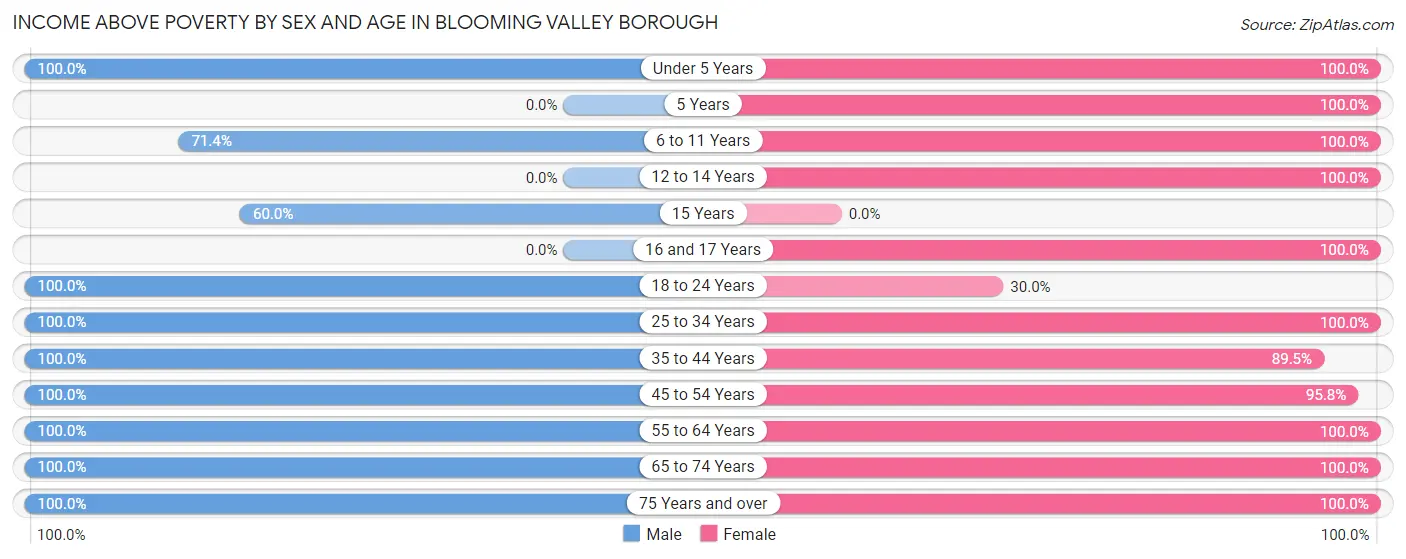
| Age Bracket | Male | Female |
| Under 5 Years | 20 (100.0%) | 2 (100.0%) |
| 5 Years | 0 (0.0%) | 2 (100.0%) |
| 6 to 11 Years | 5 (71.4%) | 2 (100.0%) |
| 12 to 14 Years | 0 (0.0%) | 3 (100.0%) |
| 15 Years | 3 (60.0%) | 0 (0.0%) |
| 16 and 17 Years | 0 (0.0%) | 1 (100.0%) |
| 18 to 24 Years | 18 (100.0%) | 3 (30.0%) |
| 25 to 34 Years | 10 (100.0%) | 14 (100.0%) |
| 35 to 44 Years | 15 (100.0%) | 17 (89.5%) |
| 45 to 54 Years | 40 (100.0%) | 46 (95.8%) |
| 55 to 64 Years | 31 (100.0%) | 33 (100.0%) |
| 65 to 74 Years | 32 (100.0%) | 20 (100.0%) |
| 75 Years and over | 19 (100.0%) | 23 (100.0%) |
| Total | 193 (98.0%) | 166 (93.8%) |
Income Below Poverty Among Married-Couple Families in Blooming Valley borough
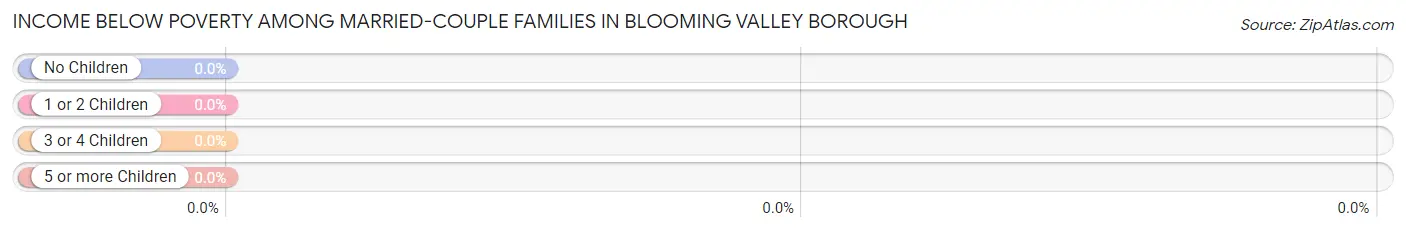
| Children | Above Poverty | Below Poverty |
| No Children | 87 (100.0%) | 0 (0.0%) |
| 1 or 2 Children | 18 (100.0%) | 0 (0.0%) |
| 3 or 4 Children | 0 (0.0%) | 0 (0.0%) |
| 5 or more Children | 0 (0.0%) | 0 (0.0%) |
| Total | 105 (100.0%) | 0 (0.0%) |
Income Below Poverty Among Single-Parent Households in Blooming Valley borough
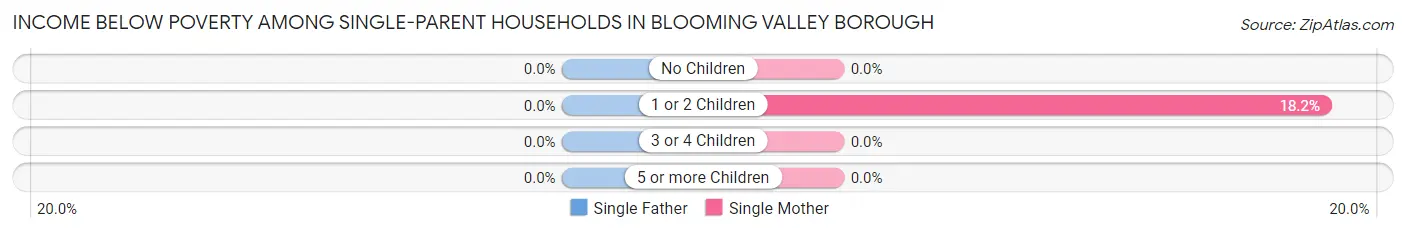
| Children | Single Father | Single Mother |
| No Children | 0 (0.0%) | 0 (0.0%) |
| 1 or 2 Children | 0 (0.0%) | 2 (18.2%) |
| 3 or 4 Children | 0 (0.0%) | 0 (0.0%) |
| 5 or more Children | 0 (0.0%) | 0 (0.0%) |
| Total | 0 (0.0%) | 2 (9.5%) |
Income Below Poverty Among Married-Couple vs Single-Parent Households in Blooming Valley borough
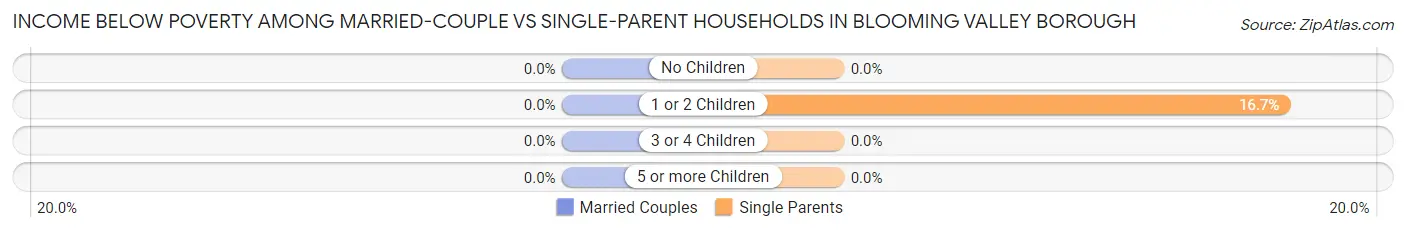
| Children | Married-Couple Families | Single-Parent Households |
| No Children | 0 (0.0%) | 0 (0.0%) |
| 1 or 2 Children | 0 (0.0%) | 2 (16.7%) |
| 3 or 4 Children | 0 (0.0%) | 0 (0.0%) |
| 5 or more Children | 0 (0.0%) | 0 (0.0%) |
| Total | 0 (0.0%) | 2 (8.7%) |
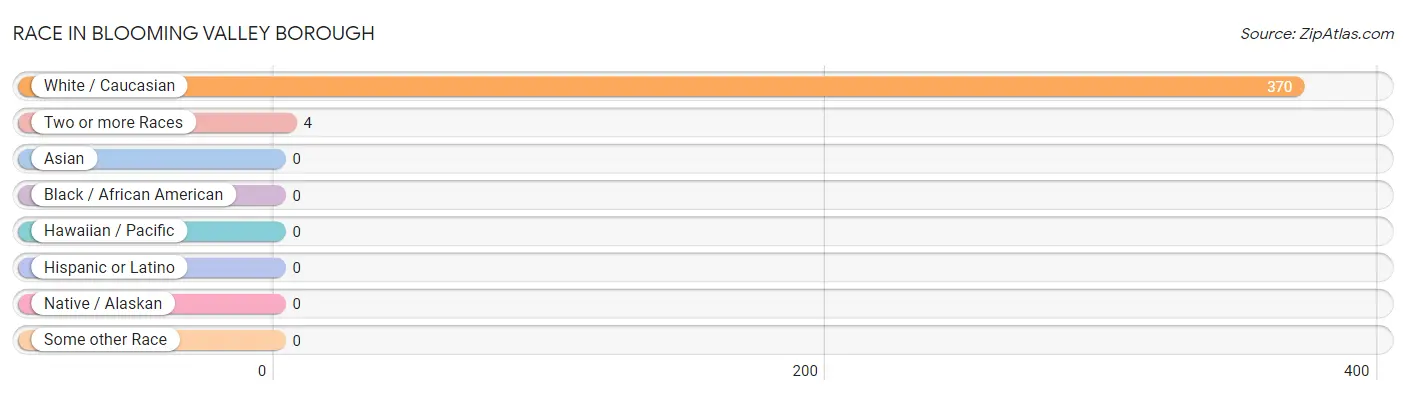
Race in Blooming Valley borough
The most populous races in Blooming Valley borough are White / Caucasian (370 | 98.9%), and Two or more Races (4 | 1.1%).
| Race | # Population | % Population |
| Asian | 0 | 0.0% |
| Black / African American | 0 | 0.0% |
| Hawaiian / Pacific | 0 | 0.0% |
| Hispanic or Latino | 0 | 0.0% |
| Native / Alaskan | 0 | 0.0% |
| White / Caucasian | 370 | 98.9% |
| Two or more Races | 4 | 1.1% |
| Some other Race | 0 | 0.0% |
| Total | 374 | 100.0% |
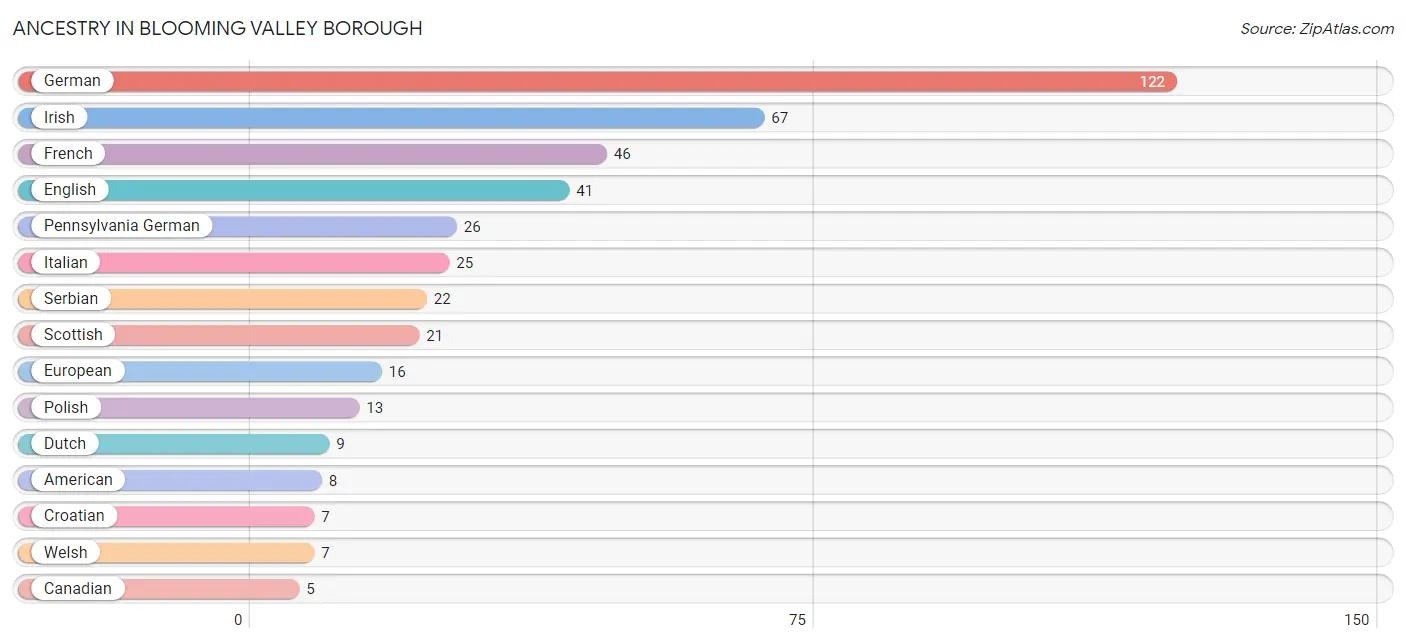
Ancestry in Blooming Valley borough
The most populous ancestries reported in Blooming Valley borough are German (122 | 32.6%), Irish (67 | 17.9%), French (46 | 12.3%), English (41 | 11.0%), and Pennsylvania German (26 | 7.0%), together accounting for 80.7% of all Blooming Valley borough residents.
| Ancestry | # Population | % Population |
| American | 8 | 2.1% |
| Austrian | 2 | 0.5% |
| British | 1 | 0.3% |
| Canadian | 5 | 1.3% |
| Croatian | 7 | 1.9% |
| Czechoslovakian | 1 | 0.3% |
| Dutch | 9 | 2.4% |
| Eastern European | 5 | 1.3% |
| English | 41 | 11.0% |
| European | 16 | 4.3% |
| French | 46 | 12.3% |
| German | 122 | 32.6% |
| Hungarian | 2 | 0.5% |
| Irish | 67 | 17.9% |
| Italian | 25 | 6.7% |
| Lithuanian | 1 | 0.3% |
| Pennsylvania German | 26 | 7.0% |
| Polish | 13 | 3.5% |
| Russian | 1 | 0.3% |
| Scandinavian | 1 | 0.3% |
| Scotch-Irish | 4 | 1.1% |
| Scottish | 21 | 5.6% |
| Serbian | 22 | 5.9% |
| Slovene | 2 | 0.5% |
| Swedish | 1 | 0.3% |
| Ukrainian | 1 | 0.3% |
| Welsh | 7 | 1.9% | View All 27 Rows |
Immigrants in Blooming Valley borough

| Immigration Origin | # Population | % Population | View All 0 Rows |
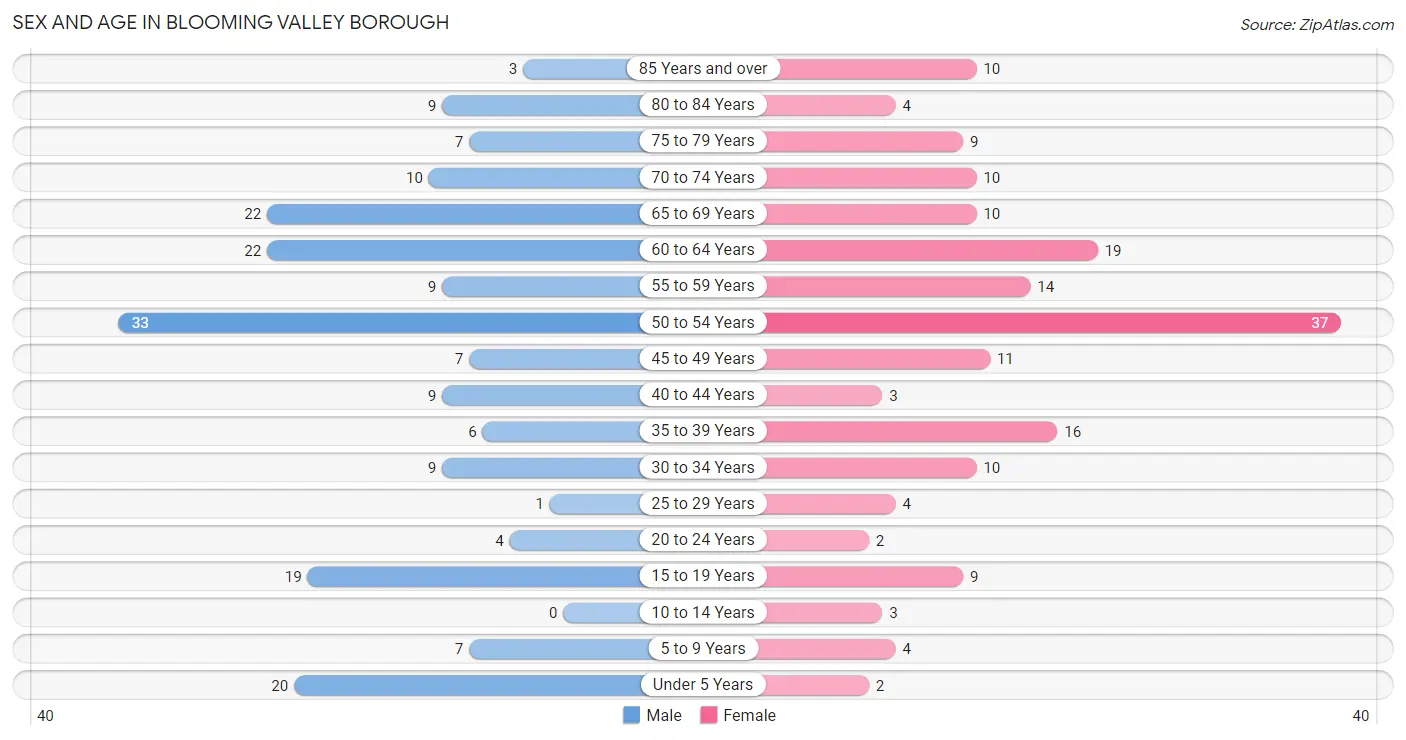
Sex and Age in Blooming Valley borough
Sex and Age in Blooming Valley borough
The most populous age groups in Blooming Valley borough are 50 to 54 Years (33 | 16.8%) for men and 50 to 54 Years (37 | 20.9%) for women.
| Age Bracket | Male | Female |
| Under 5 Years | 20 (10.2%) | 2 (1.1%) |
| 5 to 9 Years | 7 (3.5%) | 4 (2.3%) |
| 10 to 14 Years | 0 (0.0%) | 3 (1.7%) |
| 15 to 19 Years | 19 (9.6%) | 9 (5.1%) |
| 20 to 24 Years | 4 (2.0%) | 2 (1.1%) |
| 25 to 29 Years | 1 (0.5%) | 4 (2.3%) |
| 30 to 34 Years | 9 (4.6%) | 10 (5.7%) |
| 35 to 39 Years | 6 (3.0%) | 16 (9.0%) |
| 40 to 44 Years | 9 (4.6%) | 3 (1.7%) |
| 45 to 49 Years | 7 (3.5%) | 11 (6.2%) |
| 50 to 54 Years | 33 (16.8%) | 37 (20.9%) |
| 55 to 59 Years | 9 (4.6%) | 14 (7.9%) |
| 60 to 64 Years | 22 (11.2%) | 19 (10.7%) |
| 65 to 69 Years | 22 (11.2%) | 10 (5.7%) |
| 70 to 74 Years | 10 (5.1%) | 10 (5.7%) |
| 75 to 79 Years | 7 (3.5%) | 9 (5.1%) |
| 80 to 84 Years | 9 (4.6%) | 4 (2.3%) |
| 85 Years and over | 3 (1.5%) | 10 (5.7%) |
| Total | 197 (100.0%) | 177 (100.0%) |
Families and Households in Blooming Valley borough
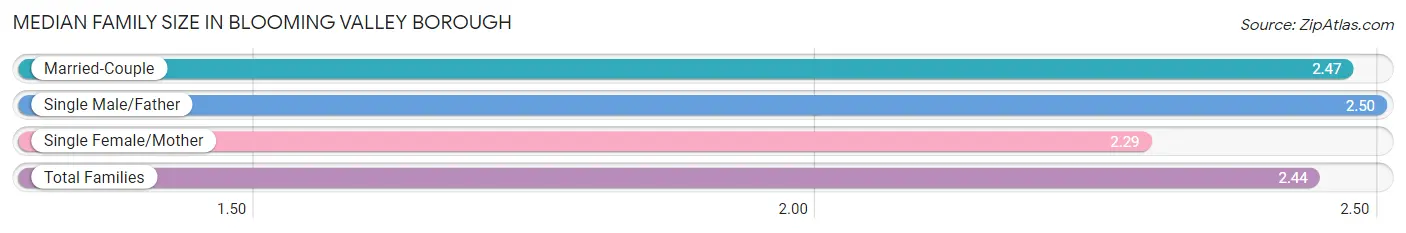
Median Family Size in Blooming Valley borough
The median family size in Blooming Valley borough is 2.44 persons per family, with single male/father families (2 | 1.6%) accounting for the largest median family size of 2.5 persons per family. On the other hand, single female/mother families (21 | 16.4%) represent the smallest median family size with 2.29 persons per family.
| Family Type | # Families | Family Size |
| Married-Couple | 105 (82.0%) | 2.47 |
| Single Male/Father | 2 (1.6%) | 2.50 |
| Single Female/Mother | 21 (16.4%) | 2.29 |
| Total Families | 128 (100.0%) | 2.44 |
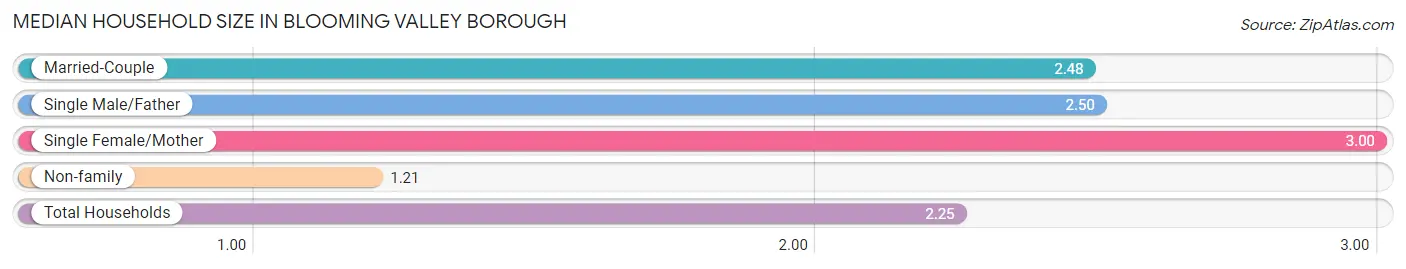
Median Household Size in Blooming Valley borough
The median household size in Blooming Valley borough is 2.25 persons per household, with single female/mother households (21 | 12.7%) accounting for the largest median household size of 3 persons per household. non-family households (38 | 22.9%) represent the smallest median household size with 1.21 persons per household.
| Household Type | # Households | Household Size |
| Married-Couple | 105 (63.2%) | 2.48 |
| Single Male/Father | 2 (1.2%) | 2.50 |
| Single Female/Mother | 21 (12.7%) | 3.00 |
| Non-family | 38 (22.9%) | 1.21 |
| Total Households | 166 (100.0%) | 2.25 |
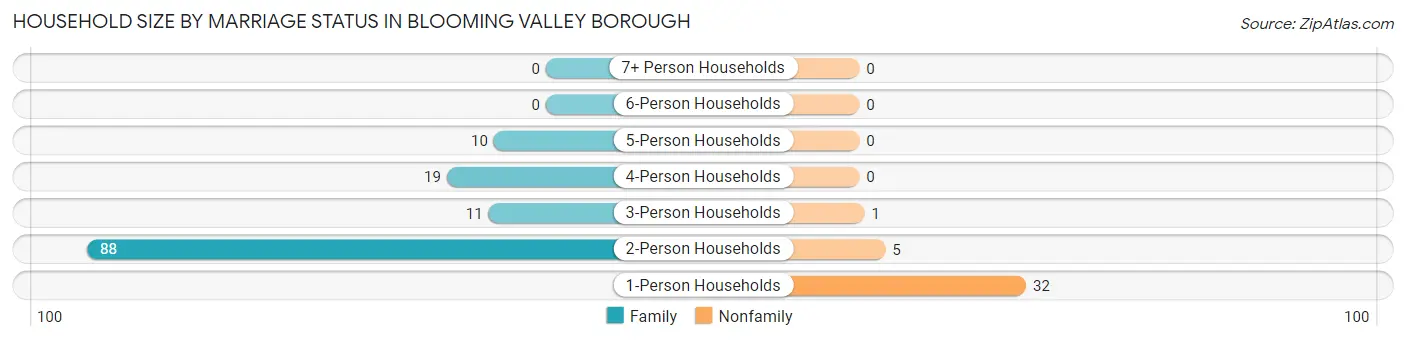
Household Size by Marriage Status in Blooming Valley borough
Out of a total of 166 households in Blooming Valley borough, 128 (77.1%) are family households, while 38 (22.9%) are nonfamily households. The most numerous type of family households are 2-person households, comprising 88, and the most common type of nonfamily households are 1-person households, comprising 32.
| Household Size | Family Households | Nonfamily Households |
| 1-Person Households | - | 32 (19.3%) |
| 2-Person Households | 88 (53.0%) | 5 (3.0%) |
| 3-Person Households | 11 (6.6%) | 1 (0.6%) |
| 4-Person Households | 19 (11.5%) | 0 (0.0%) |
| 5-Person Households | 10 (6.0%) | 0 (0.0%) |
| 6-Person Households | 0 (0.0%) | 0 (0.0%) |
| 7+ Person Households | 0 (0.0%) | 0 (0.0%) |
| Total | 128 (77.1%) | 38 (22.9%) |
Female Fertility in Blooming Valley borough
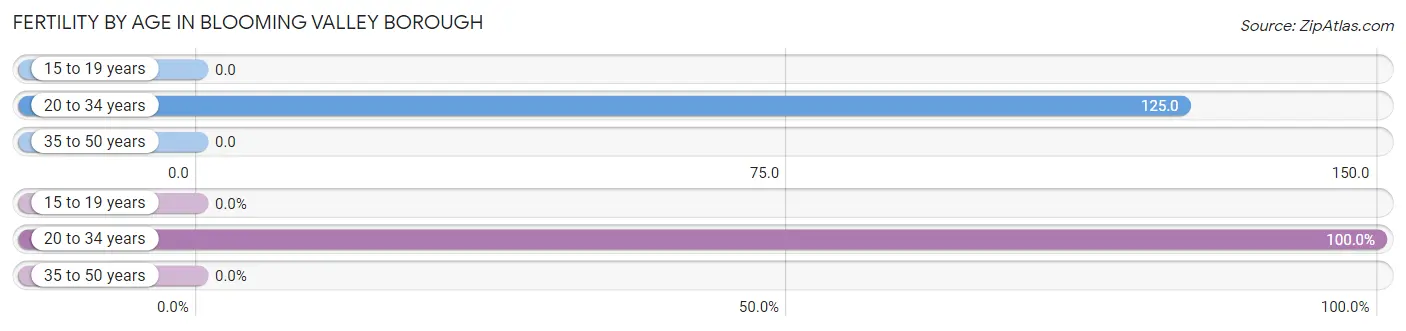
Fertility by Age in Blooming Valley borough
Average fertility rate in Blooming Valley borough is 34.0 births per 1,000 women. Women in the age bracket of 20 to 34 years have the highest fertility rate with 125.0 births per 1,000 women. Women in the age bracket of 20 to 34 years acount for 100.0% of all women with births.
| Age Bracket | Women with Births | Births / 1,000 Women |
| 15 to 19 years | 0 (0.0%) | 0.0 |
| 20 to 34 years | 2 (100.0%) | 125.0 |
| 35 to 50 years | 0 (0.0%) | 0.0 |
| Total | 2 (100.0%) | 34.0 |
Fertility by Age by Marriage Status in Blooming Valley borough
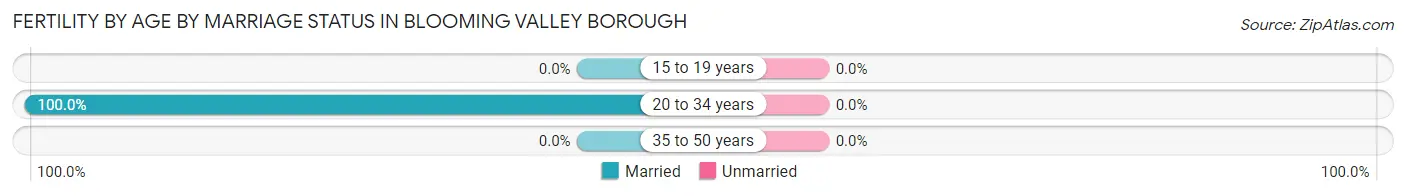
| Age Bracket | Married | Unmarried |
| 15 to 19 years | 0 (0.0%) | 0 (0.0%) |
| 20 to 34 years | 2 (100.0%) | 0 (0.0%) |
| 35 to 50 years | 0 (0.0%) | 0 (0.0%) |
| Total | 2 (100.0%) | 0 (0.0%) |
Fertility by Education in Blooming Valley borough
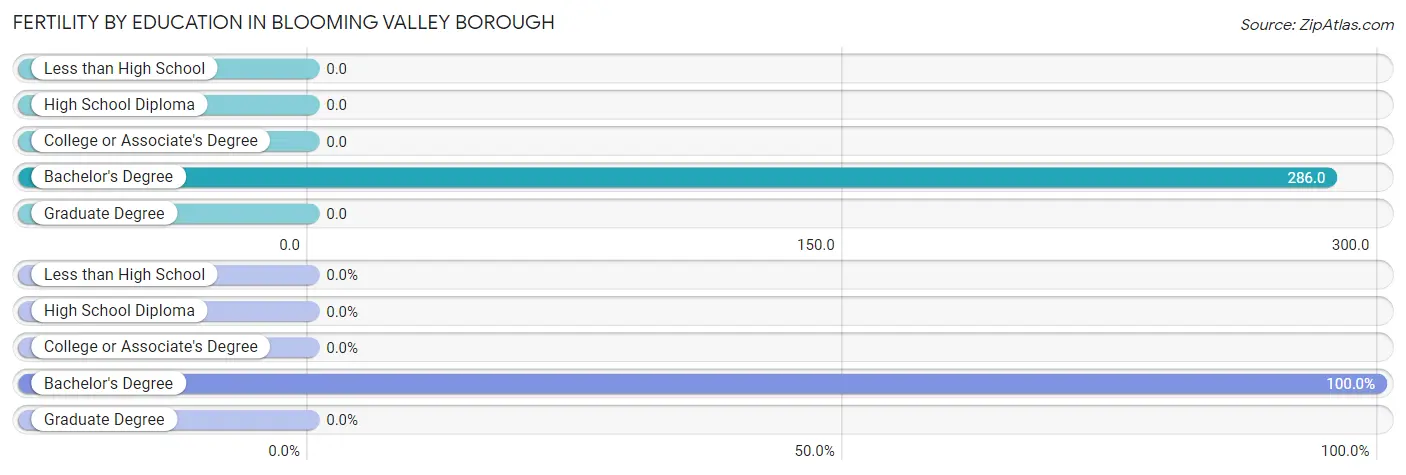
| Educational Attainment | Women with Births | Births / 1,000 Women |
| Less than High School | 0 (0.0%) | 0.0 |
| High School Diploma | 0 (0.0%) | 0.0 |
| College or Associate's Degree | 0 (0.0%) | 0.0 |
| Bachelor's Degree | 2 (100.0%) | 286.0 |
| Graduate Degree | 0 (0.0%) | 0.0 |
| Total | 2 (100.0%) | 34.0 |
Fertility by Education by Marriage Status in Blooming Valley borough
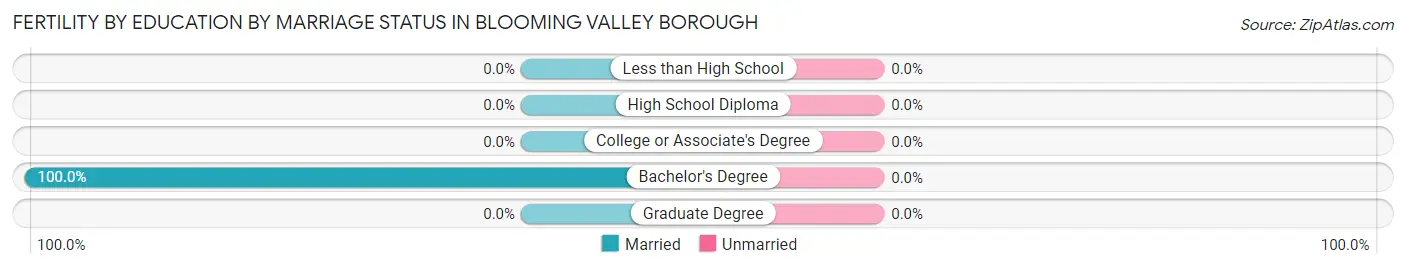
| Educational Attainment | Married | Unmarried |
| Less than High School | 0 (0.0%) | 0 (0.0%) |
| High School Diploma | 0 (0.0%) | 0 (0.0%) |
| College or Associate's Degree | 0 (0.0%) | 0 (0.0%) |
| Bachelor's Degree | 2 (100.0%) | 0 (0.0%) |
| Graduate Degree | 0 (0.0%) | 0 (0.0%) |
| Total | 2 (100.0%) | 0 (0.0%) |
Employment Characteristics in Blooming Valley borough
Employment by Class of Employer in Blooming Valley borough
Among the 213 employed individuals in Blooming Valley borough, private company employees (143 | 67.1%), self-employed (not incorporated) (32 | 15.0%), and not-for-profit organizations (16 | 7.5%) make up the most common classes of employment.
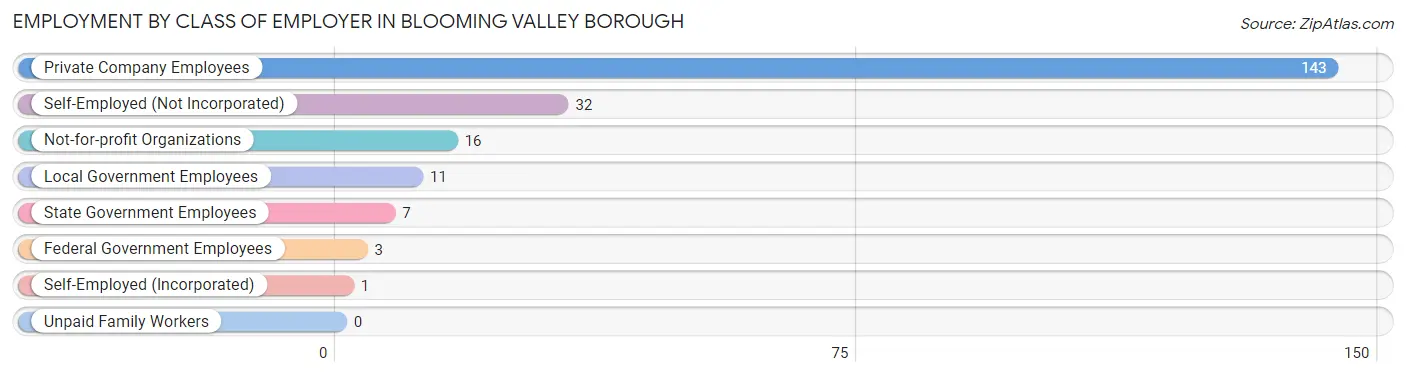
| Employer Class | # Employees | % Employees |
| Private Company Employees | 143 | 67.1% |
| Self-Employed (Incorporated) | 1 | 0.5% |
| Self-Employed (Not Incorporated) | 32 | 15.0% |
| Not-for-profit Organizations | 16 | 7.5% |
| Local Government Employees | 11 | 5.2% |
| State Government Employees | 7 | 3.3% |
| Federal Government Employees | 3 | 1.4% |
| Unpaid Family Workers | 0 | 0.0% |
| Total | 213 | 100.0% |
Employment Status by Age in Blooming Valley borough
According to the labor force statistics for Blooming Valley borough, out of the total population over 16 years of age (333), 66.7% or 222 individuals are in the labor force, with 1.4% or 3 of them unemployed. The age group with the highest labor force participation rate is 20 to 24 years, with 100.0% or 6 individuals in the labor force. Within the labor force, the 35 to 44 years age range has the highest percentage of unemployed individuals, with 8.3% or 2 of them being unemployed.
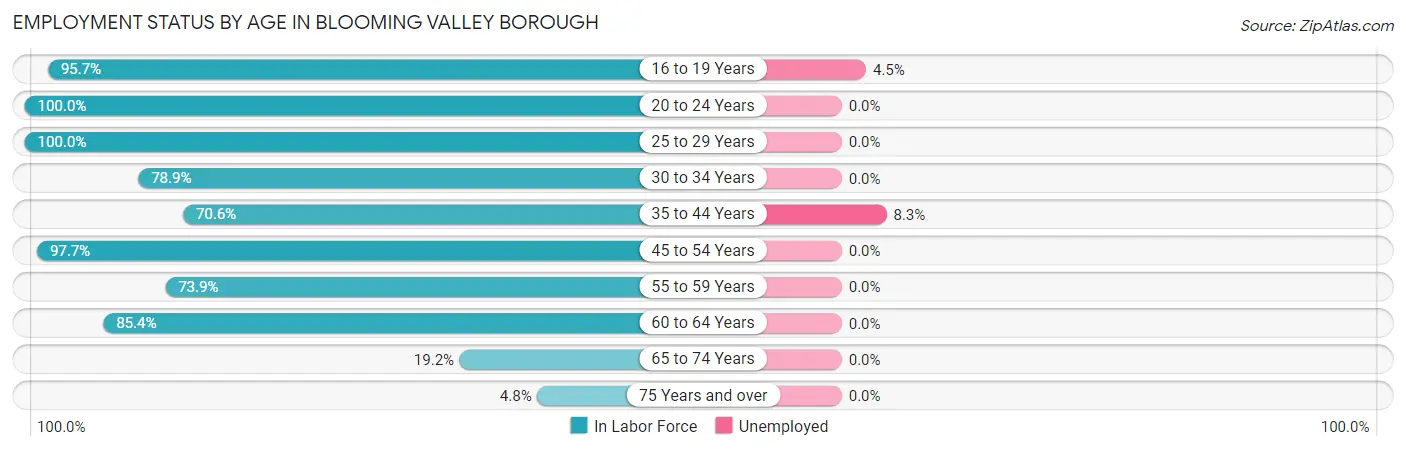
| Age Bracket | In Labor Force | Unemployed |
| 16 to 19 Years | 22 (95.7%) | 1 (4.5%) |
| 20 to 24 Years | 6 (100.0%) | 0 (0.0%) |
| 25 to 29 Years | 5 (100.0%) | 0 (0.0%) |
| 30 to 34 Years | 15 (78.9%) | 0 (0.0%) |
| 35 to 44 Years | 24 (70.6%) | 2 (8.3%) |
| 45 to 54 Years | 86 (97.7%) | 0 (0.0%) |
| 55 to 59 Years | 17 (73.9%) | 0 (0.0%) |
| 60 to 64 Years | 35 (85.4%) | 0 (0.0%) |
| 65 to 74 Years | 10 (19.2%) | 0 (0.0%) |
| 75 Years and over | 2 (4.8%) | 0 (0.0%) |
| Total | 222 (66.7%) | 3 (1.4%) |
Employment Status by Educational Attainment in Blooming Valley borough
According to labor force statistics for Blooming Valley borough, 86.7% of individuals (182) out of the total population between 25 and 64 years of age (210) are in the labor force, with 1.1% or 2 of them being unemployed. The group with the highest labor force participation rate are those with the educational attainment of college / associate degree, with 98.7% or 76 individuals in the labor force. Within the labor force, individuals with high school diploma education have the highest percentage of unemployment, with 2.6% or 2 of them being unemployed.
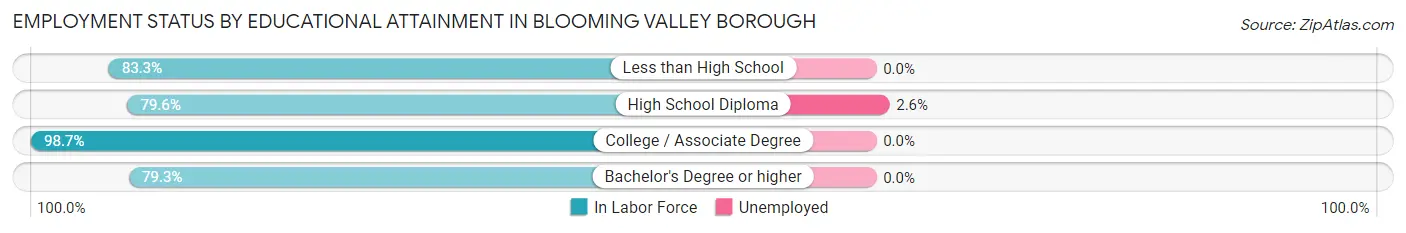
| Educational Attainment | In Labor Force | Unemployed |
| Less than High School | 5 (83.3%) | 0 (0.0%) |
| High School Diploma | 78 (79.6%) | 3 (2.6%) |
| College / Associate Degree | 76 (98.7%) | 0 (0.0%) |
| Bachelor's Degree or higher | 23 (79.3%) | 0 (0.0%) |
| Total | 182 (86.7%) | 2 (1.1%) |
Employment Occupations by Sex in Blooming Valley borough
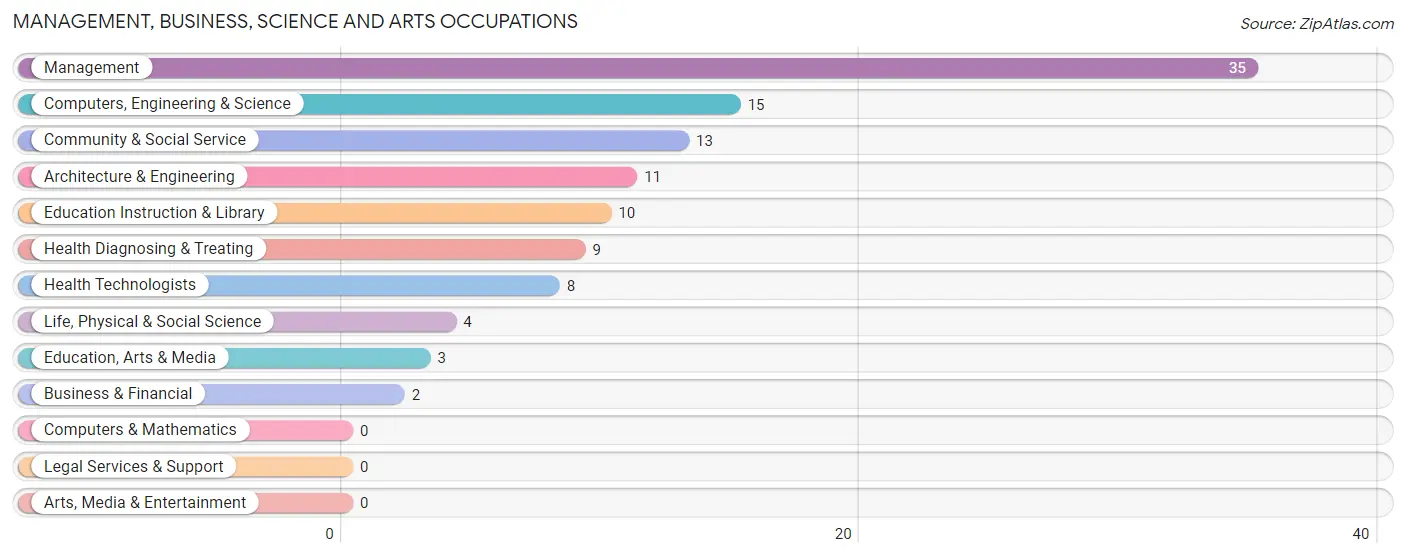
Management, Business, Science and Arts Occupations
The most common Management, Business, Science and Arts occupations in Blooming Valley borough are Management (35 | 16.0%), Computers, Engineering & Science (15 | 6.9%), Community & Social Service (13 | 5.9%), Architecture & Engineering (11 | 5.0%), and Education Instruction & Library (10 | 4.6%).
Management, Business, Science and Arts Occupations by Sex
Within the Management, Business, Science and Arts occupations in Blooming Valley borough, the most male-oriented occupations are Computers, Engineering & Science (100.0%), Architecture & Engineering (100.0%), and Life, Physical & Social Science (100.0%), while the most female-oriented occupations are Education, Arts & Media (100.0%), Health Technologists (100.0%), and Health Diagnosing & Treating (88.9%).
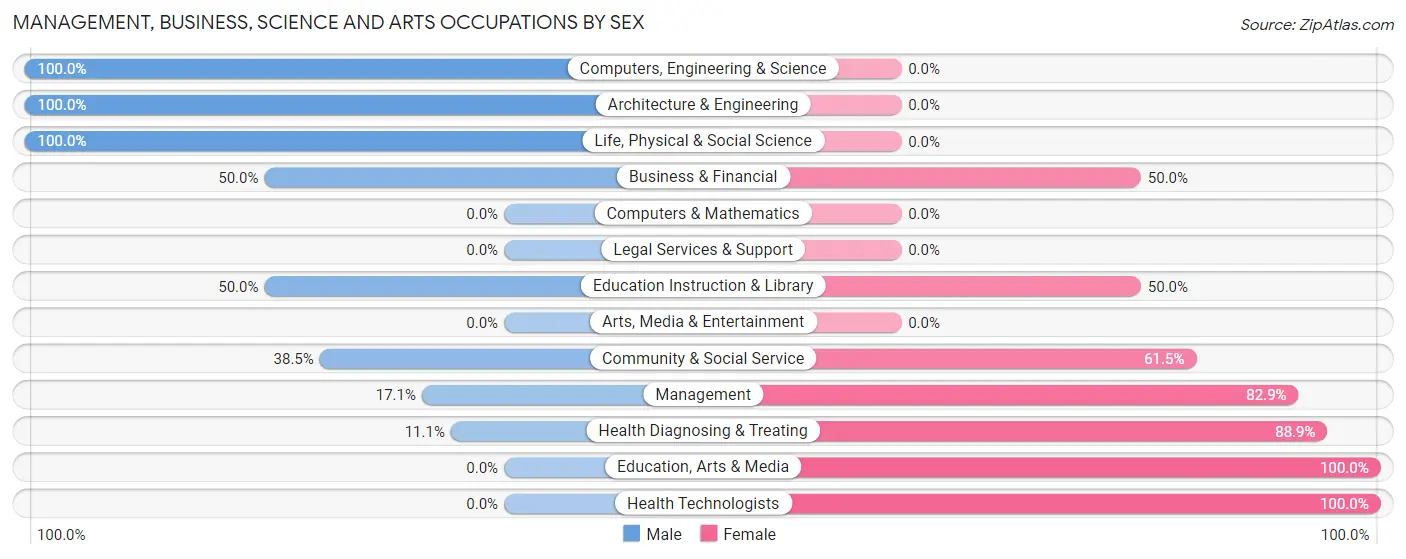
| Occupation | Male | Female |
| Management | 6 (17.1%) | 29 (82.9%) |
| Business & Financial | 1 (50.0%) | 1 (50.0%) |
| Computers, Engineering & Science | 15 (100.0%) | 0 (0.0%) |
| Computers & Mathematics | 0 (0.0%) | 0 (0.0%) |
| Architecture & Engineering | 11 (100.0%) | 0 (0.0%) |
| Life, Physical & Social Science | 4 (100.0%) | 0 (0.0%) |
| Community & Social Service | 5 (38.5%) | 8 (61.5%) |
| Education, Arts & Media | 0 (0.0%) | 3 (100.0%) |
| Legal Services & Support | 0 (0.0%) | 0 (0.0%) |
| Education Instruction & Library | 5 (50.0%) | 5 (50.0%) |
| Arts, Media & Entertainment | 0 (0.0%) | 0 (0.0%) |
| Health Diagnosing & Treating | 1 (11.1%) | 8 (88.9%) |
| Health Technologists | 0 (0.0%) | 8 (100.0%) |
| Total (Category) | 28 (37.8%) | 46 (62.2%) |
| Total (Overall) | 117 (53.4%) | 102 (46.6%) |
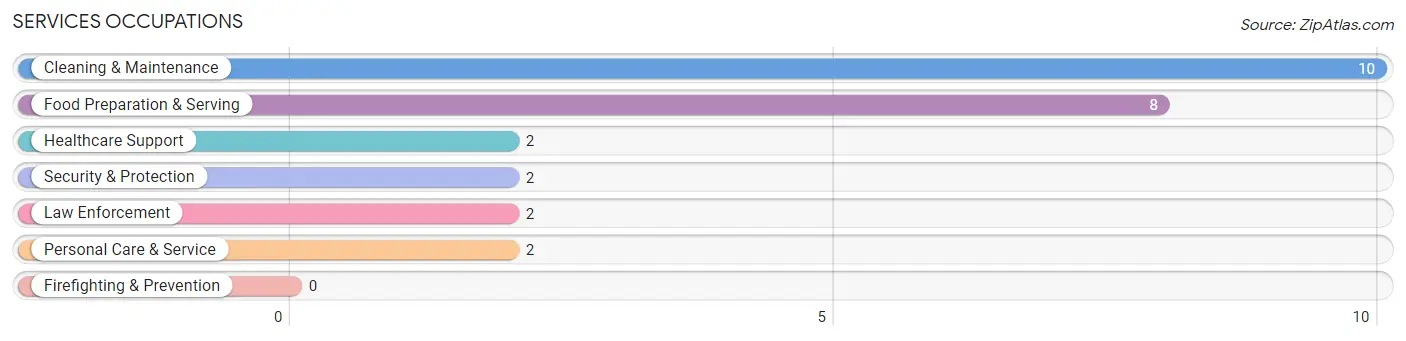
Services Occupations
The most common Services occupations in Blooming Valley borough are Cleaning & Maintenance (10 | 4.6%), Food Preparation & Serving (8 | 3.6%), Healthcare Support (2 | 0.9%), Security & Protection (2 | 0.9%), and Law Enforcement (2 | 0.9%).
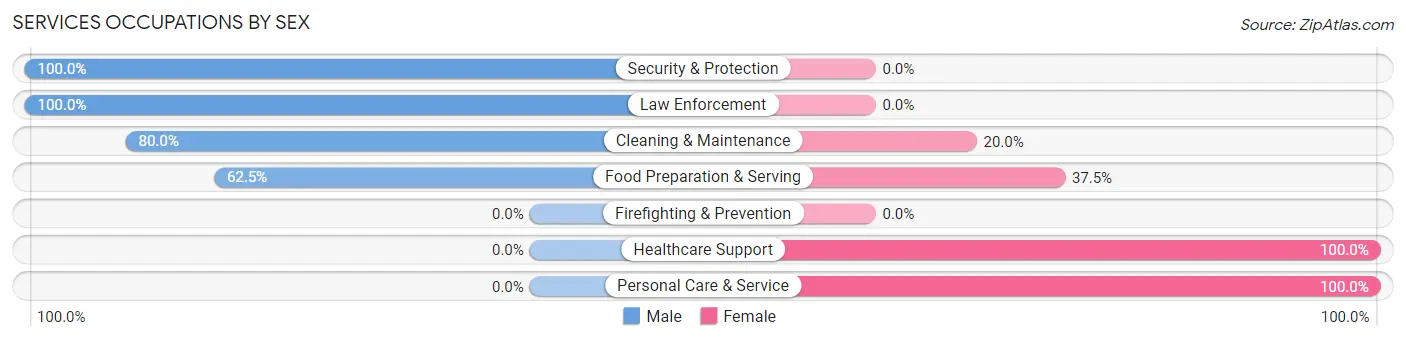
Services Occupations by Sex
Within the Services occupations in Blooming Valley borough, the most male-oriented occupations are Security & Protection (100.0%), Law Enforcement (100.0%), and Cleaning & Maintenance (80.0%), while the most female-oriented occupations are Healthcare Support (100.0%), Personal Care & Service (100.0%), and Food Preparation & Serving (37.5%).
| Occupation | Male | Female |
| Healthcare Support | 0 (0.0%) | 2 (100.0%) |
| Security & Protection | 2 (100.0%) | 0 (0.0%) |
| Firefighting & Prevention | 0 (0.0%) | 0 (0.0%) |
| Law Enforcement | 2 (100.0%) | 0 (0.0%) |
| Food Preparation & Serving | 5 (62.5%) | 3 (37.5%) |
| Cleaning & Maintenance | 8 (80.0%) | 2 (20.0%) |
| Personal Care & Service | 0 (0.0%) | 2 (100.0%) |
| Total (Category) | 15 (62.5%) | 9 (37.5%) |
| Total (Overall) | 117 (53.4%) | 102 (46.6%) |
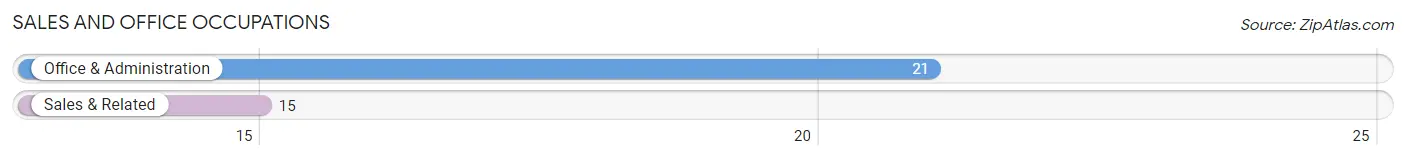
Sales and Office Occupations
The most common Sales and Office occupations in Blooming Valley borough are Office & Administration (21 | 9.6%), and Sales & Related (15 | 6.9%).
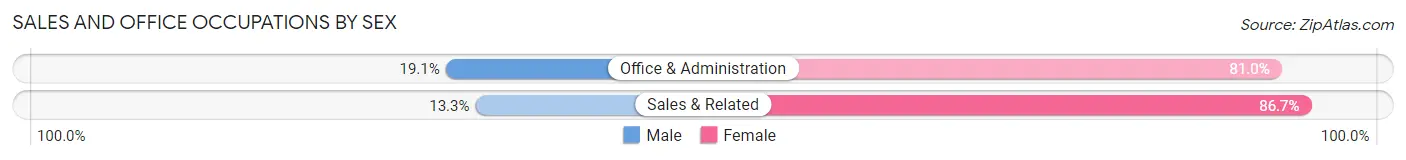
Sales and Office Occupations by Sex
| Occupation | Male | Female |
| Sales & Related | 2 (13.3%) | 13 (86.7%) |
| Office & Administration | 4 (19.1%) | 17 (80.9%) |
| Total (Category) | 6 (16.7%) | 30 (83.3%) |
| Total (Overall) | 117 (53.4%) | 102 (46.6%) |
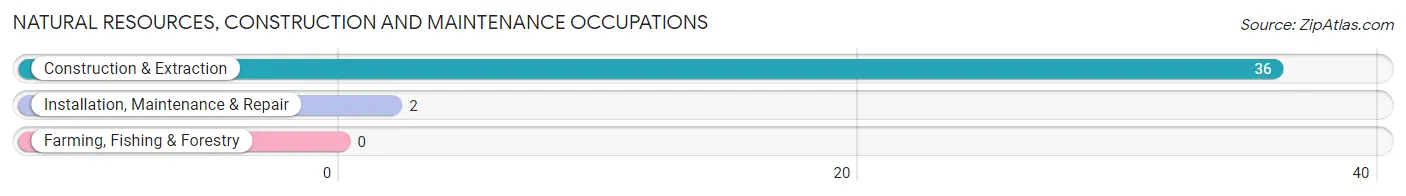
Natural Resources, Construction and Maintenance Occupations
The most common Natural Resources, Construction and Maintenance occupations in Blooming Valley borough are Construction & Extraction (36 | 16.4%), and Installation, Maintenance & Repair (2 | 0.9%).
Natural Resources, Construction and Maintenance Occupations by Sex
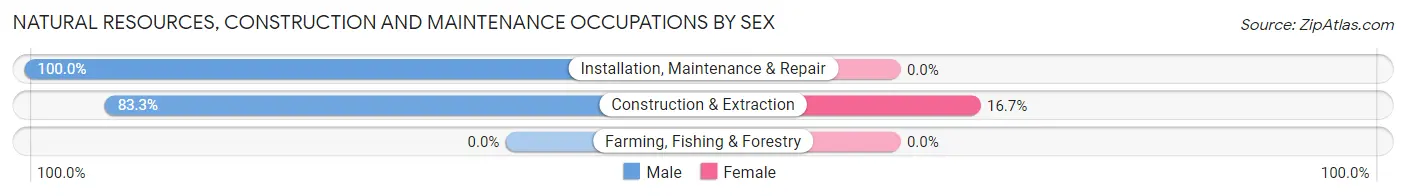
| Occupation | Male | Female |
| Farming, Fishing & Forestry | 0 (0.0%) | 0 (0.0%) |
| Construction & Extraction | 30 (83.3%) | 6 (16.7%) |
| Installation, Maintenance & Repair | 2 (100.0%) | 0 (0.0%) |
| Total (Category) | 32 (84.2%) | 6 (15.8%) |
| Total (Overall) | 117 (53.4%) | 102 (46.6%) |
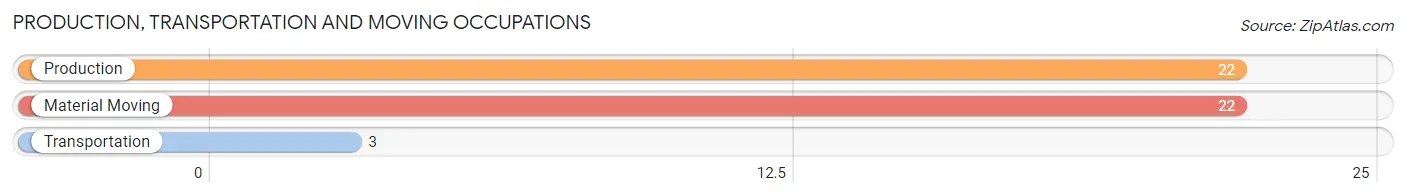
Production, Transportation and Moving Occupations
The most common Production, Transportation and Moving occupations in Blooming Valley borough are Production (22 | 10.1%), Material Moving (22 | 10.1%), and Transportation (3 | 1.4%).
Production, Transportation and Moving Occupations by Sex
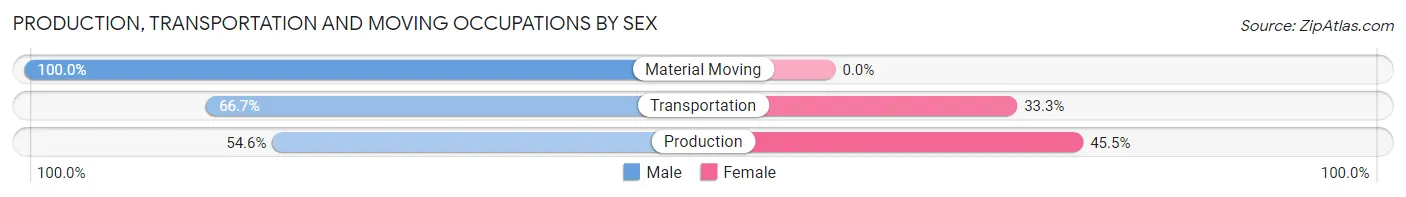
| Occupation | Male | Female |
| Production | 12 (54.5%) | 10 (45.5%) |
| Transportation | 2 (66.7%) | 1 (33.3%) |
| Material Moving | 22 (100.0%) | 0 (0.0%) |
| Total (Category) | 36 (76.6%) | 11 (23.4%) |
| Total (Overall) | 117 (53.4%) | 102 (46.6%) |
Employment Industries by Sex in Blooming Valley borough
Employment Industries in Blooming Valley borough
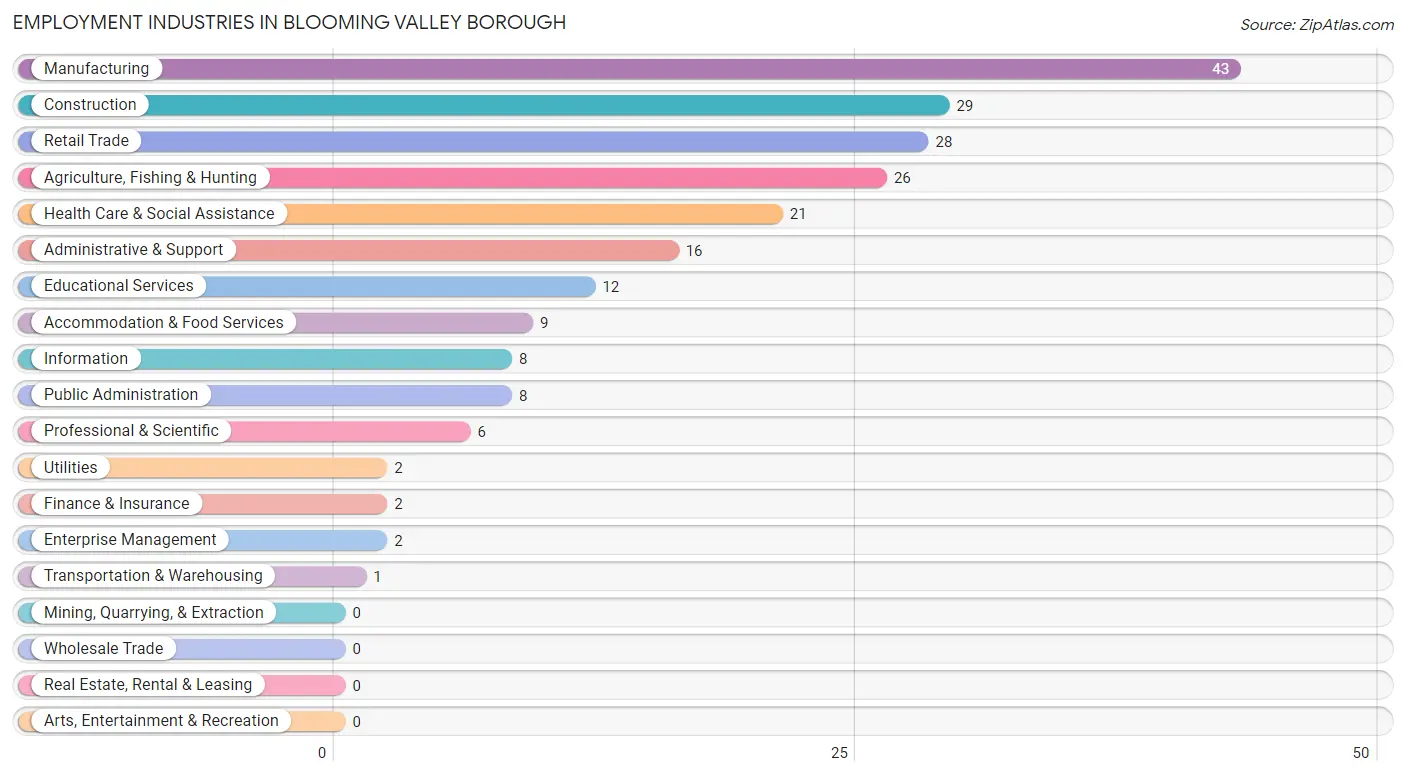
The major employment industries in Blooming Valley borough include Manufacturing (43 | 19.6%), Construction (29 | 13.2%), Retail Trade (28 | 12.8%), Agriculture, Fishing & Hunting (26 | 11.9%), and Health Care & Social Assistance (21 | 9.6%).
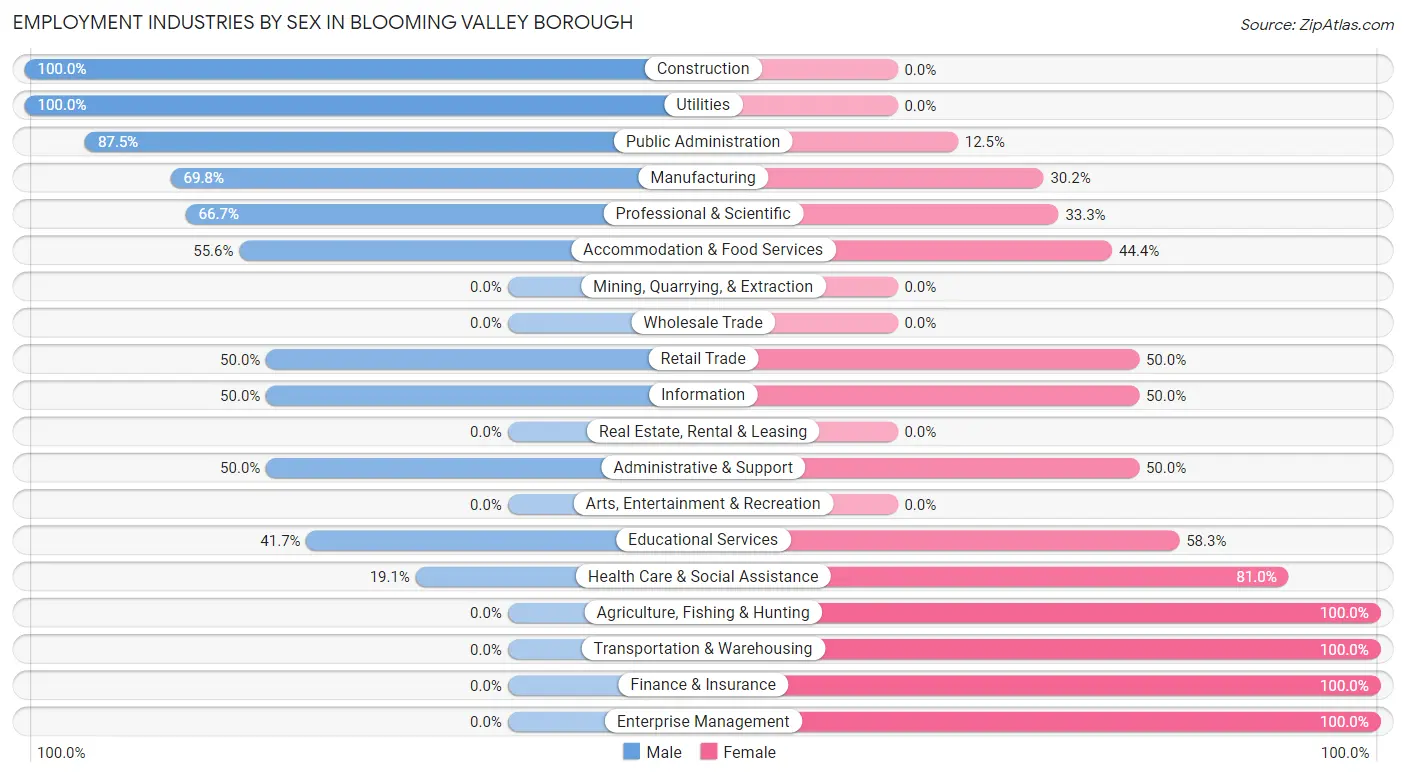
Employment Industries by Sex in Blooming Valley borough
The Blooming Valley borough industries that see more men than women are Construction (100.0%), Utilities (100.0%), and Public Administration (87.5%), whereas the industries that tend to have a higher number of women are Agriculture, Fishing & Hunting (100.0%), Transportation & Warehousing (100.0%), and Finance & Insurance (100.0%).
| Industry | Male | Female |
| Agriculture, Fishing & Hunting | 0 (0.0%) | 26 (100.0%) |
| Mining, Quarrying, & Extraction | 0 (0.0%) | 0 (0.0%) |
| Construction | 29 (100.0%) | 0 (0.0%) |
| Manufacturing | 30 (69.8%) | 13 (30.2%) |
| Wholesale Trade | 0 (0.0%) | 0 (0.0%) |
| Retail Trade | 14 (50.0%) | 14 (50.0%) |
| Transportation & Warehousing | 0 (0.0%) | 1 (100.0%) |
| Utilities | 2 (100.0%) | 0 (0.0%) |
| Information | 4 (50.0%) | 4 (50.0%) |
| Finance & Insurance | 0 (0.0%) | 2 (100.0%) |
| Real Estate, Rental & Leasing | 0 (0.0%) | 0 (0.0%) |
| Professional & Scientific | 4 (66.7%) | 2 (33.3%) |
| Enterprise Management | 0 (0.0%) | 2 (100.0%) |
| Administrative & Support | 8 (50.0%) | 8 (50.0%) |
| Educational Services | 5 (41.7%) | 7 (58.3%) |
| Health Care & Social Assistance | 4 (19.1%) | 17 (80.9%) |
| Arts, Entertainment & Recreation | 0 (0.0%) | 0 (0.0%) |
| Accommodation & Food Services | 5 (55.6%) | 4 (44.4%) |
| Public Administration | 7 (87.5%) | 1 (12.5%) |
| Total | 117 (53.4%) | 102 (46.6%) |
Education in Blooming Valley borough
School Enrollment in Blooming Valley borough
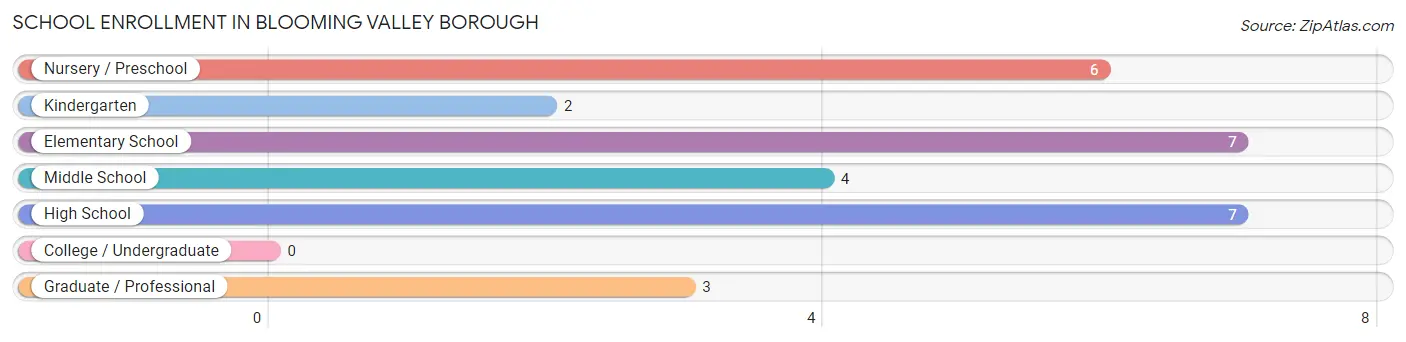
The most common levels of schooling among the 29 students in Blooming Valley borough are elementary school (7 | 24.1%), high school (7 | 24.1%), and nursery / preschool (6 | 20.7%).
| School Level | # Students | % Students |
| Nursery / Preschool | 6 | 20.7% |
| Kindergarten | 2 | 6.9% |
| Elementary School | 7 | 24.1% |
| Middle School | 4 | 13.8% |
| High School | 7 | 24.1% |
| College / Undergraduate | 0 | 0.0% |
| Graduate / Professional | 3 | 10.3% |
| Total | 29 | 100.0% |
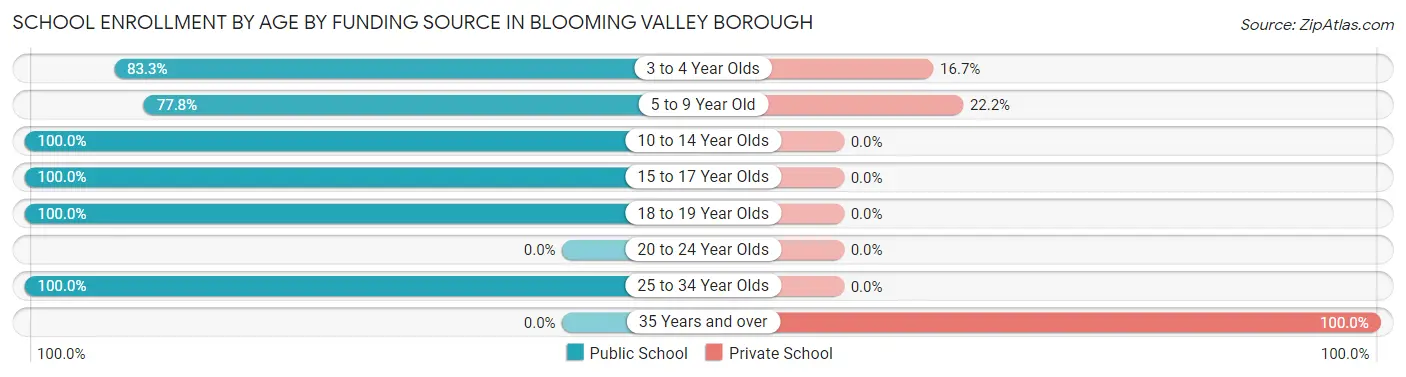
School Enrollment by Age by Funding Source in Blooming Valley borough
Out of a total of 29 students who are enrolled in schools in Blooming Valley borough, 5 (17.2%) attend a private institution, while the remaining 24 (82.8%) are enrolled in public schools. The age group of 35 years and over has the highest likelihood of being enrolled in private schools, with 2 (100.0% in the age bracket) enrolled. Conversely, the age group of 10 to 14 year olds has the lowest likelihood of being enrolled in a private school, with 3 (100.0% in the age bracket) attending a public institution.
| Age Bracket | Public School | Private School |
| 3 to 4 Year Olds | 5 (83.3%) | 1 (16.7%) |
| 5 to 9 Year Old | 7 (77.8%) | 2 (22.2%) |
| 10 to 14 Year Olds | 3 (100.0%) | 0 (0.0%) |
| 15 to 17 Year Olds | 6 (100.0%) | 0 (0.0%) |
| 18 to 19 Year Olds | 2 (100.0%) | 0 (0.0%) |
| 20 to 24 Year Olds | 0 (0.0%) | 0 (0.0%) |
| 25 to 34 Year Olds | 1 (100.0%) | 0 (0.0%) |
| 35 Years and over | 0 (0.0%) | 2 (100.0%) |
| Total | 24 (82.8%) | 5 (17.2%) |
Educational Attainment by Field of Study in Blooming Valley borough
Education (11 | 27.5%), science & technology (10 | 25.0%), business (6 | 15.0%), bio, nature & agricultural (5 | 12.5%), and psychology (3 | 7.5%) are the most common fields of study among 40 individuals in Blooming Valley borough who have obtained a bachelor's degree or higher.
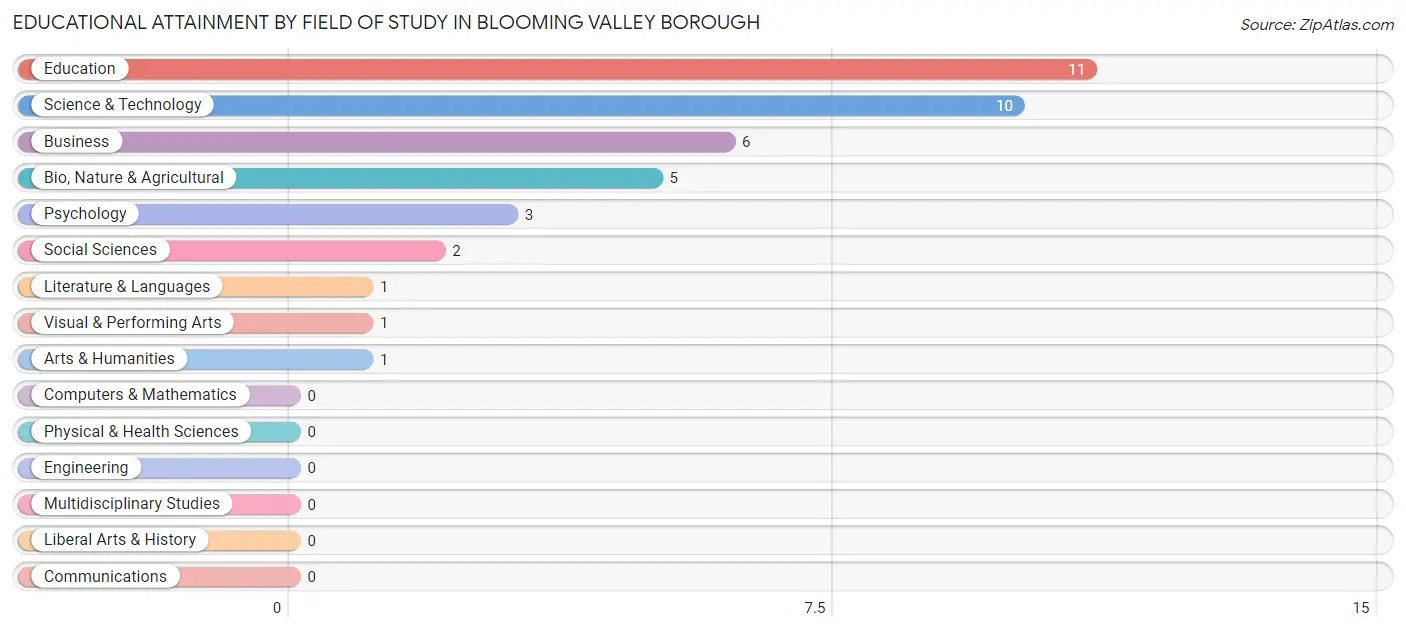
| Field of Study | # Graduates | % Graduates |
| Computers & Mathematics | 0 | 0.0% |
| Bio, Nature & Agricultural | 5 | 12.5% |
| Physical & Health Sciences | 0 | 0.0% |
| Psychology | 3 | 7.5% |
| Social Sciences | 2 | 5.0% |
| Engineering | 0 | 0.0% |
| Multidisciplinary Studies | 0 | 0.0% |
| Science & Technology | 10 | 25.0% |
| Business | 6 | 15.0% |
| Education | 11 | 27.5% |
| Literature & Languages | 1 | 2.5% |
| Liberal Arts & History | 0 | 0.0% |
| Visual & Performing Arts | 1 | 2.5% |
| Communications | 0 | 0.0% |
| Arts & Humanities | 1 | 2.5% |
| Total | 40 | 100.0% |
Transportation & Commute in Blooming Valley borough
Vehicle Availability by Sex in Blooming Valley borough
The most prevalent vehicle ownership categories in Blooming Valley borough are males with 2 vehicles (40, accounting for 34.5%) and females with 2 vehicles (35, making up 41.2%).
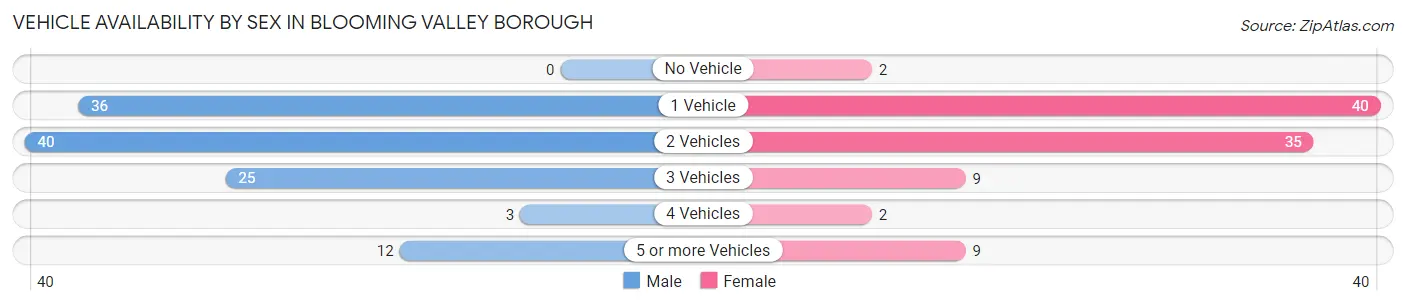
| Vehicles Available | Male | Female |
| No Vehicle | 0 (0.0%) | 2 (2.1%) |
| 1 Vehicle | 36 (31.0%) | 40 (41.2%) |
| 2 Vehicles | 40 (34.5%) | 35 (36.1%) |
| 3 Vehicles | 25 (21.5%) | 9 (9.3%) |
| 4 Vehicles | 3 (2.6%) | 2 (2.1%) |
| 5 or more Vehicles | 12 (10.3%) | 9 (9.3%) |
| Total | 116 (100.0%) | 97 (100.0%) |
Commute Time in Blooming Valley borough
The most frequently occuring commute durations in Blooming Valley borough are less than 5 minutes (39 commuters, 21.0%), 15 to 19 minutes (33 commuters, 17.7%), and 20 to 24 minutes (32 commuters, 17.2%).
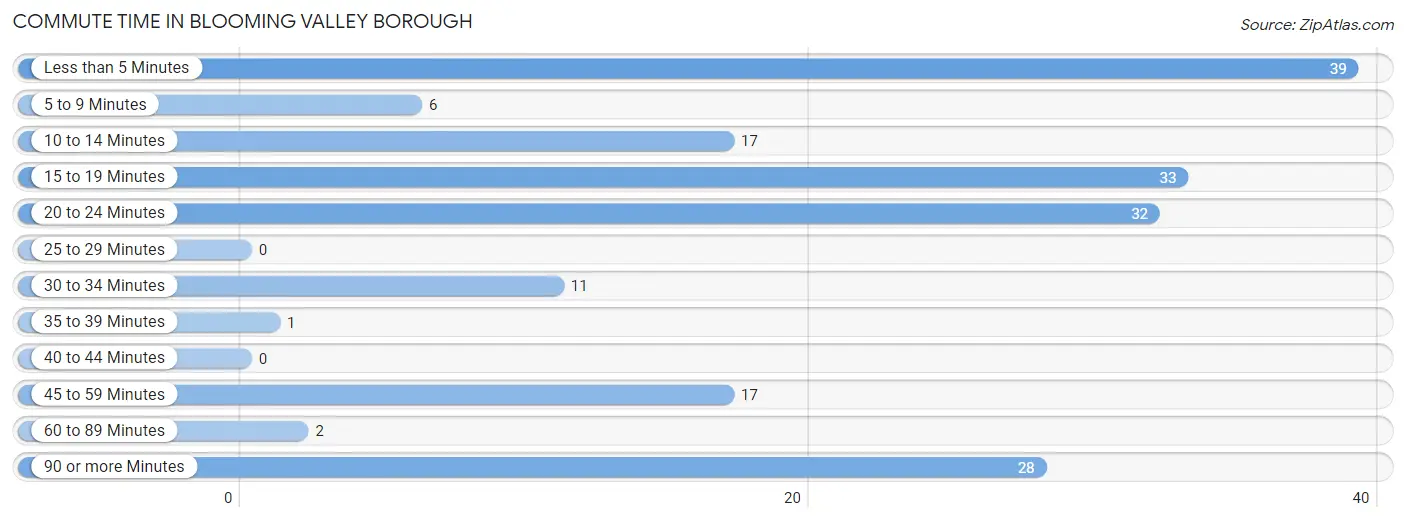
| Commute Time | # Commuters | % Commuters |
| Less than 5 Minutes | 39 | 21.0% |
| 5 to 9 Minutes | 6 | 3.2% |
| 10 to 14 Minutes | 17 | 9.1% |
| 15 to 19 Minutes | 33 | 17.7% |
| 20 to 24 Minutes | 32 | 17.2% |
| 25 to 29 Minutes | 0 | 0.0% |
| 30 to 34 Minutes | 11 | 5.9% |
| 35 to 39 Minutes | 1 | 0.5% |
| 40 to 44 Minutes | 0 | 0.0% |
| 45 to 59 Minutes | 17 | 9.1% |
| 60 to 89 Minutes | 2 | 1.1% |
| 90 or more Minutes | 28 | 15.0% |
Commute Time by Sex in Blooming Valley borough
The most common commute times in Blooming Valley borough are 90 or more minutes (27 commuters, 28.7%) for males and less than 5 minutes (38 commuters, 41.3%) for females.
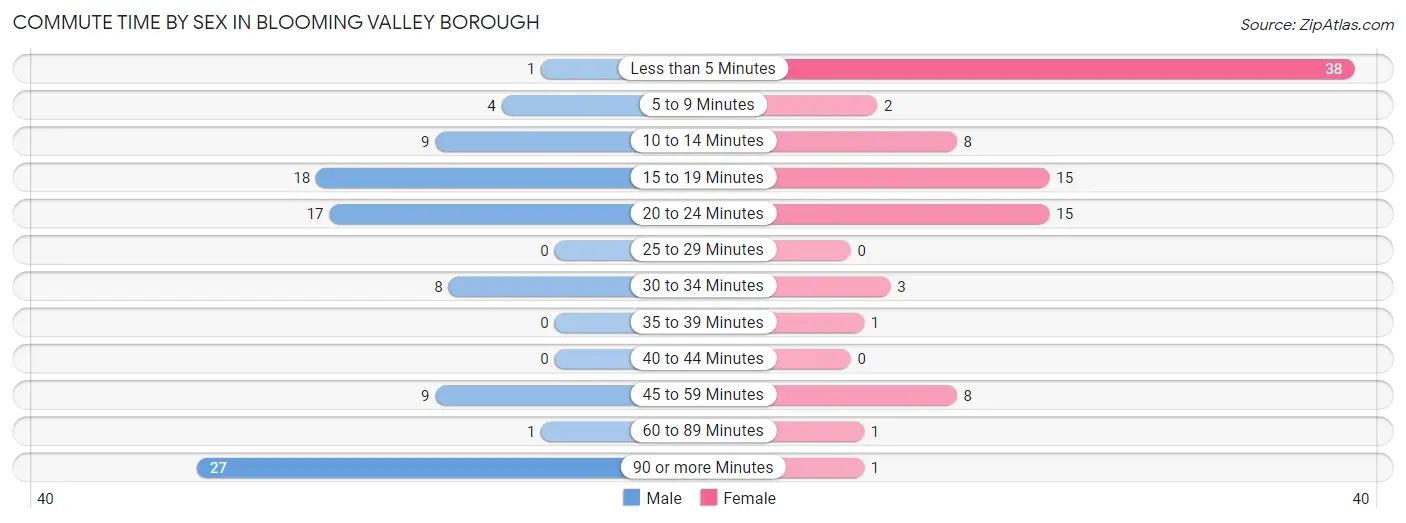
| Commute Time | Male | Female |
| Less than 5 Minutes | 1 (1.1%) | 38 (41.3%) |
| 5 to 9 Minutes | 4 (4.3%) | 2 (2.2%) |
| 10 to 14 Minutes | 9 (9.6%) | 8 (8.7%) |
| 15 to 19 Minutes | 18 (19.2%) | 15 (16.3%) |
| 20 to 24 Minutes | 17 (18.1%) | 15 (16.3%) |
| 25 to 29 Minutes | 0 (0.0%) | 0 (0.0%) |
| 30 to 34 Minutes | 8 (8.5%) | 3 (3.3%) |
| 35 to 39 Minutes | 0 (0.0%) | 1 (1.1%) |
| 40 to 44 Minutes | 0 (0.0%) | 0 (0.0%) |
| 45 to 59 Minutes | 9 (9.6%) | 8 (8.7%) |
| 60 to 89 Minutes | 1 (1.1%) | 1 (1.1%) |
| 90 or more Minutes | 27 (28.7%) | 1 (1.1%) |
Time of Departure to Work by Sex in Blooming Valley borough
The most frequent times of departure to work in Blooming Valley borough are 4:00 PM to 11:59 PM (31, 33.0%) for males and 8:00 AM to 8:29 AM (47, 51.1%) for females.
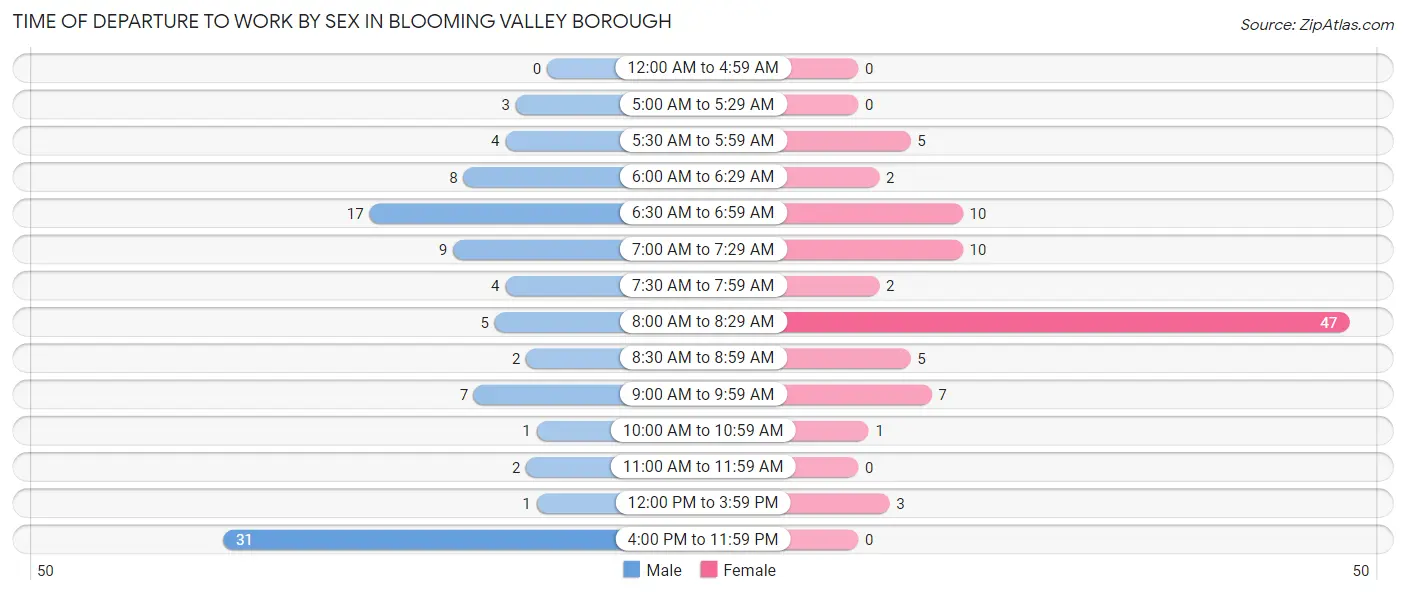
| Time of Departure | Male | Female |
| 12:00 AM to 4:59 AM | 0 (0.0%) | 0 (0.0%) |
| 5:00 AM to 5:29 AM | 3 (3.2%) | 0 (0.0%) |
| 5:30 AM to 5:59 AM | 4 (4.3%) | 5 (5.4%) |
| 6:00 AM to 6:29 AM | 8 (8.5%) | 2 (2.2%) |
| 6:30 AM to 6:59 AM | 17 (18.1%) | 10 (10.9%) |
| 7:00 AM to 7:29 AM | 9 (9.6%) | 10 (10.9%) |
| 7:30 AM to 7:59 AM | 4 (4.3%) | 2 (2.2%) |
| 8:00 AM to 8:29 AM | 5 (5.3%) | 47 (51.1%) |
| 8:30 AM to 8:59 AM | 2 (2.1%) | 5 (5.4%) |
| 9:00 AM to 9:59 AM | 7 (7.4%) | 7 (7.6%) |
| 10:00 AM to 10:59 AM | 1 (1.1%) | 1 (1.1%) |
| 11:00 AM to 11:59 AM | 2 (2.1%) | 0 (0.0%) |
| 12:00 PM to 3:59 PM | 1 (1.1%) | 3 (3.3%) |
| 4:00 PM to 11:59 PM | 31 (33.0%) | 0 (0.0%) |
| Total | 94 (100.0%) | 92 (100.0%) |
Housing Occupancy in Blooming Valley borough
Occupancy by Ownership in Blooming Valley borough
Of the total 166 dwellings in Blooming Valley borough, owner-occupied units account for 139 (83.7%), while renter-occupied units make up 27 (16.3%).
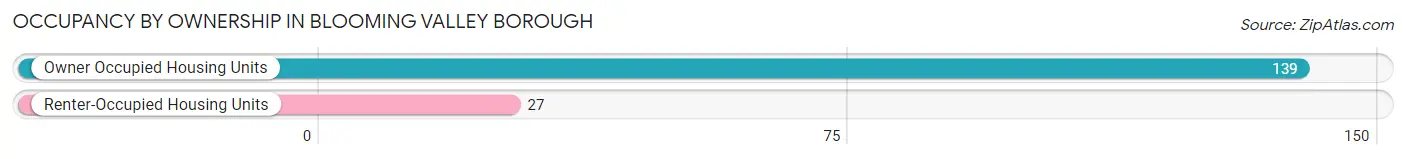
| Occupancy | # Housing Units | % Housing Units |
| Owner Occupied Housing Units | 139 | 83.7% |
| Renter-Occupied Housing Units | 27 | 16.3% |
| Total Occupied Housing Units | 166 | 100.0% |
Occupancy by Household Size in Blooming Valley borough
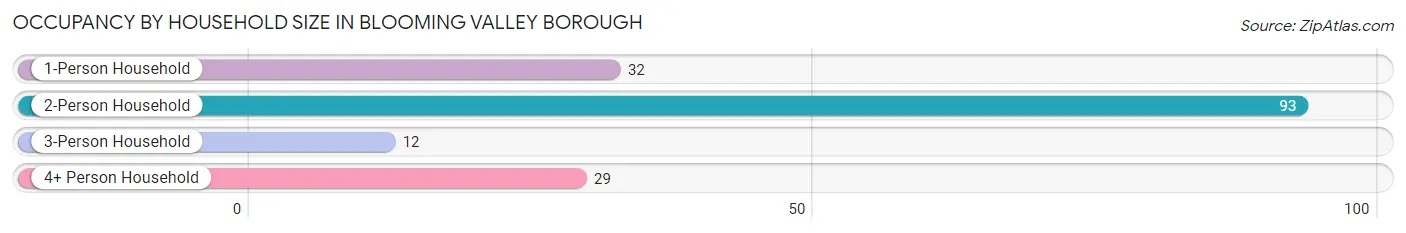
| Household Size | # Housing Units | % Housing Units |
| 1-Person Household | 32 | 19.3% |
| 2-Person Household | 93 | 56.0% |
| 3-Person Household | 12 | 7.2% |
| 4+ Person Household | 29 | 17.5% |
| Total Housing Units | 166 | 100.0% |
Occupancy by Ownership by Household Size in Blooming Valley borough
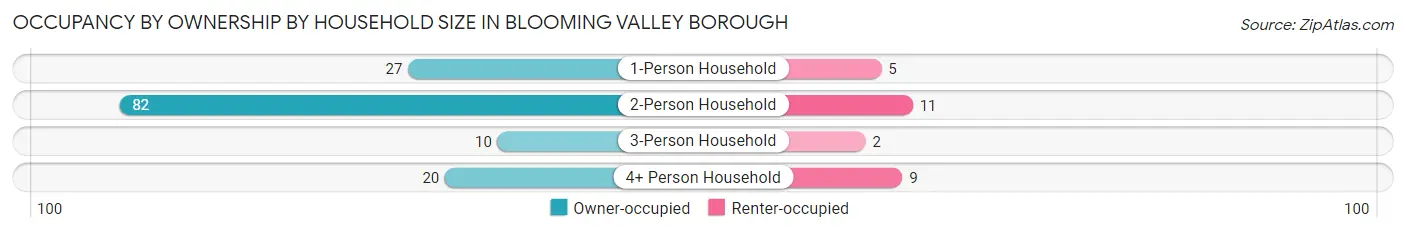
| Household Size | Owner-occupied | Renter-occupied |
| 1-Person Household | 27 (84.4%) | 5 (15.6%) |
| 2-Person Household | 82 (88.2%) | 11 (11.8%) |
| 3-Person Household | 10 (83.3%) | 2 (16.7%) |
| 4+ Person Household | 20 (69.0%) | 9 (31.0%) |
| Total Housing Units | 139 (83.7%) | 27 (16.3%) |
Occupancy by Educational Attainment in Blooming Valley borough
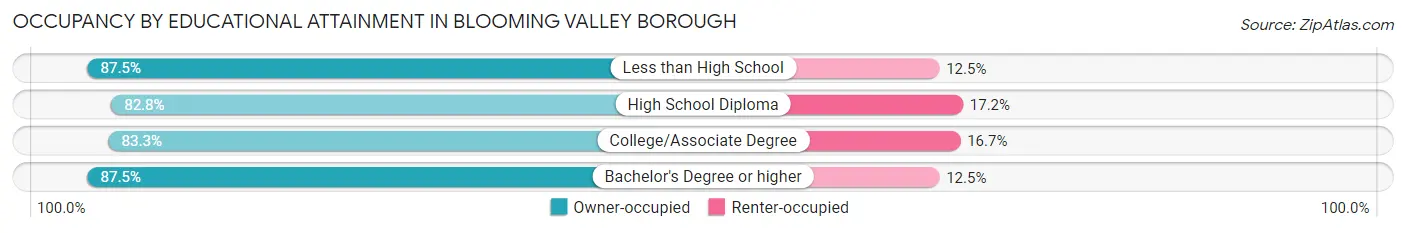
| Household Size | Owner-occupied | Renter-occupied |
| Less than High School | 7 (87.5%) | 1 (12.5%) |
| High School Diploma | 53 (82.8%) | 11 (17.2%) |
| College/Associate Degree | 65 (83.3%) | 13 (16.7%) |
| Bachelor's Degree or higher | 14 (87.5%) | 2 (12.5%) |
Occupancy by Age of Householder in Blooming Valley borough
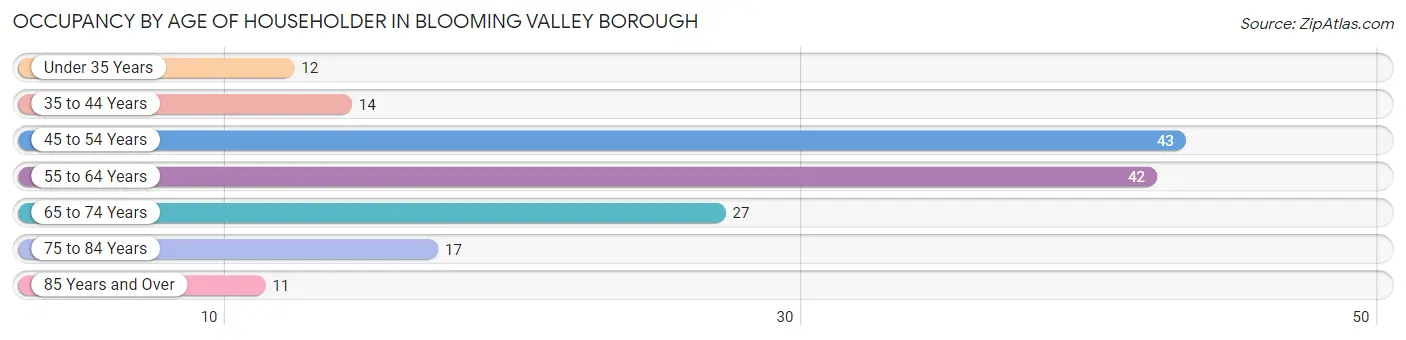
| Age Bracket | # Households | % Households |
| Under 35 Years | 12 | 7.2% |
| 35 to 44 Years | 14 | 8.4% |
| 45 to 54 Years | 43 | 25.9% |
| 55 to 64 Years | 42 | 25.3% |
| 65 to 74 Years | 27 | 16.3% |
| 75 to 84 Years | 17 | 10.2% |
| 85 Years and Over | 11 | 6.6% |
| Total | 166 | 100.0% |
Housing Finances in Blooming Valley borough
Median Income by Occupancy in Blooming Valley borough
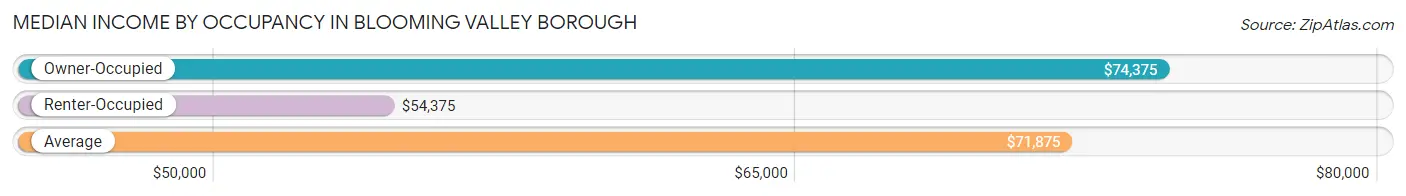
| Occupancy Type | # Households | Median Income |
| Owner-Occupied | 139 (83.7%) | $74,375 |
| Renter-Occupied | 27 (16.3%) | $54,375 |
| Average | 166 (100.0%) | $71,875 |
Occupancy by Householder Income Bracket in Blooming Valley borough
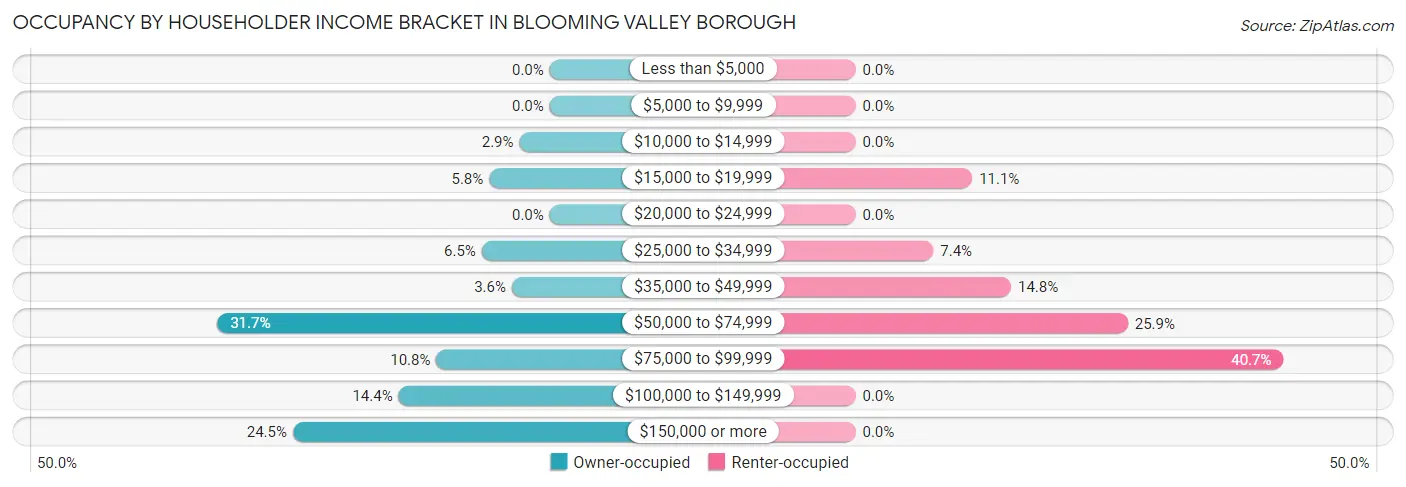
| Income Bracket | Owner-occupied | Renter-occupied |
| Less than $5,000 | 0 (0.0%) | 0 (0.0%) |
| $5,000 to $9,999 | 0 (0.0%) | 0 (0.0%) |
| $10,000 to $14,999 | 4 (2.9%) | 0 (0.0%) |
| $15,000 to $19,999 | 8 (5.8%) | 3 (11.1%) |
| $20,000 to $24,999 | 0 (0.0%) | 0 (0.0%) |
| $25,000 to $34,999 | 9 (6.5%) | 2 (7.4%) |
| $35,000 to $49,999 | 5 (3.6%) | 4 (14.8%) |
| $50,000 to $74,999 | 44 (31.7%) | 7 (25.9%) |
| $75,000 to $99,999 | 15 (10.8%) | 11 (40.7%) |
| $100,000 to $149,999 | 20 (14.4%) | 0 (0.0%) |
| $150,000 or more | 34 (24.5%) | 0 (0.0%) |
| Total | 139 (100.0%) | 27 (100.0%) |
Monthly Housing Cost Tiers in Blooming Valley borough
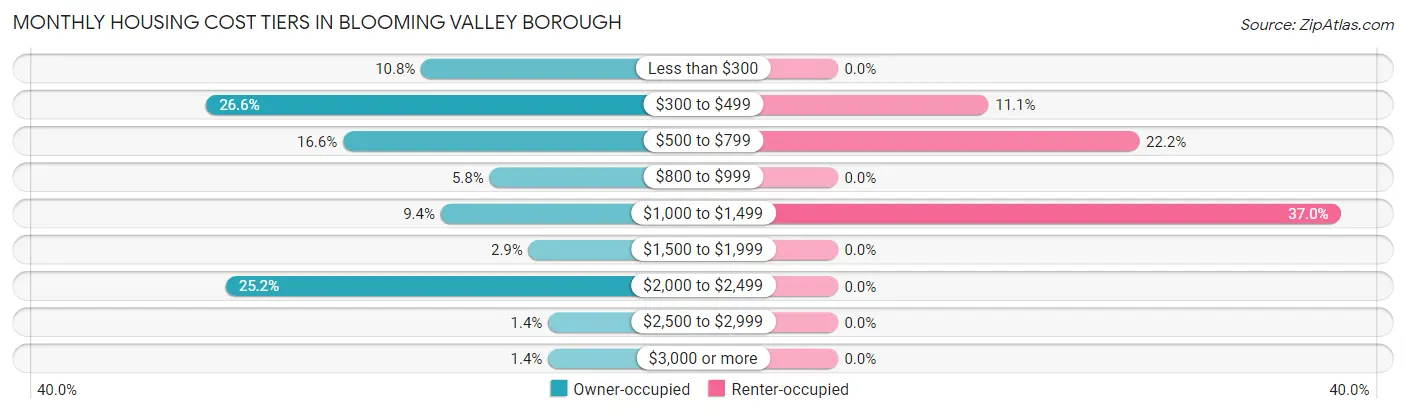
| Monthly Cost | Owner-occupied | Renter-occupied |
| Less than $300 | 15 (10.8%) | 0 (0.0%) |
| $300 to $499 | 37 (26.6%) | 3 (11.1%) |
| $500 to $799 | 23 (16.6%) | 6 (22.2%) |
| $800 to $999 | 8 (5.8%) | 0 (0.0%) |
| $1,000 to $1,499 | 13 (9.3%) | 10 (37.0%) |
| $1,500 to $1,999 | 4 (2.9%) | 0 (0.0%) |
| $2,000 to $2,499 | 35 (25.2%) | 0 (0.0%) |
| $2,500 to $2,999 | 2 (1.4%) | 0 (0.0%) |
| $3,000 or more | 2 (1.4%) | 0 (0.0%) |
| Total | 139 (100.0%) | 27 (100.0%) |
Physical Housing Characteristics in Blooming Valley borough
Housing Structures in Blooming Valley borough
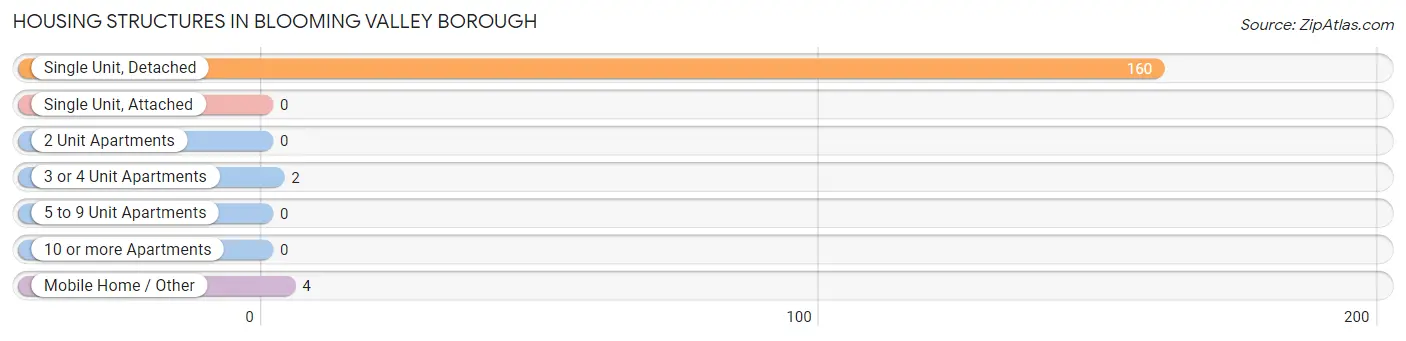
| Structure Type | # Housing Units | % Housing Units |
| Single Unit, Detached | 160 | 96.4% |
| Single Unit, Attached | 0 | 0.0% |
| 2 Unit Apartments | 0 | 0.0% |
| 3 or 4 Unit Apartments | 2 | 1.2% |
| 5 to 9 Unit Apartments | 0 | 0.0% |
| 10 or more Apartments | 0 | 0.0% |
| Mobile Home / Other | 4 | 2.4% |
| Total | 166 | 100.0% |
Housing Structures by Occupancy in Blooming Valley borough
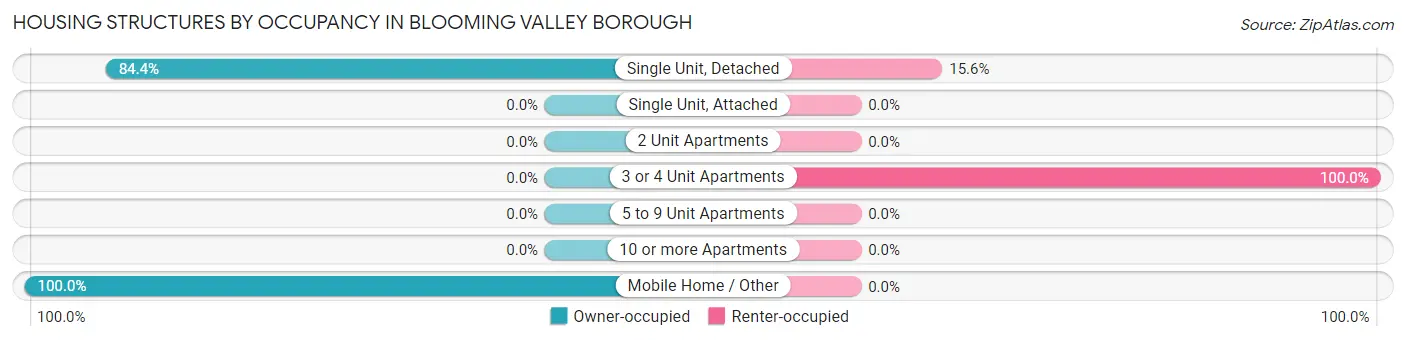
| Structure Type | Owner-occupied | Renter-occupied |
| Single Unit, Detached | 135 (84.4%) | 25 (15.6%) |
| Single Unit, Attached | 0 (0.0%) | 0 (0.0%) |
| 2 Unit Apartments | 0 (0.0%) | 0 (0.0%) |
| 3 or 4 Unit Apartments | 0 (0.0%) | 2 (100.0%) |
| 5 to 9 Unit Apartments | 0 (0.0%) | 0 (0.0%) |
| 10 or more Apartments | 0 (0.0%) | 0 (0.0%) |
| Mobile Home / Other | 4 (100.0%) | 0 (0.0%) |
| Total | 139 (83.7%) | 27 (16.3%) |
Housing Structures by Number of Rooms in Blooming Valley borough
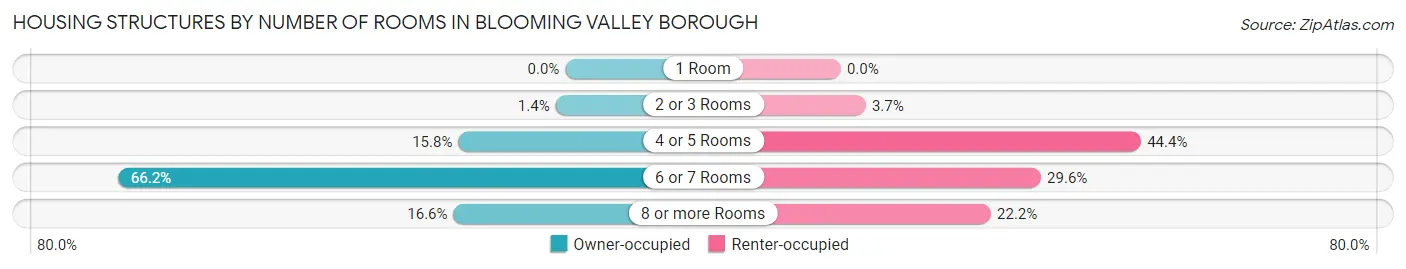
| Number of Rooms | Owner-occupied | Renter-occupied |
| 1 Room | 0 (0.0%) | 0 (0.0%) |
| 2 or 3 Rooms | 2 (1.4%) | 1 (3.7%) |
| 4 or 5 Rooms | 22 (15.8%) | 12 (44.4%) |
| 6 or 7 Rooms | 92 (66.2%) | 8 (29.6%) |
| 8 or more Rooms | 23 (16.6%) | 6 (22.2%) |
| Total | 139 (100.0%) | 27 (100.0%) |
Housing Structure by Heating Type in Blooming Valley borough
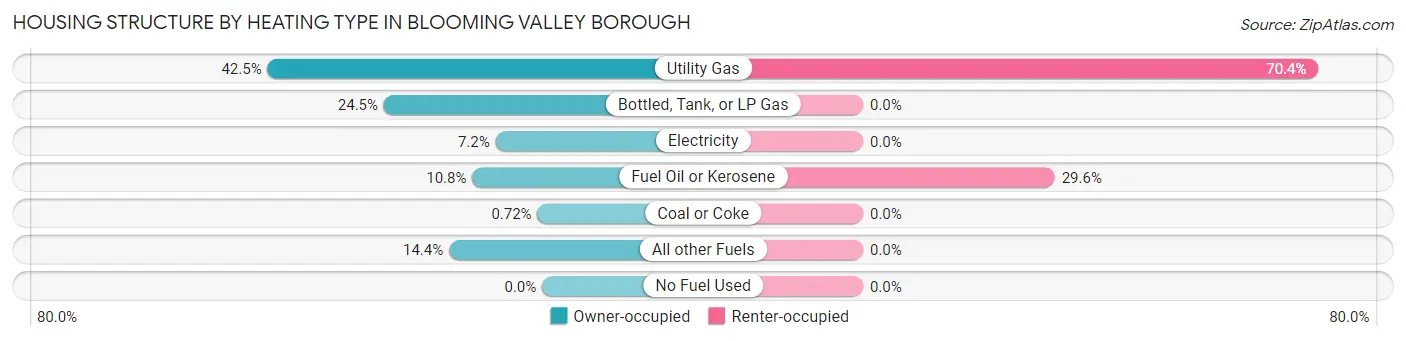
| Heating Type | Owner-occupied | Renter-occupied |
| Utility Gas | 59 (42.4%) | 19 (70.4%) |
| Bottled, Tank, or LP Gas | 34 (24.5%) | 0 (0.0%) |
| Electricity | 10 (7.2%) | 0 (0.0%) |
| Fuel Oil or Kerosene | 15 (10.8%) | 8 (29.6%) |
| Coal or Coke | 1 (0.7%) | 0 (0.0%) |
| All other Fuels | 20 (14.4%) | 0 (0.0%) |
| No Fuel Used | 0 (0.0%) | 0 (0.0%) |
| Total | 139 (100.0%) | 27 (100.0%) |
Household Vehicle Usage in Blooming Valley borough
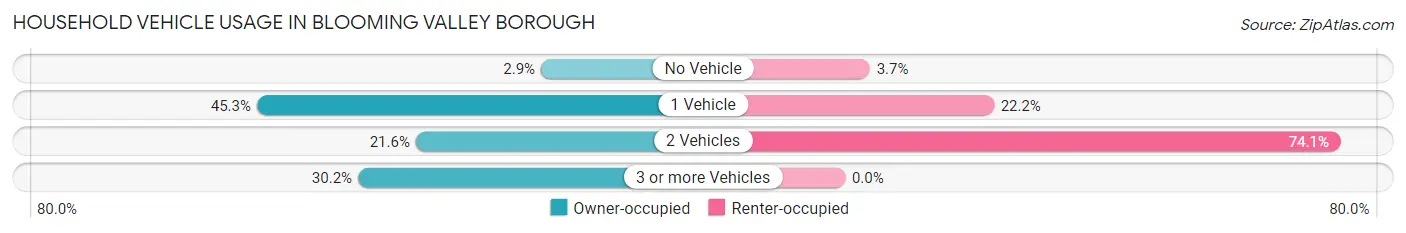
| Vehicles per Household | Owner-occupied | Renter-occupied |
| No Vehicle | 4 (2.9%) | 1 (3.7%) |
| 1 Vehicle | 63 (45.3%) | 6 (22.2%) |
| 2 Vehicles | 30 (21.6%) | 20 (74.1%) |
| 3 or more Vehicles | 42 (30.2%) | 0 (0.0%) |
| Total | 139 (100.0%) | 27 (100.0%) |
Real Estate & Mortgages in Blooming Valley borough
Real Estate and Mortgage Overview in Blooming Valley borough
| Characteristic | Without Mortgage | With Mortgage |
| Housing Units | 59 | 80 |
| Median Property Value | $138,500 | $250,000 |
| Median Household Income | $54,792 | $32 |
| Monthly Housing Costs | $440 | $2 |
| Real Estate Taxes | $1,893 | $0 |
Property Value by Mortgage Status in Blooming Valley borough
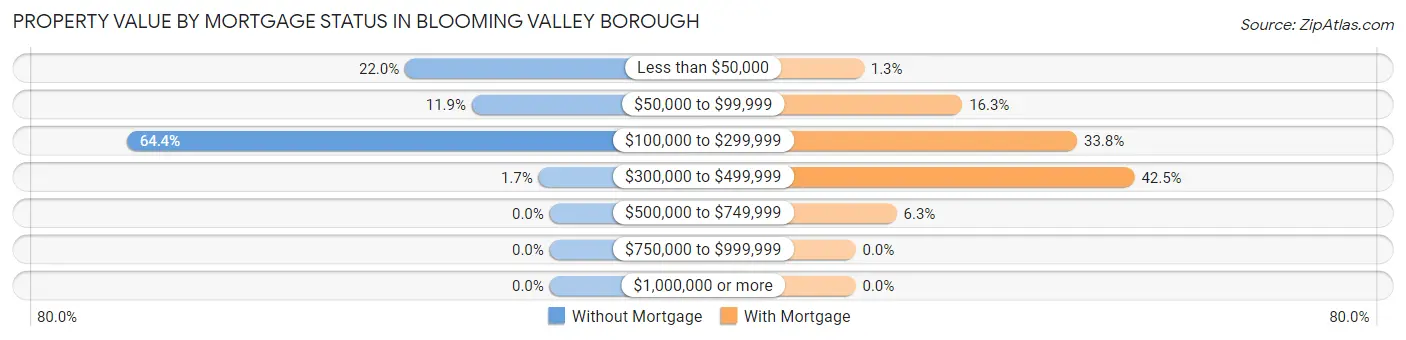
| Property Value | Without Mortgage | With Mortgage |
| Less than $50,000 | 13 (22.0%) | 1 (1.3%) |
| $50,000 to $99,999 | 7 (11.9%) | 13 (16.3%) |
| $100,000 to $299,999 | 38 (64.4%) | 27 (33.8%) |
| $300,000 to $499,999 | 1 (1.7%) | 34 (42.5%) |
| $500,000 to $749,999 | 0 (0.0%) | 5 (6.2%) |
| $750,000 to $999,999 | 0 (0.0%) | 0 (0.0%) |
| $1,000,000 or more | 0 (0.0%) | 0 (0.0%) |
| Total | 59 (100.0%) | 80 (100.0%) |
Household Income by Mortgage Status in Blooming Valley borough
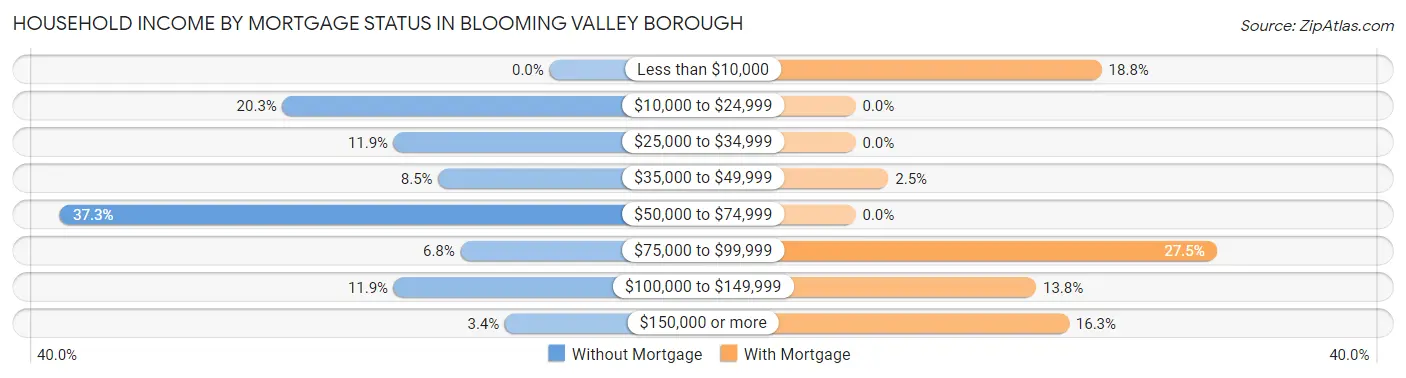
| Household Income | Without Mortgage | With Mortgage |
| Less than $10,000 | 0 (0.0%) | 15 (18.8%) |
| $10,000 to $24,999 | 12 (20.3%) | 0 (0.0%) |
| $25,000 to $34,999 | 7 (11.9%) | 0 (0.0%) |
| $35,000 to $49,999 | 5 (8.5%) | 2 (2.5%) |
| $50,000 to $74,999 | 22 (37.3%) | 0 (0.0%) |
| $75,000 to $99,999 | 4 (6.8%) | 22 (27.5%) |
| $100,000 to $149,999 | 7 (11.9%) | 11 (13.8%) |
| $150,000 or more | 2 (3.4%) | 13 (16.3%) |
| Total | 59 (100.0%) | 80 (100.0%) |
Property Value to Household Income Ratio in Blooming Valley borough
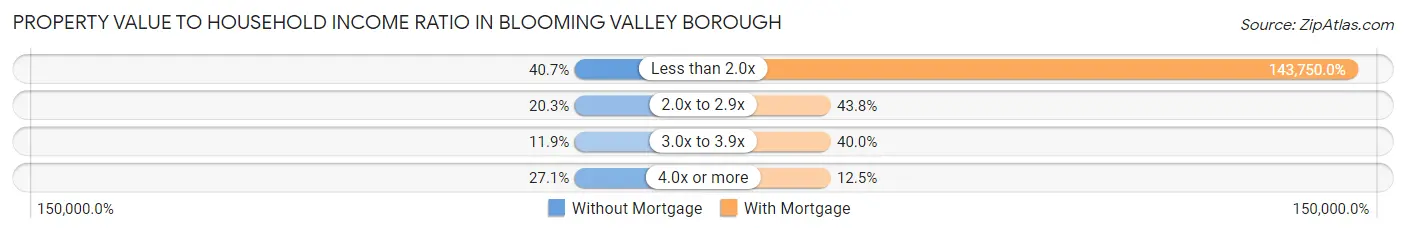
| Value-to-Income Ratio | Without Mortgage | With Mortgage |
| Less than 2.0x | 24 (40.7%) | 115,000 (143,750.0%) |
| 2.0x to 2.9x | 12 (20.3%) | 35 (43.8%) |
| 3.0x to 3.9x | 7 (11.9%) | 32 (40.0%) |
| 4.0x or more | 16 (27.1%) | 10 (12.5%) |
| Total | 59 (100.0%) | 80 (100.0%) |
Real Estate Taxes by Mortgage Status in Blooming Valley borough
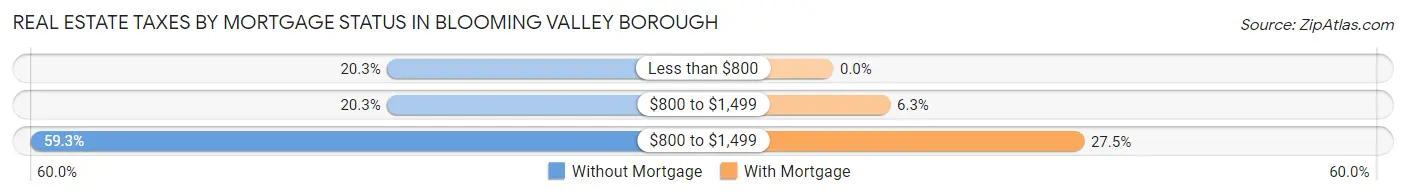
| Property Taxes | Without Mortgage | With Mortgage |
| Less than $800 | 12 (20.3%) | 0 (0.0%) |
| $800 to $1,499 | 12 (20.3%) | 5 (6.2%) |
| $800 to $1,499 | 35 (59.3%) | 22 (27.5%) |
| Total | 59 (100.0%) | 80 (100.0%) |
Health & Disability in Blooming Valley borough
Health Insurance Coverage by Age in Blooming Valley borough
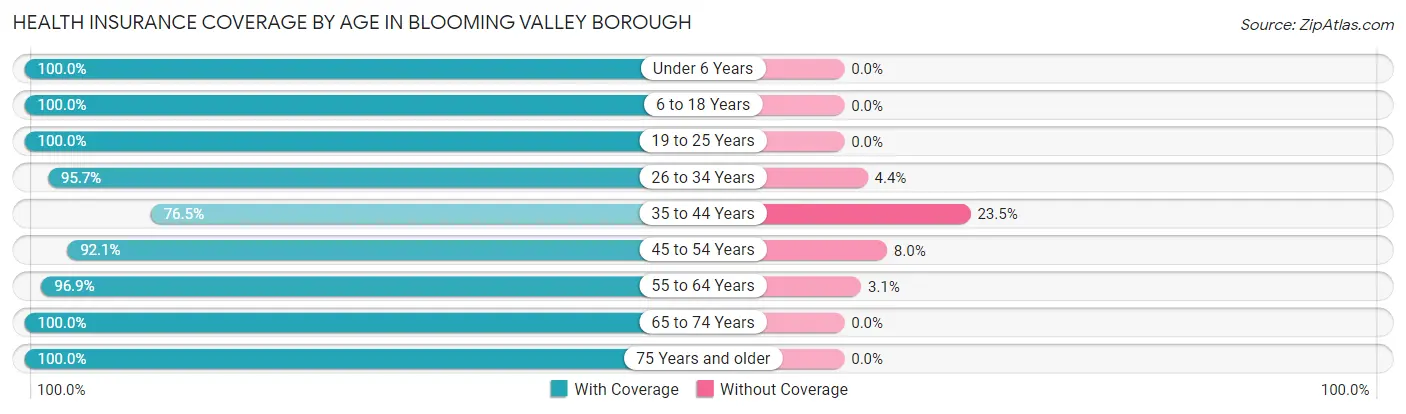
| Age Bracket | With Coverage | Without Coverage |
| Under 6 Years | 24 (100.0%) | 0 (0.0%) |
| 6 to 18 Years | 30 (100.0%) | 0 (0.0%) |
| 19 to 25 Years | 17 (100.0%) | 0 (0.0%) |
| 26 to 34 Years | 22 (95.7%) | 1 (4.3%) |
| 35 to 44 Years | 26 (76.5%) | 8 (23.5%) |
| 45 to 54 Years | 81 (92.0%) | 7 (8.0%) |
| 55 to 64 Years | 62 (96.9%) | 2 (3.1%) |
| 65 to 74 Years | 52 (100.0%) | 0 (0.0%) |
| 75 Years and older | 42 (100.0%) | 0 (0.0%) |
| Total | 356 (95.2%) | 18 (4.8%) |
Health Insurance Coverage by Citizenship Status in Blooming Valley borough
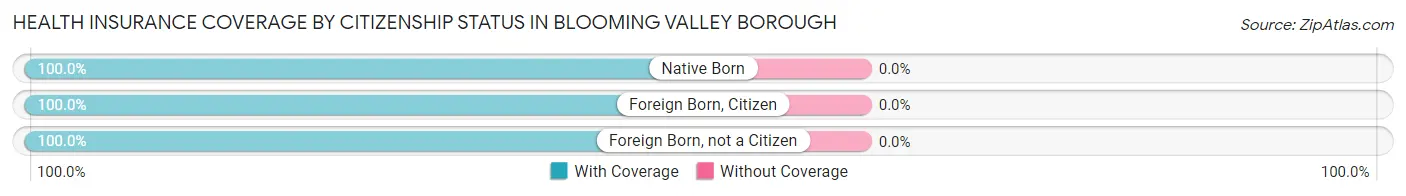
| Citizenship Status | With Coverage | Without Coverage |
| Native Born | 24 (100.0%) | 0 (0.0%) |
| Foreign Born, Citizen | 30 (100.0%) | 0 (0.0%) |
| Foreign Born, not a Citizen | 17 (100.0%) | 0 (0.0%) |
Health Insurance Coverage by Household Income in Blooming Valley borough
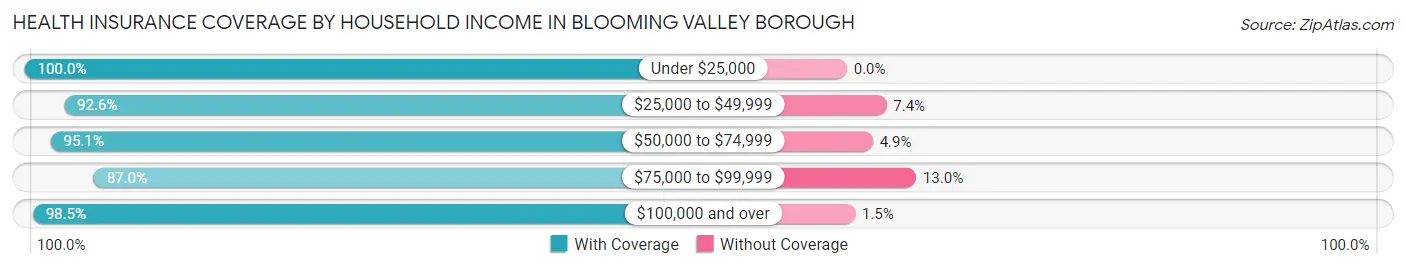
| Household Income | With Coverage | Without Coverage |
| Under $25,000 | 18 (100.0%) | 0 (0.0%) |
| $25,000 to $49,999 | 25 (92.6%) | 2 (7.4%) |
| $50,000 to $74,999 | 137 (95.1%) | 7 (4.9%) |
| $75,000 to $99,999 | 47 (87.0%) | 7 (13.0%) |
| $100,000 and over | 129 (98.5%) | 2 (1.5%) |
Public vs Private Health Insurance Coverage by Age in Blooming Valley borough
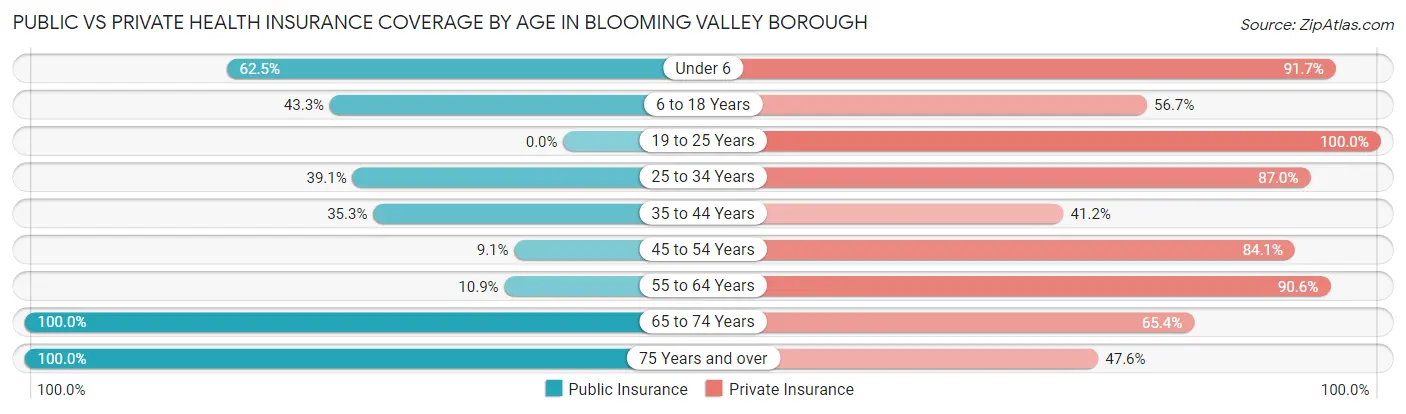
| Age Bracket | Public Insurance | Private Insurance |
| Under 6 | 15 (62.5%) | 22 (91.7%) |
| 6 to 18 Years | 13 (43.3%) | 17 (56.7%) |
| 19 to 25 Years | 0 (0.0%) | 17 (100.0%) |
| 25 to 34 Years | 9 (39.1%) | 20 (87.0%) |
| 35 to 44 Years | 12 (35.3%) | 14 (41.2%) |
| 45 to 54 Years | 8 (9.1%) | 74 (84.1%) |
| 55 to 64 Years | 7 (10.9%) | 58 (90.6%) |
| 65 to 74 Years | 52 (100.0%) | 34 (65.4%) |
| 75 Years and over | 42 (100.0%) | 20 (47.6%) |
| Total | 158 (42.2%) | 276 (73.8%) |
Disability Status by Sex by Age in Blooming Valley borough
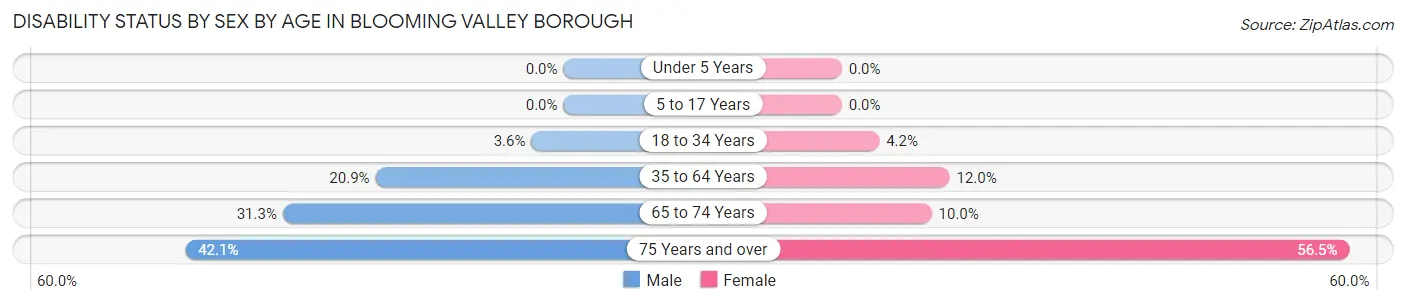
| Age Bracket | Male | Female |
| Under 5 Years | 0 (0.0%) | 0 (0.0%) |
| 5 to 17 Years | 0 (0.0%) | 0 (0.0%) |
| 18 to 34 Years | 1 (3.6%) | 1 (4.2%) |
| 35 to 64 Years | 18 (20.9%) | 12 (12.0%) |
| 65 to 74 Years | 10 (31.2%) | 2 (10.0%) |
| 75 Years and over | 8 (42.1%) | 13 (56.5%) |
Disability Class by Sex by Age in Blooming Valley borough
Disability Class: Hearing Difficulty
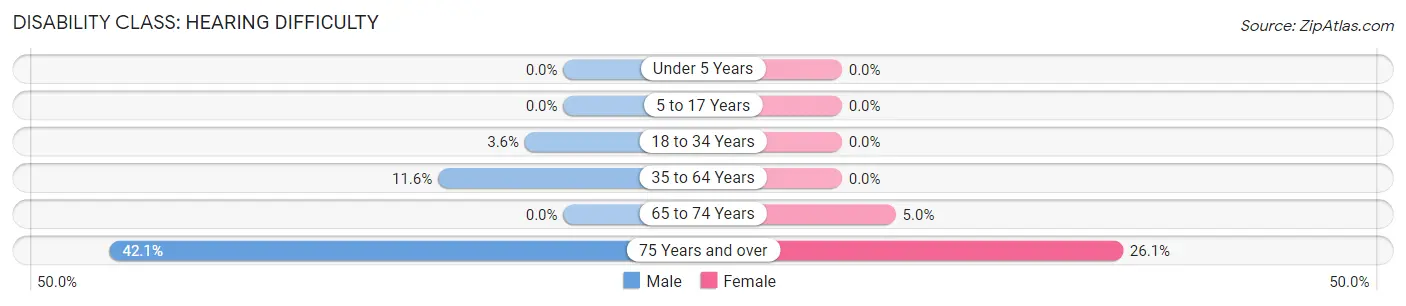
| Age Bracket | Male | Female |
| Under 5 Years | 0 (0.0%) | 0 (0.0%) |
| 5 to 17 Years | 0 (0.0%) | 0 (0.0%) |
| 18 to 34 Years | 1 (3.6%) | 0 (0.0%) |
| 35 to 64 Years | 10 (11.6%) | 0 (0.0%) |
| 65 to 74 Years | 0 (0.0%) | 1 (5.0%) |
| 75 Years and over | 8 (42.1%) | 6 (26.1%) |
Disability Class: Vision Difficulty
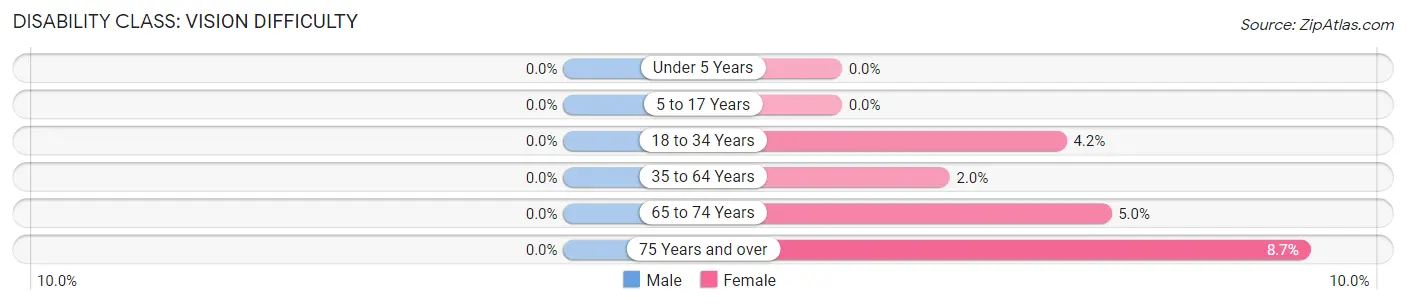
| Age Bracket | Male | Female |
| Under 5 Years | 0 (0.0%) | 0 (0.0%) |
| 5 to 17 Years | 0 (0.0%) | 0 (0.0%) |
| 18 to 34 Years | 0 (0.0%) | 1 (4.2%) |
| 35 to 64 Years | 0 (0.0%) | 2 (2.0%) |
| 65 to 74 Years | 0 (0.0%) | 1 (5.0%) |
| 75 Years and over | 0 (0.0%) | 2 (8.7%) |
Disability Class: Cognitive Difficulty
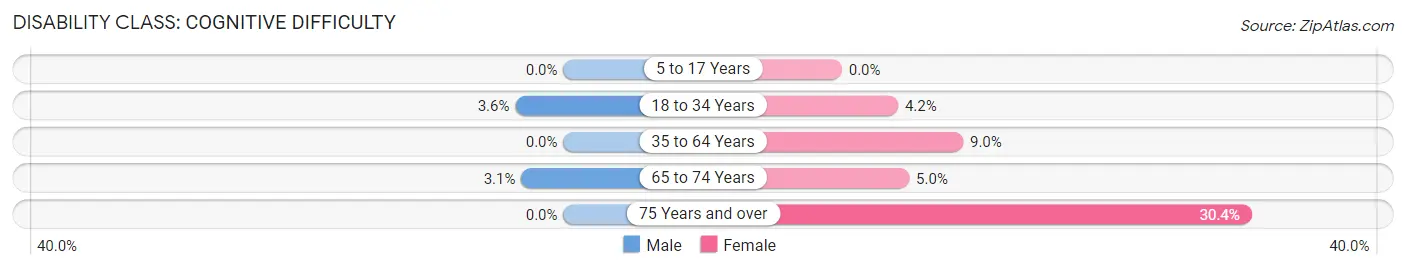
| Age Bracket | Male | Female |
| 5 to 17 Years | 0 (0.0%) | 0 (0.0%) |
| 18 to 34 Years | 1 (3.6%) | 1 (4.2%) |
| 35 to 64 Years | 0 (0.0%) | 9 (9.0%) |
| 65 to 74 Years | 1 (3.1%) | 1 (5.0%) |
| 75 Years and over | 0 (0.0%) | 7 (30.4%) |
Disability Class: Ambulatory Difficulty
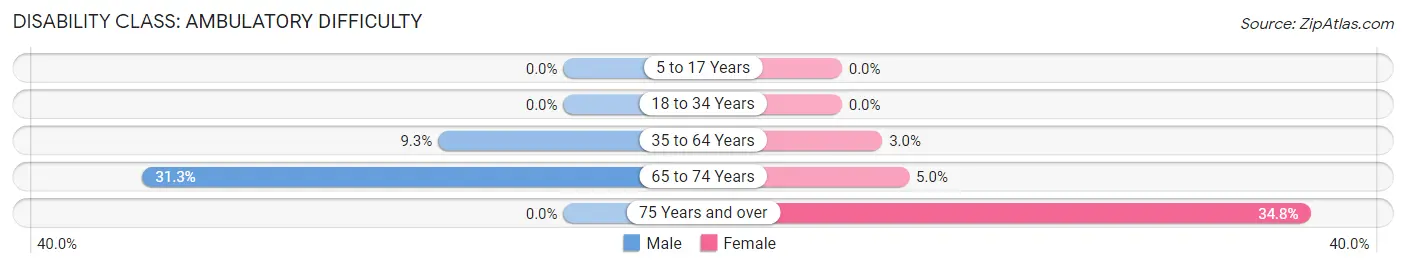
| Age Bracket | Male | Female |
| 5 to 17 Years | 0 (0.0%) | 0 (0.0%) |
| 18 to 34 Years | 0 (0.0%) | 0 (0.0%) |
| 35 to 64 Years | 8 (9.3%) | 3 (3.0%) |
| 65 to 74 Years | 10 (31.2%) | 1 (5.0%) |
| 75 Years and over | 0 (0.0%) | 8 (34.8%) |
Disability Class: Self-Care Difficulty
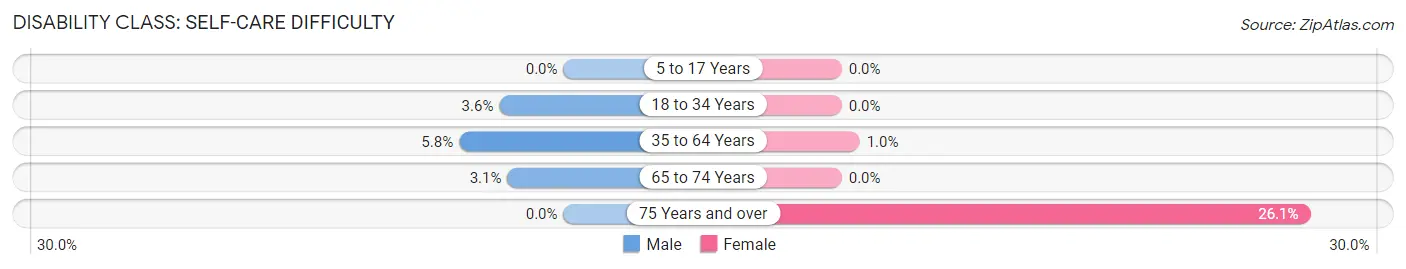
| Age Bracket | Male | Female |
| 5 to 17 Years | 0 (0.0%) | 0 (0.0%) |
| 18 to 34 Years | 1 (3.6%) | 0 (0.0%) |
| 35 to 64 Years | 5 (5.8%) | 1 (1.0%) |
| 65 to 74 Years | 1 (3.1%) | 0 (0.0%) |
| 75 Years and over | 0 (0.0%) | 6 (26.1%) |
Technology Access in Blooming Valley borough
Computing Device Access in Blooming Valley borough
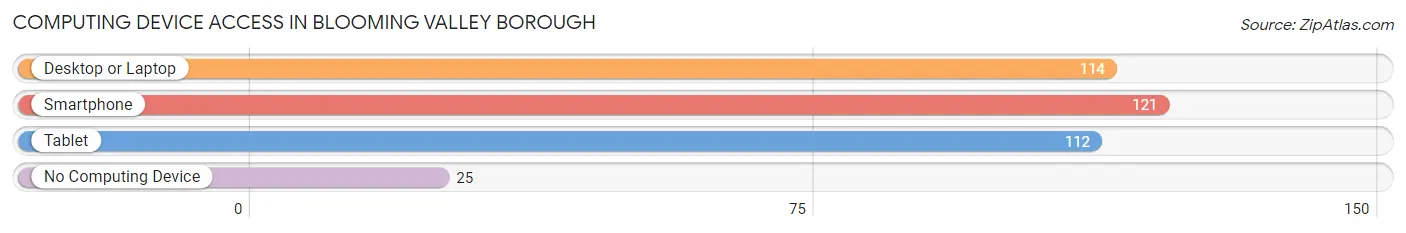
| Device Type | # Households | % Households |
| Desktop or Laptop | 114 | 68.7% |
| Smartphone | 121 | 72.9% |
| Tablet | 112 | 67.5% |
| No Computing Device | 25 | 15.1% |
| Total | 166 | 100.0% |
Internet Access in Blooming Valley borough
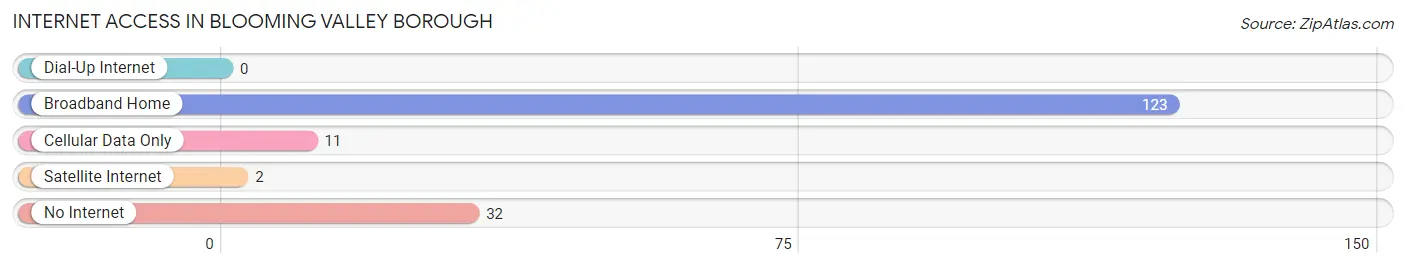
| Internet Type | # Households | % Households |
| Dial-Up Internet | 0 | 0.0% |
| Broadband Home | 123 | 74.1% |
| Cellular Data Only | 11 | 6.6% |
| Satellite Internet | 2 | 1.2% |
| No Internet | 32 | 19.3% |
| Total | 166 | 100.0% |
Blooming Valley borough Summary
Blooming Valley Borough is a small borough located in Venango County, Pennsylvania. It is situated in the northwestern part of the state, approximately 30 miles south of Erie. The borough is bordered by the townships of Cranberry, Clinton, and Irwin. As of the 2010 census, the population of Blooming Valley Borough was 1,093.
History
The area that is now Blooming Valley Borough was first settled in the late 1700s by a group of German immigrants. The first permanent settlers were the families of John and Jacob Miller, who arrived in 1797. The area was originally known as Miller’s Settlement, and the first post office was established in 1817. In 1836, the name of the settlement was changed to Blooming Valley.
The borough was officially incorporated in 1876. At the time, the population was approximately 500. The economy of the borough was largely based on agriculture, with the main crops being wheat, oats, and hay. In the late 1800s, the borough began to develop a small manufacturing sector, with several small factories producing furniture, clothing, and other goods.
Geography
Blooming Valley Borough is located at 41°25'N 79°45'W. It has a total area of 1.2 square miles, all of which is land. The borough is situated in a rural area, with rolling hills and forests. The main waterway is French Creek, which flows through the borough.
Economy
The economy of Blooming Valley Borough is largely based on agriculture. The main crops are hay, wheat, and oats. There are also several small businesses in the borough, including a grocery store, a hardware store, and a few restaurants.
Demographics
As of the 2010 census, the population of Blooming Valley Borough was 1,093. The racial makeup of the borough was 97.3% White, 0.7% African American, 0.3% Native American, 0.2% Asian, and 1.5% from other races. Hispanic or Latino of any race were 1.2% of the population.
The median household income in the borough was $41,250, and the median family income was $48,750. The per capita income was $20,945. About 11.2% of families and 13.2% of the population were below the poverty line, including 17.2% of those under age 18 and 8.2% of those age 65 or over.
Common Questions
What is Per Capita Income in Blooming Valley borough?
Per Capita income in Blooming Valley borough is $40,570.
What is the Median Family Income in Blooming Valley borough?
Median Family Income in Blooming Valley borough is $89,167.
What is the Median Household income in Blooming Valley borough?
Median Household Income in Blooming Valley borough is $71,875.
What is Income or Wage Gap in Blooming Valley borough?
Income or Wage Gap in Blooming Valley borough is 57.0%.
Women in Blooming Valley borough earn 43.0 cents for every dollar earned by a man.
What is Inequality or Gini Index in Blooming Valley borough?
Inequality or Gini Index in Blooming Valley borough is 0.38.
What is the Total Population of Blooming Valley borough?
Total Population of Blooming Valley borough is 374.
What is the Total Male Population of Blooming Valley borough?
Total Male Population of Blooming Valley borough is 197.
What is the Total Female Population of Blooming Valley borough?
Total Female Population of Blooming Valley borough is 177.
What is the Ratio of Males per 100 Females in Blooming Valley borough?
There are 111.30 Males per 100 Females in Blooming Valley borough.
What is the Ratio of Females per 100 Males in Blooming Valley borough?
There are 89.85 Females per 100 Males in Blooming Valley borough.
What is the Median Population Age in Blooming Valley borough?
Median Population Age in Blooming Valley borough is 53.0 Years.
What is the Average Family Size in Blooming Valley borough
Average Family Size in Blooming Valley borough is 2.4 People.
What is the Average Household Size in Blooming Valley borough
Average Household Size in Blooming Valley borough is 2.2 People.
How Large is the Labor Force in Blooming Valley borough?
There are 222 People in the Labor Forcein in Blooming Valley borough.
What is the Percentage of People in the Labor Force in Blooming Valley borough?
66.7% of People are in the Labor Force in Blooming Valley borough.
What is the Unemployment Rate in Blooming Valley borough?
Unemployment Rate in Blooming Valley borough is 1.4%.