Colonial Park, PA Map & Demographics
Colonial Park Map
Colonial Park Overview
$30,942
PER CAPITA INCOME
$78,175
AVG FAMILY INCOME
$62,878
AVG HOUSEHOLD INCOME
22.4%
WAGE / INCOME GAP [ % ]
77.6¢/ $1
WAGE / INCOME GAP [ $ ]
0.39
INEQUALITY / GINI INDEX
16,891
TOTAL POPULATION
7,944
MALE POPULATION
8,947
FEMALE POPULATION
88.79
MALES / 100 FEMALES
112.63
FEMALES / 100 MALES
35.9
MEDIAN AGE
3.2
AVG FAMILY SIZE
2.5
AVG HOUSEHOLD SIZE
8,870
LABOR FORCE [ PEOPLE ]
65.1%
PERCENT IN LABOR FORCE
5.3%
UNEMPLOYMENT RATE
Income in Colonial Park
Income Overview in Colonial Park
Per Capita Income in Colonial Park is $30,942, while median incomes of families and households are $78,175 and $62,878 respectively.
| Characteristic | Number | Measure |
| Per Capita Income | 16,891 | $30,942 |
| Median Family Income | 4,063 | $78,175 |
| Mean Family Income | 4,063 | $88,693 |
| Median Household Income | 6,746 | $62,878 |
| Mean Household Income | 6,746 | $76,676 |
| Income Deficit | 4,063 | $0 |
| Wage / Income Gap (%) | 16,891 | 22.44% |
| Wage / Income Gap ($) | 16,891 | 77.56¢ per $1 |
| Gini / Inequality Index | 16,891 | 0.39 |
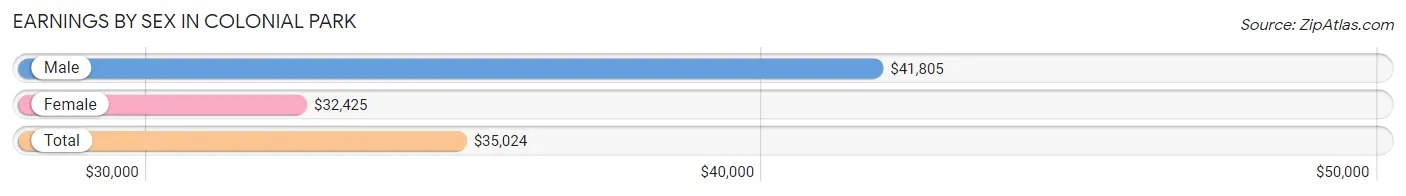
Earnings by Sex in Colonial Park
Average Earnings in Colonial Park are $35,024, $41,805 for men and $32,425 for women, a difference of 22.4%.
| Sex | Number | Average Earnings |
| Male | 4,452 (50.1%) | $41,805 |
| Female | 4,429 (49.9%) | $32,425 |
| Total | 8,881 (100.0%) | $35,024 |
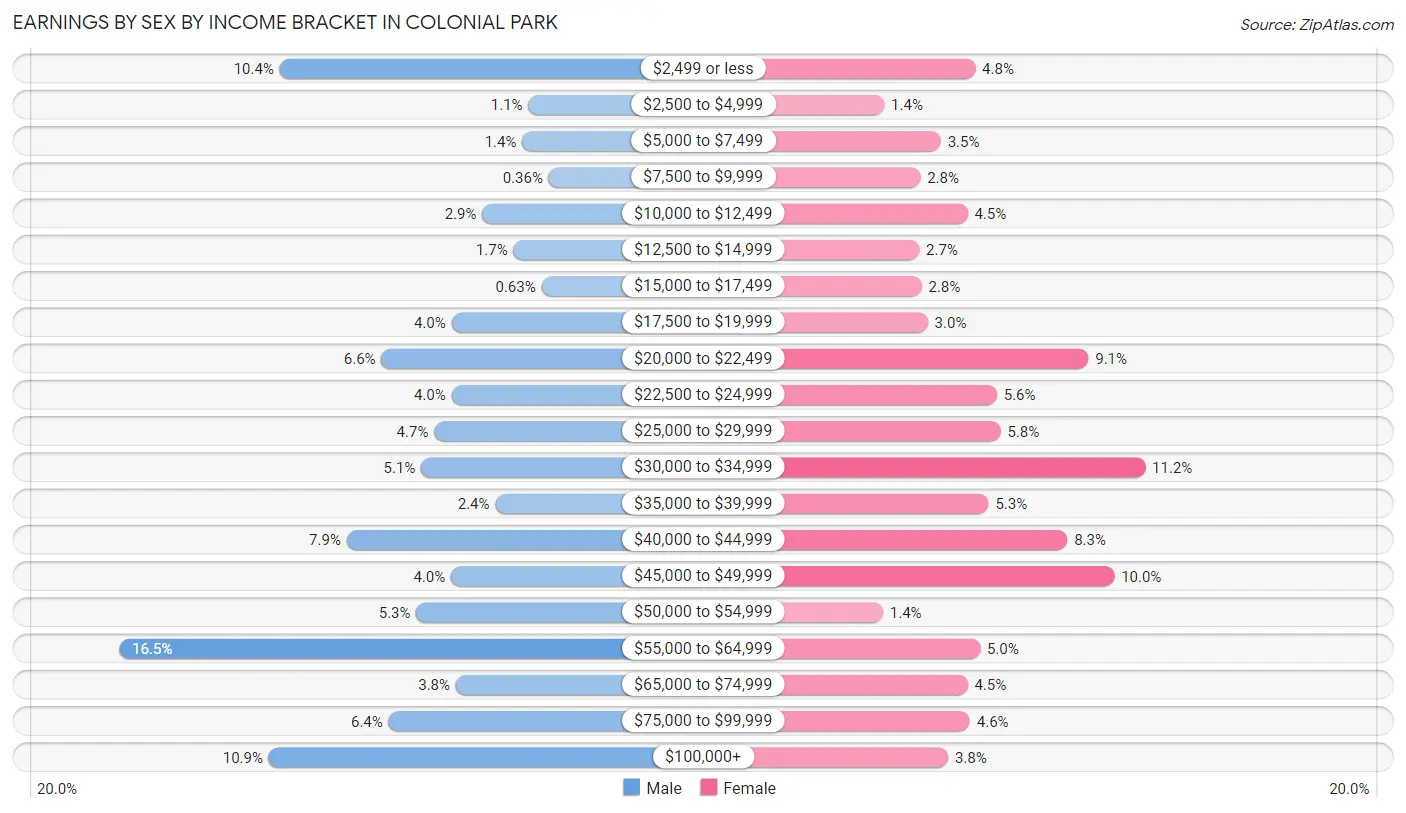
Earnings by Sex by Income Bracket in Colonial Park
The most common earnings brackets in Colonial Park are $55,000 to $64,999 for men (733 | 16.5%) and $30,000 to $34,999 for women (495 | 11.2%).
| Income | Male | Female |
| $2,499 or less | 465 (10.4%) | 213 (4.8%) |
| $2,500 to $4,999 | 50 (1.1%) | 62 (1.4%) |
| $5,000 to $7,499 | 60 (1.3%) | 156 (3.5%) |
| $7,500 to $9,999 | 16 (0.4%) | 122 (2.8%) |
| $10,000 to $12,499 | 127 (2.9%) | 200 (4.5%) |
| $12,500 to $14,999 | 75 (1.7%) | 120 (2.7%) |
| $15,000 to $17,499 | 28 (0.6%) | 124 (2.8%) |
| $17,500 to $19,999 | 178 (4.0%) | 134 (3.0%) |
| $20,000 to $22,499 | 295 (6.6%) | 401 (9.0%) |
| $22,500 to $24,999 | 178 (4.0%) | 249 (5.6%) |
| $25,000 to $29,999 | 207 (4.6%) | 255 (5.8%) |
| $30,000 to $34,999 | 229 (5.1%) | 495 (11.2%) |
| $35,000 to $39,999 | 105 (2.4%) | 235 (5.3%) |
| $40,000 to $44,999 | 353 (7.9%) | 366 (8.3%) |
| $45,000 to $49,999 | 179 (4.0%) | 444 (10.0%) |
| $50,000 to $54,999 | 237 (5.3%) | 60 (1.3%) |
| $55,000 to $64,999 | 733 (16.5%) | 221 (5.0%) |
| $65,000 to $74,999 | 171 (3.8%) | 200 (4.5%) |
| $75,000 to $99,999 | 283 (6.4%) | 204 (4.6%) |
| $100,000+ | 483 (10.8%) | 168 (3.8%) |
| Total | 4,452 (100.0%) | 4,429 (100.0%) |
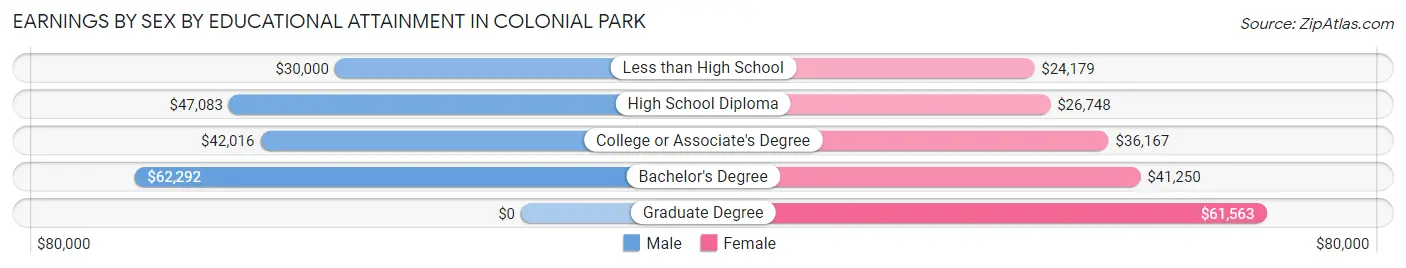
Earnings by Sex by Educational Attainment in Colonial Park
Average earnings in Colonial Park are $50,532 for men and $34,181 for women, a difference of 32.4%. Men with an educational attainment of bachelor's degree enjoy the highest average annual earnings of $62,292, while those with less than high school education earn the least with $30,000. Women with an educational attainment of graduate degree earn the most with the average annual earnings of $61,563, while those with less than high school education have the smallest earnings of $24,179.
| Educational Attainment | Male Income | Female Income |
| Less than High School | $30,000 | $24,179 |
| High School Diploma | $47,083 | $26,748 |
| College or Associate's Degree | $42,016 | $36,167 |
| Bachelor's Degree | $62,292 | $41,250 |
| Graduate Degree | - | - |
| Total | $50,532 | $34,181 |
Family Income in Colonial Park
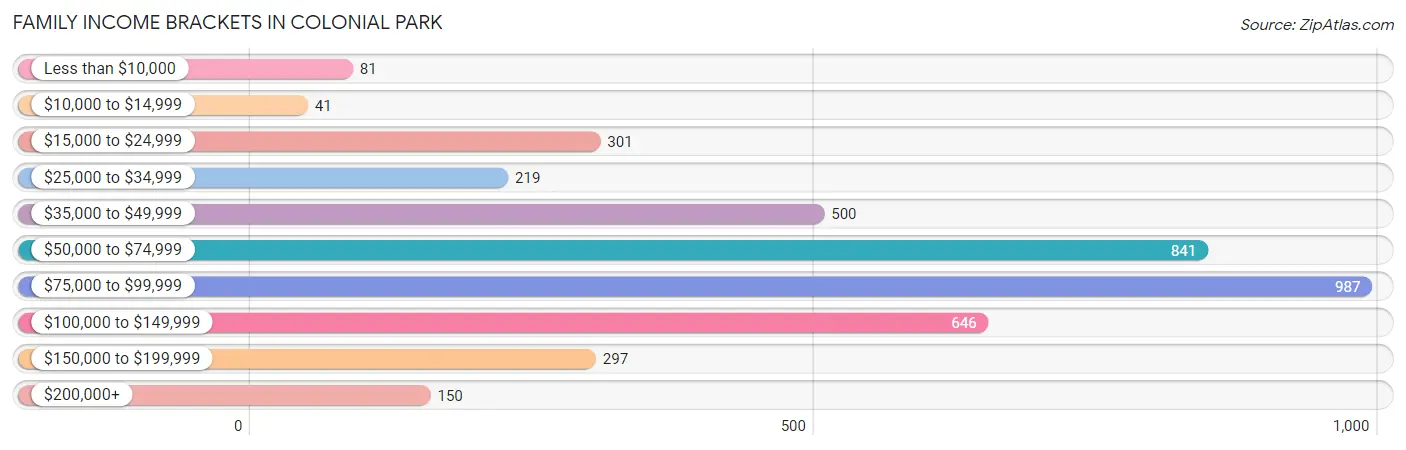
Family Income Brackets in Colonial Park
According to the Colonial Park family income data, there are 987 families falling into the $75,000 to $99,999 income range, which is the most common income bracket and makes up 24.3% of all families. Conversely, the $10,000 to $14,999 income bracket is the least frequent group with only 41 families (1.0%) belonging to this category.
| Income Bracket | # Families | % Families |
| Less than $10,000 | 81 | 2.0% |
| $10,000 to $14,999 | 41 | 1.0% |
| $15,000 to $24,999 | 301 | 7.4% |
| $25,000 to $34,999 | 219 | 5.4% |
| $35,000 to $49,999 | 500 | 12.3% |
| $50,000 to $74,999 | 841 | 20.7% |
| $75,000 to $99,999 | 987 | 24.3% |
| $100,000 to $149,999 | 646 | 15.9% |
| $150,000 to $199,999 | 297 | 7.3% |
| $200,000+ | 150 | 3.7% |
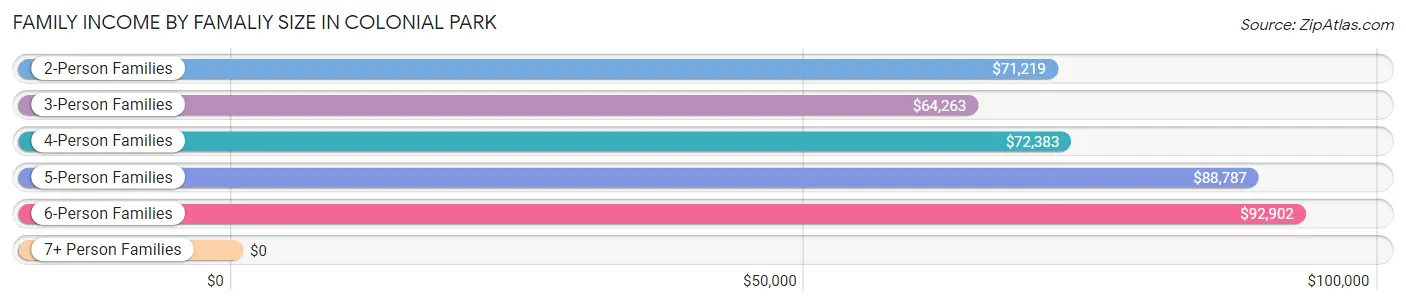
Family Income by Famaliy Size in Colonial Park
6-person families (141 | 3.5%) account for the highest median family income in Colonial Park with $92,902 per family, while 2-person families (2,143 | 52.7%) have the highest median income of $35,610 per family member.
| Income Bracket | # Families | Median Income |
| 2-Person Families | 2,143 (52.7%) | $71,219 |
| 3-Person Families | 639 (15.7%) | $64,263 |
| 4-Person Families | 610 (15.0%) | $72,383 |
| 5-Person Families | 456 (11.2%) | $88,787 |
| 6-Person Families | 141 (3.5%) | $92,902 |
| 7+ Person Families | 74 (1.8%) | $0 |
| Total | 4,063 (100.0%) | $78,175 |
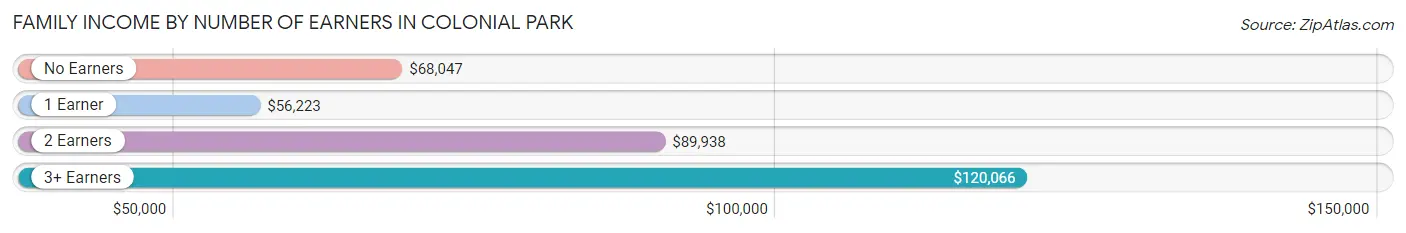
Family Income by Number of Earners in Colonial Park
The median family income in Colonial Park is $78,175, with families comprising 3+ earners (381) having the highest median family income of $120,066, while families with 1 earner (1,416) have the lowest median family income of $56,223, accounting for 9.4% and 34.8% of families, respectively.
| Number of Earners | # Families | Median Income |
| No Earners | 544 (13.4%) | $68,047 |
| 1 Earner | 1,416 (34.8%) | $56,223 |
| 2 Earners | 1,722 (42.4%) | $89,938 |
| 3+ Earners | 381 (9.4%) | $120,066 |
| Total | 4,063 (100.0%) | $78,175 |
Household Income in Colonial Park
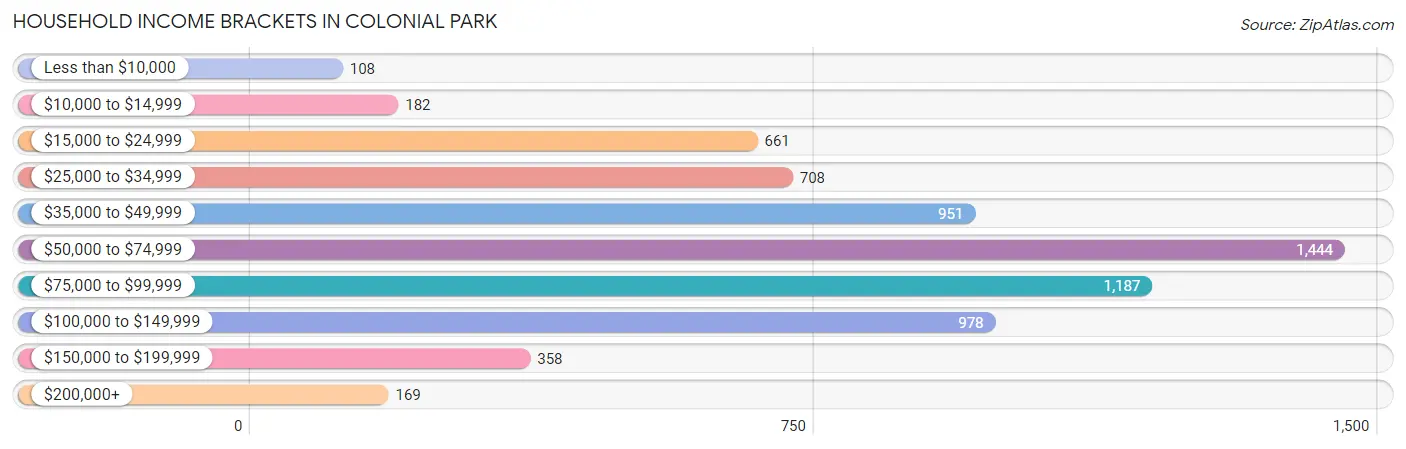
Household Income Brackets in Colonial Park
With 1,444 households falling in the category, the $50,000 to $74,999 income range is the most frequent in Colonial Park, accounting for 21.4% of all households. In contrast, only 108 households (1.6%) fall into the less than $10,000 income bracket, making it the least populous group.
| Income Bracket | # Households | % Households |
| Less than $10,000 | 108 | 1.6% |
| $10,000 to $14,999 | 182 | 2.7% |
| $15,000 to $24,999 | 661 | 9.8% |
| $25,000 to $34,999 | 708 | 10.5% |
| $35,000 to $49,999 | 951 | 14.1% |
| $50,000 to $74,999 | 1,444 | 21.4% |
| $75,000 to $99,999 | 1,187 | 17.6% |
| $100,000 to $149,999 | 978 | 14.5% |
| $150,000 to $199,999 | 358 | 5.3% |
| $200,000+ | 169 | 2.5% |
Household Income by Householder Age in Colonial Park
The median household income in Colonial Park is $62,878, with the highest median household income of $77,692 found in the 25 to 44 years age bracket for the primary householder. A total of 2,583 households (38.3%) fall into this category. Meanwhile, the 15 to 24 years age bracket for the primary householder has the lowest median household income of $46,307, with 489 households (7.2%) in this group.
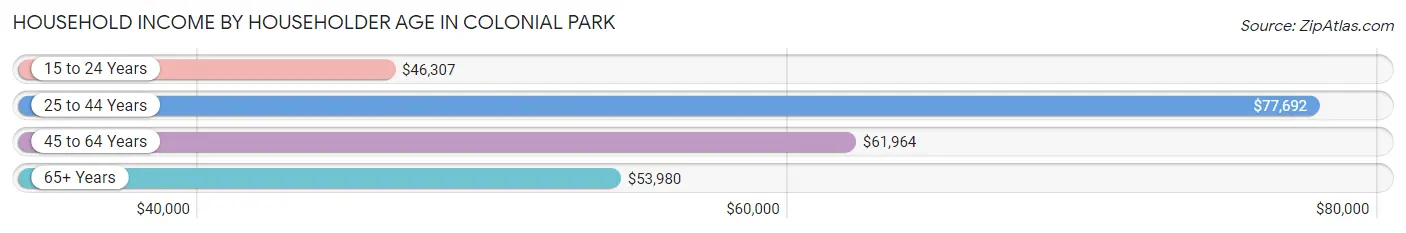
| Income Bracket | # Households | Median Income |
| 15 to 24 Years | 489 (7.2%) | $46,307 |
| 25 to 44 Years | 2,583 (38.3%) | $77,692 |
| 45 to 64 Years | 1,830 (27.1%) | $61,964 |
| 65+ Years | 1,844 (27.3%) | $53,980 |
| Total | 6,746 (100.0%) | $62,878 |
Poverty in Colonial Park
Income Below Poverty by Sex and Age in Colonial Park
With 10.9% poverty level for males and 13.1% for females among the residents of Colonial Park, under 5 year old males and 6 to 11 year old females are the most vulnerable to poverty, with 172 males (35.4%) and 224 females (33.5%) in their respective age groups living below the poverty level.
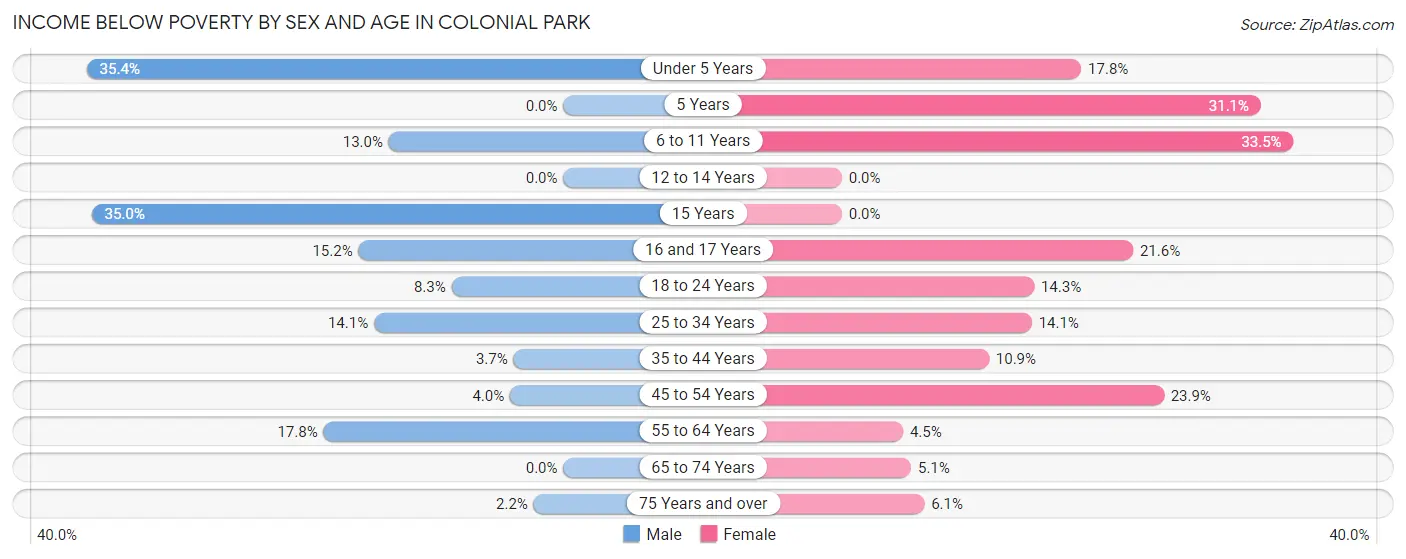
| Age Bracket | Male | Female |
| Under 5 Years | 172 (35.4%) | 99 (17.8%) |
| 5 Years | 0 (0.0%) | 28 (31.1%) |
| 6 to 11 Years | 99 (13.0%) | 224 (33.5%) |
| 12 to 14 Years | 0 (0.0%) | 0 (0.0%) |
| 15 Years | 55 (35.0%) | 0 (0.0%) |
| 16 and 17 Years | 68 (15.2%) | 24 (21.6%) |
| 18 to 24 Years | 58 (8.3%) | 124 (14.3%) |
| 25 to 34 Years | 179 (14.1%) | 221 (14.1%) |
| 35 to 44 Years | 45 (3.7%) | 126 (10.9%) |
| 45 to 54 Years | 25 (4.0%) | 157 (23.9%) |
| 55 to 64 Years | 148 (17.8%) | 47 (4.5%) |
| 65 to 74 Years | 0 (0.0%) | 55 (5.1%) |
| 75 Years and over | 11 (2.2%) | 39 (6.1%) |
| Total | 860 (10.9%) | 1,144 (13.1%) |
Income Above Poverty by Sex and Age in Colonial Park
According to the poverty statistics in Colonial Park, males aged 5 years and females aged 12 to 14 years are the age groups that are most secure financially, with 100.0% of males and 100.0% of females in these age groups living above the poverty line.
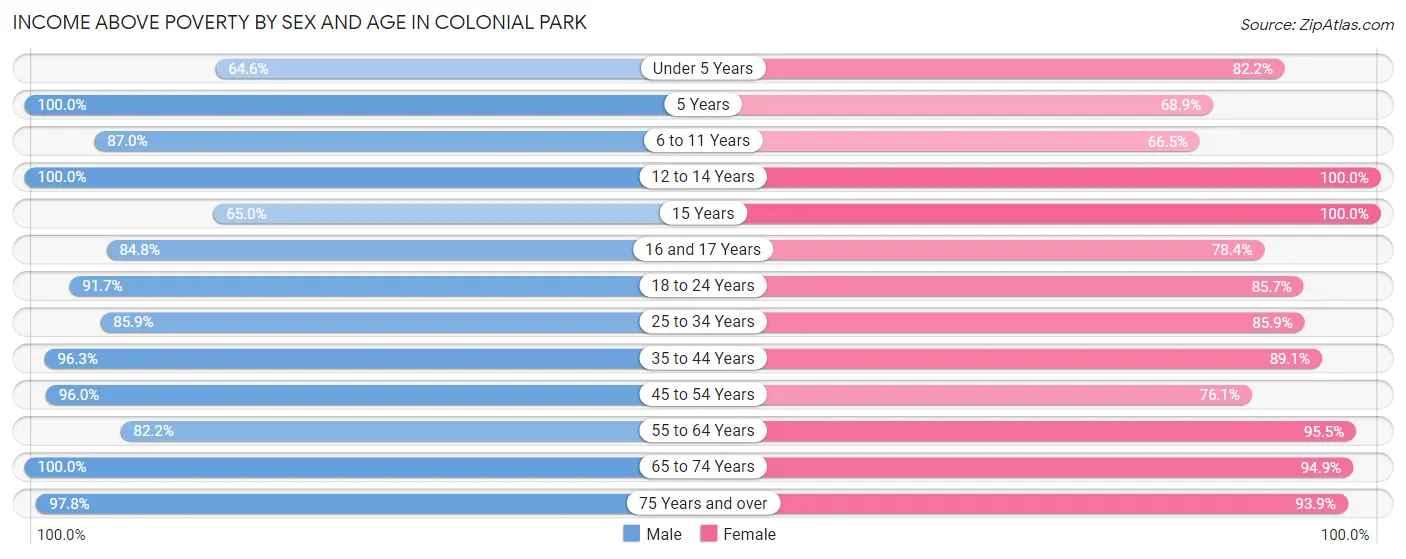
| Age Bracket | Male | Female |
| Under 5 Years | 314 (64.6%) | 458 (82.2%) |
| 5 Years | 82 (100.0%) | 62 (68.9%) |
| 6 to 11 Years | 665 (87.0%) | 444 (66.5%) |
| 12 to 14 Years | 77 (100.0%) | 120 (100.0%) |
| 15 Years | 102 (65.0%) | 214 (100.0%) |
| 16 and 17 Years | 379 (84.8%) | 87 (78.4%) |
| 18 to 24 Years | 641 (91.7%) | 745 (85.7%) |
| 25 to 34 Years | 1,094 (85.9%) | 1,346 (85.9%) |
| 35 to 44 Years | 1,172 (96.3%) | 1,028 (89.1%) |
| 45 to 54 Years | 606 (96.0%) | 500 (76.1%) |
| 55 to 64 Years | 683 (82.2%) | 988 (95.5%) |
| 65 to 74 Years | 723 (100.0%) | 1,016 (94.9%) |
| 75 Years and over | 488 (97.8%) | 598 (93.9%) |
| Total | 7,026 (89.1%) | 7,606 (86.9%) |
Income Below Poverty Among Married-Couple Families in Colonial Park
The poverty statistics for married-couple families in Colonial Park show that 7.5% or 221 of the total 2,928 families live below the poverty line. Families with 3 or 4 children have the highest poverty rate of 39.2%, comprising of 98 families. On the other hand, families with 5 or more children have the lowest poverty rate of 0.0%, which includes 0 families.
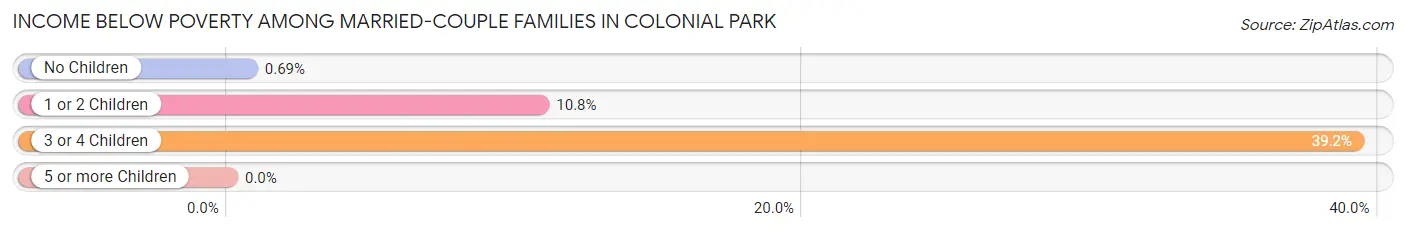
| Children | Above Poverty | Below Poverty |
| No Children | 1,583 (99.3%) | 11 (0.7%) |
| 1 or 2 Children | 921 (89.2%) | 112 (10.8%) |
| 3 or 4 Children | 152 (60.8%) | 98 (39.2%) |
| 5 or more Children | 51 (100.0%) | 0 (0.0%) |
| Total | 2,707 (92.4%) | 221 (7.5%) |
Income Below Poverty Among Single-Parent Households in Colonial Park
According to the poverty data in Colonial Park, 21.5% or 61 single-father households and 24.5% or 209 single-mother households are living below the poverty line. Among single-father households, those with 1 or 2 children have the highest poverty rate, with 50 households (44.3%) experiencing poverty. Likewise, among single-mother households, those with 3 or 4 children have the highest poverty rate, with 15 households (100.0%) falling below the poverty line.
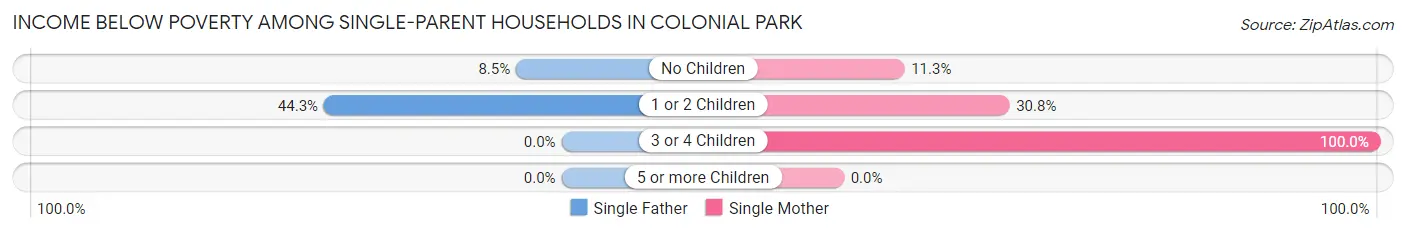
| Children | Single Father | Single Mother |
| No Children | 11 (8.5%) | 37 (11.3%) |
| 1 or 2 Children | 50 (44.3%) | 157 (30.8%) |
| 3 or 4 Children | 0 (0.0%) | 15 (100.0%) |
| 5 or more Children | 0 (0.0%) | 0 (0.0%) |
| Total | 61 (21.5%) | 209 (24.5%) |
Income Below Poverty Among Married-Couple vs Single-Parent Households in Colonial Park
The poverty data for Colonial Park shows that 221 of the married-couple family households (7.5%) and 270 of the single-parent households (23.8%) are living below the poverty level. Within the married-couple family households, those with 3 or 4 children have the highest poverty rate, with 98 households (39.2%) falling below the poverty line. Among the single-parent households, those with 1 or 2 children have the highest poverty rate, with 207 household (33.3%) living below poverty.
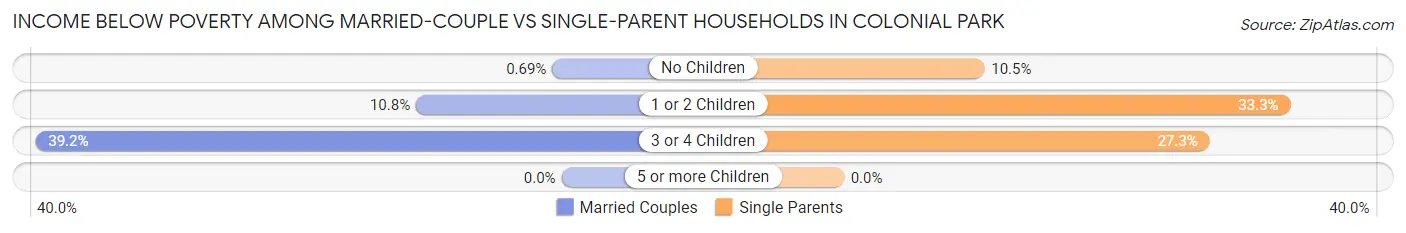
| Children | Married-Couple Families | Single-Parent Households |
| No Children | 11 (0.7%) | 48 (10.5%) |
| 1 or 2 Children | 112 (10.8%) | 207 (33.3%) |
| 3 or 4 Children | 98 (39.2%) | 15 (27.3%) |
| 5 or more Children | 0 (0.0%) | 0 (0.0%) |
| Total | 221 (7.5%) | 270 (23.8%) |
Race in Colonial Park
The most populous races in Colonial Park are White / Caucasian (10,149 | 60.1%), Black / African American (3,421 | 20.3%), and Asian (1,587 | 9.4%).
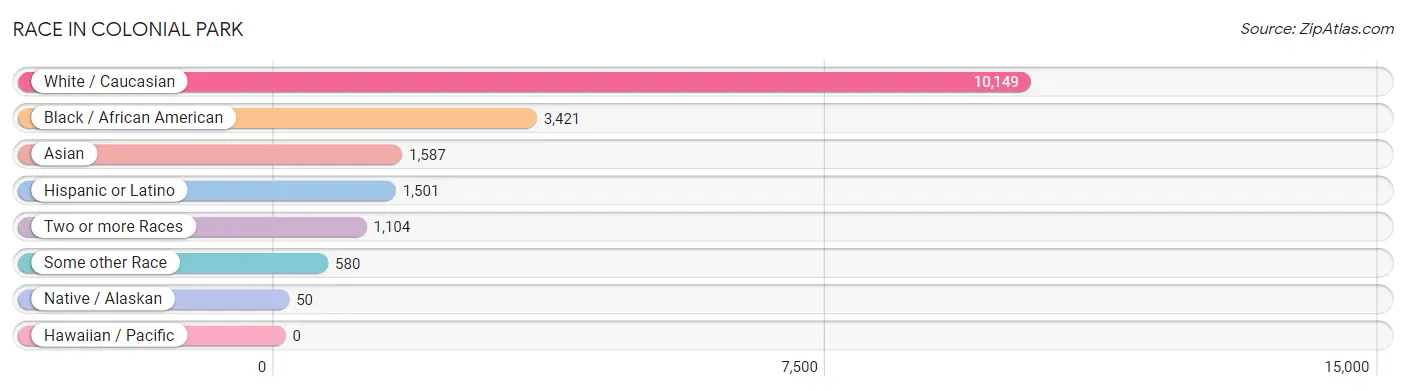
| Race | # Population | % Population |
| Asian | 1,587 | 9.4% |
| Black / African American | 3,421 | 20.3% |
| Hawaiian / Pacific | 0 | 0.0% |
| Hispanic or Latino | 1,501 | 8.9% |
| Native / Alaskan | 50 | 0.3% |
| White / Caucasian | 10,149 | 60.1% |
| Two or more Races | 1,104 | 6.5% |
| Some other Race | 580 | 3.4% |
| Total | 16,891 | 100.0% |
Ancestry in Colonial Park
The most populous ancestries reported in Colonial Park are German (3,293 | 19.5%), Irish (2,139 | 12.7%), Italian (965 | 5.7%), English (912 | 5.4%), and Puerto Rican (842 | 5.0%), together accounting for 48.2% of all Colonial Park residents.
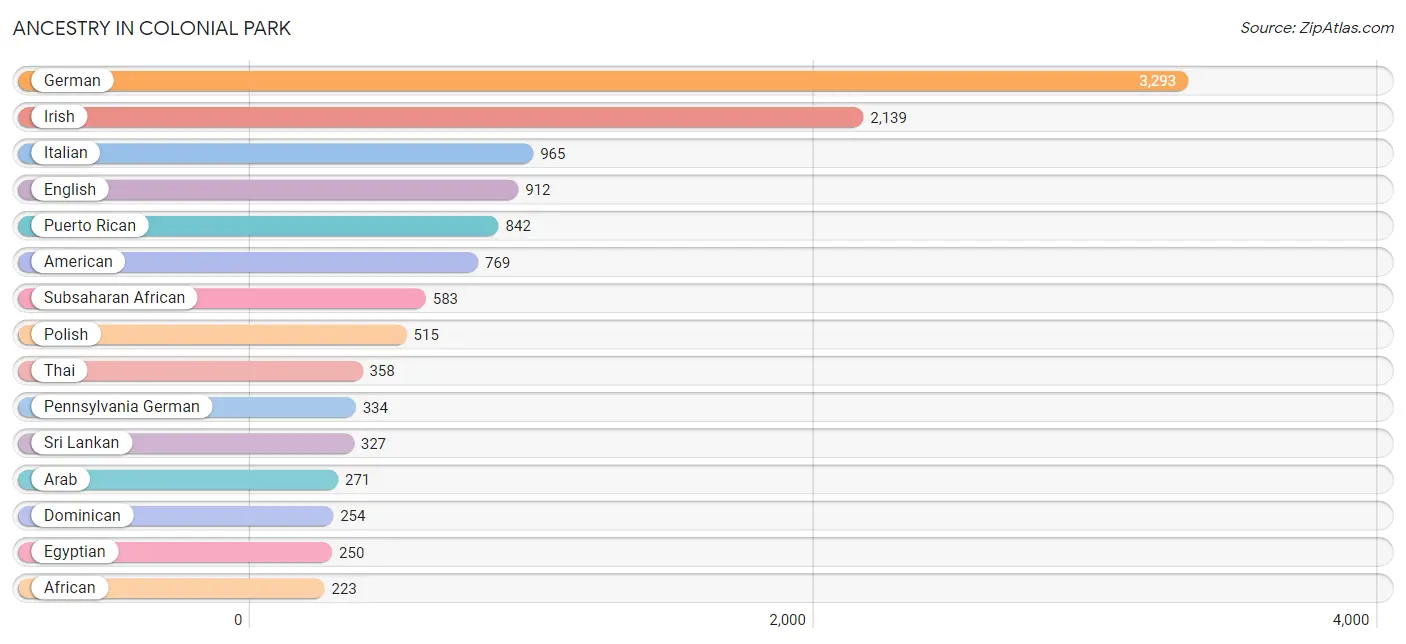
| Ancestry | # Population | % Population |
| African | 223 | 1.3% |
| American | 769 | 4.5% |
| Arab | 271 | 1.6% |
| Armenian | 23 | 0.1% |
| Bhutanese | 8 | 0.1% |
| Blackfeet | 11 | 0.1% |
| Brazilian | 13 | 0.1% |
| British | 117 | 0.7% |
| Burmese | 128 | 0.8% |
| Central American | 71 | 0.4% |
| Central American Indian | 92 | 0.5% |
| Cherokee | 34 | 0.2% |
| Chilean | 17 | 0.1% |
| Colombian | 21 | 0.1% |
| Croatian | 130 | 0.8% |
| Cuban | 53 | 0.3% |
| Czechoslovakian | 11 | 0.1% |
| Dominican | 254 | 1.5% |
| Dutch | 183 | 1.1% |
| Eastern European | 23 | 0.1% |
| Ecuadorian | 28 | 0.2% |
| Egyptian | 250 | 1.5% |
| English | 912 | 5.4% |
| European | 112 | 0.7% |
| French | 193 | 1.1% |
| French Canadian | 14 | 0.1% |
| German | 3,293 | 19.5% |
| Greek | 24 | 0.1% |
| Guatemalan | 19 | 0.1% |
| Haitian | 37 | 0.2% |
| Hungarian | 30 | 0.2% |
| Indian (Asian) | 88 | 0.5% |
| Irish | 2,139 | 12.7% |
| Israeli | 26 | 0.2% |
| Italian | 965 | 5.7% |
| Jamaican | 37 | 0.2% |
| Japanese | 11 | 0.1% |
| Korean | 68 | 0.4% |
| Lithuanian | 91 | 0.5% |
| Mexican | 167 | 1.0% |
| Nigerian | 165 | 1.0% |
| Northern European | 83 | 0.5% |
| Norwegian | 66 | 0.4% |
| Pennsylvania German | 334 | 2.0% |
| Peruvian | 24 | 0.1% |
| Polish | 515 | 3.0% |
| Puerto Rican | 842 | 5.0% |
| Russian | 33 | 0.2% |
| Salvadoran | 52 | 0.3% |
| Scotch-Irish | 66 | 0.4% |
| Scottish | 75 | 0.4% |
| Serbian | 34 | 0.2% |
| Slavic | 21 | 0.1% |
| Slovak | 16 | 0.1% |
| South American | 90 | 0.5% |
| Sri Lankan | 327 | 1.9% |
| Subsaharan African | 583 | 3.5% |
| Swedish | 55 | 0.3% |
| Swiss | 101 | 0.6% |
| Syrian | 21 | 0.1% |
| Thai | 358 | 2.1% |
| Ukrainian | 15 | 0.1% |
| Welsh | 200 | 1.2% | View All 63 Rows |
Immigrants in Colonial Park
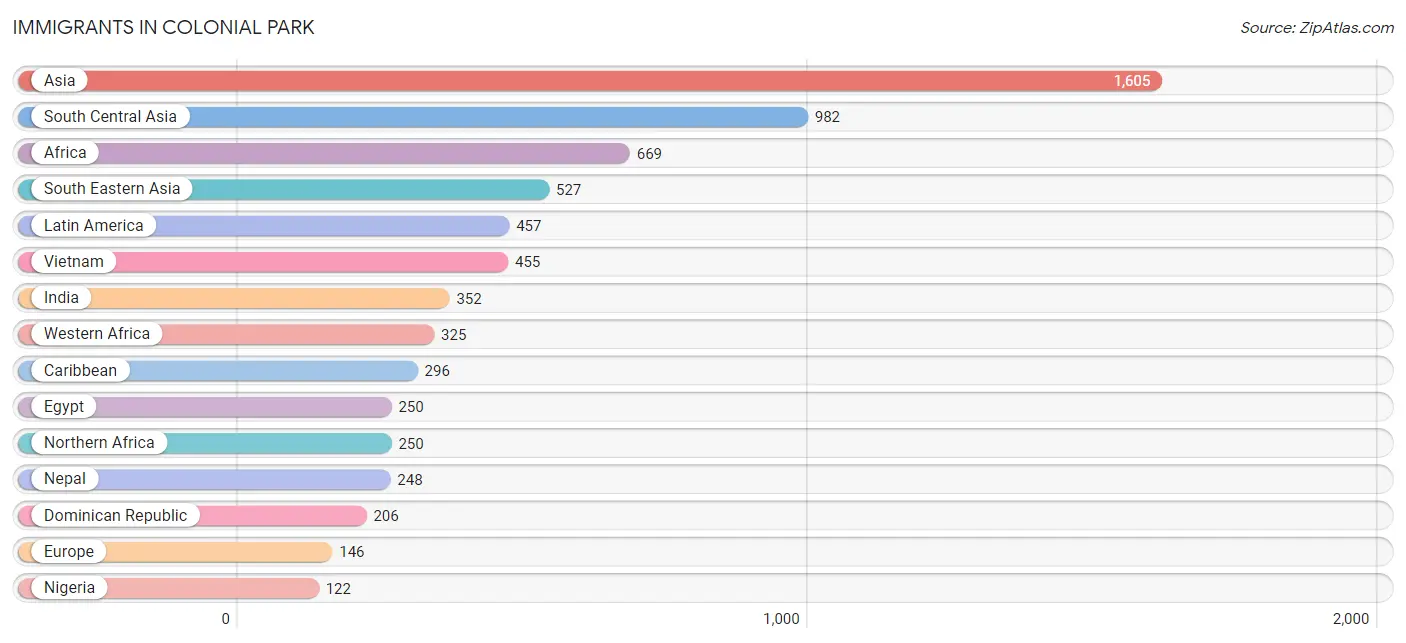
The most numerous immigrant groups reported in Colonial Park came from Asia (1,605 | 9.5%), South Central Asia (982 | 5.8%), Africa (669 | 4.0%), South Eastern Asia (527 | 3.1%), and Latin America (457 | 2.7%), together accounting for 25.1% of all Colonial Park residents.
| Immigration Origin | # Population | % Population |
| Africa | 669 | 4.0% |
| Asia | 1,605 | 9.5% |
| Bangladesh | 68 | 0.4% |
| Belgium | 19 | 0.1% |
| Bosnia and Herzegovina | 54 | 0.3% |
| Cambodia | 11 | 0.1% |
| Cameroon | 26 | 0.2% |
| Canada | 8 | 0.1% |
| Caribbean | 296 | 1.8% |
| Central America | 76 | 0.4% |
| China | 88 | 0.5% |
| Colombia | 21 | 0.1% |
| Cuba | 6 | 0.0% |
| Dominican Republic | 206 | 1.2% |
| Eastern Africa | 15 | 0.1% |
| Eastern Asia | 96 | 0.6% |
| Eastern Europe | 69 | 0.4% |
| Ecuador | 28 | 0.2% |
| Egypt | 250 | 1.5% |
| England | 15 | 0.1% |
| Eritrea | 15 | 0.1% |
| Europe | 146 | 0.9% |
| Germany | 17 | 0.1% |
| Guatemala | 19 | 0.1% |
| Guyana | 36 | 0.2% |
| Haiti | 37 | 0.2% |
| India | 352 | 2.1% |
| Italy | 26 | 0.2% |
| Jamaica | 29 | 0.2% |
| Japan | 8 | 0.1% |
| Latin America | 457 | 2.7% |
| Mexico | 57 | 0.3% |
| Middle Africa | 26 | 0.2% |
| Nepal | 248 | 1.5% |
| Nigeria | 122 | 0.7% |
| Northern Africa | 250 | 1.5% |
| Northern Europe | 15 | 0.1% |
| Philippines | 61 | 0.4% |
| South America | 85 | 0.5% |
| South Central Asia | 982 | 5.8% |
| South Eastern Asia | 527 | 3.1% |
| Southern Europe | 26 | 0.2% |
| Trinidad and Tobago | 18 | 0.1% |
| Ukraine | 15 | 0.1% |
| Vietnam | 455 | 2.7% |
| Western Africa | 325 | 1.9% |
| Western Europe | 36 | 0.2% | View All 47 Rows |
Sex and Age in Colonial Park
Sex and Age in Colonial Park
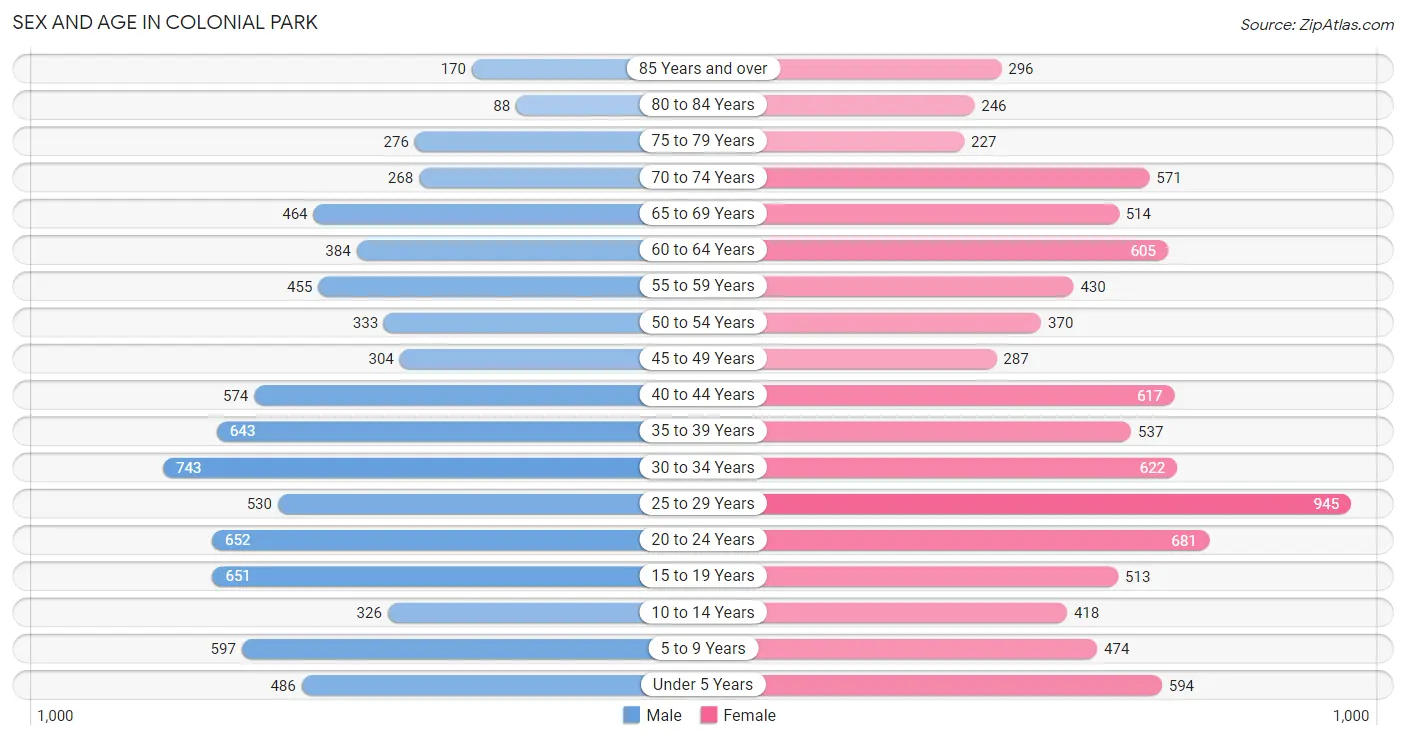
The most populous age groups in Colonial Park are 30 to 34 Years (743 | 9.3%) for men and 25 to 29 Years (945 | 10.6%) for women.
| Age Bracket | Male | Female |
| Under 5 Years | 486 (6.1%) | 594 (6.6%) |
| 5 to 9 Years | 597 (7.5%) | 474 (5.3%) |
| 10 to 14 Years | 326 (4.1%) | 418 (4.7%) |
| 15 to 19 Years | 651 (8.2%) | 513 (5.7%) |
| 20 to 24 Years | 652 (8.2%) | 681 (7.6%) |
| 25 to 29 Years | 530 (6.7%) | 945 (10.6%) |
| 30 to 34 Years | 743 (9.3%) | 622 (7.0%) |
| 35 to 39 Years | 643 (8.1%) | 537 (6.0%) |
| 40 to 44 Years | 574 (7.2%) | 617 (6.9%) |
| 45 to 49 Years | 304 (3.8%) | 287 (3.2%) |
| 50 to 54 Years | 333 (4.2%) | 370 (4.1%) |
| 55 to 59 Years | 455 (5.7%) | 430 (4.8%) |
| 60 to 64 Years | 384 (4.8%) | 605 (6.8%) |
| 65 to 69 Years | 464 (5.8%) | 514 (5.7%) |
| 70 to 74 Years | 268 (3.4%) | 571 (6.4%) |
| 75 to 79 Years | 276 (3.5%) | 227 (2.5%) |
| 80 to 84 Years | 88 (1.1%) | 246 (2.8%) |
| 85 Years and over | 170 (2.1%) | 296 (3.3%) |
| Total | 7,944 (100.0%) | 8,947 (100.0%) |
Families and Households in Colonial Park
Median Family Size in Colonial Park
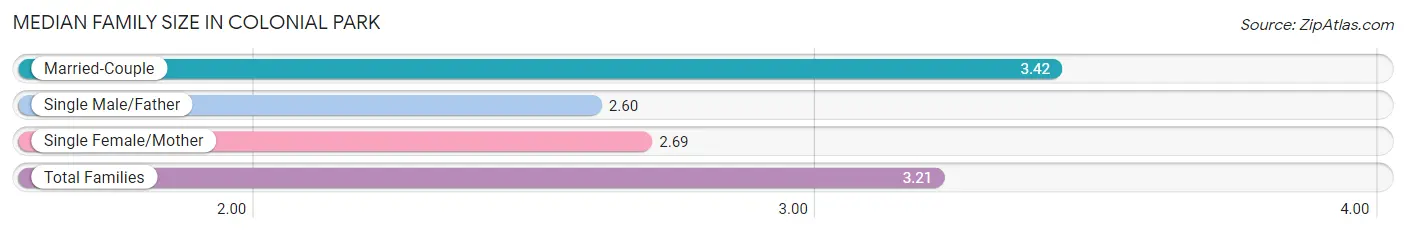
The median family size in Colonial Park is 3.21 persons per family, with married-couple families (2,928 | 72.1%) accounting for the largest median family size of 3.42 persons per family. On the other hand, single male/father families (283 | 7.0%) represent the smallest median family size with 2.60 persons per family.
| Family Type | # Families | Family Size |
| Married-Couple | 2,928 (72.1%) | 3.42 |
| Single Male/Father | 283 (7.0%) | 2.60 |
| Single Female/Mother | 852 (21.0%) | 2.69 |
| Total Families | 4,063 (100.0%) | 3.21 |
Median Household Size in Colonial Park
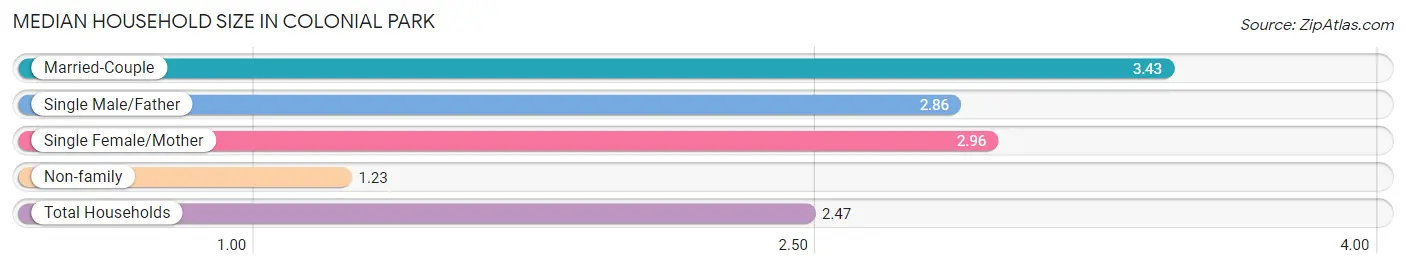
The median household size in Colonial Park is 2.47 persons per household, with married-couple households (2,928 | 43.4%) accounting for the largest median household size of 3.43 persons per household. non-family households (2,683 | 39.8%) represent the smallest median household size with 1.23 persons per household.
| Household Type | # Households | Household Size |
| Married-Couple | 2,928 (43.4%) | 3.43 |
| Single Male/Father | 283 (4.2%) | 2.86 |
| Single Female/Mother | 852 (12.6%) | 2.96 |
| Non-family | 2,683 (39.8%) | 1.23 |
| Total Households | 6,746 (100.0%) | 2.47 |
Household Size by Marriage Status in Colonial Park
Out of a total of 6,746 households in Colonial Park, 4,063 (60.2%) are family households, while 2,683 (39.8%) are nonfamily households. The most numerous type of family households are 2-person households, comprising 2,016, and the most common type of nonfamily households are 1-person households, comprising 2,060.
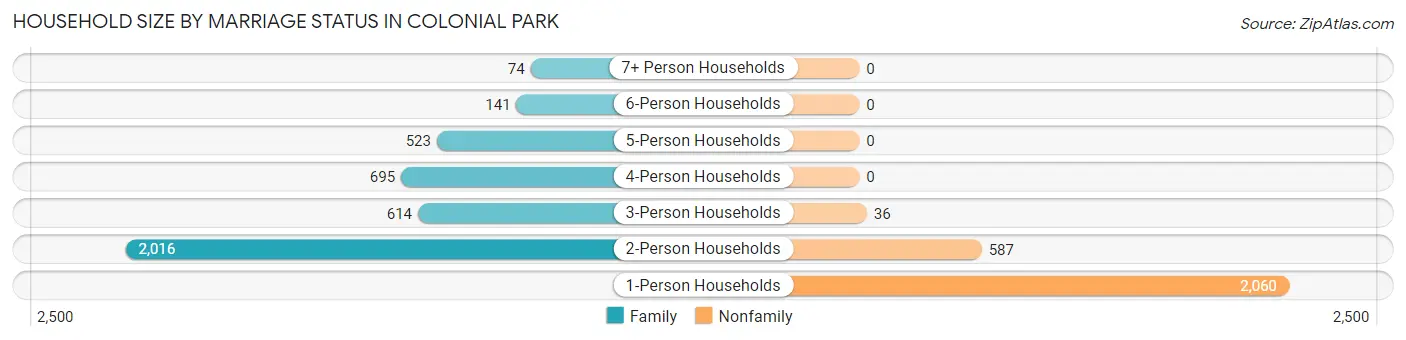
| Household Size | Family Households | Nonfamily Households |
| 1-Person Households | - | 2,060 (30.5%) |
| 2-Person Households | 2,016 (29.9%) | 587 (8.7%) |
| 3-Person Households | 614 (9.1%) | 36 (0.5%) |
| 4-Person Households | 695 (10.3%) | 0 (0.0%) |
| 5-Person Households | 523 (7.7%) | 0 (0.0%) |
| 6-Person Households | 141 (2.1%) | 0 (0.0%) |
| 7+ Person Households | 74 (1.1%) | 0 (0.0%) |
| Total | 4,063 (60.2%) | 2,683 (39.8%) |
Female Fertility in Colonial Park
Fertility by Age in Colonial Park
Average fertility rate in Colonial Park is 32.0 births per 1,000 women. Women in the age bracket of 20 to 34 years have the highest fertility rate with 59.0 births per 1,000 women. Women in the age bracket of 20 to 34 years acount for 93.6% of all women with births.
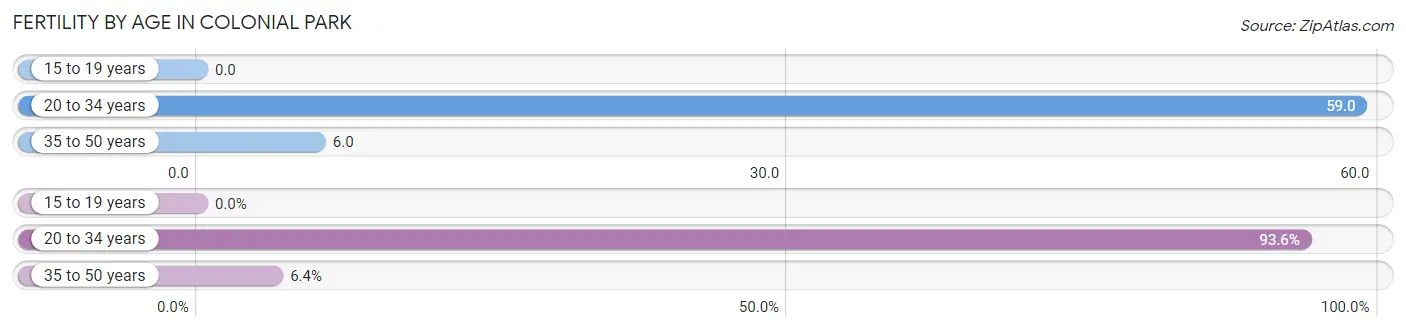
| Age Bracket | Women with Births | Births / 1,000 Women |
| 15 to 19 years | 0 (0.0%) | 0.0 |
| 20 to 34 years | 132 (93.6%) | 59.0 |
| 35 to 50 years | 9 (6.4%) | 6.0 |
| Total | 141 (100.0%) | 32.0 |
Fertility by Age by Marriage Status in Colonial Park
70.2% of women with births (141) in Colonial Park are married. The highest percentage of unmarried women with births falls into 20 to 34 years age bracket with 31.8% of them unmarried at the time of birth, while the lowest percentage of unmarried women with births belong to 35 to 50 years age bracket with 0.0% of them unmarried.
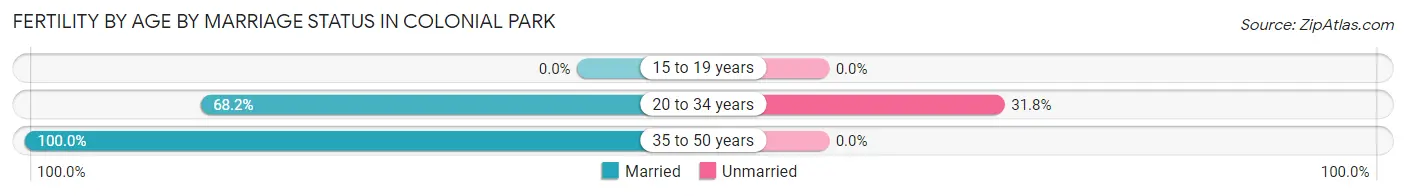
| Age Bracket | Married | Unmarried |
| 15 to 19 years | 0 (0.0%) | 0 (0.0%) |
| 20 to 34 years | 90 (68.2%) | 42 (31.8%) |
| 35 to 50 years | 9 (100.0%) | 0 (0.0%) |
| Total | 99 (70.2%) | 42 (29.8%) |
Fertility by Education in Colonial Park
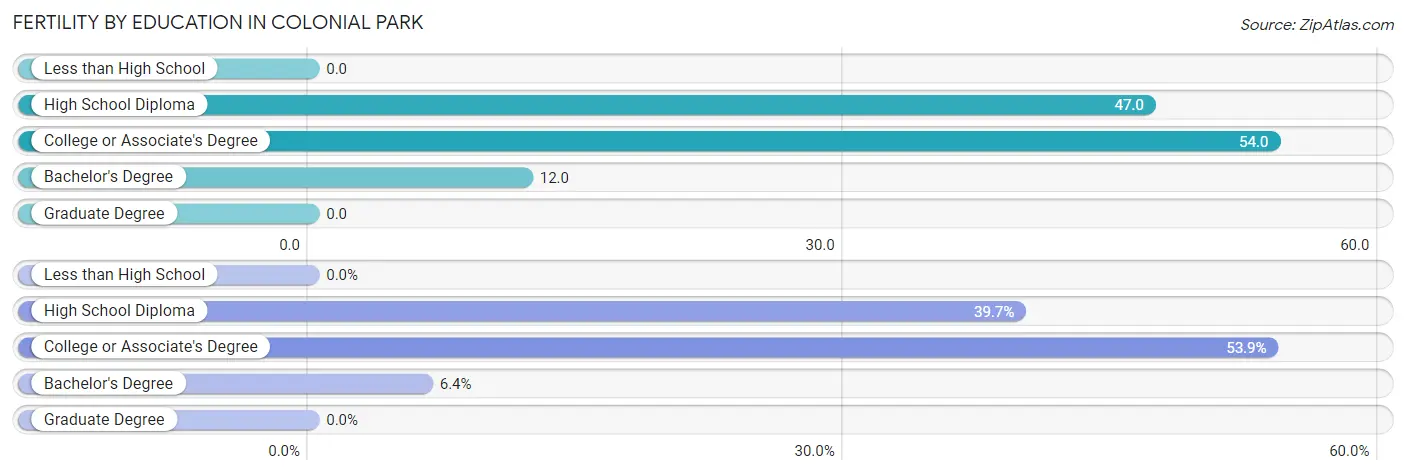
| Educational Attainment | Women with Births | Births / 1,000 Women |
| Less than High School | 0 (0.0%) | 0.0 |
| High School Diploma | 56 (39.7%) | 47.0 |
| College or Associate's Degree | 76 (53.9%) | 54.0 |
| Bachelor's Degree | 9 (6.4%) | 12.0 |
| Graduate Degree | 0 (0.0%) | 0.0 |
| Total | 141 (100.0%) | 32.0 |
Fertility by Education by Marriage Status in Colonial Park
29.8% of women with births in Colonial Park are unmarried. Women with the educational attainment of college or associate's degree are most likely to be married with 100.0% of them married at childbirth, while women with the educational attainment of high school diploma are least likely to be married with 75.0% of them unmarried at childbirth.
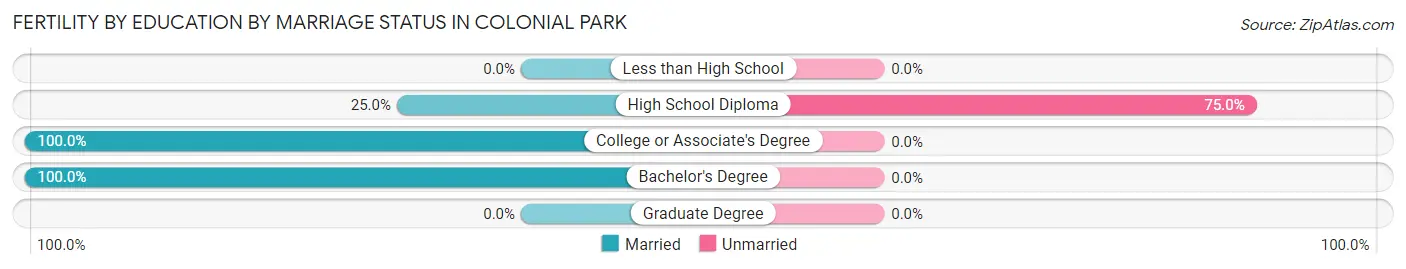
| Educational Attainment | Married | Unmarried |
| Less than High School | 0 (0.0%) | 0 (0.0%) |
| High School Diploma | 14 (25.0%) | 42 (75.0%) |
| College or Associate's Degree | 76 (100.0%) | 0 (0.0%) |
| Bachelor's Degree | 9 (100.0%) | 0 (0.0%) |
| Graduate Degree | 0 (0.0%) | 0 (0.0%) |
| Total | 99 (70.2%) | 42 (29.8%) |
Employment Characteristics in Colonial Park
Employment by Class of Employer in Colonial Park
Among the 8,354 employed individuals in Colonial Park, private company employees (5,758 | 68.9%), state government employees (775 | 9.3%), and not-for-profit organizations (511 | 6.1%) make up the most common classes of employment.
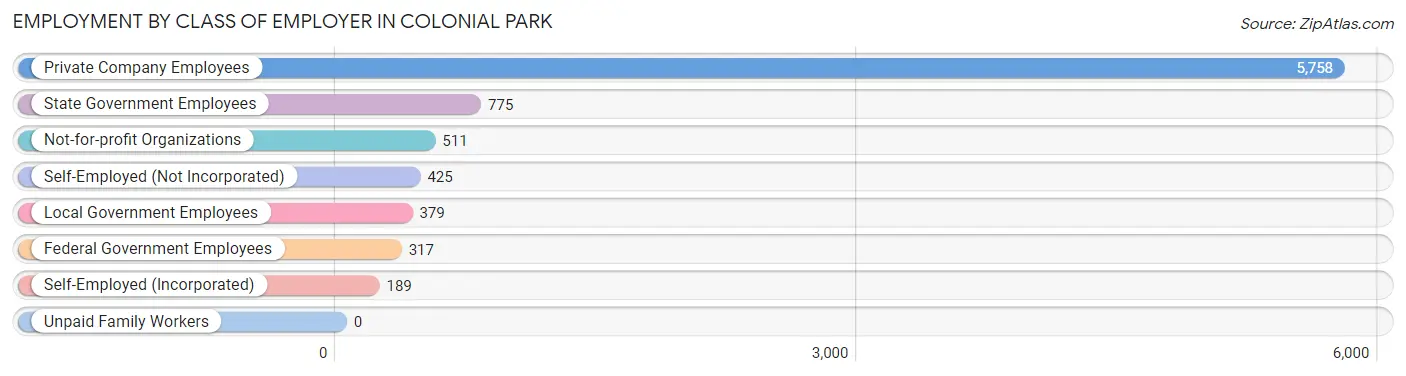
| Employer Class | # Employees | % Employees |
| Private Company Employees | 5,758 | 68.9% |
| Self-Employed (Incorporated) | 189 | 2.3% |
| Self-Employed (Not Incorporated) | 425 | 5.1% |
| Not-for-profit Organizations | 511 | 6.1% |
| Local Government Employees | 379 | 4.5% |
| State Government Employees | 775 | 9.3% |
| Federal Government Employees | 317 | 3.8% |
| Unpaid Family Workers | 0 | 0.0% |
| Total | 8,354 | 100.0% |
Employment Status by Age in Colonial Park
According to the labor force statistics for Colonial Park, out of the total population over 16 years of age (13,625), 65.1% or 8,870 individuals are in the labor force, with 5.3% or 470 of them unemployed. The age group with the highest labor force participation rate is 20 to 24 years, with 93.6% or 1,248 individuals in the labor force. Within the labor force, the 30 to 34 years age range has the highest percentage of unemployed individuals, with 14.8% or 176 of them being unemployed.
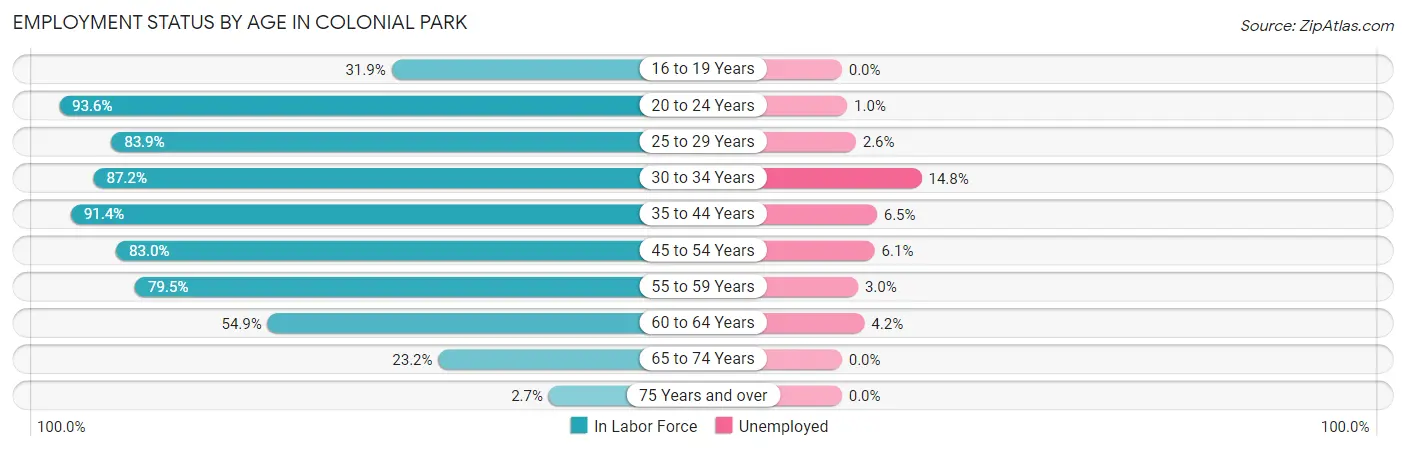
| Age Bracket | In Labor Force | Unemployed |
| 16 to 19 Years | 253 (31.9%) | 0 (0.0%) |
| 20 to 24 Years | 1,248 (93.6%) | 12 (1.0%) |
| 25 to 29 Years | 1,238 (83.9%) | 32 (2.6%) |
| 30 to 34 Years | 1,190 (87.2%) | 176 (14.8%) |
| 35 to 44 Years | 2,167 (91.4%) | 141 (6.5%) |
| 45 to 54 Years | 1,074 (83.0%) | 66 (6.1%) |
| 55 to 59 Years | 704 (79.5%) | 21 (3.0%) |
| 60 to 64 Years | 543 (54.9%) | 23 (4.2%) |
| 65 to 74 Years | 422 (23.2%) | 0 (0.0%) |
| 75 Years and over | 35 (2.7%) | 0 (0.0%) |
| Total | 8,870 (65.1%) | 470 (5.3%) |
Employment Status by Educational Attainment in Colonial Park
According to labor force statistics for Colonial Park, 82.5% of individuals (6,913) out of the total population between 25 and 64 years of age (8,379) are in the labor force, with 6.6% or 456 of them being unemployed. The group with the highest labor force participation rate are those with the educational attainment of bachelor's degree or higher, with 92.5% or 2,004 individuals in the labor force. Within the labor force, individuals with high school diploma education have the highest percentage of unemployment, with 11.0% or 247 of them being unemployed.
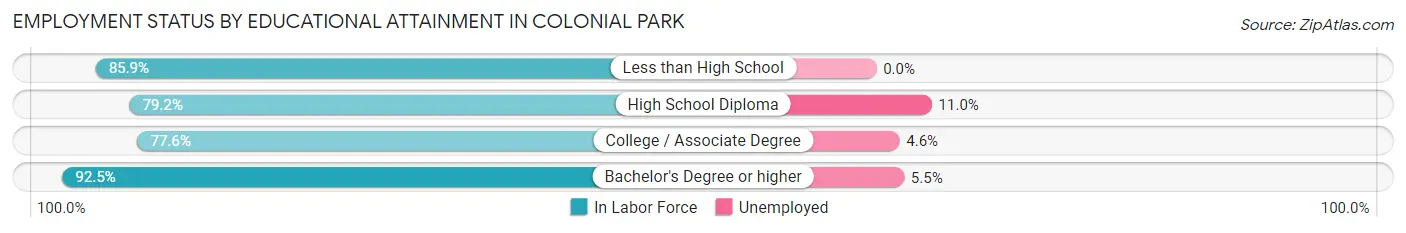
| Educational Attainment | In Labor Force | Unemployed |
| Less than High School | 452 (85.9%) | 0 (0.0%) |
| High School Diploma | 2,241 (79.2%) | 311 (11.0%) |
| College / Associate Degree | 2,218 (77.6%) | 131 (4.6%) |
| Bachelor's Degree or higher | 2,004 (92.5%) | 119 (5.5%) |
| Total | 6,913 (82.5%) | 553 (6.6%) |
Employment Occupations by Sex in Colonial Park
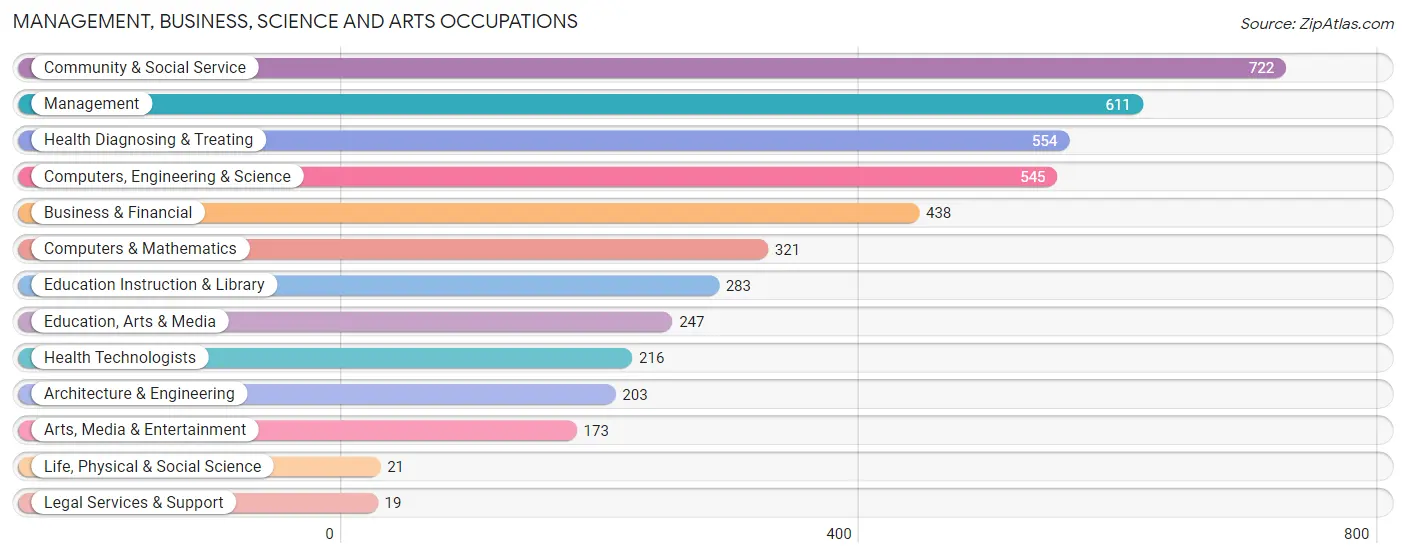
Management, Business, Science and Arts Occupations
The most common Management, Business, Science and Arts occupations in Colonial Park are Community & Social Service (722 | 8.6%), Management (611 | 7.3%), Health Diagnosing & Treating (554 | 6.6%), Computers, Engineering & Science (545 | 6.5%), and Business & Financial (438 | 5.2%).
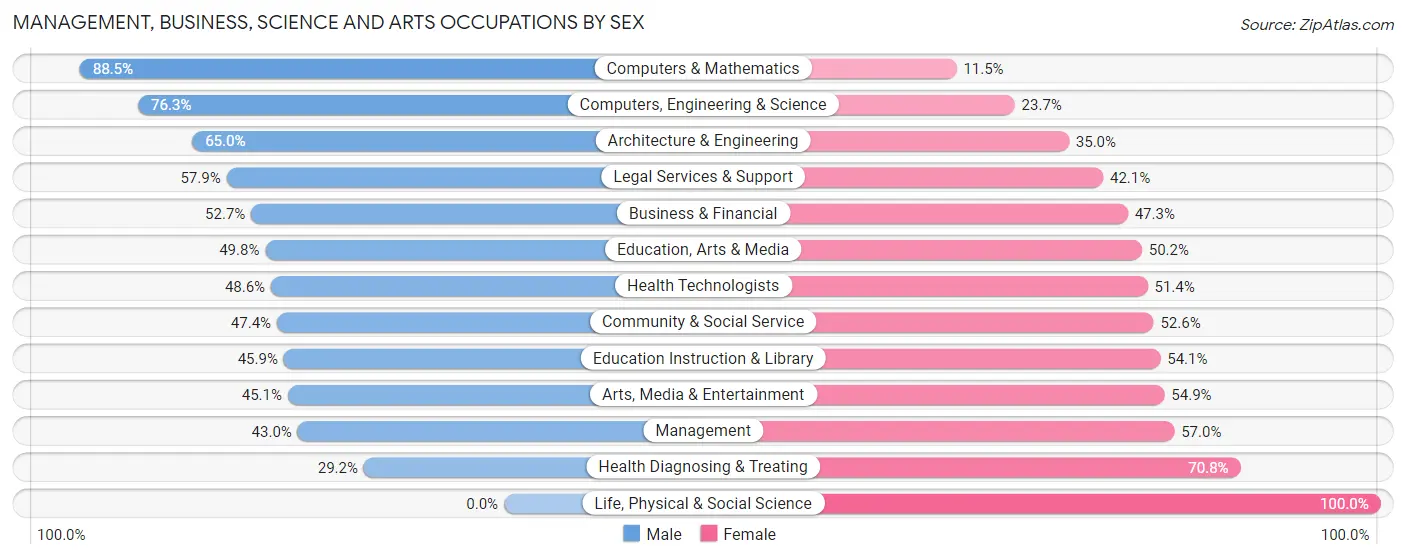
Management, Business, Science and Arts Occupations by Sex
Within the Management, Business, Science and Arts occupations in Colonial Park, the most male-oriented occupations are Computers & Mathematics (88.5%), Computers, Engineering & Science (76.3%), and Architecture & Engineering (65.0%), while the most female-oriented occupations are Life, Physical & Social Science (100.0%), Health Diagnosing & Treating (70.8%), and Management (57.0%).
| Occupation | Male | Female |
| Management | 263 (43.0%) | 348 (57.0%) |
| Business & Financial | 231 (52.7%) | 207 (47.3%) |
| Computers, Engineering & Science | 416 (76.3%) | 129 (23.7%) |
| Computers & Mathematics | 284 (88.5%) | 37 (11.5%) |
| Architecture & Engineering | 132 (65.0%) | 71 (35.0%) |
| Life, Physical & Social Science | 0 (0.0%) | 21 (100.0%) |
| Community & Social Service | 342 (47.4%) | 380 (52.6%) |
| Education, Arts & Media | 123 (49.8%) | 124 (50.2%) |
| Legal Services & Support | 11 (57.9%) | 8 (42.1%) |
| Education Instruction & Library | 130 (45.9%) | 153 (54.1%) |
| Arts, Media & Entertainment | 78 (45.1%) | 95 (54.9%) |
| Health Diagnosing & Treating | 162 (29.2%) | 392 (70.8%) |
| Health Technologists | 105 (48.6%) | 111 (51.4%) |
| Total (Category) | 1,414 (49.3%) | 1,456 (50.7%) |
| Total (Overall) | 4,225 (50.5%) | 4,133 (49.4%) |
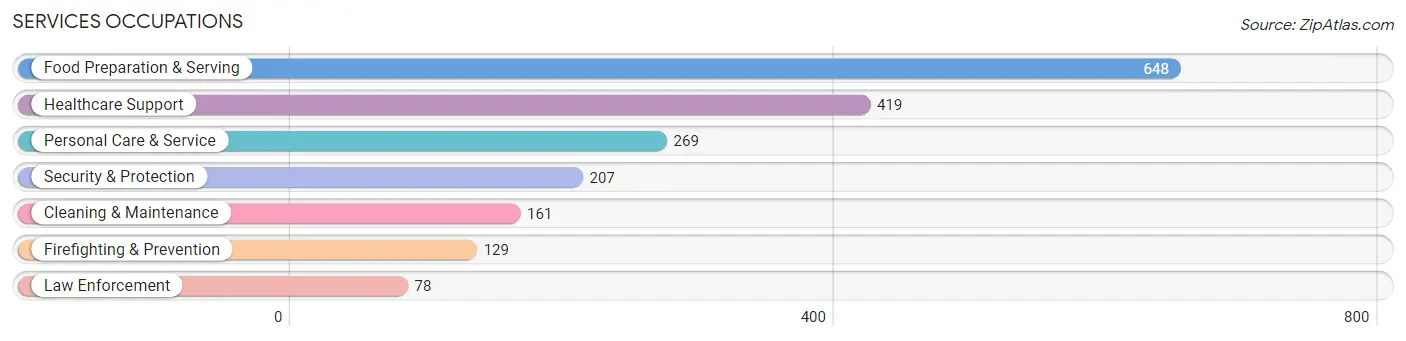
Services Occupations
The most common Services occupations in Colonial Park are Food Preparation & Serving (648 | 7.7%), Healthcare Support (419 | 5.0%), Personal Care & Service (269 | 3.2%), Security & Protection (207 | 2.5%), and Cleaning & Maintenance (161 | 1.9%).
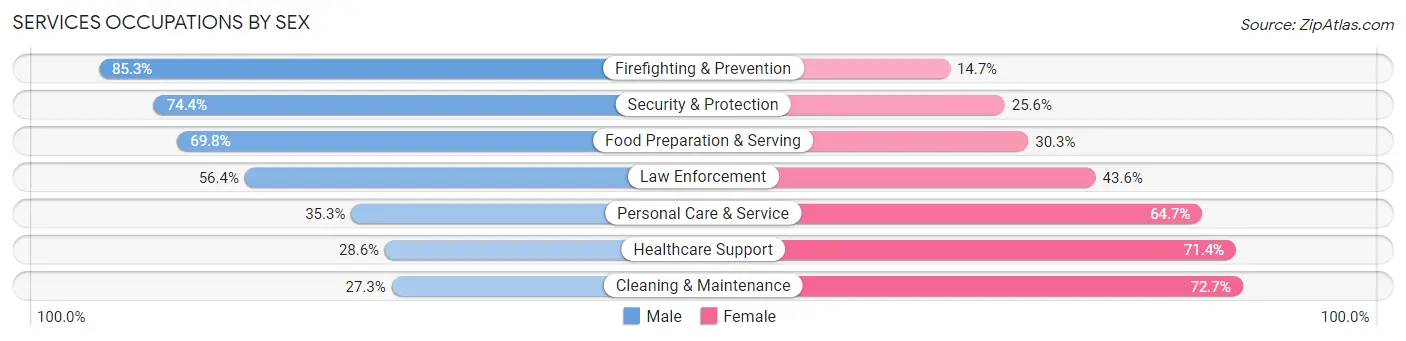
Services Occupations by Sex
Within the Services occupations in Colonial Park, the most male-oriented occupations are Firefighting & Prevention (85.3%), Security & Protection (74.4%), and Food Preparation & Serving (69.8%), while the most female-oriented occupations are Cleaning & Maintenance (72.7%), Healthcare Support (71.4%), and Personal Care & Service (64.7%).
| Occupation | Male | Female |
| Healthcare Support | 120 (28.6%) | 299 (71.4%) |
| Security & Protection | 154 (74.4%) | 53 (25.6%) |
| Firefighting & Prevention | 110 (85.3%) | 19 (14.7%) |
| Law Enforcement | 44 (56.4%) | 34 (43.6%) |
| Food Preparation & Serving | 452 (69.8%) | 196 (30.2%) |
| Cleaning & Maintenance | 44 (27.3%) | 117 (72.7%) |
| Personal Care & Service | 95 (35.3%) | 174 (64.7%) |
| Total (Category) | 865 (50.8%) | 839 (49.2%) |
| Total (Overall) | 4,225 (50.5%) | 4,133 (49.4%) |
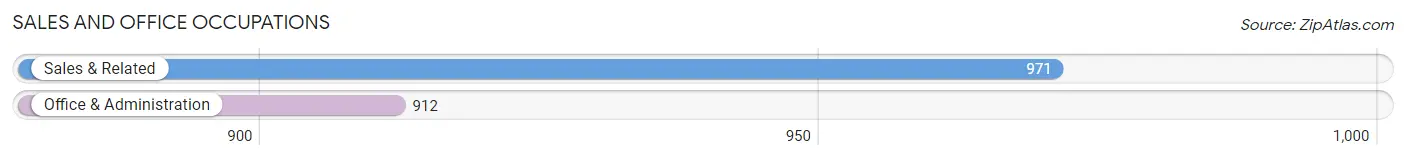
Sales and Office Occupations
The most common Sales and Office occupations in Colonial Park are Sales & Related (971 | 11.6%), and Office & Administration (912 | 10.9%).
Sales and Office Occupations by Sex
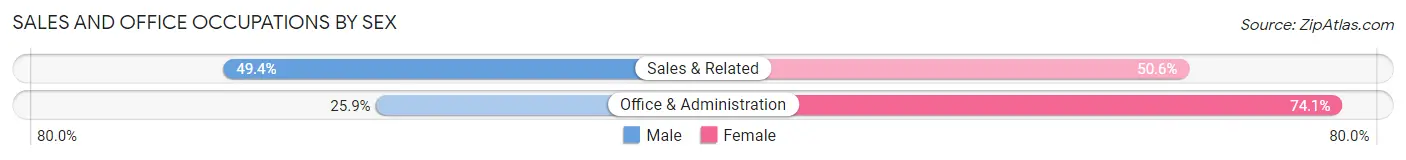
| Occupation | Male | Female |
| Sales & Related | 480 (49.4%) | 491 (50.6%) |
| Office & Administration | 236 (25.9%) | 676 (74.1%) |
| Total (Category) | 716 (38.0%) | 1,167 (62.0%) |
| Total (Overall) | 4,225 (50.5%) | 4,133 (49.4%) |
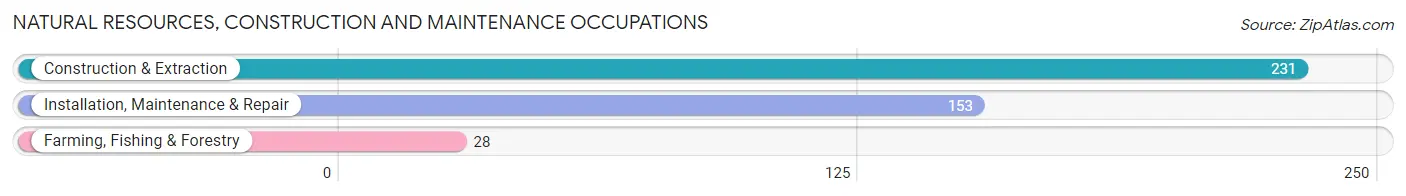
Natural Resources, Construction and Maintenance Occupations
The most common Natural Resources, Construction and Maintenance occupations in Colonial Park are Construction & Extraction (231 | 2.8%), Installation, Maintenance & Repair (153 | 1.8%), and Farming, Fishing & Forestry (28 | 0.3%).
Natural Resources, Construction and Maintenance Occupations by Sex
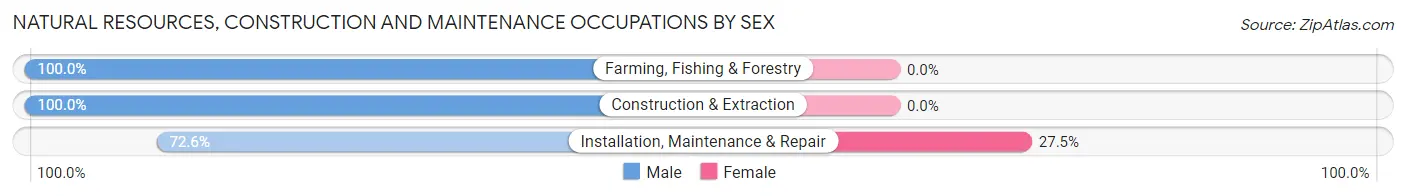
| Occupation | Male | Female |
| Farming, Fishing & Forestry | 28 (100.0%) | 0 (0.0%) |
| Construction & Extraction | 231 (100.0%) | 0 (0.0%) |
| Installation, Maintenance & Repair | 111 (72.6%) | 42 (27.5%) |
| Total (Category) | 370 (89.8%) | 42 (10.2%) |
| Total (Overall) | 4,225 (50.5%) | 4,133 (49.4%) |
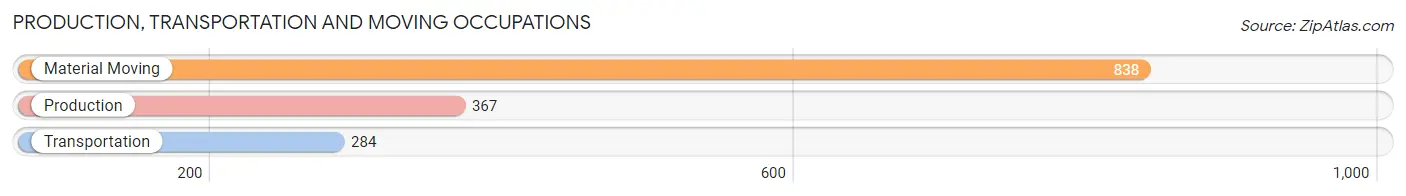
Production, Transportation and Moving Occupations
The most common Production, Transportation and Moving occupations in Colonial Park are Material Moving (838 | 10.0%), Production (367 | 4.4%), and Transportation (284 | 3.4%).
Production, Transportation and Moving Occupations by Sex
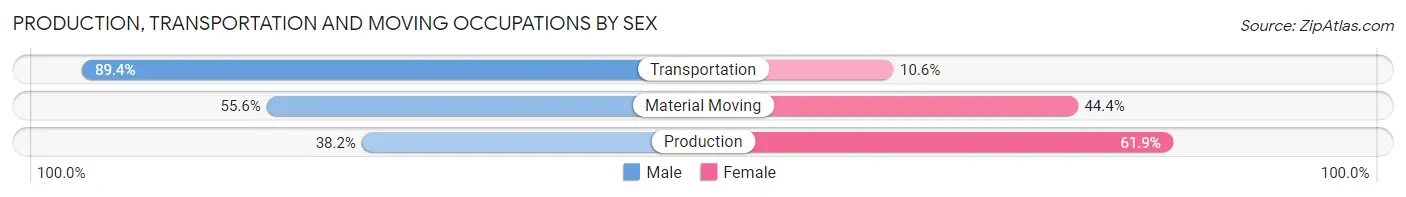
| Occupation | Male | Female |
| Production | 140 (38.2%) | 227 (61.9%) |
| Transportation | 254 (89.4%) | 30 (10.6%) |
| Material Moving | 466 (55.6%) | 372 (44.4%) |
| Total (Category) | 860 (57.8%) | 629 (42.2%) |
| Total (Overall) | 4,225 (50.5%) | 4,133 (49.4%) |
Employment Industries by Sex in Colonial Park
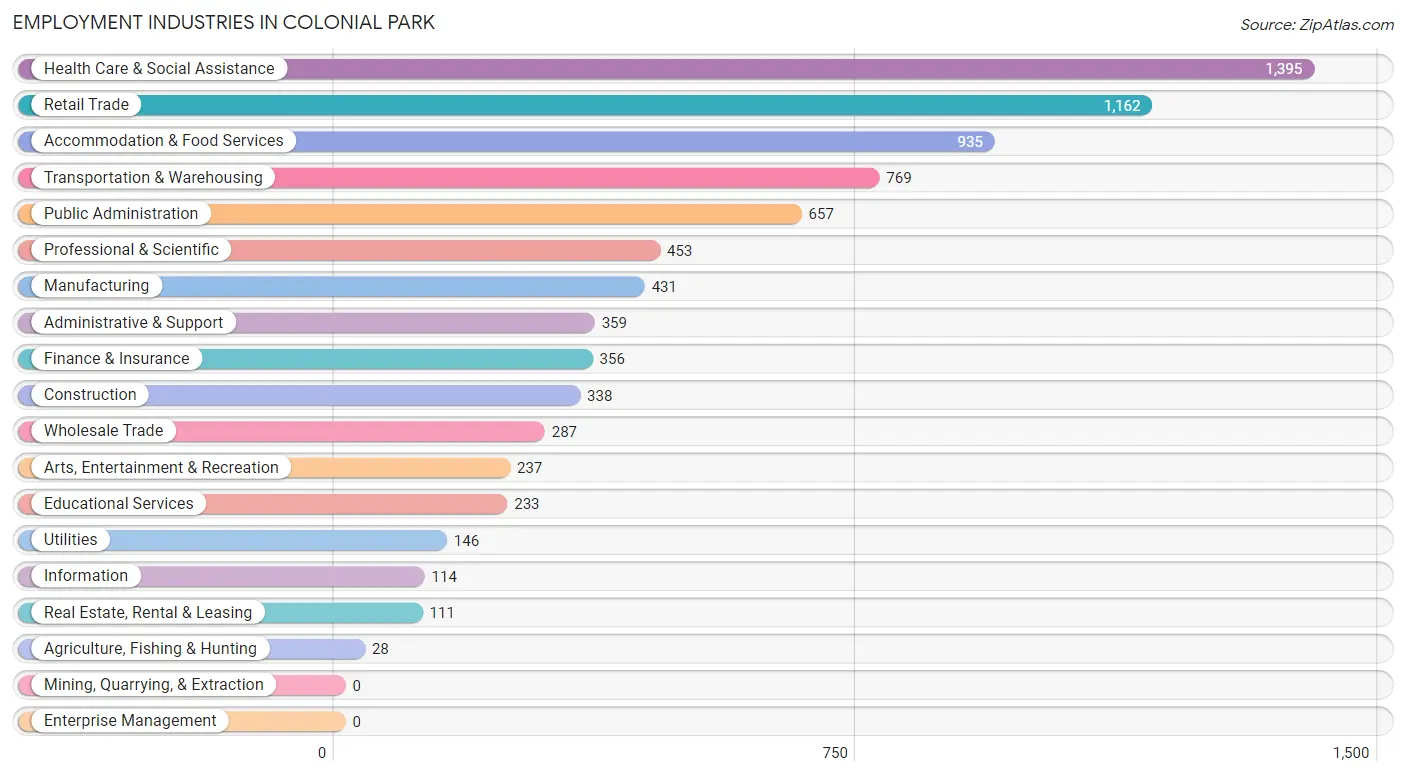
Employment Industries in Colonial Park
The major employment industries in Colonial Park include Health Care & Social Assistance (1,395 | 16.7%), Retail Trade (1,162 | 13.9%), Accommodation & Food Services (935 | 11.2%), Transportation & Warehousing (769 | 9.2%), and Public Administration (657 | 7.9%).
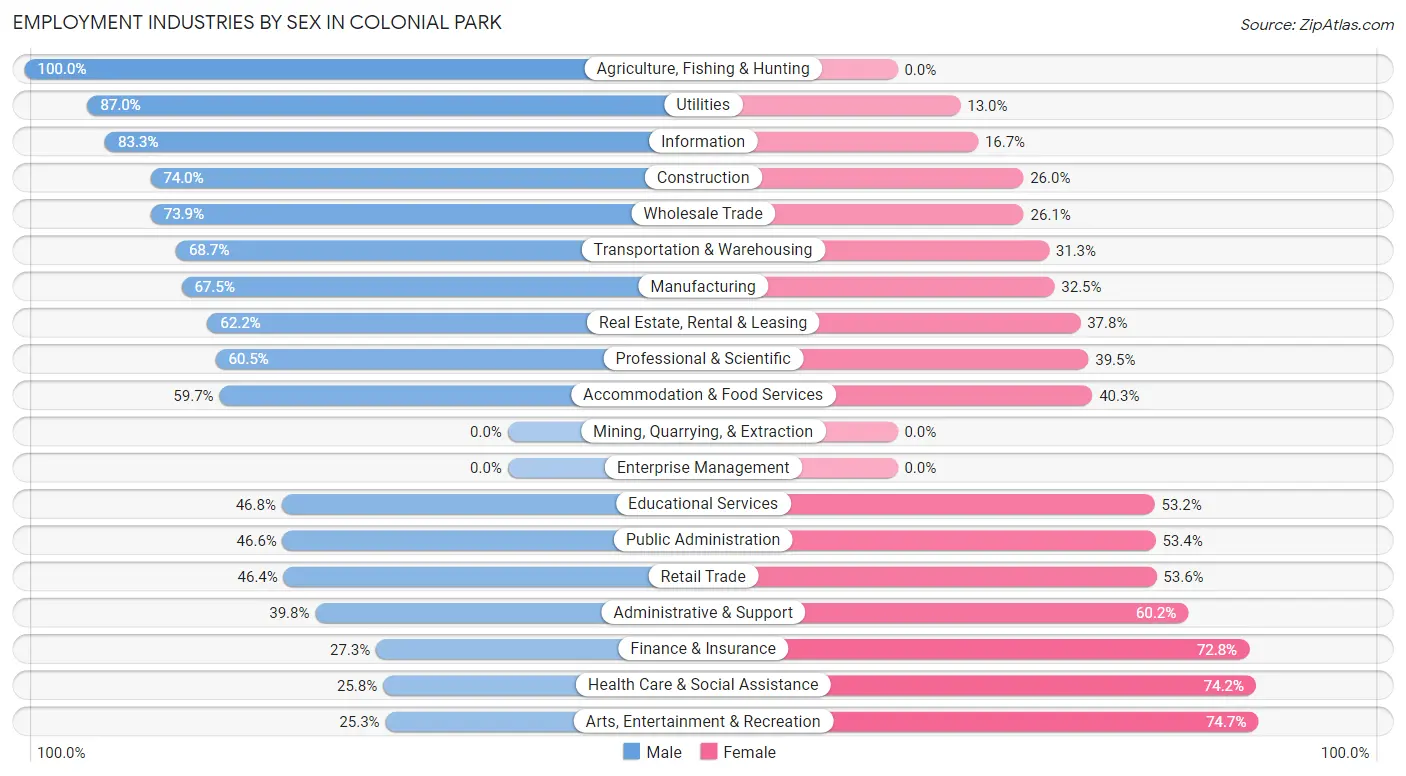
Employment Industries by Sex in Colonial Park
The Colonial Park industries that see more men than women are Agriculture, Fishing & Hunting (100.0%), Utilities (87.0%), and Information (83.3%), whereas the industries that tend to have a higher number of women are Arts, Entertainment & Recreation (74.7%), Health Care & Social Assistance (74.2%), and Finance & Insurance (72.8%).
| Industry | Male | Female |
| Agriculture, Fishing & Hunting | 28 (100.0%) | 0 (0.0%) |
| Mining, Quarrying, & Extraction | 0 (0.0%) | 0 (0.0%) |
| Construction | 250 (74.0%) | 88 (26.0%) |
| Manufacturing | 291 (67.5%) | 140 (32.5%) |
| Wholesale Trade | 212 (73.9%) | 75 (26.1%) |
| Retail Trade | 539 (46.4%) | 623 (53.6%) |
| Transportation & Warehousing | 528 (68.7%) | 241 (31.3%) |
| Utilities | 127 (87.0%) | 19 (13.0%) |
| Information | 95 (83.3%) | 19 (16.7%) |
| Finance & Insurance | 97 (27.3%) | 259 (72.8%) |
| Real Estate, Rental & Leasing | 69 (62.2%) | 42 (37.8%) |
| Professional & Scientific | 274 (60.5%) | 179 (39.5%) |
| Enterprise Management | 0 (0.0%) | 0 (0.0%) |
| Administrative & Support | 143 (39.8%) | 216 (60.2%) |
| Educational Services | 109 (46.8%) | 124 (53.2%) |
| Health Care & Social Assistance | 360 (25.8%) | 1,035 (74.2%) |
| Arts, Entertainment & Recreation | 60 (25.3%) | 177 (74.7%) |
| Accommodation & Food Services | 558 (59.7%) | 377 (40.3%) |
| Public Administration | 306 (46.6%) | 351 (53.4%) |
| Total | 4,225 (50.5%) | 4,133 (49.4%) |
Education in Colonial Park
School Enrollment in Colonial Park
The most common levels of schooling among the 3,807 students in Colonial Park are high school (1,032 | 27.1%), elementary school (864 | 22.7%), and college / undergraduate (696 | 18.3%).
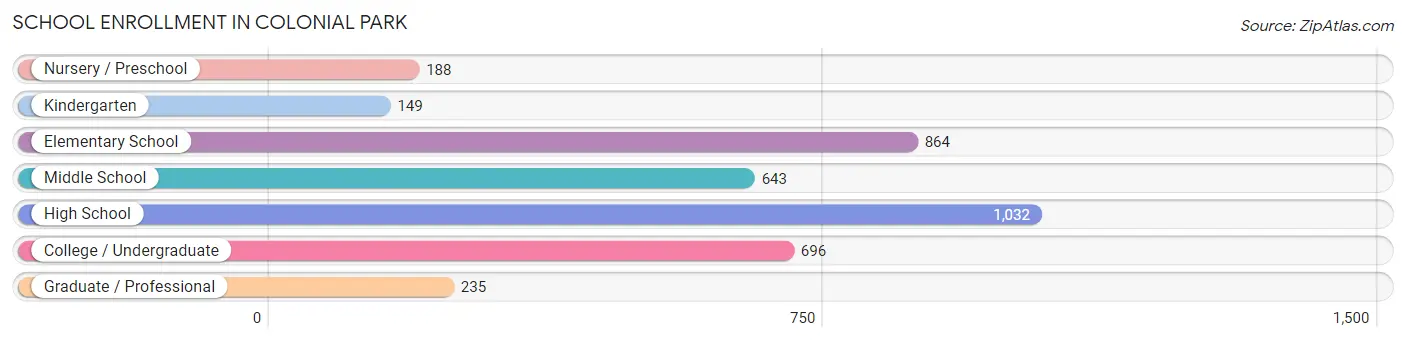
| School Level | # Students | % Students |
| Nursery / Preschool | 188 | 4.9% |
| Kindergarten | 149 | 3.9% |
| Elementary School | 864 | 22.7% |
| Middle School | 643 | 16.9% |
| High School | 1,032 | 27.1% |
| College / Undergraduate | 696 | 18.3% |
| Graduate / Professional | 235 | 6.2% |
| Total | 3,807 | 100.0% |
School Enrollment by Age by Funding Source in Colonial Park
Out of a total of 3,807 students who are enrolled in schools in Colonial Park, 670 (17.6%) attend a private institution, while the remaining 3,137 (82.4%) are enrolled in public schools. The age group of 35 years and over has the highest likelihood of being enrolled in private schools, with 159 (38.3% in the age bracket) enrolled. Conversely, the age group of 5 to 9 year old has the lowest likelihood of being enrolled in a private school, with 975 (95.5% in the age bracket) attending a public institution.
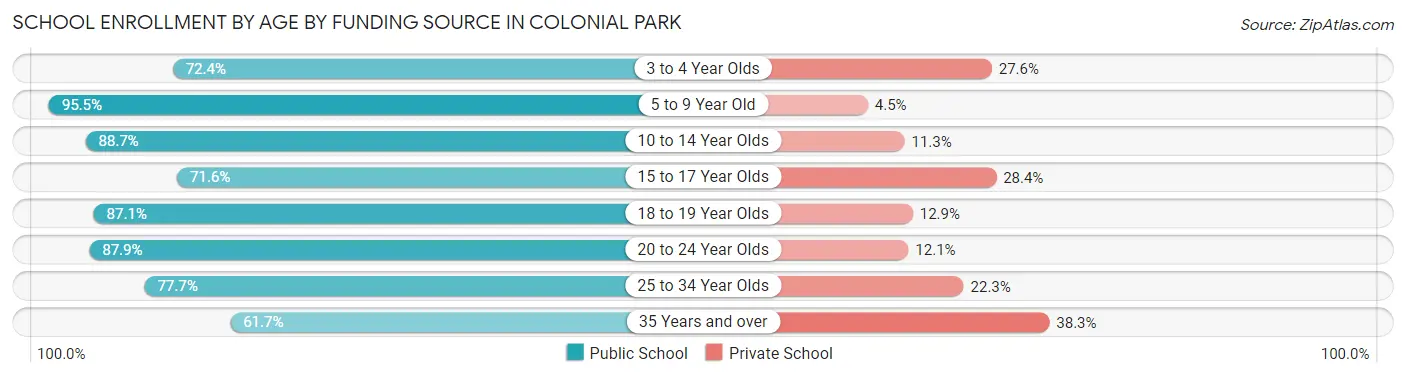
| Age Bracket | Public School | Private School |
| 3 to 4 Year Olds | 84 (72.4%) | 32 (27.6%) |
| 5 to 9 Year Old | 975 (95.5%) | 46 (4.5%) |
| 10 to 14 Year Olds | 641 (88.7%) | 82 (11.3%) |
| 15 to 17 Year Olds | 640 (71.6%) | 254 (28.4%) |
| 18 to 19 Year Olds | 88 (87.1%) | 13 (12.9%) |
| 20 to 24 Year Olds | 299 (87.9%) | 41 (12.1%) |
| 25 to 34 Year Olds | 153 (77.7%) | 44 (22.3%) |
| 35 Years and over | 256 (61.7%) | 159 (38.3%) |
| Total | 3,137 (82.4%) | 670 (17.6%) |
Educational Attainment by Field of Study in Colonial Park
Business (451 | 14.7%), social sciences (292 | 9.6%), education (280 | 9.1%), engineering (276 | 9.0%), and arts & humanities (275 | 9.0%) are the most common fields of study among 3,059 individuals in Colonial Park who have obtained a bachelor's degree or higher.
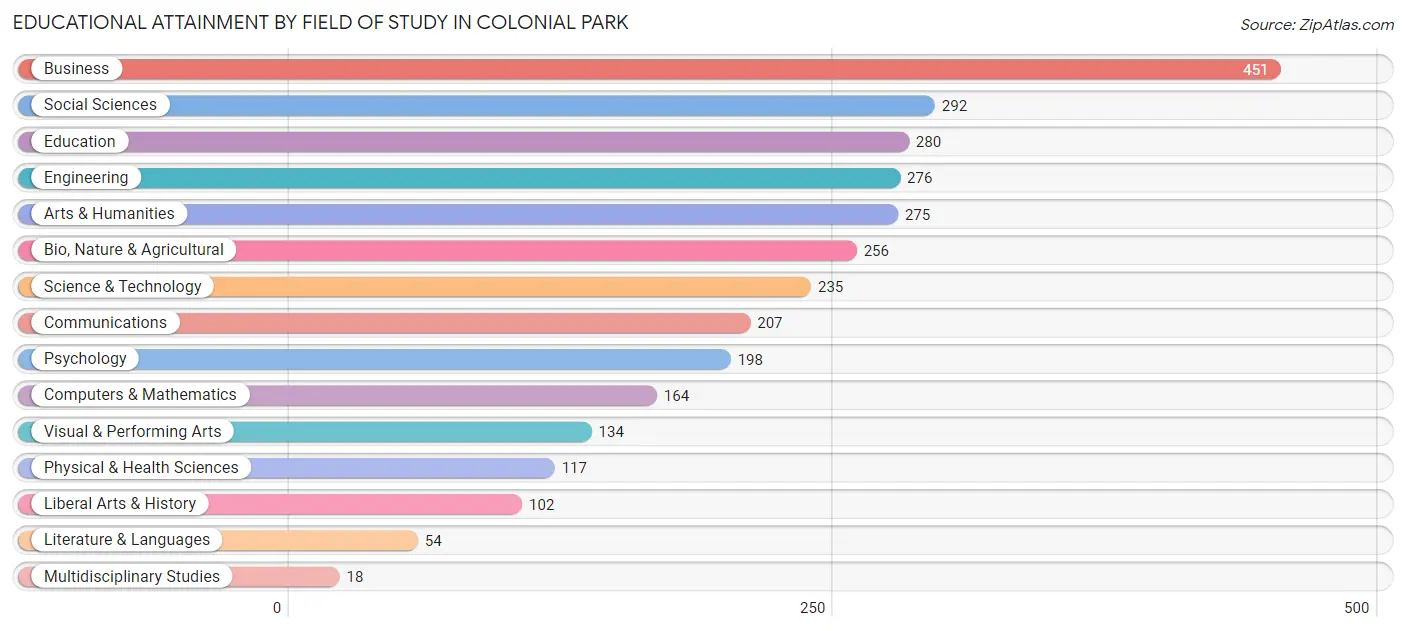
| Field of Study | # Graduates | % Graduates |
| Computers & Mathematics | 164 | 5.4% |
| Bio, Nature & Agricultural | 256 | 8.4% |
| Physical & Health Sciences | 117 | 3.8% |
| Psychology | 198 | 6.5% |
| Social Sciences | 292 | 9.6% |
| Engineering | 276 | 9.0% |
| Multidisciplinary Studies | 18 | 0.6% |
| Science & Technology | 235 | 7.7% |
| Business | 451 | 14.7% |
| Education | 280 | 9.1% |
| Literature & Languages | 54 | 1.8% |
| Liberal Arts & History | 102 | 3.3% |
| Visual & Performing Arts | 134 | 4.4% |
| Communications | 207 | 6.8% |
| Arts & Humanities | 275 | 9.0% |
| Total | 3,059 | 100.0% |
Transportation & Commute in Colonial Park
Vehicle Availability by Sex in Colonial Park
The most prevalent vehicle ownership categories in Colonial Park are males with 2 vehicles (1,814, accounting for 42.6%) and females with 2 vehicles (1,619, making up 44.3%).
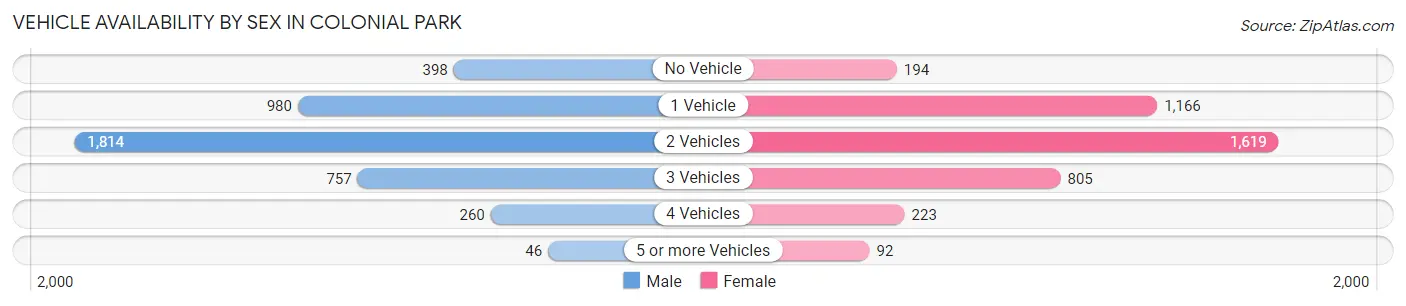
| Vehicles Available | Male | Female |
| No Vehicle | 398 (9.3%) | 194 (4.7%) |
| 1 Vehicle | 980 (23.0%) | 1,166 (28.4%) |
| 2 Vehicles | 1,814 (42.6%) | 1,619 (39.5%) |
| 3 Vehicles | 757 (17.8%) | 805 (19.6%) |
| 4 Vehicles | 260 (6.1%) | 223 (5.4%) |
| 5 or more Vehicles | 46 (1.1%) | 92 (2.2%) |
| Total | 4,255 (100.0%) | 4,099 (100.0%) |
Commute Time in Colonial Park
The most frequently occuring commute durations in Colonial Park are 15 to 19 minutes (1,391 commuters, 18.9%), 10 to 14 minutes (1,264 commuters, 17.2%), and 30 to 34 minutes (1,103 commuters, 15.0%).
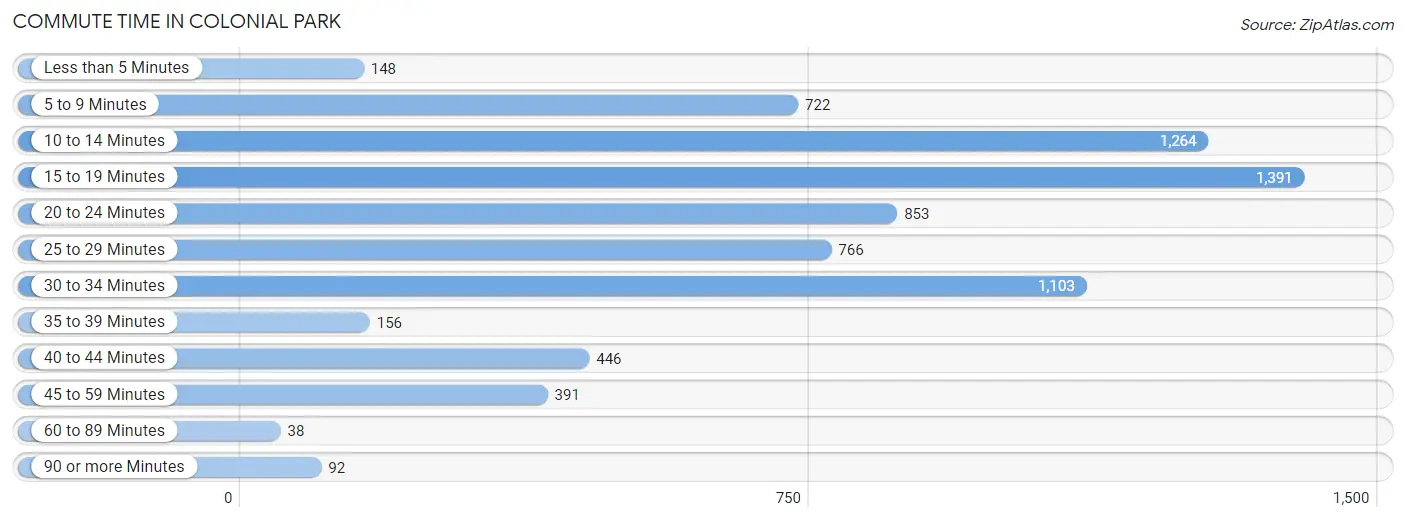
| Commute Time | # Commuters | % Commuters |
| Less than 5 Minutes | 148 | 2.0% |
| 5 to 9 Minutes | 722 | 9.8% |
| 10 to 14 Minutes | 1,264 | 17.2% |
| 15 to 19 Minutes | 1,391 | 18.9% |
| 20 to 24 Minutes | 853 | 11.6% |
| 25 to 29 Minutes | 766 | 10.4% |
| 30 to 34 Minutes | 1,103 | 15.0% |
| 35 to 39 Minutes | 156 | 2.1% |
| 40 to 44 Minutes | 446 | 6.0% |
| 45 to 59 Minutes | 391 | 5.3% |
| 60 to 89 Minutes | 38 | 0.5% |
| 90 or more Minutes | 92 | 1.3% |
Commute Time by Sex in Colonial Park
The most common commute times in Colonial Park are 10 to 14 minutes (722 commuters, 18.9%) for males and 15 to 19 minutes (704 commuters, 19.9%) for females.
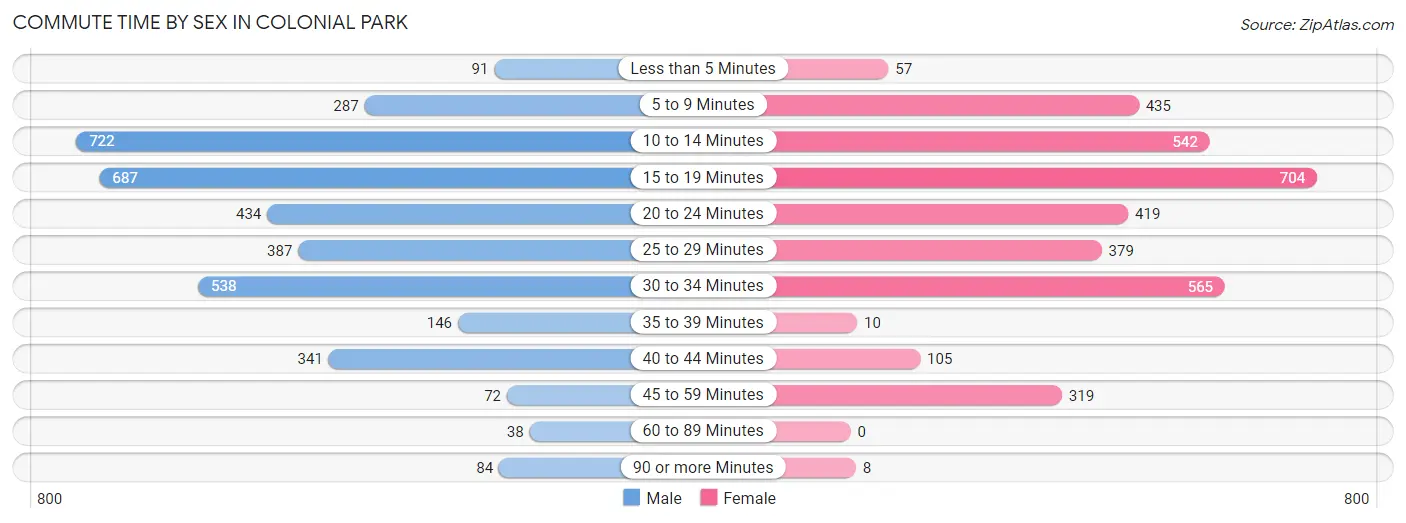
| Commute Time | Male | Female |
| Less than 5 Minutes | 91 (2.4%) | 57 (1.6%) |
| 5 to 9 Minutes | 287 (7.5%) | 435 (12.3%) |
| 10 to 14 Minutes | 722 (18.9%) | 542 (15.3%) |
| 15 to 19 Minutes | 687 (17.9%) | 704 (19.9%) |
| 20 to 24 Minutes | 434 (11.3%) | 419 (11.8%) |
| 25 to 29 Minutes | 387 (10.1%) | 379 (10.7%) |
| 30 to 34 Minutes | 538 (14.1%) | 565 (16.0%) |
| 35 to 39 Minutes | 146 (3.8%) | 10 (0.3%) |
| 40 to 44 Minutes | 341 (8.9%) | 105 (3.0%) |
| 45 to 59 Minutes | 72 (1.9%) | 319 (9.0%) |
| 60 to 89 Minutes | 38 (1.0%) | 0 (0.0%) |
| 90 or more Minutes | 84 (2.2%) | 8 (0.2%) |
Time of Departure to Work by Sex in Colonial Park
The most frequent times of departure to work in Colonial Park are 7:00 AM to 7:29 AM (511, 13.4%) for males and 6:30 AM to 6:59 AM (501, 14.1%) for females.
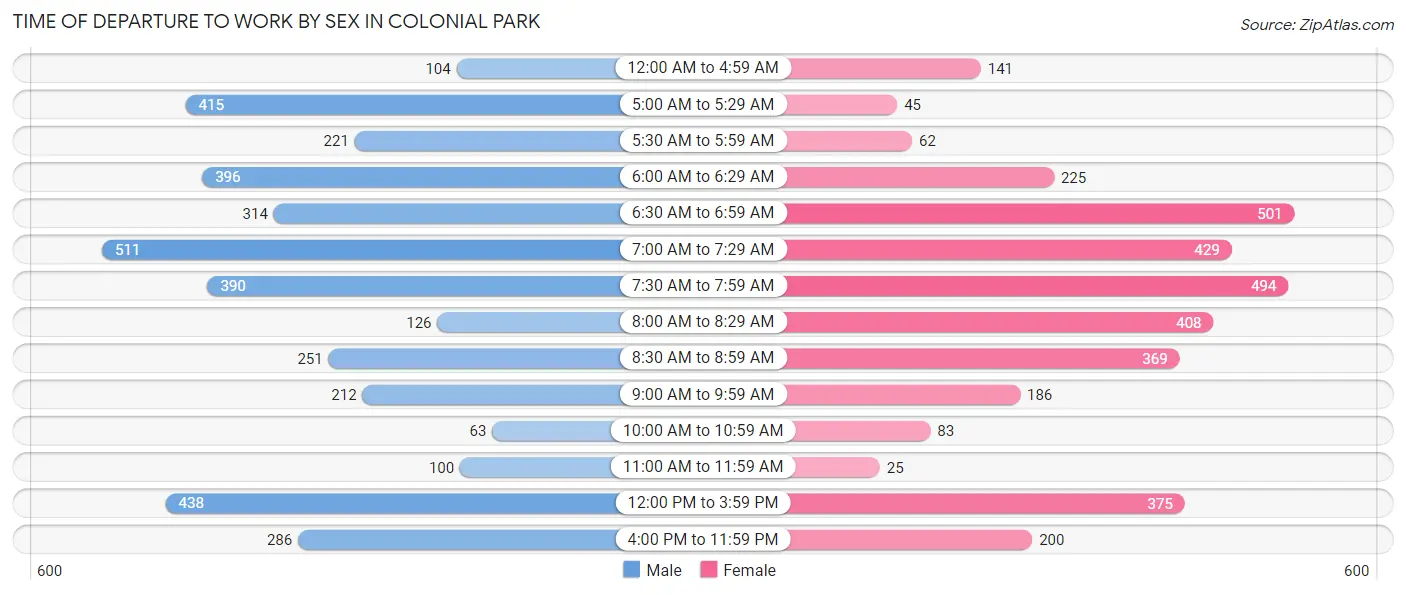
| Time of Departure | Male | Female |
| 12:00 AM to 4:59 AM | 104 (2.7%) | 141 (4.0%) |
| 5:00 AM to 5:29 AM | 415 (10.8%) | 45 (1.3%) |
| 5:30 AM to 5:59 AM | 221 (5.8%) | 62 (1.8%) |
| 6:00 AM to 6:29 AM | 396 (10.3%) | 225 (6.4%) |
| 6:30 AM to 6:59 AM | 314 (8.2%) | 501 (14.1%) |
| 7:00 AM to 7:29 AM | 511 (13.4%) | 429 (12.1%) |
| 7:30 AM to 7:59 AM | 390 (10.2%) | 494 (13.9%) |
| 8:00 AM to 8:29 AM | 126 (3.3%) | 408 (11.5%) |
| 8:30 AM to 8:59 AM | 251 (6.6%) | 369 (10.4%) |
| 9:00 AM to 9:59 AM | 212 (5.5%) | 186 (5.2%) |
| 10:00 AM to 10:59 AM | 63 (1.7%) | 83 (2.3%) |
| 11:00 AM to 11:59 AM | 100 (2.6%) | 25 (0.7%) |
| 12:00 PM to 3:59 PM | 438 (11.4%) | 375 (10.6%) |
| 4:00 PM to 11:59 PM | 286 (7.5%) | 200 (5.6%) |
| Total | 3,827 (100.0%) | 3,543 (100.0%) |
Housing Occupancy in Colonial Park
Occupancy by Ownership in Colonial Park
Of the total 6,746 dwellings in Colonial Park, owner-occupied units account for 3,408 (50.5%), while renter-occupied units make up 3,338 (49.5%).
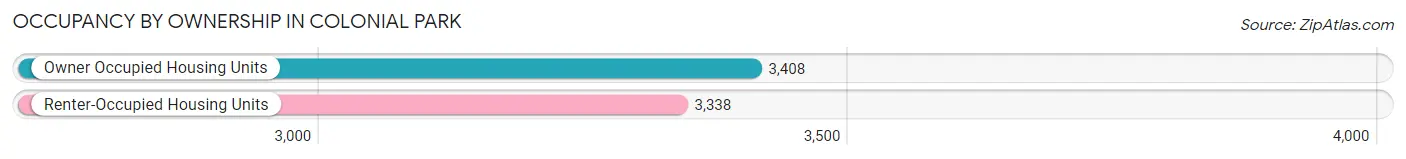
| Occupancy | # Housing Units | % Housing Units |
| Owner Occupied Housing Units | 3,408 | 50.5% |
| Renter-Occupied Housing Units | 3,338 | 49.5% |
| Total Occupied Housing Units | 6,746 | 100.0% |
Occupancy by Household Size in Colonial Park
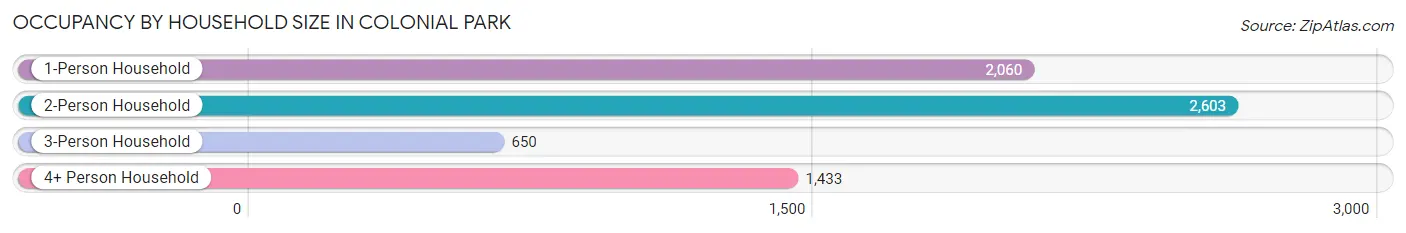
| Household Size | # Housing Units | % Housing Units |
| 1-Person Household | 2,060 | 30.5% |
| 2-Person Household | 2,603 | 38.6% |
| 3-Person Household | 650 | 9.6% |
| 4+ Person Household | 1,433 | 21.2% |
| Total Housing Units | 6,746 | 100.0% |
Occupancy by Ownership by Household Size in Colonial Park
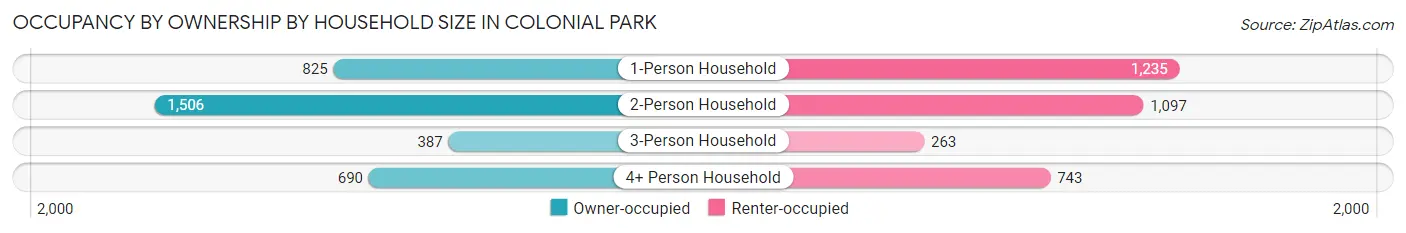
| Household Size | Owner-occupied | Renter-occupied |
| 1-Person Household | 825 (40.1%) | 1,235 (60.0%) |
| 2-Person Household | 1,506 (57.9%) | 1,097 (42.1%) |
| 3-Person Household | 387 (59.5%) | 263 (40.5%) |
| 4+ Person Household | 690 (48.1%) | 743 (51.8%) |
| Total Housing Units | 3,408 (50.5%) | 3,338 (49.5%) |
Occupancy by Educational Attainment in Colonial Park
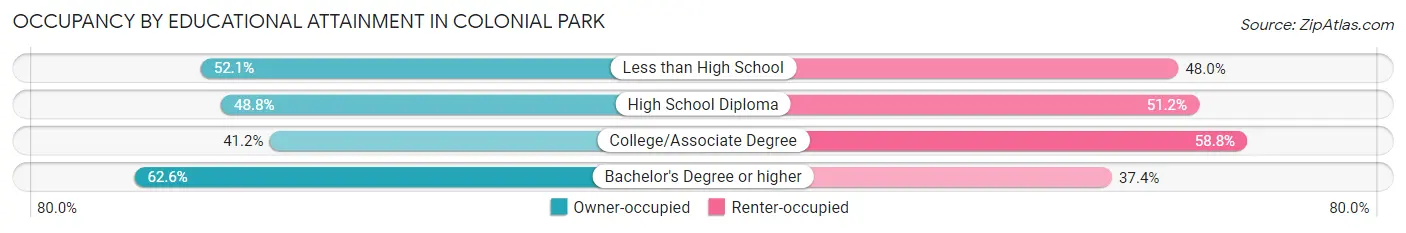
| Household Size | Owner-occupied | Renter-occupied |
| Less than High School | 228 (52.0%) | 210 (47.9%) |
| High School Diploma | 1,097 (48.8%) | 1,150 (51.2%) |
| College/Associate Degree | 883 (41.2%) | 1,260 (58.8%) |
| Bachelor's Degree or higher | 1,200 (62.6%) | 718 (37.4%) |
Occupancy by Age of Householder in Colonial Park
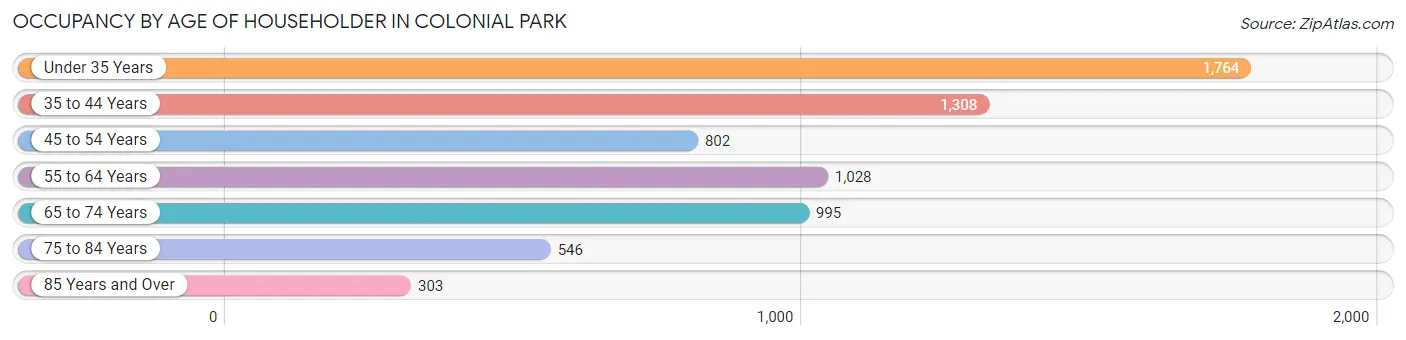
| Age Bracket | # Households | % Households |
| Under 35 Years | 1,764 | 26.2% |
| 35 to 44 Years | 1,308 | 19.4% |
| 45 to 54 Years | 802 | 11.9% |
| 55 to 64 Years | 1,028 | 15.2% |
| 65 to 74 Years | 995 | 14.7% |
| 75 to 84 Years | 546 | 8.1% |
| 85 Years and Over | 303 | 4.5% |
| Total | 6,746 | 100.0% |
Housing Finances in Colonial Park
Median Income by Occupancy in Colonial Park
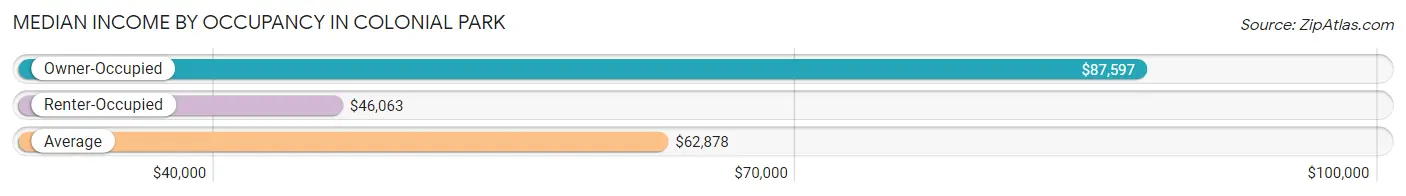
| Occupancy Type | # Households | Median Income |
| Owner-Occupied | 3,408 (50.5%) | $87,597 |
| Renter-Occupied | 3,338 (49.5%) | $46,063 |
| Average | 6,746 (100.0%) | $62,878 |
Occupancy by Householder Income Bracket in Colonial Park
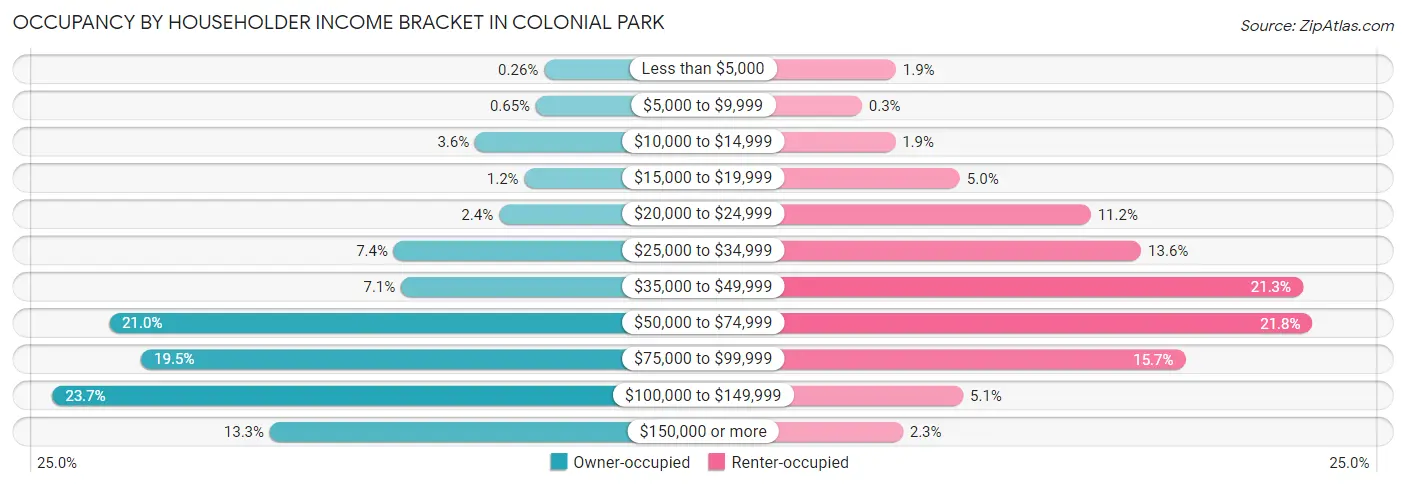
| Income Bracket | Owner-occupied | Renter-occupied |
| Less than $5,000 | 9 (0.3%) | 64 (1.9%) |
| $5,000 to $9,999 | 22 (0.6%) | 10 (0.3%) |
| $10,000 to $14,999 | 121 (3.5%) | 63 (1.9%) |
| $15,000 to $19,999 | 41 (1.2%) | 166 (5.0%) |
| $20,000 to $24,999 | 82 (2.4%) | 374 (11.2%) |
| $25,000 to $34,999 | 253 (7.4%) | 454 (13.6%) |
| $35,000 to $49,999 | 241 (7.1%) | 711 (21.3%) |
| $50,000 to $74,999 | 715 (21.0%) | 726 (21.7%) |
| $75,000 to $99,999 | 663 (19.5%) | 524 (15.7%) |
| $100,000 to $149,999 | 807 (23.7%) | 171 (5.1%) |
| $150,000 or more | 454 (13.3%) | 75 (2.2%) |
| Total | 3,408 (100.0%) | 3,338 (100.0%) |
Monthly Housing Cost Tiers in Colonial Park
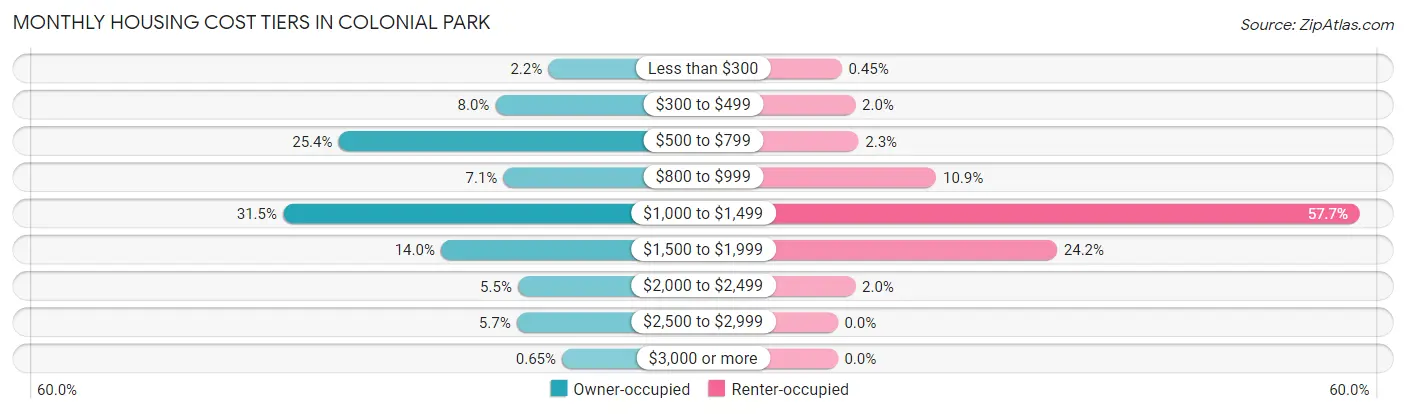
| Monthly Cost | Owner-occupied | Renter-occupied |
| Less than $300 | 74 (2.2%) | 15 (0.4%) |
| $300 to $499 | 273 (8.0%) | 65 (1.9%) |
| $500 to $799 | 864 (25.4%) | 77 (2.3%) |
| $800 to $999 | 243 (7.1%) | 364 (10.9%) |
| $1,000 to $1,499 | 1,073 (31.5%) | 1,926 (57.7%) |
| $1,500 to $1,999 | 478 (14.0%) | 809 (24.2%) |
| $2,000 to $2,499 | 188 (5.5%) | 65 (1.9%) |
| $2,500 to $2,999 | 193 (5.7%) | 0 (0.0%) |
| $3,000 or more | 22 (0.6%) | 0 (0.0%) |
| Total | 3,408 (100.0%) | 3,338 (100.0%) |
Physical Housing Characteristics in Colonial Park
Housing Structures in Colonial Park
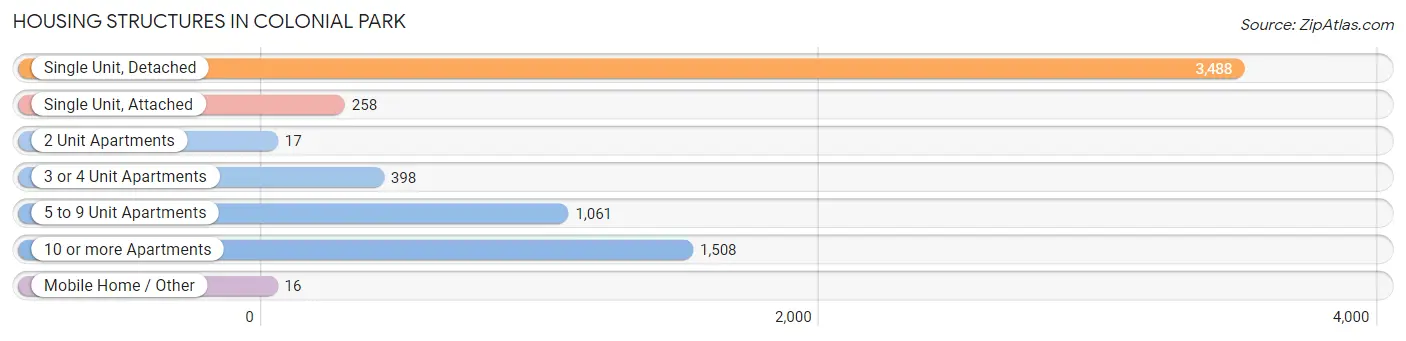
| Structure Type | # Housing Units | % Housing Units |
| Single Unit, Detached | 3,488 | 51.7% |
| Single Unit, Attached | 258 | 3.8% |
| 2 Unit Apartments | 17 | 0.3% |
| 3 or 4 Unit Apartments | 398 | 5.9% |
| 5 to 9 Unit Apartments | 1,061 | 15.7% |
| 10 or more Apartments | 1,508 | 22.4% |
| Mobile Home / Other | 16 | 0.2% |
| Total | 6,746 | 100.0% |
Housing Structures by Occupancy in Colonial Park
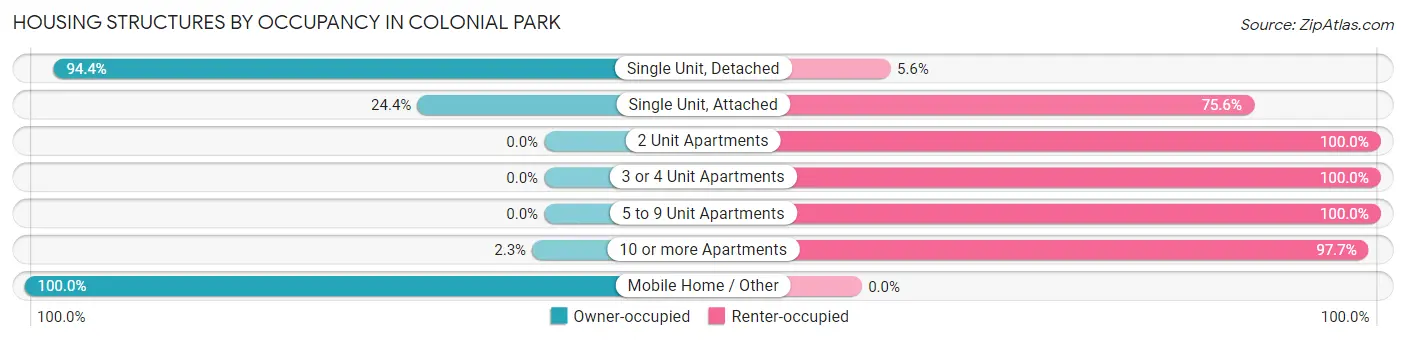
| Structure Type | Owner-occupied | Renter-occupied |
| Single Unit, Detached | 3,294 (94.4%) | 194 (5.6%) |
| Single Unit, Attached | 63 (24.4%) | 195 (75.6%) |
| 2 Unit Apartments | 0 (0.0%) | 17 (100.0%) |
| 3 or 4 Unit Apartments | 0 (0.0%) | 398 (100.0%) |
| 5 to 9 Unit Apartments | 0 (0.0%) | 1,061 (100.0%) |
| 10 or more Apartments | 35 (2.3%) | 1,473 (97.7%) |
| Mobile Home / Other | 16 (100.0%) | 0 (0.0%) |
| Total | 3,408 (50.5%) | 3,338 (49.5%) |
Housing Structures by Number of Rooms in Colonial Park
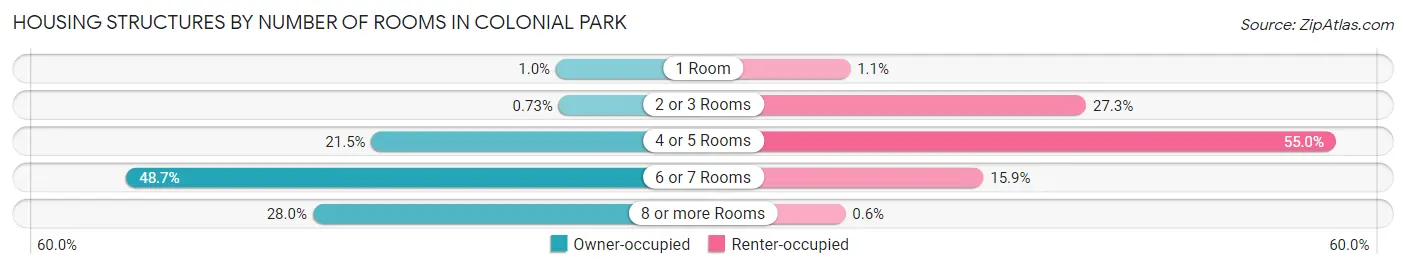
| Number of Rooms | Owner-occupied | Renter-occupied |
| 1 Room | 35 (1.0%) | 38 (1.1%) |
| 2 or 3 Rooms | 25 (0.7%) | 912 (27.3%) |
| 4 or 5 Rooms | 733 (21.5%) | 1,837 (55.0%) |
| 6 or 7 Rooms | 1,660 (48.7%) | 531 (15.9%) |
| 8 or more Rooms | 955 (28.0%) | 20 (0.6%) |
| Total | 3,408 (100.0%) | 3,338 (100.0%) |
Housing Structure by Heating Type in Colonial Park
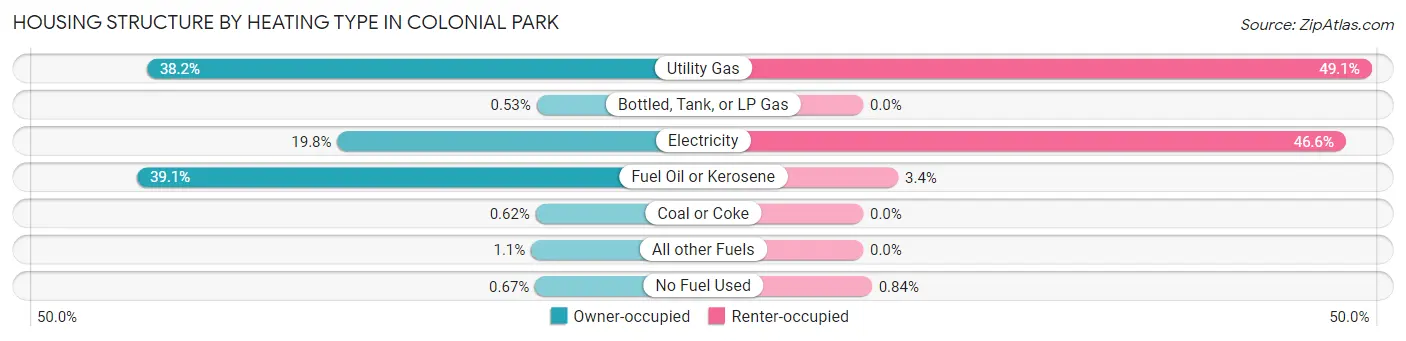
| Heating Type | Owner-occupied | Renter-occupied |
| Utility Gas | 1,302 (38.2%) | 1,640 (49.1%) |
| Bottled, Tank, or LP Gas | 18 (0.5%) | 0 (0.0%) |
| Electricity | 674 (19.8%) | 1,557 (46.6%) |
| Fuel Oil or Kerosene | 1,334 (39.1%) | 113 (3.4%) |
| Coal or Coke | 21 (0.6%) | 0 (0.0%) |
| All other Fuels | 36 (1.1%) | 0 (0.0%) |
| No Fuel Used | 23 (0.7%) | 28 (0.8%) |
| Total | 3,408 (100.0%) | 3,338 (100.0%) |
Household Vehicle Usage in Colonial Park
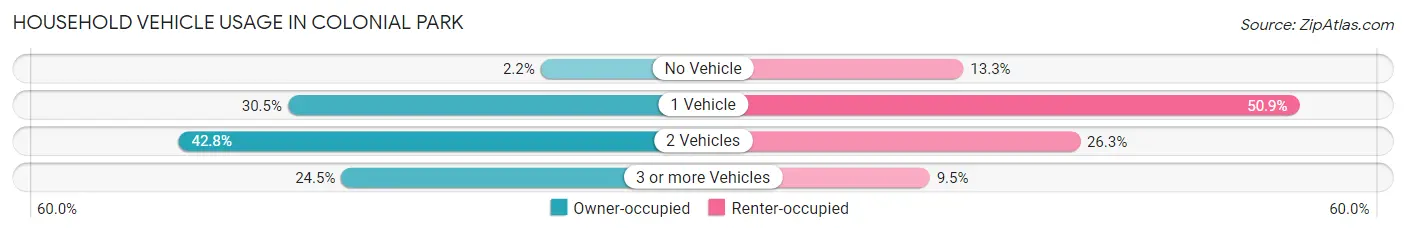
| Vehicles per Household | Owner-occupied | Renter-occupied |
| No Vehicle | 75 (2.2%) | 443 (13.3%) |
| 1 Vehicle | 1,040 (30.5%) | 1,699 (50.9%) |
| 2 Vehicles | 1,457 (42.7%) | 879 (26.3%) |
| 3 or more Vehicles | 836 (24.5%) | 317 (9.5%) |
| Total | 3,408 (100.0%) | 3,338 (100.0%) |
Real Estate & Mortgages in Colonial Park
Real Estate and Mortgage Overview in Colonial Park
| Characteristic | Without Mortgage | With Mortgage |
| Housing Units | 1,366 | 2,042 |
| Median Property Value | $205,700 | $202,200 |
| Median Household Income | $66,607 | $383 |
| Monthly Housing Costs | $583 | $22 |
| Real Estate Taxes | $2,238 | $51 |
Property Value by Mortgage Status in Colonial Park
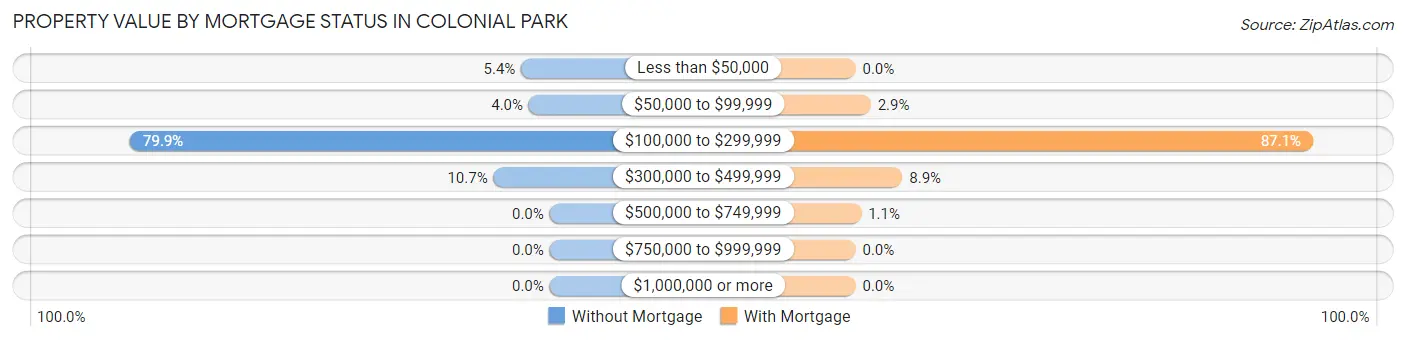
| Property Value | Without Mortgage | With Mortgage |
| Less than $50,000 | 74 (5.4%) | 0 (0.0%) |
| $50,000 to $99,999 | 54 (4.0%) | 59 (2.9%) |
| $100,000 to $299,999 | 1,092 (79.9%) | 1,779 (87.1%) |
| $300,000 to $499,999 | 146 (10.7%) | 182 (8.9%) |
| $500,000 to $749,999 | 0 (0.0%) | 22 (1.1%) |
| $750,000 to $999,999 | 0 (0.0%) | 0 (0.0%) |
| $1,000,000 or more | 0 (0.0%) | 0 (0.0%) |
| Total | 1,366 (100.0%) | 2,042 (100.0%) |
Household Income by Mortgage Status in Colonial Park
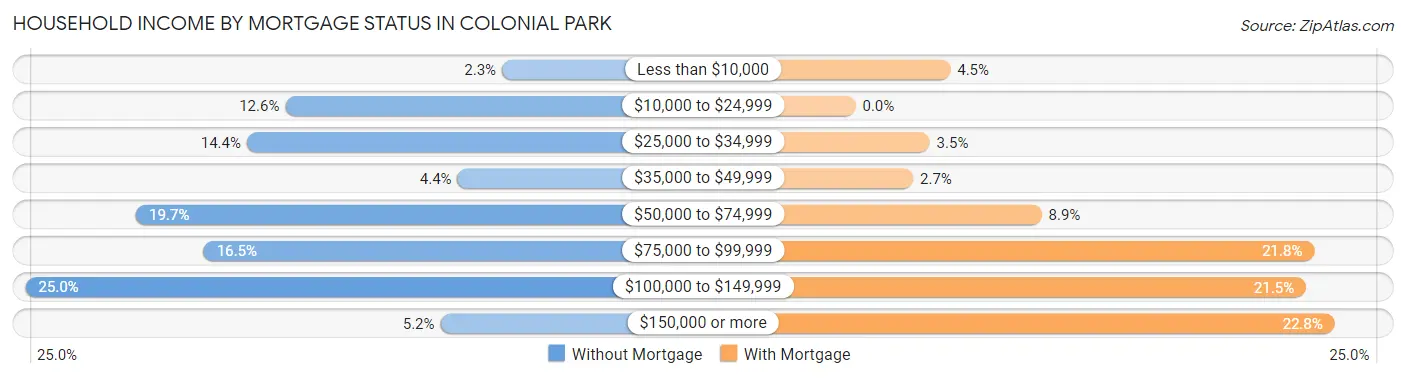
| Household Income | Without Mortgage | With Mortgage |
| Less than $10,000 | 31 (2.3%) | 92 (4.5%) |
| $10,000 to $24,999 | 172 (12.6%) | 0 (0.0%) |
| $25,000 to $34,999 | 197 (14.4%) | 72 (3.5%) |
| $35,000 to $49,999 | 60 (4.4%) | 56 (2.7%) |
| $50,000 to $74,999 | 269 (19.7%) | 181 (8.9%) |
| $75,000 to $99,999 | 225 (16.5%) | 446 (21.8%) |
| $100,000 to $149,999 | 341 (25.0%) | 438 (21.4%) |
| $150,000 or more | 71 (5.2%) | 466 (22.8%) |
| Total | 1,366 (100.0%) | 2,042 (100.0%) |
Property Value to Household Income Ratio in Colonial Park
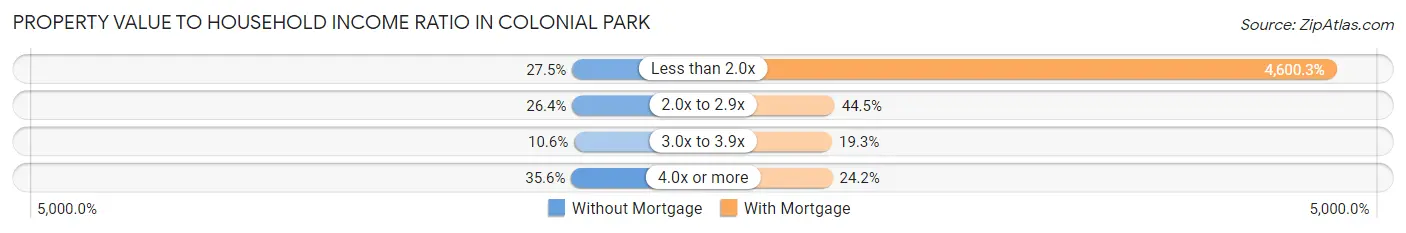
| Value-to-Income Ratio | Without Mortgage | With Mortgage |
| Less than 2.0x | 375 (27.5%) | 93,939 (4,600.3%) |
| 2.0x to 2.9x | 360 (26.4%) | 908 (44.5%) |
| 3.0x to 3.9x | 145 (10.6%) | 393 (19.3%) |
| 4.0x or more | 486 (35.6%) | 494 (24.2%) |
| Total | 1,366 (100.0%) | 2,042 (100.0%) |
Real Estate Taxes by Mortgage Status in Colonial Park
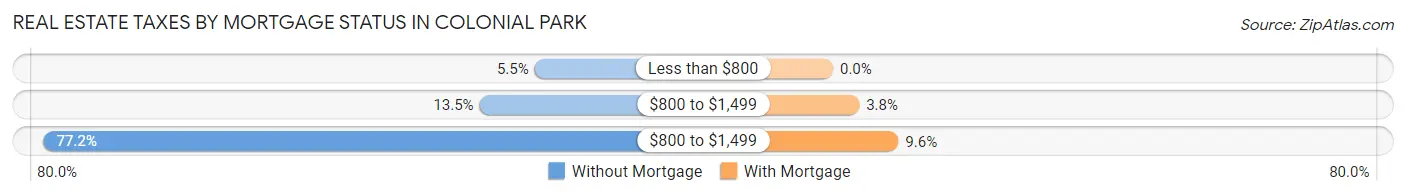
| Property Taxes | Without Mortgage | With Mortgage |
| Less than $800 | 75 (5.5%) | 0 (0.0%) |
| $800 to $1,499 | 185 (13.5%) | 78 (3.8%) |
| $800 to $1,499 | 1,055 (77.2%) | 195 (9.6%) |
| Total | 1,366 (100.0%) | 2,042 (100.0%) |
Health & Disability in Colonial Park
Health Insurance Coverage by Age in Colonial Park
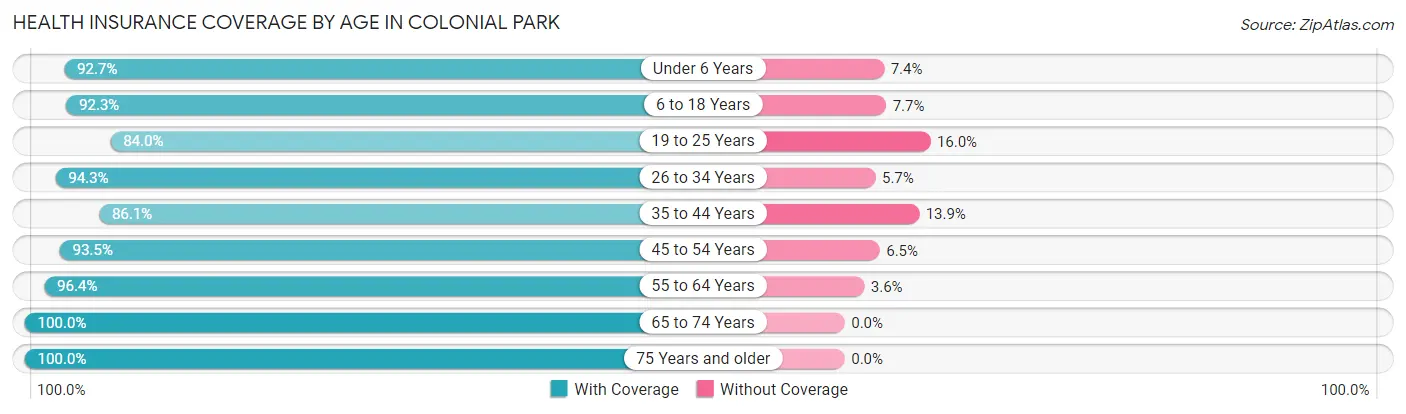
| Age Bracket | With Coverage | Without Coverage |
| Under 6 Years | 1,160 (92.6%) | 92 (7.3%) |
| 6 to 18 Years | 2,510 (92.3%) | 210 (7.7%) |
| 19 to 25 Years | 1,363 (84.0%) | 259 (16.0%) |
| 26 to 34 Years | 2,450 (94.3%) | 149 (5.7%) |
| 35 to 44 Years | 2,036 (86.1%) | 328 (13.9%) |
| 45 to 54 Years | 1,204 (93.5%) | 84 (6.5%) |
| 55 to 64 Years | 1,798 (96.4%) | 68 (3.6%) |
| 65 to 74 Years | 1,794 (100.0%) | 0 (0.0%) |
| 75 Years and older | 1,136 (100.0%) | 0 (0.0%) |
| Total | 15,451 (92.8%) | 1,190 (7.1%) |
Health Insurance Coverage by Citizenship Status in Colonial Park
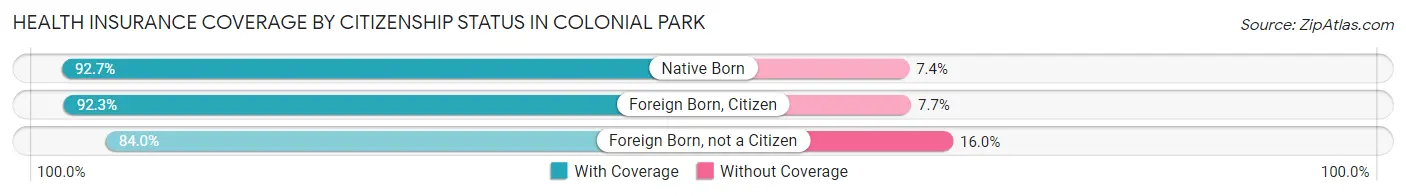
| Citizenship Status | With Coverage | Without Coverage |
| Native Born | 1,160 (92.6%) | 92 (7.3%) |
| Foreign Born, Citizen | 2,510 (92.3%) | 210 (7.7%) |
| Foreign Born, not a Citizen | 1,363 (84.0%) | 259 (16.0%) |
Health Insurance Coverage by Household Income in Colonial Park
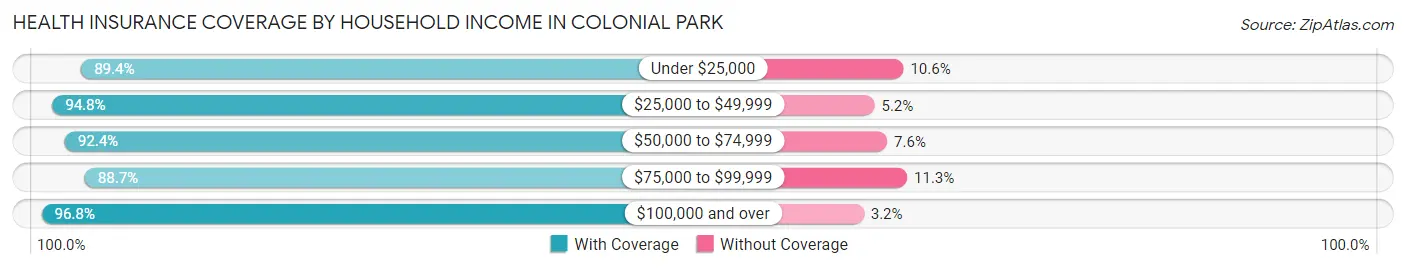
| Household Income | With Coverage | Without Coverage |
| Under $25,000 | 1,279 (89.4%) | 152 (10.6%) |
| $25,000 to $49,999 | 3,192 (94.8%) | 175 (5.2%) |
| $50,000 to $74,999 | 3,534 (92.4%) | 289 (7.6%) |
| $75,000 to $99,999 | 3,485 (88.7%) | 444 (11.3%) |
| $100,000 and over | 3,953 (96.8%) | 130 (3.2%) |
Public vs Private Health Insurance Coverage by Age in Colonial Park
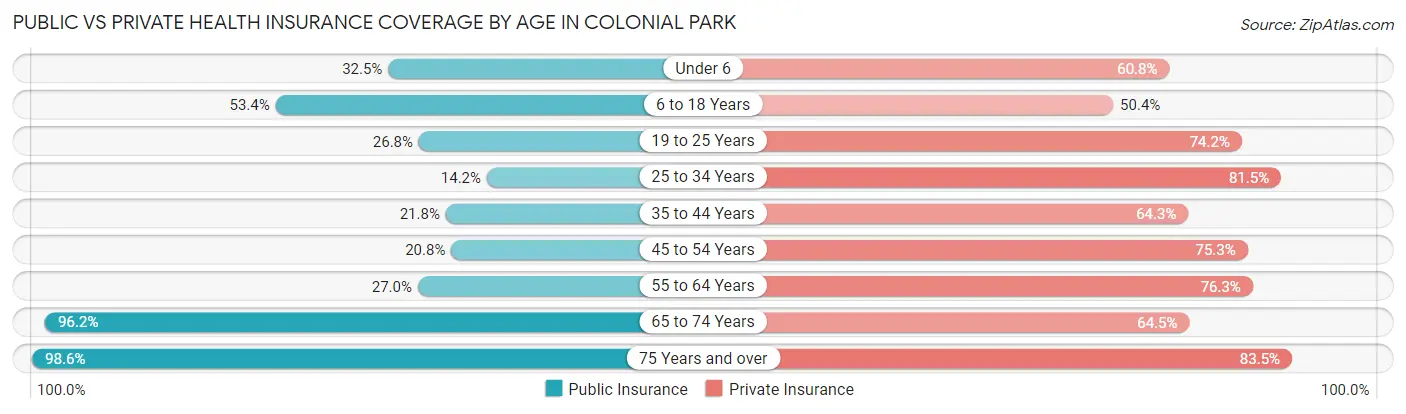
| Age Bracket | Public Insurance | Private Insurance |
| Under 6 | 407 (32.5%) | 761 (60.8%) |
| 6 to 18 Years | 1,453 (53.4%) | 1,370 (50.4%) |
| 19 to 25 Years | 435 (26.8%) | 1,204 (74.2%) |
| 25 to 34 Years | 369 (14.2%) | 2,119 (81.5%) |
| 35 to 44 Years | 516 (21.8%) | 1,520 (64.3%) |
| 45 to 54 Years | 268 (20.8%) | 970 (75.3%) |
| 55 to 64 Years | 504 (27.0%) | 1,423 (76.3%) |
| 65 to 74 Years | 1,726 (96.2%) | 1,157 (64.5%) |
| 75 Years and over | 1,120 (98.6%) | 949 (83.5%) |
| Total | 6,798 (40.8%) | 11,473 (68.9%) |
Disability Status by Sex by Age in Colonial Park
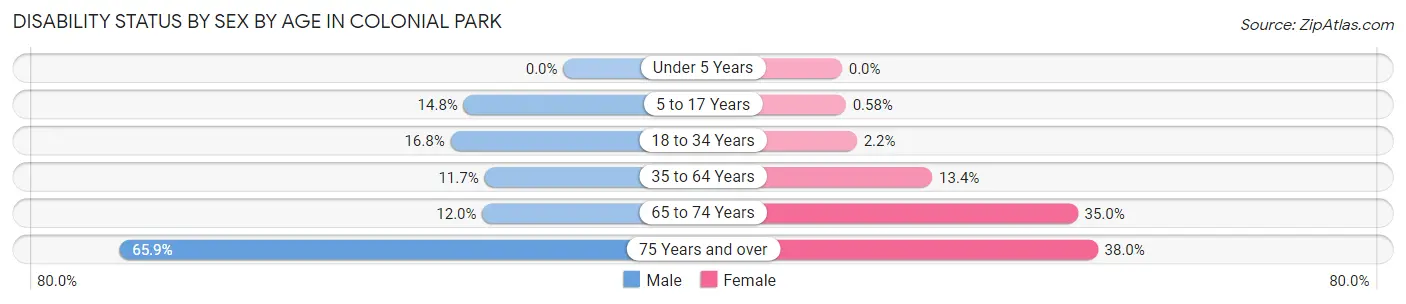
| Age Bracket | Male | Female |
| Under 5 Years | 0 (0.0%) | 0 (0.0%) |
| 5 to 17 Years | 226 (14.8%) | 7 (0.6%) |
| 18 to 34 Years | 324 (16.8%) | 54 (2.2%) |
| 35 to 64 Years | 313 (11.7%) | 382 (13.4%) |
| 65 to 74 Years | 87 (12.0%) | 375 (35.0%) |
| 75 Years and over | 329 (65.9%) | 242 (38.0%) |
Disability Class by Sex by Age in Colonial Park
Disability Class: Hearing Difficulty
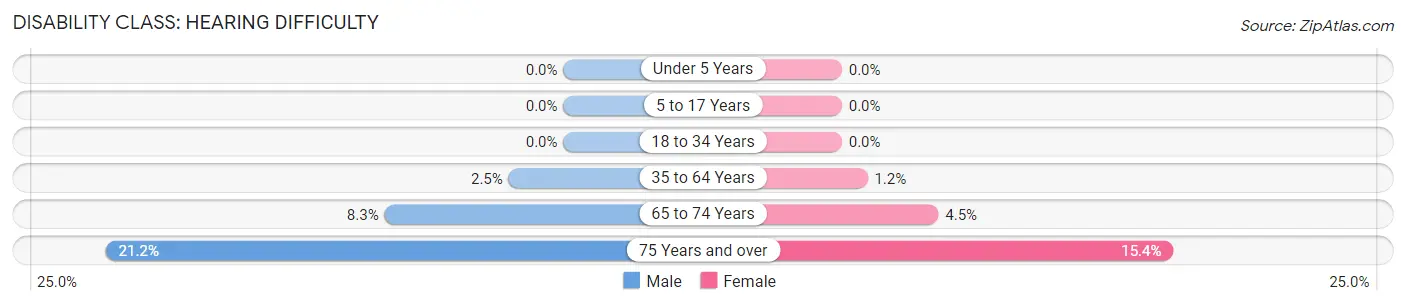
| Age Bracket | Male | Female |
| Under 5 Years | 0 (0.0%) | 0 (0.0%) |
| 5 to 17 Years | 0 (0.0%) | 0 (0.0%) |
| 18 to 34 Years | 0 (0.0%) | 0 (0.0%) |
| 35 to 64 Years | 68 (2.5%) | 34 (1.2%) |
| 65 to 74 Years | 60 (8.3%) | 48 (4.5%) |
| 75 Years and over | 106 (21.2%) | 98 (15.4%) |
Disability Class: Vision Difficulty
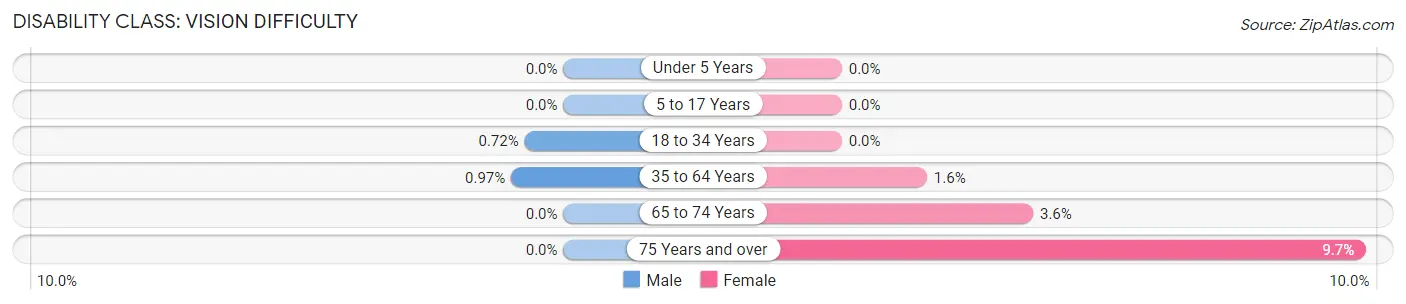
| Age Bracket | Male | Female |
| Under 5 Years | 0 (0.0%) | 0 (0.0%) |
| 5 to 17 Years | 0 (0.0%) | 0 (0.0%) |
| 18 to 34 Years | 14 (0.7%) | 0 (0.0%) |
| 35 to 64 Years | 26 (1.0%) | 45 (1.6%) |
| 65 to 74 Years | 0 (0.0%) | 38 (3.5%) |
| 75 Years and over | 0 (0.0%) | 62 (9.7%) |
Disability Class: Cognitive Difficulty
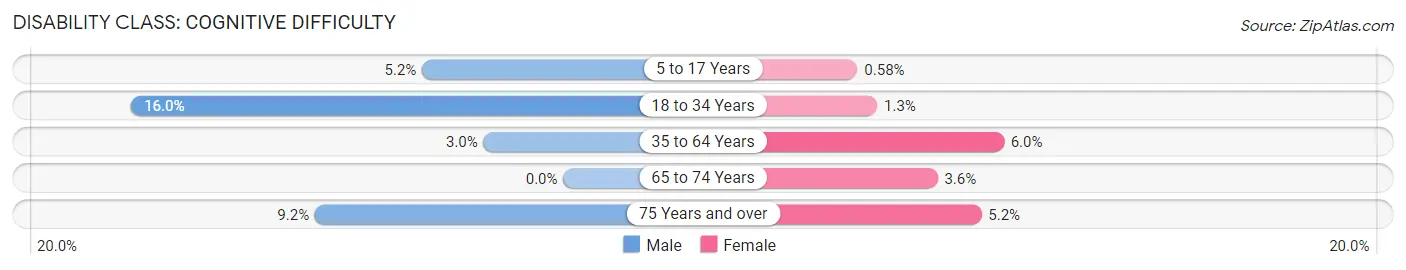
| Age Bracket | Male | Female |
| 5 to 17 Years | 80 (5.2%) | 7 (0.6%) |
| 18 to 34 Years | 310 (16.0%) | 32 (1.3%) |
| 35 to 64 Years | 79 (3.0%) | 171 (6.0%) |
| 65 to 74 Years | 0 (0.0%) | 38 (3.5%) |
| 75 Years and over | 46 (9.2%) | 33 (5.2%) |
Disability Class: Ambulatory Difficulty
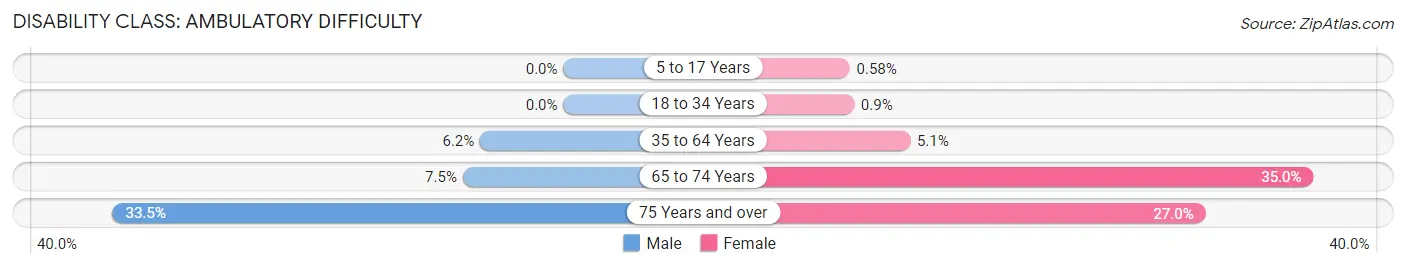
| Age Bracket | Male | Female |
| 5 to 17 Years | 0 (0.0%) | 7 (0.6%) |
| 18 to 34 Years | 0 (0.0%) | 22 (0.9%) |
| 35 to 64 Years | 165 (6.2%) | 144 (5.1%) |
| 65 to 74 Years | 54 (7.5%) | 375 (35.0%) |
| 75 Years and over | 167 (33.5%) | 172 (27.0%) |
Disability Class: Self-Care Difficulty
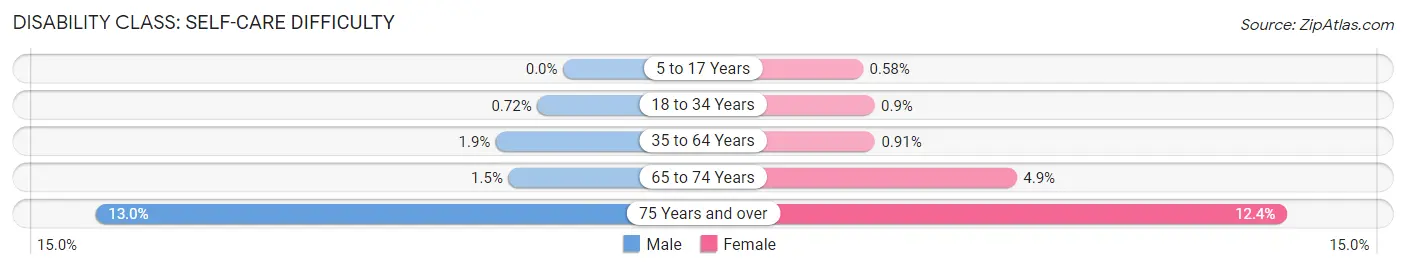
| Age Bracket | Male | Female |
| 5 to 17 Years | 0 (0.0%) | 7 (0.6%) |
| 18 to 34 Years | 14 (0.7%) | 22 (0.9%) |
| 35 to 64 Years | 50 (1.9%) | 26 (0.9%) |
| 65 to 74 Years | 11 (1.5%) | 52 (4.9%) |
| 75 Years and over | 65 (13.0%) | 79 (12.4%) |
Technology Access in Colonial Park
Computing Device Access in Colonial Park
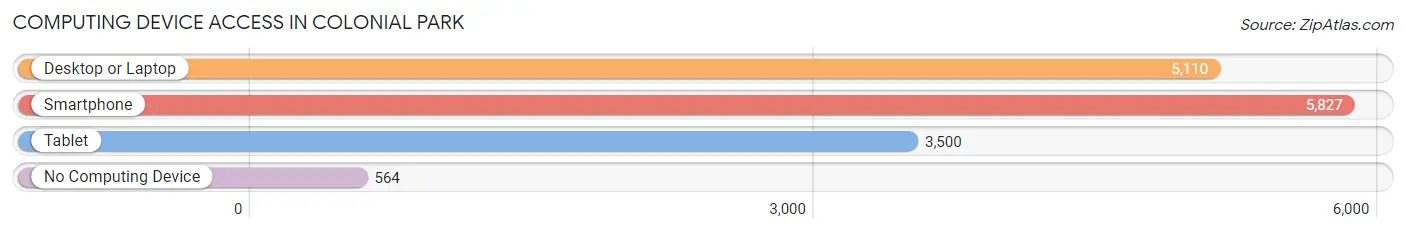
| Device Type | # Households | % Households |
| Desktop or Laptop | 5,110 | 75.7% |
| Smartphone | 5,827 | 86.4% |
| Tablet | 3,500 | 51.9% |
| No Computing Device | 564 | 8.4% |
| Total | 6,746 | 100.0% |
Internet Access in Colonial Park
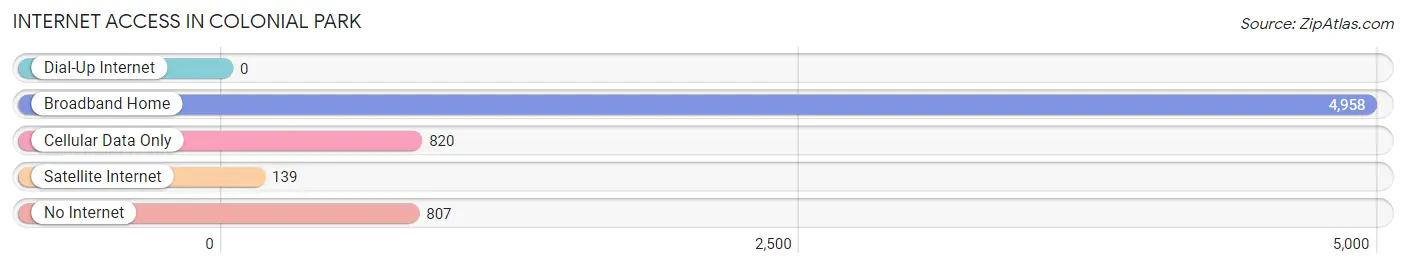
| Internet Type | # Households | % Households |
| Dial-Up Internet | 0 | 0.0% |
| Broadband Home | 4,958 | 73.5% |
| Cellular Data Only | 820 | 12.2% |
| Satellite Internet | 139 | 2.1% |
| No Internet | 807 | 12.0% |
| Total | 6,746 | 100.0% |
Colonial Park Summary
Colonial Park is a census-designated place (CDP) located in Lower Paxton Township, Dauphin County, Pennsylvania. It is a suburb of Harrisburg, the state capital of Pennsylvania. The population of Colonial Park was 8,945 at the 2010 census.
Geography
Colonial Park is located at 40°17'45" North, 76°52'45" West (40.295833, -76.879167). It is situated in the Susquehanna Valley, approximately 3 miles east of Harrisburg. The CDP has a total area of 2.3 square miles, all of which is land.
History
Colonial Park was originally part of the land grant given to William Penn in 1681. The area was first settled in the 1730s by German immigrants. The area was known as “Kreutz Creek” until the early 1900s when it was renamed “Colonial Park”. The name was chosen to reflect the area’s colonial history.
In the early 1900s, the area was a rural farming community. In the 1950s, the area began to experience rapid growth as Harrisburg’s suburbs expanded. The population of Colonial Park increased from 1,000 in 1950 to 8,945 in 2010.
Economy
Colonial Park is primarily a residential community. The area is home to several small businesses, including restaurants, retail stores, and professional services. The largest employer in the area is the Colonial Park Mall, which employs over 1,000 people.
Demographics
As of the 2010 census, the population of Colonial Park was 8,945. The racial makeup of the CDP was 87.3% White, 6.2% African American, 0.7% Asian, 0.2% Native American, 0.1% Pacific Islander, and 4.5% from two or more races. Hispanic or Latino of any race were 2.2% of the population.
The median household income in Colonial Park was $50,945 in 2010. The per capita income was $25,945. About 5.3% of families and 7.2% of the population were below the poverty line.
Conclusion
Colonial Park is a census-designated place located in Lower Paxton Township, Dauphin County, Pennsylvania. It is a suburb of Harrisburg, the state capital of Pennsylvania. The population of Colonial Park was 8,945 at the 2010 census. The area was originally settled in the 1730s by German immigrants and was known as “Kreutz Creek” until the early 1900s when it was renamed “Colonial Park”. The area is primarily a residential community and is home to several small businesses. The largest employer in the area is the Colonial Park Mall, which employs over 1,000 people. The racial makeup of the CDP was 87.3% White, 6.2% African American, 0.7% Asian, 0.2% Native American, 0.1% Pacific Islander, and 4.5% from two or more races. The median household income in Colonial Park was $50,945 in 2010.
Common Questions
What is Per Capita Income in Colonial Park?
Per Capita income in Colonial Park is $30,942.
What is the Median Family Income in Colonial Park?
Median Family Income in Colonial Park is $78,175.
What is the Median Household income in Colonial Park?
Median Household Income in Colonial Park is $62,878.
What is Income or Wage Gap in Colonial Park?
Income or Wage Gap in Colonial Park is 22.4%.
Women in Colonial Park earn 77.6 cents for every dollar earned by a man.
What is Inequality or Gini Index in Colonial Park?
Inequality or Gini Index in Colonial Park is 0.39.
What is the Total Population of Colonial Park?
Total Population of Colonial Park is 16,891.
What is the Total Male Population of Colonial Park?
Total Male Population of Colonial Park is 7,944.
What is the Total Female Population of Colonial Park?
Total Female Population of Colonial Park is 8,947.
What is the Ratio of Males per 100 Females in Colonial Park?
There are 88.79 Males per 100 Females in Colonial Park.
What is the Ratio of Females per 100 Males in Colonial Park?
There are 112.63 Females per 100 Males in Colonial Park.
What is the Median Population Age in Colonial Park?
Median Population Age in Colonial Park is 35.9 Years.
What is the Average Family Size in Colonial Park
Average Family Size in Colonial Park is 3.2 People.
What is the Average Household Size in Colonial Park
Average Household Size in Colonial Park is 2.5 People.
How Large is the Labor Force in Colonial Park?
There are 8,870 People in the Labor Forcein in Colonial Park.
What is the Percentage of People in the Labor Force in Colonial Park?
65.1% of People are in the Labor Force in Colonial Park.
What is the Unemployment Rate in Colonial Park?
Unemployment Rate in Colonial Park is 5.3%.