East Washington borough, PA Map & Demographics
East Washington borough Overview
$46,962
PER CAPITA INCOME
$135,563
AVG FAMILY INCOME
$82,434
AVG HOUSEHOLD INCOME
22.7%
WAGE / INCOME GAP [ % ]
77.3¢/ $1
WAGE / INCOME GAP [ $ ]
0.39
INEQUALITY / GINI INDEX
1,706
TOTAL POPULATION
792
MALE POPULATION
914
FEMALE POPULATION
86.65
MALES / 100 FEMALES
115.40
FEMALES / 100 MALES
37.5
MEDIAN AGE
2.9
AVG FAMILY SIZE
2.0
AVG HOUSEHOLD SIZE
1,032
LABOR FORCE [ PEOPLE ]
68.1%
PERCENT IN LABOR FORCE
1.5%
UNEMPLOYMENT RATE
Income in East Washington borough
Income Overview in East Washington borough
Per Capita Income in East Washington borough is $46,962, while median incomes of families and households are $135,563 and $82,434 respectively.
| Characteristic | Number | Measure |
| Per Capita Income | 1,706 | $46,962 |
| Median Family Income | 345 | $135,563 |
| Mean Family Income | 345 | $135,312 |
| Median Household Income | 747 | $82,434 |
| Mean Household Income | 747 | $104,234 |
| Income Deficit | 345 | $0 |
| Wage / Income Gap (%) | 1,706 | 22.68% |
| Wage / Income Gap ($) | 1,706 | 77.32¢ per $1 |
| Gini / Inequality Index | 1,706 | 0.39 |
Earnings by Sex in East Washington borough
Average Earnings in East Washington borough are $42,483, $51,071 for men and $39,489 for women, a difference of 22.7%.
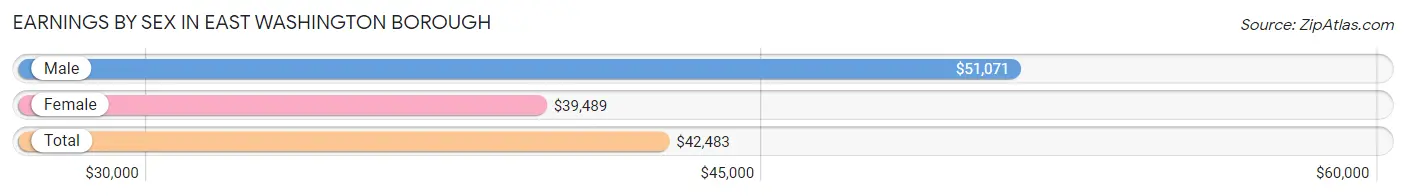
| Sex | Number | Average Earnings |
| Male | 568 (50.3%) | $51,071 |
| Female | 561 (49.7%) | $39,489 |
| Total | 1,129 (100.0%) | $42,483 |
Earnings by Sex by Income Bracket in East Washington borough
The most common earnings brackets in East Washington borough are $75,000 to $99,999 for men (102 | 18.0%) and $65,000 to $74,999 for women (71 | 12.7%).
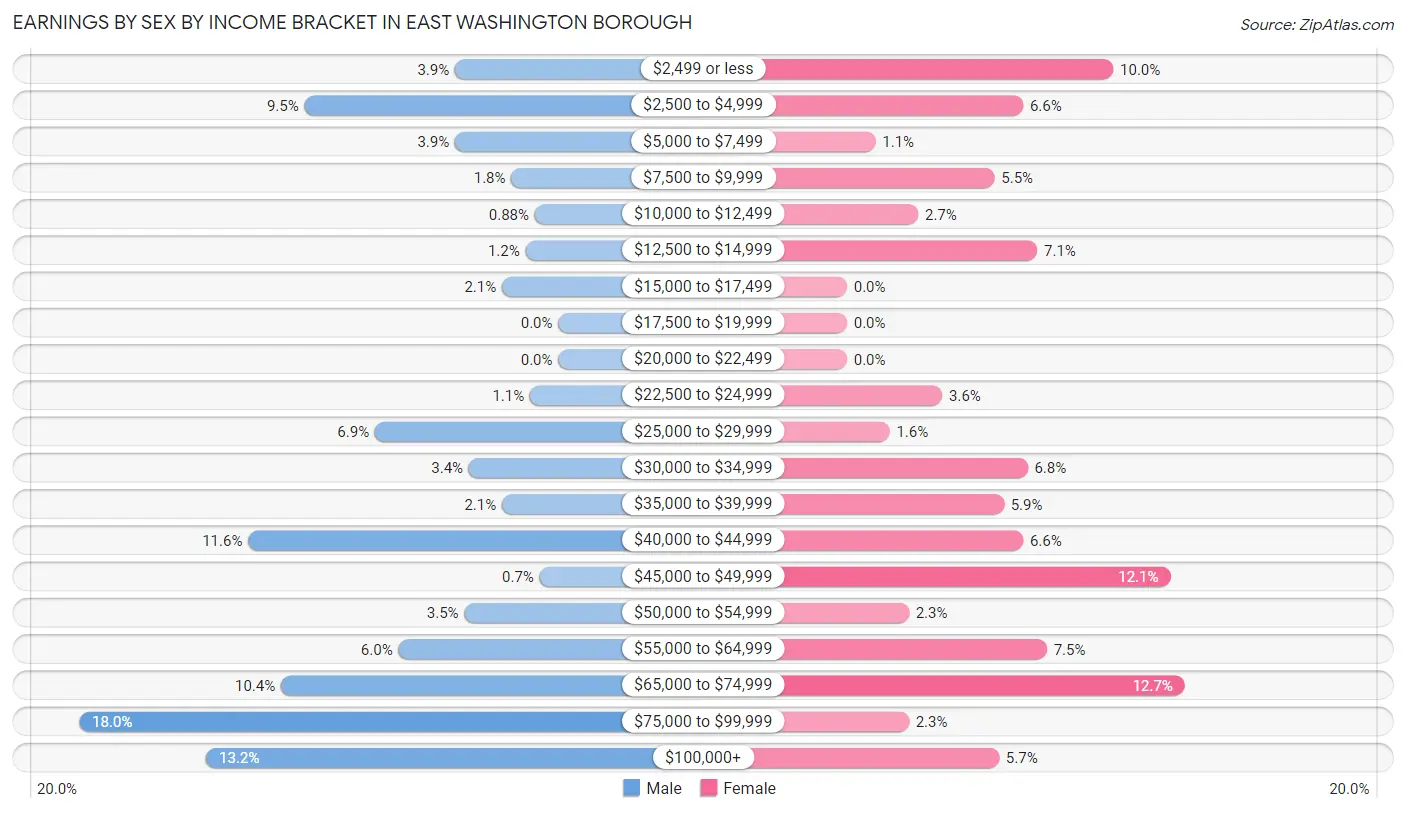
| Income | Male | Female |
| $2,499 or less | 22 (3.9%) | 56 (10.0%) |
| $2,500 to $4,999 | 54 (9.5%) | 37 (6.6%) |
| $5,000 to $7,499 | 22 (3.9%) | 6 (1.1%) |
| $7,500 to $9,999 | 10 (1.8%) | 31 (5.5%) |
| $10,000 to $12,499 | 5 (0.9%) | 15 (2.7%) |
| $12,500 to $14,999 | 7 (1.2%) | 40 (7.1%) |
| $15,000 to $17,499 | 12 (2.1%) | 0 (0.0%) |
| $17,500 to $19,999 | 0 (0.0%) | 0 (0.0%) |
| $20,000 to $22,499 | 0 (0.0%) | 0 (0.0%) |
| $22,500 to $24,999 | 6 (1.1%) | 20 (3.6%) |
| $25,000 to $29,999 | 39 (6.9%) | 9 (1.6%) |
| $30,000 to $34,999 | 19 (3.4%) | 38 (6.8%) |
| $35,000 to $39,999 | 12 (2.1%) | 33 (5.9%) |
| $40,000 to $44,999 | 66 (11.6%) | 37 (6.6%) |
| $45,000 to $49,999 | 4 (0.7%) | 68 (12.1%) |
| $50,000 to $54,999 | 20 (3.5%) | 13 (2.3%) |
| $55,000 to $64,999 | 34 (6.0%) | 42 (7.5%) |
| $65,000 to $74,999 | 59 (10.4%) | 71 (12.7%) |
| $75,000 to $99,999 | 102 (18.0%) | 13 (2.3%) |
| $100,000+ | 75 (13.2%) | 32 (5.7%) |
| Total | 568 (100.0%) | 561 (100.0%) |
Earnings by Sex by Educational Attainment in East Washington borough
Average earnings in East Washington borough are $62,708 for men and $48,073 for women, a difference of 23.3%. Men with an educational attainment of college or associate's degree enjoy the highest average annual earnings of $69,550, while those with high school diploma education earn the least with $41,528. Women with an educational attainment of bachelor's degree earn the most with the average annual earnings of $67,566, while those with high school diploma education have the smallest earnings of $39,602.
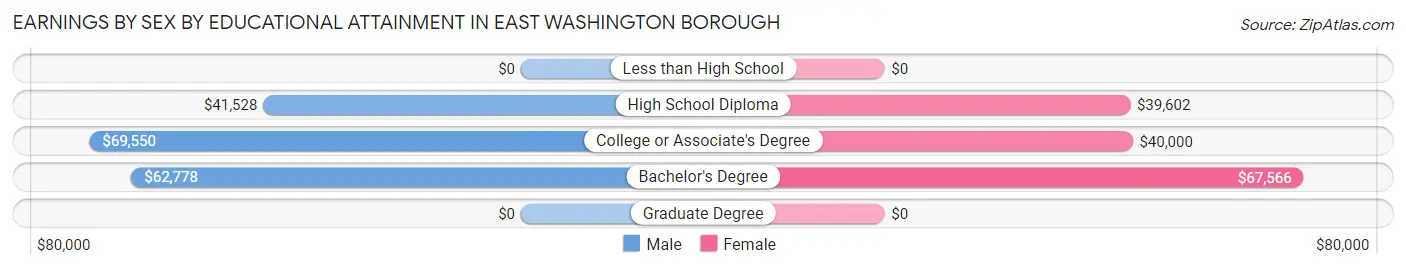
| Educational Attainment | Male Income | Female Income |
| Less than High School | - | - |
| High School Diploma | $41,528 | $39,602 |
| College or Associate's Degree | $69,550 | $40,000 |
| Bachelor's Degree | $62,778 | $67,566 |
| Graduate Degree | - | - |
| Total | $62,708 | $48,073 |
Family Income in East Washington borough
Family Income Brackets in East Washington borough
According to the East Washington borough family income data, there are 100 families falling into the $150,000 to $199,999 income range, which is the most common income bracket and makes up 29.0% of all families.
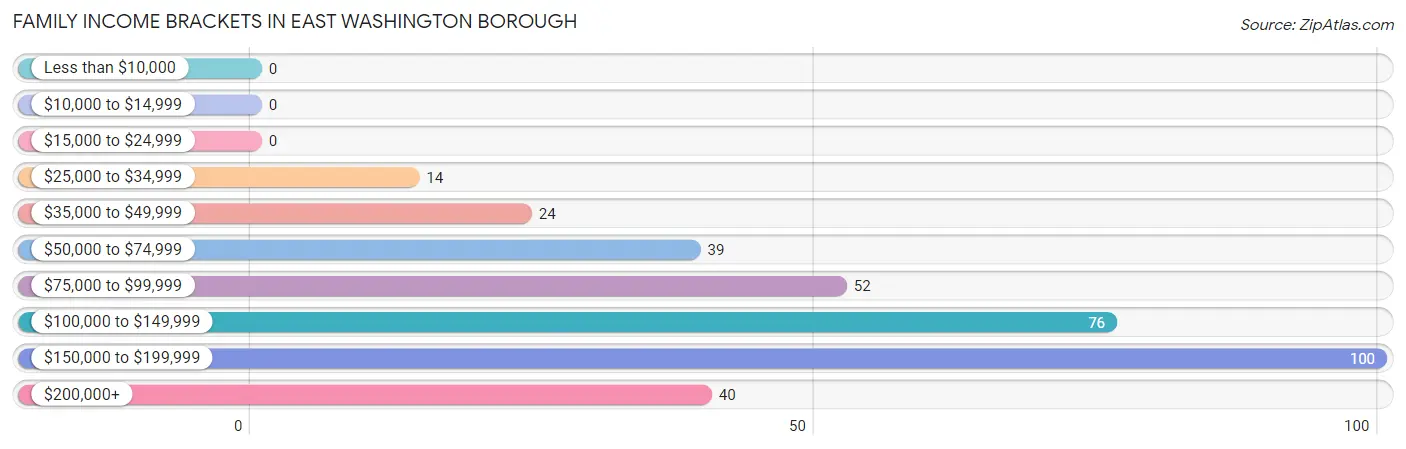
| Income Bracket | # Families | % Families |
| Less than $10,000 | 0 | 0.0% |
| $10,000 to $14,999 | 0 | 0.0% |
| $15,000 to $24,999 | 0 | 0.0% |
| $25,000 to $34,999 | 14 | 4.1% |
| $35,000 to $49,999 | 24 | 7.0% |
| $50,000 to $74,999 | 39 | 11.3% |
| $75,000 to $99,999 | 52 | 15.1% |
| $100,000 to $149,999 | 76 | 22.0% |
| $150,000 to $199,999 | 100 | 29.0% |
| $200,000+ | 40 | 11.6% |
Family Income by Famaliy Size in East Washington borough
4-person families (92 | 26.7%) account for the highest median family income in East Washington borough with $170,288 per family, while 2-person families (177 | 51.3%) have the highest median income of $47,656 per family member.
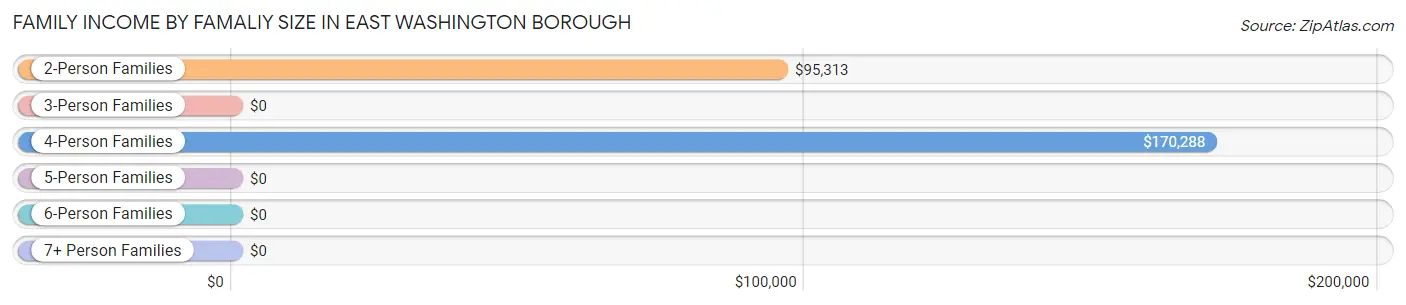
| Income Bracket | # Families | Median Income |
| 2-Person Families | 177 (51.3%) | $95,313 |
| 3-Person Families | 62 (18.0%) | $0 |
| 4-Person Families | 92 (26.7%) | $170,288 |
| 5-Person Families | 14 (4.1%) | $0 |
| 6-Person Families | 0 (0.0%) | $0 |
| 7+ Person Families | 0 (0.0%) | $0 |
| Total | 345 (100.0%) | $135,563 |
Family Income by Number of Earners in East Washington borough
The median family income in East Washington borough is $135,563, with families comprising 3+ earners (33) having the highest median family income of $168,583, while families with no earners (56) have the lowest median family income of $80,417, accounting for 9.6% and 16.2% of families, respectively.
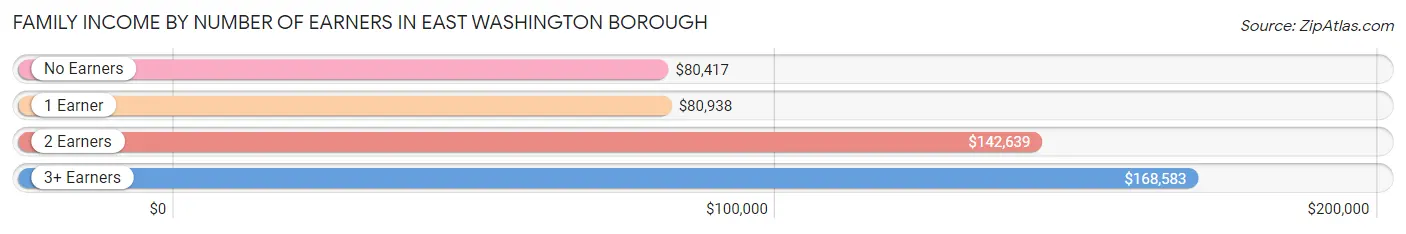
| Number of Earners | # Families | Median Income |
| No Earners | 56 (16.2%) | $80,417 |
| 1 Earner | 67 (19.4%) | $80,938 |
| 2 Earners | 189 (54.8%) | $142,639 |
| 3+ Earners | 33 (9.6%) | $168,583 |
| Total | 345 (100.0%) | $135,563 |
Household Income in East Washington borough
Household Income Brackets in East Washington borough
With 143 households falling in the category, the $100,000 to $149,999 income range is the most frequent in East Washington borough, accounting for 19.1% of all households. In contrast, only 14 households (1.9%) fall into the $10,000 to $14,999 income bracket, making it the least populous group.
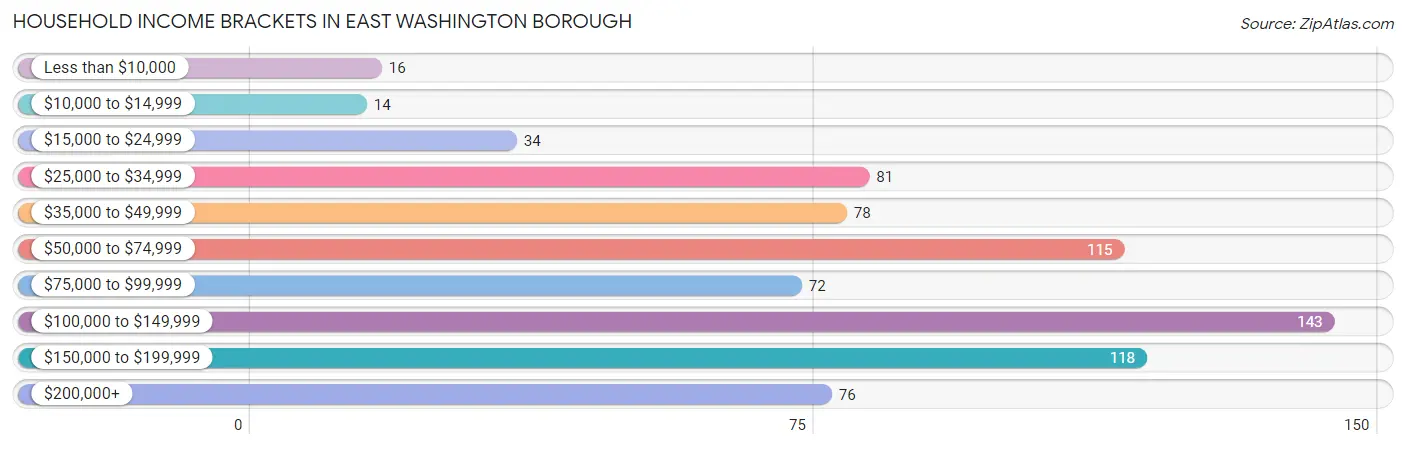
| Income Bracket | # Households | % Households |
| Less than $10,000 | 16 | 2.1% |
| $10,000 to $14,999 | 14 | 1.9% |
| $15,000 to $24,999 | 34 | 4.6% |
| $25,000 to $34,999 | 81 | 10.8% |
| $35,000 to $49,999 | 78 | 10.4% |
| $50,000 to $74,999 | 115 | 15.4% |
| $75,000 to $99,999 | 72 | 9.6% |
| $100,000 to $149,999 | 143 | 19.1% |
| $150,000 to $199,999 | 118 | 15.8% |
| $200,000+ | 76 | 10.2% |
Household Income by Householder Age in East Washington borough
The median household income in East Washington borough is $82,434, with the highest median household income of $110,938 found in the 45 to 64 years age bracket for the primary householder. A total of 217 households (29.0%) fall into this category. Meanwhile, the 15 to 24 years age bracket for the primary householder has the lowest median household income of $0, with 39 households (5.2%) in this group.
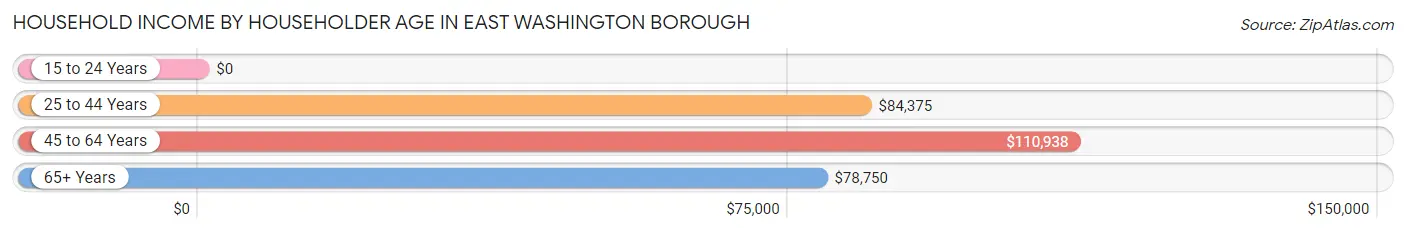
| Income Bracket | # Households | Median Income |
| 15 to 24 Years | 39 (5.2%) | $0 |
| 25 to 44 Years | 243 (32.5%) | $84,375 |
| 45 to 64 Years | 217 (29.0%) | $110,938 |
| 65+ Years | 248 (33.2%) | $78,750 |
| Total | 747 (100.0%) | $82,434 |
Poverty in East Washington borough
Income Below Poverty by Sex and Age in East Washington borough
With 3.7% poverty level for males and 4.0% for females among the residents of East Washington borough, 55 to 64 year old males and 16 and 17 year old females are the most vulnerable to poverty, with 19 males (23.2%) and 2 females (100.0%) in their respective age groups living below the poverty level.
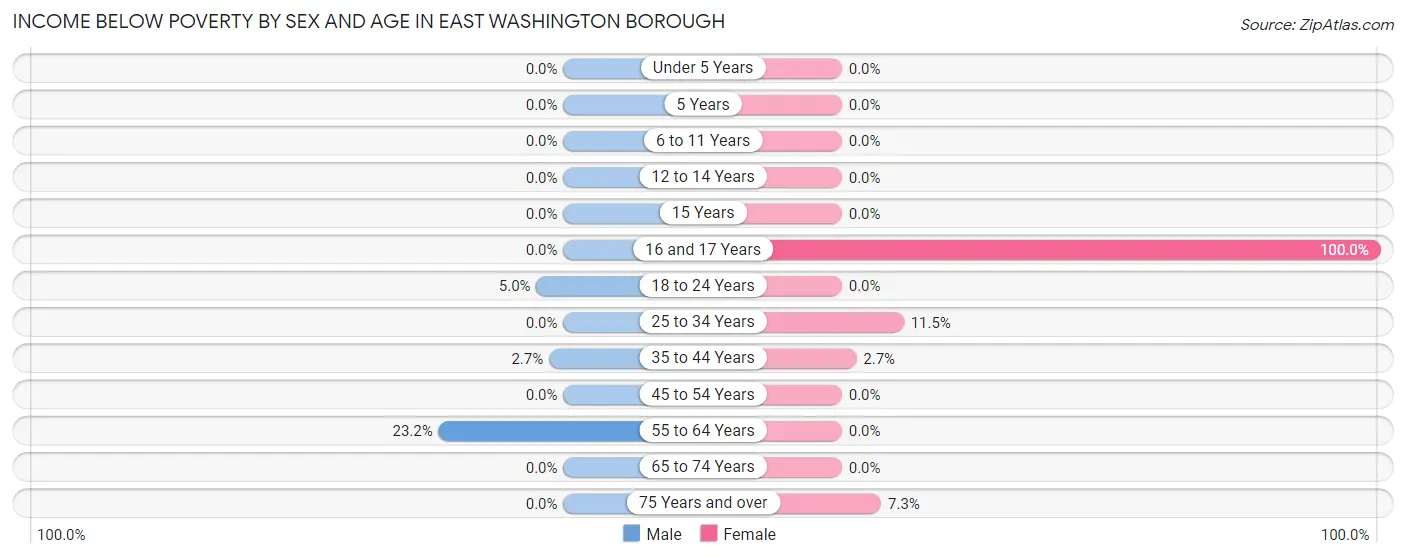
| Age Bracket | Male | Female |
| Under 5 Years | 0 (0.0%) | 0 (0.0%) |
| 5 Years | 0 (0.0%) | 0 (0.0%) |
| 6 to 11 Years | 0 (0.0%) | 0 (0.0%) |
| 12 to 14 Years | 0 (0.0%) | 0 (0.0%) |
| 15 Years | 0 (0.0%) | 0 (0.0%) |
| 16 and 17 Years | 0 (0.0%) | 2 (100.0%) |
| 18 to 24 Years | 3 (5.0%) | 0 (0.0%) |
| 25 to 34 Years | 0 (0.0%) | 20 (11.5%) |
| 35 to 44 Years | 4 (2.6%) | 2 (2.7%) |
| 45 to 54 Years | 0 (0.0%) | 0 (0.0%) |
| 55 to 64 Years | 19 (23.2%) | 0 (0.0%) |
| 65 to 74 Years | 0 (0.0%) | 0 (0.0%) |
| 75 Years and over | 0 (0.0%) | 7 (7.3%) |
| Total | 26 (3.7%) | 31 (4.0%) |
Income Above Poverty by Sex and Age in East Washington borough
According to the poverty statistics in East Washington borough, males aged under 5 years and females aged under 5 years are the age groups that are most secure financially, with 100.0% of males and 100.0% of females in these age groups living above the poverty line.
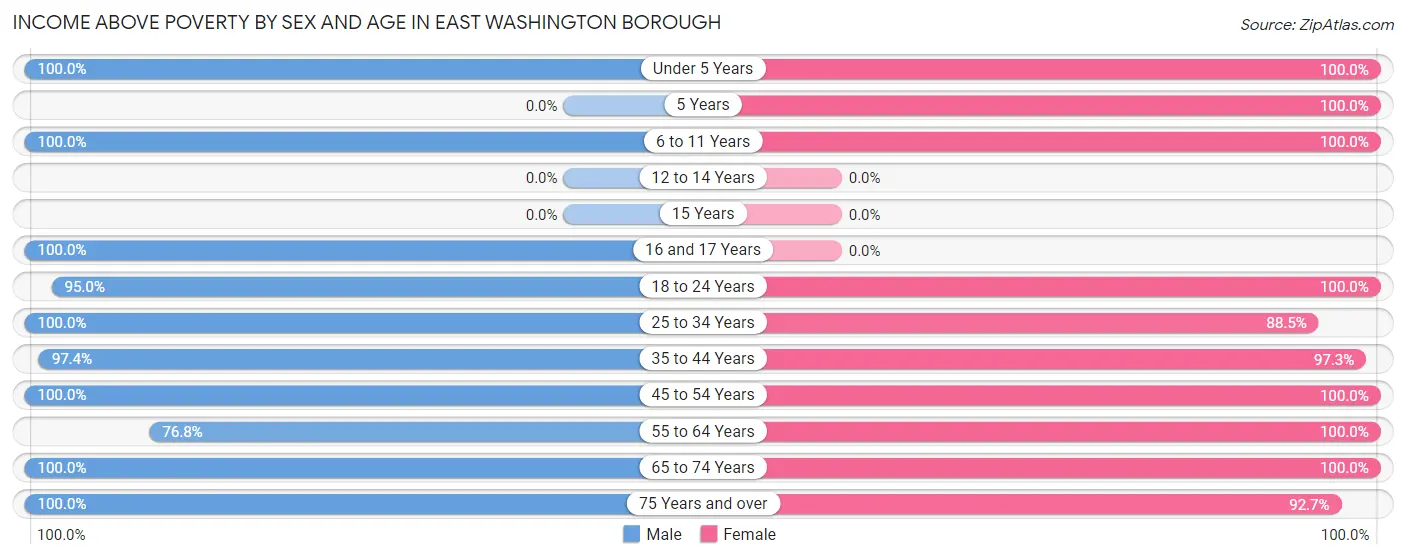
| Age Bracket | Male | Female |
| Under 5 Years | 49 (100.0%) | 13 (100.0%) |
| 5 Years | 0 (0.0%) | 31 (100.0%) |
| 6 to 11 Years | 24 (100.0%) | 73 (100.0%) |
| 12 to 14 Years | 0 (0.0%) | 0 (0.0%) |
| 15 Years | 0 (0.0%) | 0 (0.0%) |
| 16 and 17 Years | 10 (100.0%) | 0 (0.0%) |
| 18 to 24 Years | 57 (95.0%) | 36 (100.0%) |
| 25 to 34 Years | 92 (100.0%) | 154 (88.5%) |
| 35 to 44 Years | 147 (97.4%) | 72 (97.3%) |
| 45 to 54 Years | 77 (100.0%) | 49 (100.0%) |
| 55 to 64 Years | 63 (76.8%) | 112 (100.0%) |
| 65 to 74 Years | 102 (100.0%) | 119 (100.0%) |
| 75 Years and over | 58 (100.0%) | 89 (92.7%) |
| Total | 679 (96.3%) | 748 (96.0%) |
Income Below Poverty Among Married-Couple Families in East Washington borough
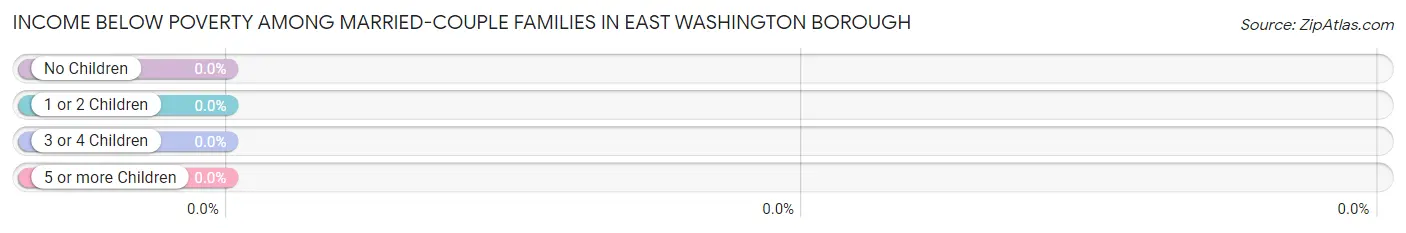
| Children | Above Poverty | Below Poverty |
| No Children | 204 (100.0%) | 0 (0.0%) |
| 1 or 2 Children | 110 (100.0%) | 0 (0.0%) |
| 3 or 4 Children | 0 (0.0%) | 0 (0.0%) |
| 5 or more Children | 0 (0.0%) | 0 (0.0%) |
| Total | 314 (100.0%) | 0 (0.0%) |
Income Below Poverty Among Single-Parent Households in East Washington borough
| Children | Single Father | Single Mother |
| No Children | 0 (0.0%) | 0 (0.0%) |
| 1 or 2 Children | 0 (0.0%) | 0 (0.0%) |
| 3 or 4 Children | 0 (0.0%) | 0 (0.0%) |
| 5 or more Children | 0 (0.0%) | 0 (0.0%) |
| Total | 0 (0.0%) | 0 (0.0%) |
Income Below Poverty Among Married-Couple vs Single-Parent Households in East Washington borough
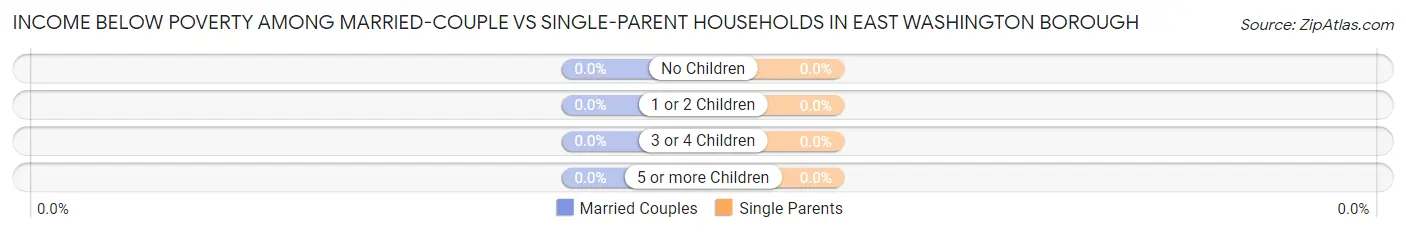
| Children | Married-Couple Families | Single-Parent Households |
| No Children | 0 (0.0%) | 0 (0.0%) |
| 1 or 2 Children | 0 (0.0%) | 0 (0.0%) |
| 3 or 4 Children | 0 (0.0%) | 0 (0.0%) |
| 5 or more Children | 0 (0.0%) | 0 (0.0%) |
| Total | 0 (0.0%) | 0 (0.0%) |
Race in East Washington borough
The most populous races in East Washington borough are White / Caucasian (1,506 | 88.3%), Hispanic or Latino (150 | 8.8%), and Two or more Races (86 | 5.0%).
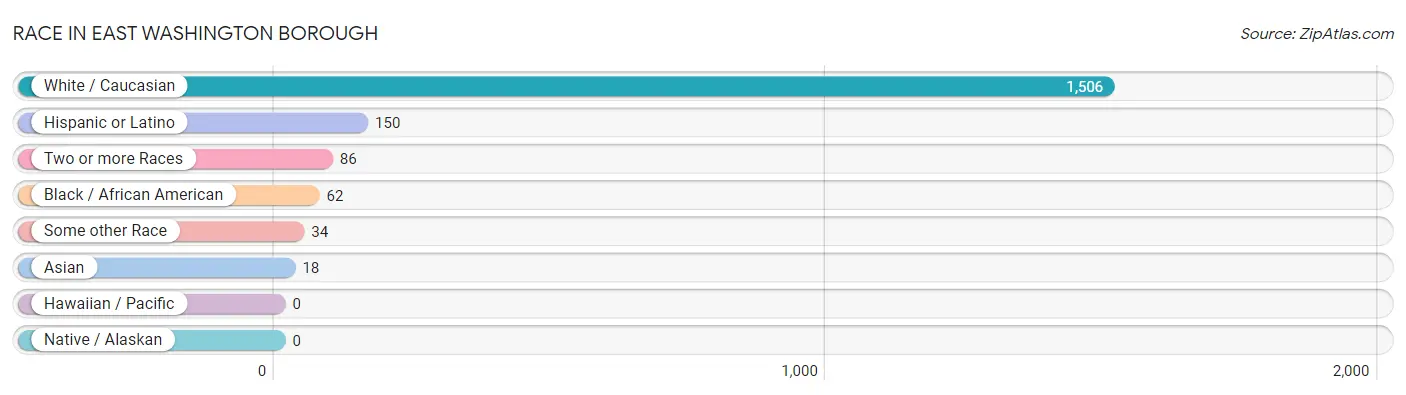
| Race | # Population | % Population |
| Asian | 18 | 1.1% |
| Black / African American | 62 | 3.6% |
| Hawaiian / Pacific | 0 | 0.0% |
| Hispanic or Latino | 150 | 8.8% |
| Native / Alaskan | 0 | 0.0% |
| White / Caucasian | 1,506 | 88.3% |
| Two or more Races | 86 | 5.0% |
| Some other Race | 34 | 2.0% |
| Total | 1,706 | 100.0% |
Ancestry in East Washington borough
The most populous ancestries reported in East Washington borough are Italian (327 | 19.2%), Irish (310 | 18.2%), German (229 | 13.4%), English (173 | 10.1%), and Polish (64 | 3.7%), together accounting for 64.7% of all East Washington borough residents.
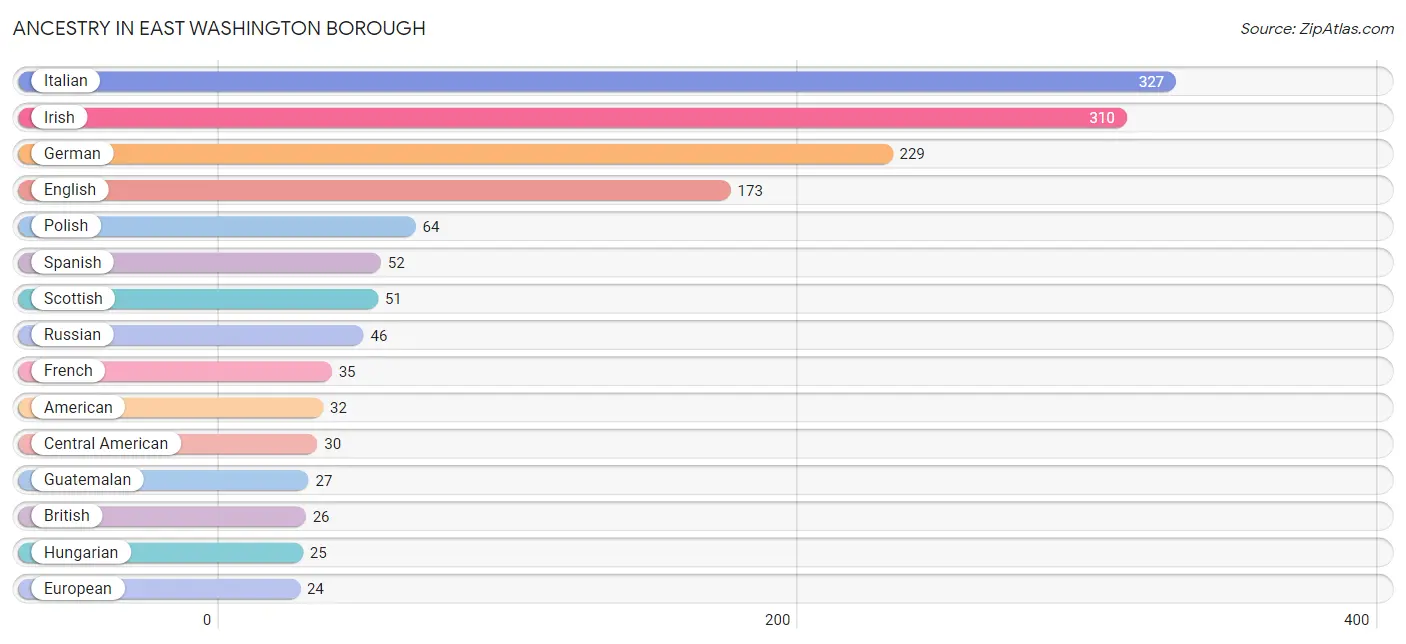
| Ancestry | # Population | % Population |
| American | 32 | 1.9% |
| Arab | 5 | 0.3% |
| Armenian | 2 | 0.1% |
| British | 26 | 1.5% |
| Cambodian | 2 | 0.1% |
| Central American | 30 | 1.8% |
| Cherokee | 5 | 0.3% |
| Croatian | 9 | 0.5% |
| Czech | 9 | 0.5% |
| Czechoslovakian | 10 | 0.6% |
| Dutch | 8 | 0.5% |
| English | 173 | 10.1% |
| Ethiopian | 5 | 0.3% |
| European | 24 | 1.4% |
| Filipino | 1 | 0.1% |
| French | 35 | 2.1% |
| German | 229 | 13.4% |
| Greek | 13 | 0.8% |
| Guatemalan | 27 | 1.6% |
| Honduran | 3 | 0.2% |
| Hungarian | 25 | 1.5% |
| Irish | 310 | 18.2% |
| Italian | 327 | 19.2% |
| Kenyan | 3 | 0.2% |
| Korean | 5 | 0.3% |
| Liberian | 2 | 0.1% |
| Lithuanian | 4 | 0.2% |
| Mexican | 12 | 0.7% |
| Northern European | 5 | 0.3% |
| Polish | 64 | 3.7% |
| Puerto Rican | 1 | 0.1% |
| Russian | 46 | 2.7% |
| Scotch-Irish | 22 | 1.3% |
| Scottish | 51 | 3.0% |
| Slavic | 8 | 0.5% |
| Slovak | 17 | 1.0% |
| Slovene | 4 | 0.2% |
| Spaniard | 5 | 0.3% |
| Spanish | 52 | 3.0% |
| Sri Lankan | 1 | 0.1% |
| Subsaharan African | 17 | 1.0% |
| Syrian | 5 | 0.3% |
| Thai | 5 | 0.3% |
| Welsh | 18 | 1.1% | View All 44 Rows |
Immigrants in East Washington borough
The most numerous immigrant groups reported in East Washington borough came from Asia (17 | 1.0%), Africa (12 | 0.7%), South Central Asia (12 | 0.7%), Central America (7 | 0.4%), and Guatemala (7 | 0.4%), together accounting for 3.2% of all East Washington borough residents.
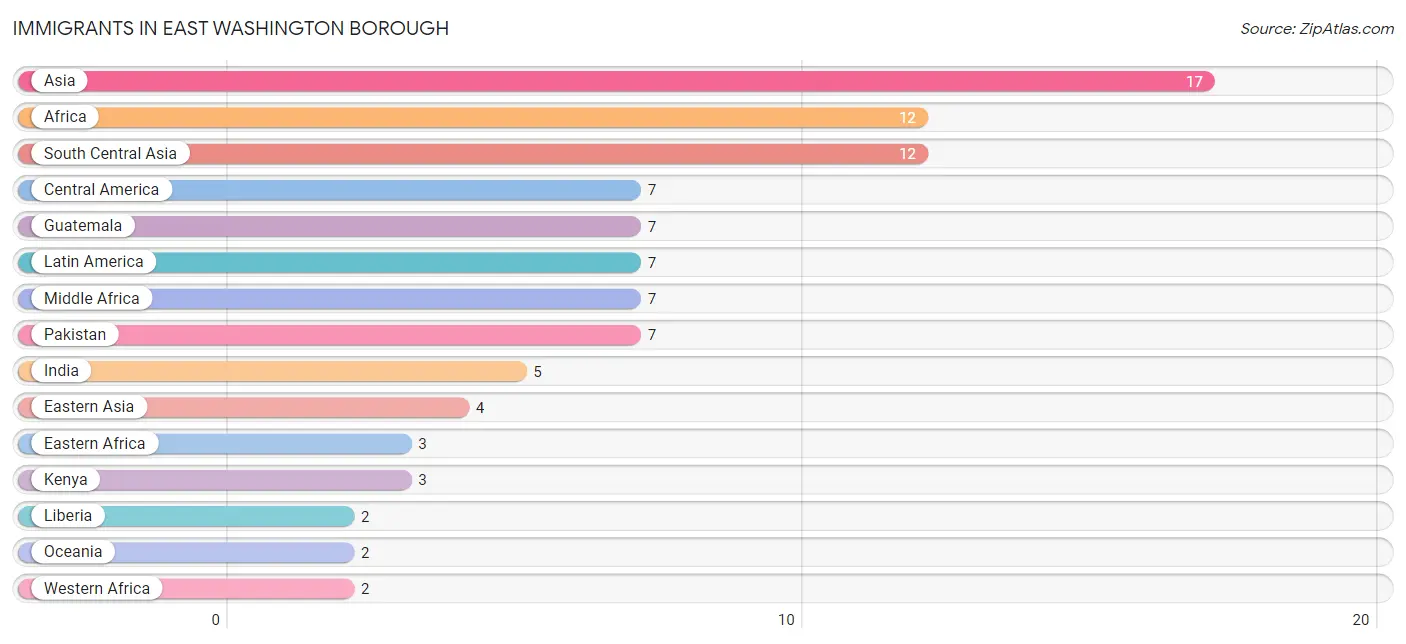
| Immigration Origin | # Population | % Population |
| Africa | 12 | 0.7% |
| Asia | 17 | 1.0% |
| Central America | 7 | 0.4% |
| Eastern Africa | 3 | 0.2% |
| Eastern Asia | 4 | 0.2% |
| Guatemala | 7 | 0.4% |
| India | 5 | 0.3% |
| Kenya | 3 | 0.2% |
| Latin America | 7 | 0.4% |
| Liberia | 2 | 0.1% |
| Middle Africa | 7 | 0.4% |
| Oceania | 2 | 0.1% |
| Pakistan | 7 | 0.4% |
| South Central Asia | 12 | 0.7% |
| South Eastern Asia | 1 | 0.1% |
| Vietnam | 1 | 0.1% |
| Western Africa | 2 | 0.1% | View All 17 Rows |
Sex and Age in East Washington borough
Sex and Age in East Washington borough
The most populous age groups in East Washington borough are 35 to 39 Years (127 | 16.0%) for men and 20 to 24 Years (98 | 10.7%) for women.
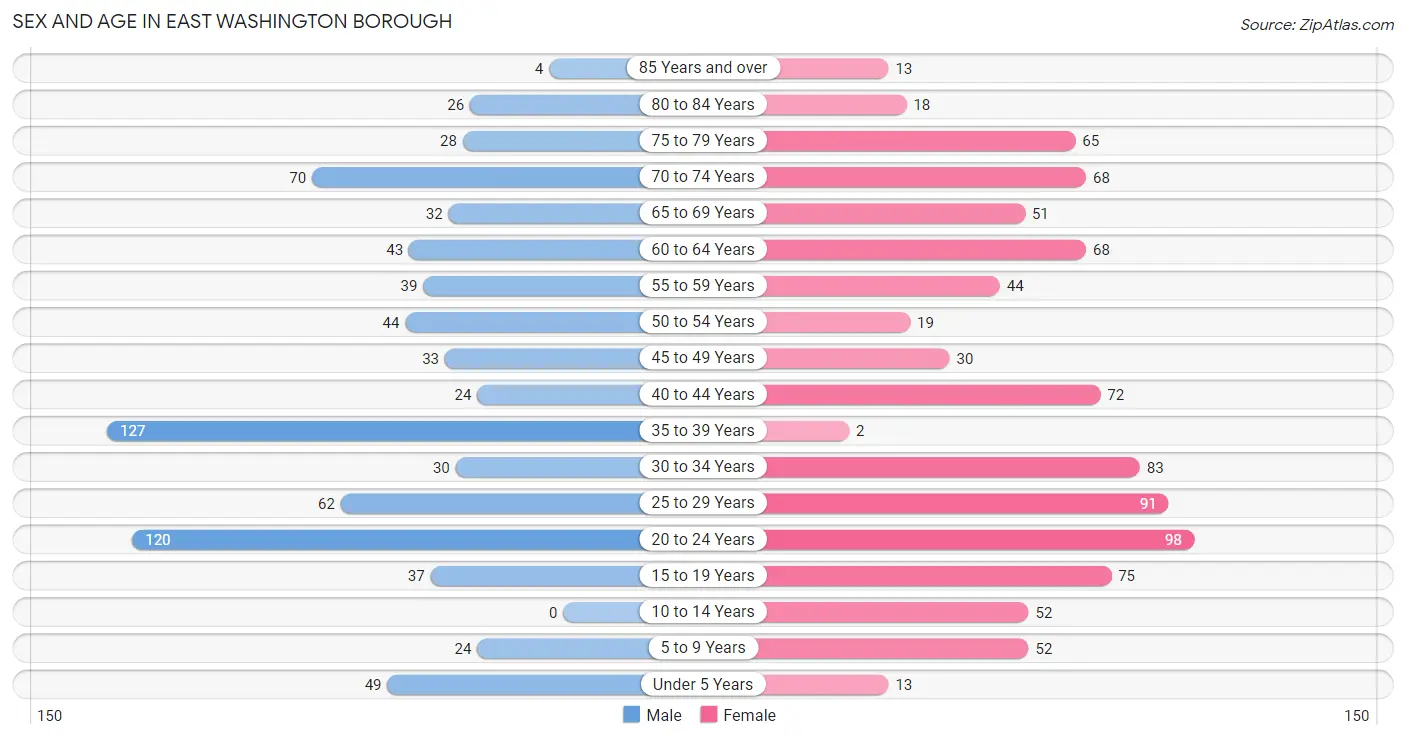
| Age Bracket | Male | Female |
| Under 5 Years | 49 (6.2%) | 13 (1.4%) |
| 5 to 9 Years | 24 (3.0%) | 52 (5.7%) |
| 10 to 14 Years | 0 (0.0%) | 52 (5.7%) |
| 15 to 19 Years | 37 (4.7%) | 75 (8.2%) |
| 20 to 24 Years | 120 (15.1%) | 98 (10.7%) |
| 25 to 29 Years | 62 (7.8%) | 91 (10.0%) |
| 30 to 34 Years | 30 (3.8%) | 83 (9.1%) |
| 35 to 39 Years | 127 (16.0%) | 2 (0.2%) |
| 40 to 44 Years | 24 (3.0%) | 72 (7.9%) |
| 45 to 49 Years | 33 (4.2%) | 30 (3.3%) |
| 50 to 54 Years | 44 (5.6%) | 19 (2.1%) |
| 55 to 59 Years | 39 (4.9%) | 44 (4.8%) |
| 60 to 64 Years | 43 (5.4%) | 68 (7.4%) |
| 65 to 69 Years | 32 (4.0%) | 51 (5.6%) |
| 70 to 74 Years | 70 (8.8%) | 68 (7.4%) |
| 75 to 79 Years | 28 (3.5%) | 65 (7.1%) |
| 80 to 84 Years | 26 (3.3%) | 18 (2.0%) |
| 85 Years and over | 4 (0.5%) | 13 (1.4%) |
| Total | 792 (100.0%) | 914 (100.0%) |
Families and Households in East Washington borough
Median Family Size in East Washington borough
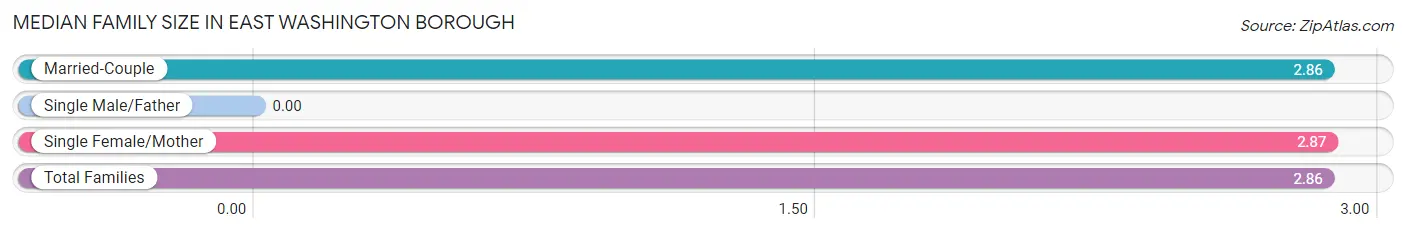
| Family Type | # Families | Family Size |
| Married-Couple | 314 (91.0%) | 2.86 |
| Single Male/Father | 0 (0.0%) | - |
| Single Female/Mother | 31 (9.0%) | 2.87 |
| Total Families | 345 (100.0%) | 2.86 |
Median Household Size in East Washington borough
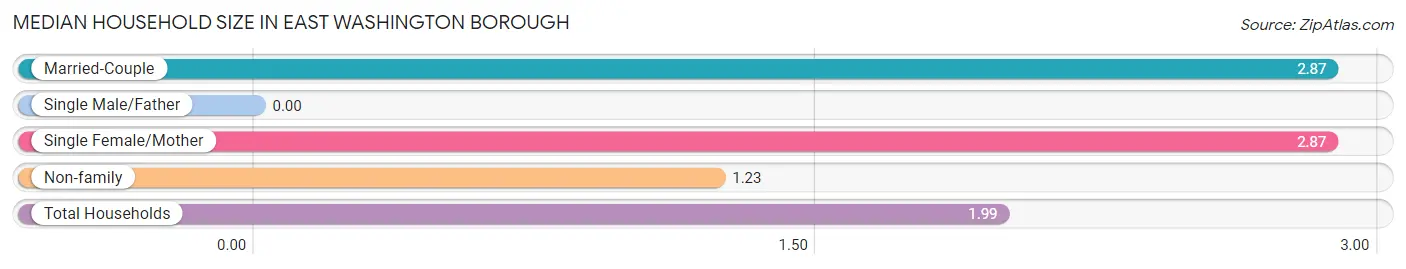
| Household Type | # Households | Household Size |
| Married-Couple | 314 (42.0%) | 2.87 |
| Single Male/Father | 0 (0.0%) | - |
| Single Female/Mother | 31 (4.2%) | 2.87 |
| Non-family | 402 (53.8%) | 1.23 |
| Total Households | 747 (100.0%) | 1.99 |
Household Size by Marriage Status in East Washington borough
Out of a total of 747 households in East Washington borough, 345 (46.2%) are family households, while 402 (53.8%) are nonfamily households. The most numerous type of family households are 2-person households, comprising 176, and the most common type of nonfamily households are 1-person households, comprising 307.
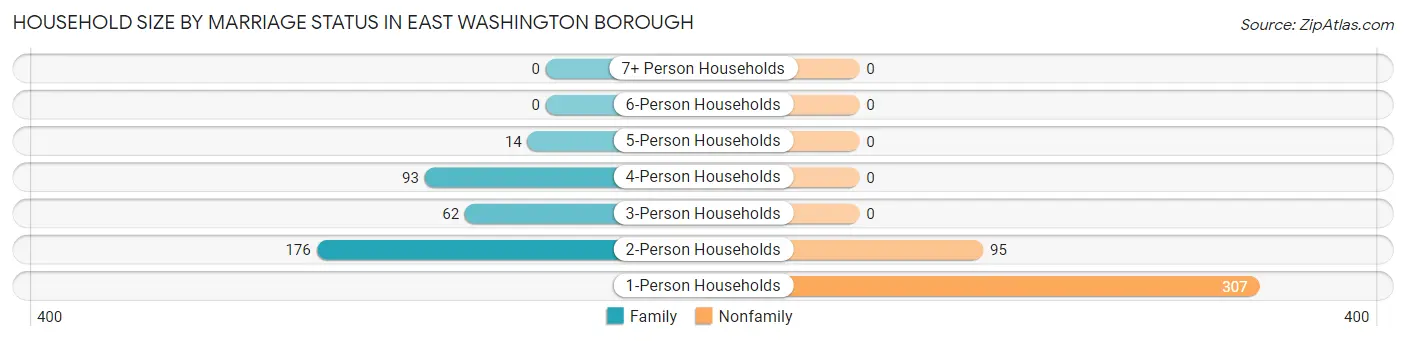
| Household Size | Family Households | Nonfamily Households |
| 1-Person Households | - | 307 (41.1%) |
| 2-Person Households | 176 (23.6%) | 95 (12.7%) |
| 3-Person Households | 62 (8.3%) | 0 (0.0%) |
| 4-Person Households | 93 (12.4%) | 0 (0.0%) |
| 5-Person Households | 14 (1.9%) | 0 (0.0%) |
| 6-Person Households | 0 (0.0%) | 0 (0.0%) |
| 7+ Person Households | 0 (0.0%) | 0 (0.0%) |
| Total | 345 (46.2%) | 402 (53.8%) |
Female Fertility in East Washington borough
Fertility by Age in East Washington borough
Average fertility rate in East Washington borough is 13.0 births per 1,000 women. Women in the age bracket of 35 to 50 years have the highest fertility rate with 53.0 births per 1,000 women. Women in the age bracket of 35 to 50 years acount for 100.0% of all women with births.
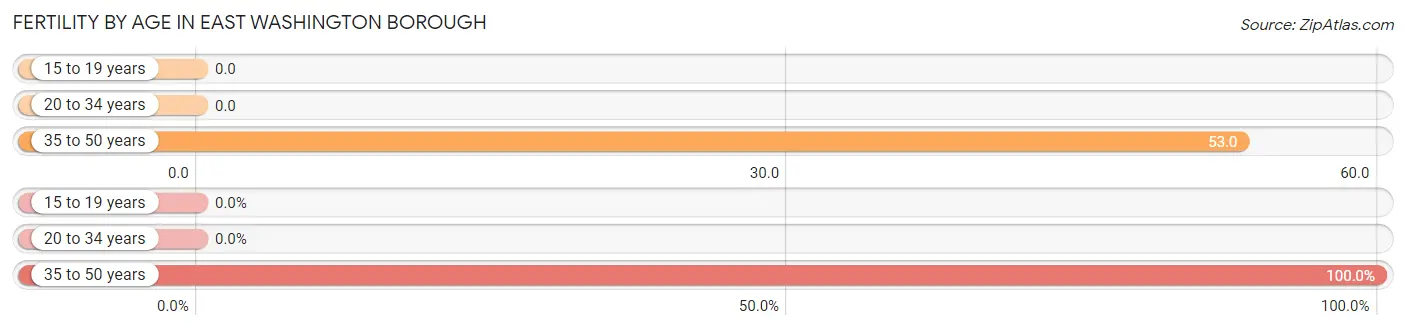
| Age Bracket | Women with Births | Births / 1,000 Women |
| 15 to 19 years | 0 (0.0%) | 0.0 |
| 20 to 34 years | 0 (0.0%) | 0.0 |
| 35 to 50 years | 6 (100.0%) | 53.0 |
| Total | 6 (100.0%) | 13.0 |
Fertility by Age by Marriage Status in East Washington borough
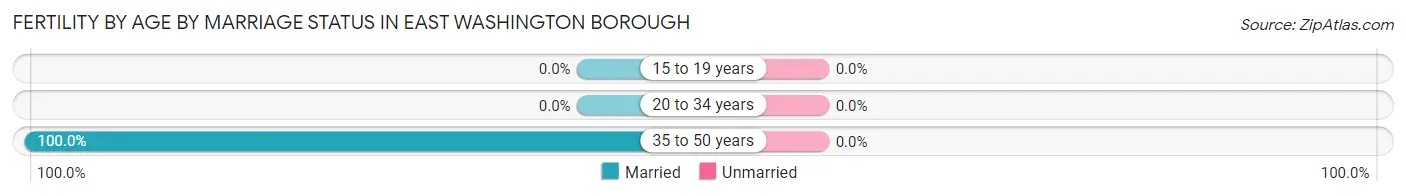
| Age Bracket | Married | Unmarried |
| 15 to 19 years | 0 (0.0%) | 0 (0.0%) |
| 20 to 34 years | 0 (0.0%) | 0 (0.0%) |
| 35 to 50 years | 6 (100.0%) | 0 (0.0%) |
| Total | 6 (100.0%) | 0 (0.0%) |
Fertility by Education in East Washington borough
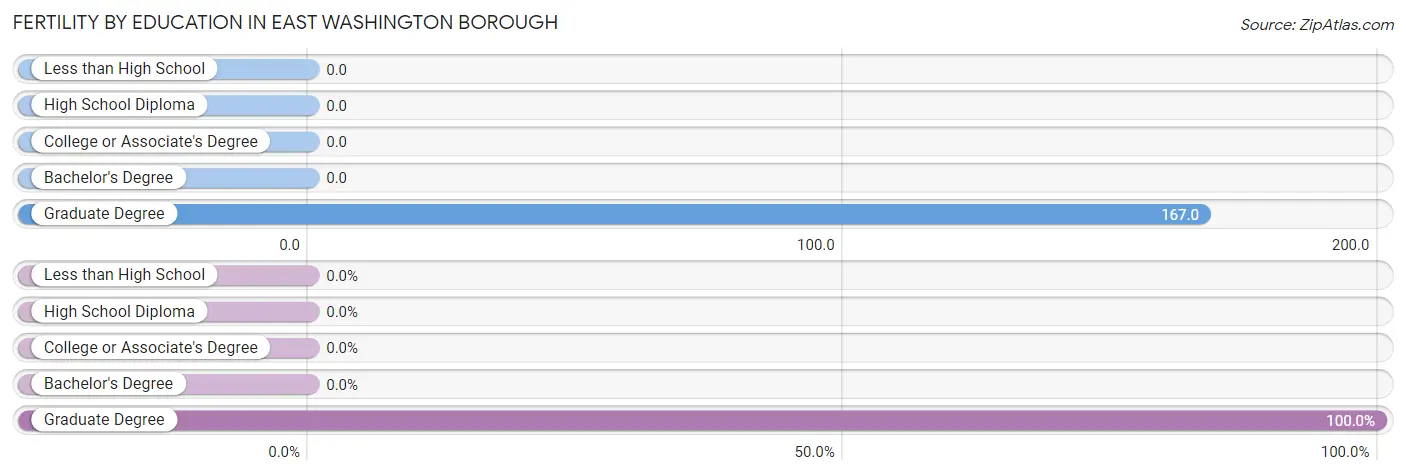
| Educational Attainment | Women with Births | Births / 1,000 Women |
| Less than High School | 0 (0.0%) | 0.0 |
| High School Diploma | 0 (0.0%) | 0.0 |
| College or Associate's Degree | 0 (0.0%) | 0.0 |
| Bachelor's Degree | 0 (0.0%) | 0.0 |
| Graduate Degree | 6 (100.0%) | 167.0 |
| Total | 6 (100.0%) | 13.0 |
Fertility by Education by Marriage Status in East Washington borough
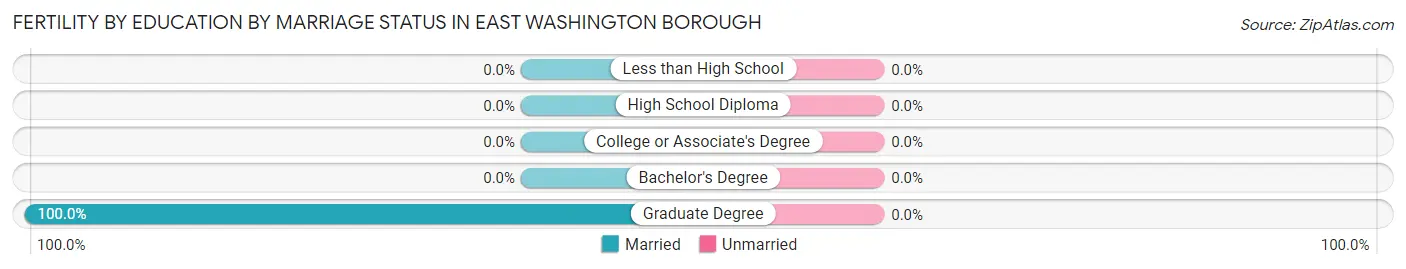
| Educational Attainment | Married | Unmarried |
| Less than High School | 0 (0.0%) | 0 (0.0%) |
| High School Diploma | 0 (0.0%) | 0 (0.0%) |
| College or Associate's Degree | 0 (0.0%) | 0 (0.0%) |
| Bachelor's Degree | 0 (0.0%) | 0 (0.0%) |
| Graduate Degree | 6 (100.0%) | 0 (0.0%) |
| Total | 6 (100.0%) | 0 (0.0%) |
Employment Characteristics in East Washington borough
Employment by Class of Employer in East Washington borough
Among the 984 employed individuals in East Washington borough, private company employees (545 | 55.4%), not-for-profit organizations (180 | 18.3%), and self-employed (incorporated) (79 | 8.0%) make up the most common classes of employment.
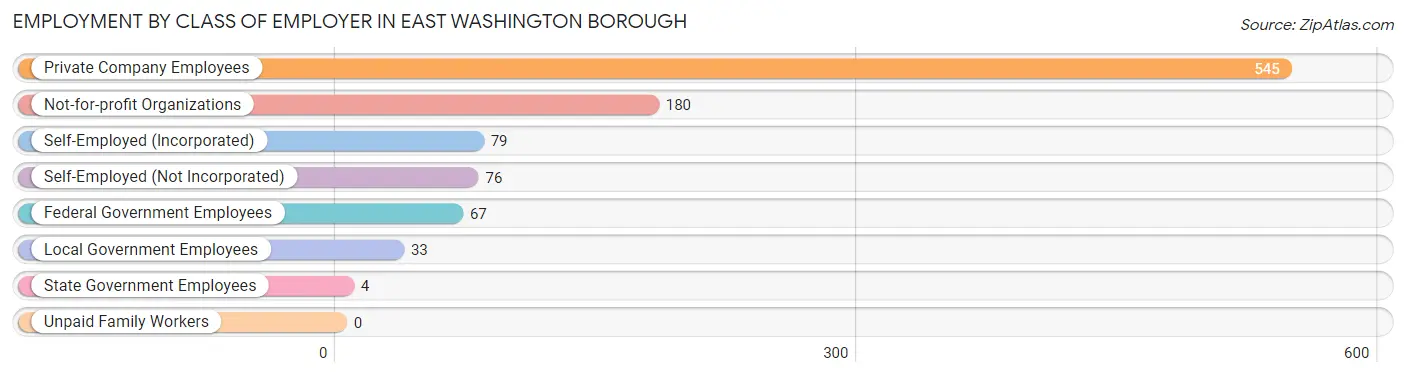
| Employer Class | # Employees | % Employees |
| Private Company Employees | 545 | 55.4% |
| Self-Employed (Incorporated) | 79 | 8.0% |
| Self-Employed (Not Incorporated) | 76 | 7.7% |
| Not-for-profit Organizations | 180 | 18.3% |
| Local Government Employees | 33 | 3.4% |
| State Government Employees | 4 | 0.4% |
| Federal Government Employees | 67 | 6.8% |
| Unpaid Family Workers | 0 | 0.0% |
| Total | 984 | 100.0% |
Employment Status by Age in East Washington borough
According to the labor force statistics for East Washington borough, out of the total population over 16 years of age (1,516), 68.1% or 1,032 individuals are in the labor force, with 1.5% or 15 of them unemployed. The age group with the highest labor force participation rate is 35 to 44 years, with 98.7% or 222 individuals in the labor force. Within the labor force, the 20 to 24 years age range has the highest percentage of unemployed individuals, with 4.1% or 7 of them being unemployed.
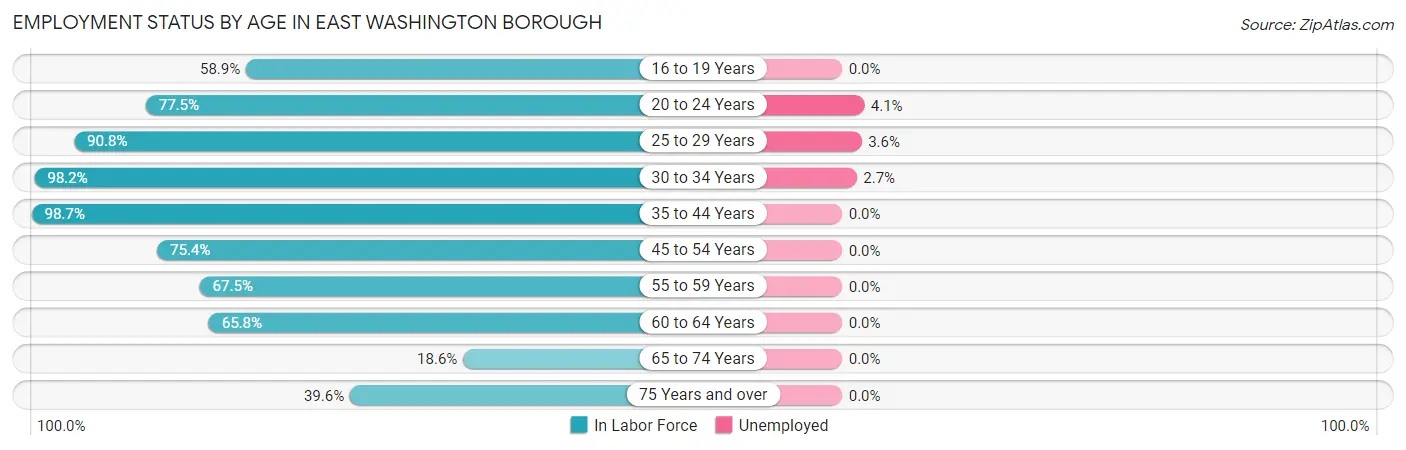
| Age Bracket | In Labor Force | Unemployed |
| 16 to 19 Years | 66 (58.9%) | 0 (0.0%) |
| 20 to 24 Years | 169 (77.5%) | 7 (4.1%) |
| 25 to 29 Years | 139 (90.8%) | 5 (3.6%) |
| 30 to 34 Years | 111 (98.2%) | 3 (2.7%) |
| 35 to 44 Years | 222 (98.7%) | 0 (0.0%) |
| 45 to 54 Years | 95 (75.4%) | 0 (0.0%) |
| 55 to 59 Years | 56 (67.5%) | 0 (0.0%) |
| 60 to 64 Years | 73 (65.8%) | 0 (0.0%) |
| 65 to 74 Years | 41 (18.6%) | 0 (0.0%) |
| 75 Years and over | 61 (39.6%) | 0 (0.0%) |
| Total | 1,032 (68.1%) | 15 (1.5%) |
Employment Status by Educational Attainment in East Washington borough
According to labor force statistics for East Washington borough, 85.8% of individuals (696) out of the total population between 25 and 64 years of age (811) are in the labor force, with 1.1% or 8 of them being unemployed. The group with the highest labor force participation rate are those with the educational attainment of less than high school, with 97.3% or 36 individuals in the labor force. Within the labor force, individuals with bachelor's degree or higher education have the highest percentage of unemployment, with 2.5% or 8 of them being unemployed.
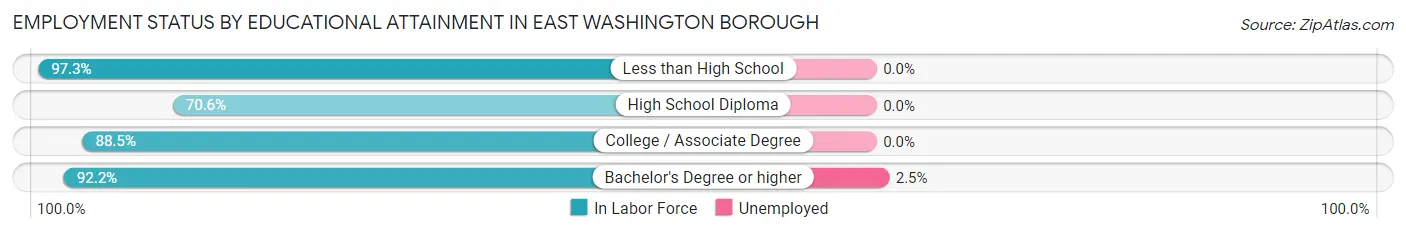
| Educational Attainment | In Labor Force | Unemployed |
| Less than High School | 36 (97.3%) | 0 (0.0%) |
| High School Diploma | 149 (70.6%) | 0 (0.0%) |
| College / Associate Degree | 192 (88.5%) | 0 (0.0%) |
| Bachelor's Degree or higher | 319 (92.2%) | 9 (2.5%) |
| Total | 696 (85.8%) | 9 (1.1%) |
Employment Occupations by Sex in East Washington borough
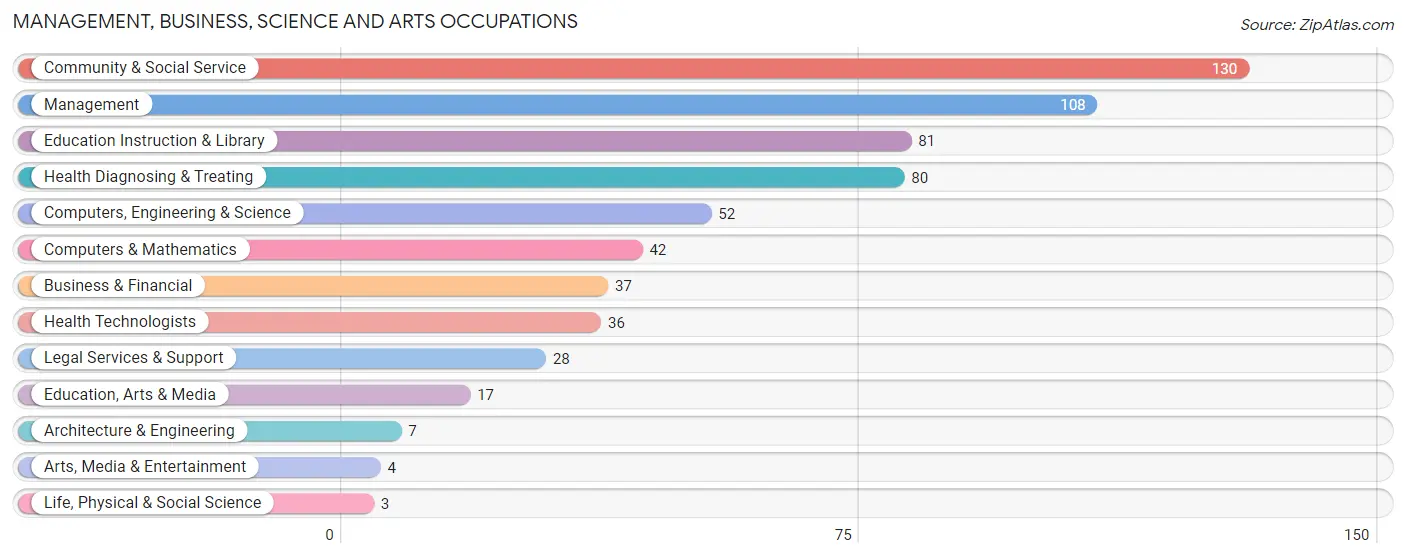
Management, Business, Science and Arts Occupations
The most common Management, Business, Science and Arts occupations in East Washington borough are Community & Social Service (130 | 12.8%), Management (108 | 10.6%), Education Instruction & Library (81 | 8.0%), Health Diagnosing & Treating (80 | 7.9%), and Computers, Engineering & Science (52 | 5.1%).
Management, Business, Science and Arts Occupations by Sex
Within the Management, Business, Science and Arts occupations in East Washington borough, the most male-oriented occupations are Architecture & Engineering (100.0%), Arts, Media & Entertainment (100.0%), and Computers, Engineering & Science (65.4%), while the most female-oriented occupations are Life, Physical & Social Science (100.0%), Education, Arts & Media (100.0%), and Business & Financial (64.9%).
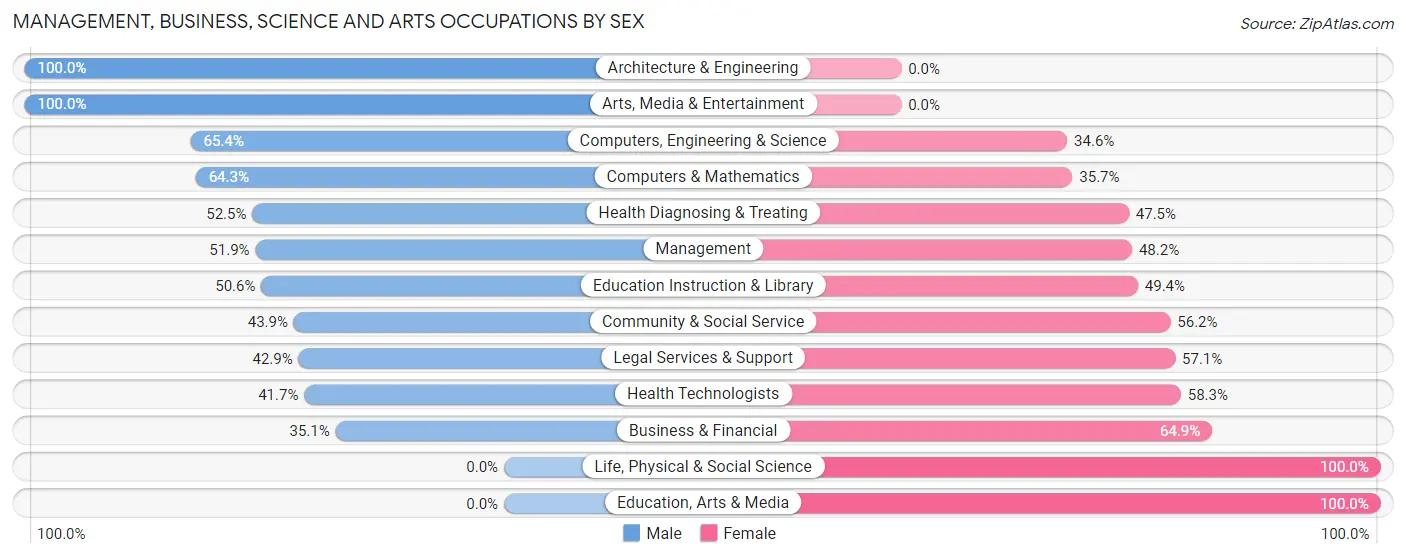
| Occupation | Male | Female |
| Management | 56 (51.8%) | 52 (48.1%) |
| Business & Financial | 13 (35.1%) | 24 (64.9%) |
| Computers, Engineering & Science | 34 (65.4%) | 18 (34.6%) |
| Computers & Mathematics | 27 (64.3%) | 15 (35.7%) |
| Architecture & Engineering | 7 (100.0%) | 0 (0.0%) |
| Life, Physical & Social Science | 0 (0.0%) | 3 (100.0%) |
| Community & Social Service | 57 (43.9%) | 73 (56.1%) |
| Education, Arts & Media | 0 (0.0%) | 17 (100.0%) |
| Legal Services & Support | 12 (42.9%) | 16 (57.1%) |
| Education Instruction & Library | 41 (50.6%) | 40 (49.4%) |
| Arts, Media & Entertainment | 4 (100.0%) | 0 (0.0%) |
| Health Diagnosing & Treating | 42 (52.5%) | 38 (47.5%) |
| Health Technologists | 15 (41.7%) | 21 (58.3%) |
| Total (Category) | 202 (49.6%) | 205 (50.4%) |
| Total (Overall) | 497 (48.8%) | 521 (51.2%) |
Services Occupations
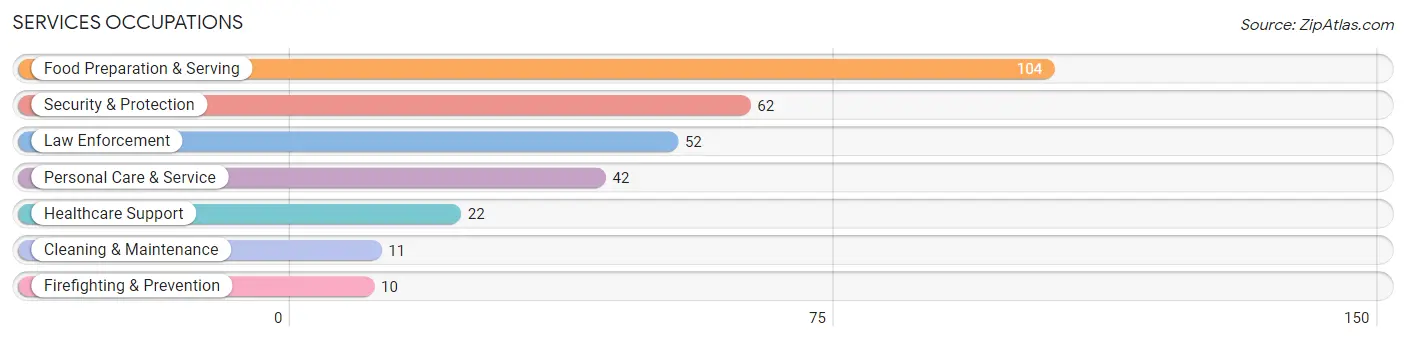
The most common Services occupations in East Washington borough are Food Preparation & Serving (104 | 10.2%), Security & Protection (62 | 6.1%), Law Enforcement (52 | 5.1%), Personal Care & Service (42 | 4.1%), and Healthcare Support (22 | 2.2%).
Services Occupations by Sex
Within the Services occupations in East Washington borough, the most male-oriented occupations are Law Enforcement (100.0%), Security & Protection (87.1%), and Cleaning & Maintenance (45.5%), while the most female-oriented occupations are Healthcare Support (100.0%), Personal Care & Service (88.1%), and Firefighting & Prevention (80.0%).
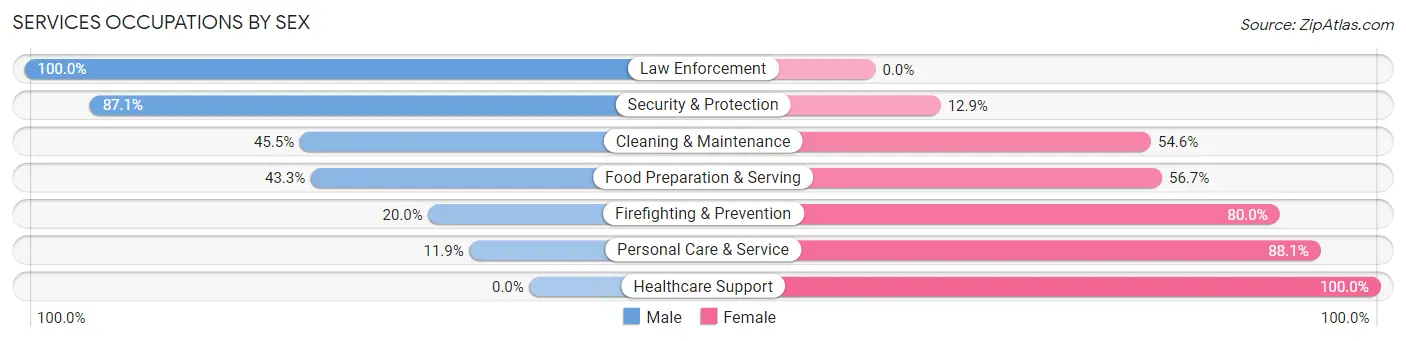
| Occupation | Male | Female |
| Healthcare Support | 0 (0.0%) | 22 (100.0%) |
| Security & Protection | 54 (87.1%) | 8 (12.9%) |
| Firefighting & Prevention | 2 (20.0%) | 8 (80.0%) |
| Law Enforcement | 52 (100.0%) | 0 (0.0%) |
| Food Preparation & Serving | 45 (43.3%) | 59 (56.7%) |
| Cleaning & Maintenance | 5 (45.5%) | 6 (54.5%) |
| Personal Care & Service | 5 (11.9%) | 37 (88.1%) |
| Total (Category) | 109 (45.2%) | 132 (54.8%) |
| Total (Overall) | 497 (48.8%) | 521 (51.2%) |
Sales and Office Occupations
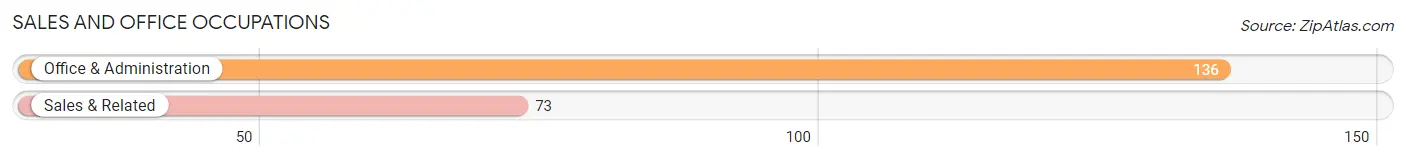
The most common Sales and Office occupations in East Washington borough are Office & Administration (136 | 13.4%), and Sales & Related (73 | 7.2%).
Sales and Office Occupations by Sex
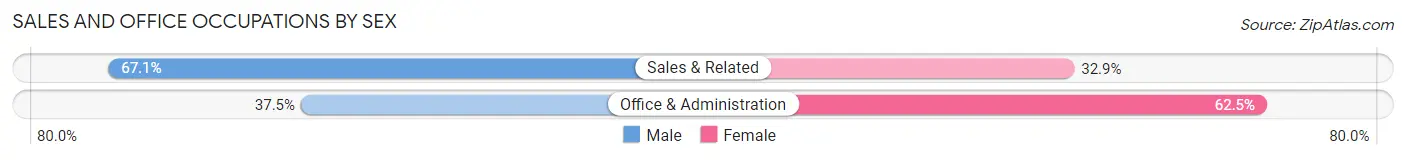
| Occupation | Male | Female |
| Sales & Related | 49 (67.1%) | 24 (32.9%) |
| Office & Administration | 51 (37.5%) | 85 (62.5%) |
| Total (Category) | 100 (47.8%) | 109 (52.1%) |
| Total (Overall) | 497 (48.8%) | 521 (51.2%) |
Natural Resources, Construction and Maintenance Occupations
The most common Natural Resources, Construction and Maintenance occupations in East Washington borough are Construction & Extraction (25 | 2.5%), and Installation, Maintenance & Repair (17 | 1.7%).
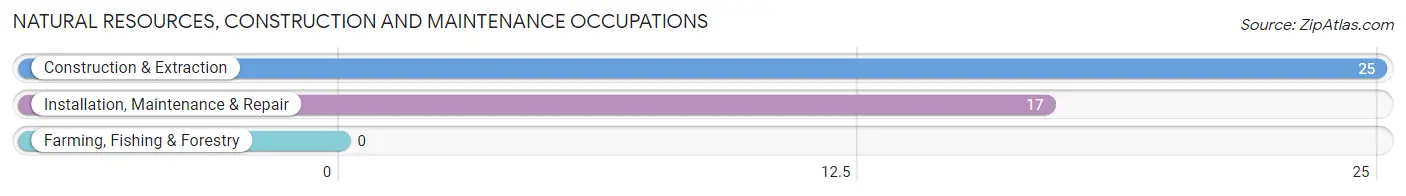
Natural Resources, Construction and Maintenance Occupations by Sex
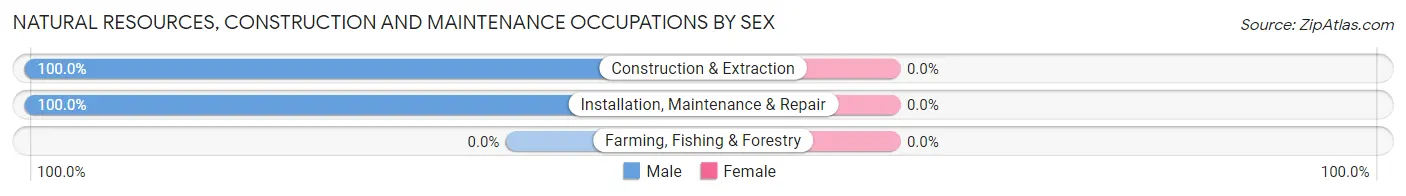
| Occupation | Male | Female |
| Farming, Fishing & Forestry | 0 (0.0%) | 0 (0.0%) |
| Construction & Extraction | 25 (100.0%) | 0 (0.0%) |
| Installation, Maintenance & Repair | 17 (100.0%) | 0 (0.0%) |
| Total (Category) | 42 (100.0%) | 0 (0.0%) |
| Total (Overall) | 497 (48.8%) | 521 (51.2%) |
Production, Transportation and Moving Occupations
The most common Production, Transportation and Moving occupations in East Washington borough are Transportation (75 | 7.4%), Production (33 | 3.2%), and Material Moving (11 | 1.1%).
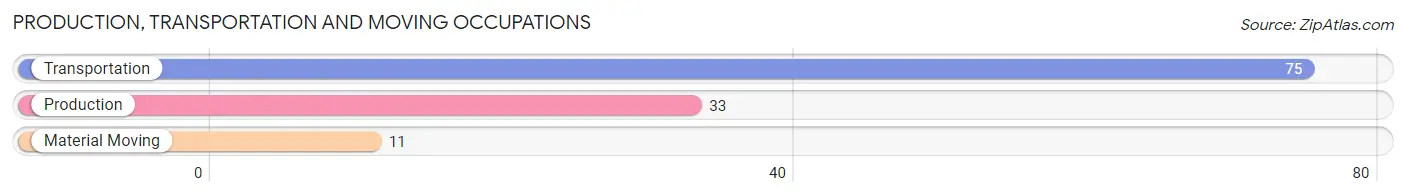
Production, Transportation and Moving Occupations by Sex
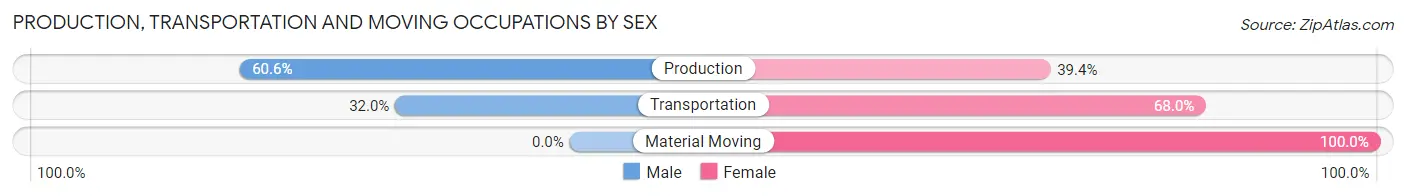
| Occupation | Male | Female |
| Production | 20 (60.6%) | 13 (39.4%) |
| Transportation | 24 (32.0%) | 51 (68.0%) |
| Material Moving | 0 (0.0%) | 11 (100.0%) |
| Total (Category) | 44 (37.0%) | 75 (63.0%) |
| Total (Overall) | 497 (48.8%) | 521 (51.2%) |
Employment Industries by Sex in East Washington borough
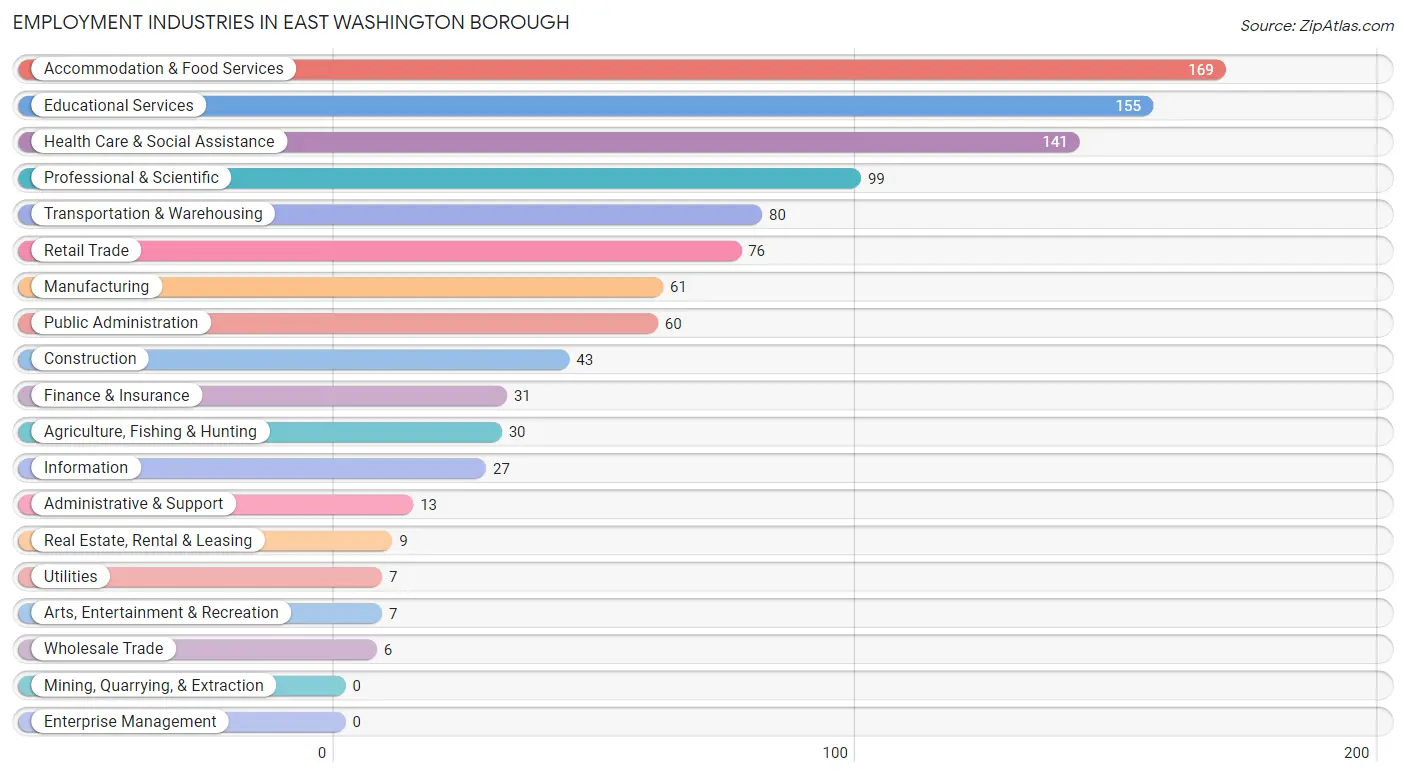
Employment Industries in East Washington borough
The major employment industries in East Washington borough include Accommodation & Food Services (169 | 16.6%), Educational Services (155 | 15.2%), Health Care & Social Assistance (141 | 13.9%), Professional & Scientific (99 | 9.7%), and Transportation & Warehousing (80 | 7.9%).
Employment Industries by Sex in East Washington borough
The East Washington borough industries that see more men than women are Wholesale Trade (100.0%), Utilities (100.0%), and Arts, Entertainment & Recreation (100.0%), whereas the industries that tend to have a higher number of women are Transportation & Warehousing (77.5%), Administrative & Support (76.9%), and Real Estate, Rental & Leasing (66.7%).
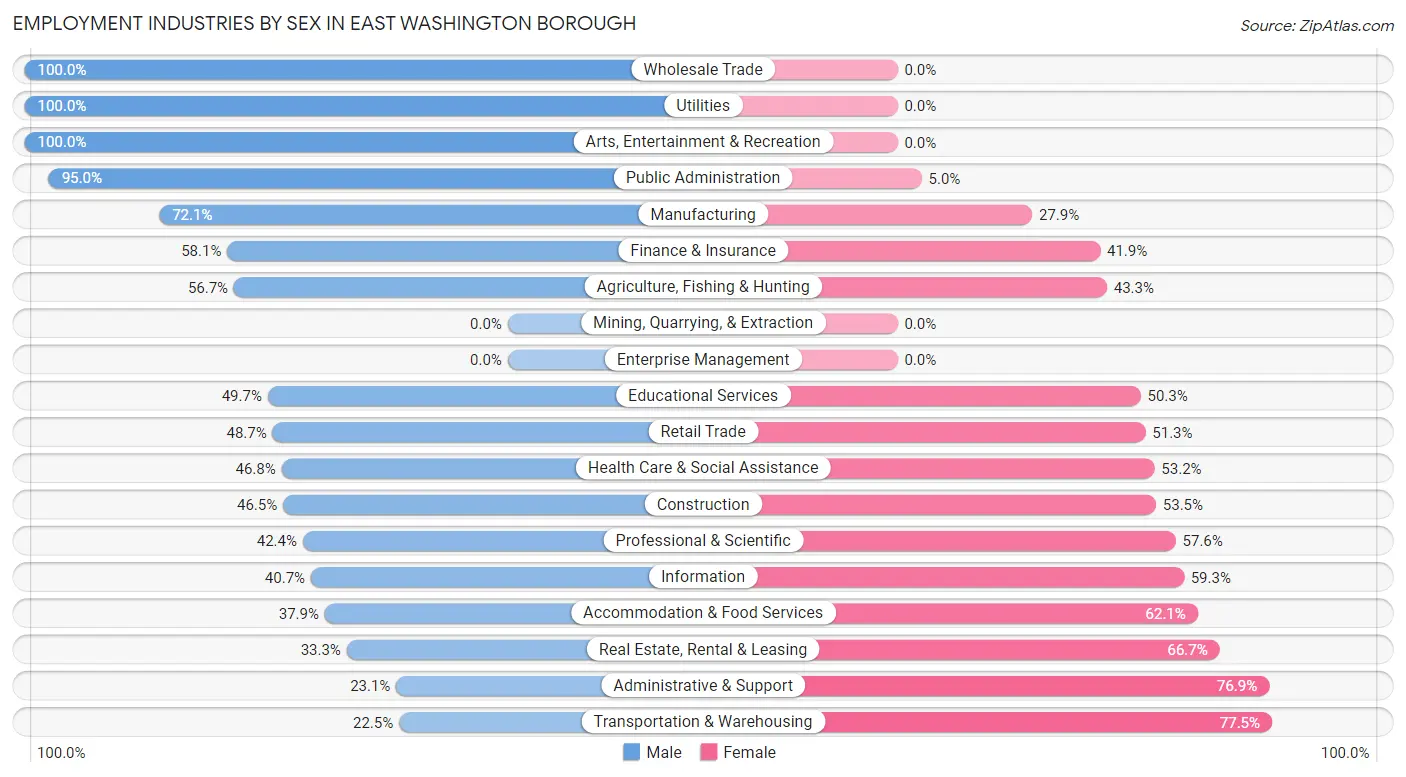
| Industry | Male | Female |
| Agriculture, Fishing & Hunting | 17 (56.7%) | 13 (43.3%) |
| Mining, Quarrying, & Extraction | 0 (0.0%) | 0 (0.0%) |
| Construction | 20 (46.5%) | 23 (53.5%) |
| Manufacturing | 44 (72.1%) | 17 (27.9%) |
| Wholesale Trade | 6 (100.0%) | 0 (0.0%) |
| Retail Trade | 37 (48.7%) | 39 (51.3%) |
| Transportation & Warehousing | 18 (22.5%) | 62 (77.5%) |
| Utilities | 7 (100.0%) | 0 (0.0%) |
| Information | 11 (40.7%) | 16 (59.3%) |
| Finance & Insurance | 18 (58.1%) | 13 (41.9%) |
| Real Estate, Rental & Leasing | 3 (33.3%) | 6 (66.7%) |
| Professional & Scientific | 42 (42.4%) | 57 (57.6%) |
| Enterprise Management | 0 (0.0%) | 0 (0.0%) |
| Administrative & Support | 3 (23.1%) | 10 (76.9%) |
| Educational Services | 77 (49.7%) | 78 (50.3%) |
| Health Care & Social Assistance | 66 (46.8%) | 75 (53.2%) |
| Arts, Entertainment & Recreation | 7 (100.0%) | 0 (0.0%) |
| Accommodation & Food Services | 64 (37.9%) | 105 (62.1%) |
| Public Administration | 57 (95.0%) | 3 (5.0%) |
| Total | 497 (48.8%) | 521 (51.2%) |
Education in East Washington borough
School Enrollment in East Washington borough
The most common levels of schooling among the 419 students in East Washington borough are college / undergraduate (242 | 57.8%), middle school (52 | 12.4%), and high school (47 | 11.2%).
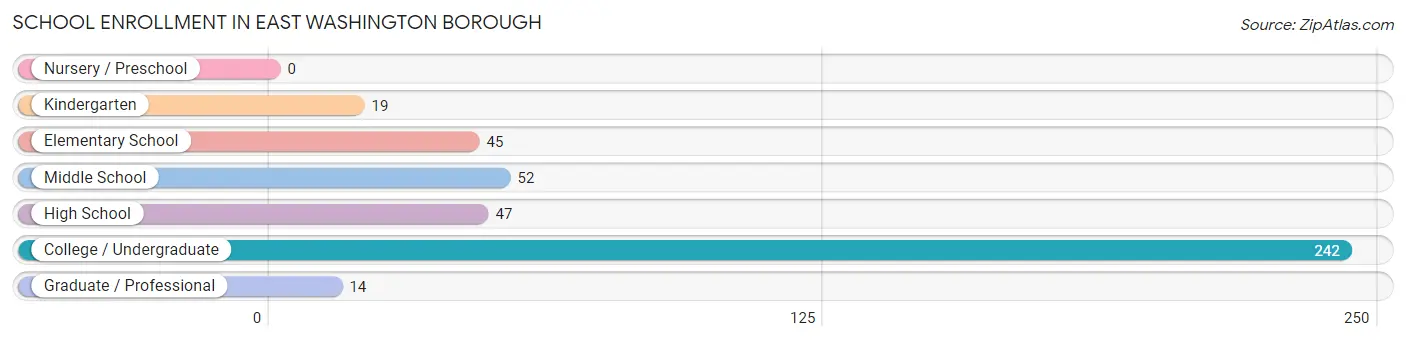
| School Level | # Students | % Students |
| Nursery / Preschool | 0 | 0.0% |
| Kindergarten | 19 | 4.5% |
| Elementary School | 45 | 10.7% |
| Middle School | 52 | 12.4% |
| High School | 47 | 11.2% |
| College / Undergraduate | 242 | 57.8% |
| Graduate / Professional | 14 | 3.3% |
| Total | 419 | 100.0% |
School Enrollment by Age by Funding Source in East Washington borough
Out of a total of 419 students who are enrolled in schools in East Washington borough, 197 (47.0%) attend a private institution, while the remaining 222 (53.0%) are enrolled in public schools. The age group of 35 years and over has the highest likelihood of being enrolled in private schools, with 5 (100.0% in the age bracket) enrolled. Conversely, the age group of 25 to 34 year olds has the lowest likelihood of being enrolled in a private school, with 21 (100.0% in the age bracket) attending a public institution.
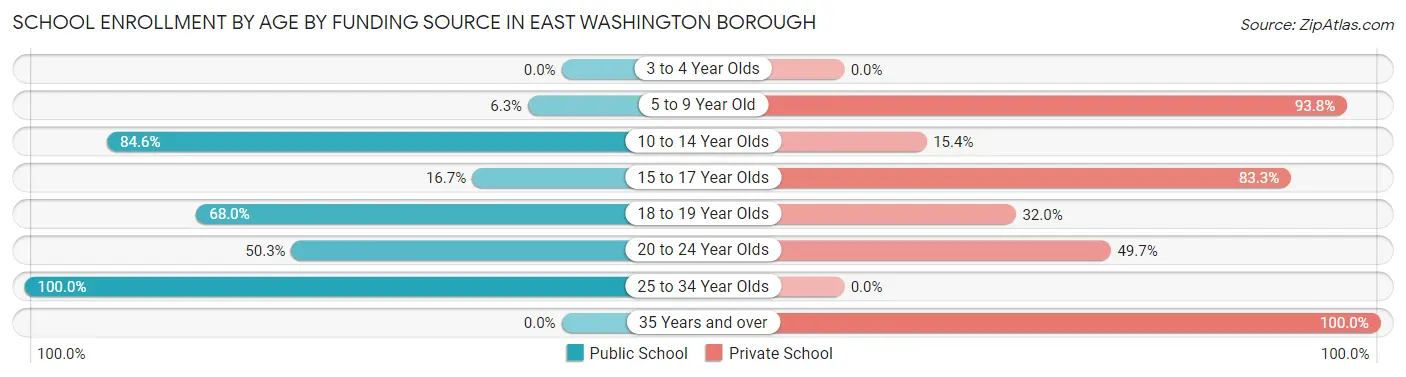
| Age Bracket | Public School | Private School |
| 3 to 4 Year Olds | 0 (0.0%) | 0 (0.0%) |
| 5 to 9 Year Old | 4 (6.2%) | 60 (93.8%) |
| 10 to 14 Year Olds | 44 (84.6%) | 8 (15.4%) |
| 15 to 17 Year Olds | 2 (16.7%) | 10 (83.3%) |
| 18 to 19 Year Olds | 68 (68.0%) | 32 (32.0%) |
| 20 to 24 Year Olds | 83 (50.3%) | 82 (49.7%) |
| 25 to 34 Year Olds | 21 (100.0%) | 0 (0.0%) |
| 35 Years and over | 0 (0.0%) | 5 (100.0%) |
| Total | 222 (53.0%) | 197 (47.0%) |
Educational Attainment by Field of Study in East Washington borough
Education (100 | 14.9%), social sciences (97 | 14.4%), psychology (70 | 10.4%), arts & humanities (70 | 10.4%), and business (61 | 9.1%) are the most common fields of study among 673 individuals in East Washington borough who have obtained a bachelor's degree or higher.
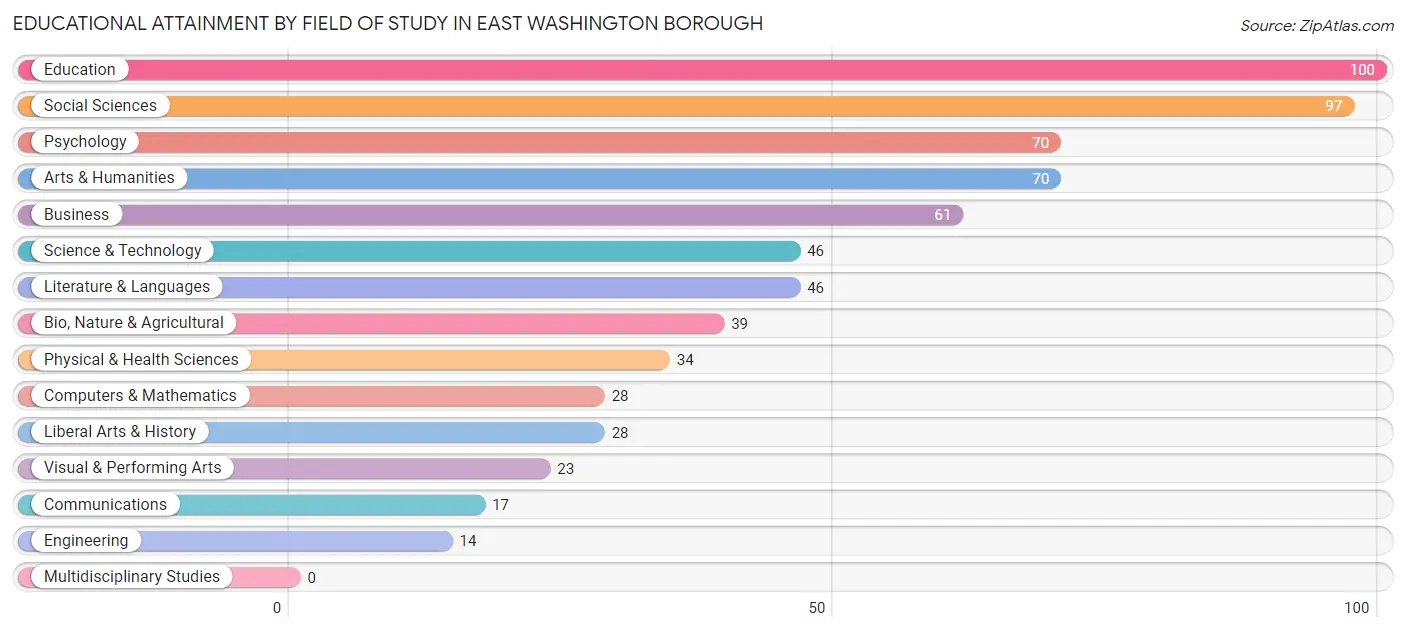
| Field of Study | # Graduates | % Graduates |
| Computers & Mathematics | 28 | 4.2% |
| Bio, Nature & Agricultural | 39 | 5.8% |
| Physical & Health Sciences | 34 | 5.1% |
| Psychology | 70 | 10.4% |
| Social Sciences | 97 | 14.4% |
| Engineering | 14 | 2.1% |
| Multidisciplinary Studies | 0 | 0.0% |
| Science & Technology | 46 | 6.8% |
| Business | 61 | 9.1% |
| Education | 100 | 14.9% |
| Literature & Languages | 46 | 6.8% |
| Liberal Arts & History | 28 | 4.2% |
| Visual & Performing Arts | 23 | 3.4% |
| Communications | 17 | 2.5% |
| Arts & Humanities | 70 | 10.4% |
| Total | 673 | 100.0% |
Transportation & Commute in East Washington borough
Vehicle Availability by Sex in East Washington borough
The most prevalent vehicle ownership categories in East Washington borough are males with 2 vehicles (233, accounting for 53.1%) and females with 2 vehicles (222, making up 53.4%).
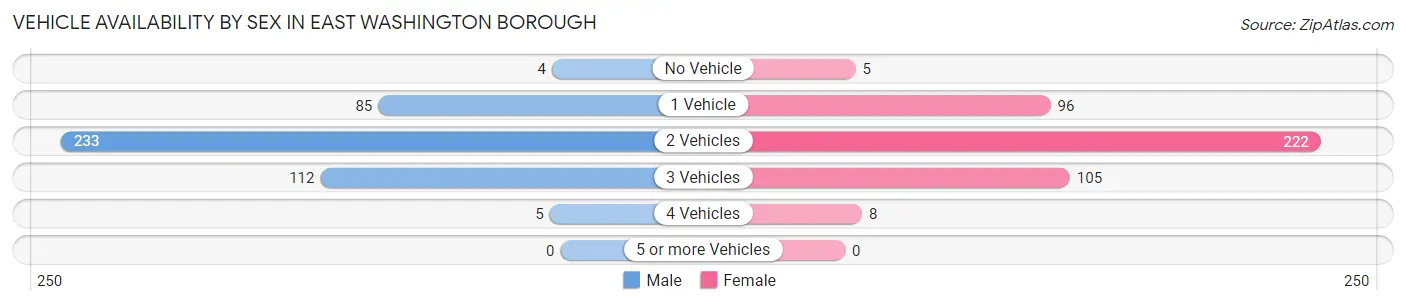
| Vehicles Available | Male | Female |
| No Vehicle | 4 (0.9%) | 5 (1.1%) |
| 1 Vehicle | 85 (19.4%) | 96 (22.0%) |
| 2 Vehicles | 233 (53.1%) | 222 (50.9%) |
| 3 Vehicles | 112 (25.5%) | 105 (24.1%) |
| 4 Vehicles | 5 (1.1%) | 8 (1.8%) |
| 5 or more Vehicles | 0 (0.0%) | 0 (0.0%) |
| Total | 439 (100.0%) | 436 (100.0%) |
Commute Time in East Washington borough
The most frequently occuring commute durations in East Washington borough are 10 to 14 minutes (249 commuters, 26.8%), 20 to 24 minutes (163 commuters, 17.5%), and 5 to 9 minutes (109 commuters, 11.7%).
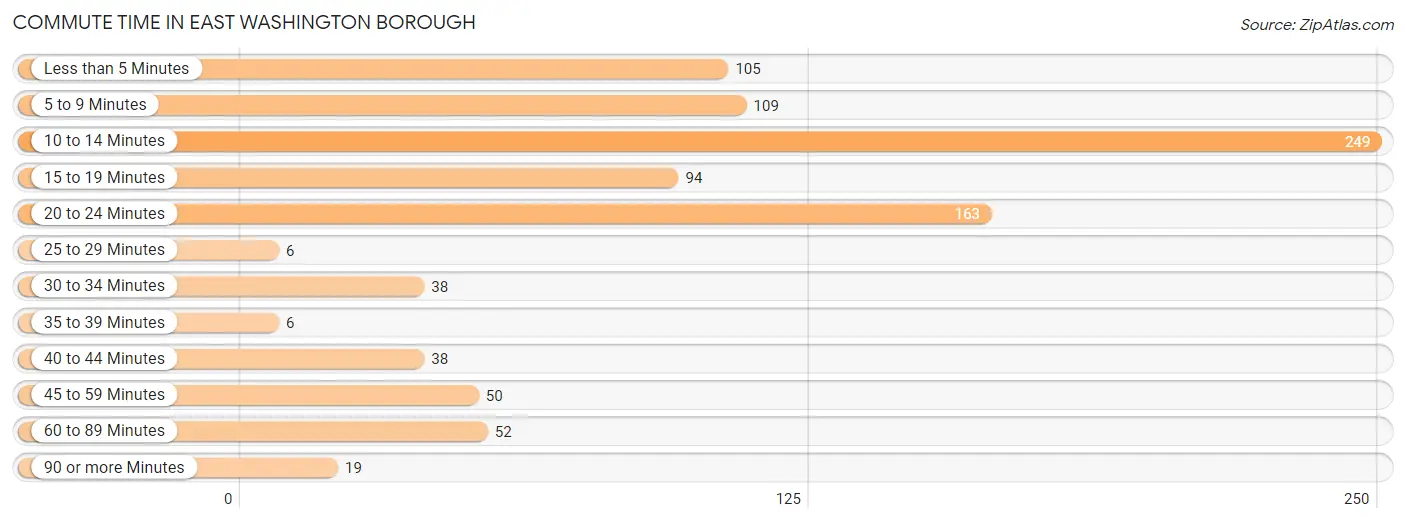
| Commute Time | # Commuters | % Commuters |
| Less than 5 Minutes | 105 | 11.3% |
| 5 to 9 Minutes | 109 | 11.7% |
| 10 to 14 Minutes | 249 | 26.8% |
| 15 to 19 Minutes | 94 | 10.1% |
| 20 to 24 Minutes | 163 | 17.5% |
| 25 to 29 Minutes | 6 | 0.6% |
| 30 to 34 Minutes | 38 | 4.1% |
| 35 to 39 Minutes | 6 | 0.6% |
| 40 to 44 Minutes | 38 | 4.1% |
| 45 to 59 Minutes | 50 | 5.4% |
| 60 to 89 Minutes | 52 | 5.6% |
| 90 or more Minutes | 19 | 2.1% |
Commute Time by Sex in East Washington borough
The most common commute times in East Washington borough are 20 to 24 minutes (84 commuters, 18.8%) for males and 10 to 14 minutes (178 commuters, 37.0%) for females.
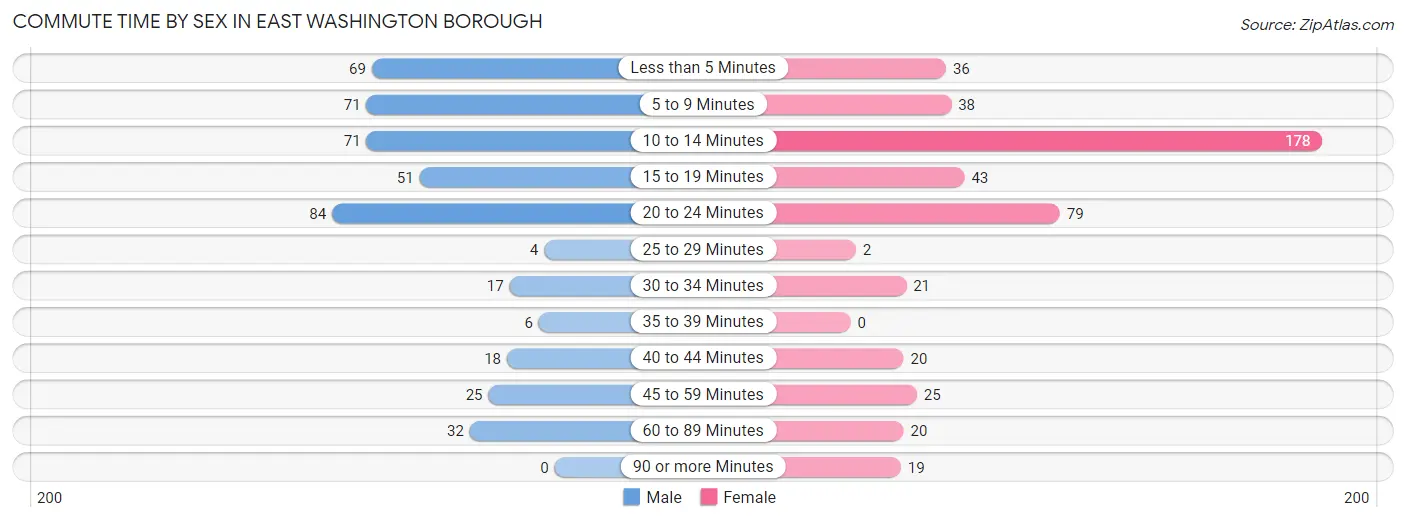
| Commute Time | Male | Female |
| Less than 5 Minutes | 69 (15.4%) | 36 (7.5%) |
| 5 to 9 Minutes | 71 (15.9%) | 38 (7.9%) |
| 10 to 14 Minutes | 71 (15.9%) | 178 (37.0%) |
| 15 to 19 Minutes | 51 (11.4%) | 43 (8.9%) |
| 20 to 24 Minutes | 84 (18.8%) | 79 (16.4%) |
| 25 to 29 Minutes | 4 (0.9%) | 2 (0.4%) |
| 30 to 34 Minutes | 17 (3.8%) | 21 (4.4%) |
| 35 to 39 Minutes | 6 (1.3%) | 0 (0.0%) |
| 40 to 44 Minutes | 18 (4.0%) | 20 (4.2%) |
| 45 to 59 Minutes | 25 (5.6%) | 25 (5.2%) |
| 60 to 89 Minutes | 32 (7.1%) | 20 (4.2%) |
| 90 or more Minutes | 0 (0.0%) | 19 (4.0%) |
Time of Departure to Work by Sex in East Washington borough
The most frequent times of departure to work in East Washington borough are 7:00 AM to 7:29 AM (76, 17.0%) for males and 6:00 AM to 6:29 AM (111, 23.1%) for females.
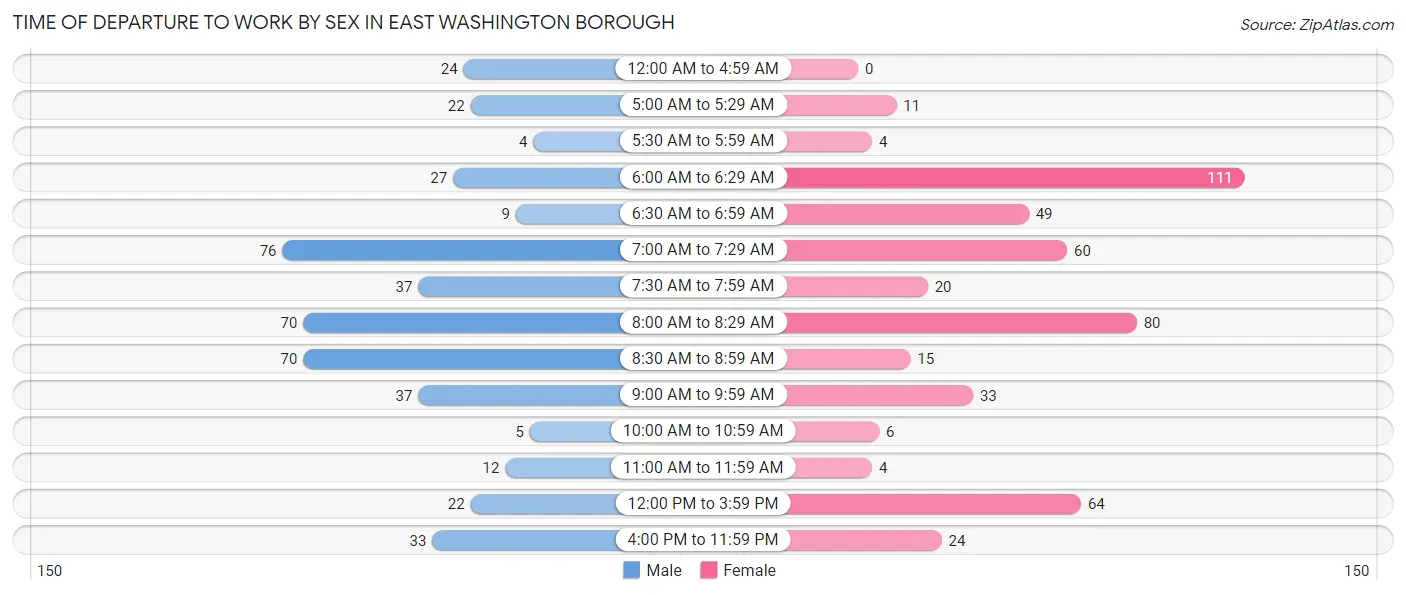
| Time of Departure | Male | Female |
| 12:00 AM to 4:59 AM | 24 (5.4%) | 0 (0.0%) |
| 5:00 AM to 5:29 AM | 22 (4.9%) | 11 (2.3%) |
| 5:30 AM to 5:59 AM | 4 (0.9%) | 4 (0.8%) |
| 6:00 AM to 6:29 AM | 27 (6.0%) | 111 (23.1%) |
| 6:30 AM to 6:59 AM | 9 (2.0%) | 49 (10.2%) |
| 7:00 AM to 7:29 AM | 76 (17.0%) | 60 (12.5%) |
| 7:30 AM to 7:59 AM | 37 (8.3%) | 20 (4.2%) |
| 8:00 AM to 8:29 AM | 70 (15.6%) | 80 (16.6%) |
| 8:30 AM to 8:59 AM | 70 (15.6%) | 15 (3.1%) |
| 9:00 AM to 9:59 AM | 37 (8.3%) | 33 (6.9%) |
| 10:00 AM to 10:59 AM | 5 (1.1%) | 6 (1.3%) |
| 11:00 AM to 11:59 AM | 12 (2.7%) | 4 (0.8%) |
| 12:00 PM to 3:59 PM | 22 (4.9%) | 64 (13.3%) |
| 4:00 PM to 11:59 PM | 33 (7.4%) | 24 (5.0%) |
| Total | 448 (100.0%) | 481 (100.0%) |
Housing Occupancy in East Washington borough
Occupancy by Ownership in East Washington borough
Of the total 747 dwellings in East Washington borough, owner-occupied units account for 478 (64.0%), while renter-occupied units make up 269 (36.0%).
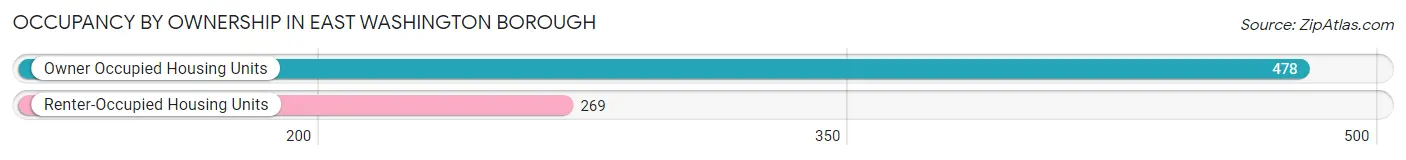
| Occupancy | # Housing Units | % Housing Units |
| Owner Occupied Housing Units | 478 | 64.0% |
| Renter-Occupied Housing Units | 269 | 36.0% |
| Total Occupied Housing Units | 747 | 100.0% |
Occupancy by Household Size in East Washington borough
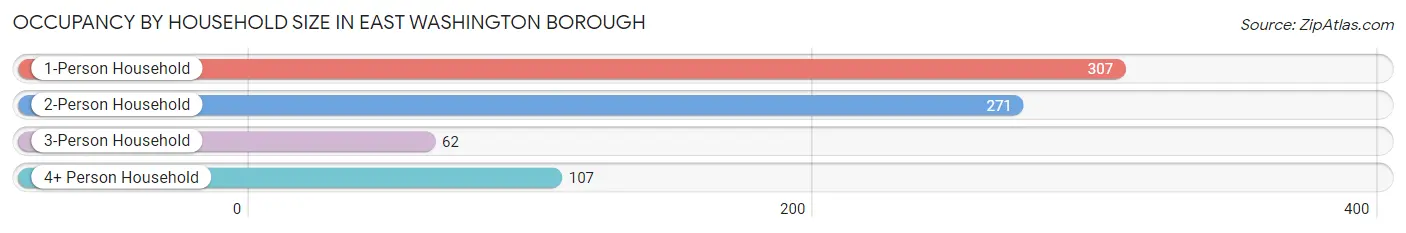
| Household Size | # Housing Units | % Housing Units |
| 1-Person Household | 307 | 41.1% |
| 2-Person Household | 271 | 36.3% |
| 3-Person Household | 62 | 8.3% |
| 4+ Person Household | 107 | 14.3% |
| Total Housing Units | 747 | 100.0% |
Occupancy by Ownership by Household Size in East Washington borough
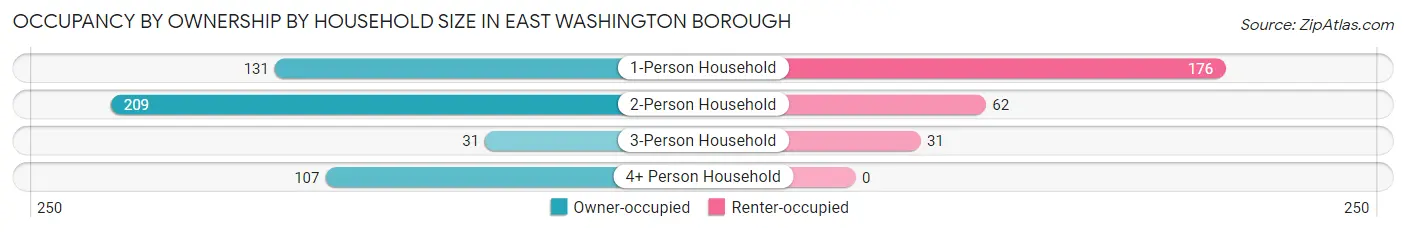
| Household Size | Owner-occupied | Renter-occupied |
| 1-Person Household | 131 (42.7%) | 176 (57.3%) |
| 2-Person Household | 209 (77.1%) | 62 (22.9%) |
| 3-Person Household | 31 (50.0%) | 31 (50.0%) |
| 4+ Person Household | 107 (100.0%) | 0 (0.0%) |
| Total Housing Units | 478 (64.0%) | 269 (36.0%) |
Occupancy by Educational Attainment in East Washington borough
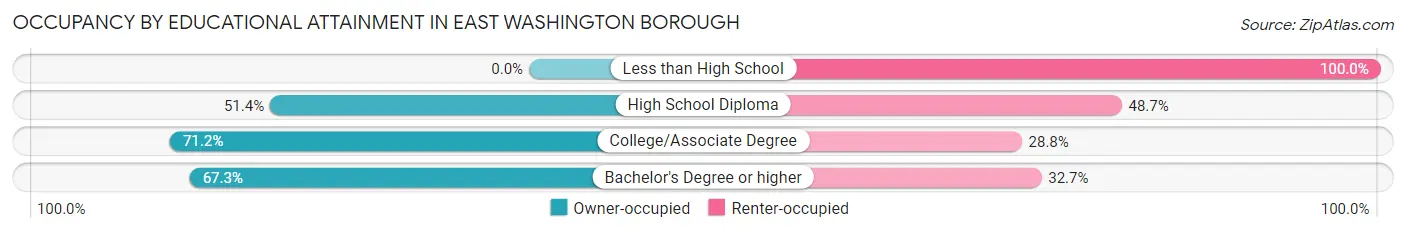
| Household Size | Owner-occupied | Renter-occupied |
| Less than High School | 0 (0.0%) | 23 (100.0%) |
| High School Diploma | 57 (51.3%) | 54 (48.6%) |
| College/Associate Degree | 158 (71.2%) | 64 (28.8%) |
| Bachelor's Degree or higher | 263 (67.3%) | 128 (32.7%) |
Occupancy by Age of Householder in East Washington borough
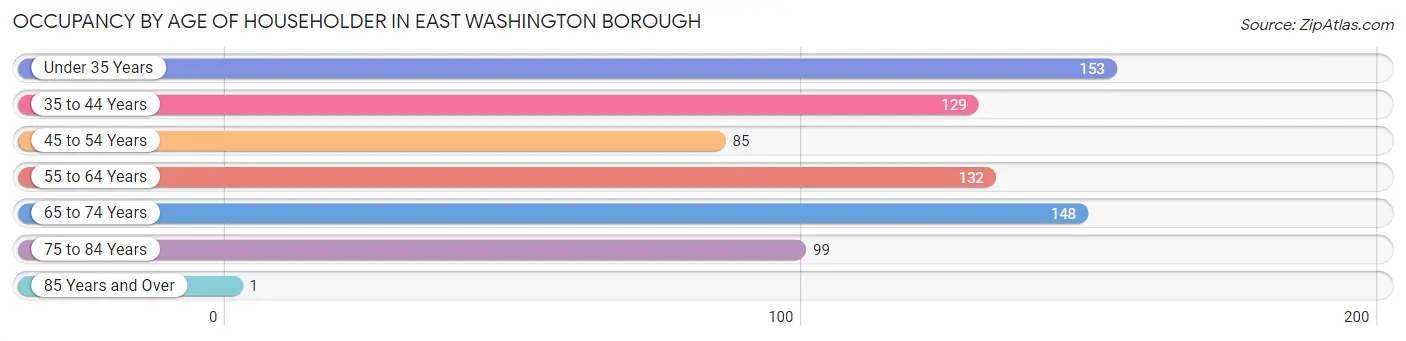
| Age Bracket | # Households | % Households |
| Under 35 Years | 153 | 20.5% |
| 35 to 44 Years | 129 | 17.3% |
| 45 to 54 Years | 85 | 11.4% |
| 55 to 64 Years | 132 | 17.7% |
| 65 to 74 Years | 148 | 19.8% |
| 75 to 84 Years | 99 | 13.3% |
| 85 Years and Over | 1 | 0.1% |
| Total | 747 | 100.0% |
Housing Finances in East Washington borough
Median Income by Occupancy in East Washington borough
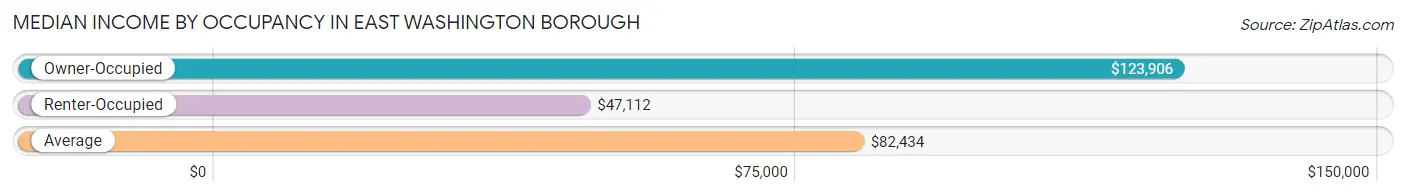
| Occupancy Type | # Households | Median Income |
| Owner-Occupied | 478 (64.0%) | $123,906 |
| Renter-Occupied | 269 (36.0%) | $47,112 |
| Average | 747 (100.0%) | $82,434 |
Occupancy by Householder Income Bracket in East Washington borough
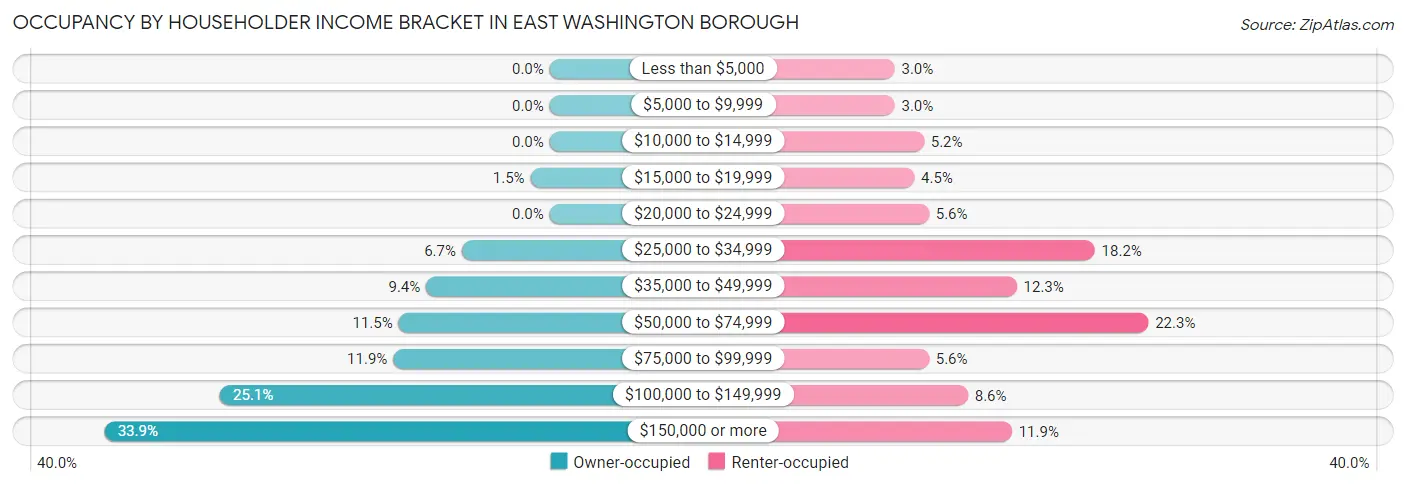
| Income Bracket | Owner-occupied | Renter-occupied |
| Less than $5,000 | 0 (0.0%) | 8 (3.0%) |
| $5,000 to $9,999 | 0 (0.0%) | 8 (3.0%) |
| $10,000 to $14,999 | 0 (0.0%) | 14 (5.2%) |
| $15,000 to $19,999 | 7 (1.5%) | 12 (4.5%) |
| $20,000 to $24,999 | 0 (0.0%) | 15 (5.6%) |
| $25,000 to $34,999 | 32 (6.7%) | 49 (18.2%) |
| $35,000 to $49,999 | 45 (9.4%) | 33 (12.3%) |
| $50,000 to $74,999 | 55 (11.5%) | 60 (22.3%) |
| $75,000 to $99,999 | 57 (11.9%) | 15 (5.6%) |
| $100,000 to $149,999 | 120 (25.1%) | 23 (8.6%) |
| $150,000 or more | 162 (33.9%) | 32 (11.9%) |
| Total | 478 (100.0%) | 269 (100.0%) |
Monthly Housing Cost Tiers in East Washington borough
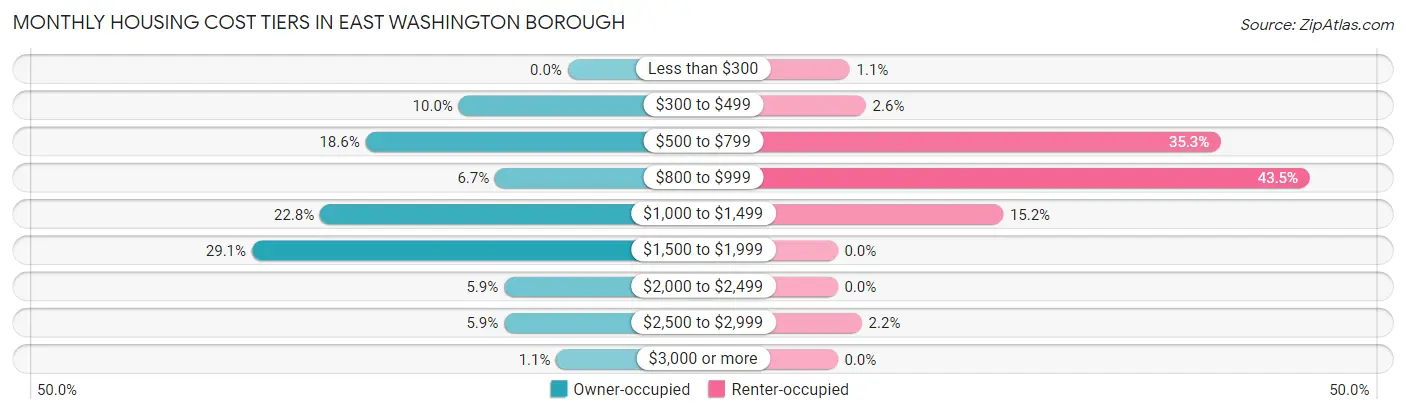
| Monthly Cost | Owner-occupied | Renter-occupied |
| Less than $300 | 0 (0.0%) | 3 (1.1%) |
| $300 to $499 | 48 (10.0%) | 7 (2.6%) |
| $500 to $799 | 89 (18.6%) | 95 (35.3%) |
| $800 to $999 | 32 (6.7%) | 117 (43.5%) |
| $1,000 to $1,499 | 109 (22.8%) | 41 (15.2%) |
| $1,500 to $1,999 | 139 (29.1%) | 0 (0.0%) |
| $2,000 to $2,499 | 28 (5.9%) | 0 (0.0%) |
| $2,500 to $2,999 | 28 (5.9%) | 6 (2.2%) |
| $3,000 or more | 5 (1.1%) | 0 (0.0%) |
| Total | 478 (100.0%) | 269 (100.0%) |
Physical Housing Characteristics in East Washington borough
Housing Structures in East Washington borough
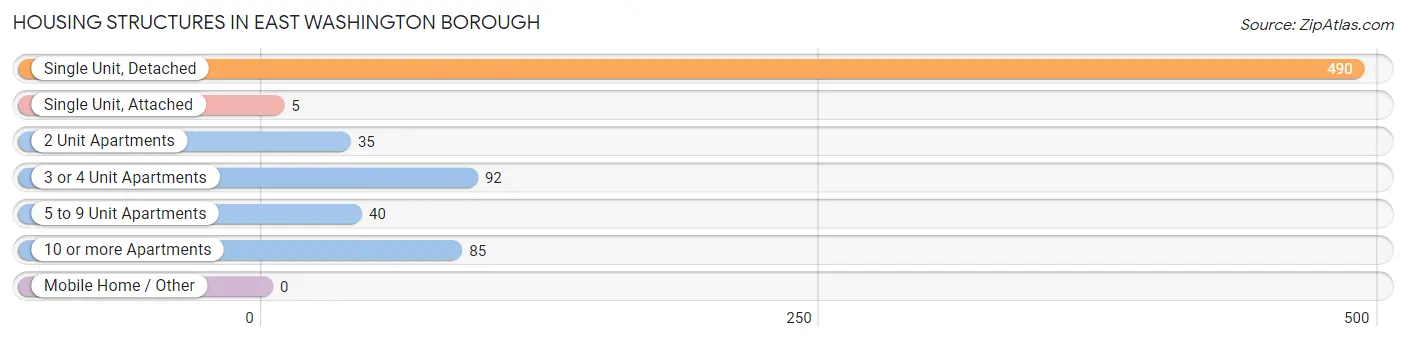
| Structure Type | # Housing Units | % Housing Units |
| Single Unit, Detached | 490 | 65.6% |
| Single Unit, Attached | 5 | 0.7% |
| 2 Unit Apartments | 35 | 4.7% |
| 3 or 4 Unit Apartments | 92 | 12.3% |
| 5 to 9 Unit Apartments | 40 | 5.3% |
| 10 or more Apartments | 85 | 11.4% |
| Mobile Home / Other | 0 | 0.0% |
| Total | 747 | 100.0% |
Housing Structures by Occupancy in East Washington borough
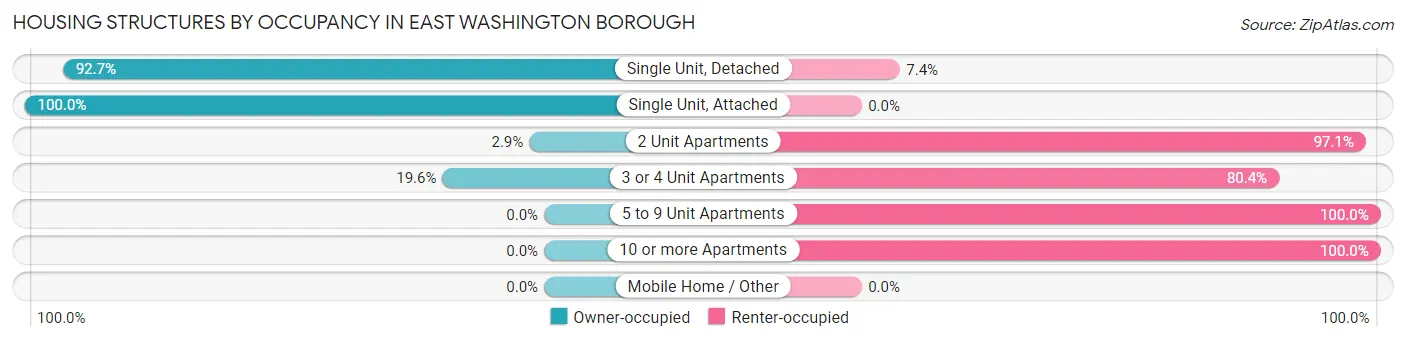
| Structure Type | Owner-occupied | Renter-occupied |
| Single Unit, Detached | 454 (92.6%) | 36 (7.3%) |
| Single Unit, Attached | 5 (100.0%) | 0 (0.0%) |
| 2 Unit Apartments | 1 (2.9%) | 34 (97.1%) |
| 3 or 4 Unit Apartments | 18 (19.6%) | 74 (80.4%) |
| 5 to 9 Unit Apartments | 0 (0.0%) | 40 (100.0%) |
| 10 or more Apartments | 0 (0.0%) | 85 (100.0%) |
| Mobile Home / Other | 0 (0.0%) | 0 (0.0%) |
| Total | 478 (64.0%) | 269 (36.0%) |
Housing Structures by Number of Rooms in East Washington borough
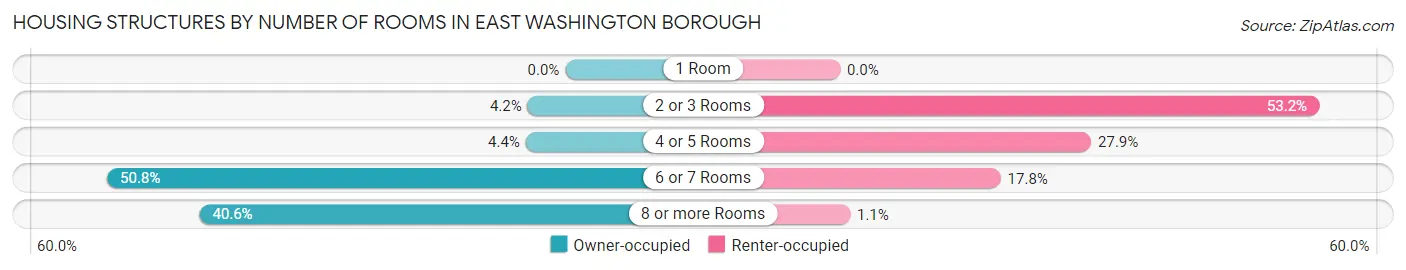
| Number of Rooms | Owner-occupied | Renter-occupied |
| 1 Room | 0 (0.0%) | 0 (0.0%) |
| 2 or 3 Rooms | 20 (4.2%) | 143 (53.2%) |
| 4 or 5 Rooms | 21 (4.4%) | 75 (27.9%) |
| 6 or 7 Rooms | 243 (50.8%) | 48 (17.8%) |
| 8 or more Rooms | 194 (40.6%) | 3 (1.1%) |
| Total | 478 (100.0%) | 269 (100.0%) |
Housing Structure by Heating Type in East Washington borough
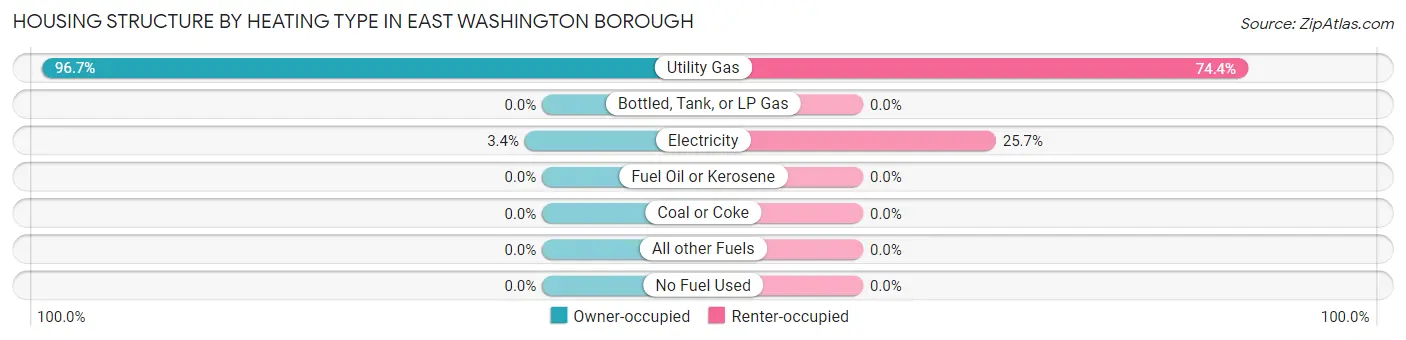
| Heating Type | Owner-occupied | Renter-occupied |
| Utility Gas | 462 (96.7%) | 200 (74.4%) |
| Bottled, Tank, or LP Gas | 0 (0.0%) | 0 (0.0%) |
| Electricity | 16 (3.4%) | 69 (25.7%) |
| Fuel Oil or Kerosene | 0 (0.0%) | 0 (0.0%) |
| Coal or Coke | 0 (0.0%) | 0 (0.0%) |
| All other Fuels | 0 (0.0%) | 0 (0.0%) |
| No Fuel Used | 0 (0.0%) | 0 (0.0%) |
| Total | 478 (100.0%) | 269 (100.0%) |
Household Vehicle Usage in East Washington borough
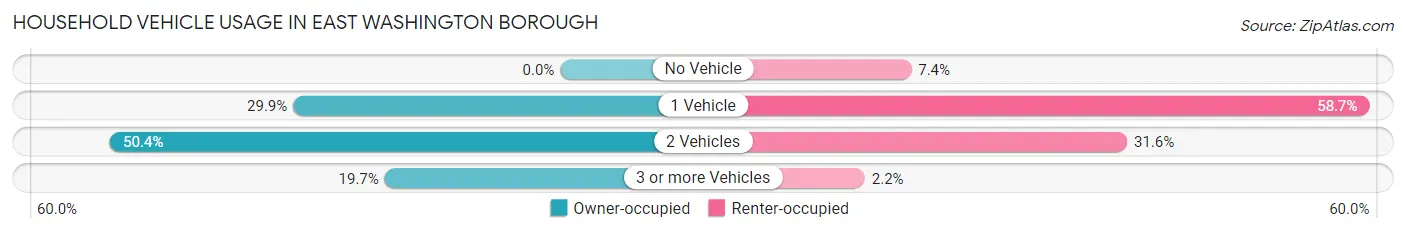
| Vehicles per Household | Owner-occupied | Renter-occupied |
| No Vehicle | 0 (0.0%) | 20 (7.4%) |
| 1 Vehicle | 143 (29.9%) | 158 (58.7%) |
| 2 Vehicles | 241 (50.4%) | 85 (31.6%) |
| 3 or more Vehicles | 94 (19.7%) | 6 (2.2%) |
| Total | 478 (100.0%) | 269 (100.0%) |
Real Estate & Mortgages in East Washington borough
Real Estate and Mortgage Overview in East Washington borough
| Characteristic | Without Mortgage | With Mortgage |
| Housing Units | 195 | 283 |
| Median Property Value | $262,500 | $233,600 |
| Median Household Income | $105,750 | $106 |
| Monthly Housing Costs | $727 | $5 |
| Real Estate Taxes | $2,765 | $0 |
Property Value by Mortgage Status in East Washington borough
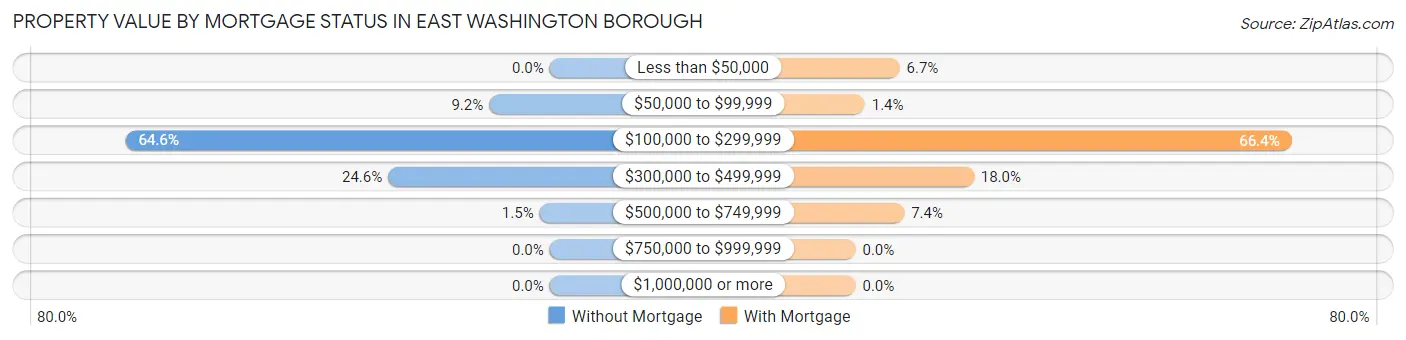
| Property Value | Without Mortgage | With Mortgage |
| Less than $50,000 | 0 (0.0%) | 19 (6.7%) |
| $50,000 to $99,999 | 18 (9.2%) | 4 (1.4%) |
| $100,000 to $299,999 | 126 (64.6%) | 188 (66.4%) |
| $300,000 to $499,999 | 48 (24.6%) | 51 (18.0%) |
| $500,000 to $749,999 | 3 (1.5%) | 21 (7.4%) |
| $750,000 to $999,999 | 0 (0.0%) | 0 (0.0%) |
| $1,000,000 or more | 0 (0.0%) | 0 (0.0%) |
| Total | 195 (100.0%) | 283 (100.0%) |
Household Income by Mortgage Status in East Washington borough
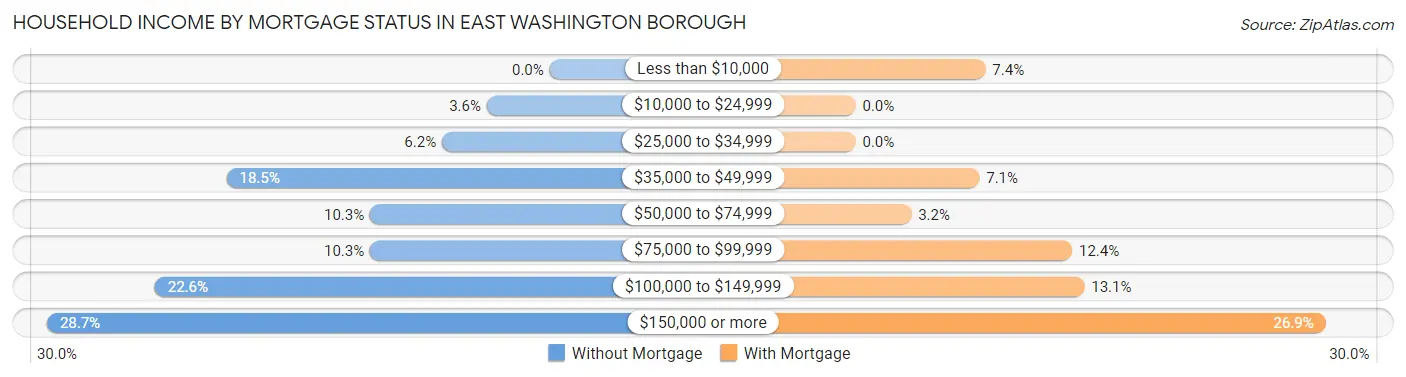
| Household Income | Without Mortgage | With Mortgage |
| Less than $10,000 | 0 (0.0%) | 21 (7.4%) |
| $10,000 to $24,999 | 7 (3.6%) | 0 (0.0%) |
| $25,000 to $34,999 | 12 (6.1%) | 0 (0.0%) |
| $35,000 to $49,999 | 36 (18.5%) | 20 (7.1%) |
| $50,000 to $74,999 | 20 (10.3%) | 9 (3.2%) |
| $75,000 to $99,999 | 20 (10.3%) | 35 (12.4%) |
| $100,000 to $149,999 | 44 (22.6%) | 37 (13.1%) |
| $150,000 or more | 56 (28.7%) | 76 (26.9%) |
| Total | 195 (100.0%) | 283 (100.0%) |
Property Value to Household Income Ratio in East Washington borough
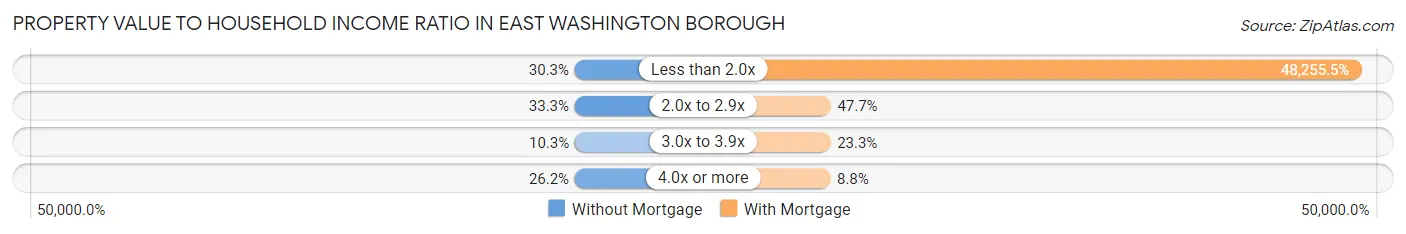
| Value-to-Income Ratio | Without Mortgage | With Mortgage |
| Less than 2.0x | 59 (30.3%) | 136,563 (48,255.5%) |
| 2.0x to 2.9x | 65 (33.3%) | 135 (47.7%) |
| 3.0x to 3.9x | 20 (10.3%) | 66 (23.3%) |
| 4.0x or more | 51 (26.2%) | 25 (8.8%) |
| Total | 195 (100.0%) | 283 (100.0%) |
Real Estate Taxes by Mortgage Status in East Washington borough
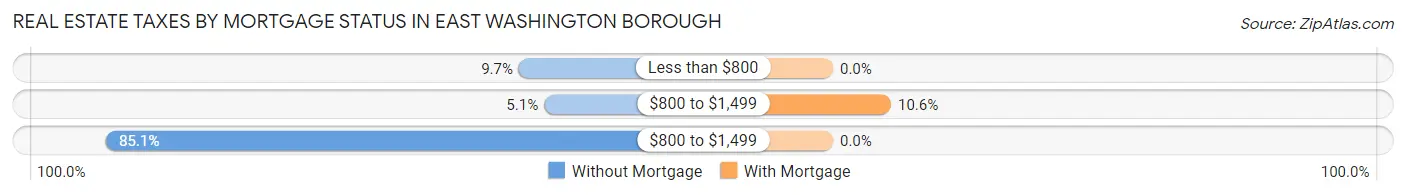
| Property Taxes | Without Mortgage | With Mortgage |
| Less than $800 | 19 (9.7%) | 0 (0.0%) |
| $800 to $1,499 | 10 (5.1%) | 30 (10.6%) |
| $800 to $1,499 | 166 (85.1%) | 0 (0.0%) |
| Total | 195 (100.0%) | 283 (100.0%) |
Health & Disability in East Washington borough
Health Insurance Coverage by Age in East Washington borough
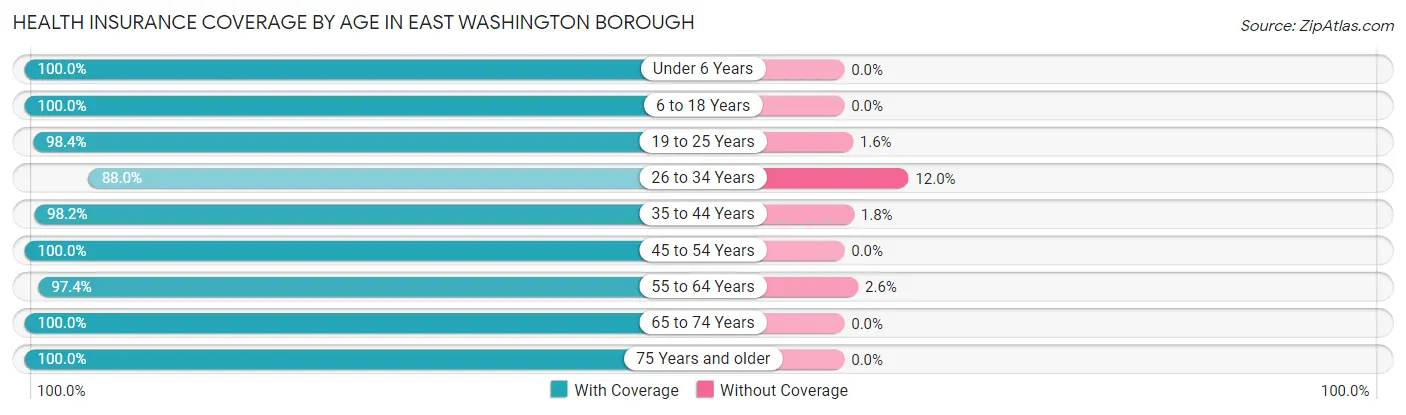
| Age Bracket | With Coverage | Without Coverage |
| Under 6 Years | 93 (100.0%) | 0 (0.0%) |
| 6 to 18 Years | 172 (100.0%) | 0 (0.0%) |
| 19 to 25 Years | 307 (98.4%) | 5 (1.6%) |
| 26 to 34 Years | 184 (88.0%) | 25 (12.0%) |
| 35 to 44 Years | 221 (98.2%) | 4 (1.8%) |
| 45 to 54 Years | 126 (100.0%) | 0 (0.0%) |
| 55 to 64 Years | 189 (97.4%) | 5 (2.6%) |
| 65 to 74 Years | 221 (100.0%) | 0 (0.0%) |
| 75 Years and older | 154 (100.0%) | 0 (0.0%) |
| Total | 1,667 (97.7%) | 39 (2.3%) |
Health Insurance Coverage by Citizenship Status in East Washington borough
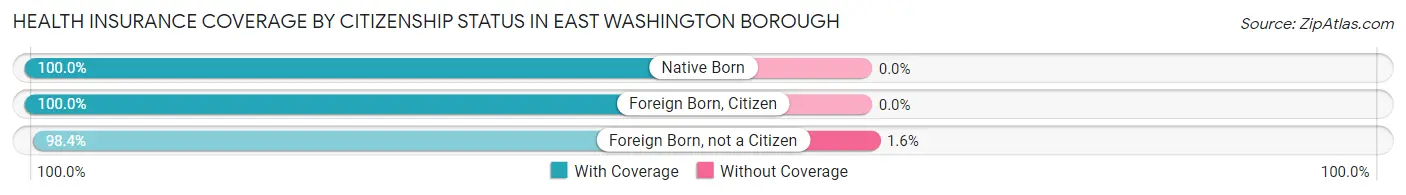
| Citizenship Status | With Coverage | Without Coverage |
| Native Born | 93 (100.0%) | 0 (0.0%) |
| Foreign Born, Citizen | 172 (100.0%) | 0 (0.0%) |
| Foreign Born, not a Citizen | 307 (98.4%) | 5 (1.6%) |
Health Insurance Coverage by Household Income in East Washington borough
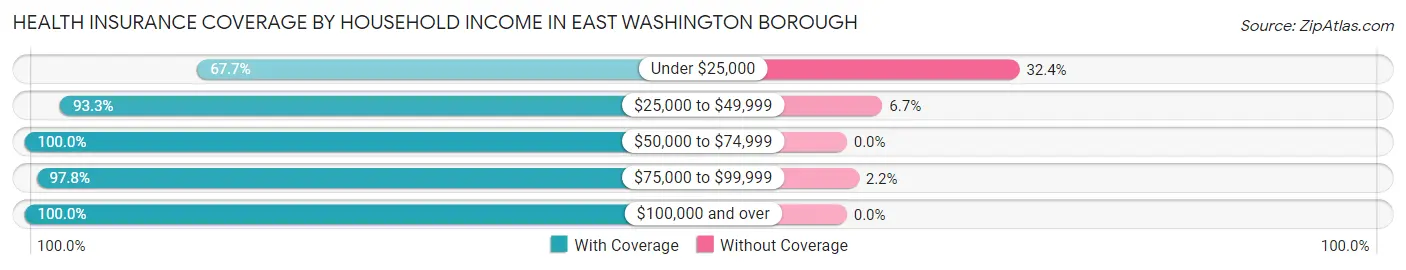
| Household Income | With Coverage | Without Coverage |
| Under $25,000 | 46 (67.6%) | 22 (32.4%) |
| $25,000 to $49,999 | 196 (93.3%) | 14 (6.7%) |
| $50,000 to $74,999 | 191 (100.0%) | 0 (0.0%) |
| $75,000 to $99,999 | 131 (97.8%) | 3 (2.2%) |
| $100,000 and over | 881 (100.0%) | 0 (0.0%) |
Public vs Private Health Insurance Coverage by Age in East Washington borough
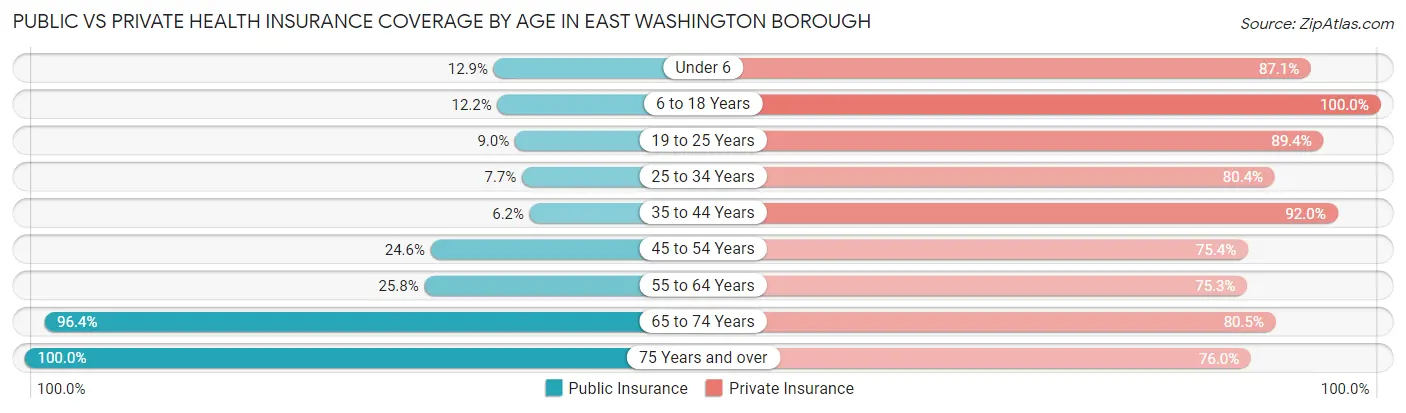
| Age Bracket | Public Insurance | Private Insurance |
| Under 6 | 12 (12.9%) | 81 (87.1%) |
| 6 to 18 Years | 21 (12.2%) | 172 (100.0%) |
| 19 to 25 Years | 28 (9.0%) | 279 (89.4%) |
| 25 to 34 Years | 16 (7.7%) | 168 (80.4%) |
| 35 to 44 Years | 14 (6.2%) | 207 (92.0%) |
| 45 to 54 Years | 31 (24.6%) | 95 (75.4%) |
| 55 to 64 Years | 50 (25.8%) | 146 (75.3%) |
| 65 to 74 Years | 213 (96.4%) | 178 (80.5%) |
| 75 Years and over | 154 (100.0%) | 117 (76.0%) |
| Total | 539 (31.6%) | 1,443 (84.6%) |
Disability Status by Sex by Age in East Washington borough
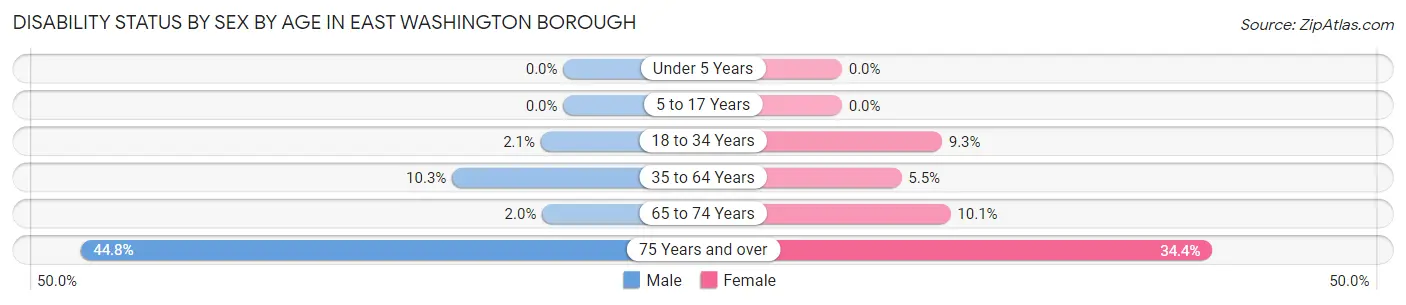
| Age Bracket | Male | Female |
| Under 5 Years | 0 (0.0%) | 0 (0.0%) |
| 5 to 17 Years | 0 (0.0%) | 0 (0.0%) |
| 18 to 34 Years | 5 (2.1%) | 32 (9.3%) |
| 35 to 64 Years | 32 (10.3%) | 13 (5.5%) |
| 65 to 74 Years | 2 (2.0%) | 12 (10.1%) |
| 75 Years and over | 26 (44.8%) | 33 (34.4%) |
Disability Class by Sex by Age in East Washington borough
Disability Class: Hearing Difficulty
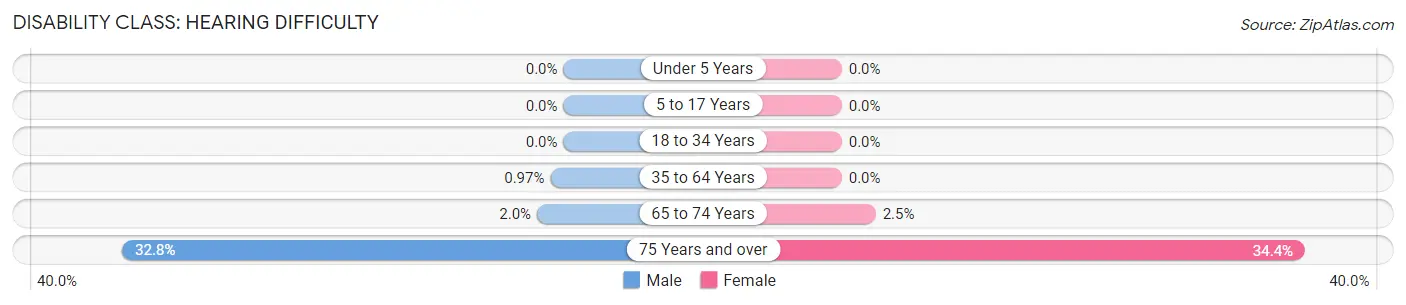
| Age Bracket | Male | Female |
| Under 5 Years | 0 (0.0%) | 0 (0.0%) |
| 5 to 17 Years | 0 (0.0%) | 0 (0.0%) |
| 18 to 34 Years | 0 (0.0%) | 0 (0.0%) |
| 35 to 64 Years | 3 (1.0%) | 0 (0.0%) |
| 65 to 74 Years | 2 (2.0%) | 3 (2.5%) |
| 75 Years and over | 19 (32.8%) | 33 (34.4%) |
Disability Class: Vision Difficulty
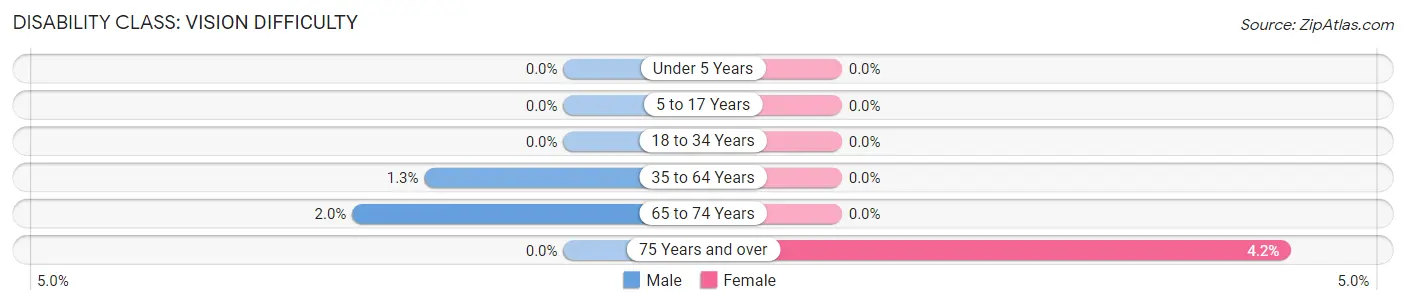
| Age Bracket | Male | Female |
| Under 5 Years | 0 (0.0%) | 0 (0.0%) |
| 5 to 17 Years | 0 (0.0%) | 0 (0.0%) |
| 18 to 34 Years | 0 (0.0%) | 0 (0.0%) |
| 35 to 64 Years | 4 (1.3%) | 0 (0.0%) |
| 65 to 74 Years | 2 (2.0%) | 0 (0.0%) |
| 75 Years and over | 0 (0.0%) | 4 (4.2%) |
Disability Class: Cognitive Difficulty
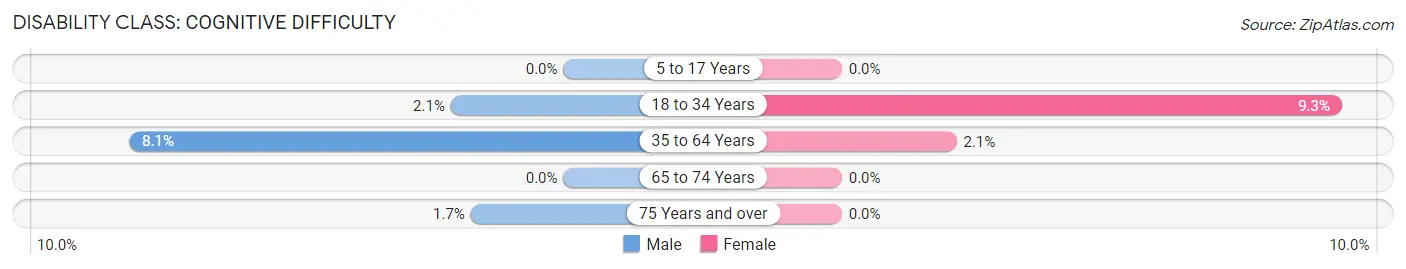
| Age Bracket | Male | Female |
| 5 to 17 Years | 0 (0.0%) | 0 (0.0%) |
| 18 to 34 Years | 5 (2.1%) | 32 (9.3%) |
| 35 to 64 Years | 25 (8.1%) | 5 (2.1%) |
| 65 to 74 Years | 0 (0.0%) | 0 (0.0%) |
| 75 Years and over | 1 (1.7%) | 0 (0.0%) |
Disability Class: Ambulatory Difficulty
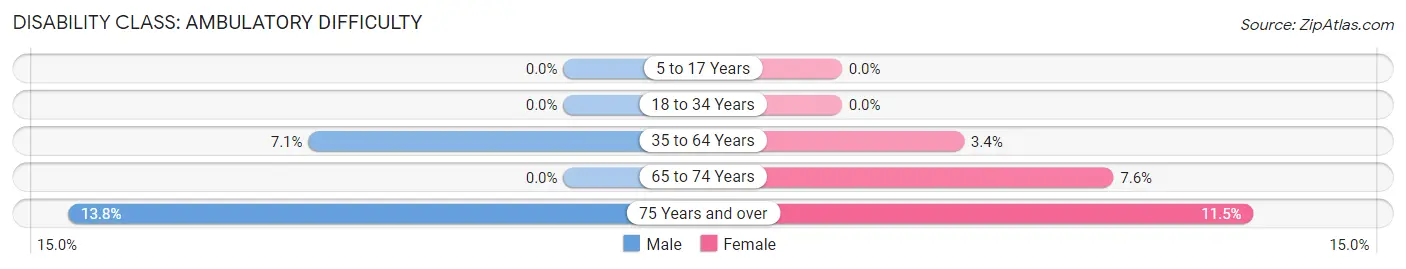
| Age Bracket | Male | Female |
| 5 to 17 Years | 0 (0.0%) | 0 (0.0%) |
| 18 to 34 Years | 0 (0.0%) | 0 (0.0%) |
| 35 to 64 Years | 22 (7.1%) | 8 (3.4%) |
| 65 to 74 Years | 0 (0.0%) | 9 (7.6%) |
| 75 Years and over | 8 (13.8%) | 11 (11.5%) |
Disability Class: Self-Care Difficulty
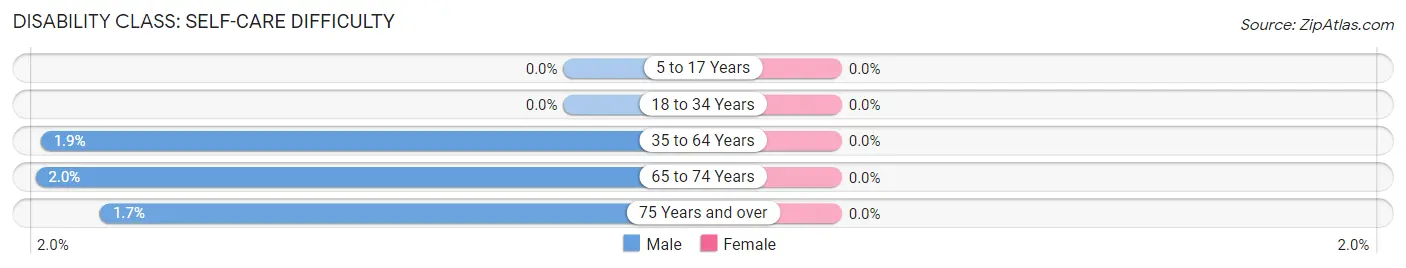
| Age Bracket | Male | Female |
| 5 to 17 Years | 0 (0.0%) | 0 (0.0%) |
| 18 to 34 Years | 0 (0.0%) | 0 (0.0%) |
| 35 to 64 Years | 6 (1.9%) | 0 (0.0%) |
| 65 to 74 Years | 2 (2.0%) | 0 (0.0%) |
| 75 Years and over | 1 (1.7%) | 0 (0.0%) |
Technology Access in East Washington borough
Computing Device Access in East Washington borough
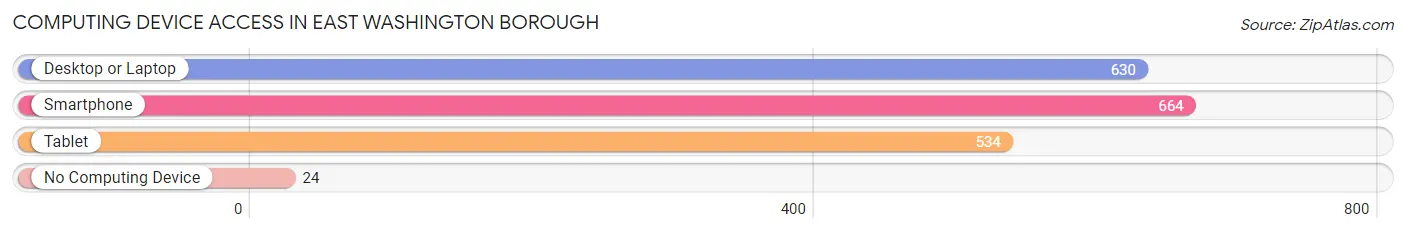
| Device Type | # Households | % Households |
| Desktop or Laptop | 630 | 84.3% |
| Smartphone | 664 | 88.9% |
| Tablet | 534 | 71.5% |
| No Computing Device | 24 | 3.2% |
| Total | 747 | 100.0% |
Internet Access in East Washington borough
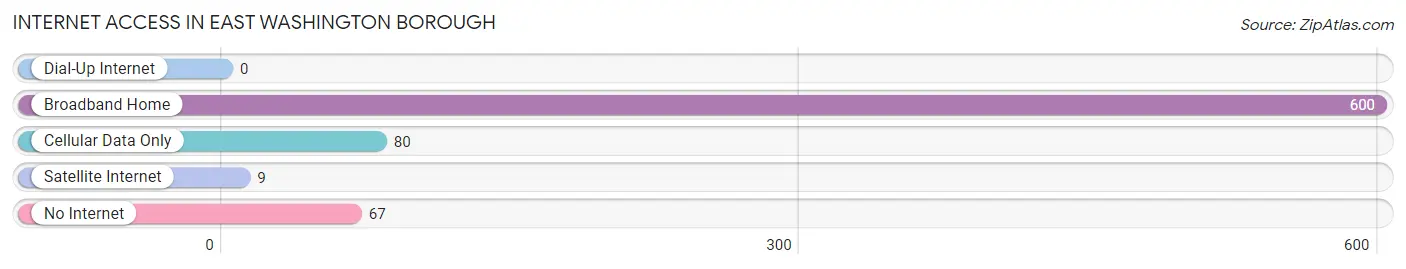
| Internet Type | # Households | % Households |
| Dial-Up Internet | 0 | 0.0% |
| Broadband Home | 600 | 80.3% |
| Cellular Data Only | 80 | 10.7% |
| Satellite Internet | 9 | 1.2% |
| No Internet | 67 | 9.0% |
| Total | 747 | 100.0% |
East Washington borough Summary
East Washington Borough is a small borough located in Washington County, Pennsylvania. It is situated in the southwestern corner of the county, approximately 20 miles south of Pittsburgh. The borough is bordered by the townships of North Franklin, South Franklin, and East Finley. As of the 2010 census, the population of East Washington Borough was 1,717.
History
East Washington Borough was founded in 1832 by a group of settlers from the nearby town of Washington. The settlers were looking for a place to build a new community and chose the area that is now East Washington Borough. The town was originally known as East Washington, but was later changed to East Washington Borough in 1875.
The town was originally a farming community, but in the late 19th century, the town began to industrialize. The first industry to come to the town was a glass factory, which opened in 1883. This was followed by a brickyard, a coal mine, and a steel mill. These industries helped to bring prosperity to the town and allowed it to grow and develop.
Geography
East Washington Borough is located in the southwestern corner of Washington County, Pennsylvania. It is situated in the Monongahela Valley, which is part of the Appalachian Plateau. The borough is bordered by the townships of North Franklin, South Franklin, and East Finley.
The borough is located on the banks of the Monongahela River, which is a major tributary of the Ohio River. The borough is also located near the Pennsylvania Turnpike, which runs through the borough.
The borough has a total area of 1.2 square miles, all of which is land. The borough is located at an elevation of 890 feet above sea level.
Economy
East Washington Borough has a diverse economy. The town is home to a variety of businesses, including manufacturing, retail, and service industries. The town is also home to a number of small businesses, such as restaurants, shops, and other services.
The town is also home to a number of industrial parks, which are home to a variety of businesses, including manufacturing, warehousing, and distribution. The town is also home to a number of corporate offices, including those of the East Washington Borough Chamber of Commerce.
Demographics
As of the 2010 census, the population of East Washington Borough was 1,717. The population is made up of a variety of ethnic and racial backgrounds, including White (87.2%), African American (7.2%), Hispanic (2.2%), and Asian (1.3%).
The median household income in East Washington Borough is $41,944, and the median family income is $50,944. The per capita income in the borough is $20,944. The poverty rate in the borough is 11.3%.
Conclusion
East Washington Borough is a small borough located in Washington County, Pennsylvania. It is situated in the southwestern corner of the county, approximately 20 miles south of Pittsburgh. The borough was founded in 1832 by a group of settlers from the nearby town of Washington. The town was originally a farming community, but in the late 19th century, the town began to industrialize. The borough has a total area of 1.2 square miles, all of which is land. The borough is home to a variety of businesses, including manufacturing, retail, and service industries. As of the 2010 census, the population of East Washington Borough was 1,717. The population is made up of a variety of ethnic and racial backgrounds, and the median household income in East Washington Borough is $41,944.
Common Questions
What is Per Capita Income in East Washington borough?
Per Capita income in East Washington borough is $46,962.
What is the Median Family Income in East Washington borough?
Median Family Income in East Washington borough is $135,563.
What is the Median Household income in East Washington borough?
Median Household Income in East Washington borough is $82,434.
What is Income or Wage Gap in East Washington borough?
Income or Wage Gap in East Washington borough is 22.7%.
Women in East Washington borough earn 77.3 cents for every dollar earned by a man.
What is Inequality or Gini Index in East Washington borough?
Inequality or Gini Index in East Washington borough is 0.39.
What is the Total Population of East Washington borough?
Total Population of East Washington borough is 1,706.
What is the Total Male Population of East Washington borough?
Total Male Population of East Washington borough is 792.
What is the Total Female Population of East Washington borough?
Total Female Population of East Washington borough is 914.
What is the Ratio of Males per 100 Females in East Washington borough?
There are 86.65 Males per 100 Females in East Washington borough.
What is the Ratio of Females per 100 Males in East Washington borough?
There are 115.40 Females per 100 Males in East Washington borough.
What is the Median Population Age in East Washington borough?
Median Population Age in East Washington borough is 37.5 Years.
What is the Average Family Size in East Washington borough
Average Family Size in East Washington borough is 2.9 People.
What is the Average Household Size in East Washington borough
Average Household Size in East Washington borough is 2.0 People.
How Large is the Labor Force in East Washington borough?
There are 1,032 People in the Labor Forcein in East Washington borough.
What is the Percentage of People in the Labor Force in East Washington borough?
68.1% of People are in the Labor Force in East Washington borough.
What is the Unemployment Rate in East Washington borough?
Unemployment Rate in East Washington borough is 1.5%.