Wyomissing borough, PA Map & Demographics
Wyomissing borough Overview
$65,321
PER CAPITA INCOME
$149,123
AVG FAMILY INCOME
$86,786
AVG HOUSEHOLD INCOME
34.9%
WAGE / INCOME GAP [ % ]
65.1¢/ $1
WAGE / INCOME GAP [ $ ]
0.50
INEQUALITY / GINI INDEX
11,067
TOTAL POPULATION
5,425
MALE POPULATION
5,642
FEMALE POPULATION
96.15
MALES / 100 FEMALES
104.00
FEMALES / 100 MALES
49.7
MEDIAN AGE
2.9
AVG FAMILY SIZE
2.2
AVG HOUSEHOLD SIZE
5,699
LABOR FORCE [ PEOPLE ]
60.3%
PERCENT IN LABOR FORCE
3.6%
UNEMPLOYMENT RATE
Income in Wyomissing borough
Income Overview in Wyomissing borough
Per Capita Income in Wyomissing borough is $65,321, while median incomes of families and households are $149,123 and $86,786 respectively.
| Characteristic | Number | Measure |
| Per Capita Income | 11,067 | $65,321 |
| Median Family Income | 2,840 | $149,123 |
| Mean Family Income | 2,840 | $195,888 |
| Median Household Income | 4,930 | $86,786 |
| Mean Household Income | 4,930 | $145,191 |
| Income Deficit | 2,840 | $0 |
| Wage / Income Gap (%) | 11,067 | 34.94% |
| Wage / Income Gap ($) | 11,067 | 65.06¢ per $1 |
| Gini / Inequality Index | 11,067 | 0.50 |
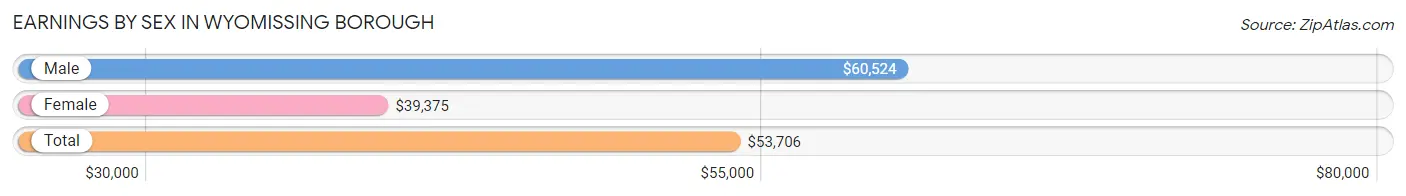
Earnings by Sex in Wyomissing borough
Average Earnings in Wyomissing borough are $53,706, $60,524 for men and $39,375 for women, a difference of 34.9%.
| Sex | Number | Average Earnings |
| Male | 3,441 (57.5%) | $60,524 |
| Female | 2,542 (42.5%) | $39,375 |
| Total | 5,983 (100.0%) | $53,706 |
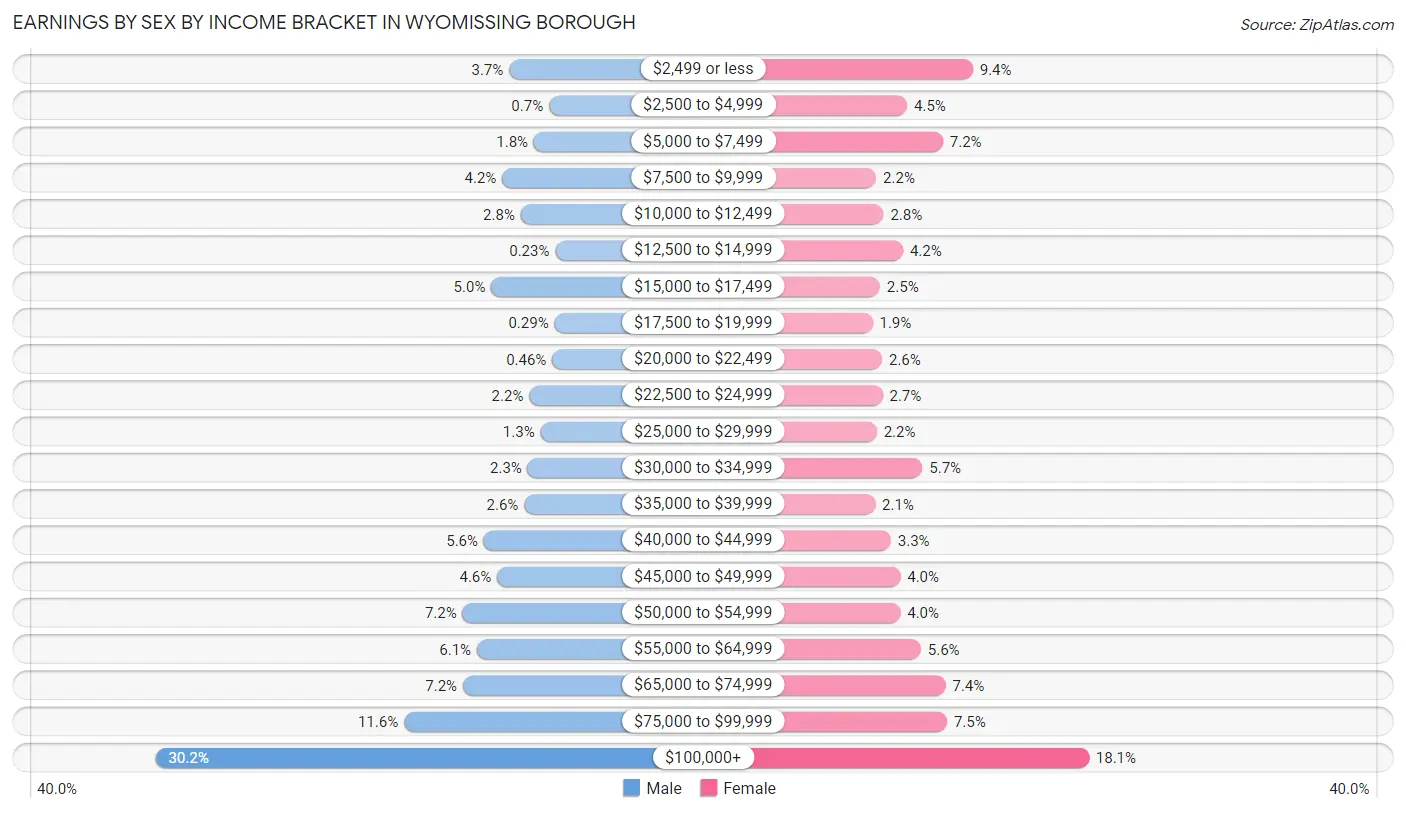
Earnings by Sex by Income Bracket in Wyomissing borough
The most common earnings brackets in Wyomissing borough are $100,000+ for men (1,039 | 30.2%) and $100,000+ for women (461 | 18.1%).
| Income | Male | Female |
| $2,499 or less | 127 (3.7%) | 240 (9.4%) |
| $2,500 to $4,999 | 24 (0.7%) | 115 (4.5%) |
| $5,000 to $7,499 | 63 (1.8%) | 183 (7.2%) |
| $7,500 to $9,999 | 145 (4.2%) | 56 (2.2%) |
| $10,000 to $12,499 | 97 (2.8%) | 70 (2.8%) |
| $12,500 to $14,999 | 8 (0.2%) | 107 (4.2%) |
| $15,000 to $17,499 | 173 (5.0%) | 63 (2.5%) |
| $17,500 to $19,999 | 10 (0.3%) | 49 (1.9%) |
| $20,000 to $22,499 | 16 (0.5%) | 67 (2.6%) |
| $22,500 to $24,999 | 75 (2.2%) | 68 (2.7%) |
| $25,000 to $29,999 | 46 (1.3%) | 57 (2.2%) |
| $30,000 to $34,999 | 79 (2.3%) | 144 (5.7%) |
| $35,000 to $39,999 | 88 (2.6%) | 54 (2.1%) |
| $40,000 to $44,999 | 192 (5.6%) | 84 (3.3%) |
| $45,000 to $49,999 | 158 (4.6%) | 102 (4.0%) |
| $50,000 to $54,999 | 247 (7.2%) | 102 (4.0%) |
| $55,000 to $64,999 | 210 (6.1%) | 141 (5.6%) |
| $65,000 to $74,999 | 246 (7.1%) | 188 (7.4%) |
| $75,000 to $99,999 | 398 (11.6%) | 191 (7.5%) |
| $100,000+ | 1,039 (30.2%) | 461 (18.1%) |
| Total | 3,441 (100.0%) | 2,542 (100.0%) |
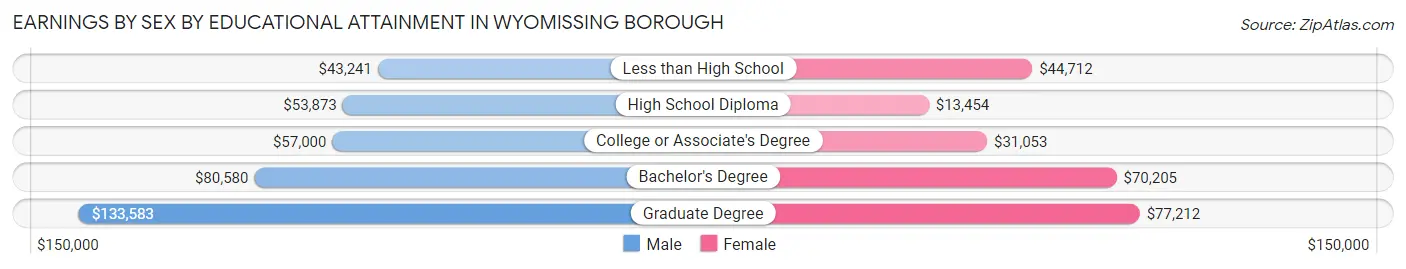
Earnings by Sex by Educational Attainment in Wyomissing borough
Average earnings in Wyomissing borough are $69,583 for men and $48,257 for women, a difference of 30.6%. Men with an educational attainment of graduate degree enjoy the highest average annual earnings of $133,583, while those with less than high school education earn the least with $43,241. Women with an educational attainment of graduate degree earn the most with the average annual earnings of $77,212, while those with high school diploma education have the smallest earnings of $13,454.
| Educational Attainment | Male Income | Female Income |
| Less than High School | $43,241 | $44,712 |
| High School Diploma | $53,873 | $13,454 |
| College or Associate's Degree | $57,000 | $31,053 |
| Bachelor's Degree | $80,580 | $70,205 |
| Graduate Degree | $133,583 | $77,212 |
| Total | $69,583 | $48,257 |
Family Income in Wyomissing borough
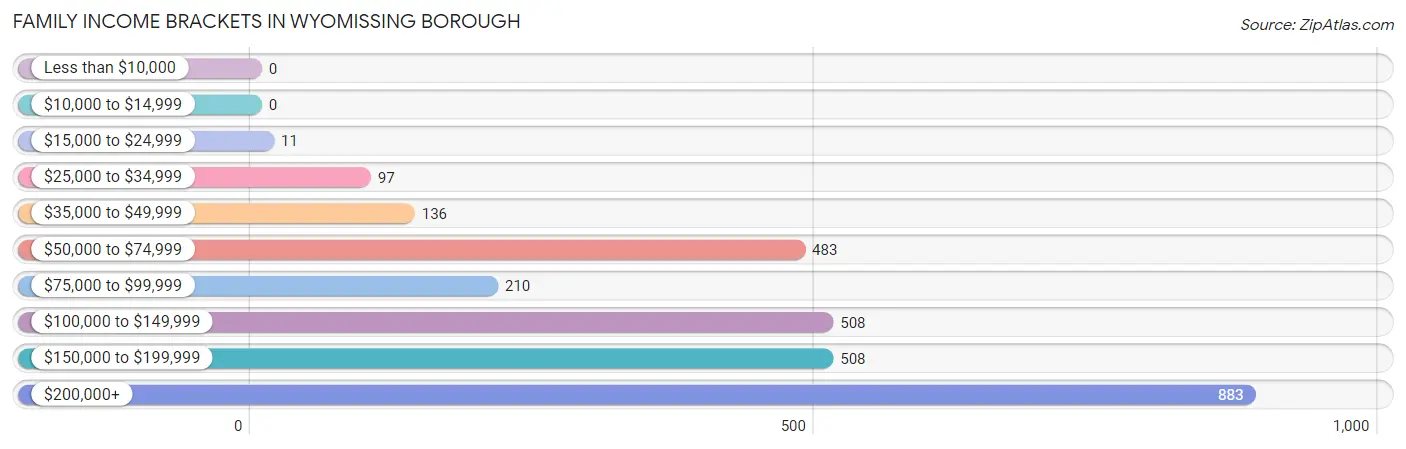
Family Income Brackets in Wyomissing borough
According to the Wyomissing borough family income data, there are 883 families falling into the $200,000+ income range, which is the most common income bracket and makes up 31.1% of all families.
| Income Bracket | # Families | % Families |
| Less than $10,000 | 0 | 0.0% |
| $10,000 to $14,999 | 0 | 0.0% |
| $15,000 to $24,999 | 11 | 0.4% |
| $25,000 to $34,999 | 97 | 3.4% |
| $35,000 to $49,999 | 136 | 4.8% |
| $50,000 to $74,999 | 483 | 17.0% |
| $75,000 to $99,999 | 210 | 7.4% |
| $100,000 to $149,999 | 508 | 17.9% |
| $150,000 to $199,999 | 508 | 17.9% |
| $200,000+ | 883 | 31.1% |
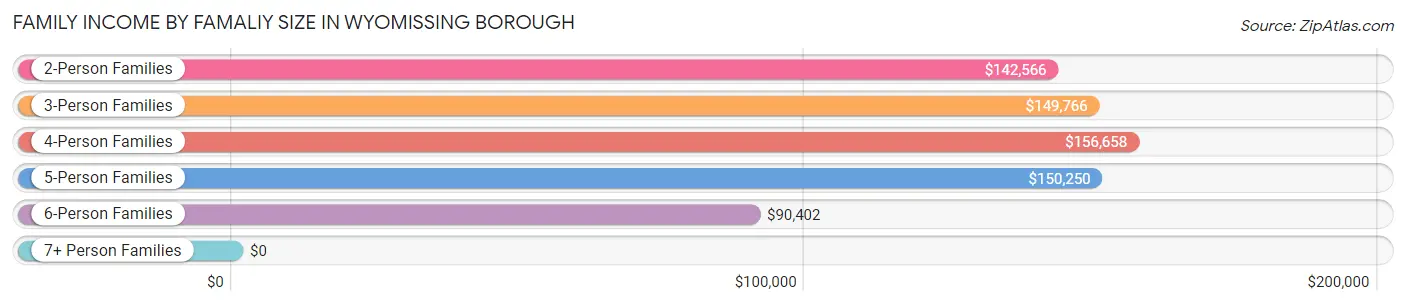
Family Income by Famaliy Size in Wyomissing borough
4-person families (483 | 17.0%) account for the highest median family income in Wyomissing borough with $156,658 per family, while 2-person families (1,625 | 57.2%) have the highest median income of $71,283 per family member.
| Income Bracket | # Families | Median Income |
| 2-Person Families | 1,625 (57.2%) | $142,566 |
| 3-Person Families | 483 (17.0%) | $149,766 |
| 4-Person Families | 483 (17.0%) | $156,658 |
| 5-Person Families | 152 (5.3%) | $150,250 |
| 6-Person Families | 97 (3.4%) | $90,402 |
| 7+ Person Families | 0 (0.0%) | $0 |
| Total | 2,840 (100.0%) | $149,123 |
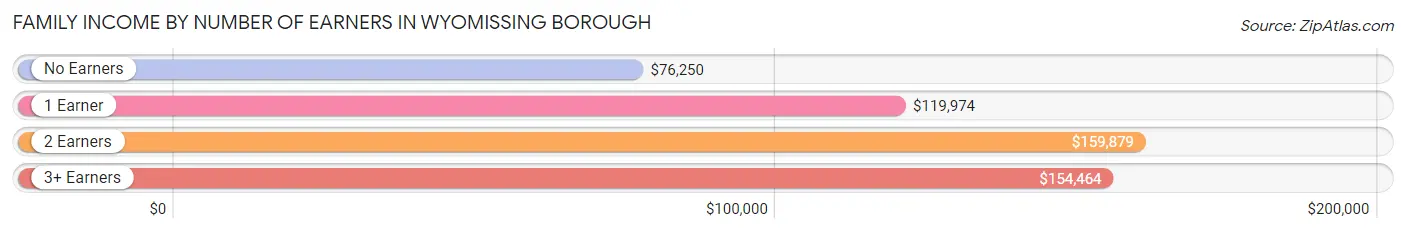
Family Income by Number of Earners in Wyomissing borough
The median family income in Wyomissing borough is $149,123, with families comprising 2 earners (1,196) having the highest median family income of $159,879, while families with no earners (536) have the lowest median family income of $76,250, accounting for 42.1% and 18.9% of families, respectively.
| Number of Earners | # Families | Median Income |
| No Earners | 536 (18.9%) | $76,250 |
| 1 Earner | 751 (26.4%) | $119,974 |
| 2 Earners | 1,196 (42.1%) | $159,879 |
| 3+ Earners | 357 (12.6%) | $154,464 |
| Total | 2,840 (100.0%) | $149,123 |
Household Income in Wyomissing borough
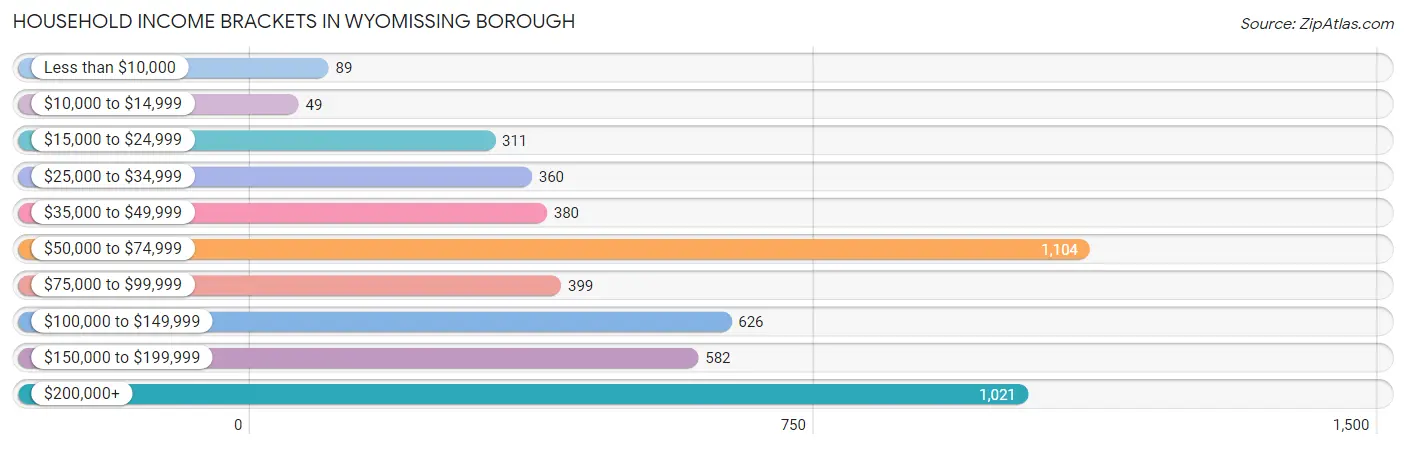
Household Income Brackets in Wyomissing borough
With 1,104 households falling in the category, the $50,000 to $74,999 income range is the most frequent in Wyomissing borough, accounting for 22.4% of all households. In contrast, only 49 households (1.0%) fall into the $10,000 to $14,999 income bracket, making it the least populous group.
| Income Bracket | # Households | % Households |
| Less than $10,000 | 89 | 1.8% |
| $10,000 to $14,999 | 49 | 1.0% |
| $15,000 to $24,999 | 311 | 6.3% |
| $25,000 to $34,999 | 360 | 7.3% |
| $35,000 to $49,999 | 380 | 7.7% |
| $50,000 to $74,999 | 1,104 | 22.4% |
| $75,000 to $99,999 | 399 | 8.1% |
| $100,000 to $149,999 | 626 | 12.7% |
| $150,000 to $199,999 | 582 | 11.8% |
| $200,000+ | 1,021 | 20.7% |
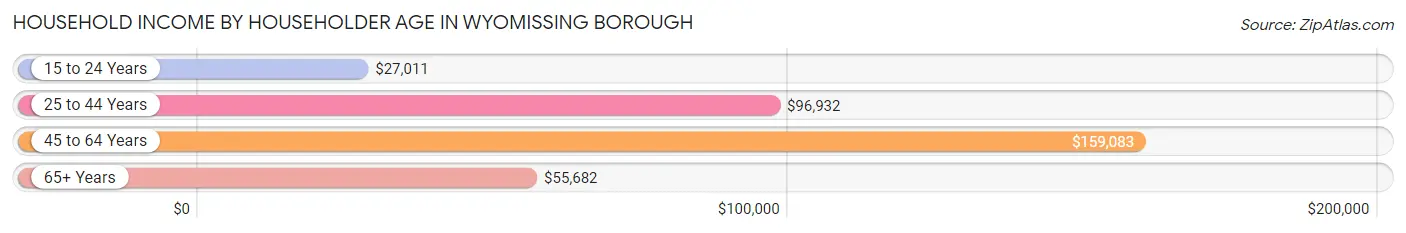
Household Income by Householder Age in Wyomissing borough
The median household income in Wyomissing borough is $86,786, with the highest median household income of $159,083 found in the 45 to 64 years age bracket for the primary householder. A total of 1,571 households (31.9%) fall into this category. Meanwhile, the 15 to 24 years age bracket for the primary householder has the lowest median household income of $27,011, with 101 households (2.1%) in this group.
| Income Bracket | # Households | Median Income |
| 15 to 24 Years | 101 (2.1%) | $27,011 |
| 25 to 44 Years | 1,168 (23.7%) | $96,932 |
| 45 to 64 Years | 1,571 (31.9%) | $159,083 |
| 65+ Years | 2,090 (42.4%) | $55,682 |
| Total | 4,930 (100.0%) | $86,786 |
Poverty in Wyomissing borough
Income Below Poverty by Sex and Age in Wyomissing borough
With 1.7% poverty level for males and 7.5% for females among the residents of Wyomissing borough, 25 to 34 year old males and under 5 year old females are the most vulnerable to poverty, with 48 males (5.9%) and 75 females (42.9%) in their respective age groups living below the poverty level.
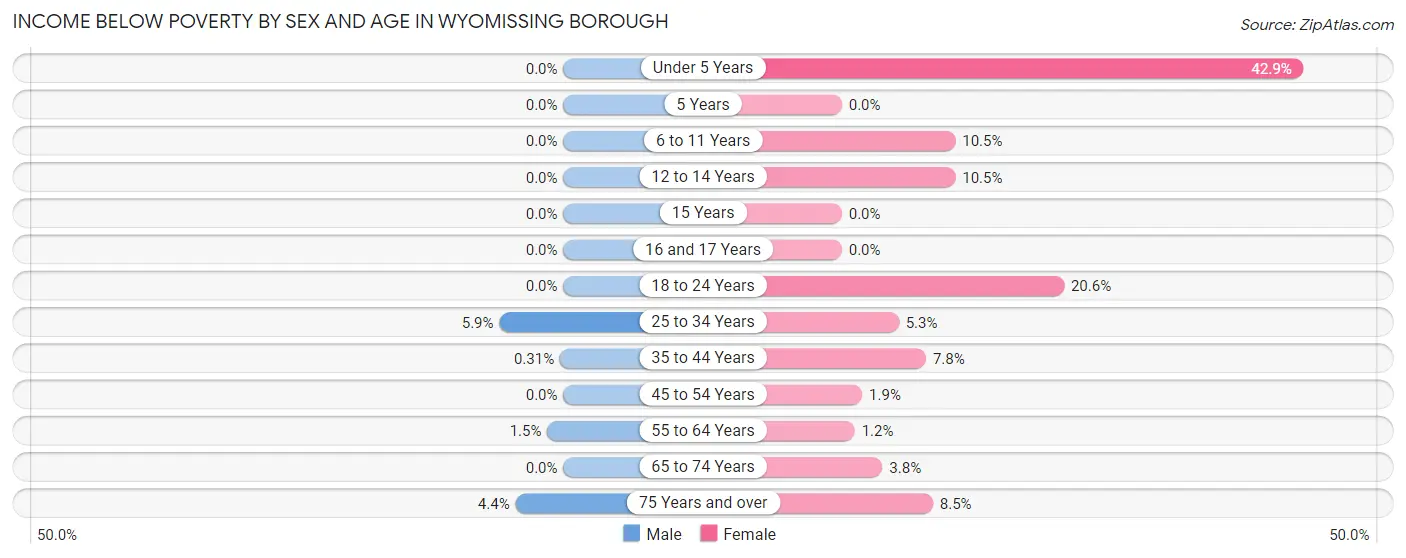
| Age Bracket | Male | Female |
| Under 5 Years | 0 (0.0%) | 75 (42.9%) |
| 5 Years | 0 (0.0%) | 0 (0.0%) |
| 6 to 11 Years | 0 (0.0%) | 40 (10.5%) |
| 12 to 14 Years | 0 (0.0%) | 26 (10.5%) |
| 15 Years | 0 (0.0%) | 0 (0.0%) |
| 16 and 17 Years | 0 (0.0%) | 0 (0.0%) |
| 18 to 24 Years | 0 (0.0%) | 67 (20.6%) |
| 25 to 34 Years | 48 (5.9%) | 30 (5.3%) |
| 35 to 44 Years | 2 (0.3%) | 36 (7.8%) |
| 45 to 54 Years | 0 (0.0%) | 12 (1.9%) |
| 55 to 64 Years | 13 (1.5%) | 9 (1.2%) |
| 65 to 74 Years | 0 (0.0%) | 25 (3.8%) |
| 75 Years and over | 30 (4.4%) | 99 (8.5%) |
| Total | 93 (1.7%) | 419 (7.5%) |
Income Above Poverty by Sex and Age in Wyomissing borough
According to the poverty statistics in Wyomissing borough, males aged under 5 years and females aged 5 years are the age groups that are most secure financially, with 100.0% of males and 100.0% of females in these age groups living above the poverty line.
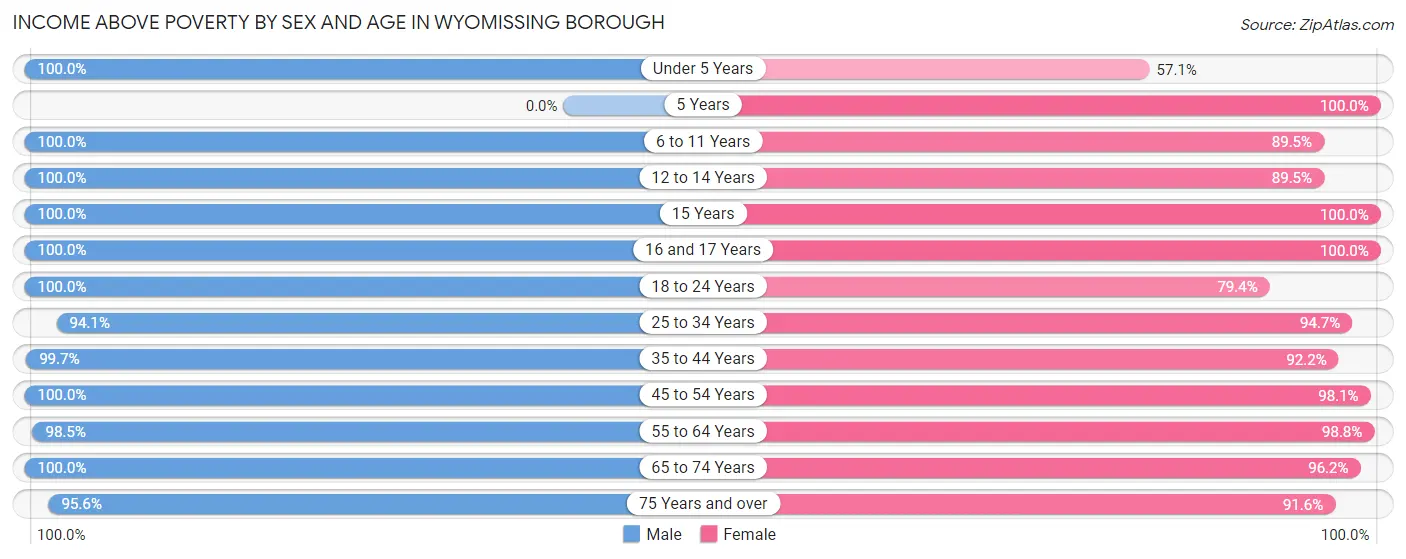
| Age Bracket | Male | Female |
| Under 5 Years | 208 (100.0%) | 100 (57.1%) |
| 5 Years | 0 (0.0%) | 12 (100.0%) |
| 6 to 11 Years | 303 (100.0%) | 340 (89.5%) |
| 12 to 14 Years | 165 (100.0%) | 221 (89.5%) |
| 15 Years | 50 (100.0%) | 55 (100.0%) |
| 16 and 17 Years | 69 (100.0%) | 117 (100.0%) |
| 18 to 24 Years | 303 (100.0%) | 258 (79.4%) |
| 25 to 34 Years | 760 (94.1%) | 538 (94.7%) |
| 35 to 44 Years | 636 (99.7%) | 425 (92.2%) |
| 45 to 54 Years | 626 (100.0%) | 623 (98.1%) |
| 55 to 64 Years | 859 (98.5%) | 741 (98.8%) |
| 65 to 74 Years | 625 (100.0%) | 639 (96.2%) |
| 75 Years and over | 646 (95.6%) | 1,072 (91.5%) |
| Total | 5,250 (98.3%) | 5,141 (92.5%) |
Income Below Poverty Among Married-Couple Families in Wyomissing borough
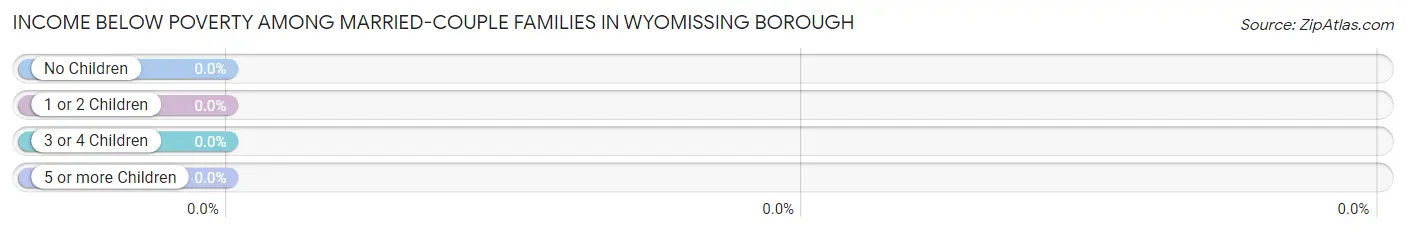
| Children | Above Poverty | Below Poverty |
| No Children | 1,859 (100.0%) | 0 (0.0%) |
| 1 or 2 Children | 490 (100.0%) | 0 (0.0%) |
| 3 or 4 Children | 167 (100.0%) | 0 (0.0%) |
| 5 or more Children | 0 (0.0%) | 0 (0.0%) |
| Total | 2,516 (100.0%) | 0 (0.0%) |
Income Below Poverty Among Single-Parent Households in Wyomissing borough
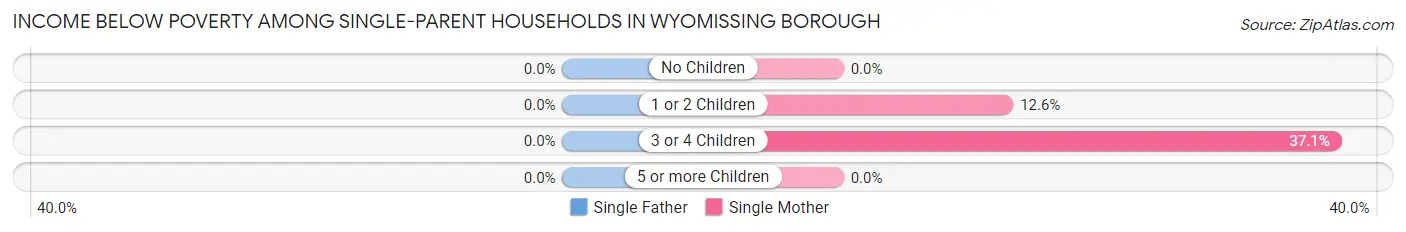
| Children | Single Father | Single Mother |
| No Children | 0 (0.0%) | 0 (0.0%) |
| 1 or 2 Children | 0 (0.0%) | 12 (12.6%) |
| 3 or 4 Children | 0 (0.0%) | 23 (37.1%) |
| 5 or more Children | 0 (0.0%) | 0 (0.0%) |
| Total | 0 (0.0%) | 35 (14.7%) |
Income Below Poverty Among Married-Couple vs Single-Parent Households in Wyomissing borough
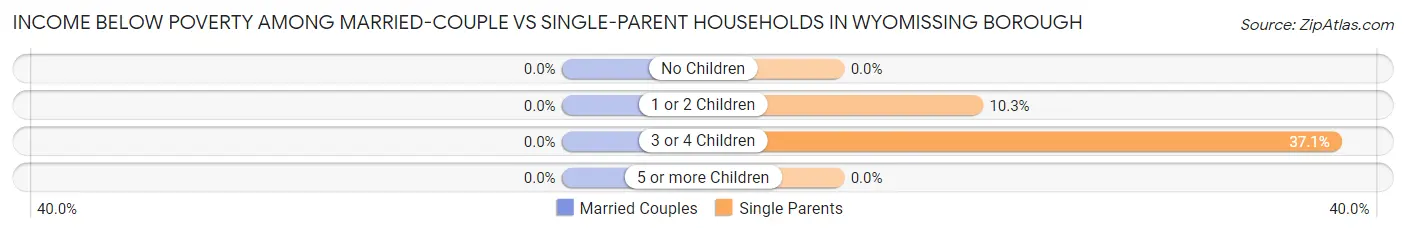
| Children | Married-Couple Families | Single-Parent Households |
| No Children | 0 (0.0%) | 0 (0.0%) |
| 1 or 2 Children | 0 (0.0%) | 12 (10.3%) |
| 3 or 4 Children | 0 (0.0%) | 23 (37.1%) |
| 5 or more Children | 0 (0.0%) | 0 (0.0%) |
| Total | 0 (0.0%) | 35 (10.8%) |
Race in Wyomissing borough
The most populous races in Wyomissing borough are White / Caucasian (9,577 | 86.5%), Hispanic or Latino (1,184 | 10.7%), and Two or more Races (536 | 4.8%).
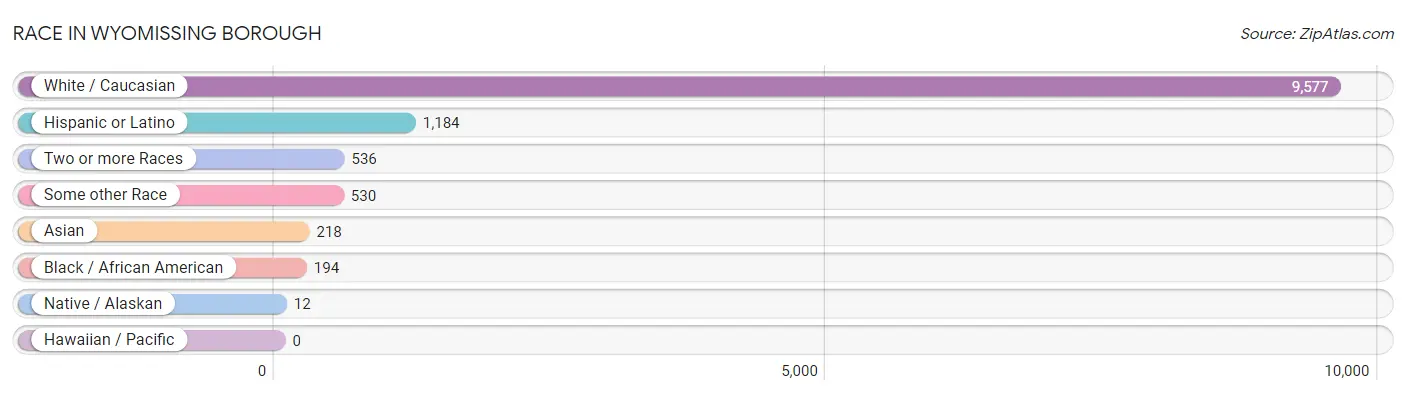
| Race | # Population | % Population |
| Asian | 218 | 2.0% |
| Black / African American | 194 | 1.8% |
| Hawaiian / Pacific | 0 | 0.0% |
| Hispanic or Latino | 1,184 | 10.7% |
| Native / Alaskan | 12 | 0.1% |
| White / Caucasian | 9,577 | 86.5% |
| Two or more Races | 536 | 4.8% |
| Some other Race | 530 | 4.8% |
| Total | 11,067 | 100.0% |
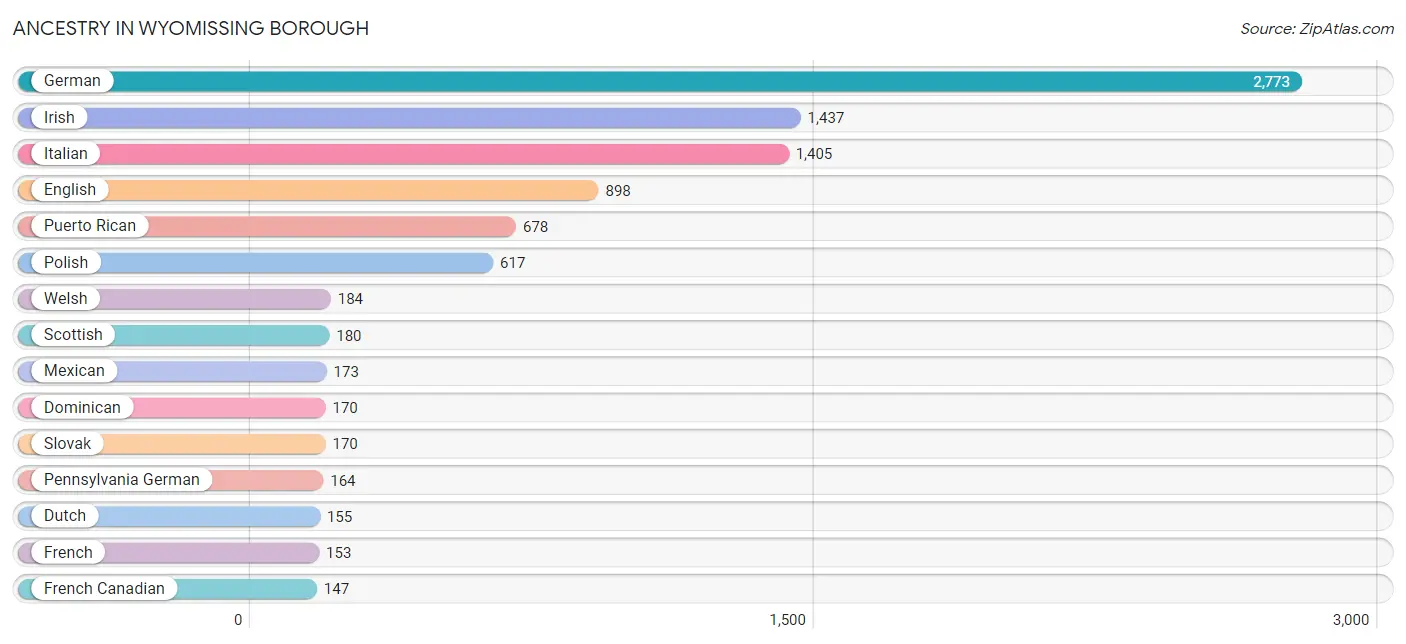
Ancestry in Wyomissing borough
The most populous ancestries reported in Wyomissing borough are German (2,773 | 25.1%), Irish (1,437 | 13.0%), Italian (1,405 | 12.7%), English (898 | 8.1%), and Puerto Rican (678 | 6.1%), together accounting for 65.0% of all Wyomissing borough residents.
| Ancestry | # Population | % Population |
| American | 112 | 1.0% |
| Arab | 55 | 0.5% |
| Australian | 3 | 0.0% |
| Austrian | 14 | 0.1% |
| Belgian | 28 | 0.3% |
| Bhutanese | 14 | 0.1% |
| Brazilian | 18 | 0.2% |
| British | 60 | 0.5% |
| Central American | 102 | 0.9% |
| Cherokee | 21 | 0.2% |
| Croatian | 43 | 0.4% |
| Cuban | 31 | 0.3% |
| Czech | 8 | 0.1% |
| Danish | 17 | 0.2% |
| Dominican | 170 | 1.5% |
| Dutch | 155 | 1.4% |
| Eastern European | 102 | 0.9% |
| English | 898 | 8.1% |
| Ethiopian | 75 | 0.7% |
| European | 117 | 1.1% |
| French | 153 | 1.4% |
| French Canadian | 147 | 1.3% |
| German | 2,773 | 25.1% |
| Ghanaian | 29 | 0.3% |
| Greek | 64 | 0.6% |
| Guatemalan | 9 | 0.1% |
| Guyanese | 12 | 0.1% |
| Honduran | 88 | 0.8% |
| Hungarian | 16 | 0.1% |
| Indian (Asian) | 92 | 0.8% |
| Irish | 1,437 | 13.0% |
| Iroquois | 6 | 0.1% |
| Italian | 1,405 | 12.7% |
| Jamaican | 47 | 0.4% |
| Korean | 19 | 0.2% |
| Lebanese | 22 | 0.2% |
| Lithuanian | 136 | 1.2% |
| Mexican | 173 | 1.6% |
| Nicaraguan | 5 | 0.1% |
| Northern European | 27 | 0.2% |
| Norwegian | 69 | 0.6% |
| Palestinian | 14 | 0.1% |
| Pennsylvania German | 164 | 1.5% |
| Polish | 617 | 5.6% |
| Portuguese | 17 | 0.2% |
| Puerto Rican | 678 | 6.1% |
| Romanian | 51 | 0.5% |
| Russian | 106 | 1.0% |
| Scandinavian | 17 | 0.2% |
| Scotch-Irish | 107 | 1.0% |
| Scottish | 180 | 1.6% |
| Slovak | 170 | 1.5% |
| South African | 40 | 0.4% |
| Spaniard | 30 | 0.3% |
| Sri Lankan | 26 | 0.2% |
| Subsaharan African | 144 | 1.3% |
| Swedish | 46 | 0.4% |
| Swiss | 47 | 0.4% |
| Syrian | 5 | 0.1% |
| Thai | 130 | 1.2% |
| Ukrainian | 69 | 0.6% |
| Welsh | 184 | 1.7% |
| Yugoslavian | 11 | 0.1% | View All 63 Rows |
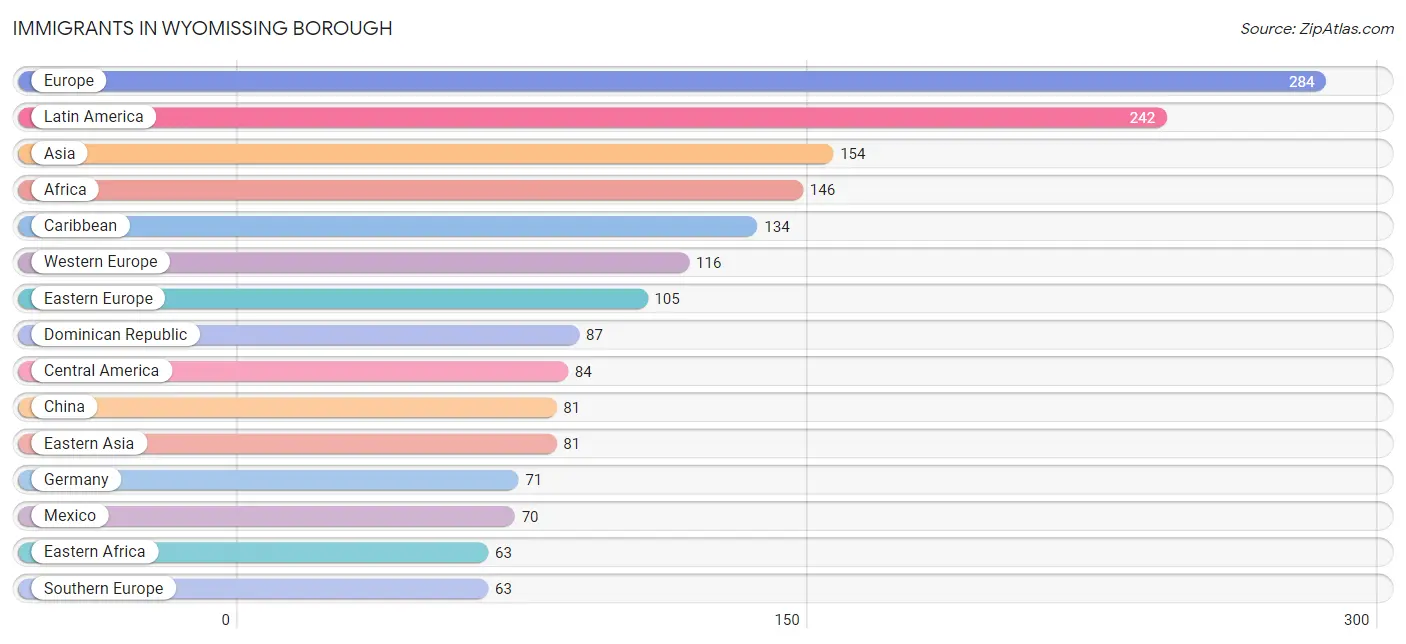
Immigrants in Wyomissing borough
The most numerous immigrant groups reported in Wyomissing borough came from Europe (284 | 2.6%), Latin America (242 | 2.2%), Asia (154 | 1.4%), Africa (146 | 1.3%), and Caribbean (134 | 1.2%), together accounting for 8.7% of all Wyomissing borough residents.
| Immigration Origin | # Population | % Population |
| Africa | 146 | 1.3% |
| Asia | 154 | 1.4% |
| Belgium | 18 | 0.2% |
| Bosnia and Herzegovina | 33 | 0.3% |
| Canada | 44 | 0.4% |
| Caribbean | 134 | 1.2% |
| Central America | 84 | 0.8% |
| China | 81 | 0.7% |
| Dominican Republic | 87 | 0.8% |
| Eastern Africa | 63 | 0.6% |
| Eastern Asia | 81 | 0.7% |
| Eastern Europe | 105 | 0.9% |
| Ethiopia | 52 | 0.5% |
| Europe | 284 | 2.6% |
| France | 27 | 0.2% |
| Germany | 71 | 0.6% |
| Ghana | 29 | 0.3% |
| Greece | 11 | 0.1% |
| Guyana | 24 | 0.2% |
| Hungary | 6 | 0.1% |
| India | 11 | 0.1% |
| Israel | 12 | 0.1% |
| Italy | 6 | 0.1% |
| Jamaica | 47 | 0.4% |
| Kenya | 11 | 0.1% |
| Latin America | 242 | 2.2% |
| Mexico | 70 | 0.6% |
| Morocco | 14 | 0.1% |
| Nepal | 11 | 0.1% |
| Nicaragua | 5 | 0.1% |
| Northern Africa | 14 | 0.1% |
| Panama | 9 | 0.1% |
| Philippines | 13 | 0.1% |
| Romania | 54 | 0.5% |
| Russia | 12 | 0.1% |
| South Africa | 40 | 0.4% |
| South America | 24 | 0.2% |
| South Central Asia | 22 | 0.2% |
| South Eastern Asia | 39 | 0.4% |
| Southern Europe | 63 | 0.6% |
| Spain | 46 | 0.4% |
| Taiwan | 6 | 0.1% |
| Vietnam | 26 | 0.2% |
| Western Africa | 29 | 0.3% |
| Western Asia | 12 | 0.1% |
| Western Europe | 116 | 1.1% | View All 46 Rows |
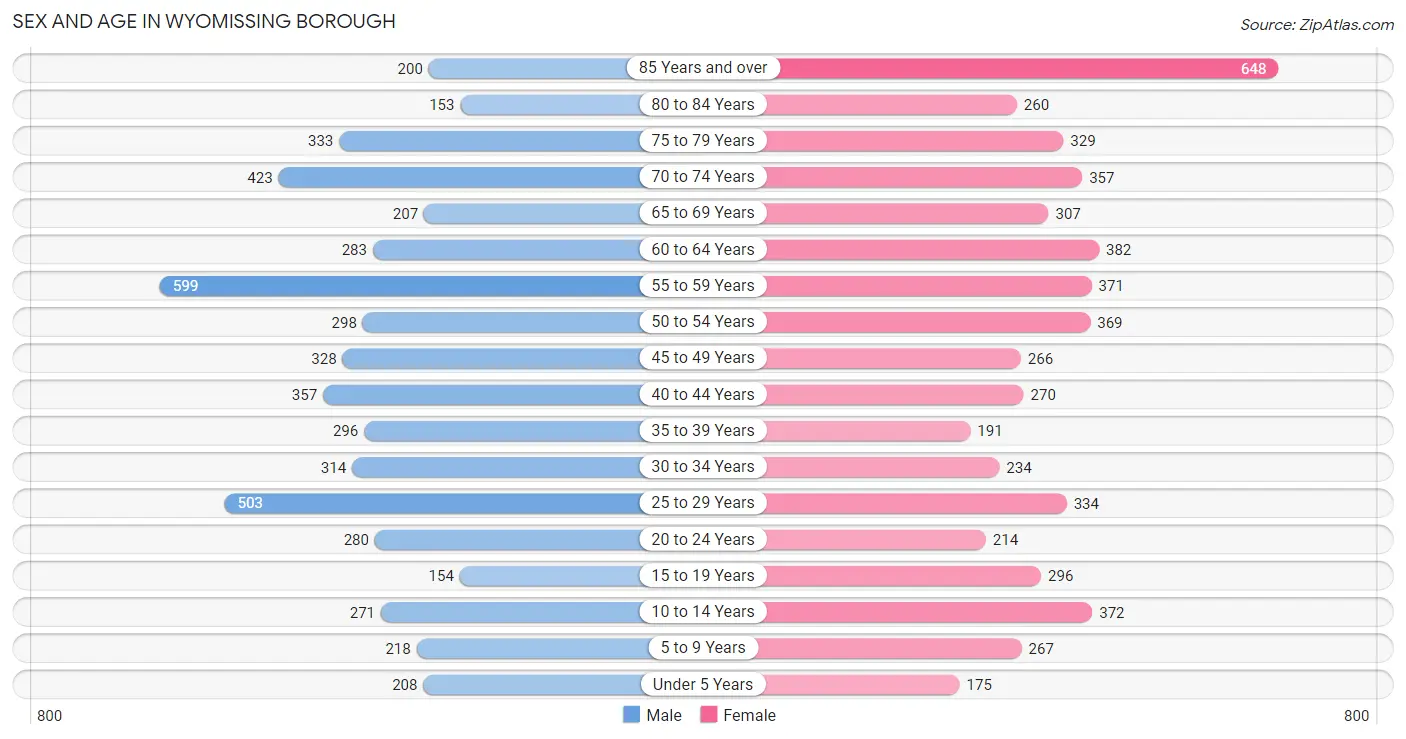
Sex and Age in Wyomissing borough
Sex and Age in Wyomissing borough
The most populous age groups in Wyomissing borough are 55 to 59 Years (599 | 11.0%) for men and 85 Years and over (648 | 11.5%) for women.
| Age Bracket | Male | Female |
| Under 5 Years | 208 (3.8%) | 175 (3.1%) |
| 5 to 9 Years | 218 (4.0%) | 267 (4.7%) |
| 10 to 14 Years | 271 (5.0%) | 372 (6.6%) |
| 15 to 19 Years | 154 (2.8%) | 296 (5.2%) |
| 20 to 24 Years | 280 (5.2%) | 214 (3.8%) |
| 25 to 29 Years | 503 (9.3%) | 334 (5.9%) |
| 30 to 34 Years | 314 (5.8%) | 234 (4.2%) |
| 35 to 39 Years | 296 (5.5%) | 191 (3.4%) |
| 40 to 44 Years | 357 (6.6%) | 270 (4.8%) |
| 45 to 49 Years | 328 (6.0%) | 266 (4.7%) |
| 50 to 54 Years | 298 (5.5%) | 369 (6.5%) |
| 55 to 59 Years | 599 (11.0%) | 371 (6.6%) |
| 60 to 64 Years | 283 (5.2%) | 382 (6.8%) |
| 65 to 69 Years | 207 (3.8%) | 307 (5.4%) |
| 70 to 74 Years | 423 (7.8%) | 357 (6.3%) |
| 75 to 79 Years | 333 (6.1%) | 329 (5.8%) |
| 80 to 84 Years | 153 (2.8%) | 260 (4.6%) |
| 85 Years and over | 200 (3.7%) | 648 (11.5%) |
| Total | 5,425 (100.0%) | 5,642 (100.0%) |
Families and Households in Wyomissing borough
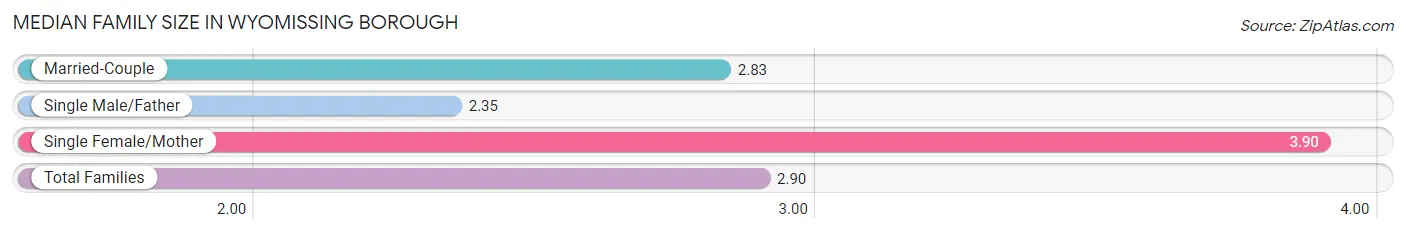
Median Family Size in Wyomissing borough
The median family size in Wyomissing borough is 2.90 persons per family, with single female/mother families (238 | 8.4%) accounting for the largest median family size of 3.9 persons per family. On the other hand, single male/father families (86 | 3.0%) represent the smallest median family size with 2.35 persons per family.
| Family Type | # Families | Family Size |
| Married-Couple | 2,516 (88.6%) | 2.83 |
| Single Male/Father | 86 (3.0%) | 2.35 |
| Single Female/Mother | 238 (8.4%) | 3.90 |
| Total Families | 2,840 (100.0%) | 2.90 |
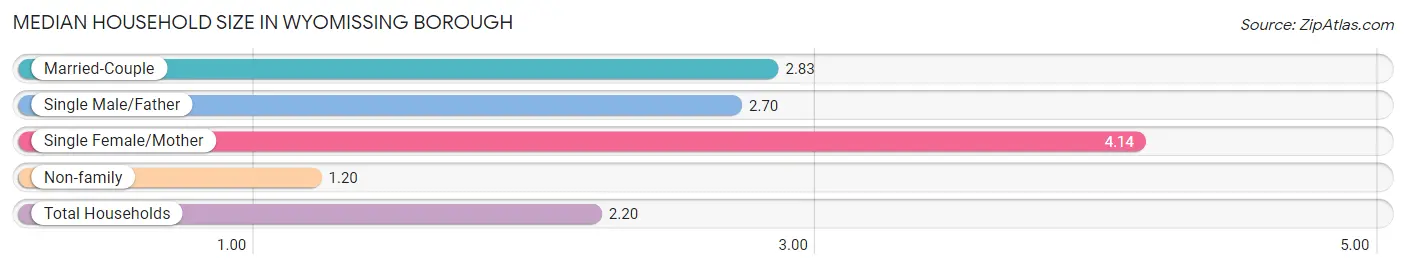
Median Household Size in Wyomissing borough
The median household size in Wyomissing borough is 2.20 persons per household, with single female/mother households (238 | 4.8%) accounting for the largest median household size of 4.14 persons per household. non-family households (2,090 | 42.4%) represent the smallest median household size with 1.20 persons per household.
| Household Type | # Households | Household Size |
| Married-Couple | 2,516 (51.0%) | 2.83 |
| Single Male/Father | 86 (1.7%) | 2.70 |
| Single Female/Mother | 238 (4.8%) | 4.14 |
| Non-family | 2,090 (42.4%) | 1.20 |
| Total Households | 4,930 (100.0%) | 2.20 |
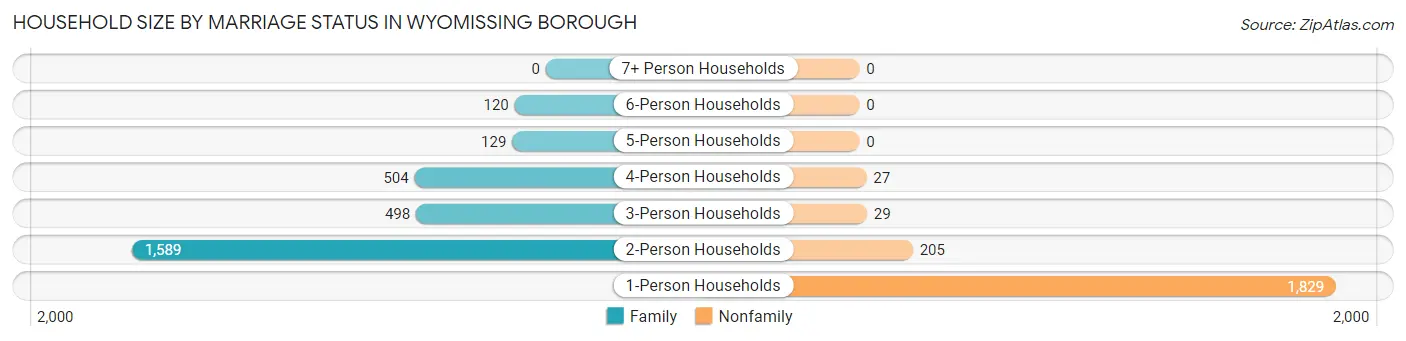
Household Size by Marriage Status in Wyomissing borough
Out of a total of 4,930 households in Wyomissing borough, 2,840 (57.6%) are family households, while 2,090 (42.4%) are nonfamily households. The most numerous type of family households are 2-person households, comprising 1,589, and the most common type of nonfamily households are 1-person households, comprising 1,829.
| Household Size | Family Households | Nonfamily Households |
| 1-Person Households | - | 1,829 (37.1%) |
| 2-Person Households | 1,589 (32.2%) | 205 (4.2%) |
| 3-Person Households | 498 (10.1%) | 29 (0.6%) |
| 4-Person Households | 504 (10.2%) | 27 (0.5%) |
| 5-Person Households | 129 (2.6%) | 0 (0.0%) |
| 6-Person Households | 120 (2.4%) | 0 (0.0%) |
| 7+ Person Households | 0 (0.0%) | 0 (0.0%) |
| Total | 2,840 (57.6%) | 2,090 (42.4%) |
Female Fertility in Wyomissing borough
Fertility by Age in Wyomissing borough
Average fertility rate in Wyomissing borough is 28.0 births per 1,000 women. Women in the age bracket of 20 to 34 years have the highest fertility rate with 43.0 births per 1,000 women. Women in the age bracket of 20 to 34 years acount for 65.4% of all women with births.
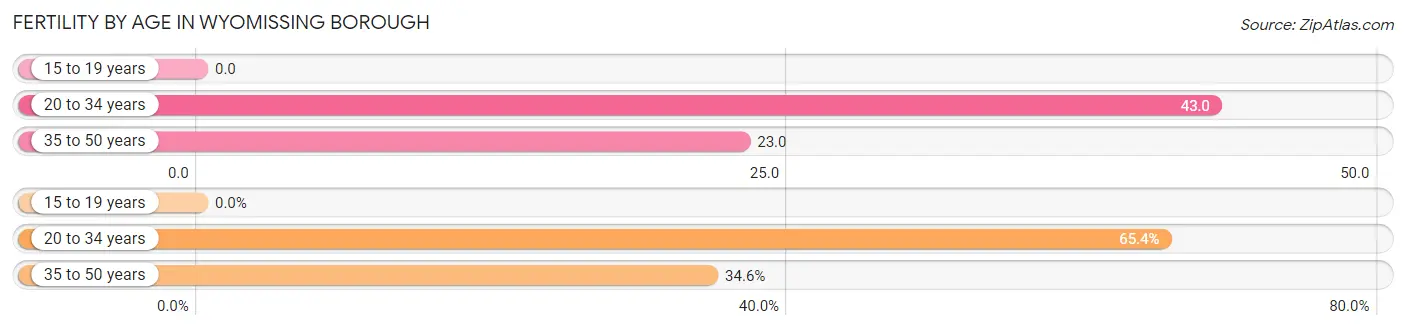
| Age Bracket | Women with Births | Births / 1,000 Women |
| 15 to 19 years | 0 (0.0%) | 0.0 |
| 20 to 34 years | 34 (65.4%) | 43.0 |
| 35 to 50 years | 18 (34.6%) | 23.0 |
| Total | 52 (100.0%) | 28.0 |
Fertility by Age by Marriage Status in Wyomissing borough
76.9% of women with births (52) in Wyomissing borough are married. The highest percentage of unmarried women with births falls into 20 to 34 years age bracket with 35.3% of them unmarried at the time of birth, while the lowest percentage of unmarried women with births belong to 35 to 50 years age bracket with 0.0% of them unmarried.
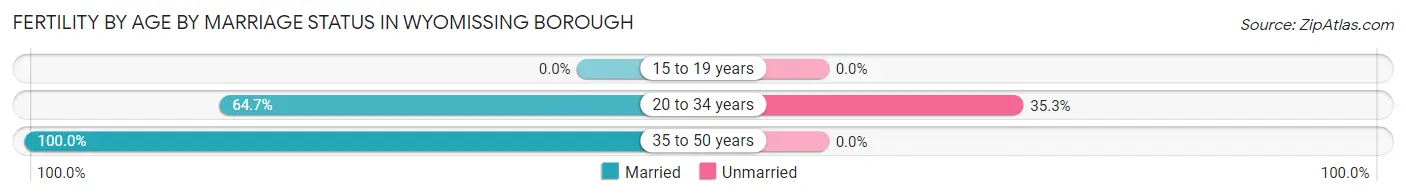
| Age Bracket | Married | Unmarried |
| 15 to 19 years | 0 (0.0%) | 0 (0.0%) |
| 20 to 34 years | 22 (64.7%) | 12 (35.3%) |
| 35 to 50 years | 18 (100.0%) | 0 (0.0%) |
| Total | 40 (76.9%) | 12 (23.1%) |
Fertility by Education in Wyomissing borough
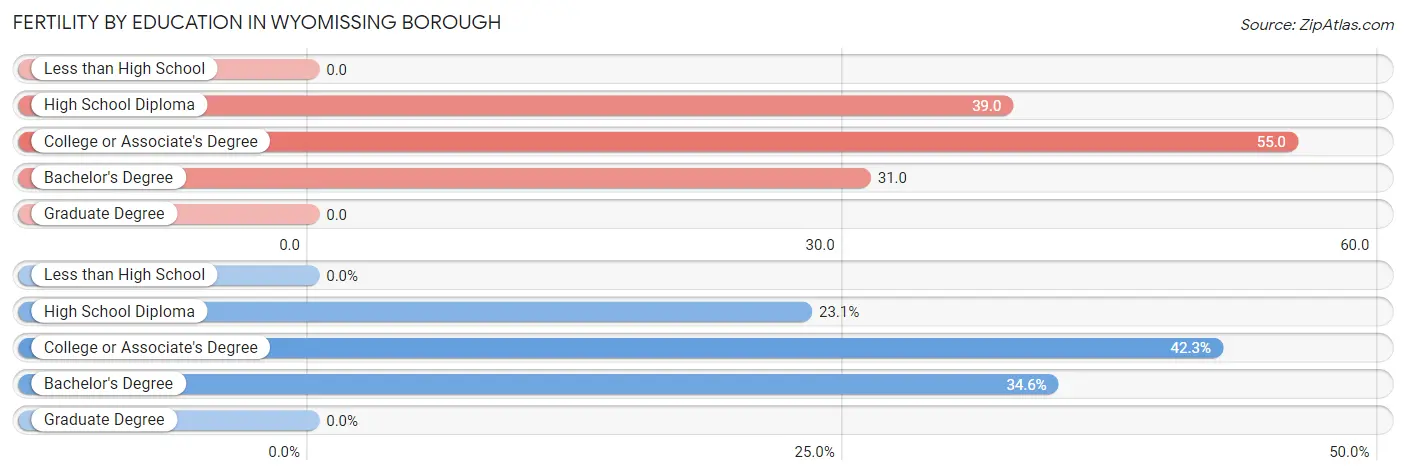
| Educational Attainment | Women with Births | Births / 1,000 Women |
| Less than High School | 0 (0.0%) | 0.0 |
| High School Diploma | 12 (23.1%) | 39.0 |
| College or Associate's Degree | 22 (42.3%) | 55.0 |
| Bachelor's Degree | 18 (34.6%) | 31.0 |
| Graduate Degree | 0 (0.0%) | 0.0 |
| Total | 52 (100.0%) | 28.0 |
Fertility by Education by Marriage Status in Wyomissing borough
23.1% of women with births in Wyomissing borough are unmarried. Women with the educational attainment of college or associate's degree are most likely to be married with 100.0% of them married at childbirth, while women with the educational attainment of high school diploma are least likely to be married with 100.0% of them unmarried at childbirth.
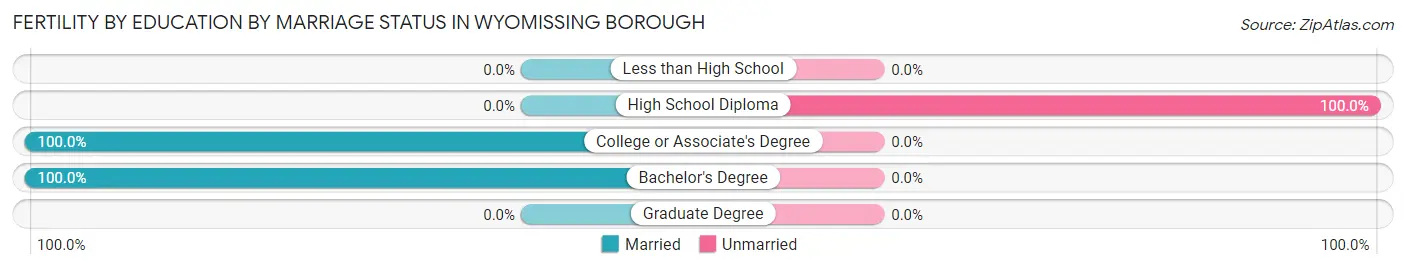
| Educational Attainment | Married | Unmarried |
| Less than High School | 0 (0.0%) | 0 (0.0%) |
| High School Diploma | 0 (0.0%) | 12 (100.0%) |
| College or Associate's Degree | 22 (100.0%) | 0 (0.0%) |
| Bachelor's Degree | 18 (100.0%) | 0 (0.0%) |
| Graduate Degree | 0 (0.0%) | 0 (0.0%) |
| Total | 40 (76.9%) | 12 (23.1%) |
Employment Characteristics in Wyomissing borough
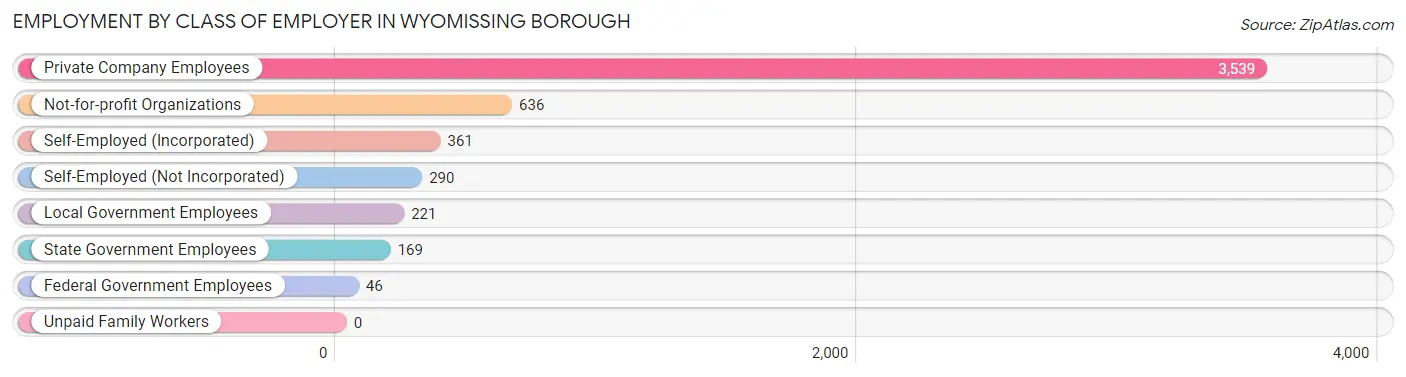
Employment by Class of Employer in Wyomissing borough
Among the 5,262 employed individuals in Wyomissing borough, private company employees (3,539 | 67.3%), not-for-profit organizations (636 | 12.1%), and self-employed (incorporated) (361 | 6.9%) make up the most common classes of employment.
| Employer Class | # Employees | % Employees |
| Private Company Employees | 3,539 | 67.3% |
| Self-Employed (Incorporated) | 361 | 6.9% |
| Self-Employed (Not Incorporated) | 290 | 5.5% |
| Not-for-profit Organizations | 636 | 12.1% |
| Local Government Employees | 221 | 4.2% |
| State Government Employees | 169 | 3.2% |
| Federal Government Employees | 46 | 0.9% |
| Unpaid Family Workers | 0 | 0.0% |
| Total | 5,262 | 100.0% |
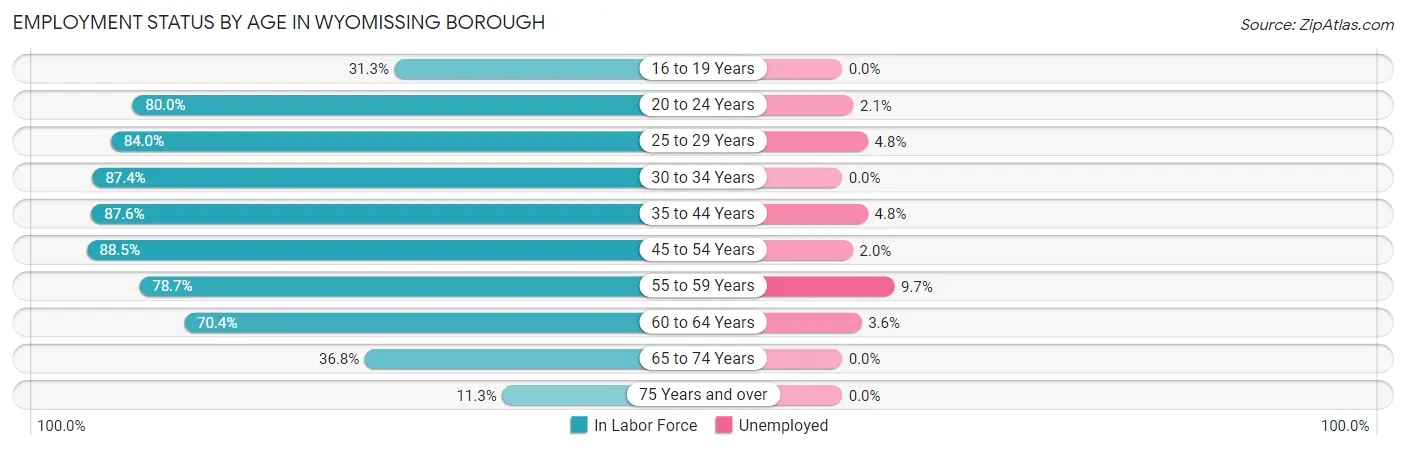
Employment Status by Age in Wyomissing borough
According to the labor force statistics for Wyomissing borough, out of the total population over 16 years of age (9,451), 60.3% or 5,699 individuals are in the labor force, with 3.6% or 205 of them unemployed. The age group with the highest labor force participation rate is 45 to 54 years, with 88.5% or 1,116 individuals in the labor force. Within the labor force, the 55 to 59 years age range has the highest percentage of unemployed individuals, with 9.7% or 74 of them being unemployed.
| Age Bracket | In Labor Force | Unemployed |
| 16 to 19 Years | 108 (31.3%) | 0 (0.0%) |
| 20 to 24 Years | 395 (80.0%) | 8 (2.1%) |
| 25 to 29 Years | 703 (84.0%) | 34 (4.8%) |
| 30 to 34 Years | 479 (87.4%) | 0 (0.0%) |
| 35 to 44 Years | 976 (87.6%) | 47 (4.8%) |
| 45 to 54 Years | 1,116 (88.5%) | 22 (2.0%) |
| 55 to 59 Years | 763 (78.7%) | 74 (9.7%) |
| 60 to 64 Years | 468 (70.4%) | 17 (3.6%) |
| 65 to 74 Years | 476 (36.8%) | 0 (0.0%) |
| 75 Years and over | 217 (11.3%) | 0 (0.0%) |
| Total | 5,699 (60.3%) | 205 (3.6%) |
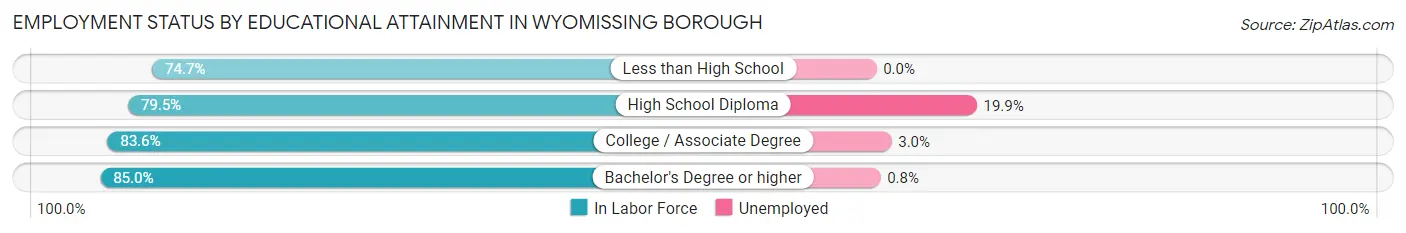
Employment Status by Educational Attainment in Wyomissing borough
According to labor force statistics for Wyomissing borough, 83.5% of individuals (4,505) out of the total population between 25 and 64 years of age (5,395) are in the labor force, with 4.3% or 194 of them being unemployed. The group with the highest labor force participation rate are those with the educational attainment of bachelor's degree or higher, with 85.0% or 2,728 individuals in the labor force. Within the labor force, individuals with high school diploma education have the highest percentage of unemployment, with 19.9% or 144 of them being unemployed.
| Educational Attainment | In Labor Force | Unemployed |
| Less than High School | 109 (74.7%) | 0 (0.0%) |
| High School Diploma | 725 (79.5%) | 181 (19.9%) |
| College / Associate Degree | 942 (83.6%) | 34 (3.0%) |
| Bachelor's Degree or higher | 2,728 (85.0%) | 26 (0.8%) |
| Total | 4,505 (83.5%) | 232 (4.3%) |
Employment Occupations by Sex in Wyomissing borough
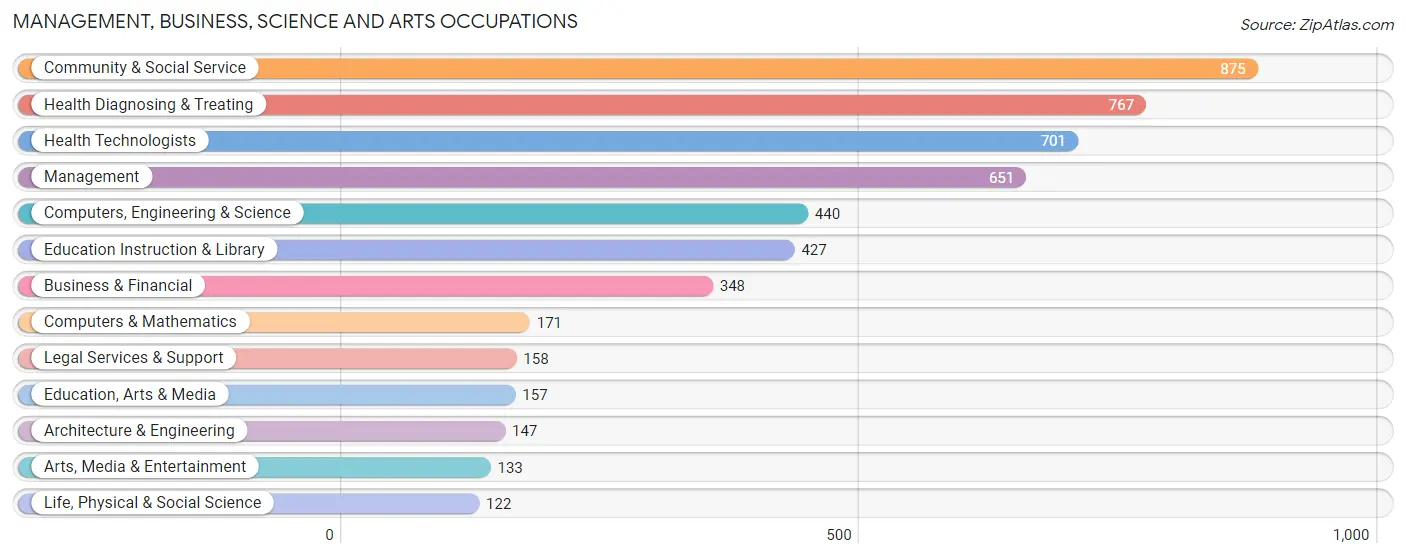
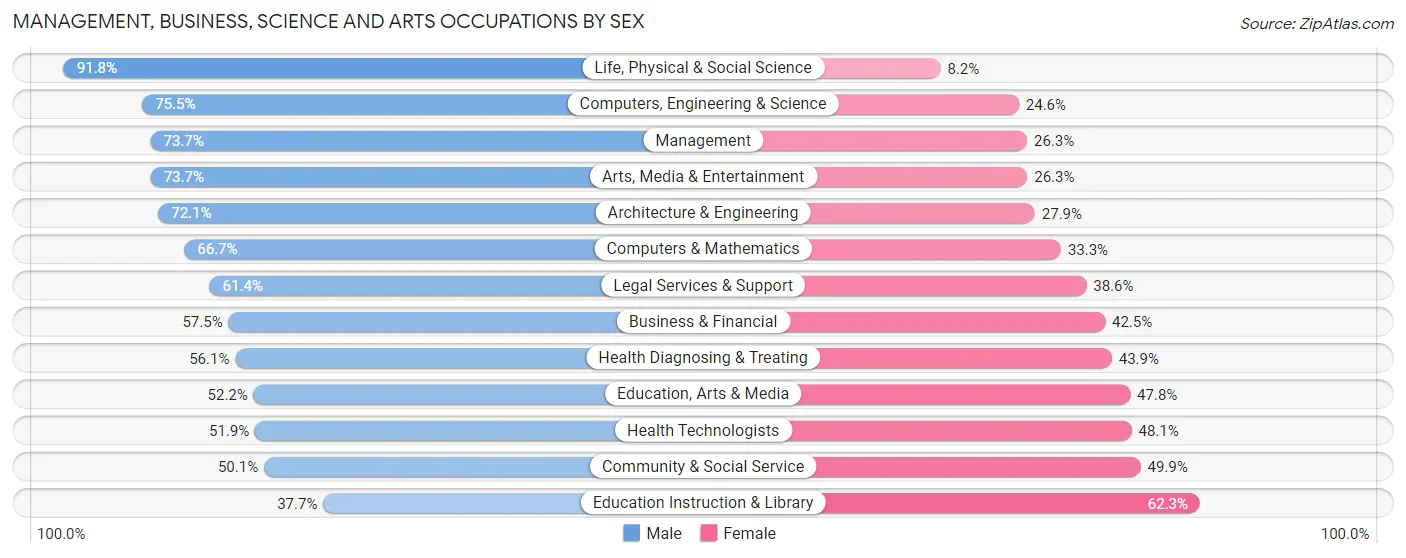
Management, Business, Science and Arts Occupations
The most common Management, Business, Science and Arts occupations in Wyomissing borough are Community & Social Service (875 | 16.0%), Health Diagnosing & Treating (767 | 14.0%), Health Technologists (701 | 12.8%), Management (651 | 11.9%), and Computers, Engineering & Science (440 | 8.0%).
Management, Business, Science and Arts Occupations by Sex
Within the Management, Business, Science and Arts occupations in Wyomissing borough, the most male-oriented occupations are Life, Physical & Social Science (91.8%), Computers, Engineering & Science (75.4%), and Management (73.7%), while the most female-oriented occupations are Education Instruction & Library (62.3%), Community & Social Service (49.9%), and Health Technologists (48.1%).
| Occupation | Male | Female |
| Management | 480 (73.7%) | 171 (26.3%) |
| Business & Financial | 200 (57.5%) | 148 (42.5%) |
| Computers, Engineering & Science | 332 (75.4%) | 108 (24.5%) |
| Computers & Mathematics | 114 (66.7%) | 57 (33.3%) |
| Architecture & Engineering | 106 (72.1%) | 41 (27.9%) |
| Life, Physical & Social Science | 112 (91.8%) | 10 (8.2%) |
| Community & Social Service | 438 (50.1%) | 437 (49.9%) |
| Education, Arts & Media | 82 (52.2%) | 75 (47.8%) |
| Legal Services & Support | 97 (61.4%) | 61 (38.6%) |
| Education Instruction & Library | 161 (37.7%) | 266 (62.3%) |
| Arts, Media & Entertainment | 98 (73.7%) | 35 (26.3%) |
| Health Diagnosing & Treating | 430 (56.1%) | 337 (43.9%) |
| Health Technologists | 364 (51.9%) | 337 (48.1%) |
| Total (Category) | 1,880 (61.0%) | 1,201 (39.0%) |
| Total (Overall) | 3,266 (59.7%) | 2,209 (40.4%) |
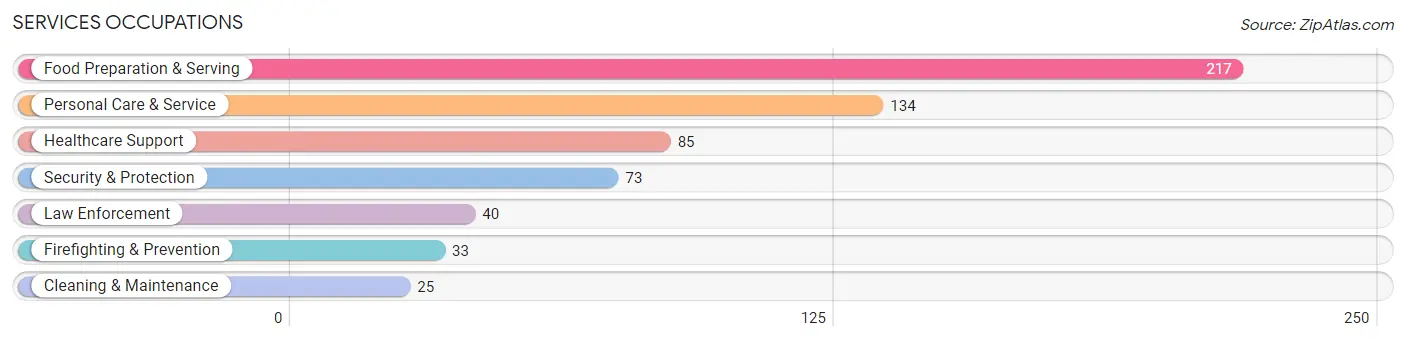
Services Occupations
The most common Services occupations in Wyomissing borough are Food Preparation & Serving (217 | 4.0%), Personal Care & Service (134 | 2.5%), Healthcare Support (85 | 1.5%), Security & Protection (73 | 1.3%), and Law Enforcement (40 | 0.7%).
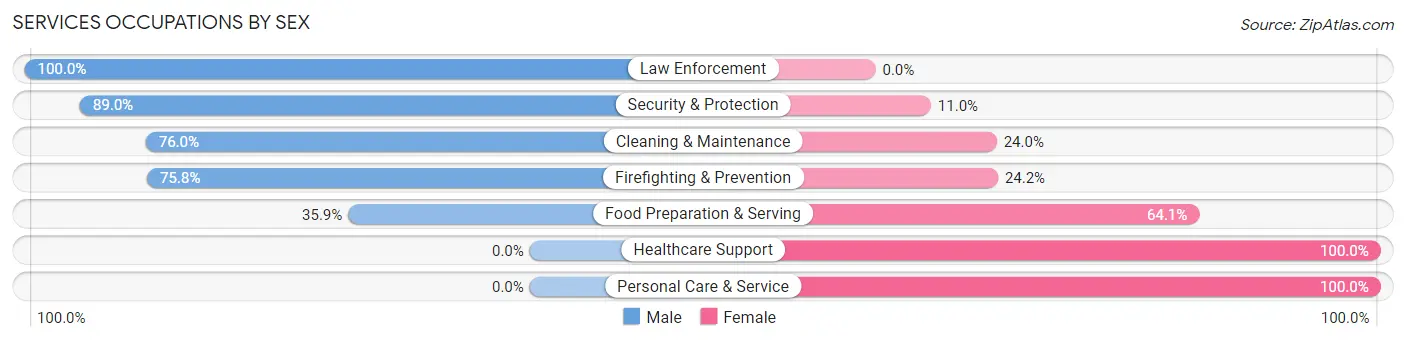
Services Occupations by Sex
Within the Services occupations in Wyomissing borough, the most male-oriented occupations are Law Enforcement (100.0%), Security & Protection (89.0%), and Cleaning & Maintenance (76.0%), while the most female-oriented occupations are Healthcare Support (100.0%), Personal Care & Service (100.0%), and Food Preparation & Serving (64.1%).
| Occupation | Male | Female |
| Healthcare Support | 0 (0.0%) | 85 (100.0%) |
| Security & Protection | 65 (89.0%) | 8 (11.0%) |
| Firefighting & Prevention | 25 (75.8%) | 8 (24.2%) |
| Law Enforcement | 40 (100.0%) | 0 (0.0%) |
| Food Preparation & Serving | 78 (35.9%) | 139 (64.1%) |
| Cleaning & Maintenance | 19 (76.0%) | 6 (24.0%) |
| Personal Care & Service | 0 (0.0%) | 134 (100.0%) |
| Total (Category) | 162 (30.3%) | 372 (69.7%) |
| Total (Overall) | 3,266 (59.7%) | 2,209 (40.4%) |
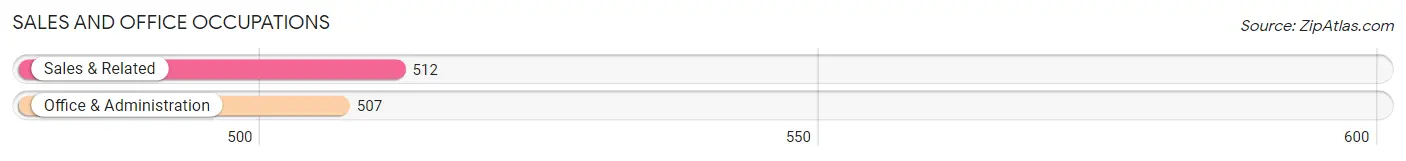
Sales and Office Occupations
The most common Sales and Office occupations in Wyomissing borough are Sales & Related (512 | 9.3%), and Office & Administration (507 | 9.3%).
Sales and Office Occupations by Sex
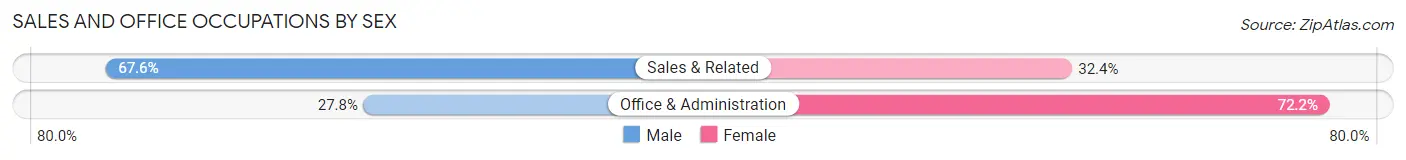
| Occupation | Male | Female |
| Sales & Related | 346 (67.6%) | 166 (32.4%) |
| Office & Administration | 141 (27.8%) | 366 (72.2%) |
| Total (Category) | 487 (47.8%) | 532 (52.2%) |
| Total (Overall) | 3,266 (59.7%) | 2,209 (40.4%) |
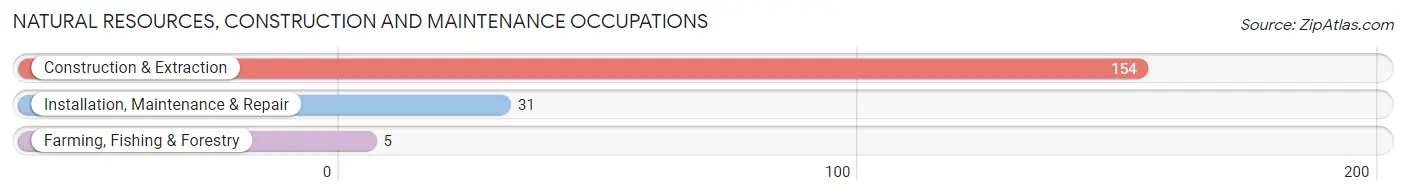
Natural Resources, Construction and Maintenance Occupations
The most common Natural Resources, Construction and Maintenance occupations in Wyomissing borough are Construction & Extraction (154 | 2.8%), Installation, Maintenance & Repair (31 | 0.6%), and Farming, Fishing & Forestry (5 | 0.1%).
Natural Resources, Construction and Maintenance Occupations by Sex
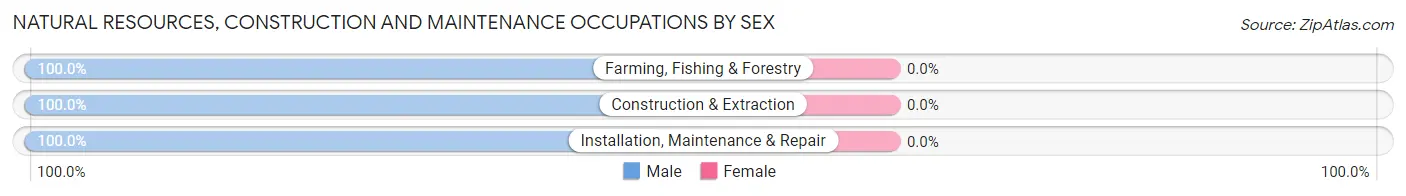
| Occupation | Male | Female |
| Farming, Fishing & Forestry | 5 (100.0%) | 0 (0.0%) |
| Construction & Extraction | 154 (100.0%) | 0 (0.0%) |
| Installation, Maintenance & Repair | 31 (100.0%) | 0 (0.0%) |
| Total (Category) | 190 (100.0%) | 0 (0.0%) |
| Total (Overall) | 3,266 (59.7%) | 2,209 (40.4%) |
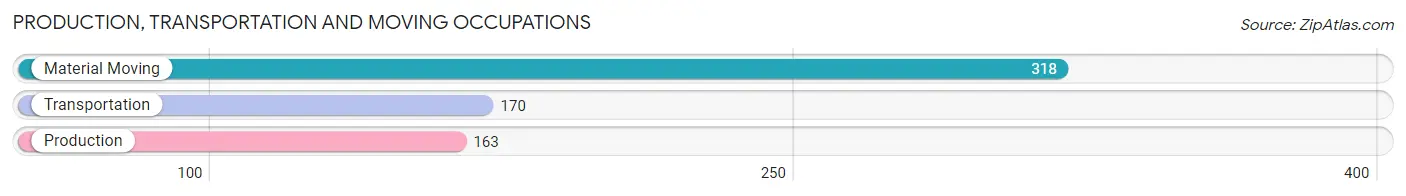
Production, Transportation and Moving Occupations
The most common Production, Transportation and Moving occupations in Wyomissing borough are Material Moving (318 | 5.8%), Transportation (170 | 3.1%), and Production (163 | 3.0%).
Production, Transportation and Moving Occupations by Sex
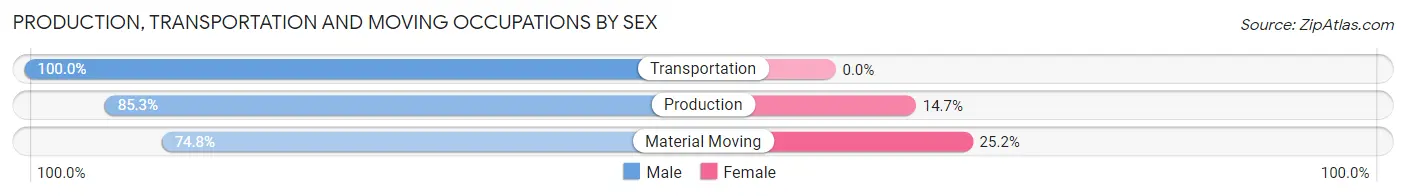
| Occupation | Male | Female |
| Production | 139 (85.3%) | 24 (14.7%) |
| Transportation | 170 (100.0%) | 0 (0.0%) |
| Material Moving | 238 (74.8%) | 80 (25.2%) |
| Total (Category) | 547 (84.0%) | 104 (16.0%) |
| Total (Overall) | 3,266 (59.7%) | 2,209 (40.4%) |
Employment Industries by Sex in Wyomissing borough
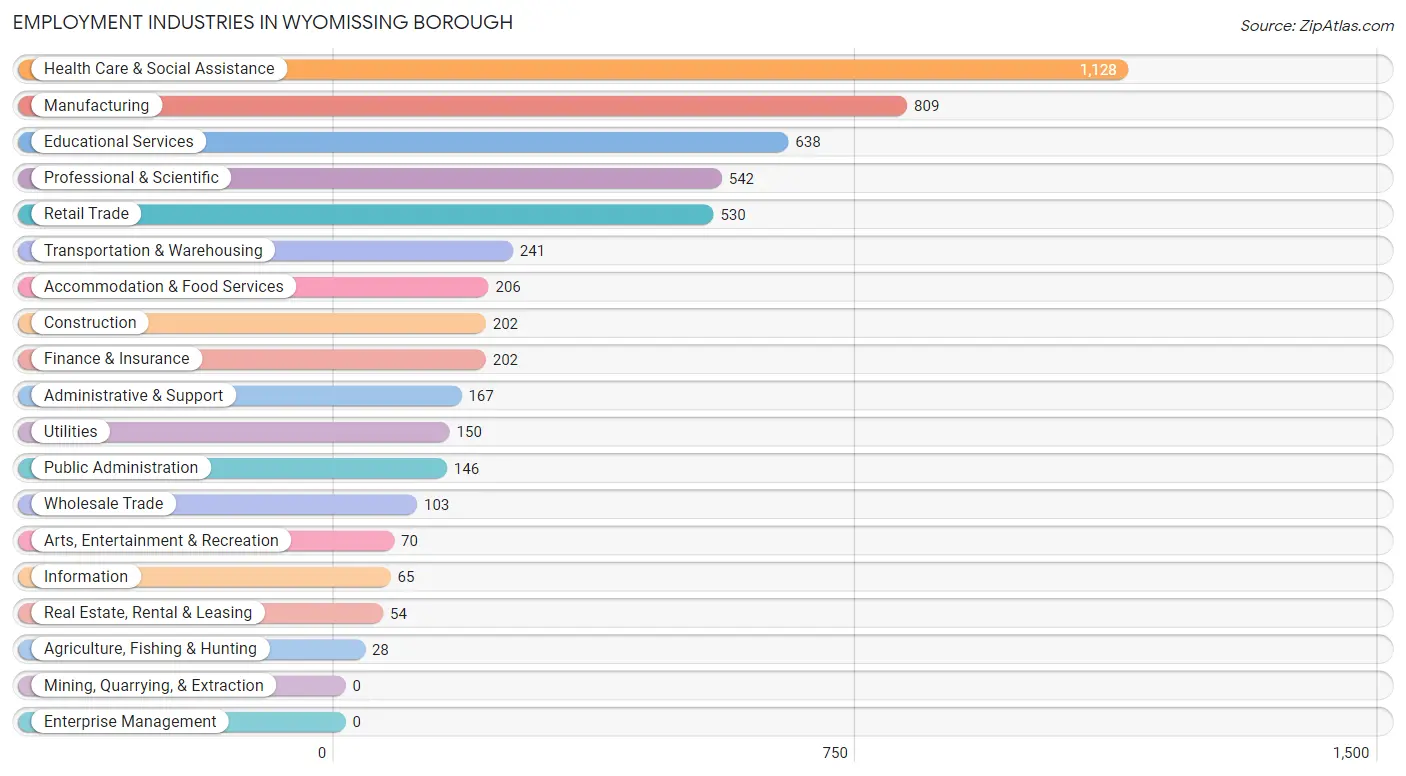
Employment Industries in Wyomissing borough
The major employment industries in Wyomissing borough include Health Care & Social Assistance (1,128 | 20.6%), Manufacturing (809 | 14.8%), Educational Services (638 | 11.7%), Professional & Scientific (542 | 9.9%), and Retail Trade (530 | 9.7%).
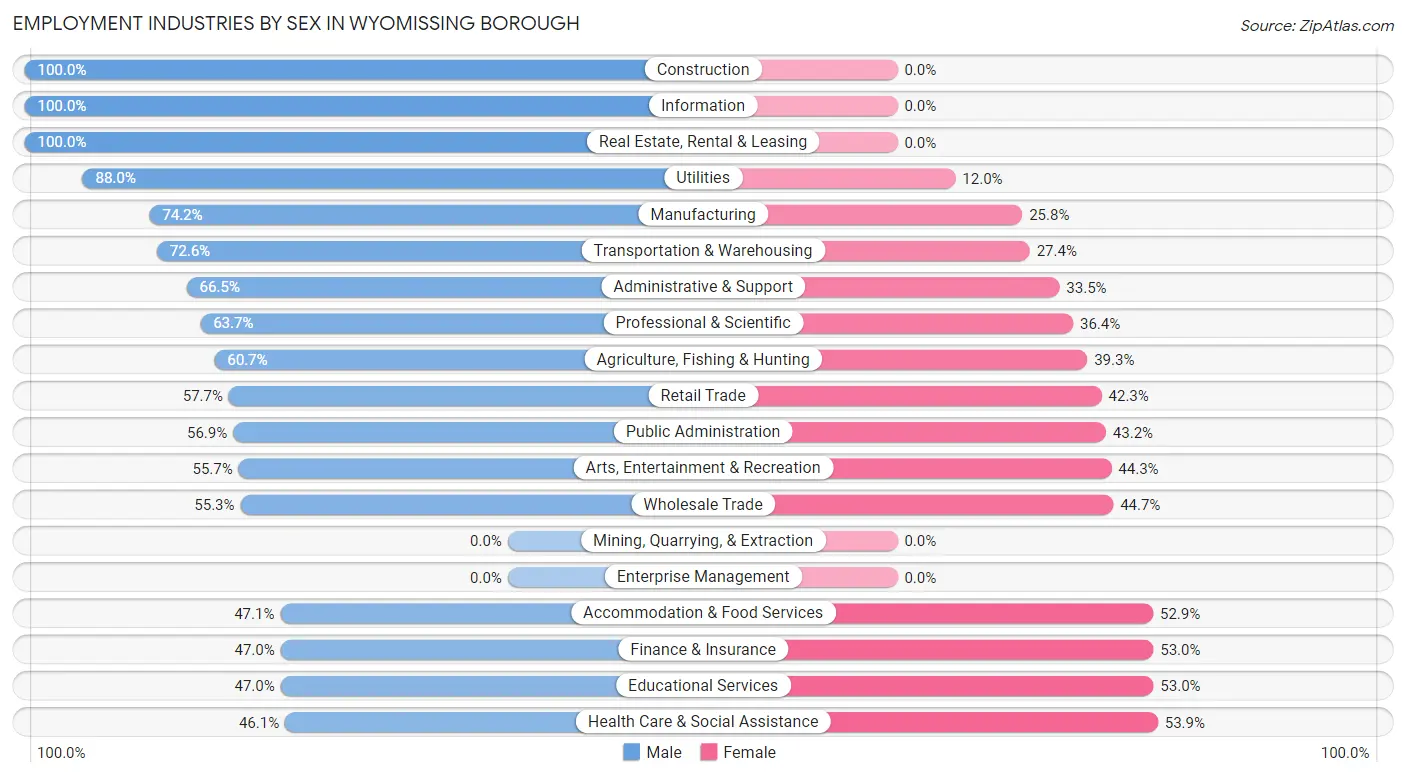
Employment Industries by Sex in Wyomissing borough
The Wyomissing borough industries that see more men than women are Construction (100.0%), Information (100.0%), and Real Estate, Rental & Leasing (100.0%), whereas the industries that tend to have a higher number of women are Health Care & Social Assistance (53.9%), Educational Services (53.0%), and Finance & Insurance (53.0%).
| Industry | Male | Female |
| Agriculture, Fishing & Hunting | 17 (60.7%) | 11 (39.3%) |
| Mining, Quarrying, & Extraction | 0 (0.0%) | 0 (0.0%) |
| Construction | 202 (100.0%) | 0 (0.0%) |
| Manufacturing | 600 (74.2%) | 209 (25.8%) |
| Wholesale Trade | 57 (55.3%) | 46 (44.7%) |
| Retail Trade | 306 (57.7%) | 224 (42.3%) |
| Transportation & Warehousing | 175 (72.6%) | 66 (27.4%) |
| Utilities | 132 (88.0%) | 18 (12.0%) |
| Information | 65 (100.0%) | 0 (0.0%) |
| Finance & Insurance | 95 (47.0%) | 107 (53.0%) |
| Real Estate, Rental & Leasing | 54 (100.0%) | 0 (0.0%) |
| Professional & Scientific | 345 (63.6%) | 197 (36.3%) |
| Enterprise Management | 0 (0.0%) | 0 (0.0%) |
| Administrative & Support | 111 (66.5%) | 56 (33.5%) |
| Educational Services | 300 (47.0%) | 338 (53.0%) |
| Health Care & Social Assistance | 520 (46.1%) | 608 (53.9%) |
| Arts, Entertainment & Recreation | 39 (55.7%) | 31 (44.3%) |
| Accommodation & Food Services | 97 (47.1%) | 109 (52.9%) |
| Public Administration | 83 (56.9%) | 63 (43.1%) |
| Total | 3,266 (59.7%) | 2,209 (40.4%) |
Education in Wyomissing borough
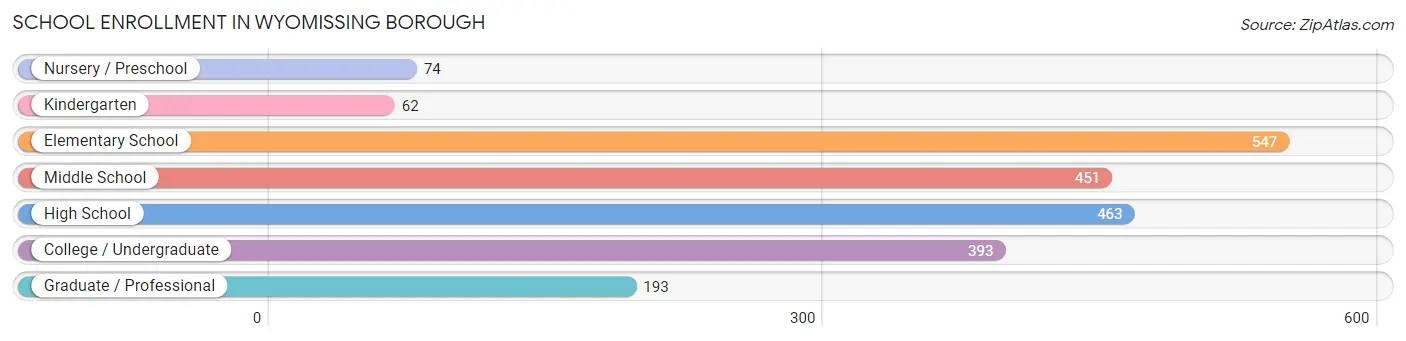
School Enrollment in Wyomissing borough
The most common levels of schooling among the 2,183 students in Wyomissing borough are elementary school (547 | 25.1%), high school (463 | 21.2%), and middle school (451 | 20.7%).
| School Level | # Students | % Students |
| Nursery / Preschool | 74 | 3.4% |
| Kindergarten | 62 | 2.8% |
| Elementary School | 547 | 25.1% |
| Middle School | 451 | 20.7% |
| High School | 463 | 21.2% |
| College / Undergraduate | 393 | 18.0% |
| Graduate / Professional | 193 | 8.8% |
| Total | 2,183 | 100.0% |
School Enrollment by Age by Funding Source in Wyomissing borough
Out of a total of 2,183 students who are enrolled in schools in Wyomissing borough, 482 (22.1%) attend a private institution, while the remaining 1,701 (77.9%) are enrolled in public schools. The age group of 3 to 4 year olds has the highest likelihood of being enrolled in private schools, with 48 (64.9% in the age bracket) enrolled. Conversely, the age group of 5 to 9 year old has the lowest likelihood of being enrolled in a private school, with 423 (87.2% in the age bracket) attending a public institution.
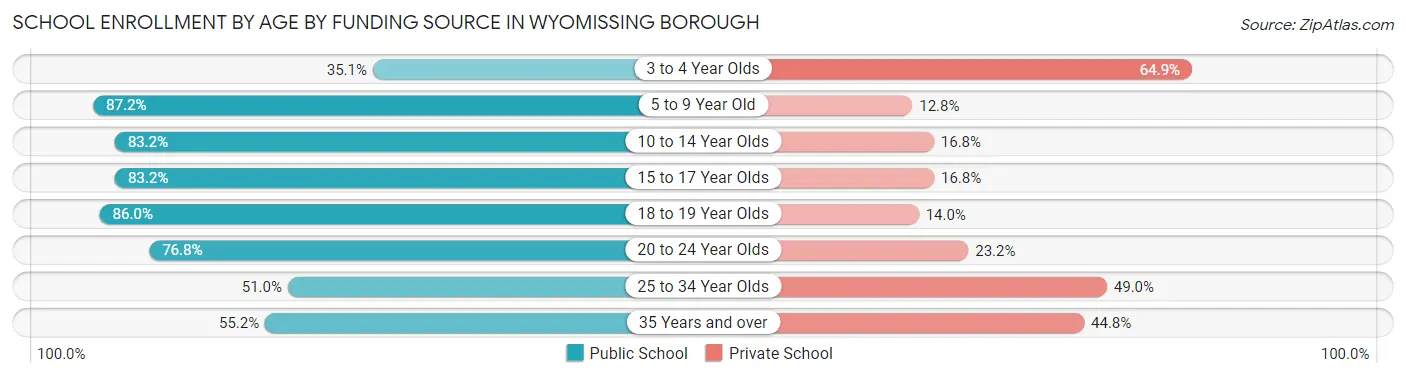
| Age Bracket | Public School | Private School |
| 3 to 4 Year Olds | 26 (35.1%) | 48 (64.9%) |
| 5 to 9 Year Old | 423 (87.2%) | 62 (12.8%) |
| 10 to 14 Year Olds | 535 (83.2%) | 108 (16.8%) |
| 15 to 17 Year Olds | 242 (83.2%) | 49 (16.8%) |
| 18 to 19 Year Olds | 117 (86.0%) | 19 (14.0%) |
| 20 to 24 Year Olds | 205 (76.8%) | 62 (23.2%) |
| 25 to 34 Year Olds | 78 (51.0%) | 75 (49.0%) |
| 35 Years and over | 74 (55.2%) | 60 (44.8%) |
| Total | 1,701 (77.9%) | 482 (22.1%) |
Educational Attainment by Field of Study in Wyomissing borough
Bio, nature & agricultural (673 | 13.3%), education (672 | 13.2%), business (625 | 12.3%), social sciences (496 | 9.8%), and engineering (417 | 8.2%) are the most common fields of study among 5,078 individuals in Wyomissing borough who have obtained a bachelor's degree or higher.
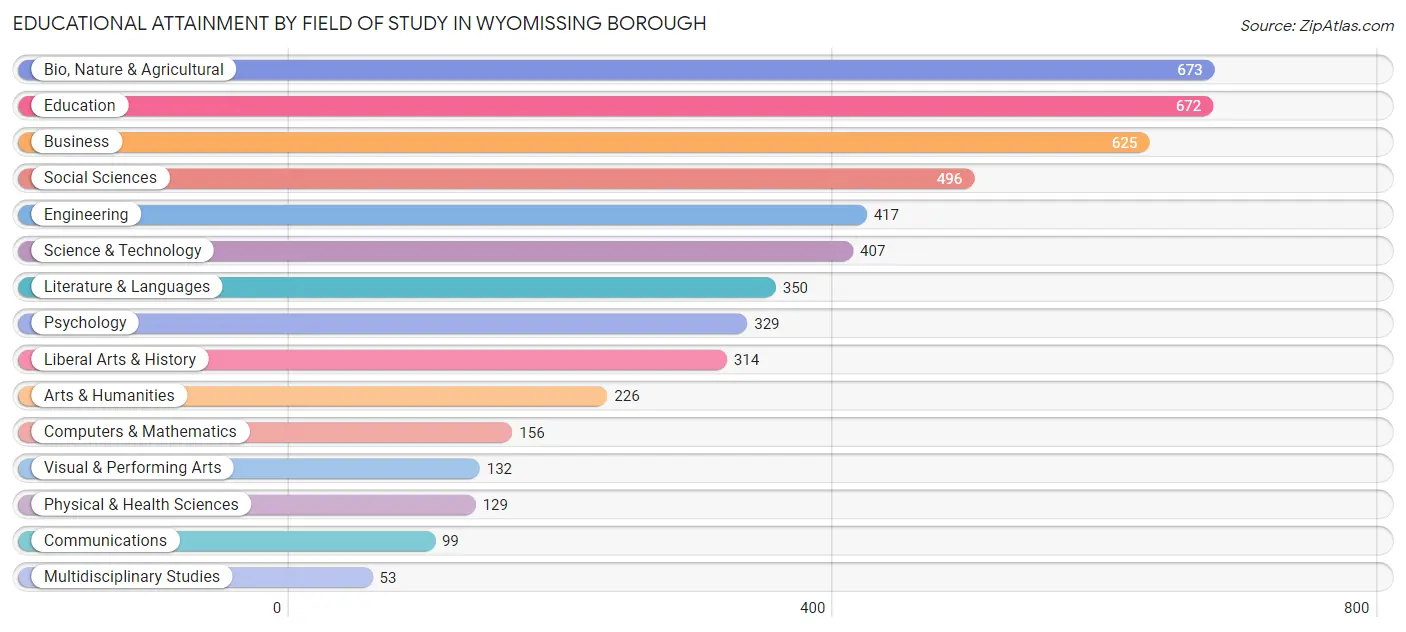
| Field of Study | # Graduates | % Graduates |
| Computers & Mathematics | 156 | 3.1% |
| Bio, Nature & Agricultural | 673 | 13.3% |
| Physical & Health Sciences | 129 | 2.5% |
| Psychology | 329 | 6.5% |
| Social Sciences | 496 | 9.8% |
| Engineering | 417 | 8.2% |
| Multidisciplinary Studies | 53 | 1.0% |
| Science & Technology | 407 | 8.0% |
| Business | 625 | 12.3% |
| Education | 672 | 13.2% |
| Literature & Languages | 350 | 6.9% |
| Liberal Arts & History | 314 | 6.2% |
| Visual & Performing Arts | 132 | 2.6% |
| Communications | 99 | 1.9% |
| Arts & Humanities | 226 | 4.4% |
| Total | 5,078 | 100.0% |
Transportation & Commute in Wyomissing borough
Vehicle Availability by Sex in Wyomissing borough
The most prevalent vehicle ownership categories in Wyomissing borough are males with 2 vehicles (1,663, accounting for 53.3%) and females with 2 vehicles (1,081, making up 79.1%).
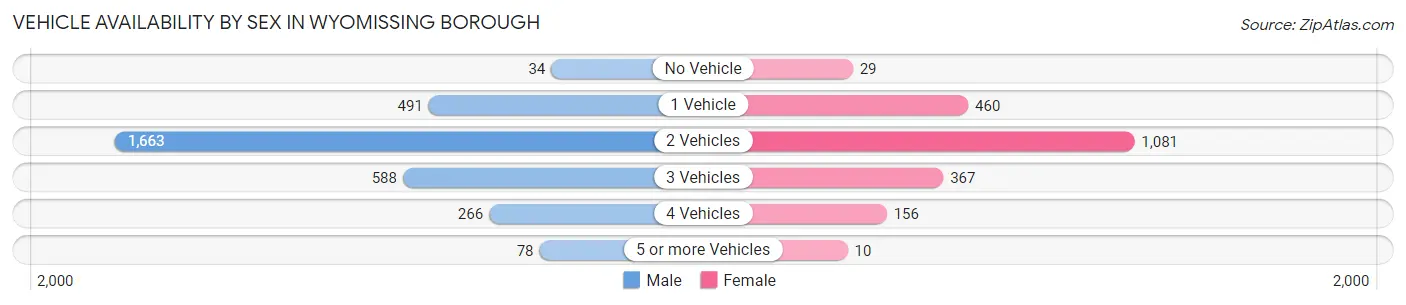
| Vehicles Available | Male | Female |
| No Vehicle | 34 (1.1%) | 29 (1.4%) |
| 1 Vehicle | 491 (15.7%) | 460 (21.9%) |
| 2 Vehicles | 1,663 (53.3%) | 1,081 (51.4%) |
| 3 Vehicles | 588 (18.9%) | 367 (17.4%) |
| 4 Vehicles | 266 (8.5%) | 156 (7.4%) |
| 5 or more Vehicles | 78 (2.5%) | 10 (0.5%) |
| Total | 3,120 (100.0%) | 2,103 (100.0%) |
Commute Time in Wyomissing borough
The most frequently occuring commute durations in Wyomissing borough are 10 to 14 minutes (1,398 commuters, 29.1%), 15 to 19 minutes (764 commuters, 15.9%), and 5 to 9 minutes (760 commuters, 15.8%).
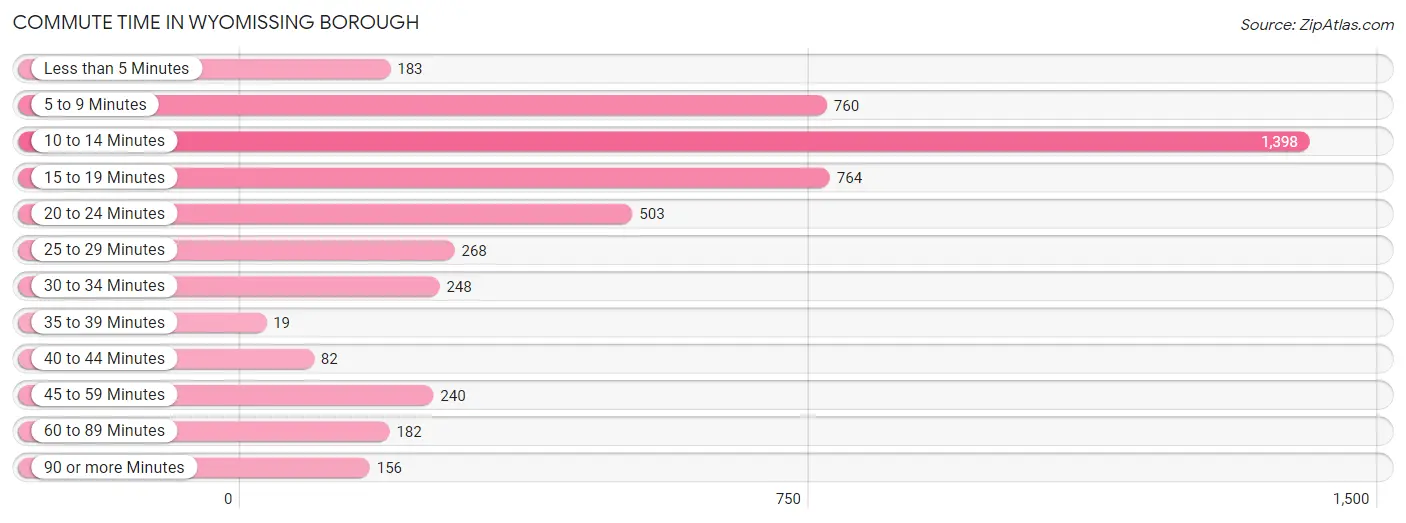
| Commute Time | # Commuters | % Commuters |
| Less than 5 Minutes | 183 | 3.8% |
| 5 to 9 Minutes | 760 | 15.8% |
| 10 to 14 Minutes | 1,398 | 29.1% |
| 15 to 19 Minutes | 764 | 15.9% |
| 20 to 24 Minutes | 503 | 10.5% |
| 25 to 29 Minutes | 268 | 5.6% |
| 30 to 34 Minutes | 248 | 5.2% |
| 35 to 39 Minutes | 19 | 0.4% |
| 40 to 44 Minutes | 82 | 1.7% |
| 45 to 59 Minutes | 240 | 5.0% |
| 60 to 89 Minutes | 182 | 3.8% |
| 90 or more Minutes | 156 | 3.3% |
Commute Time by Sex in Wyomissing borough
The most common commute times in Wyomissing borough are 10 to 14 minutes (837 commuters, 28.9%) for males and 10 to 14 minutes (561 commuters, 29.4%) for females.
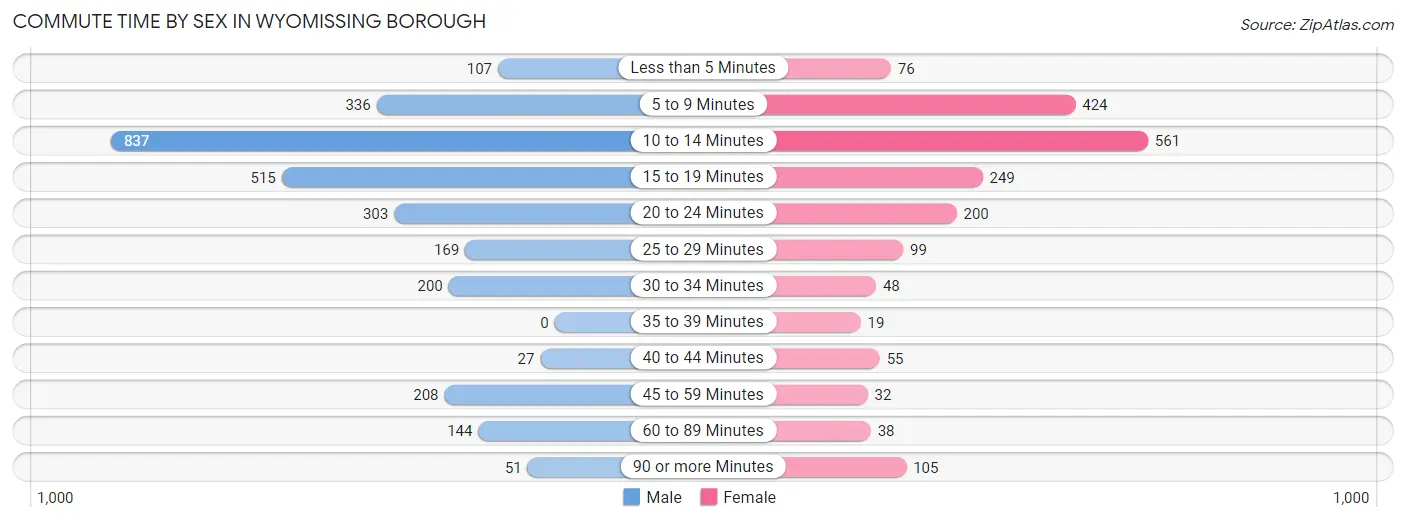
| Commute Time | Male | Female |
| Less than 5 Minutes | 107 (3.7%) | 76 (4.0%) |
| 5 to 9 Minutes | 336 (11.6%) | 424 (22.3%) |
| 10 to 14 Minutes | 837 (28.9%) | 561 (29.4%) |
| 15 to 19 Minutes | 515 (17.8%) | 249 (13.1%) |
| 20 to 24 Minutes | 303 (10.5%) | 200 (10.5%) |
| 25 to 29 Minutes | 169 (5.8%) | 99 (5.2%) |
| 30 to 34 Minutes | 200 (6.9%) | 48 (2.5%) |
| 35 to 39 Minutes | 0 (0.0%) | 19 (1.0%) |
| 40 to 44 Minutes | 27 (0.9%) | 55 (2.9%) |
| 45 to 59 Minutes | 208 (7.2%) | 32 (1.7%) |
| 60 to 89 Minutes | 144 (5.0%) | 38 (2.0%) |
| 90 or more Minutes | 51 (1.8%) | 105 (5.5%) |
Time of Departure to Work by Sex in Wyomissing borough
The most frequent times of departure to work in Wyomissing borough are 7:00 AM to 7:29 AM (641, 22.1%) for males and 7:00 AM to 7:29 AM (442, 23.2%) for females.
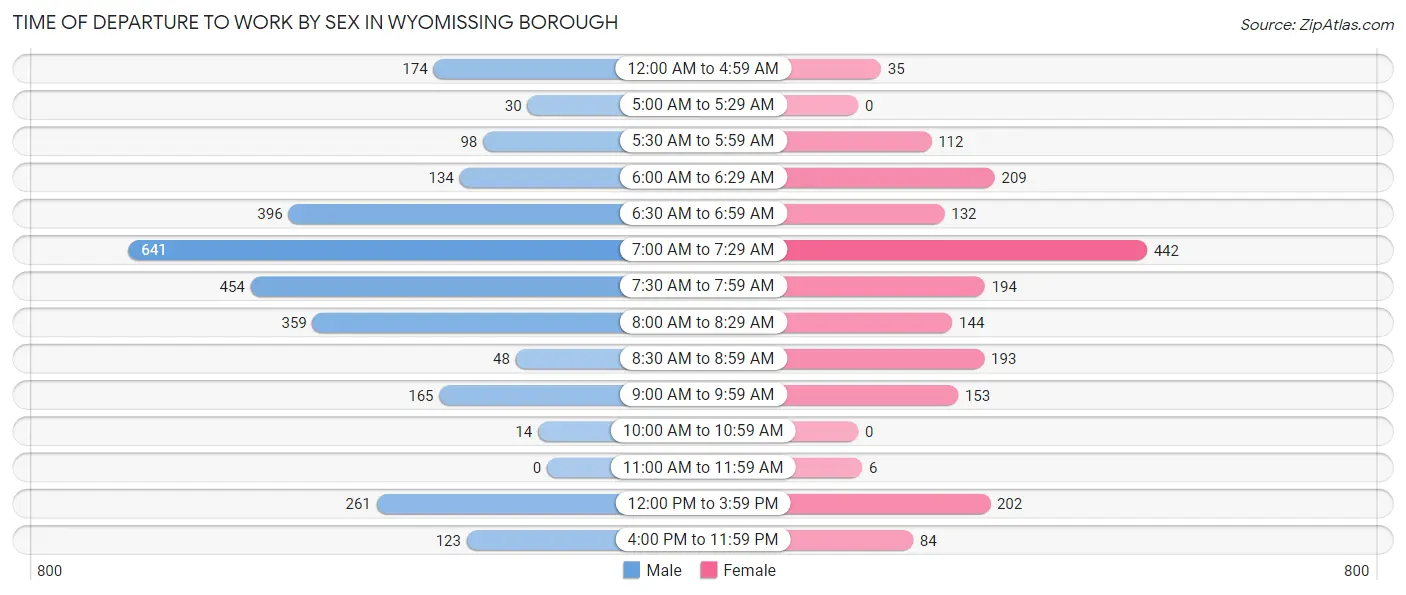
| Time of Departure | Male | Female |
| 12:00 AM to 4:59 AM | 174 (6.0%) | 35 (1.8%) |
| 5:00 AM to 5:29 AM | 30 (1.0%) | 0 (0.0%) |
| 5:30 AM to 5:59 AM | 98 (3.4%) | 112 (5.9%) |
| 6:00 AM to 6:29 AM | 134 (4.6%) | 209 (11.0%) |
| 6:30 AM to 6:59 AM | 396 (13.7%) | 132 (6.9%) |
| 7:00 AM to 7:29 AM | 641 (22.1%) | 442 (23.2%) |
| 7:30 AM to 7:59 AM | 454 (15.7%) | 194 (10.2%) |
| 8:00 AM to 8:29 AM | 359 (12.4%) | 144 (7.6%) |
| 8:30 AM to 8:59 AM | 48 (1.7%) | 193 (10.1%) |
| 9:00 AM to 9:59 AM | 165 (5.7%) | 153 (8.0%) |
| 10:00 AM to 10:59 AM | 14 (0.5%) | 0 (0.0%) |
| 11:00 AM to 11:59 AM | 0 (0.0%) | 6 (0.3%) |
| 12:00 PM to 3:59 PM | 261 (9.0%) | 202 (10.6%) |
| 4:00 PM to 11:59 PM | 123 (4.3%) | 84 (4.4%) |
| Total | 2,897 (100.0%) | 1,906 (100.0%) |
Housing Occupancy in Wyomissing borough
Occupancy by Ownership in Wyomissing borough
Of the total 4,930 dwellings in Wyomissing borough, owner-occupied units account for 3,341 (67.8%), while renter-occupied units make up 1,589 (32.2%).
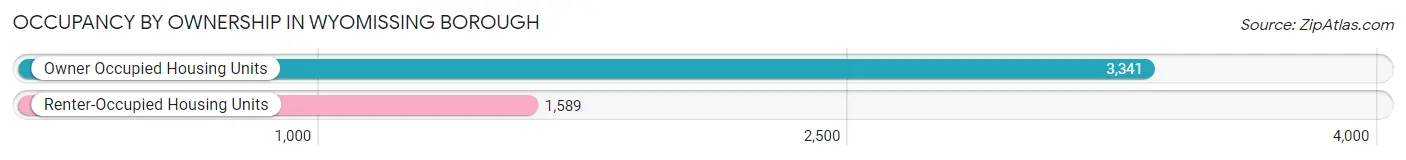
| Occupancy | # Housing Units | % Housing Units |
| Owner Occupied Housing Units | 3,341 | 67.8% |
| Renter-Occupied Housing Units | 1,589 | 32.2% |
| Total Occupied Housing Units | 4,930 | 100.0% |
Occupancy by Household Size in Wyomissing borough
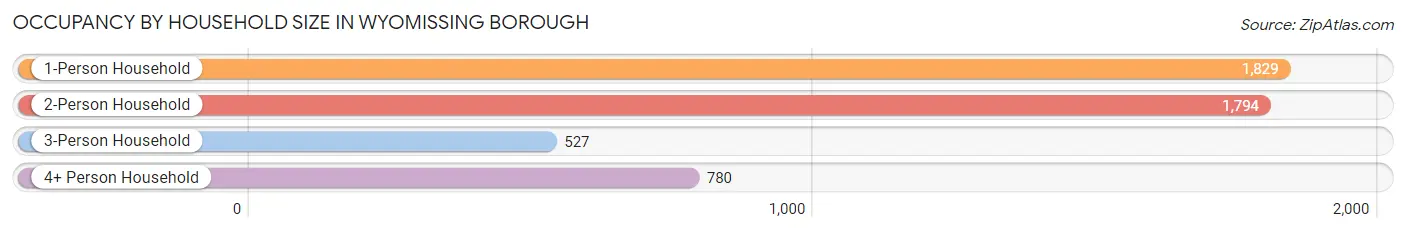
| Household Size | # Housing Units | % Housing Units |
| 1-Person Household | 1,829 | 37.1% |
| 2-Person Household | 1,794 | 36.4% |
| 3-Person Household | 527 | 10.7% |
| 4+ Person Household | 780 | 15.8% |
| Total Housing Units | 4,930 | 100.0% |
Occupancy by Ownership by Household Size in Wyomissing borough
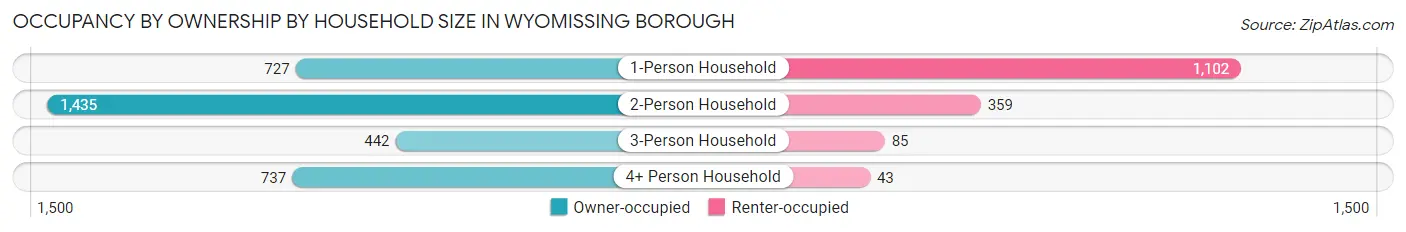
| Household Size | Owner-occupied | Renter-occupied |
| 1-Person Household | 727 (39.8%) | 1,102 (60.3%) |
| 2-Person Household | 1,435 (80.0%) | 359 (20.0%) |
| 3-Person Household | 442 (83.9%) | 85 (16.1%) |
| 4+ Person Household | 737 (94.5%) | 43 (5.5%) |
| Total Housing Units | 3,341 (67.8%) | 1,589 (32.2%) |
Occupancy by Educational Attainment in Wyomissing borough
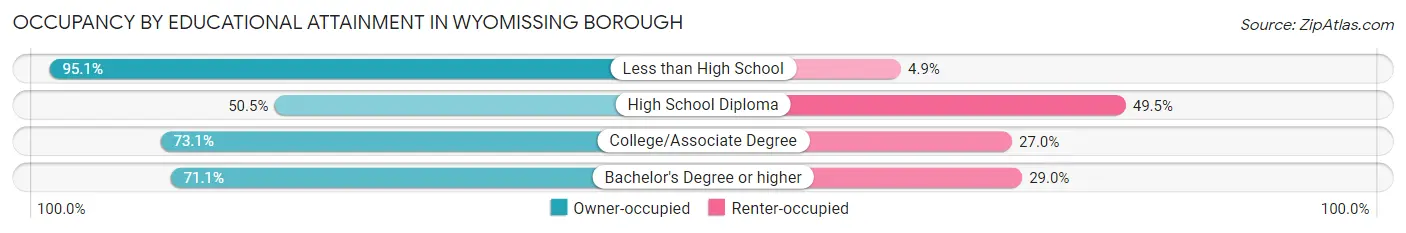
| Household Size | Owner-occupied | Renter-occupied |
| Less than High School | 77 (95.1%) | 4 (4.9%) |
| High School Diploma | 494 (50.5%) | 484 (49.5%) |
| College/Associate Degree | 721 (73.1%) | 266 (27.0%) |
| Bachelor's Degree or higher | 2,049 (71.1%) | 835 (28.9%) |
Occupancy by Age of Householder in Wyomissing borough
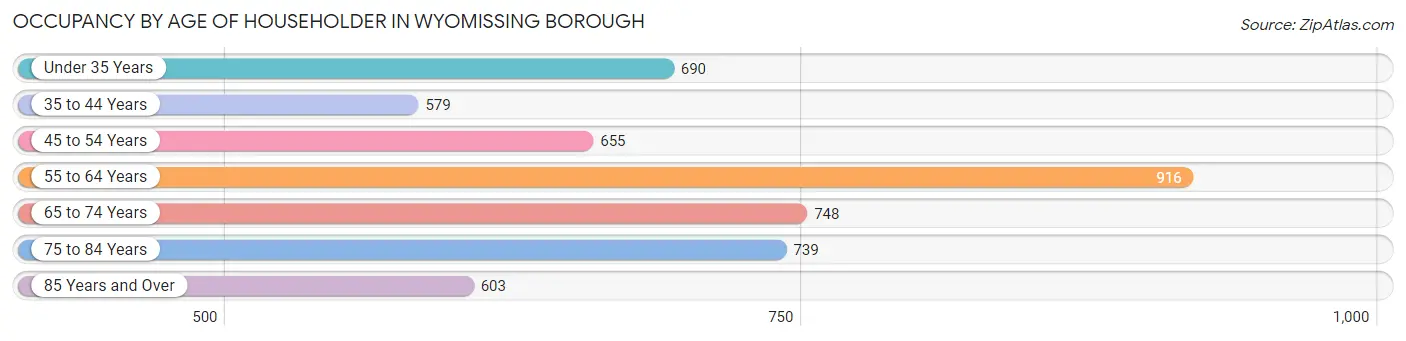
| Age Bracket | # Households | % Households |
| Under 35 Years | 690 | 14.0% |
| 35 to 44 Years | 579 | 11.7% |
| 45 to 54 Years | 655 | 13.3% |
| 55 to 64 Years | 916 | 18.6% |
| 65 to 74 Years | 748 | 15.2% |
| 75 to 84 Years | 739 | 15.0% |
| 85 Years and Over | 603 | 12.2% |
| Total | 4,930 | 100.0% |
Housing Finances in Wyomissing borough
Median Income by Occupancy in Wyomissing borough
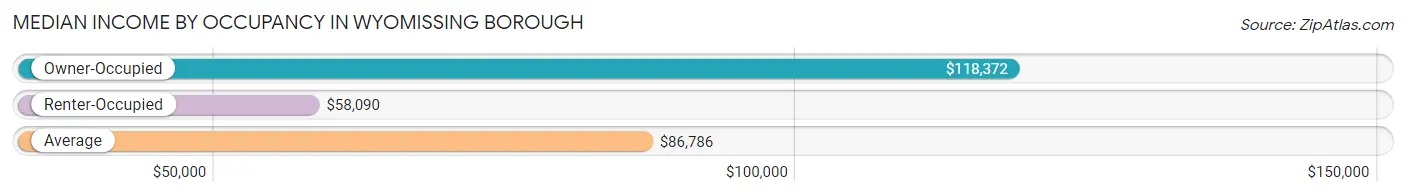
| Occupancy Type | # Households | Median Income |
| Owner-Occupied | 3,341 (67.8%) | $118,372 |
| Renter-Occupied | 1,589 (32.2%) | $58,090 |
| Average | 4,930 (100.0%) | $86,786 |
Occupancy by Householder Income Bracket in Wyomissing borough
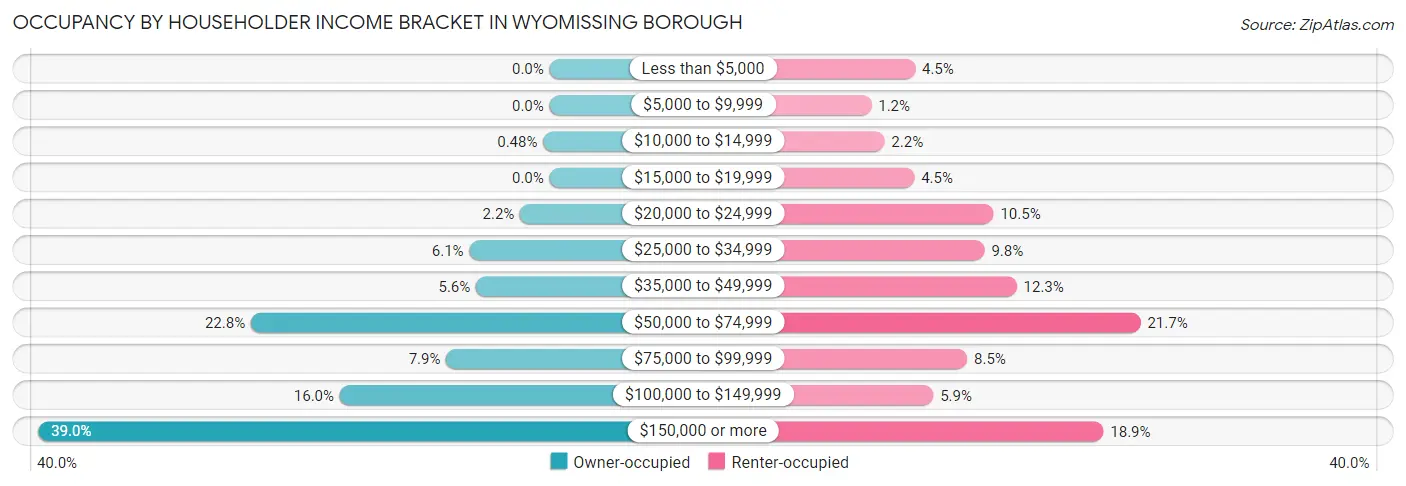
| Income Bracket | Owner-occupied | Renter-occupied |
| Less than $5,000 | 0 (0.0%) | 72 (4.5%) |
| $5,000 to $9,999 | 0 (0.0%) | 19 (1.2%) |
| $10,000 to $14,999 | 16 (0.5%) | 35 (2.2%) |
| $15,000 to $19,999 | 0 (0.0%) | 71 (4.5%) |
| $20,000 to $24,999 | 75 (2.2%) | 167 (10.5%) |
| $25,000 to $34,999 | 204 (6.1%) | 156 (9.8%) |
| $35,000 to $49,999 | 187 (5.6%) | 195 (12.3%) |
| $50,000 to $74,999 | 760 (22.8%) | 345 (21.7%) |
| $75,000 to $99,999 | 263 (7.9%) | 135 (8.5%) |
| $100,000 to $149,999 | 534 (16.0%) | 94 (5.9%) |
| $150,000 or more | 1,302 (39.0%) | 300 (18.9%) |
| Total | 3,341 (100.0%) | 1,589 (100.0%) |
Monthly Housing Cost Tiers in Wyomissing borough
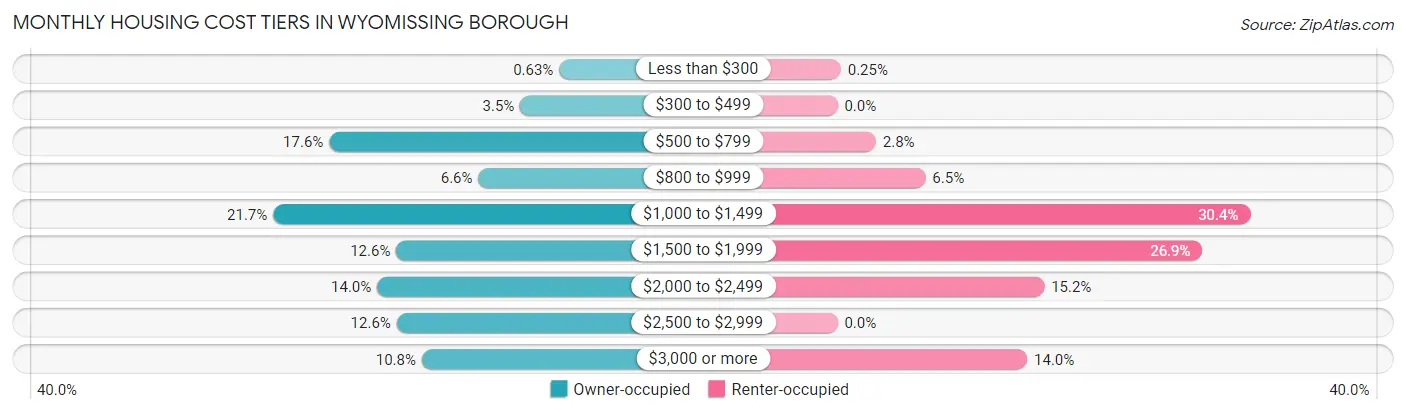
| Monthly Cost | Owner-occupied | Renter-occupied |
| Less than $300 | 21 (0.6%) | 4 (0.3%) |
| $300 to $499 | 117 (3.5%) | 0 (0.0%) |
| $500 to $799 | 587 (17.6%) | 45 (2.8%) |
| $800 to $999 | 220 (6.6%) | 103 (6.5%) |
| $1,000 to $1,499 | 725 (21.7%) | 483 (30.4%) |
| $1,500 to $1,999 | 422 (12.6%) | 427 (26.9%) |
| $2,000 to $2,499 | 469 (14.0%) | 242 (15.2%) |
| $2,500 to $2,999 | 421 (12.6%) | 0 (0.0%) |
| $3,000 or more | 359 (10.7%) | 222 (14.0%) |
| Total | 3,341 (100.0%) | 1,589 (100.0%) |
Physical Housing Characteristics in Wyomissing borough
Housing Structures in Wyomissing borough
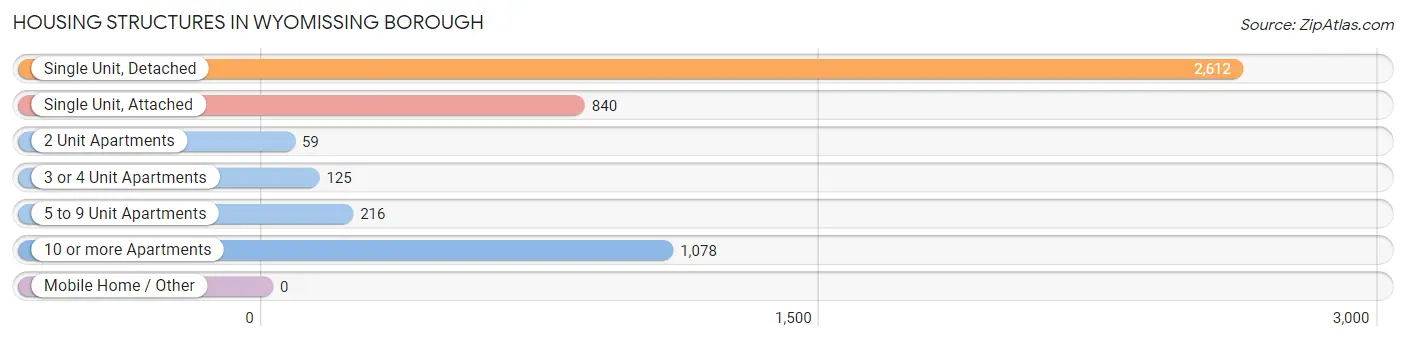
| Structure Type | # Housing Units | % Housing Units |
| Single Unit, Detached | 2,612 | 53.0% |
| Single Unit, Attached | 840 | 17.0% |
| 2 Unit Apartments | 59 | 1.2% |
| 3 or 4 Unit Apartments | 125 | 2.5% |
| 5 to 9 Unit Apartments | 216 | 4.4% |
| 10 or more Apartments | 1,078 | 21.9% |
| Mobile Home / Other | 0 | 0.0% |
| Total | 4,930 | 100.0% |
Housing Structures by Occupancy in Wyomissing borough
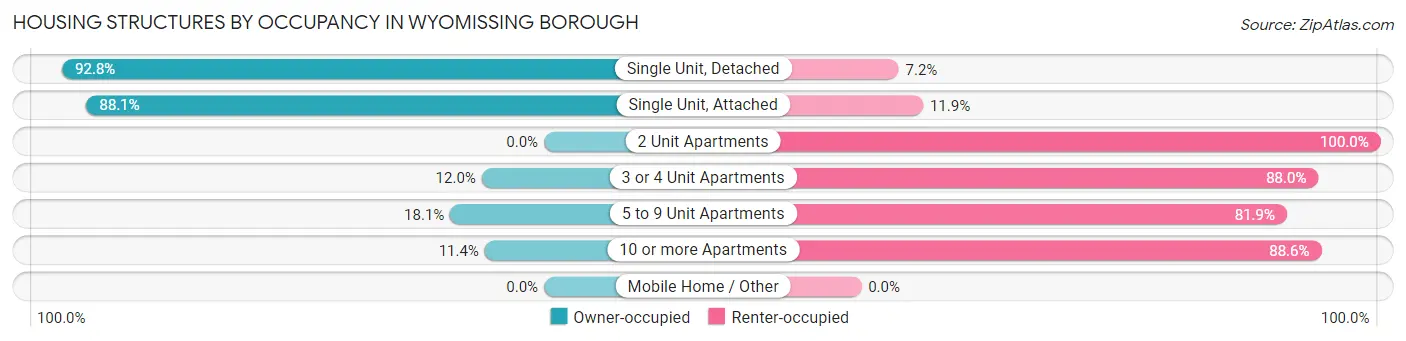
| Structure Type | Owner-occupied | Renter-occupied |
| Single Unit, Detached | 2,424 (92.8%) | 188 (7.2%) |
| Single Unit, Attached | 740 (88.1%) | 100 (11.9%) |
| 2 Unit Apartments | 0 (0.0%) | 59 (100.0%) |
| 3 or 4 Unit Apartments | 15 (12.0%) | 110 (88.0%) |
| 5 to 9 Unit Apartments | 39 (18.1%) | 177 (81.9%) |
| 10 or more Apartments | 123 (11.4%) | 955 (88.6%) |
| Mobile Home / Other | 0 (0.0%) | 0 (0.0%) |
| Total | 3,341 (67.8%) | 1,589 (32.2%) |
Housing Structures by Number of Rooms in Wyomissing borough
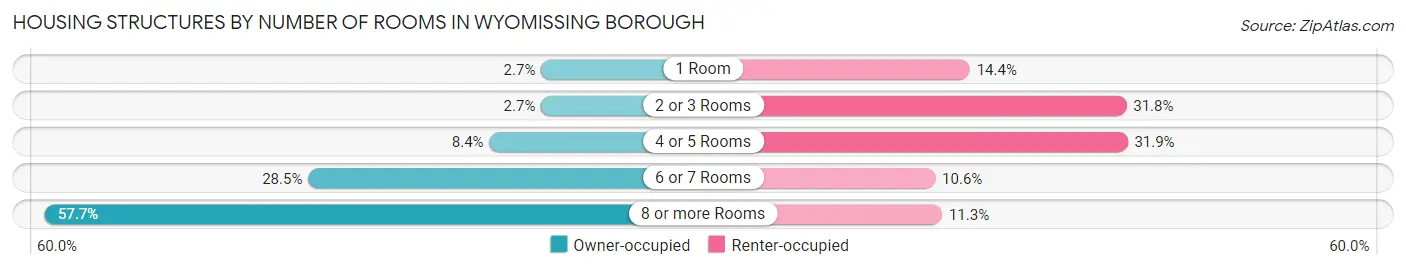
| Number of Rooms | Owner-occupied | Renter-occupied |
| 1 Room | 89 (2.7%) | 229 (14.4%) |
| 2 or 3 Rooms | 89 (2.7%) | 505 (31.8%) |
| 4 or 5 Rooms | 281 (8.4%) | 507 (31.9%) |
| 6 or 7 Rooms | 953 (28.5%) | 168 (10.6%) |
| 8 or more Rooms | 1,929 (57.7%) | 180 (11.3%) |
| Total | 3,341 (100.0%) | 1,589 (100.0%) |
Housing Structure by Heating Type in Wyomissing borough
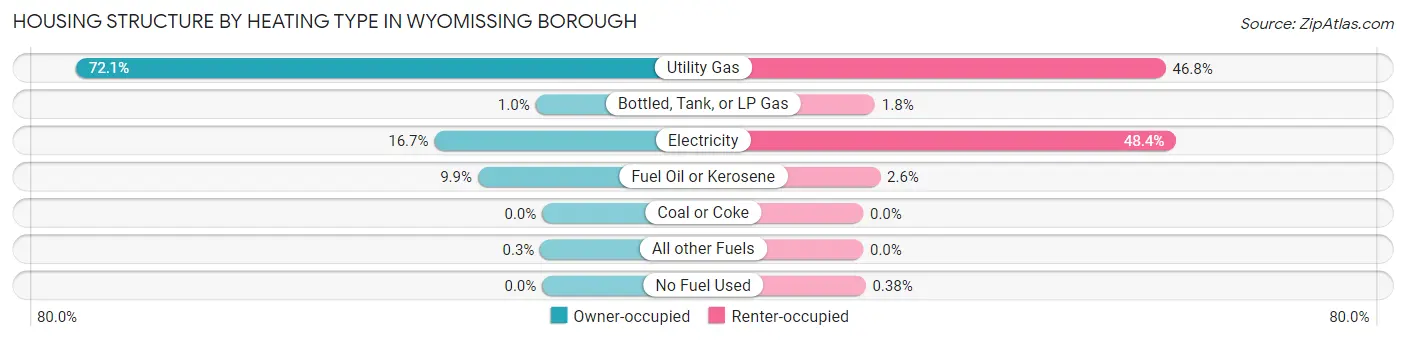
| Heating Type | Owner-occupied | Renter-occupied |
| Utility Gas | 2,408 (72.1%) | 743 (46.8%) |
| Bottled, Tank, or LP Gas | 34 (1.0%) | 29 (1.8%) |
| Electricity | 557 (16.7%) | 769 (48.4%) |
| Fuel Oil or Kerosene | 332 (9.9%) | 42 (2.6%) |
| Coal or Coke | 0 (0.0%) | 0 (0.0%) |
| All other Fuels | 10 (0.3%) | 0 (0.0%) |
| No Fuel Used | 0 (0.0%) | 6 (0.4%) |
| Total | 3,341 (100.0%) | 1,589 (100.0%) |
Household Vehicle Usage in Wyomissing borough
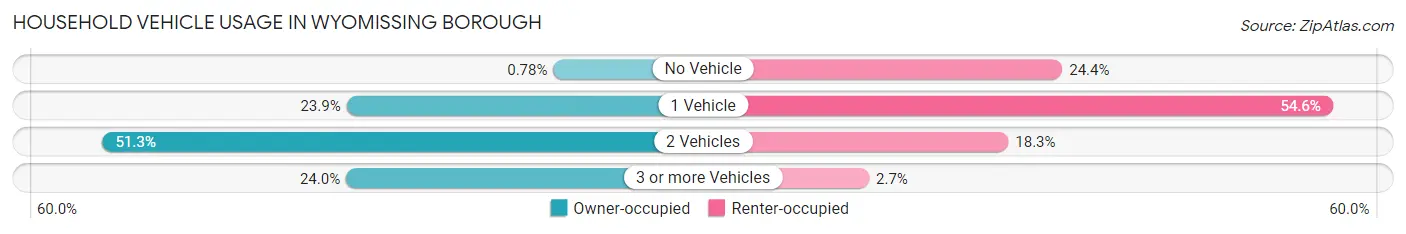
| Vehicles per Household | Owner-occupied | Renter-occupied |
| No Vehicle | 26 (0.8%) | 387 (24.3%) |
| 1 Vehicle | 800 (23.9%) | 868 (54.6%) |
| 2 Vehicles | 1,713 (51.3%) | 291 (18.3%) |
| 3 or more Vehicles | 802 (24.0%) | 43 (2.7%) |
| Total | 3,341 (100.0%) | 1,589 (100.0%) |
Real Estate & Mortgages in Wyomissing borough
Real Estate and Mortgage Overview in Wyomissing borough
| Characteristic | Without Mortgage | With Mortgage |
| Housing Units | 1,475 | 1,866 |
| Median Property Value | $293,900 | $321,900 |
| Median Household Income | $69,832 | $879 |
| Monthly Housing Costs | $896 | $340 |
| Real Estate Taxes | $5,819 | $0 |
Property Value by Mortgage Status in Wyomissing borough
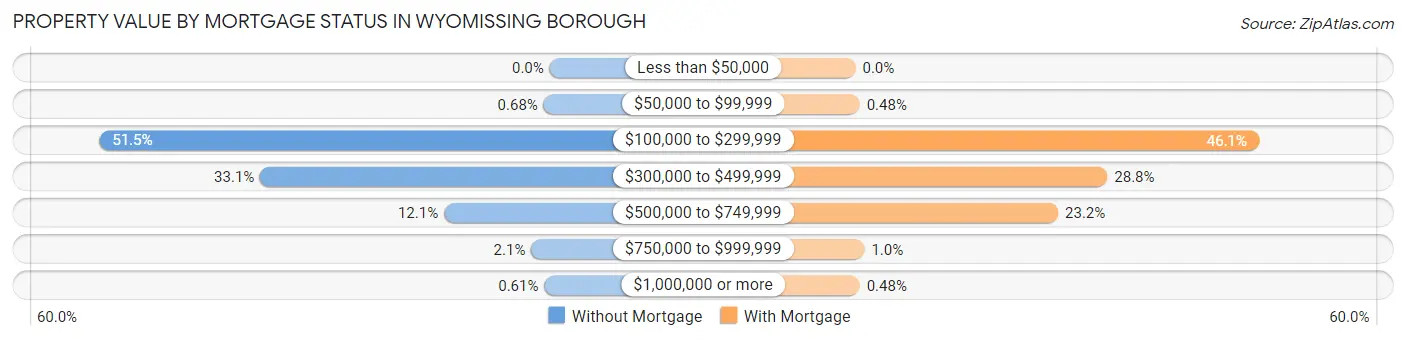
| Property Value | Without Mortgage | With Mortgage |
| Less than $50,000 | 0 (0.0%) | 0 (0.0%) |
| $50,000 to $99,999 | 10 (0.7%) | 9 (0.5%) |
| $100,000 to $299,999 | 759 (51.5%) | 860 (46.1%) |
| $300,000 to $499,999 | 488 (33.1%) | 537 (28.8%) |
| $500,000 to $749,999 | 178 (12.1%) | 432 (23.2%) |
| $750,000 to $999,999 | 31 (2.1%) | 19 (1.0%) |
| $1,000,000 or more | 9 (0.6%) | 9 (0.5%) |
| Total | 1,475 (100.0%) | 1,866 (100.0%) |
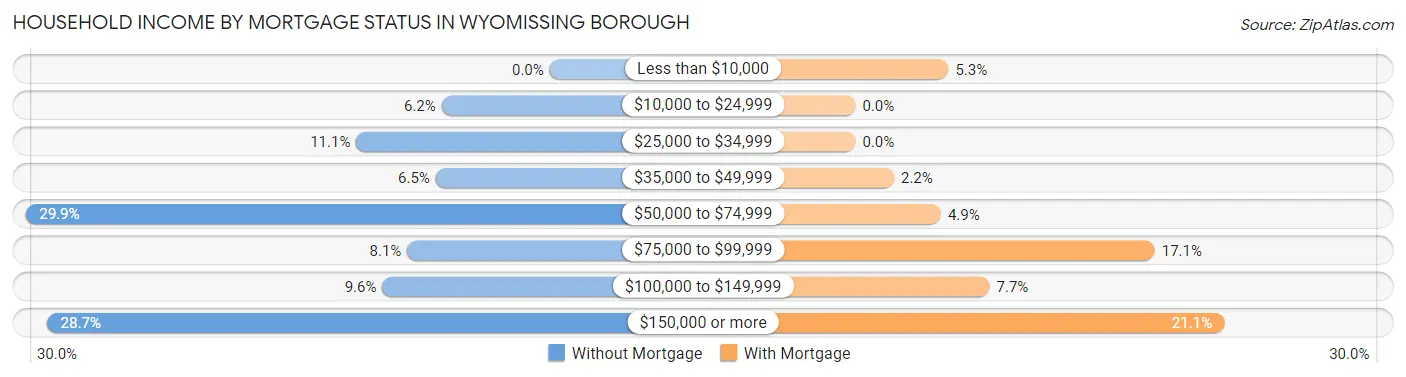
Household Income by Mortgage Status in Wyomissing borough
| Household Income | Without Mortgage | With Mortgage |
| Less than $10,000 | 0 (0.0%) | 99 (5.3%) |
| $10,000 to $24,999 | 91 (6.2%) | 0 (0.0%) |
| $25,000 to $34,999 | 163 (11.1%) | 0 (0.0%) |
| $35,000 to $49,999 | 96 (6.5%) | 41 (2.2%) |
| $50,000 to $74,999 | 441 (29.9%) | 91 (4.9%) |
| $75,000 to $99,999 | 120 (8.1%) | 319 (17.1%) |
| $100,000 to $149,999 | 141 (9.6%) | 143 (7.7%) |
| $150,000 or more | 423 (28.7%) | 393 (21.1%) |
| Total | 1,475 (100.0%) | 1,866 (100.0%) |
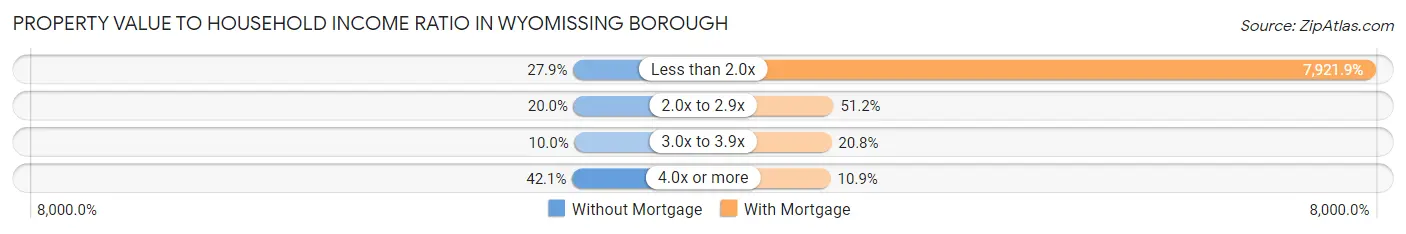
Property Value to Household Income Ratio in Wyomissing borough
| Value-to-Income Ratio | Without Mortgage | With Mortgage |
| Less than 2.0x | 411 (27.9%) | 147,823 (7,921.9%) |
| 2.0x to 2.9x | 295 (20.0%) | 955 (51.2%) |
| 3.0x to 3.9x | 148 (10.0%) | 388 (20.8%) |
| 4.0x or more | 621 (42.1%) | 203 (10.9%) |
| Total | 1,475 (100.0%) | 1,866 (100.0%) |
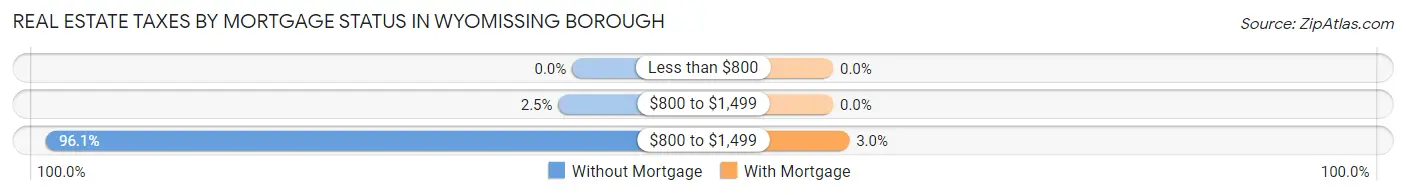
Real Estate Taxes by Mortgage Status in Wyomissing borough
| Property Taxes | Without Mortgage | With Mortgage |
| Less than $800 | 0 (0.0%) | 0 (0.0%) |
| $800 to $1,499 | 37 (2.5%) | 0 (0.0%) |
| $800 to $1,499 | 1,417 (96.1%) | 55 (2.9%) |
| Total | 1,475 (100.0%) | 1,866 (100.0%) |
Health & Disability in Wyomissing borough
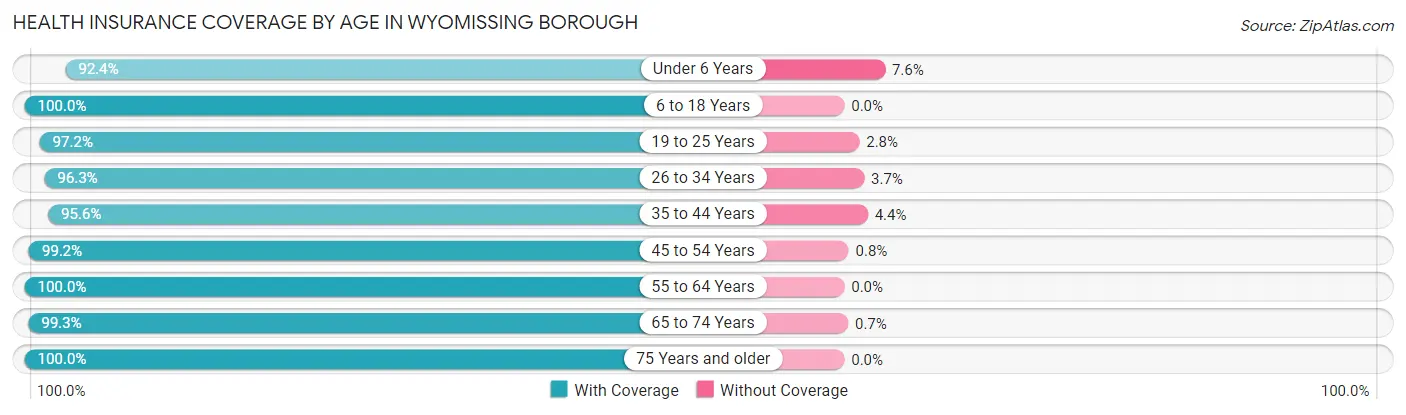
Health Insurance Coverage by Age in Wyomissing borough
| Age Bracket | With Coverage | Without Coverage |
| Under 6 Years | 365 (92.4%) | 30 (7.6%) |
| 6 to 18 Years | 1,512 (100.0%) | 0 (0.0%) |
| 19 to 25 Years | 696 (97.2%) | 20 (2.8%) |
| 26 to 34 Years | 1,145 (96.3%) | 44 (3.7%) |
| 35 to 44 Years | 1,051 (95.6%) | 48 (4.4%) |
| 45 to 54 Years | 1,246 (99.2%) | 10 (0.8%) |
| 55 to 64 Years | 1,622 (100.0%) | 0 (0.0%) |
| 65 to 74 Years | 1,280 (99.3%) | 9 (0.7%) |
| 75 Years and older | 1,847 (100.0%) | 0 (0.0%) |
| Total | 10,764 (98.5%) | 161 (1.5%) |
Health Insurance Coverage by Citizenship Status in Wyomissing borough
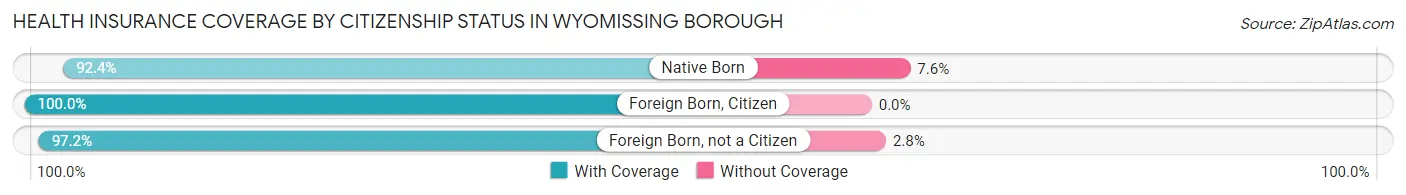
| Citizenship Status | With Coverage | Without Coverage |
| Native Born | 365 (92.4%) | 30 (7.6%) |
| Foreign Born, Citizen | 1,512 (100.0%) | 0 (0.0%) |
| Foreign Born, not a Citizen | 696 (97.2%) | 20 (2.8%) |
Health Insurance Coverage by Household Income in Wyomissing borough
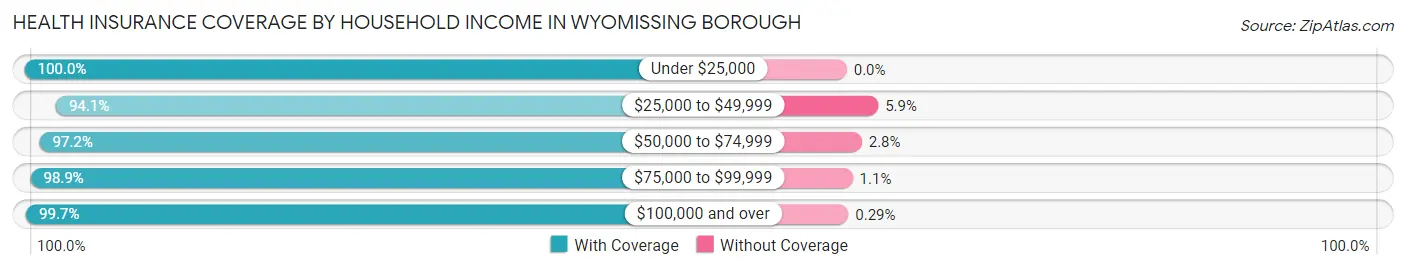
| Household Income | With Coverage | Without Coverage |
| Under $25,000 | 484 (100.0%) | 0 (0.0%) |
| $25,000 to $49,999 | 1,183 (94.1%) | 74 (5.9%) |
| $50,000 to $74,999 | 2,076 (97.2%) | 60 (2.8%) |
| $75,000 to $99,999 | 809 (98.9%) | 9 (1.1%) |
| $100,000 and over | 6,099 (99.7%) | 18 (0.3%) |
Public vs Private Health Insurance Coverage by Age in Wyomissing borough
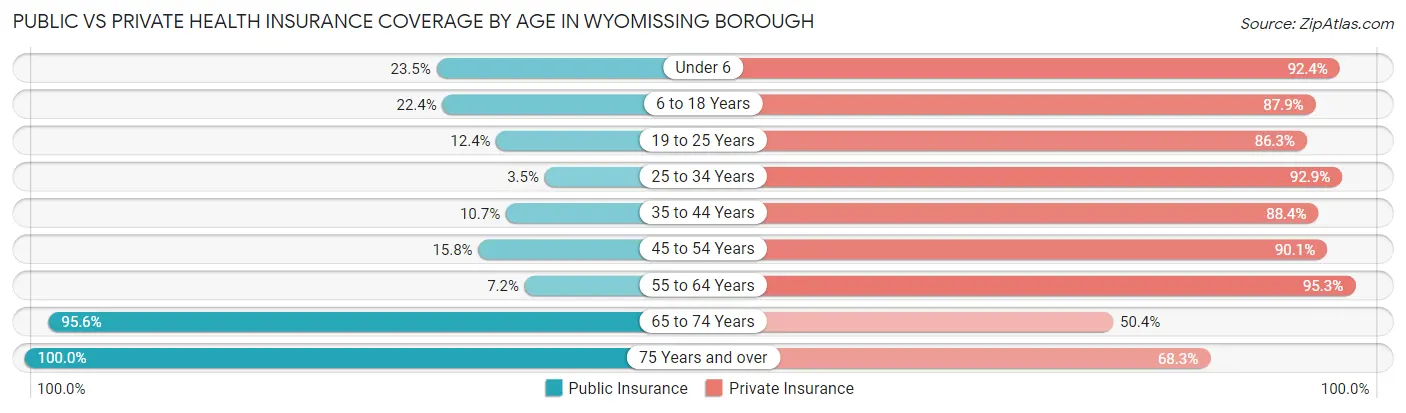
| Age Bracket | Public Insurance | Private Insurance |
| Under 6 | 93 (23.5%) | 365 (92.4%) |
| 6 to 18 Years | 339 (22.4%) | 1,329 (87.9%) |
| 19 to 25 Years | 89 (12.4%) | 618 (86.3%) |
| 25 to 34 Years | 41 (3.5%) | 1,104 (92.8%) |
| 35 to 44 Years | 117 (10.6%) | 972 (88.4%) |
| 45 to 54 Years | 198 (15.8%) | 1,131 (90.0%) |
| 55 to 64 Years | 116 (7.1%) | 1,545 (95.3%) |
| 65 to 74 Years | 1,232 (95.6%) | 649 (50.3%) |
| 75 Years and over | 1,847 (100.0%) | 1,262 (68.3%) |
| Total | 4,072 (37.3%) | 8,975 (82.2%) |
Disability Status by Sex by Age in Wyomissing borough
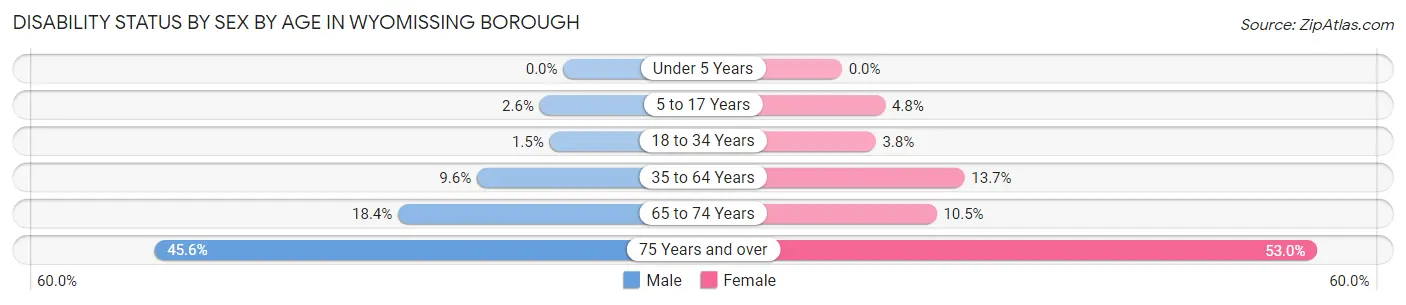
| Age Bracket | Male | Female |
| Under 5 Years | 0 (0.0%) | 0 (0.0%) |
| 5 to 17 Years | 16 (2.6%) | 39 (4.8%) |
| 18 to 34 Years | 17 (1.5%) | 34 (3.7%) |
| 35 to 64 Years | 205 (9.6%) | 252 (13.7%) |
| 65 to 74 Years | 115 (18.4%) | 70 (10.5%) |
| 75 Years and over | 308 (45.6%) | 620 (52.9%) |
Disability Class by Sex by Age in Wyomissing borough
Disability Class: Hearing Difficulty
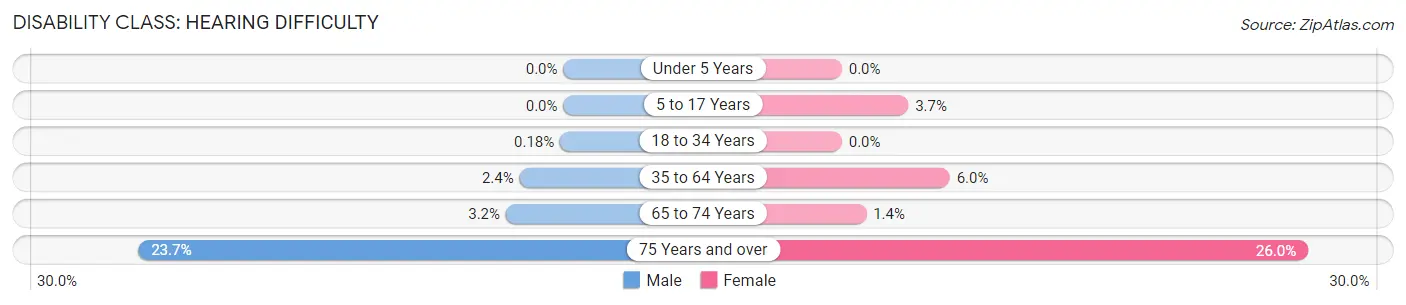
| Age Bracket | Male | Female |
| Under 5 Years | 0 (0.0%) | 0 (0.0%) |
| 5 to 17 Years | 0 (0.0%) | 30 (3.7%) |
| 18 to 34 Years | 2 (0.2%) | 0 (0.0%) |
| 35 to 64 Years | 52 (2.4%) | 111 (6.0%) |
| 65 to 74 Years | 20 (3.2%) | 9 (1.4%) |
| 75 Years and over | 160 (23.7%) | 304 (26.0%) |
Disability Class: Vision Difficulty
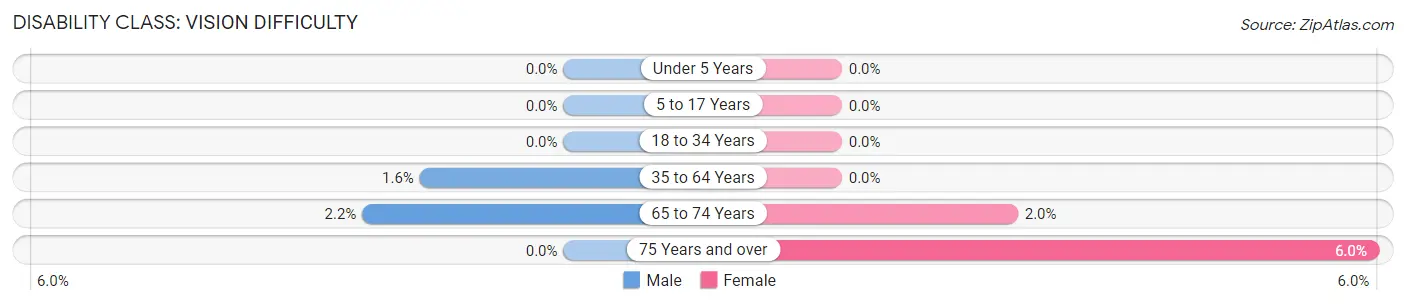
| Age Bracket | Male | Female |
| Under 5 Years | 0 (0.0%) | 0 (0.0%) |
| 5 to 17 Years | 0 (0.0%) | 0 (0.0%) |
| 18 to 34 Years | 0 (0.0%) | 0 (0.0%) |
| 35 to 64 Years | 34 (1.6%) | 0 (0.0%) |
| 65 to 74 Years | 14 (2.2%) | 13 (2.0%) |
| 75 Years and over | 0 (0.0%) | 70 (6.0%) |
Disability Class: Cognitive Difficulty
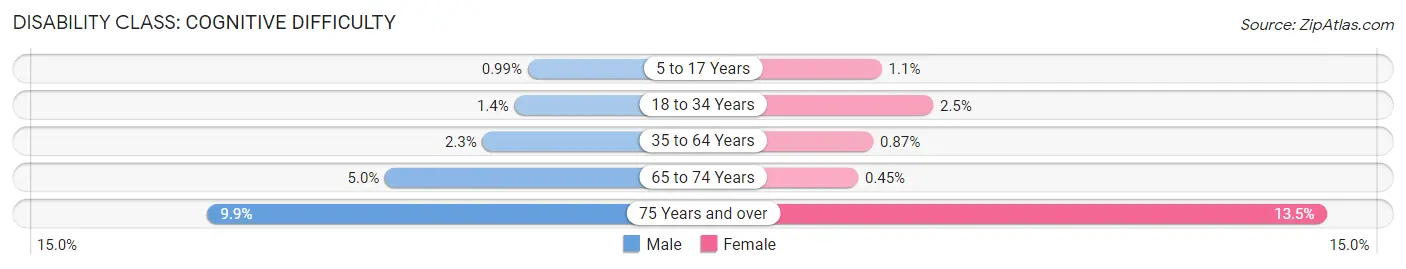
| Age Bracket | Male | Female |
| 5 to 17 Years | 6 (1.0%) | 9 (1.1%) |
| 18 to 34 Years | 15 (1.4%) | 23 (2.5%) |
| 35 to 64 Years | 48 (2.2%) | 16 (0.9%) |
| 65 to 74 Years | 31 (5.0%) | 3 (0.4%) |
| 75 Years and over | 67 (9.9%) | 158 (13.5%) |
Disability Class: Ambulatory Difficulty
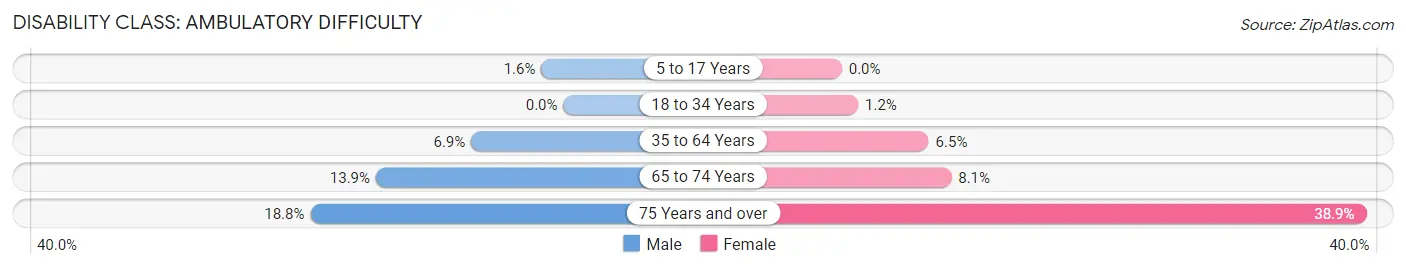
| Age Bracket | Male | Female |
| 5 to 17 Years | 10 (1.6%) | 0 (0.0%) |
| 18 to 34 Years | 0 (0.0%) | 11 (1.2%) |
| 35 to 64 Years | 146 (6.9%) | 119 (6.5%) |
| 65 to 74 Years | 87 (13.9%) | 54 (8.1%) |
| 75 Years and over | 127 (18.8%) | 456 (38.9%) |
Disability Class: Self-Care Difficulty
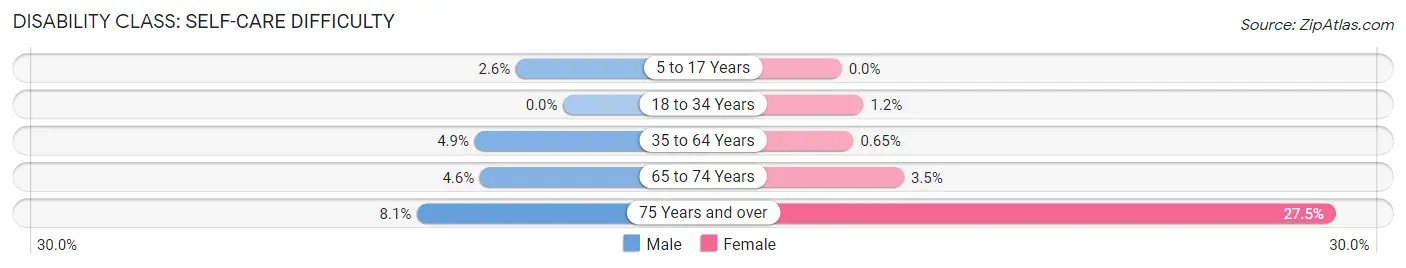
| Age Bracket | Male | Female |
| 5 to 17 Years | 16 (2.6%) | 0 (0.0%) |
| 18 to 34 Years | 0 (0.0%) | 11 (1.2%) |
| 35 to 64 Years | 105 (4.9%) | 12 (0.6%) |
| 65 to 74 Years | 29 (4.6%) | 23 (3.5%) |
| 75 Years and over | 55 (8.1%) | 322 (27.5%) |
Technology Access in Wyomissing borough
Computing Device Access in Wyomissing borough
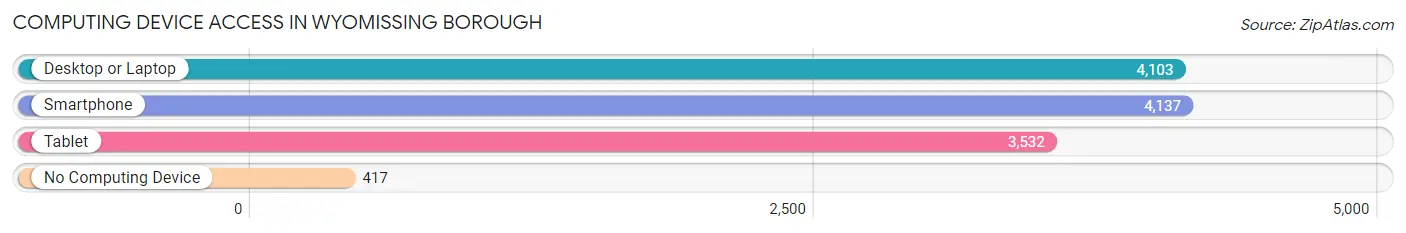
| Device Type | # Households | % Households |
| Desktop or Laptop | 4,103 | 83.2% |
| Smartphone | 4,137 | 83.9% |
| Tablet | 3,532 | 71.6% |
| No Computing Device | 417 | 8.5% |
| Total | 4,930 | 100.0% |
Internet Access in Wyomissing borough
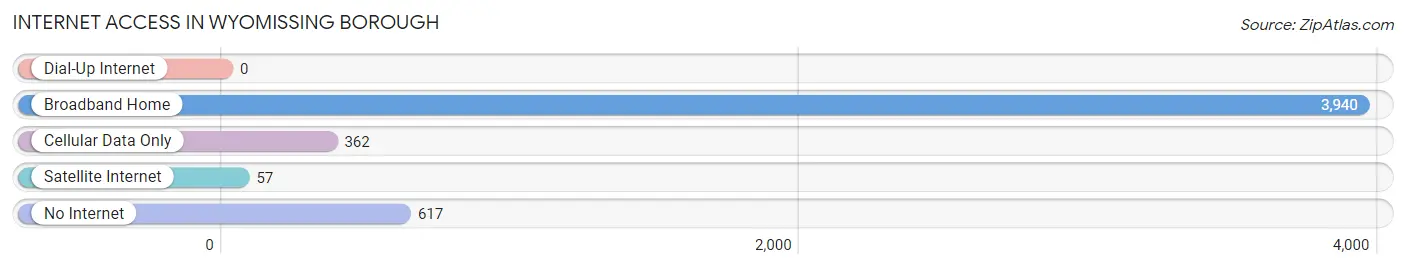
| Internet Type | # Households | % Households |
| Dial-Up Internet | 0 | 0.0% |
| Broadband Home | 3,940 | 79.9% |
| Cellular Data Only | 362 | 7.3% |
| Satellite Internet | 57 | 1.2% |
| No Internet | 617 | 12.5% |
| Total | 4,930 | 100.0% |
Wyomissing borough Summary
Wyomissing Borough is a small borough located in Berks County, Pennsylvania. It is situated in the southeastern part of the state, approximately 10 miles west of Reading, the county seat. The borough is bordered by the City of Reading to the east, West Reading to the south, and the Borough of West Lawn to the west. Wyomissing Borough is part of the Greater Reading Metropolitan Statistical Area.
History
Wyomissing Borough was founded in 1906 by the Reading Company, a railroad company that had been operating in the area since the mid-1800s. The Reading Company wanted to create a residential community for its employees, and chose the area now known as Wyomissing Borough for its location. The borough was named after the Wyomissing Creek, which runs through the area.
The Reading Company built a number of homes in the area, as well as a school, a library, and a park. The company also built a trolley line that connected the borough to Reading. The trolley line was eventually replaced by a bus line, which is still in operation today.
In the early 1900s, the borough was home to a number of factories, including a silk mill, a paper mill, and a brickyard. These factories provided employment for many of the borough’s residents.
Geography
Wyomissing Borough is located in southeastern Pennsylvania, approximately 10 miles west of Reading. The borough is situated in the Schuylkill River Valley, and is bordered by the City of Reading to the east, West Reading to the south, and the Borough of West Lawn to the west.
The borough covers an area of 1.3 square miles, and is home to a population of approximately 10,000 people. The terrain of the borough is mostly flat, with some rolling hills in the northern part of the borough.
Economy
The economy of Wyomissing Borough is largely based on the service industry. The borough is home to a number of restaurants, retail stores, and other businesses that provide services to the local community.
The borough is also home to a number of manufacturing companies, including a paper mill, a printing company, and a plastics manufacturer. These companies provide employment for many of the borough’s residents.
Demographics
As of the 2010 census, the population of Wyomissing Borough was 10,072. The racial makeup of the borough was 90.2% White, 4.2% African American, 0.3% Native American, 2.2% Asian, and 2.9% from other races. Hispanic or Latino of any race were 4.3% of the population.
The median household income in the borough was $60,945, and the median family income was $71,945. The per capita income was $30,945. About 4.2% of families and 5.3% of the population were below the poverty line.
The population of Wyomissing Borough is well-educated, with 92.2% of the population over the age of 25 having a high school diploma or higher, and 44.2% having a bachelor’s degree or higher. The borough is also home to a number of colleges and universities, including Alvernia University, Albright College, and Reading Area Community College.
Common Questions
What is Per Capita Income in Wyomissing borough?
Per Capita income in Wyomissing borough is $65,321.
What is the Median Family Income in Wyomissing borough?
Median Family Income in Wyomissing borough is $149,123.
What is the Median Household income in Wyomissing borough?
Median Household Income in Wyomissing borough is $86,786.
What is Income or Wage Gap in Wyomissing borough?
Income or Wage Gap in Wyomissing borough is 34.9%.
Women in Wyomissing borough earn 65.1 cents for every dollar earned by a man.
What is Inequality or Gini Index in Wyomissing borough?
Inequality or Gini Index in Wyomissing borough is 0.50.
What is the Total Population of Wyomissing borough?
Total Population of Wyomissing borough is 11,067.
What is the Total Male Population of Wyomissing borough?
Total Male Population of Wyomissing borough is 5,425.
What is the Total Female Population of Wyomissing borough?
Total Female Population of Wyomissing borough is 5,642.
What is the Ratio of Males per 100 Females in Wyomissing borough?
There are 96.15 Males per 100 Females in Wyomissing borough.
What is the Ratio of Females per 100 Males in Wyomissing borough?
There are 104.00 Females per 100 Males in Wyomissing borough.
What is the Median Population Age in Wyomissing borough?
Median Population Age in Wyomissing borough is 49.7 Years.
What is the Average Family Size in Wyomissing borough
Average Family Size in Wyomissing borough is 2.9 People.
What is the Average Household Size in Wyomissing borough
Average Household Size in Wyomissing borough is 2.2 People.
How Large is the Labor Force in Wyomissing borough?
There are 5,699 People in the Labor Forcein in Wyomissing borough.
What is the Percentage of People in the Labor Force in Wyomissing borough?
60.3% of People are in the Labor Force in Wyomissing borough.
What is the Unemployment Rate in Wyomissing borough?
Unemployment Rate in Wyomissing borough is 3.6%.