Flemington borough, PA Map & Demographics
Flemington borough Overview
$27,195
PER CAPITA INCOME
$57,969
AVG FAMILY INCOME
$47,600
AVG HOUSEHOLD INCOME
9.4%
WAGE / INCOME GAP [ % ]
90.6¢/ $1
WAGE / INCOME GAP [ $ ]
0.40
INEQUALITY / GINI INDEX
1,265
TOTAL POPULATION
591
MALE POPULATION
674
FEMALE POPULATION
87.69
MALES / 100 FEMALES
114.04
FEMALES / 100 MALES
40.0
MEDIAN AGE
2.9
AVG FAMILY SIZE
2.2
AVG HOUSEHOLD SIZE
623
LABOR FORCE [ PEOPLE ]
57.8%
PERCENT IN LABOR FORCE
5.6%
UNEMPLOYMENT RATE
Income in Flemington borough
Income Overview in Flemington borough
Per Capita Income in Flemington borough is $27,195, while median incomes of families and households are $57,969 and $47,600 respectively.
| Characteristic | Number | Measure |
| Per Capita Income | 1,265 | $27,195 |
| Median Family Income | 306 | $57,969 |
| Mean Family Income | 306 | $72,135 |
| Median Household Income | 576 | $47,600 |
| Mean Household Income | 576 | $58,176 |
| Income Deficit | 306 | $0 |
| Wage / Income Gap (%) | 1,265 | 9.35% |
| Wage / Income Gap ($) | 1,265 | 90.65¢ per $1 |
| Gini / Inequality Index | 1,265 | 0.40 |
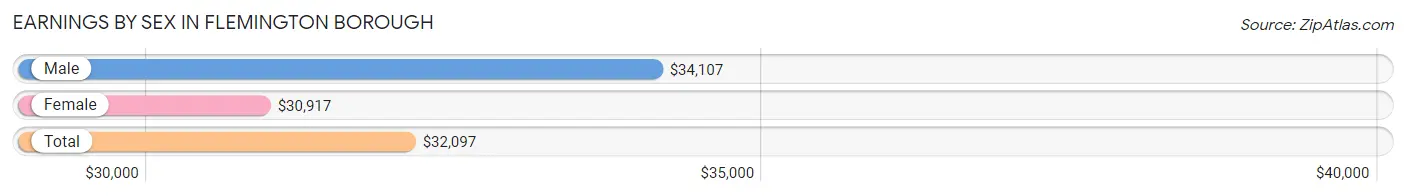
Earnings by Sex in Flemington borough
Average Earnings in Flemington borough are $32,097, $34,107 for men and $30,917 for women, a difference of 9.3%.
| Sex | Number | Average Earnings |
| Male | 342 (53.4%) | $34,107 |
| Female | 298 (46.6%) | $30,917 |
| Total | 640 (100.0%) | $32,097 |
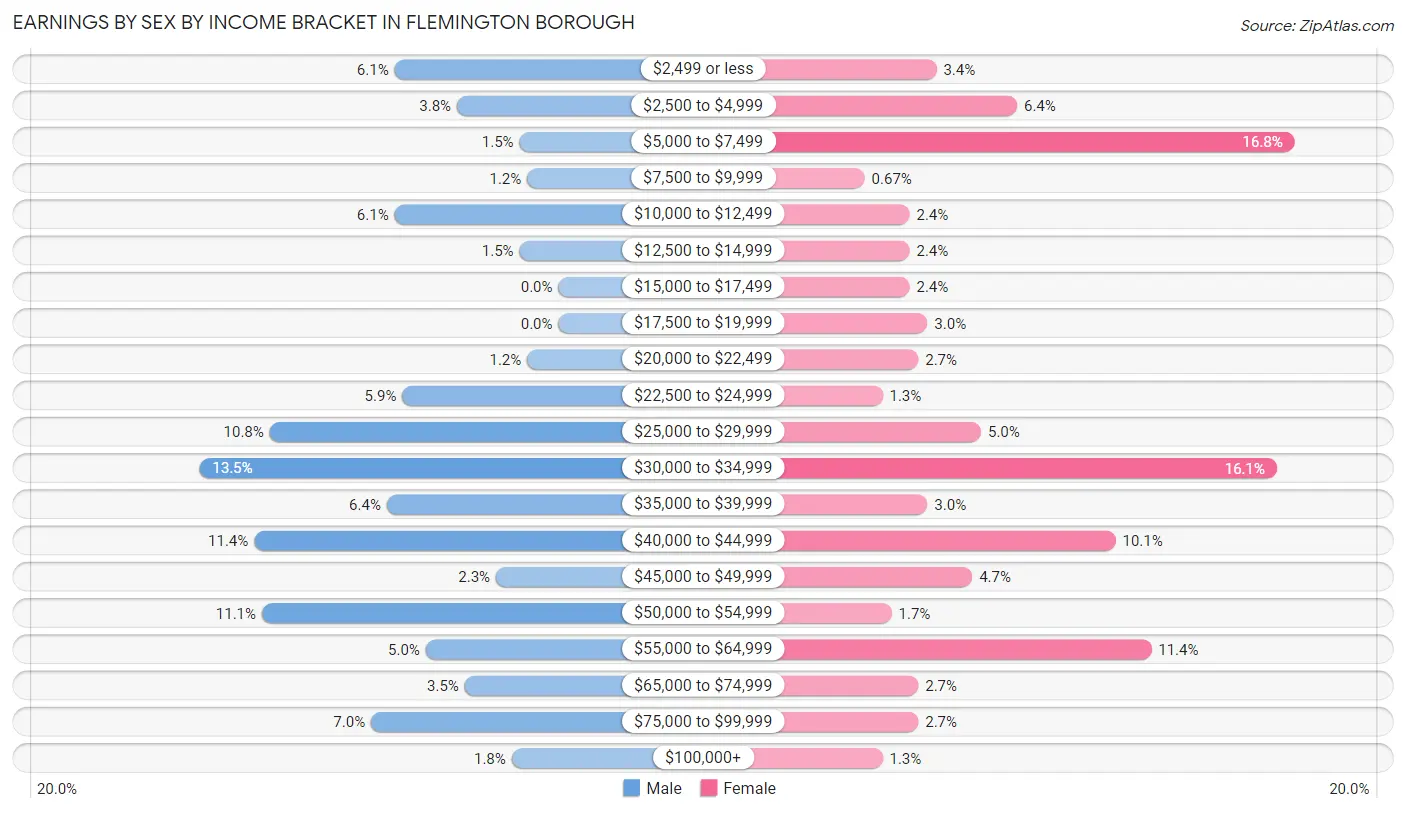
Earnings by Sex by Income Bracket in Flemington borough
The most common earnings brackets in Flemington borough are $30,000 to $34,999 for men (46 | 13.5%) and $5,000 to $7,499 for women (50 | 16.8%).
| Income | Male | Female |
| $2,499 or less | 21 (6.1%) | 10 (3.4%) |
| $2,500 to $4,999 | 13 (3.8%) | 19 (6.4%) |
| $5,000 to $7,499 | 5 (1.5%) | 50 (16.8%) |
| $7,500 to $9,999 | 4 (1.2%) | 2 (0.7%) |
| $10,000 to $12,499 | 21 (6.1%) | 7 (2.4%) |
| $12,500 to $14,999 | 5 (1.5%) | 7 (2.4%) |
| $15,000 to $17,499 | 0 (0.0%) | 7 (2.4%) |
| $17,500 to $19,999 | 0 (0.0%) | 9 (3.0%) |
| $20,000 to $22,499 | 4 (1.2%) | 8 (2.7%) |
| $22,500 to $24,999 | 20 (5.9%) | 4 (1.3%) |
| $25,000 to $29,999 | 37 (10.8%) | 15 (5.0%) |
| $30,000 to $34,999 | 46 (13.5%) | 48 (16.1%) |
| $35,000 to $39,999 | 22 (6.4%) | 9 (3.0%) |
| $40,000 to $44,999 | 39 (11.4%) | 30 (10.1%) |
| $45,000 to $49,999 | 8 (2.3%) | 14 (4.7%) |
| $50,000 to $54,999 | 38 (11.1%) | 5 (1.7%) |
| $55,000 to $64,999 | 17 (5.0%) | 34 (11.4%) |
| $65,000 to $74,999 | 12 (3.5%) | 8 (2.7%) |
| $75,000 to $99,999 | 24 (7.0%) | 8 (2.7%) |
| $100,000+ | 6 (1.8%) | 4 (1.3%) |
| Total | 342 (100.0%) | 298 (100.0%) |
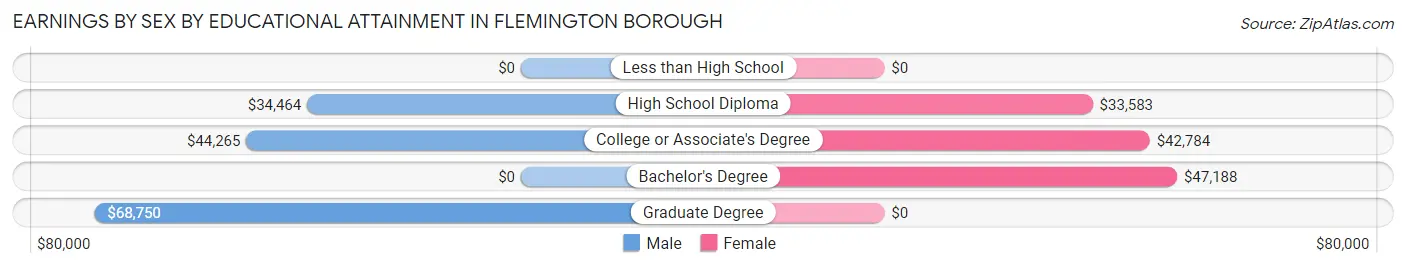
Earnings by Sex by Educational Attainment in Flemington borough
Average earnings in Flemington borough are $37,750 for men and $39,000 for women, a difference of 3.2%. Men with an educational attainment of graduate degree enjoy the highest average annual earnings of $68,750, while those with high school diploma education earn the least with $34,464. Women with an educational attainment of bachelor's degree earn the most with the average annual earnings of $47,188, while those with high school diploma education have the smallest earnings of $33,583.
| Educational Attainment | Male Income | Female Income |
| Less than High School | - | - |
| High School Diploma | $34,464 | $33,583 |
| College or Associate's Degree | $44,265 | $42,784 |
| Bachelor's Degree | - | - |
| Graduate Degree | $68,750 | $0 |
| Total | $37,750 | $39,000 |
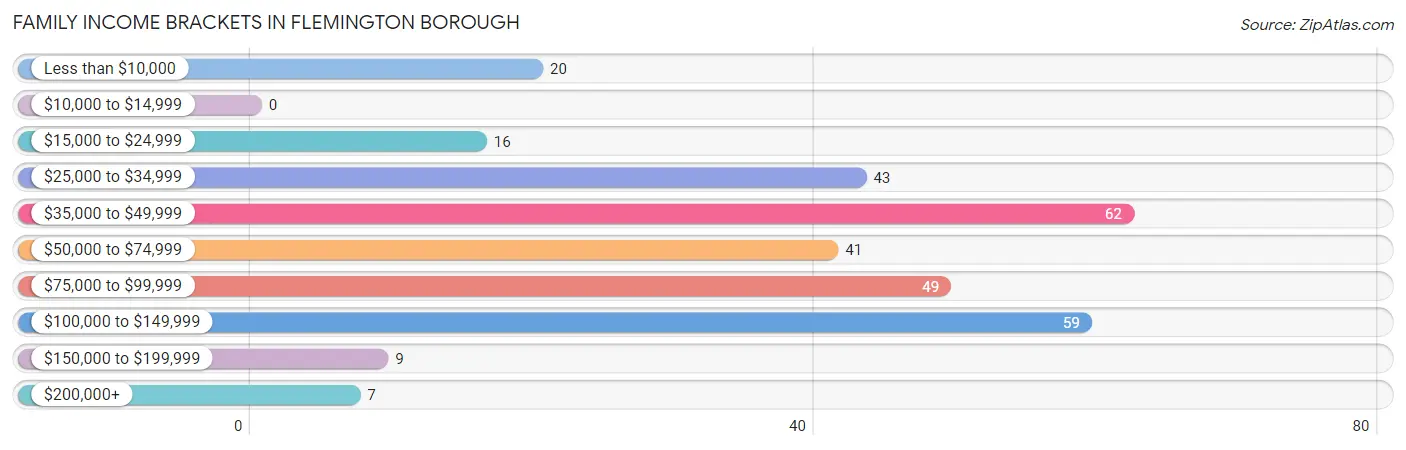
Family Income in Flemington borough
Family Income Brackets in Flemington borough
According to the Flemington borough family income data, there are 62 families falling into the $35,000 to $49,999 income range, which is the most common income bracket and makes up 20.3% of all families.
| Income Bracket | # Families | % Families |
| Less than $10,000 | 20 | 6.5% |
| $10,000 to $14,999 | 0 | 0.0% |
| $15,000 to $24,999 | 16 | 5.2% |
| $25,000 to $34,999 | 43 | 14.1% |
| $35,000 to $49,999 | 62 | 20.3% |
| $50,000 to $74,999 | 41 | 13.4% |
| $75,000 to $99,999 | 49 | 16.0% |
| $100,000 to $149,999 | 59 | 19.3% |
| $150,000 to $199,999 | 9 | 2.9% |
| $200,000+ | 7 | 2.3% |
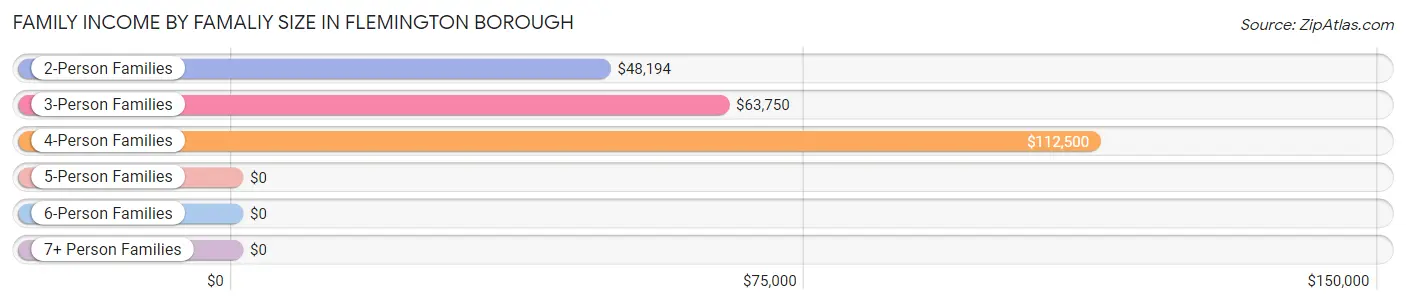
Family Income by Famaliy Size in Flemington borough
4-person families (38 | 12.4%) account for the highest median family income in Flemington borough with $112,500 per family, while 4-person families (38 | 12.4%) have the highest median income of $28,125 per family member.
| Income Bracket | # Families | Median Income |
| 2-Person Families | 170 (55.6%) | $48,194 |
| 3-Person Families | 90 (29.4%) | $63,750 |
| 4-Person Families | 38 (12.4%) | $112,500 |
| 5-Person Families | 8 (2.6%) | $0 |
| 6-Person Families | 0 (0.0%) | $0 |
| 7+ Person Families | 0 (0.0%) | $0 |
| Total | 306 (100.0%) | $57,969 |
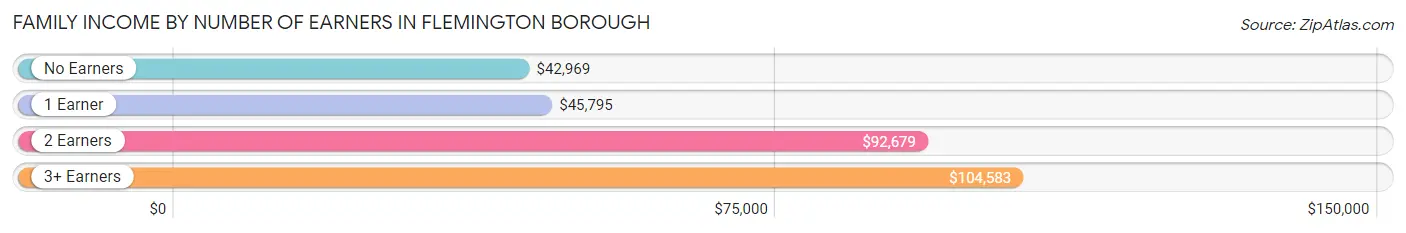
Family Income by Number of Earners in Flemington borough
The median family income in Flemington borough is $57,969, with families comprising 3+ earners (23) having the highest median family income of $104,583, while families with no earners (87) have the lowest median family income of $42,969, accounting for 7.5% and 28.4% of families, respectively.
| Number of Earners | # Families | Median Income |
| No Earners | 87 (28.4%) | $42,969 |
| 1 Earner | 99 (32.4%) | $45,795 |
| 2 Earners | 97 (31.7%) | $92,679 |
| 3+ Earners | 23 (7.5%) | $104,583 |
| Total | 306 (100.0%) | $57,969 |
Household Income in Flemington borough
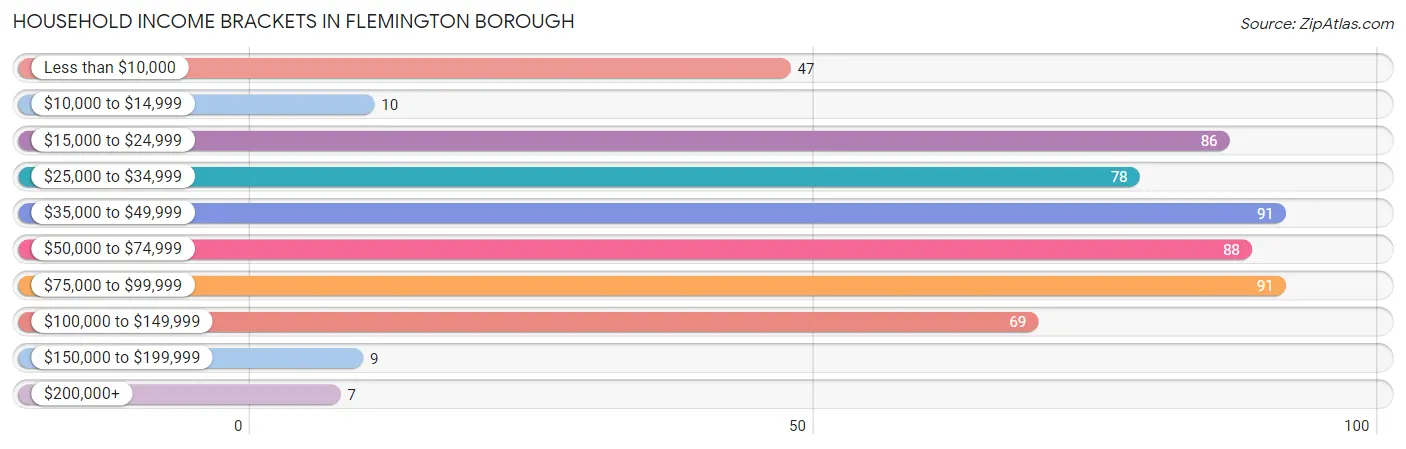
Household Income Brackets in Flemington borough
With 91 households falling in the category, the $35,000 to $49,999 income range is the most frequent in Flemington borough, accounting for 15.8% of all households. In contrast, only 7 households (1.2%) fall into the $200,000+ income bracket, making it the least populous group.
| Income Bracket | # Households | % Households |
| Less than $10,000 | 47 | 8.2% |
| $10,000 to $14,999 | 10 | 1.7% |
| $15,000 to $24,999 | 86 | 14.9% |
| $25,000 to $34,999 | 78 | 13.5% |
| $35,000 to $49,999 | 91 | 15.8% |
| $50,000 to $74,999 | 88 | 15.3% |
| $75,000 to $99,999 | 91 | 15.8% |
| $100,000 to $149,999 | 69 | 12.0% |
| $150,000 to $199,999 | 9 | 1.6% |
| $200,000+ | 7 | 1.2% |
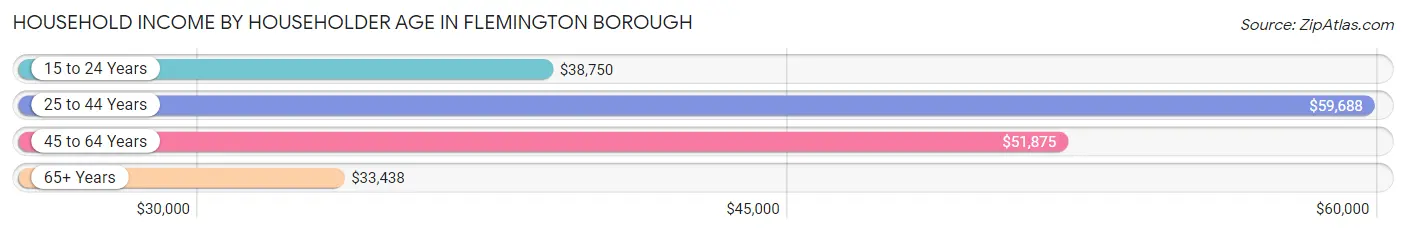
Household Income by Householder Age in Flemington borough
The median household income in Flemington borough is $47,600, with the highest median household income of $59,688 found in the 25 to 44 years age bracket for the primary householder. A total of 190 households (33.0%) fall into this category. Meanwhile, the 65+ years age bracket for the primary householder has the lowest median household income of $33,438, with 207 households (35.9%) in this group.
| Income Bracket | # Households | Median Income |
| 15 to 24 Years | 18 (3.1%) | $38,750 |
| 25 to 44 Years | 190 (33.0%) | $59,688 |
| 45 to 64 Years | 161 (28.0%) | $51,875 |
| 65+ Years | 207 (35.9%) | $33,438 |
| Total | 576 (100.0%) | $47,600 |
Poverty in Flemington borough
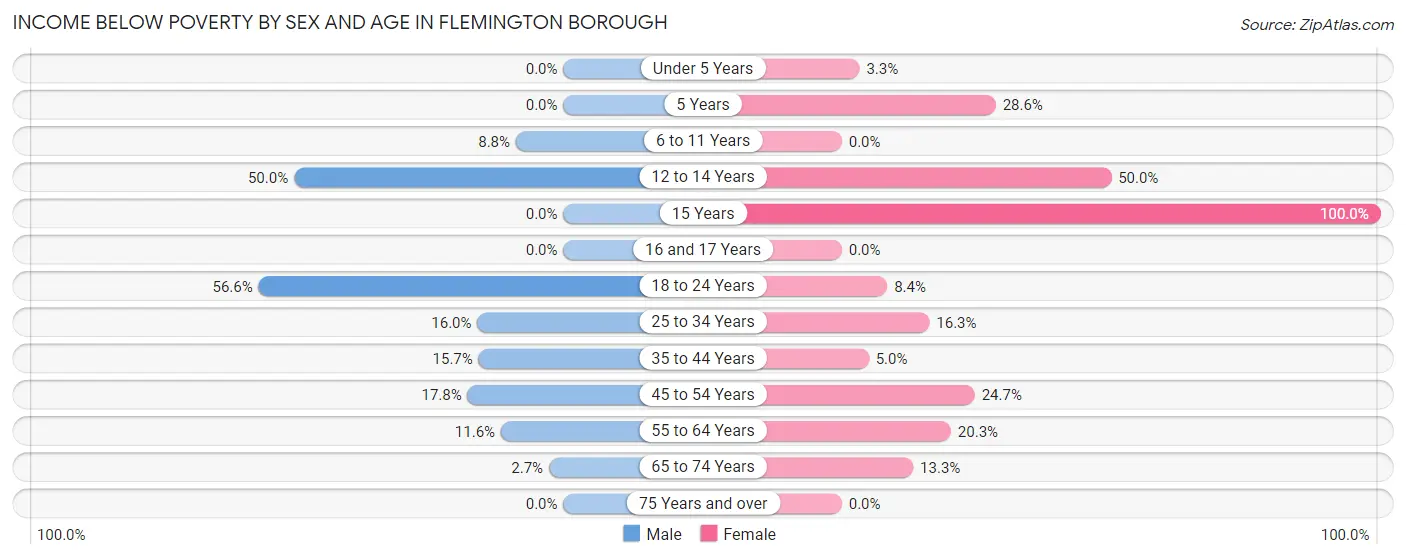
Income Below Poverty by Sex and Age in Flemington borough
With 17.1% poverty level for males and 11.9% for females among the residents of Flemington borough, 18 to 24 year old males and 15 year old females are the most vulnerable to poverty, with 43 males (56.6%) and 3 females (100.0%) in their respective age groups living below the poverty level.
| Age Bracket | Male | Female |
| Under 5 Years | 0 (0.0%) | 2 (3.3%) |
| 5 Years | 0 (0.0%) | 2 (28.6%) |
| 6 to 11 Years | 3 (8.8%) | 0 (0.0%) |
| 12 to 14 Years | 8 (50.0%) | 4 (50.0%) |
| 15 Years | 0 (0.0%) | 3 (100.0%) |
| 16 and 17 Years | 0 (0.0%) | 0 (0.0%) |
| 18 to 24 Years | 43 (56.6%) | 7 (8.4%) |
| 25 to 34 Years | 15 (16.0%) | 13 (16.3%) |
| 35 to 44 Years | 14 (15.7%) | 3 (5.0%) |
| 45 to 54 Years | 8 (17.8%) | 19 (24.7%) |
| 55 to 64 Years | 8 (11.6%) | 16 (20.3%) |
| 65 to 74 Years | 2 (2.7%) | 11 (13.3%) |
| 75 Years and over | 0 (0.0%) | 0 (0.0%) |
| Total | 101 (17.1%) | 80 (11.9%) |
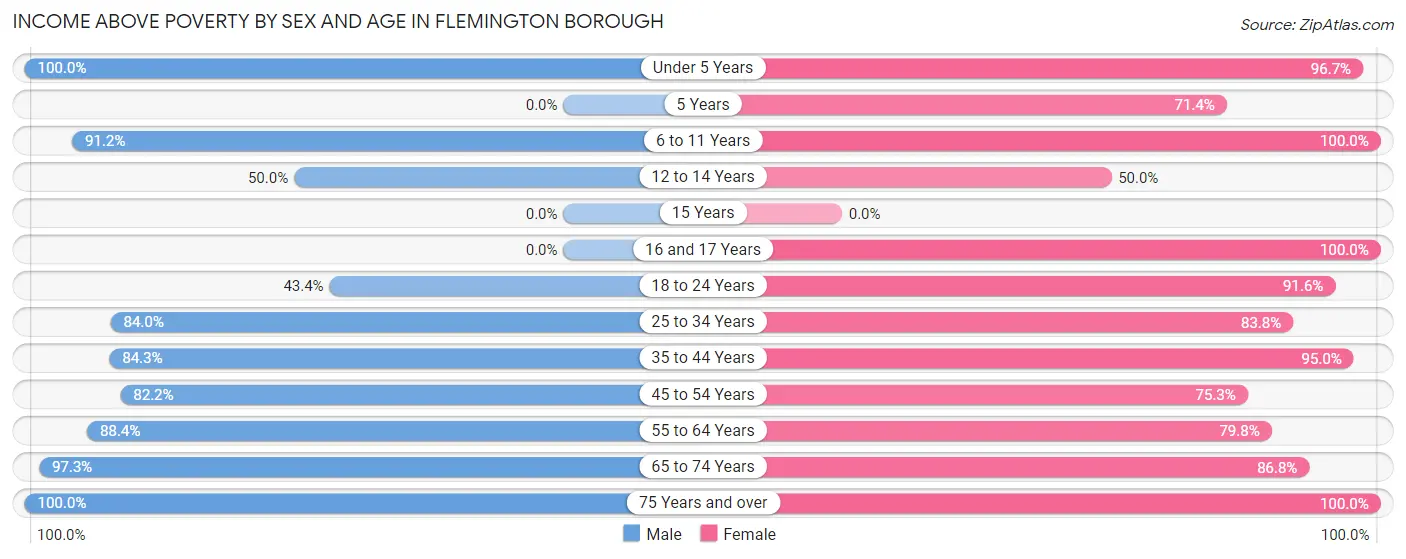
Income Above Poverty by Sex and Age in Flemington borough
According to the poverty statistics in Flemington borough, males aged under 5 years and females aged 6 to 11 years are the age groups that are most secure financially, with 100.0% of males and 100.0% of females in these age groups living above the poverty line.
| Age Bracket | Male | Female |
| Under 5 Years | 28 (100.0%) | 59 (96.7%) |
| 5 Years | 0 (0.0%) | 5 (71.4%) |
| 6 to 11 Years | 31 (91.2%) | 30 (100.0%) |
| 12 to 14 Years | 8 (50.0%) | 4 (50.0%) |
| 15 Years | 0 (0.0%) | 0 (0.0%) |
| 16 and 17 Years | 0 (0.0%) | 27 (100.0%) |
| 18 to 24 Years | 33 (43.4%) | 76 (91.6%) |
| 25 to 34 Years | 79 (84.0%) | 67 (83.8%) |
| 35 to 44 Years | 75 (84.3%) | 57 (95.0%) |
| 45 to 54 Years | 37 (82.2%) | 58 (75.3%) |
| 55 to 64 Years | 61 (88.4%) | 63 (79.7%) |
| 65 to 74 Years | 73 (97.3%) | 72 (86.8%) |
| 75 Years and over | 65 (100.0%) | 76 (100.0%) |
| Total | 490 (82.9%) | 594 (88.1%) |
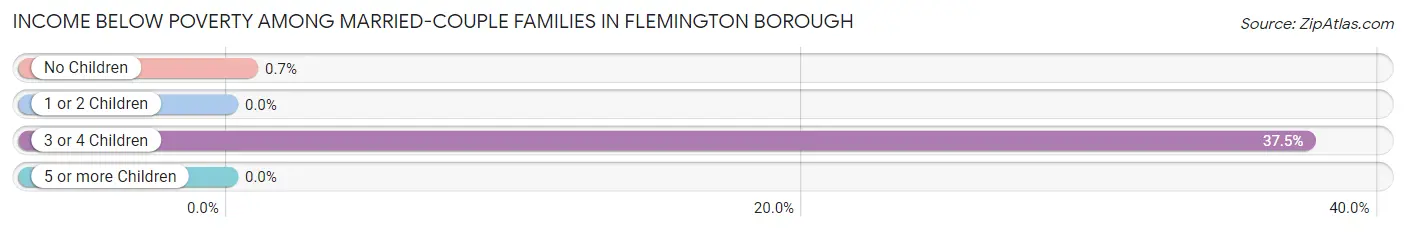
Income Below Poverty Among Married-Couple Families in Flemington borough
The poverty statistics for married-couple families in Flemington borough show that 1.9% or 4 of the total 206 families live below the poverty line. Families with 3 or 4 children have the highest poverty rate of 37.5%, comprising of 3 families. On the other hand, families with 1 or 2 children have the lowest poverty rate of 0.0%, which includes 0 families.
| Children | Above Poverty | Below Poverty |
| No Children | 141 (99.3%) | 1 (0.7%) |
| 1 or 2 Children | 56 (100.0%) | 0 (0.0%) |
| 3 or 4 Children | 5 (62.5%) | 3 (37.5%) |
| 5 or more Children | 0 (0.0%) | 0 (0.0%) |
| Total | 202 (98.1%) | 4 (1.9%) |
Income Below Poverty Among Single-Parent Households in Flemington borough
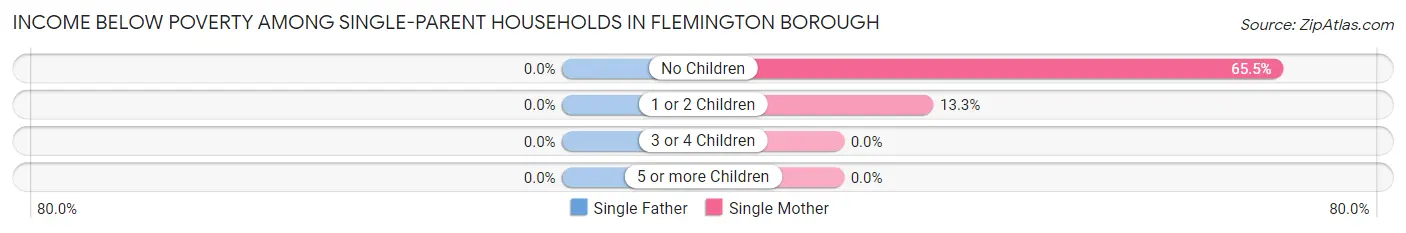
| Children | Single Father | Single Mother |
| No Children | 0 (0.0%) | 19 (65.5%) |
| 1 or 2 Children | 0 (0.0%) | 6 (13.3%) |
| 3 or 4 Children | 0 (0.0%) | 0 (0.0%) |
| 5 or more Children | 0 (0.0%) | 0 (0.0%) |
| Total | 0 (0.0%) | 25 (33.8%) |
Income Below Poverty Among Married-Couple vs Single-Parent Households in Flemington borough
The poverty data for Flemington borough shows that 4 of the married-couple family households (1.9%) and 25 of the single-parent households (25.0%) are living below the poverty level. Within the married-couple family households, those with 3 or 4 children have the highest poverty rate, with 3 households (37.5%) falling below the poverty line. Among the single-parent households, those with no children have the highest poverty rate, with 19 household (48.7%) living below poverty.
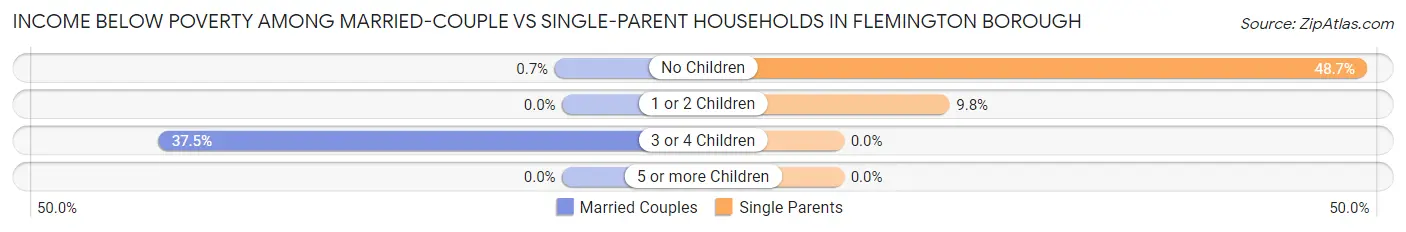
| Children | Married-Couple Families | Single-Parent Households |
| No Children | 1 (0.7%) | 19 (48.7%) |
| 1 or 2 Children | 0 (0.0%) | 6 (9.8%) |
| 3 or 4 Children | 3 (37.5%) | 0 (0.0%) |
| 5 or more Children | 0 (0.0%) | 0 (0.0%) |
| Total | 4 (1.9%) | 25 (25.0%) |
Race in Flemington borough
The most populous races in Flemington borough are White / Caucasian (1,183 | 93.5%), Two or more Races (56 | 4.4%), and Asian (16 | 1.3%).
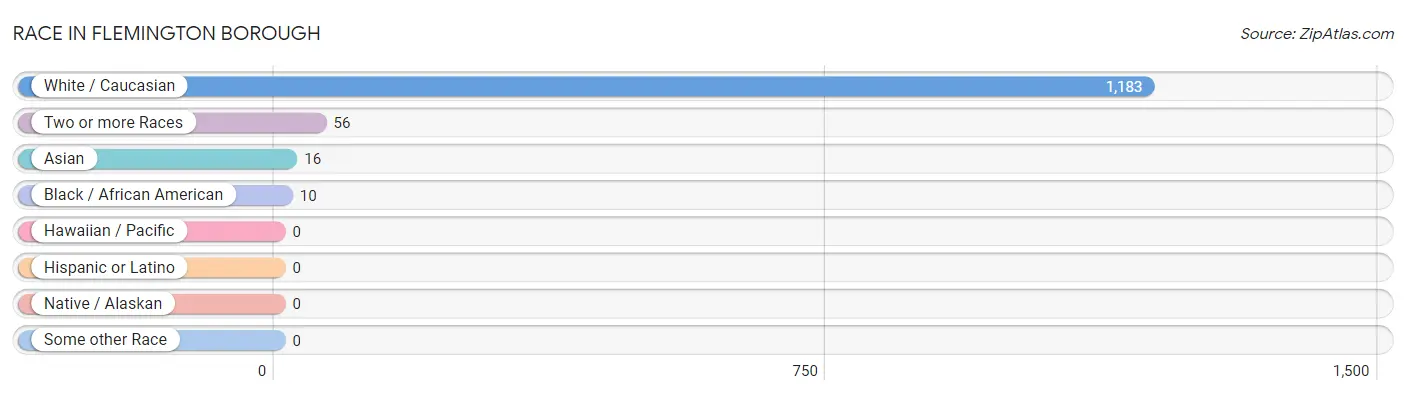
| Race | # Population | % Population |
| Asian | 16 | 1.3% |
| Black / African American | 10 | 0.8% |
| Hawaiian / Pacific | 0 | 0.0% |
| Hispanic or Latino | 0 | 0.0% |
| Native / Alaskan | 0 | 0.0% |
| White / Caucasian | 1,183 | 93.5% |
| Two or more Races | 56 | 4.4% |
| Some other Race | 0 | 0.0% |
| Total | 1,265 | 100.0% |
Ancestry in Flemington borough
The most populous ancestries reported in Flemington borough are German (371 | 29.3%), Italian (180 | 14.2%), Irish (136 | 10.7%), American (89 | 7.0%), and English (88 | 7.0%), together accounting for 68.3% of all Flemington borough residents.
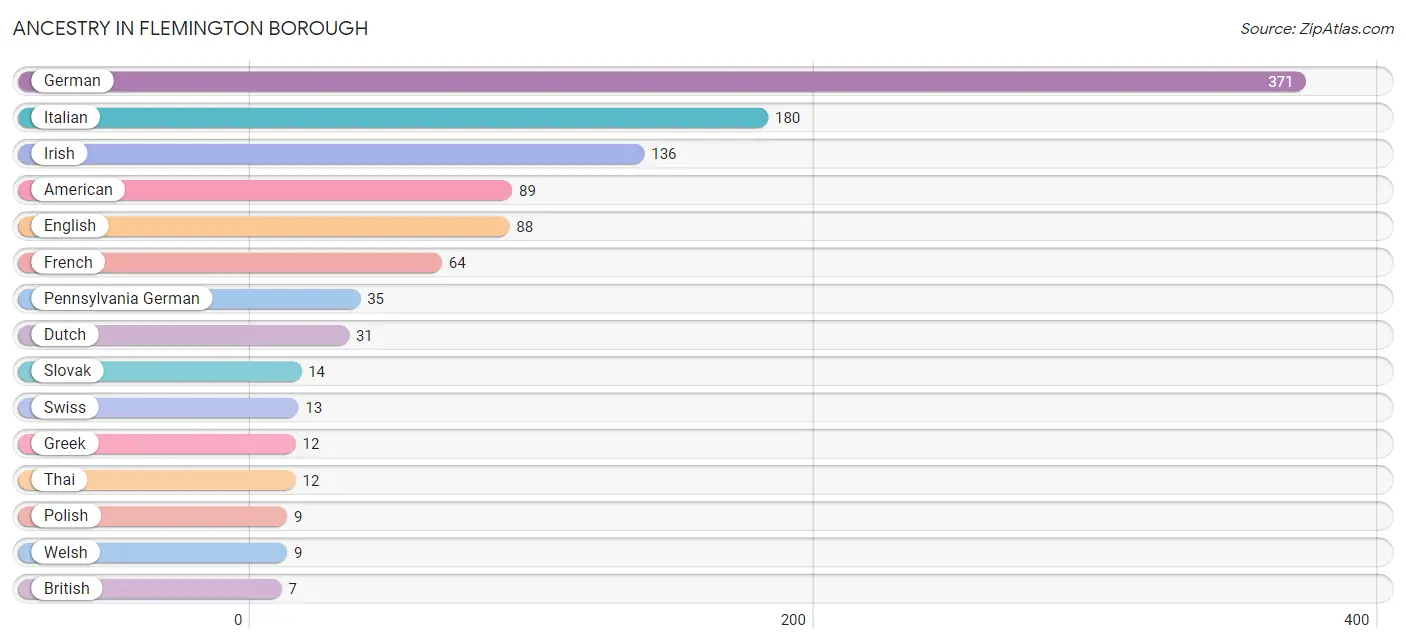
| Ancestry | # Population | % Population |
| American | 89 | 7.0% |
| Arab | 2 | 0.2% |
| British | 7 | 0.5% |
| Dutch | 31 | 2.5% |
| English | 88 | 7.0% |
| French | 64 | 5.1% |
| German | 371 | 29.3% |
| Greek | 12 | 0.9% |
| Irish | 136 | 10.7% |
| Italian | 180 | 14.2% |
| Korean | 4 | 0.3% |
| Lebanese | 2 | 0.2% |
| Lithuanian | 2 | 0.2% |
| Pennsylvania German | 35 | 2.8% |
| Polish | 9 | 0.7% |
| Scottish | 2 | 0.2% |
| Slovak | 14 | 1.1% |
| Swiss | 13 | 1.0% |
| Thai | 12 | 0.9% |
| Welsh | 9 | 0.7% | View All 20 Rows |
Immigrants in Flemington borough
The most numerous immigrant groups reported in Flemington borough came from Asia (11 | 0.9%), India (7 | 0.5%), South Central Asia (7 | 0.5%), Europe (4 | 0.3%), and Greece (4 | 0.3%), together accounting for 2.6% of all Flemington borough residents.
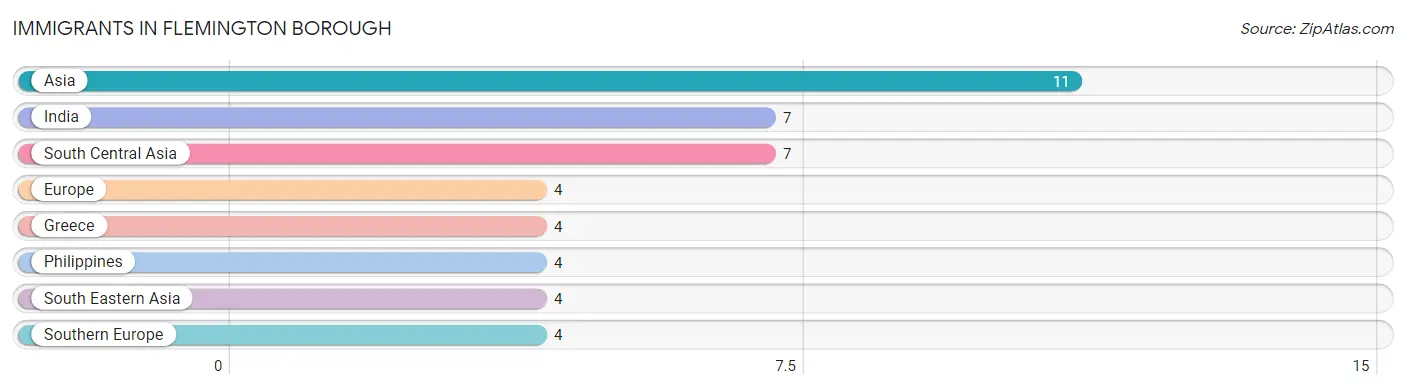
| Immigration Origin | # Population | % Population |
| Asia | 11 | 0.9% |
| Europe | 4 | 0.3% |
| Greece | 4 | 0.3% |
| India | 7 | 0.5% |
| Philippines | 4 | 0.3% |
| South Central Asia | 7 | 0.5% |
| South Eastern Asia | 4 | 0.3% |
| Southern Europe | 4 | 0.3% | View All 8 Rows |
Sex and Age in Flemington borough
Sex and Age in Flemington borough
The most populous age groups in Flemington borough are 20 to 24 Years (69 | 11.7%) for men and 20 to 24 Years (74 | 11.0%) for women.
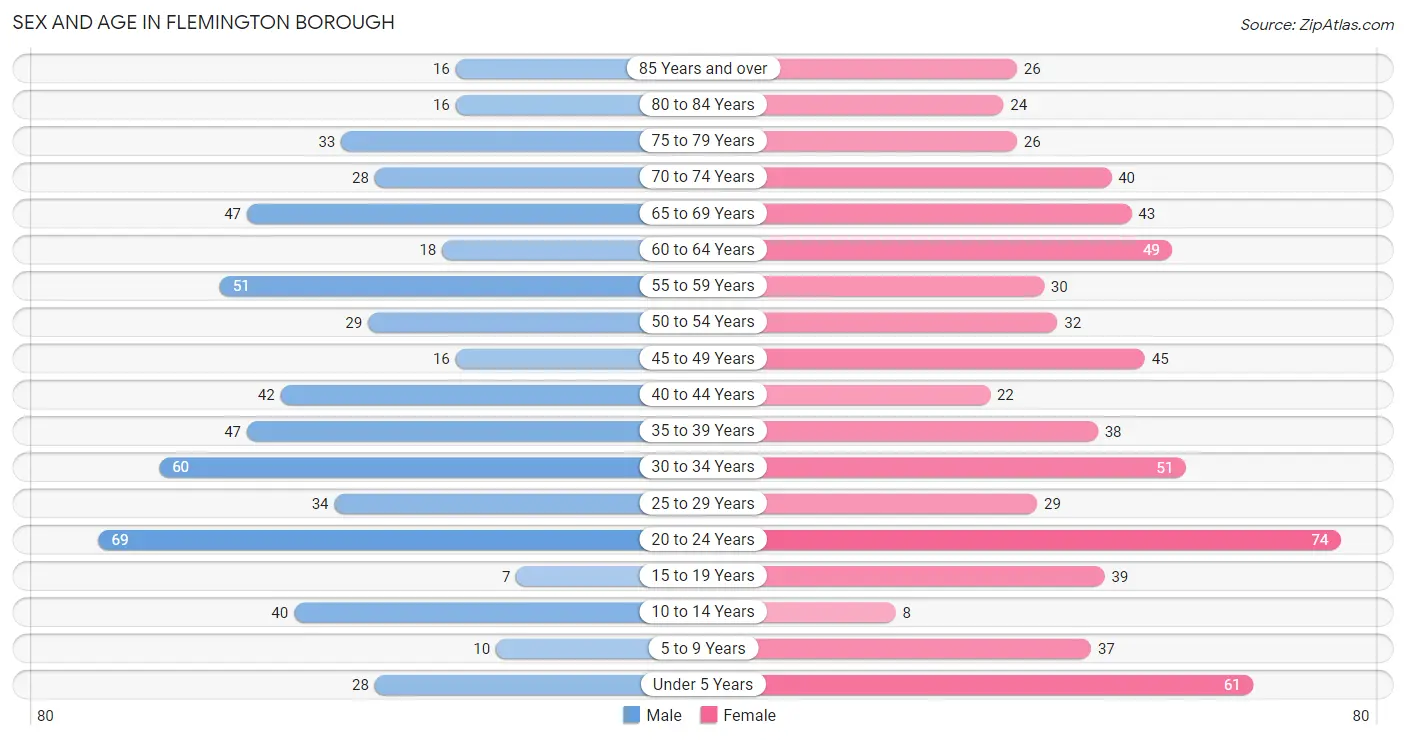
| Age Bracket | Male | Female |
| Under 5 Years | 28 (4.7%) | 61 (9.0%) |
| 5 to 9 Years | 10 (1.7%) | 37 (5.5%) |
| 10 to 14 Years | 40 (6.8%) | 8 (1.2%) |
| 15 to 19 Years | 7 (1.2%) | 39 (5.8%) |
| 20 to 24 Years | 69 (11.7%) | 74 (11.0%) |
| 25 to 29 Years | 34 (5.8%) | 29 (4.3%) |
| 30 to 34 Years | 60 (10.2%) | 51 (7.6%) |
| 35 to 39 Years | 47 (8.0%) | 38 (5.6%) |
| 40 to 44 Years | 42 (7.1%) | 22 (3.3%) |
| 45 to 49 Years | 16 (2.7%) | 45 (6.7%) |
| 50 to 54 Years | 29 (4.9%) | 32 (4.8%) |
| 55 to 59 Years | 51 (8.6%) | 30 (4.4%) |
| 60 to 64 Years | 18 (3.0%) | 49 (7.3%) |
| 65 to 69 Years | 47 (8.0%) | 43 (6.4%) |
| 70 to 74 Years | 28 (4.7%) | 40 (5.9%) |
| 75 to 79 Years | 33 (5.6%) | 26 (3.9%) |
| 80 to 84 Years | 16 (2.7%) | 24 (3.6%) |
| 85 Years and over | 16 (2.7%) | 26 (3.9%) |
| Total | 591 (100.0%) | 674 (100.0%) |
Families and Households in Flemington borough
Median Family Size in Flemington borough
The median family size in Flemington borough is 2.89 persons per family, with single male/father families (26 | 8.5%) accounting for the largest median family size of 3.58 persons per family. On the other hand, single female/mother families (74 | 24.2%) represent the smallest median family size with 2.69 persons per family.
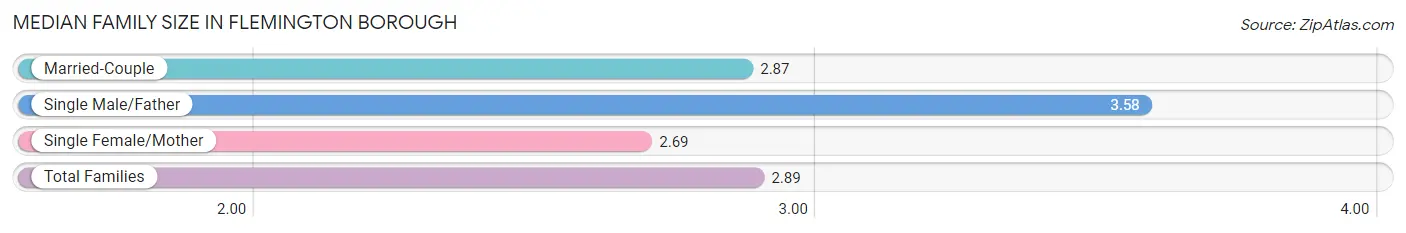
| Family Type | # Families | Family Size |
| Married-Couple | 206 (67.3%) | 2.87 |
| Single Male/Father | 26 (8.5%) | 3.58 |
| Single Female/Mother | 74 (24.2%) | 2.69 |
| Total Families | 306 (100.0%) | 2.89 |
Median Household Size in Flemington borough
The median household size in Flemington borough is 2.20 persons per household, with single male/father households (26 | 4.5%) accounting for the largest median household size of 4.19 persons per household. non-family households (270 | 46.9%) represent the smallest median household size with 1.27 persons per household.
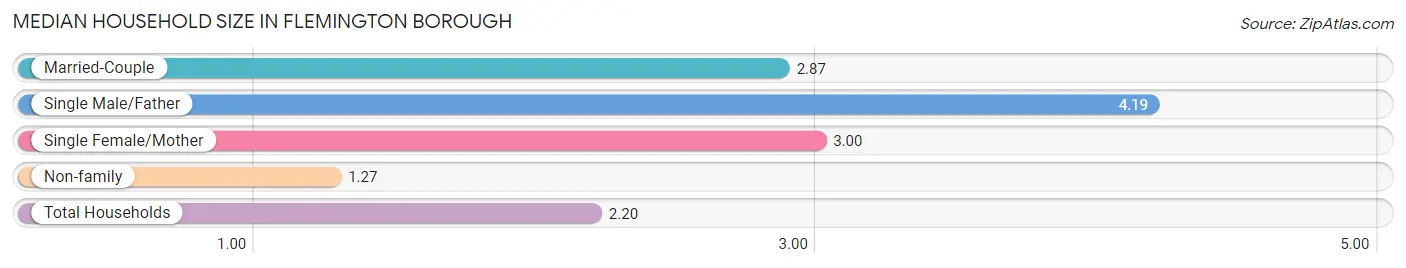
| Household Type | # Households | Household Size |
| Married-Couple | 206 (35.8%) | 2.87 |
| Single Male/Father | 26 (4.5%) | 4.19 |
| Single Female/Mother | 74 (12.9%) | 3.00 |
| Non-family | 270 (46.9%) | 1.27 |
| Total Households | 576 (100.0%) | 2.20 |
Household Size by Marriage Status in Flemington borough
Out of a total of 576 households in Flemington borough, 306 (53.1%) are family households, while 270 (46.9%) are nonfamily households. The most numerous type of family households are 2-person households, comprising 167, and the most common type of nonfamily households are 1-person households, comprising 205.
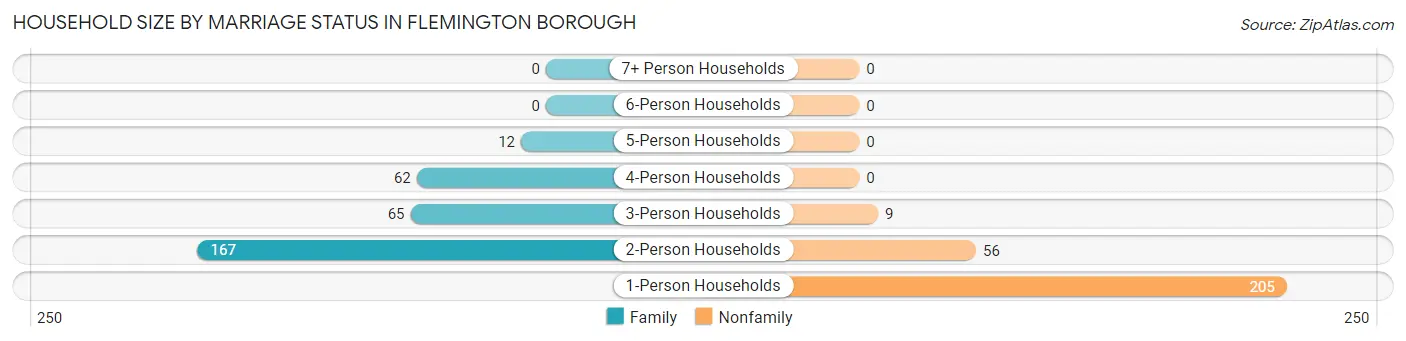
| Household Size | Family Households | Nonfamily Households |
| 1-Person Households | - | 205 (35.6%) |
| 2-Person Households | 167 (29.0%) | 56 (9.7%) |
| 3-Person Households | 65 (11.3%) | 9 (1.6%) |
| 4-Person Households | 62 (10.8%) | 0 (0.0%) |
| 5-Person Households | 12 (2.1%) | 0 (0.0%) |
| 6-Person Households | 0 (0.0%) | 0 (0.0%) |
| 7+ Person Households | 0 (0.0%) | 0 (0.0%) |
| Total | 306 (53.1%) | 270 (46.9%) |
Female Fertility in Flemington borough
Fertility by Age in Flemington borough
Average fertility rate in Flemington borough is 158.0 births per 1,000 women. Women in the age bracket of 20 to 34 years have the highest fertility rate with 318.0 births per 1,000 women. Women in the age bracket of 20 to 34 years acount for 100.0% of all women with births.
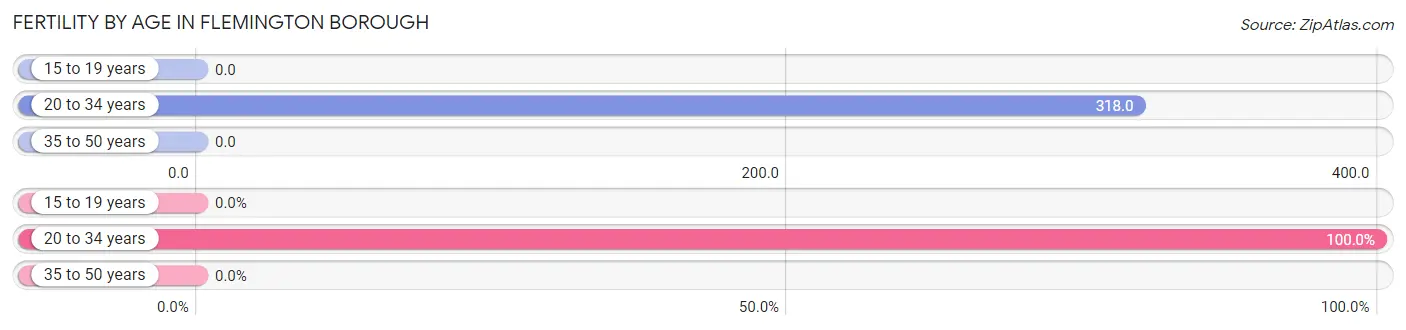
| Age Bracket | Women with Births | Births / 1,000 Women |
| 15 to 19 years | 0 (0.0%) | 0.0 |
| 20 to 34 years | 49 (100.0%) | 318.0 |
| 35 to 50 years | 0 (0.0%) | 0.0 |
| Total | 49 (100.0%) | 158.0 |
Fertility by Age by Marriage Status in Flemington borough
81.6% of women with births (49) in Flemington borough are married. The highest percentage of unmarried women with births falls into 20 to 34 years age bracket with 18.4% of them unmarried at the time of birth, while the lowest percentage of unmarried women with births belong to 20 to 34 years age bracket with 18.4% of them unmarried.
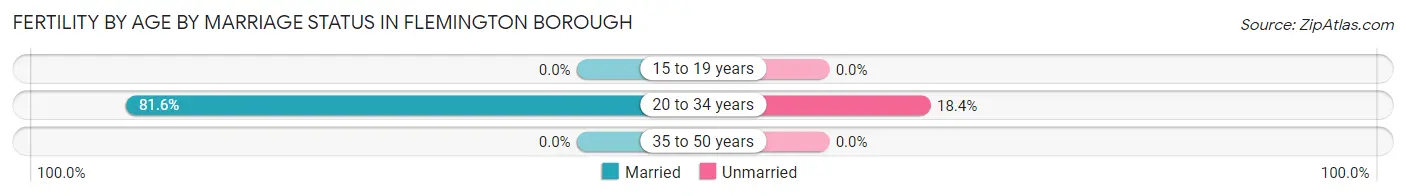
| Age Bracket | Married | Unmarried |
| 15 to 19 years | 0 (0.0%) | 0 (0.0%) |
| 20 to 34 years | 40 (81.6%) | 9 (18.4%) |
| 35 to 50 years | 0 (0.0%) | 0 (0.0%) |
| Total | 40 (81.6%) | 9 (18.4%) |
Fertility by Education in Flemington borough
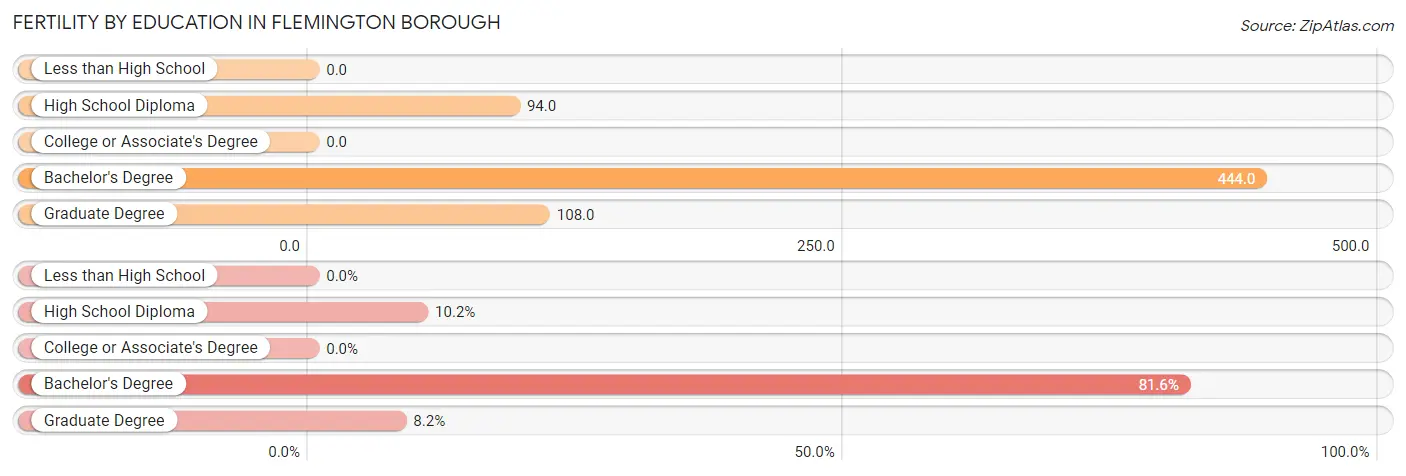
| Educational Attainment | Women with Births | Births / 1,000 Women |
| Less than High School | 0 (0.0%) | 0.0 |
| High School Diploma | 5 (10.2%) | 94.0 |
| College or Associate's Degree | 0 (0.0%) | 0.0 |
| Bachelor's Degree | 40 (81.6%) | 444.0 |
| Graduate Degree | 4 (8.2%) | 108.0 |
| Total | 49 (100.0%) | 158.0 |
Fertility by Education by Marriage Status in Flemington borough
18.4% of women with births in Flemington borough are unmarried. Women with the educational attainment of bachelor's degree are most likely to be married with 100.0% of them married at childbirth, while women with the educational attainment of high school diploma are least likely to be married with 100.0% of them unmarried at childbirth.
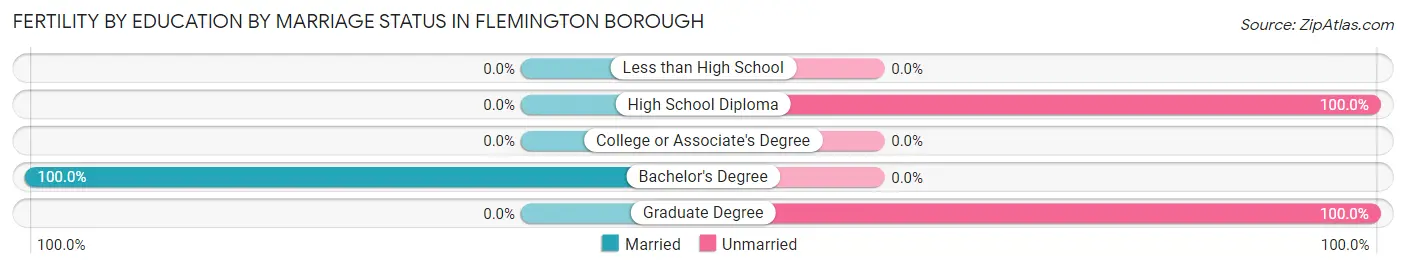
| Educational Attainment | Married | Unmarried |
| Less than High School | 0 (0.0%) | 0 (0.0%) |
| High School Diploma | 0 (0.0%) | 5 (100.0%) |
| College or Associate's Degree | 0 (0.0%) | 0 (0.0%) |
| Bachelor's Degree | 40 (100.0%) | 0 (0.0%) |
| Graduate Degree | 0 (0.0%) | 4 (100.0%) |
| Total | 40 (81.6%) | 9 (18.4%) |
Employment Characteristics in Flemington borough
Employment by Class of Employer in Flemington borough
Among the 579 employed individuals in Flemington borough, private company employees (436 | 75.3%), not-for-profit organizations (89 | 15.4%), and self-employed (not incorporated) (28 | 4.8%) make up the most common classes of employment.
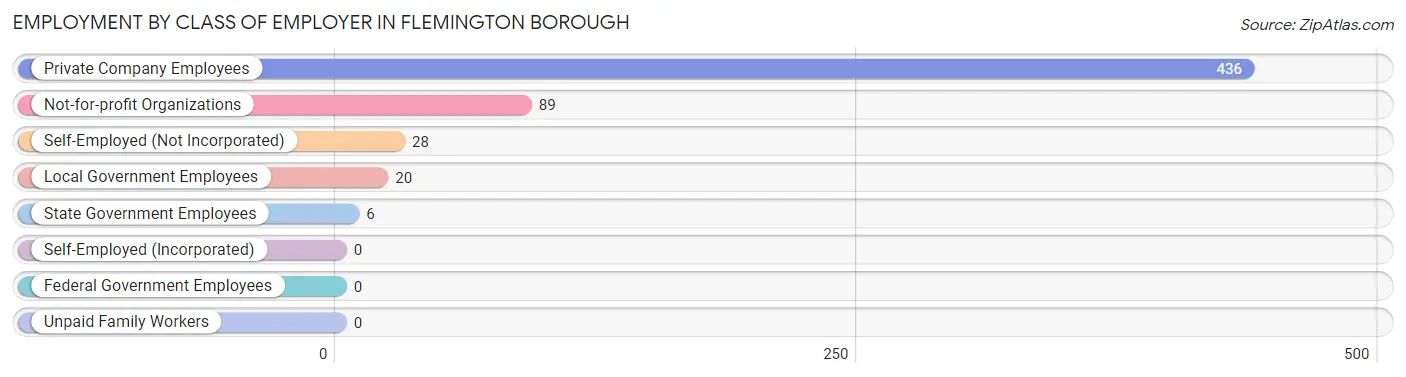
| Employer Class | # Employees | % Employees |
| Private Company Employees | 436 | 75.3% |
| Self-Employed (Incorporated) | 0 | 0.0% |
| Self-Employed (Not Incorporated) | 28 | 4.8% |
| Not-for-profit Organizations | 89 | 15.4% |
| Local Government Employees | 20 | 3.5% |
| State Government Employees | 6 | 1.0% |
| Federal Government Employees | 0 | 0.0% |
| Unpaid Family Workers | 0 | 0.0% |
| Total | 579 | 100.0% |
Employment Status by Age in Flemington borough
According to the labor force statistics for Flemington borough, out of the total population over 16 years of age (1,078), 57.8% or 623 individuals are in the labor force, with 5.6% or 35 of them unemployed. The age group with the highest labor force participation rate is 30 to 34 years, with 96.4% or 107 individuals in the labor force. Within the labor force, the 65 to 74 years age range has the highest percentage of unemployed individuals, with 34.4% or 11 of them being unemployed.
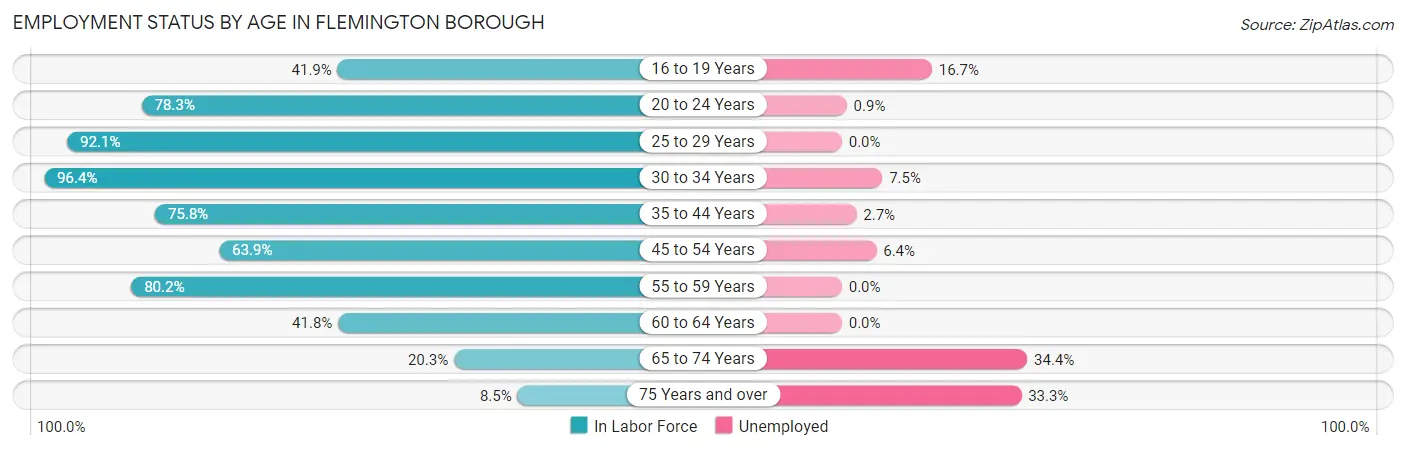
| Age Bracket | In Labor Force | Unemployed |
| 16 to 19 Years | 18 (41.9%) | 3 (16.7%) |
| 20 to 24 Years | 112 (78.3%) | 1 (0.9%) |
| 25 to 29 Years | 58 (92.1%) | 0 (0.0%) |
| 30 to 34 Years | 107 (96.4%) | 8 (7.5%) |
| 35 to 44 Years | 113 (75.8%) | 3 (2.7%) |
| 45 to 54 Years | 78 (63.9%) | 5 (6.4%) |
| 55 to 59 Years | 65 (80.2%) | 0 (0.0%) |
| 60 to 64 Years | 28 (41.8%) | 0 (0.0%) |
| 65 to 74 Years | 32 (20.3%) | 11 (34.4%) |
| 75 Years and over | 12 (8.5%) | 4 (33.3%) |
| Total | 623 (57.8%) | 35 (5.6%) |
Employment Status by Educational Attainment in Flemington borough
According to labor force statistics for Flemington borough, 75.7% of individuals (449) out of the total population between 25 and 64 years of age (593) are in the labor force, with 3.6% or 16 of them being unemployed. The group with the highest labor force participation rate are those with the educational attainment of college / associate degree, with 85.2% or 132 individuals in the labor force. Within the labor force, individuals with high school diploma education have the highest percentage of unemployment, with 6.4% or 13 of them being unemployed.
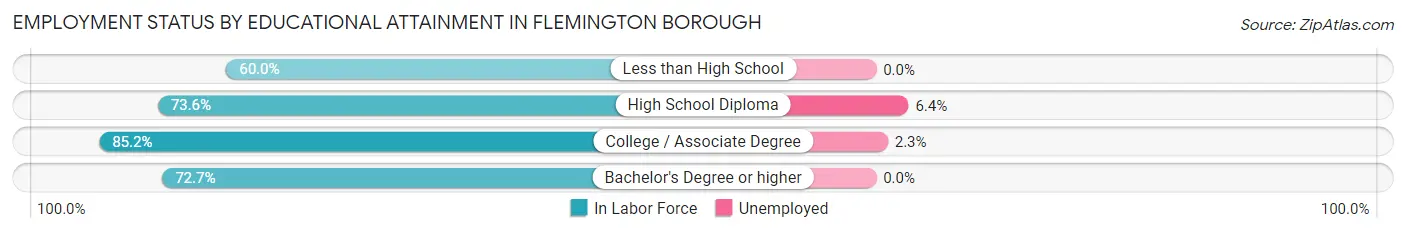
| Educational Attainment | In Labor Force | Unemployed |
| Less than High School | 18 (60.0%) | 0 (0.0%) |
| High School Diploma | 203 (73.6%) | 18 (6.4%) |
| College / Associate Degree | 132 (85.2%) | 4 (2.3%) |
| Bachelor's Degree or higher | 96 (72.7%) | 0 (0.0%) |
| Total | 449 (75.7%) | 21 (3.6%) |
Employment Occupations by Sex in Flemington borough
Management, Business, Science and Arts Occupations
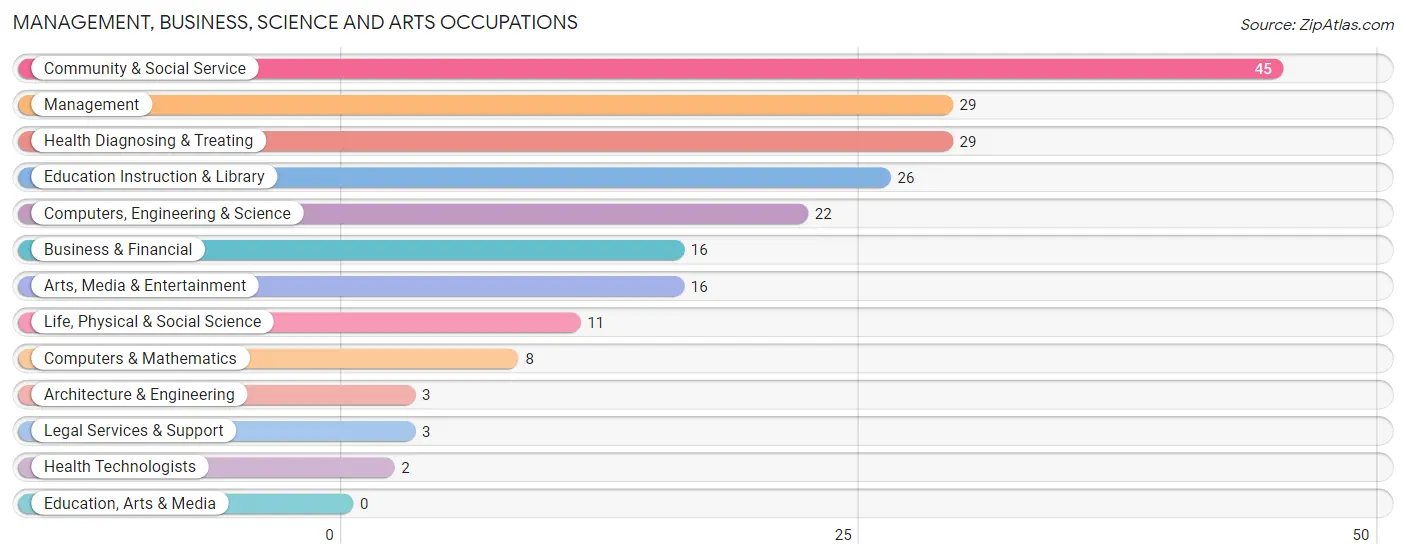
The most common Management, Business, Science and Arts occupations in Flemington borough are Community & Social Service (45 | 7.6%), Management (29 | 4.9%), Health Diagnosing & Treating (29 | 4.9%), Education Instruction & Library (26 | 4.4%), and Computers, Engineering & Science (22 | 3.7%).
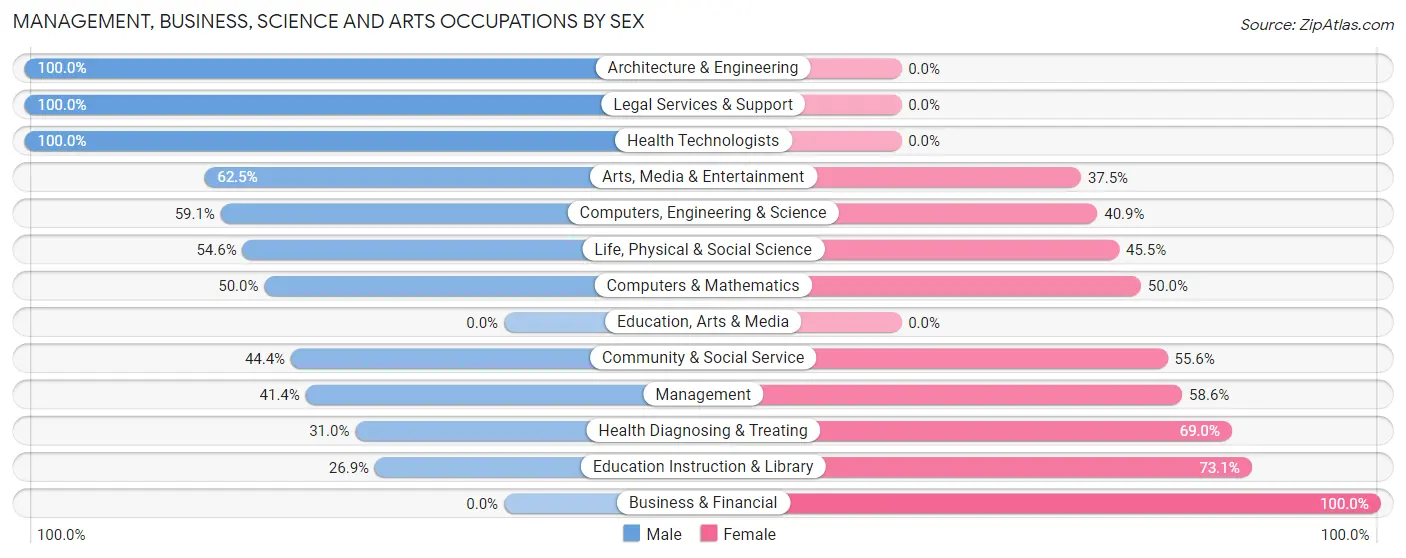
Management, Business, Science and Arts Occupations by Sex
Within the Management, Business, Science and Arts occupations in Flemington borough, the most male-oriented occupations are Architecture & Engineering (100.0%), Legal Services & Support (100.0%), and Health Technologists (100.0%), while the most female-oriented occupations are Business & Financial (100.0%), Education Instruction & Library (73.1%), and Health Diagnosing & Treating (69.0%).
| Occupation | Male | Female |
| Management | 12 (41.4%) | 17 (58.6%) |
| Business & Financial | 0 (0.0%) | 16 (100.0%) |
| Computers, Engineering & Science | 13 (59.1%) | 9 (40.9%) |
| Computers & Mathematics | 4 (50.0%) | 4 (50.0%) |
| Architecture & Engineering | 3 (100.0%) | 0 (0.0%) |
| Life, Physical & Social Science | 6 (54.5%) | 5 (45.5%) |
| Community & Social Service | 20 (44.4%) | 25 (55.6%) |
| Education, Arts & Media | 0 (0.0%) | 0 (0.0%) |
| Legal Services & Support | 3 (100.0%) | 0 (0.0%) |
| Education Instruction & Library | 7 (26.9%) | 19 (73.1%) |
| Arts, Media & Entertainment | 10 (62.5%) | 6 (37.5%) |
| Health Diagnosing & Treating | 9 (31.0%) | 20 (69.0%) |
| Health Technologists | 2 (100.0%) | 0 (0.0%) |
| Total (Category) | 54 (38.3%) | 87 (61.7%) |
| Total (Overall) | 310 (52.7%) | 278 (47.3%) |
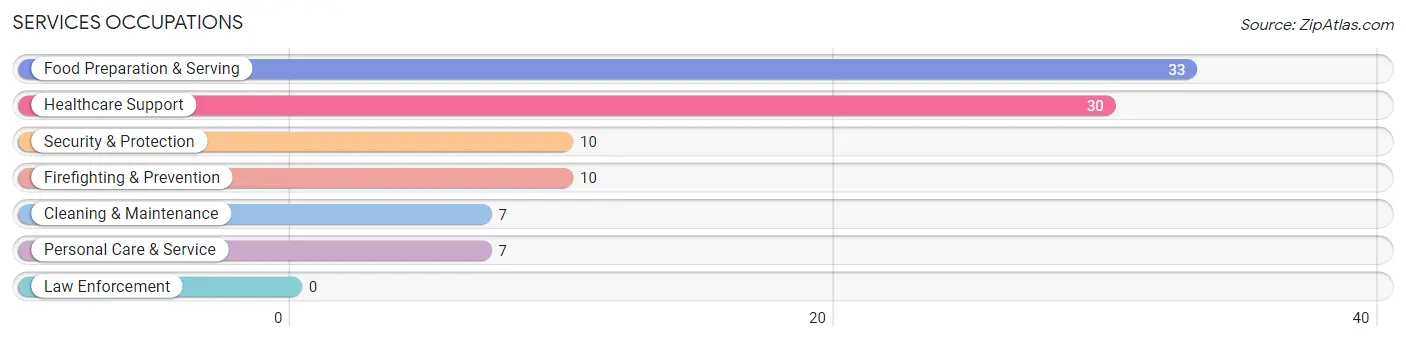
Services Occupations
The most common Services occupations in Flemington borough are Food Preparation & Serving (33 | 5.6%), Healthcare Support (30 | 5.1%), Security & Protection (10 | 1.7%), Firefighting & Prevention (10 | 1.7%), and Cleaning & Maintenance (7 | 1.2%).
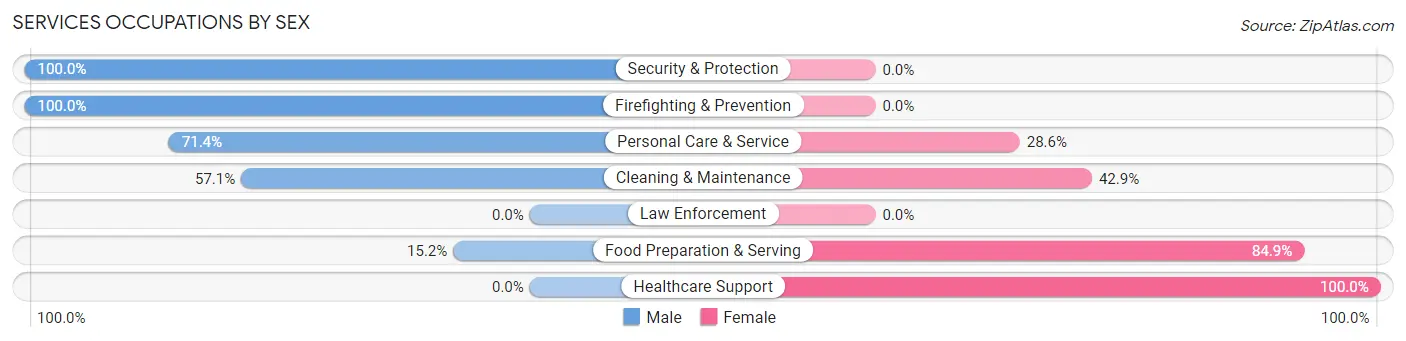
Services Occupations by Sex
Within the Services occupations in Flemington borough, the most male-oriented occupations are Security & Protection (100.0%), Firefighting & Prevention (100.0%), and Personal Care & Service (71.4%), while the most female-oriented occupations are Healthcare Support (100.0%), Food Preparation & Serving (84.9%), and Cleaning & Maintenance (42.9%).
| Occupation | Male | Female |
| Healthcare Support | 0 (0.0%) | 30 (100.0%) |
| Security & Protection | 10 (100.0%) | 0 (0.0%) |
| Firefighting & Prevention | 10 (100.0%) | 0 (0.0%) |
| Law Enforcement | 0 (0.0%) | 0 (0.0%) |
| Food Preparation & Serving | 5 (15.1%) | 28 (84.9%) |
| Cleaning & Maintenance | 4 (57.1%) | 3 (42.9%) |
| Personal Care & Service | 5 (71.4%) | 2 (28.6%) |
| Total (Category) | 24 (27.6%) | 63 (72.4%) |
| Total (Overall) | 310 (52.7%) | 278 (47.3%) |
Sales and Office Occupations
The most common Sales and Office occupations in Flemington borough are Office & Administration (85 | 14.5%), and Sales & Related (37 | 6.3%).
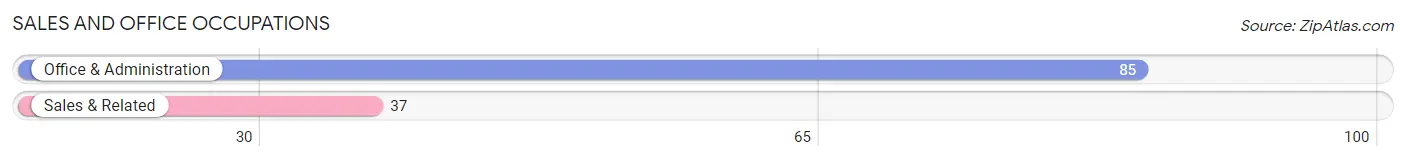
Sales and Office Occupations by Sex
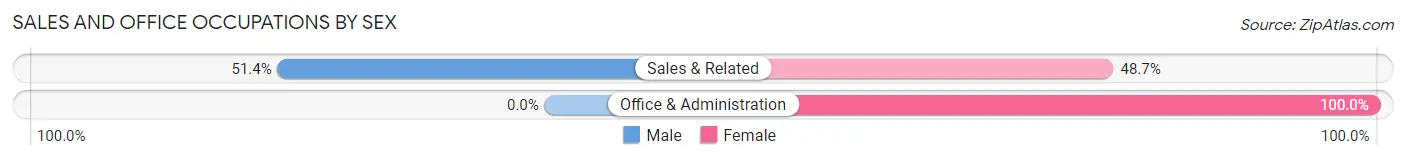
| Occupation | Male | Female |
| Sales & Related | 19 (51.3%) | 18 (48.6%) |
| Office & Administration | 0 (0.0%) | 85 (100.0%) |
| Total (Category) | 19 (15.6%) | 103 (84.4%) |
| Total (Overall) | 310 (52.7%) | 278 (47.3%) |
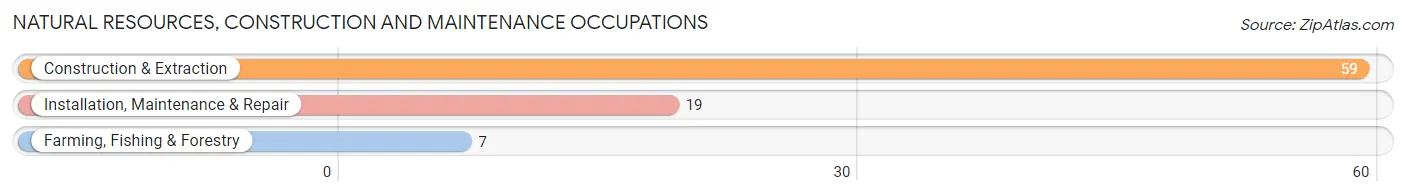
Natural Resources, Construction and Maintenance Occupations
The most common Natural Resources, Construction and Maintenance occupations in Flemington borough are Construction & Extraction (59 | 10.0%), Installation, Maintenance & Repair (19 | 3.2%), and Farming, Fishing & Forestry (7 | 1.2%).
Natural Resources, Construction and Maintenance Occupations by Sex
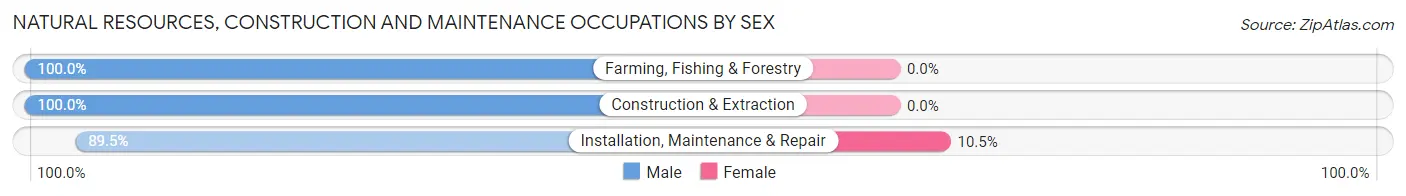
| Occupation | Male | Female |
| Farming, Fishing & Forestry | 7 (100.0%) | 0 (0.0%) |
| Construction & Extraction | 59 (100.0%) | 0 (0.0%) |
| Installation, Maintenance & Repair | 17 (89.5%) | 2 (10.5%) |
| Total (Category) | 83 (97.7%) | 2 (2.4%) |
| Total (Overall) | 310 (52.7%) | 278 (47.3%) |
Production, Transportation and Moving Occupations
The most common Production, Transportation and Moving occupations in Flemington borough are Production (73 | 12.4%), Material Moving (69 | 11.7%), and Transportation (11 | 1.9%).
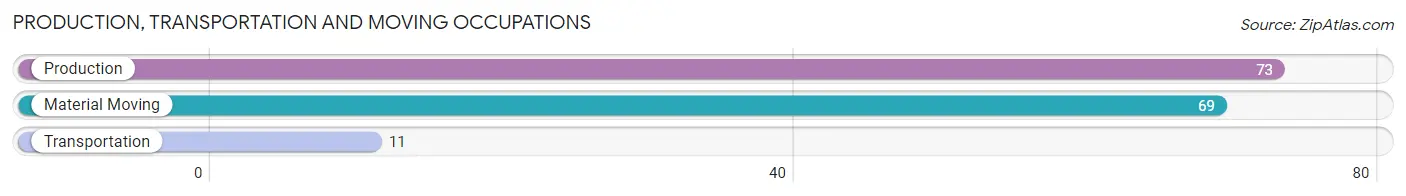
Production, Transportation and Moving Occupations by Sex
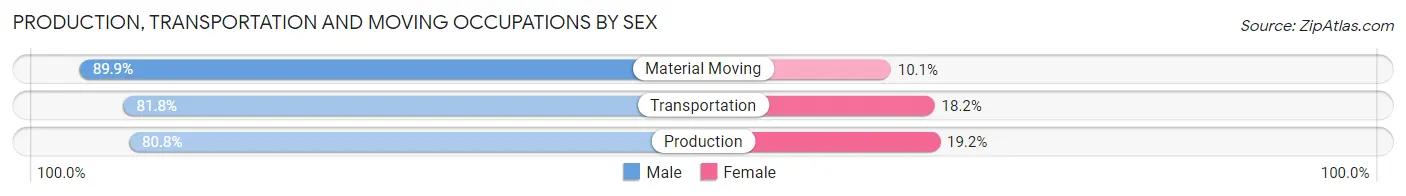
| Occupation | Male | Female |
| Production | 59 (80.8%) | 14 (19.2%) |
| Transportation | 9 (81.8%) | 2 (18.2%) |
| Material Moving | 62 (89.9%) | 7 (10.1%) |
| Total (Category) | 130 (85.0%) | 23 (15.0%) |
| Total (Overall) | 310 (52.7%) | 278 (47.3%) |
Employment Industries by Sex in Flemington borough
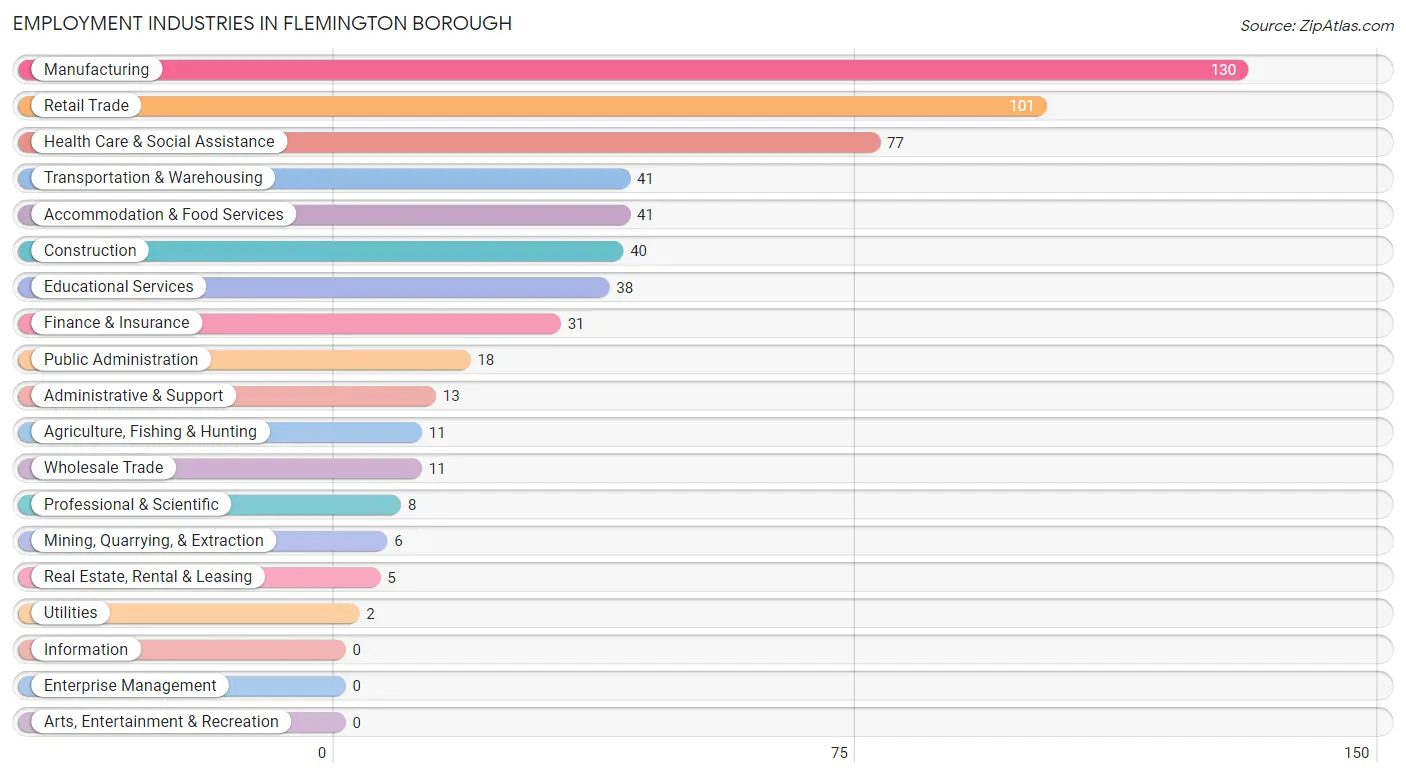
Employment Industries in Flemington borough
The major employment industries in Flemington borough include Manufacturing (130 | 22.1%), Retail Trade (101 | 17.2%), Health Care & Social Assistance (77 | 13.1%), Transportation & Warehousing (41 | 7.0%), and Accommodation & Food Services (41 | 7.0%).
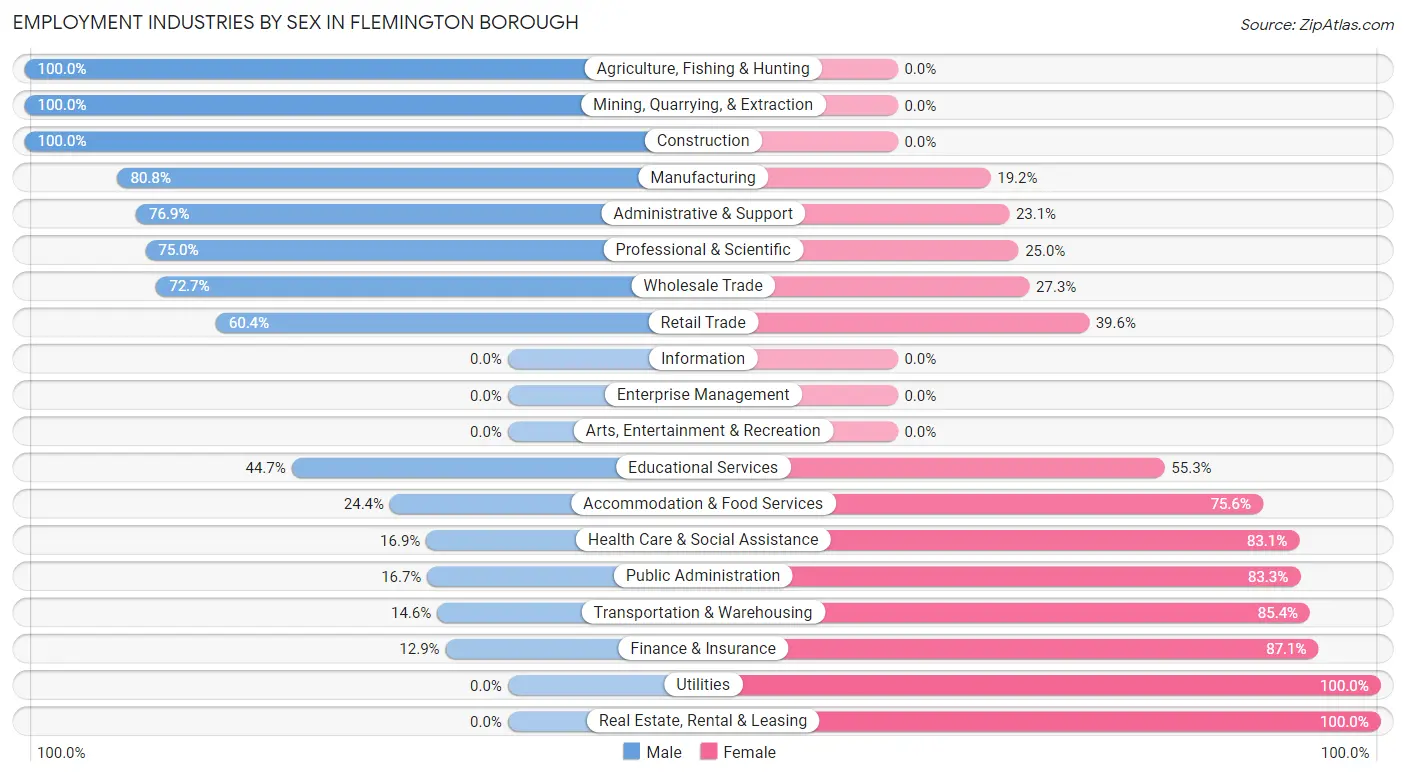
Employment Industries by Sex in Flemington borough
The Flemington borough industries that see more men than women are Agriculture, Fishing & Hunting (100.0%), Mining, Quarrying, & Extraction (100.0%), and Construction (100.0%), whereas the industries that tend to have a higher number of women are Utilities (100.0%), Real Estate, Rental & Leasing (100.0%), and Finance & Insurance (87.1%).
| Industry | Male | Female |
| Agriculture, Fishing & Hunting | 11 (100.0%) | 0 (0.0%) |
| Mining, Quarrying, & Extraction | 6 (100.0%) | 0 (0.0%) |
| Construction | 40 (100.0%) | 0 (0.0%) |
| Manufacturing | 105 (80.8%) | 25 (19.2%) |
| Wholesale Trade | 8 (72.7%) | 3 (27.3%) |
| Retail Trade | 61 (60.4%) | 40 (39.6%) |
| Transportation & Warehousing | 6 (14.6%) | 35 (85.4%) |
| Utilities | 0 (0.0%) | 2 (100.0%) |
| Information | 0 (0.0%) | 0 (0.0%) |
| Finance & Insurance | 4 (12.9%) | 27 (87.1%) |
| Real Estate, Rental & Leasing | 0 (0.0%) | 5 (100.0%) |
| Professional & Scientific | 6 (75.0%) | 2 (25.0%) |
| Enterprise Management | 0 (0.0%) | 0 (0.0%) |
| Administrative & Support | 10 (76.9%) | 3 (23.1%) |
| Educational Services | 17 (44.7%) | 21 (55.3%) |
| Health Care & Social Assistance | 13 (16.9%) | 64 (83.1%) |
| Arts, Entertainment & Recreation | 0 (0.0%) | 0 (0.0%) |
| Accommodation & Food Services | 10 (24.4%) | 31 (75.6%) |
| Public Administration | 3 (16.7%) | 15 (83.3%) |
| Total | 310 (52.7%) | 278 (47.3%) |
Education in Flemington borough
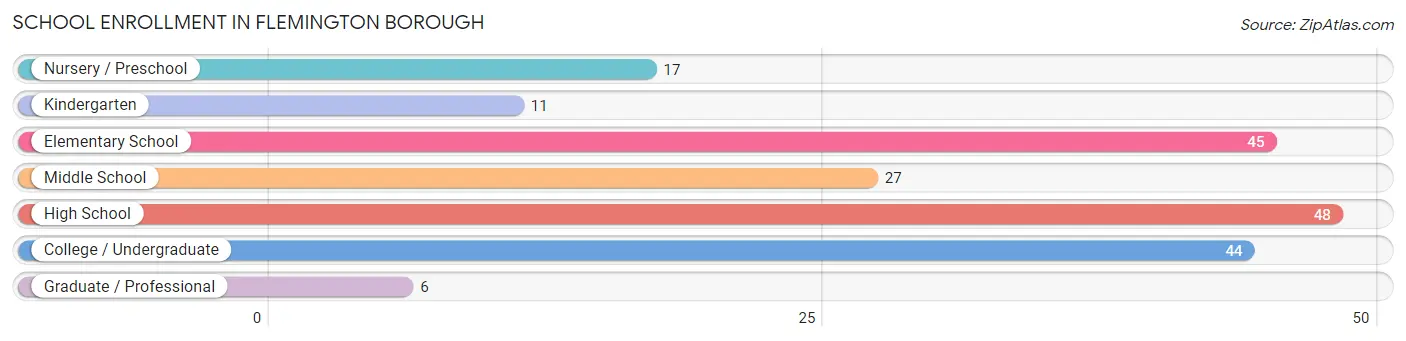
School Enrollment in Flemington borough
The most common levels of schooling among the 198 students in Flemington borough are high school (48 | 24.2%), elementary school (45 | 22.7%), and college / undergraduate (44 | 22.2%).
| School Level | # Students | % Students |
| Nursery / Preschool | 17 | 8.6% |
| Kindergarten | 11 | 5.6% |
| Elementary School | 45 | 22.7% |
| Middle School | 27 | 13.6% |
| High School | 48 | 24.2% |
| College / Undergraduate | 44 | 22.2% |
| Graduate / Professional | 6 | 3.0% |
| Total | 198 | 100.0% |
School Enrollment by Age by Funding Source in Flemington borough
Out of a total of 198 students who are enrolled in schools in Flemington borough, 21 (10.6%) attend a private institution, while the remaining 177 (89.4%) are enrolled in public schools. The age group of 5 to 9 year old has the highest likelihood of being enrolled in private schools, with 11 (29.7% in the age bracket) enrolled. Conversely, the age group of 3 to 4 year olds has the lowest likelihood of being enrolled in a private school, with 15 (100.0% in the age bracket) attending a public institution.
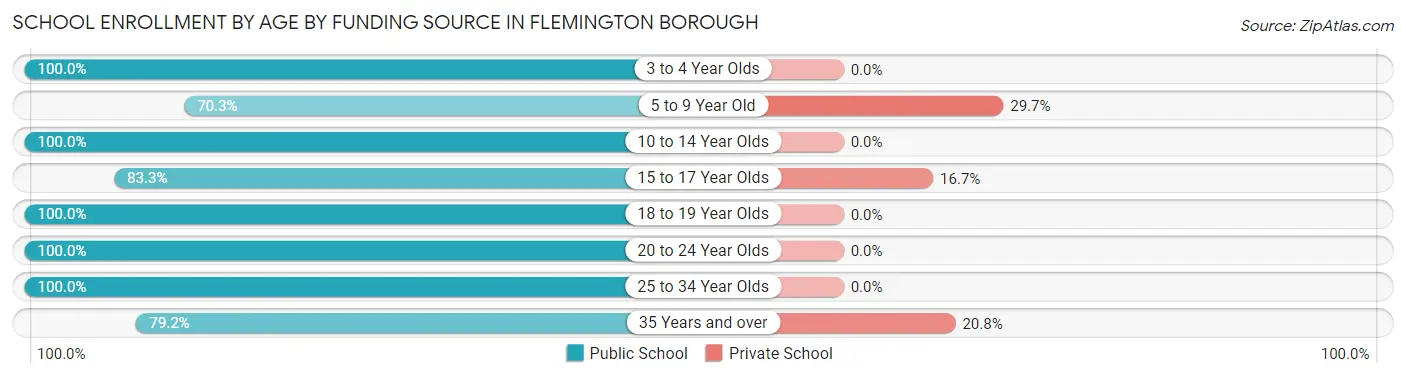
| Age Bracket | Public School | Private School |
| 3 to 4 Year Olds | 15 (100.0%) | 0 (0.0%) |
| 5 to 9 Year Old | 26 (70.3%) | 11 (29.7%) |
| 10 to 14 Year Olds | 48 (100.0%) | 0 (0.0%) |
| 15 to 17 Year Olds | 25 (83.3%) | 5 (16.7%) |
| 18 to 19 Year Olds | 13 (100.0%) | 0 (0.0%) |
| 20 to 24 Year Olds | 7 (100.0%) | 0 (0.0%) |
| 25 to 34 Year Olds | 24 (100.0%) | 0 (0.0%) |
| 35 Years and over | 19 (79.2%) | 5 (20.8%) |
| Total | 177 (89.4%) | 21 (10.6%) |
Educational Attainment by Field of Study in Flemington borough
Education (46 | 24.0%), arts & humanities (32 | 16.7%), science & technology (25 | 13.0%), business (24 | 12.5%), and liberal arts & history (16 | 8.3%) are the most common fields of study among 192 individuals in Flemington borough who have obtained a bachelor's degree or higher.
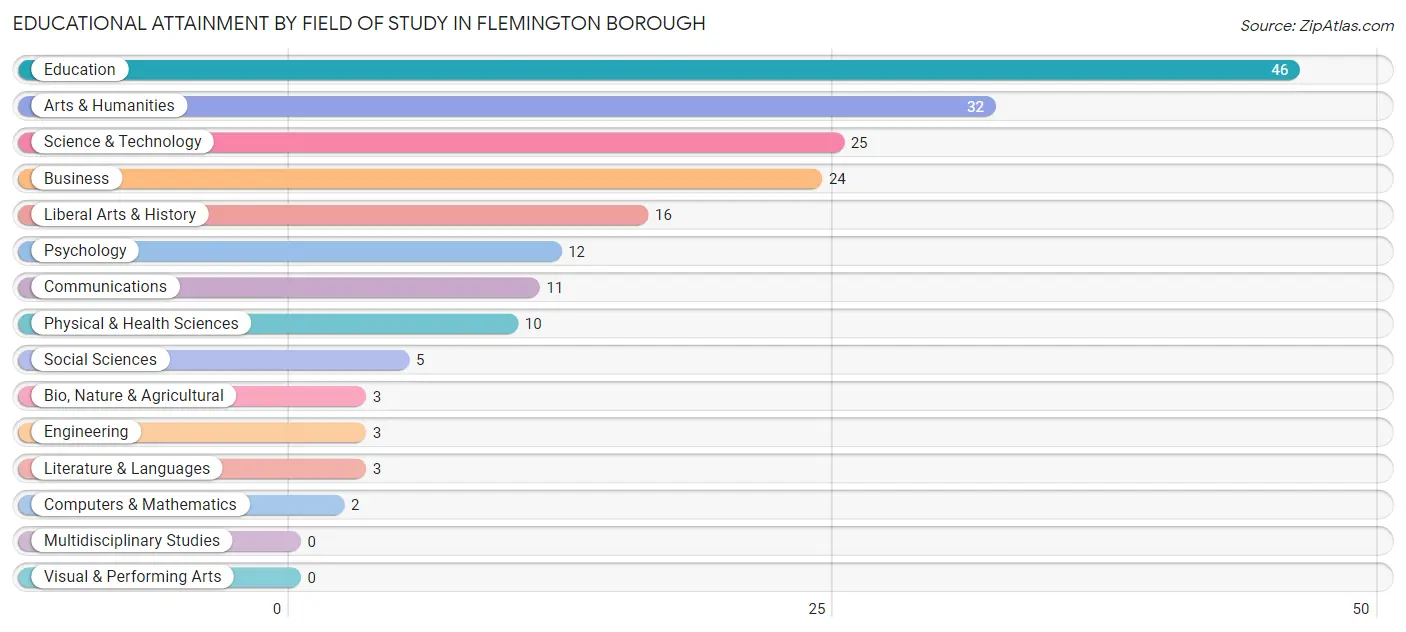
| Field of Study | # Graduates | % Graduates |
| Computers & Mathematics | 2 | 1.0% |
| Bio, Nature & Agricultural | 3 | 1.6% |
| Physical & Health Sciences | 10 | 5.2% |
| Psychology | 12 | 6.2% |
| Social Sciences | 5 | 2.6% |
| Engineering | 3 | 1.6% |
| Multidisciplinary Studies | 0 | 0.0% |
| Science & Technology | 25 | 13.0% |
| Business | 24 | 12.5% |
| Education | 46 | 24.0% |
| Literature & Languages | 3 | 1.6% |
| Liberal Arts & History | 16 | 8.3% |
| Visual & Performing Arts | 0 | 0.0% |
| Communications | 11 | 5.7% |
| Arts & Humanities | 32 | 16.7% |
| Total | 192 | 100.0% |
Transportation & Commute in Flemington borough
Vehicle Availability by Sex in Flemington borough
The most prevalent vehicle ownership categories in Flemington borough are males with 2 vehicles (128, accounting for 42.5%) and females with 2 vehicles (126, making up 46.0%).
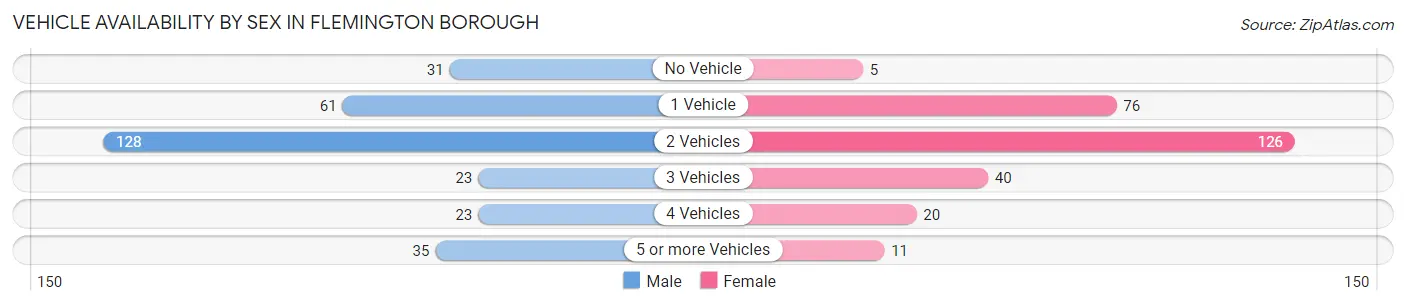
| Vehicles Available | Male | Female |
| No Vehicle | 31 (10.3%) | 5 (1.8%) |
| 1 Vehicle | 61 (20.3%) | 76 (27.3%) |
| 2 Vehicles | 128 (42.5%) | 126 (45.3%) |
| 3 Vehicles | 23 (7.6%) | 40 (14.4%) |
| 4 Vehicles | 23 (7.6%) | 20 (7.2%) |
| 5 or more Vehicles | 35 (11.6%) | 11 (4.0%) |
| Total | 301 (100.0%) | 278 (100.0%) |
Commute Time in Flemington borough
The most frequently occuring commute durations in Flemington borough are 5 to 9 minutes (138 commuters, 24.9%), less than 5 minutes (81 commuters, 14.6%), and 20 to 24 minutes (63 commuters, 11.4%).
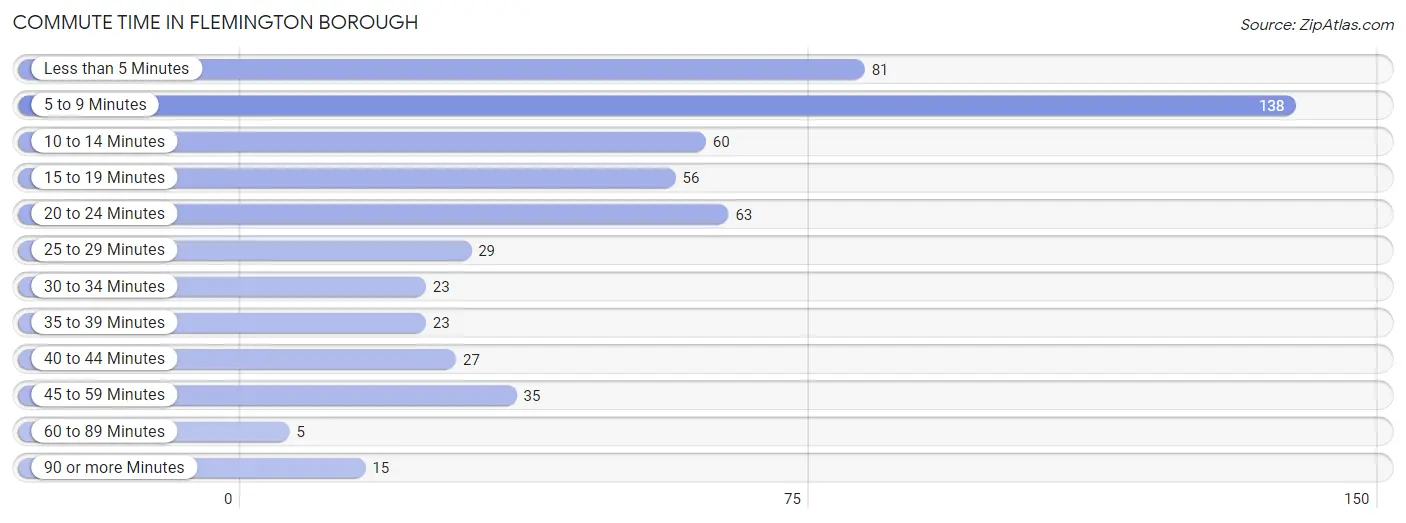
| Commute Time | # Commuters | % Commuters |
| Less than 5 Minutes | 81 | 14.6% |
| 5 to 9 Minutes | 138 | 24.9% |
| 10 to 14 Minutes | 60 | 10.8% |
| 15 to 19 Minutes | 56 | 10.1% |
| 20 to 24 Minutes | 63 | 11.4% |
| 25 to 29 Minutes | 29 | 5.2% |
| 30 to 34 Minutes | 23 | 4.1% |
| 35 to 39 Minutes | 23 | 4.1% |
| 40 to 44 Minutes | 27 | 4.9% |
| 45 to 59 Minutes | 35 | 6.3% |
| 60 to 89 Minutes | 5 | 0.9% |
| 90 or more Minutes | 15 | 2.7% |
Commute Time by Sex in Flemington borough
The most common commute times in Flemington borough are 5 to 9 minutes (69 commuters, 23.5%) for males and 5 to 9 minutes (69 commuters, 26.3%) for females.
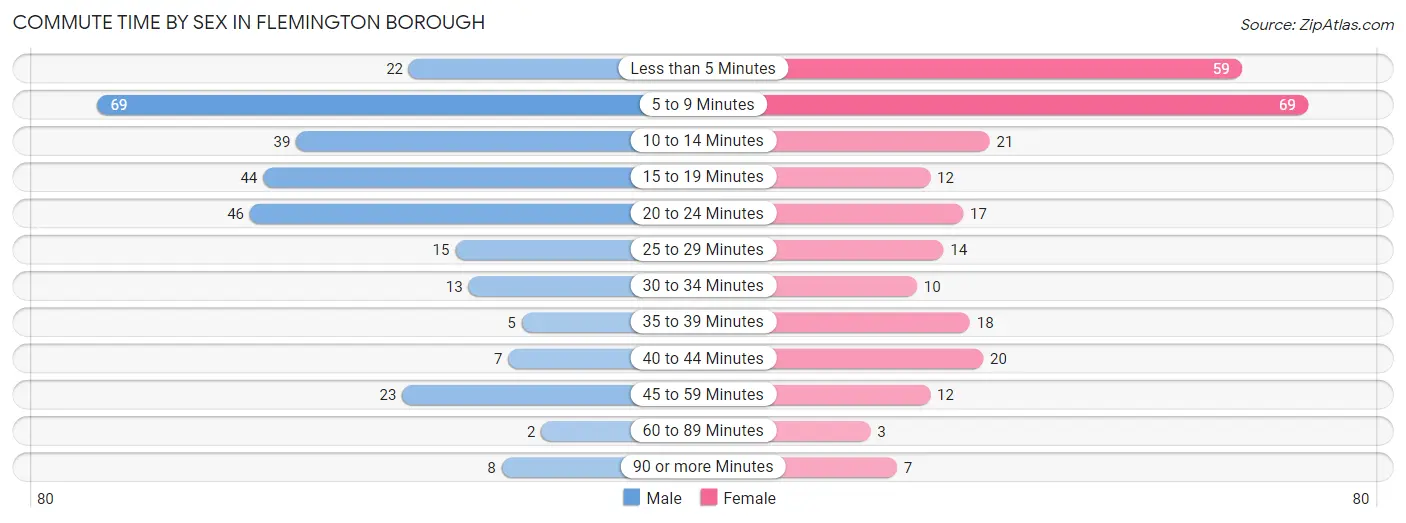
| Commute Time | Male | Female |
| Less than 5 Minutes | 22 (7.5%) | 59 (22.5%) |
| 5 to 9 Minutes | 69 (23.5%) | 69 (26.3%) |
| 10 to 14 Minutes | 39 (13.3%) | 21 (8.0%) |
| 15 to 19 Minutes | 44 (15.0%) | 12 (4.6%) |
| 20 to 24 Minutes | 46 (15.7%) | 17 (6.5%) |
| 25 to 29 Minutes | 15 (5.1%) | 14 (5.3%) |
| 30 to 34 Minutes | 13 (4.4%) | 10 (3.8%) |
| 35 to 39 Minutes | 5 (1.7%) | 18 (6.9%) |
| 40 to 44 Minutes | 7 (2.4%) | 20 (7.6%) |
| 45 to 59 Minutes | 23 (7.9%) | 12 (4.6%) |
| 60 to 89 Minutes | 2 (0.7%) | 3 (1.1%) |
| 90 or more Minutes | 8 (2.7%) | 7 (2.7%) |
Time of Departure to Work by Sex in Flemington borough
The most frequent times of departure to work in Flemington borough are 4:00 PM to 11:59 PM (59, 20.1%) for males and 6:30 AM to 6:59 AM (39, 14.9%) for females.
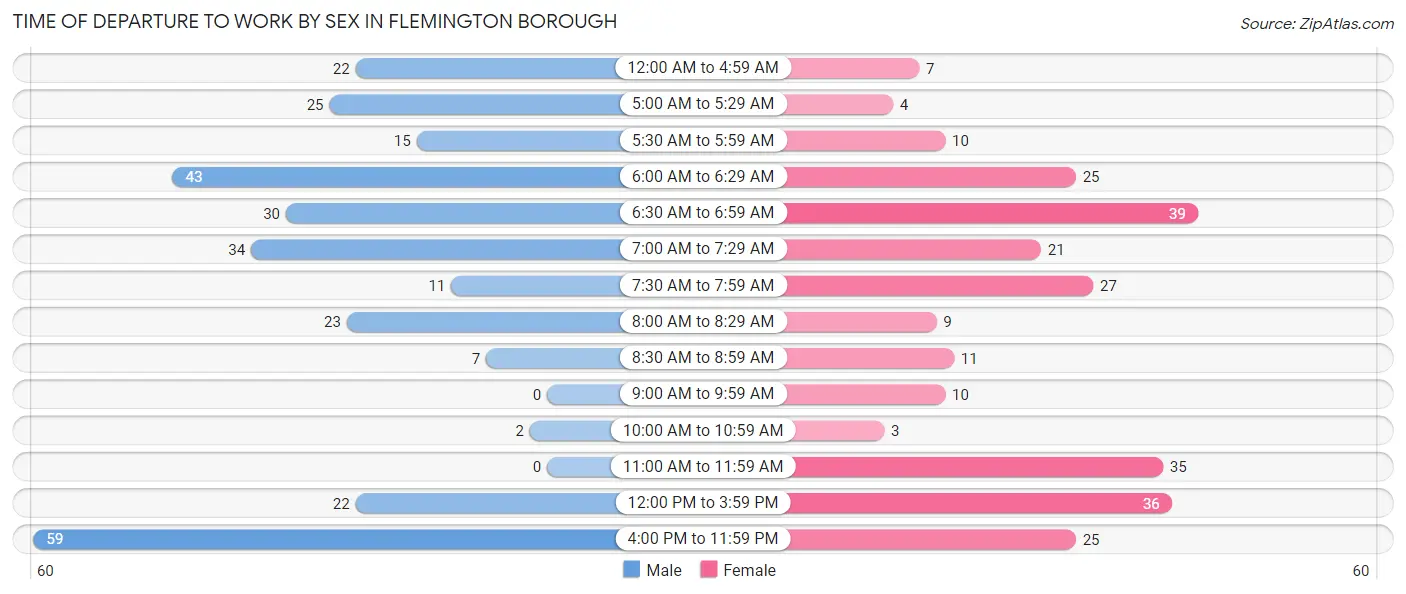
| Time of Departure | Male | Female |
| 12:00 AM to 4:59 AM | 22 (7.5%) | 7 (2.7%) |
| 5:00 AM to 5:29 AM | 25 (8.5%) | 4 (1.5%) |
| 5:30 AM to 5:59 AM | 15 (5.1%) | 10 (3.8%) |
| 6:00 AM to 6:29 AM | 43 (14.7%) | 25 (9.5%) |
| 6:30 AM to 6:59 AM | 30 (10.2%) | 39 (14.9%) |
| 7:00 AM to 7:29 AM | 34 (11.6%) | 21 (8.0%) |
| 7:30 AM to 7:59 AM | 11 (3.7%) | 27 (10.3%) |
| 8:00 AM to 8:29 AM | 23 (7.9%) | 9 (3.4%) |
| 8:30 AM to 8:59 AM | 7 (2.4%) | 11 (4.2%) |
| 9:00 AM to 9:59 AM | 0 (0.0%) | 10 (3.8%) |
| 10:00 AM to 10:59 AM | 2 (0.7%) | 3 (1.1%) |
| 11:00 AM to 11:59 AM | 0 (0.0%) | 35 (13.4%) |
| 12:00 PM to 3:59 PM | 22 (7.5%) | 36 (13.7%) |
| 4:00 PM to 11:59 PM | 59 (20.1%) | 25 (9.5%) |
| Total | 293 (100.0%) | 262 (100.0%) |
Housing Occupancy in Flemington borough
Occupancy by Ownership in Flemington borough
Of the total 576 dwellings in Flemington borough, owner-occupied units account for 416 (72.2%), while renter-occupied units make up 160 (27.8%).
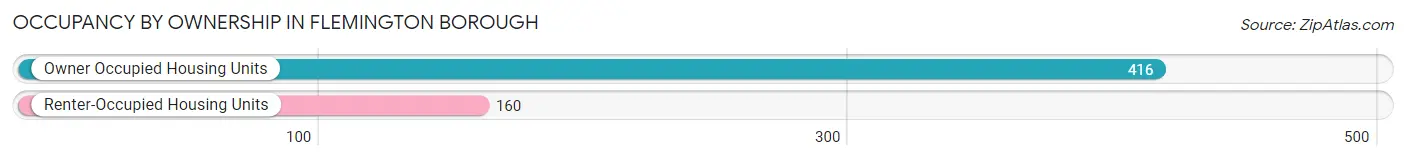
| Occupancy | # Housing Units | % Housing Units |
| Owner Occupied Housing Units | 416 | 72.2% |
| Renter-Occupied Housing Units | 160 | 27.8% |
| Total Occupied Housing Units | 576 | 100.0% |
Occupancy by Household Size in Flemington borough
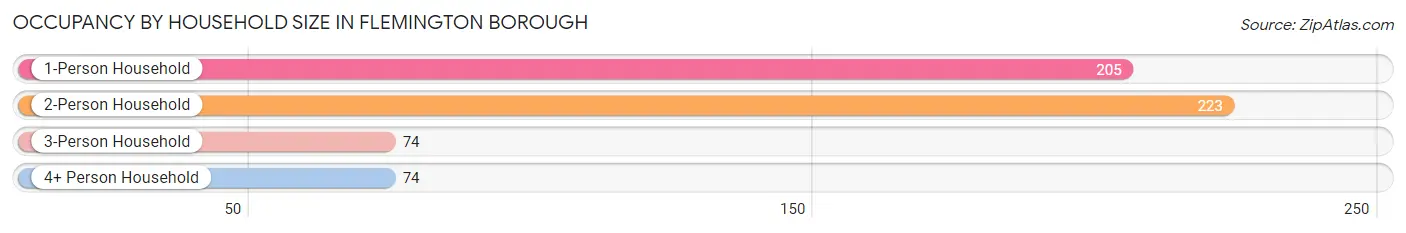
| Household Size | # Housing Units | % Housing Units |
| 1-Person Household | 205 | 35.6% |
| 2-Person Household | 223 | 38.7% |
| 3-Person Household | 74 | 12.9% |
| 4+ Person Household | 74 | 12.9% |
| Total Housing Units | 576 | 100.0% |
Occupancy by Ownership by Household Size in Flemington borough
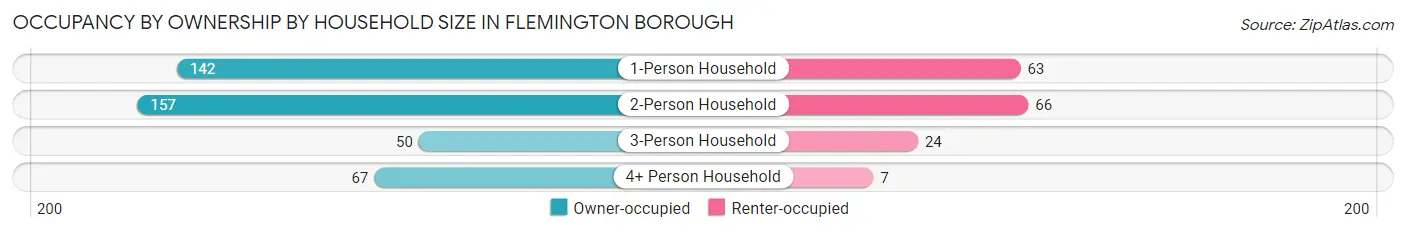
| Household Size | Owner-occupied | Renter-occupied |
| 1-Person Household | 142 (69.3%) | 63 (30.7%) |
| 2-Person Household | 157 (70.4%) | 66 (29.6%) |
| 3-Person Household | 50 (67.6%) | 24 (32.4%) |
| 4+ Person Household | 67 (90.5%) | 7 (9.5%) |
| Total Housing Units | 416 (72.2%) | 160 (27.8%) |
Occupancy by Educational Attainment in Flemington borough
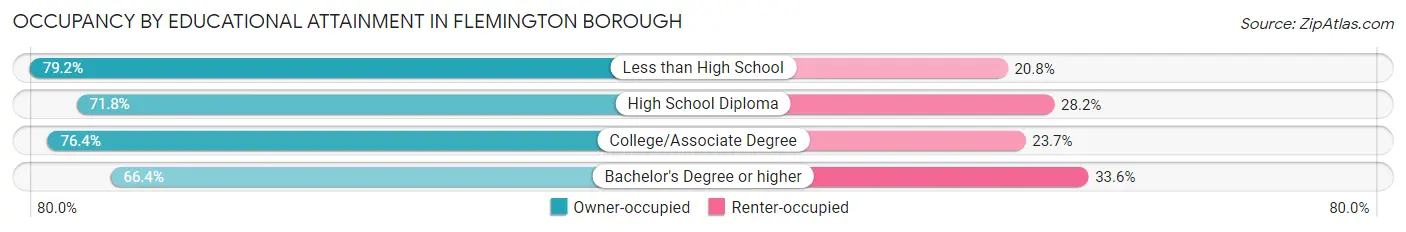
| Household Size | Owner-occupied | Renter-occupied |
| Less than High School | 19 (79.2%) | 5 (20.8%) |
| High School Diploma | 211 (71.8%) | 83 (28.2%) |
| College/Associate Degree | 113 (76.3%) | 35 (23.6%) |
| Bachelor's Degree or higher | 73 (66.4%) | 37 (33.6%) |
Occupancy by Age of Householder in Flemington borough
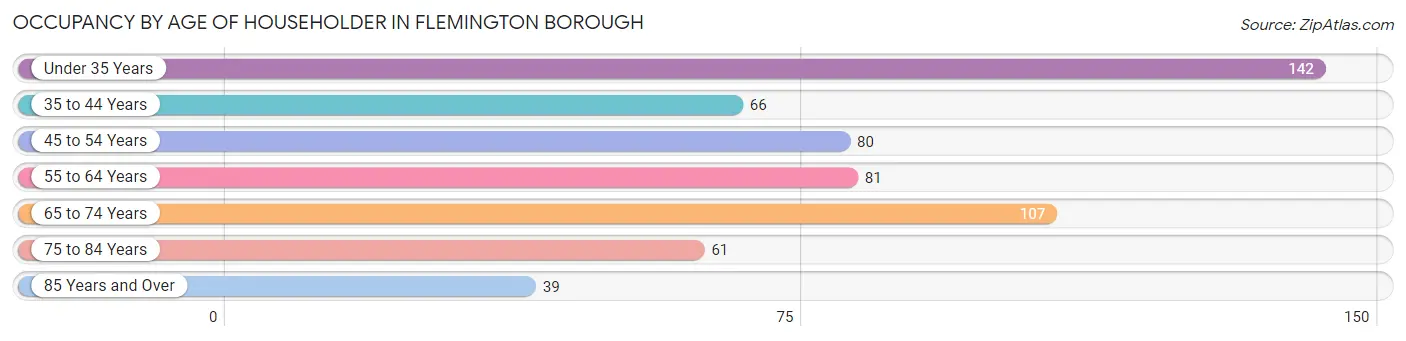
| Age Bracket | # Households | % Households |
| Under 35 Years | 142 | 24.6% |
| 35 to 44 Years | 66 | 11.5% |
| 45 to 54 Years | 80 | 13.9% |
| 55 to 64 Years | 81 | 14.1% |
| 65 to 74 Years | 107 | 18.6% |
| 75 to 84 Years | 61 | 10.6% |
| 85 Years and Over | 39 | 6.8% |
| Total | 576 | 100.0% |
Housing Finances in Flemington borough
Median Income by Occupancy in Flemington borough
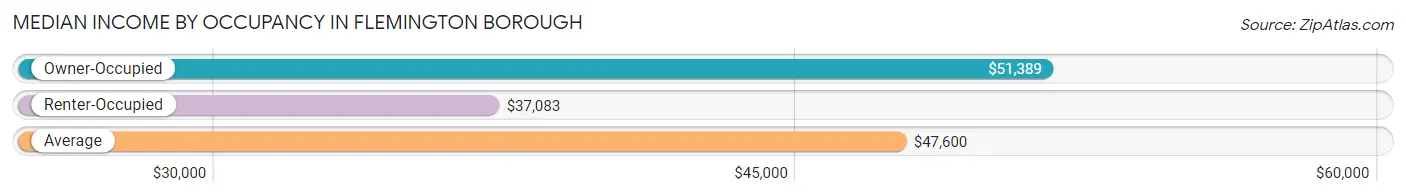
| Occupancy Type | # Households | Median Income |
| Owner-Occupied | 416 (72.2%) | $51,389 |
| Renter-Occupied | 160 (27.8%) | $37,083 |
| Average | 576 (100.0%) | $47,600 |
Occupancy by Householder Income Bracket in Flemington borough
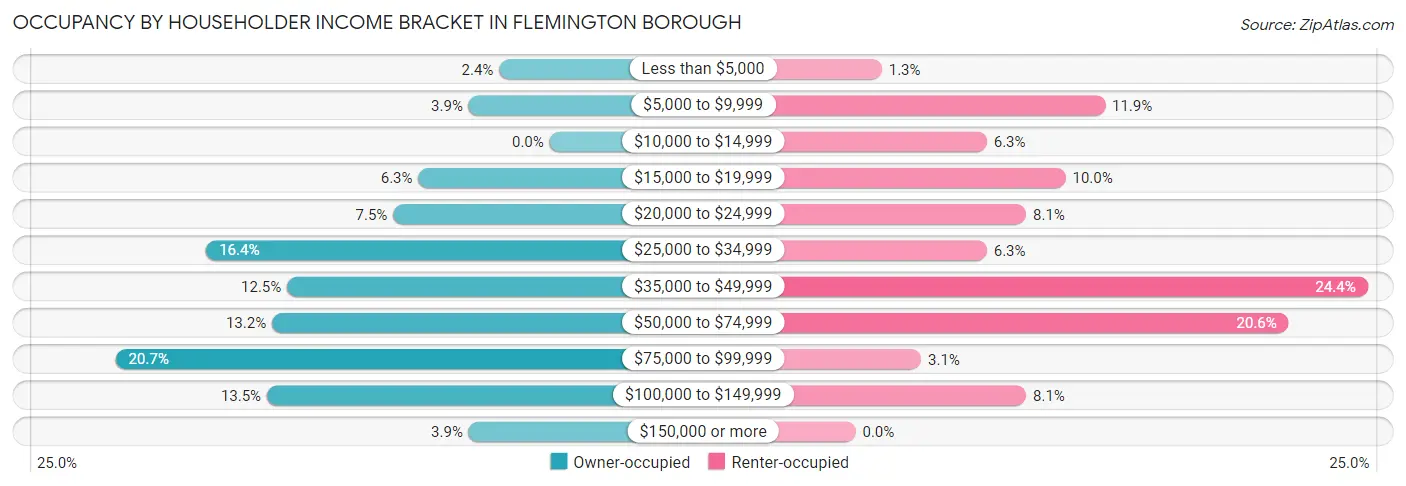
| Income Bracket | Owner-occupied | Renter-occupied |
| Less than $5,000 | 10 (2.4%) | 2 (1.3%) |
| $5,000 to $9,999 | 16 (3.8%) | 19 (11.9%) |
| $10,000 to $14,999 | 0 (0.0%) | 10 (6.2%) |
| $15,000 to $19,999 | 26 (6.2%) | 16 (10.0%) |
| $20,000 to $24,999 | 31 (7.4%) | 13 (8.1%) |
| $25,000 to $34,999 | 68 (16.4%) | 10 (6.2%) |
| $35,000 to $49,999 | 52 (12.5%) | 39 (24.4%) |
| $50,000 to $74,999 | 55 (13.2%) | 33 (20.6%) |
| $75,000 to $99,999 | 86 (20.7%) | 5 (3.1%) |
| $100,000 to $149,999 | 56 (13.5%) | 13 (8.1%) |
| $150,000 or more | 16 (3.8%) | 0 (0.0%) |
| Total | 416 (100.0%) | 160 (100.0%) |
Monthly Housing Cost Tiers in Flemington borough
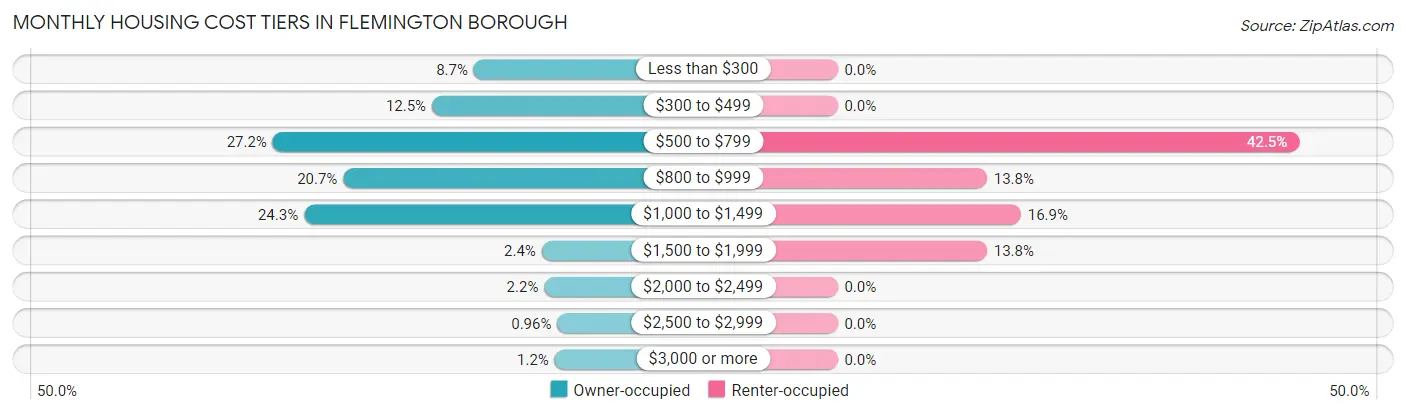
| Monthly Cost | Owner-occupied | Renter-occupied |
| Less than $300 | 36 (8.6%) | 0 (0.0%) |
| $300 to $499 | 52 (12.5%) | 0 (0.0%) |
| $500 to $799 | 113 (27.2%) | 68 (42.5%) |
| $800 to $999 | 86 (20.7%) | 22 (13.8%) |
| $1,000 to $1,499 | 101 (24.3%) | 27 (16.9%) |
| $1,500 to $1,999 | 10 (2.4%) | 22 (13.8%) |
| $2,000 to $2,499 | 9 (2.2%) | 0 (0.0%) |
| $2,500 to $2,999 | 4 (1.0%) | 0 (0.0%) |
| $3,000 or more | 5 (1.2%) | 0 (0.0%) |
| Total | 416 (100.0%) | 160 (100.0%) |
Physical Housing Characteristics in Flemington borough
Housing Structures in Flemington borough
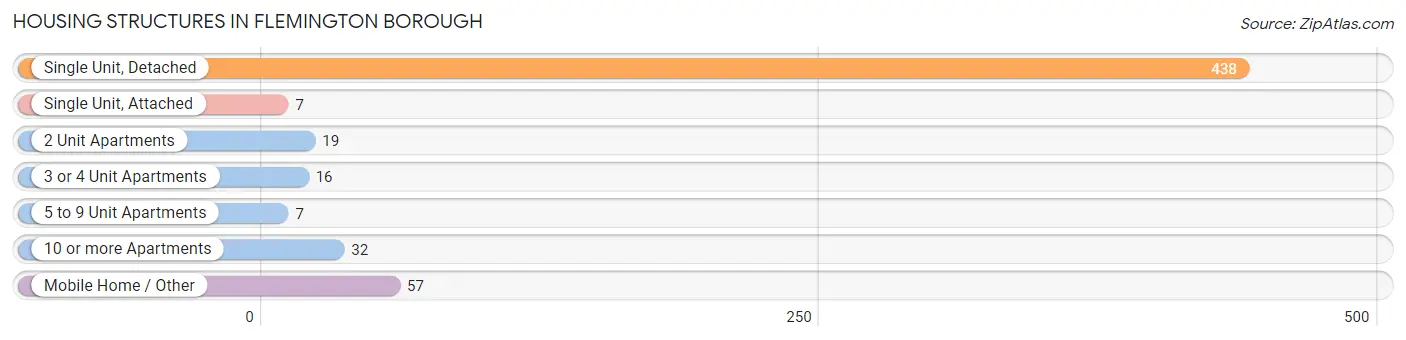
| Structure Type | # Housing Units | % Housing Units |
| Single Unit, Detached | 438 | 76.0% |
| Single Unit, Attached | 7 | 1.2% |
| 2 Unit Apartments | 19 | 3.3% |
| 3 or 4 Unit Apartments | 16 | 2.8% |
| 5 to 9 Unit Apartments | 7 | 1.2% |
| 10 or more Apartments | 32 | 5.6% |
| Mobile Home / Other | 57 | 9.9% |
| Total | 576 | 100.0% |
Housing Structures by Occupancy in Flemington borough
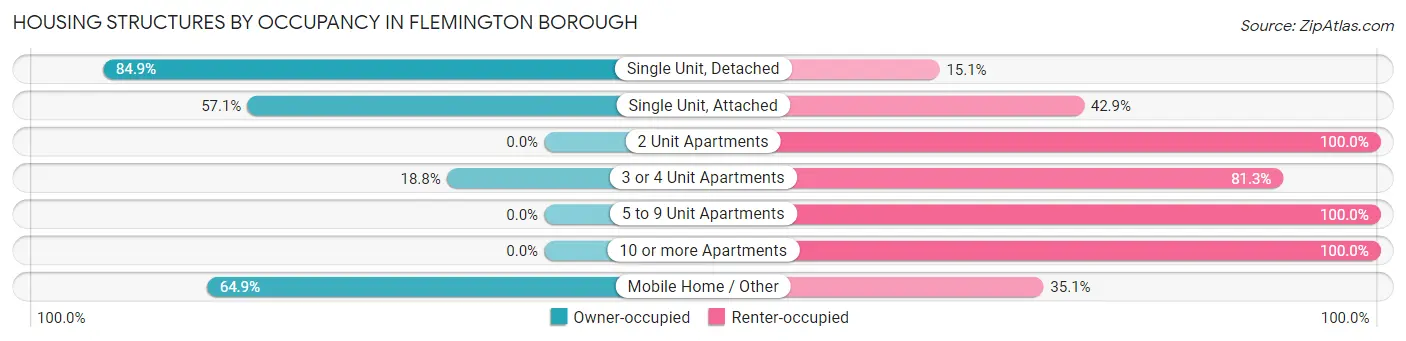
| Structure Type | Owner-occupied | Renter-occupied |
| Single Unit, Detached | 372 (84.9%) | 66 (15.1%) |
| Single Unit, Attached | 4 (57.1%) | 3 (42.9%) |
| 2 Unit Apartments | 0 (0.0%) | 19 (100.0%) |
| 3 or 4 Unit Apartments | 3 (18.8%) | 13 (81.2%) |
| 5 to 9 Unit Apartments | 0 (0.0%) | 7 (100.0%) |
| 10 or more Apartments | 0 (0.0%) | 32 (100.0%) |
| Mobile Home / Other | 37 (64.9%) | 20 (35.1%) |
| Total | 416 (72.2%) | 160 (27.8%) |
Housing Structures by Number of Rooms in Flemington borough
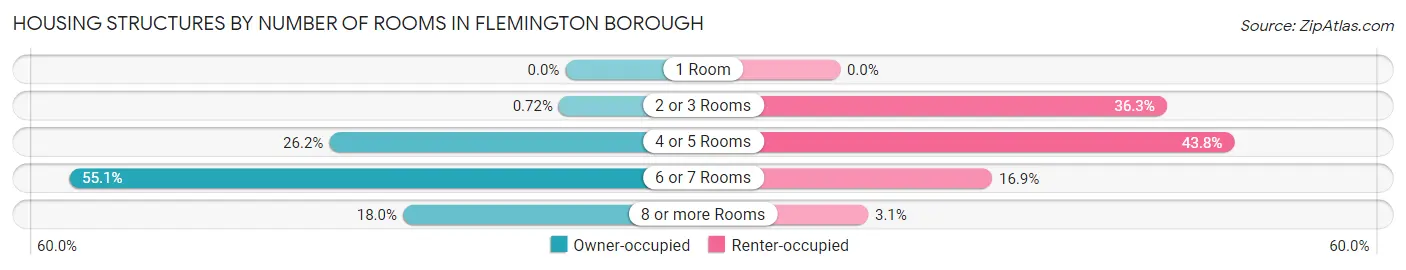
| Number of Rooms | Owner-occupied | Renter-occupied |
| 1 Room | 0 (0.0%) | 0 (0.0%) |
| 2 or 3 Rooms | 3 (0.7%) | 58 (36.2%) |
| 4 or 5 Rooms | 109 (26.2%) | 70 (43.8%) |
| 6 or 7 Rooms | 229 (55.0%) | 27 (16.9%) |
| 8 or more Rooms | 75 (18.0%) | 5 (3.1%) |
| Total | 416 (100.0%) | 160 (100.0%) |
Housing Structure by Heating Type in Flemington borough
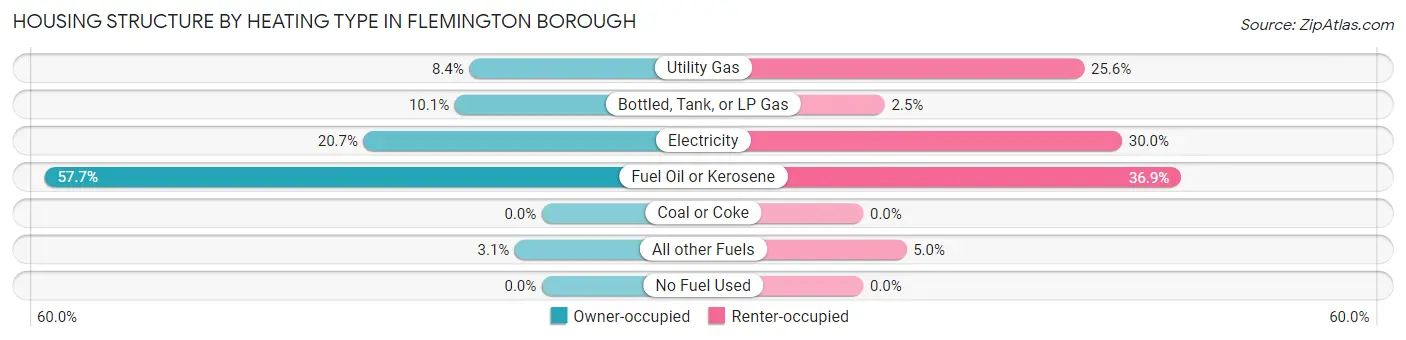
| Heating Type | Owner-occupied | Renter-occupied |
| Utility Gas | 35 (8.4%) | 41 (25.6%) |
| Bottled, Tank, or LP Gas | 42 (10.1%) | 4 (2.5%) |
| Electricity | 86 (20.7%) | 48 (30.0%) |
| Fuel Oil or Kerosene | 240 (57.7%) | 59 (36.9%) |
| Coal or Coke | 0 (0.0%) | 0 (0.0%) |
| All other Fuels | 13 (3.1%) | 8 (5.0%) |
| No Fuel Used | 0 (0.0%) | 0 (0.0%) |
| Total | 416 (100.0%) | 160 (100.0%) |
Household Vehicle Usage in Flemington borough
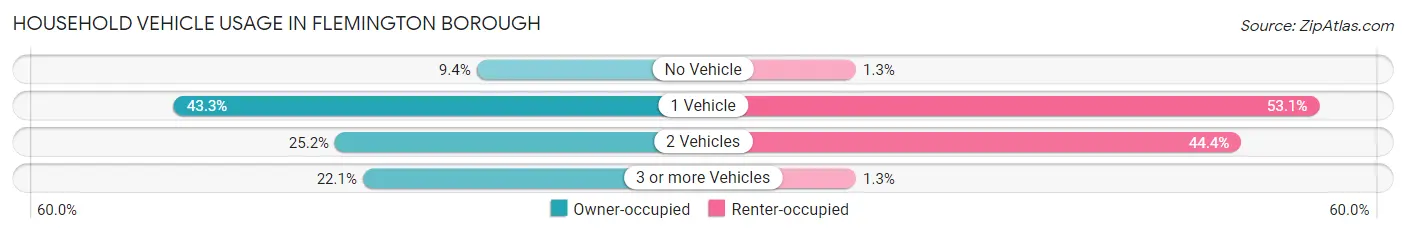
| Vehicles per Household | Owner-occupied | Renter-occupied |
| No Vehicle | 39 (9.4%) | 2 (1.3%) |
| 1 Vehicle | 180 (43.3%) | 85 (53.1%) |
| 2 Vehicles | 105 (25.2%) | 71 (44.4%) |
| 3 or more Vehicles | 92 (22.1%) | 2 (1.3%) |
| Total | 416 (100.0%) | 160 (100.0%) |
Real Estate & Mortgages in Flemington borough
Real Estate and Mortgage Overview in Flemington borough
| Characteristic | Without Mortgage | With Mortgage |
| Housing Units | 178 | 238 |
| Median Property Value | $137,500 | $132,900 |
| Median Household Income | $33,500 | $10 |
| Monthly Housing Costs | $505 | $5 |
| Real Estate Taxes | $1,632 | $0 |
Property Value by Mortgage Status in Flemington borough
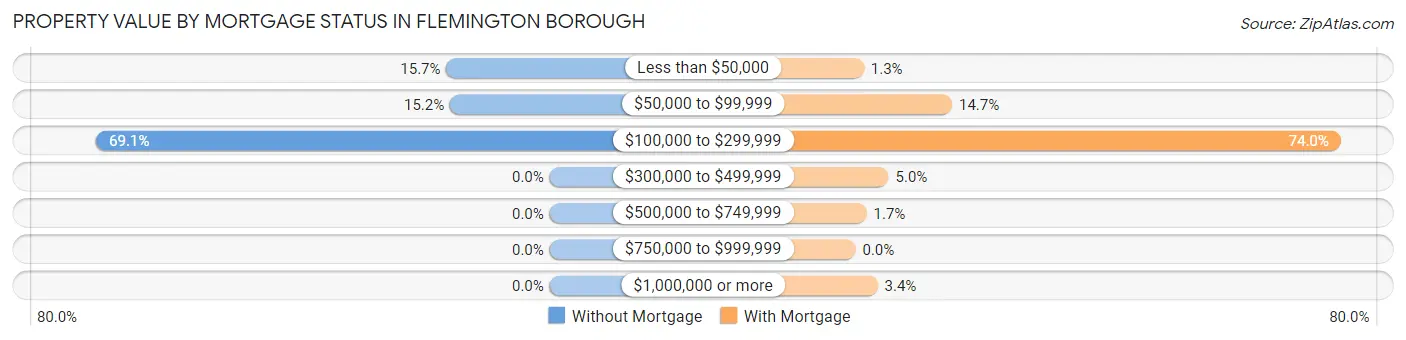
| Property Value | Without Mortgage | With Mortgage |
| Less than $50,000 | 28 (15.7%) | 3 (1.3%) |
| $50,000 to $99,999 | 27 (15.2%) | 35 (14.7%) |
| $100,000 to $299,999 | 123 (69.1%) | 176 (74.0%) |
| $300,000 to $499,999 | 0 (0.0%) | 12 (5.0%) |
| $500,000 to $749,999 | 0 (0.0%) | 4 (1.7%) |
| $750,000 to $999,999 | 0 (0.0%) | 0 (0.0%) |
| $1,000,000 or more | 0 (0.0%) | 8 (3.4%) |
| Total | 178 (100.0%) | 238 (100.0%) |
Household Income by Mortgage Status in Flemington borough
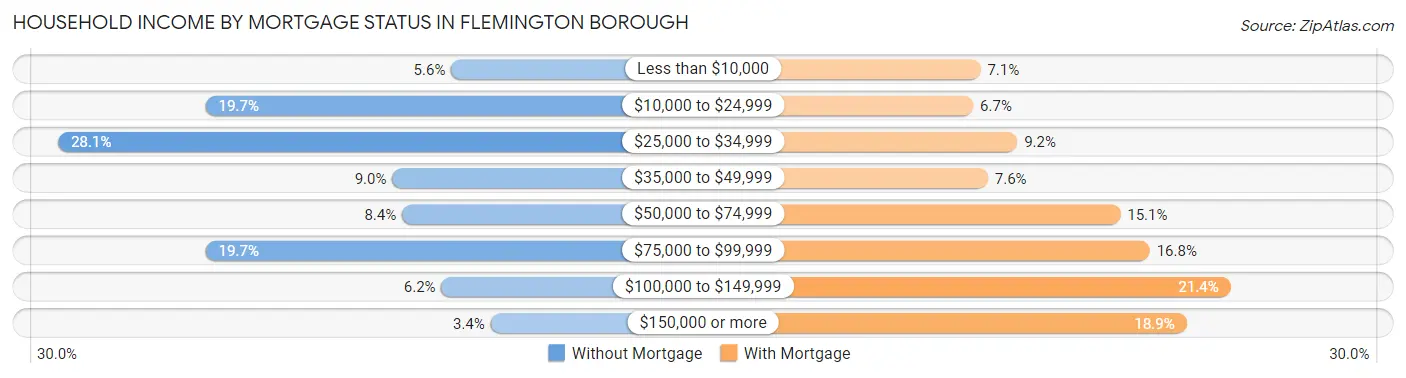
| Household Income | Without Mortgage | With Mortgage |
| Less than $10,000 | 10 (5.6%) | 17 (7.1%) |
| $10,000 to $24,999 | 35 (19.7%) | 16 (6.7%) |
| $25,000 to $34,999 | 50 (28.1%) | 22 (9.2%) |
| $35,000 to $49,999 | 16 (9.0%) | 18 (7.6%) |
| $50,000 to $74,999 | 15 (8.4%) | 36 (15.1%) |
| $75,000 to $99,999 | 35 (19.7%) | 40 (16.8%) |
| $100,000 to $149,999 | 11 (6.2%) | 51 (21.4%) |
| $150,000 or more | 6 (3.4%) | 45 (18.9%) |
| Total | 178 (100.0%) | 238 (100.0%) |
Property Value to Household Income Ratio in Flemington borough
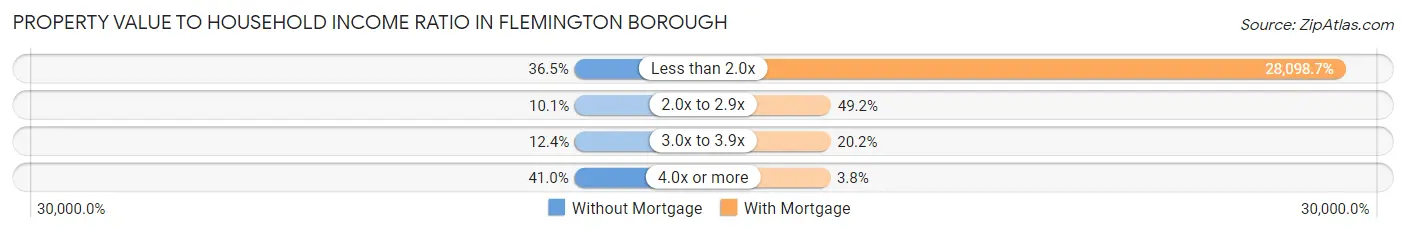
| Value-to-Income Ratio | Without Mortgage | With Mortgage |
| Less than 2.0x | 65 (36.5%) | 66,875 (28,098.7%) |
| 2.0x to 2.9x | 18 (10.1%) | 117 (49.2%) |
| 3.0x to 3.9x | 22 (12.4%) | 48 (20.2%) |
| 4.0x or more | 73 (41.0%) | 9 (3.8%) |
| Total | 178 (100.0%) | 238 (100.0%) |
Real Estate Taxes by Mortgage Status in Flemington borough
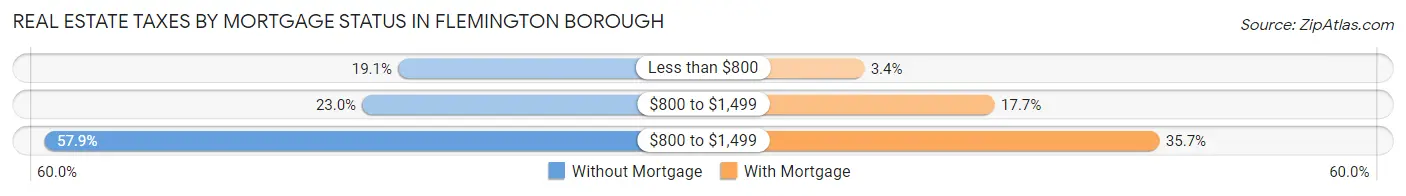
| Property Taxes | Without Mortgage | With Mortgage |
| Less than $800 | 34 (19.1%) | 8 (3.4%) |
| $800 to $1,499 | 41 (23.0%) | 42 (17.6%) |
| $800 to $1,499 | 103 (57.9%) | 85 (35.7%) |
| Total | 178 (100.0%) | 238 (100.0%) |
Health & Disability in Flemington borough
Health Insurance Coverage by Age in Flemington borough
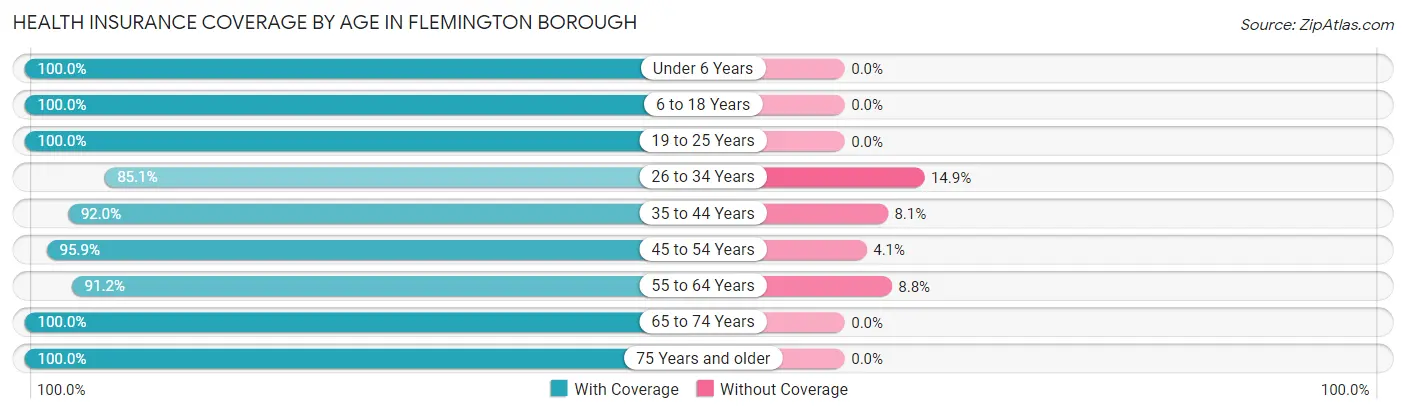
| Age Bracket | With Coverage | Without Coverage |
| Under 6 Years | 96 (100.0%) | 0 (0.0%) |
| 6 to 18 Years | 134 (100.0%) | 0 (0.0%) |
| 19 to 25 Years | 169 (100.0%) | 0 (0.0%) |
| 26 to 34 Years | 126 (85.1%) | 22 (14.9%) |
| 35 to 44 Years | 137 (91.9%) | 12 (8.1%) |
| 45 to 54 Years | 117 (95.9%) | 5 (4.1%) |
| 55 to 64 Years | 135 (91.2%) | 13 (8.8%) |
| 65 to 74 Years | 158 (100.0%) | 0 (0.0%) |
| 75 Years and older | 141 (100.0%) | 0 (0.0%) |
| Total | 1,213 (95.9%) | 52 (4.1%) |
Health Insurance Coverage by Citizenship Status in Flemington borough
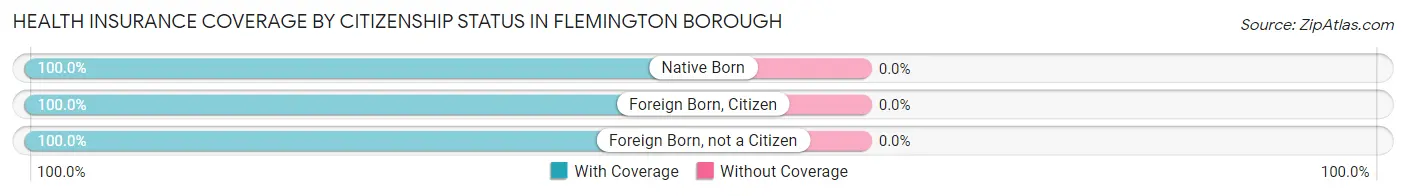
| Citizenship Status | With Coverage | Without Coverage |
| Native Born | 96 (100.0%) | 0 (0.0%) |
| Foreign Born, Citizen | 134 (100.0%) | 0 (0.0%) |
| Foreign Born, not a Citizen | 169 (100.0%) | 0 (0.0%) |
Health Insurance Coverage by Household Income in Flemington borough
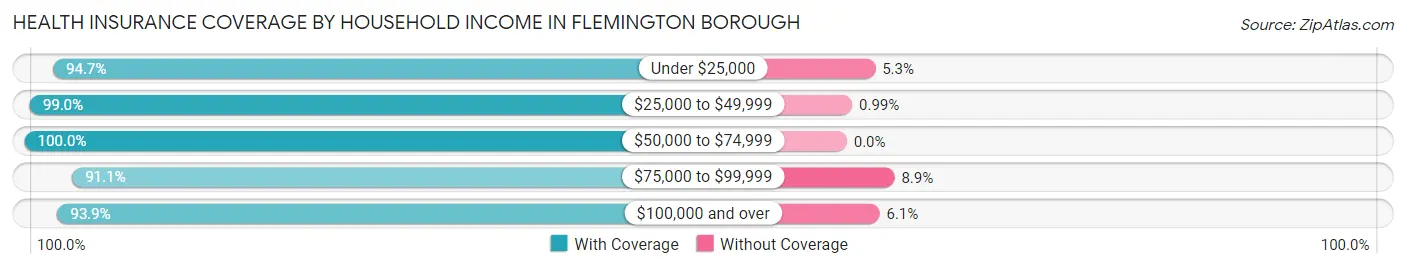
| Household Income | With Coverage | Without Coverage |
| Under $25,000 | 231 (94.7%) | 13 (5.3%) |
| $25,000 to $49,999 | 299 (99.0%) | 3 (1.0%) |
| $50,000 to $74,999 | 234 (100.0%) | 0 (0.0%) |
| $75,000 to $99,999 | 204 (91.1%) | 20 (8.9%) |
| $100,000 and over | 245 (93.9%) | 16 (6.1%) |
Public vs Private Health Insurance Coverage by Age in Flemington borough
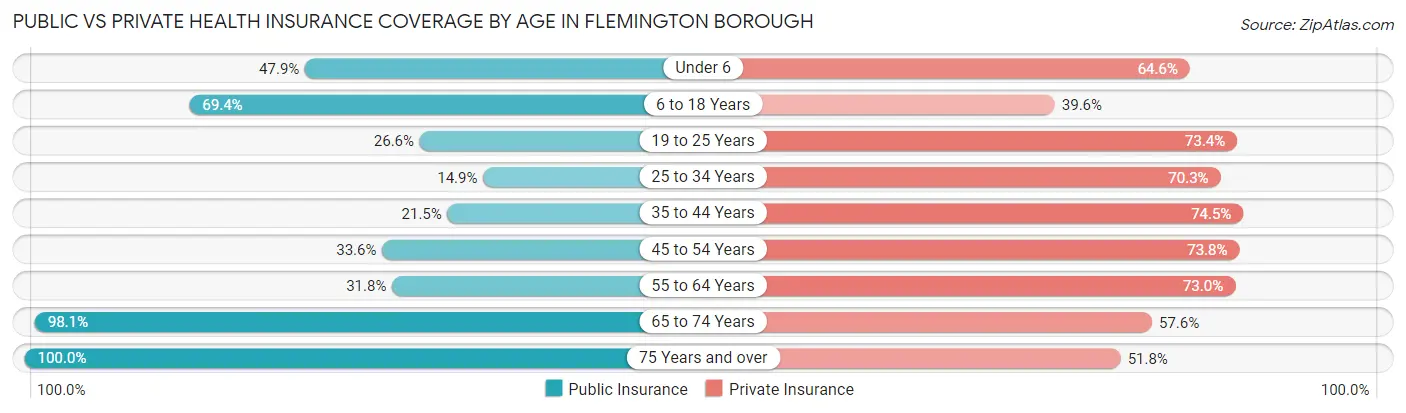
| Age Bracket | Public Insurance | Private Insurance |
| Under 6 | 46 (47.9%) | 62 (64.6%) |
| 6 to 18 Years | 93 (69.4%) | 53 (39.6%) |
| 19 to 25 Years | 45 (26.6%) | 124 (73.4%) |
| 25 to 34 Years | 22 (14.9%) | 104 (70.3%) |
| 35 to 44 Years | 32 (21.5%) | 111 (74.5%) |
| 45 to 54 Years | 41 (33.6%) | 90 (73.8%) |
| 55 to 64 Years | 47 (31.8%) | 108 (73.0%) |
| 65 to 74 Years | 155 (98.1%) | 91 (57.6%) |
| 75 Years and over | 141 (100.0%) | 73 (51.8%) |
| Total | 622 (49.2%) | 816 (64.5%) |
Disability Status by Sex by Age in Flemington borough
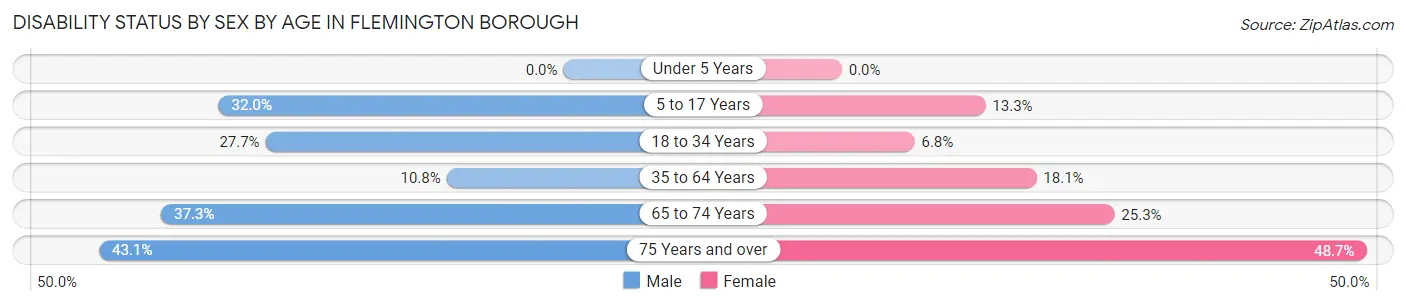
| Age Bracket | Male | Female |
| Under 5 Years | 0 (0.0%) | 0 (0.0%) |
| 5 to 17 Years | 16 (32.0%) | 10 (13.3%) |
| 18 to 34 Years | 47 (27.7%) | 11 (6.8%) |
| 35 to 64 Years | 22 (10.8%) | 39 (18.1%) |
| 65 to 74 Years | 28 (37.3%) | 21 (25.3%) |
| 75 Years and over | 28 (43.1%) | 37 (48.7%) |
Disability Class by Sex by Age in Flemington borough
Disability Class: Hearing Difficulty
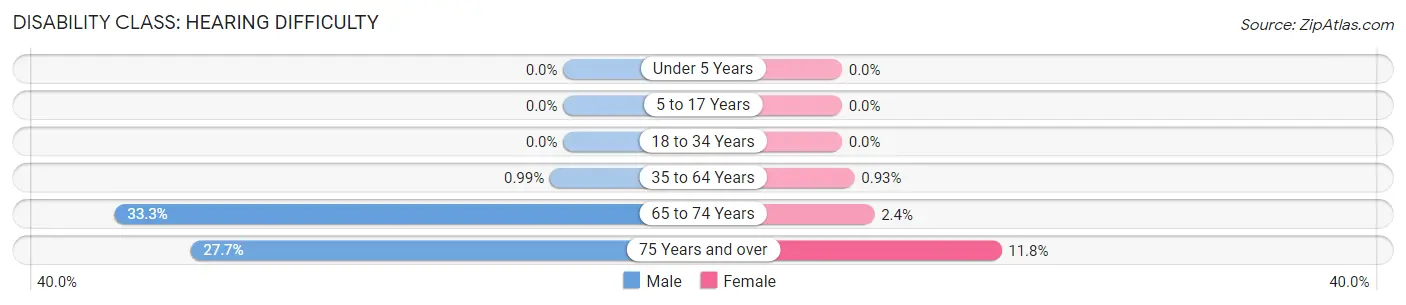
| Age Bracket | Male | Female |
| Under 5 Years | 0 (0.0%) | 0 (0.0%) |
| 5 to 17 Years | 0 (0.0%) | 0 (0.0%) |
| 18 to 34 Years | 0 (0.0%) | 0 (0.0%) |
| 35 to 64 Years | 2 (1.0%) | 2 (0.9%) |
| 65 to 74 Years | 25 (33.3%) | 2 (2.4%) |
| 75 Years and over | 18 (27.7%) | 9 (11.8%) |
Disability Class: Vision Difficulty
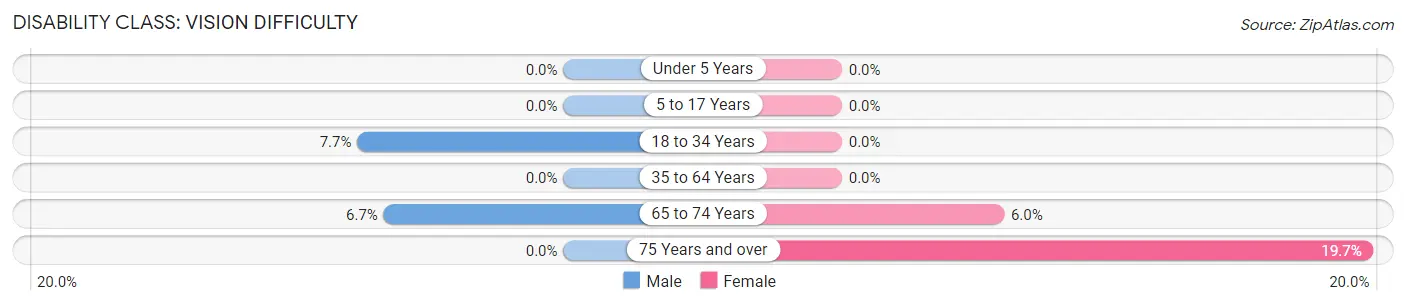
| Age Bracket | Male | Female |
| Under 5 Years | 0 (0.0%) | 0 (0.0%) |
| 5 to 17 Years | 0 (0.0%) | 0 (0.0%) |
| 18 to 34 Years | 13 (7.6%) | 0 (0.0%) |
| 35 to 64 Years | 0 (0.0%) | 0 (0.0%) |
| 65 to 74 Years | 5 (6.7%) | 5 (6.0%) |
| 75 Years and over | 0 (0.0%) | 15 (19.7%) |
Disability Class: Cognitive Difficulty
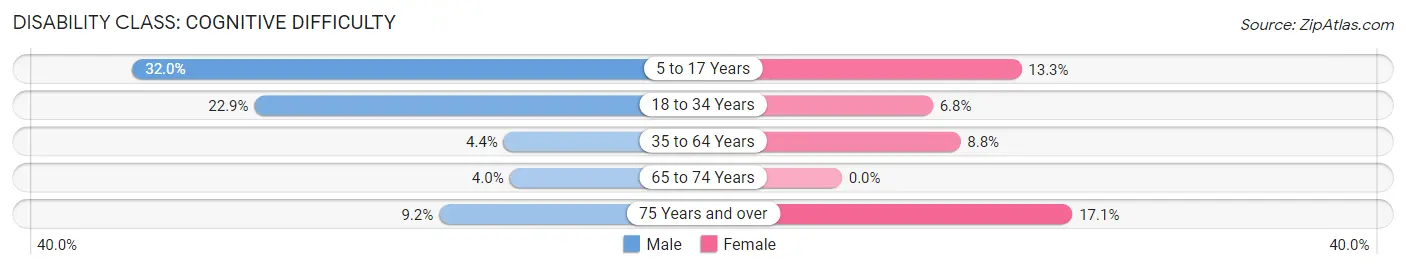
| Age Bracket | Male | Female |
| 5 to 17 Years | 16 (32.0%) | 10 (13.3%) |
| 18 to 34 Years | 39 (22.9%) | 11 (6.8%) |
| 35 to 64 Years | 9 (4.4%) | 19 (8.8%) |
| 65 to 74 Years | 3 (4.0%) | 0 (0.0%) |
| 75 Years and over | 6 (9.2%) | 13 (17.1%) |
Disability Class: Ambulatory Difficulty
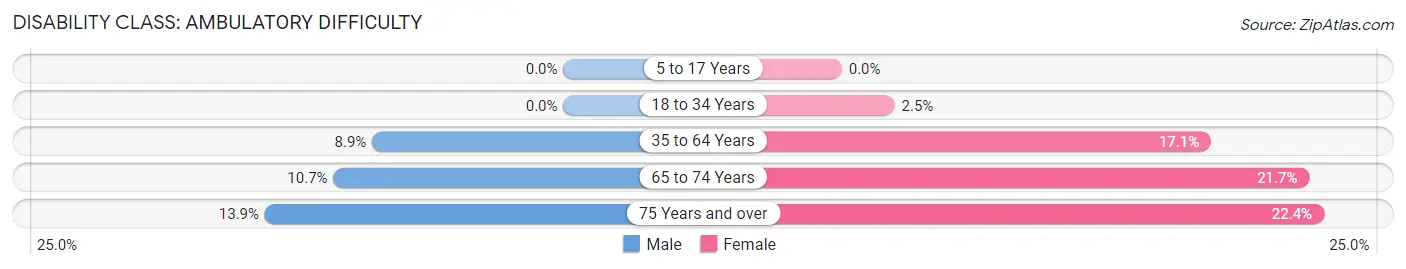
| Age Bracket | Male | Female |
| 5 to 17 Years | 0 (0.0%) | 0 (0.0%) |
| 18 to 34 Years | 0 (0.0%) | 4 (2.5%) |
| 35 to 64 Years | 18 (8.9%) | 37 (17.1%) |
| 65 to 74 Years | 8 (10.7%) | 18 (21.7%) |
| 75 Years and over | 9 (13.9%) | 17 (22.4%) |
Disability Class: Self-Care Difficulty
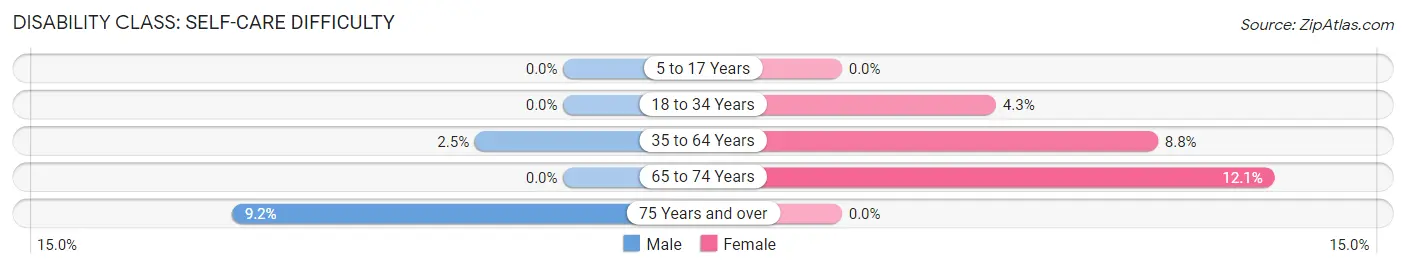
| Age Bracket | Male | Female |
| 5 to 17 Years | 0 (0.0%) | 0 (0.0%) |
| 18 to 34 Years | 0 (0.0%) | 7 (4.3%) |
| 35 to 64 Years | 5 (2.5%) | 19 (8.8%) |
| 65 to 74 Years | 0 (0.0%) | 10 (12.0%) |
| 75 Years and over | 6 (9.2%) | 0 (0.0%) |
Technology Access in Flemington borough
Computing Device Access in Flemington borough
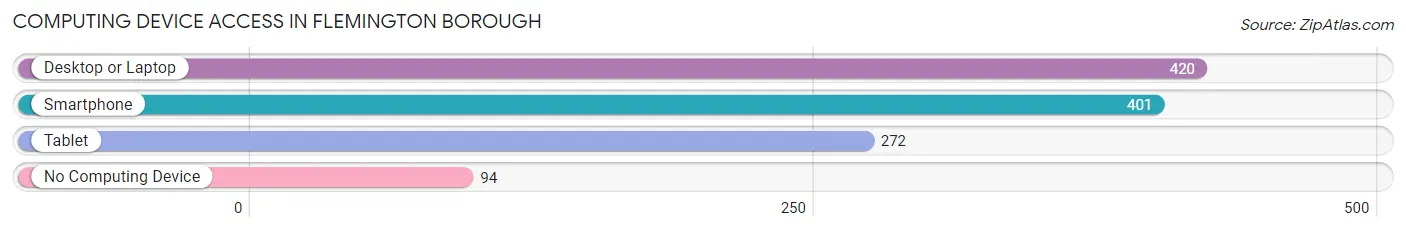
| Device Type | # Households | % Households |
| Desktop or Laptop | 420 | 72.9% |
| Smartphone | 401 | 69.6% |
| Tablet | 272 | 47.2% |
| No Computing Device | 94 | 16.3% |
| Total | 576 | 100.0% |
Internet Access in Flemington borough
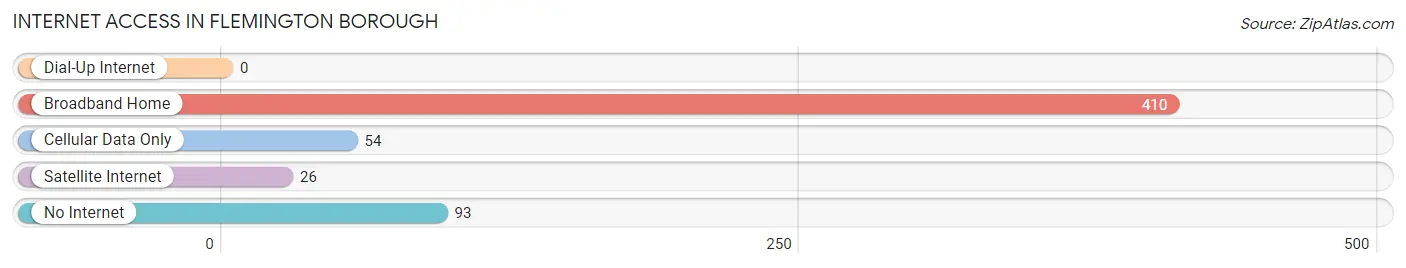
| Internet Type | # Households | % Households |
| Dial-Up Internet | 0 | 0.0% |
| Broadband Home | 410 | 71.2% |
| Cellular Data Only | 54 | 9.4% |
| Satellite Internet | 26 | 4.5% |
| No Internet | 93 | 16.2% |
| Total | 576 | 100.0% |
Flemington borough Summary
Flemington Borough is a small borough located in Hunterdon County, New Jersey. It is situated in the heart of the Raritan Valley, approximately 40 miles west of New York City. The borough is bordered by Raritan Township to the north, Delaware Township to the east, and East Amwell Township to the south and west. Flemington Borough is home to a population of 4,581 people, according to the 2010 United States Census.
Geography
Flemington Borough is located at 40°25'17" North, 74°51'45" West (40.4214, -74.8625). It has a total area of 1.2 square miles, all of which is land. The borough is situated in the Raritan Valley, a region of the state that is known for its rolling hills and fertile farmland. The borough is located at the intersection of Routes 12 and 31, which provide access to nearby cities such as Trenton, Princeton, and New Brunswick.
Climate
Flemington Borough has a humid continental climate, with hot, humid summers and cold, snowy winters. The average temperature in the summer is around 75°F, while the average temperature in the winter is around 25°F. The average annual precipitation is around 45 inches.
Demographics
As of the 2010 United States Census, there were 4,581 people, 1,845 households, and 1,093 families residing in the borough. The population density was 3,817.7 people per square mile. The racial makeup of the borough was 87.2% White, 5.2% African American, 0.2% Native American, 3.3% Asian, 0.1% Pacific Islander, 1.7% from other races, and 2.3% from two or more races. Hispanic or Latino of any race were 6.7% of the population.
There were 1,845 households, out of which 28.3% had children under the age of 18 living with them, 43.2% were married couples living together, 11.7% had a female householder with no husband present, and 40.2% were non-families. 33.2% of all households were made up of individuals, and 11.7% had someone living alone who was 65 years of age or older. The average household size was 2.48 and the average family size was 3.17.
The median age in the borough was 39.7 years. 22.3% of residents were under the age of 18; 8.2% were between the ages of 18 and 24; 28.2% were from 25 to 44; 27.2% were from 45 to 64; and 14.1% were 65 years of age or older. The gender makeup of the borough was 48.2% male and 51.8% female.
Economy
Flemington Borough is home to a variety of businesses, including retail stores, restaurants, and professional services. The borough is also home to the Flemington Outlets, a large outlet mall that features a variety of stores and restaurants. The borough is also home to several corporate headquarters, including the headquarters of the Hunterdon County Chamber of Commerce and the Hunterdon County Economic Development Corporation.
The borough is also home to several educational institutions, including the Hunterdon County Polytech, a vocational school that offers a variety of courses in the fields of engineering, business, and health sciences. The borough is also home to the Hunterdon County Library, which serves the entire county.
Conclusion
Flemington Borough is a small borough located in Hunterdon County, New Jersey. It is situated in the heart of the Raritan Valley, approximately 40 miles west of New York City. The borough is home to a population of 4,581 people, according to the 2010 United States Census. Flemington Borough has a humid continental climate, with hot, humid summers and cold, snowy winters. The borough is home to a variety of businesses, including retail stores, restaurants, and professional services. The borough is also home to several educational institutions, including the Hunterdon County Polytech and the Hunterdon County Library.
Common Questions
What is Per Capita Income in Flemington borough?
Per Capita income in Flemington borough is $27,195.
What is the Median Family Income in Flemington borough?
Median Family Income in Flemington borough is $57,969.
What is the Median Household income in Flemington borough?
Median Household Income in Flemington borough is $47,600.
What is Income or Wage Gap in Flemington borough?
Income or Wage Gap in Flemington borough is 9.4%.
Women in Flemington borough earn 90.6 cents for every dollar earned by a man.
What is Inequality or Gini Index in Flemington borough?
Inequality or Gini Index in Flemington borough is 0.40.
What is the Total Population of Flemington borough?
Total Population of Flemington borough is 1,265.
What is the Total Male Population of Flemington borough?
Total Male Population of Flemington borough is 591.
What is the Total Female Population of Flemington borough?
Total Female Population of Flemington borough is 674.
What is the Ratio of Males per 100 Females in Flemington borough?
There are 87.69 Males per 100 Females in Flemington borough.
What is the Ratio of Females per 100 Males in Flemington borough?
There are 114.04 Females per 100 Males in Flemington borough.
What is the Median Population Age in Flemington borough?
Median Population Age in Flemington borough is 40.0 Years.
What is the Average Family Size in Flemington borough
Average Family Size in Flemington borough is 2.9 People.
What is the Average Household Size in Flemington borough
Average Household Size in Flemington borough is 2.2 People.
How Large is the Labor Force in Flemington borough?
There are 623 People in the Labor Forcein in Flemington borough.
What is the Percentage of People in the Labor Force in Flemington borough?
57.8% of People are in the Labor Force in Flemington borough.
What is the Unemployment Rate in Flemington borough?
Unemployment Rate in Flemington borough is 5.6%.