New Wilmington borough, PA Map & Demographics
New Wilmington borough Overview
$22,091
PER CAPITA INCOME
$111,786
AVG FAMILY INCOME
$73,611
AVG HOUSEHOLD INCOME
12.3%
WAGE / INCOME GAP [ % ]
87.7¢/ $1
WAGE / INCOME GAP [ $ ]
0.41
INEQUALITY / GINI INDEX
2,157
TOTAL POPULATION
1,063
MALE POPULATION
1,094
FEMALE POPULATION
97.17
MALES / 100 FEMALES
102.92
FEMALES / 100 MALES
21.5
MEDIAN AGE
3.0
AVG FAMILY SIZE
2.3
AVG HOUSEHOLD SIZE
1,173
LABOR FORCE [ PEOPLE ]
60.6%
PERCENT IN LABOR FORCE
0.9%
UNEMPLOYMENT RATE
Income in New Wilmington borough
Income Overview in New Wilmington borough
Per Capita Income in New Wilmington borough is $22,091, while median incomes of families and households are $111,786 and $73,611 respectively.
| Characteristic | Number | Measure |
| Per Capita Income | 2,157 | $22,091 |
| Median Family Income | 256 | $111,786 |
| Mean Family Income | 256 | $116,010 |
| Median Household Income | 468 | $73,611 |
| Mean Household Income | 468 | $87,335 |
| Income Deficit | 256 | $0 |
| Wage / Income Gap (%) | 2,157 | 12.31% |
| Wage / Income Gap ($) | 2,157 | 87.69¢ per $1 |
| Gini / Inequality Index | 2,157 | 0.41 |
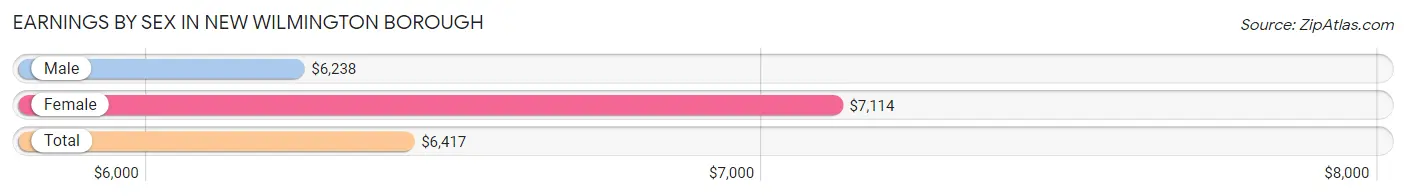
Earnings by Sex in New Wilmington borough
Average Earnings in New Wilmington borough are $6,417, $6,238 for men and $7,114 for women, a difference of 12.3%.
| Sex | Number | Average Earnings |
| Male | 802 (54.7%) | $6,238 |
| Female | 665 (45.3%) | $7,114 |
| Total | 1,467 (100.0%) | $6,417 |
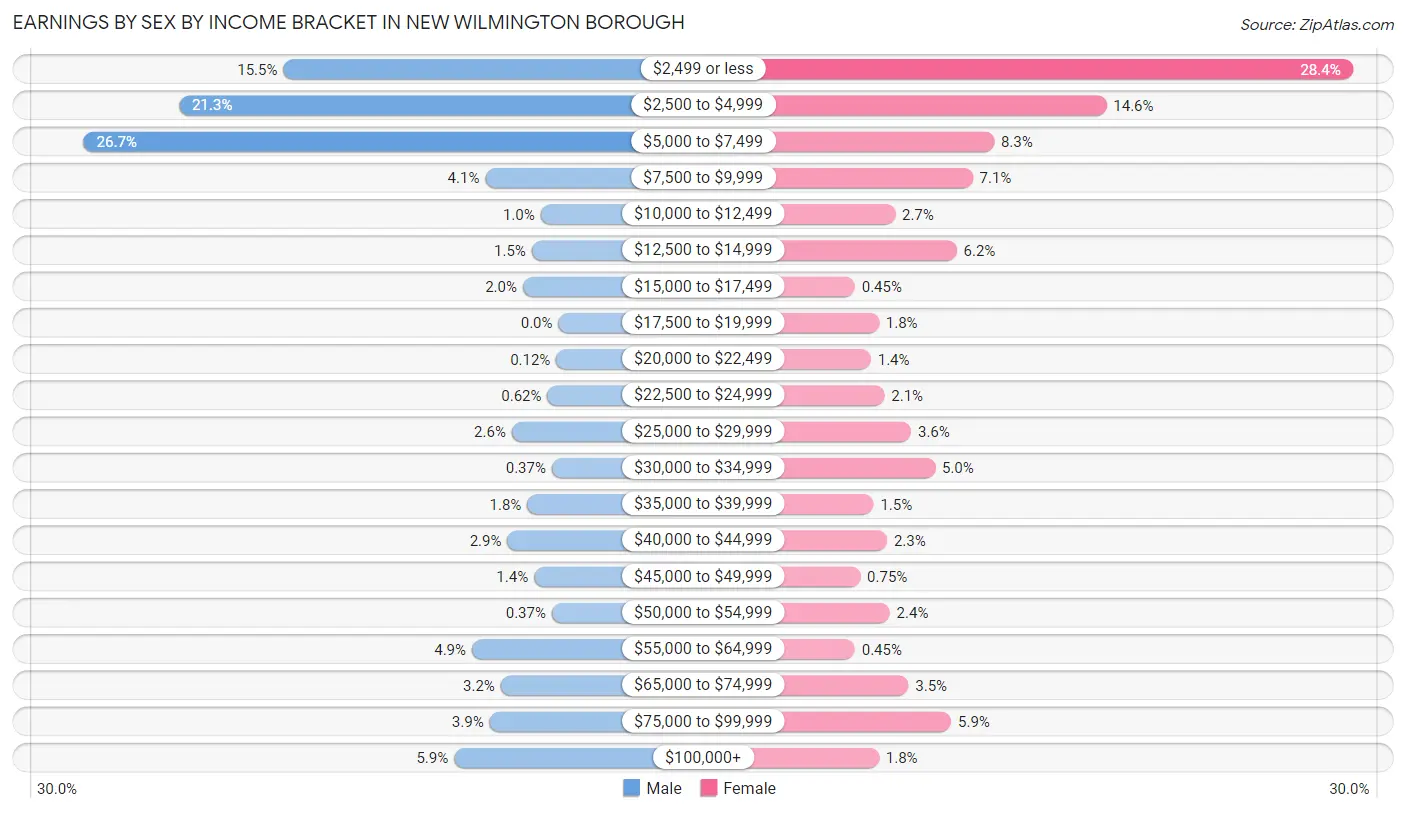
Earnings by Sex by Income Bracket in New Wilmington borough
The most common earnings brackets in New Wilmington borough are $5,000 to $7,499 for men (214 | 26.7%) and $2,499 or less for women (189 | 28.4%).
| Income | Male | Female |
| $2,499 or less | 124 (15.5%) | 189 (28.4%) |
| $2,500 to $4,999 | 171 (21.3%) | 97 (14.6%) |
| $5,000 to $7,499 | 214 (26.7%) | 55 (8.3%) |
| $7,500 to $9,999 | 33 (4.1%) | 47 (7.1%) |
| $10,000 to $12,499 | 8 (1.0%) | 18 (2.7%) |
| $12,500 to $14,999 | 12 (1.5%) | 41 (6.2%) |
| $15,000 to $17,499 | 16 (2.0%) | 3 (0.4%) |
| $17,500 to $19,999 | 0 (0.0%) | 12 (1.8%) |
| $20,000 to $22,499 | 1 (0.1%) | 9 (1.3%) |
| $22,500 to $24,999 | 5 (0.6%) | 14 (2.1%) |
| $25,000 to $29,999 | 21 (2.6%) | 24 (3.6%) |
| $30,000 to $34,999 | 3 (0.4%) | 33 (5.0%) |
| $35,000 to $39,999 | 14 (1.8%) | 10 (1.5%) |
| $40,000 to $44,999 | 23 (2.9%) | 15 (2.3%) |
| $45,000 to $49,999 | 11 (1.4%) | 5 (0.7%) |
| $50,000 to $54,999 | 3 (0.4%) | 16 (2.4%) |
| $55,000 to $64,999 | 39 (4.9%) | 3 (0.4%) |
| $65,000 to $74,999 | 26 (3.2%) | 23 (3.5%) |
| $75,000 to $99,999 | 31 (3.9%) | 39 (5.9%) |
| $100,000+ | 47 (5.9%) | 12 (1.8%) |
| Total | 802 (100.0%) | 665 (100.0%) |
Earnings by Sex by Educational Attainment in New Wilmington borough
Average earnings in New Wilmington borough are $61,250 for men and $42,917 for women, a difference of 29.9%. Men with an educational attainment of graduate degree enjoy the highest average annual earnings of $93,750, while those with high school diploma education earn the least with $32,083. Women with an educational attainment of graduate degree earn the most with the average annual earnings of $67,000, while those with high school diploma education have the smallest earnings of $19,375.

| Educational Attainment | Male Income | Female Income |
| Less than High School | - | - |
| High School Diploma | $32,083 | $19,375 |
| College or Associate's Degree | - | - |
| Bachelor's Degree | $61,786 | $0 |
| Graduate Degree | $93,750 | $67,000 |
| Total | $61,250 | $42,917 |
Family Income in New Wilmington borough
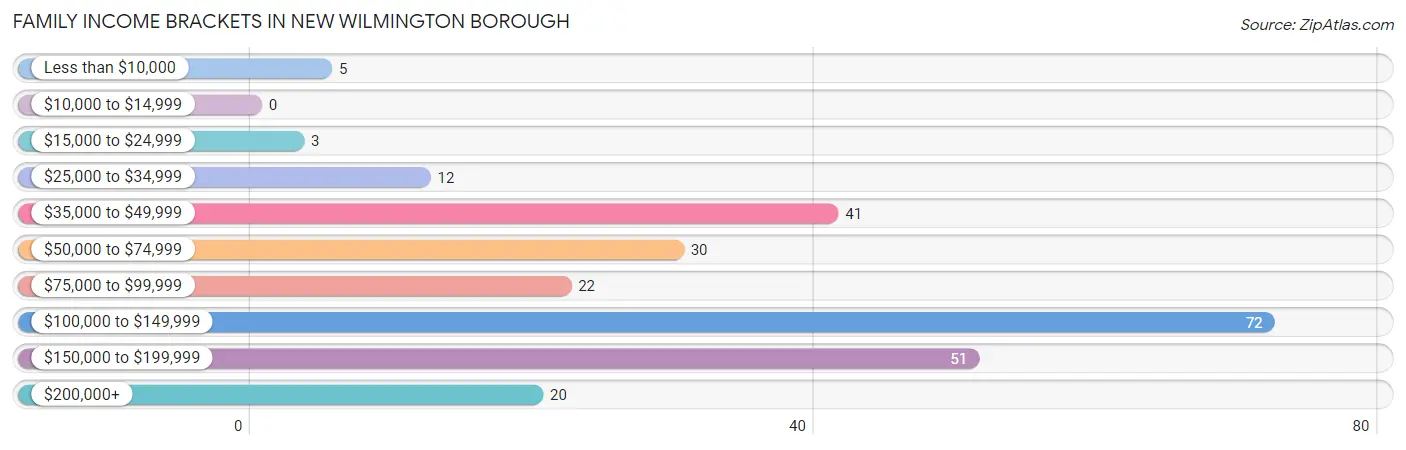
Family Income Brackets in New Wilmington borough
According to the New Wilmington borough family income data, there are 72 families falling into the $100,000 to $149,999 income range, which is the most common income bracket and makes up 28.1% of all families.
| Income Bracket | # Families | % Families |
| Less than $10,000 | 5 | 2.0% |
| $10,000 to $14,999 | 0 | 0.0% |
| $15,000 to $24,999 | 3 | 1.2% |
| $25,000 to $34,999 | 12 | 4.7% |
| $35,000 to $49,999 | 41 | 16.0% |
| $50,000 to $74,999 | 30 | 11.7% |
| $75,000 to $99,999 | 22 | 8.6% |
| $100,000 to $149,999 | 72 | 28.1% |
| $150,000 to $199,999 | 51 | 19.9% |
| $200,000+ | 20 | 7.8% |
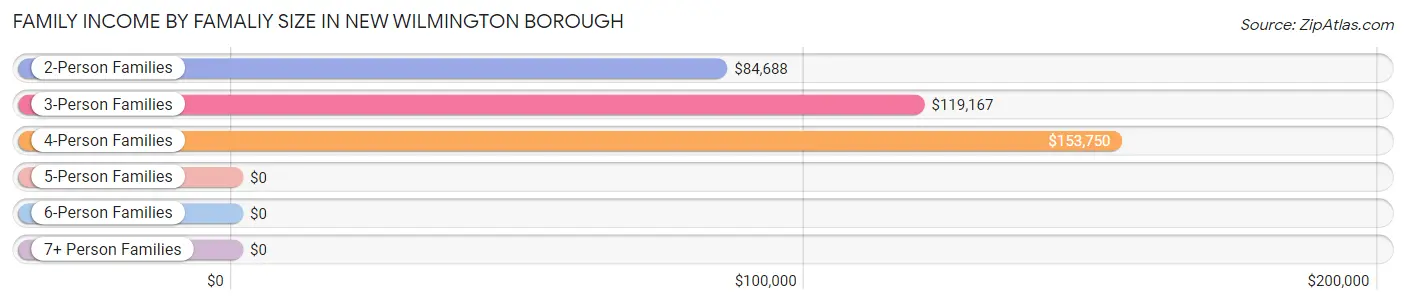
Family Income by Famaliy Size in New Wilmington borough
4-person families (28 | 10.9%) account for the highest median family income in New Wilmington borough with $153,750 per family, while 2-person families (121 | 47.3%) have the highest median income of $42,344 per family member.
| Income Bracket | # Families | Median Income |
| 2-Person Families | 121 (47.3%) | $84,688 |
| 3-Person Families | 86 (33.6%) | $119,167 |
| 4-Person Families | 28 (10.9%) | $153,750 |
| 5-Person Families | 10 (3.9%) | $0 |
| 6-Person Families | 0 (0.0%) | $0 |
| 7+ Person Families | 11 (4.3%) | $0 |
| Total | 256 (100.0%) | $111,786 |
Family Income by Number of Earners in New Wilmington borough
The median family income in New Wilmington borough is $111,786, with families comprising 3+ earners (35) having the highest median family income of $142,125, while families with no earners (22) have the lowest median family income of $52,500, accounting for 13.7% and 8.6% of families, respectively.
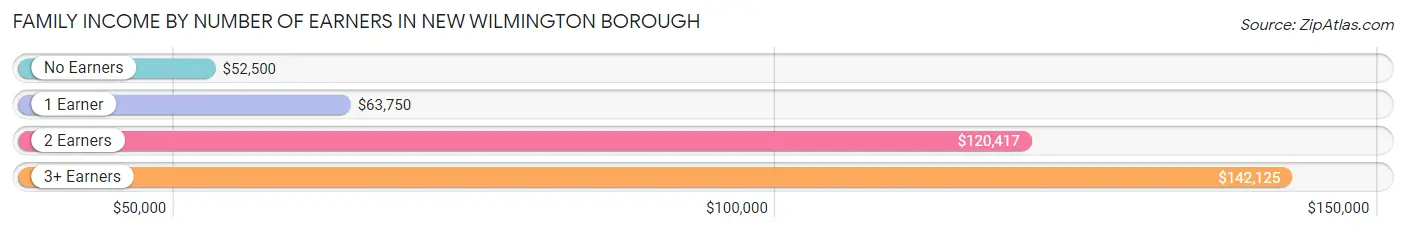
| Number of Earners | # Families | Median Income |
| No Earners | 22 (8.6%) | $52,500 |
| 1 Earner | 72 (28.1%) | $63,750 |
| 2 Earners | 127 (49.6%) | $120,417 |
| 3+ Earners | 35 (13.7%) | $142,125 |
| Total | 256 (100.0%) | $111,786 |
Household Income in New Wilmington borough
Household Income Brackets in New Wilmington borough
With 111 households falling in the category, the $100,000 to $149,999 income range is the most frequent in New Wilmington borough, accounting for 23.7% of all households. In contrast, only 6 households (1.3%) fall into the $10,000 to $14,999 income bracket, making it the least populous group.
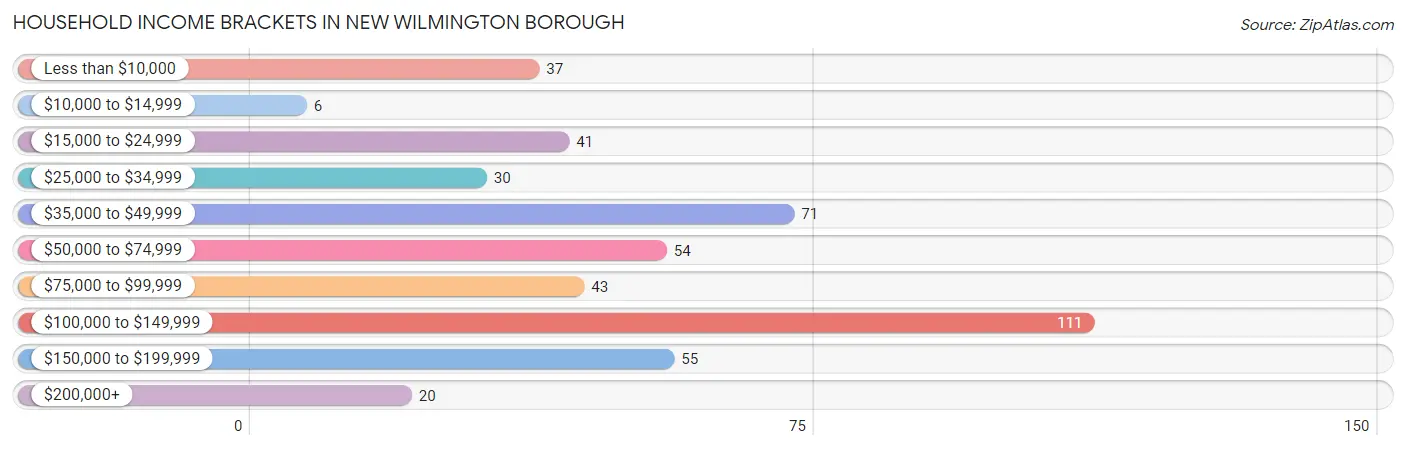
| Income Bracket | # Households | % Households |
| Less than $10,000 | 37 | 7.9% |
| $10,000 to $14,999 | 6 | 1.3% |
| $15,000 to $24,999 | 41 | 8.8% |
| $25,000 to $34,999 | 30 | 6.4% |
| $35,000 to $49,999 | 71 | 15.2% |
| $50,000 to $74,999 | 54 | 11.5% |
| $75,000 to $99,999 | 43 | 9.2% |
| $100,000 to $149,999 | 111 | 23.7% |
| $150,000 to $199,999 | 55 | 11.8% |
| $200,000+ | 20 | 4.3% |
Household Income by Householder Age in New Wilmington borough
The median household income in New Wilmington borough is $73,611, with the highest median household income of $116,250 found in the 25 to 44 years age bracket for the primary householder. A total of 103 households (22.0%) fall into this category. Meanwhile, the 15 to 24 years age bracket for the primary householder has the lowest median household income of $0, with 55 households (11.7%) in this group.
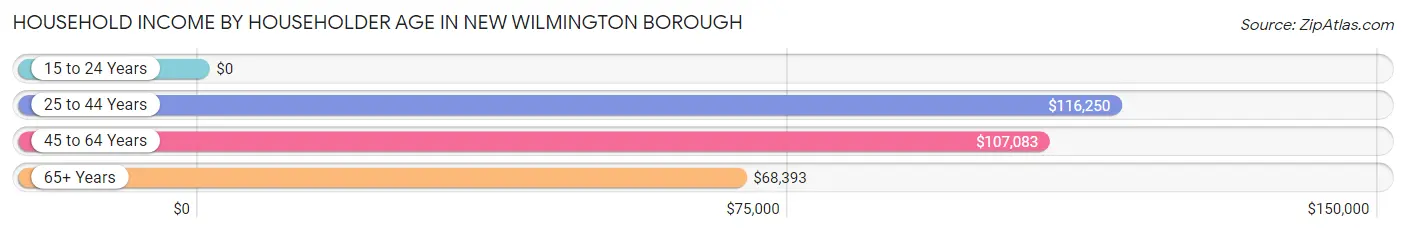
| Income Bracket | # Households | Median Income |
| 15 to 24 Years | 55 (11.7%) | $0 |
| 25 to 44 Years | 103 (22.0%) | $116,250 |
| 45 to 64 Years | 137 (29.3%) | $107,083 |
| 65+ Years | 173 (37.0%) | $68,393 |
| Total | 468 (100.0%) | $73,611 |
Poverty in New Wilmington borough
Income Below Poverty by Sex and Age in New Wilmington borough
With 9.6% poverty level for males and 4.4% for females among the residents of New Wilmington borough, 18 to 24 year old males and 18 to 24 year old females are the most vulnerable to poverty, with 32 males (57.1%) and 22 females (18.2%) in their respective age groups living below the poverty level.
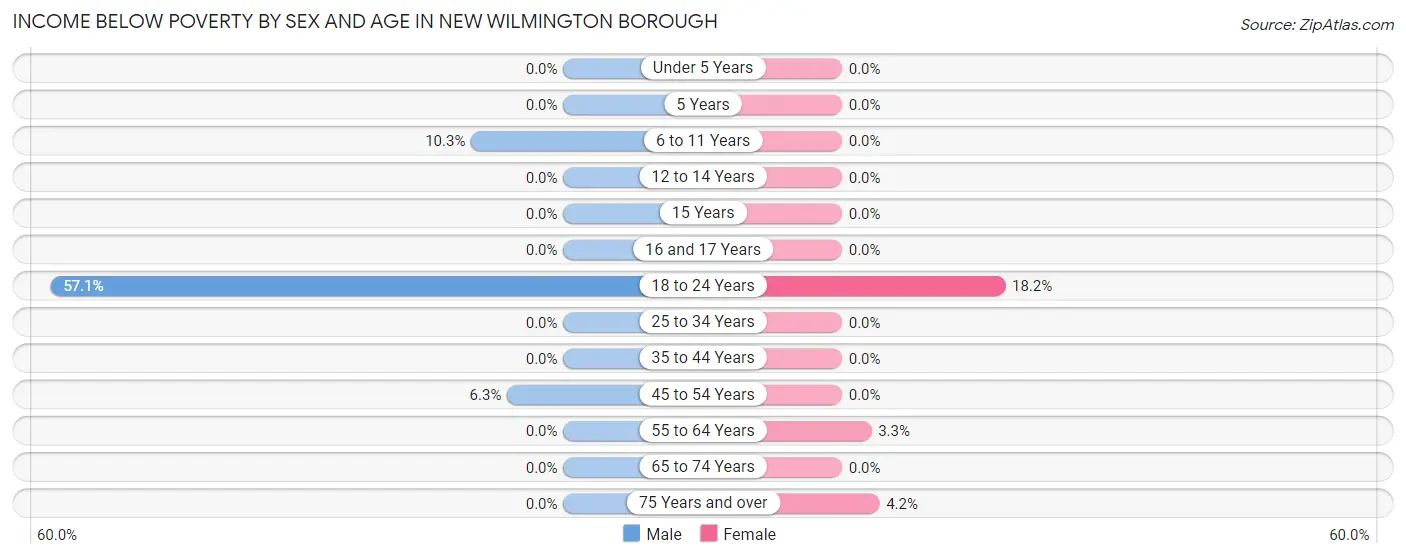
| Age Bracket | Male | Female |
| Under 5 Years | 0 (0.0%) | 0 (0.0%) |
| 5 Years | 0 (0.0%) | 0 (0.0%) |
| 6 to 11 Years | 4 (10.3%) | 0 (0.0%) |
| 12 to 14 Years | 0 (0.0%) | 0 (0.0%) |
| 15 Years | 0 (0.0%) | 0 (0.0%) |
| 16 and 17 Years | 0 (0.0%) | 0 (0.0%) |
| 18 to 24 Years | 32 (57.1%) | 22 (18.2%) |
| 25 to 34 Years | 0 (0.0%) | 0 (0.0%) |
| 35 to 44 Years | 0 (0.0%) | 0 (0.0%) |
| 45 to 54 Years | 4 (6.2%) | 0 (0.0%) |
| 55 to 64 Years | 0 (0.0%) | 2 (3.3%) |
| 65 to 74 Years | 0 (0.0%) | 0 (0.0%) |
| 75 Years and over | 0 (0.0%) | 3 (4.2%) |
| Total | 40 (9.6%) | 27 (4.4%) |
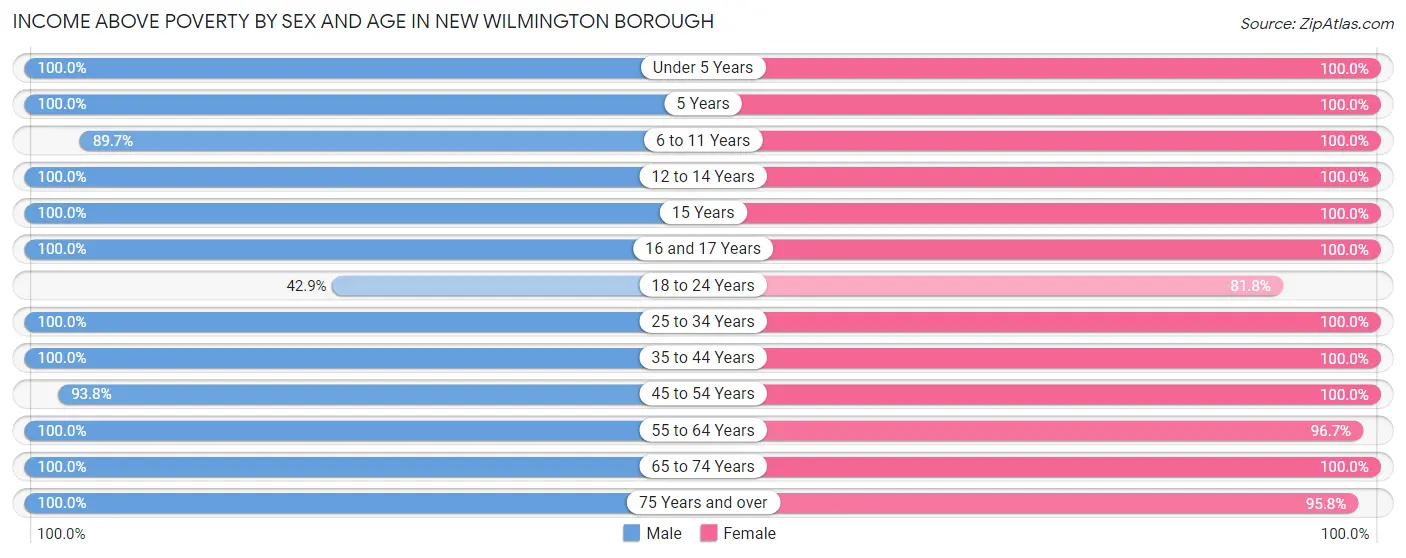
Income Above Poverty by Sex and Age in New Wilmington borough
According to the poverty statistics in New Wilmington borough, males aged under 5 years and females aged under 5 years are the age groups that are most secure financially, with 100.0% of males and 100.0% of females in these age groups living above the poverty line.
| Age Bracket | Male | Female |
| Under 5 Years | 12 (100.0%) | 7 (100.0%) |
| 5 Years | 4 (100.0%) | 8 (100.0%) |
| 6 to 11 Years | 35 (89.7%) | 36 (100.0%) |
| 12 to 14 Years | 8 (100.0%) | 46 (100.0%) |
| 15 Years | 1 (100.0%) | 15 (100.0%) |
| 16 and 17 Years | 3 (100.0%) | 33 (100.0%) |
| 18 to 24 Years | 24 (42.9%) | 99 (81.8%) |
| 25 to 34 Years | 30 (100.0%) | 29 (100.0%) |
| 35 to 44 Years | 60 (100.0%) | 74 (100.0%) |
| 45 to 54 Years | 60 (93.8%) | 52 (100.0%) |
| 55 to 64 Years | 64 (100.0%) | 59 (96.7%) |
| 65 to 74 Years | 44 (100.0%) | 61 (100.0%) |
| 75 Years and over | 32 (100.0%) | 69 (95.8%) |
| Total | 377 (90.4%) | 588 (95.6%) |
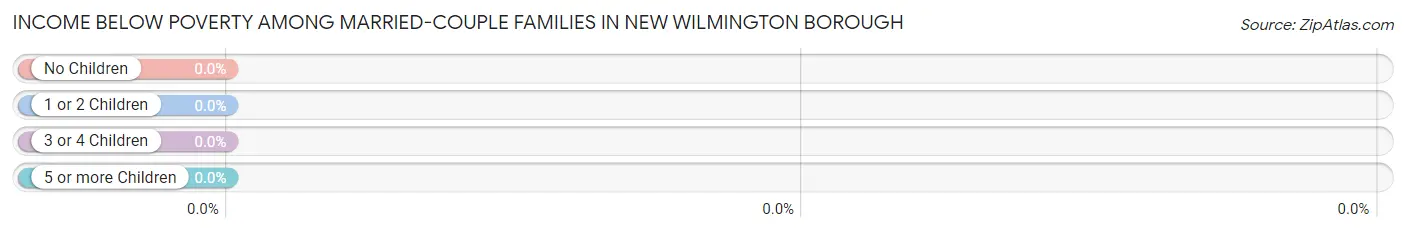
Income Below Poverty Among Married-Couple Families in New Wilmington borough
| Children | Above Poverty | Below Poverty |
| No Children | 112 (100.0%) | 0 (0.0%) |
| 1 or 2 Children | 45 (100.0%) | 0 (0.0%) |
| 3 or 4 Children | 20 (100.0%) | 0 (0.0%) |
| 5 or more Children | 1 (100.0%) | 0 (0.0%) |
| Total | 178 (100.0%) | 0 (0.0%) |
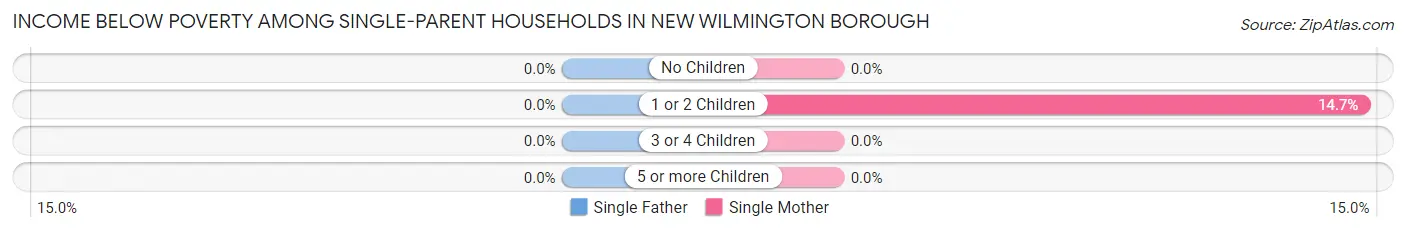
Income Below Poverty Among Single-Parent Households in New Wilmington borough
| Children | Single Father | Single Mother |
| No Children | 0 (0.0%) | 0 (0.0%) |
| 1 or 2 Children | 0 (0.0%) | 5 (14.7%) |
| 3 or 4 Children | 0 (0.0%) | 0 (0.0%) |
| 5 or more Children | 0 (0.0%) | 0 (0.0%) |
| Total | 0 (0.0%) | 5 (10.2%) |
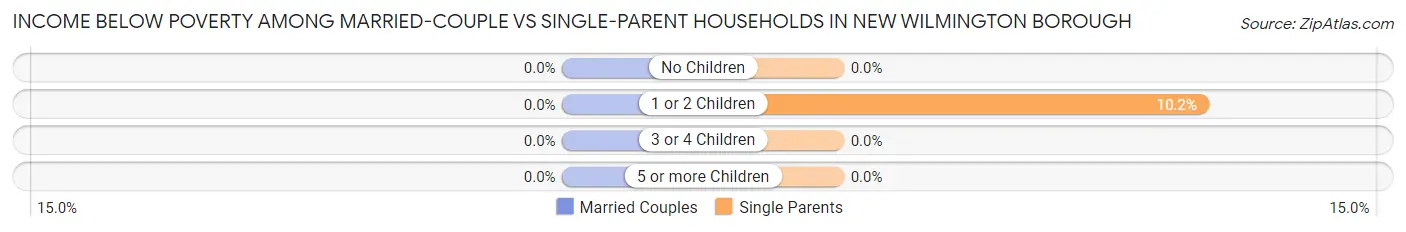
Income Below Poverty Among Married-Couple vs Single-Parent Households in New Wilmington borough
| Children | Married-Couple Families | Single-Parent Households |
| No Children | 0 (0.0%) | 0 (0.0%) |
| 1 or 2 Children | 0 (0.0%) | 5 (10.2%) |
| 3 or 4 Children | 0 (0.0%) | 0 (0.0%) |
| 5 or more Children | 0 (0.0%) | 0 (0.0%) |
| Total | 0 (0.0%) | 5 (6.4%) |
Race in New Wilmington borough
The most populous races in New Wilmington borough are White / Caucasian (1,798 | 83.4%), Black / African American (205 | 9.5%), and Two or more Races (143 | 6.6%).
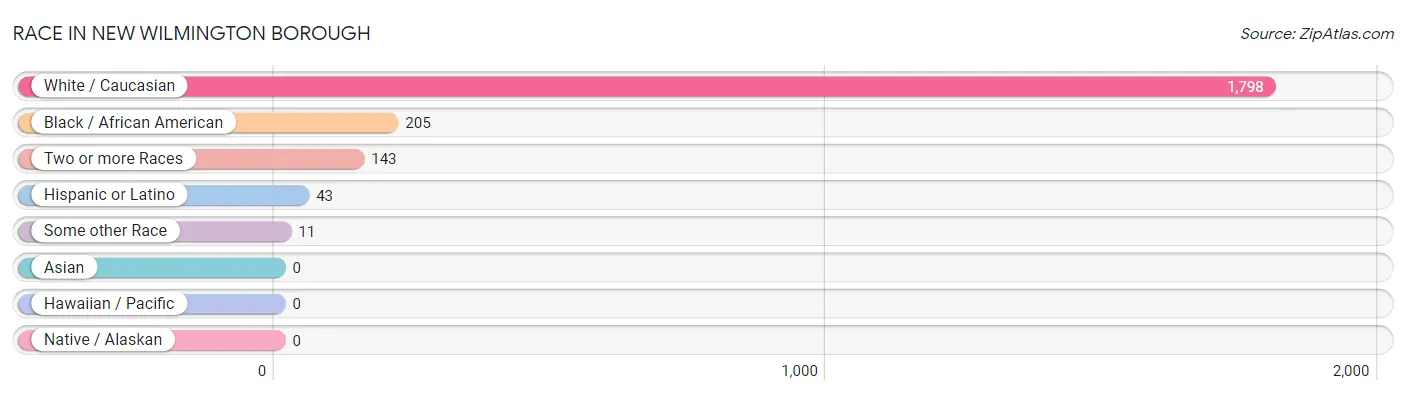
| Race | # Population | % Population |
| Asian | 0 | 0.0% |
| Black / African American | 205 | 9.5% |
| Hawaiian / Pacific | 0 | 0.0% |
| Hispanic or Latino | 43 | 2.0% |
| Native / Alaskan | 0 | 0.0% |
| White / Caucasian | 1,798 | 83.4% |
| Two or more Races | 143 | 6.6% |
| Some other Race | 11 | 0.5% |
| Total | 2,157 | 100.0% |
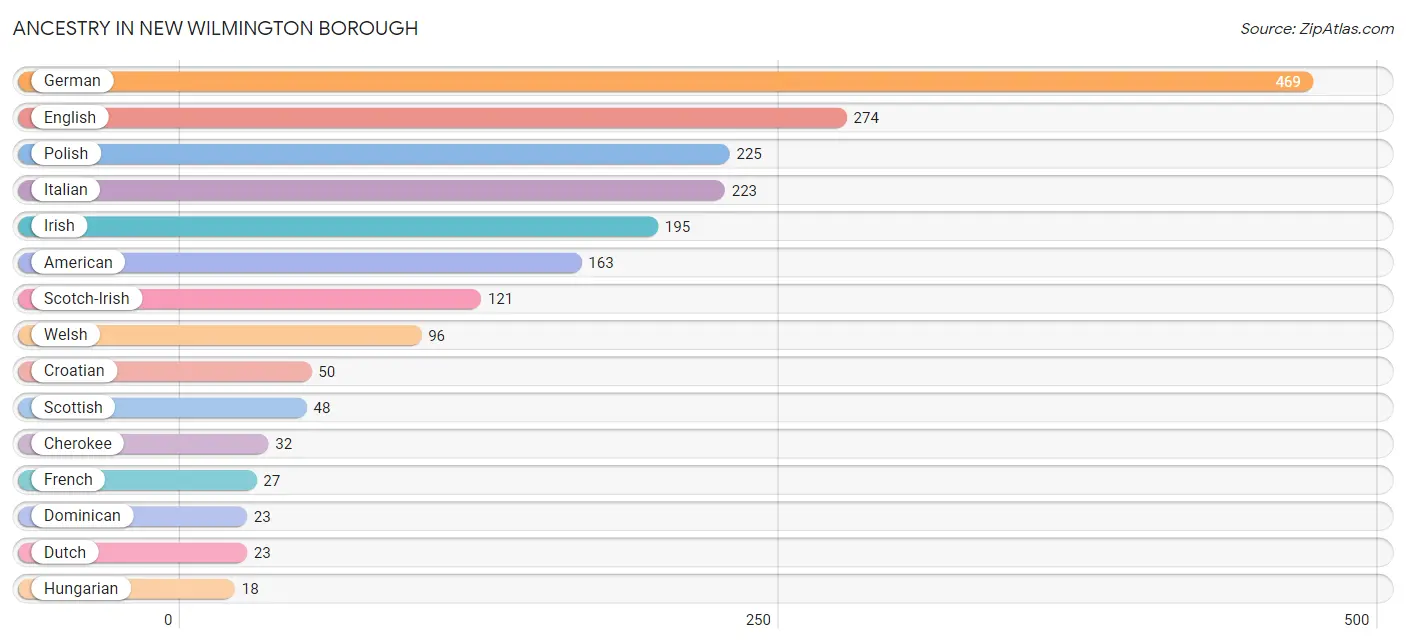
Ancestry in New Wilmington borough
The most populous ancestries reported in New Wilmington borough are German (469 | 21.7%), English (274 | 12.7%), Polish (225 | 10.4%), Italian (223 | 10.3%), and Irish (195 | 9.0%), together accounting for 64.3% of all New Wilmington borough residents.
| Ancestry | # Population | % Population |
| African | 3 | 0.1% |
| American | 163 | 7.6% |
| Arab | 6 | 0.3% |
| Austrian | 13 | 0.6% |
| Bhutanese | 6 | 0.3% |
| British | 1 | 0.1% |
| Central American | 3 | 0.1% |
| Cherokee | 32 | 1.5% |
| Croatian | 50 | 2.3% |
| Dominican | 23 | 1.1% |
| Dutch | 23 | 1.1% |
| English | 274 | 12.7% |
| European | 7 | 0.3% |
| Finnish | 14 | 0.6% |
| French | 27 | 1.3% |
| French Canadian | 9 | 0.4% |
| German | 469 | 21.7% |
| Greek | 9 | 0.4% |
| Hungarian | 18 | 0.8% |
| Irish | 195 | 9.0% |
| Italian | 223 | 10.3% |
| Jamaican | 8 | 0.4% |
| Mexican | 4 | 0.2% |
| Nigerian | 5 | 0.2% |
| Pennsylvania German | 3 | 0.1% |
| Polish | 225 | 10.4% |
| Puerto Rican | 13 | 0.6% |
| Romanian | 5 | 0.2% |
| Russian | 14 | 0.6% |
| Salvadoran | 3 | 0.1% |
| Scotch-Irish | 121 | 5.6% |
| Scottish | 48 | 2.2% |
| Slovak | 14 | 0.6% |
| Slovene | 3 | 0.1% |
| Subsaharan African | 8 | 0.4% |
| Swedish | 8 | 0.4% |
| Swiss | 8 | 0.4% |
| Syrian | 6 | 0.3% |
| Thai | 7 | 0.3% |
| Ukrainian | 3 | 0.1% |
| Welsh | 96 | 4.4% |
| Yugoslavian | 6 | 0.3% | View All 42 Rows |
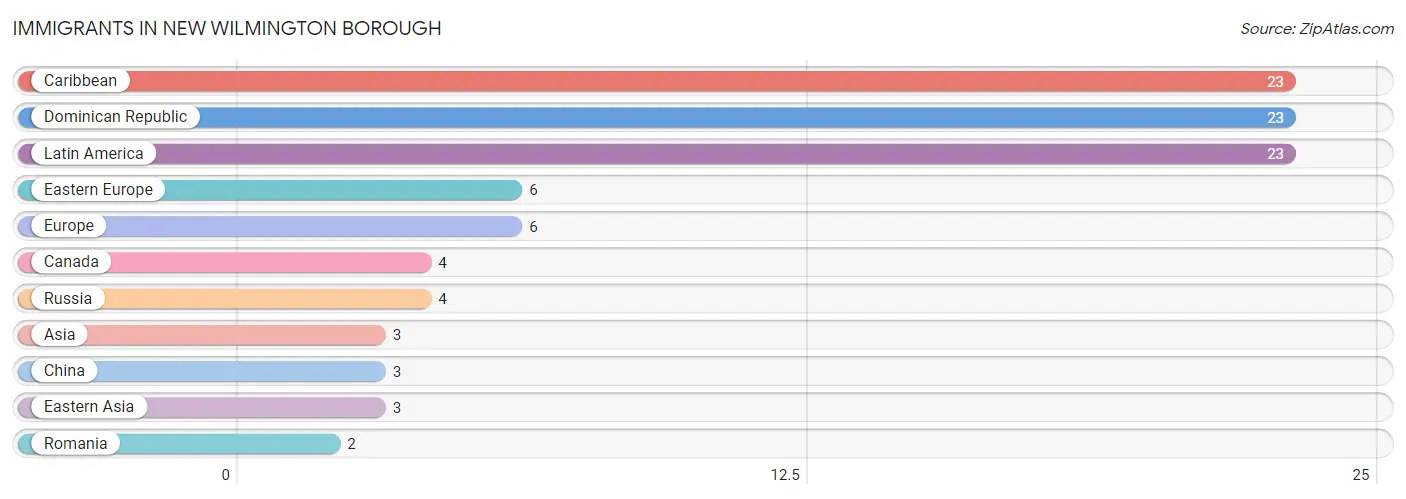
Immigrants in New Wilmington borough
The most numerous immigrant groups reported in New Wilmington borough came from Caribbean (23 | 1.1%), Dominican Republic (23 | 1.1%), Latin America (23 | 1.1%), Eastern Europe (6 | 0.3%), and Europe (6 | 0.3%), together accounting for 3.8% of all New Wilmington borough residents.
| Immigration Origin | # Population | % Population |
| Asia | 3 | 0.1% |
| Canada | 4 | 0.2% |
| Caribbean | 23 | 1.1% |
| China | 3 | 0.1% |
| Dominican Republic | 23 | 1.1% |
| Eastern Asia | 3 | 0.1% |
| Eastern Europe | 6 | 0.3% |
| Europe | 6 | 0.3% |
| Latin America | 23 | 1.1% |
| Romania | 2 | 0.1% |
| Russia | 4 | 0.2% | View All 11 Rows |
Sex and Age in New Wilmington borough
Sex and Age in New Wilmington borough
The most populous age groups in New Wilmington borough are 20 to 24 Years (346 | 32.6%) for men and 20 to 24 Years (356 | 32.5%) for women.
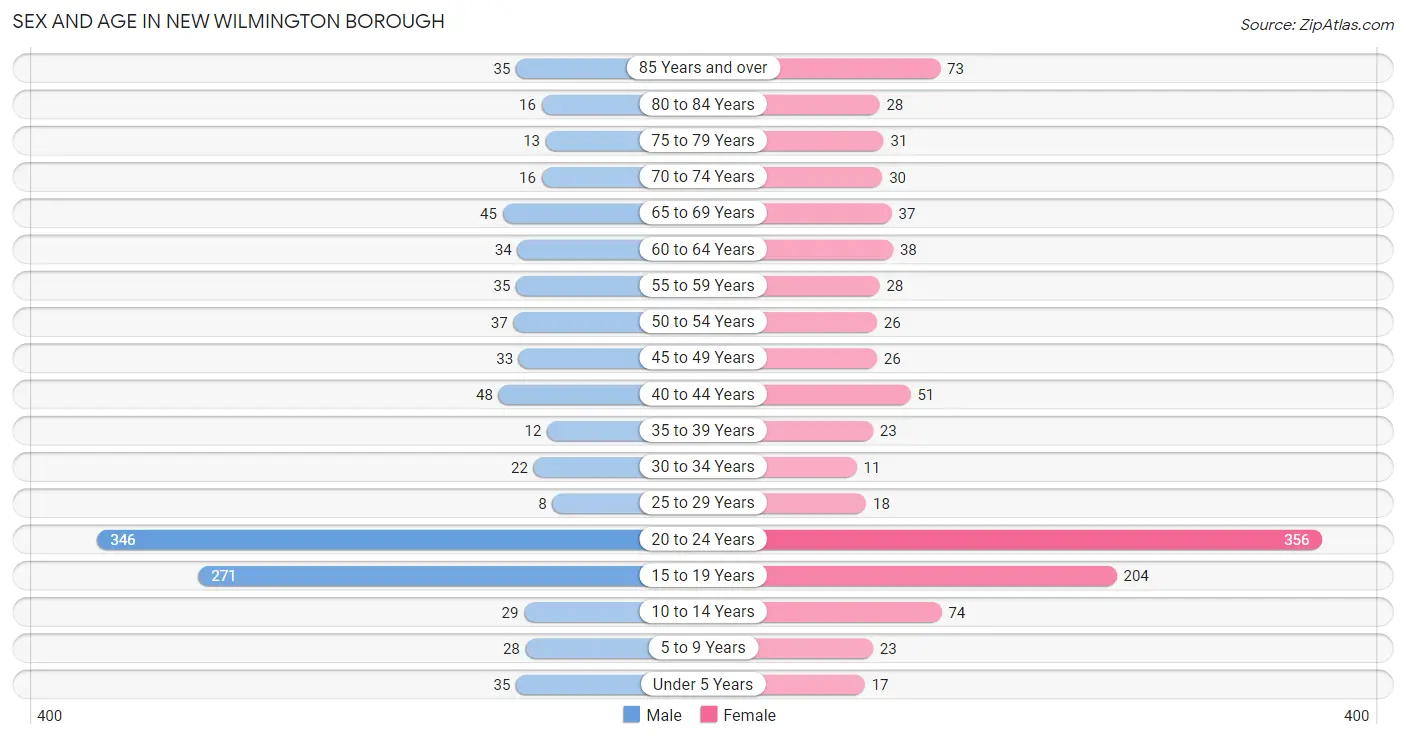
| Age Bracket | Male | Female |
| Under 5 Years | 35 (3.3%) | 17 (1.5%) |
| 5 to 9 Years | 28 (2.6%) | 23 (2.1%) |
| 10 to 14 Years | 29 (2.7%) | 74 (6.8%) |
| 15 to 19 Years | 271 (25.5%) | 204 (18.6%) |
| 20 to 24 Years | 346 (32.6%) | 356 (32.5%) |
| 25 to 29 Years | 8 (0.7%) | 18 (1.7%) |
| 30 to 34 Years | 22 (2.1%) | 11 (1.0%) |
| 35 to 39 Years | 12 (1.1%) | 23 (2.1%) |
| 40 to 44 Years | 48 (4.5%) | 51 (4.7%) |
| 45 to 49 Years | 33 (3.1%) | 26 (2.4%) |
| 50 to 54 Years | 37 (3.5%) | 26 (2.4%) |
| 55 to 59 Years | 35 (3.3%) | 28 (2.6%) |
| 60 to 64 Years | 34 (3.2%) | 38 (3.5%) |
| 65 to 69 Years | 45 (4.2%) | 37 (3.4%) |
| 70 to 74 Years | 16 (1.5%) | 30 (2.7%) |
| 75 to 79 Years | 13 (1.2%) | 31 (2.8%) |
| 80 to 84 Years | 16 (1.5%) | 28 (2.6%) |
| 85 Years and over | 35 (3.3%) | 73 (6.7%) |
| Total | 1,063 (100.0%) | 1,094 (100.0%) |
Families and Households in New Wilmington borough
Median Family Size in New Wilmington borough
The median family size in New Wilmington borough is 3.04 persons per family, with married-couple families (178 | 69.5%) accounting for the largest median family size of 3.22 persons per family. On the other hand, single female/mother families (49 | 19.1%) represent the smallest median family size with 2.45 persons per family.
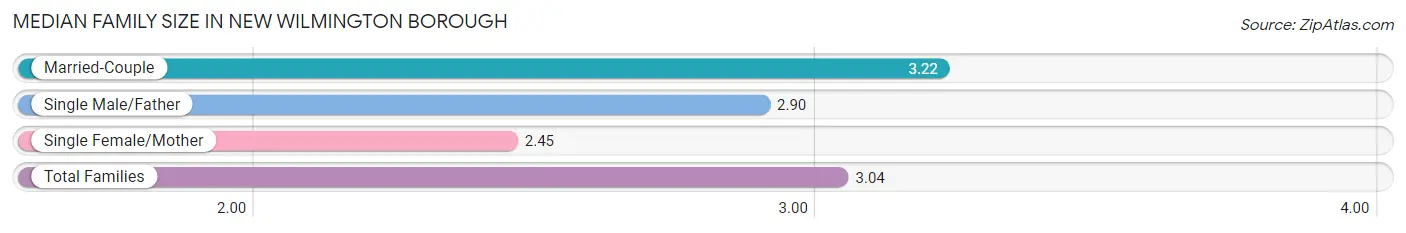
| Family Type | # Families | Family Size |
| Married-Couple | 178 (69.5%) | 3.22 |
| Single Male/Father | 29 (11.3%) | 2.90 |
| Single Female/Mother | 49 (19.1%) | 2.45 |
| Total Families | 256 (100.0%) | 3.04 |
Median Household Size in New Wilmington borough
The median household size in New Wilmington borough is 2.30 persons per household, with married-couple households (178 | 38.0%) accounting for the largest median household size of 3.4 persons per household. non-family households (212 | 45.3%) represent the smallest median household size with 1.24 persons per household.
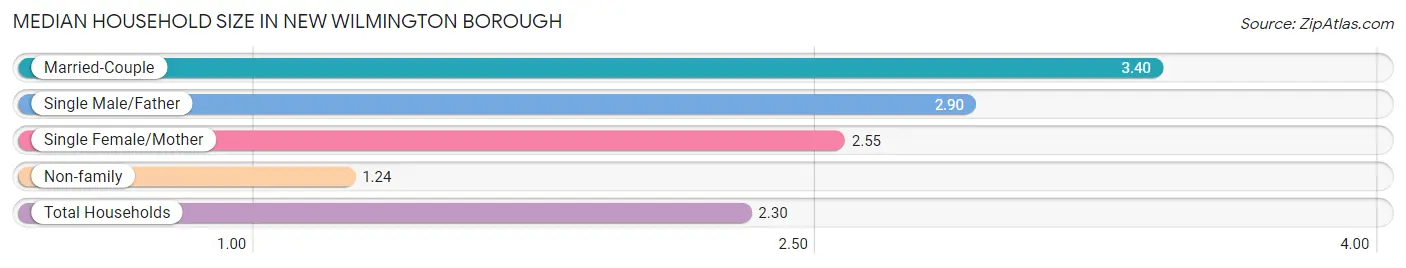
| Household Type | # Households | Household Size |
| Married-Couple | 178 (38.0%) | 3.40 |
| Single Male/Father | 29 (6.2%) | 2.90 |
| Single Female/Mother | 49 (10.5%) | 2.55 |
| Non-family | 212 (45.3%) | 1.24 |
| Total Households | 468 (100.0%) | 2.30 |
Household Size by Marriage Status in New Wilmington borough
Out of a total of 468 households in New Wilmington borough, 256 (54.7%) are family households, while 212 (45.3%) are nonfamily households. The most numerous type of family households are 2-person households, comprising 121, and the most common type of nonfamily households are 1-person households, comprising 177.
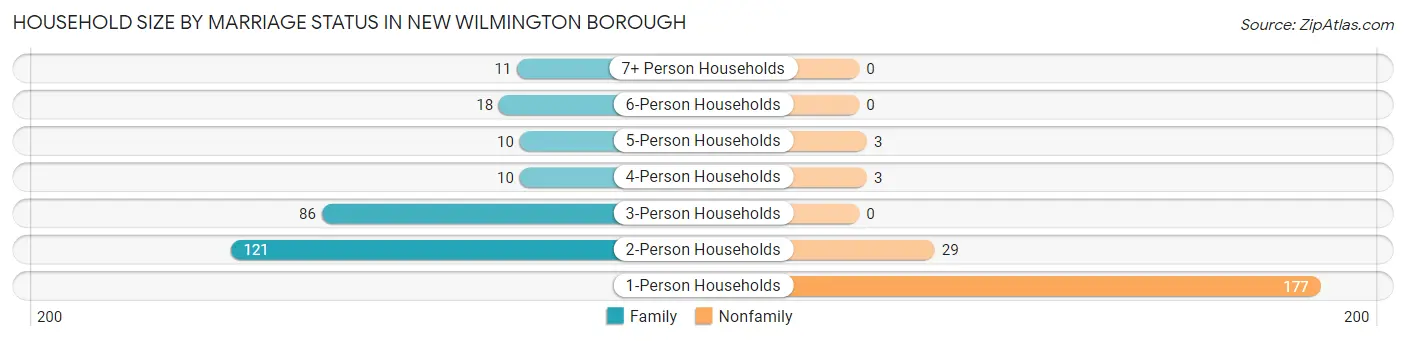
| Household Size | Family Households | Nonfamily Households |
| 1-Person Households | - | 177 (37.8%) |
| 2-Person Households | 121 (25.9%) | 29 (6.2%) |
| 3-Person Households | 86 (18.4%) | 0 (0.0%) |
| 4-Person Households | 10 (2.1%) | 3 (0.6%) |
| 5-Person Households | 10 (2.1%) | 3 (0.6%) |
| 6-Person Households | 18 (3.8%) | 0 (0.0%) |
| 7+ Person Households | 11 (2.4%) | 0 (0.0%) |
| Total | 256 (54.7%) | 212 (45.3%) |
Female Fertility in New Wilmington borough
Fertility by Age in New Wilmington borough
Average fertility rate in New Wilmington borough is 7.0 births per 1,000 women. Women in the age bracket of 35 to 50 years have the highest fertility rate with 28.0 births per 1,000 women. Women in the age bracket of 35 to 50 years acount for 60.0% of all women with births.
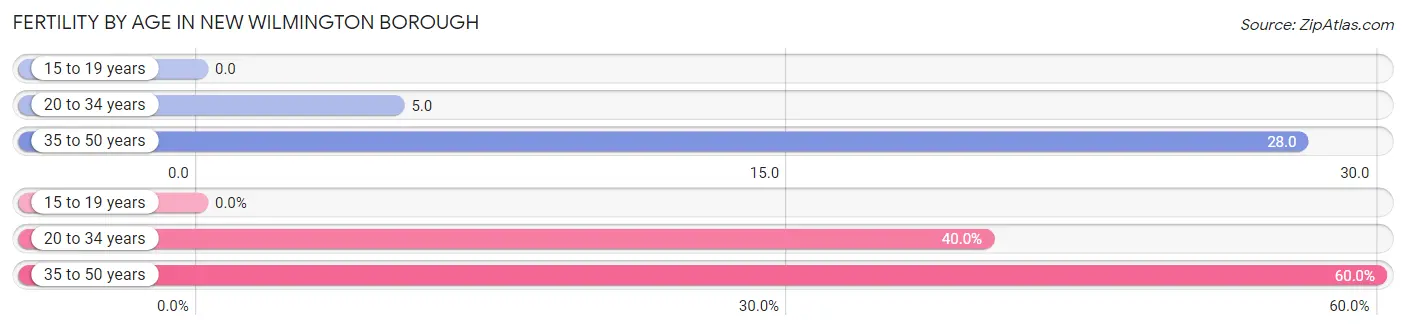
| Age Bracket | Women with Births | Births / 1,000 Women |
| 15 to 19 years | 0 (0.0%) | 0.0 |
| 20 to 34 years | 2 (40.0%) | 5.0 |
| 35 to 50 years | 3 (60.0%) | 28.0 |
| Total | 5 (100.0%) | 7.0 |
Fertility by Age by Marriage Status in New Wilmington borough
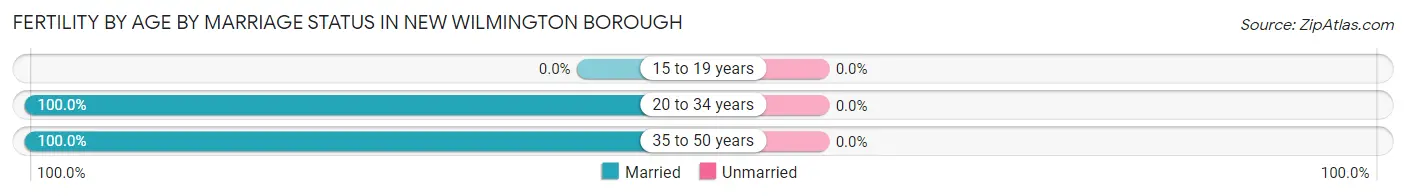
| Age Bracket | Married | Unmarried |
| 15 to 19 years | 0 (0.0%) | 0 (0.0%) |
| 20 to 34 years | 2 (100.0%) | 0 (0.0%) |
| 35 to 50 years | 3 (100.0%) | 0 (0.0%) |
| Total | 5 (100.0%) | 0 (0.0%) |
Fertility by Education in New Wilmington borough
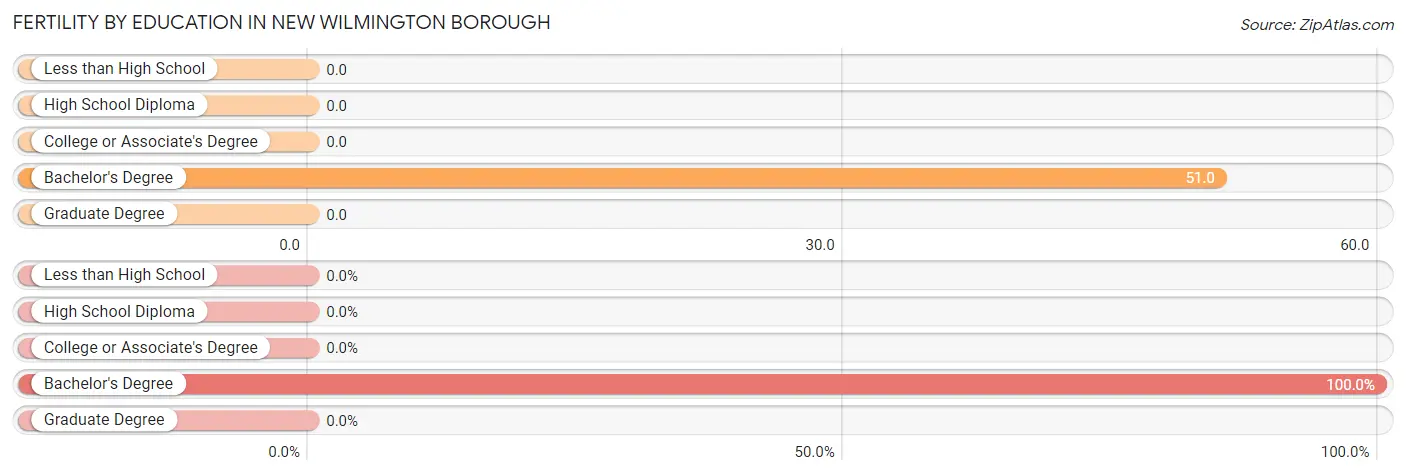
| Educational Attainment | Women with Births | Births / 1,000 Women |
| Less than High School | 0 (0.0%) | 0.0 |
| High School Diploma | 0 (0.0%) | 0.0 |
| College or Associate's Degree | 0 (0.0%) | 0.0 |
| Bachelor's Degree | 5 (100.0%) | 51.0 |
| Graduate Degree | 0 (0.0%) | 0.0 |
| Total | 5 (100.0%) | 7.0 |
Fertility by Education by Marriage Status in New Wilmington borough
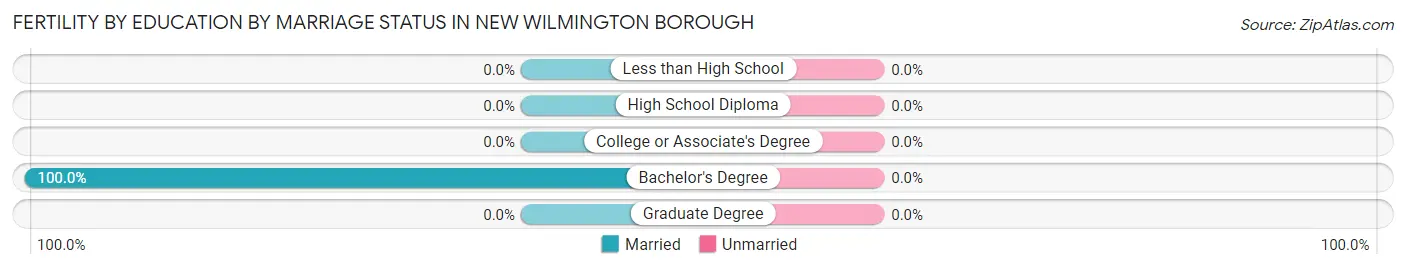
| Educational Attainment | Married | Unmarried |
| Less than High School | 0 (0.0%) | 0 (0.0%) |
| High School Diploma | 0 (0.0%) | 0 (0.0%) |
| College or Associate's Degree | 0 (0.0%) | 0 (0.0%) |
| Bachelor's Degree | 5 (100.0%) | 0 (0.0%) |
| Graduate Degree | 0 (0.0%) | 0 (0.0%) |
| Total | 5 (100.0%) | 0 (0.0%) |
Employment Characteristics in New Wilmington borough
Employment by Class of Employer in New Wilmington borough
Among the 1,087 employed individuals in New Wilmington borough, private company employees (696 | 64.0%), not-for-profit organizations (147 | 13.5%), and state government employees (96 | 8.8%) make up the most common classes of employment.
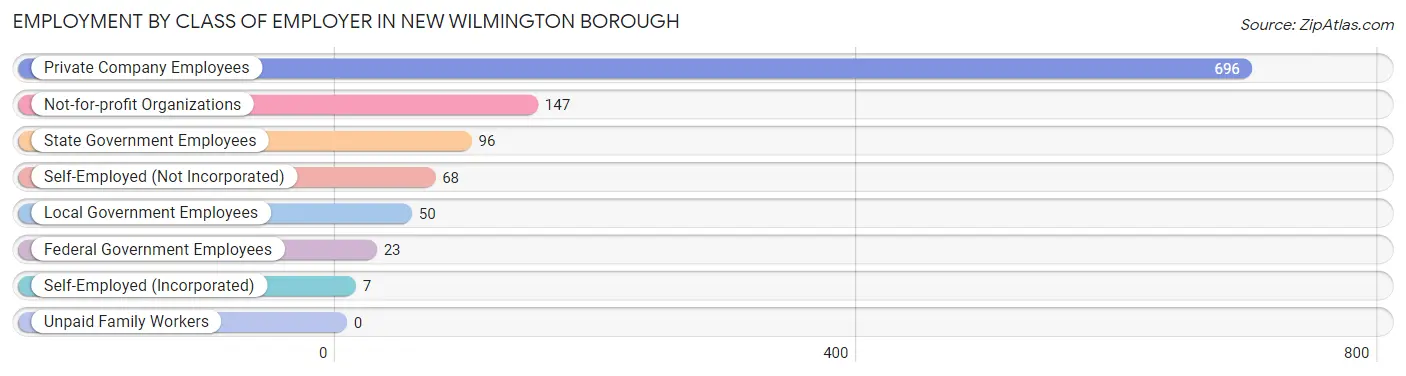
| Employer Class | # Employees | % Employees |
| Private Company Employees | 696 | 64.0% |
| Self-Employed (Incorporated) | 7 | 0.6% |
| Self-Employed (Not Incorporated) | 68 | 6.3% |
| Not-for-profit Organizations | 147 | 13.5% |
| Local Government Employees | 50 | 4.6% |
| State Government Employees | 96 | 8.8% |
| Federal Government Employees | 23 | 2.1% |
| Unpaid Family Workers | 0 | 0.0% |
| Total | 1,087 | 100.0% |
Employment Status by Age in New Wilmington borough
According to the labor force statistics for New Wilmington borough, out of the total population over 16 years of age (1,935), 60.6% or 1,173 individuals are in the labor force, with 0.9% or 11 of them unemployed. The age group with the highest labor force participation rate is 25 to 29 years, with 100.0% or 26 individuals in the labor force. Within the labor force, the 45 to 54 years age range has the highest percentage of unemployed individuals, with 2.9% or 3 of them being unemployed.
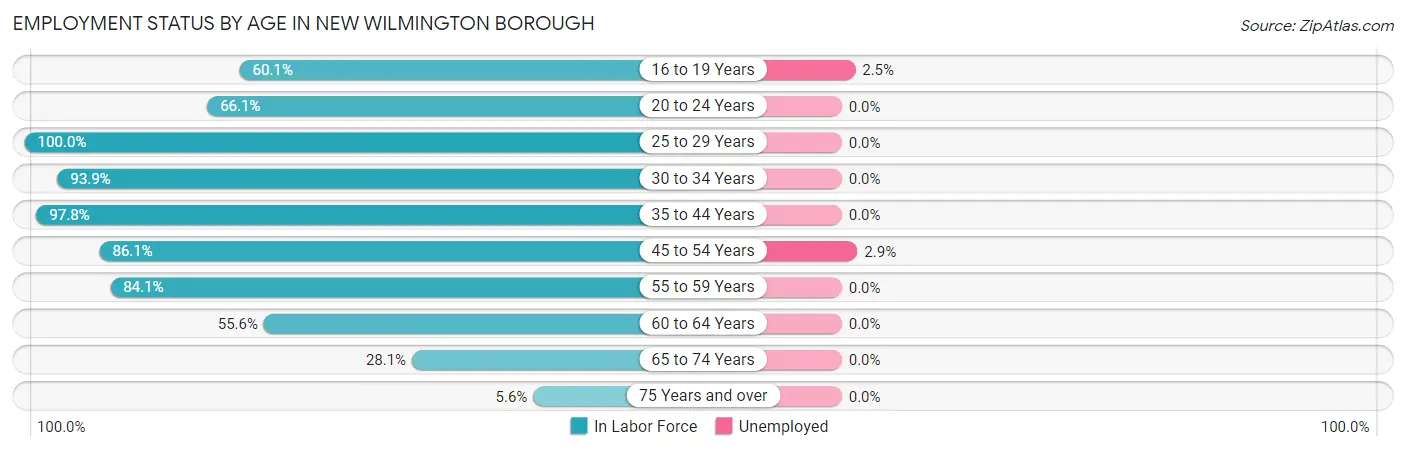
| Age Bracket | In Labor Force | Unemployed |
| 16 to 19 Years | 276 (60.1%) | 7 (2.5%) |
| 20 to 24 Years | 464 (66.1%) | 0 (0.0%) |
| 25 to 29 Years | 26 (100.0%) | 0 (0.0%) |
| 30 to 34 Years | 31 (93.9%) | 0 (0.0%) |
| 35 to 44 Years | 131 (97.8%) | 0 (0.0%) |
| 45 to 54 Years | 105 (86.1%) | 3 (2.9%) |
| 55 to 59 Years | 53 (84.1%) | 0 (0.0%) |
| 60 to 64 Years | 40 (55.6%) | 0 (0.0%) |
| 65 to 74 Years | 36 (28.1%) | 0 (0.0%) |
| 75 Years and over | 11 (5.6%) | 0 (0.0%) |
| Total | 1,173 (60.6%) | 11 (0.9%) |
Employment Status by Educational Attainment in New Wilmington borough
According to labor force statistics for New Wilmington borough, 85.8% of individuals (386) out of the total population between 25 and 64 years of age (450) are in the labor force, with 0.8% or 3 of them being unemployed. The group with the highest labor force participation rate are those with the educational attainment of bachelor's degree or higher, with 93.3% or 265 individuals in the labor force. Within the labor force, individuals with less than high school education have the highest percentage of unemployment, with 17.6% or 3 of them being unemployed.
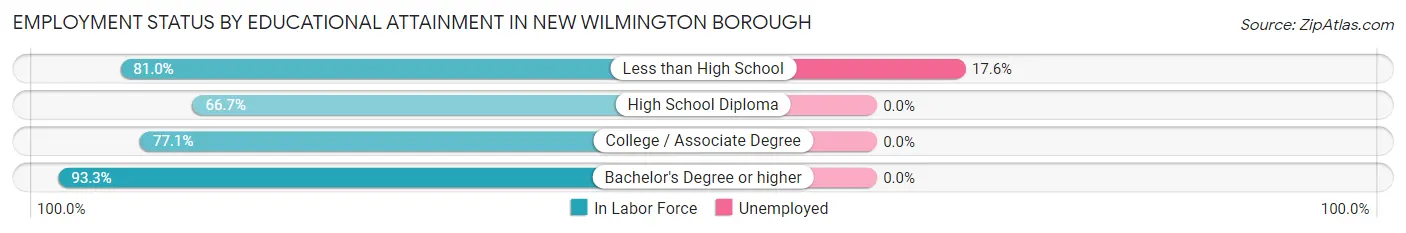
| Educational Attainment | In Labor Force | Unemployed |
| Less than High School | 17 (81.0%) | 4 (17.6%) |
| High School Diploma | 50 (66.7%) | 0 (0.0%) |
| College / Associate Degree | 54 (77.1%) | 0 (0.0%) |
| Bachelor's Degree or higher | 265 (93.3%) | 0 (0.0%) |
| Total | 386 (85.8%) | 4 (0.8%) |
Employment Occupations by Sex in New Wilmington borough
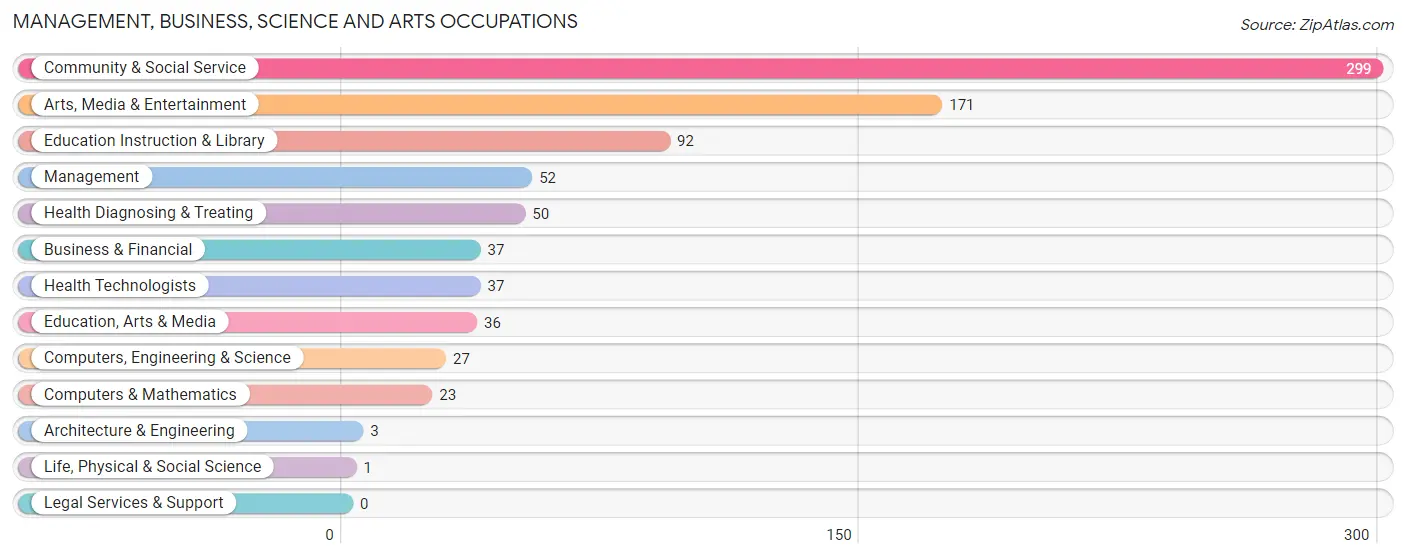
Management, Business, Science and Arts Occupations
The most common Management, Business, Science and Arts occupations in New Wilmington borough are Community & Social Service (299 | 25.7%), Arts, Media & Entertainment (171 | 14.7%), Education Instruction & Library (92 | 7.9%), Management (52 | 4.5%), and Health Diagnosing & Treating (50 | 4.3%).
Management, Business, Science and Arts Occupations by Sex
Within the Management, Business, Science and Arts occupations in New Wilmington borough, the most male-oriented occupations are Architecture & Engineering (100.0%), Life, Physical & Social Science (100.0%), and Arts, Media & Entertainment (86.6%), while the most female-oriented occupations are Education, Arts & Media (75.0%), Education Instruction & Library (59.8%), and Health Diagnosing & Treating (52.0%).
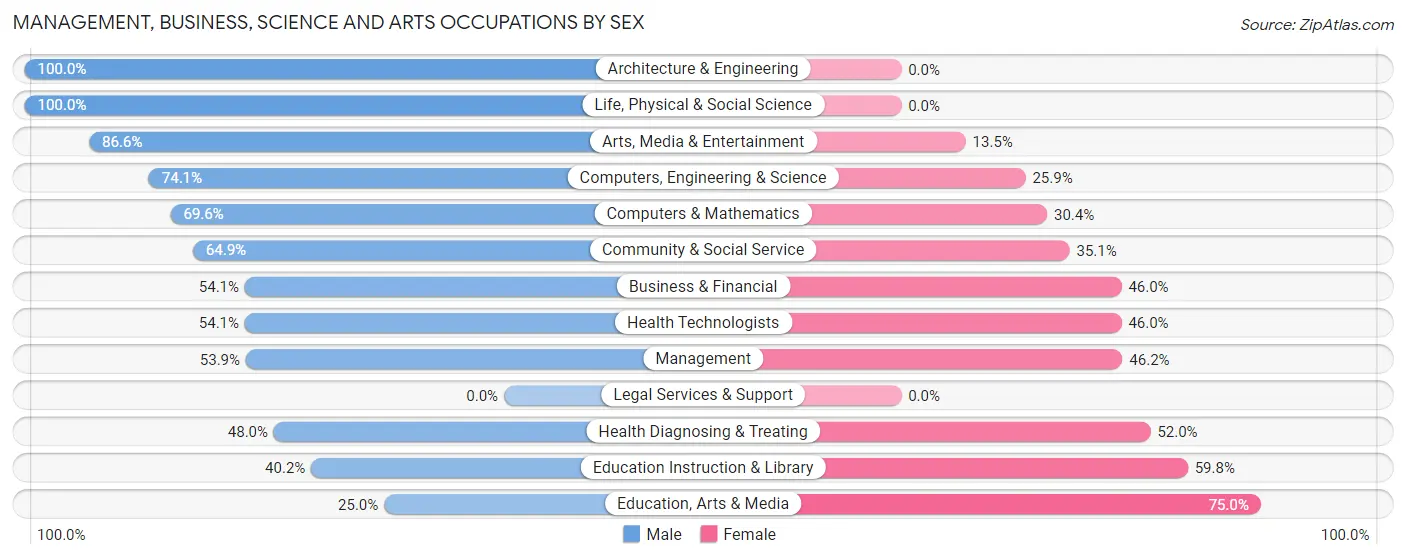
| Occupation | Male | Female |
| Management | 28 (53.8%) | 24 (46.2%) |
| Business & Financial | 20 (54.0%) | 17 (46.0%) |
| Computers, Engineering & Science | 20 (74.1%) | 7 (25.9%) |
| Computers & Mathematics | 16 (69.6%) | 7 (30.4%) |
| Architecture & Engineering | 3 (100.0%) | 0 (0.0%) |
| Life, Physical & Social Science | 1 (100.0%) | 0 (0.0%) |
| Community & Social Service | 194 (64.9%) | 105 (35.1%) |
| Education, Arts & Media | 9 (25.0%) | 27 (75.0%) |
| Legal Services & Support | 0 (0.0%) | 0 (0.0%) |
| Education Instruction & Library | 37 (40.2%) | 55 (59.8%) |
| Arts, Media & Entertainment | 148 (86.6%) | 23 (13.5%) |
| Health Diagnosing & Treating | 24 (48.0%) | 26 (52.0%) |
| Health Technologists | 20 (54.0%) | 17 (46.0%) |
| Total (Category) | 286 (61.5%) | 179 (38.5%) |
| Total (Overall) | 653 (56.1%) | 510 (43.9%) |
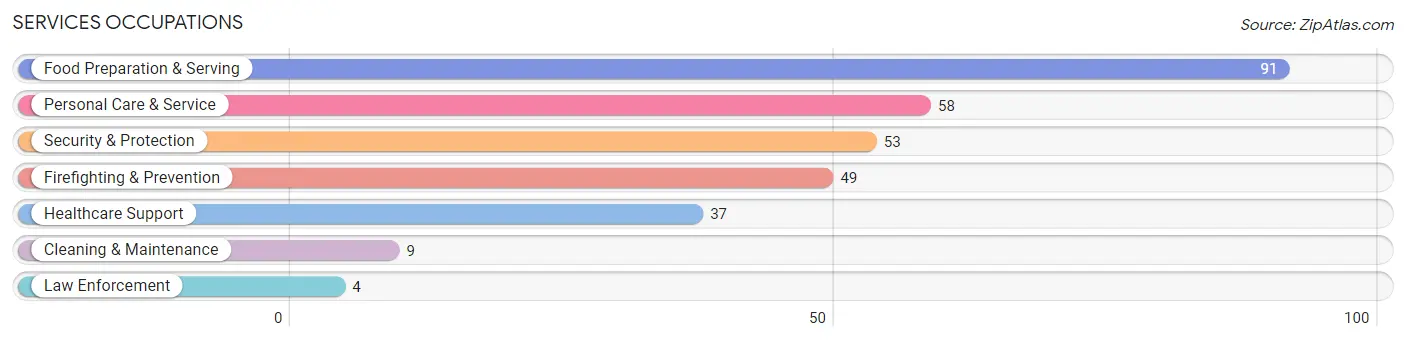
Services Occupations
The most common Services occupations in New Wilmington borough are Food Preparation & Serving (91 | 7.8%), Personal Care & Service (58 | 5.0%), Security & Protection (53 | 4.6%), Firefighting & Prevention (49 | 4.2%), and Healthcare Support (37 | 3.2%).
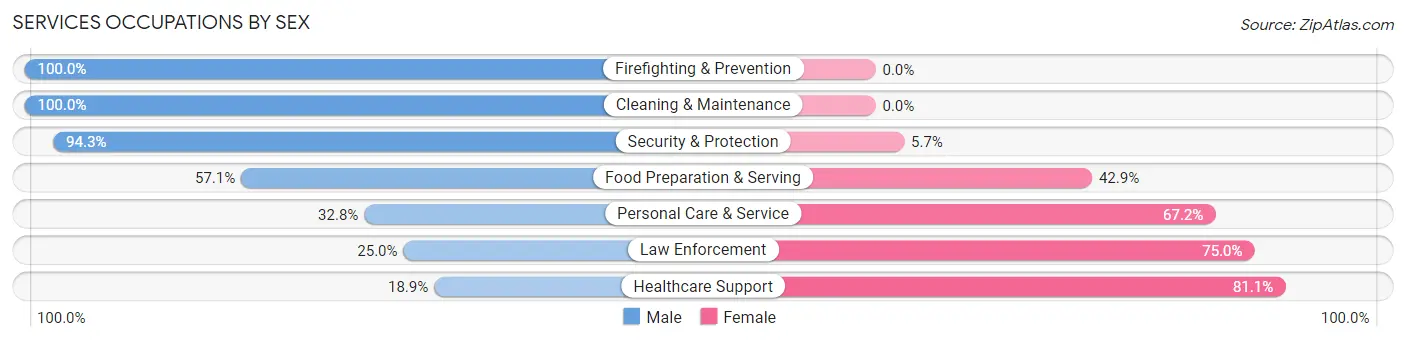
Services Occupations by Sex
Within the Services occupations in New Wilmington borough, the most male-oriented occupations are Firefighting & Prevention (100.0%), Cleaning & Maintenance (100.0%), and Security & Protection (94.3%), while the most female-oriented occupations are Healthcare Support (81.1%), Law Enforcement (75.0%), and Personal Care & Service (67.2%).
| Occupation | Male | Female |
| Healthcare Support | 7 (18.9%) | 30 (81.1%) |
| Security & Protection | 50 (94.3%) | 3 (5.7%) |
| Firefighting & Prevention | 49 (100.0%) | 0 (0.0%) |
| Law Enforcement | 1 (25.0%) | 3 (75.0%) |
| Food Preparation & Serving | 52 (57.1%) | 39 (42.9%) |
| Cleaning & Maintenance | 9 (100.0%) | 0 (0.0%) |
| Personal Care & Service | 19 (32.8%) | 39 (67.2%) |
| Total (Category) | 137 (55.2%) | 111 (44.8%) |
| Total (Overall) | 653 (56.1%) | 510 (43.9%) |
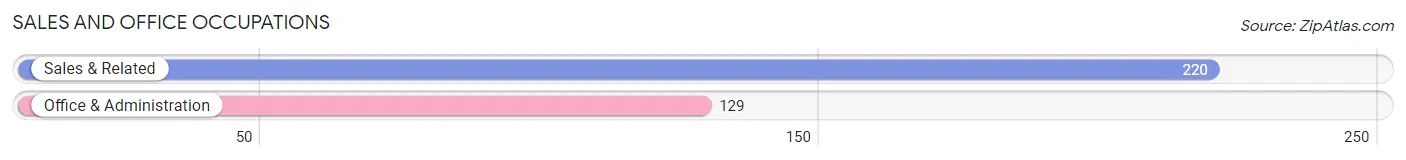
Sales and Office Occupations
The most common Sales and Office occupations in New Wilmington borough are Sales & Related (220 | 18.9%), and Office & Administration (129 | 11.1%).
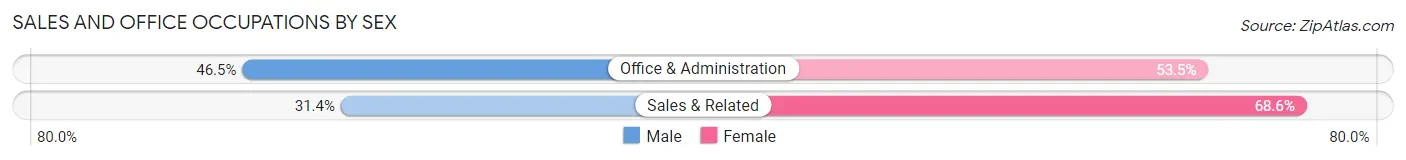
Sales and Office Occupations by Sex
| Occupation | Male | Female |
| Sales & Related | 69 (31.4%) | 151 (68.6%) |
| Office & Administration | 60 (46.5%) | 69 (53.5%) |
| Total (Category) | 129 (37.0%) | 220 (63.0%) |
| Total (Overall) | 653 (56.1%) | 510 (43.9%) |
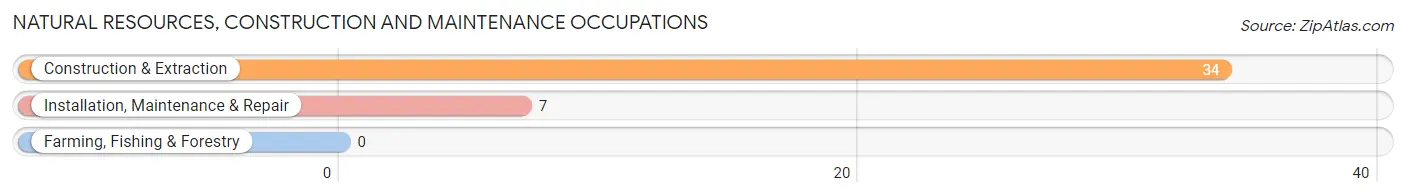
Natural Resources, Construction and Maintenance Occupations
The most common Natural Resources, Construction and Maintenance occupations in New Wilmington borough are Construction & Extraction (34 | 2.9%), and Installation, Maintenance & Repair (7 | 0.6%).
Natural Resources, Construction and Maintenance Occupations by Sex
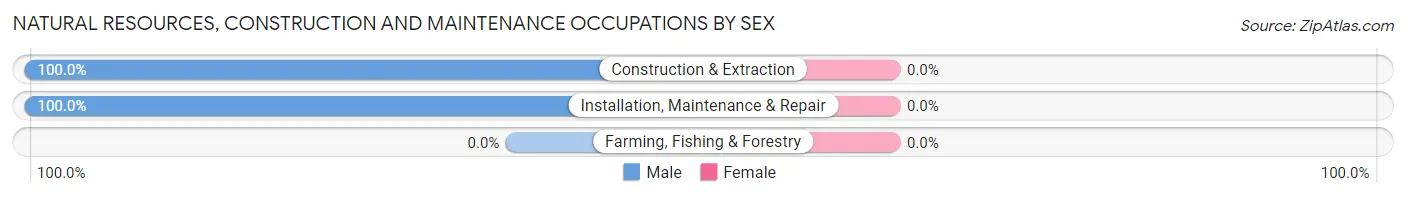
| Occupation | Male | Female |
| Farming, Fishing & Forestry | 0 (0.0%) | 0 (0.0%) |
| Construction & Extraction | 34 (100.0%) | 0 (0.0%) |
| Installation, Maintenance & Repair | 7 (100.0%) | 0 (0.0%) |
| Total (Category) | 41 (100.0%) | 0 (0.0%) |
| Total (Overall) | 653 (56.1%) | 510 (43.9%) |
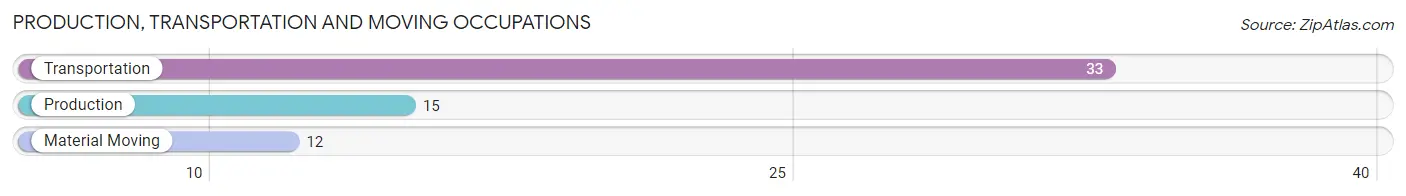
Production, Transportation and Moving Occupations
The most common Production, Transportation and Moving occupations in New Wilmington borough are Transportation (33 | 2.8%), Production (15 | 1.3%), and Material Moving (12 | 1.0%).
Production, Transportation and Moving Occupations by Sex
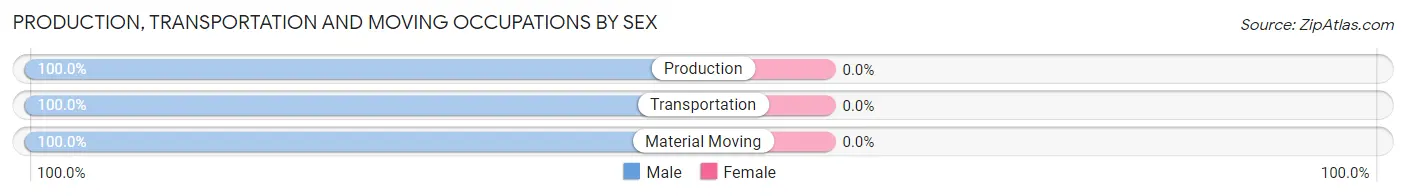
| Occupation | Male | Female |
| Production | 15 (100.0%) | 0 (0.0%) |
| Transportation | 33 (100.0%) | 0 (0.0%) |
| Material Moving | 12 (100.0%) | 0 (0.0%) |
| Total (Category) | 60 (100.0%) | 0 (0.0%) |
| Total (Overall) | 653 (56.1%) | 510 (43.9%) |
Employment Industries by Sex in New Wilmington borough
Employment Industries in New Wilmington borough
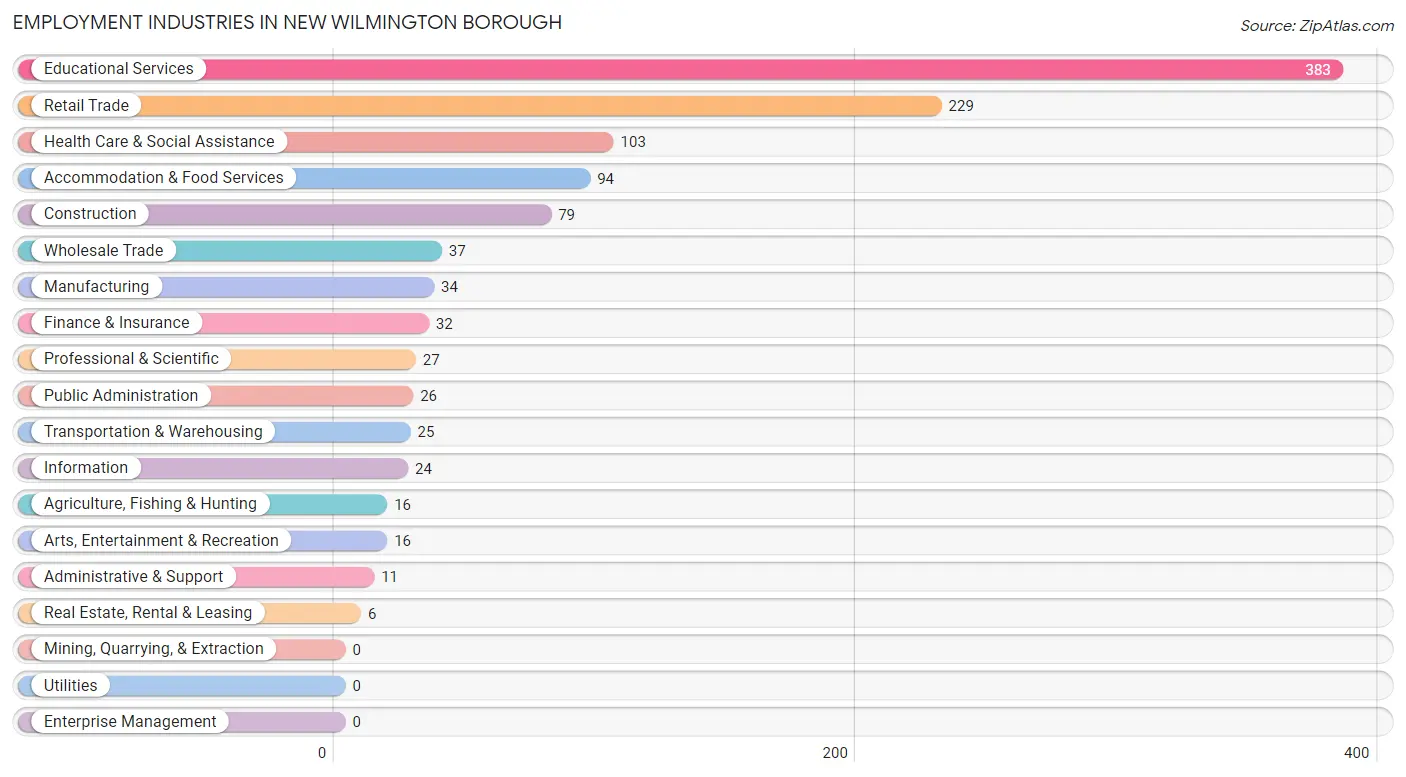
The major employment industries in New Wilmington borough include Educational Services (383 | 32.9%), Retail Trade (229 | 19.7%), Health Care & Social Assistance (103 | 8.9%), Accommodation & Food Services (94 | 8.1%), and Construction (79 | 6.8%).
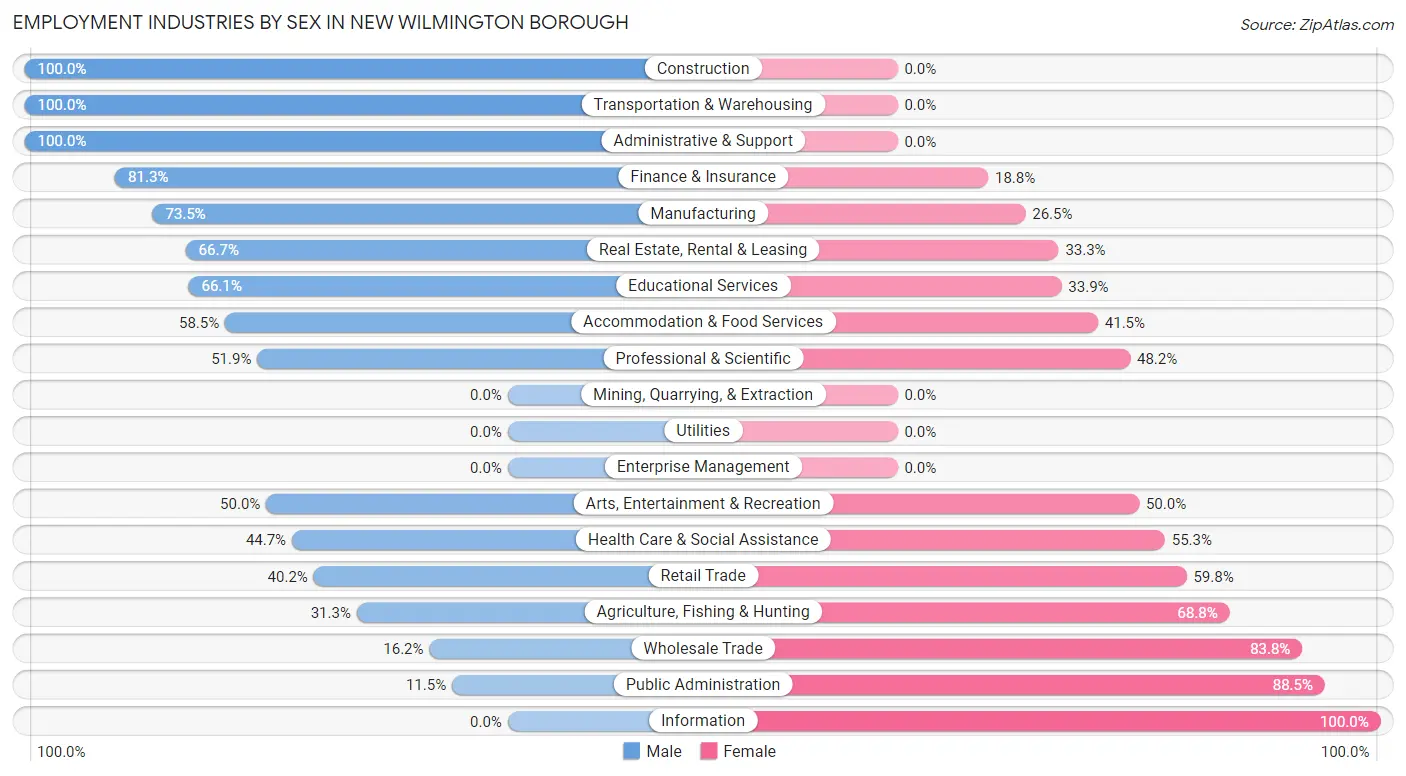
Employment Industries by Sex in New Wilmington borough
The New Wilmington borough industries that see more men than women are Construction (100.0%), Transportation & Warehousing (100.0%), and Administrative & Support (100.0%), whereas the industries that tend to have a higher number of women are Information (100.0%), Public Administration (88.5%), and Wholesale Trade (83.8%).
| Industry | Male | Female |
| Agriculture, Fishing & Hunting | 5 (31.2%) | 11 (68.8%) |
| Mining, Quarrying, & Extraction | 0 (0.0%) | 0 (0.0%) |
| Construction | 79 (100.0%) | 0 (0.0%) |
| Manufacturing | 25 (73.5%) | 9 (26.5%) |
| Wholesale Trade | 6 (16.2%) | 31 (83.8%) |
| Retail Trade | 92 (40.2%) | 137 (59.8%) |
| Transportation & Warehousing | 25 (100.0%) | 0 (0.0%) |
| Utilities | 0 (0.0%) | 0 (0.0%) |
| Information | 0 (0.0%) | 24 (100.0%) |
| Finance & Insurance | 26 (81.2%) | 6 (18.8%) |
| Real Estate, Rental & Leasing | 4 (66.7%) | 2 (33.3%) |
| Professional & Scientific | 14 (51.8%) | 13 (48.1%) |
| Enterprise Management | 0 (0.0%) | 0 (0.0%) |
| Administrative & Support | 11 (100.0%) | 0 (0.0%) |
| Educational Services | 253 (66.1%) | 130 (33.9%) |
| Health Care & Social Assistance | 46 (44.7%) | 57 (55.3%) |
| Arts, Entertainment & Recreation | 8 (50.0%) | 8 (50.0%) |
| Accommodation & Food Services | 55 (58.5%) | 39 (41.5%) |
| Public Administration | 3 (11.5%) | 23 (88.5%) |
| Total | 653 (56.1%) | 510 (43.9%) |
Education in New Wilmington borough
School Enrollment in New Wilmington borough
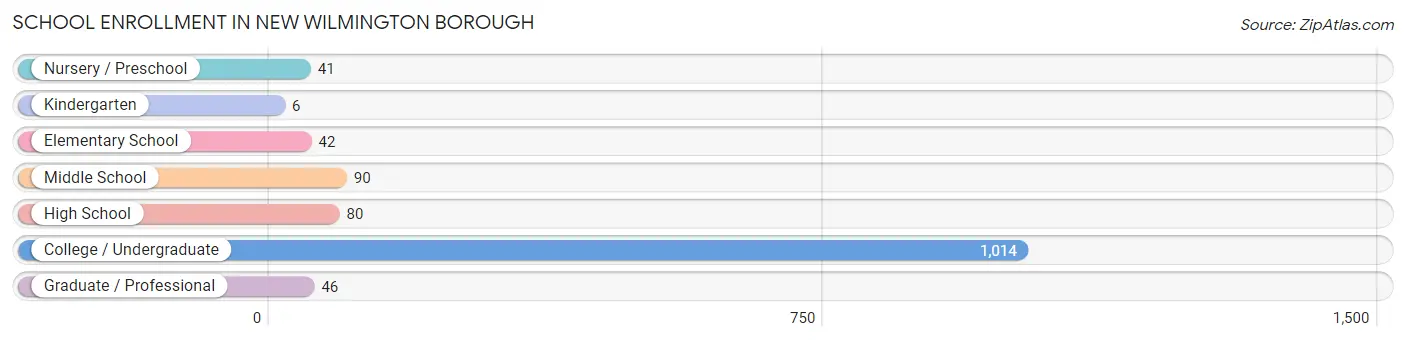
The most common levels of schooling among the 1,319 students in New Wilmington borough are college / undergraduate (1,014 | 76.9%), middle school (90 | 6.8%), and high school (80 | 6.1%).
| School Level | # Students | % Students |
| Nursery / Preschool | 41 | 3.1% |
| Kindergarten | 6 | 0.4% |
| Elementary School | 42 | 3.2% |
| Middle School | 90 | 6.8% |
| High School | 80 | 6.1% |
| College / Undergraduate | 1,014 | 76.9% |
| Graduate / Professional | 46 | 3.5% |
| Total | 1,319 | 100.0% |
School Enrollment by Age by Funding Source in New Wilmington borough
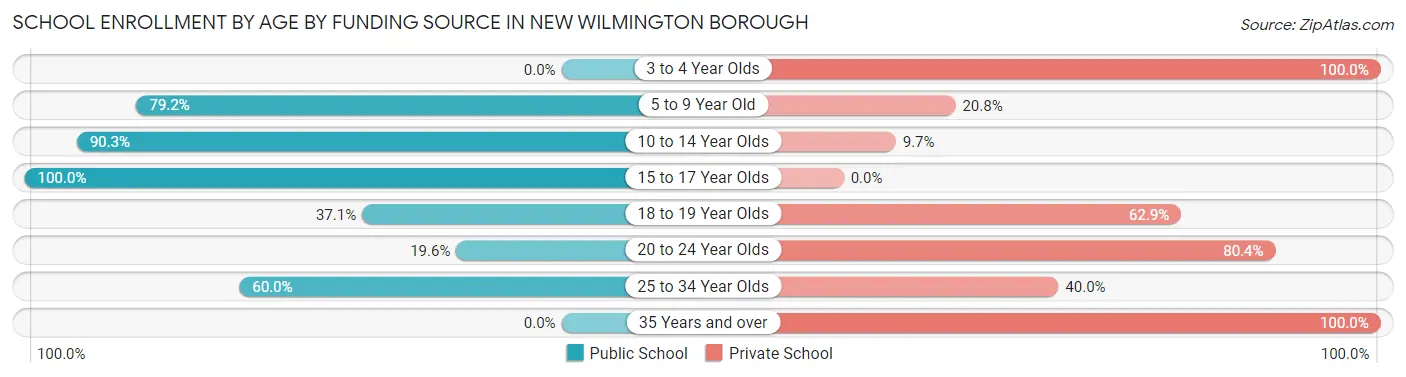
Out of a total of 1,319 students who are enrolled in schools in New Wilmington borough, 852 (64.6%) attend a private institution, while the remaining 467 (35.4%) are enrolled in public schools. The age group of 3 to 4 year olds has the highest likelihood of being enrolled in private schools, with 33 (100.0% in the age bracket) enrolled. Conversely, the age group of 15 to 17 year olds has the lowest likelihood of being enrolled in a private school, with 52 (100.0% in the age bracket) attending a public institution.
| Age Bracket | Public School | Private School |
| 3 to 4 Year Olds | 0 (0.0%) | 33 (100.0%) |
| 5 to 9 Year Old | 38 (79.2%) | 10 (20.8%) |
| 10 to 14 Year Olds | 93 (90.3%) | 10 (9.7%) |
| 15 to 17 Year Olds | 52 (100.0%) | 0 (0.0%) |
| 18 to 19 Year Olds | 153 (37.1%) | 259 (62.9%) |
| 20 to 24 Year Olds | 128 (19.6%) | 525 (80.4%) |
| 25 to 34 Year Olds | 3 (60.0%) | 2 (40.0%) |
| 35 Years and over | 0 (0.0%) | 13 (100.0%) |
| Total | 467 (35.4%) | 852 (64.6%) |
Educational Attainment by Field of Study in New Wilmington borough
Education (105 | 25.2%), business (59 | 14.1%), science & technology (43 | 10.3%), liberal arts & history (43 | 10.3%), and social sciences (36 | 8.6%) are the most common fields of study among 417 individuals in New Wilmington borough who have obtained a bachelor's degree or higher.
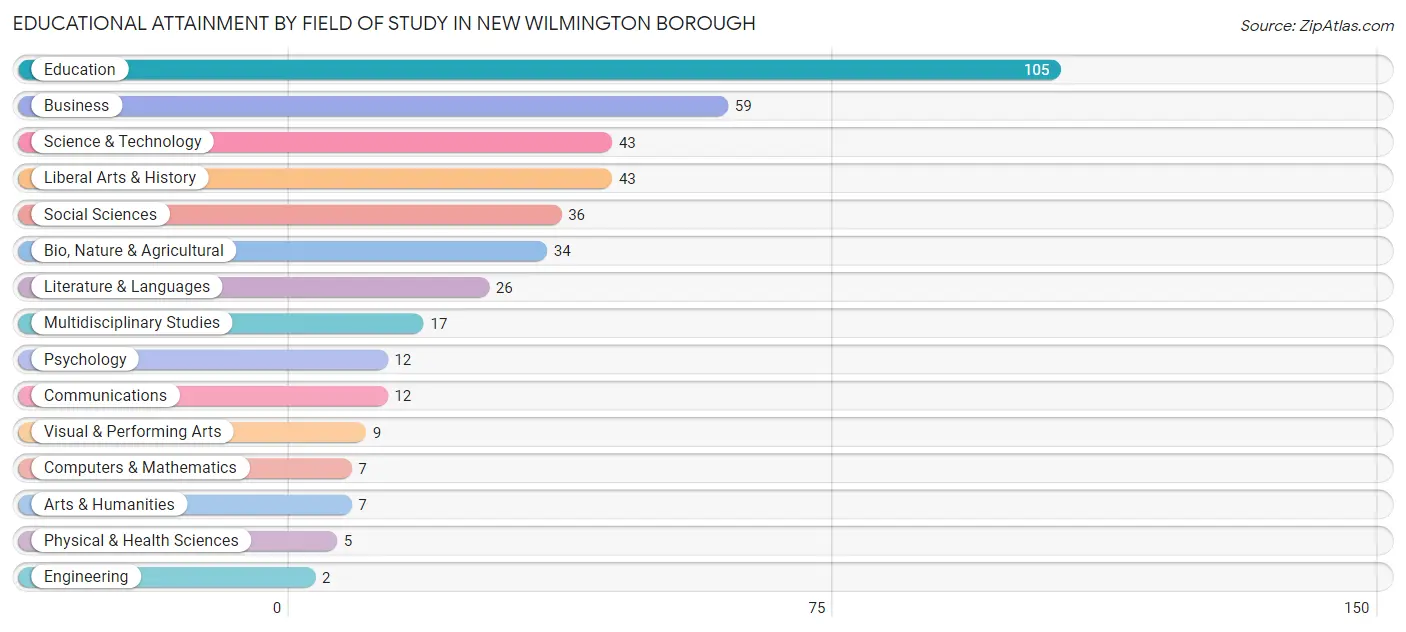
| Field of Study | # Graduates | % Graduates |
| Computers & Mathematics | 7 | 1.7% |
| Bio, Nature & Agricultural | 34 | 8.2% |
| Physical & Health Sciences | 5 | 1.2% |
| Psychology | 12 | 2.9% |
| Social Sciences | 36 | 8.6% |
| Engineering | 2 | 0.5% |
| Multidisciplinary Studies | 17 | 4.1% |
| Science & Technology | 43 | 10.3% |
| Business | 59 | 14.1% |
| Education | 105 | 25.2% |
| Literature & Languages | 26 | 6.2% |
| Liberal Arts & History | 43 | 10.3% |
| Visual & Performing Arts | 9 | 2.2% |
| Communications | 12 | 2.9% |
| Arts & Humanities | 7 | 1.7% |
| Total | 417 | 100.0% |
Transportation & Commute in New Wilmington borough
Vehicle Availability by Sex in New Wilmington borough
The most prevalent vehicle ownership categories in New Wilmington borough are males with 2 vehicles (139, accounting for 62.9%) and females with 2 vehicles (173, making up 43.9%).
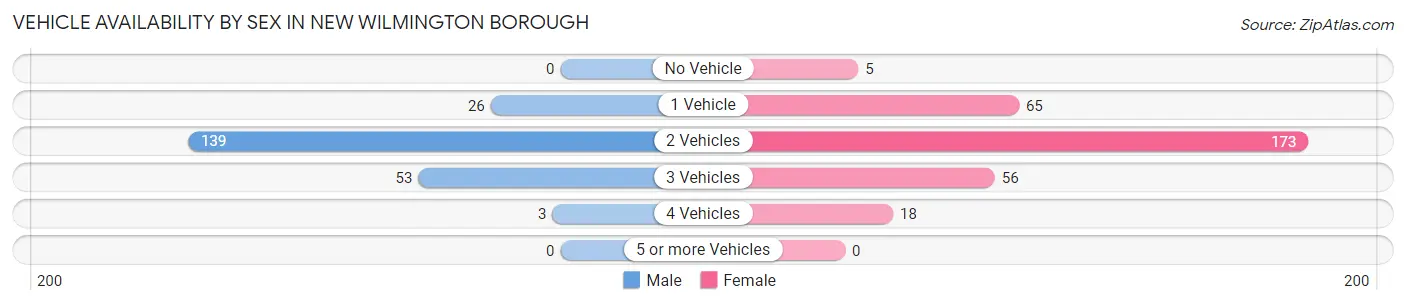
| Vehicles Available | Male | Female |
| No Vehicle | 0 (0.0%) | 5 (1.6%) |
| 1 Vehicle | 26 (11.8%) | 65 (20.5%) |
| 2 Vehicles | 139 (62.9%) | 173 (54.6%) |
| 3 Vehicles | 53 (24.0%) | 56 (17.7%) |
| 4 Vehicles | 3 (1.4%) | 18 (5.7%) |
| 5 or more Vehicles | 0 (0.0%) | 0 (0.0%) |
| Total | 221 (100.0%) | 317 (100.0%) |
Commute Time in New Wilmington borough
The most frequently occuring commute durations in New Wilmington borough are 5 to 9 minutes (207 commuters, 21.8%), less than 5 minutes (165 commuters, 17.4%), and 25 to 29 minutes (154 commuters, 16.2%).
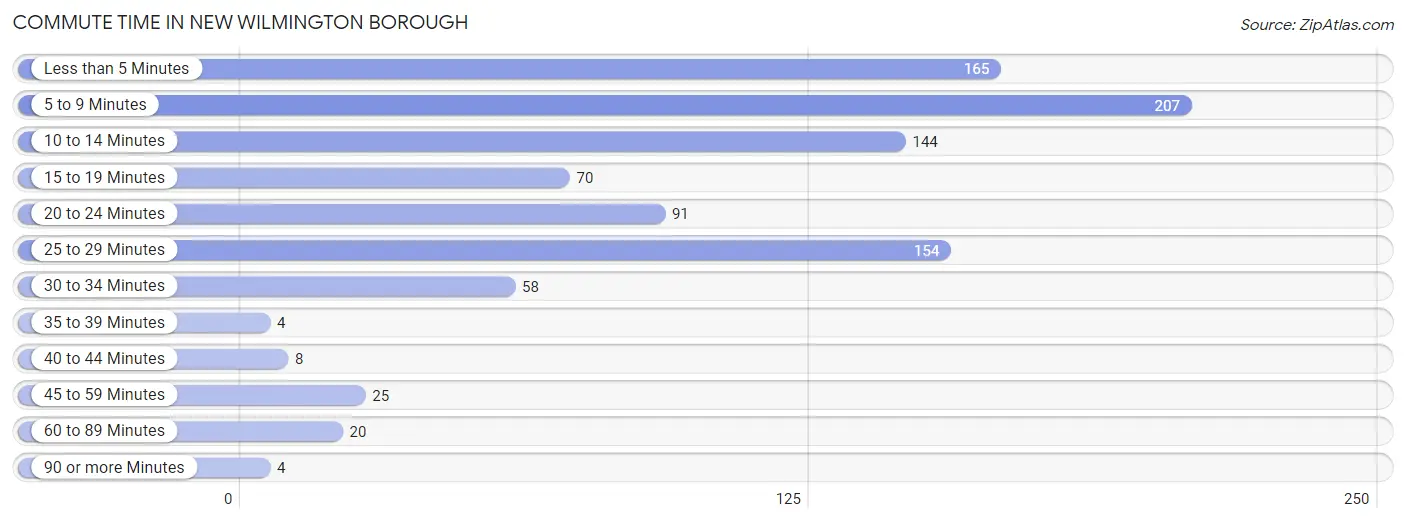
| Commute Time | # Commuters | % Commuters |
| Less than 5 Minutes | 165 | 17.4% |
| 5 to 9 Minutes | 207 | 21.8% |
| 10 to 14 Minutes | 144 | 15.2% |
| 15 to 19 Minutes | 70 | 7.4% |
| 20 to 24 Minutes | 91 | 9.6% |
| 25 to 29 Minutes | 154 | 16.2% |
| 30 to 34 Minutes | 58 | 6.1% |
| 35 to 39 Minutes | 4 | 0.4% |
| 40 to 44 Minutes | 8 | 0.8% |
| 45 to 59 Minutes | 25 | 2.6% |
| 60 to 89 Minutes | 20 | 2.1% |
| 90 or more Minutes | 4 | 0.4% |
Commute Time by Sex in New Wilmington borough
The most common commute times in New Wilmington borough are 5 to 9 minutes (151 commuters, 29.1%) for males and less than 5 minutes (98 commuters, 22.7%) for females.
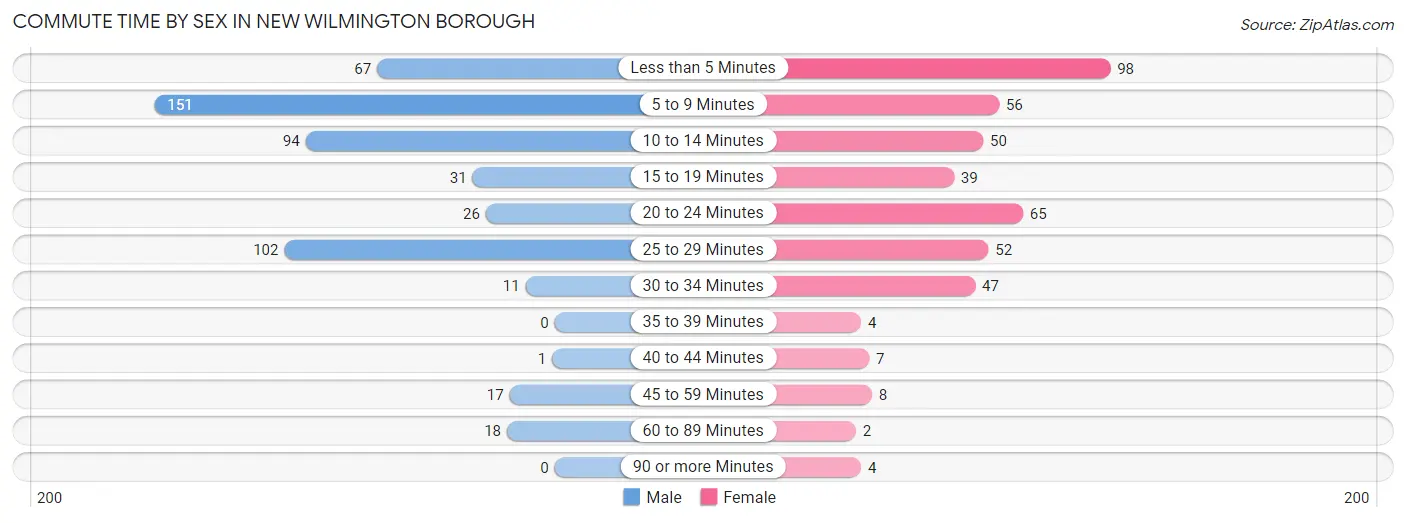
| Commute Time | Male | Female |
| Less than 5 Minutes | 67 (12.9%) | 98 (22.7%) |
| 5 to 9 Minutes | 151 (29.1%) | 56 (13.0%) |
| 10 to 14 Minutes | 94 (18.1%) | 50 (11.6%) |
| 15 to 19 Minutes | 31 (6.0%) | 39 (9.0%) |
| 20 to 24 Minutes | 26 (5.0%) | 65 (15.0%) |
| 25 to 29 Minutes | 102 (19.7%) | 52 (12.0%) |
| 30 to 34 Minutes | 11 (2.1%) | 47 (10.9%) |
| 35 to 39 Minutes | 0 (0.0%) | 4 (0.9%) |
| 40 to 44 Minutes | 1 (0.2%) | 7 (1.6%) |
| 45 to 59 Minutes | 17 (3.3%) | 8 (1.8%) |
| 60 to 89 Minutes | 18 (3.5%) | 2 (0.5%) |
| 90 or more Minutes | 0 (0.0%) | 4 (0.9%) |
Time of Departure to Work by Sex in New Wilmington borough
The most frequent times of departure to work in New Wilmington borough are 12:00 PM to 3:59 PM (134, 25.9%) for males and 12:00 PM to 3:59 PM (107, 24.8%) for females.
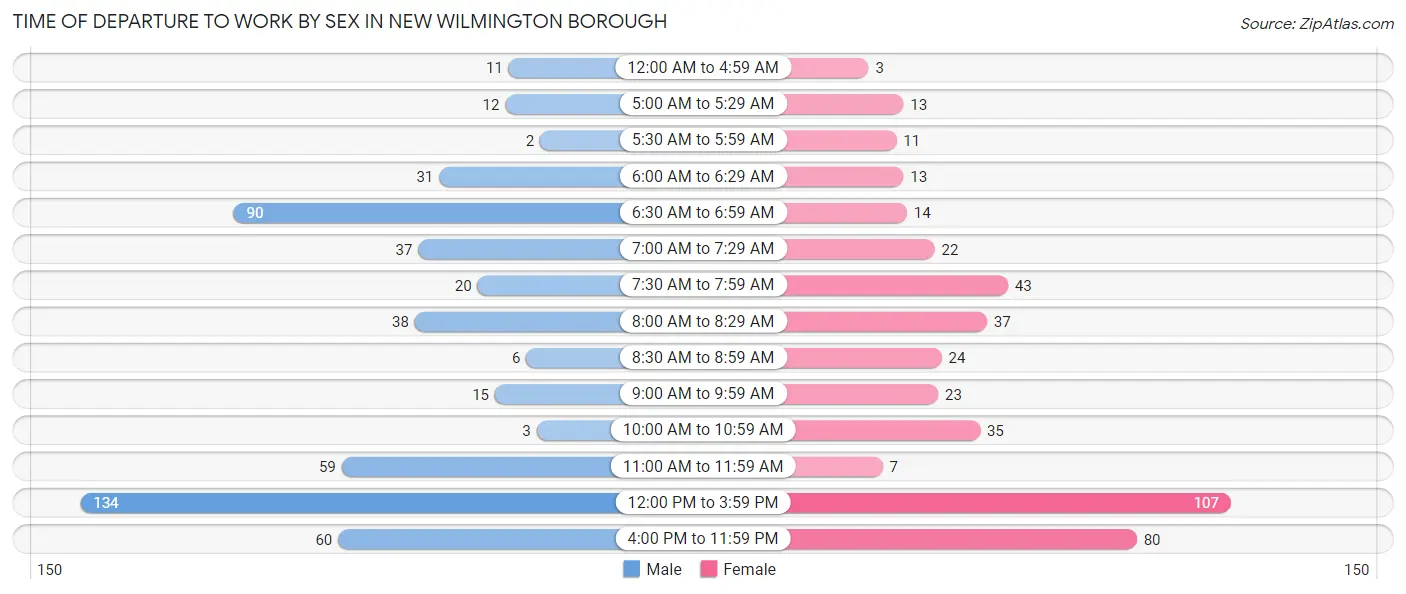
| Time of Departure | Male | Female |
| 12:00 AM to 4:59 AM | 11 (2.1%) | 3 (0.7%) |
| 5:00 AM to 5:29 AM | 12 (2.3%) | 13 (3.0%) |
| 5:30 AM to 5:59 AM | 2 (0.4%) | 11 (2.5%) |
| 6:00 AM to 6:29 AM | 31 (6.0%) | 13 (3.0%) |
| 6:30 AM to 6:59 AM | 90 (17.4%) | 14 (3.2%) |
| 7:00 AM to 7:29 AM | 37 (7.1%) | 22 (5.1%) |
| 7:30 AM to 7:59 AM | 20 (3.9%) | 43 (10.0%) |
| 8:00 AM to 8:29 AM | 38 (7.3%) | 37 (8.6%) |
| 8:30 AM to 8:59 AM | 6 (1.2%) | 24 (5.6%) |
| 9:00 AM to 9:59 AM | 15 (2.9%) | 23 (5.3%) |
| 10:00 AM to 10:59 AM | 3 (0.6%) | 35 (8.1%) |
| 11:00 AM to 11:59 AM | 59 (11.4%) | 7 (1.6%) |
| 12:00 PM to 3:59 PM | 134 (25.9%) | 107 (24.8%) |
| 4:00 PM to 11:59 PM | 60 (11.6%) | 80 (18.5%) |
| Total | 518 (100.0%) | 432 (100.0%) |
Housing Occupancy in New Wilmington borough
Occupancy by Ownership in New Wilmington borough
Of the total 468 dwellings in New Wilmington borough, owner-occupied units account for 289 (61.8%), while renter-occupied units make up 179 (38.3%).
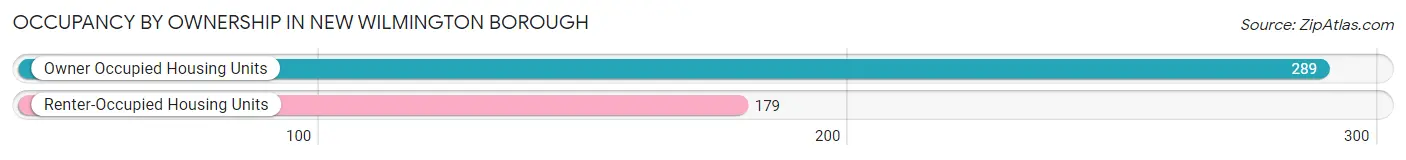
| Occupancy | # Housing Units | % Housing Units |
| Owner Occupied Housing Units | 289 | 61.8% |
| Renter-Occupied Housing Units | 179 | 38.3% |
| Total Occupied Housing Units | 468 | 100.0% |
Occupancy by Household Size in New Wilmington borough
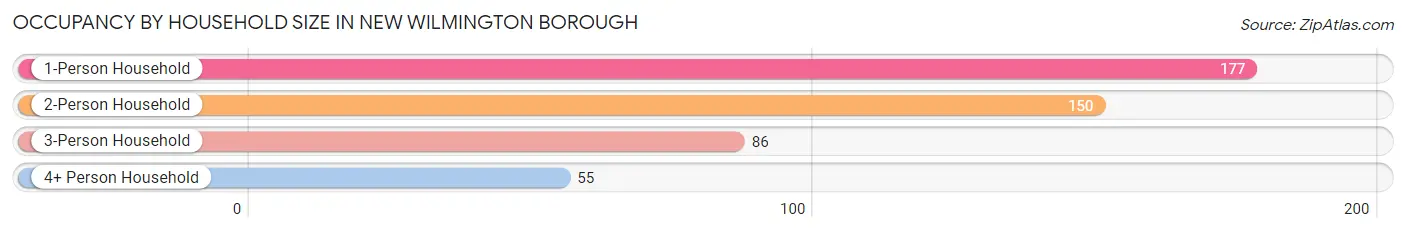
| Household Size | # Housing Units | % Housing Units |
| 1-Person Household | 177 | 37.8% |
| 2-Person Household | 150 | 32.1% |
| 3-Person Household | 86 | 18.4% |
| 4+ Person Household | 55 | 11.7% |
| Total Housing Units | 468 | 100.0% |
Occupancy by Ownership by Household Size in New Wilmington borough
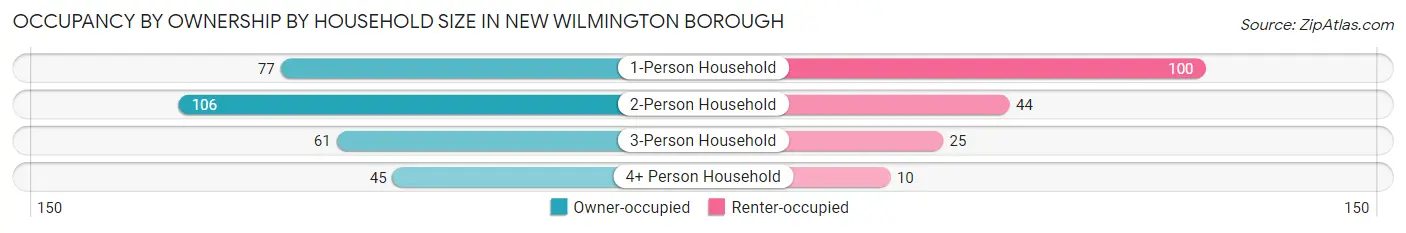
| Household Size | Owner-occupied | Renter-occupied |
| 1-Person Household | 77 (43.5%) | 100 (56.5%) |
| 2-Person Household | 106 (70.7%) | 44 (29.3%) |
| 3-Person Household | 61 (70.9%) | 25 (29.1%) |
| 4+ Person Household | 45 (81.8%) | 10 (18.2%) |
| Total Housing Units | 289 (61.8%) | 179 (38.3%) |
Occupancy by Educational Attainment in New Wilmington borough
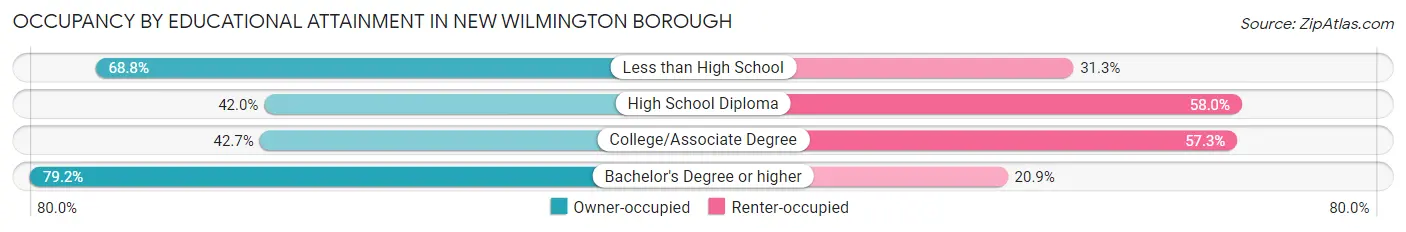
| Household Size | Owner-occupied | Renter-occupied |
| Less than High School | 11 (68.8%) | 5 (31.2%) |
| High School Diploma | 42 (42.0%) | 58 (58.0%) |
| College/Associate Degree | 50 (42.7%) | 67 (57.3%) |
| Bachelor's Degree or higher | 186 (79.1%) | 49 (20.8%) |
Occupancy by Age of Householder in New Wilmington borough
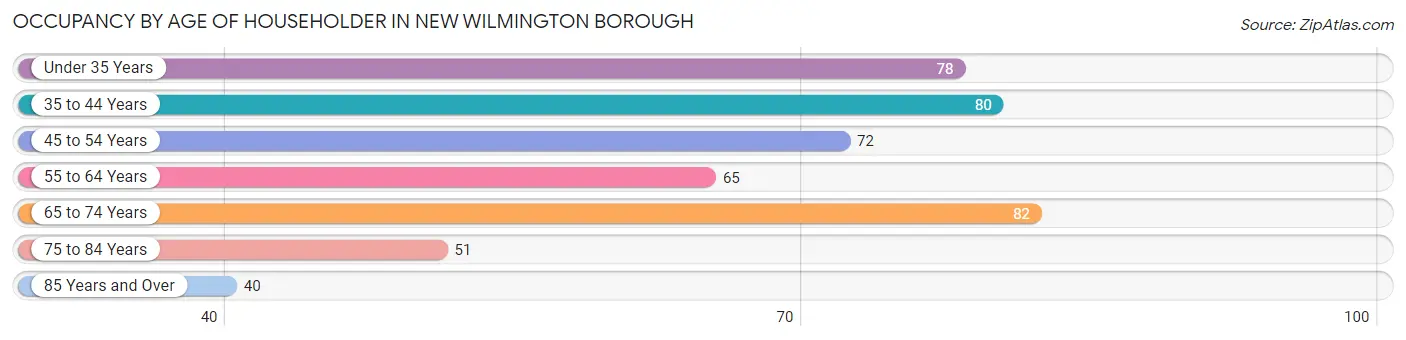
| Age Bracket | # Households | % Households |
| Under 35 Years | 78 | 16.7% |
| 35 to 44 Years | 80 | 17.1% |
| 45 to 54 Years | 72 | 15.4% |
| 55 to 64 Years | 65 | 13.9% |
| 65 to 74 Years | 82 | 17.5% |
| 75 to 84 Years | 51 | 10.9% |
| 85 Years and Over | 40 | 8.6% |
| Total | 468 | 100.0% |
Housing Finances in New Wilmington borough
Median Income by Occupancy in New Wilmington borough
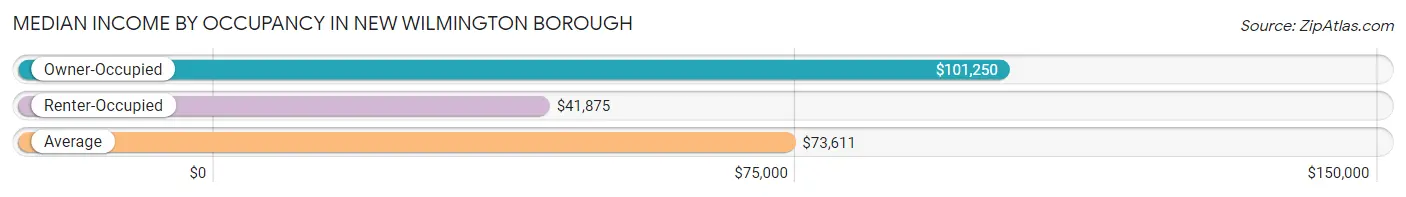
| Occupancy Type | # Households | Median Income |
| Owner-Occupied | 289 (61.8%) | $101,250 |
| Renter-Occupied | 179 (38.3%) | $41,875 |
| Average | 468 (100.0%) | $73,611 |
Occupancy by Householder Income Bracket in New Wilmington borough
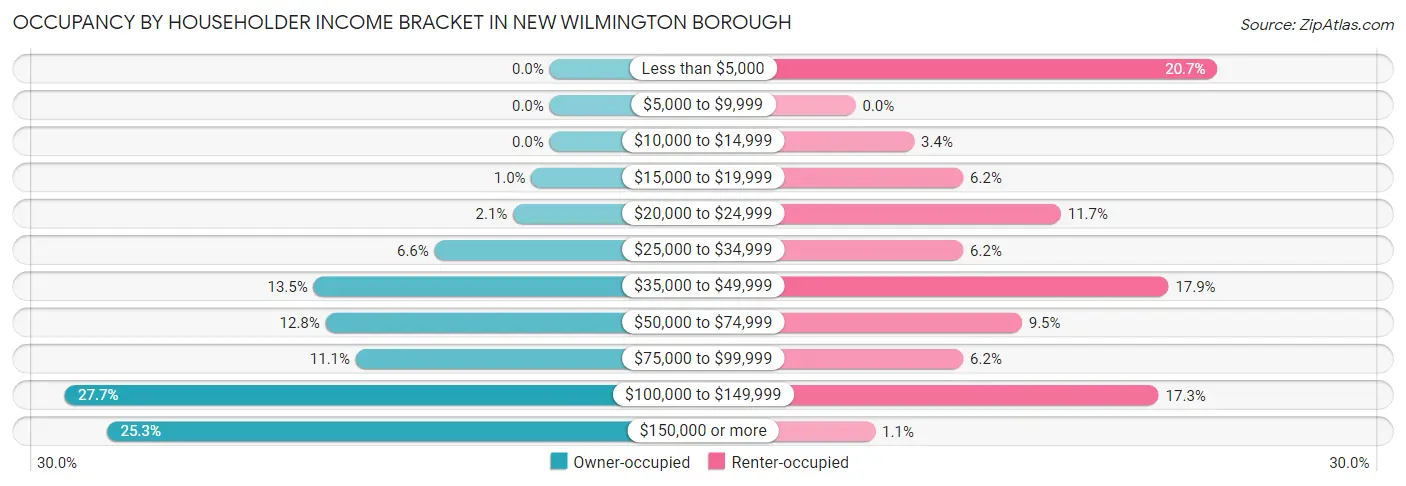
| Income Bracket | Owner-occupied | Renter-occupied |
| Less than $5,000 | 0 (0.0%) | 37 (20.7%) |
| $5,000 to $9,999 | 0 (0.0%) | 0 (0.0%) |
| $10,000 to $14,999 | 0 (0.0%) | 6 (3.4%) |
| $15,000 to $19,999 | 3 (1.0%) | 11 (6.1%) |
| $20,000 to $24,999 | 6 (2.1%) | 21 (11.7%) |
| $25,000 to $34,999 | 19 (6.6%) | 11 (6.1%) |
| $35,000 to $49,999 | 39 (13.5%) | 32 (17.9%) |
| $50,000 to $74,999 | 37 (12.8%) | 17 (9.5%) |
| $75,000 to $99,999 | 32 (11.1%) | 11 (6.1%) |
| $100,000 to $149,999 | 80 (27.7%) | 31 (17.3%) |
| $150,000 or more | 73 (25.3%) | 2 (1.1%) |
| Total | 289 (100.0%) | 179 (100.0%) |
Monthly Housing Cost Tiers in New Wilmington borough
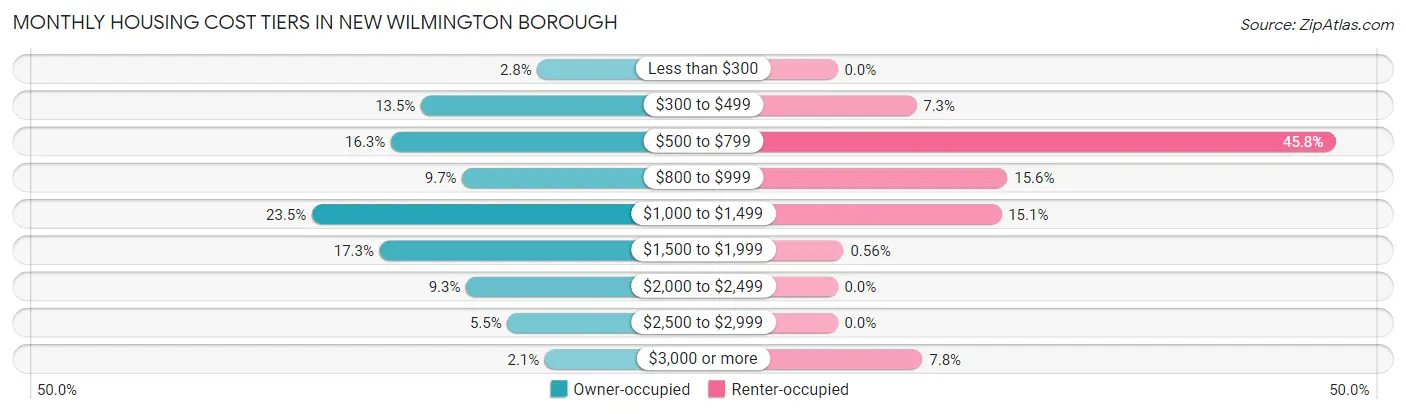
| Monthly Cost | Owner-occupied | Renter-occupied |
| Less than $300 | 8 (2.8%) | 0 (0.0%) |
| $300 to $499 | 39 (13.5%) | 13 (7.3%) |
| $500 to $799 | 47 (16.3%) | 82 (45.8%) |
| $800 to $999 | 28 (9.7%) | 28 (15.6%) |
| $1,000 to $1,499 | 68 (23.5%) | 27 (15.1%) |
| $1,500 to $1,999 | 50 (17.3%) | 1 (0.6%) |
| $2,000 to $2,499 | 27 (9.3%) | 0 (0.0%) |
| $2,500 to $2,999 | 16 (5.5%) | 0 (0.0%) |
| $3,000 or more | 6 (2.1%) | 14 (7.8%) |
| Total | 289 (100.0%) | 179 (100.0%) |
Physical Housing Characteristics in New Wilmington borough
Housing Structures in New Wilmington borough
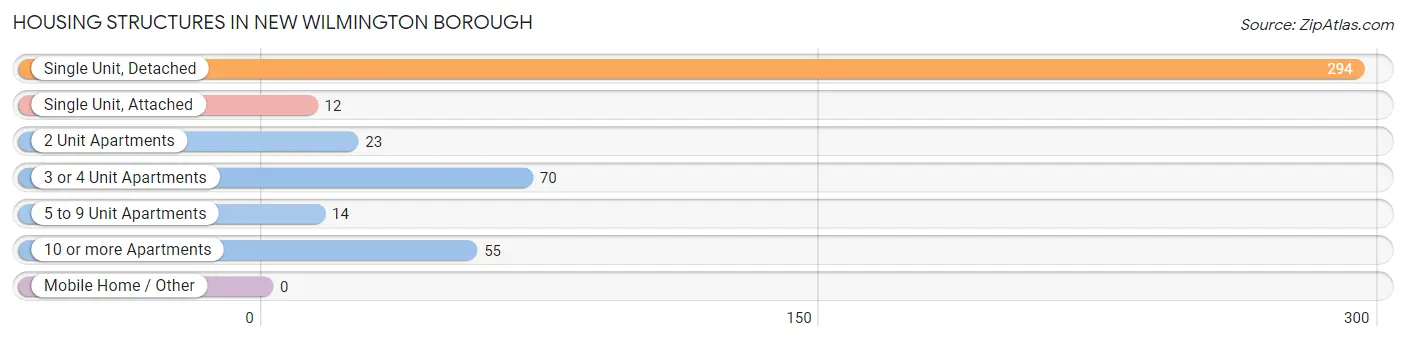
| Structure Type | # Housing Units | % Housing Units |
| Single Unit, Detached | 294 | 62.8% |
| Single Unit, Attached | 12 | 2.6% |
| 2 Unit Apartments | 23 | 4.9% |
| 3 or 4 Unit Apartments | 70 | 15.0% |
| 5 to 9 Unit Apartments | 14 | 3.0% |
| 10 or more Apartments | 55 | 11.7% |
| Mobile Home / Other | 0 | 0.0% |
| Total | 468 | 100.0% |
Housing Structures by Occupancy in New Wilmington borough
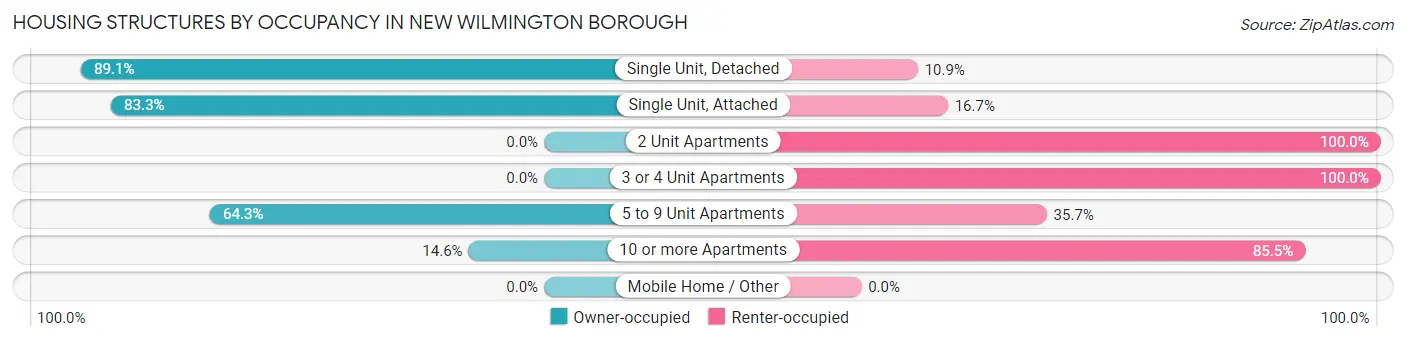
| Structure Type | Owner-occupied | Renter-occupied |
| Single Unit, Detached | 262 (89.1%) | 32 (10.9%) |
| Single Unit, Attached | 10 (83.3%) | 2 (16.7%) |
| 2 Unit Apartments | 0 (0.0%) | 23 (100.0%) |
| 3 or 4 Unit Apartments | 0 (0.0%) | 70 (100.0%) |
| 5 to 9 Unit Apartments | 9 (64.3%) | 5 (35.7%) |
| 10 or more Apartments | 8 (14.5%) | 47 (85.5%) |
| Mobile Home / Other | 0 (0.0%) | 0 (0.0%) |
| Total | 289 (61.8%) | 179 (38.3%) |
Housing Structures by Number of Rooms in New Wilmington borough
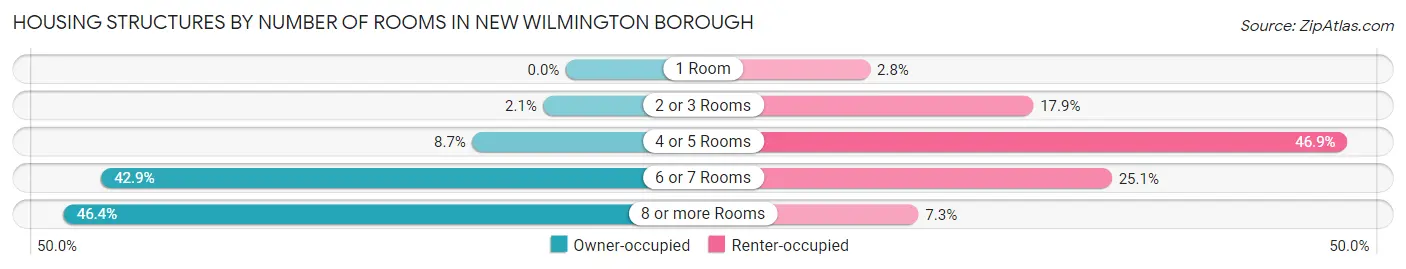
| Number of Rooms | Owner-occupied | Renter-occupied |
| 1 Room | 0 (0.0%) | 5 (2.8%) |
| 2 or 3 Rooms | 6 (2.1%) | 32 (17.9%) |
| 4 or 5 Rooms | 25 (8.6%) | 84 (46.9%) |
| 6 or 7 Rooms | 124 (42.9%) | 45 (25.1%) |
| 8 or more Rooms | 134 (46.4%) | 13 (7.3%) |
| Total | 289 (100.0%) | 179 (100.0%) |
Housing Structure by Heating Type in New Wilmington borough
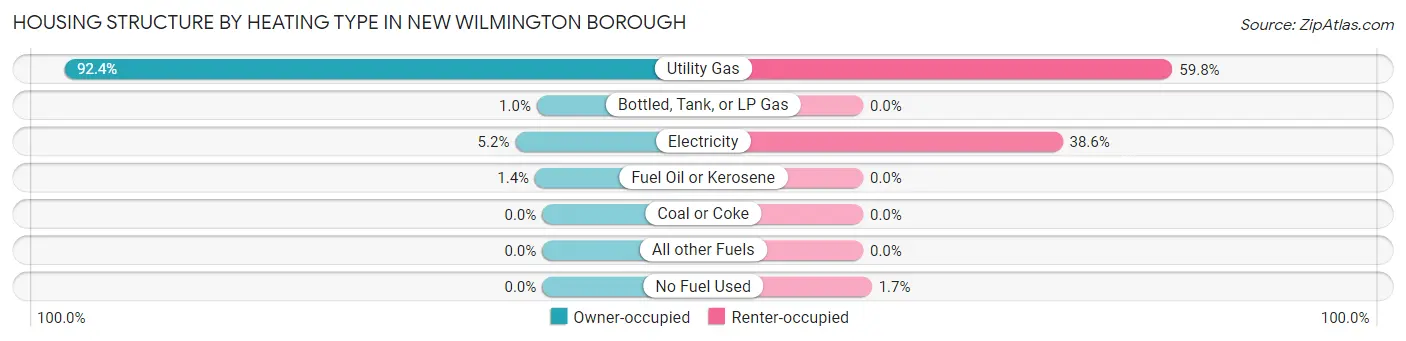
| Heating Type | Owner-occupied | Renter-occupied |
| Utility Gas | 267 (92.4%) | 107 (59.8%) |
| Bottled, Tank, or LP Gas | 3 (1.0%) | 0 (0.0%) |
| Electricity | 15 (5.2%) | 69 (38.6%) |
| Fuel Oil or Kerosene | 4 (1.4%) | 0 (0.0%) |
| Coal or Coke | 0 (0.0%) | 0 (0.0%) |
| All other Fuels | 0 (0.0%) | 0 (0.0%) |
| No Fuel Used | 0 (0.0%) | 3 (1.7%) |
| Total | 289 (100.0%) | 179 (100.0%) |
Household Vehicle Usage in New Wilmington borough
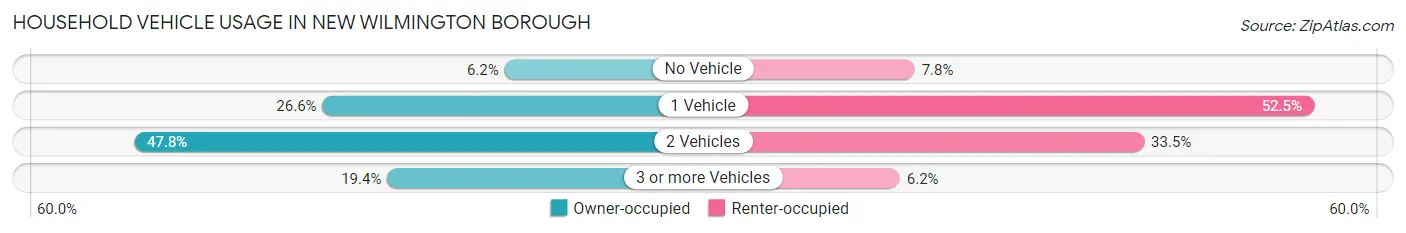
| Vehicles per Household | Owner-occupied | Renter-occupied |
| No Vehicle | 18 (6.2%) | 14 (7.8%) |
| 1 Vehicle | 77 (26.6%) | 94 (52.5%) |
| 2 Vehicles | 138 (47.7%) | 60 (33.5%) |
| 3 or more Vehicles | 56 (19.4%) | 11 (6.1%) |
| Total | 289 (100.0%) | 179 (100.0%) |
Real Estate & Mortgages in New Wilmington borough
Real Estate and Mortgage Overview in New Wilmington borough
| Characteristic | Without Mortgage | With Mortgage |
| Housing Units | 109 | 180 |
| Median Property Value | $177,000 | $206,800 |
| Median Household Income | $49,375 | $70 |
| Monthly Housing Costs | $527 | $6 |
| Real Estate Taxes | $1,960 | $3 |
Property Value by Mortgage Status in New Wilmington borough
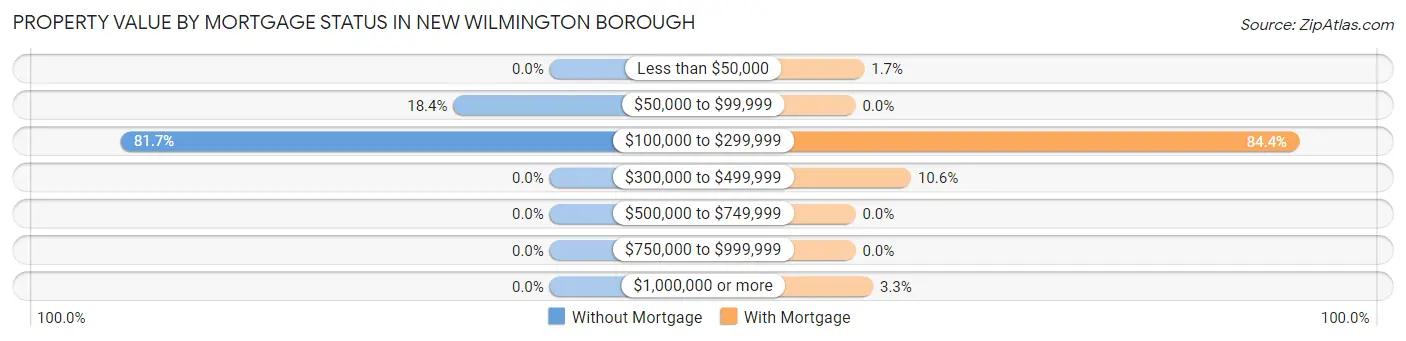
| Property Value | Without Mortgage | With Mortgage |
| Less than $50,000 | 0 (0.0%) | 3 (1.7%) |
| $50,000 to $99,999 | 20 (18.3%) | 0 (0.0%) |
| $100,000 to $299,999 | 89 (81.7%) | 152 (84.4%) |
| $300,000 to $499,999 | 0 (0.0%) | 19 (10.6%) |
| $500,000 to $749,999 | 0 (0.0%) | 0 (0.0%) |
| $750,000 to $999,999 | 0 (0.0%) | 0 (0.0%) |
| $1,000,000 or more | 0 (0.0%) | 6 (3.3%) |
| Total | 109 (100.0%) | 180 (100.0%) |
Household Income by Mortgage Status in New Wilmington borough
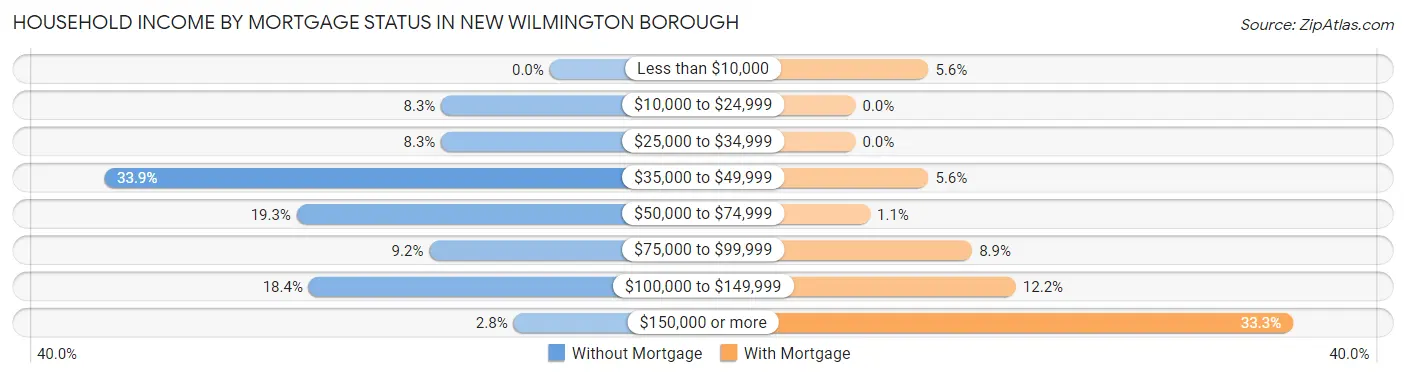
| Household Income | Without Mortgage | With Mortgage |
| Less than $10,000 | 0 (0.0%) | 10 (5.6%) |
| $10,000 to $24,999 | 9 (8.3%) | 0 (0.0%) |
| $25,000 to $34,999 | 9 (8.3%) | 0 (0.0%) |
| $35,000 to $49,999 | 37 (33.9%) | 10 (5.6%) |
| $50,000 to $74,999 | 21 (19.3%) | 2 (1.1%) |
| $75,000 to $99,999 | 10 (9.2%) | 16 (8.9%) |
| $100,000 to $149,999 | 20 (18.3%) | 22 (12.2%) |
| $150,000 or more | 3 (2.8%) | 60 (33.3%) |
| Total | 109 (100.0%) | 180 (100.0%) |
Property Value to Household Income Ratio in New Wilmington borough
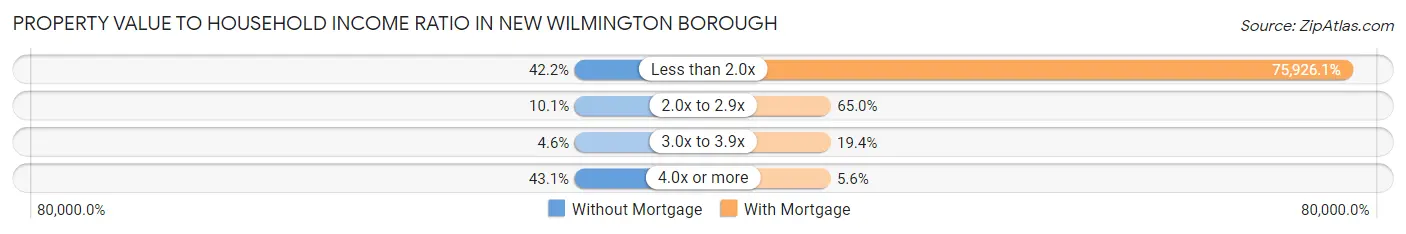
| Value-to-Income Ratio | Without Mortgage | With Mortgage |
| Less than 2.0x | 46 (42.2%) | 136,667 (75,926.1%) |
| 2.0x to 2.9x | 11 (10.1%) | 117 (65.0%) |
| 3.0x to 3.9x | 5 (4.6%) | 35 (19.4%) |
| 4.0x or more | 47 (43.1%) | 10 (5.6%) |
| Total | 109 (100.0%) | 180 (100.0%) |
Real Estate Taxes by Mortgage Status in New Wilmington borough
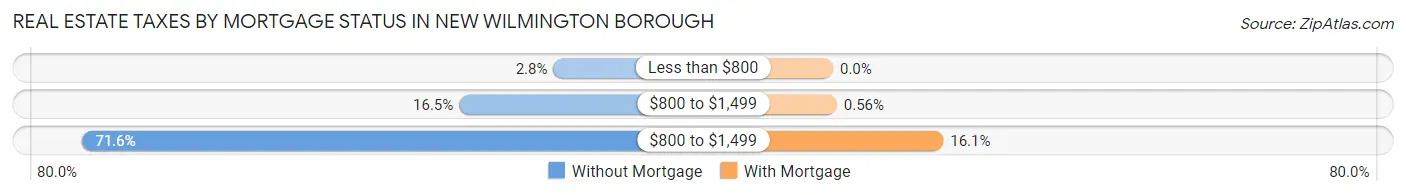
| Property Taxes | Without Mortgage | With Mortgage |
| Less than $800 | 3 (2.8%) | 0 (0.0%) |
| $800 to $1,499 | 18 (16.5%) | 1 (0.6%) |
| $800 to $1,499 | 78 (71.6%) | 29 (16.1%) |
| Total | 109 (100.0%) | 180 (100.0%) |
Health & Disability in New Wilmington borough
Health Insurance Coverage by Age in New Wilmington borough
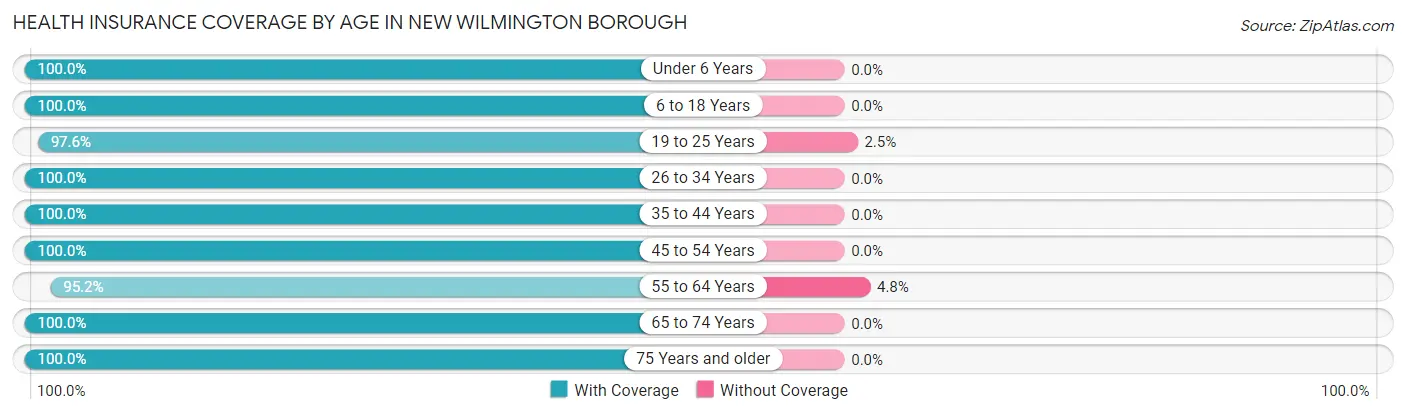
| Age Bracket | With Coverage | Without Coverage |
| Under 6 Years | 64 (100.0%) | 0 (0.0%) |
| 6 to 18 Years | 339 (100.0%) | 0 (0.0%) |
| 19 to 25 Years | 956 (97.6%) | 24 (2.5%) |
| 26 to 34 Years | 59 (100.0%) | 0 (0.0%) |
| 35 to 44 Years | 134 (100.0%) | 0 (0.0%) |
| 45 to 54 Years | 116 (100.0%) | 0 (0.0%) |
| 55 to 64 Years | 119 (95.2%) | 6 (4.8%) |
| 65 to 74 Years | 105 (100.0%) | 0 (0.0%) |
| 75 Years and older | 104 (100.0%) | 0 (0.0%) |
| Total | 1,996 (98.5%) | 30 (1.5%) |
Health Insurance Coverage by Citizenship Status in New Wilmington borough
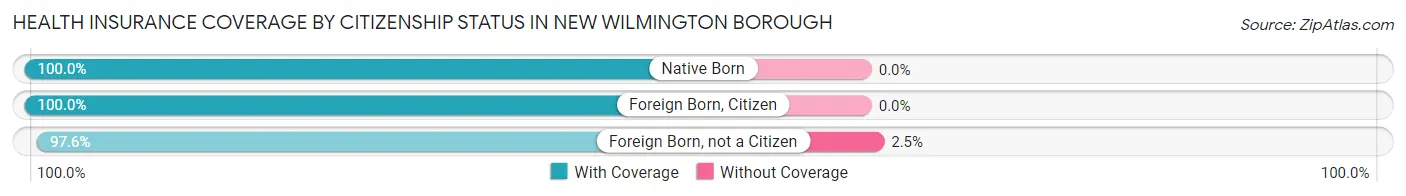
| Citizenship Status | With Coverage | Without Coverage |
| Native Born | 64 (100.0%) | 0 (0.0%) |
| Foreign Born, Citizen | 339 (100.0%) | 0 (0.0%) |
| Foreign Born, not a Citizen | 956 (97.6%) | 24 (2.5%) |
Health Insurance Coverage by Household Income in New Wilmington borough
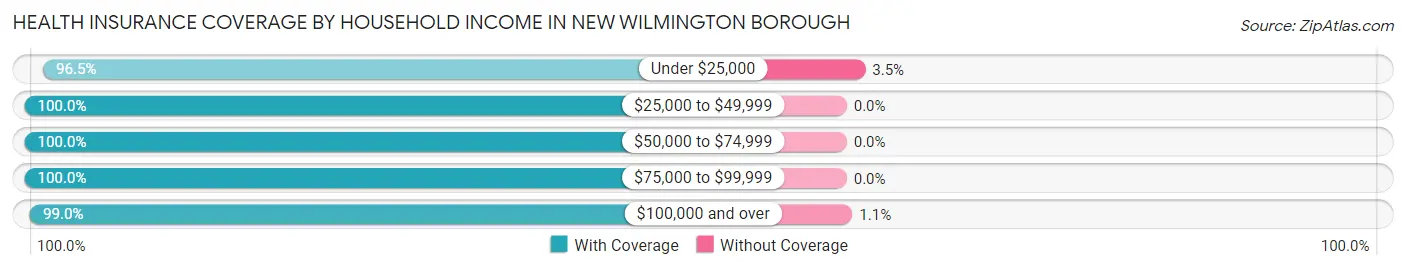
| Household Income | With Coverage | Without Coverage |
| Under $25,000 | 111 (96.5%) | 4 (3.5%) |
| $25,000 to $49,999 | 204 (100.0%) | 0 (0.0%) |
| $50,000 to $74,999 | 97 (100.0%) | 0 (0.0%) |
| $75,000 to $99,999 | 88 (100.0%) | 0 (0.0%) |
| $100,000 and over | 568 (99.0%) | 6 (1.1%) |
Public vs Private Health Insurance Coverage by Age in New Wilmington borough
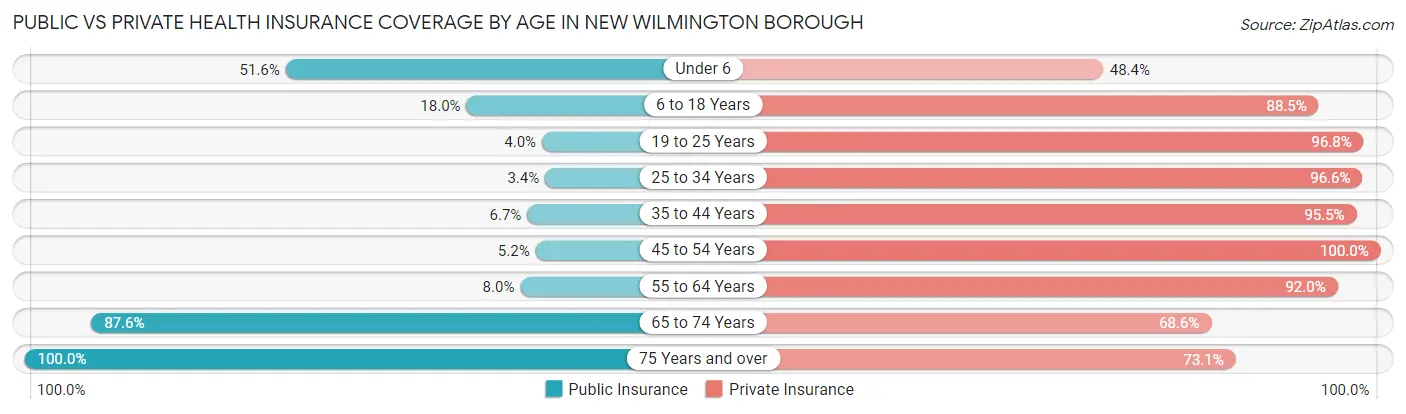
| Age Bracket | Public Insurance | Private Insurance |
| Under 6 | 33 (51.6%) | 31 (48.4%) |
| 6 to 18 Years | 61 (18.0%) | 300 (88.5%) |
| 19 to 25 Years | 39 (4.0%) | 949 (96.8%) |
| 25 to 34 Years | 2 (3.4%) | 57 (96.6%) |
| 35 to 44 Years | 9 (6.7%) | 128 (95.5%) |
| 45 to 54 Years | 6 (5.2%) | 116 (100.0%) |
| 55 to 64 Years | 10 (8.0%) | 115 (92.0%) |
| 65 to 74 Years | 92 (87.6%) | 72 (68.6%) |
| 75 Years and over | 104 (100.0%) | 76 (73.1%) |
| Total | 356 (17.6%) | 1,844 (91.0%) |
Disability Status by Sex by Age in New Wilmington borough
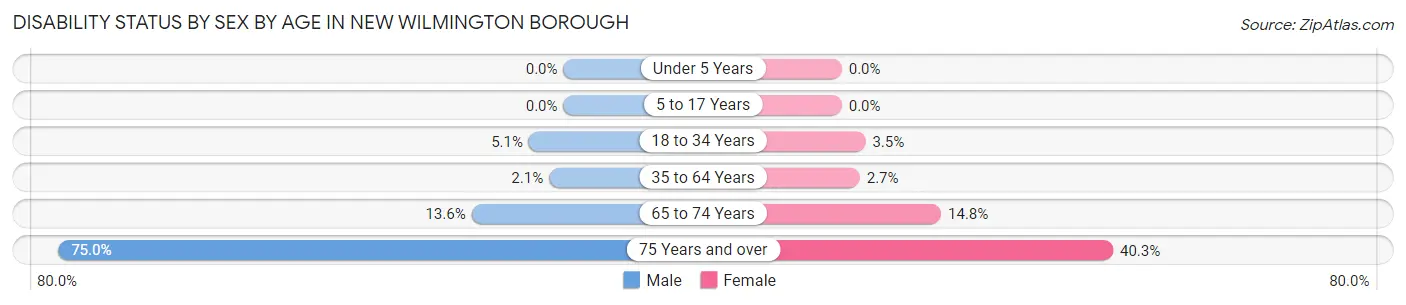
| Age Bracket | Male | Female |
| Under 5 Years | 0 (0.0%) | 0 (0.0%) |
| 5 to 17 Years | 0 (0.0%) | 0 (0.0%) |
| 18 to 34 Years | 33 (5.1%) | 19 (3.5%) |
| 35 to 64 Years | 4 (2.1%) | 5 (2.7%) |
| 65 to 74 Years | 6 (13.6%) | 9 (14.7%) |
| 75 Years and over | 24 (75.0%) | 29 (40.3%) |
Disability Class by Sex by Age in New Wilmington borough
Disability Class: Hearing Difficulty
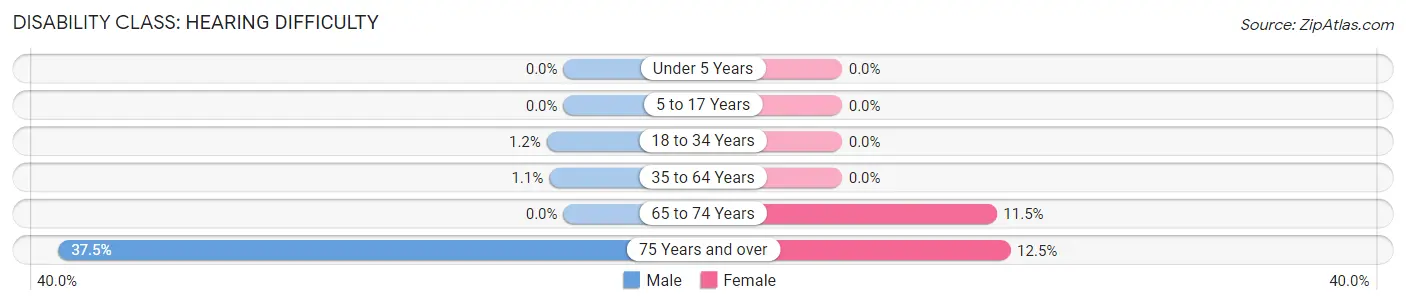
| Age Bracket | Male | Female |
| Under 5 Years | 0 (0.0%) | 0 (0.0%) |
| 5 to 17 Years | 0 (0.0%) | 0 (0.0%) |
| 18 to 34 Years | 8 (1.2%) | 0 (0.0%) |
| 35 to 64 Years | 2 (1.1%) | 0 (0.0%) |
| 65 to 74 Years | 0 (0.0%) | 7 (11.5%) |
| 75 Years and over | 12 (37.5%) | 9 (12.5%) |
Disability Class: Vision Difficulty
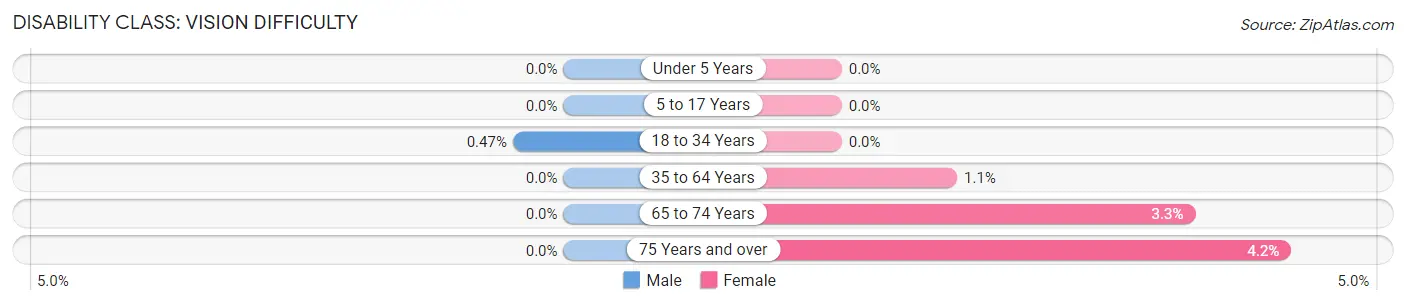
| Age Bracket | Male | Female |
| Under 5 Years | 0 (0.0%) | 0 (0.0%) |
| 5 to 17 Years | 0 (0.0%) | 0 (0.0%) |
| 18 to 34 Years | 3 (0.5%) | 0 (0.0%) |
| 35 to 64 Years | 0 (0.0%) | 2 (1.1%) |
| 65 to 74 Years | 0 (0.0%) | 2 (3.3%) |
| 75 Years and over | 0 (0.0%) | 3 (4.2%) |
Disability Class: Cognitive Difficulty
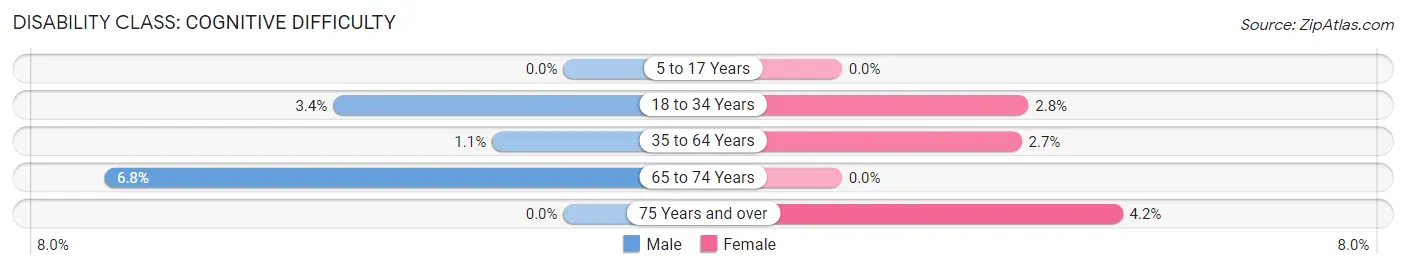
| Age Bracket | Male | Female |
| 5 to 17 Years | 0 (0.0%) | 0 (0.0%) |
| 18 to 34 Years | 22 (3.4%) | 15 (2.8%) |
| 35 to 64 Years | 2 (1.1%) | 5 (2.7%) |
| 65 to 74 Years | 3 (6.8%) | 0 (0.0%) |
| 75 Years and over | 0 (0.0%) | 3 (4.2%) |
Disability Class: Ambulatory Difficulty
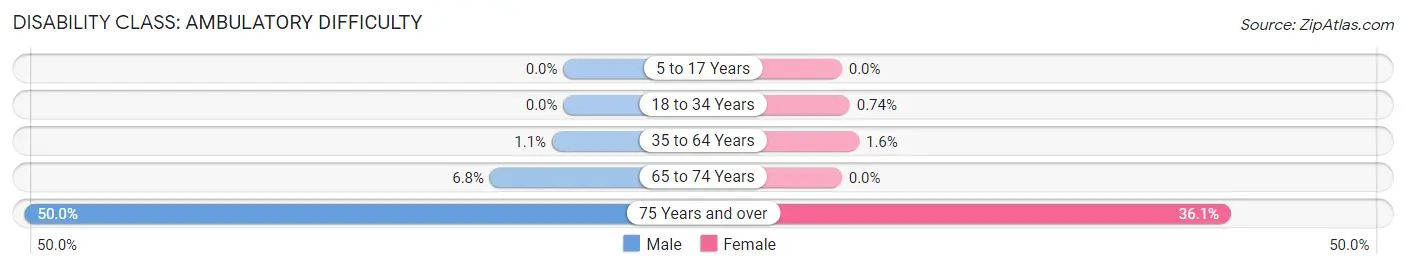
| Age Bracket | Male | Female |
| 5 to 17 Years | 0 (0.0%) | 0 (0.0%) |
| 18 to 34 Years | 0 (0.0%) | 4 (0.7%) |
| 35 to 64 Years | 2 (1.1%) | 3 (1.6%) |
| 65 to 74 Years | 3 (6.8%) | 0 (0.0%) |
| 75 Years and over | 16 (50.0%) | 26 (36.1%) |
Disability Class: Self-Care Difficulty
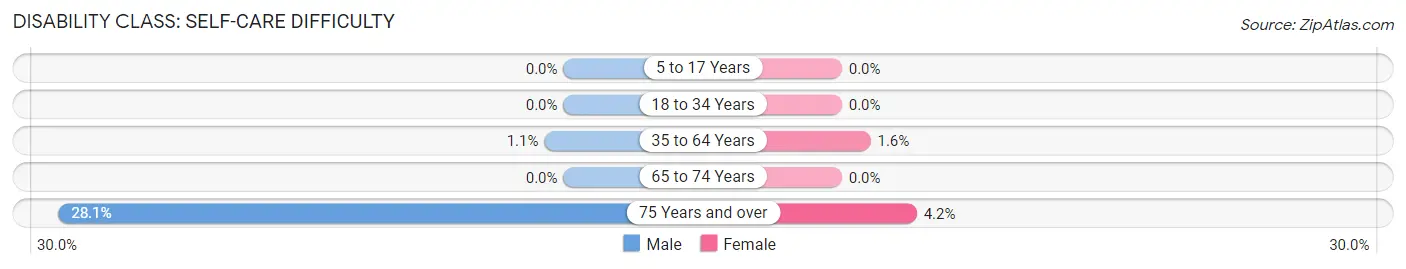
| Age Bracket | Male | Female |
| 5 to 17 Years | 0 (0.0%) | 0 (0.0%) |
| 18 to 34 Years | 0 (0.0%) | 0 (0.0%) |
| 35 to 64 Years | 2 (1.1%) | 3 (1.6%) |
| 65 to 74 Years | 0 (0.0%) | 0 (0.0%) |
| 75 Years and over | 9 (28.1%) | 3 (4.2%) |
Technology Access in New Wilmington borough
Computing Device Access in New Wilmington borough
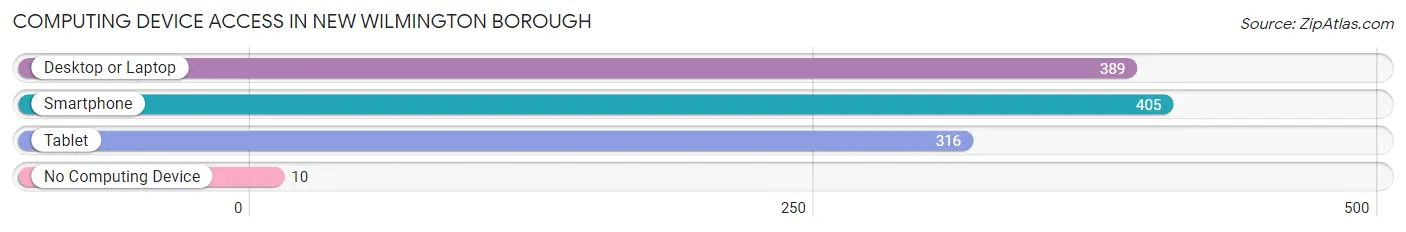
| Device Type | # Households | % Households |
| Desktop or Laptop | 389 | 83.1% |
| Smartphone | 405 | 86.5% |
| Tablet | 316 | 67.5% |
| No Computing Device | 10 | 2.1% |
| Total | 468 | 100.0% |
Internet Access in New Wilmington borough
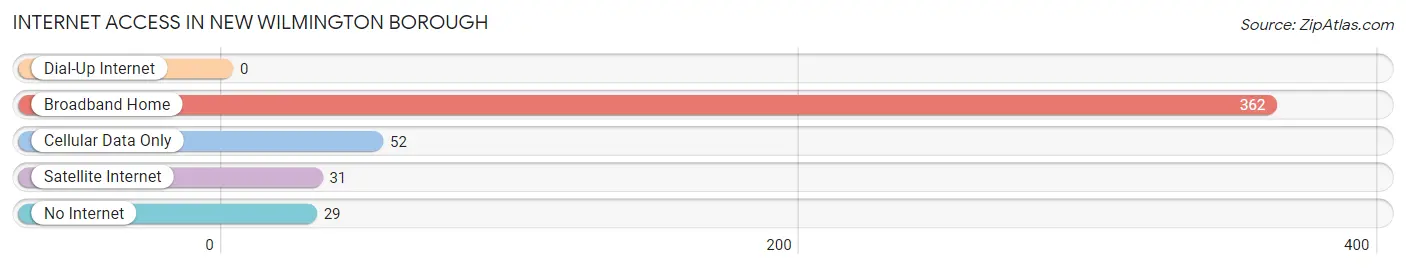
| Internet Type | # Households | % Households |
| Dial-Up Internet | 0 | 0.0% |
| Broadband Home | 362 | 77.3% |
| Cellular Data Only | 52 | 11.1% |
| Satellite Internet | 31 | 6.6% |
| No Internet | 29 | 6.2% |
| Total | 468 | 100.0% |
New Wilmington borough Summary
New Wilmington Borough is a small borough located in Lawrence County, Pennsylvania. It is situated in the Shenango Valley, approximately 40 miles north of Pittsburgh. The borough was founded in 1832 and is home to approximately 2,500 people.
History
New Wilmington was founded in 1832 by a group of settlers from New Wilmington, Delaware. The settlers were led by John W. Smith, who purchased the land from the local Native American tribes. The town was originally known as Smithville, but was later renamed New Wilmington in honor of its founders.
The town quickly grew and became an important center for trade and industry. The first industry in the area was a sawmill, which was built in 1833. This was followed by a gristmill, a tannery, and a woolen mill. The town also had a number of stores, hotels, and churches.
In 1851, the Pennsylvania Railroad arrived in New Wilmington, connecting the town to Pittsburgh and other major cities. This allowed the town to become a major hub for trade and industry. The railroad also brought a large influx of new residents to the area.
In the late 19th century, New Wilmington became a popular tourist destination. The town was known for its beautiful scenery and its many resorts. The town also had a number of cultural attractions, including a theater, a library, and a museum.
Geography
New Wilmington is located in the Shenango Valley, approximately 40 miles north of Pittsburgh. The borough is situated on the banks of the Shenango River, which flows through the town. The borough is surrounded by the townships of Wilmington, Neshannock, and Shenango.
The borough has a total area of 1.2 square miles, all of which is land. The borough is located at an elevation of 890 feet above sea level.
Economy
New Wilmington is a small, rural community with a diverse economy. The town is home to a number of small businesses, including restaurants, retail stores, and professional services. The town also has a number of manufacturing companies, including a steel mill and a plastics factory.
The town is also home to Westminster College, a private liberal arts college. The college has an enrollment of approximately 1,500 students and employs a number of faculty and staff.
Demographics
As of the 2010 census, New Wilmington had a population of 2,521. The racial makeup of the borough was 97.2% White, 0.9% African American, 0.2% Native American, 0.4% Asian, 0.1% Pacific Islander, 0.3% from other races, and 0.9% from two or more races. Hispanic or Latino of any race were 1.2% of the population.
The median household income in New Wilmington was $41,250, and the median family income was $50,000. The per capita income for the borough was $20,845. About 8.2% of families and 10.2% of the population were below the poverty line, including 14.2% of those under age 18 and 6.2% of those age 65 or over.
Common Questions
What is Per Capita Income in New Wilmington borough?
Per Capita income in New Wilmington borough is $22,091.
What is the Median Family Income in New Wilmington borough?
Median Family Income in New Wilmington borough is $111,786.
What is the Median Household income in New Wilmington borough?
Median Household Income in New Wilmington borough is $73,611.
What is Income or Wage Gap in New Wilmington borough?
Income or Wage Gap in New Wilmington borough is 12.3%.
Women in New Wilmington borough earn 87.7 cents for every dollar earned by a man.
What is Inequality or Gini Index in New Wilmington borough?
Inequality or Gini Index in New Wilmington borough is 0.41.
What is the Total Population of New Wilmington borough?
Total Population of New Wilmington borough is 2,157.
What is the Total Male Population of New Wilmington borough?
Total Male Population of New Wilmington borough is 1,063.
What is the Total Female Population of New Wilmington borough?
Total Female Population of New Wilmington borough is 1,094.
What is the Ratio of Males per 100 Females in New Wilmington borough?
There are 97.17 Males per 100 Females in New Wilmington borough.
What is the Ratio of Females per 100 Males in New Wilmington borough?
There are 102.92 Females per 100 Males in New Wilmington borough.
What is the Median Population Age in New Wilmington borough?
Median Population Age in New Wilmington borough is 21.5 Years.
What is the Average Family Size in New Wilmington borough
Average Family Size in New Wilmington borough is 3.0 People.
What is the Average Household Size in New Wilmington borough
Average Household Size in New Wilmington borough is 2.3 People.
How Large is the Labor Force in New Wilmington borough?
There are 1,173 People in the Labor Forcein in New Wilmington borough.
What is the Percentage of People in the Labor Force in New Wilmington borough?
60.6% of People are in the Labor Force in New Wilmington borough.
What is the Unemployment Rate in New Wilmington borough?
Unemployment Rate in New Wilmington borough is 0.9%.