Brentwood borough, PA Map & Demographics
Brentwood borough Overview
$32,600
PER CAPITA INCOME
$92,729
AVG FAMILY INCOME
$57,900
AVG HOUSEHOLD INCOME
9.0%
WAGE / INCOME GAP [ % ]
91.0¢/ $1
WAGE / INCOME GAP [ $ ]
$21,536
FAMILY INCOME DEFICIT
0.39
INEQUALITY / GINI INDEX
9,982
TOTAL POPULATION
4,656
MALE POPULATION
5,326
FEMALE POPULATION
87.42
MALES / 100 FEMALES
114.39
FEMALES / 100 MALES
36.7
MEDIAN AGE
3.0
AVG FAMILY SIZE
2.2
AVG HOUSEHOLD SIZE
5,361
LABOR FORCE [ PEOPLE ]
66.8%
PERCENT IN LABOR FORCE
2.0%
UNEMPLOYMENT RATE
Income in Brentwood borough
Income Overview in Brentwood borough
Per Capita Income in Brentwood borough is $32,600, while median incomes of families and households are $92,729 and $57,900 respectively.
| Characteristic | Number | Measure |
| Per Capita Income | 9,982 | $32,600 |
| Median Family Income | 2,282 | $92,729 |
| Mean Family Income | 2,282 | $88,797 |
| Median Household Income | 4,621 | $57,900 |
| Mean Household Income | 4,621 | $68,319 |
| Income Deficit | 2,282 | $21,536 |
| Wage / Income Gap (%) | 9,982 | 9.03% |
| Wage / Income Gap ($) | 9,982 | 90.97¢ per $1 |
| Gini / Inequality Index | 9,982 | 0.39 |
Earnings by Sex in Brentwood borough
Average Earnings in Brentwood borough are $41,484, $42,359 for men and $38,533 for women, a difference of 9.0%.
| Sex | Number | Average Earnings |
| Male | 2,905 (52.6%) | $42,359 |
| Female | 2,613 (47.3%) | $38,533 |
| Total | 5,518 (100.0%) | $41,484 |
Earnings by Sex by Income Bracket in Brentwood borough
The most common earnings brackets in Brentwood borough are $35,000 to $39,999 for men (340 | 11.7%) and $30,000 to $34,999 for women (362 | 13.9%).
| Income | Male | Female |
| $2,499 or less | 60 (2.1%) | 76 (2.9%) |
| $2,500 to $4,999 | 13 (0.4%) | 109 (4.2%) |
| $5,000 to $7,499 | 167 (5.8%) | 7 (0.3%) |
| $7,500 to $9,999 | 69 (2.4%) | 54 (2.1%) |
| $10,000 to $12,499 | 65 (2.2%) | 28 (1.1%) |
| $12,500 to $14,999 | 30 (1.0%) | 32 (1.2%) |
| $15,000 to $17,499 | 0 (0.0%) | 121 (4.6%) |
| $17,500 to $19,999 | 69 (2.4%) | 45 (1.7%) |
| $20,000 to $22,499 | 41 (1.4%) | 16 (0.6%) |
| $22,500 to $24,999 | 42 (1.5%) | 130 (5.0%) |
| $25,000 to $29,999 | 120 (4.1%) | 86 (3.3%) |
| $30,000 to $34,999 | 193 (6.6%) | 362 (13.9%) |
| $35,000 to $39,999 | 340 (11.7%) | 281 (10.7%) |
| $40,000 to $44,999 | 303 (10.4%) | 158 (6.0%) |
| $45,000 to $49,999 | 221 (7.6%) | 171 (6.5%) |
| $50,000 to $54,999 | 250 (8.6%) | 265 (10.1%) |
| $55,000 to $64,999 | 319 (11.0%) | 118 (4.5%) |
| $65,000 to $74,999 | 149 (5.1%) | 160 (6.1%) |
| $75,000 to $99,999 | 236 (8.1%) | 210 (8.0%) |
| $100,000+ | 218 (7.5%) | 184 (7.0%) |
| Total | 2,905 (100.0%) | 2,613 (100.0%) |
Earnings by Sex by Educational Attainment in Brentwood borough
Average earnings in Brentwood borough are $47,835 for men and $45,332 for women, a difference of 5.2%. Men with an educational attainment of bachelor's degree enjoy the highest average annual earnings of $56,648, while those with high school diploma education earn the least with $36,199. Women with an educational attainment of graduate degree earn the most with the average annual earnings of $87,695, while those with college or associate's degree education have the smallest earnings of $36,653.
| Educational Attainment | Male Income | Female Income |
| Less than High School | - | - |
| High School Diploma | $36,199 | $42,194 |
| College or Associate's Degree | $42,750 | $36,653 |
| Bachelor's Degree | $56,648 | $50,885 |
| Graduate Degree | $49,653 | $87,695 |
| Total | $47,835 | $45,332 |
Family Income in Brentwood borough
Family Income Brackets in Brentwood borough
According to the Brentwood borough family income data, there are 806 families falling into the $100,000 to $149,999 income range, which is the most common income bracket and makes up 35.3% of all families.
| Income Bracket | # Families | % Families |
| Less than $10,000 | 173 | 7.6% |
| $10,000 to $14,999 | 41 | 1.8% |
| $15,000 to $24,999 | 0 | 0.0% |
| $25,000 to $34,999 | 171 | 7.5% |
| $35,000 to $49,999 | 137 | 6.0% |
| $50,000 to $74,999 | 388 | 17.0% |
| $75,000 to $99,999 | 377 | 16.5% |
| $100,000 to $149,999 | 806 | 35.3% |
| $150,000 to $199,999 | 141 | 6.2% |
| $200,000+ | 46 | 2.0% |
Family Income by Famaliy Size in Brentwood borough
6-person families (71 | 3.1%) account for the highest median family income in Brentwood borough with $127,063 per family, while 2-person families (1,354 | 59.3%) have the highest median income of $46,870 per family member.
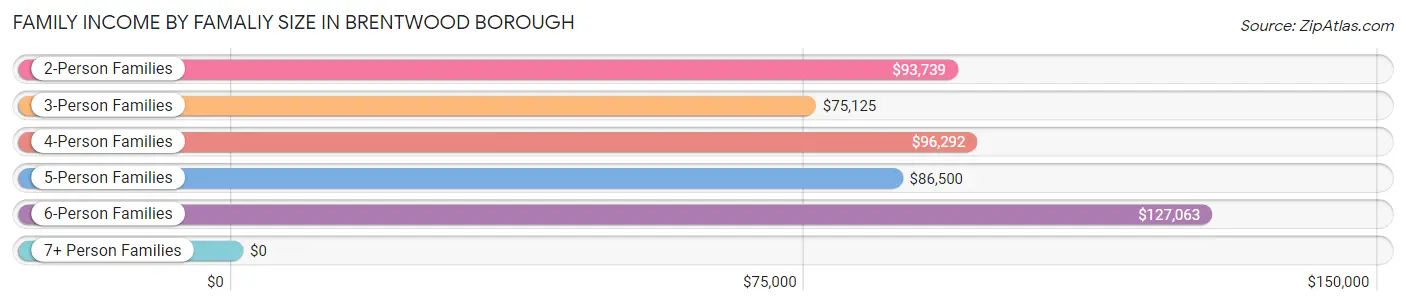
| Income Bracket | # Families | Median Income |
| 2-Person Families | 1,354 (59.3%) | $93,739 |
| 3-Person Families | 263 (11.5%) | $75,125 |
| 4-Person Families | 363 (15.9%) | $96,292 |
| 5-Person Families | 160 (7.0%) | $86,500 |
| 6-Person Families | 71 (3.1%) | $127,063 |
| 7+ Person Families | 71 (3.1%) | $0 |
| Total | 2,282 (100.0%) | $92,729 |
Family Income by Number of Earners in Brentwood borough
The median family income in Brentwood borough is $92,729, with families comprising 3+ earners (222) having the highest median family income of $141,250, while families with no earners (320) have the lowest median family income of $38,750, accounting for 9.7% and 14.0% of families, respectively.
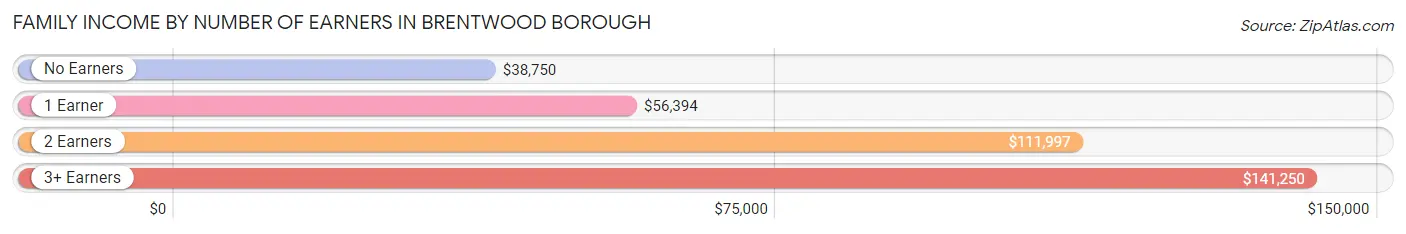
| Number of Earners | # Families | Median Income |
| No Earners | 320 (14.0%) | $38,750 |
| 1 Earner | 725 (31.8%) | $56,394 |
| 2 Earners | 1,015 (44.5%) | $111,997 |
| 3+ Earners | 222 (9.7%) | $141,250 |
| Total | 2,282 (100.0%) | $92,729 |
Household Income in Brentwood borough
Household Income Brackets in Brentwood borough
With 1,026 households falling in the category, the $100,000 to $149,999 income range is the most frequent in Brentwood borough, accounting for 22.2% of all households. In contrast, only 46 households (1.0%) fall into the $200,000+ income bracket, making it the least populous group.
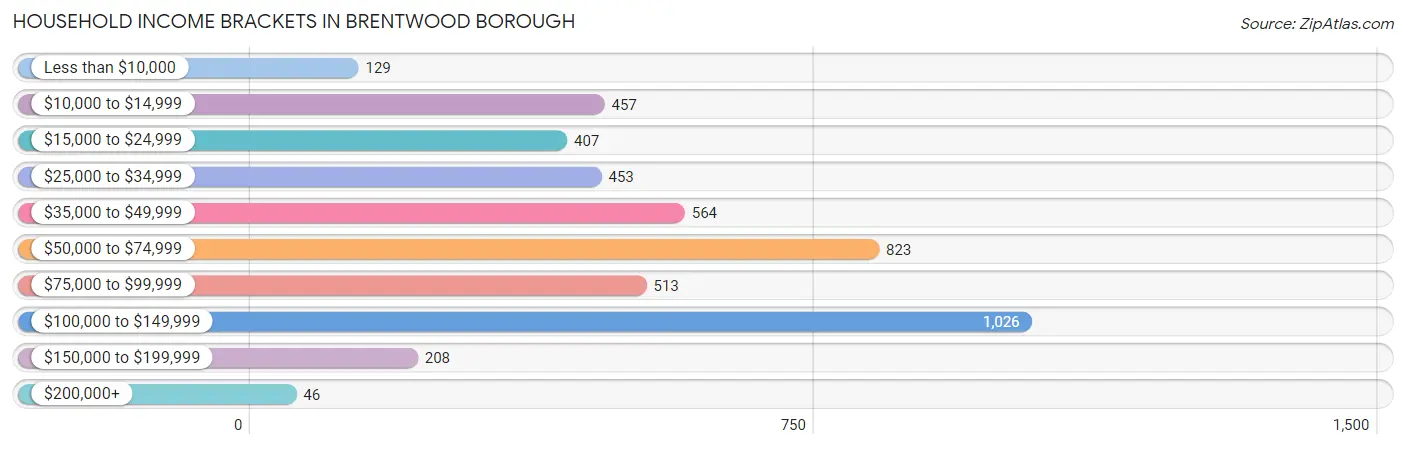
| Income Bracket | # Households | % Households |
| Less than $10,000 | 129 | 2.8% |
| $10,000 to $14,999 | 457 | 9.9% |
| $15,000 to $24,999 | 407 | 8.8% |
| $25,000 to $34,999 | 453 | 9.8% |
| $35,000 to $49,999 | 564 | 12.2% |
| $50,000 to $74,999 | 823 | 17.8% |
| $75,000 to $99,999 | 513 | 11.1% |
| $100,000 to $149,999 | 1,026 | 22.2% |
| $150,000 to $199,999 | 208 | 4.5% |
| $200,000+ | 46 | 1.0% |
Household Income by Householder Age in Brentwood borough
The median household income in Brentwood borough is $57,900, with the highest median household income of $76,714 found in the 25 to 44 years age bracket for the primary householder. A total of 1,704 households (36.9%) fall into this category. Meanwhile, the 15 to 24 years age bracket for the primary householder has the lowest median household income of $0, with 243 households (5.3%) in this group.
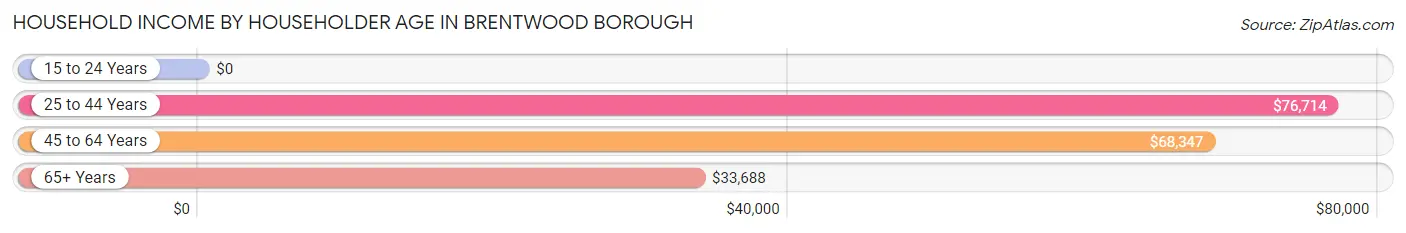
| Income Bracket | # Households | Median Income |
| 15 to 24 Years | 243 (5.3%) | $0 |
| 25 to 44 Years | 1,704 (36.9%) | $76,714 |
| 45 to 64 Years | 1,427 (30.9%) | $68,347 |
| 65+ Years | 1,247 (27.0%) | $33,688 |
| Total | 4,621 (100.0%) | $57,900 |
Poverty in Brentwood borough
Income Below Poverty by Sex and Age in Brentwood borough
With 9.9% poverty level for males and 16.1% for females among the residents of Brentwood borough, 16 and 17 year old males and 12 to 14 year old females are the most vulnerable to poverty, with 124 males (53.2%) and 111 females (45.7%) in their respective age groups living below the poverty level.
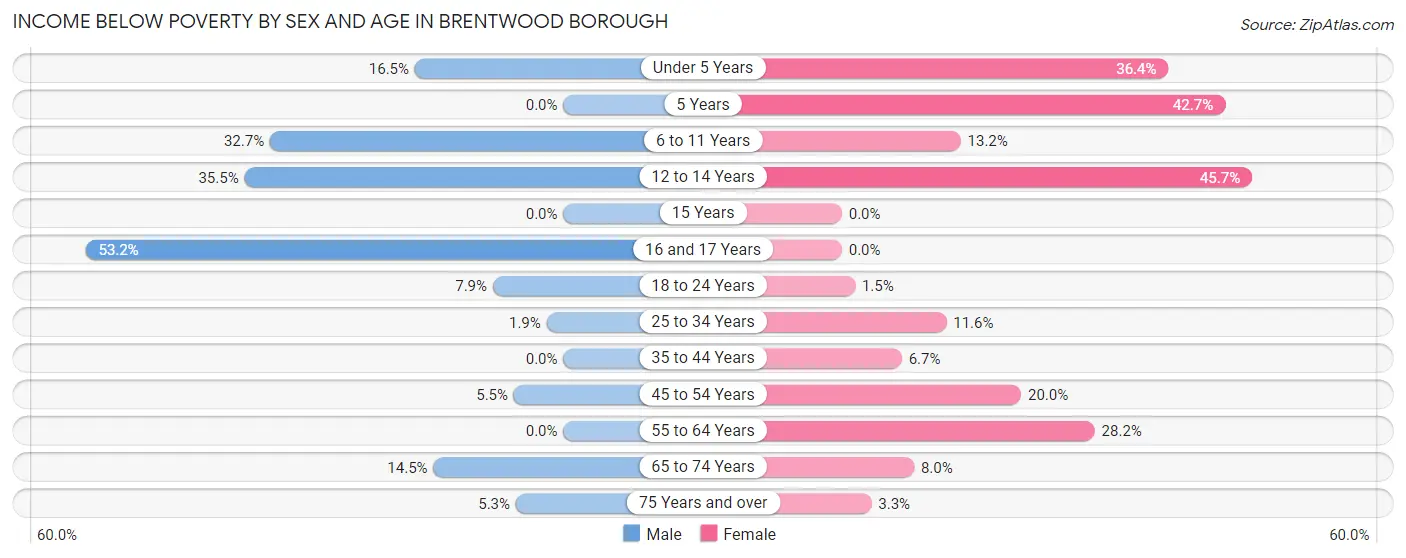
| Age Bracket | Male | Female |
| Under 5 Years | 42 (16.5%) | 152 (36.4%) |
| 5 Years | 0 (0.0%) | 32 (42.7%) |
| 6 to 11 Years | 98 (32.7%) | 50 (13.2%) |
| 12 to 14 Years | 49 (35.5%) | 111 (45.7%) |
| 15 Years | 0 (0.0%) | 0 (0.0%) |
| 16 and 17 Years | 124 (53.2%) | 0 (0.0%) |
| 18 to 24 Years | 19 (7.9%) | 7 (1.5%) |
| 25 to 34 Years | 16 (1.9%) | 97 (11.6%) |
| 35 to 44 Years | 0 (0.0%) | 42 (6.7%) |
| 45 to 54 Years | 25 (5.5%) | 92 (20.0%) |
| 55 to 64 Years | 0 (0.0%) | 216 (28.2%) |
| 65 to 74 Years | 69 (14.5%) | 43 (8.0%) |
| 75 Years and over | 20 (5.3%) | 11 (3.3%) |
| Total | 462 (9.9%) | 853 (16.1%) |
Income Above Poverty by Sex and Age in Brentwood borough
According to the poverty statistics in Brentwood borough, males aged 5 years and females aged 15 years are the age groups that are most secure financially, with 100.0% of males and 100.0% of females in these age groups living above the poverty line.
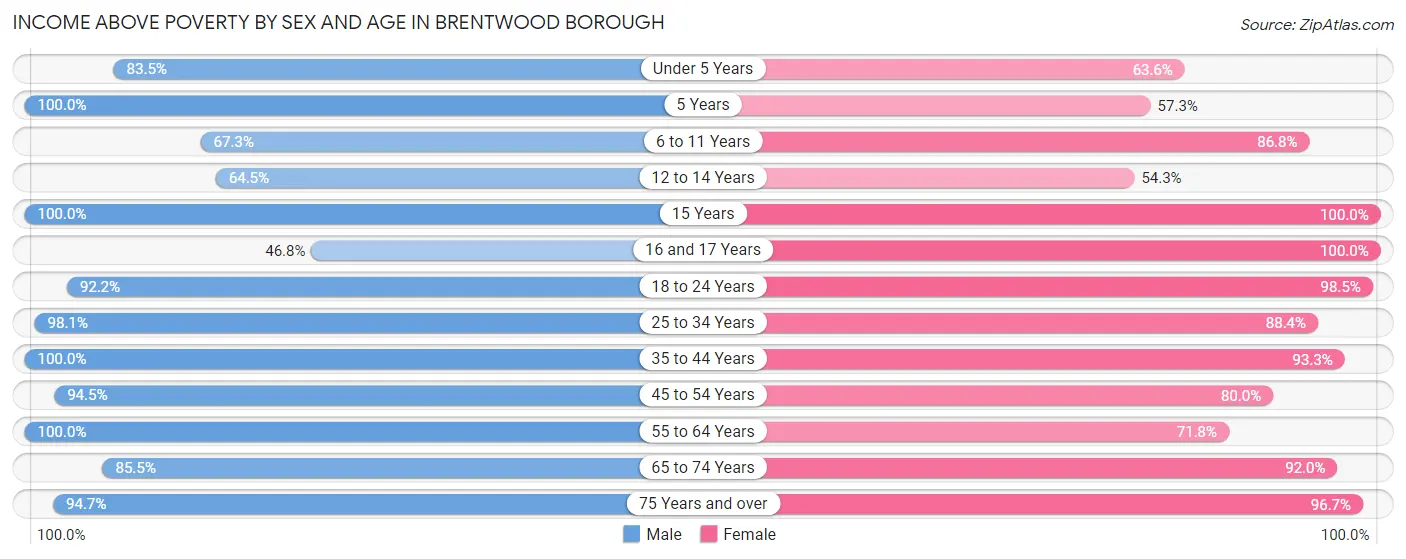
| Age Bracket | Male | Female |
| Under 5 Years | 212 (83.5%) | 266 (63.6%) |
| 5 Years | 43 (100.0%) | 43 (57.3%) |
| 6 to 11 Years | 202 (67.3%) | 328 (86.8%) |
| 12 to 14 Years | 89 (64.5%) | 132 (54.3%) |
| 15 Years | 26 (100.0%) | 66 (100.0%) |
| 16 and 17 Years | 109 (46.8%) | 94 (100.0%) |
| 18 to 24 Years | 223 (92.1%) | 470 (98.5%) |
| 25 to 34 Years | 843 (98.1%) | 736 (88.4%) |
| 35 to 44 Years | 779 (100.0%) | 588 (93.3%) |
| 45 to 54 Years | 429 (94.5%) | 369 (80.0%) |
| 55 to 64 Years | 473 (100.0%) | 551 (71.8%) |
| 65 to 74 Years | 408 (85.5%) | 492 (92.0%) |
| 75 Years and over | 358 (94.7%) | 323 (96.7%) |
| Total | 4,194 (90.1%) | 4,458 (83.9%) |
Income Below Poverty Among Married-Couple Families in Brentwood borough
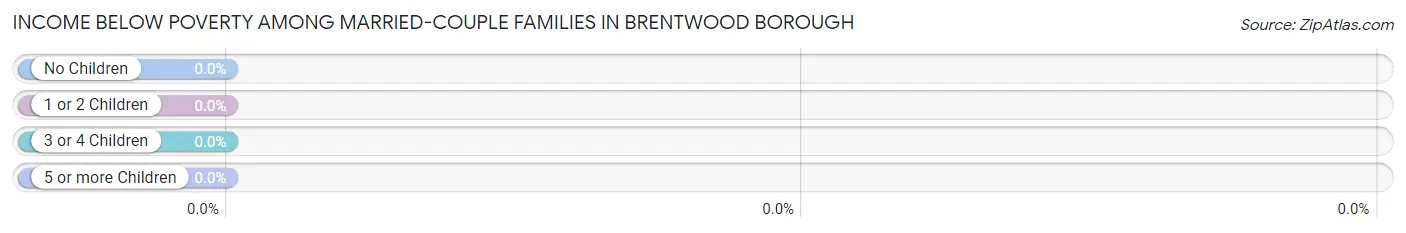
| Children | Above Poverty | Below Poverty |
| No Children | 942 (100.0%) | 0 (0.0%) |
| 1 or 2 Children | 323 (100.0%) | 0 (0.0%) |
| 3 or 4 Children | 168 (100.0%) | 0 (0.0%) |
| 5 or more Children | 0 (0.0%) | 0 (0.0%) |
| Total | 1,433 (100.0%) | 0 (0.0%) |
Income Below Poverty Among Single-Parent Households in Brentwood borough
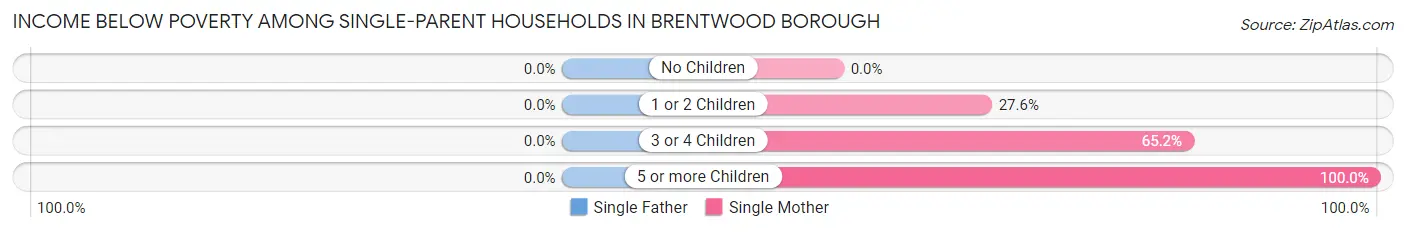
| Children | Single Father | Single Mother |
| No Children | 0 (0.0%) | 0 (0.0%) |
| 1 or 2 Children | 0 (0.0%) | 91 (27.6%) |
| 3 or 4 Children | 0 (0.0%) | 75 (65.2%) |
| 5 or more Children | 0 (0.0%) | 50 (100.0%) |
| Total | 0 (0.0%) | 216 (28.8%) |
Income Below Poverty Among Married-Couple vs Single-Parent Households in Brentwood borough
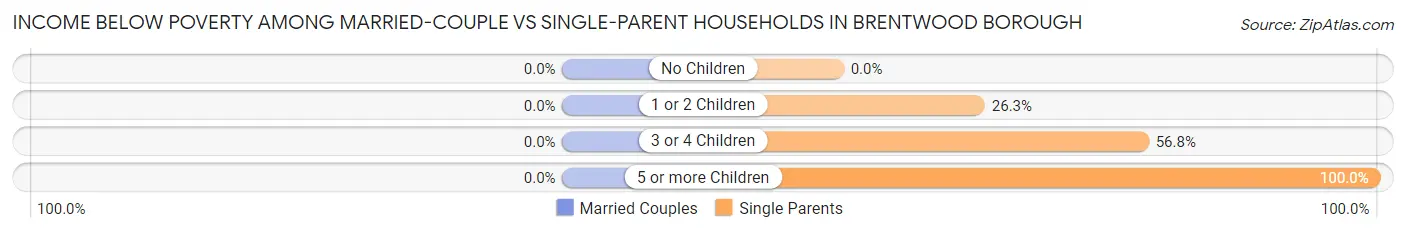
| Children | Married-Couple Families | Single-Parent Households |
| No Children | 0 (0.0%) | 0 (0.0%) |
| 1 or 2 Children | 0 (0.0%) | 91 (26.3%) |
| 3 or 4 Children | 0 (0.0%) | 75 (56.8%) |
| 5 or more Children | 0 (0.0%) | 50 (100.0%) |
| Total | 0 (0.0%) | 216 (25.4%) |
Race in Brentwood borough
The most populous races in Brentwood borough are White / Caucasian (8,487 | 85.0%), Two or more Races (550 | 5.5%), and Black / African American (530 | 5.3%).
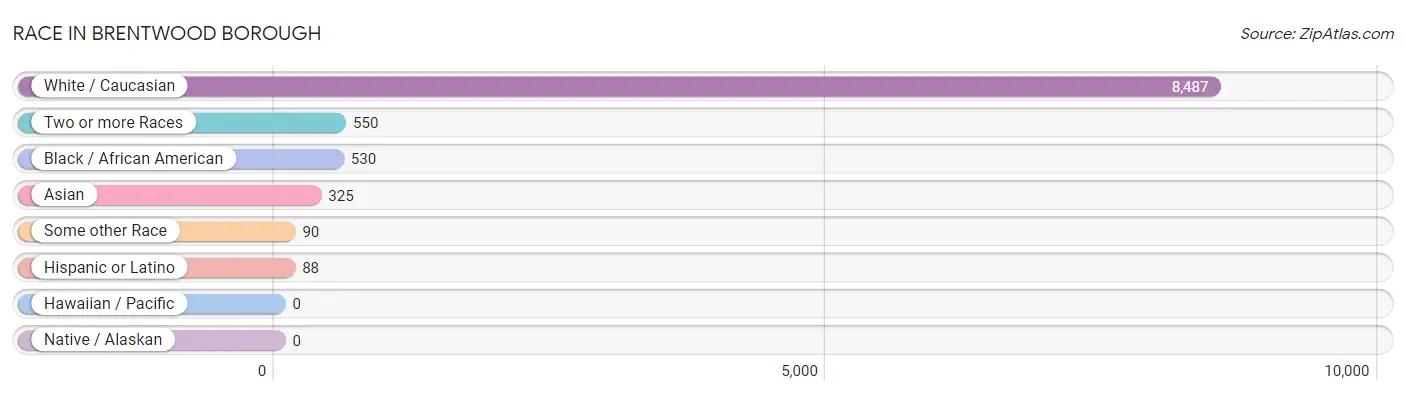
| Race | # Population | % Population |
| Asian | 325 | 3.3% |
| Black / African American | 530 | 5.3% |
| Hawaiian / Pacific | 0 | 0.0% |
| Hispanic or Latino | 88 | 0.9% |
| Native / Alaskan | 0 | 0.0% |
| White / Caucasian | 8,487 | 85.0% |
| Two or more Races | 550 | 5.5% |
| Some other Race | 90 | 0.9% |
| Total | 9,982 | 100.0% |
Ancestry in Brentwood borough
The most populous ancestries reported in Brentwood borough are German (2,608 | 26.1%), Italian (1,996 | 20.0%), Irish (1,841 | 18.4%), Polish (844 | 8.5%), and English (523 | 5.2%), together accounting for 78.3% of all Brentwood borough residents.
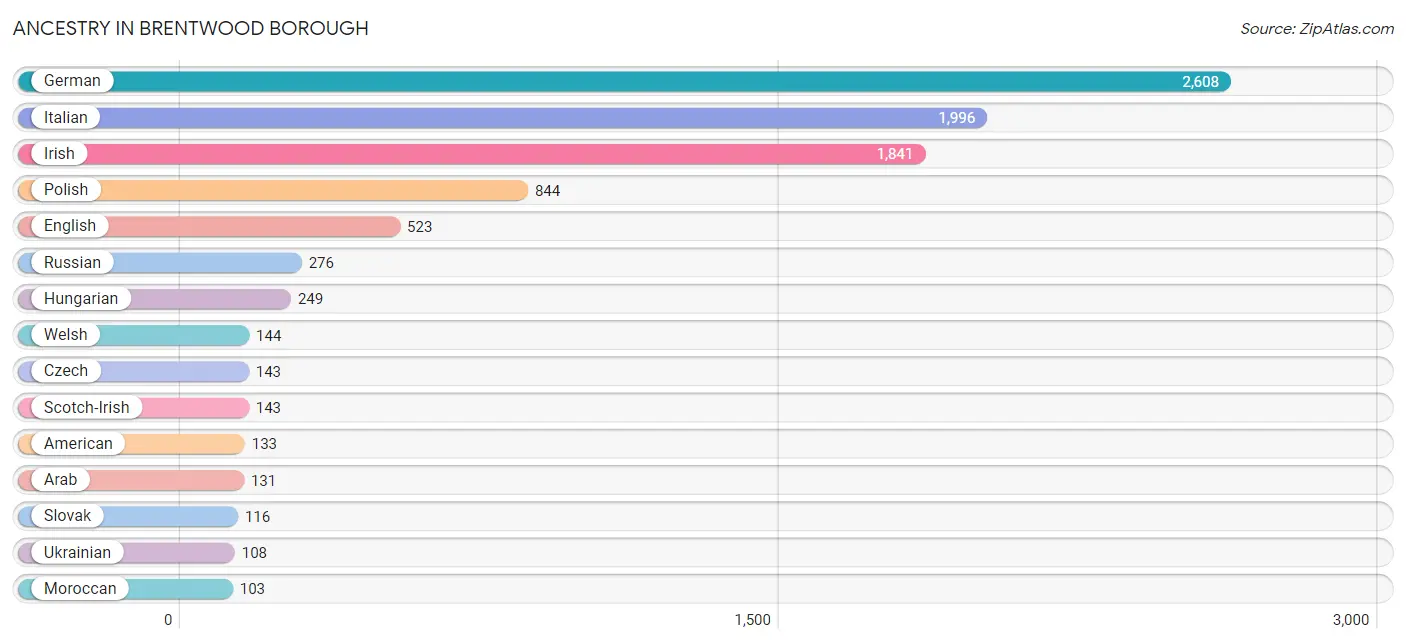
| Ancestry | # Population | % Population |
| African | 49 | 0.5% |
| Albanian | 20 | 0.2% |
| American | 133 | 1.3% |
| Arab | 131 | 1.3% |
| Austrian | 19 | 0.2% |
| Bhutanese | 49 | 0.5% |
| British | 31 | 0.3% |
| Celtic | 17 | 0.2% |
| Colombian | 62 | 0.6% |
| Croatian | 51 | 0.5% |
| Czech | 143 | 1.4% |
| Czechoslovakian | 39 | 0.4% |
| Danish | 21 | 0.2% |
| Dutch | 90 | 0.9% |
| Eastern European | 66 | 0.7% |
| English | 523 | 5.2% |
| European | 31 | 0.3% |
| Finnish | 8 | 0.1% |
| French | 63 | 0.6% |
| German | 2,608 | 26.1% |
| Greek | 62 | 0.6% |
| Hungarian | 249 | 2.5% |
| Irish | 1,841 | 18.4% |
| Italian | 1,996 | 20.0% |
| Korean | 15 | 0.2% |
| Lebanese | 17 | 0.2% |
| Mexican | 14 | 0.1% |
| Moroccan | 103 | 1.0% |
| Native Hawaiian | 1 | 0.0% |
| Norwegian | 47 | 0.5% |
| Pennsylvania German | 7 | 0.1% |
| Peruvian | 11 | 0.1% |
| Polish | 844 | 8.5% |
| Puerto Rican | 1 | 0.0% |
| Russian | 276 | 2.8% |
| Scotch-Irish | 143 | 1.4% |
| Serbian | 18 | 0.2% |
| Slovak | 116 | 1.2% |
| South American | 73 | 0.7% |
| Subsaharan African | 73 | 0.7% |
| Swedish | 61 | 0.6% |
| Syrian | 11 | 0.1% |
| Thai | 59 | 0.6% |
| Ukrainian | 108 | 1.1% |
| Welsh | 144 | 1.4% |
| West Indian | 85 | 0.9% | View All 46 Rows |
Immigrants in Brentwood borough
The most numerous immigrant groups reported in Brentwood borough came from Africa (384 | 3.8%), Asia (216 | 2.2%), South Central Asia (216 | 2.2%), Western Africa (208 | 2.1%), and Morocco (152 | 1.5%), together accounting for 11.8% of all Brentwood borough residents.
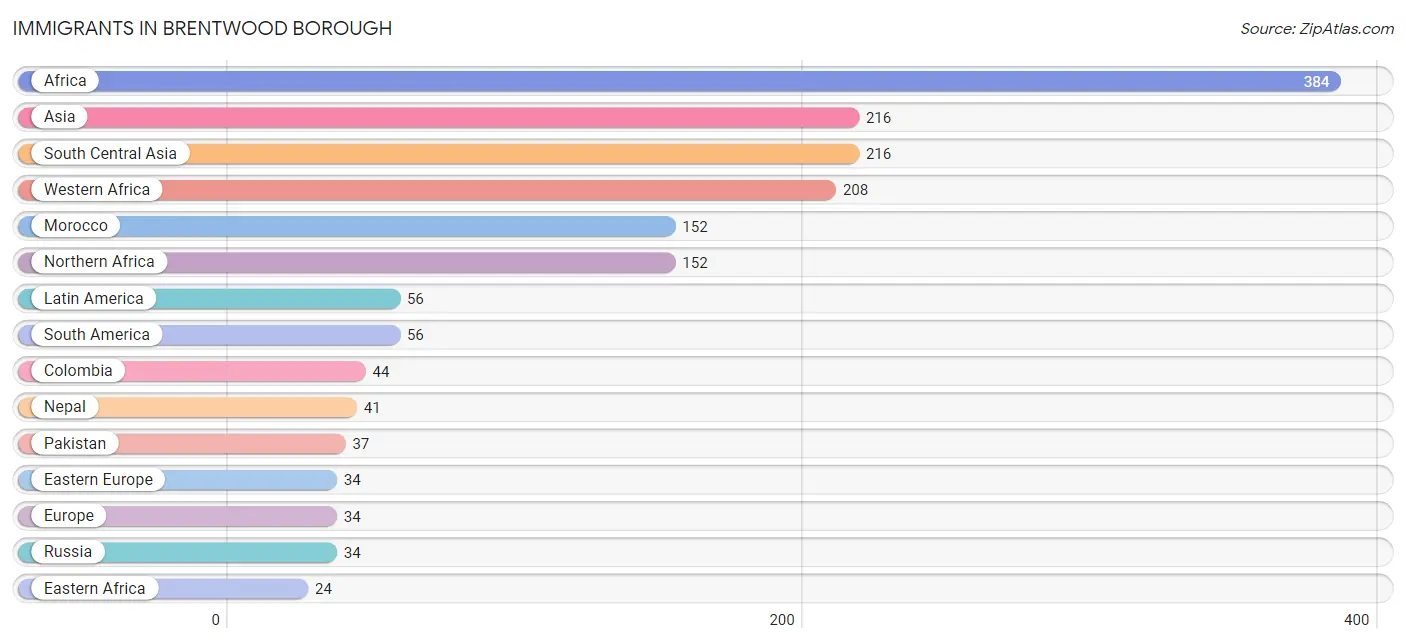
| Immigration Origin | # Population | % Population |
| Africa | 384 | 3.8% |
| Asia | 216 | 2.2% |
| Canada | 15 | 0.2% |
| Colombia | 44 | 0.4% |
| Eastern Africa | 24 | 0.2% |
| Eastern Europe | 34 | 0.3% |
| Europe | 34 | 0.3% |
| Latin America | 56 | 0.6% |
| Morocco | 152 | 1.5% |
| Nepal | 41 | 0.4% |
| Northern Africa | 152 | 1.5% |
| Pakistan | 37 | 0.4% |
| Peru | 11 | 0.1% |
| Russia | 34 | 0.3% |
| South America | 56 | 0.6% |
| South Central Asia | 216 | 2.2% |
| Western Africa | 208 | 2.1% | View All 17 Rows |
Sex and Age in Brentwood borough
Sex and Age in Brentwood borough
The most populous age groups in Brentwood borough are 35 to 39 Years (494 | 10.6%) for men and 60 to 64 Years (514 | 9.7%) for women.
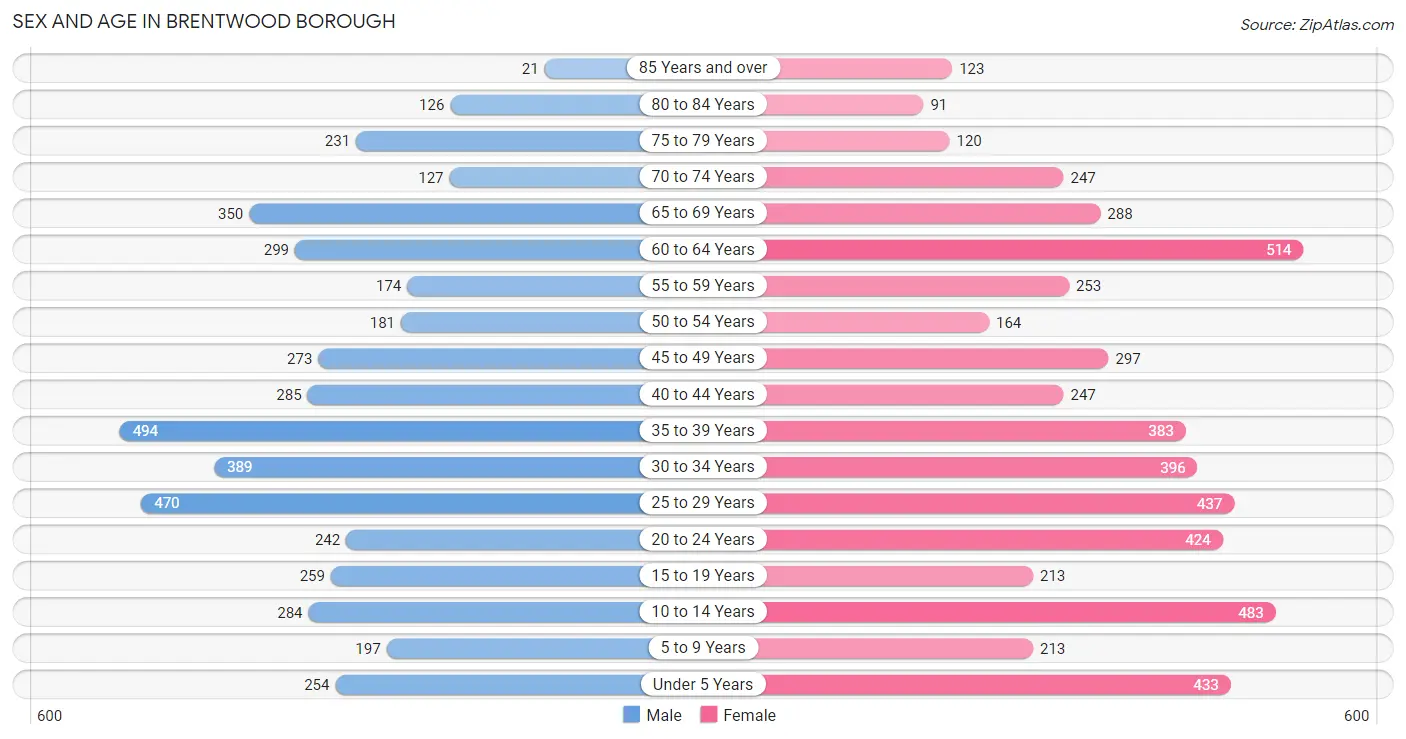
| Age Bracket | Male | Female |
| Under 5 Years | 254 (5.5%) | 433 (8.1%) |
| 5 to 9 Years | 197 (4.2%) | 213 (4.0%) |
| 10 to 14 Years | 284 (6.1%) | 483 (9.1%) |
| 15 to 19 Years | 259 (5.6%) | 213 (4.0%) |
| 20 to 24 Years | 242 (5.2%) | 424 (8.0%) |
| 25 to 29 Years | 470 (10.1%) | 437 (8.2%) |
| 30 to 34 Years | 389 (8.4%) | 396 (7.4%) |
| 35 to 39 Years | 494 (10.6%) | 383 (7.2%) |
| 40 to 44 Years | 285 (6.1%) | 247 (4.6%) |
| 45 to 49 Years | 273 (5.9%) | 297 (5.6%) |
| 50 to 54 Years | 181 (3.9%) | 164 (3.1%) |
| 55 to 59 Years | 174 (3.7%) | 253 (4.8%) |
| 60 to 64 Years | 299 (6.4%) | 514 (9.7%) |
| 65 to 69 Years | 350 (7.5%) | 288 (5.4%) |
| 70 to 74 Years | 127 (2.7%) | 247 (4.6%) |
| 75 to 79 Years | 231 (5.0%) | 120 (2.2%) |
| 80 to 84 Years | 126 (2.7%) | 91 (1.7%) |
| 85 Years and over | 21 (0.4%) | 123 (2.3%) |
| Total | 4,656 (100.0%) | 5,326 (100.0%) |
Families and Households in Brentwood borough
Median Family Size in Brentwood borough
The median family size in Brentwood borough is 3.04 persons per family, with married-couple families (1,433 | 62.8%) accounting for the largest median family size of 3.13 persons per family. On the other hand, single male/father families (99 | 4.3%) represent the smallest median family size with 2.37 persons per family.
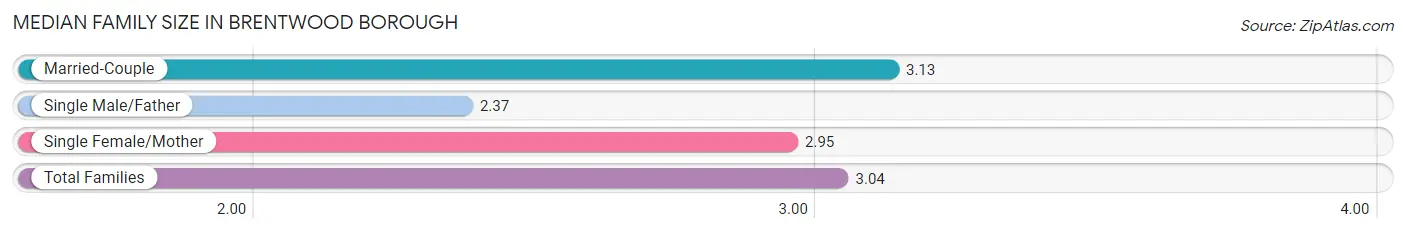
| Family Type | # Families | Family Size |
| Married-Couple | 1,433 (62.8%) | 3.13 |
| Single Male/Father | 99 (4.3%) | 2.37 |
| Single Female/Mother | 750 (32.9%) | 2.95 |
| Total Families | 2,282 (100.0%) | 3.04 |
Median Household Size in Brentwood borough
The median household size in Brentwood borough is 2.16 persons per household, with single female/mother households (750 | 16.2%) accounting for the largest median household size of 3.23 persons per household. non-family households (2,339 | 50.6%) represent the smallest median household size with 1.18 persons per household.
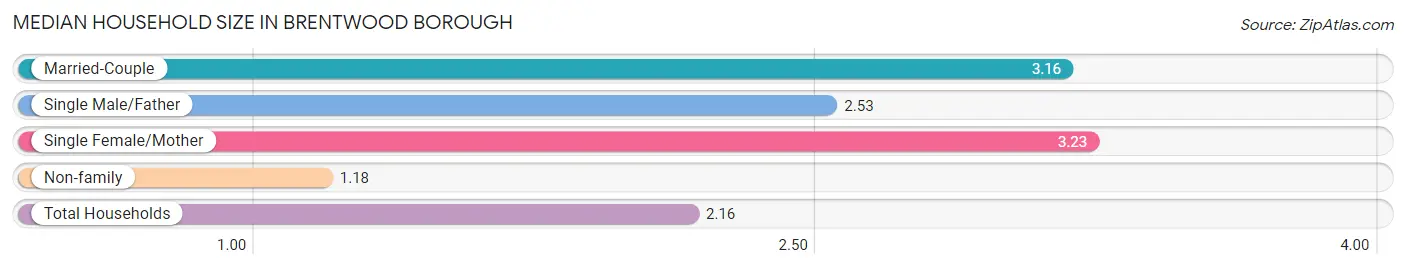
| Household Type | # Households | Household Size |
| Married-Couple | 1,433 (31.0%) | 3.16 |
| Single Male/Father | 99 (2.1%) | 2.53 |
| Single Female/Mother | 750 (16.2%) | 3.23 |
| Non-family | 2,339 (50.6%) | 1.18 |
| Total Households | 4,621 (100.0%) | 2.16 |
Household Size by Marriage Status in Brentwood borough
Out of a total of 4,621 households in Brentwood borough, 2,282 (49.4%) are family households, while 2,339 (50.6%) are nonfamily households. The most numerous type of family households are 2-person households, comprising 1,237, and the most common type of nonfamily households are 1-person households, comprising 2,046.
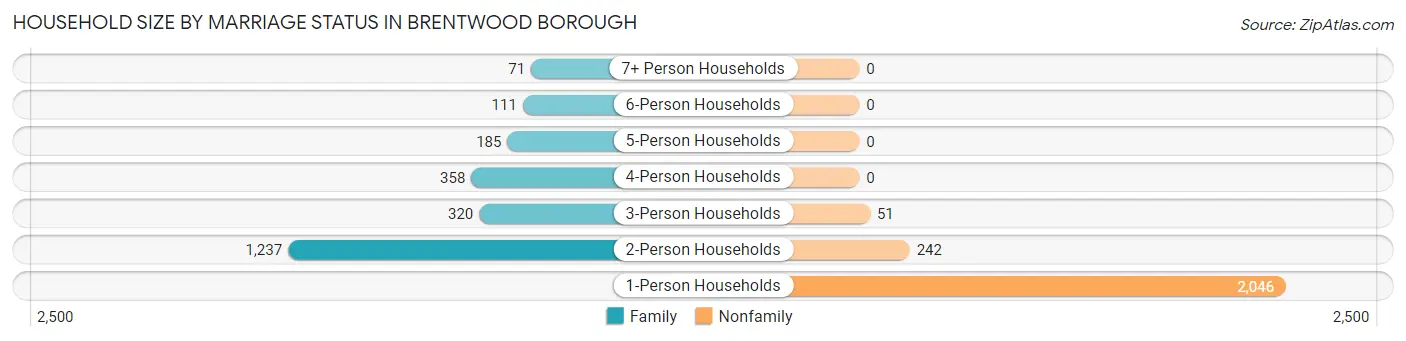
| Household Size | Family Households | Nonfamily Households |
| 1-Person Households | - | 2,046 (44.3%) |
| 2-Person Households | 1,237 (26.8%) | 242 (5.2%) |
| 3-Person Households | 320 (6.9%) | 51 (1.1%) |
| 4-Person Households | 358 (7.7%) | 0 (0.0%) |
| 5-Person Households | 185 (4.0%) | 0 (0.0%) |
| 6-Person Households | 111 (2.4%) | 0 (0.0%) |
| 7+ Person Households | 71 (1.5%) | 0 (0.0%) |
| Total | 2,282 (49.4%) | 2,339 (50.6%) |
Female Fertility in Brentwood borough
Fertility by Age in Brentwood borough
Average fertility rate in Brentwood borough is 63.0 births per 1,000 women. Women in the age bracket of 35 to 50 years have the highest fertility rate with 102.0 births per 1,000 women. Women in the age bracket of 35 to 50 years acount for 65.4% of all women with births.
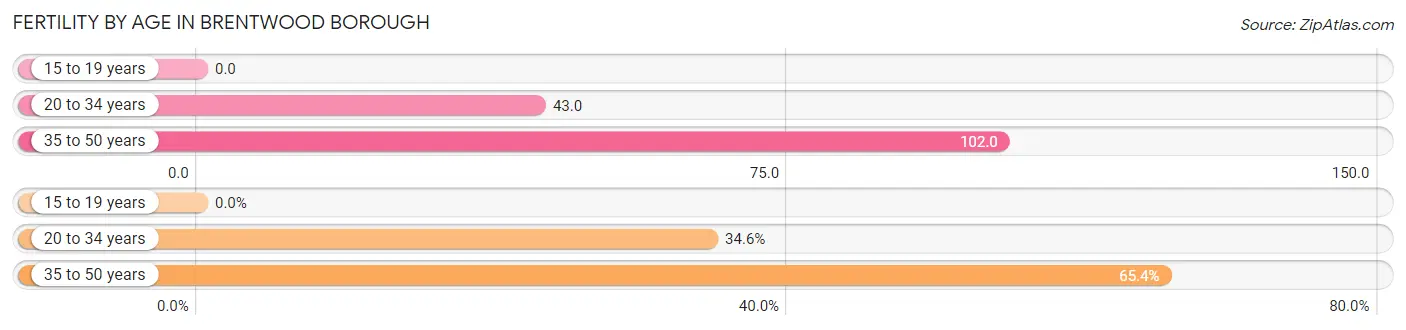
| Age Bracket | Women with Births | Births / 1,000 Women |
| 15 to 19 years | 0 (0.0%) | 0.0 |
| 20 to 34 years | 54 (34.6%) | 43.0 |
| 35 to 50 years | 102 (65.4%) | 102.0 |
| Total | 156 (100.0%) | 63.0 |
Fertility by Age by Marriage Status in Brentwood borough
53.2% of women with births (156) in Brentwood borough are married. The highest percentage of unmarried women with births falls into 35 to 50 years age bracket with 71.6% of them unmarried at the time of birth, while the lowest percentage of unmarried women with births belong to 20 to 34 years age bracket with 0.0% of them unmarried.
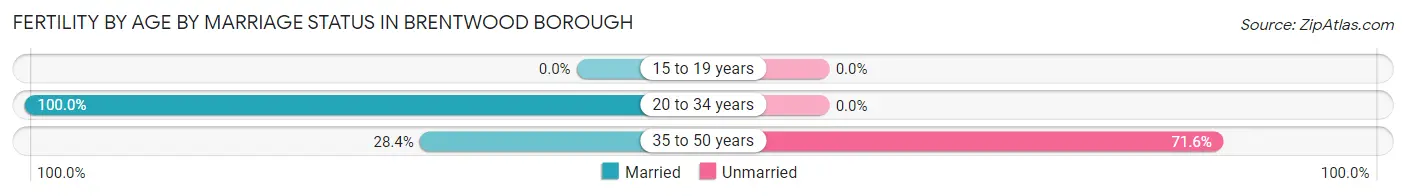
| Age Bracket | Married | Unmarried |
| 15 to 19 years | 0 (0.0%) | 0 (0.0%) |
| 20 to 34 years | 54 (100.0%) | 0 (0.0%) |
| 35 to 50 years | 29 (28.4%) | 73 (71.6%) |
| Total | 83 (53.2%) | 73 (46.8%) |
Fertility by Education in Brentwood borough
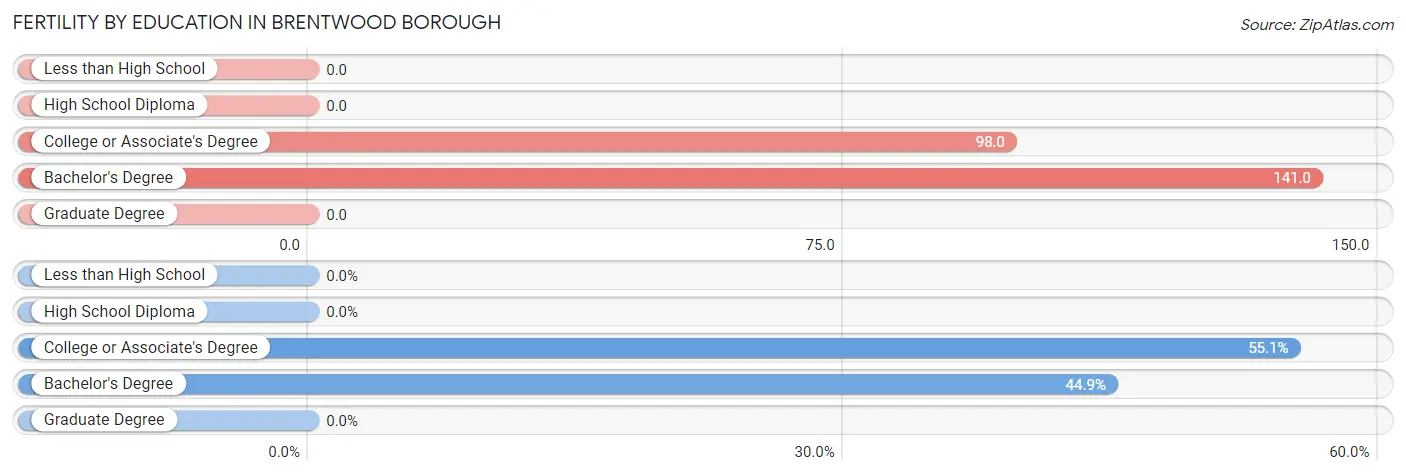
| Educational Attainment | Women with Births | Births / 1,000 Women |
| Less than High School | 0 (0.0%) | 0.0 |
| High School Diploma | 0 (0.0%) | 0.0 |
| College or Associate's Degree | 86 (55.1%) | 98.0 |
| Bachelor's Degree | 70 (44.9%) | 141.0 |
| Graduate Degree | 0 (0.0%) | 0.0 |
| Total | 156 (100.0%) | 63.0 |
Fertility by Education by Marriage Status in Brentwood borough
46.8% of women with births in Brentwood borough are unmarried. Women with the educational attainment of bachelor's degree are most likely to be married with 100.0% of them married at childbirth, while women with the educational attainment of college or associate's degree are least likely to be married with 84.9% of them unmarried at childbirth.
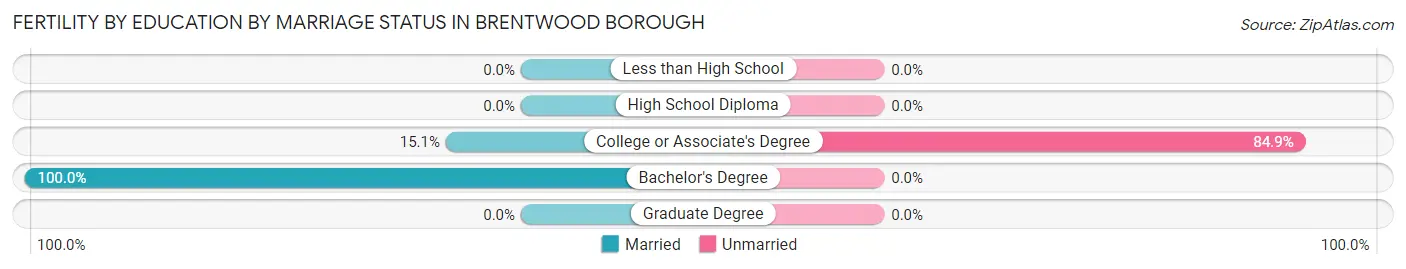
| Educational Attainment | Married | Unmarried |
| Less than High School | 0 (0.0%) | 0 (0.0%) |
| High School Diploma | 0 (0.0%) | 0 (0.0%) |
| College or Associate's Degree | 13 (15.1%) | 73 (84.9%) |
| Bachelor's Degree | 70 (100.0%) | 0 (0.0%) |
| Graduate Degree | 0 (0.0%) | 0 (0.0%) |
| Total | 83 (53.2%) | 73 (46.8%) |
Employment Characteristics in Brentwood borough
Employment by Class of Employer in Brentwood borough
Among the 5,134 employed individuals in Brentwood borough, private company employees (3,461 | 67.4%), not-for-profit organizations (947 | 18.4%), and local government employees (263 | 5.1%) make up the most common classes of employment.
| Employer Class | # Employees | % Employees |
| Private Company Employees | 3,461 | 67.4% |
| Self-Employed (Incorporated) | 153 | 3.0% |
| Self-Employed (Not Incorporated) | 110 | 2.1% |
| Not-for-profit Organizations | 947 | 18.4% |
| Local Government Employees | 263 | 5.1% |
| State Government Employees | 72 | 1.4% |
| Federal Government Employees | 128 | 2.5% |
| Unpaid Family Workers | 0 | 0.0% |
| Total | 5,134 | 100.0% |
Employment Status by Age in Brentwood borough
According to the labor force statistics for Brentwood borough, out of the total population over 16 years of age (8,026), 66.8% or 5,361 individuals are in the labor force, with 2.0% or 107 of them unemployed. The age group with the highest labor force participation rate is 20 to 24 years, with 98.6% or 657 individuals in the labor force. Within the labor force, the 16 to 19 years age range has the highest percentage of unemployed individuals, with 14.5% or 29 of them being unemployed.
| Age Bracket | In Labor Force | Unemployed |
| 16 to 19 Years | 200 (52.6%) | 29 (14.5%) |
| 20 to 24 Years | 657 (98.6%) | 0 (0.0%) |
| 25 to 29 Years | 772 (85.1%) | 0 (0.0%) |
| 30 to 34 Years | 731 (93.1%) | 10 (1.4%) |
| 35 to 44 Years | 1,329 (94.3%) | 45 (3.4%) |
| 45 to 54 Years | 701 (76.6%) | 0 (0.0%) |
| 55 to 59 Years | 364 (85.2%) | 13 (3.6%) |
| 60 to 64 Years | 395 (48.6%) | 9 (2.3%) |
| 65 to 74 Years | 190 (18.8%) | 0 (0.0%) |
| 75 Years and over | 20 (2.8%) | 0 (0.0%) |
| Total | 5,361 (66.8%) | 107 (2.0%) |
Employment Status by Educational Attainment in Brentwood borough
According to labor force statistics for Brentwood borough, 81.6% of individuals (4,289) out of the total population between 25 and 64 years of age (5,256) are in the labor force, with 1.8% or 77 of them being unemployed. The group with the highest labor force participation rate are those with the educational attainment of bachelor's degree or higher, with 90.8% or 1,810 individuals in the labor force. Within the labor force, individuals with high school diploma education have the highest percentage of unemployment, with 4.1% or 41 of them being unemployed.
| Educational Attainment | In Labor Force | Unemployed |
| Less than High School | 20 (16.9%) | 0 (0.0%) |
| High School Diploma | 1,009 (73.2%) | 56 (4.1%) |
| College / Associate Degree | 1,452 (82.2%) | 18 (1.0%) |
| Bachelor's Degree or higher | 1,810 (90.8%) | 24 (1.2%) |
| Total | 4,289 (81.6%) | 95 (1.8%) |
Employment Occupations by Sex in Brentwood borough
Management, Business, Science and Arts Occupations
The most common Management, Business, Science and Arts occupations in Brentwood borough are Health Diagnosing & Treating (627 | 11.9%), Health Technologists (480 | 9.1%), Community & Social Service (444 | 8.5%), Computers, Engineering & Science (428 | 8.2%), and Computers & Mathematics (318 | 6.0%).
Management, Business, Science and Arts Occupations by Sex
Within the Management, Business, Science and Arts occupations in Brentwood borough, the most male-oriented occupations are Architecture & Engineering (100.0%), Computers & Mathematics (77.7%), and Computers, Engineering & Science (77.1%), while the most female-oriented occupations are Life, Physical & Social Science (100.0%), Health Technologists (89.2%), and Health Diagnosing & Treating (85.2%).
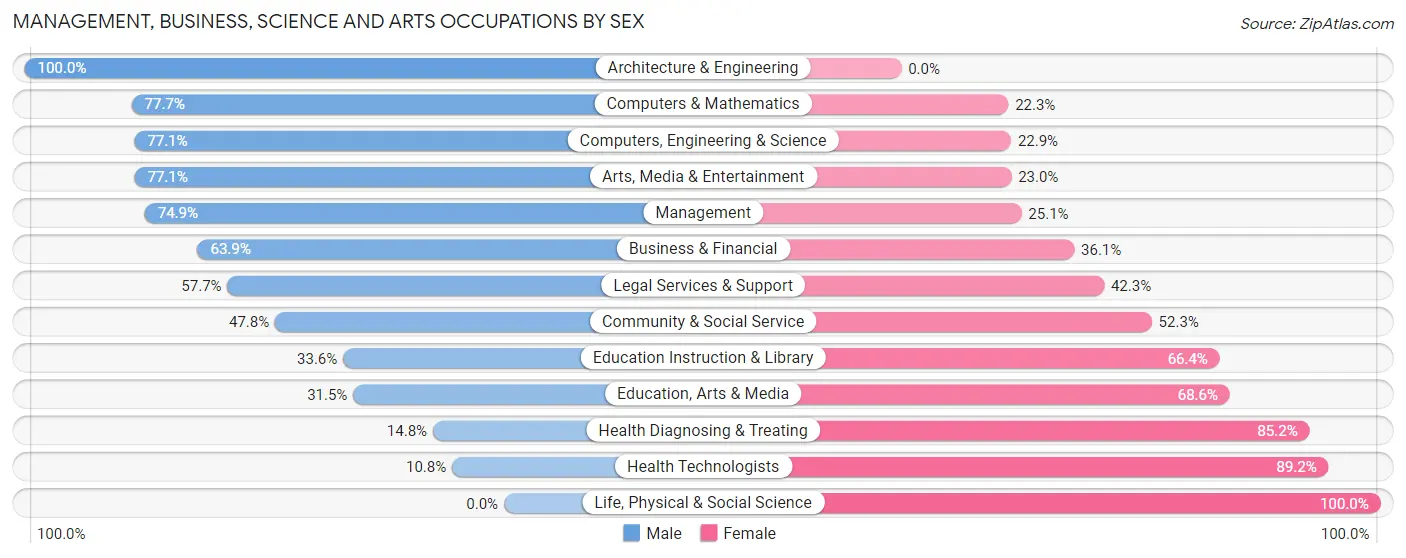
| Occupation | Male | Female |
| Management | 224 (74.9%) | 75 (25.1%) |
| Business & Financial | 186 (63.9%) | 105 (36.1%) |
| Computers, Engineering & Science | 330 (77.1%) | 98 (22.9%) |
| Computers & Mathematics | 247 (77.7%) | 71 (22.3%) |
| Architecture & Engineering | 83 (100.0%) | 0 (0.0%) |
| Life, Physical & Social Science | 0 (0.0%) | 27 (100.0%) |
| Community & Social Service | 212 (47.7%) | 232 (52.2%) |
| Education, Arts & Media | 39 (31.5%) | 85 (68.5%) |
| Legal Services & Support | 30 (57.7%) | 22 (42.3%) |
| Education Instruction & Library | 49 (33.6%) | 97 (66.4%) |
| Arts, Media & Entertainment | 94 (77.0%) | 28 (23.0%) |
| Health Diagnosing & Treating | 93 (14.8%) | 534 (85.2%) |
| Health Technologists | 52 (10.8%) | 428 (89.2%) |
| Total (Category) | 1,045 (50.0%) | 1,044 (50.0%) |
| Total (Overall) | 2,674 (50.9%) | 2,578 (49.1%) |
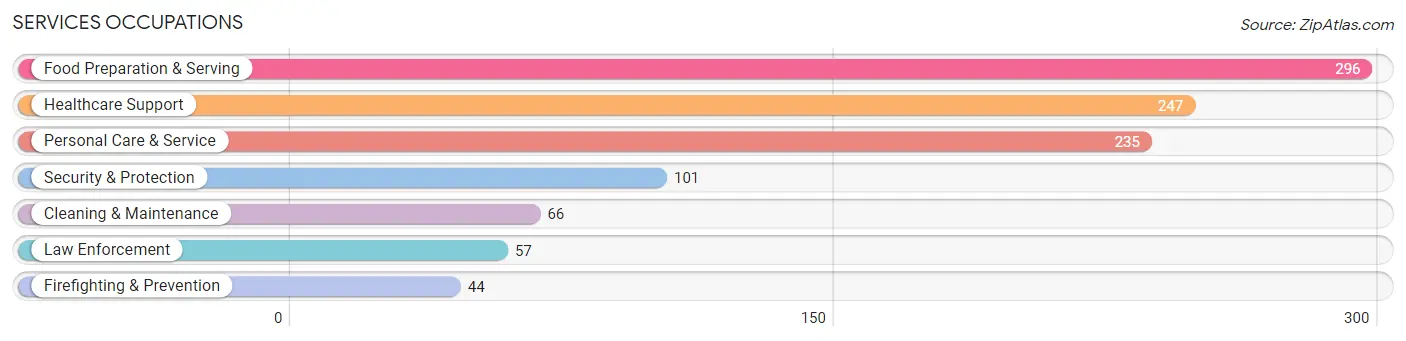
Services Occupations
The most common Services occupations in Brentwood borough are Food Preparation & Serving (296 | 5.6%), Healthcare Support (247 | 4.7%), Personal Care & Service (235 | 4.5%), Security & Protection (101 | 1.9%), and Cleaning & Maintenance (66 | 1.3%).
Services Occupations by Sex
Within the Services occupations in Brentwood borough, the most male-oriented occupations are Cleaning & Maintenance (100.0%), Law Enforcement (82.5%), and Security & Protection (74.3%), while the most female-oriented occupations are Healthcare Support (85.4%), Personal Care & Service (80.8%), and Food Preparation & Serving (57.1%).
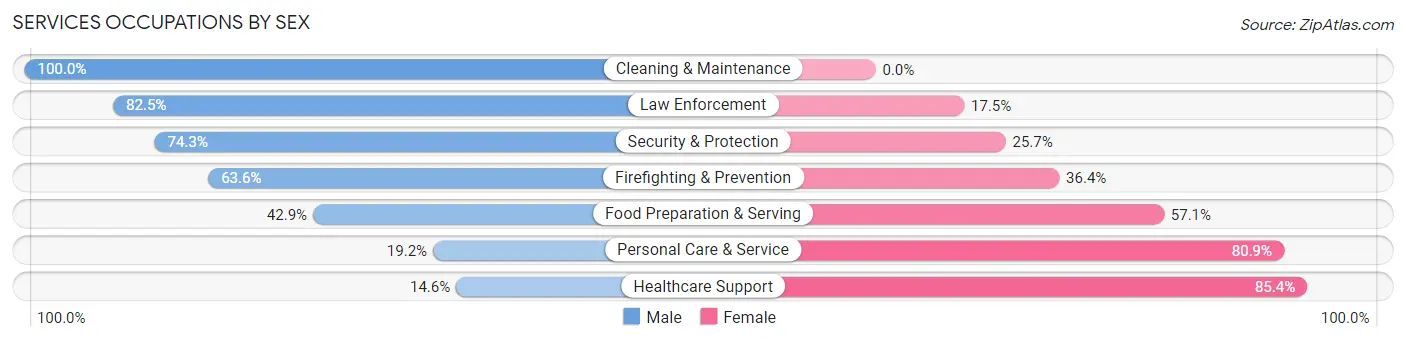
| Occupation | Male | Female |
| Healthcare Support | 36 (14.6%) | 211 (85.4%) |
| Security & Protection | 75 (74.3%) | 26 (25.7%) |
| Firefighting & Prevention | 28 (63.6%) | 16 (36.4%) |
| Law Enforcement | 47 (82.5%) | 10 (17.5%) |
| Food Preparation & Serving | 127 (42.9%) | 169 (57.1%) |
| Cleaning & Maintenance | 66 (100.0%) | 0 (0.0%) |
| Personal Care & Service | 45 (19.2%) | 190 (80.8%) |
| Total (Category) | 349 (36.9%) | 596 (63.1%) |
| Total (Overall) | 2,674 (50.9%) | 2,578 (49.1%) |
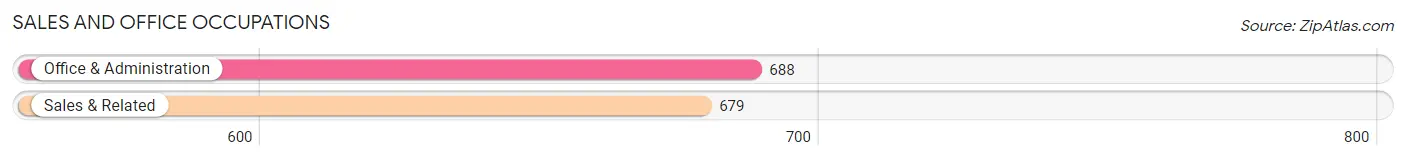
Sales and Office Occupations
The most common Sales and Office occupations in Brentwood borough are Office & Administration (688 | 13.1%), and Sales & Related (679 | 12.9%).
Sales and Office Occupations by Sex
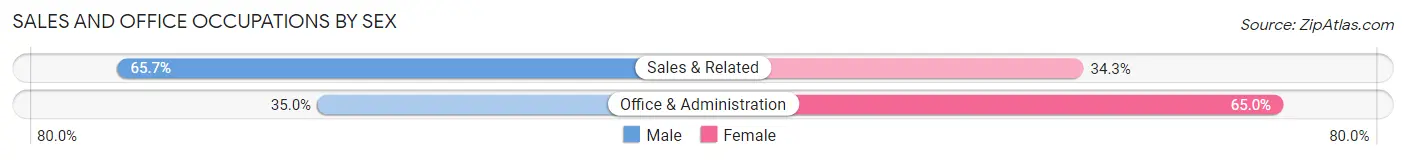
| Occupation | Male | Female |
| Sales & Related | 446 (65.7%) | 233 (34.3%) |
| Office & Administration | 241 (35.0%) | 447 (65.0%) |
| Total (Category) | 687 (50.3%) | 680 (49.7%) |
| Total (Overall) | 2,674 (50.9%) | 2,578 (49.1%) |
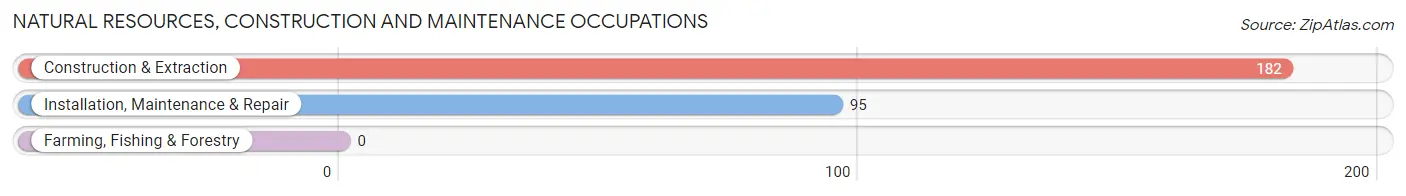
Natural Resources, Construction and Maintenance Occupations
The most common Natural Resources, Construction and Maintenance occupations in Brentwood borough are Construction & Extraction (182 | 3.5%), and Installation, Maintenance & Repair (95 | 1.8%).
Natural Resources, Construction and Maintenance Occupations by Sex
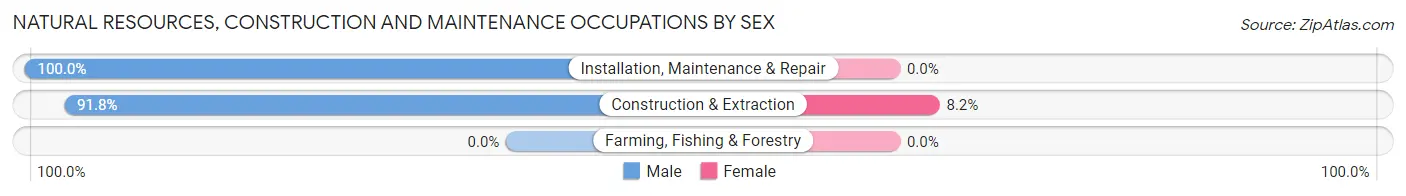
| Occupation | Male | Female |
| Farming, Fishing & Forestry | 0 (0.0%) | 0 (0.0%) |
| Construction & Extraction | 167 (91.8%) | 15 (8.2%) |
| Installation, Maintenance & Repair | 95 (100.0%) | 0 (0.0%) |
| Total (Category) | 262 (94.6%) | 15 (5.4%) |
| Total (Overall) | 2,674 (50.9%) | 2,578 (49.1%) |
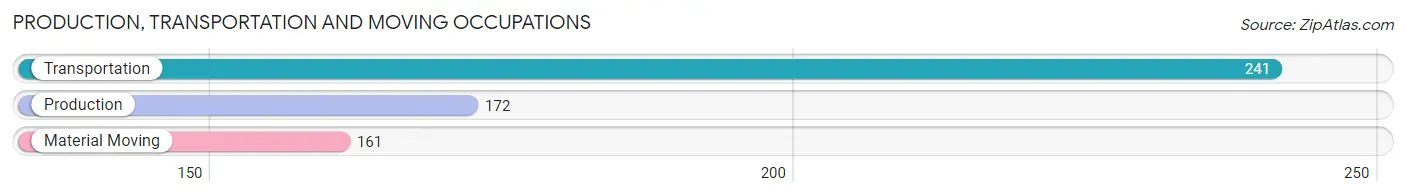
Production, Transportation and Moving Occupations
The most common Production, Transportation and Moving occupations in Brentwood borough are Transportation (241 | 4.6%), Production (172 | 3.3%), and Material Moving (161 | 3.1%).
Production, Transportation and Moving Occupations by Sex
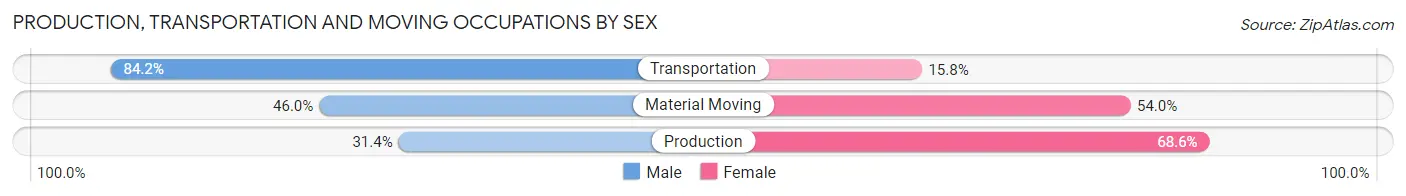
| Occupation | Male | Female |
| Production | 54 (31.4%) | 118 (68.6%) |
| Transportation | 203 (84.2%) | 38 (15.8%) |
| Material Moving | 74 (46.0%) | 87 (54.0%) |
| Total (Category) | 331 (57.7%) | 243 (42.3%) |
| Total (Overall) | 2,674 (50.9%) | 2,578 (49.1%) |
Employment Industries by Sex in Brentwood borough
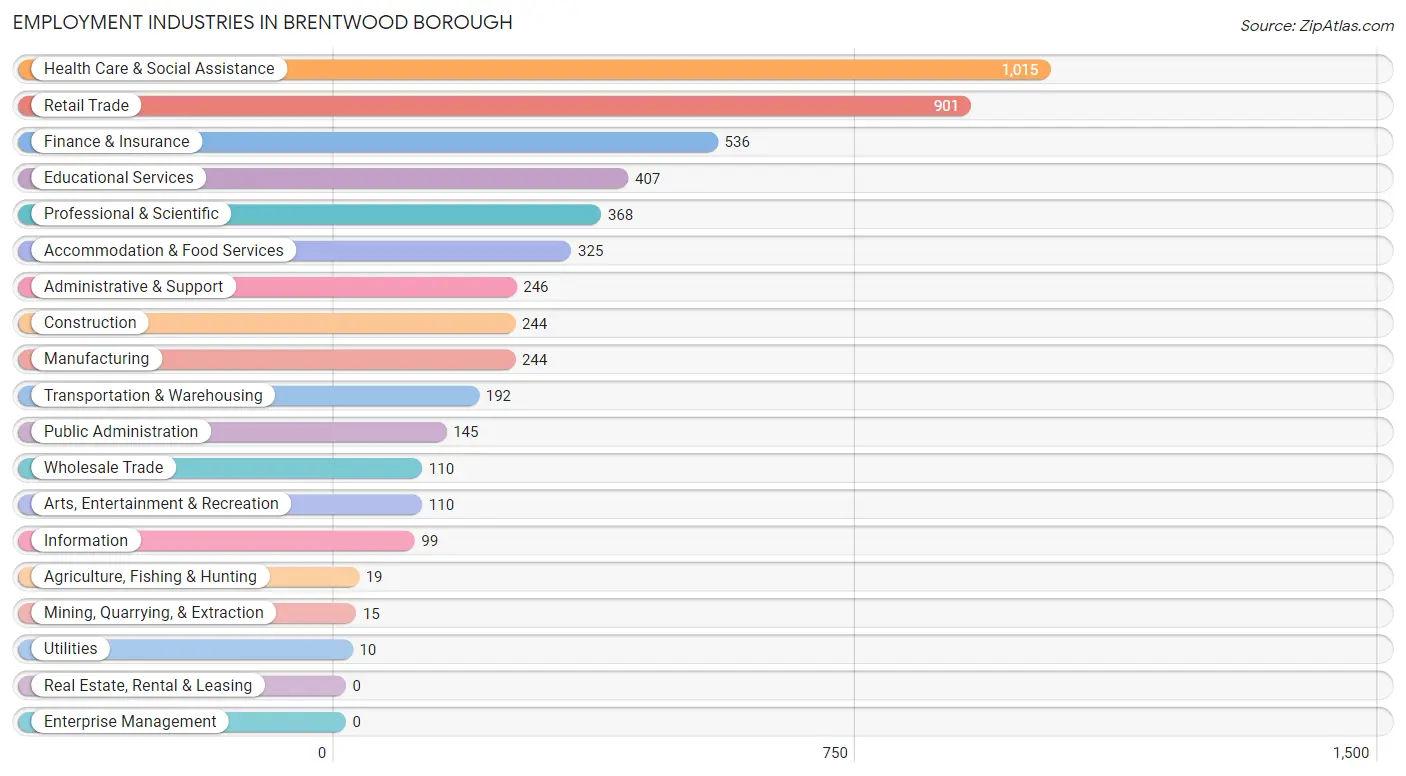
Employment Industries in Brentwood borough
The major employment industries in Brentwood borough include Health Care & Social Assistance (1,015 | 19.3%), Retail Trade (901 | 17.2%), Finance & Insurance (536 | 10.2%), Educational Services (407 | 7.7%), and Professional & Scientific (368 | 7.0%).
Employment Industries by Sex in Brentwood borough
The Brentwood borough industries that see more men than women are Agriculture, Fishing & Hunting (100.0%), Mining, Quarrying, & Extraction (100.0%), and Wholesale Trade (100.0%), whereas the industries that tend to have a higher number of women are Utilities (100.0%), Arts, Entertainment & Recreation (80.9%), and Health Care & Social Assistance (77.6%).
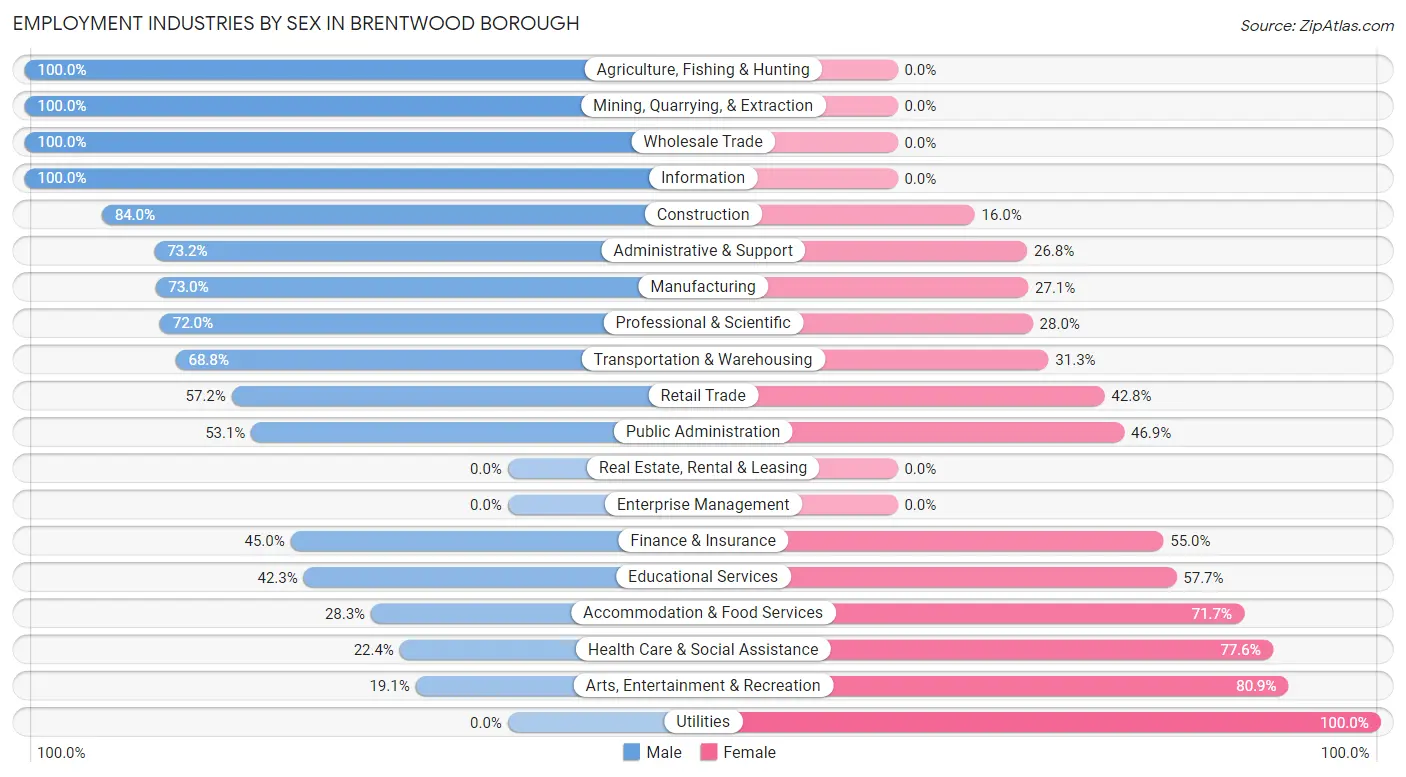
| Industry | Male | Female |
| Agriculture, Fishing & Hunting | 19 (100.0%) | 0 (0.0%) |
| Mining, Quarrying, & Extraction | 15 (100.0%) | 0 (0.0%) |
| Construction | 205 (84.0%) | 39 (16.0%) |
| Manufacturing | 178 (73.0%) | 66 (27.1%) |
| Wholesale Trade | 110 (100.0%) | 0 (0.0%) |
| Retail Trade | 515 (57.2%) | 386 (42.8%) |
| Transportation & Warehousing | 132 (68.8%) | 60 (31.2%) |
| Utilities | 0 (0.0%) | 10 (100.0%) |
| Information | 99 (100.0%) | 0 (0.0%) |
| Finance & Insurance | 241 (45.0%) | 295 (55.0%) |
| Real Estate, Rental & Leasing | 0 (0.0%) | 0 (0.0%) |
| Professional & Scientific | 265 (72.0%) | 103 (28.0%) |
| Enterprise Management | 0 (0.0%) | 0 (0.0%) |
| Administrative & Support | 180 (73.2%) | 66 (26.8%) |
| Educational Services | 172 (42.3%) | 235 (57.7%) |
| Health Care & Social Assistance | 227 (22.4%) | 788 (77.6%) |
| Arts, Entertainment & Recreation | 21 (19.1%) | 89 (80.9%) |
| Accommodation & Food Services | 92 (28.3%) | 233 (71.7%) |
| Public Administration | 77 (53.1%) | 68 (46.9%) |
| Total | 2,674 (50.9%) | 2,578 (49.1%) |
Education in Brentwood borough
School Enrollment in Brentwood borough
The most common levels of schooling among the 2,088 students in Brentwood borough are high school (616 | 29.5%), elementary school (421 | 20.2%), and middle school (403 | 19.3%).
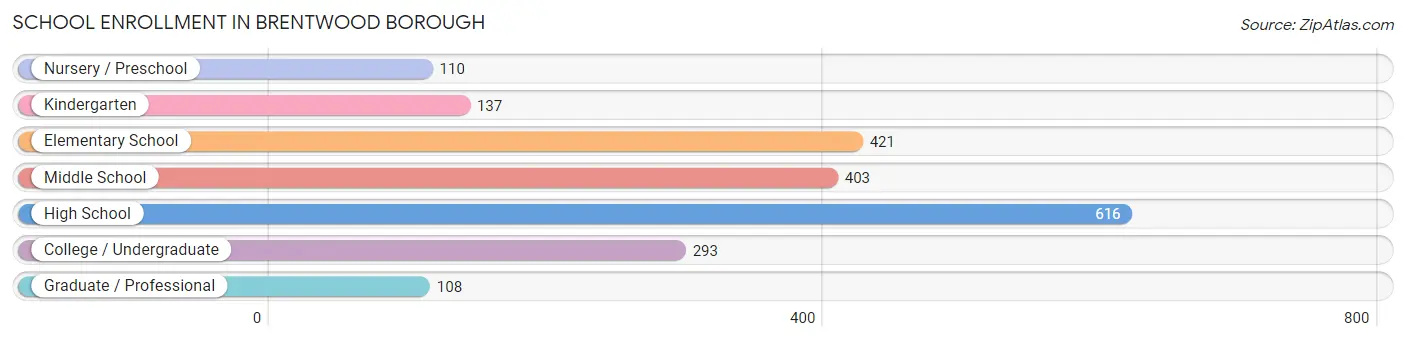
| School Level | # Students | % Students |
| Nursery / Preschool | 110 | 5.3% |
| Kindergarten | 137 | 6.6% |
| Elementary School | 421 | 20.2% |
| Middle School | 403 | 19.3% |
| High School | 616 | 29.5% |
| College / Undergraduate | 293 | 14.0% |
| Graduate / Professional | 108 | 5.2% |
| Total | 2,088 | 100.0% |
School Enrollment by Age by Funding Source in Brentwood borough
Out of a total of 2,088 students who are enrolled in schools in Brentwood borough, 200 (9.6%) attend a private institution, while the remaining 1,888 (90.4%) are enrolled in public schools. The age group of 3 to 4 year olds has the highest likelihood of being enrolled in private schools, with 56 (50.9% in the age bracket) enrolled. Conversely, the age group of 15 to 17 year olds has the lowest likelihood of being enrolled in a private school, with 419 (100.0% in the age bracket) attending a public institution.
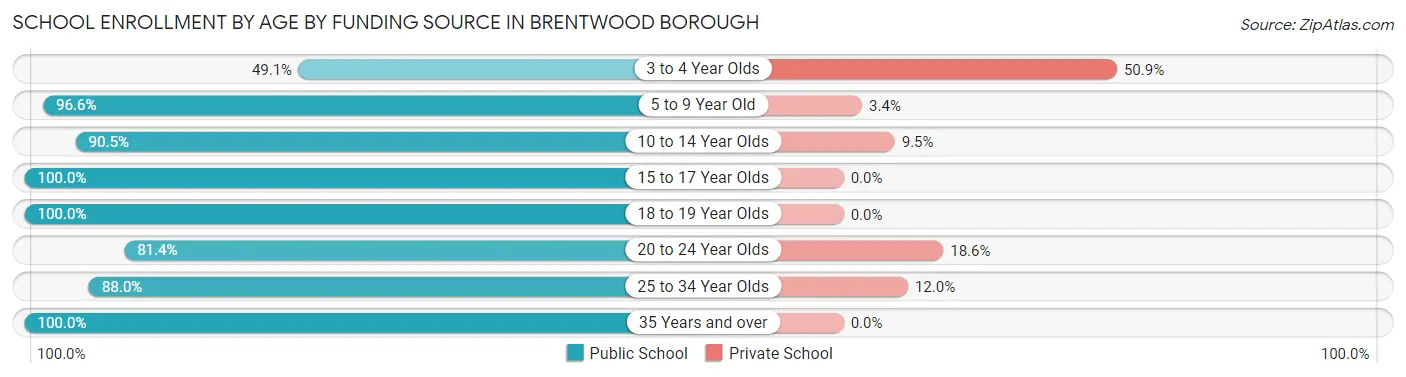
| Age Bracket | Public School | Private School |
| 3 to 4 Year Olds | 54 (49.1%) | 56 (50.9%) |
| 5 to 9 Year Old | 365 (96.6%) | 13 (3.4%) |
| 10 to 14 Year Olds | 694 (90.5%) | 73 (9.5%) |
| 15 to 17 Year Olds | 419 (100.0%) | 0 (0.0%) |
| 18 to 19 Year Olds | 13 (100.0%) | 0 (0.0%) |
| 20 to 24 Year Olds | 158 (81.4%) | 36 (18.6%) |
| 25 to 34 Year Olds | 169 (88.0%) | 23 (12.0%) |
| 35 Years and over | 15 (100.0%) | 0 (0.0%) |
| Total | 1,888 (90.4%) | 200 (9.6%) |
Educational Attainment by Field of Study in Brentwood borough
Business (447 | 15.9%), science & technology (424 | 15.1%), social sciences (344 | 12.2%), literature & languages (233 | 8.3%), and education (227 | 8.1%) are the most common fields of study among 2,810 individuals in Brentwood borough who have obtained a bachelor's degree or higher.
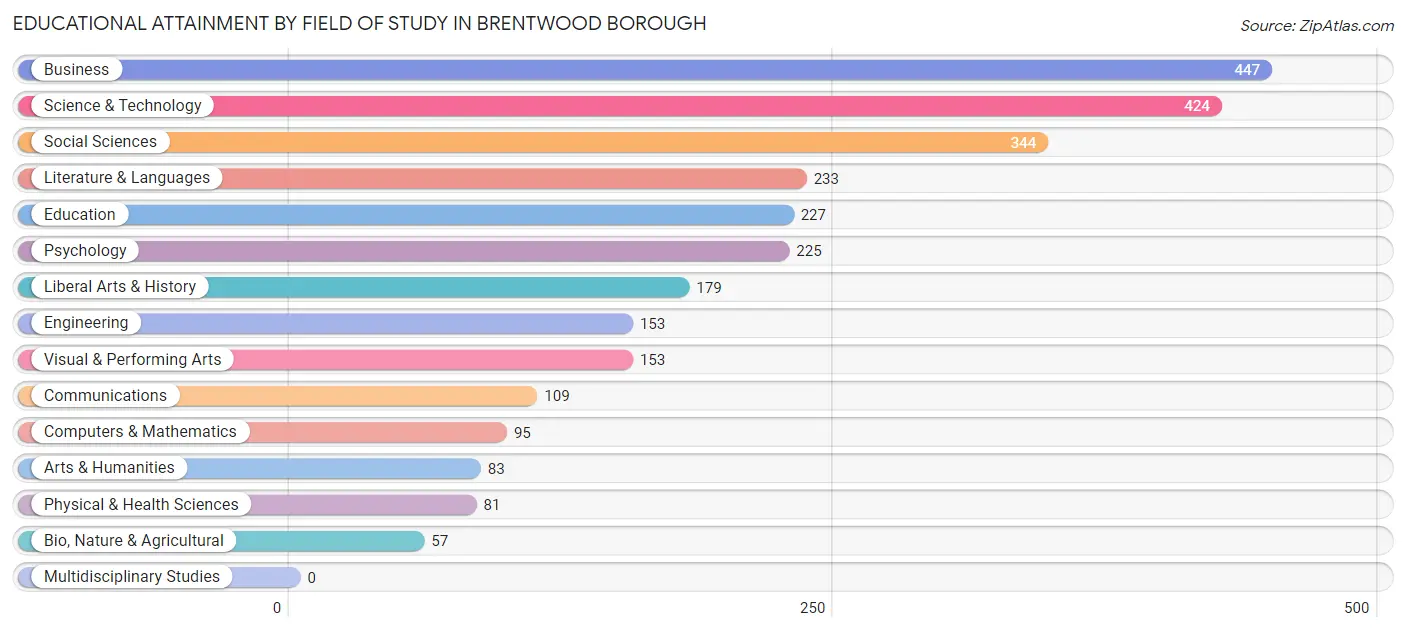
| Field of Study | # Graduates | % Graduates |
| Computers & Mathematics | 95 | 3.4% |
| Bio, Nature & Agricultural | 57 | 2.0% |
| Physical & Health Sciences | 81 | 2.9% |
| Psychology | 225 | 8.0% |
| Social Sciences | 344 | 12.2% |
| Engineering | 153 | 5.4% |
| Multidisciplinary Studies | 0 | 0.0% |
| Science & Technology | 424 | 15.1% |
| Business | 447 | 15.9% |
| Education | 227 | 8.1% |
| Literature & Languages | 233 | 8.3% |
| Liberal Arts & History | 179 | 6.4% |
| Visual & Performing Arts | 153 | 5.4% |
| Communications | 109 | 3.9% |
| Arts & Humanities | 83 | 2.9% |
| Total | 2,810 | 100.0% |
Transportation & Commute in Brentwood borough
Vehicle Availability by Sex in Brentwood borough
The most prevalent vehicle ownership categories in Brentwood borough are males with 2 vehicles (1,181, accounting for 44.4%) and females with 2 vehicles (1,346, making up 47.7%).
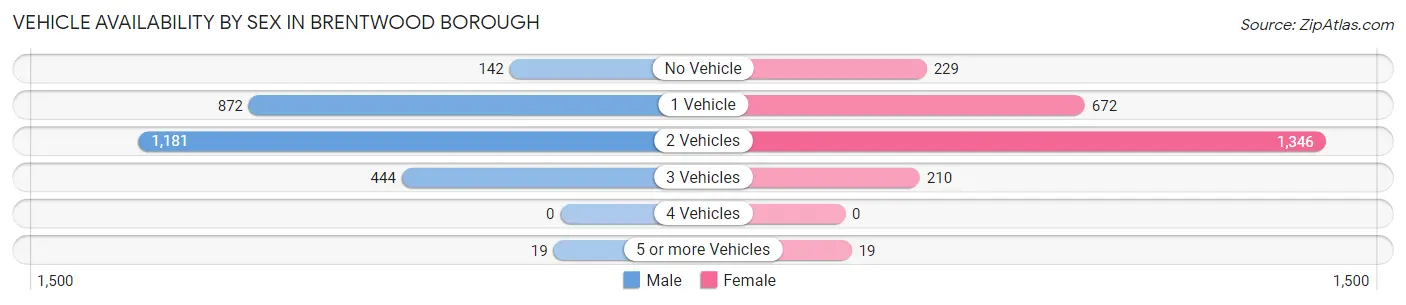
| Vehicles Available | Male | Female |
| No Vehicle | 142 (5.3%) | 229 (9.2%) |
| 1 Vehicle | 872 (32.8%) | 672 (27.1%) |
| 2 Vehicles | 1,181 (44.4%) | 1,346 (54.4%) |
| 3 Vehicles | 444 (16.7%) | 210 (8.5%) |
| 4 Vehicles | 0 (0.0%) | 0 (0.0%) |
| 5 or more Vehicles | 19 (0.7%) | 19 (0.8%) |
| Total | 2,658 (100.0%) | 2,476 (100.0%) |
Commute Time in Brentwood borough
The most frequently occuring commute durations in Brentwood borough are 30 to 34 minutes (979 commuters, 22.6%), 45 to 59 minutes (692 commuters, 16.0%), and 25 to 29 minutes (597 commuters, 13.8%).
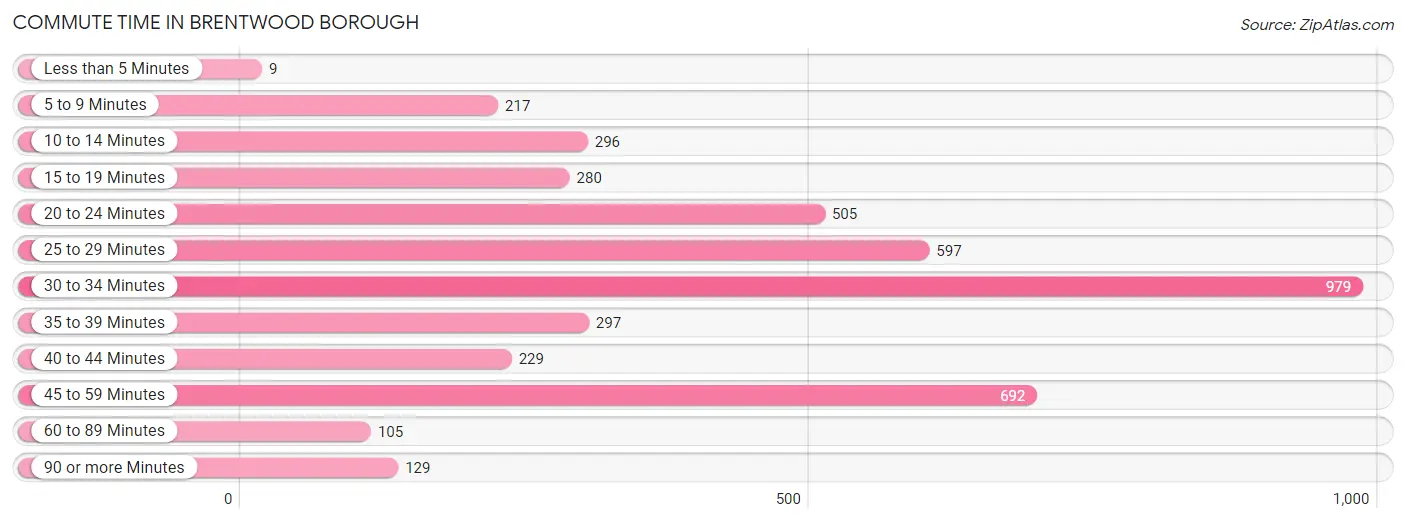
| Commute Time | # Commuters | % Commuters |
| Less than 5 Minutes | 9 | 0.2% |
| 5 to 9 Minutes | 217 | 5.0% |
| 10 to 14 Minutes | 296 | 6.8% |
| 15 to 19 Minutes | 280 | 6.5% |
| 20 to 24 Minutes | 505 | 11.7% |
| 25 to 29 Minutes | 597 | 13.8% |
| 30 to 34 Minutes | 979 | 22.6% |
| 35 to 39 Minutes | 297 | 6.9% |
| 40 to 44 Minutes | 229 | 5.3% |
| 45 to 59 Minutes | 692 | 16.0% |
| 60 to 89 Minutes | 105 | 2.4% |
| 90 or more Minutes | 129 | 3.0% |
Commute Time by Sex in Brentwood borough
The most common commute times in Brentwood borough are 30 to 34 minutes (486 commuters, 20.7%) for males and 30 to 34 minutes (493 commuters, 24.8%) for females.
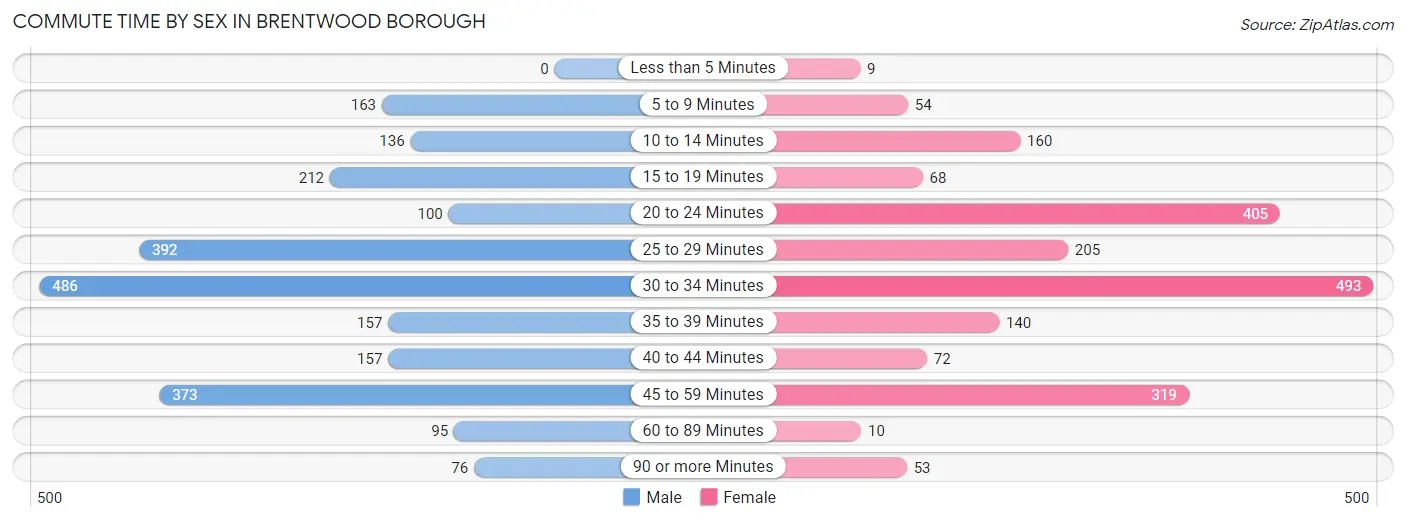
| Commute Time | Male | Female |
| Less than 5 Minutes | 0 (0.0%) | 9 (0.4%) |
| 5 to 9 Minutes | 163 (7.0%) | 54 (2.7%) |
| 10 to 14 Minutes | 136 (5.8%) | 160 (8.1%) |
| 15 to 19 Minutes | 212 (9.0%) | 68 (3.4%) |
| 20 to 24 Minutes | 100 (4.3%) | 405 (20.4%) |
| 25 to 29 Minutes | 392 (16.7%) | 205 (10.3%) |
| 30 to 34 Minutes | 486 (20.7%) | 493 (24.8%) |
| 35 to 39 Minutes | 157 (6.7%) | 140 (7.0%) |
| 40 to 44 Minutes | 157 (6.7%) | 72 (3.6%) |
| 45 to 59 Minutes | 373 (15.9%) | 319 (16.1%) |
| 60 to 89 Minutes | 95 (4.1%) | 10 (0.5%) |
| 90 or more Minutes | 76 (3.2%) | 53 (2.7%) |
Time of Departure to Work by Sex in Brentwood borough
The most frequent times of departure to work in Brentwood borough are 7:30 AM to 7:59 AM (399, 17.0%) for males and 7:00 AM to 7:29 AM (492, 24.7%) for females.
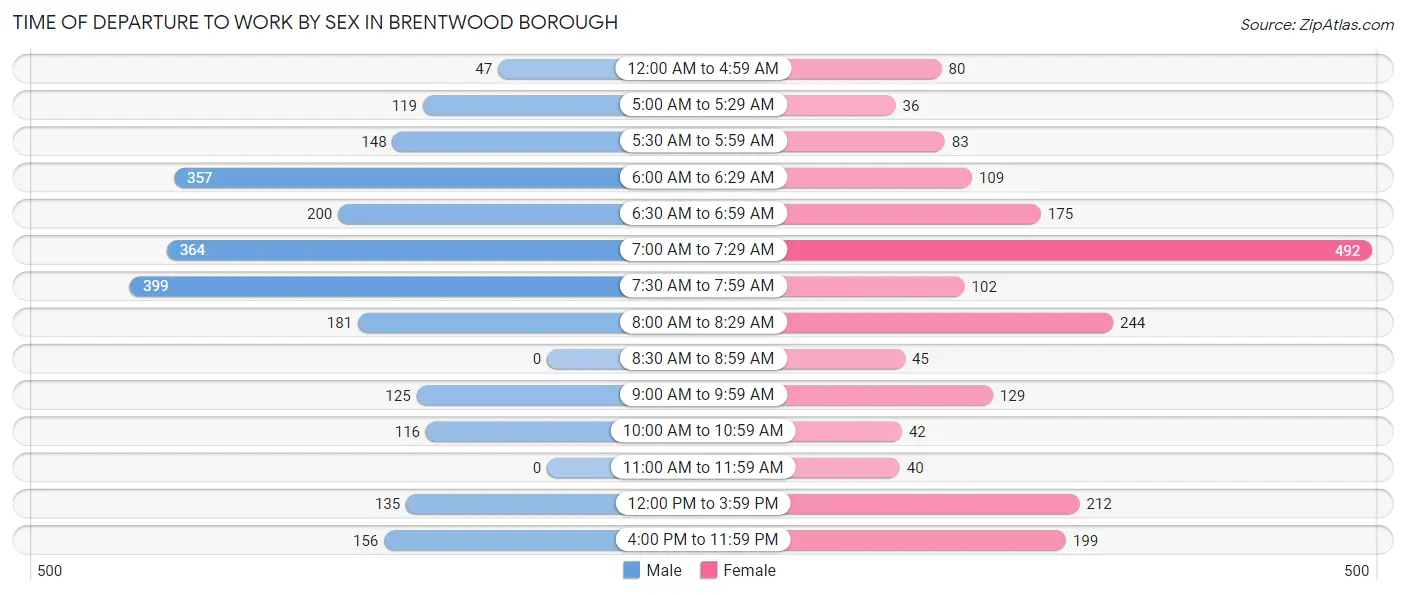
| Time of Departure | Male | Female |
| 12:00 AM to 4:59 AM | 47 (2.0%) | 80 (4.0%) |
| 5:00 AM to 5:29 AM | 119 (5.1%) | 36 (1.8%) |
| 5:30 AM to 5:59 AM | 148 (6.3%) | 83 (4.2%) |
| 6:00 AM to 6:29 AM | 357 (15.2%) | 109 (5.5%) |
| 6:30 AM to 6:59 AM | 200 (8.5%) | 175 (8.8%) |
| 7:00 AM to 7:29 AM | 364 (15.5%) | 492 (24.7%) |
| 7:30 AM to 7:59 AM | 399 (17.0%) | 102 (5.1%) |
| 8:00 AM to 8:29 AM | 181 (7.7%) | 244 (12.3%) |
| 8:30 AM to 8:59 AM | 0 (0.0%) | 45 (2.3%) |
| 9:00 AM to 9:59 AM | 125 (5.3%) | 129 (6.5%) |
| 10:00 AM to 10:59 AM | 116 (4.9%) | 42 (2.1%) |
| 11:00 AM to 11:59 AM | 0 (0.0%) | 40 (2.0%) |
| 12:00 PM to 3:59 PM | 135 (5.8%) | 212 (10.7%) |
| 4:00 PM to 11:59 PM | 156 (6.7%) | 199 (10.0%) |
| Total | 2,347 (100.0%) | 1,988 (100.0%) |
Housing Occupancy in Brentwood borough
Occupancy by Ownership in Brentwood borough
Of the total 4,621 dwellings in Brentwood borough, owner-occupied units account for 2,970 (64.3%), while renter-occupied units make up 1,651 (35.7%).
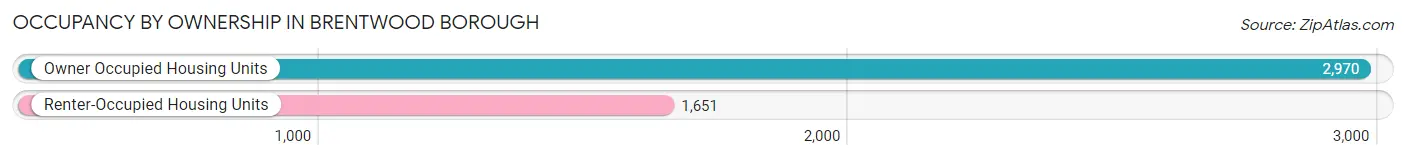
| Occupancy | # Housing Units | % Housing Units |
| Owner Occupied Housing Units | 2,970 | 64.3% |
| Renter-Occupied Housing Units | 1,651 | 35.7% |
| Total Occupied Housing Units | 4,621 | 100.0% |
Occupancy by Household Size in Brentwood borough
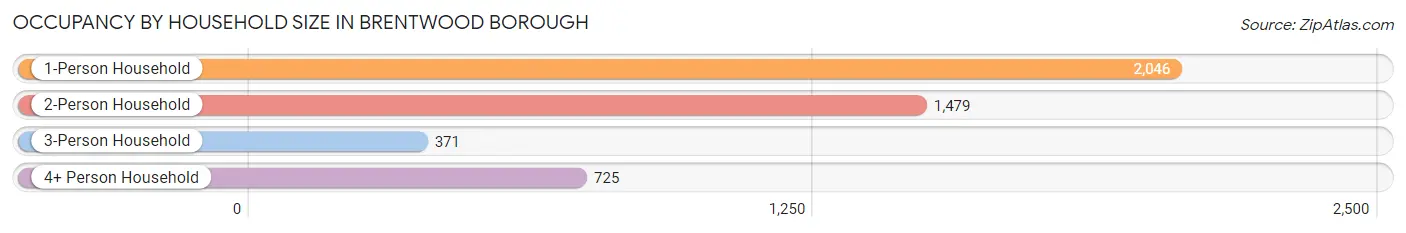
| Household Size | # Housing Units | % Housing Units |
| 1-Person Household | 2,046 | 44.3% |
| 2-Person Household | 1,479 | 32.0% |
| 3-Person Household | 371 | 8.0% |
| 4+ Person Household | 725 | 15.7% |
| Total Housing Units | 4,621 | 100.0% |
Occupancy by Ownership by Household Size in Brentwood borough
| Household Size | Owner-occupied | Renter-occupied |
| 1-Person Household | 1,089 (53.2%) | 957 (46.8%) |
| 2-Person Household | 1,120 (75.7%) | 359 (24.3%) |
| 3-Person Household | 207 (55.8%) | 164 (44.2%) |
| 4+ Person Household | 554 (76.4%) | 171 (23.6%) |
| Total Housing Units | 2,970 (64.3%) | 1,651 (35.7%) |
Occupancy by Educational Attainment in Brentwood borough
| Household Size | Owner-occupied | Renter-occupied |
| Less than High School | 30 (36.6%) | 52 (63.4%) |
| High School Diploma | 655 (46.9%) | 741 (53.1%) |
| College/Associate Degree | 1,109 (69.1%) | 497 (30.9%) |
| Bachelor's Degree or higher | 1,176 (76.5%) | 361 (23.5%) |
Occupancy by Age of Householder in Brentwood borough
| Age Bracket | # Households | % Households |
| Under 35 Years | 1,097 | 23.7% |
| 35 to 44 Years | 850 | 18.4% |
| 45 to 54 Years | 518 | 11.2% |
| 55 to 64 Years | 909 | 19.7% |
| 65 to 74 Years | 698 | 15.1% |
| 75 to 84 Years | 461 | 10.0% |
| 85 Years and Over | 88 | 1.9% |
| Total | 4,621 | 100.0% |
Housing Finances in Brentwood borough
Median Income by Occupancy in Brentwood borough
| Occupancy Type | # Households | Median Income |
| Owner-Occupied | 2,970 (64.3%) | $76,844 |
| Renter-Occupied | 1,651 (35.7%) | $27,292 |
| Average | 4,621 (100.0%) | $57,900 |
Occupancy by Householder Income Bracket in Brentwood borough
| Income Bracket | Owner-occupied | Renter-occupied |
| Less than $5,000 | 10 (0.3%) | 61 (3.7%) |
| $5,000 to $9,999 | 50 (1.7%) | 7 (0.4%) |
| $10,000 to $14,999 | 142 (4.8%) | 317 (19.2%) |
| $15,000 to $19,999 | 16 (0.5%) | 154 (9.3%) |
| $20,000 to $24,999 | 87 (2.9%) | 149 (9.0%) |
| $25,000 to $34,999 | 170 (5.7%) | 281 (17.0%) |
| $35,000 to $49,999 | 274 (9.2%) | 290 (17.6%) |
| $50,000 to $74,999 | 677 (22.8%) | 146 (8.8%) |
| $75,000 to $99,999 | 415 (14.0%) | 98 (5.9%) |
| $100,000 to $149,999 | 927 (31.2%) | 97 (5.9%) |
| $150,000 or more | 202 (6.8%) | 51 (3.1%) |
| Total | 2,970 (100.0%) | 1,651 (100.0%) |
Monthly Housing Cost Tiers in Brentwood borough
| Monthly Cost | Owner-occupied | Renter-occupied |
| Less than $300 | 26 (0.9%) | 0 (0.0%) |
| $300 to $499 | 380 (12.8%) | 231 (14.0%) |
| $500 to $799 | 816 (27.5%) | 546 (33.1%) |
| $800 to $999 | 208 (7.0%) | 320 (19.4%) |
| $1,000 to $1,499 | 794 (26.7%) | 368 (22.3%) |
| $1,500 to $1,999 | 586 (19.7%) | 85 (5.1%) |
| $2,000 to $2,499 | 141 (4.8%) | 20 (1.2%) |
| $2,500 to $2,999 | 19 (0.6%) | 0 (0.0%) |
| $3,000 or more | 0 (0.0%) | 0 (0.0%) |
| Total | 2,970 (100.0%) | 1,651 (100.0%) |
Physical Housing Characteristics in Brentwood borough
Housing Structures in Brentwood borough
| Structure Type | # Housing Units | % Housing Units |
| Single Unit, Detached | 3,020 | 65.3% |
| Single Unit, Attached | 332 | 7.2% |
| 2 Unit Apartments | 392 | 8.5% |
| 3 or 4 Unit Apartments | 132 | 2.9% |
| 5 to 9 Unit Apartments | 53 | 1.1% |
| 10 or more Apartments | 692 | 15.0% |
| Mobile Home / Other | 0 | 0.0% |
| Total | 4,621 | 100.0% |
Housing Structures by Occupancy in Brentwood borough
| Structure Type | Owner-occupied | Renter-occupied |
| Single Unit, Detached | 2,830 (93.7%) | 190 (6.3%) |
| Single Unit, Attached | 103 (31.0%) | 229 (69.0%) |
| 2 Unit Apartments | 37 (9.4%) | 355 (90.6%) |
| 3 or 4 Unit Apartments | 0 (0.0%) | 132 (100.0%) |
| 5 to 9 Unit Apartments | 0 (0.0%) | 53 (100.0%) |
| 10 or more Apartments | 0 (0.0%) | 692 (100.0%) |
| Mobile Home / Other | 0 (0.0%) | 0 (0.0%) |
| Total | 2,970 (64.3%) | 1,651 (35.7%) |
Housing Structures by Number of Rooms in Brentwood borough
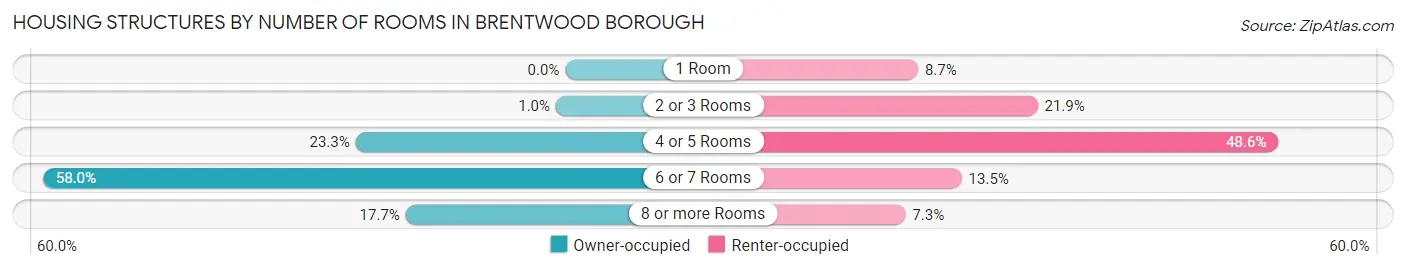
| Number of Rooms | Owner-occupied | Renter-occupied |
| 1 Room | 0 (0.0%) | 143 (8.7%) |
| 2 or 3 Rooms | 31 (1.0%) | 362 (21.9%) |
| 4 or 5 Rooms | 691 (23.3%) | 803 (48.6%) |
| 6 or 7 Rooms | 1,722 (58.0%) | 223 (13.5%) |
| 8 or more Rooms | 526 (17.7%) | 120 (7.3%) |
| Total | 2,970 (100.0%) | 1,651 (100.0%) |
Housing Structure by Heating Type in Brentwood borough
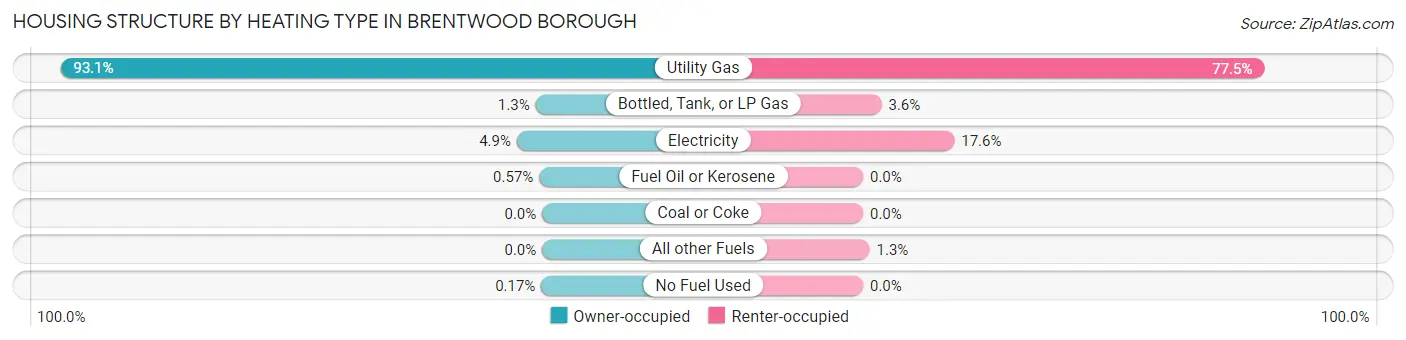
| Heating Type | Owner-occupied | Renter-occupied |
| Utility Gas | 2,765 (93.1%) | 1,280 (77.5%) |
| Bottled, Tank, or LP Gas | 38 (1.3%) | 59 (3.6%) |
| Electricity | 145 (4.9%) | 291 (17.6%) |
| Fuel Oil or Kerosene | 17 (0.6%) | 0 (0.0%) |
| Coal or Coke | 0 (0.0%) | 0 (0.0%) |
| All other Fuels | 0 (0.0%) | 21 (1.3%) |
| No Fuel Used | 5 (0.2%) | 0 (0.0%) |
| Total | 2,970 (100.0%) | 1,651 (100.0%) |
Household Vehicle Usage in Brentwood borough
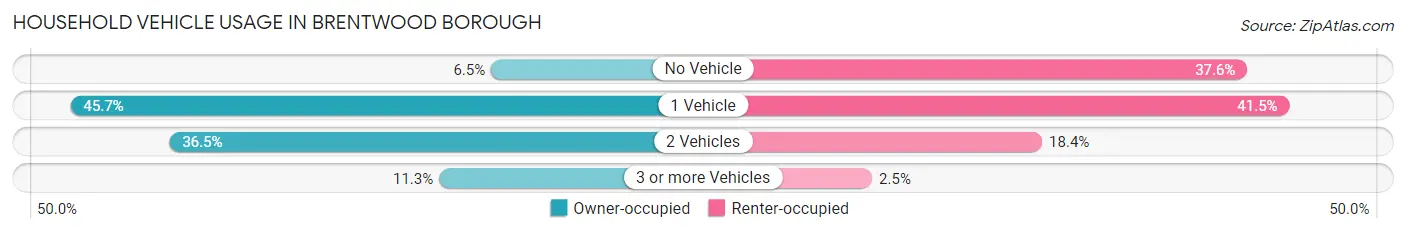
| Vehicles per Household | Owner-occupied | Renter-occupied |
| No Vehicle | 192 (6.5%) | 620 (37.6%) |
| 1 Vehicle | 1,358 (45.7%) | 685 (41.5%) |
| 2 Vehicles | 1,084 (36.5%) | 304 (18.4%) |
| 3 or more Vehicles | 336 (11.3%) | 42 (2.5%) |
| Total | 2,970 (100.0%) | 1,651 (100.0%) |
Real Estate & Mortgages in Brentwood borough
Real Estate and Mortgage Overview in Brentwood borough
| Characteristic | Without Mortgage | With Mortgage |
| Housing Units | 1,393 | 1,577 |
| Median Property Value | $117,700 | $141,700 |
| Median Household Income | $58,767 | $148 |
| Monthly Housing Costs | $634 | $0 |
| Real Estate Taxes | $3,492 | $73 |
Property Value by Mortgage Status in Brentwood borough
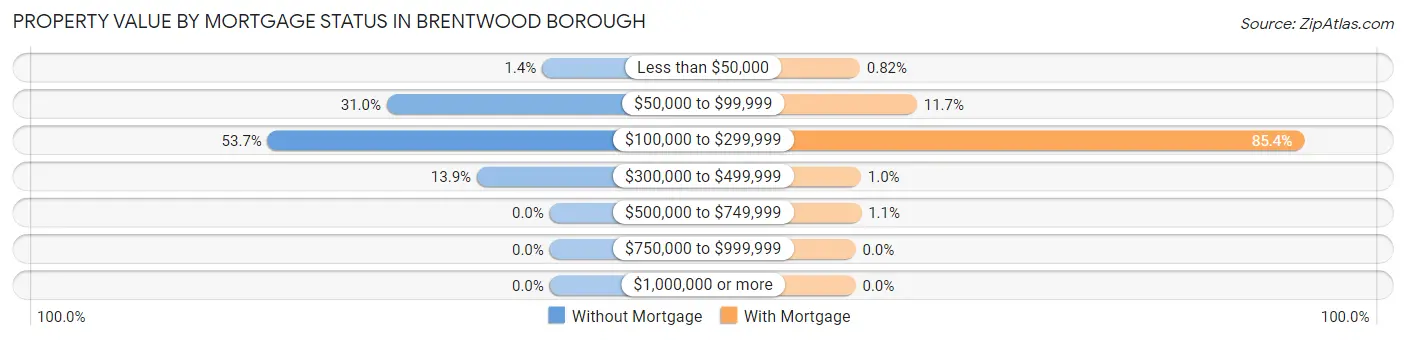
| Property Value | Without Mortgage | With Mortgage |
| Less than $50,000 | 20 (1.4%) | 13 (0.8%) |
| $50,000 to $99,999 | 432 (31.0%) | 184 (11.7%) |
| $100,000 to $299,999 | 748 (53.7%) | 1,347 (85.4%) |
| $300,000 to $499,999 | 193 (13.9%) | 16 (1.0%) |
| $500,000 to $749,999 | 0 (0.0%) | 17 (1.1%) |
| $750,000 to $999,999 | 0 (0.0%) | 0 (0.0%) |
| $1,000,000 or more | 0 (0.0%) | 0 (0.0%) |
| Total | 1,393 (100.0%) | 1,577 (100.0%) |
Household Income by Mortgage Status in Brentwood borough
| Household Income | Without Mortgage | With Mortgage |
| Less than $10,000 | 10 (0.7%) | 60 (3.8%) |
| $10,000 to $24,999 | 237 (17.0%) | 50 (3.2%) |
| $25,000 to $34,999 | 123 (8.8%) | 8 (0.5%) |
| $35,000 to $49,999 | 114 (8.2%) | 47 (3.0%) |
| $50,000 to $74,999 | 393 (28.2%) | 160 (10.2%) |
| $75,000 to $99,999 | 181 (13.0%) | 284 (18.0%) |
| $100,000 to $149,999 | 281 (20.2%) | 234 (14.8%) |
| $150,000 or more | 54 (3.9%) | 646 (41.0%) |
| Total | 1,393 (100.0%) | 1,577 (100.0%) |
Property Value to Household Income Ratio in Brentwood borough
| Value-to-Income Ratio | Without Mortgage | With Mortgage |
| Less than 2.0x | 649 (46.6%) | 100,917 (6,399.3%) |
| 2.0x to 2.9x | 166 (11.9%) | 1,008 (63.9%) |
| 3.0x to 3.9x | 139 (10.0%) | 342 (21.7%) |
| 4.0x or more | 439 (31.5%) | 122 (7.7%) |
| Total | 1,393 (100.0%) | 1,577 (100.0%) |
Real Estate Taxes by Mortgage Status in Brentwood borough
| Property Taxes | Without Mortgage | With Mortgage |
| Less than $800 | 53 (3.8%) | 0 (0.0%) |
| $800 to $1,499 | 200 (14.4%) | 101 (6.4%) |
| $800 to $1,499 | 1,128 (81.0%) | 119 (7.5%) |
| Total | 1,393 (100.0%) | 1,577 (100.0%) |
Health & Disability in Brentwood borough
Health Insurance Coverage by Age in Brentwood borough
| Age Bracket | With Coverage | Without Coverage |
| Under 6 Years | 805 (100.0%) | 0 (0.0%) |
| 6 to 18 Years | 1,279 (83.5%) | 252 (16.5%) |
| 19 to 25 Years | 852 (100.0%) | 0 (0.0%) |
| 26 to 34 Years | 1,310 (87.0%) | 196 (13.0%) |
| 35 to 44 Years | 1,356 (96.2%) | 53 (3.8%) |
| 45 to 54 Years | 897 (98.0%) | 18 (2.0%) |
| 55 to 64 Years | 1,218 (98.2%) | 22 (1.8%) |
| 65 to 74 Years | 1,012 (100.0%) | 0 (0.0%) |
| 75 Years and older | 712 (100.0%) | 0 (0.0%) |
| Total | 9,441 (94.6%) | 541 (5.4%) |
Health Insurance Coverage by Citizenship Status in Brentwood borough
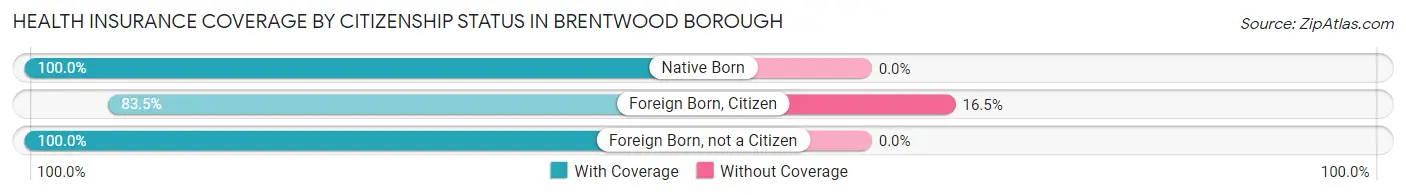
| Citizenship Status | With Coverage | Without Coverage |
| Native Born | 805 (100.0%) | 0 (0.0%) |
| Foreign Born, Citizen | 1,279 (83.5%) | 252 (16.5%) |
| Foreign Born, not a Citizen | 852 (100.0%) | 0 (0.0%) |
Health Insurance Coverage by Household Income in Brentwood borough
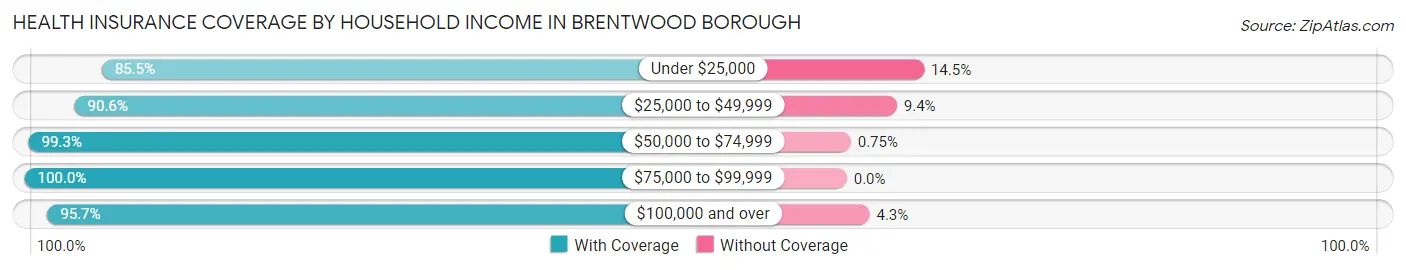
| Household Income | With Coverage | Without Coverage |
| Under $25,000 | 1,272 (85.5%) | 215 (14.5%) |
| $25,000 to $49,999 | 1,469 (90.6%) | 152 (9.4%) |
| $50,000 to $74,999 | 1,724 (99.3%) | 13 (0.7%) |
| $75,000 to $99,999 | 1,366 (100.0%) | 0 (0.0%) |
| $100,000 and over | 3,594 (95.7%) | 160 (4.3%) |
Public vs Private Health Insurance Coverage by Age in Brentwood borough
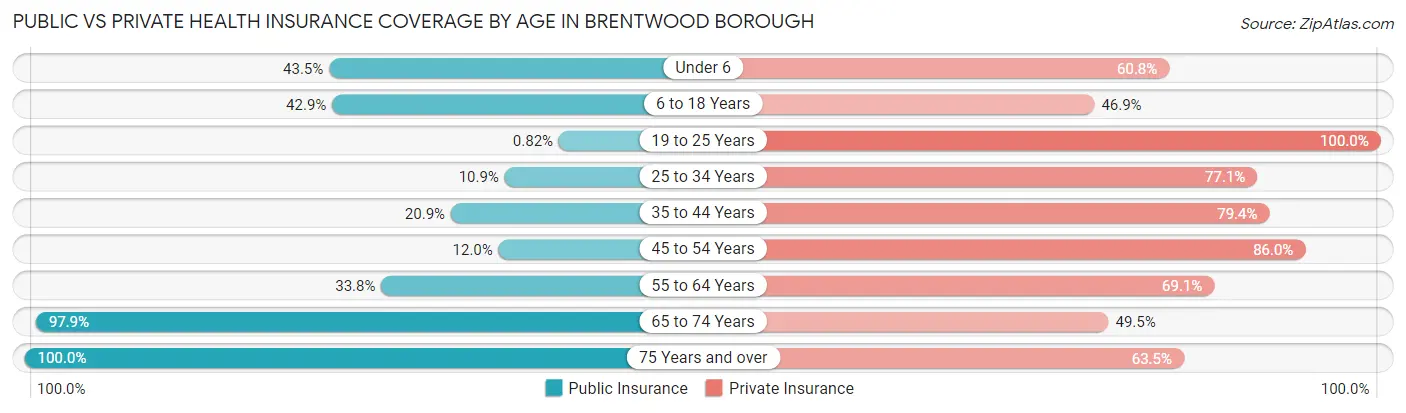
| Age Bracket | Public Insurance | Private Insurance |
| Under 6 | 350 (43.5%) | 489 (60.8%) |
| 6 to 18 Years | 657 (42.9%) | 718 (46.9%) |
| 19 to 25 Years | 7 (0.8%) | 852 (100.0%) |
| 25 to 34 Years | 164 (10.9%) | 1,161 (77.1%) |
| 35 to 44 Years | 294 (20.9%) | 1,118 (79.3%) |
| 45 to 54 Years | 110 (12.0%) | 787 (86.0%) |
| 55 to 64 Years | 419 (33.8%) | 857 (69.1%) |
| 65 to 74 Years | 991 (97.9%) | 501 (49.5%) |
| 75 Years and over | 712 (100.0%) | 452 (63.5%) |
| Total | 3,704 (37.1%) | 6,935 (69.5%) |
Disability Status by Sex by Age in Brentwood borough
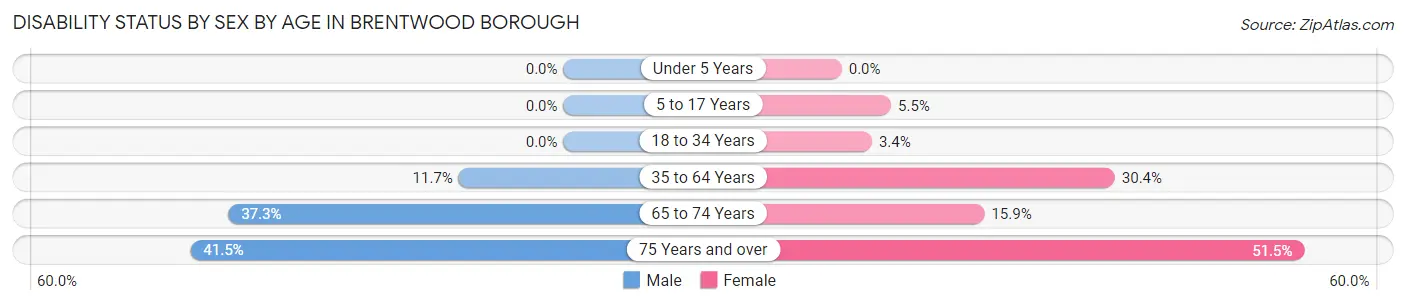
| Age Bracket | Male | Female |
| Under 5 Years | 0 (0.0%) | 0 (0.0%) |
| 5 to 17 Years | 0 (0.0%) | 47 (5.5%) |
| 18 to 34 Years | 0 (0.0%) | 44 (3.4%) |
| 35 to 64 Years | 199 (11.7%) | 565 (30.4%) |
| 65 to 74 Years | 178 (37.3%) | 85 (15.9%) |
| 75 Years and over | 157 (41.5%) | 172 (51.5%) |
Disability Class by Sex by Age in Brentwood borough
Disability Class: Hearing Difficulty
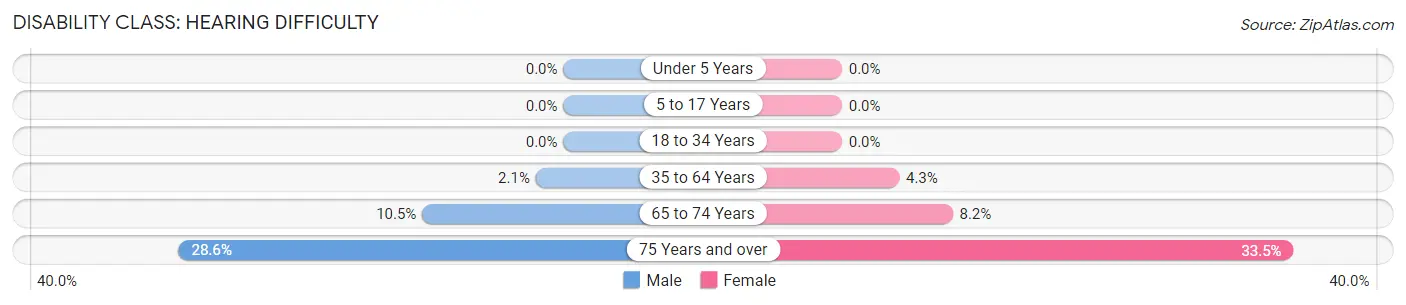
| Age Bracket | Male | Female |
| Under 5 Years | 0 (0.0%) | 0 (0.0%) |
| 5 to 17 Years | 0 (0.0%) | 0 (0.0%) |
| 18 to 34 Years | 0 (0.0%) | 0 (0.0%) |
| 35 to 64 Years | 35 (2.1%) | 79 (4.3%) |
| 65 to 74 Years | 50 (10.5%) | 44 (8.2%) |
| 75 Years and over | 108 (28.6%) | 112 (33.5%) |
Disability Class: Vision Difficulty
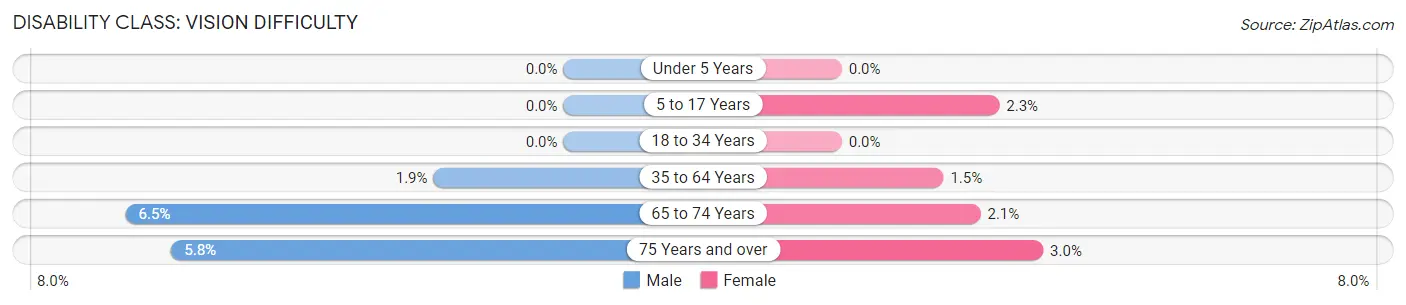
| Age Bracket | Male | Female |
| Under 5 Years | 0 (0.0%) | 0 (0.0%) |
| 5 to 17 Years | 0 (0.0%) | 20 (2.3%) |
| 18 to 34 Years | 0 (0.0%) | 0 (0.0%) |
| 35 to 64 Years | 33 (1.9%) | 28 (1.5%) |
| 65 to 74 Years | 31 (6.5%) | 11 (2.1%) |
| 75 Years and over | 22 (5.8%) | 10 (3.0%) |
Disability Class: Cognitive Difficulty
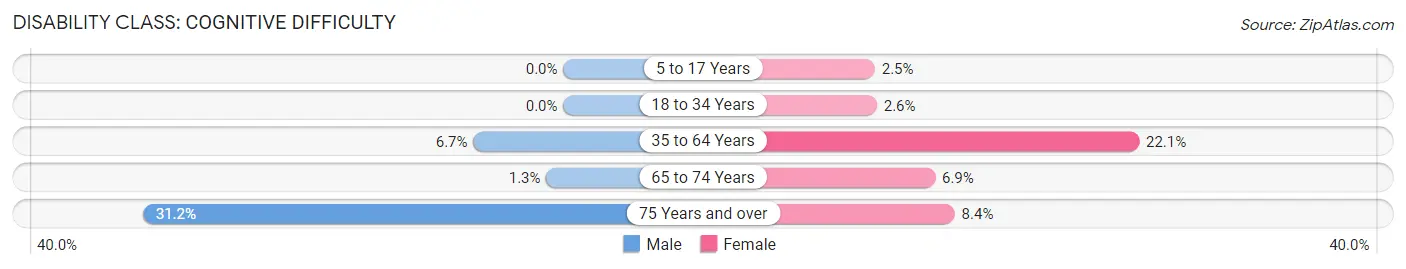
| Age Bracket | Male | Female |
| 5 to 17 Years | 0 (0.0%) | 21 (2.5%) |
| 18 to 34 Years | 0 (0.0%) | 34 (2.6%) |
| 35 to 64 Years | 114 (6.7%) | 410 (22.1%) |
| 65 to 74 Years | 6 (1.3%) | 37 (6.9%) |
| 75 Years and over | 118 (31.2%) | 28 (8.4%) |
Disability Class: Ambulatory Difficulty
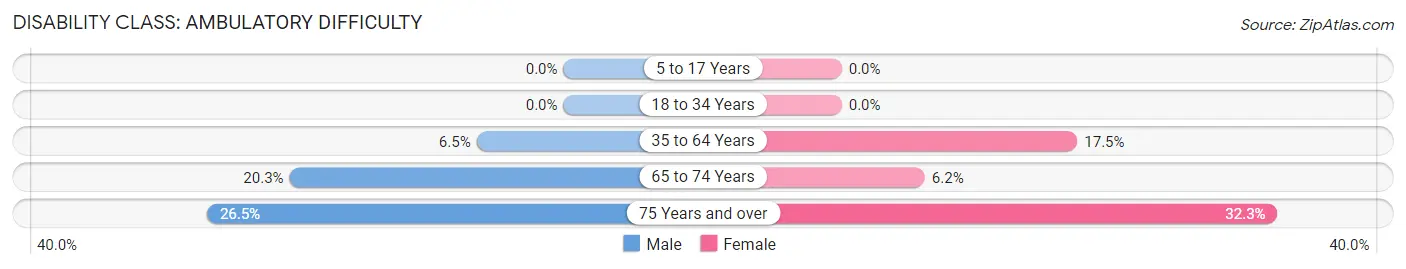
| Age Bracket | Male | Female |
| 5 to 17 Years | 0 (0.0%) | 0 (0.0%) |
| 18 to 34 Years | 0 (0.0%) | 0 (0.0%) |
| 35 to 64 Years | 110 (6.5%) | 325 (17.5%) |
| 65 to 74 Years | 97 (20.3%) | 33 (6.2%) |
| 75 Years and over | 100 (26.5%) | 108 (32.3%) |
Disability Class: Self-Care Difficulty
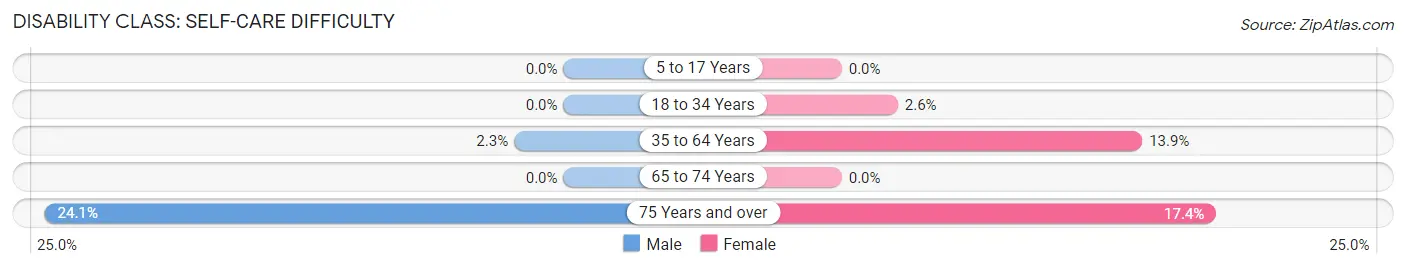
| Age Bracket | Male | Female |
| 5 to 17 Years | 0 (0.0%) | 0 (0.0%) |
| 18 to 34 Years | 0 (0.0%) | 34 (2.6%) |
| 35 to 64 Years | 39 (2.3%) | 259 (13.9%) |
| 65 to 74 Years | 0 (0.0%) | 0 (0.0%) |
| 75 Years and over | 91 (24.1%) | 58 (17.4%) |
Technology Access in Brentwood borough
Computing Device Access in Brentwood borough
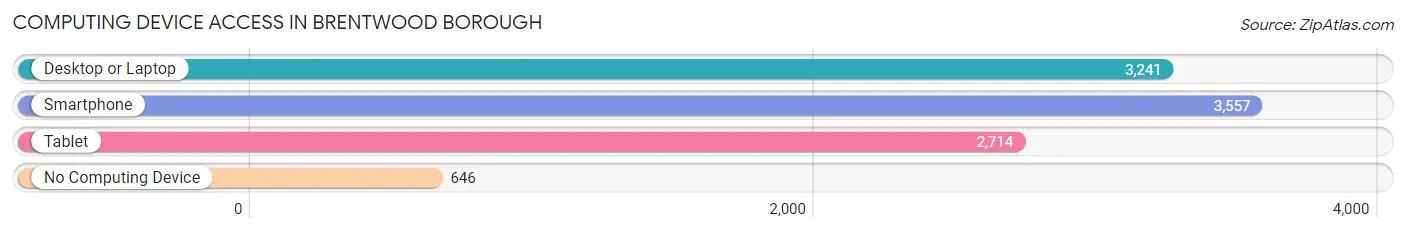
| Device Type | # Households | % Households |
| Desktop or Laptop | 3,241 | 70.1% |
| Smartphone | 3,557 | 77.0% |
| Tablet | 2,714 | 58.7% |
| No Computing Device | 646 | 14.0% |
| Total | 4,621 | 100.0% |
Internet Access in Brentwood borough
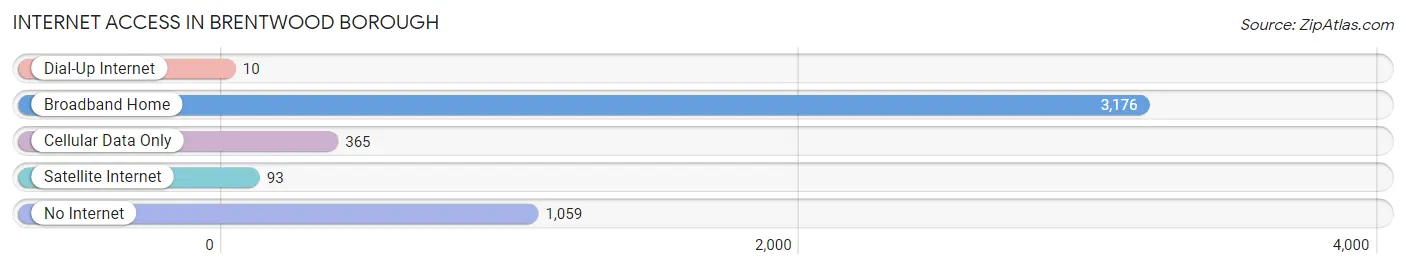
| Internet Type | # Households | % Households |
| Dial-Up Internet | 10 | 0.2% |
| Broadband Home | 3,176 | 68.7% |
| Cellular Data Only | 365 | 7.9% |
| Satellite Internet | 93 | 2.0% |
| No Internet | 1,059 | 22.9% |
| Total | 4,621 | 100.0% |
Brentwood borough Summary
Brentwood Borough is a small borough located in Allegheny County, Pennsylvania. It is situated in the South Hills of Pittsburgh, approximately 8 miles south of the city. The borough is bordered by Baldwin Township to the north, Whitehall Borough to the east, Baldwin Borough to the south, and Castle Shannon to the west. The population of Brentwood Borough was 8,717 at the 2010 census.
History
Brentwood Borough was founded in 1875 by a group of settlers from the nearby town of Brentwood, England. The settlers purchased the land from the local Native American tribes and named the area after their hometown. The first post office was established in 1876 and the borough was officially incorporated in 1877.
The borough was originally a farming community, but in the early 20th century, it began to develop into a residential suburb of Pittsburgh. The population of Brentwood Borough grew steadily throughout the 20th century, reaching 8,717 at the 2010 census.
Geography
Brentwood Borough is located at 40°22'45" North, 80°2'45" West (40.379167, -80.045278). It has a total area of 1.3 square miles, all of which is land. The borough is situated in the South Hills of Pittsburgh, approximately 8 miles south of the city. It is bordered by Baldwin Township to the north, Whitehall Borough to the east, Baldwin Borough to the south, and Castle Shannon to the west.
The borough is served by the Brentwood Borough School District, which consists of two elementary schools, one middle school, and one high school.
Economy
Brentwood Borough is primarily a residential community, but it does have a few businesses. The largest employer in the borough is the Brentwood Borough School District, which employs over 500 people. Other major employers include the Brentwood Borough Police Department, the Brentwood Borough Fire Department, and the Brentwood Borough Public Works Department.
The borough also has a few retail businesses, including a grocery store, a pharmacy, and a few restaurants.
Demographics
As of the 2010 census, the population of Brentwood Borough was 8,717. The racial makeup of the borough was 87.3% White, 8.2% African American, 0.3% Native American, 1.2% Asian, 0.1% Pacific Islander, 0.7% from other races, and 2.3% from two or more races. Hispanic or Latino of any race were 2.2% of the population.
The median income for a household in the borough was $50,945, and the median income for a family was $60,945. The per capita income for the borough was $25,945. About 4.3% of families and 5.7% of the population were below the poverty line, including 8.2% of those under age 18 and 4.2% of those age 65 or over.
Common Questions
What is Per Capita Income in Brentwood borough?
Per Capita income in Brentwood borough is $32,600.
What is the Median Family Income in Brentwood borough?
Median Family Income in Brentwood borough is $92,729.
What is the Median Household income in Brentwood borough?
Median Household Income in Brentwood borough is $57,900.
What is Income or Wage Gap in Brentwood borough?
Income or Wage Gap in Brentwood borough is 9.0%.
Women in Brentwood borough earn 91.0 cents for every dollar earned by a man.
What is Family Income Deficit in Brentwood borough?
Family Income Deficit in Brentwood borough is $21,536.
Families that are below poverty line in Brentwood borough earn $21,536 less on average than the poverty threshold level.
What is Inequality or Gini Index in Brentwood borough?
Inequality or Gini Index in Brentwood borough is 0.39.
What is the Total Population of Brentwood borough?
Total Population of Brentwood borough is 9,982.
What is the Total Male Population of Brentwood borough?
Total Male Population of Brentwood borough is 4,656.
What is the Total Female Population of Brentwood borough?
Total Female Population of Brentwood borough is 5,326.
What is the Ratio of Males per 100 Females in Brentwood borough?
There are 87.42 Males per 100 Females in Brentwood borough.
What is the Ratio of Females per 100 Males in Brentwood borough?
There are 114.39 Females per 100 Males in Brentwood borough.
What is the Median Population Age in Brentwood borough?
Median Population Age in Brentwood borough is 36.7 Years.
What is the Average Family Size in Brentwood borough
Average Family Size in Brentwood borough is 3.0 People.
What is the Average Household Size in Brentwood borough
Average Household Size in Brentwood borough is 2.2 People.
How Large is the Labor Force in Brentwood borough?
There are 5,361 People in the Labor Forcein in Brentwood borough.
What is the Percentage of People in the Labor Force in Brentwood borough?
66.8% of People are in the Labor Force in Brentwood borough.
What is the Unemployment Rate in Brentwood borough?
Unemployment Rate in Brentwood borough is 2.0%.