Old Forge borough, PA Map & Demographics
Old Forge borough Overview
$39,287
PER CAPITA INCOME
$103,116
AVG FAMILY INCOME
$71,615
AVG HOUSEHOLD INCOME
20.8%
WAGE / INCOME GAP [ % ]
79.2¢/ $1
WAGE / INCOME GAP [ $ ]
0.42
INEQUALITY / GINI INDEX
8,506
TOTAL POPULATION
4,175
MALE POPULATION
4,331
FEMALE POPULATION
96.40
MALES / 100 FEMALES
103.74
FEMALES / 100 MALES
47.2
MEDIAN AGE
3.0
AVG FAMILY SIZE
2.2
AVG HOUSEHOLD SIZE
4,704
LABOR FORCE [ PEOPLE ]
67.3%
PERCENT IN LABOR FORCE
5.5%
UNEMPLOYMENT RATE
Income in Old Forge borough
Income Overview in Old Forge borough
Per Capita Income in Old Forge borough is $39,287, while median incomes of families and households are $103,116 and $71,615 respectively.
| Characteristic | Number | Measure |
| Per Capita Income | 8,506 | $39,287 |
| Median Family Income | 2,102 | $103,116 |
| Mean Family Income | 2,102 | $115,338 |
| Median Household Income | 3,801 | $71,615 |
| Mean Household Income | 3,801 | $88,842 |
| Income Deficit | 2,102 | $0 |
| Wage / Income Gap (%) | 8,506 | 20.80% |
| Wage / Income Gap ($) | 8,506 | 79.20¢ per $1 |
| Gini / Inequality Index | 8,506 | 0.42 |
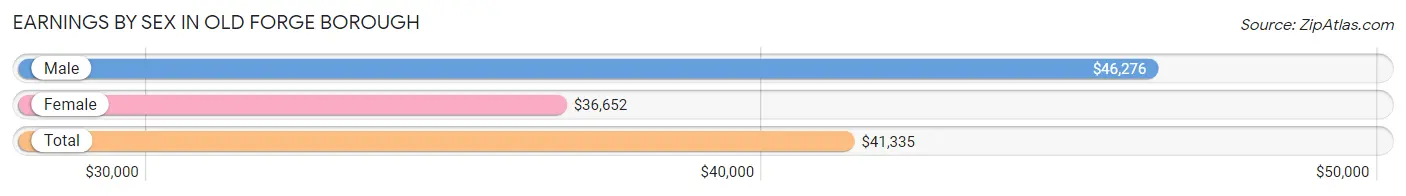
Earnings by Sex in Old Forge borough
Average Earnings in Old Forge borough are $41,335, $46,276 for men and $36,652 for women, a difference of 20.8%.
| Sex | Number | Average Earnings |
| Male | 2,438 (50.9%) | $46,276 |
| Female | 2,356 (49.1%) | $36,652 |
| Total | 4,794 (100.0%) | $41,335 |
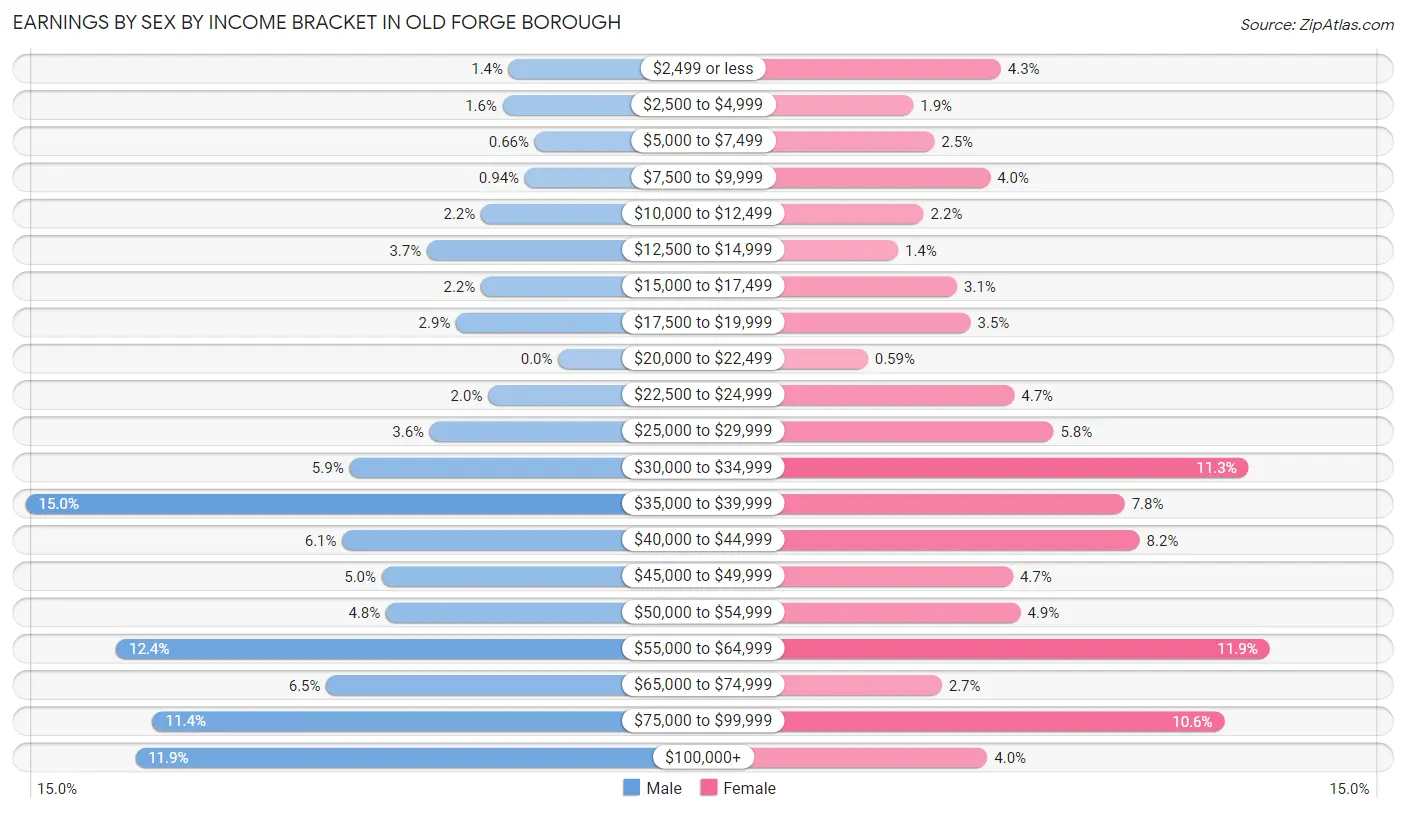
Earnings by Sex by Income Bracket in Old Forge borough
The most common earnings brackets in Old Forge borough are $35,000 to $39,999 for men (365 | 15.0%) and $55,000 to $64,999 for women (280 | 11.9%).
| Income | Male | Female |
| $2,499 or less | 34 (1.4%) | 102 (4.3%) |
| $2,500 to $4,999 | 38 (1.6%) | 44 (1.9%) |
| $5,000 to $7,499 | 16 (0.7%) | 58 (2.5%) |
| $7,500 to $9,999 | 23 (0.9%) | 95 (4.0%) |
| $10,000 to $12,499 | 53 (2.2%) | 51 (2.2%) |
| $12,500 to $14,999 | 90 (3.7%) | 34 (1.4%) |
| $15,000 to $17,499 | 53 (2.2%) | 73 (3.1%) |
| $17,500 to $19,999 | 70 (2.9%) | 82 (3.5%) |
| $20,000 to $22,499 | 0 (0.0%) | 14 (0.6%) |
| $22,500 to $24,999 | 48 (2.0%) | 111 (4.7%) |
| $25,000 to $29,999 | 88 (3.6%) | 137 (5.8%) |
| $30,000 to $34,999 | 143 (5.9%) | 266 (11.3%) |
| $35,000 to $39,999 | 365 (15.0%) | 184 (7.8%) |
| $40,000 to $44,999 | 148 (6.1%) | 194 (8.2%) |
| $45,000 to $49,999 | 121 (5.0%) | 110 (4.7%) |
| $50,000 to $54,999 | 118 (4.8%) | 115 (4.9%) |
| $55,000 to $64,999 | 303 (12.4%) | 280 (11.9%) |
| $65,000 to $74,999 | 159 (6.5%) | 63 (2.7%) |
| $75,000 to $99,999 | 278 (11.4%) | 250 (10.6%) |
| $100,000+ | 290 (11.9%) | 93 (4.0%) |
| Total | 2,438 (100.0%) | 2,356 (100.0%) |
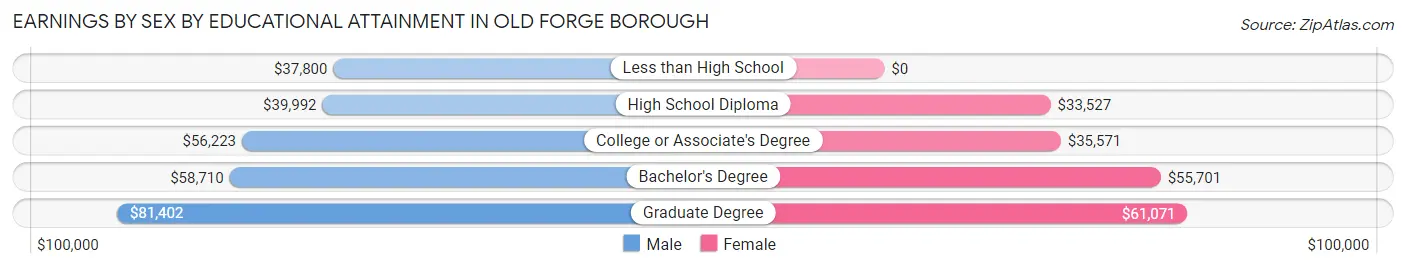
Earnings by Sex by Educational Attainment in Old Forge borough
Average earnings in Old Forge borough are $47,334 for men and $39,063 for women, a difference of 17.5%. Men with an educational attainment of graduate degree enjoy the highest average annual earnings of $81,402, while those with less than high school education earn the least with $37,800. Women with an educational attainment of graduate degree earn the most with the average annual earnings of $61,071, while those with high school diploma education have the smallest earnings of $33,527.
| Educational Attainment | Male Income | Female Income |
| Less than High School | $37,800 | $0 |
| High School Diploma | $39,992 | $33,527 |
| College or Associate's Degree | $56,223 | $35,571 |
| Bachelor's Degree | $58,710 | $55,701 |
| Graduate Degree | $81,402 | $61,071 |
| Total | $47,334 | $39,063 |
Family Income in Old Forge borough
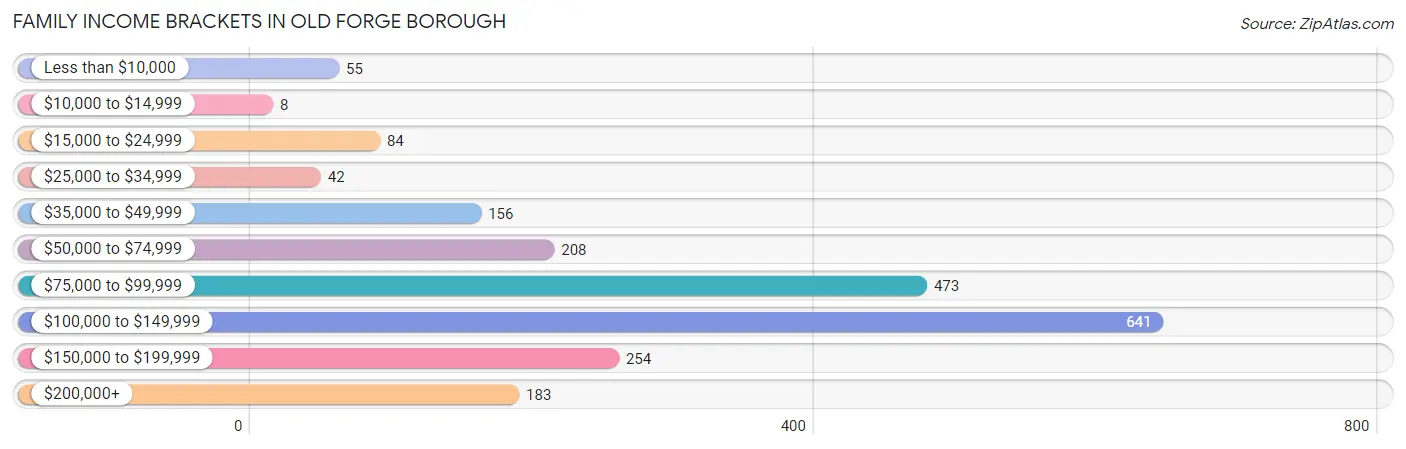
Family Income Brackets in Old Forge borough
According to the Old Forge borough family income data, there are 641 families falling into the $100,000 to $149,999 income range, which is the most common income bracket and makes up 30.5% of all families. Conversely, the $10,000 to $14,999 income bracket is the least frequent group with only 8 families (0.4%) belonging to this category.
| Income Bracket | # Families | % Families |
| Less than $10,000 | 55 | 2.6% |
| $10,000 to $14,999 | 8 | 0.4% |
| $15,000 to $24,999 | 84 | 4.0% |
| $25,000 to $34,999 | 42 | 2.0% |
| $35,000 to $49,999 | 156 | 7.4% |
| $50,000 to $74,999 | 208 | 9.9% |
| $75,000 to $99,999 | 473 | 22.5% |
| $100,000 to $149,999 | 641 | 30.5% |
| $150,000 to $199,999 | 254 | 12.1% |
| $200,000+ | 183 | 8.7% |
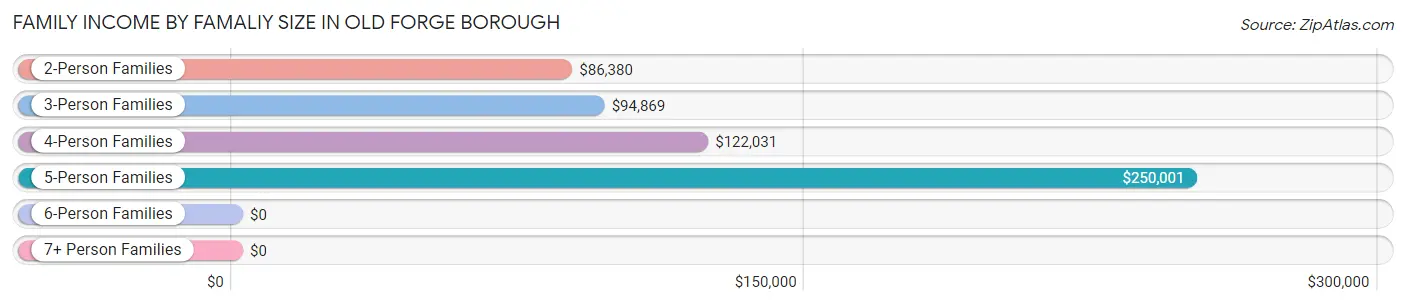
Family Income by Famaliy Size in Old Forge borough
5-person families (72 | 3.4%) account for the highest median family income in Old Forge borough with $250,001 per family, while 5-person families (72 | 3.4%) have the highest median income of $50,000 per family member.
| Income Bracket | # Families | Median Income |
| 2-Person Families | 1,013 (48.2%) | $86,380 |
| 3-Person Families | 557 (26.5%) | $94,869 |
| 4-Person Families | 320 (15.2%) | $122,031 |
| 5-Person Families | 72 (3.4%) | $250,001 |
| 6-Person Families | 24 (1.1%) | $0 |
| 7+ Person Families | 116 (5.5%) | $0 |
| Total | 2,102 (100.0%) | $103,116 |
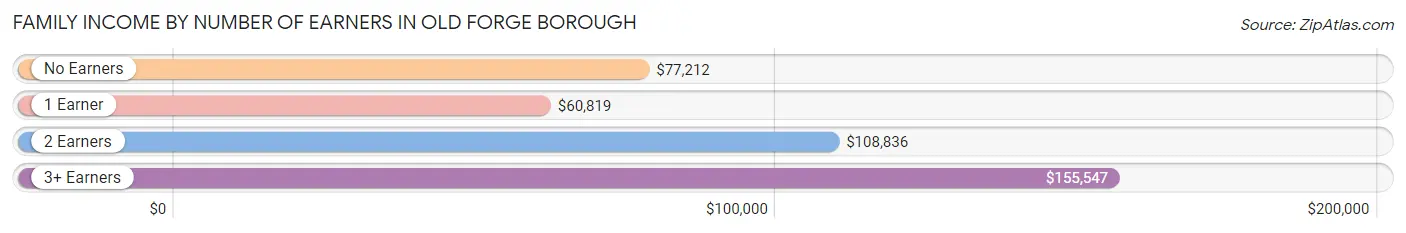
Family Income by Number of Earners in Old Forge borough
The median family income in Old Forge borough is $103,116, with families comprising 3+ earners (399) having the highest median family income of $155,547, while families with 1 earner (451) have the lowest median family income of $60,819, accounting for 19.0% and 21.5% of families, respectively.
| Number of Earners | # Families | Median Income |
| No Earners | 363 (17.3%) | $77,212 |
| 1 Earner | 451 (21.5%) | $60,819 |
| 2 Earners | 889 (42.3%) | $108,836 |
| 3+ Earners | 399 (19.0%) | $155,547 |
| Total | 2,102 (100.0%) | $103,116 |
Household Income in Old Forge borough
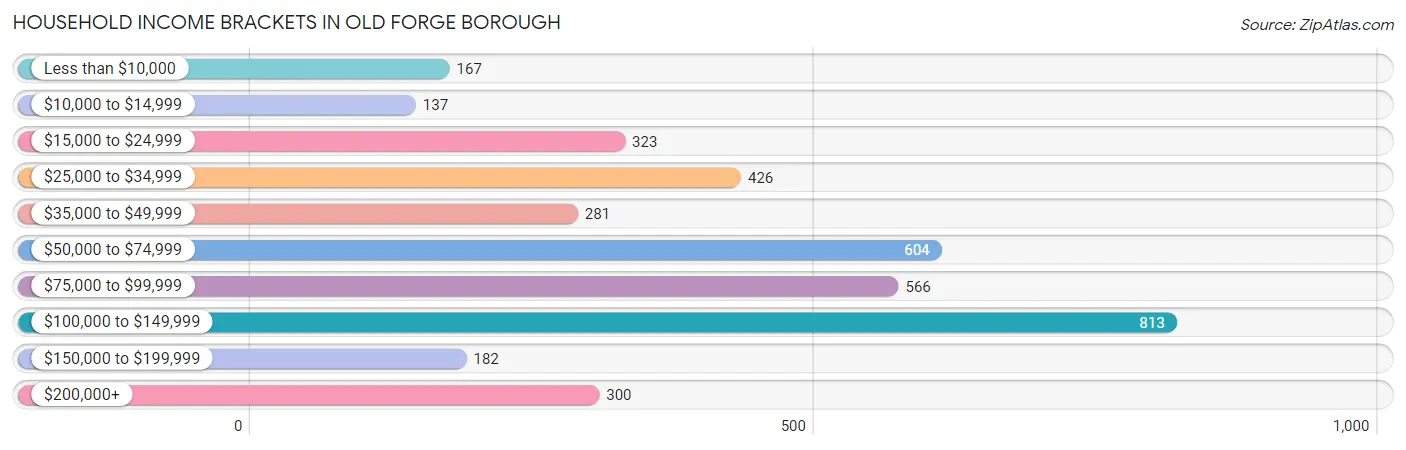
Household Income Brackets in Old Forge borough
With 813 households falling in the category, the $100,000 to $149,999 income range is the most frequent in Old Forge borough, accounting for 21.4% of all households. In contrast, only 137 households (3.6%) fall into the $10,000 to $14,999 income bracket, making it the least populous group.
| Income Bracket | # Households | % Households |
| Less than $10,000 | 167 | 4.4% |
| $10,000 to $14,999 | 137 | 3.6% |
| $15,000 to $24,999 | 323 | 8.5% |
| $25,000 to $34,999 | 426 | 11.2% |
| $35,000 to $49,999 | 281 | 7.4% |
| $50,000 to $74,999 | 604 | 15.9% |
| $75,000 to $99,999 | 566 | 14.9% |
| $100,000 to $149,999 | 813 | 21.4% |
| $150,000 to $199,999 | 182 | 4.8% |
| $200,000+ | 300 | 7.9% |
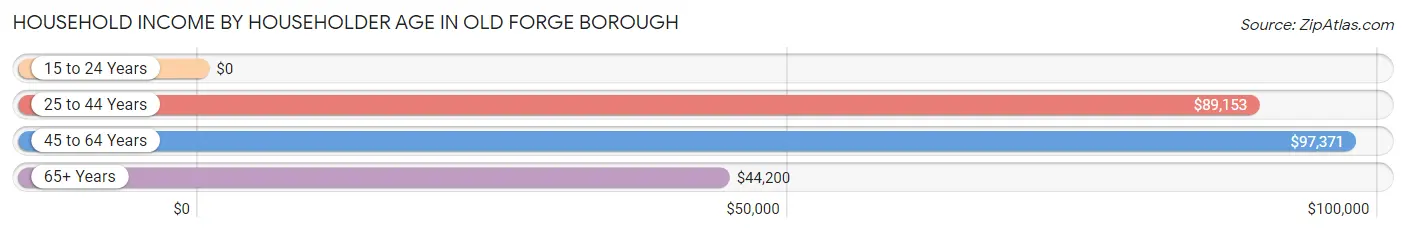
Household Income by Householder Age in Old Forge borough
The median household income in Old Forge borough is $71,615, with the highest median household income of $97,371 found in the 45 to 64 years age bracket for the primary householder. A total of 1,413 households (37.2%) fall into this category. Meanwhile, the 15 to 24 years age bracket for the primary householder has the lowest median household income of $0, with 15 households (0.4%) in this group.
| Income Bracket | # Households | Median Income |
| 15 to 24 Years | 15 (0.4%) | $0 |
| 25 to 44 Years | 933 (24.5%) | $89,153 |
| 45 to 64 Years | 1,413 (37.2%) | $97,371 |
| 65+ Years | 1,440 (37.9%) | $44,200 |
| Total | 3,801 (100.0%) | $71,615 |
Poverty in Old Forge borough
Income Below Poverty by Sex and Age in Old Forge borough
With 5.0% poverty level for males and 9.5% for females among the residents of Old Forge borough, 45 to 54 year old males and under 5 year old females are the most vulnerable to poverty, with 56 males (9.8%) and 113 females (36.7%) in their respective age groups living below the poverty level.
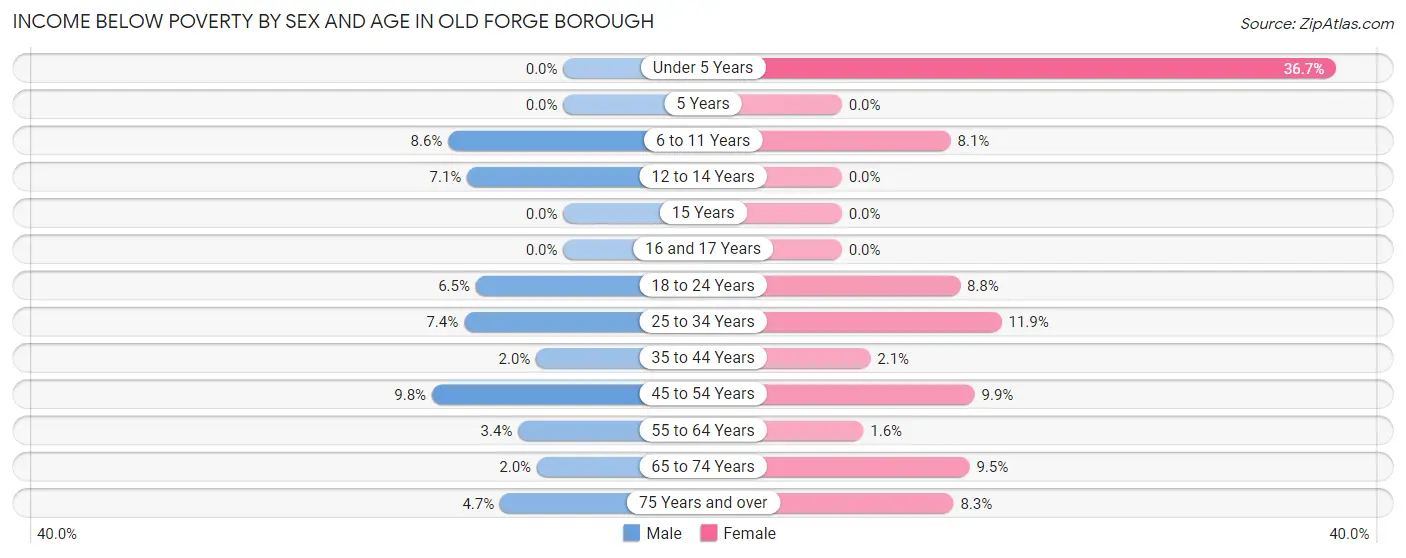
| Age Bracket | Male | Female |
| Under 5 Years | 0 (0.0%) | 113 (36.7%) |
| 5 Years | 0 (0.0%) | 0 (0.0%) |
| 6 to 11 Years | 23 (8.6%) | 16 (8.1%) |
| 12 to 14 Years | 10 (7.1%) | 0 (0.0%) |
| 15 Years | 0 (0.0%) | 0 (0.0%) |
| 16 and 17 Years | 0 (0.0%) | 0 (0.0%) |
| 18 to 24 Years | 8 (6.5%) | 13 (8.8%) |
| 25 to 34 Years | 51 (7.4%) | 102 (11.9%) |
| 35 to 44 Years | 8 (2.0%) | 8 (2.1%) |
| 45 to 54 Years | 56 (9.8%) | 56 (9.9%) |
| 55 to 64 Years | 25 (3.4%) | 10 (1.6%) |
| 65 to 74 Years | 8 (2.0%) | 58 (9.5%) |
| 75 Years and over | 19 (4.7%) | 36 (8.3%) |
| Total | 208 (5.0%) | 412 (9.5%) |
Income Above Poverty by Sex and Age in Old Forge borough
According to the poverty statistics in Old Forge borough, males aged under 5 years and females aged 5 years are the age groups that are most secure financially, with 100.0% of males and 100.0% of females in these age groups living above the poverty line.
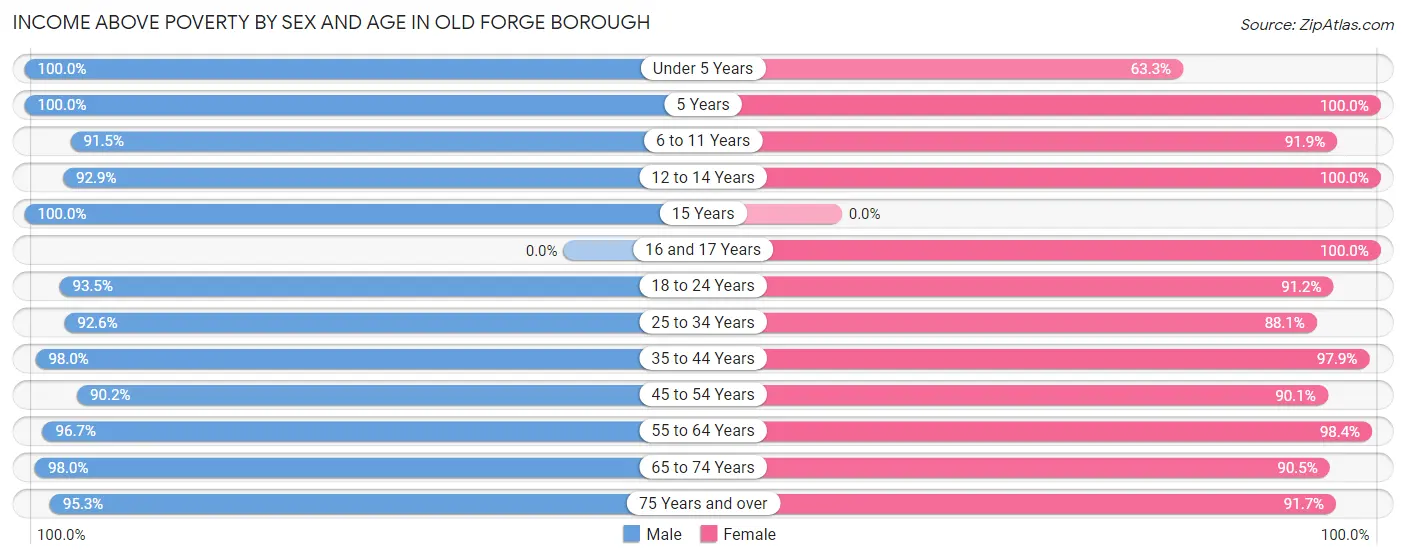
| Age Bracket | Male | Female |
| Under 5 Years | 317 (100.0%) | 195 (63.3%) |
| 5 Years | 50 (100.0%) | 101 (100.0%) |
| 6 to 11 Years | 246 (91.4%) | 182 (91.9%) |
| 12 to 14 Years | 130 (92.9%) | 79 (100.0%) |
| 15 Years | 42 (100.0%) | 0 (0.0%) |
| 16 and 17 Years | 0 (0.0%) | 20 (100.0%) |
| 18 to 24 Years | 115 (93.5%) | 135 (91.2%) |
| 25 to 34 Years | 641 (92.6%) | 758 (88.1%) |
| 35 to 44 Years | 389 (98.0%) | 370 (97.9%) |
| 45 to 54 Years | 518 (90.2%) | 512 (90.1%) |
| 55 to 64 Years | 721 (96.7%) | 615 (98.4%) |
| 65 to 74 Years | 400 (98.0%) | 554 (90.5%) |
| 75 Years and over | 385 (95.3%) | 398 (91.7%) |
| Total | 3,954 (95.0%) | 3,919 (90.5%) |
Income Below Poverty Among Married-Couple Families in Old Forge borough
The poverty statistics for married-couple families in Old Forge borough show that 0.5% or 8 of the total 1,516 families live below the poverty line. Families with no children have the highest poverty rate of 0.7%, comprising of 8 families. On the other hand, families with 1 or 2 children have the lowest poverty rate of 0.0%, which includes 0 families.
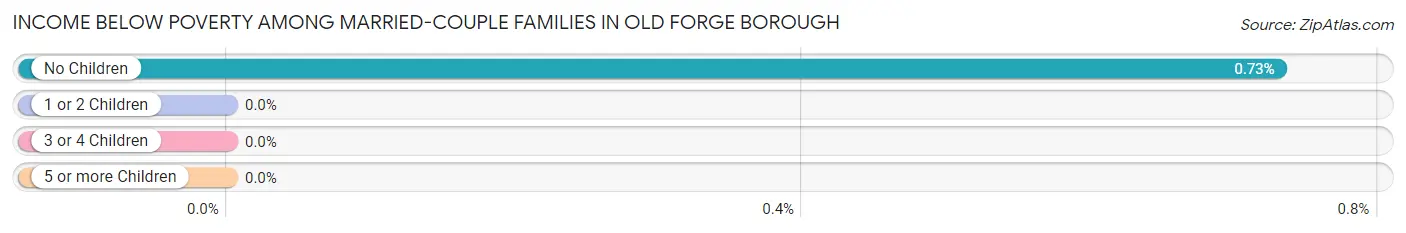
| Children | Above Poverty | Below Poverty |
| No Children | 1,094 (99.3%) | 8 (0.7%) |
| 1 or 2 Children | 385 (100.0%) | 0 (0.0%) |
| 3 or 4 Children | 17 (100.0%) | 0 (0.0%) |
| 5 or more Children | 12 (100.0%) | 0 (0.0%) |
| Total | 1,508 (99.5%) | 8 (0.5%) |
Income Below Poverty Among Single-Parent Households in Old Forge borough
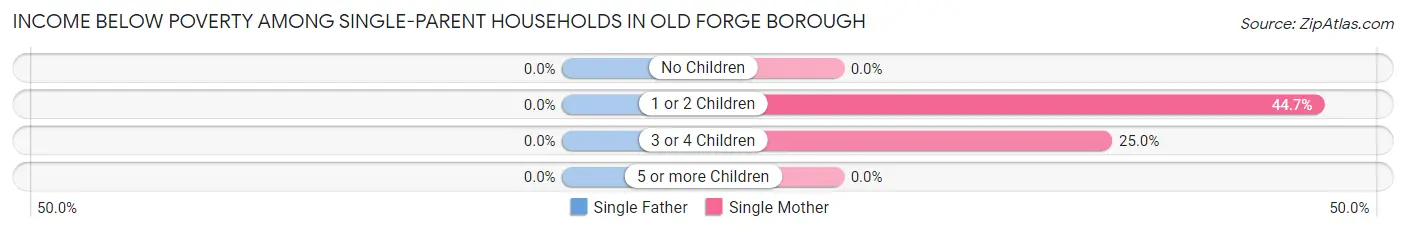
| Children | Single Father | Single Mother |
| No Children | 0 (0.0%) | 0 (0.0%) |
| 1 or 2 Children | 0 (0.0%) | 85 (44.7%) |
| 3 or 4 Children | 0 (0.0%) | 5 (25.0%) |
| 5 or more Children | 0 (0.0%) | 0 (0.0%) |
| Total | 0 (0.0%) | 90 (23.9%) |
Income Below Poverty Among Married-Couple vs Single-Parent Households in Old Forge borough
The poverty data for Old Forge borough shows that 8 of the married-couple family households (0.5%) and 90 of the single-parent households (15.4%) are living below the poverty level. Within the married-couple family households, those with no children have the highest poverty rate, with 8 households (0.7%) falling below the poverty line. Among the single-parent households, those with 1 or 2 children have the highest poverty rate, with 85 household (37.0%) living below poverty.
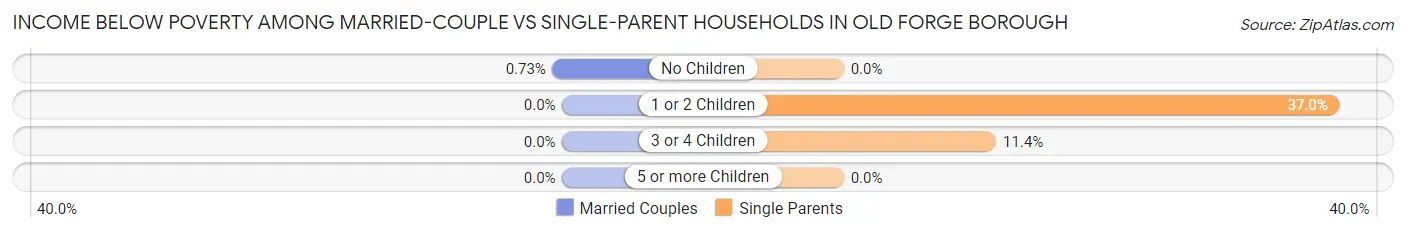
| Children | Married-Couple Families | Single-Parent Households |
| No Children | 8 (0.7%) | 0 (0.0%) |
| 1 or 2 Children | 0 (0.0%) | 85 (37.0%) |
| 3 or 4 Children | 0 (0.0%) | 5 (11.4%) |
| 5 or more Children | 0 (0.0%) | 0 (0.0%) |
| Total | 8 (0.5%) | 90 (15.4%) |
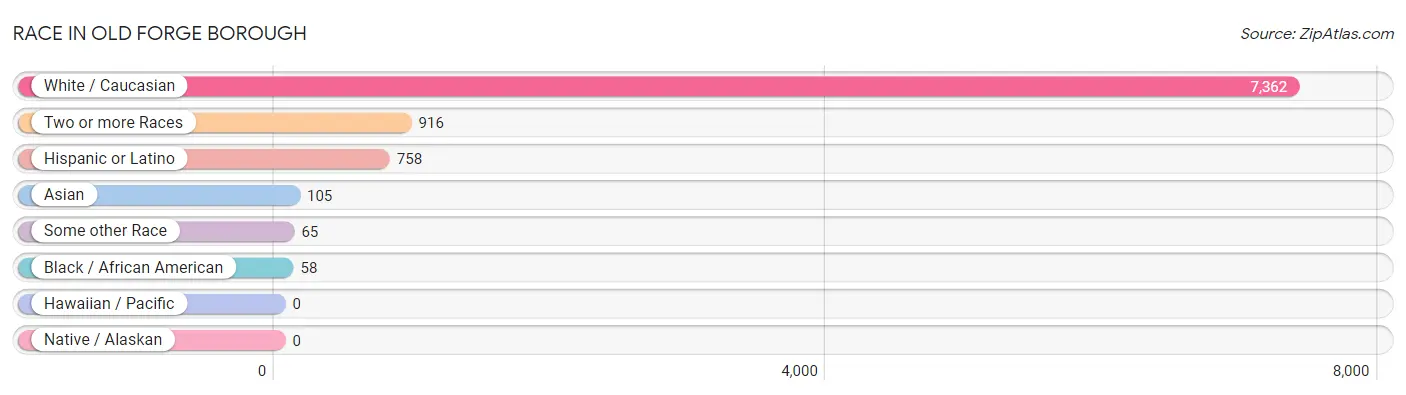
Race in Old Forge borough
The most populous races in Old Forge borough are White / Caucasian (7,362 | 86.6%), Two or more Races (916 | 10.8%), and Hispanic or Latino (758 | 8.9%).
| Race | # Population | % Population |
| Asian | 105 | 1.2% |
| Black / African American | 58 | 0.7% |
| Hawaiian / Pacific | 0 | 0.0% |
| Hispanic or Latino | 758 | 8.9% |
| Native / Alaskan | 0 | 0.0% |
| White / Caucasian | 7,362 | 86.6% |
| Two or more Races | 916 | 10.8% |
| Some other Race | 65 | 0.8% |
| Total | 8,506 | 100.0% |
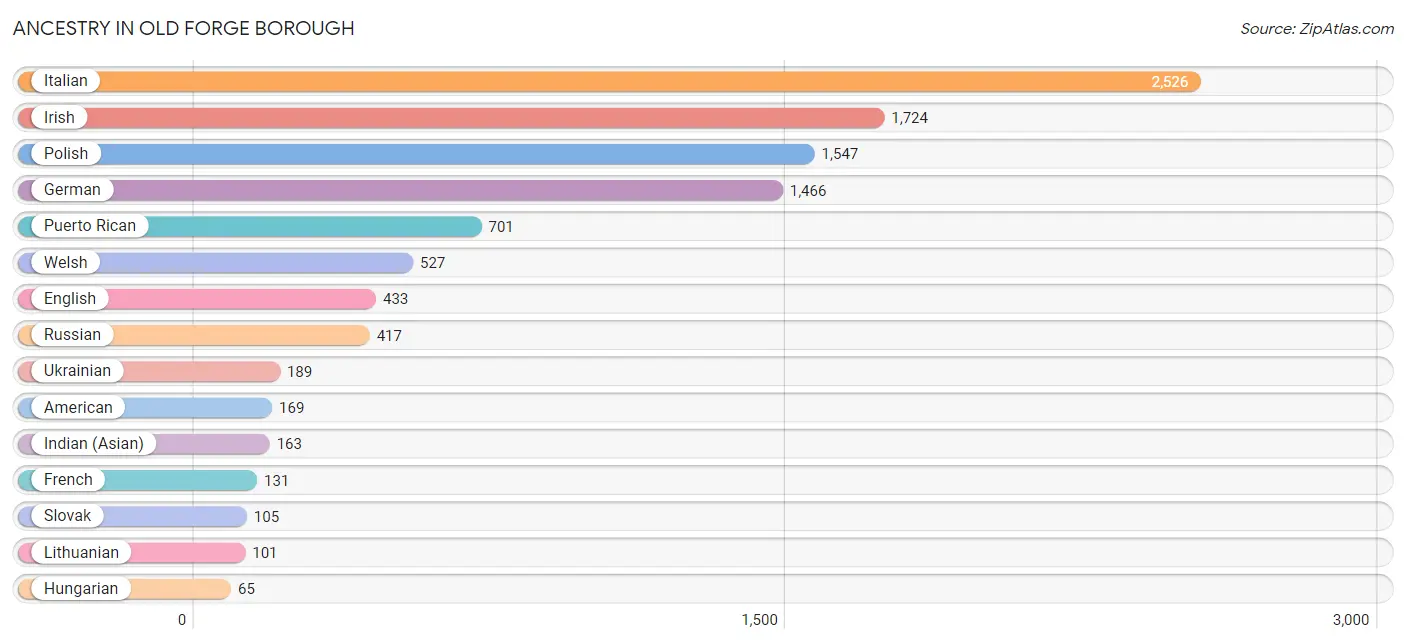
Ancestry in Old Forge borough
The most populous ancestries reported in Old Forge borough are Italian (2,526 | 29.7%), Irish (1,724 | 20.3%), Polish (1,547 | 18.2%), German (1,466 | 17.2%), and Puerto Rican (701 | 8.2%), together accounting for 93.6% of all Old Forge borough residents.
| Ancestry | # Population | % Population |
| American | 169 | 2.0% |
| Arab | 23 | 0.3% |
| Austrian | 21 | 0.3% |
| Bhutanese | 9 | 0.1% |
| Canadian | 1 | 0.0% |
| Czech | 44 | 0.5% |
| Dominican | 21 | 0.3% |
| Dutch | 43 | 0.5% |
| Eastern European | 49 | 0.6% |
| English | 433 | 5.1% |
| European | 28 | 0.3% |
| French | 131 | 1.5% |
| German | 1,466 | 17.2% |
| Hungarian | 65 | 0.8% |
| Indian (Asian) | 163 | 1.9% |
| Irish | 1,724 | 20.3% |
| Italian | 2,526 | 29.7% |
| Japanese | 14 | 0.2% |
| Lebanese | 23 | 0.3% |
| Lithuanian | 101 | 1.2% |
| Macedonian | 22 | 0.3% |
| Malaysian | 24 | 0.3% |
| Mexican | 6 | 0.1% |
| Native Hawaiian | 10 | 0.1% |
| Norwegian | 19 | 0.2% |
| Pennsylvania German | 36 | 0.4% |
| Polish | 1,547 | 18.2% |
| Portuguese | 21 | 0.3% |
| Potawatomi | 9 | 0.1% |
| Puerto Rican | 701 | 8.2% |
| Russian | 417 | 4.9% |
| Scotch-Irish | 8 | 0.1% |
| Scottish | 55 | 0.6% |
| Slavic | 37 | 0.4% |
| Slovak | 105 | 1.2% |
| South American | 30 | 0.4% |
| Swedish | 7 | 0.1% |
| Thai | 35 | 0.4% |
| Ukrainian | 189 | 2.2% |
| Uruguayan | 30 | 0.4% |
| Welsh | 527 | 6.2% | View All 41 Rows |
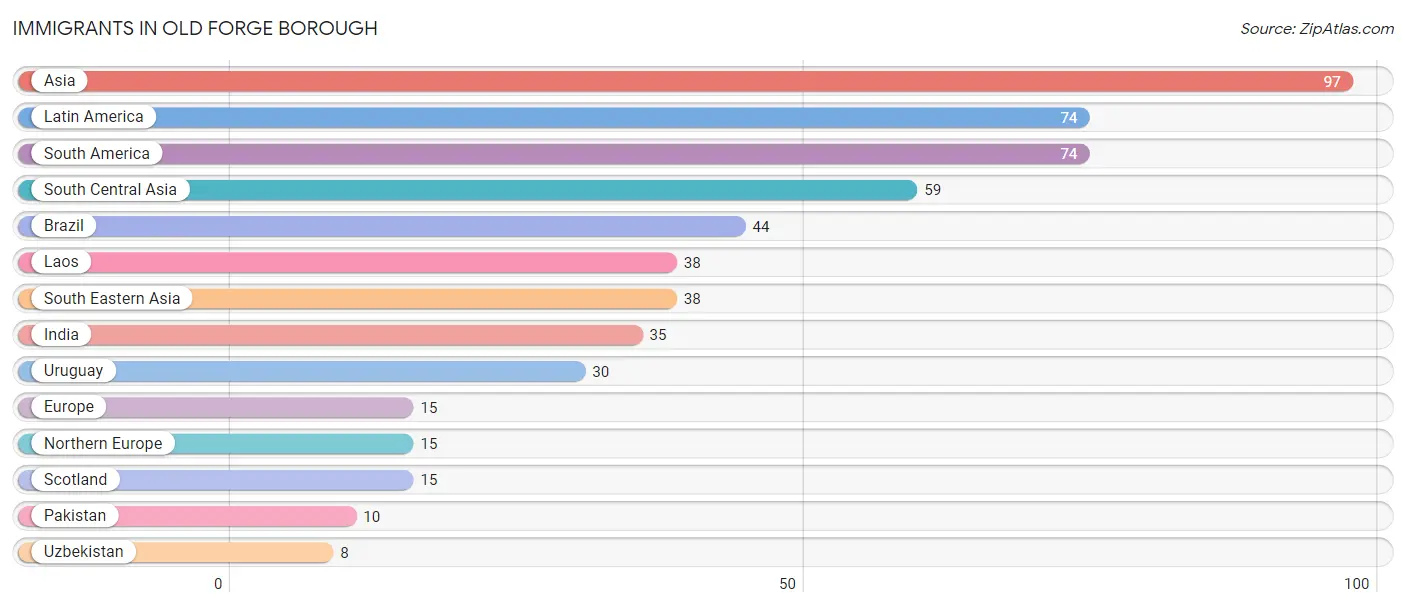
Immigrants in Old Forge borough
The most numerous immigrant groups reported in Old Forge borough came from Asia (97 | 1.1%), Latin America (74 | 0.9%), South America (74 | 0.9%), South Central Asia (59 | 0.7%), and Brazil (44 | 0.5%), together accounting for 4.1% of all Old Forge borough residents.
| Immigration Origin | # Population | % Population |
| Asia | 97 | 1.1% |
| Brazil | 44 | 0.5% |
| Europe | 15 | 0.2% |
| India | 35 | 0.4% |
| Laos | 38 | 0.4% |
| Latin America | 74 | 0.9% |
| Northern Europe | 15 | 0.2% |
| Pakistan | 10 | 0.1% |
| Scotland | 15 | 0.2% |
| South America | 74 | 0.9% |
| South Central Asia | 59 | 0.7% |
| South Eastern Asia | 38 | 0.4% |
| Uruguay | 30 | 0.4% |
| Uzbekistan | 8 | 0.1% | View All 14 Rows |
Sex and Age in Old Forge borough
Sex and Age in Old Forge borough
The most populous age groups in Old Forge borough are 25 to 29 Years (491 | 11.8%) for men and 25 to 29 Years (574 | 13.3%) for women.
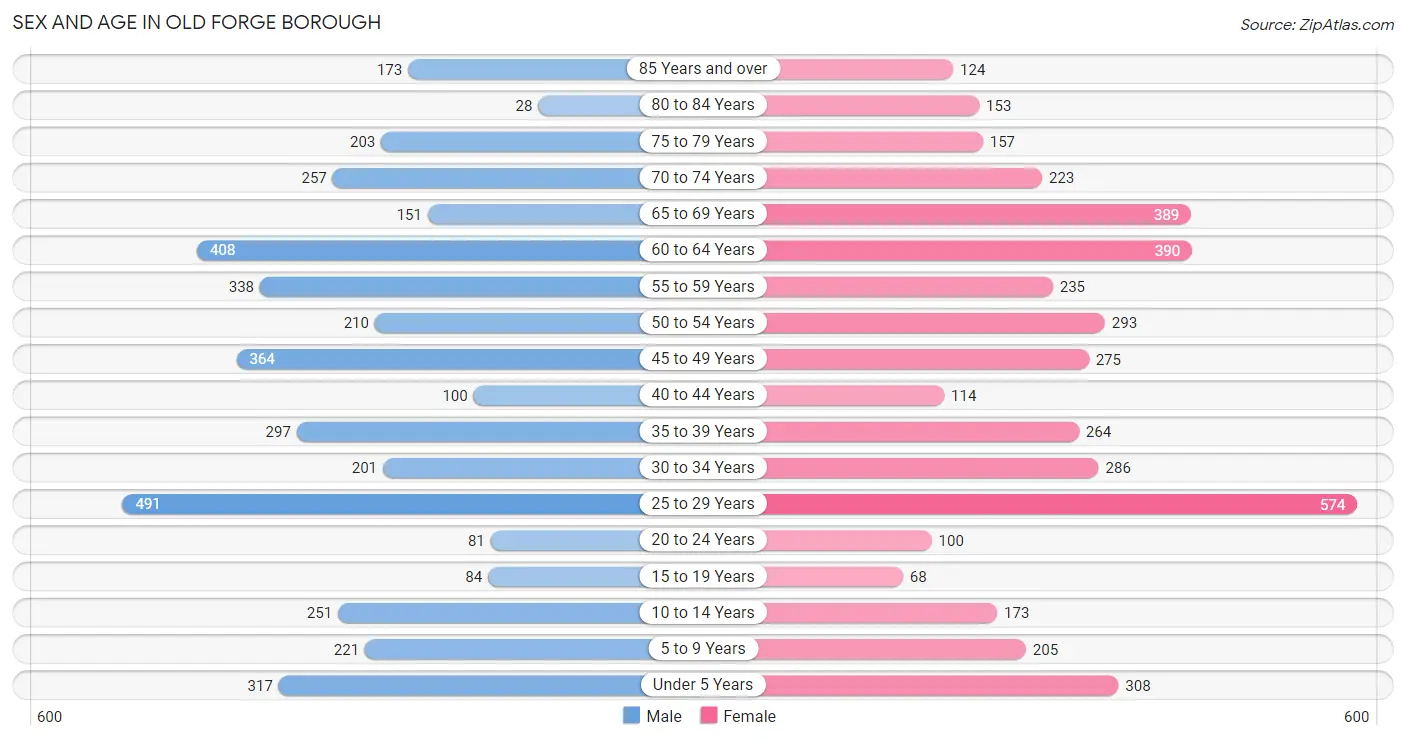
| Age Bracket | Male | Female |
| Under 5 Years | 317 (7.6%) | 308 (7.1%) |
| 5 to 9 Years | 221 (5.3%) | 205 (4.7%) |
| 10 to 14 Years | 251 (6.0%) | 173 (4.0%) |
| 15 to 19 Years | 84 (2.0%) | 68 (1.6%) |
| 20 to 24 Years | 81 (1.9%) | 100 (2.3%) |
| 25 to 29 Years | 491 (11.8%) | 574 (13.3%) |
| 30 to 34 Years | 201 (4.8%) | 286 (6.6%) |
| 35 to 39 Years | 297 (7.1%) | 264 (6.1%) |
| 40 to 44 Years | 100 (2.4%) | 114 (2.6%) |
| 45 to 49 Years | 364 (8.7%) | 275 (6.4%) |
| 50 to 54 Years | 210 (5.0%) | 293 (6.8%) |
| 55 to 59 Years | 338 (8.1%) | 235 (5.4%) |
| 60 to 64 Years | 408 (9.8%) | 390 (9.0%) |
| 65 to 69 Years | 151 (3.6%) | 389 (9.0%) |
| 70 to 74 Years | 257 (6.2%) | 223 (5.1%) |
| 75 to 79 Years | 203 (4.9%) | 157 (3.6%) |
| 80 to 84 Years | 28 (0.7%) | 153 (3.5%) |
| 85 Years and over | 173 (4.1%) | 124 (2.9%) |
| Total | 4,175 (100.0%) | 4,331 (100.0%) |
Families and Households in Old Forge borough
Median Family Size in Old Forge borough
The median family size in Old Forge borough is 3.05 persons per family, with single male/father families (210 | 10.0%) accounting for the largest median family size of 4.98 persons per family. On the other hand, single female/mother families (376 | 17.9%) represent the smallest median family size with 2.77 persons per family.
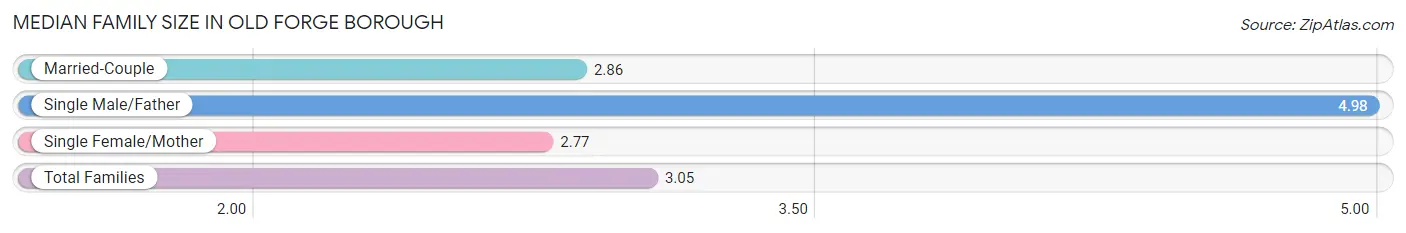
| Family Type | # Families | Family Size |
| Married-Couple | 1,516 (72.1%) | 2.86 |
| Single Male/Father | 210 (10.0%) | 4.98 |
| Single Female/Mother | 376 (17.9%) | 2.77 |
| Total Families | 2,102 (100.0%) | 3.05 |
Median Household Size in Old Forge borough
The median household size in Old Forge borough is 2.24 persons per household, with single male/father households (210 | 5.5%) accounting for the largest median household size of 5.43 persons per household. non-family households (1,699 | 44.7%) represent the smallest median household size with 1.13 persons per household.
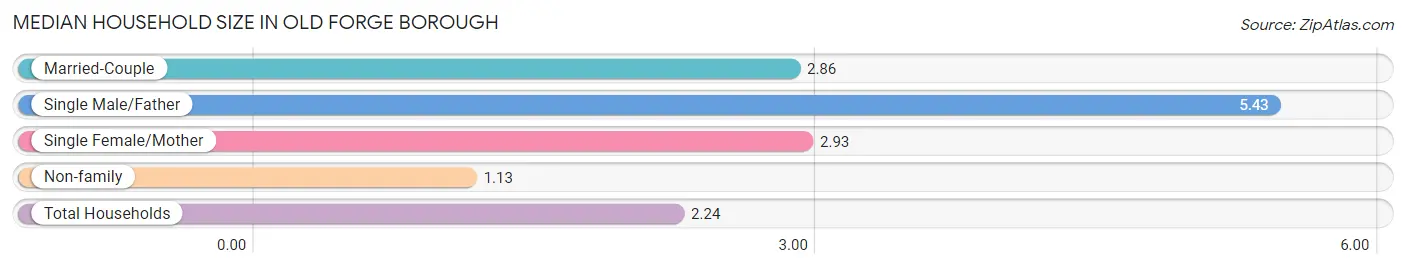
| Household Type | # Households | Household Size |
| Married-Couple | 1,516 (39.9%) | 2.86 |
| Single Male/Father | 210 (5.5%) | 5.43 |
| Single Female/Mother | 376 (9.9%) | 2.93 |
| Non-family | 1,699 (44.7%) | 1.13 |
| Total Households | 3,801 (100.0%) | 2.24 |
Household Size by Marriage Status in Old Forge borough
Out of a total of 3,801 households in Old Forge borough, 2,102 (55.3%) are family households, while 1,699 (44.7%) are nonfamily households. The most numerous type of family households are 2-person households, comprising 1,001, and the most common type of nonfamily households are 1-person households, comprising 1,469.
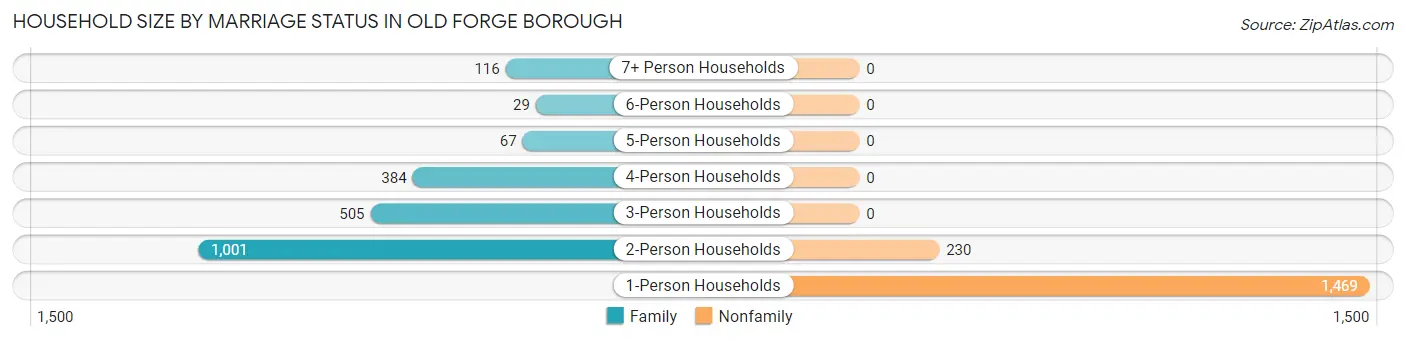
| Household Size | Family Households | Nonfamily Households |
| 1-Person Households | - | 1,469 (38.7%) |
| 2-Person Households | 1,001 (26.3%) | 230 (6.0%) |
| 3-Person Households | 505 (13.3%) | 0 (0.0%) |
| 4-Person Households | 384 (10.1%) | 0 (0.0%) |
| 5-Person Households | 67 (1.8%) | 0 (0.0%) |
| 6-Person Households | 29 (0.8%) | 0 (0.0%) |
| 7+ Person Households | 116 (3.0%) | 0 (0.0%) |
| Total | 2,102 (55.3%) | 1,699 (44.7%) |
Female Fertility in Old Forge borough
Fertility by Age in Old Forge borough
Average fertility rate in Old Forge borough is 67.0 births per 1,000 women. Women in the age bracket of 20 to 34 years have the highest fertility rate with 85.0 births per 1,000 women. Women in the age bracket of 20 to 34 years acount for 72.6% of all women with births.
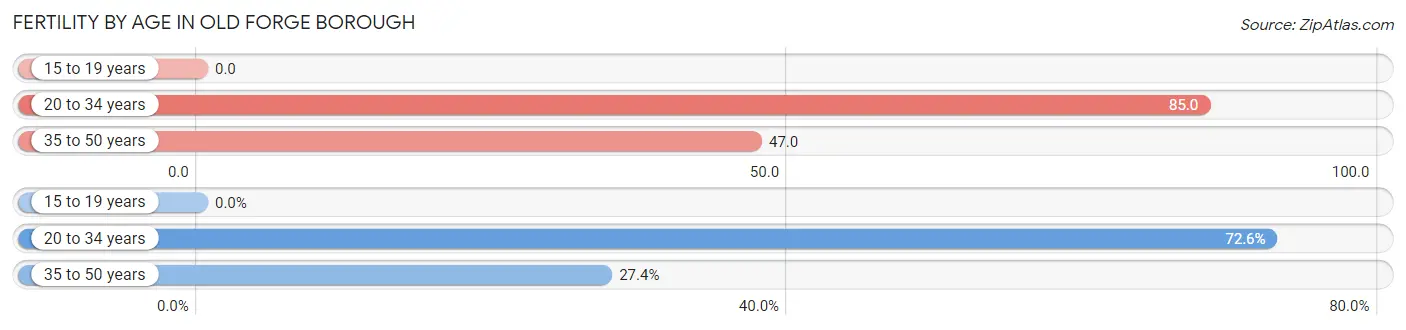
| Age Bracket | Women with Births | Births / 1,000 Women |
| 15 to 19 years | 0 (0.0%) | 0.0 |
| 20 to 34 years | 82 (72.6%) | 85.0 |
| 35 to 50 years | 31 (27.4%) | 47.0 |
| Total | 113 (100.0%) | 67.0 |
Fertility by Age by Marriage Status in Old Forge borough
51.3% of women with births (113) in Old Forge borough are married. The highest percentage of unmarried women with births falls into 20 to 34 years age bracket with 51.2% of them unmarried at the time of birth, while the lowest percentage of unmarried women with births belong to 35 to 50 years age bracket with 41.9% of them unmarried.
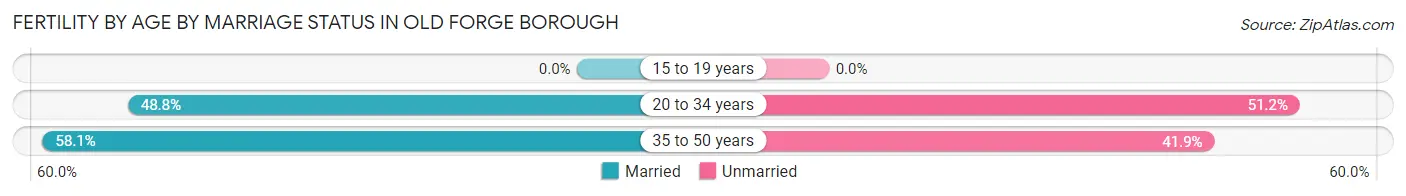
| Age Bracket | Married | Unmarried |
| 15 to 19 years | 0 (0.0%) | 0 (0.0%) |
| 20 to 34 years | 40 (48.8%) | 42 (51.2%) |
| 35 to 50 years | 18 (58.1%) | 13 (41.9%) |
| Total | 58 (51.3%) | 55 (48.7%) |
Fertility by Education in Old Forge borough
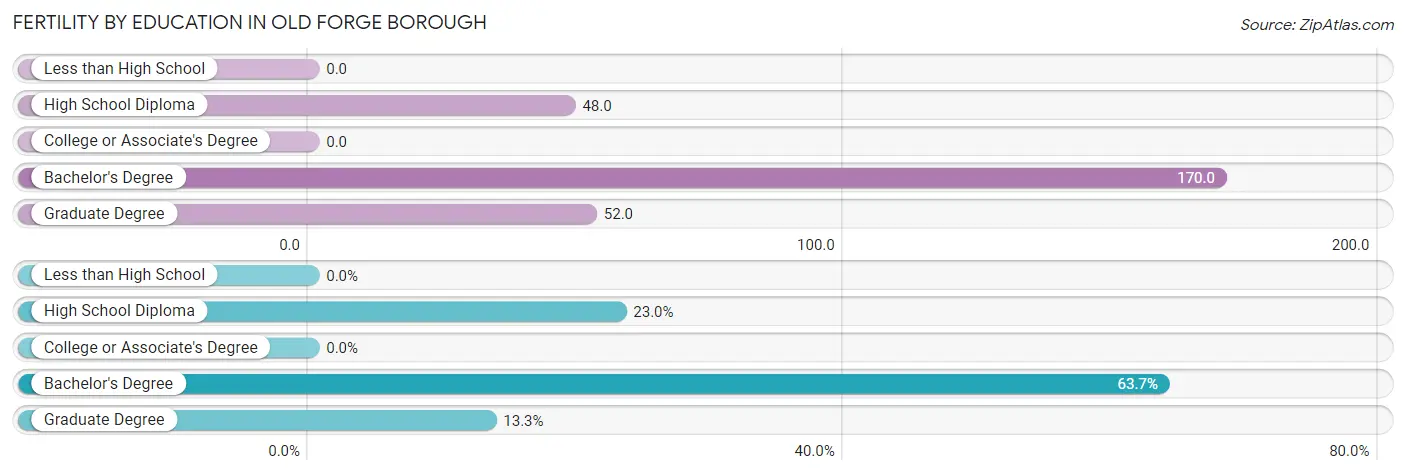
| Educational Attainment | Women with Births | Births / 1,000 Women |
| Less than High School | 0 (0.0%) | 0.0 |
| High School Diploma | 26 (23.0%) | 48.0 |
| College or Associate's Degree | 0 (0.0%) | 0.0 |
| Bachelor's Degree | 72 (63.7%) | 170.0 |
| Graduate Degree | 15 (13.3%) | 52.0 |
| Total | 113 (100.0%) | 67.0 |
Fertility by Education by Marriage Status in Old Forge borough
48.7% of women with births in Old Forge borough are unmarried. Women with the educational attainment of graduate degree are most likely to be married with 100.0% of them married at childbirth, while women with the educational attainment of high school diploma are least likely to be married with 100.0% of them unmarried at childbirth.
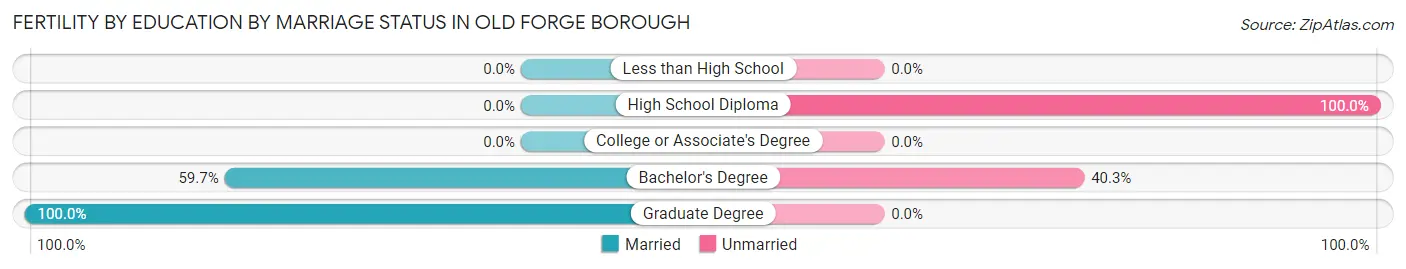
| Educational Attainment | Married | Unmarried |
| Less than High School | 0 (0.0%) | 0 (0.0%) |
| High School Diploma | 0 (0.0%) | 26 (100.0%) |
| College or Associate's Degree | 0 (0.0%) | 0 (0.0%) |
| Bachelor's Degree | 43 (59.7%) | 29 (40.3%) |
| Graduate Degree | 15 (100.0%) | 0 (0.0%) |
| Total | 58 (51.3%) | 55 (48.7%) |
Employment Characteristics in Old Forge borough
Employment by Class of Employer in Old Forge borough
Among the 4,371 employed individuals in Old Forge borough, private company employees (2,971 | 68.0%), not-for-profit organizations (394 | 9.0%), and state government employees (264 | 6.0%) make up the most common classes of employment.
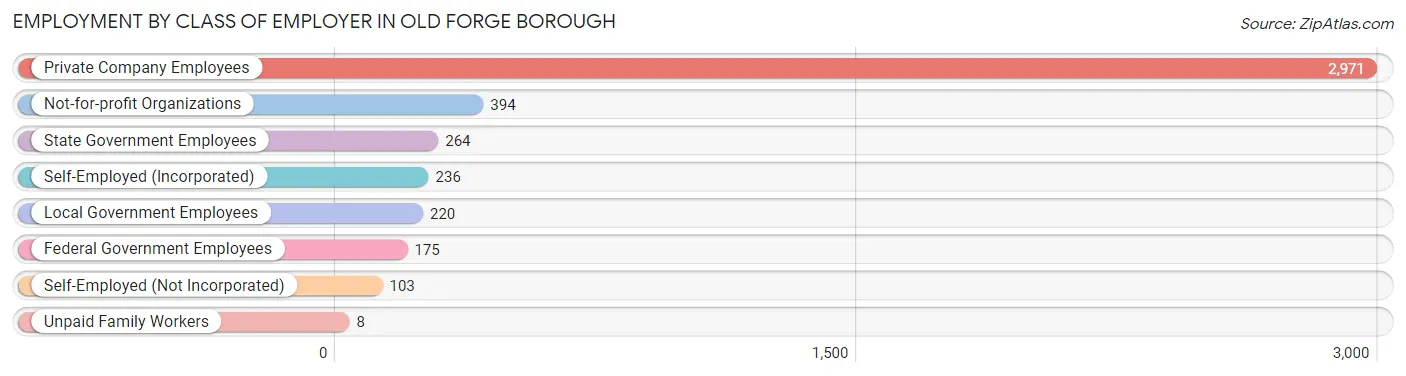
| Employer Class | # Employees | % Employees |
| Private Company Employees | 2,971 | 68.0% |
| Self-Employed (Incorporated) | 236 | 5.4% |
| Self-Employed (Not Incorporated) | 103 | 2.4% |
| Not-for-profit Organizations | 394 | 9.0% |
| Local Government Employees | 220 | 5.0% |
| State Government Employees | 264 | 6.0% |
| Federal Government Employees | 175 | 4.0% |
| Unpaid Family Workers | 8 | 0.2% |
| Total | 4,371 | 100.0% |
Employment Status by Age in Old Forge borough
According to the labor force statistics for Old Forge borough, out of the total population over 16 years of age (6,989), 67.3% or 4,704 individuals are in the labor force, with 5.5% or 259 of them unemployed. The age group with the highest labor force participation rate is 35 to 44 years, with 97.8% or 758 individuals in the labor force. Within the labor force, the 65 to 74 years age range has the highest percentage of unemployed individuals, with 17.1% or 57 of them being unemployed.
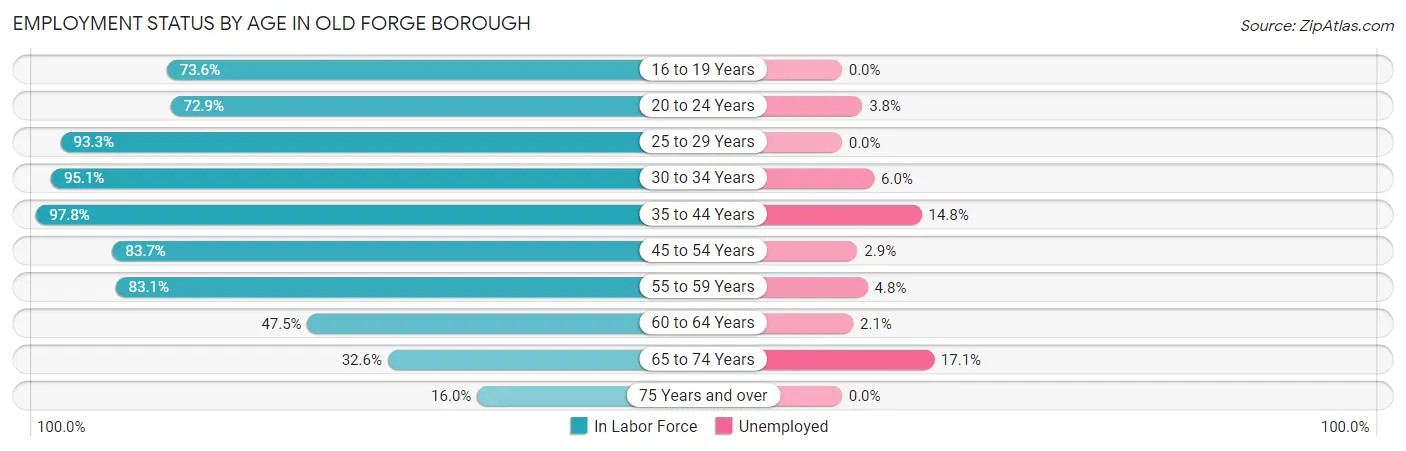
| Age Bracket | In Labor Force | Unemployed |
| 16 to 19 Years | 81 (73.6%) | 0 (0.0%) |
| 20 to 24 Years | 132 (72.9%) | 5 (3.8%) |
| 25 to 29 Years | 994 (93.3%) | 0 (0.0%) |
| 30 to 34 Years | 463 (95.1%) | 28 (6.0%) |
| 35 to 44 Years | 758 (97.8%) | 112 (14.8%) |
| 45 to 54 Years | 956 (83.7%) | 28 (2.9%) |
| 55 to 59 Years | 476 (83.1%) | 23 (4.8%) |
| 60 to 64 Years | 379 (47.5%) | 8 (2.1%) |
| 65 to 74 Years | 333 (32.6%) | 57 (17.1%) |
| 75 Years and over | 134 (16.0%) | 0 (0.0%) |
| Total | 4,704 (67.3%) | 259 (5.5%) |
Employment Status by Educational Attainment in Old Forge borough
According to labor force statistics for Old Forge borough, 83.2% of individuals (4,027) out of the total population between 25 and 64 years of age (4,840) are in the labor force, with 4.9% or 197 of them being unemployed. The group with the highest labor force participation rate are those with the educational attainment of bachelor's degree or higher, with 94.7% or 1,483 individuals in the labor force. Within the labor force, individuals with less than high school education have the highest percentage of unemployment, with 69.8% or 127 of them being unemployed.
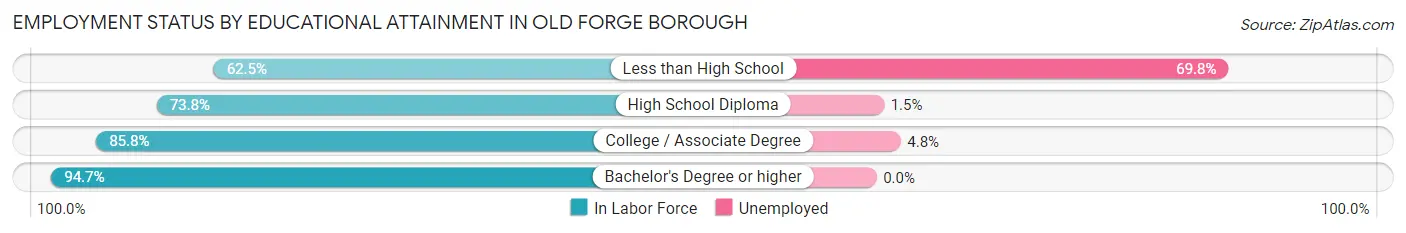
| Educational Attainment | In Labor Force | Unemployed |
| Less than High School | 182 (62.5%) | 203 (69.8%) |
| High School Diploma | 1,227 (73.8%) | 25 (1.5%) |
| College / Associate Degree | 1,133 (85.8%) | 63 (4.8%) |
| Bachelor's Degree or higher | 1,483 (94.7%) | 0 (0.0%) |
| Total | 4,027 (83.2%) | 237 (4.9%) |
Employment Occupations by Sex in Old Forge borough
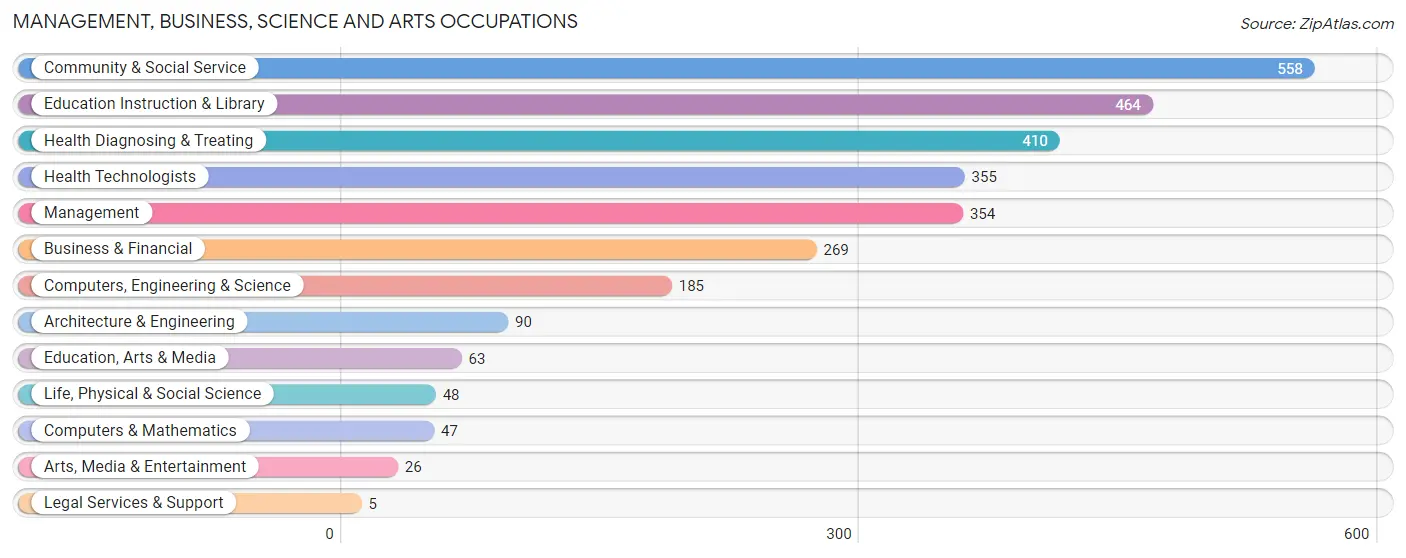
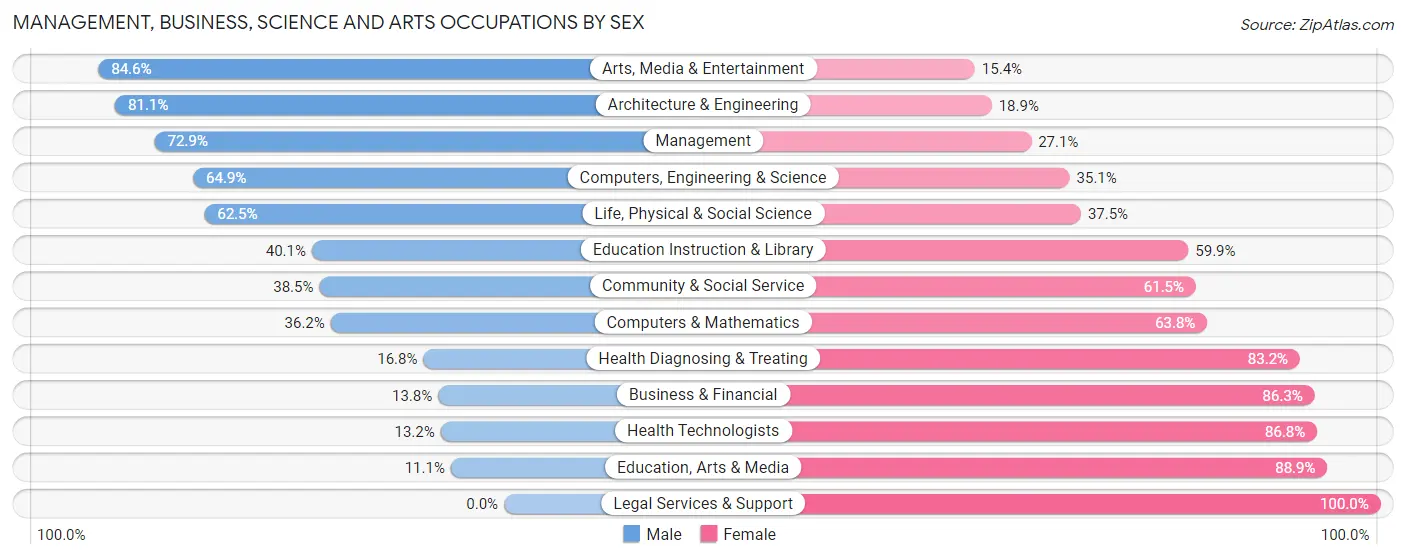
Management, Business, Science and Arts Occupations
The most common Management, Business, Science and Arts occupations in Old Forge borough are Community & Social Service (558 | 12.6%), Education Instruction & Library (464 | 10.4%), Health Diagnosing & Treating (410 | 9.2%), Health Technologists (355 | 8.0%), and Management (354 | 8.0%).
Management, Business, Science and Arts Occupations by Sex
Within the Management, Business, Science and Arts occupations in Old Forge borough, the most male-oriented occupations are Arts, Media & Entertainment (84.6%), Architecture & Engineering (81.1%), and Management (72.9%), while the most female-oriented occupations are Legal Services & Support (100.0%), Education, Arts & Media (88.9%), and Health Technologists (86.8%).
| Occupation | Male | Female |
| Management | 258 (72.9%) | 96 (27.1%) |
| Business & Financial | 37 (13.8%) | 232 (86.3%) |
| Computers, Engineering & Science | 120 (64.9%) | 65 (35.1%) |
| Computers & Mathematics | 17 (36.2%) | 30 (63.8%) |
| Architecture & Engineering | 73 (81.1%) | 17 (18.9%) |
| Life, Physical & Social Science | 30 (62.5%) | 18 (37.5%) |
| Community & Social Service | 215 (38.5%) | 343 (61.5%) |
| Education, Arts & Media | 7 (11.1%) | 56 (88.9%) |
| Legal Services & Support | 0 (0.0%) | 5 (100.0%) |
| Education Instruction & Library | 186 (40.1%) | 278 (59.9%) |
| Arts, Media & Entertainment | 22 (84.6%) | 4 (15.4%) |
| Health Diagnosing & Treating | 69 (16.8%) | 341 (83.2%) |
| Health Technologists | 47 (13.2%) | 308 (86.8%) |
| Total (Category) | 699 (39.4%) | 1,077 (60.6%) |
| Total (Overall) | 2,190 (49.3%) | 2,255 (50.7%) |
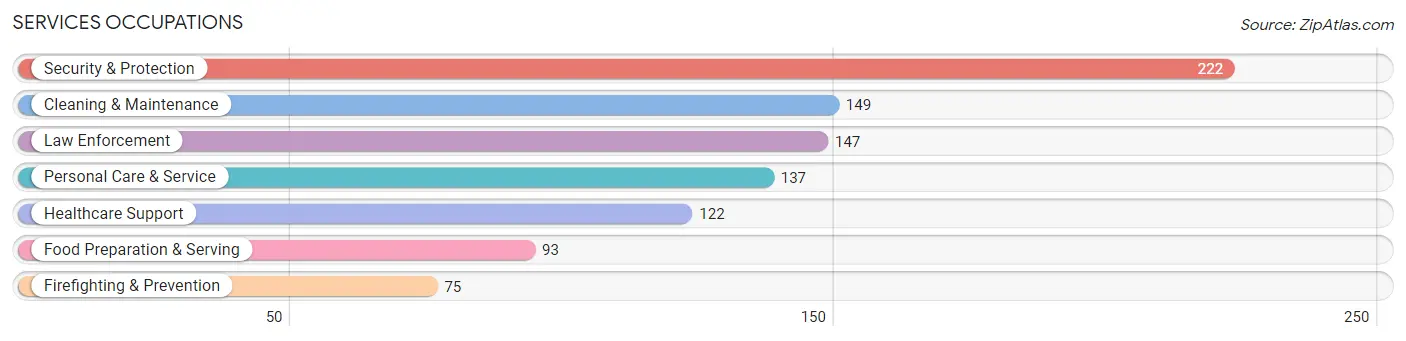
Services Occupations
The most common Services occupations in Old Forge borough are Security & Protection (222 | 5.0%), Cleaning & Maintenance (149 | 3.4%), Law Enforcement (147 | 3.3%), Personal Care & Service (137 | 3.1%), and Healthcare Support (122 | 2.7%).
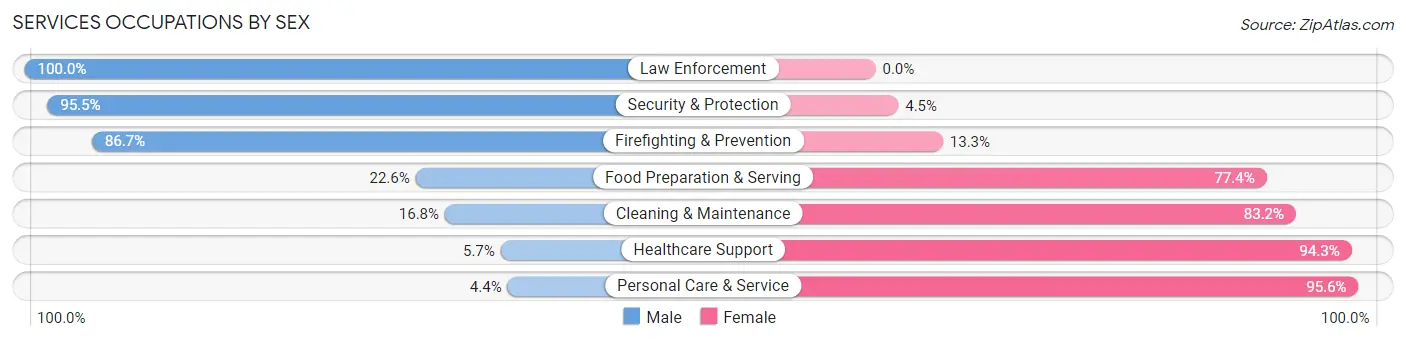
Services Occupations by Sex
Within the Services occupations in Old Forge borough, the most male-oriented occupations are Law Enforcement (100.0%), Security & Protection (95.5%), and Firefighting & Prevention (86.7%), while the most female-oriented occupations are Personal Care & Service (95.6%), Healthcare Support (94.3%), and Cleaning & Maintenance (83.2%).
| Occupation | Male | Female |
| Healthcare Support | 7 (5.7%) | 115 (94.3%) |
| Security & Protection | 212 (95.5%) | 10 (4.5%) |
| Firefighting & Prevention | 65 (86.7%) | 10 (13.3%) |
| Law Enforcement | 147 (100.0%) | 0 (0.0%) |
| Food Preparation & Serving | 21 (22.6%) | 72 (77.4%) |
| Cleaning & Maintenance | 25 (16.8%) | 124 (83.2%) |
| Personal Care & Service | 6 (4.4%) | 131 (95.6%) |
| Total (Category) | 271 (37.5%) | 452 (62.5%) |
| Total (Overall) | 2,190 (49.3%) | 2,255 (50.7%) |
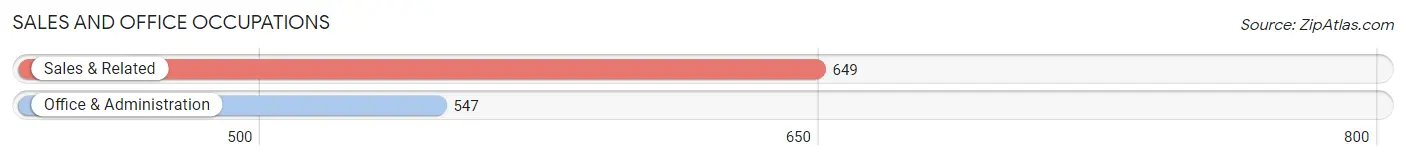
Sales and Office Occupations
The most common Sales and Office occupations in Old Forge borough are Sales & Related (649 | 14.6%), and Office & Administration (547 | 12.3%).
Sales and Office Occupations by Sex
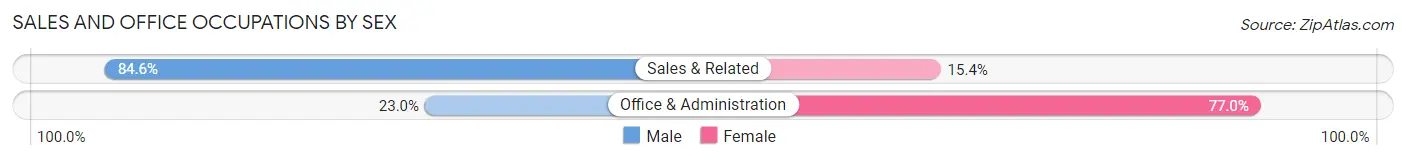
| Occupation | Male | Female |
| Sales & Related | 549 (84.6%) | 100 (15.4%) |
| Office & Administration | 126 (23.0%) | 421 (77.0%) |
| Total (Category) | 675 (56.4%) | 521 (43.6%) |
| Total (Overall) | 2,190 (49.3%) | 2,255 (50.7%) |
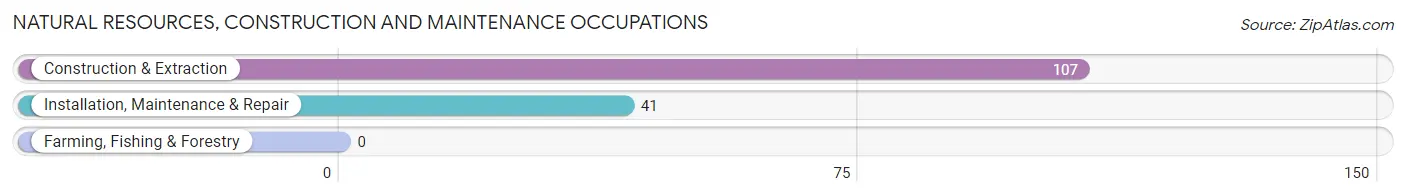
Natural Resources, Construction and Maintenance Occupations
The most common Natural Resources, Construction and Maintenance occupations in Old Forge borough are Construction & Extraction (107 | 2.4%), and Installation, Maintenance & Repair (41 | 0.9%).
Natural Resources, Construction and Maintenance Occupations by Sex
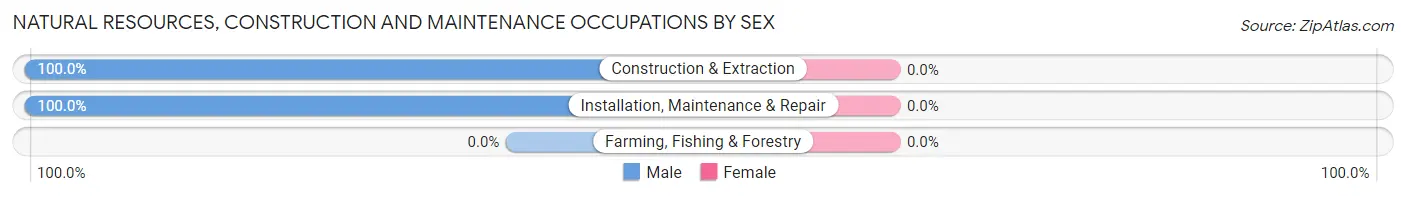
| Occupation | Male | Female |
| Farming, Fishing & Forestry | 0 (0.0%) | 0 (0.0%) |
| Construction & Extraction | 107 (100.0%) | 0 (0.0%) |
| Installation, Maintenance & Repair | 41 (100.0%) | 0 (0.0%) |
| Total (Category) | 148 (100.0%) | 0 (0.0%) |
| Total (Overall) | 2,190 (49.3%) | 2,255 (50.7%) |
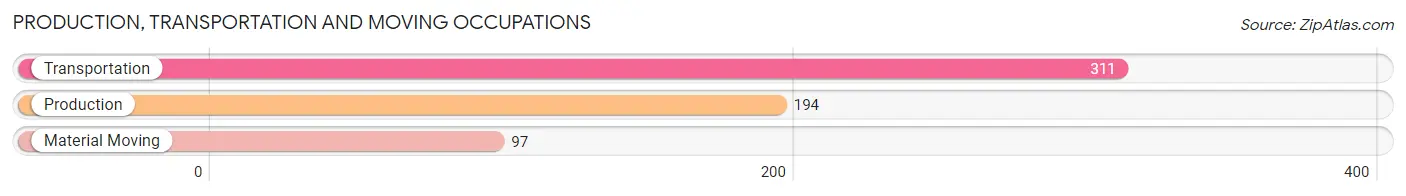
Production, Transportation and Moving Occupations
The most common Production, Transportation and Moving occupations in Old Forge borough are Transportation (311 | 7.0%), Production (194 | 4.4%), and Material Moving (97 | 2.2%).
Production, Transportation and Moving Occupations by Sex
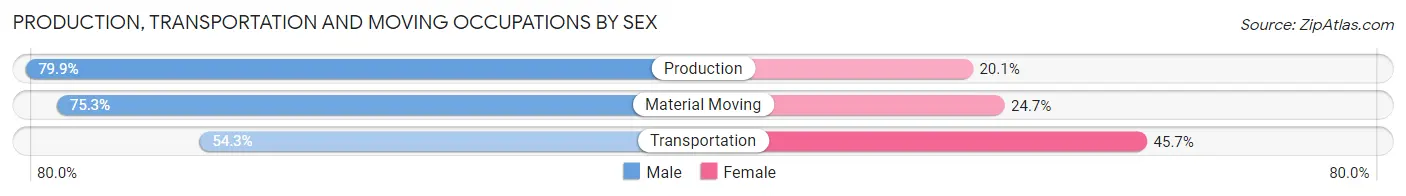
| Occupation | Male | Female |
| Production | 155 (79.9%) | 39 (20.1%) |
| Transportation | 169 (54.3%) | 142 (45.7%) |
| Material Moving | 73 (75.3%) | 24 (24.7%) |
| Total (Category) | 397 (65.9%) | 205 (34.1%) |
| Total (Overall) | 2,190 (49.3%) | 2,255 (50.7%) |
Employment Industries by Sex in Old Forge borough
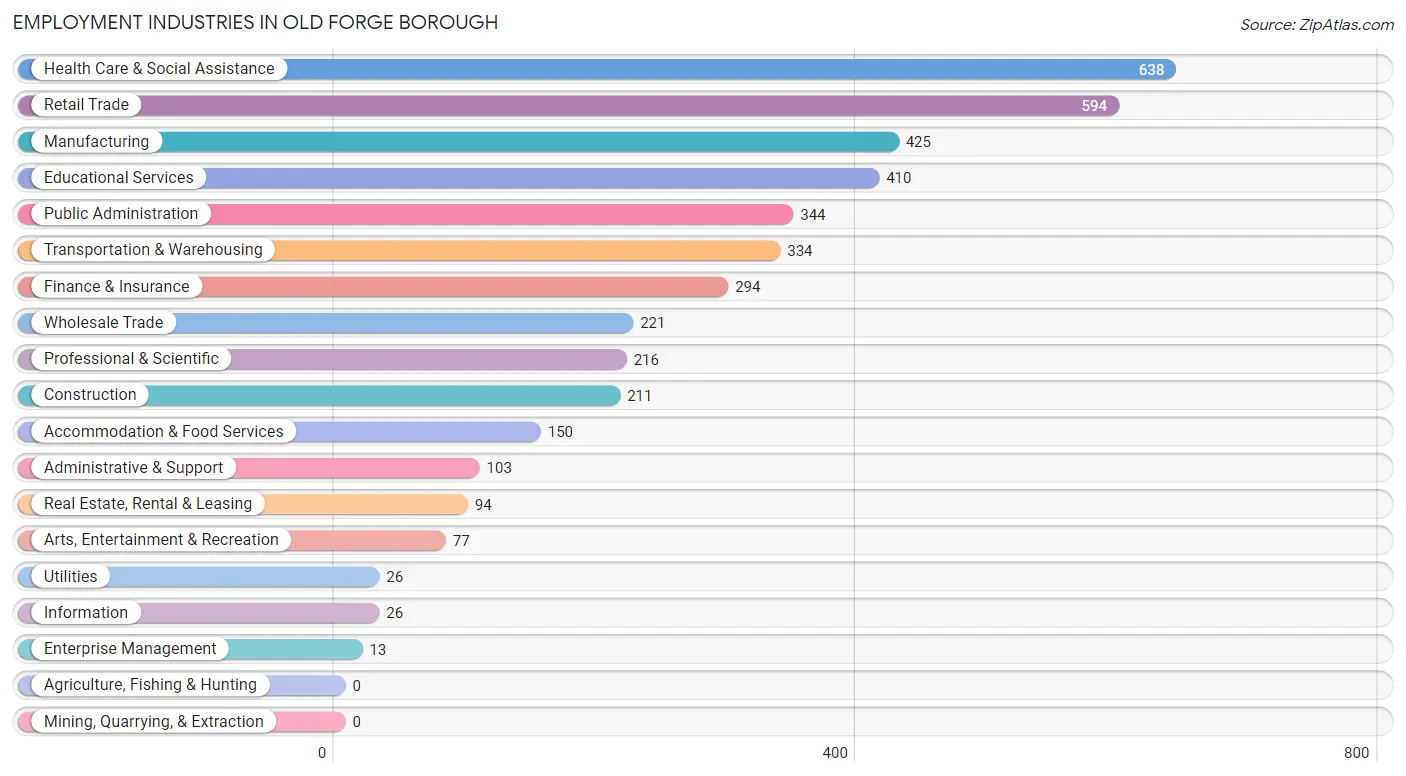
Employment Industries in Old Forge borough
The major employment industries in Old Forge borough include Health Care & Social Assistance (638 | 14.3%), Retail Trade (594 | 13.4%), Manufacturing (425 | 9.6%), Educational Services (410 | 9.2%), and Public Administration (344 | 7.7%).
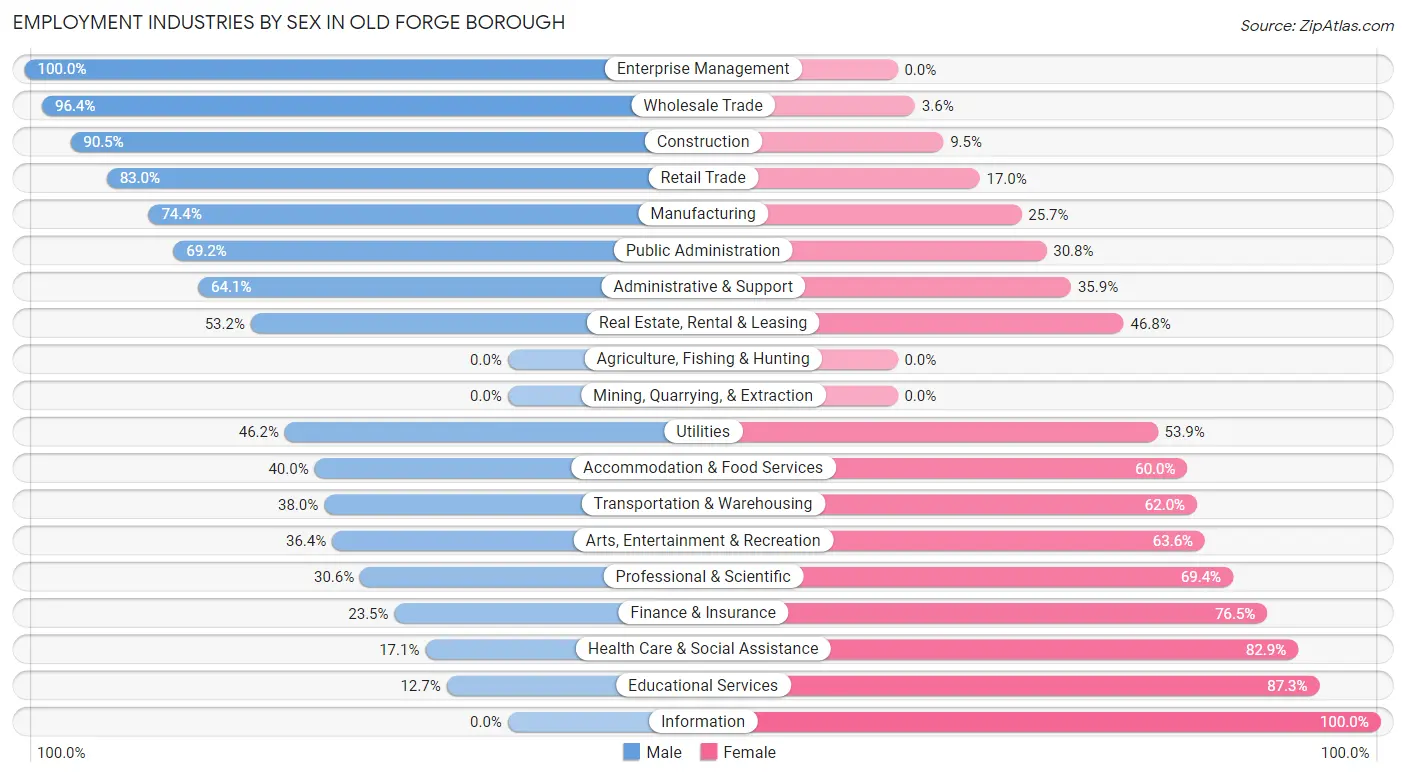
Employment Industries by Sex in Old Forge borough
The Old Forge borough industries that see more men than women are Enterprise Management (100.0%), Wholesale Trade (96.4%), and Construction (90.5%), whereas the industries that tend to have a higher number of women are Information (100.0%), Educational Services (87.3%), and Health Care & Social Assistance (82.9%).
| Industry | Male | Female |
| Agriculture, Fishing & Hunting | 0 (0.0%) | 0 (0.0%) |
| Mining, Quarrying, & Extraction | 0 (0.0%) | 0 (0.0%) |
| Construction | 191 (90.5%) | 20 (9.5%) |
| Manufacturing | 316 (74.4%) | 109 (25.7%) |
| Wholesale Trade | 213 (96.4%) | 8 (3.6%) |
| Retail Trade | 493 (83.0%) | 101 (17.0%) |
| Transportation & Warehousing | 127 (38.0%) | 207 (62.0%) |
| Utilities | 12 (46.2%) | 14 (53.8%) |
| Information | 0 (0.0%) | 26 (100.0%) |
| Finance & Insurance | 69 (23.5%) | 225 (76.5%) |
| Real Estate, Rental & Leasing | 50 (53.2%) | 44 (46.8%) |
| Professional & Scientific | 66 (30.6%) | 150 (69.4%) |
| Enterprise Management | 13 (100.0%) | 0 (0.0%) |
| Administrative & Support | 66 (64.1%) | 37 (35.9%) |
| Educational Services | 52 (12.7%) | 358 (87.3%) |
| Health Care & Social Assistance | 109 (17.1%) | 529 (82.9%) |
| Arts, Entertainment & Recreation | 28 (36.4%) | 49 (63.6%) |
| Accommodation & Food Services | 60 (40.0%) | 90 (60.0%) |
| Public Administration | 238 (69.2%) | 106 (30.8%) |
| Total | 2,190 (49.3%) | 2,255 (50.7%) |
Education in Old Forge borough
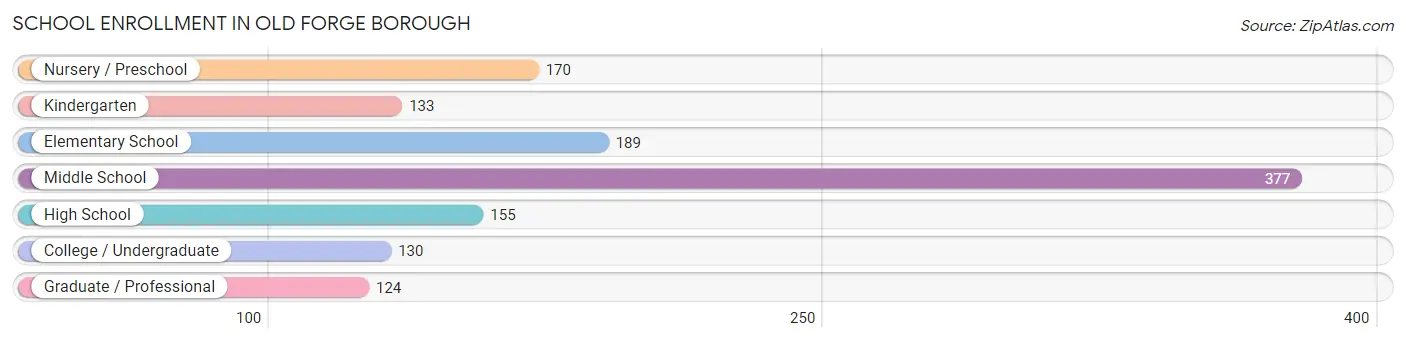
School Enrollment in Old Forge borough
The most common levels of schooling among the 1,278 students in Old Forge borough are middle school (377 | 29.5%), elementary school (189 | 14.8%), and nursery / preschool (170 | 13.3%).
| School Level | # Students | % Students |
| Nursery / Preschool | 170 | 13.3% |
| Kindergarten | 133 | 10.4% |
| Elementary School | 189 | 14.8% |
| Middle School | 377 | 29.5% |
| High School | 155 | 12.1% |
| College / Undergraduate | 130 | 10.2% |
| Graduate / Professional | 124 | 9.7% |
| Total | 1,278 | 100.0% |
School Enrollment by Age by Funding Source in Old Forge borough
Out of a total of 1,278 students who are enrolled in schools in Old Forge borough, 443 (34.7%) attend a private institution, while the remaining 835 (65.3%) are enrolled in public schools. The age group of 3 to 4 year olds has the highest likelihood of being enrolled in private schools, with 112 (92.6% in the age bracket) enrolled. Conversely, the age group of 10 to 14 year olds has the lowest likelihood of being enrolled in a private school, with 404 (95.3% in the age bracket) attending a public institution.
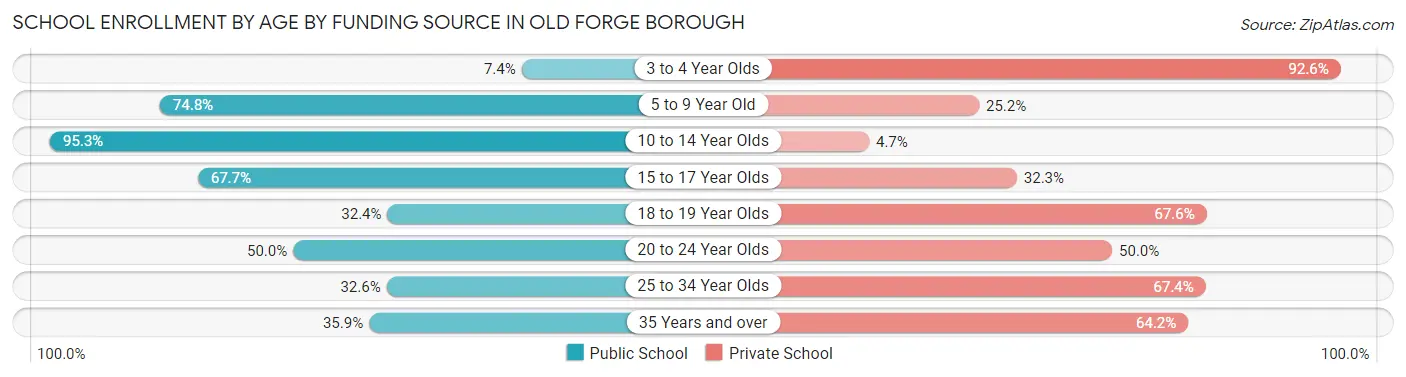
| Age Bracket | Public School | Private School |
| 3 to 4 Year Olds | 9 (7.4%) | 112 (92.6%) |
| 5 to 9 Year Old | 267 (74.8%) | 90 (25.2%) |
| 10 to 14 Year Olds | 404 (95.3%) | 20 (4.7%) |
| 15 to 17 Year Olds | 42 (67.7%) | 20 (32.3%) |
| 18 to 19 Year Olds | 24 (32.4%) | 50 (67.6%) |
| 20 to 24 Year Olds | 26 (50.0%) | 26 (50.0%) |
| 25 to 34 Year Olds | 44 (32.6%) | 91 (67.4%) |
| 35 Years and over | 19 (35.8%) | 34 (64.1%) |
| Total | 835 (65.3%) | 443 (34.7%) |
Educational Attainment by Field of Study in Old Forge borough
Business (458 | 18.5%), education (452 | 18.2%), science & technology (342 | 13.8%), communications (229 | 9.2%), and social sciences (158 | 6.4%) are the most common fields of study among 2,481 individuals in Old Forge borough who have obtained a bachelor's degree or higher.
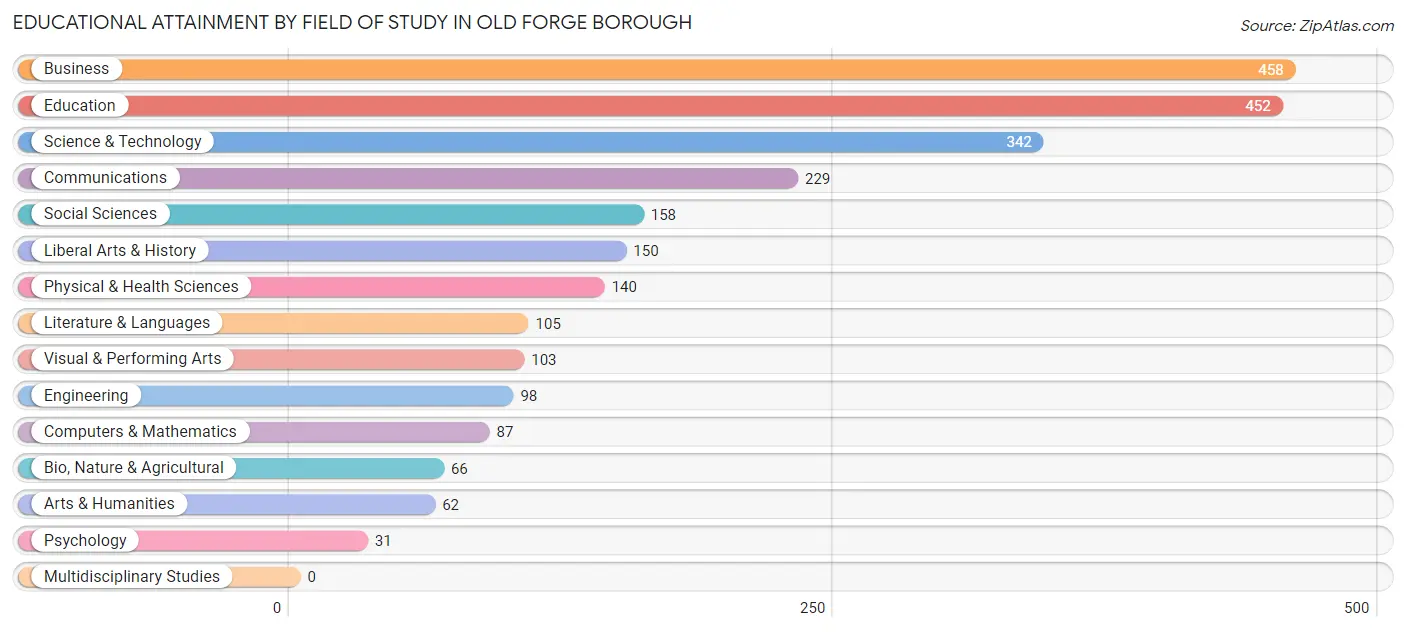
| Field of Study | # Graduates | % Graduates |
| Computers & Mathematics | 87 | 3.5% |
| Bio, Nature & Agricultural | 66 | 2.7% |
| Physical & Health Sciences | 140 | 5.6% |
| Psychology | 31 | 1.3% |
| Social Sciences | 158 | 6.4% |
| Engineering | 98 | 4.0% |
| Multidisciplinary Studies | 0 | 0.0% |
| Science & Technology | 342 | 13.8% |
| Business | 458 | 18.5% |
| Education | 452 | 18.2% |
| Literature & Languages | 105 | 4.2% |
| Liberal Arts & History | 150 | 6.0% |
| Visual & Performing Arts | 103 | 4.2% |
| Communications | 229 | 9.2% |
| Arts & Humanities | 62 | 2.5% |
| Total | 2,481 | 100.0% |
Transportation & Commute in Old Forge borough
Vehicle Availability by Sex in Old Forge borough
The most prevalent vehicle ownership categories in Old Forge borough are males with 2 vehicles (1,085, accounting for 50.0%) and females with 2 vehicles (957, making up 49.3%).
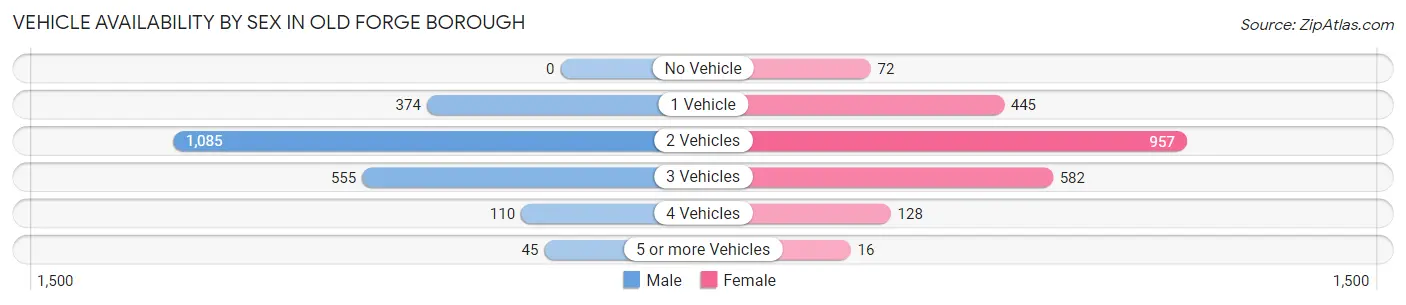
| Vehicles Available | Male | Female |
| No Vehicle | 0 (0.0%) | 72 (3.3%) |
| 1 Vehicle | 374 (17.2%) | 445 (20.2%) |
| 2 Vehicles | 1,085 (50.0%) | 957 (43.5%) |
| 3 Vehicles | 555 (25.6%) | 582 (26.5%) |
| 4 Vehicles | 110 (5.1%) | 128 (5.8%) |
| 5 or more Vehicles | 45 (2.1%) | 16 (0.7%) |
| Total | 2,169 (100.0%) | 2,200 (100.0%) |
Commute Time in Old Forge borough
The most frequently occuring commute durations in Old Forge borough are 10 to 14 minutes (842 commuters, 21.2%), 20 to 24 minutes (815 commuters, 20.5%), and 15 to 19 minutes (585 commuters, 14.7%).
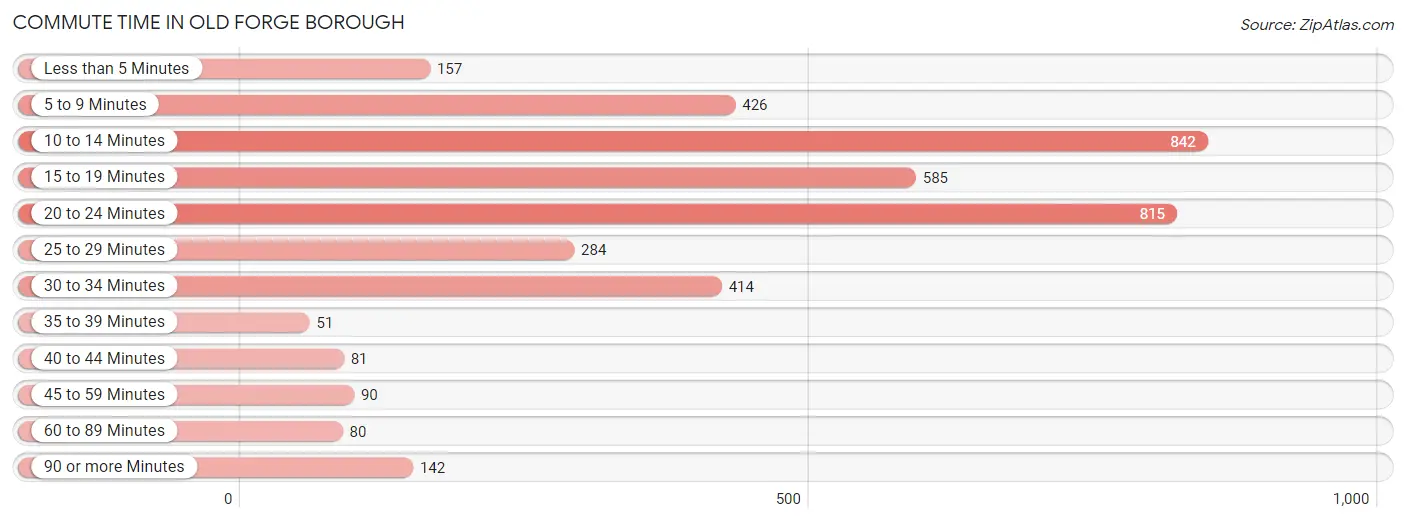
| Commute Time | # Commuters | % Commuters |
| Less than 5 Minutes | 157 | 4.0% |
| 5 to 9 Minutes | 426 | 10.7% |
| 10 to 14 Minutes | 842 | 21.2% |
| 15 to 19 Minutes | 585 | 14.7% |
| 20 to 24 Minutes | 815 | 20.5% |
| 25 to 29 Minutes | 284 | 7.2% |
| 30 to 34 Minutes | 414 | 10.4% |
| 35 to 39 Minutes | 51 | 1.3% |
| 40 to 44 Minutes | 81 | 2.0% |
| 45 to 59 Minutes | 90 | 2.3% |
| 60 to 89 Minutes | 80 | 2.0% |
| 90 or more Minutes | 142 | 3.6% |
Commute Time by Sex in Old Forge borough
The most common commute times in Old Forge borough are 10 to 14 minutes (469 commuters, 23.2%) for males and 20 to 24 minutes (516 commuters, 26.5%) for females.
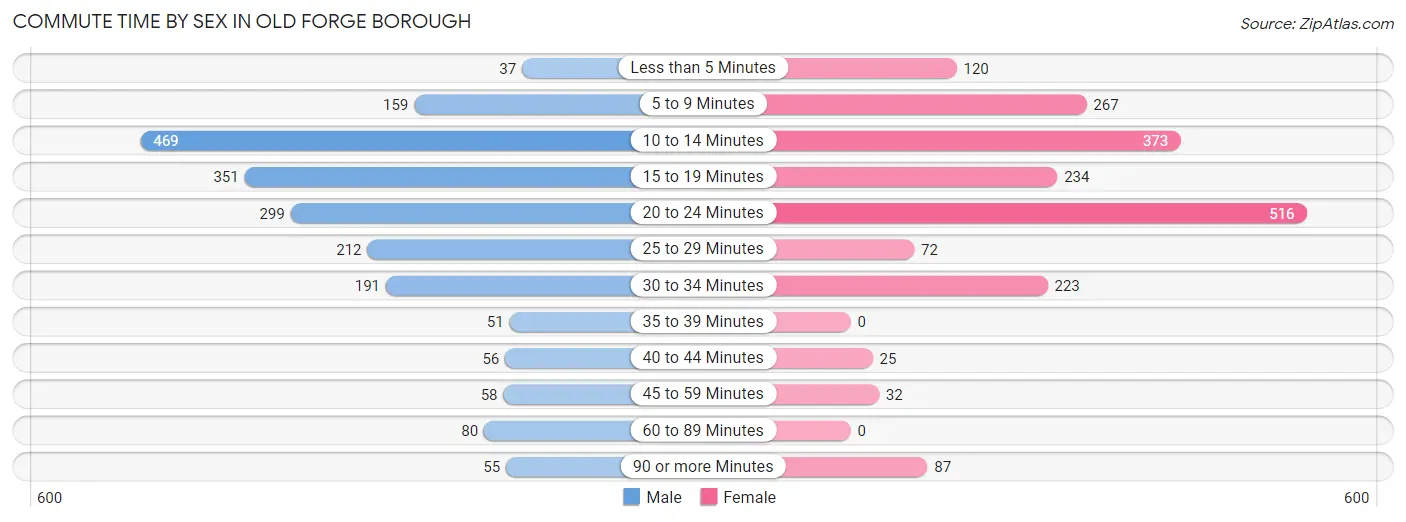
| Commute Time | Male | Female |
| Less than 5 Minutes | 37 (1.8%) | 120 (6.2%) |
| 5 to 9 Minutes | 159 (7.9%) | 267 (13.7%) |
| 10 to 14 Minutes | 469 (23.2%) | 373 (19.1%) |
| 15 to 19 Minutes | 351 (17.4%) | 234 (12.0%) |
| 20 to 24 Minutes | 299 (14.8%) | 516 (26.5%) |
| 25 to 29 Minutes | 212 (10.5%) | 72 (3.7%) |
| 30 to 34 Minutes | 191 (9.5%) | 223 (11.4%) |
| 35 to 39 Minutes | 51 (2.5%) | 0 (0.0%) |
| 40 to 44 Minutes | 56 (2.8%) | 25 (1.3%) |
| 45 to 59 Minutes | 58 (2.9%) | 32 (1.6%) |
| 60 to 89 Minutes | 80 (4.0%) | 0 (0.0%) |
| 90 or more Minutes | 55 (2.7%) | 87 (4.5%) |
Time of Departure to Work by Sex in Old Forge borough
The most frequent times of departure to work in Old Forge borough are 12:00 AM to 4:59 AM (337, 16.7%) for males and 7:30 AM to 7:59 AM (344, 17.6%) for females.
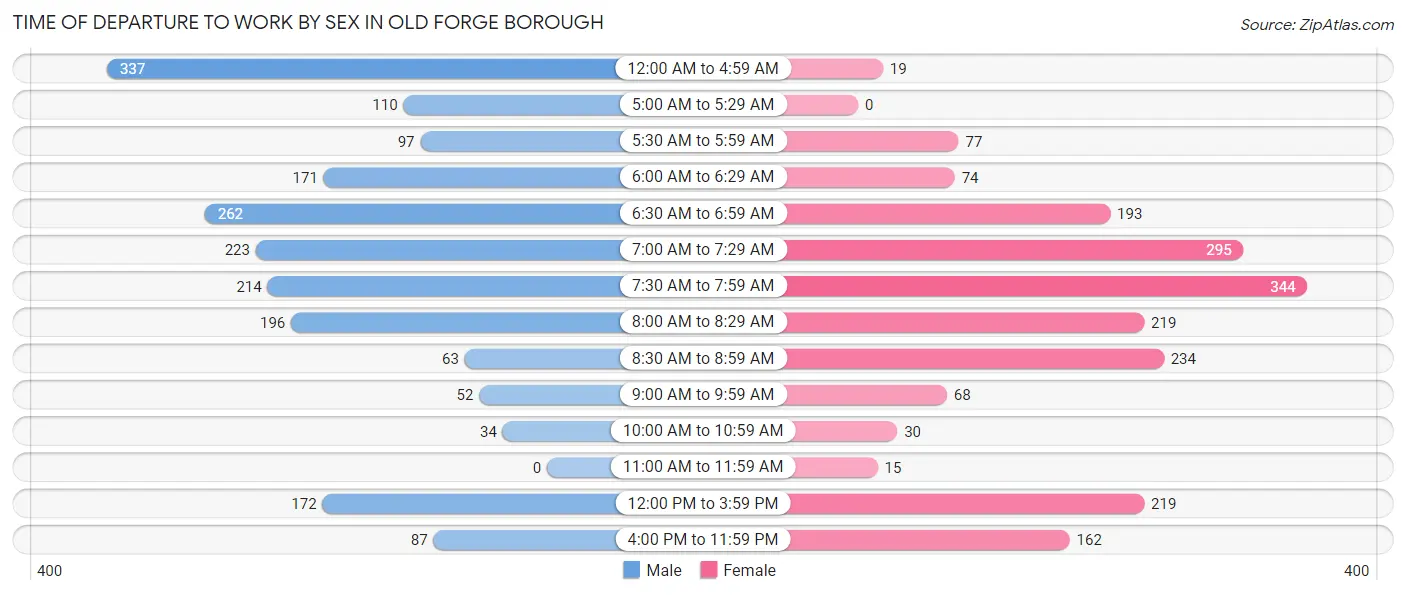
| Time of Departure | Male | Female |
| 12:00 AM to 4:59 AM | 337 (16.7%) | 19 (1.0%) |
| 5:00 AM to 5:29 AM | 110 (5.4%) | 0 (0.0%) |
| 5:30 AM to 5:59 AM | 97 (4.8%) | 77 (4.0%) |
| 6:00 AM to 6:29 AM | 171 (8.5%) | 74 (3.8%) |
| 6:30 AM to 6:59 AM | 262 (13.0%) | 193 (9.9%) |
| 7:00 AM to 7:29 AM | 223 (11.1%) | 295 (15.1%) |
| 7:30 AM to 7:59 AM | 214 (10.6%) | 344 (17.6%) |
| 8:00 AM to 8:29 AM | 196 (9.7%) | 219 (11.2%) |
| 8:30 AM to 8:59 AM | 63 (3.1%) | 234 (12.0%) |
| 9:00 AM to 9:59 AM | 52 (2.6%) | 68 (3.5%) |
| 10:00 AM to 10:59 AM | 34 (1.7%) | 30 (1.5%) |
| 11:00 AM to 11:59 AM | 0 (0.0%) | 15 (0.8%) |
| 12:00 PM to 3:59 PM | 172 (8.5%) | 219 (11.2%) |
| 4:00 PM to 11:59 PM | 87 (4.3%) | 162 (8.3%) |
| Total | 2,018 (100.0%) | 1,949 (100.0%) |
Housing Occupancy in Old Forge borough
Occupancy by Ownership in Old Forge borough
Of the total 3,801 dwellings in Old Forge borough, owner-occupied units account for 2,685 (70.6%), while renter-occupied units make up 1,116 (29.4%).
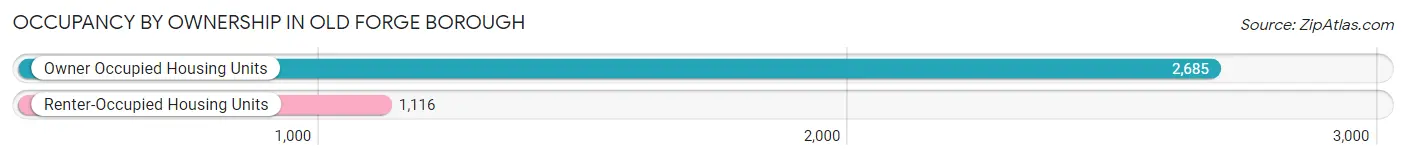
| Occupancy | # Housing Units | % Housing Units |
| Owner Occupied Housing Units | 2,685 | 70.6% |
| Renter-Occupied Housing Units | 1,116 | 29.4% |
| Total Occupied Housing Units | 3,801 | 100.0% |
Occupancy by Household Size in Old Forge borough
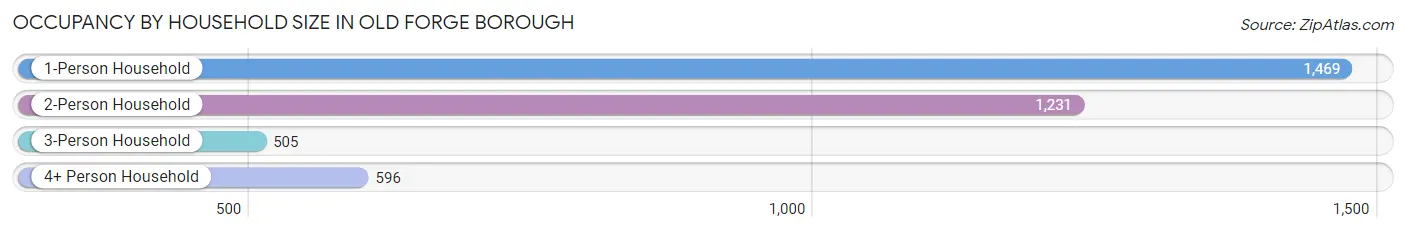
| Household Size | # Housing Units | % Housing Units |
| 1-Person Household | 1,469 | 38.7% |
| 2-Person Household | 1,231 | 32.4% |
| 3-Person Household | 505 | 13.3% |
| 4+ Person Household | 596 | 15.7% |
| Total Housing Units | 3,801 | 100.0% |
Occupancy by Ownership by Household Size in Old Forge borough
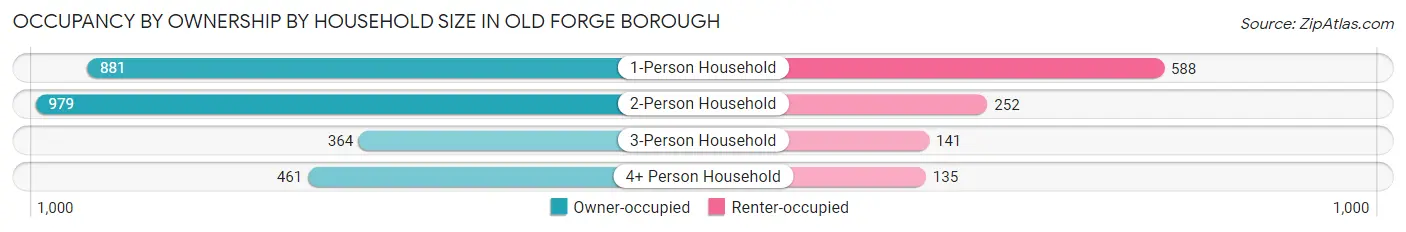
| Household Size | Owner-occupied | Renter-occupied |
| 1-Person Household | 881 (60.0%) | 588 (40.0%) |
| 2-Person Household | 979 (79.5%) | 252 (20.5%) |
| 3-Person Household | 364 (72.1%) | 141 (27.9%) |
| 4+ Person Household | 461 (77.3%) | 135 (22.7%) |
| Total Housing Units | 2,685 (70.6%) | 1,116 (29.4%) |
Occupancy by Educational Attainment in Old Forge borough
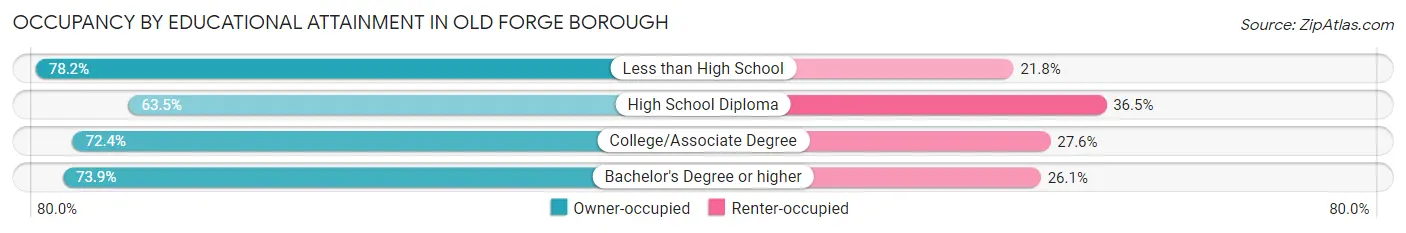
| Household Size | Owner-occupied | Renter-occupied |
| Less than High School | 183 (78.2%) | 51 (21.8%) |
| High School Diploma | 724 (63.5%) | 416 (36.5%) |
| College/Associate Degree | 736 (72.4%) | 281 (27.6%) |
| Bachelor's Degree or higher | 1,042 (73.9%) | 368 (26.1%) |
Occupancy by Age of Householder in Old Forge borough
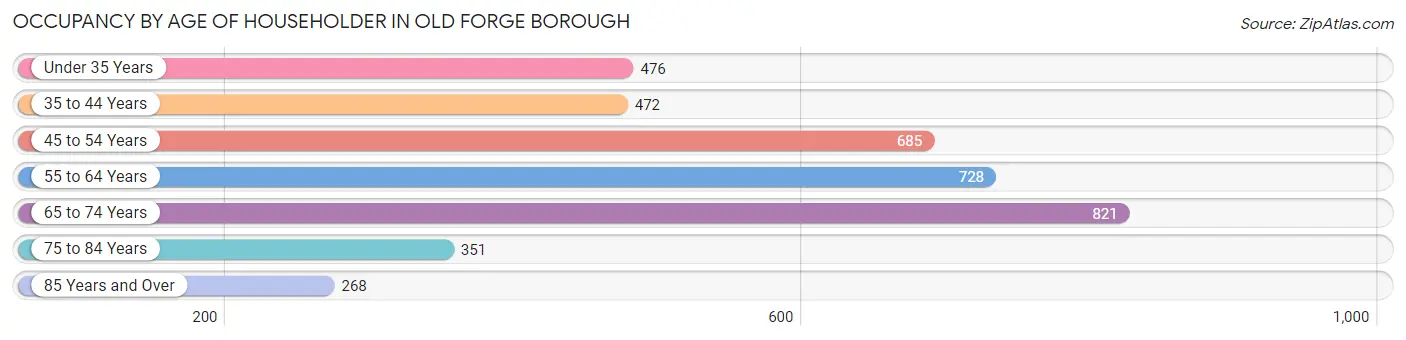
| Age Bracket | # Households | % Households |
| Under 35 Years | 476 | 12.5% |
| 35 to 44 Years | 472 | 12.4% |
| 45 to 54 Years | 685 | 18.0% |
| 55 to 64 Years | 728 | 19.2% |
| 65 to 74 Years | 821 | 21.6% |
| 75 to 84 Years | 351 | 9.2% |
| 85 Years and Over | 268 | 7.0% |
| Total | 3,801 | 100.0% |
Housing Finances in Old Forge borough
Median Income by Occupancy in Old Forge borough
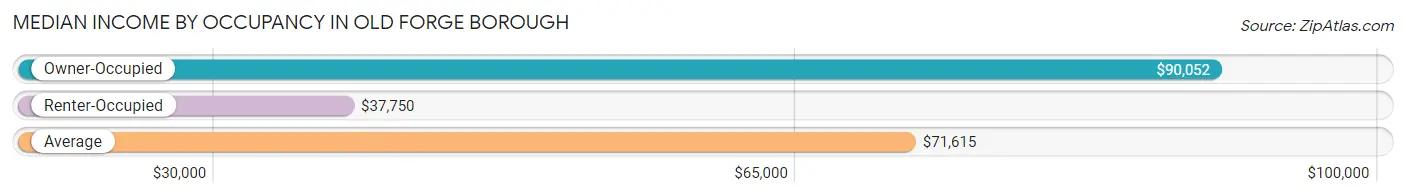
| Occupancy Type | # Households | Median Income |
| Owner-Occupied | 2,685 (70.6%) | $90,052 |
| Renter-Occupied | 1,116 (29.4%) | $37,750 |
| Average | 3,801 (100.0%) | $71,615 |
Occupancy by Householder Income Bracket in Old Forge borough
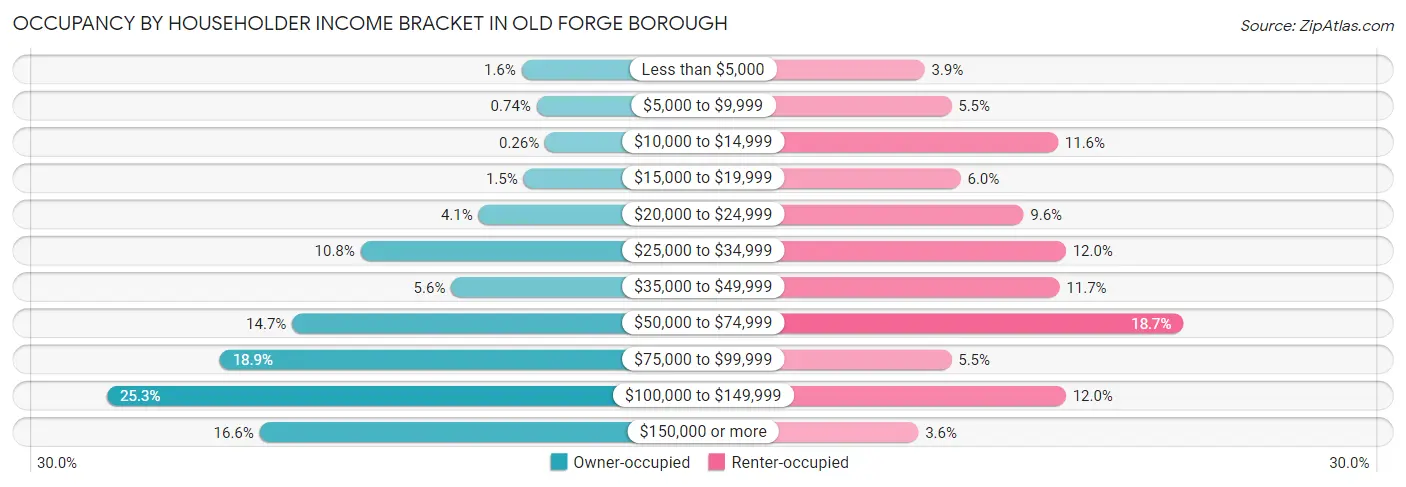
| Income Bracket | Owner-occupied | Renter-occupied |
| Less than $5,000 | 43 (1.6%) | 44 (3.9%) |
| $5,000 to $9,999 | 20 (0.7%) | 61 (5.5%) |
| $10,000 to $14,999 | 7 (0.3%) | 129 (11.6%) |
| $15,000 to $19,999 | 40 (1.5%) | 67 (6.0%) |
| $20,000 to $24,999 | 109 (4.1%) | 107 (9.6%) |
| $25,000 to $34,999 | 290 (10.8%) | 134 (12.0%) |
| $35,000 to $49,999 | 151 (5.6%) | 130 (11.7%) |
| $50,000 to $74,999 | 395 (14.7%) | 209 (18.7%) |
| $75,000 to $99,999 | 506 (18.9%) | 61 (5.5%) |
| $100,000 to $149,999 | 679 (25.3%) | 134 (12.0%) |
| $150,000 or more | 445 (16.6%) | 40 (3.6%) |
| Total | 2,685 (100.0%) | 1,116 (100.0%) |
Monthly Housing Cost Tiers in Old Forge borough
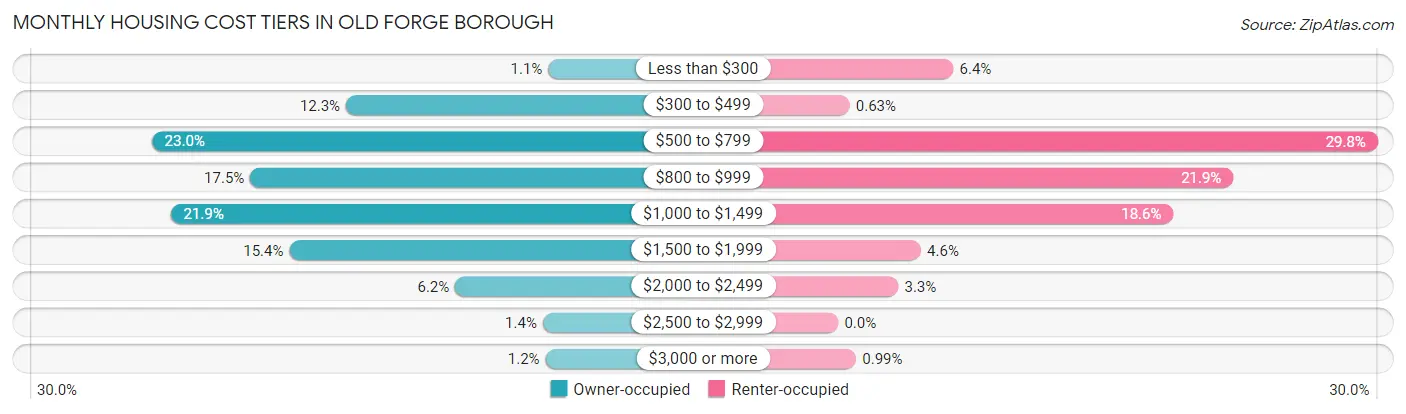
| Monthly Cost | Owner-occupied | Renter-occupied |
| Less than $300 | 29 (1.1%) | 71 (6.4%) |
| $300 to $499 | 329 (12.2%) | 7 (0.6%) |
| $500 to $799 | 617 (23.0%) | 333 (29.8%) |
| $800 to $999 | 471 (17.5%) | 244 (21.9%) |
| $1,000 to $1,499 | 589 (21.9%) | 207 (18.5%) |
| $1,500 to $1,999 | 413 (15.4%) | 51 (4.6%) |
| $2,000 to $2,499 | 167 (6.2%) | 37 (3.3%) |
| $2,500 to $2,999 | 37 (1.4%) | 0 (0.0%) |
| $3,000 or more | 33 (1.2%) | 11 (1.0%) |
| Total | 2,685 (100.0%) | 1,116 (100.0%) |
Physical Housing Characteristics in Old Forge borough
Housing Structures in Old Forge borough
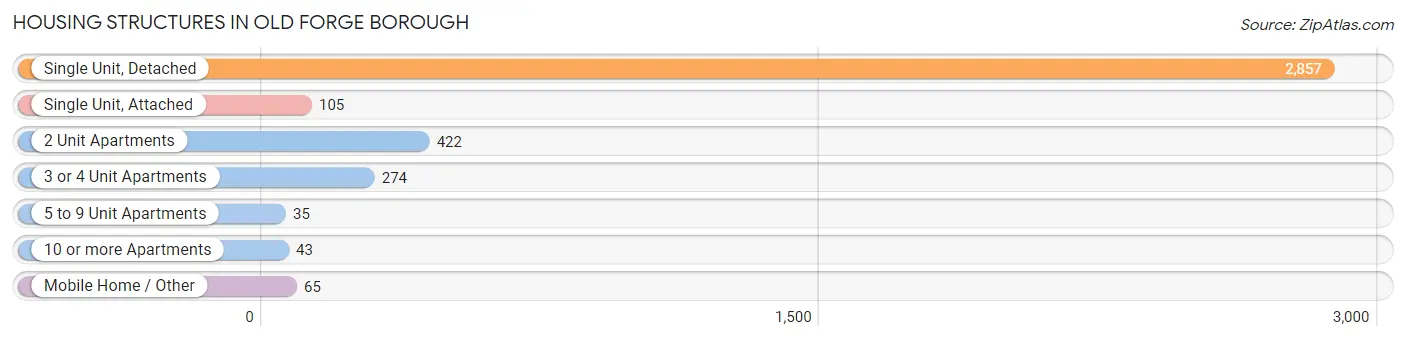
| Structure Type | # Housing Units | % Housing Units |
| Single Unit, Detached | 2,857 | 75.2% |
| Single Unit, Attached | 105 | 2.8% |
| 2 Unit Apartments | 422 | 11.1% |
| 3 or 4 Unit Apartments | 274 | 7.2% |
| 5 to 9 Unit Apartments | 35 | 0.9% |
| 10 or more Apartments | 43 | 1.1% |
| Mobile Home / Other | 65 | 1.7% |
| Total | 3,801 | 100.0% |
Housing Structures by Occupancy in Old Forge borough
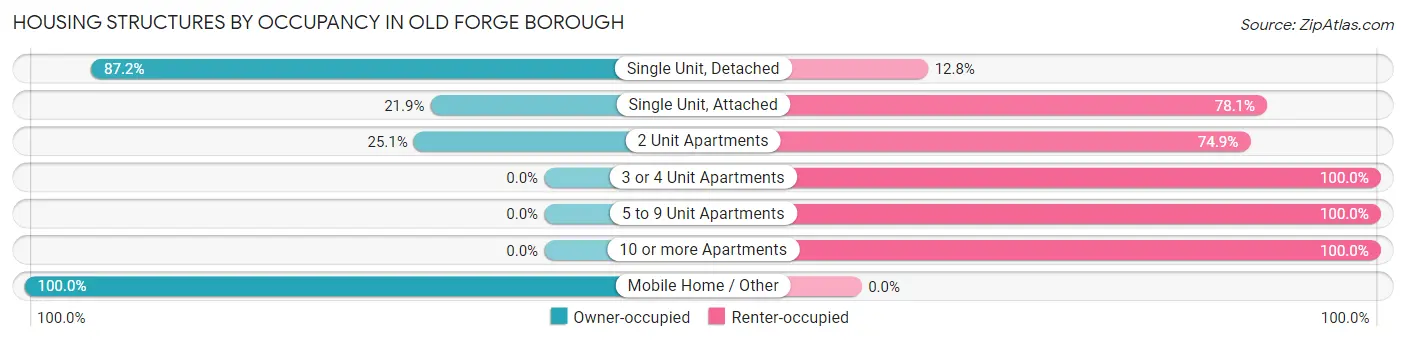
| Structure Type | Owner-occupied | Renter-occupied |
| Single Unit, Detached | 2,491 (87.2%) | 366 (12.8%) |
| Single Unit, Attached | 23 (21.9%) | 82 (78.1%) |
| 2 Unit Apartments | 106 (25.1%) | 316 (74.9%) |
| 3 or 4 Unit Apartments | 0 (0.0%) | 274 (100.0%) |
| 5 to 9 Unit Apartments | 0 (0.0%) | 35 (100.0%) |
| 10 or more Apartments | 0 (0.0%) | 43 (100.0%) |
| Mobile Home / Other | 65 (100.0%) | 0 (0.0%) |
| Total | 2,685 (70.6%) | 1,116 (29.4%) |
Housing Structures by Number of Rooms in Old Forge borough
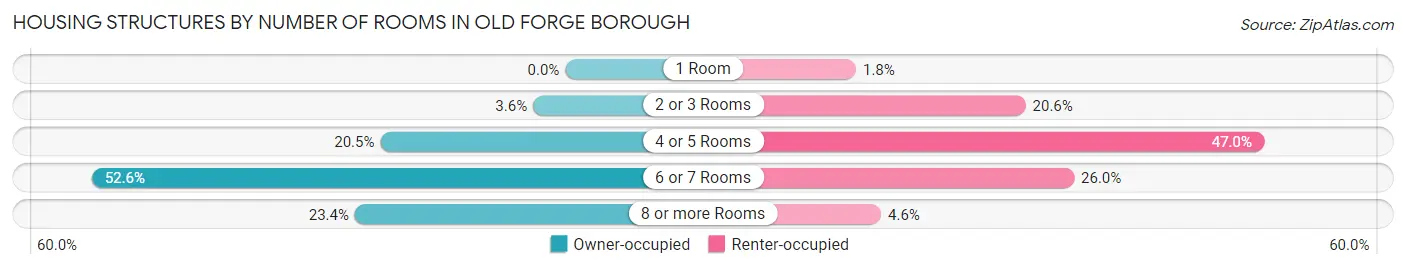
| Number of Rooms | Owner-occupied | Renter-occupied |
| 1 Room | 0 (0.0%) | 20 (1.8%) |
| 2 or 3 Rooms | 96 (3.6%) | 230 (20.6%) |
| 4 or 5 Rooms | 551 (20.5%) | 525 (47.0%) |
| 6 or 7 Rooms | 1,411 (52.5%) | 290 (26.0%) |
| 8 or more Rooms | 627 (23.4%) | 51 (4.6%) |
| Total | 2,685 (100.0%) | 1,116 (100.0%) |
Housing Structure by Heating Type in Old Forge borough
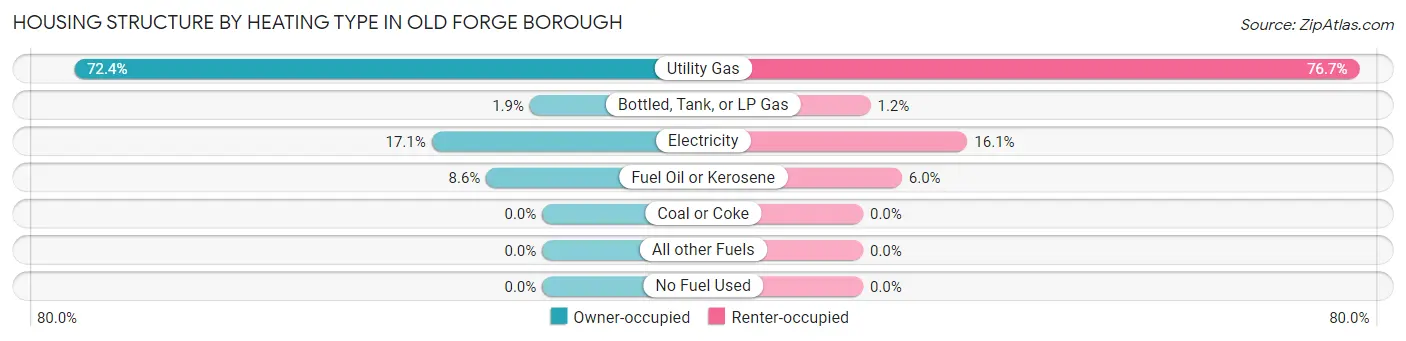
| Heating Type | Owner-occupied | Renter-occupied |
| Utility Gas | 1,943 (72.4%) | 856 (76.7%) |
| Bottled, Tank, or LP Gas | 51 (1.9%) | 13 (1.2%) |
| Electricity | 459 (17.1%) | 180 (16.1%) |
| Fuel Oil or Kerosene | 232 (8.6%) | 67 (6.0%) |
| Coal or Coke | 0 (0.0%) | 0 (0.0%) |
| All other Fuels | 0 (0.0%) | 0 (0.0%) |
| No Fuel Used | 0 (0.0%) | 0 (0.0%) |
| Total | 2,685 (100.0%) | 1,116 (100.0%) |
Household Vehicle Usage in Old Forge borough
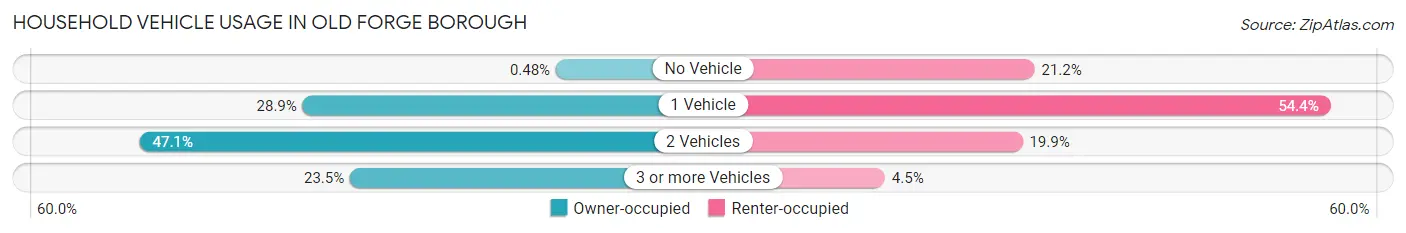
| Vehicles per Household | Owner-occupied | Renter-occupied |
| No Vehicle | 13 (0.5%) | 237 (21.2%) |
| 1 Vehicle | 775 (28.9%) | 607 (54.4%) |
| 2 Vehicles | 1,265 (47.1%) | 222 (19.9%) |
| 3 or more Vehicles | 632 (23.5%) | 50 (4.5%) |
| Total | 2,685 (100.0%) | 1,116 (100.0%) |
Real Estate & Mortgages in Old Forge borough
Real Estate and Mortgage Overview in Old Forge borough
| Characteristic | Without Mortgage | With Mortgage |
| Housing Units | 964 | 1,721 |
| Median Property Value | $149,000 | $158,100 |
| Median Household Income | $68,750 | $298 |
| Monthly Housing Costs | $568 | $33 |
| Real Estate Taxes | $2,085 | $30 |
Property Value by Mortgage Status in Old Forge borough
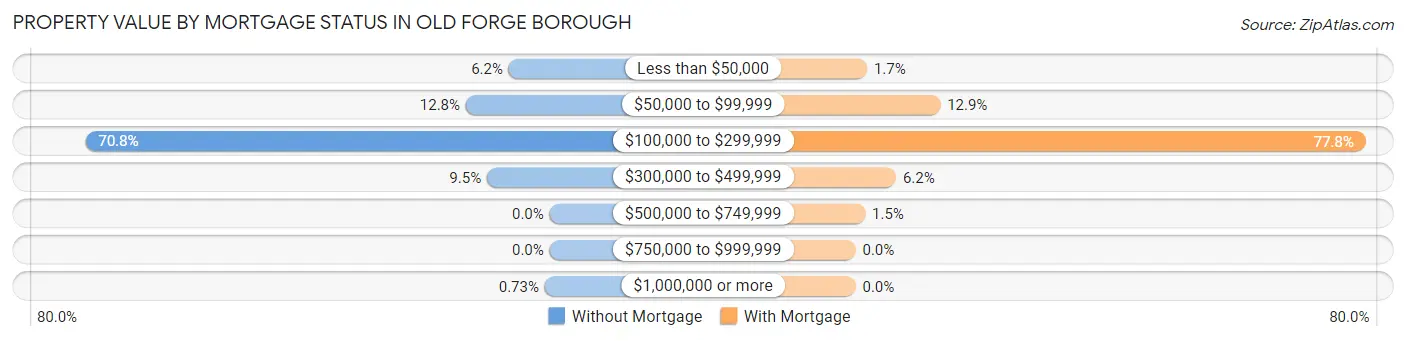
| Property Value | Without Mortgage | With Mortgage |
| Less than $50,000 | 60 (6.2%) | 30 (1.7%) |
| $50,000 to $99,999 | 123 (12.8%) | 222 (12.9%) |
| $100,000 to $299,999 | 682 (70.8%) | 1,338 (77.7%) |
| $300,000 to $499,999 | 92 (9.5%) | 106 (6.2%) |
| $500,000 to $749,999 | 0 (0.0%) | 25 (1.5%) |
| $750,000 to $999,999 | 0 (0.0%) | 0 (0.0%) |
| $1,000,000 or more | 7 (0.7%) | 0 (0.0%) |
| Total | 964 (100.0%) | 1,721 (100.0%) |
Household Income by Mortgage Status in Old Forge borough
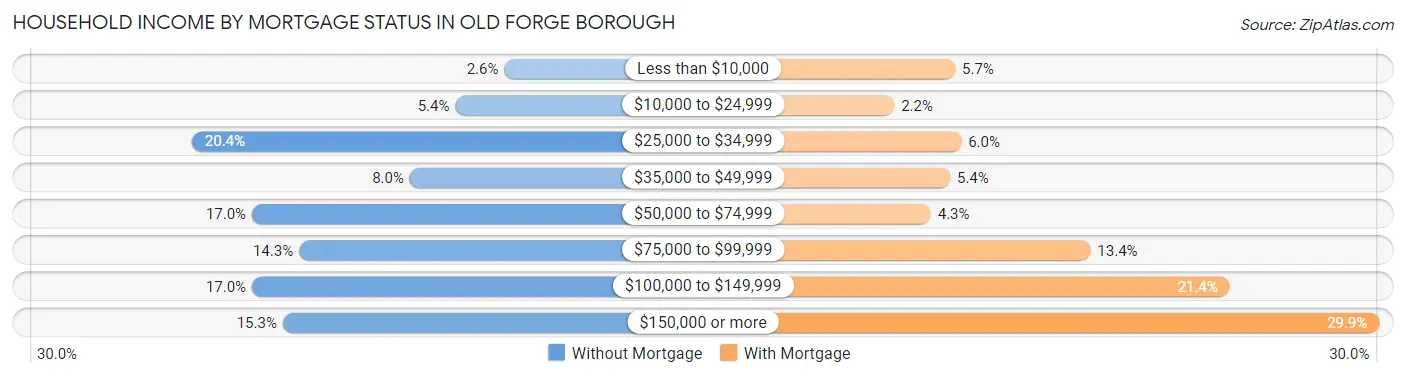
| Household Income | Without Mortgage | With Mortgage |
| Less than $10,000 | 25 (2.6%) | 98 (5.7%) |
| $10,000 to $24,999 | 52 (5.4%) | 38 (2.2%) |
| $25,000 to $34,999 | 197 (20.4%) | 104 (6.0%) |
| $35,000 to $49,999 | 77 (8.0%) | 93 (5.4%) |
| $50,000 to $74,999 | 164 (17.0%) | 74 (4.3%) |
| $75,000 to $99,999 | 138 (14.3%) | 231 (13.4%) |
| $100,000 to $149,999 | 164 (17.0%) | 368 (21.4%) |
| $150,000 or more | 147 (15.2%) | 515 (29.9%) |
| Total | 964 (100.0%) | 1,721 (100.0%) |
Property Value to Household Income Ratio in Old Forge borough
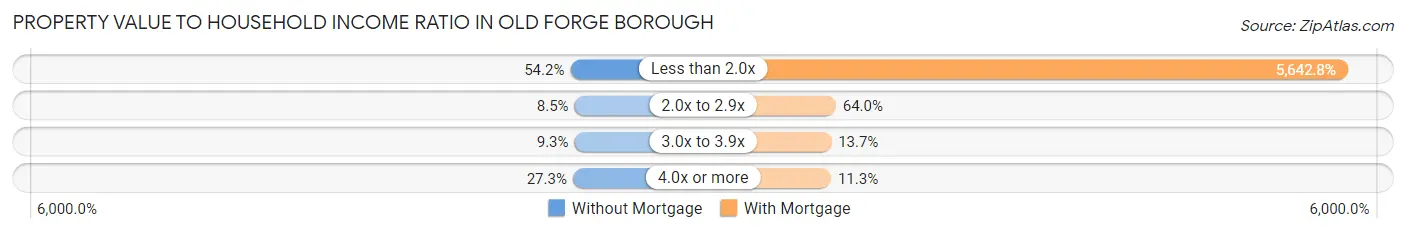
| Value-to-Income Ratio | Without Mortgage | With Mortgage |
| Less than 2.0x | 522 (54.1%) | 97,112 (5,642.8%) |
| 2.0x to 2.9x | 82 (8.5%) | 1,101 (64.0%) |
| 3.0x to 3.9x | 90 (9.3%) | 235 (13.7%) |
| 4.0x or more | 263 (27.3%) | 195 (11.3%) |
| Total | 964 (100.0%) | 1,721 (100.0%) |
Real Estate Taxes by Mortgage Status in Old Forge borough
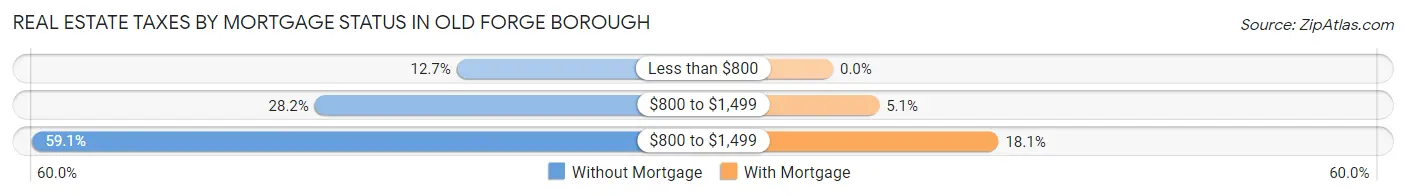
| Property Taxes | Without Mortgage | With Mortgage |
| Less than $800 | 122 (12.7%) | 0 (0.0%) |
| $800 to $1,499 | 272 (28.2%) | 87 (5.1%) |
| $800 to $1,499 | 570 (59.1%) | 312 (18.1%) |
| Total | 964 (100.0%) | 1,721 (100.0%) |
Health & Disability in Old Forge borough
Health Insurance Coverage by Age in Old Forge borough
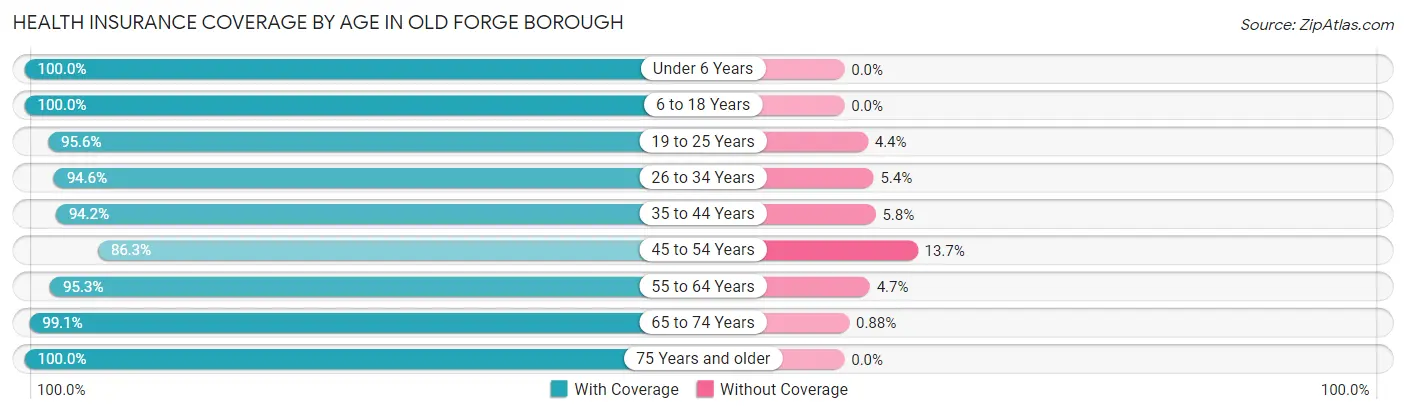
| Age Bracket | With Coverage | Without Coverage |
| Under 6 Years | 776 (100.0%) | 0 (0.0%) |
| 6 to 18 Years | 822 (100.0%) | 0 (0.0%) |
| 19 to 25 Years | 349 (95.6%) | 16 (4.4%) |
| 26 to 34 Years | 1,321 (94.6%) | 76 (5.4%) |
| 35 to 44 Years | 730 (94.2%) | 45 (5.8%) |
| 45 to 54 Years | 986 (86.3%) | 156 (13.7%) |
| 55 to 64 Years | 1,306 (95.3%) | 65 (4.7%) |
| 65 to 74 Years | 1,011 (99.1%) | 9 (0.9%) |
| 75 Years and older | 838 (100.0%) | 0 (0.0%) |
| Total | 8,139 (95.7%) | 367 (4.3%) |
Health Insurance Coverage by Citizenship Status in Old Forge borough
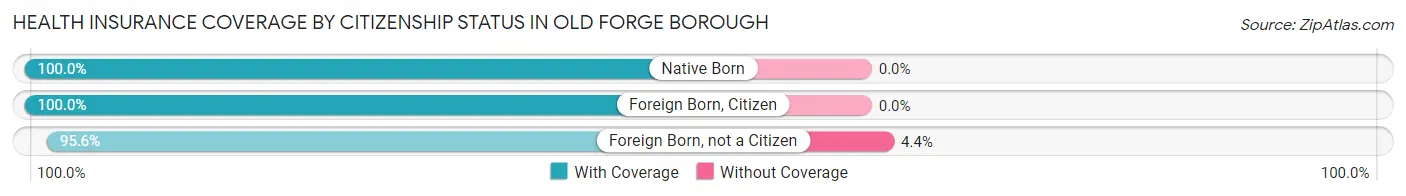
| Citizenship Status | With Coverage | Without Coverage |
| Native Born | 776 (100.0%) | 0 (0.0%) |
| Foreign Born, Citizen | 822 (100.0%) | 0 (0.0%) |
| Foreign Born, not a Citizen | 349 (95.6%) | 16 (4.4%) |
Health Insurance Coverage by Household Income in Old Forge borough
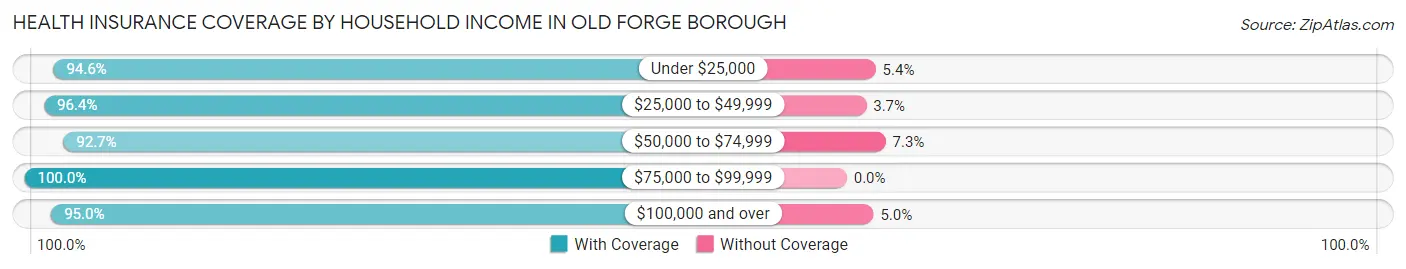
| Household Income | With Coverage | Without Coverage |
| Under $25,000 | 856 (94.6%) | 49 (5.4%) |
| $25,000 to $49,999 | 1,003 (96.4%) | 38 (3.6%) |
| $50,000 to $74,999 | 880 (92.7%) | 69 (7.3%) |
| $75,000 to $99,999 | 1,402 (100.0%) | 0 (0.0%) |
| $100,000 and over | 3,993 (95.0%) | 210 (5.0%) |
Public vs Private Health Insurance Coverage by Age in Old Forge borough
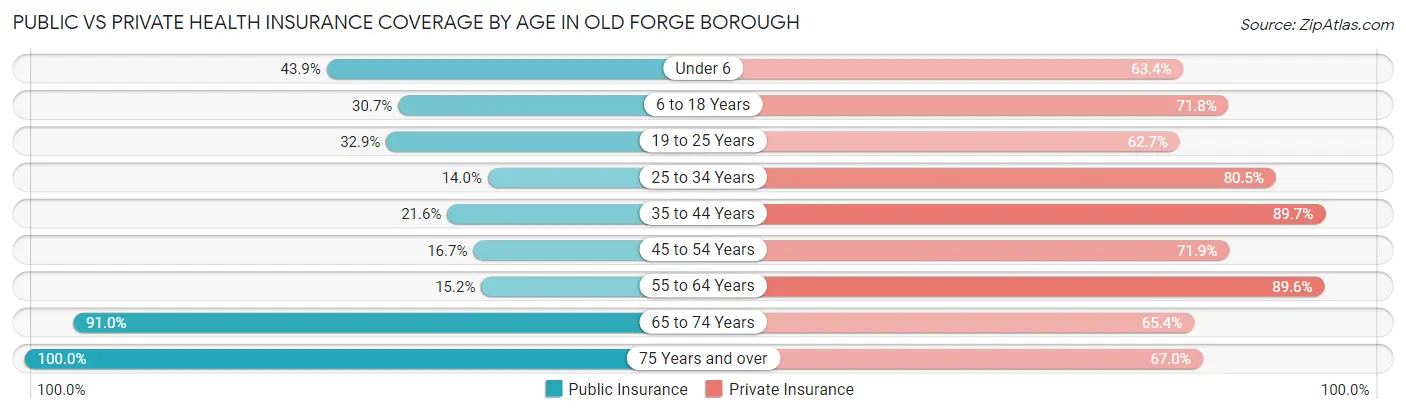
| Age Bracket | Public Insurance | Private Insurance |
| Under 6 | 341 (43.9%) | 492 (63.4%) |
| 6 to 18 Years | 252 (30.7%) | 590 (71.8%) |
| 19 to 25 Years | 120 (32.9%) | 229 (62.7%) |
| 25 to 34 Years | 196 (14.0%) | 1,125 (80.5%) |
| 35 to 44 Years | 167 (21.5%) | 695 (89.7%) |
| 45 to 54 Years | 191 (16.7%) | 821 (71.9%) |
| 55 to 64 Years | 209 (15.2%) | 1,228 (89.6%) |
| 65 to 74 Years | 928 (91.0%) | 667 (65.4%) |
| 75 Years and over | 838 (100.0%) | 561 (66.9%) |
| Total | 3,242 (38.1%) | 6,408 (75.3%) |
Disability Status by Sex by Age in Old Forge borough
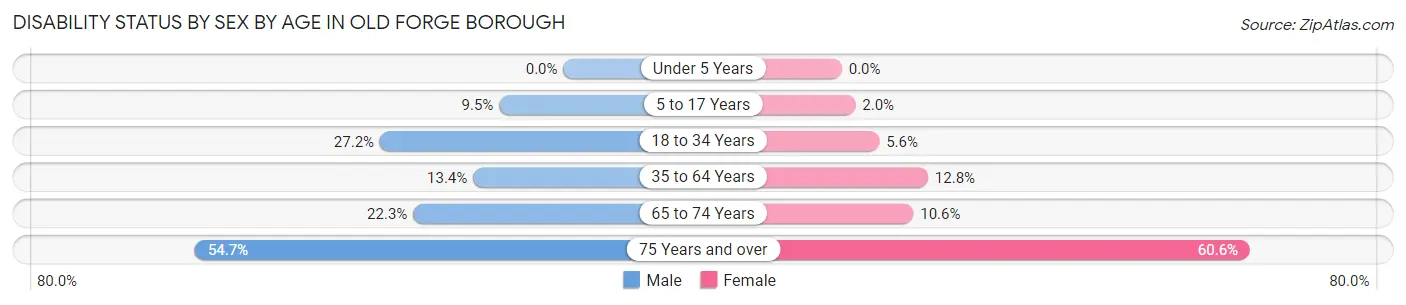
| Age Bracket | Male | Female |
| Under 5 Years | 0 (0.0%) | 0 (0.0%) |
| 5 to 17 Years | 49 (9.5%) | 8 (2.0%) |
| 18 to 34 Years | 222 (27.2%) | 56 (5.6%) |
| 35 to 64 Years | 230 (13.4%) | 201 (12.8%) |
| 65 to 74 Years | 91 (22.3%) | 65 (10.6%) |
| 75 Years and over | 221 (54.7%) | 263 (60.6%) |
Disability Class by Sex by Age in Old Forge borough
Disability Class: Hearing Difficulty
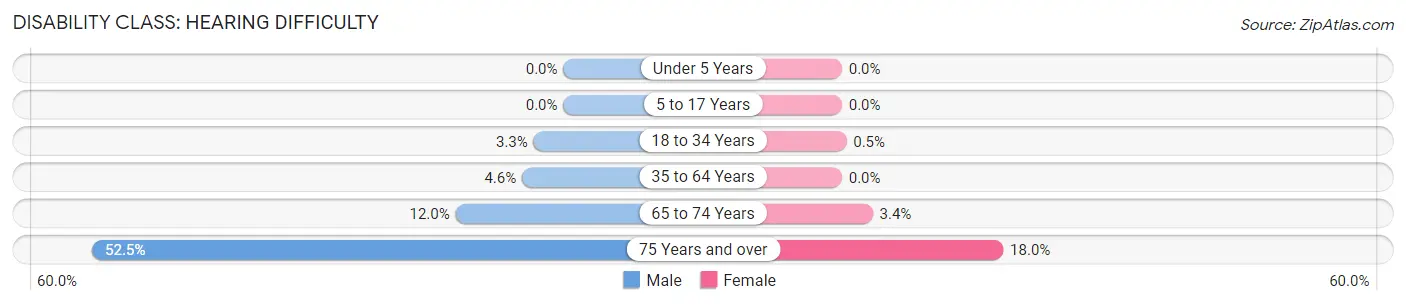
| Age Bracket | Male | Female |
| Under 5 Years | 0 (0.0%) | 0 (0.0%) |
| 5 to 17 Years | 0 (0.0%) | 0 (0.0%) |
| 18 to 34 Years | 27 (3.3%) | 5 (0.5%) |
| 35 to 64 Years | 79 (4.6%) | 0 (0.0%) |
| 65 to 74 Years | 49 (12.0%) | 21 (3.4%) |
| 75 Years and over | 212 (52.5%) | 78 (18.0%) |
Disability Class: Vision Difficulty
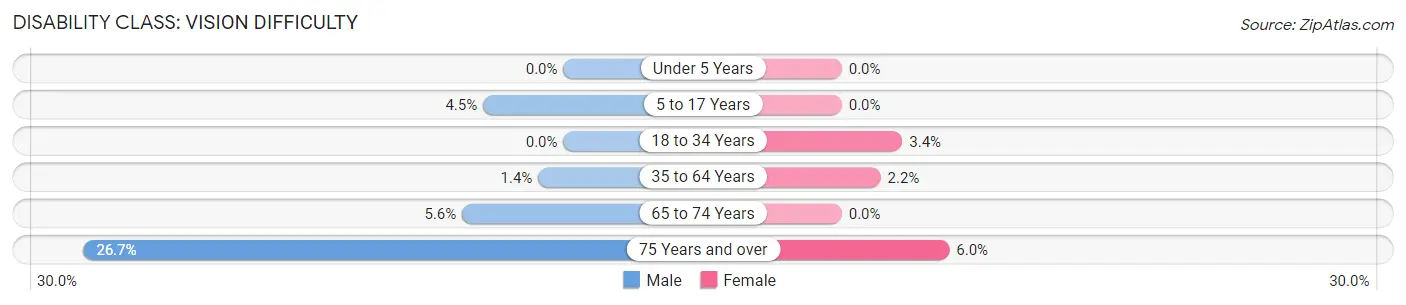
| Age Bracket | Male | Female |
| Under 5 Years | 0 (0.0%) | 0 (0.0%) |
| 5 to 17 Years | 23 (4.5%) | 0 (0.0%) |
| 18 to 34 Years | 0 (0.0%) | 34 (3.4%) |
| 35 to 64 Years | 24 (1.4%) | 34 (2.2%) |
| 65 to 74 Years | 23 (5.6%) | 0 (0.0%) |
| 75 Years and over | 108 (26.7%) | 26 (6.0%) |
Disability Class: Cognitive Difficulty
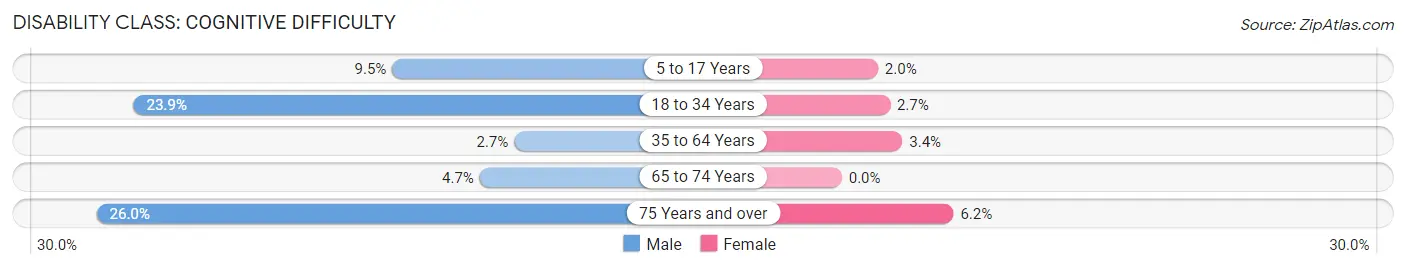
| Age Bracket | Male | Female |
| 5 to 17 Years | 49 (9.5%) | 8 (2.0%) |
| 18 to 34 Years | 195 (23.9%) | 27 (2.7%) |
| 35 to 64 Years | 47 (2.7%) | 53 (3.4%) |
| 65 to 74 Years | 19 (4.7%) | 0 (0.0%) |
| 75 Years and over | 105 (26.0%) | 27 (6.2%) |
Disability Class: Ambulatory Difficulty
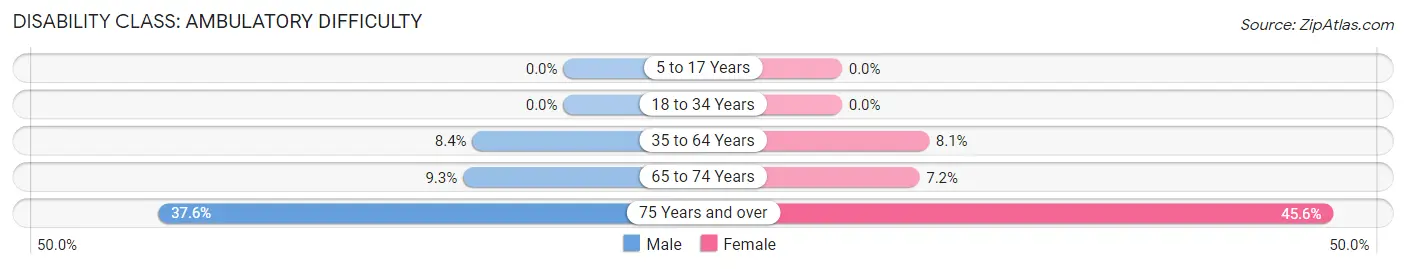
| Age Bracket | Male | Female |
| 5 to 17 Years | 0 (0.0%) | 0 (0.0%) |
| 18 to 34 Years | 0 (0.0%) | 0 (0.0%) |
| 35 to 64 Years | 145 (8.4%) | 127 (8.1%) |
| 65 to 74 Years | 38 (9.3%) | 44 (7.2%) |
| 75 Years and over | 152 (37.6%) | 198 (45.6%) |
Disability Class: Self-Care Difficulty
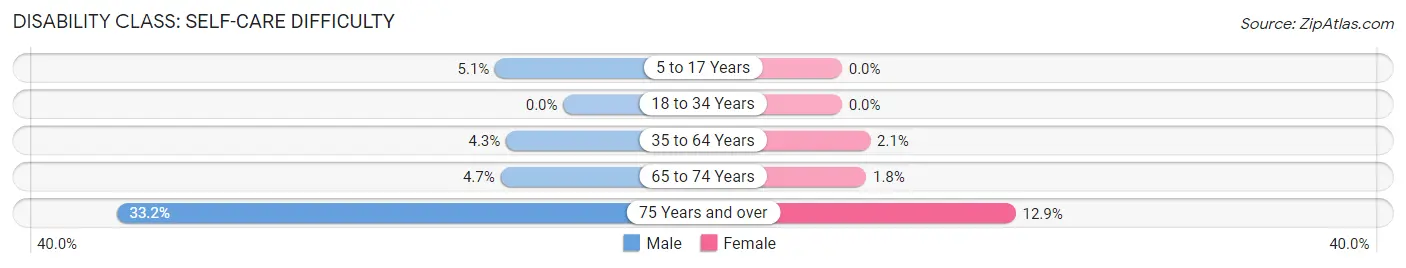
| Age Bracket | Male | Female |
| 5 to 17 Years | 26 (5.1%) | 0 (0.0%) |
| 18 to 34 Years | 0 (0.0%) | 0 (0.0%) |
| 35 to 64 Years | 73 (4.3%) | 33 (2.1%) |
| 65 to 74 Years | 19 (4.7%) | 11 (1.8%) |
| 75 Years and over | 134 (33.2%) | 56 (12.9%) |
Technology Access in Old Forge borough
Computing Device Access in Old Forge borough
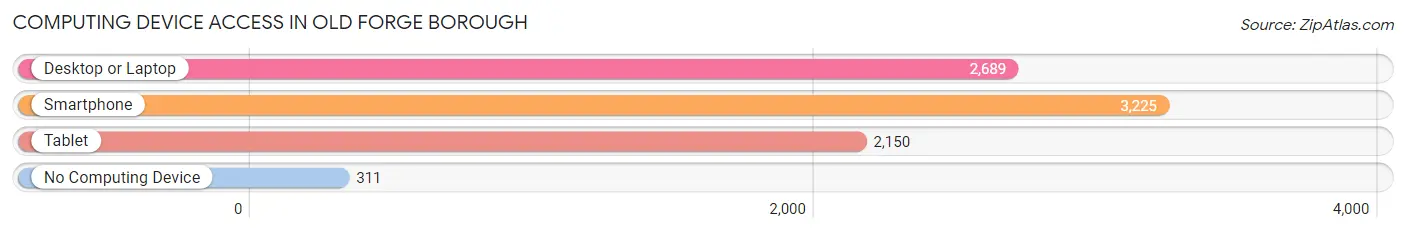
| Device Type | # Households | % Households |
| Desktop or Laptop | 2,689 | 70.7% |
| Smartphone | 3,225 | 84.9% |
| Tablet | 2,150 | 56.6% |
| No Computing Device | 311 | 8.2% |
| Total | 3,801 | 100.0% |
Internet Access in Old Forge borough

| Internet Type | # Households | % Households |
| Dial-Up Internet | 7 | 0.2% |
| Broadband Home | 2,499 | 65.7% |
| Cellular Data Only | 645 | 17.0% |
| Satellite Internet | 81 | 2.1% |
| No Internet | 598 | 15.7% |
| Total | 3,801 | 100.0% |
Old Forge borough Summary
Introduction
Old Forge Borough is a small borough located in Lackawanna County, Pennsylvania. It is situated in the northeastern part of the state, about five miles from Scranton. The borough is home to a population of approximately 4,000 people, and is known for its rich history and culture.
History
Old Forge Borough was founded in 1876 by a group of settlers from the nearby town of Carbondale. The settlers were looking for a place to build a new community, and they chose the area around the Lackawanna River. The name “Old Forge” was chosen to honor the area’s history as a former iron-working center.
The borough was incorporated in 1891, and the first mayor was elected in 1892. The first post office was established in 1895, and the first school was built in 1897.
The borough grew steadily throughout the 20th century, and by the 1950s, it had become a thriving community. The population peaked in the 1970s, but has since declined due to the decline of the local steel industry.
Geography
Old Forge Borough is located in the northeastern part of Lackawanna County, Pennsylvania. It is situated on the Lackawanna River, and is bordered by the towns of Carbondale, Dickson City, and Olyphant. The borough covers an area of 1.3 square miles, and is home to a population of approximately 4,000 people.
The borough is located in the foothills of the Pocono Mountains, and is surrounded by rolling hills and forests. The climate is humid continental, with cold winters and hot summers.
Economy
Old Forge Borough’s economy is largely based on the service industry. The borough is home to several restaurants, bars, and retail stores. There are also several manufacturing companies located in the area, including a steel mill and a paper mill.
The borough is also home to a number of small businesses, including a bakery, a florist, and a furniture store. The borough is also home to a number of professional services, such as lawyers, accountants, and doctors.
Demographics
As of the 2010 census, Old Forge Borough had a population of 4,000 people. The racial makeup of the borough was 97.2% White, 0.7% African American, 0.3% Native American, 0.3% Asian, and 1.5% from other races.
The median household income in the borough was $37,500, and the median family income was $45,000. The per capita income was $20,000. The poverty rate was 11.3%.
Conclusion
Old Forge Borough is a small borough located in Lackawanna County, Pennsylvania. It is home to a population of approximately 4,000 people, and is known for its rich history and culture. The borough’s economy is largely based on the service industry, and it is home to a number of small businesses. The borough’s population is predominantly white, with a small percentage of African Americans, Native Americans, and Asians. The median household income in the borough is $37,500, and the poverty rate is 11.3%.
Common Questions
What is Per Capita Income in Old Forge borough?
Per Capita income in Old Forge borough is $39,287.
What is the Median Family Income in Old Forge borough?
Median Family Income in Old Forge borough is $103,116.
What is the Median Household income in Old Forge borough?
Median Household Income in Old Forge borough is $71,615.
What is Income or Wage Gap in Old Forge borough?
Income or Wage Gap in Old Forge borough is 20.8%.
Women in Old Forge borough earn 79.2 cents for every dollar earned by a man.
What is Inequality or Gini Index in Old Forge borough?
Inequality or Gini Index in Old Forge borough is 0.42.
What is the Total Population of Old Forge borough?
Total Population of Old Forge borough is 8,506.
What is the Total Male Population of Old Forge borough?
Total Male Population of Old Forge borough is 4,175.
What is the Total Female Population of Old Forge borough?
Total Female Population of Old Forge borough is 4,331.
What is the Ratio of Males per 100 Females in Old Forge borough?
There are 96.40 Males per 100 Females in Old Forge borough.
What is the Ratio of Females per 100 Males in Old Forge borough?
There are 103.74 Females per 100 Males in Old Forge borough.
What is the Median Population Age in Old Forge borough?
Median Population Age in Old Forge borough is 47.2 Years.
What is the Average Family Size in Old Forge borough
Average Family Size in Old Forge borough is 3.0 People.
What is the Average Household Size in Old Forge borough
Average Household Size in Old Forge borough is 2.2 People.
How Large is the Labor Force in Old Forge borough?
There are 4,704 People in the Labor Forcein in Old Forge borough.
What is the Percentage of People in the Labor Force in Old Forge borough?
67.3% of People are in the Labor Force in Old Forge borough.
What is the Unemployment Rate in Old Forge borough?
Unemployment Rate in Old Forge borough is 5.5%.