Glenolden borough, PA Map & Demographics
Glenolden borough Overview
$35,322
PER CAPITA INCOME
$83,438
AVG FAMILY INCOME
$71,719
AVG HOUSEHOLD INCOME
36.3%
WAGE / INCOME GAP [ % ]
63.7¢/ $1
WAGE / INCOME GAP [ $ ]
0.40
INEQUALITY / GINI INDEX
7,190
TOTAL POPULATION
3,559
MALE POPULATION
3,631
FEMALE POPULATION
98.02
MALES / 100 FEMALES
102.02
FEMALES / 100 MALES
38.1
MEDIAN AGE
3.1
AVG FAMILY SIZE
2.6
AVG HOUSEHOLD SIZE
3,792
LABOR FORCE [ PEOPLE ]
68.6%
PERCENT IN LABOR FORCE
4.7%
UNEMPLOYMENT RATE
Income in Glenolden borough
Income Overview in Glenolden borough
Per Capita Income in Glenolden borough is $35,322, while median incomes of families and households are $83,438 and $71,719 respectively.
| Characteristic | Number | Measure |
| Per Capita Income | 7,190 | $35,322 |
| Median Family Income | 1,826 | $83,438 |
| Mean Family Income | 1,826 | $99,775 |
| Median Household Income | 2,795 | $71,719 |
| Mean Household Income | 2,795 | $89,380 |
| Income Deficit | 1,826 | $0 |
| Wage / Income Gap (%) | 7,190 | 36.27% |
| Wage / Income Gap ($) | 7,190 | 63.73¢ per $1 |
| Gini / Inequality Index | 7,190 | 0.40 |
Earnings by Sex in Glenolden borough
Average Earnings in Glenolden borough are $43,843, $58,077 for men and $37,010 for women, a difference of 36.3%.

| Sex | Number | Average Earnings |
| Male | 1,902 (49.9%) | $58,077 |
| Female | 1,910 (50.1%) | $37,010 |
| Total | 3,812 (100.0%) | $43,843 |
Earnings by Sex by Income Bracket in Glenolden borough
The most common earnings brackets in Glenolden borough are $100,000+ for men (397 | 20.9%) and $65,000 to $74,999 for women (215 | 11.3%).
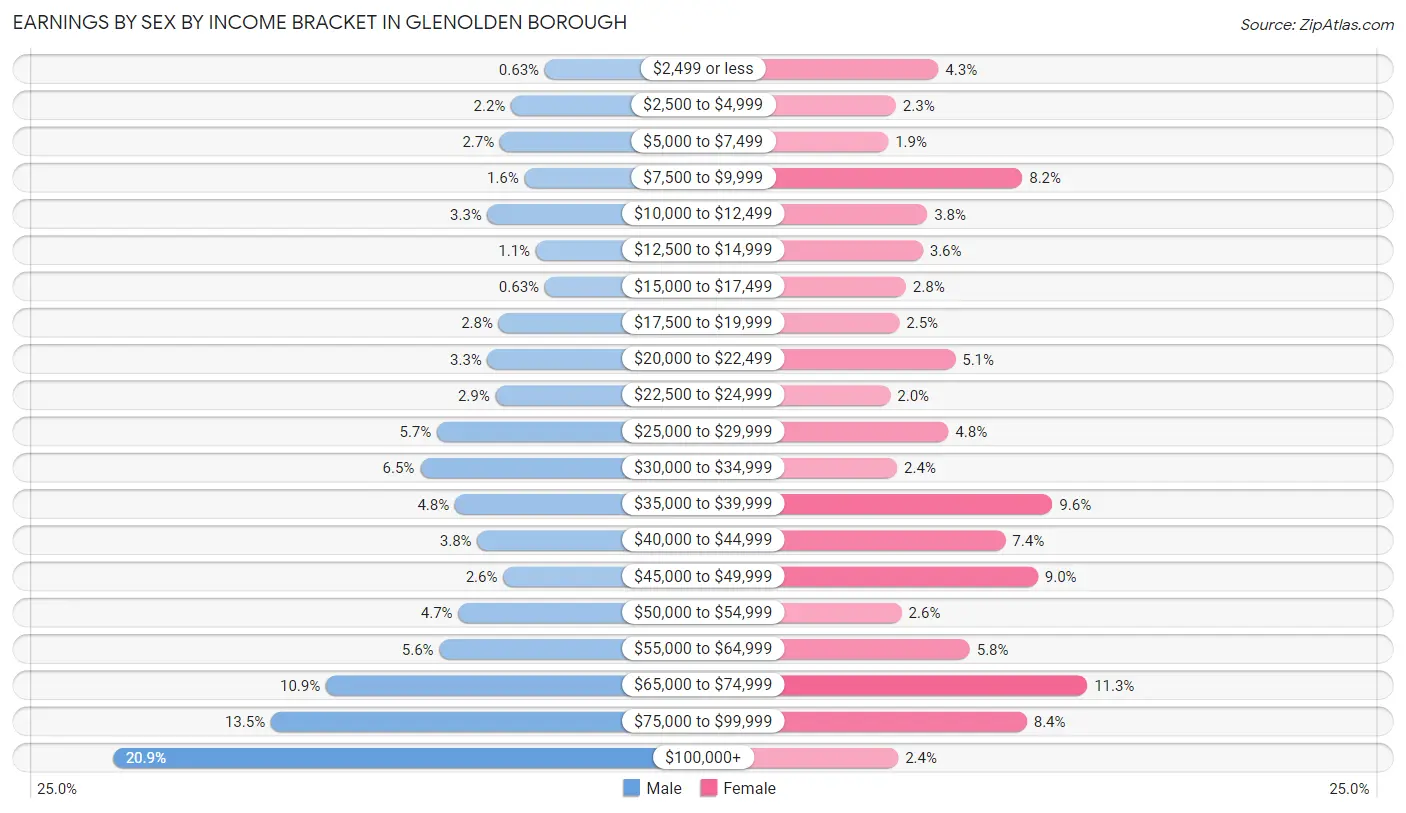
| Income | Male | Female |
| $2,499 or less | 12 (0.6%) | 82 (4.3%) |
| $2,500 to $4,999 | 42 (2.2%) | 44 (2.3%) |
| $5,000 to $7,499 | 52 (2.7%) | 37 (1.9%) |
| $7,500 to $9,999 | 30 (1.6%) | 157 (8.2%) |
| $10,000 to $12,499 | 63 (3.3%) | 72 (3.8%) |
| $12,500 to $14,999 | 20 (1.1%) | 68 (3.6%) |
| $15,000 to $17,499 | 12 (0.6%) | 53 (2.8%) |
| $17,500 to $19,999 | 53 (2.8%) | 47 (2.5%) |
| $20,000 to $22,499 | 63 (3.3%) | 97 (5.1%) |
| $22,500 to $24,999 | 56 (2.9%) | 39 (2.0%) |
| $25,000 to $29,999 | 108 (5.7%) | 91 (4.8%) |
| $30,000 to $34,999 | 123 (6.5%) | 45 (2.4%) |
| $35,000 to $39,999 | 92 (4.8%) | 184 (9.6%) |
| $40,000 to $44,999 | 72 (3.8%) | 142 (7.4%) |
| $45,000 to $49,999 | 49 (2.6%) | 171 (8.9%) |
| $50,000 to $54,999 | 89 (4.7%) | 49 (2.6%) |
| $55,000 to $64,999 | 106 (5.6%) | 110 (5.8%) |
| $65,000 to $74,999 | 207 (10.9%) | 215 (11.3%) |
| $75,000 to $99,999 | 256 (13.5%) | 161 (8.4%) |
| $100,000+ | 397 (20.9%) | 46 (2.4%) |
| Total | 1,902 (100.0%) | 1,910 (100.0%) |
Earnings by Sex by Educational Attainment in Glenolden borough
Average earnings in Glenolden borough are $61,553 for men and $41,719 for women, a difference of 32.2%. Men with an educational attainment of graduate degree enjoy the highest average annual earnings of $92,667, while those with college or associate's degree education earn the least with $58,068. Women with an educational attainment of graduate degree earn the most with the average annual earnings of $68,829, while those with high school diploma education have the smallest earnings of $29,531.
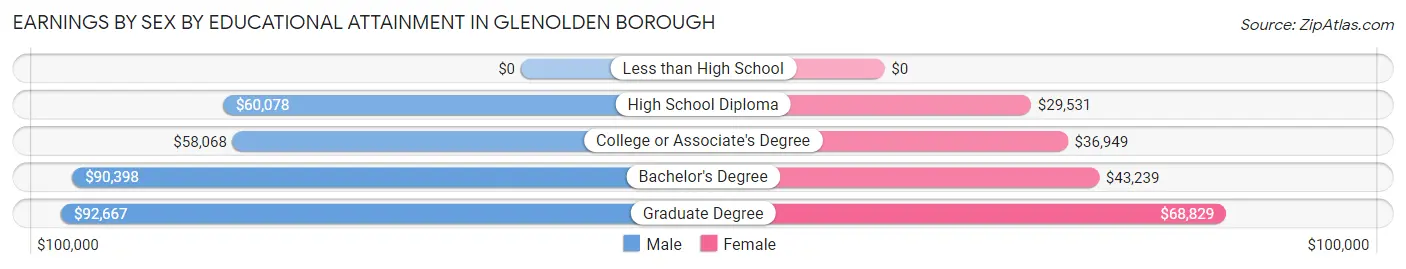
| Educational Attainment | Male Income | Female Income |
| Less than High School | - | - |
| High School Diploma | $60,078 | $29,531 |
| College or Associate's Degree | $58,068 | $36,949 |
| Bachelor's Degree | $90,398 | $43,239 |
| Graduate Degree | $92,667 | $68,829 |
| Total | $61,553 | $41,719 |
Family Income in Glenolden borough
Family Income Brackets in Glenolden borough
According to the Glenolden borough family income data, there are 411 families falling into the $50,000 to $74,999 income range, which is the most common income bracket and makes up 22.5% of all families. Conversely, the $10,000 to $14,999 income bracket is the least frequent group with only 13 families (0.7%) belonging to this category.
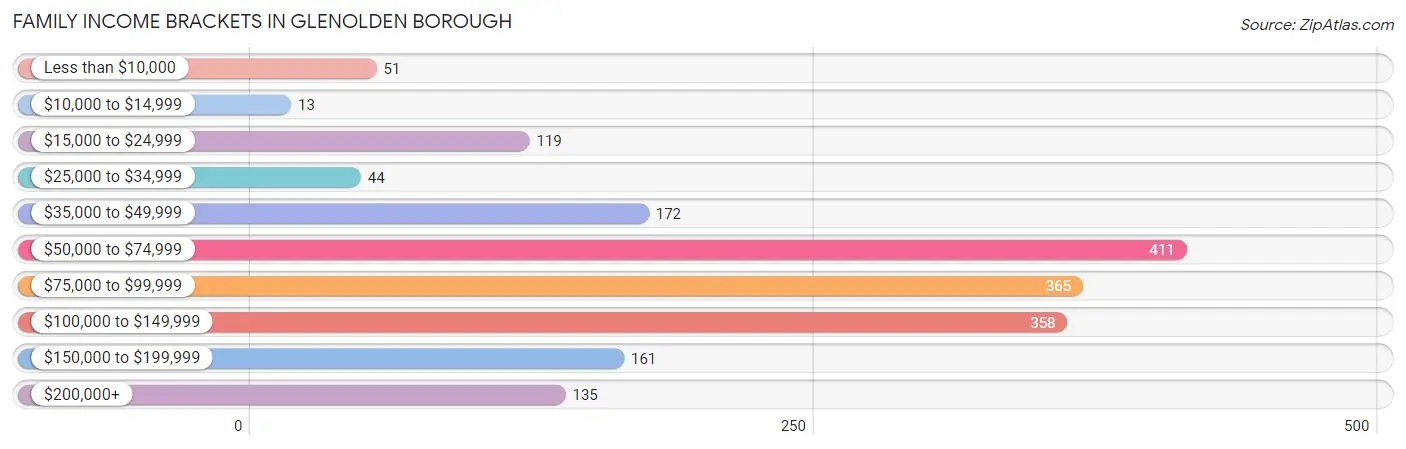
| Income Bracket | # Families | % Families |
| Less than $10,000 | 51 | 2.8% |
| $10,000 to $14,999 | 13 | 0.7% |
| $15,000 to $24,999 | 119 | 6.5% |
| $25,000 to $34,999 | 44 | 2.4% |
| $35,000 to $49,999 | 172 | 9.4% |
| $50,000 to $74,999 | 411 | 22.5% |
| $75,000 to $99,999 | 365 | 20.0% |
| $100,000 to $149,999 | 358 | 19.6% |
| $150,000 to $199,999 | 161 | 8.8% |
| $200,000+ | 135 | 7.4% |
Family Income by Famaliy Size in Glenolden borough
3-person families (502 | 27.5%) account for the highest median family income in Glenolden borough with $101,250 per family, while 3-person families (502 | 27.5%) have the highest median income of $33,750 per family member.
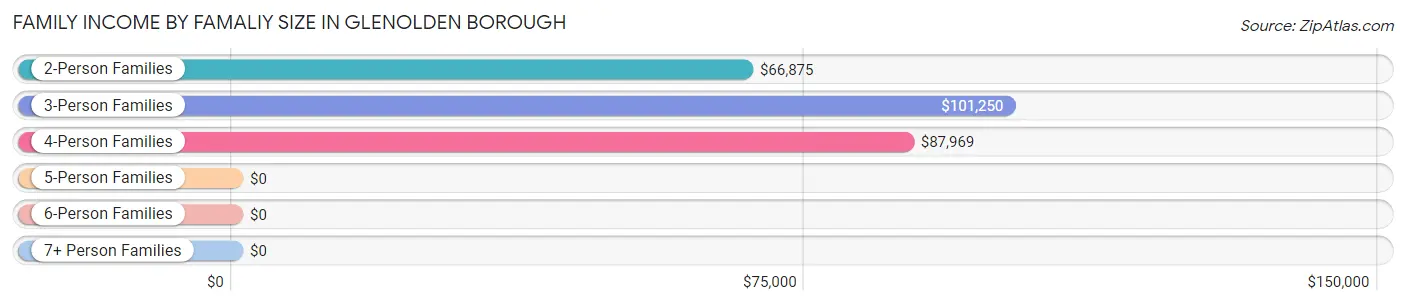
| Income Bracket | # Families | Median Income |
| 2-Person Families | 813 (44.5%) | $66,875 |
| 3-Person Families | 502 (27.5%) | $101,250 |
| 4-Person Families | 383 (21.0%) | $87,969 |
| 5-Person Families | 65 (3.6%) | $0 |
| 6-Person Families | 17 (0.9%) | $0 |
| 7+ Person Families | 46 (2.5%) | $0 |
| Total | 1,826 (100.0%) | $83,438 |
Family Income by Number of Earners in Glenolden borough
The median family income in Glenolden borough is $83,438, with families comprising 2 earners (576) having the highest median family income of $124,609, while families with no earners (250) have the lowest median family income of $31,250, accounting for 31.5% and 13.7% of families, respectively.
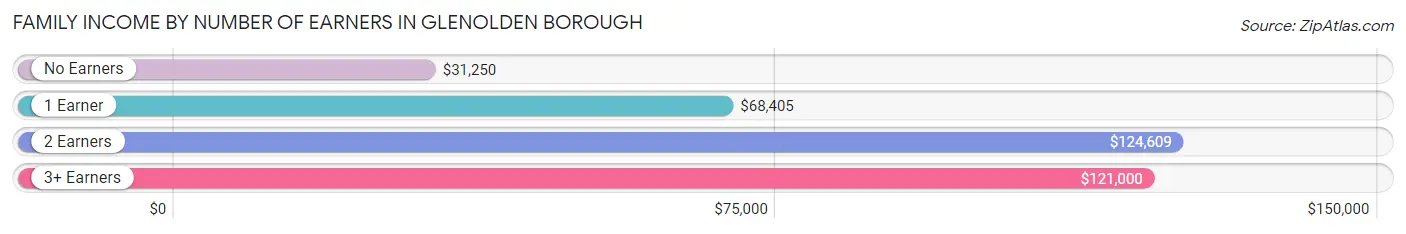
| Number of Earners | # Families | Median Income |
| No Earners | 250 (13.7%) | $31,250 |
| 1 Earner | 740 (40.5%) | $68,405 |
| 2 Earners | 576 (31.5%) | $124,609 |
| 3+ Earners | 260 (14.2%) | $121,000 |
| Total | 1,826 (100.0%) | $83,438 |
Household Income in Glenolden borough
Household Income Brackets in Glenolden borough
With 553 households falling in the category, the $50,000 to $74,999 income range is the most frequent in Glenolden borough, accounting for 19.8% of all households. In contrast, only 39 households (1.4%) fall into the $10,000 to $14,999 income bracket, making it the least populous group.
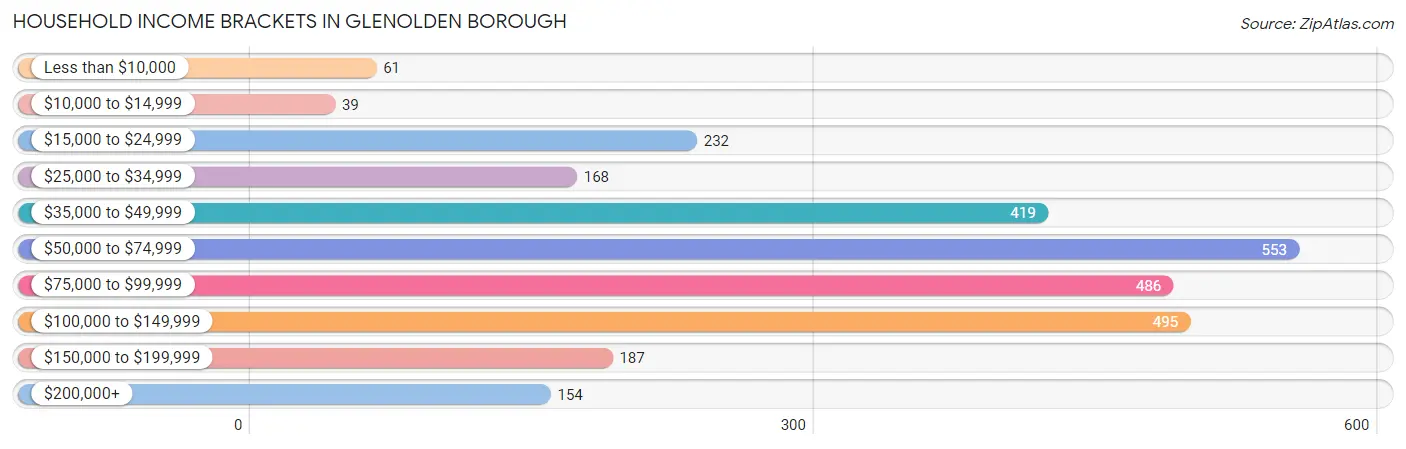
| Income Bracket | # Households | % Households |
| Less than $10,000 | 61 | 2.2% |
| $10,000 to $14,999 | 39 | 1.4% |
| $15,000 to $24,999 | 232 | 8.3% |
| $25,000 to $34,999 | 168 | 6.0% |
| $35,000 to $49,999 | 419 | 15.0% |
| $50,000 to $74,999 | 553 | 19.8% |
| $75,000 to $99,999 | 486 | 17.4% |
| $100,000 to $149,999 | 495 | 17.7% |
| $150,000 to $199,999 | 187 | 6.7% |
| $200,000+ | 154 | 5.5% |
Household Income by Householder Age in Glenolden borough
The median household income in Glenolden borough is $71,719, with the highest median household income of $86,622 found in the 45 to 64 years age bracket for the primary householder. A total of 1,012 households (36.2%) fall into this category. Meanwhile, the 15 to 24 years age bracket for the primary householder has the lowest median household income of $31,477, with 101 households (3.6%) in this group.
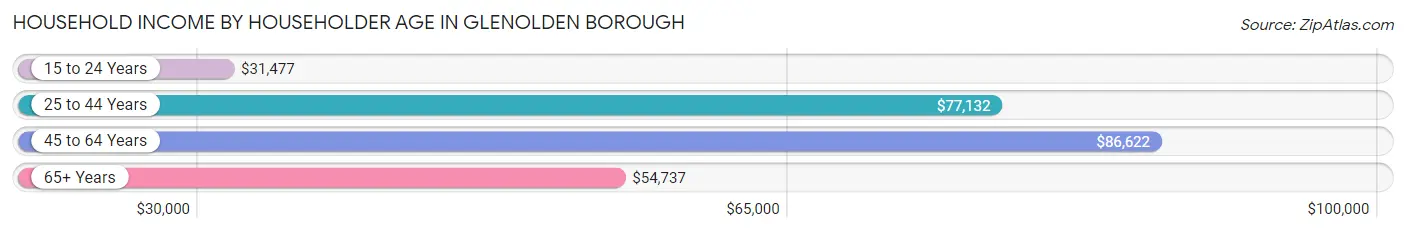
| Income Bracket | # Households | Median Income |
| 15 to 24 Years | 101 (3.6%) | $31,477 |
| 25 to 44 Years | 1,004 (35.9%) | $77,132 |
| 45 to 64 Years | 1,012 (36.2%) | $86,622 |
| 65+ Years | 678 (24.3%) | $54,737 |
| Total | 2,795 (100.0%) | $71,719 |
Poverty in Glenolden borough
Income Below Poverty by Sex and Age in Glenolden borough
With 8.9% poverty level for males and 20.4% for females among the residents of Glenolden borough, 15 year old males and 6 to 11 year old females are the most vulnerable to poverty, with 34 males (59.7%) and 136 females (63.5%) in their respective age groups living below the poverty level.
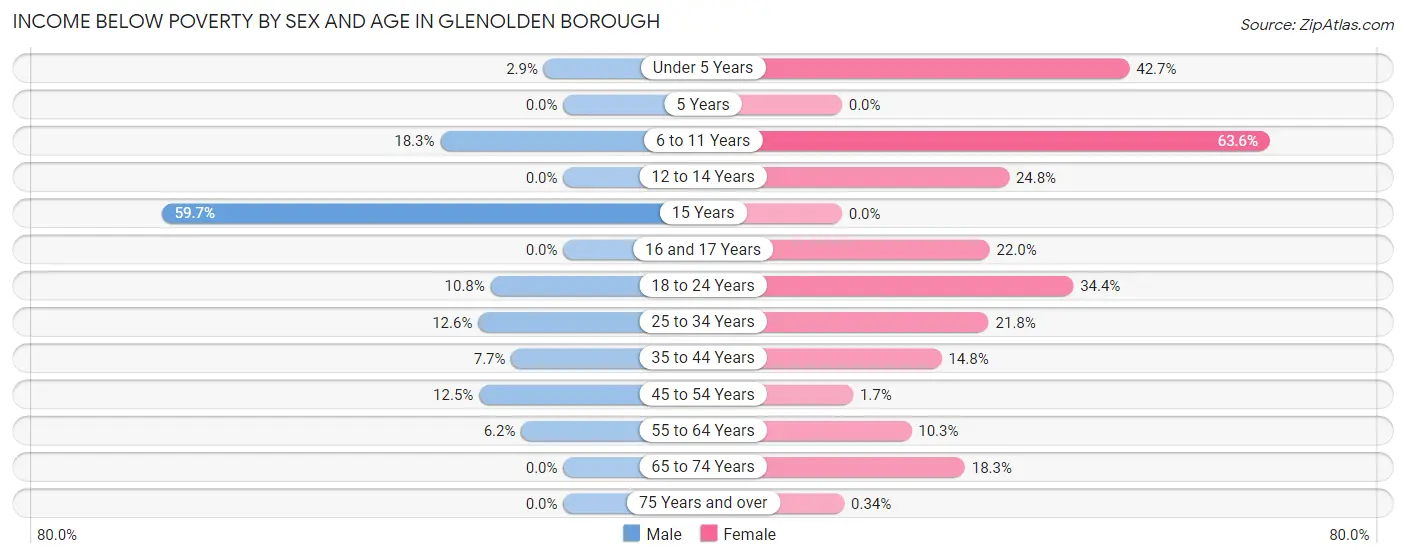
| Age Bracket | Male | Female |
| Under 5 Years | 10 (2.9%) | 181 (42.7%) |
| 5 Years | 0 (0.0%) | 0 (0.0%) |
| 6 to 11 Years | 57 (18.3%) | 136 (63.5%) |
| 12 to 14 Years | 0 (0.0%) | 34 (24.8%) |
| 15 Years | 34 (59.7%) | 0 (0.0%) |
| 16 and 17 Years | 0 (0.0%) | 9 (22.0%) |
| 18 to 24 Years | 27 (10.8%) | 78 (34.4%) |
| 25 to 34 Years | 67 (12.6%) | 97 (21.8%) |
| 35 to 44 Years | 37 (7.7%) | 90 (14.8%) |
| 45 to 54 Years | 51 (12.5%) | 7 (1.7%) |
| 55 to 64 Years | 33 (6.2%) | 48 (10.3%) |
| 65 to 74 Years | 0 (0.0%) | 57 (18.3%) |
| 75 Years and over | 0 (0.0%) | 1 (0.3%) |
| Total | 316 (8.9%) | 738 (20.4%) |
Income Above Poverty by Sex and Age in Glenolden borough
According to the poverty statistics in Glenolden borough, males aged 5 years and females aged 5 years are the age groups that are most secure financially, with 100.0% of males and 100.0% of females in these age groups living above the poverty line.
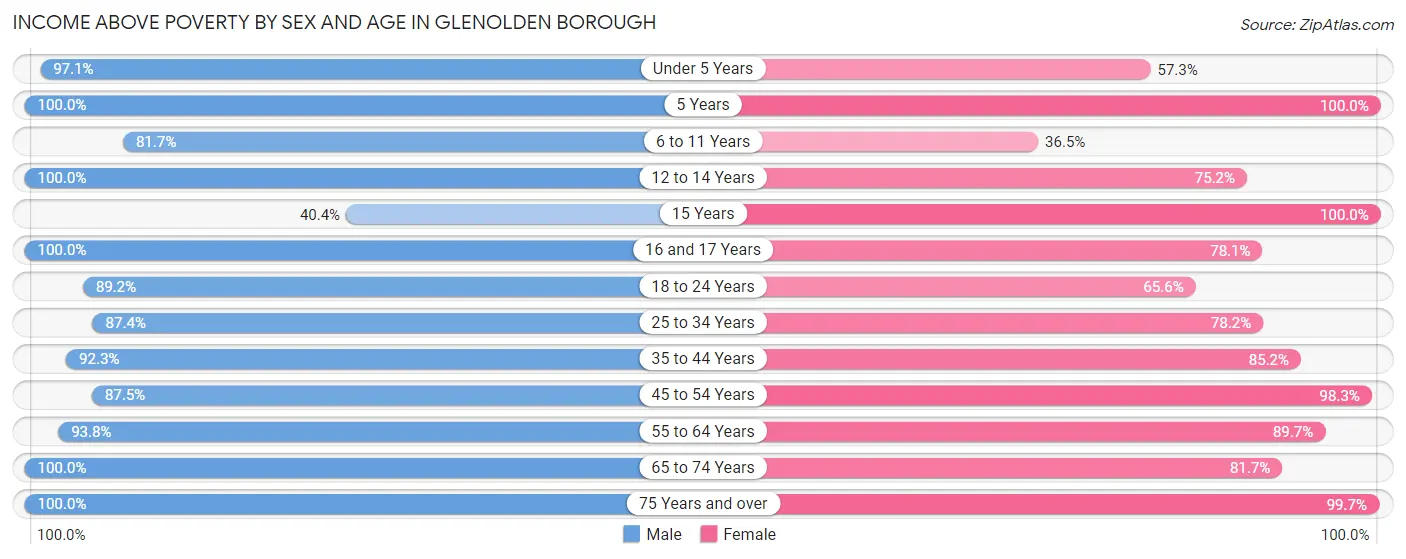
| Age Bracket | Male | Female |
| Under 5 Years | 335 (97.1%) | 243 (57.3%) |
| 5 Years | 82 (100.0%) | 16 (100.0%) |
| 6 to 11 Years | 255 (81.7%) | 78 (36.4%) |
| 12 to 14 Years | 46 (100.0%) | 103 (75.2%) |
| 15 Years | 23 (40.4%) | 17 (100.0%) |
| 16 and 17 Years | 59 (100.0%) | 32 (78.0%) |
| 18 to 24 Years | 223 (89.2%) | 149 (65.6%) |
| 25 to 34 Years | 463 (87.4%) | 348 (78.2%) |
| 35 to 44 Years | 442 (92.3%) | 518 (85.2%) |
| 45 to 54 Years | 357 (87.5%) | 414 (98.3%) |
| 55 to 64 Years | 496 (93.8%) | 417 (89.7%) |
| 65 to 74 Years | 260 (100.0%) | 255 (81.7%) |
| 75 Years and over | 202 (100.0%) | 291 (99.7%) |
| Total | 3,243 (91.1%) | 2,881 (79.6%) |
Income Below Poverty Among Married-Couple Families in Glenolden borough
The poverty statistics for married-couple families in Glenolden borough show that 1.2% or 13 of the total 1,053 families live below the poverty line. Families with 1 or 2 children have the highest poverty rate of 3.0%, comprising of 13 families. On the other hand, families with no children have the lowest poverty rate of 0.0%, which includes 0 families.
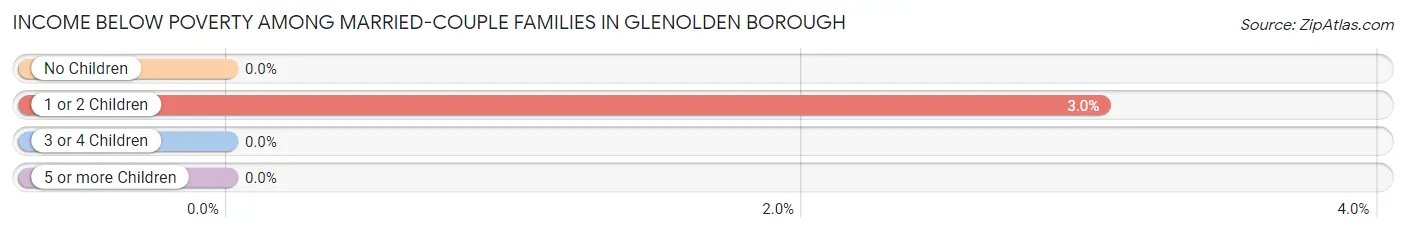
| Children | Above Poverty | Below Poverty |
| No Children | 605 (100.0%) | 0 (0.0%) |
| 1 or 2 Children | 415 (97.0%) | 13 (3.0%) |
| 3 or 4 Children | 20 (100.0%) | 0 (0.0%) |
| 5 or more Children | 0 (0.0%) | 0 (0.0%) |
| Total | 1,040 (98.8%) | 13 (1.2%) |
Income Below Poverty Among Single-Parent Households in Glenolden borough
According to the poverty data in Glenolden borough, 12.2% or 24 single-father households and 26.4% or 152 single-mother households are living below the poverty line. Among single-father households, those with no children have the highest poverty rate, with 24 households (18.9%) experiencing poverty. Likewise, among single-mother households, those with 5 or more children have the highest poverty rate, with 24 households (100.0%) falling below the poverty line.
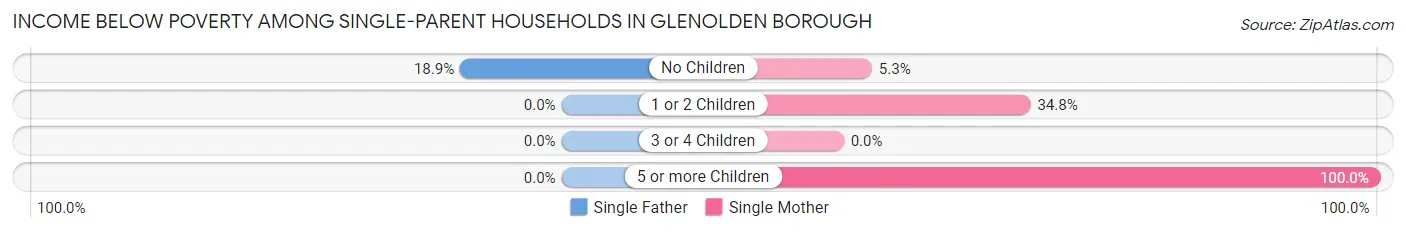
| Children | Single Father | Single Mother |
| No Children | 24 (18.9%) | 9 (5.3%) |
| 1 or 2 Children | 0 (0.0%) | 119 (34.8%) |
| 3 or 4 Children | 0 (0.0%) | 0 (0.0%) |
| 5 or more Children | 0 (0.0%) | 24 (100.0%) |
| Total | 24 (12.2%) | 152 (26.4%) |
Income Below Poverty Among Married-Couple vs Single-Parent Households in Glenolden borough
The poverty data for Glenolden borough shows that 13 of the married-couple family households (1.2%) and 176 of the single-parent households (22.8%) are living below the poverty level. Within the married-couple family households, those with 1 or 2 children have the highest poverty rate, with 13 households (3.0%) falling below the poverty line. Among the single-parent households, those with 5 or more children have the highest poverty rate, with 24 household (100.0%) living below poverty.
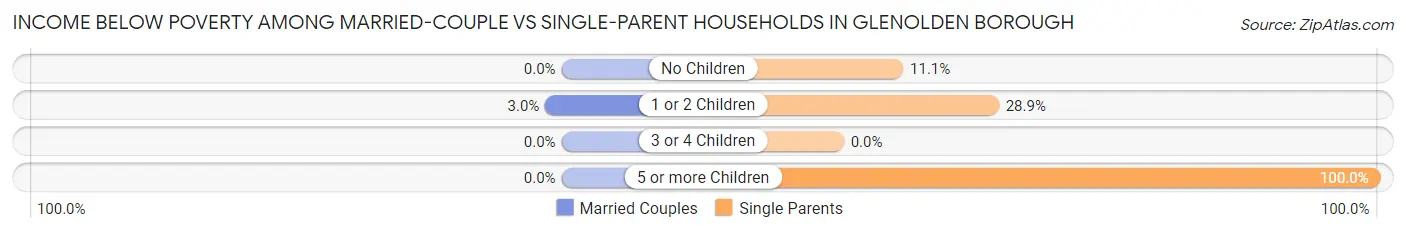
| Children | Married-Couple Families | Single-Parent Households |
| No Children | 0 (0.0%) | 33 (11.1%) |
| 1 or 2 Children | 13 (3.0%) | 119 (28.9%) |
| 3 or 4 Children | 0 (0.0%) | 0 (0.0%) |
| 5 or more Children | 0 (0.0%) | 24 (100.0%) |
| Total | 13 (1.2%) | 176 (22.8%) |
Race in Glenolden borough
The most populous races in Glenolden borough are White / Caucasian (5,742 | 79.9%), Black / African American (923 | 12.8%), and Two or more Races (308 | 4.3%).
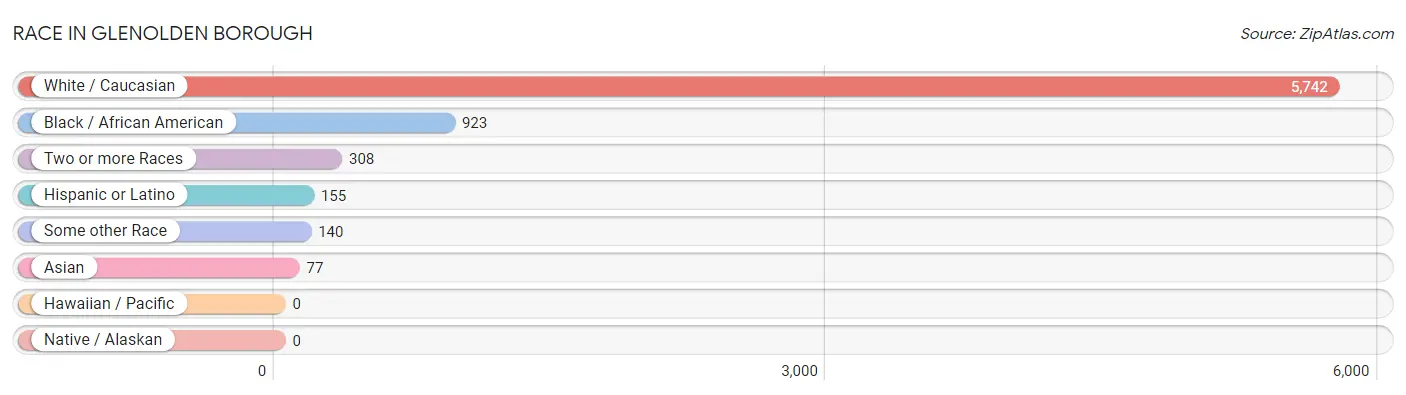
| Race | # Population | % Population |
| Asian | 77 | 1.1% |
| Black / African American | 923 | 12.8% |
| Hawaiian / Pacific | 0 | 0.0% |
| Hispanic or Latino | 155 | 2.2% |
| Native / Alaskan | 0 | 0.0% |
| White / Caucasian | 5,742 | 79.9% |
| Two or more Races | 308 | 4.3% |
| Some other Race | 140 | 1.9% |
| Total | 7,190 | 100.0% |
Ancestry in Glenolden borough
The most populous ancestries reported in Glenolden borough are Irish (2,349 | 32.7%), German (1,799 | 25.0%), Italian (1,643 | 22.9%), English (418 | 5.8%), and Polish (340 | 4.7%), together accounting for 91.1% of all Glenolden borough residents.
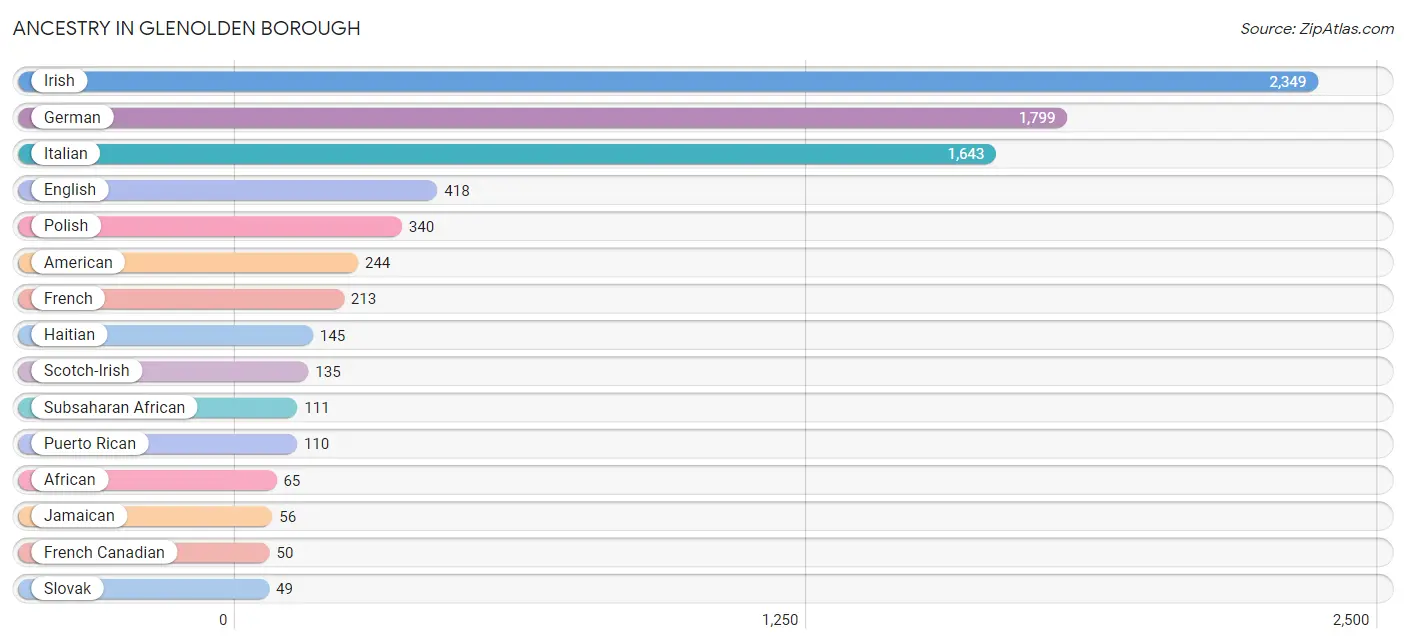
| Ancestry | # Population | % Population |
| African | 65 | 0.9% |
| American | 244 | 3.4% |
| Arab | 34 | 0.5% |
| Armenian | 34 | 0.5% |
| Bahamian | 13 | 0.2% |
| Bangladeshi | 10 | 0.1% |
| Brazilian | 10 | 0.1% |
| British | 1 | 0.0% |
| Burmese | 7 | 0.1% |
| Cherokee | 6 | 0.1% |
| Chilean | 21 | 0.3% |
| Czech | 5 | 0.1% |
| Danish | 9 | 0.1% |
| Dominican | 14 | 0.2% |
| Dutch | 14 | 0.2% |
| English | 418 | 5.8% |
| European | 36 | 0.5% |
| French | 213 | 3.0% |
| French Canadian | 50 | 0.7% |
| German | 1,799 | 25.0% |
| Ghanaian | 11 | 0.2% |
| Greek | 18 | 0.3% |
| Haitian | 145 | 2.0% |
| Hungarian | 4 | 0.1% |
| Indian (Asian) | 15 | 0.2% |
| Irish | 2,349 | 32.7% |
| Italian | 1,643 | 22.9% |
| Jamaican | 56 | 0.8% |
| Jordanian | 34 | 0.5% |
| Liberian | 46 | 0.6% |
| Lithuanian | 44 | 0.6% |
| Mexican | 10 | 0.1% |
| Nigerian | 15 | 0.2% |
| Pakistani | 16 | 0.2% |
| Pennsylvania German | 22 | 0.3% |
| Polish | 340 | 4.7% |
| Portuguese | 11 | 0.2% |
| Puerto Rican | 110 | 1.5% |
| Romanian | 15 | 0.2% |
| Russian | 33 | 0.5% |
| Scotch-Irish | 135 | 1.9% |
| Scottish | 48 | 0.7% |
| Slavic | 11 | 0.2% |
| Slovak | 49 | 0.7% |
| South American | 21 | 0.3% |
| Subsaharan African | 111 | 1.5% |
| Swedish | 19 | 0.3% |
| Swiss | 20 | 0.3% |
| Trinidadian and Tobagonian | 5 | 0.1% |
| U.S. Virgin Islander | 14 | 0.2% |
| Welsh | 9 | 0.1% | View All 51 Rows |
Immigrants in Glenolden borough
The most numerous immigrant groups reported in Glenolden borough came from Latin America (92 | 1.3%), Asia (87 | 1.2%), Africa (72 | 1.0%), Western Africa (72 | 1.0%), and Caribbean (61 | 0.9%), together accounting for 5.3% of all Glenolden borough residents.
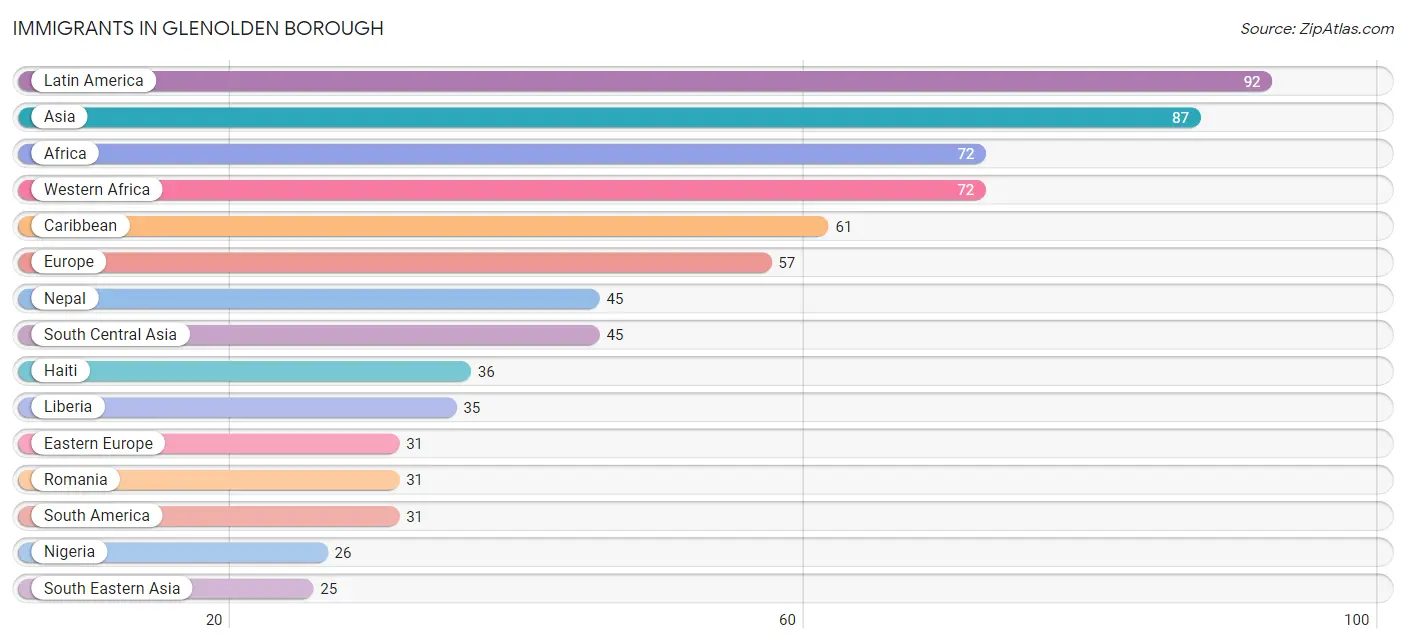
| Immigration Origin | # Population | % Population |
| Africa | 72 | 1.0% |
| Asia | 87 | 1.2% |
| Bahamas | 13 | 0.2% |
| Brazil | 10 | 0.1% |
| Caribbean | 61 | 0.9% |
| Chile | 21 | 0.3% |
| Eastern Asia | 7 | 0.1% |
| Eastern Europe | 31 | 0.4% |
| Europe | 57 | 0.8% |
| Germany | 19 | 0.3% |
| Ghana | 11 | 0.2% |
| Haiti | 36 | 0.5% |
| Indonesia | 15 | 0.2% |
| Ireland | 7 | 0.1% |
| Jamaica | 7 | 0.1% |
| Jordan | 10 | 0.1% |
| Korea | 7 | 0.1% |
| Latin America | 92 | 1.3% |
| Liberia | 35 | 0.5% |
| Nepal | 45 | 0.6% |
| Nigeria | 26 | 0.4% |
| Northern Europe | 7 | 0.1% |
| Romania | 31 | 0.4% |
| South America | 31 | 0.4% |
| South Central Asia | 45 | 0.6% |
| South Eastern Asia | 25 | 0.4% |
| Thailand | 10 | 0.1% |
| Trinidad and Tobago | 5 | 0.1% |
| Western Africa | 72 | 1.0% |
| Western Asia | 10 | 0.1% |
| Western Europe | 19 | 0.3% | View All 31 Rows |
Sex and Age in Glenolden borough
Sex and Age in Glenolden borough
The most populous age groups in Glenolden borough are Under 5 Years (345 | 9.7%) for men and Under 5 Years (424 | 11.7%) for women.
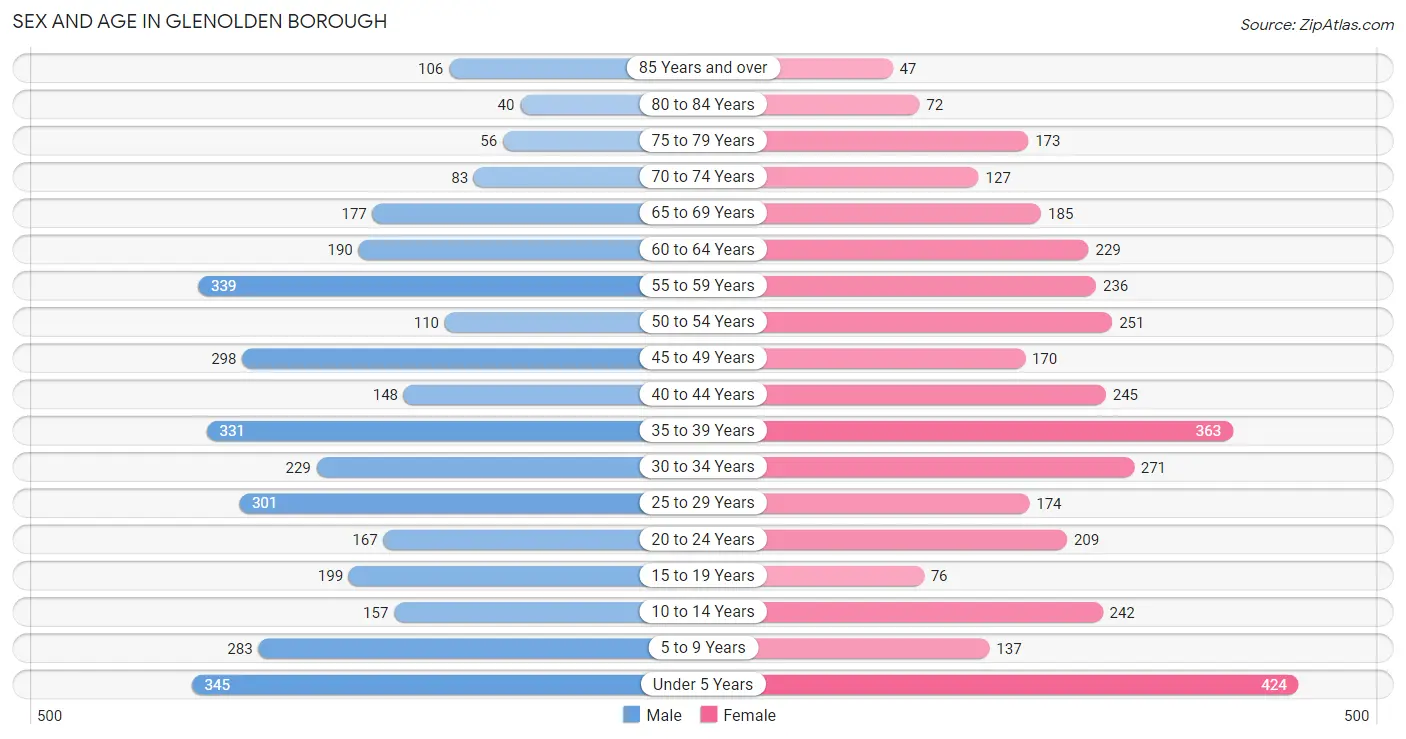
| Age Bracket | Male | Female |
| Under 5 Years | 345 (9.7%) | 424 (11.7%) |
| 5 to 9 Years | 283 (8.0%) | 137 (3.8%) |
| 10 to 14 Years | 157 (4.4%) | 242 (6.7%) |
| 15 to 19 Years | 199 (5.6%) | 76 (2.1%) |
| 20 to 24 Years | 167 (4.7%) | 209 (5.8%) |
| 25 to 29 Years | 301 (8.5%) | 174 (4.8%) |
| 30 to 34 Years | 229 (6.4%) | 271 (7.5%) |
| 35 to 39 Years | 331 (9.3%) | 363 (10.0%) |
| 40 to 44 Years | 148 (4.2%) | 245 (6.8%) |
| 45 to 49 Years | 298 (8.4%) | 170 (4.7%) |
| 50 to 54 Years | 110 (3.1%) | 251 (6.9%) |
| 55 to 59 Years | 339 (9.5%) | 236 (6.5%) |
| 60 to 64 Years | 190 (5.3%) | 229 (6.3%) |
| 65 to 69 Years | 177 (5.0%) | 185 (5.1%) |
| 70 to 74 Years | 83 (2.3%) | 127 (3.5%) |
| 75 to 79 Years | 56 (1.6%) | 173 (4.8%) |
| 80 to 84 Years | 40 (1.1%) | 72 (2.0%) |
| 85 Years and over | 106 (3.0%) | 47 (1.3%) |
| Total | 3,559 (100.0%) | 3,631 (100.0%) |
Families and Households in Glenolden borough
Median Family Size in Glenolden borough
The median family size in Glenolden borough is 3.13 persons per family, with single female/mother families (576 | 31.5%) accounting for the largest median family size of 3.37 persons per family. On the other hand, single male/father families (197 | 10.8%) represent the smallest median family size with 2.48 persons per family.
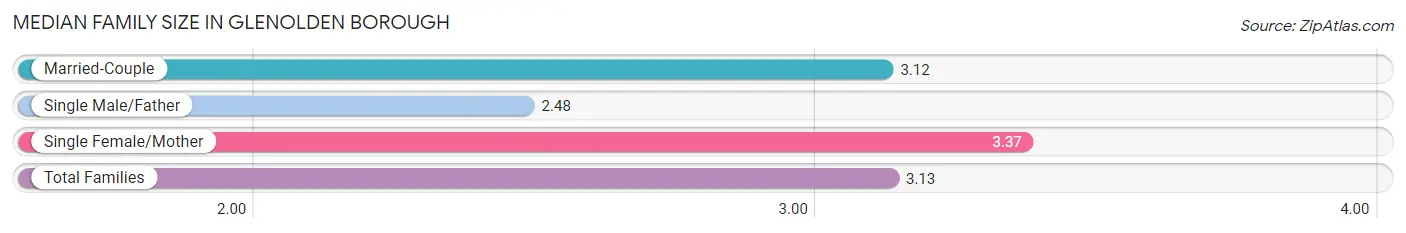
| Family Type | # Families | Family Size |
| Married-Couple | 1,053 (57.7%) | 3.12 |
| Single Male/Father | 197 (10.8%) | 2.48 |
| Single Female/Mother | 576 (31.5%) | 3.37 |
| Total Families | 1,826 (100.0%) | 3.13 |
Median Household Size in Glenolden borough
The median household size in Glenolden borough is 2.57 persons per household, with single female/mother households (576 | 20.6%) accounting for the largest median household size of 3.66 persons per household. non-family households (969 | 34.7%) represent the smallest median household size with 1.26 persons per household.
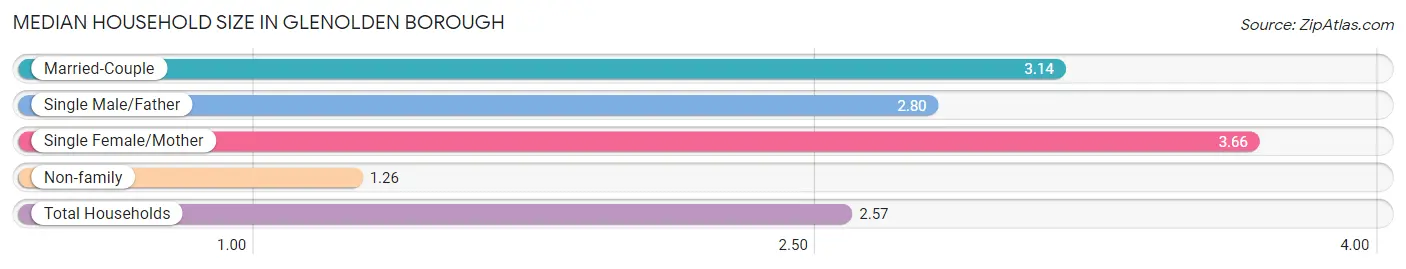
| Household Type | # Households | Household Size |
| Married-Couple | 1,053 (37.7%) | 3.14 |
| Single Male/Father | 197 (7.0%) | 2.80 |
| Single Female/Mother | 576 (20.6%) | 3.66 |
| Non-family | 969 (34.7%) | 1.26 |
| Total Households | 2,795 (100.0%) | 2.57 |
Household Size by Marriage Status in Glenolden borough
Out of a total of 2,795 households in Glenolden borough, 1,826 (65.3%) are family households, while 969 (34.7%) are nonfamily households. The most numerous type of family households are 2-person households, comprising 713, and the most common type of nonfamily households are 1-person households, comprising 747.
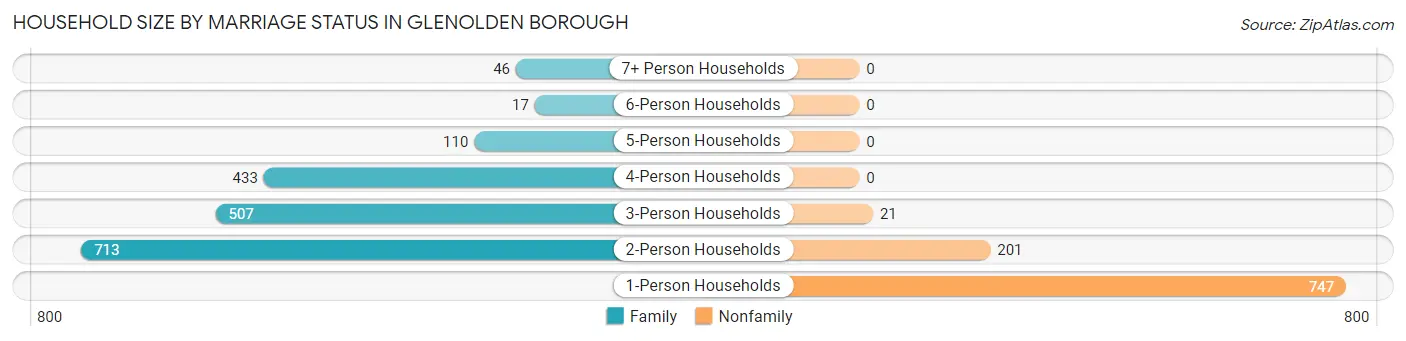
| Household Size | Family Households | Nonfamily Households |
| 1-Person Households | - | 747 (26.7%) |
| 2-Person Households | 713 (25.5%) | 201 (7.2%) |
| 3-Person Households | 507 (18.1%) | 21 (0.7%) |
| 4-Person Households | 433 (15.5%) | 0 (0.0%) |
| 5-Person Households | 110 (3.9%) | 0 (0.0%) |
| 6-Person Households | 17 (0.6%) | 0 (0.0%) |
| 7+ Person Households | 46 (1.7%) | 0 (0.0%) |
| Total | 1,826 (65.3%) | 969 (34.7%) |
Female Fertility in Glenolden borough
Fertility by Age in Glenolden borough
Average fertility rate in Glenolden borough is 43.0 births per 1,000 women. Women in the age bracket of 20 to 34 years have the highest fertility rate with 64.0 births per 1,000 women. Women in the age bracket of 20 to 34 years acount for 62.7% of all women with births.
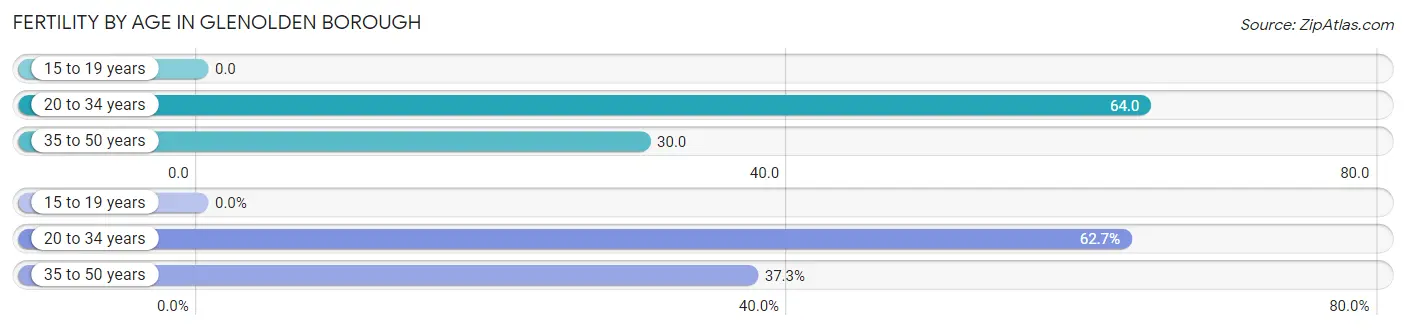
| Age Bracket | Women with Births | Births / 1,000 Women |
| 15 to 19 years | 0 (0.0%) | 0.0 |
| 20 to 34 years | 42 (62.7%) | 64.0 |
| 35 to 50 years | 25 (37.3%) | 30.0 |
| Total | 67 (100.0%) | 43.0 |
Fertility by Age by Marriage Status in Glenolden borough
65.7% of women with births (67) in Glenolden borough are married. The highest percentage of unmarried women with births falls into 20 to 34 years age bracket with 54.8% of them unmarried at the time of birth, while the lowest percentage of unmarried women with births belong to 35 to 50 years age bracket with 0.0% of them unmarried.
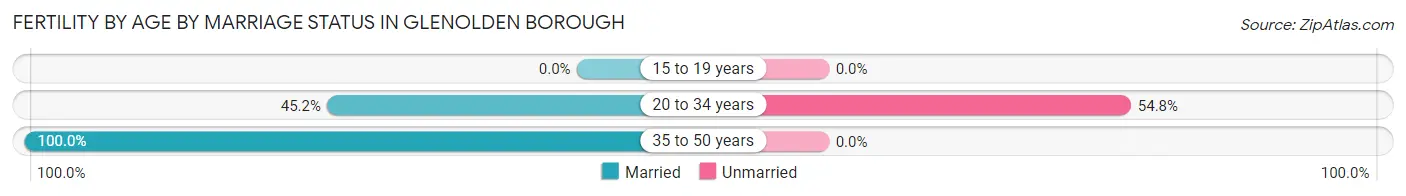
| Age Bracket | Married | Unmarried |
| 15 to 19 years | 0 (0.0%) | 0 (0.0%) |
| 20 to 34 years | 19 (45.2%) | 23 (54.8%) |
| 35 to 50 years | 25 (100.0%) | 0 (0.0%) |
| Total | 44 (65.7%) | 23 (34.3%) |
Fertility by Education in Glenolden borough
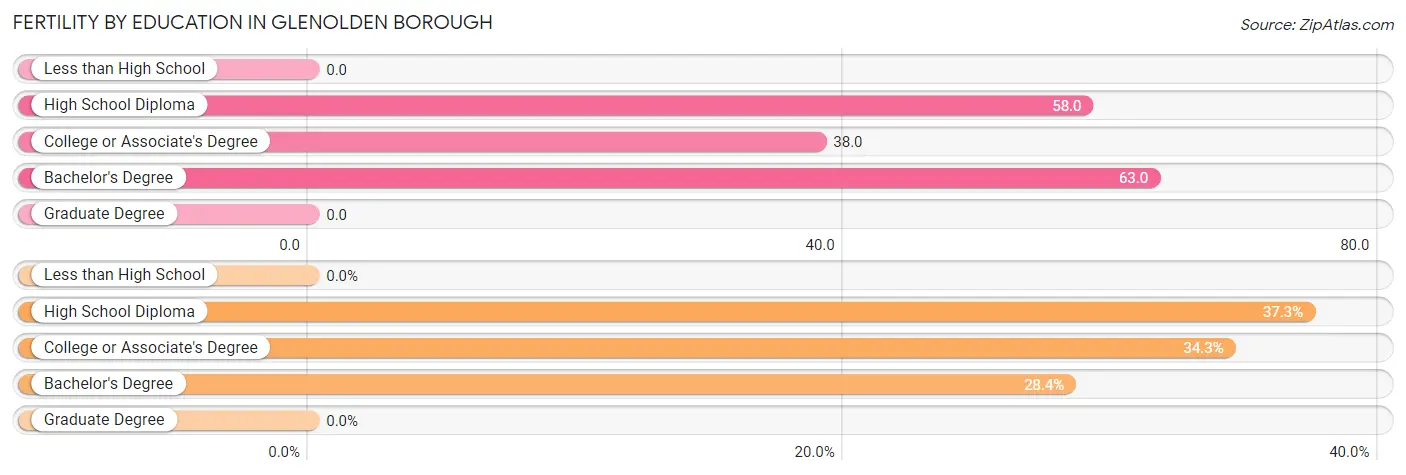
| Educational Attainment | Women with Births | Births / 1,000 Women |
| Less than High School | 0 (0.0%) | 0.0 |
| High School Diploma | 25 (37.3%) | 58.0 |
| College or Associate's Degree | 23 (34.3%) | 38.0 |
| Bachelor's Degree | 19 (28.4%) | 63.0 |
| Graduate Degree | 0 (0.0%) | 0.0 |
| Total | 67 (100.0%) | 43.0 |
Fertility by Education by Marriage Status in Glenolden borough
34.3% of women with births in Glenolden borough are unmarried. Women with the educational attainment of high school diploma are most likely to be married with 100.0% of them married at childbirth, while women with the educational attainment of college or associate's degree are least likely to be married with 100.0% of them unmarried at childbirth.
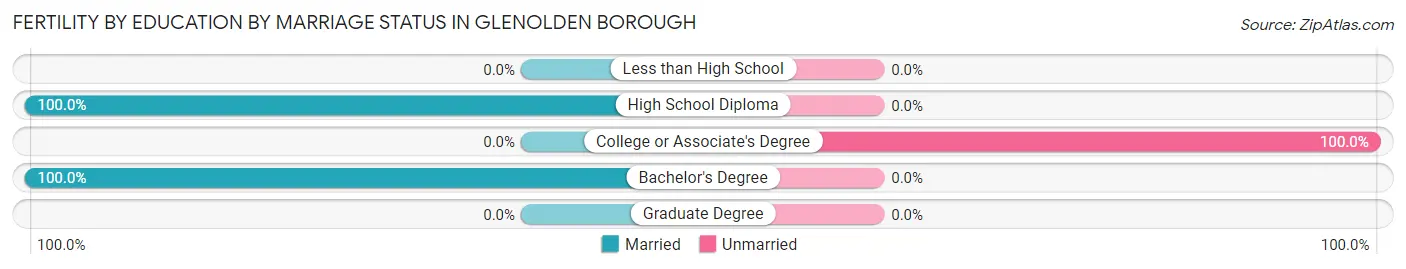
| Educational Attainment | Married | Unmarried |
| Less than High School | 0 (0.0%) | 0 (0.0%) |
| High School Diploma | 25 (100.0%) | 0 (0.0%) |
| College or Associate's Degree | 0 (0.0%) | 23 (100.0%) |
| Bachelor's Degree | 19 (100.0%) | 0 (0.0%) |
| Graduate Degree | 0 (0.0%) | 0 (0.0%) |
| Total | 44 (65.7%) | 23 (34.3%) |
Employment Characteristics in Glenolden borough
Employment by Class of Employer in Glenolden borough
Among the 3,593 employed individuals in Glenolden borough, private company employees (2,681 | 74.6%), not-for-profit organizations (510 | 14.2%), and local government employees (183 | 5.1%) make up the most common classes of employment.
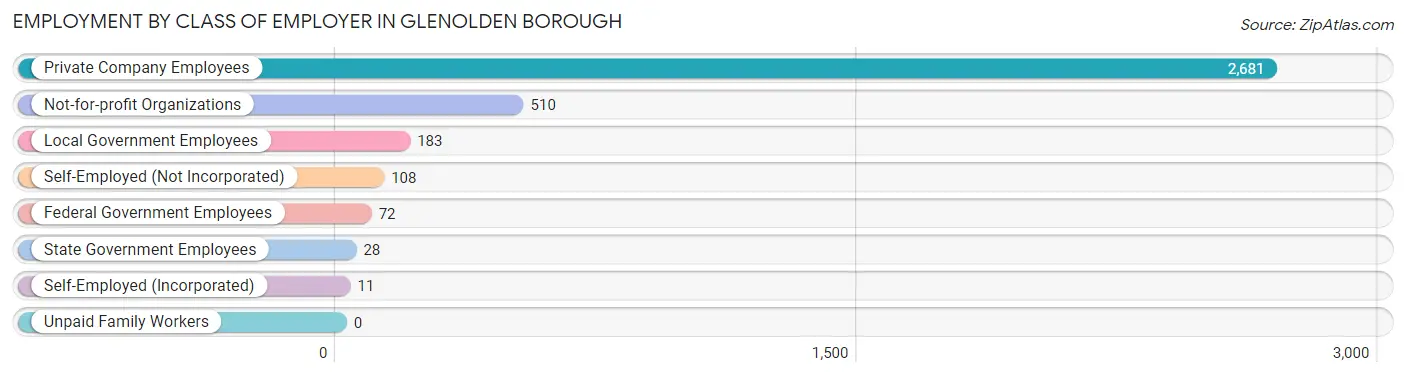
| Employer Class | # Employees | % Employees |
| Private Company Employees | 2,681 | 74.6% |
| Self-Employed (Incorporated) | 11 | 0.3% |
| Self-Employed (Not Incorporated) | 108 | 3.0% |
| Not-for-profit Organizations | 510 | 14.2% |
| Local Government Employees | 183 | 5.1% |
| State Government Employees | 28 | 0.8% |
| Federal Government Employees | 72 | 2.0% |
| Unpaid Family Workers | 0 | 0.0% |
| Total | 3,593 | 100.0% |
Employment Status by Age in Glenolden borough
According to the labor force statistics for Glenolden borough, out of the total population over 16 years of age (5,528), 68.6% or 3,792 individuals are in the labor force, with 4.7% or 178 of them unemployed. The age group with the highest labor force participation rate is 25 to 29 years, with 93.7% or 445 individuals in the labor force. Within the labor force, the 45 to 54 years age range has the highest percentage of unemployed individuals, with 8.7% or 55 of them being unemployed.
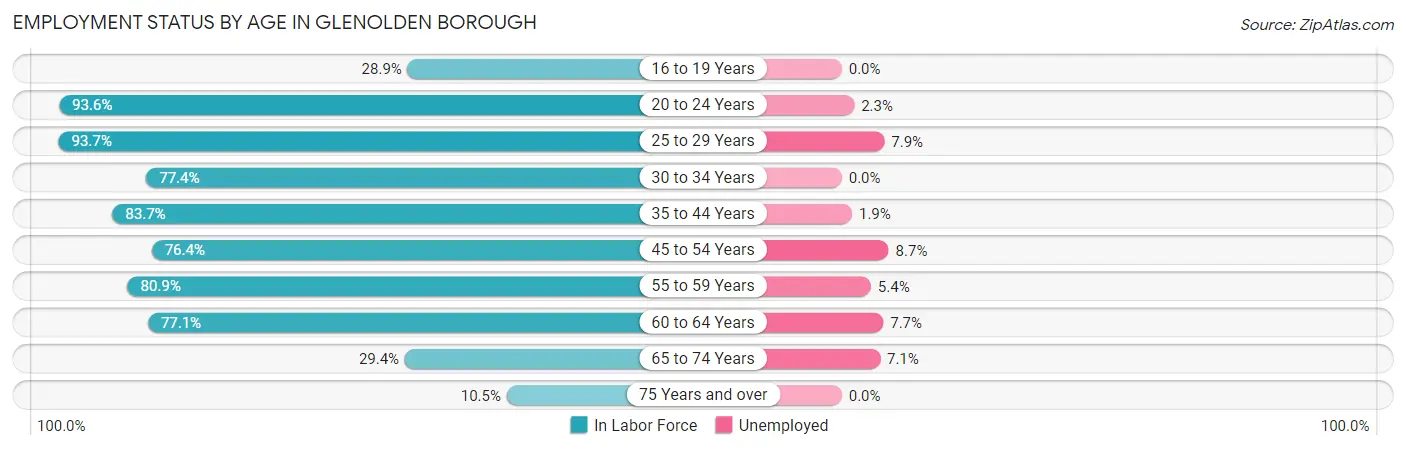
| Age Bracket | In Labor Force | Unemployed |
| 16 to 19 Years | 58 (28.9%) | 0 (0.0%) |
| 20 to 24 Years | 352 (93.6%) | 8 (2.3%) |
| 25 to 29 Years | 445 (93.7%) | 35 (7.9%) |
| 30 to 34 Years | 387 (77.4%) | 0 (0.0%) |
| 35 to 44 Years | 910 (83.7%) | 17 (1.9%) |
| 45 to 54 Years | 633 (76.4%) | 55 (8.7%) |
| 55 to 59 Years | 465 (80.9%) | 25 (5.4%) |
| 60 to 64 Years | 323 (77.1%) | 25 (7.7%) |
| 65 to 74 Years | 168 (29.4%) | 12 (7.1%) |
| 75 Years and over | 52 (10.5%) | 0 (0.0%) |
| Total | 3,792 (68.6%) | 178 (4.7%) |
Employment Status by Educational Attainment in Glenolden borough
According to labor force statistics for Glenolden borough, 81.4% of individuals (3,162) out of the total population between 25 and 64 years of age (3,885) are in the labor force, with 5.0% or 158 of them being unemployed. The group with the highest labor force participation rate are those with the educational attainment of bachelor's degree or higher, with 89.4% or 870 individuals in the labor force. Within the labor force, individuals with less than high school education have the highest percentage of unemployment, with 56.1% or 46 of them being unemployed.
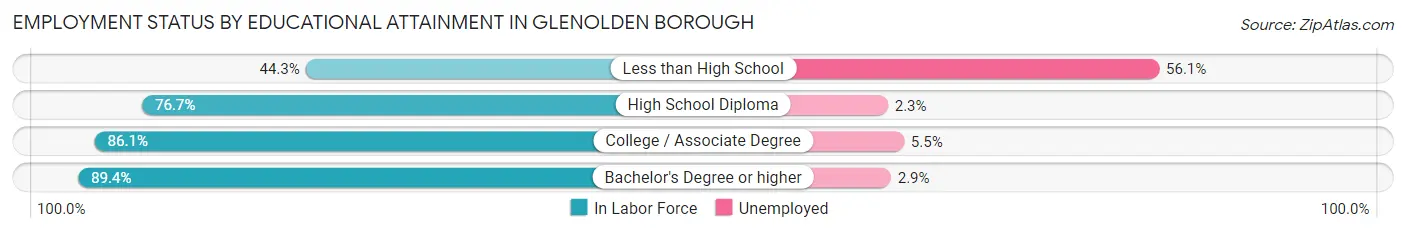
| Educational Attainment | In Labor Force | Unemployed |
| Less than High School | 82 (44.3%) | 104 (56.1%) |
| High School Diploma | 1,118 (76.7%) | 34 (2.3%) |
| College / Associate Degree | 1,093 (86.1%) | 70 (5.5%) |
| Bachelor's Degree or higher | 870 (89.4%) | 28 (2.9%) |
| Total | 3,162 (81.4%) | 194 (5.0%) |
Employment Occupations by Sex in Glenolden borough
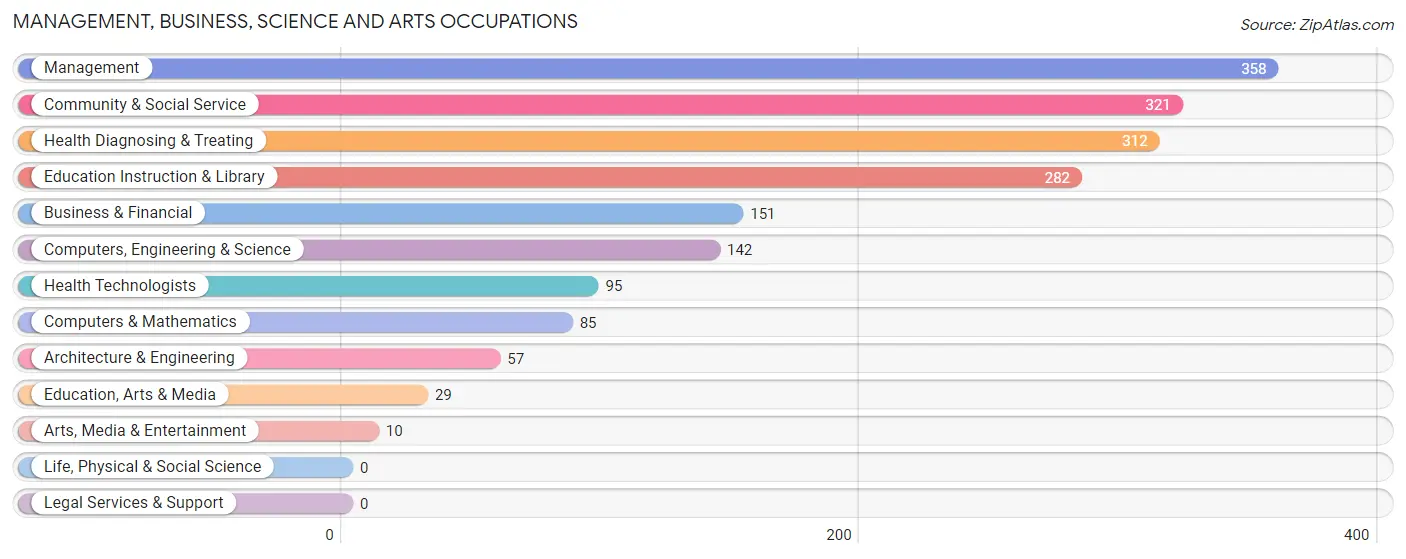
Management, Business, Science and Arts Occupations
The most common Management, Business, Science and Arts occupations in Glenolden borough are Management (358 | 9.9%), Community & Social Service (321 | 8.9%), Health Diagnosing & Treating (312 | 8.6%), Education Instruction & Library (282 | 7.8%), and Business & Financial (151 | 4.2%).
Management, Business, Science and Arts Occupations by Sex
Within the Management, Business, Science and Arts occupations in Glenolden borough, the most male-oriented occupations are Computers, Engineering & Science (100.0%), Computers & Mathematics (100.0%), and Architecture & Engineering (100.0%), while the most female-oriented occupations are Education Instruction & Library (94.7%), Health Diagnosing & Treating (84.6%), and Community & Social Service (83.8%).
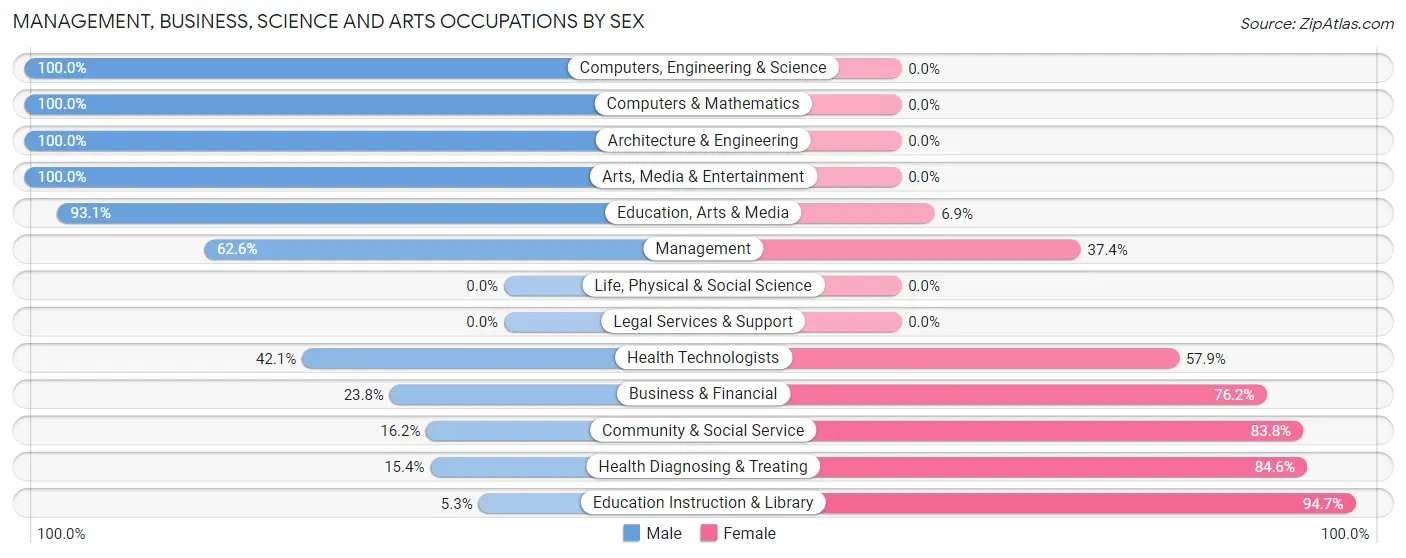
| Occupation | Male | Female |
| Management | 224 (62.6%) | 134 (37.4%) |
| Business & Financial | 36 (23.8%) | 115 (76.2%) |
| Computers, Engineering & Science | 142 (100.0%) | 0 (0.0%) |
| Computers & Mathematics | 85 (100.0%) | 0 (0.0%) |
| Architecture & Engineering | 57 (100.0%) | 0 (0.0%) |
| Life, Physical & Social Science | 0 (0.0%) | 0 (0.0%) |
| Community & Social Service | 52 (16.2%) | 269 (83.8%) |
| Education, Arts & Media | 27 (93.1%) | 2 (6.9%) |
| Legal Services & Support | 0 (0.0%) | 0 (0.0%) |
| Education Instruction & Library | 15 (5.3%) | 267 (94.7%) |
| Arts, Media & Entertainment | 10 (100.0%) | 0 (0.0%) |
| Health Diagnosing & Treating | 48 (15.4%) | 264 (84.6%) |
| Health Technologists | 40 (42.1%) | 55 (57.9%) |
| Total (Category) | 502 (39.1%) | 782 (60.9%) |
| Total (Overall) | 1,779 (49.2%) | 1,837 (50.8%) |
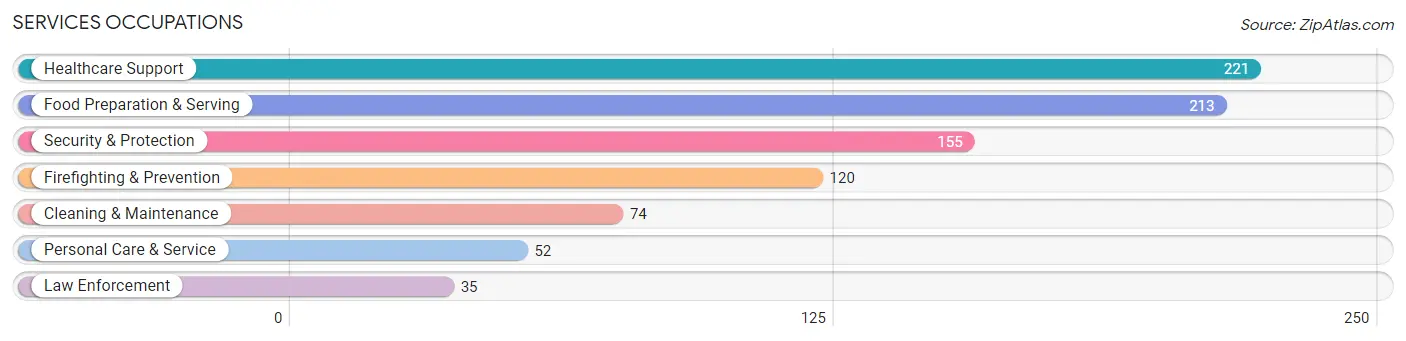
Services Occupations
The most common Services occupations in Glenolden borough are Healthcare Support (221 | 6.1%), Food Preparation & Serving (213 | 5.9%), Security & Protection (155 | 4.3%), Firefighting & Prevention (120 | 3.3%), and Cleaning & Maintenance (74 | 2.1%).
Services Occupations by Sex
Within the Services occupations in Glenolden borough, the most male-oriented occupations are Law Enforcement (100.0%), Cleaning & Maintenance (100.0%), and Security & Protection (52.9%), while the most female-oriented occupations are Personal Care & Service (100.0%), Food Preparation & Serving (70.0%), and Healthcare Support (66.1%).
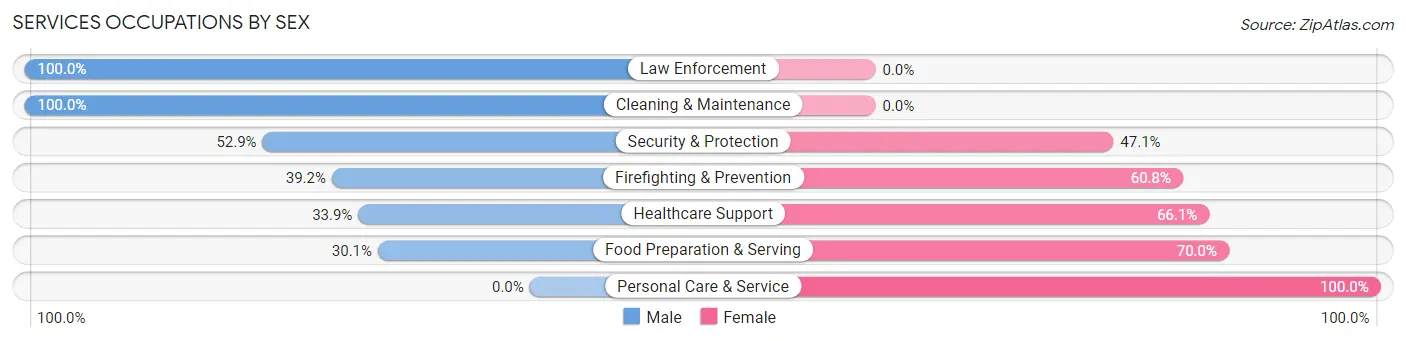
| Occupation | Male | Female |
| Healthcare Support | 75 (33.9%) | 146 (66.1%) |
| Security & Protection | 82 (52.9%) | 73 (47.1%) |
| Firefighting & Prevention | 47 (39.2%) | 73 (60.8%) |
| Law Enforcement | 35 (100.0%) | 0 (0.0%) |
| Food Preparation & Serving | 64 (30.0%) | 149 (70.0%) |
| Cleaning & Maintenance | 74 (100.0%) | 0 (0.0%) |
| Personal Care & Service | 0 (0.0%) | 52 (100.0%) |
| Total (Category) | 295 (41.3%) | 420 (58.7%) |
| Total (Overall) | 1,779 (49.2%) | 1,837 (50.8%) |
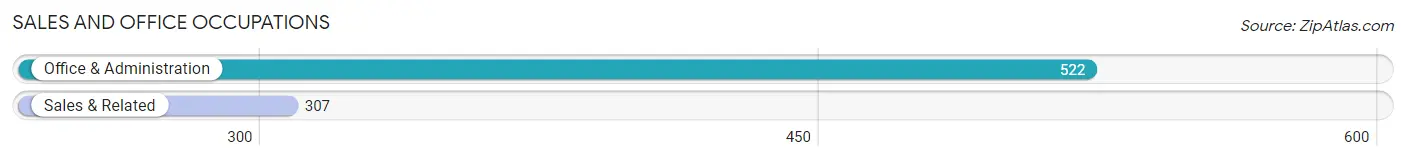
Sales and Office Occupations
The most common Sales and Office occupations in Glenolden borough are Office & Administration (522 | 14.4%), and Sales & Related (307 | 8.5%).
Sales and Office Occupations by Sex
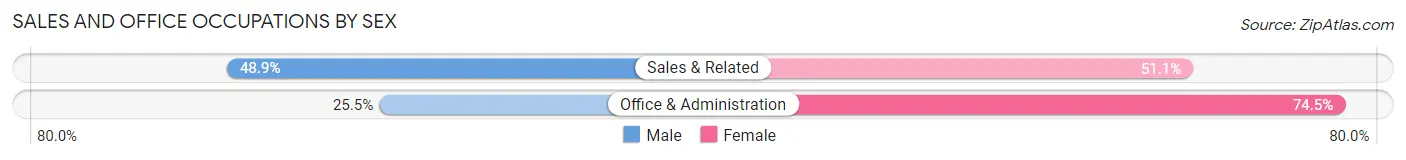
| Occupation | Male | Female |
| Sales & Related | 150 (48.9%) | 157 (51.1%) |
| Office & Administration | 133 (25.5%) | 389 (74.5%) |
| Total (Category) | 283 (34.1%) | 546 (65.9%) |
| Total (Overall) | 1,779 (49.2%) | 1,837 (50.8%) |
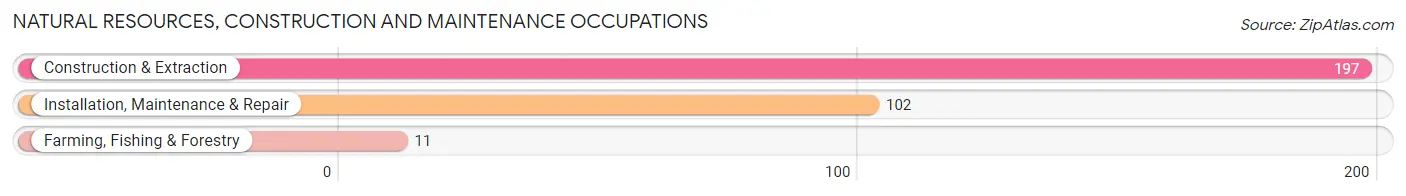
Natural Resources, Construction and Maintenance Occupations
The most common Natural Resources, Construction and Maintenance occupations in Glenolden borough are Construction & Extraction (197 | 5.4%), Installation, Maintenance & Repair (102 | 2.8%), and Farming, Fishing & Forestry (11 | 0.3%).
Natural Resources, Construction and Maintenance Occupations by Sex
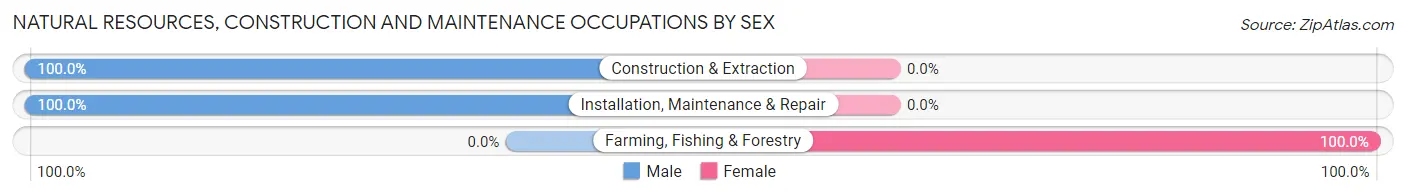
| Occupation | Male | Female |
| Farming, Fishing & Forestry | 0 (0.0%) | 11 (100.0%) |
| Construction & Extraction | 197 (100.0%) | 0 (0.0%) |
| Installation, Maintenance & Repair | 102 (100.0%) | 0 (0.0%) |
| Total (Category) | 299 (96.5%) | 11 (3.5%) |
| Total (Overall) | 1,779 (49.2%) | 1,837 (50.8%) |
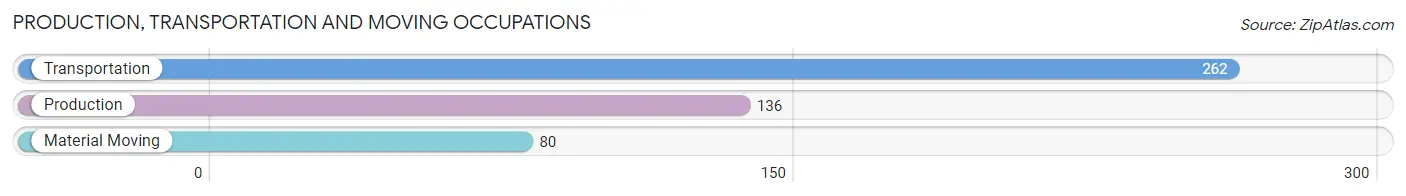
Production, Transportation and Moving Occupations
The most common Production, Transportation and Moving occupations in Glenolden borough are Transportation (262 | 7.2%), Production (136 | 3.8%), and Material Moving (80 | 2.2%).
Production, Transportation and Moving Occupations by Sex
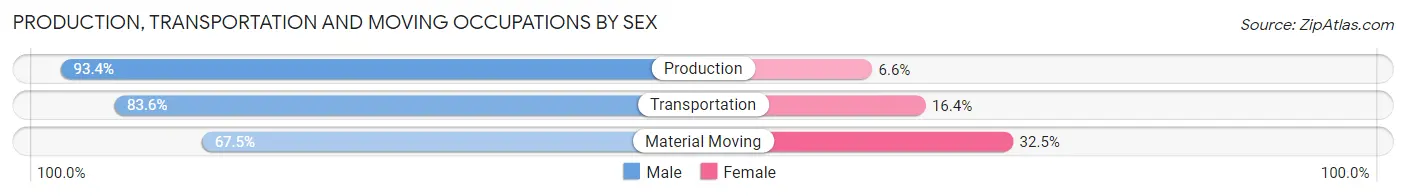
| Occupation | Male | Female |
| Production | 127 (93.4%) | 9 (6.6%) |
| Transportation | 219 (83.6%) | 43 (16.4%) |
| Material Moving | 54 (67.5%) | 26 (32.5%) |
| Total (Category) | 400 (83.7%) | 78 (16.3%) |
| Total (Overall) | 1,779 (49.2%) | 1,837 (50.8%) |
Employment Industries by Sex in Glenolden borough
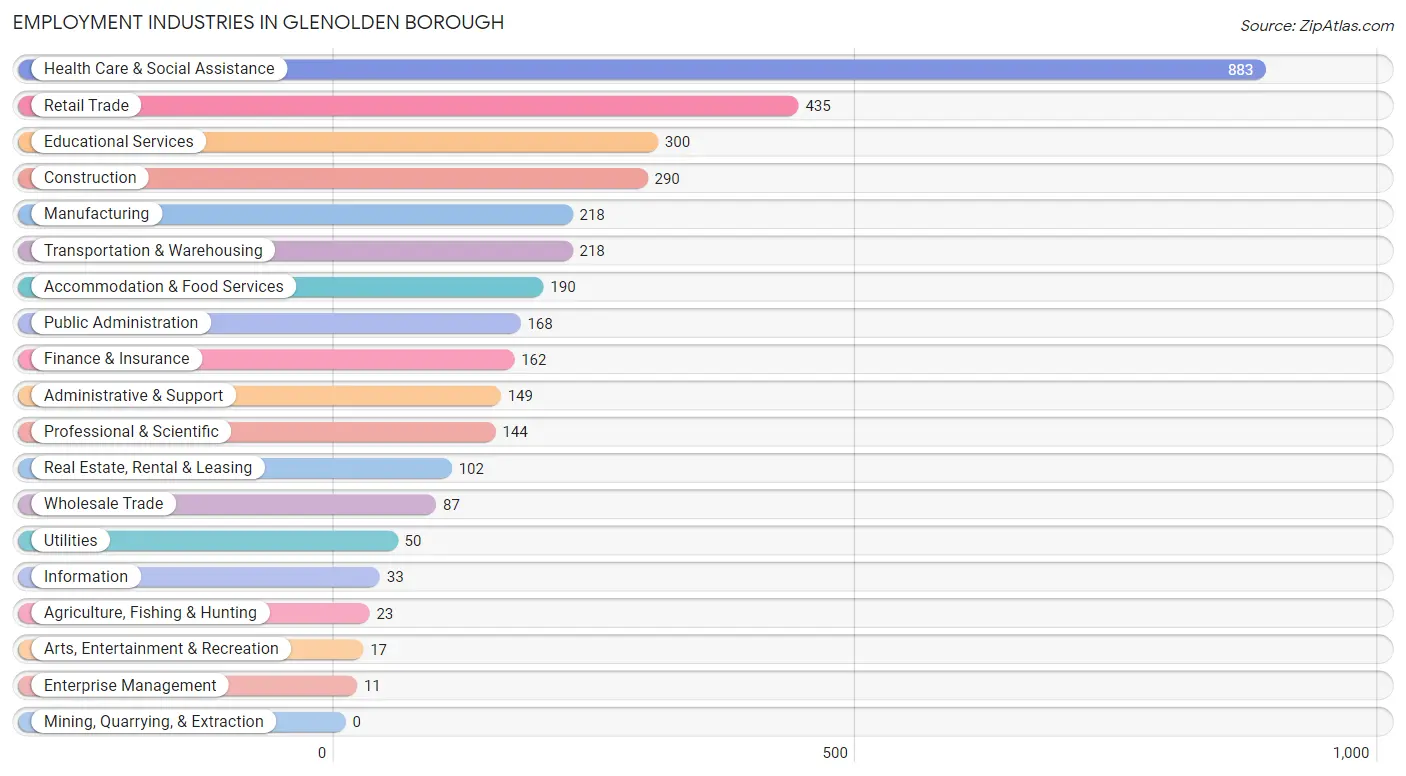
Employment Industries in Glenolden borough
The major employment industries in Glenolden borough include Health Care & Social Assistance (883 | 24.4%), Retail Trade (435 | 12.0%), Educational Services (300 | 8.3%), Construction (290 | 8.0%), and Manufacturing (218 | 6.0%).
Employment Industries by Sex in Glenolden borough
The Glenolden borough industries that see more men than women are Utilities (100.0%), Enterprise Management (100.0%), and Arts, Entertainment & Recreation (100.0%), whereas the industries that tend to have a higher number of women are Educational Services (86.3%), Administrative & Support (79.2%), and Health Care & Social Assistance (77.8%).
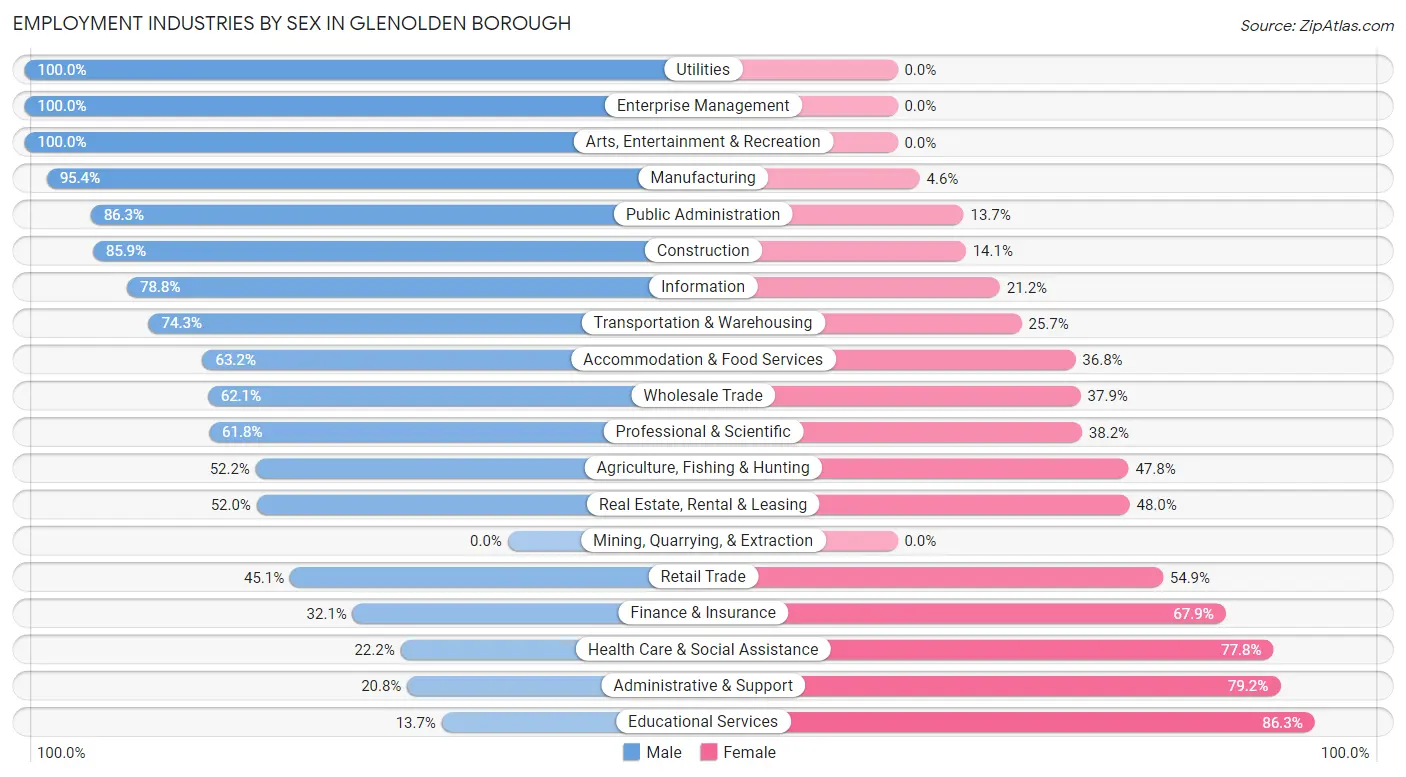
| Industry | Male | Female |
| Agriculture, Fishing & Hunting | 12 (52.2%) | 11 (47.8%) |
| Mining, Quarrying, & Extraction | 0 (0.0%) | 0 (0.0%) |
| Construction | 249 (85.9%) | 41 (14.1%) |
| Manufacturing | 208 (95.4%) | 10 (4.6%) |
| Wholesale Trade | 54 (62.1%) | 33 (37.9%) |
| Retail Trade | 196 (45.1%) | 239 (54.9%) |
| Transportation & Warehousing | 162 (74.3%) | 56 (25.7%) |
| Utilities | 50 (100.0%) | 0 (0.0%) |
| Information | 26 (78.8%) | 7 (21.2%) |
| Finance & Insurance | 52 (32.1%) | 110 (67.9%) |
| Real Estate, Rental & Leasing | 53 (52.0%) | 49 (48.0%) |
| Professional & Scientific | 89 (61.8%) | 55 (38.2%) |
| Enterprise Management | 11 (100.0%) | 0 (0.0%) |
| Administrative & Support | 31 (20.8%) | 118 (79.2%) |
| Educational Services | 41 (13.7%) | 259 (86.3%) |
| Health Care & Social Assistance | 196 (22.2%) | 687 (77.8%) |
| Arts, Entertainment & Recreation | 17 (100.0%) | 0 (0.0%) |
| Accommodation & Food Services | 120 (63.2%) | 70 (36.8%) |
| Public Administration | 145 (86.3%) | 23 (13.7%) |
| Total | 1,779 (49.2%) | 1,837 (50.8%) |
Education in Glenolden borough
School Enrollment in Glenolden borough
The most common levels of schooling among the 1,513 students in Glenolden borough are college / undergraduate (336 | 22.2%), middle school (328 | 21.7%), and elementary school (309 | 20.4%).
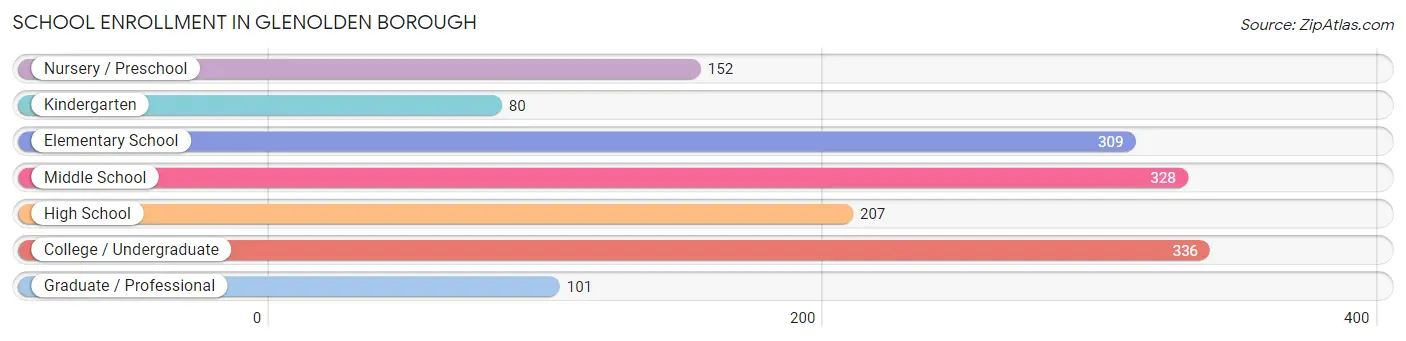
| School Level | # Students | % Students |
| Nursery / Preschool | 152 | 10.1% |
| Kindergarten | 80 | 5.3% |
| Elementary School | 309 | 20.4% |
| Middle School | 328 | 21.7% |
| High School | 207 | 13.7% |
| College / Undergraduate | 336 | 22.2% |
| Graduate / Professional | 101 | 6.7% |
| Total | 1,513 | 100.0% |
School Enrollment by Age by Funding Source in Glenolden borough
Out of a total of 1,513 students who are enrolled in schools in Glenolden borough, 315 (20.8%) attend a private institution, while the remaining 1,198 (79.2%) are enrolled in public schools. The age group of 3 to 4 year olds has the highest likelihood of being enrolled in private schools, with 84 (68.9% in the age bracket) enrolled. Conversely, the age group of 15 to 17 year olds has the lowest likelihood of being enrolled in a private school, with 174 (100.0% in the age bracket) attending a public institution.
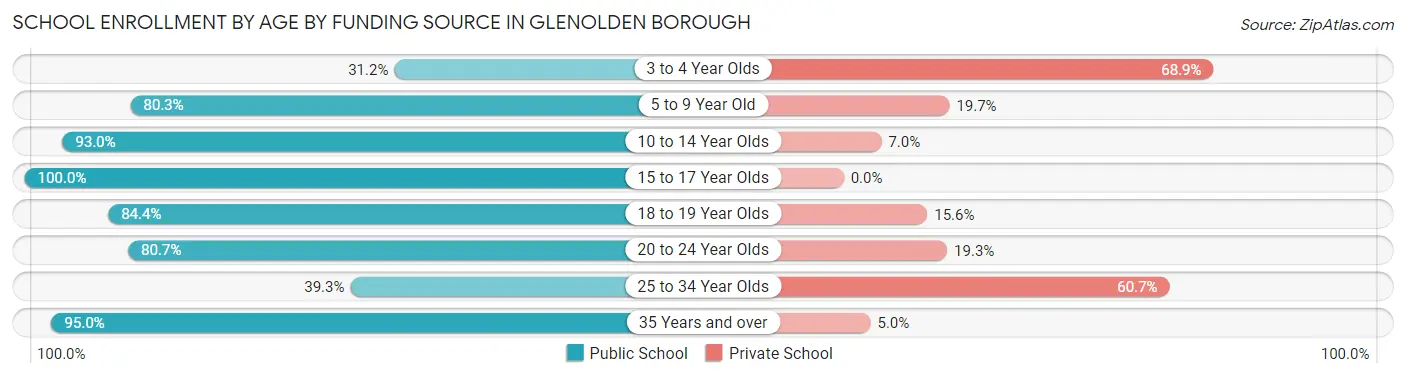
| Age Bracket | Public School | Private School |
| 3 to 4 Year Olds | 38 (31.1%) | 84 (68.9%) |
| 5 to 9 Year Old | 326 (80.3%) | 80 (19.7%) |
| 10 to 14 Year Olds | 317 (93.0%) | 24 (7.0%) |
| 15 to 17 Year Olds | 174 (100.0%) | 0 (0.0%) |
| 18 to 19 Year Olds | 65 (84.4%) | 12 (15.6%) |
| 20 to 24 Year Olds | 67 (80.7%) | 16 (19.3%) |
| 25 to 34 Year Olds | 59 (39.3%) | 91 (60.7%) |
| 35 Years and over | 152 (95.0%) | 8 (5.0%) |
| Total | 1,198 (79.2%) | 315 (20.8%) |
Educational Attainment by Field of Study in Glenolden borough
Business (328 | 26.7%), education (207 | 16.9%), arts & humanities (115 | 9.4%), liberal arts & history (94 | 7.6%), and science & technology (88 | 7.2%) are the most common fields of study among 1,228 individuals in Glenolden borough who have obtained a bachelor's degree or higher.
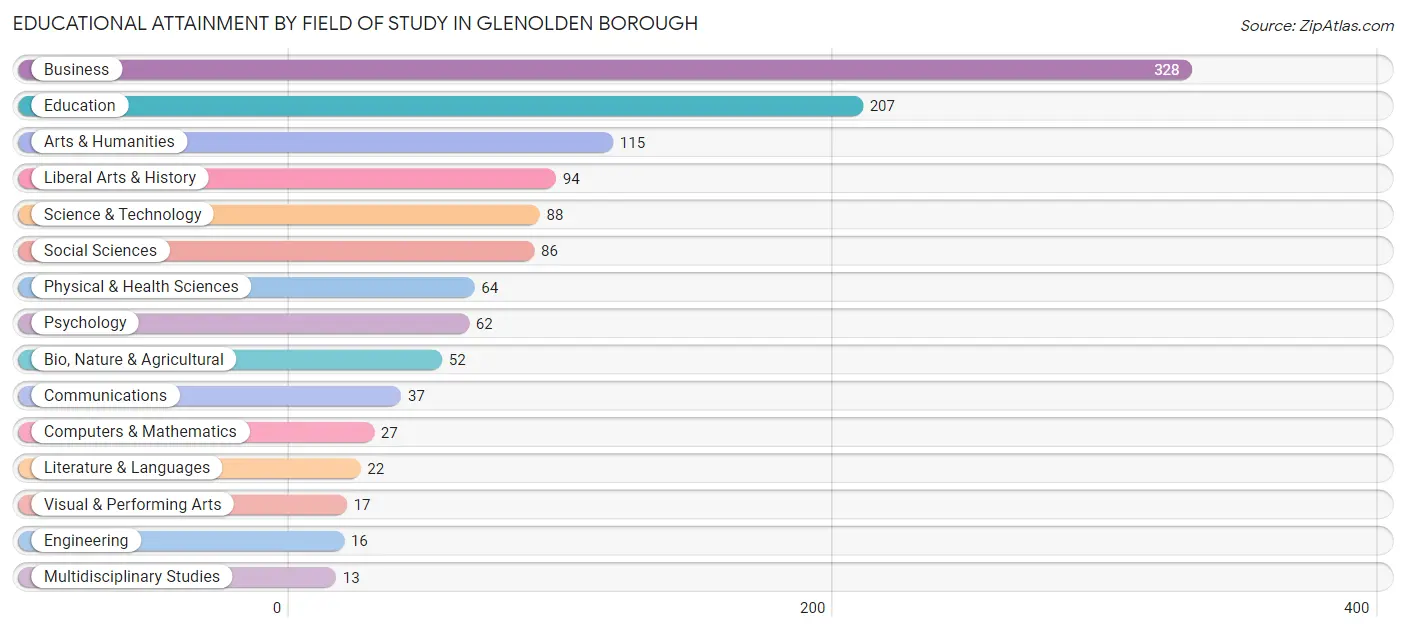
| Field of Study | # Graduates | % Graduates |
| Computers & Mathematics | 27 | 2.2% |
| Bio, Nature & Agricultural | 52 | 4.2% |
| Physical & Health Sciences | 64 | 5.2% |
| Psychology | 62 | 5.1% |
| Social Sciences | 86 | 7.0% |
| Engineering | 16 | 1.3% |
| Multidisciplinary Studies | 13 | 1.1% |
| Science & Technology | 88 | 7.2% |
| Business | 328 | 26.7% |
| Education | 207 | 16.9% |
| Literature & Languages | 22 | 1.8% |
| Liberal Arts & History | 94 | 7.6% |
| Visual & Performing Arts | 17 | 1.4% |
| Communications | 37 | 3.0% |
| Arts & Humanities | 115 | 9.4% |
| Total | 1,228 | 100.0% |
Transportation & Commute in Glenolden borough
Vehicle Availability by Sex in Glenolden borough
The most prevalent vehicle ownership categories in Glenolden borough are males with 2 vehicles (805, accounting for 45.4%) and females with 2 vehicles (714, making up 44.3%).
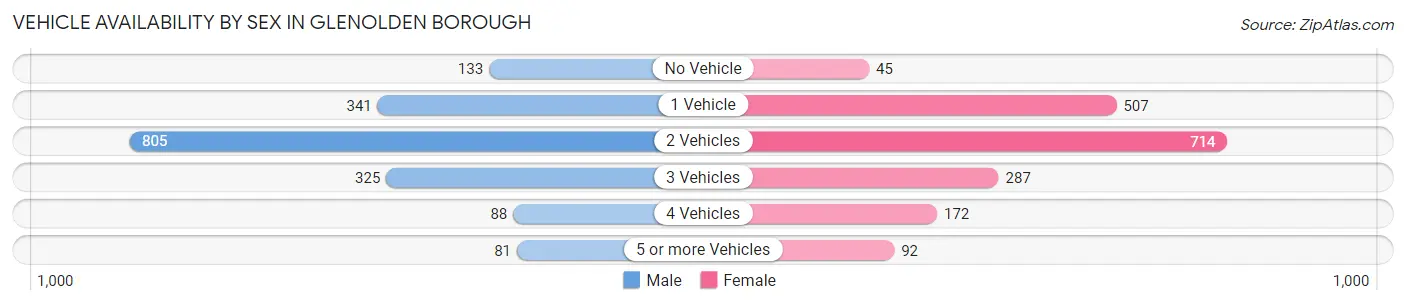
| Vehicles Available | Male | Female |
| No Vehicle | 133 (7.5%) | 45 (2.5%) |
| 1 Vehicle | 341 (19.2%) | 507 (27.9%) |
| 2 Vehicles | 805 (45.4%) | 714 (39.3%) |
| 3 Vehicles | 325 (18.3%) | 287 (15.8%) |
| 4 Vehicles | 88 (5.0%) | 172 (9.5%) |
| 5 or more Vehicles | 81 (4.6%) | 92 (5.1%) |
| Total | 1,773 (100.0%) | 1,817 (100.0%) |
Commute Time in Glenolden borough
The most frequently occuring commute durations in Glenolden borough are 30 to 34 minutes (646 commuters, 19.1%), 20 to 24 minutes (546 commuters, 16.2%), and 15 to 19 minutes (449 commuters, 13.3%).
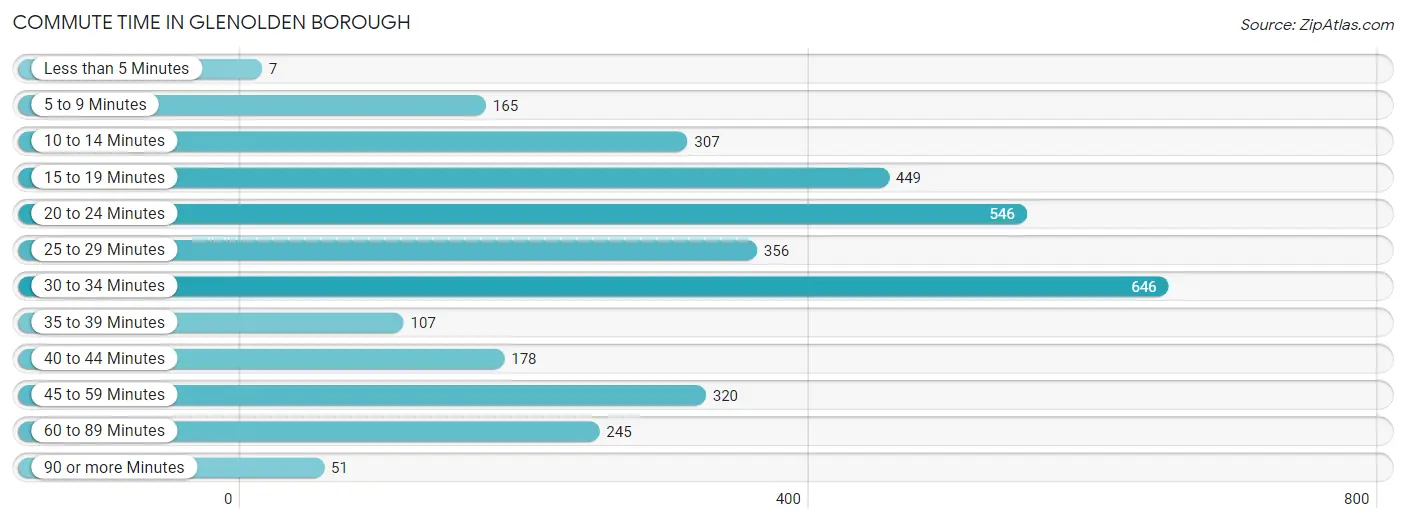
| Commute Time | # Commuters | % Commuters |
| Less than 5 Minutes | 7 | 0.2% |
| 5 to 9 Minutes | 165 | 4.9% |
| 10 to 14 Minutes | 307 | 9.1% |
| 15 to 19 Minutes | 449 | 13.3% |
| 20 to 24 Minutes | 546 | 16.2% |
| 25 to 29 Minutes | 356 | 10.5% |
| 30 to 34 Minutes | 646 | 19.1% |
| 35 to 39 Minutes | 107 | 3.2% |
| 40 to 44 Minutes | 178 | 5.3% |
| 45 to 59 Minutes | 320 | 9.5% |
| 60 to 89 Minutes | 245 | 7.2% |
| 90 or more Minutes | 51 | 1.5% |
Commute Time by Sex in Glenolden borough
The most common commute times in Glenolden borough are 30 to 34 minutes (435 commuters, 25.2%) for males and 20 to 24 minutes (328 commuters, 19.9%) for females.
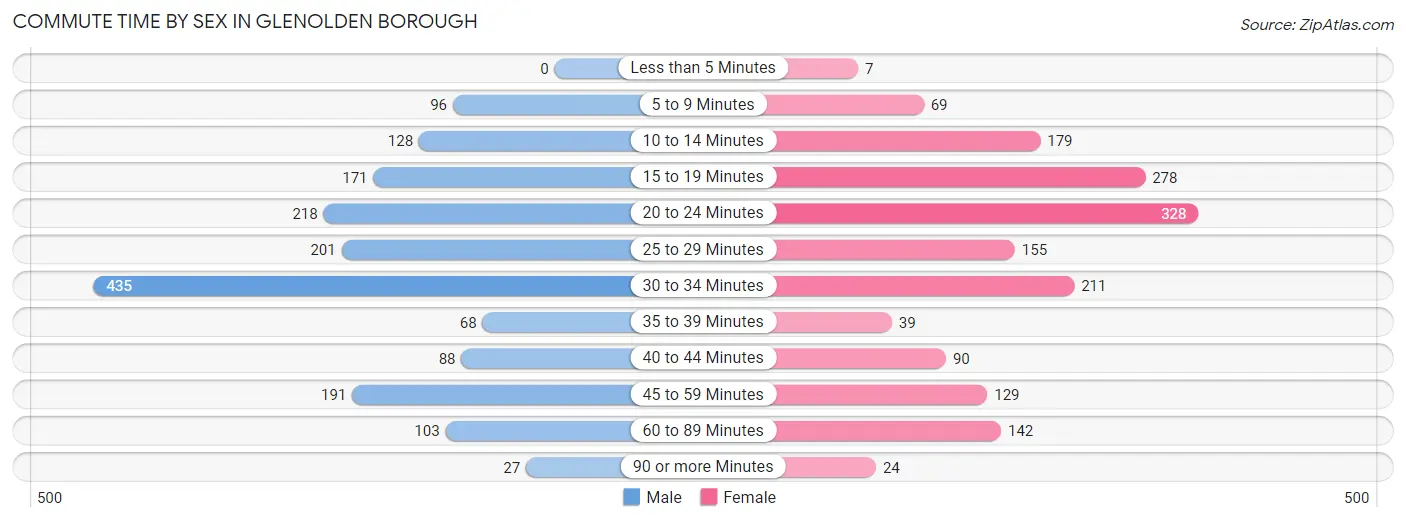
| Commute Time | Male | Female |
| Less than 5 Minutes | 0 (0.0%) | 7 (0.4%) |
| 5 to 9 Minutes | 96 (5.6%) | 69 (4.2%) |
| 10 to 14 Minutes | 128 (7.4%) | 179 (10.8%) |
| 15 to 19 Minutes | 171 (9.9%) | 278 (16.8%) |
| 20 to 24 Minutes | 218 (12.6%) | 328 (19.9%) |
| 25 to 29 Minutes | 201 (11.7%) | 155 (9.4%) |
| 30 to 34 Minutes | 435 (25.2%) | 211 (12.8%) |
| 35 to 39 Minutes | 68 (3.9%) | 39 (2.4%) |
| 40 to 44 Minutes | 88 (5.1%) | 90 (5.4%) |
| 45 to 59 Minutes | 191 (11.1%) | 129 (7.8%) |
| 60 to 89 Minutes | 103 (6.0%) | 142 (8.6%) |
| 90 or more Minutes | 27 (1.6%) | 24 (1.5%) |
Time of Departure to Work by Sex in Glenolden borough
The most frequent times of departure to work in Glenolden borough are 8:00 AM to 8:29 AM (329, 19.1%) for males and 6:30 AM to 6:59 AM (259, 15.7%) for females.
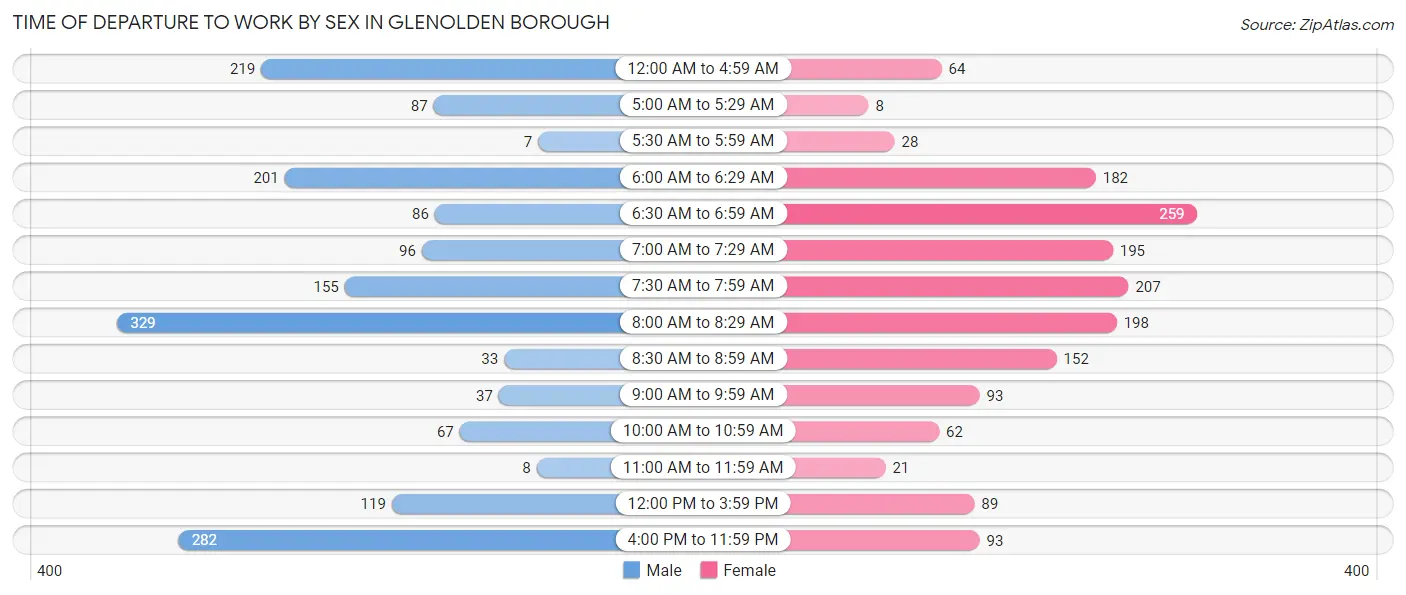
| Time of Departure | Male | Female |
| 12:00 AM to 4:59 AM | 219 (12.7%) | 64 (3.9%) |
| 5:00 AM to 5:29 AM | 87 (5.0%) | 8 (0.5%) |
| 5:30 AM to 5:59 AM | 7 (0.4%) | 28 (1.7%) |
| 6:00 AM to 6:29 AM | 201 (11.7%) | 182 (11.0%) |
| 6:30 AM to 6:59 AM | 86 (5.0%) | 259 (15.7%) |
| 7:00 AM to 7:29 AM | 96 (5.6%) | 195 (11.8%) |
| 7:30 AM to 7:59 AM | 155 (9.0%) | 207 (12.5%) |
| 8:00 AM to 8:29 AM | 329 (19.1%) | 198 (12.0%) |
| 8:30 AM to 8:59 AM | 33 (1.9%) | 152 (9.2%) |
| 9:00 AM to 9:59 AM | 37 (2.1%) | 93 (5.6%) |
| 10:00 AM to 10:59 AM | 67 (3.9%) | 62 (3.8%) |
| 11:00 AM to 11:59 AM | 8 (0.5%) | 21 (1.3%) |
| 12:00 PM to 3:59 PM | 119 (6.9%) | 89 (5.4%) |
| 4:00 PM to 11:59 PM | 282 (16.3%) | 93 (5.6%) |
| Total | 1,726 (100.0%) | 1,651 (100.0%) |
Housing Occupancy in Glenolden borough
Occupancy by Ownership in Glenolden borough
Of the total 2,795 dwellings in Glenolden borough, owner-occupied units account for 2,202 (78.8%), while renter-occupied units make up 593 (21.2%).
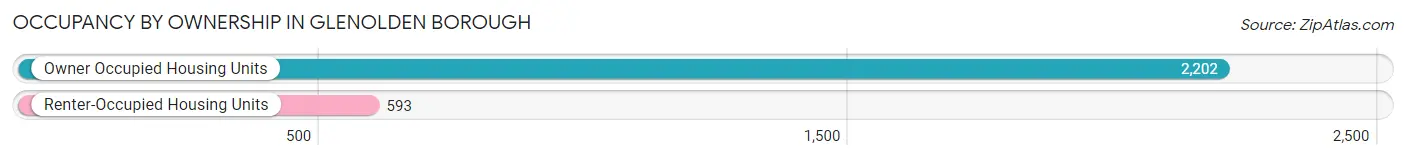
| Occupancy | # Housing Units | % Housing Units |
| Owner Occupied Housing Units | 2,202 | 78.8% |
| Renter-Occupied Housing Units | 593 | 21.2% |
| Total Occupied Housing Units | 2,795 | 100.0% |
Occupancy by Household Size in Glenolden borough
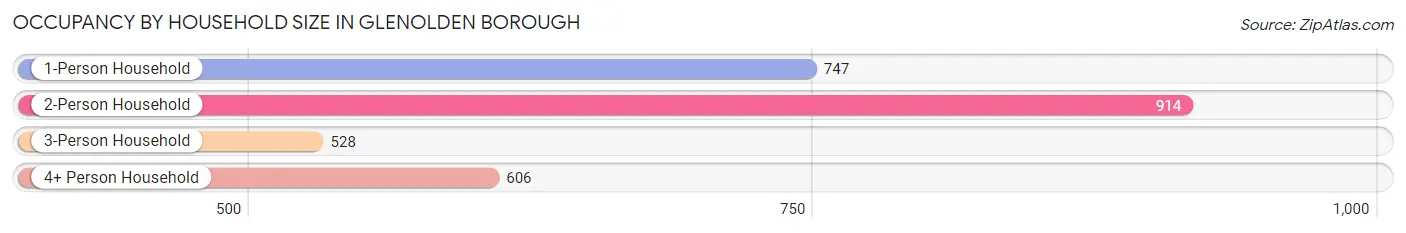
| Household Size | # Housing Units | % Housing Units |
| 1-Person Household | 747 | 26.7% |
| 2-Person Household | 914 | 32.7% |
| 3-Person Household | 528 | 18.9% |
| 4+ Person Household | 606 | 21.7% |
| Total Housing Units | 2,795 | 100.0% |
Occupancy by Ownership by Household Size in Glenolden borough
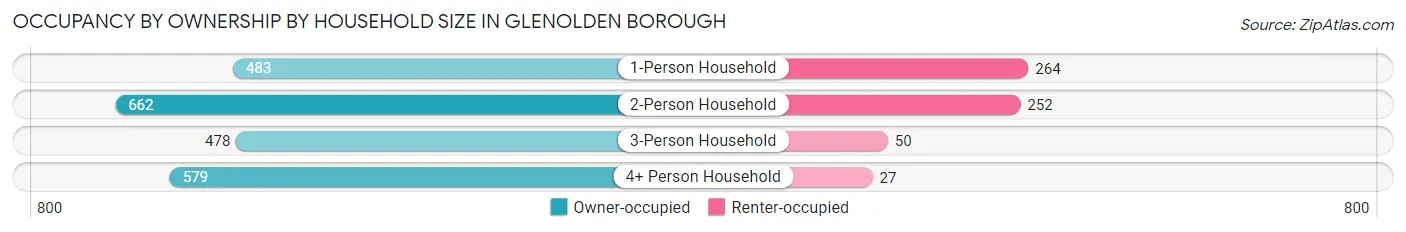
| Household Size | Owner-occupied | Renter-occupied |
| 1-Person Household | 483 (64.7%) | 264 (35.3%) |
| 2-Person Household | 662 (72.4%) | 252 (27.6%) |
| 3-Person Household | 478 (90.5%) | 50 (9.5%) |
| 4+ Person Household | 579 (95.5%) | 27 (4.5%) |
| Total Housing Units | 2,202 (78.8%) | 593 (21.2%) |
Occupancy by Educational Attainment in Glenolden borough
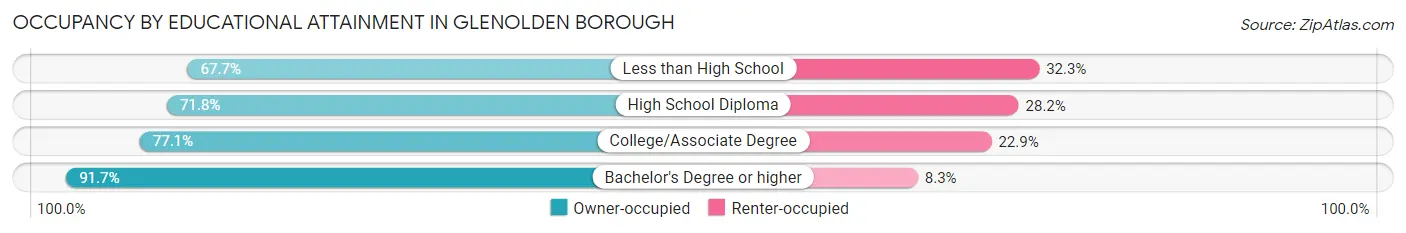
| Household Size | Owner-occupied | Renter-occupied |
| Less than High School | 67 (67.7%) | 32 (32.3%) |
| High School Diploma | 841 (71.8%) | 331 (28.2%) |
| College/Associate Degree | 550 (77.1%) | 163 (22.9%) |
| Bachelor's Degree or higher | 744 (91.7%) | 67 (8.3%) |
Occupancy by Age of Householder in Glenolden borough
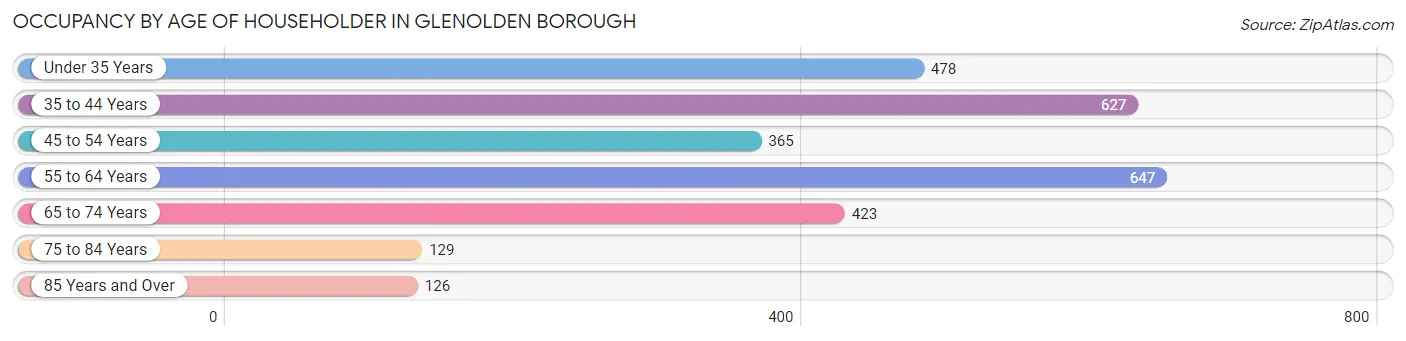
| Age Bracket | # Households | % Households |
| Under 35 Years | 478 | 17.1% |
| 35 to 44 Years | 627 | 22.4% |
| 45 to 54 Years | 365 | 13.1% |
| 55 to 64 Years | 647 | 23.2% |
| 65 to 74 Years | 423 | 15.1% |
| 75 to 84 Years | 129 | 4.6% |
| 85 Years and Over | 126 | 4.5% |
| Total | 2,795 | 100.0% |
Housing Finances in Glenolden borough
Median Income by Occupancy in Glenolden borough
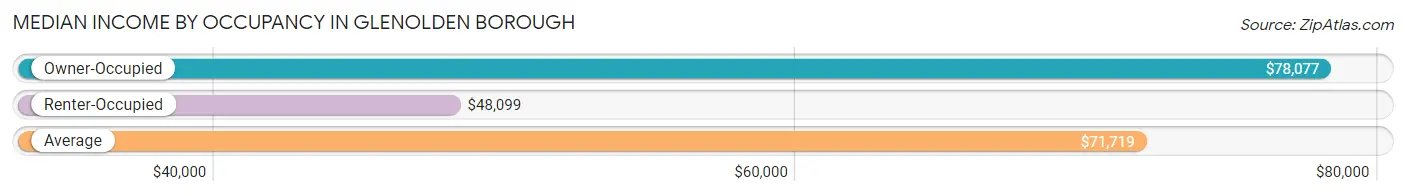
| Occupancy Type | # Households | Median Income |
| Owner-Occupied | 2,202 (78.8%) | $78,077 |
| Renter-Occupied | 593 (21.2%) | $48,099 |
| Average | 2,795 (100.0%) | $71,719 |
Occupancy by Householder Income Bracket in Glenolden borough
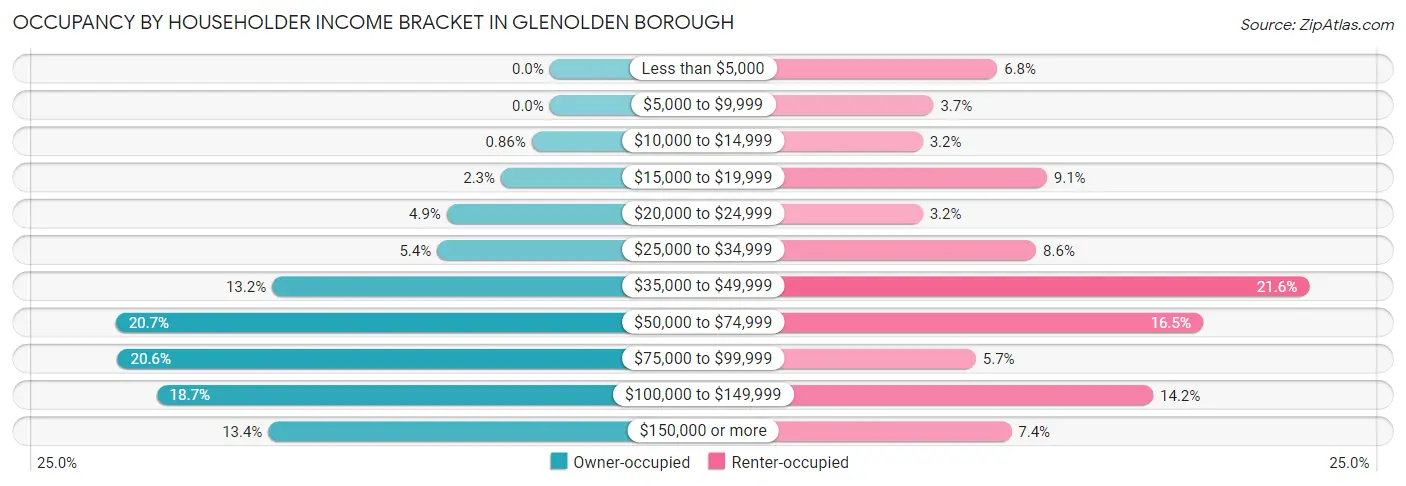
| Income Bracket | Owner-occupied | Renter-occupied |
| Less than $5,000 | 0 (0.0%) | 40 (6.8%) |
| $5,000 to $9,999 | 0 (0.0%) | 22 (3.7%) |
| $10,000 to $14,999 | 19 (0.9%) | 19 (3.2%) |
| $15,000 to $19,999 | 51 (2.3%) | 54 (9.1%) |
| $20,000 to $24,999 | 108 (4.9%) | 19 (3.2%) |
| $25,000 to $34,999 | 118 (5.4%) | 51 (8.6%) |
| $35,000 to $49,999 | 291 (13.2%) | 128 (21.6%) |
| $50,000 to $74,999 | 455 (20.7%) | 98 (16.5%) |
| $75,000 to $99,999 | 453 (20.6%) | 34 (5.7%) |
| $100,000 to $149,999 | 412 (18.7%) | 84 (14.2%) |
| $150,000 or more | 295 (13.4%) | 44 (7.4%) |
| Total | 2,202 (100.0%) | 593 (100.0%) |
Monthly Housing Cost Tiers in Glenolden borough
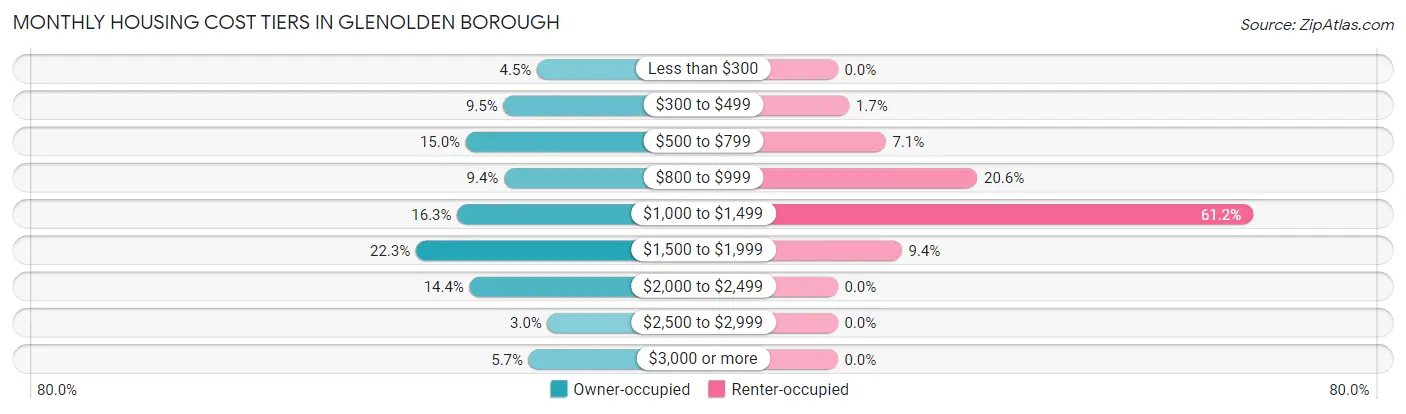
| Monthly Cost | Owner-occupied | Renter-occupied |
| Less than $300 | 99 (4.5%) | 0 (0.0%) |
| $300 to $499 | 208 (9.5%) | 10 (1.7%) |
| $500 to $799 | 330 (15.0%) | 42 (7.1%) |
| $800 to $999 | 206 (9.4%) | 122 (20.6%) |
| $1,000 to $1,499 | 358 (16.3%) | 363 (61.2%) |
| $1,500 to $1,999 | 492 (22.3%) | 56 (9.4%) |
| $2,000 to $2,499 | 318 (14.4%) | 0 (0.0%) |
| $2,500 to $2,999 | 65 (2.9%) | 0 (0.0%) |
| $3,000 or more | 126 (5.7%) | 0 (0.0%) |
| Total | 2,202 (100.0%) | 593 (100.0%) |
Physical Housing Characteristics in Glenolden borough
Housing Structures in Glenolden borough
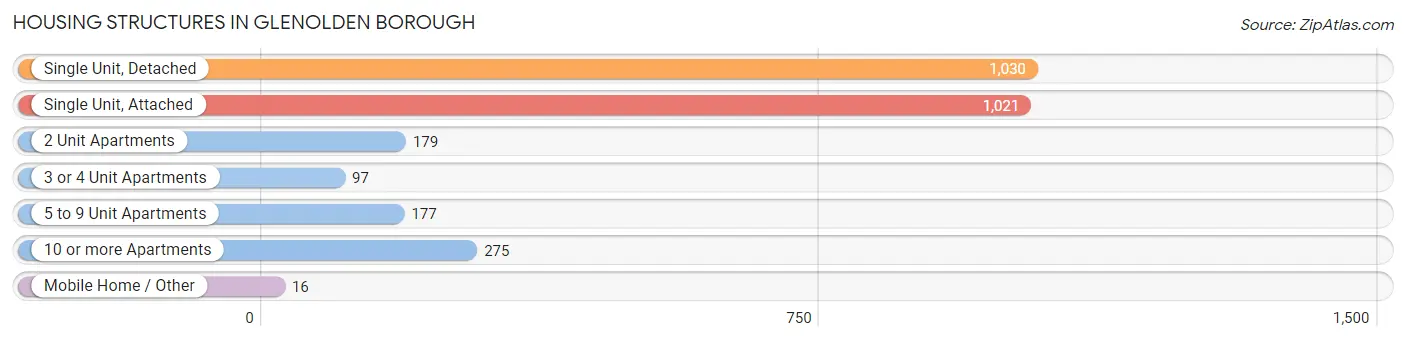
| Structure Type | # Housing Units | % Housing Units |
| Single Unit, Detached | 1,030 | 36.8% |
| Single Unit, Attached | 1,021 | 36.5% |
| 2 Unit Apartments | 179 | 6.4% |
| 3 or 4 Unit Apartments | 97 | 3.5% |
| 5 to 9 Unit Apartments | 177 | 6.3% |
| 10 or more Apartments | 275 | 9.8% |
| Mobile Home / Other | 16 | 0.6% |
| Total | 2,795 | 100.0% |
Housing Structures by Occupancy in Glenolden borough
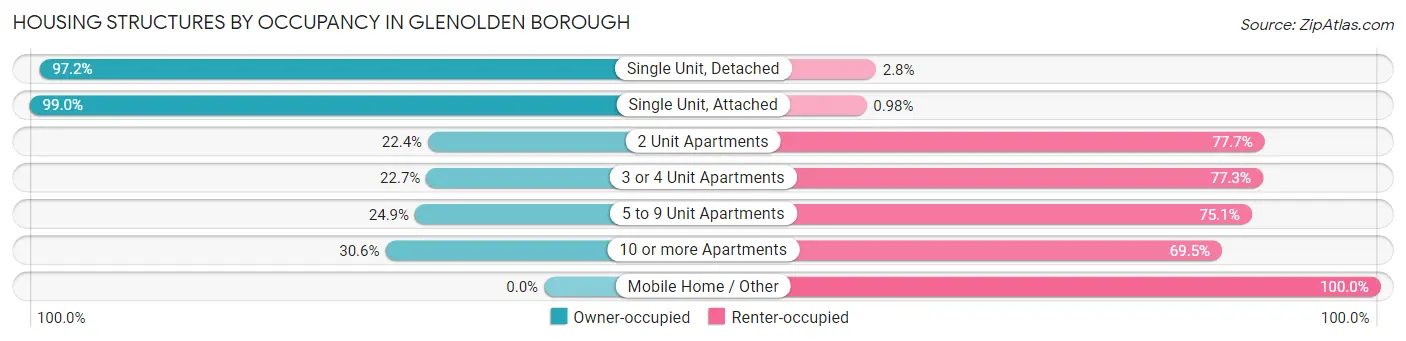
| Structure Type | Owner-occupied | Renter-occupied |
| Single Unit, Detached | 1,001 (97.2%) | 29 (2.8%) |
| Single Unit, Attached | 1,011 (99.0%) | 10 (1.0%) |
| 2 Unit Apartments | 40 (22.4%) | 139 (77.6%) |
| 3 or 4 Unit Apartments | 22 (22.7%) | 75 (77.3%) |
| 5 to 9 Unit Apartments | 44 (24.9%) | 133 (75.1%) |
| 10 or more Apartments | 84 (30.5%) | 191 (69.5%) |
| Mobile Home / Other | 0 (0.0%) | 16 (100.0%) |
| Total | 2,202 (78.8%) | 593 (21.2%) |
Housing Structures by Number of Rooms in Glenolden borough
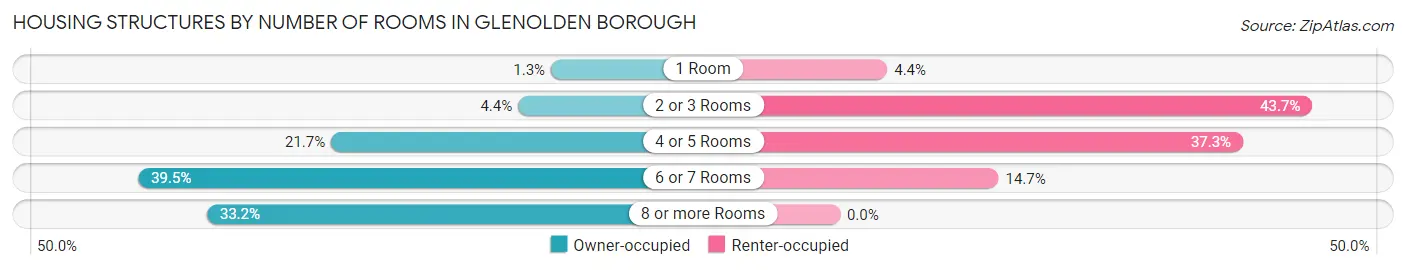
| Number of Rooms | Owner-occupied | Renter-occupied |
| 1 Room | 29 (1.3%) | 26 (4.4%) |
| 2 or 3 Rooms | 96 (4.4%) | 259 (43.7%) |
| 4 or 5 Rooms | 477 (21.7%) | 221 (37.3%) |
| 6 or 7 Rooms | 870 (39.5%) | 87 (14.7%) |
| 8 or more Rooms | 730 (33.2%) | 0 (0.0%) |
| Total | 2,202 (100.0%) | 593 (100.0%) |
Housing Structure by Heating Type in Glenolden borough
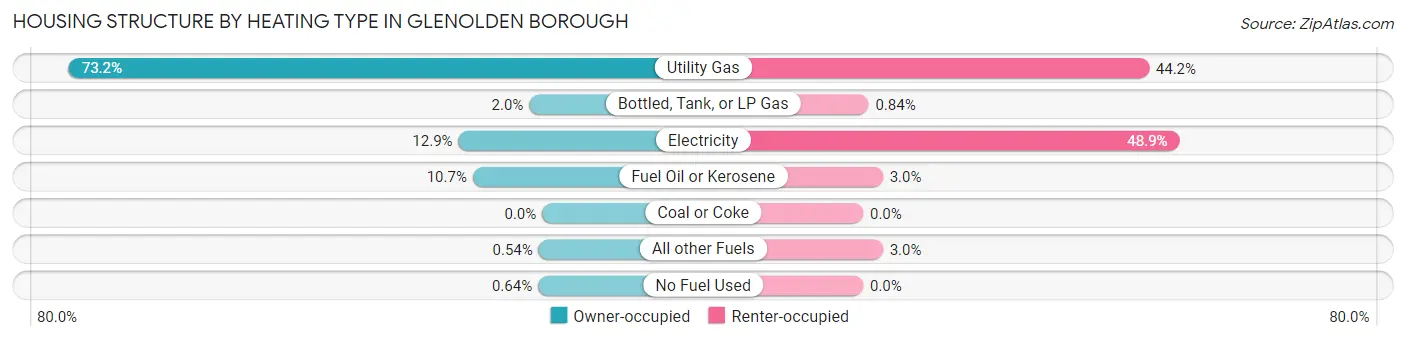
| Heating Type | Owner-occupied | Renter-occupied |
| Utility Gas | 1,611 (73.2%) | 262 (44.2%) |
| Bottled, Tank, or LP Gas | 44 (2.0%) | 5 (0.8%) |
| Electricity | 285 (12.9%) | 290 (48.9%) |
| Fuel Oil or Kerosene | 236 (10.7%) | 18 (3.0%) |
| Coal or Coke | 0 (0.0%) | 0 (0.0%) |
| All other Fuels | 12 (0.5%) | 18 (3.0%) |
| No Fuel Used | 14 (0.6%) | 0 (0.0%) |
| Total | 2,202 (100.0%) | 593 (100.0%) |
Household Vehicle Usage in Glenolden borough
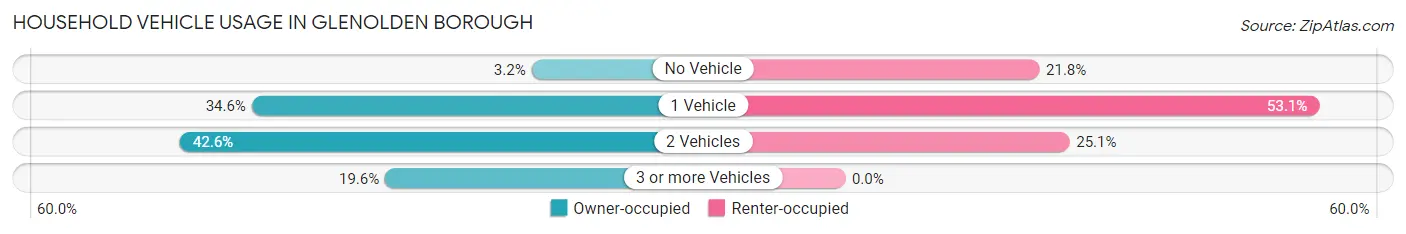
| Vehicles per Household | Owner-occupied | Renter-occupied |
| No Vehicle | 71 (3.2%) | 129 (21.7%) |
| 1 Vehicle | 761 (34.6%) | 315 (53.1%) |
| 2 Vehicles | 938 (42.6%) | 149 (25.1%) |
| 3 or more Vehicles | 432 (19.6%) | 0 (0.0%) |
| Total | 2,202 (100.0%) | 593 (100.0%) |
Real Estate & Mortgages in Glenolden borough
Real Estate and Mortgage Overview in Glenolden borough
| Characteristic | Without Mortgage | With Mortgage |
| Housing Units | 772 | 1,430 |
| Median Property Value | $89,300 | $200,500 |
| Median Household Income | $56,111 | $238 |
| Monthly Housing Costs | $640 | $126 |
| Real Estate Taxes | $2,980 | $0 |
Property Value by Mortgage Status in Glenolden borough
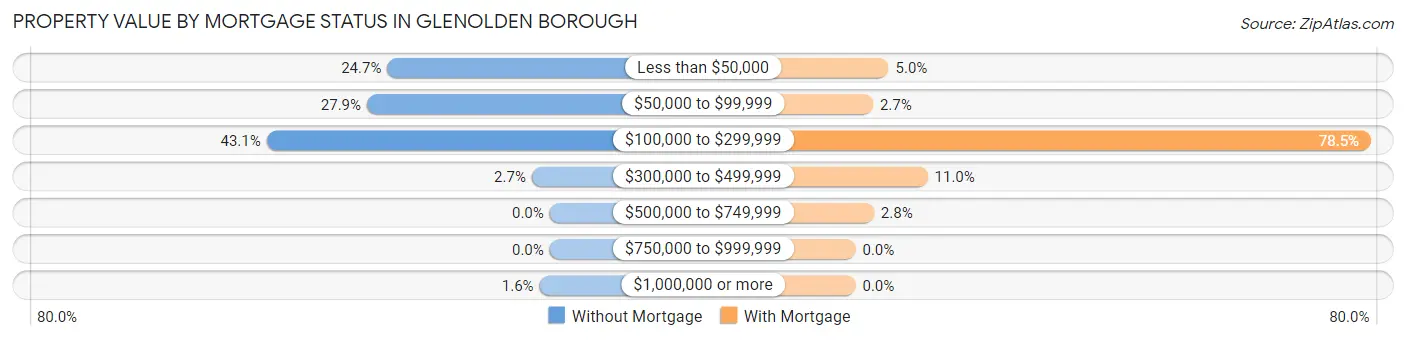
| Property Value | Without Mortgage | With Mortgage |
| Less than $50,000 | 191 (24.7%) | 72 (5.0%) |
| $50,000 to $99,999 | 215 (27.9%) | 38 (2.7%) |
| $100,000 to $299,999 | 333 (43.1%) | 1,123 (78.5%) |
| $300,000 to $499,999 | 21 (2.7%) | 157 (11.0%) |
| $500,000 to $749,999 | 0 (0.0%) | 40 (2.8%) |
| $750,000 to $999,999 | 0 (0.0%) | 0 (0.0%) |
| $1,000,000 or more | 12 (1.5%) | 0 (0.0%) |
| Total | 772 (100.0%) | 1,430 (100.0%) |
Household Income by Mortgage Status in Glenolden borough
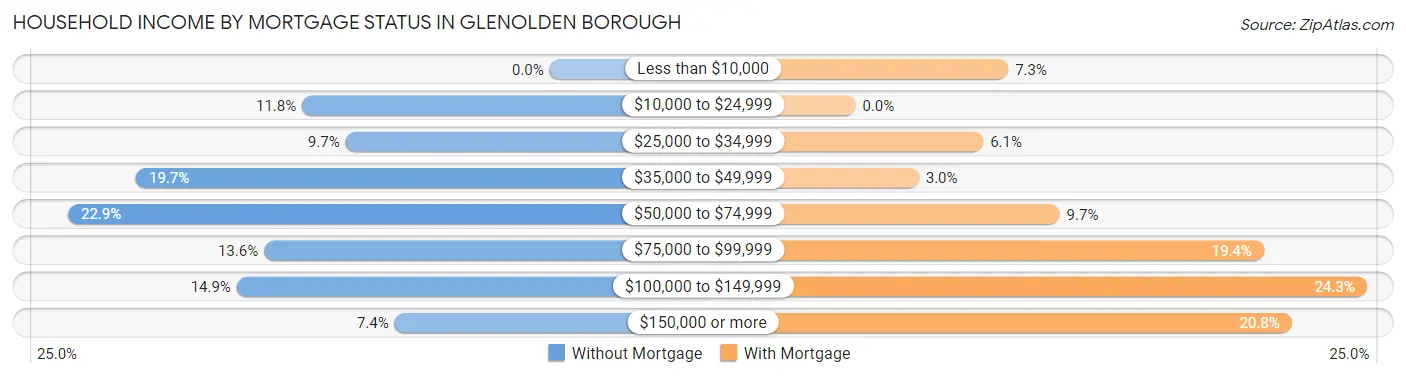
| Household Income | Without Mortgage | With Mortgage |
| Less than $10,000 | 0 (0.0%) | 104 (7.3%) |
| $10,000 to $24,999 | 91 (11.8%) | 0 (0.0%) |
| $25,000 to $34,999 | 75 (9.7%) | 87 (6.1%) |
| $35,000 to $49,999 | 152 (19.7%) | 43 (3.0%) |
| $50,000 to $74,999 | 177 (22.9%) | 139 (9.7%) |
| $75,000 to $99,999 | 105 (13.6%) | 278 (19.4%) |
| $100,000 to $149,999 | 115 (14.9%) | 348 (24.3%) |
| $150,000 or more | 57 (7.4%) | 297 (20.8%) |
| Total | 772 (100.0%) | 1,430 (100.0%) |
Property Value to Household Income Ratio in Glenolden borough
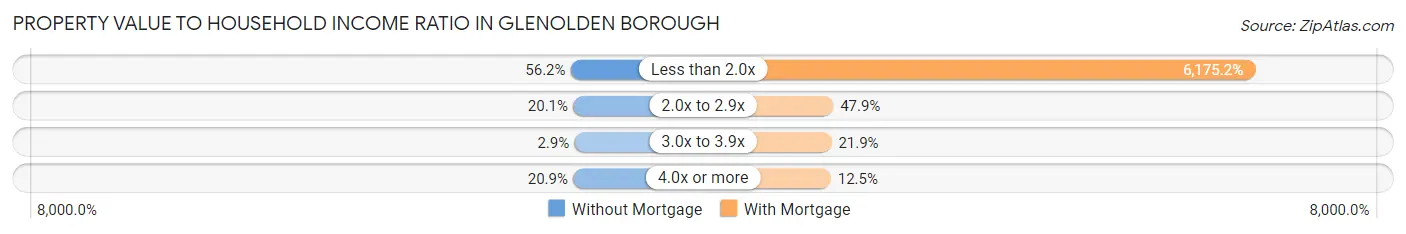
| Value-to-Income Ratio | Without Mortgage | With Mortgage |
| Less than 2.0x | 434 (56.2%) | 88,306 (6,175.2%) |
| 2.0x to 2.9x | 155 (20.1%) | 685 (47.9%) |
| 3.0x to 3.9x | 22 (2.9%) | 313 (21.9%) |
| 4.0x or more | 161 (20.8%) | 179 (12.5%) |
| Total | 772 (100.0%) | 1,430 (100.0%) |
Real Estate Taxes by Mortgage Status in Glenolden borough
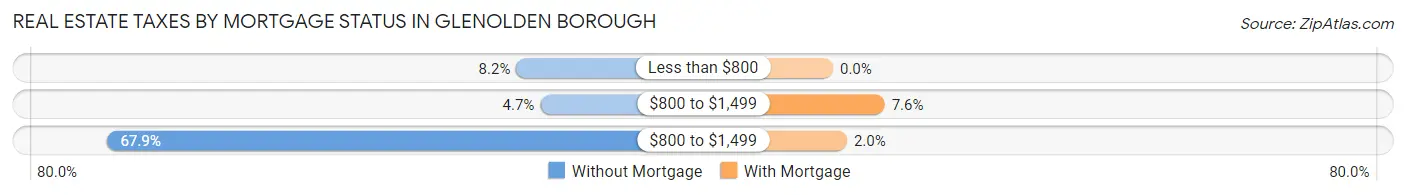
| Property Taxes | Without Mortgage | With Mortgage |
| Less than $800 | 63 (8.2%) | 0 (0.0%) |
| $800 to $1,499 | 36 (4.7%) | 108 (7.5%) |
| $800 to $1,499 | 524 (67.9%) | 29 (2.0%) |
| Total | 772 (100.0%) | 1,430 (100.0%) |
Health & Disability in Glenolden borough
Health Insurance Coverage by Age in Glenolden borough
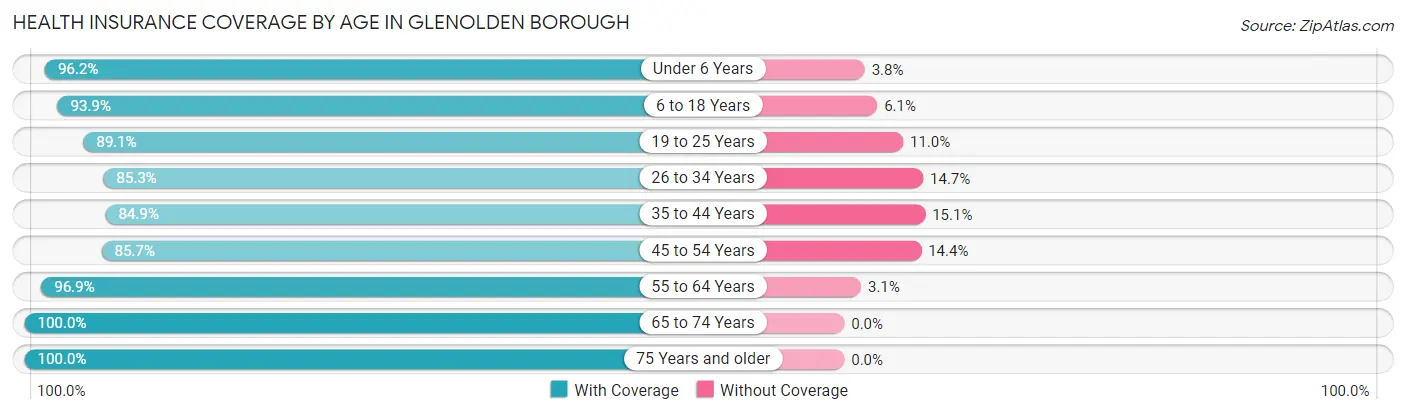
| Age Bracket | With Coverage | Without Coverage |
| Under 6 Years | 834 (96.2%) | 33 (3.8%) |
| 6 to 18 Years | 871 (93.9%) | 57 (6.1%) |
| 19 to 25 Years | 488 (89.0%) | 60 (11.0%) |
| 26 to 34 Years | 743 (85.3%) | 128 (14.7%) |
| 35 to 44 Years | 923 (84.9%) | 164 (15.1%) |
| 45 to 54 Years | 710 (85.7%) | 119 (14.3%) |
| 55 to 64 Years | 963 (96.9%) | 31 (3.1%) |
| 65 to 74 Years | 572 (100.0%) | 0 (0.0%) |
| 75 Years and older | 494 (100.0%) | 0 (0.0%) |
| Total | 6,598 (91.8%) | 592 (8.2%) |
Health Insurance Coverage by Citizenship Status in Glenolden borough
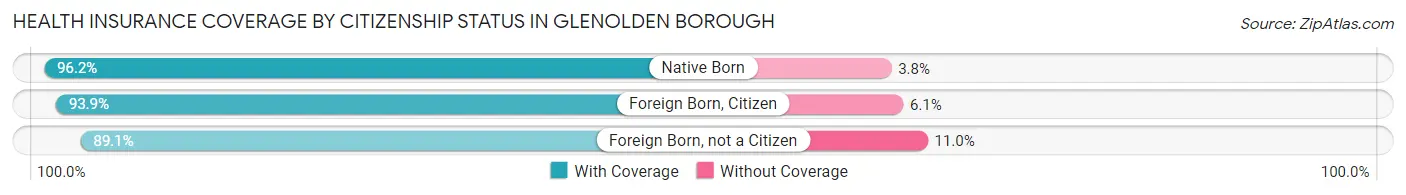
| Citizenship Status | With Coverage | Without Coverage |
| Native Born | 834 (96.2%) | 33 (3.8%) |
| Foreign Born, Citizen | 871 (93.9%) | 57 (6.1%) |
| Foreign Born, not a Citizen | 488 (89.0%) | 60 (11.0%) |
Health Insurance Coverage by Household Income in Glenolden borough
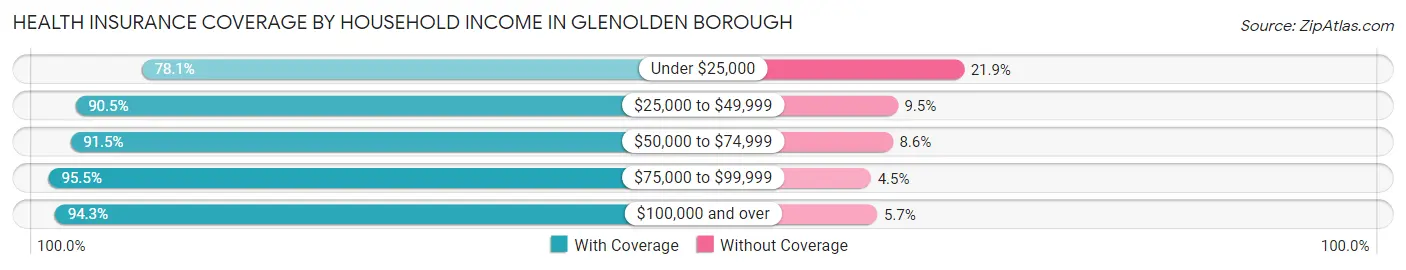
| Household Income | With Coverage | Without Coverage |
| Under $25,000 | 567 (78.1%) | 159 (21.9%) |
| $25,000 to $49,999 | 1,068 (90.5%) | 112 (9.5%) |
| $50,000 to $74,999 | 1,241 (91.4%) | 116 (8.6%) |
| $75,000 to $99,999 | 1,363 (95.5%) | 64 (4.5%) |
| $100,000 and over | 2,352 (94.3%) | 141 (5.7%) |
Public vs Private Health Insurance Coverage by Age in Glenolden borough
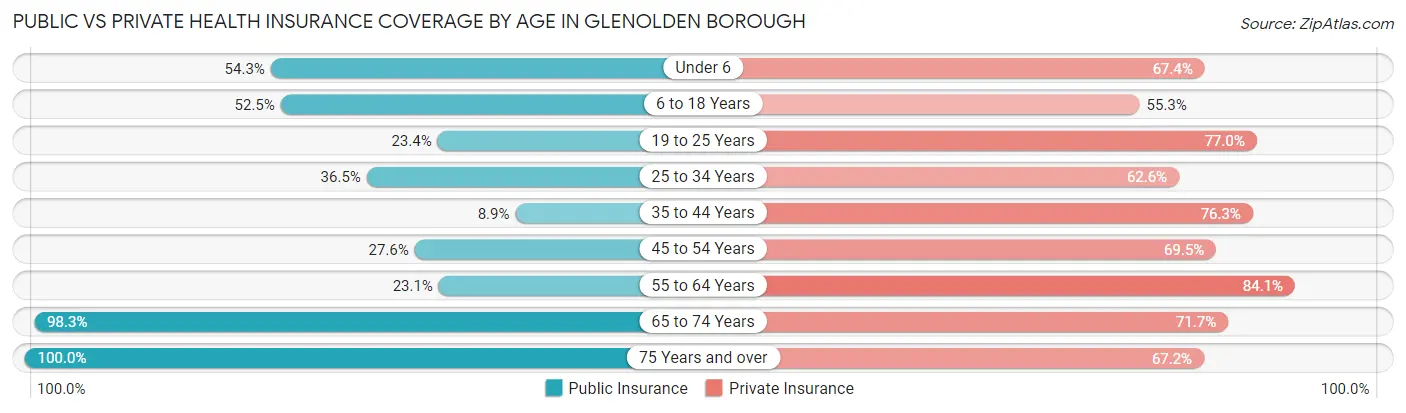
| Age Bracket | Public Insurance | Private Insurance |
| Under 6 | 471 (54.3%) | 584 (67.4%) |
| 6 to 18 Years | 487 (52.5%) | 513 (55.3%) |
| 19 to 25 Years | 128 (23.4%) | 422 (77.0%) |
| 25 to 34 Years | 318 (36.5%) | 545 (62.6%) |
| 35 to 44 Years | 97 (8.9%) | 829 (76.3%) |
| 45 to 54 Years | 229 (27.6%) | 576 (69.5%) |
| 55 to 64 Years | 230 (23.1%) | 836 (84.1%) |
| 65 to 74 Years | 562 (98.3%) | 410 (71.7%) |
| 75 Years and over | 494 (100.0%) | 332 (67.2%) |
| Total | 3,016 (41.9%) | 5,047 (70.2%) |
Disability Status by Sex by Age in Glenolden borough
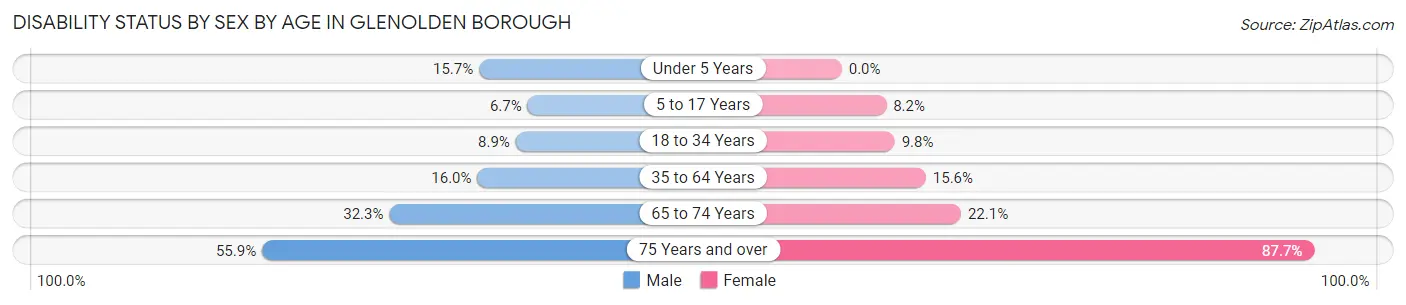
| Age Bracket | Male | Female |
| Under 5 Years | 54 (15.7%) | 0 (0.0%) |
| 5 to 17 Years | 37 (6.7%) | 36 (8.2%) |
| 18 to 34 Years | 69 (8.8%) | 66 (9.8%) |
| 35 to 64 Years | 226 (16.0%) | 233 (15.6%) |
| 65 to 74 Years | 84 (32.3%) | 69 (22.1%) |
| 75 Years and over | 113 (55.9%) | 256 (87.7%) |
Disability Class by Sex by Age in Glenolden borough
Disability Class: Hearing Difficulty
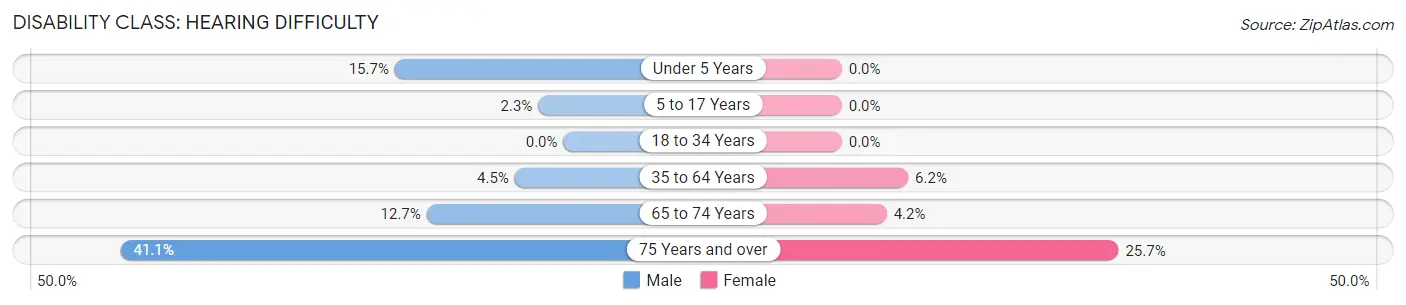
| Age Bracket | Male | Female |
| Under 5 Years | 54 (15.7%) | 0 (0.0%) |
| 5 to 17 Years | 13 (2.3%) | 0 (0.0%) |
| 18 to 34 Years | 0 (0.0%) | 0 (0.0%) |
| 35 to 64 Years | 64 (4.5%) | 92 (6.2%) |
| 65 to 74 Years | 33 (12.7%) | 13 (4.2%) |
| 75 Years and over | 83 (41.1%) | 75 (25.7%) |
Disability Class: Vision Difficulty
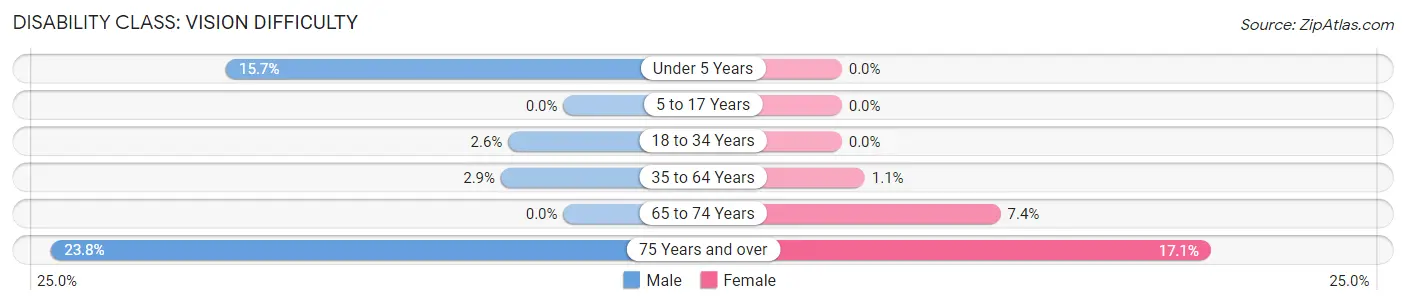
| Age Bracket | Male | Female |
| Under 5 Years | 54 (15.7%) | 0 (0.0%) |
| 5 to 17 Years | 0 (0.0%) | 0 (0.0%) |
| 18 to 34 Years | 20 (2.6%) | 0 (0.0%) |
| 35 to 64 Years | 41 (2.9%) | 16 (1.1%) |
| 65 to 74 Years | 0 (0.0%) | 23 (7.4%) |
| 75 Years and over | 48 (23.8%) | 50 (17.1%) |
Disability Class: Cognitive Difficulty
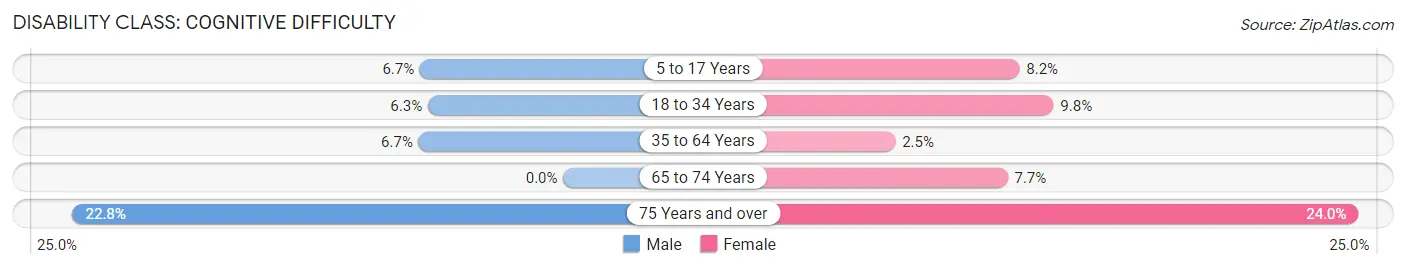
| Age Bracket | Male | Female |
| 5 to 17 Years | 37 (6.7%) | 36 (8.2%) |
| 18 to 34 Years | 49 (6.3%) | 66 (9.8%) |
| 35 to 64 Years | 95 (6.7%) | 37 (2.5%) |
| 65 to 74 Years | 0 (0.0%) | 24 (7.7%) |
| 75 Years and over | 46 (22.8%) | 70 (24.0%) |
Disability Class: Ambulatory Difficulty
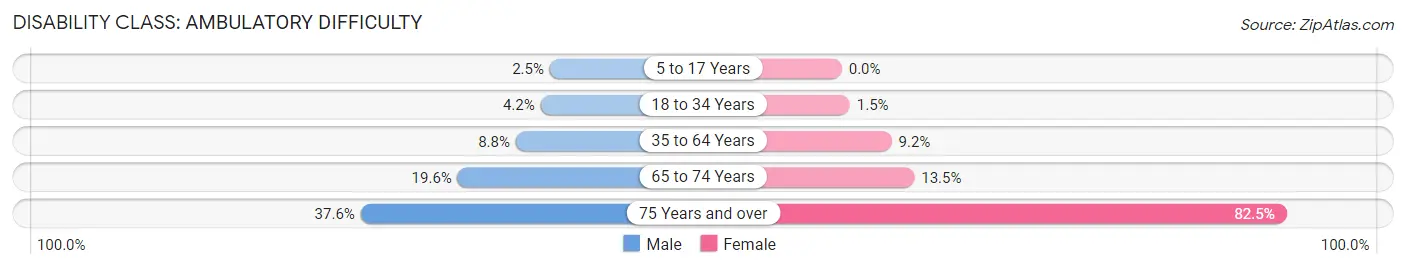
| Age Bracket | Male | Female |
| 5 to 17 Years | 14 (2.5%) | 0 (0.0%) |
| 18 to 34 Years | 33 (4.2%) | 10 (1.5%) |
| 35 to 64 Years | 125 (8.8%) | 138 (9.2%) |
| 65 to 74 Years | 51 (19.6%) | 42 (13.5%) |
| 75 Years and over | 76 (37.6%) | 241 (82.5%) |
Disability Class: Self-Care Difficulty
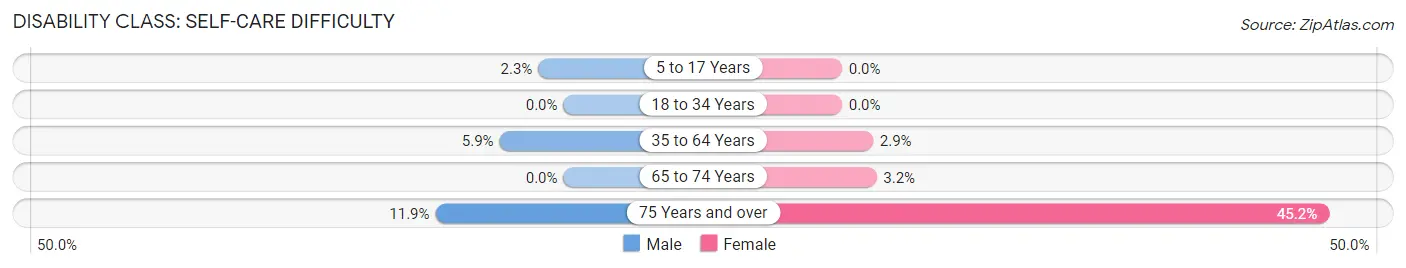
| Age Bracket | Male | Female |
| 5 to 17 Years | 13 (2.3%) | 0 (0.0%) |
| 18 to 34 Years | 0 (0.0%) | 0 (0.0%) |
| 35 to 64 Years | 84 (5.9%) | 43 (2.9%) |
| 65 to 74 Years | 0 (0.0%) | 10 (3.2%) |
| 75 Years and over | 24 (11.9%) | 132 (45.2%) |
Technology Access in Glenolden borough
Computing Device Access in Glenolden borough
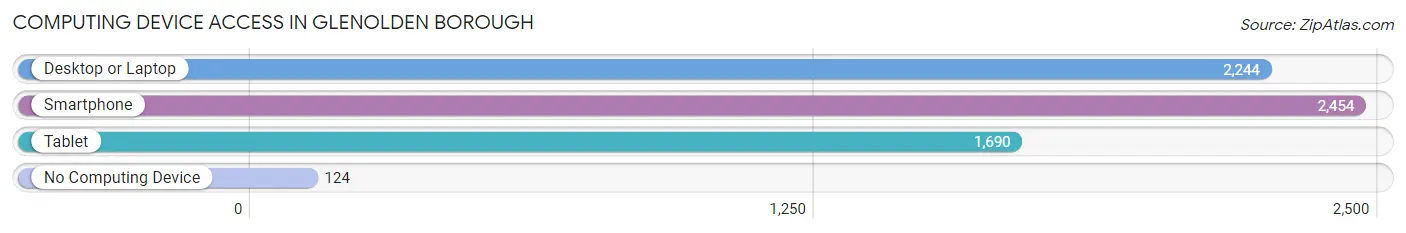
| Device Type | # Households | % Households |
| Desktop or Laptop | 2,244 | 80.3% |
| Smartphone | 2,454 | 87.8% |
| Tablet | 1,690 | 60.5% |
| No Computing Device | 124 | 4.4% |
| Total | 2,795 | 100.0% |
Internet Access in Glenolden borough
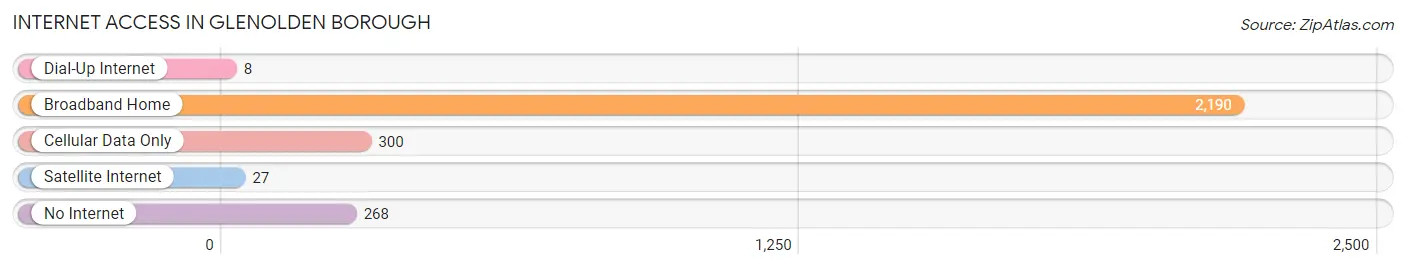
| Internet Type | # Households | % Households |
| Dial-Up Internet | 8 | 0.3% |
| Broadband Home | 2,190 | 78.3% |
| Cellular Data Only | 300 | 10.7% |
| Satellite Internet | 27 | 1.0% |
| No Internet | 268 | 9.6% |
| Total | 2,795 | 100.0% |
Glenolden borough Summary
Glenolden Borough is a small borough located in Delaware County, Pennsylvania. It is situated just south of the city of Philadelphia and is part of the Philadelphia metropolitan area. The borough has a population of approximately 5,000 people and covers an area of 0.6 square miles.
History
Glenolden Borough was founded in 1891 by a group of investors led by William H. Gause. The borough was named after Gause’s hometown of Glenolden, England. The borough was incorporated in 1895 and was originally a farming community. In the early 1900s, the borough began to develop into a residential community. The population grew steadily throughout the 20th century and the borough was eventually annexed by the city of Philadelphia in 1952.
Geography
Glenolden Borough is located in southeastern Pennsylvania, just south of the city of Philadelphia. It is situated in Delaware County and is part of the Philadelphia metropolitan area. The borough covers an area of 0.6 square miles and is bordered by the boroughs of Norwood, Prospect Park, and Ridley Park. The borough is located on the Delaware River and is home to several parks and recreational areas.
Economy
The economy of Glenolden Borough is largely based on the service industry. The borough is home to several small businesses, including restaurants, retail stores, and professional services. The borough also has a number of manufacturing and industrial businesses, including a paper mill and a printing company. The borough is also home to a number of government offices, including the Delaware County Courthouse and the Delaware County Department of Human Services.
Demographics
As of the 2010 census, the population of Glenolden Borough was 5,068. The racial makeup of the borough was 79.3% White, 11.2% African American, 0.3% Native American, 2.2% Asian, and 6.9% from other races. The median household income was $45,945 and the median family income was $54,945. The per capita income was $21,945.
Conclusion
Glenolden Borough is a small borough located in Delaware County, Pennsylvania. It is situated just south of the city of Philadelphia and is part of the Philadelphia metropolitan area. The borough has a population of approximately 5,000 people and covers an area of 0.6 square miles. The economy of the borough is largely based on the service industry and it is home to several small businesses, manufacturing and industrial businesses, and government offices. The population of the borough is largely White, with a small percentage of African Americans, Native Americans, and Asians. The median household income is $45,945 and the median family income is $54,945.
Common Questions
What is Per Capita Income in Glenolden borough?
Per Capita income in Glenolden borough is $35,322.
What is the Median Family Income in Glenolden borough?
Median Family Income in Glenolden borough is $83,438.
What is the Median Household income in Glenolden borough?
Median Household Income in Glenolden borough is $71,719.
What is Income or Wage Gap in Glenolden borough?
Income or Wage Gap in Glenolden borough is 36.3%.
Women in Glenolden borough earn 63.7 cents for every dollar earned by a man.
What is Inequality or Gini Index in Glenolden borough?
Inequality or Gini Index in Glenolden borough is 0.40.
What is the Total Population of Glenolden borough?
Total Population of Glenolden borough is 7,190.
What is the Total Male Population of Glenolden borough?
Total Male Population of Glenolden borough is 3,559.
What is the Total Female Population of Glenolden borough?
Total Female Population of Glenolden borough is 3,631.
What is the Ratio of Males per 100 Females in Glenolden borough?
There are 98.02 Males per 100 Females in Glenolden borough.
What is the Ratio of Females per 100 Males in Glenolden borough?
There are 102.02 Females per 100 Males in Glenolden borough.
What is the Median Population Age in Glenolden borough?
Median Population Age in Glenolden borough is 38.1 Years.
What is the Average Family Size in Glenolden borough
Average Family Size in Glenolden borough is 3.1 People.
What is the Average Household Size in Glenolden borough
Average Household Size in Glenolden borough is 2.6 People.
How Large is the Labor Force in Glenolden borough?
There are 3,792 People in the Labor Forcein in Glenolden borough.
What is the Percentage of People in the Labor Force in Glenolden borough?
68.6% of People are in the Labor Force in Glenolden borough.
What is the Unemployment Rate in Glenolden borough?
Unemployment Rate in Glenolden borough is 4.7%.