Bedford borough, PA Map & Demographics
Bedford borough Overview
$33,204
PER CAPITA INCOME
$84,635
AVG FAMILY INCOME
$48,342
AVG HOUSEHOLD INCOME
31.4%
WAGE / INCOME GAP [ % ]
68.6¢/ $1
WAGE / INCOME GAP [ $ ]
$7,775
FAMILY INCOME DEFICIT
0.45
INEQUALITY / GINI INDEX
2,855
TOTAL POPULATION
1,383
MALE POPULATION
1,472
FEMALE POPULATION
93.95
MALES / 100 FEMALES
106.44
FEMALES / 100 MALES
45.4
MEDIAN AGE
3.0
AVG FAMILY SIZE
2.1
AVG HOUSEHOLD SIZE
1,581
LABOR FORCE [ PEOPLE ]
62.2%
PERCENT IN LABOR FORCE
1.7%
UNEMPLOYMENT RATE
Income in Bedford borough
Income Overview in Bedford borough
Per Capita Income in Bedford borough is $33,204, while median incomes of families and households are $84,635 and $48,342 respectively.
| Characteristic | Number | Measure |
| Per Capita Income | 2,855 | $33,204 |
| Median Family Income | 681 | $84,635 |
| Mean Family Income | 681 | $92,313 |
| Median Household Income | 1,367 | $48,342 |
| Mean Household Income | 1,367 | $66,407 |
| Income Deficit | 681 | $7,775 |
| Wage / Income Gap (%) | 2,855 | 31.36% |
| Wage / Income Gap ($) | 2,855 | 68.64¢ per $1 |
| Gini / Inequality Index | 2,855 | 0.45 |
Earnings by Sex in Bedford borough
Average Earnings in Bedford borough are $27,832, $35,000 for men and $24,023 for women, a difference of 31.4%.
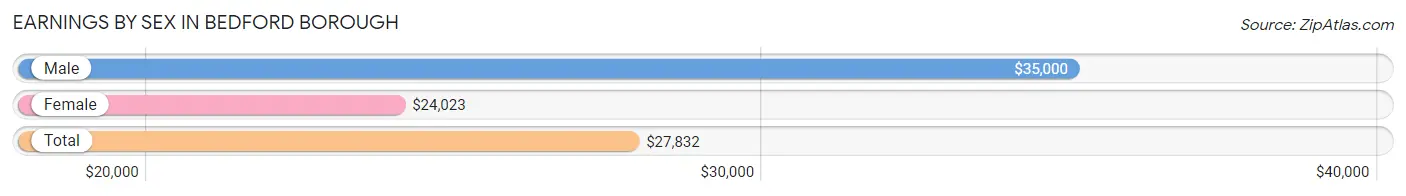
| Sex | Number | Average Earnings |
| Male | 870 (53.0%) | $35,000 |
| Female | 771 (47.0%) | $24,023 |
| Total | 1,641 (100.0%) | $27,832 |
Earnings by Sex by Income Bracket in Bedford borough
The most common earnings brackets in Bedford borough are $75,000 to $99,999 for men (105 | 12.1%) and $22,500 to $24,999 for women (96 | 12.4%).
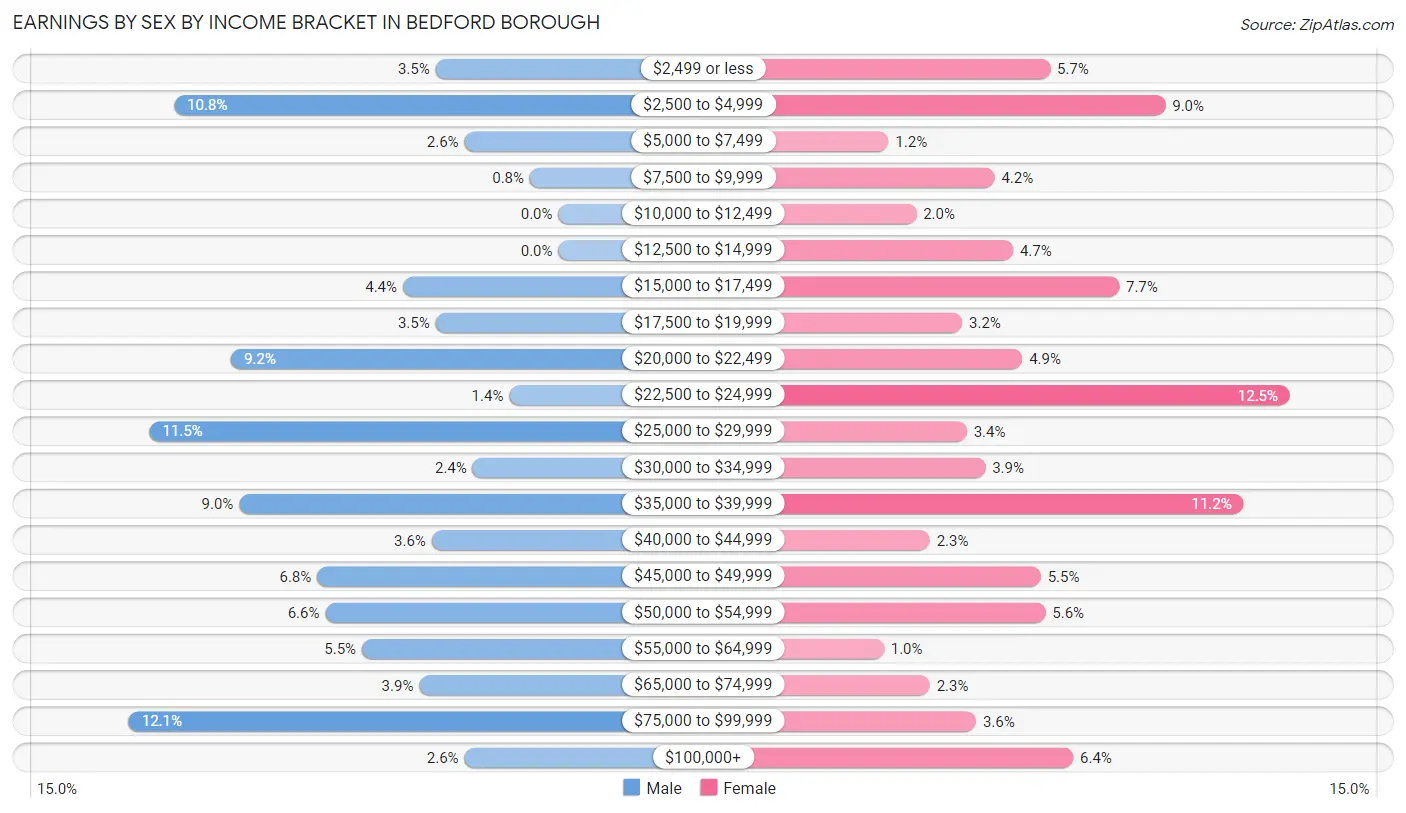
| Income | Male | Female |
| $2,499 or less | 30 (3.5%) | 44 (5.7%) |
| $2,500 to $4,999 | 94 (10.8%) | 69 (8.9%) |
| $5,000 to $7,499 | 23 (2.6%) | 9 (1.2%) |
| $7,500 to $9,999 | 7 (0.8%) | 32 (4.2%) |
| $10,000 to $12,499 | 0 (0.0%) | 15 (1.9%) |
| $12,500 to $14,999 | 0 (0.0%) | 36 (4.7%) |
| $15,000 to $17,499 | 38 (4.4%) | 59 (7.6%) |
| $17,500 to $19,999 | 30 (3.5%) | 25 (3.2%) |
| $20,000 to $22,499 | 80 (9.2%) | 38 (4.9%) |
| $22,500 to $24,999 | 12 (1.4%) | 96 (12.4%) |
| $25,000 to $29,999 | 100 (11.5%) | 26 (3.4%) |
| $30,000 to $34,999 | 21 (2.4%) | 30 (3.9%) |
| $35,000 to $39,999 | 78 (9.0%) | 86 (11.2%) |
| $40,000 to $44,999 | 31 (3.6%) | 18 (2.3%) |
| $45,000 to $49,999 | 59 (6.8%) | 42 (5.4%) |
| $50,000 to $54,999 | 57 (6.6%) | 43 (5.6%) |
| $55,000 to $64,999 | 48 (5.5%) | 8 (1.0%) |
| $65,000 to $74,999 | 34 (3.9%) | 18 (2.3%) |
| $75,000 to $99,999 | 105 (12.1%) | 28 (3.6%) |
| $100,000+ | 23 (2.6%) | 49 (6.4%) |
| Total | 870 (100.0%) | 771 (100.0%) |
Earnings by Sex by Educational Attainment in Bedford borough
Average earnings in Bedford borough are $39,615 for men and $30,833 for women, a difference of 22.2%. Men with an educational attainment of graduate degree enjoy the highest average annual earnings of $57,614, while those with high school diploma education earn the least with $28,542. Women with an educational attainment of graduate degree earn the most with the average annual earnings of $76,136, while those with college or associate's degree education have the smallest earnings of $24,125.
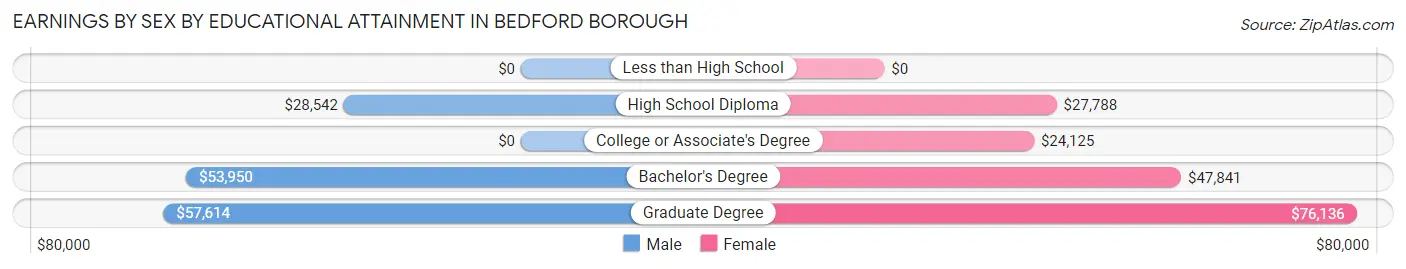
| Educational Attainment | Male Income | Female Income |
| Less than High School | - | - |
| High School Diploma | $28,542 | $27,788 |
| College or Associate's Degree | - | - |
| Bachelor's Degree | $53,950 | $47,841 |
| Graduate Degree | $57,614 | $76,136 |
| Total | $39,615 | $30,833 |
Family Income in Bedford borough
Family Income Brackets in Bedford borough
According to the Bedford borough family income data, there are 175 families falling into the $100,000 to $149,999 income range, which is the most common income bracket and makes up 25.7% of all families.
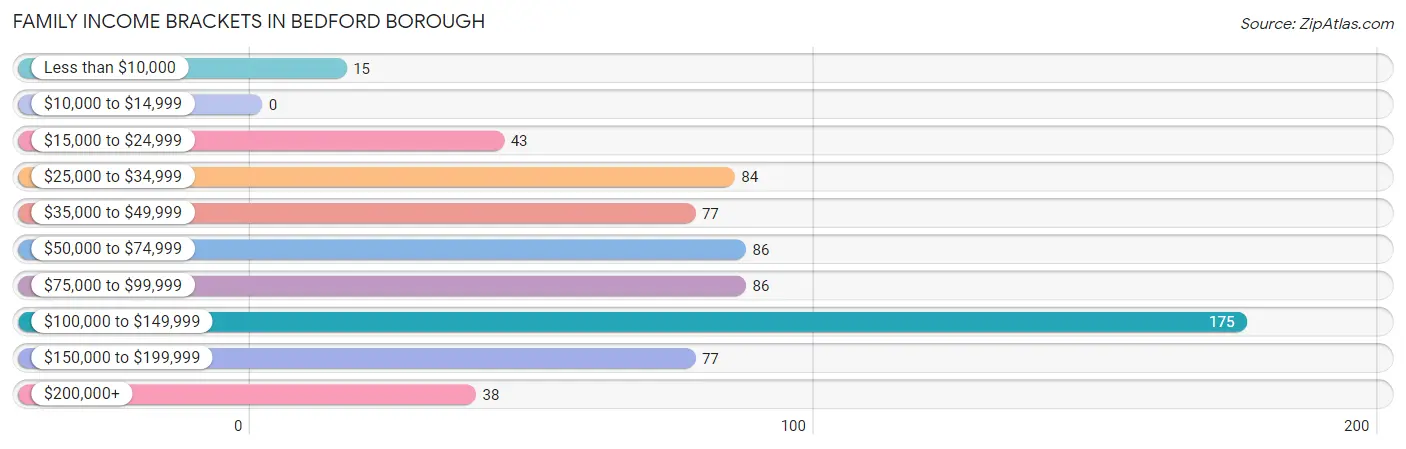
| Income Bracket | # Families | % Families |
| Less than $10,000 | 15 | 2.2% |
| $10,000 to $14,999 | 0 | 0.0% |
| $15,000 to $24,999 | 43 | 6.3% |
| $25,000 to $34,999 | 84 | 12.3% |
| $35,000 to $49,999 | 77 | 11.3% |
| $50,000 to $74,999 | 86 | 12.6% |
| $75,000 to $99,999 | 86 | 12.6% |
| $100,000 to $149,999 | 175 | 25.7% |
| $150,000 to $199,999 | 77 | 11.3% |
| $200,000+ | 38 | 5.6% |
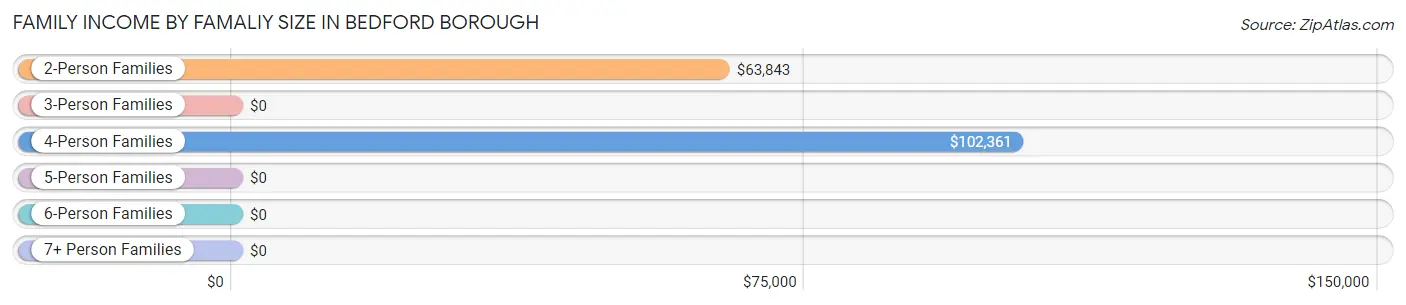
Family Income by Famaliy Size in Bedford borough
4-person families (101 | 14.8%) account for the highest median family income in Bedford borough with $102,361 per family, while 2-person families (391 | 57.4%) have the highest median income of $31,922 per family member.
| Income Bracket | # Families | Median Income |
| 2-Person Families | 391 (57.4%) | $63,843 |
| 3-Person Families | 110 (16.2%) | $0 |
| 4-Person Families | 101 (14.8%) | $102,361 |
| 5-Person Families | 16 (2.4%) | $0 |
| 6-Person Families | 63 (9.2%) | $0 |
| 7+ Person Families | 0 (0.0%) | $0 |
| Total | 681 (100.0%) | $84,635 |
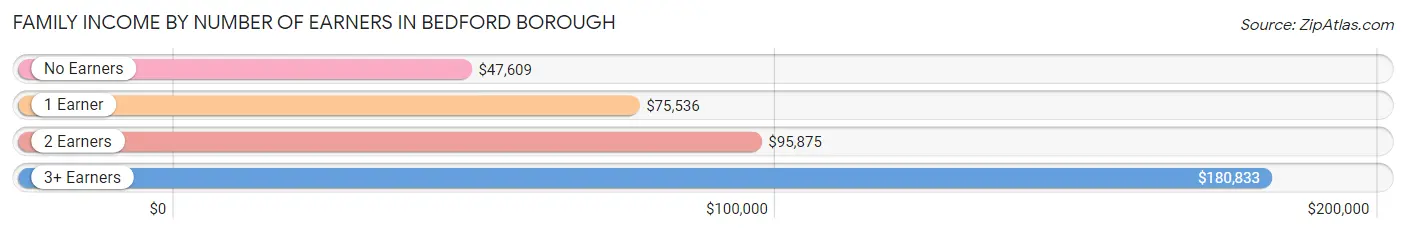
Family Income by Number of Earners in Bedford borough
The median family income in Bedford borough is $84,635, with families comprising 3+ earners (114) having the highest median family income of $180,833, while families with no earners (124) have the lowest median family income of $47,609, accounting for 16.7% and 18.2% of families, respectively.
| Number of Earners | # Families | Median Income |
| No Earners | 124 (18.2%) | $47,609 |
| 1 Earner | 149 (21.9%) | $75,536 |
| 2 Earners | 294 (43.2%) | $95,875 |
| 3+ Earners | 114 (16.7%) | $180,833 |
| Total | 681 (100.0%) | $84,635 |
Household Income in Bedford borough
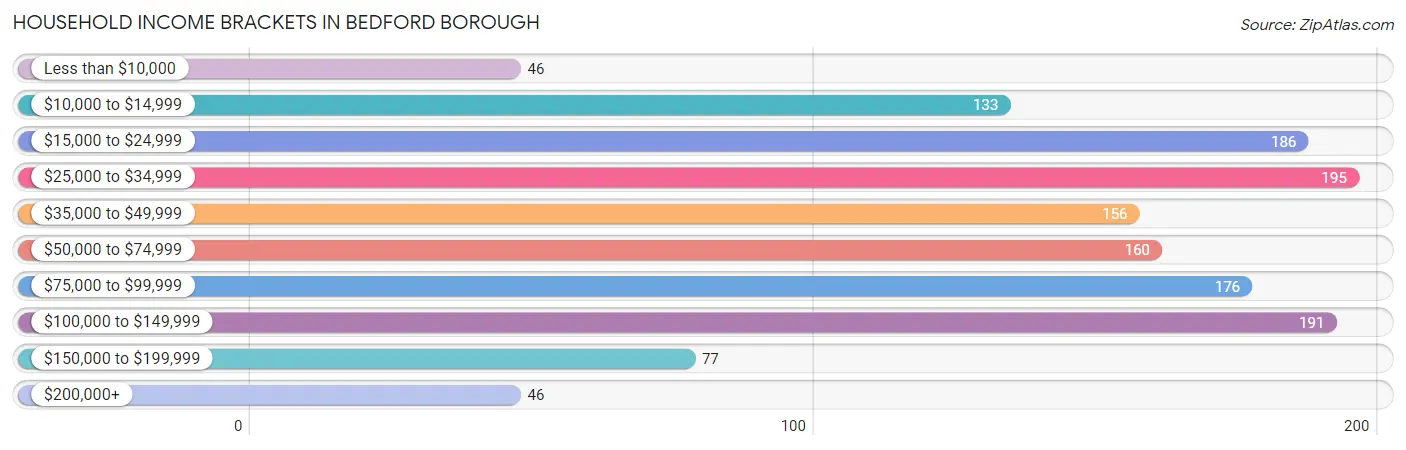
Household Income Brackets in Bedford borough
With 195 households falling in the category, the $25,000 to $34,999 income range is the most frequent in Bedford borough, accounting for 14.3% of all households. In contrast, only 46 households (3.4%) fall into the less than $10,000 income bracket, making it the least populous group.
| Income Bracket | # Households | % Households |
| Less than $10,000 | 46 | 3.4% |
| $10,000 to $14,999 | 133 | 9.7% |
| $15,000 to $24,999 | 186 | 13.6% |
| $25,000 to $34,999 | 195 | 14.3% |
| $35,000 to $49,999 | 156 | 11.4% |
| $50,000 to $74,999 | 160 | 11.7% |
| $75,000 to $99,999 | 176 | 12.9% |
| $100,000 to $149,999 | 191 | 14.0% |
| $150,000 to $199,999 | 77 | 5.6% |
| $200,000+ | 46 | 3.4% |
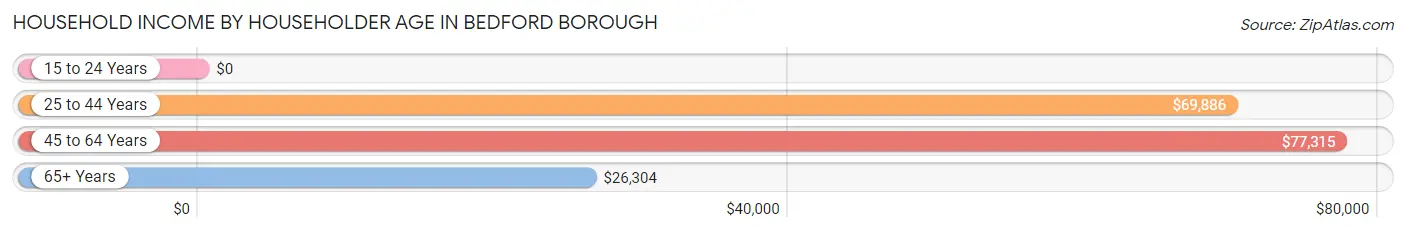
Household Income by Householder Age in Bedford borough
The median household income in Bedford borough is $48,342, with the highest median household income of $77,315 found in the 45 to 64 years age bracket for the primary householder. A total of 396 households (29.0%) fall into this category. Meanwhile, the 15 to 24 years age bracket for the primary householder has the lowest median household income of $0, with 22 households (1.6%) in this group.
| Income Bracket | # Households | Median Income |
| 15 to 24 Years | 22 (1.6%) | $0 |
| 25 to 44 Years | 375 (27.4%) | $69,886 |
| 45 to 64 Years | 396 (29.0%) | $77,315 |
| 65+ Years | 574 (42.0%) | $26,304 |
| Total | 1,367 (100.0%) | $48,342 |
Poverty in Bedford borough
Income Below Poverty by Sex and Age in Bedford borough
With 10.9% poverty level for males and 8.0% for females among the residents of Bedford borough, 75 year old and over males and 65 to 74 year old females are the most vulnerable to poverty, with 39 males (27.5%) and 52 females (22.9%) in their respective age groups living below the poverty level.
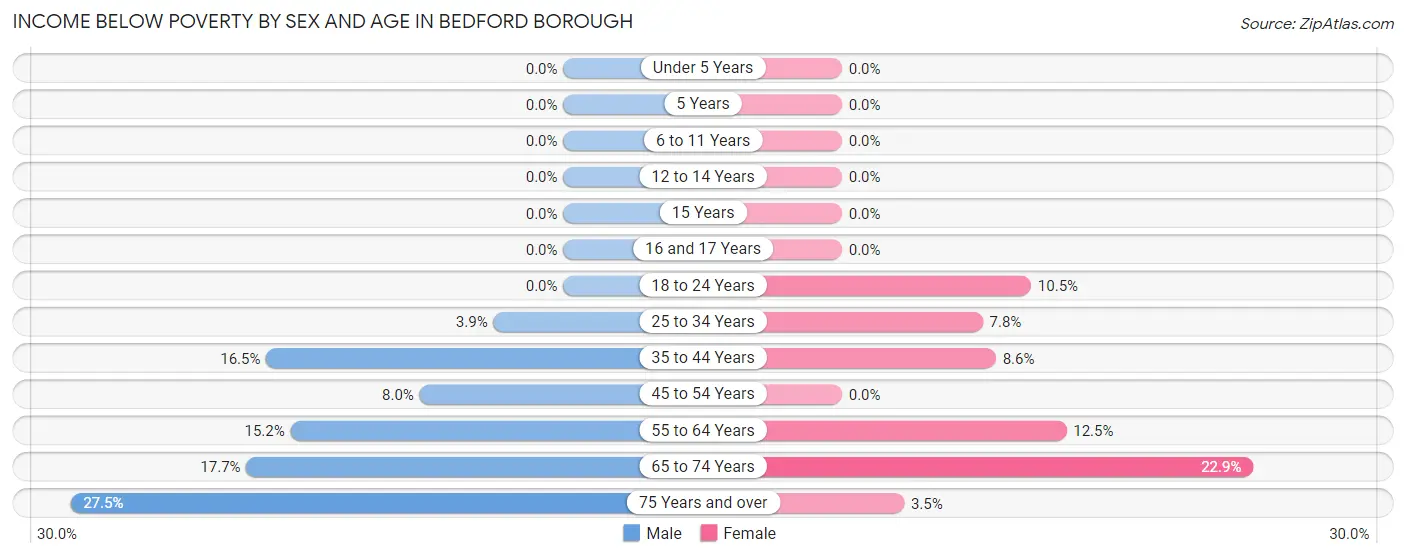
| Age Bracket | Male | Female |
| Under 5 Years | 0 (0.0%) | 0 (0.0%) |
| 5 Years | 0 (0.0%) | 0 (0.0%) |
| 6 to 11 Years | 0 (0.0%) | 0 (0.0%) |
| 12 to 14 Years | 0 (0.0%) | 0 (0.0%) |
| 15 Years | 0 (0.0%) | 0 (0.0%) |
| 16 and 17 Years | 0 (0.0%) | 0 (0.0%) |
| 18 to 24 Years | 0 (0.0%) | 12 (10.5%) |
| 25 to 34 Years | 7 (3.9%) | 8 (7.8%) |
| 35 to 44 Years | 42 (16.5%) | 15 (8.6%) |
| 45 to 54 Years | 12 (8.0%) | 0 (0.0%) |
| 55 to 64 Years | 24 (15.2%) | 23 (12.5%) |
| 65 to 74 Years | 27 (17.6%) | 52 (22.9%) |
| 75 Years and over | 39 (27.5%) | 8 (3.5%) |
| Total | 151 (10.9%) | 118 (8.0%) |
Income Above Poverty by Sex and Age in Bedford borough
According to the poverty statistics in Bedford borough, males aged under 5 years and females aged under 5 years are the age groups that are most secure financially, with 100.0% of males and 100.0% of females in these age groups living above the poverty line.
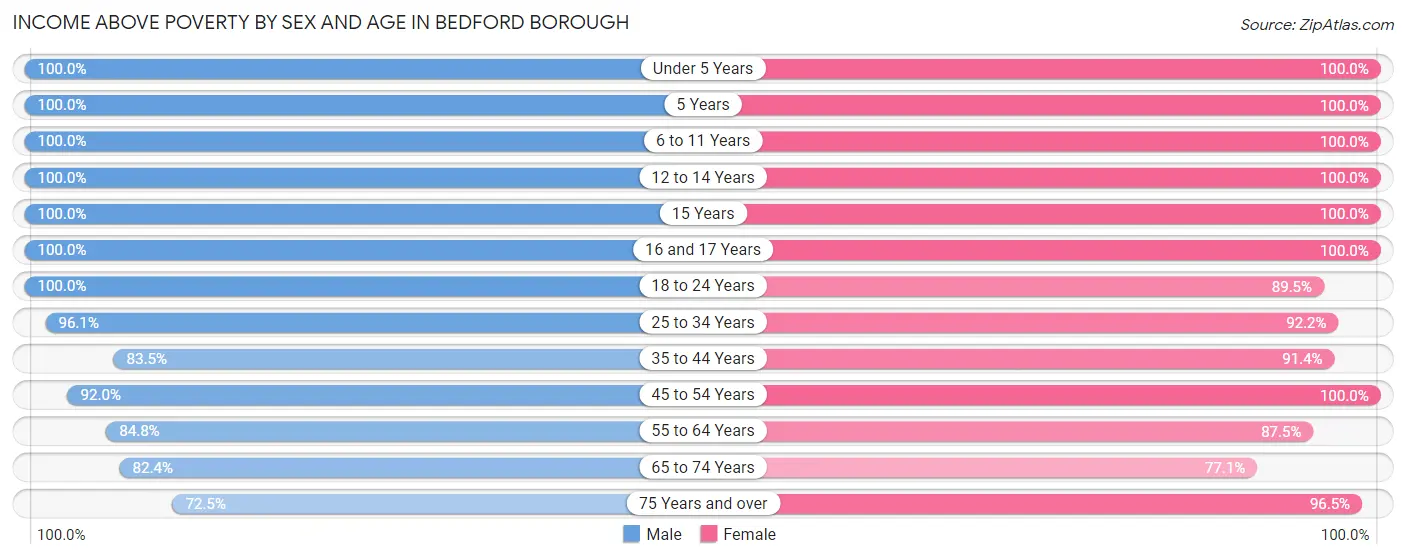
| Age Bracket | Male | Female |
| Under 5 Years | 13 (100.0%) | 78 (100.0%) |
| 5 Years | 10 (100.0%) | 3 (100.0%) |
| 6 to 11 Years | 52 (100.0%) | 67 (100.0%) |
| 12 to 14 Years | 20 (100.0%) | 49 (100.0%) |
| 15 Years | 9 (100.0%) | 13 (100.0%) |
| 16 and 17 Years | 112 (100.0%) | 32 (100.0%) |
| 18 to 24 Years | 130 (100.0%) | 102 (89.5%) |
| 25 to 34 Years | 173 (96.1%) | 94 (92.2%) |
| 35 to 44 Years | 212 (83.5%) | 160 (91.4%) |
| 45 to 54 Years | 138 (92.0%) | 197 (100.0%) |
| 55 to 64 Years | 134 (84.8%) | 161 (87.5%) |
| 65 to 74 Years | 126 (82.4%) | 175 (77.1%) |
| 75 Years and over | 103 (72.5%) | 223 (96.5%) |
| Total | 1,232 (89.1%) | 1,354 (92.0%) |
Income Below Poverty Among Married-Couple Families in Bedford borough
The poverty statistics for married-couple families in Bedford borough show that 5.5% or 28 of the total 510 families live below the poverty line. Families with no children have the highest poverty rate of 9.2%, comprising of 28 families. On the other hand, families with 1 or 2 children have the lowest poverty rate of 0.0%, which includes 0 families.
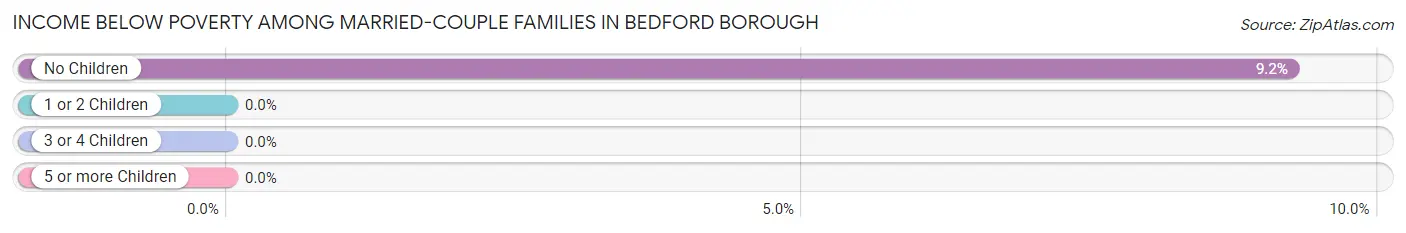
| Children | Above Poverty | Below Poverty |
| No Children | 275 (90.8%) | 28 (9.2%) |
| 1 or 2 Children | 193 (100.0%) | 0 (0.0%) |
| 3 or 4 Children | 14 (100.0%) | 0 (0.0%) |
| 5 or more Children | 0 (0.0%) | 0 (0.0%) |
| Total | 482 (94.5%) | 28 (5.5%) |
Income Below Poverty Among Single-Parent Households in Bedford borough
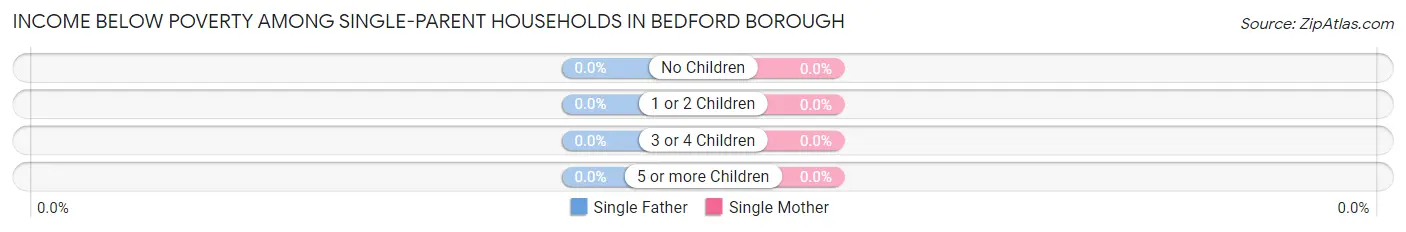
| Children | Single Father | Single Mother |
| No Children | 0 (0.0%) | 0 (0.0%) |
| 1 or 2 Children | 0 (0.0%) | 0 (0.0%) |
| 3 or 4 Children | 0 (0.0%) | 0 (0.0%) |
| 5 or more Children | 0 (0.0%) | 0 (0.0%) |
| Total | 0 (0.0%) | 0 (0.0%) |
Income Below Poverty Among Married-Couple vs Single-Parent Households in Bedford borough
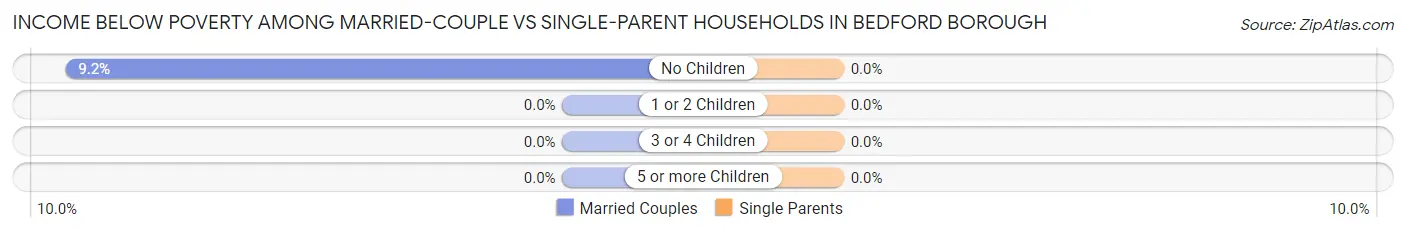
| Children | Married-Couple Families | Single-Parent Households |
| No Children | 28 (9.2%) | 0 (0.0%) |
| 1 or 2 Children | 0 (0.0%) | 0 (0.0%) |
| 3 or 4 Children | 0 (0.0%) | 0 (0.0%) |
| 5 or more Children | 0 (0.0%) | 0 (0.0%) |
| Total | 28 (5.5%) | 0 (0.0%) |
Race in Bedford borough
The most populous races in Bedford borough are White / Caucasian (2,702 | 94.6%), Black / African American (55 | 1.9%), and Two or more Races (52 | 1.8%).
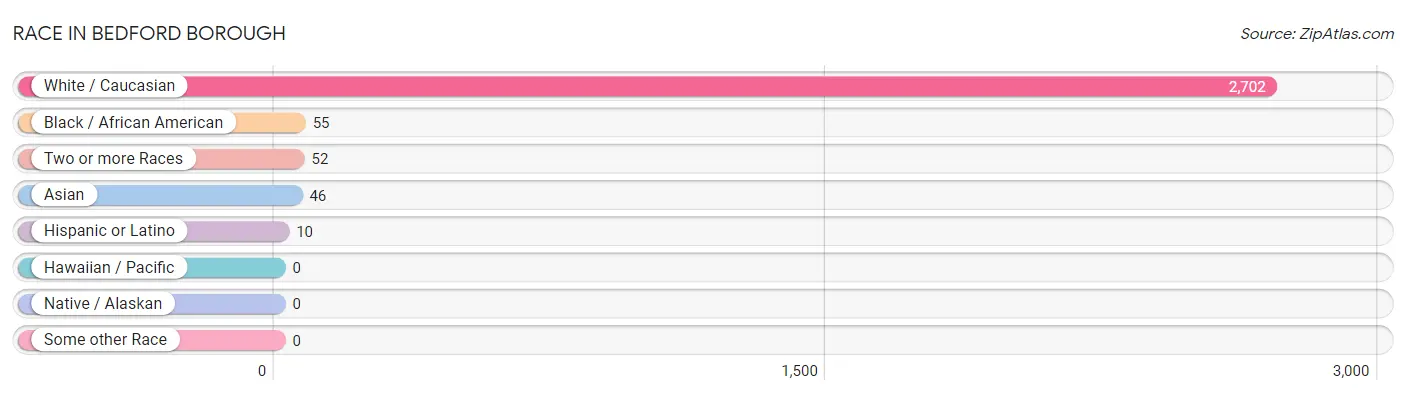
| Race | # Population | % Population |
| Asian | 46 | 1.6% |
| Black / African American | 55 | 1.9% |
| Hawaiian / Pacific | 0 | 0.0% |
| Hispanic or Latino | 10 | 0.4% |
| Native / Alaskan | 0 | 0.0% |
| White / Caucasian | 2,702 | 94.6% |
| Two or more Races | 52 | 1.8% |
| Some other Race | 0 | 0.0% |
| Total | 2,855 | 100.0% |
Ancestry in Bedford borough
The most populous ancestries reported in Bedford borough are German (1,043 | 36.5%), English (296 | 10.4%), American (271 | 9.5%), Irish (251 | 8.8%), and Italian (77 | 2.7%), together accounting for 67.9% of all Bedford borough residents.
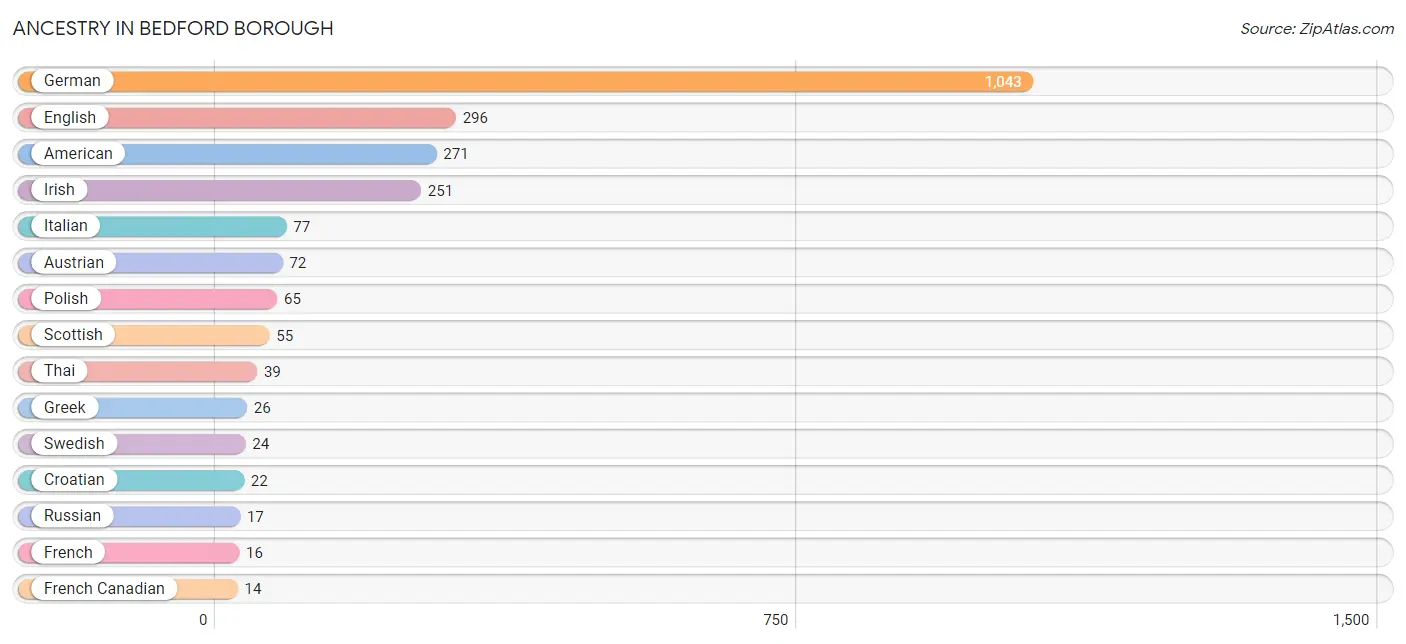
| Ancestry | # Population | % Population |
| American | 271 | 9.5% |
| Austrian | 72 | 2.5% |
| British | 10 | 0.4% |
| Carpatho Rusyn | 9 | 0.3% |
| Croatian | 22 | 0.8% |
| Czech | 9 | 0.3% |
| Dutch | 5 | 0.2% |
| English | 296 | 10.4% |
| French | 16 | 0.6% |
| French Canadian | 14 | 0.5% |
| German | 1,043 | 36.5% |
| Greek | 26 | 0.9% |
| Hungarian | 4 | 0.1% |
| Indian (Asian) | 7 | 0.3% |
| Irish | 251 | 8.8% |
| Italian | 77 | 2.7% |
| Lithuanian | 5 | 0.2% |
| Mexican | 10 | 0.4% |
| Pennsylvania German | 5 | 0.2% |
| Polish | 65 | 2.3% |
| Russian | 17 | 0.6% |
| Scotch-Irish | 7 | 0.3% |
| Scottish | 55 | 1.9% |
| Serbian | 10 | 0.4% |
| Swedish | 24 | 0.8% |
| Swiss | 8 | 0.3% |
| Thai | 39 | 1.4% |
| Welsh | 9 | 0.3% | View All 28 Rows |
Immigrants in Bedford borough
The most numerous immigrant groups reported in Bedford borough came from Asia (39 | 1.4%), India (39 | 1.4%), South Central Asia (39 | 1.4%), Europe (4 | 0.1%), and Ireland (4 | 0.1%), together accounting for 4.4% of all Bedford borough residents.
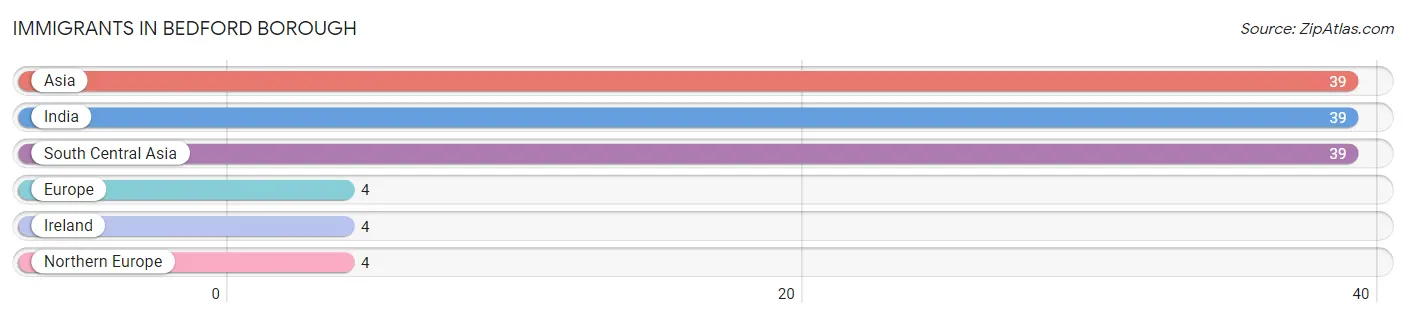
| Immigration Origin | # Population | % Population |
| Asia | 39 | 1.4% |
| Europe | 4 | 0.1% |
| India | 39 | 1.4% |
| Ireland | 4 | 0.1% |
| Northern Europe | 4 | 0.1% |
| South Central Asia | 39 | 1.4% | View All 6 Rows |
Sex and Age in Bedford borough
Sex and Age in Bedford borough
The most populous age groups in Bedford borough are 35 to 39 Years (142 | 10.3%) for men and 35 to 39 Years (125 | 8.5%) for women.
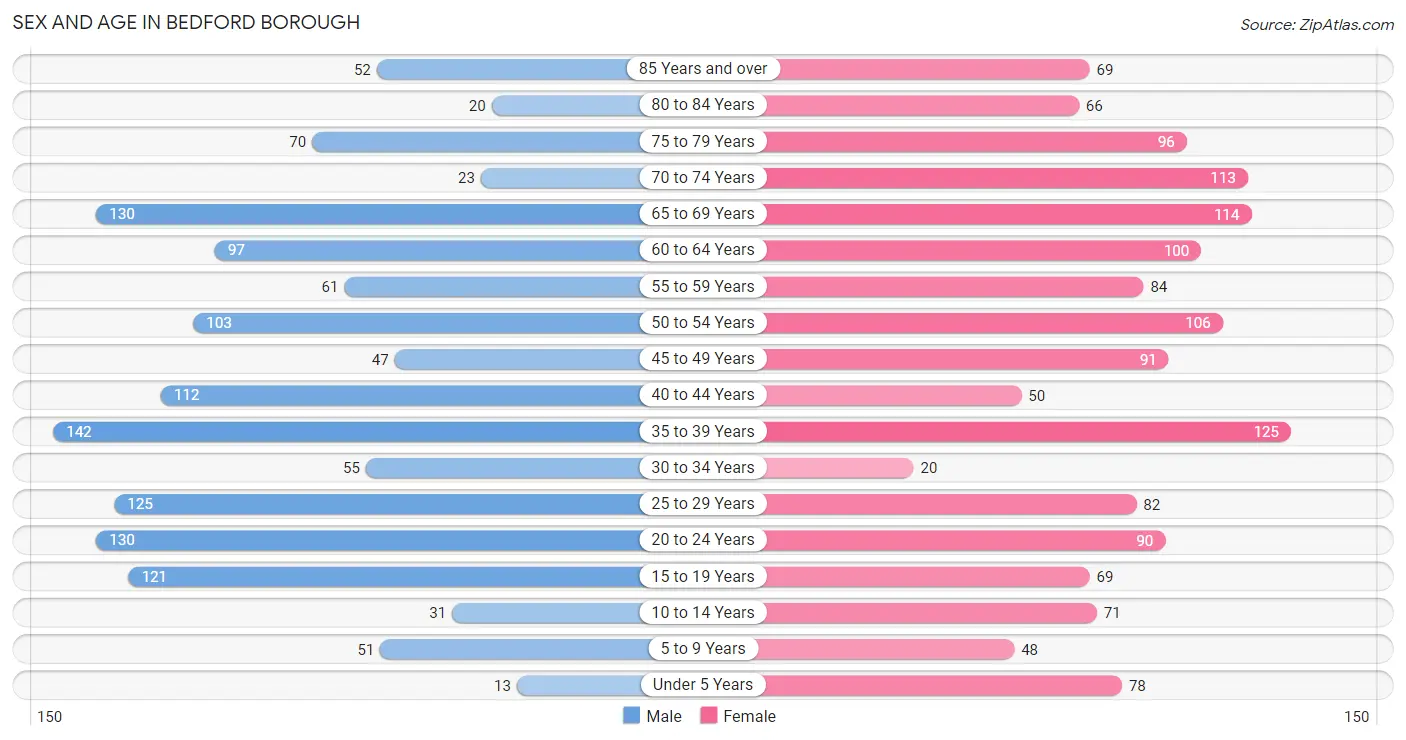
| Age Bracket | Male | Female |
| Under 5 Years | 13 (0.9%) | 78 (5.3%) |
| 5 to 9 Years | 51 (3.7%) | 48 (3.3%) |
| 10 to 14 Years | 31 (2.2%) | 71 (4.8%) |
| 15 to 19 Years | 121 (8.7%) | 69 (4.7%) |
| 20 to 24 Years | 130 (9.4%) | 90 (6.1%) |
| 25 to 29 Years | 125 (9.0%) | 82 (5.6%) |
| 30 to 34 Years | 55 (4.0%) | 20 (1.4%) |
| 35 to 39 Years | 142 (10.3%) | 125 (8.5%) |
| 40 to 44 Years | 112 (8.1%) | 50 (3.4%) |
| 45 to 49 Years | 47 (3.4%) | 91 (6.2%) |
| 50 to 54 Years | 103 (7.4%) | 106 (7.2%) |
| 55 to 59 Years | 61 (4.4%) | 84 (5.7%) |
| 60 to 64 Years | 97 (7.0%) | 100 (6.8%) |
| 65 to 69 Years | 130 (9.4%) | 114 (7.7%) |
| 70 to 74 Years | 23 (1.7%) | 113 (7.7%) |
| 75 to 79 Years | 70 (5.1%) | 96 (6.5%) |
| 80 to 84 Years | 20 (1.5%) | 66 (4.5%) |
| 85 Years and over | 52 (3.8%) | 69 (4.7%) |
| Total | 1,383 (100.0%) | 1,472 (100.0%) |
Families and Households in Bedford borough
Median Family Size in Bedford borough
The median family size in Bedford borough is 3.00 persons per family, with married-couple families (510 | 74.9%) accounting for the largest median family size of 3.14 persons per family. On the other hand, single male/father families (73 | 10.7%) represent the smallest median family size with 2.48 persons per family.
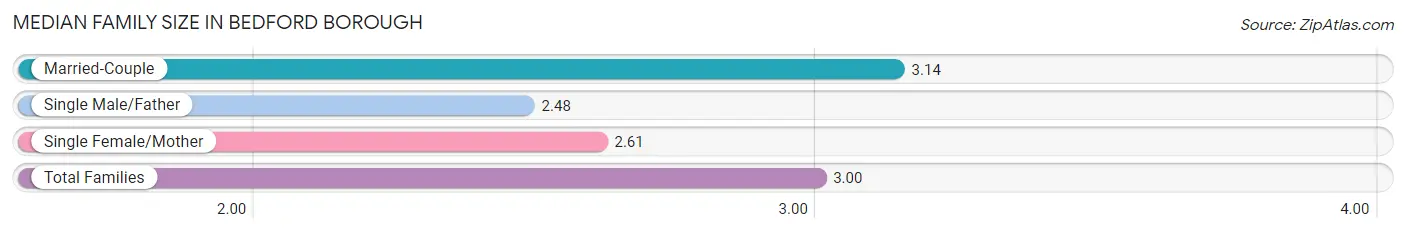
| Family Type | # Families | Family Size |
| Married-Couple | 510 (74.9%) | 3.14 |
| Single Male/Father | 73 (10.7%) | 2.48 |
| Single Female/Mother | 98 (14.4%) | 2.61 |
| Total Families | 681 (100.0%) | 3.00 |
Median Household Size in Bedford borough
The median household size in Bedford borough is 2.08 persons per household, with married-couple households (510 | 37.3%) accounting for the largest median household size of 3.14 persons per household. non-family households (686 | 50.2%) represent the smallest median household size with 1.10 persons per household.
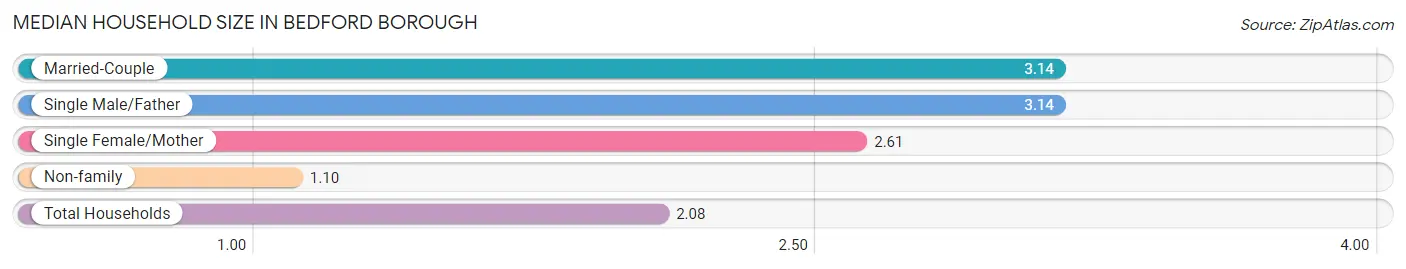
| Household Type | # Households | Household Size |
| Married-Couple | 510 (37.3%) | 3.14 |
| Single Male/Father | 73 (5.3%) | 3.14 |
| Single Female/Mother | 98 (7.2%) | 2.61 |
| Non-family | 686 (50.2%) | 1.10 |
| Total Households | 1,367 (100.0%) | 2.08 |
Household Size by Marriage Status in Bedford borough
Out of a total of 1,367 households in Bedford borough, 681 (49.8%) are family households, while 686 (50.2%) are nonfamily households. The most numerous type of family households are 2-person households, comprising 357, and the most common type of nonfamily households are 1-person households, comprising 622.
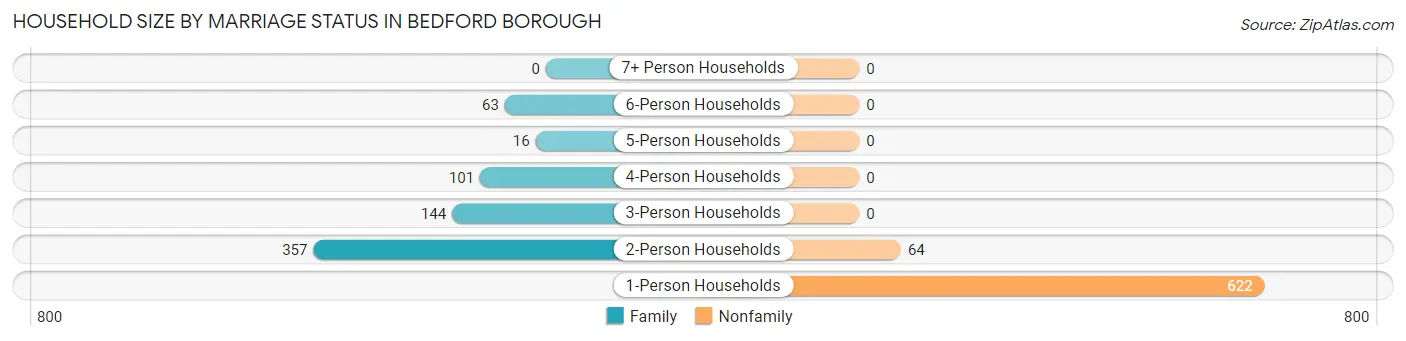
| Household Size | Family Households | Nonfamily Households |
| 1-Person Households | - | 622 (45.5%) |
| 2-Person Households | 357 (26.1%) | 64 (4.7%) |
| 3-Person Households | 144 (10.5%) | 0 (0.0%) |
| 4-Person Households | 101 (7.4%) | 0 (0.0%) |
| 5-Person Households | 16 (1.2%) | 0 (0.0%) |
| 6-Person Households | 63 (4.6%) | 0 (0.0%) |
| 7+ Person Households | 0 (0.0%) | 0 (0.0%) |
| Total | 681 (49.8%) | 686 (50.2%) |
Female Fertility in Bedford borough
Fertility by Age in Bedford borough
Average fertility rate in Bedford borough is 30.0 births per 1,000 women. Women in the age bracket of 20 to 34 years have the highest fertility rate with 83.0 births per 1,000 women. Women in the age bracket of 20 to 34 years acount for 100.0% of all women with births.
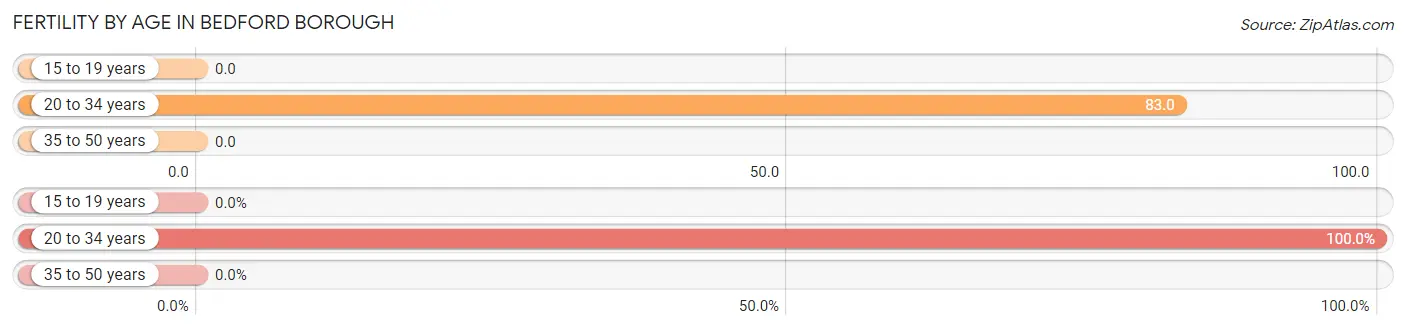
| Age Bracket | Women with Births | Births / 1,000 Women |
| 15 to 19 years | 0 (0.0%) | 0.0 |
| 20 to 34 years | 16 (100.0%) | 83.0 |
| 35 to 50 years | 0 (0.0%) | 0.0 |
| Total | 16 (100.0%) | 30.0 |
Fertility by Age by Marriage Status in Bedford borough
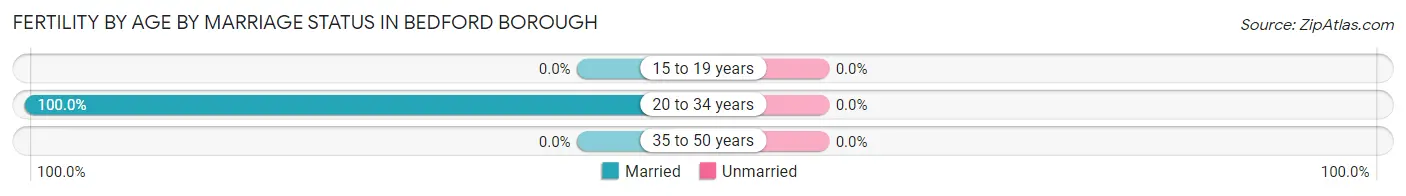
| Age Bracket | Married | Unmarried |
| 15 to 19 years | 0 (0.0%) | 0 (0.0%) |
| 20 to 34 years | 16 (100.0%) | 0 (0.0%) |
| 35 to 50 years | 0 (0.0%) | 0 (0.0%) |
| Total | 16 (100.0%) | 0 (0.0%) |
Fertility by Education in Bedford borough
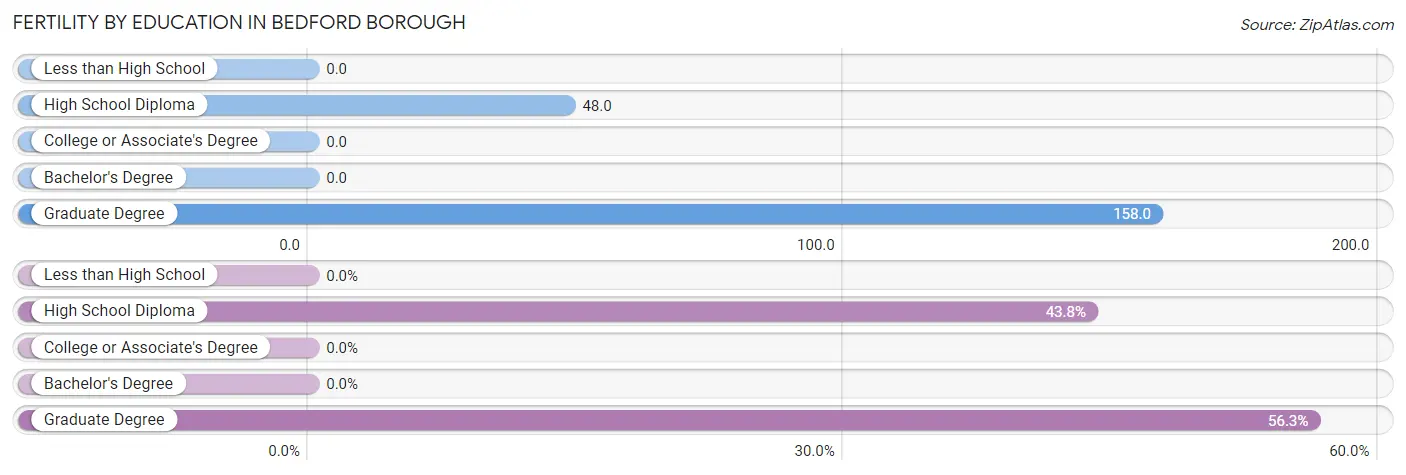
| Educational Attainment | Women with Births | Births / 1,000 Women |
| Less than High School | 0 (0.0%) | 0.0 |
| High School Diploma | 7 (43.8%) | 48.0 |
| College or Associate's Degree | 0 (0.0%) | 0.0 |
| Bachelor's Degree | 0 (0.0%) | 0.0 |
| Graduate Degree | 9 (56.2%) | 158.0 |
| Total | 16 (100.0%) | 30.0 |
Fertility by Education by Marriage Status in Bedford borough
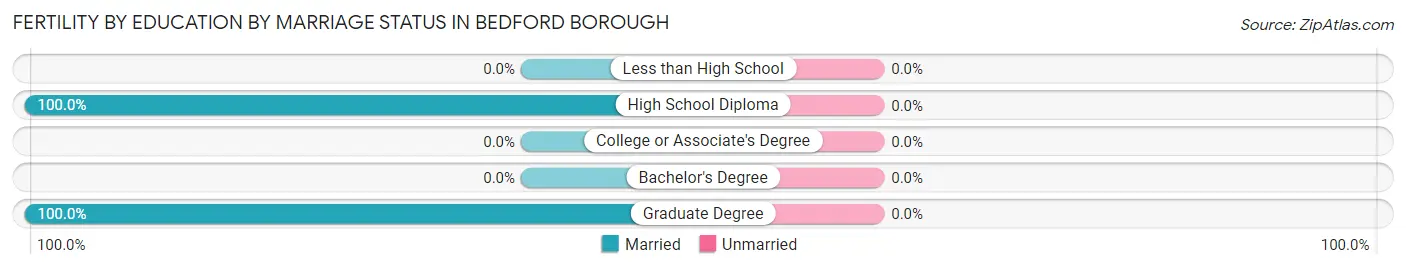
| Educational Attainment | Married | Unmarried |
| Less than High School | 0 (0.0%) | 0 (0.0%) |
| High School Diploma | 7 (100.0%) | 0 (0.0%) |
| College or Associate's Degree | 0 (0.0%) | 0 (0.0%) |
| Bachelor's Degree | 0 (0.0%) | 0 (0.0%) |
| Graduate Degree | 9 (100.0%) | 0 (0.0%) |
| Total | 16 (100.0%) | 0 (0.0%) |
Employment Characteristics in Bedford borough
Employment by Class of Employer in Bedford borough
Among the 1,544 employed individuals in Bedford borough, private company employees (1,192 | 77.2%), not-for-profit organizations (150 | 9.7%), and state government employees (76 | 4.9%) make up the most common classes of employment.
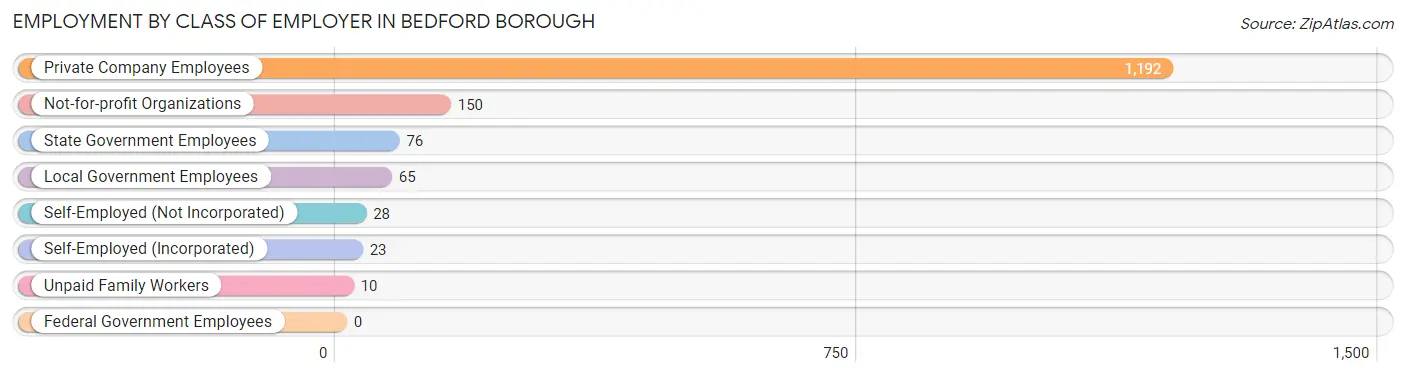
| Employer Class | # Employees | % Employees |
| Private Company Employees | 1,192 | 77.2% |
| Self-Employed (Incorporated) | 23 | 1.5% |
| Self-Employed (Not Incorporated) | 28 | 1.8% |
| Not-for-profit Organizations | 150 | 9.7% |
| Local Government Employees | 65 | 4.2% |
| State Government Employees | 76 | 4.9% |
| Federal Government Employees | 0 | 0.0% |
| Unpaid Family Workers | 10 | 0.6% |
| Total | 1,544 | 100.0% |
Employment Status by Age in Bedford borough
According to the labor force statistics for Bedford borough, out of the total population over 16 years of age (2,541), 62.2% or 1,581 individuals are in the labor force, with 1.7% or 27 of them unemployed. The age group with the highest labor force participation rate is 20 to 24 years, with 100.0% or 220 individuals in the labor force. Within the labor force, the 45 to 54 years age range has the highest percentage of unemployed individuals, with 3.6% or 12 of them being unemployed.
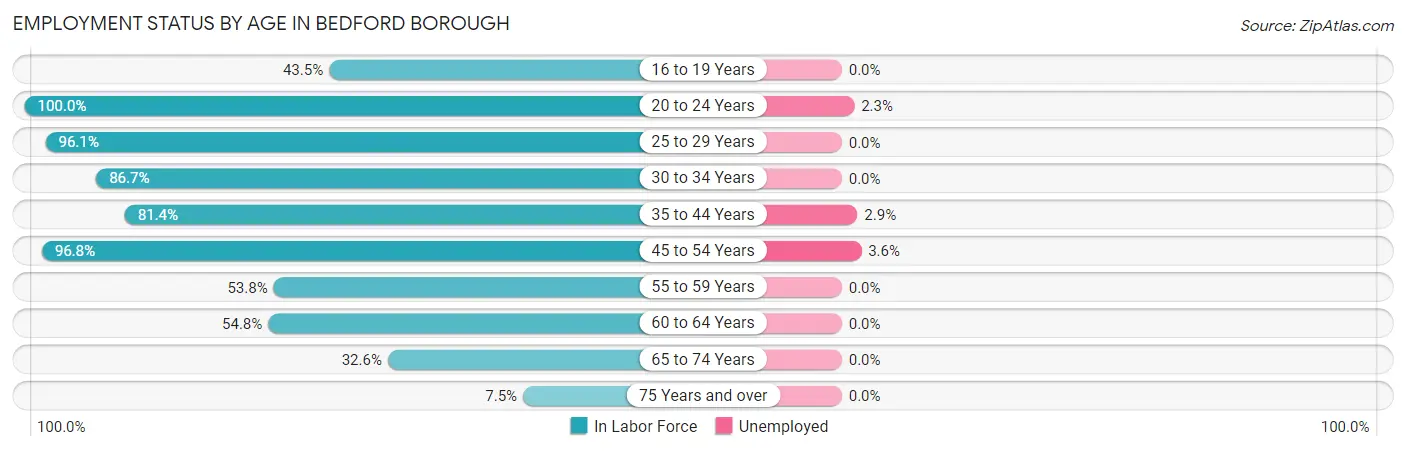
| Age Bracket | In Labor Force | Unemployed |
| 16 to 19 Years | 73 (43.5%) | 0 (0.0%) |
| 20 to 24 Years | 220 (100.0%) | 5 (2.3%) |
| 25 to 29 Years | 199 (96.1%) | 0 (0.0%) |
| 30 to 34 Years | 65 (86.7%) | 0 (0.0%) |
| 35 to 44 Years | 349 (81.4%) | 10 (2.9%) |
| 45 to 54 Years | 336 (96.8%) | 12 (3.6%) |
| 55 to 59 Years | 78 (53.8%) | 0 (0.0%) |
| 60 to 64 Years | 108 (54.8%) | 0 (0.0%) |
| 65 to 74 Years | 124 (32.6%) | 0 (0.0%) |
| 75 Years and over | 28 (7.5%) | 0 (0.0%) |
| Total | 1,581 (62.2%) | 27 (1.7%) |
Employment Status by Educational Attainment in Bedford borough
According to labor force statistics for Bedford borough, 81.1% of individuals (1,135) out of the total population between 25 and 64 years of age (1,400) are in the labor force, with 1.9% or 22 of them being unemployed. The group with the highest labor force participation rate are those with the educational attainment of high school diploma, with 86.0% or 375 individuals in the labor force. Within the labor force, individuals with bachelor's degree or higher education have the highest percentage of unemployment, with 3.1% or 10 of them being unemployed.
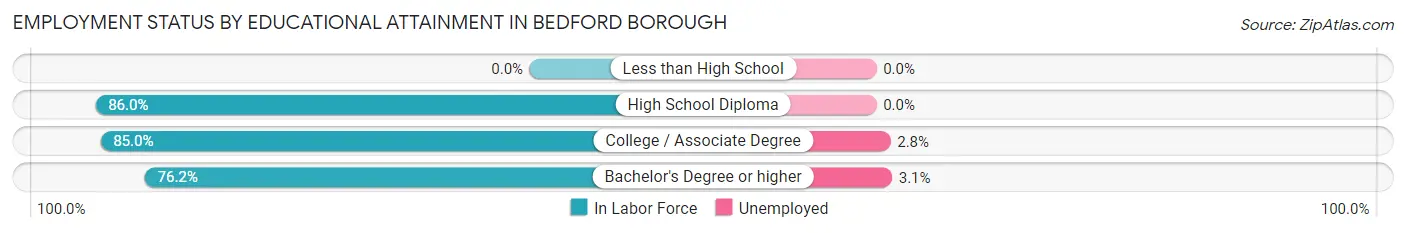
| Educational Attainment | In Labor Force | Unemployed |
| Less than High School | 0 (0.0%) | 0 (0.0%) |
| High School Diploma | 375 (86.0%) | 0 (0.0%) |
| College / Associate Degree | 436 (85.0%) | 14 (2.8%) |
| Bachelor's Degree or higher | 324 (76.2%) | 13 (3.1%) |
| Total | 1,135 (81.1%) | 27 (1.9%) |
Employment Occupations by Sex in Bedford borough
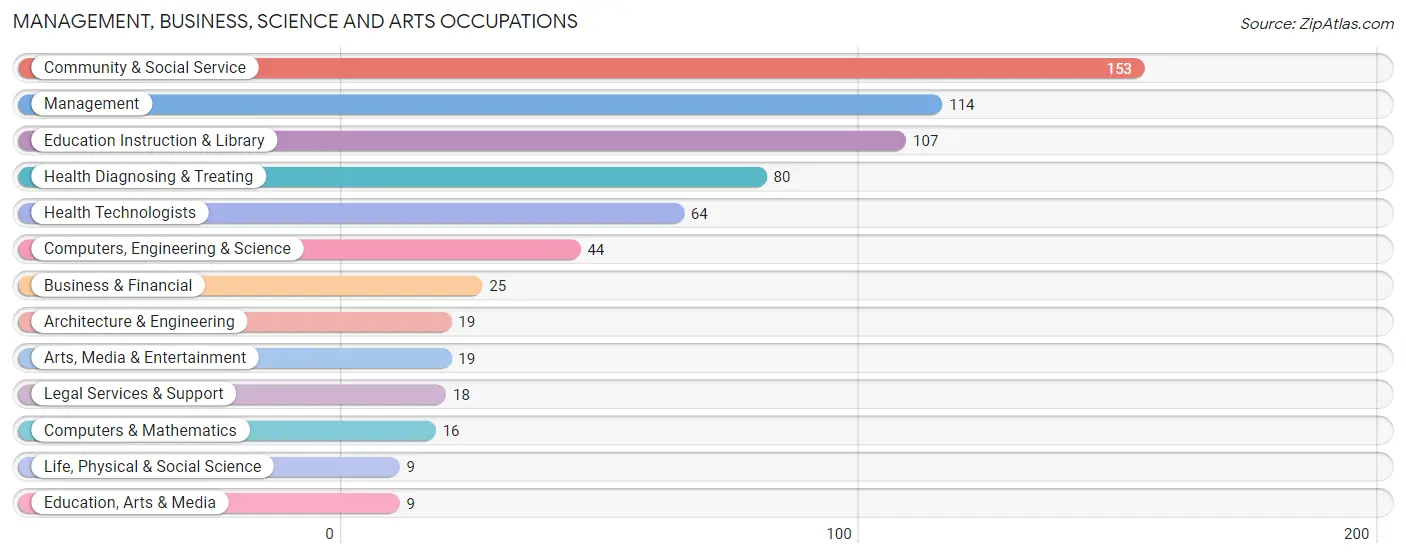
Management, Business, Science and Arts Occupations
The most common Management, Business, Science and Arts occupations in Bedford borough are Community & Social Service (153 | 9.9%), Management (114 | 7.3%), Education Instruction & Library (107 | 6.9%), Health Diagnosing & Treating (80 | 5.1%), and Health Technologists (64 | 4.1%).
Management, Business, Science and Arts Occupations by Sex
Within the Management, Business, Science and Arts occupations in Bedford borough, the most male-oriented occupations are Business & Financial (100.0%), Computers, Engineering & Science (100.0%), and Computers & Mathematics (100.0%), while the most female-oriented occupations are Education, Arts & Media (100.0%), Health Technologists (95.3%), and Health Diagnosing & Treating (90.0%).
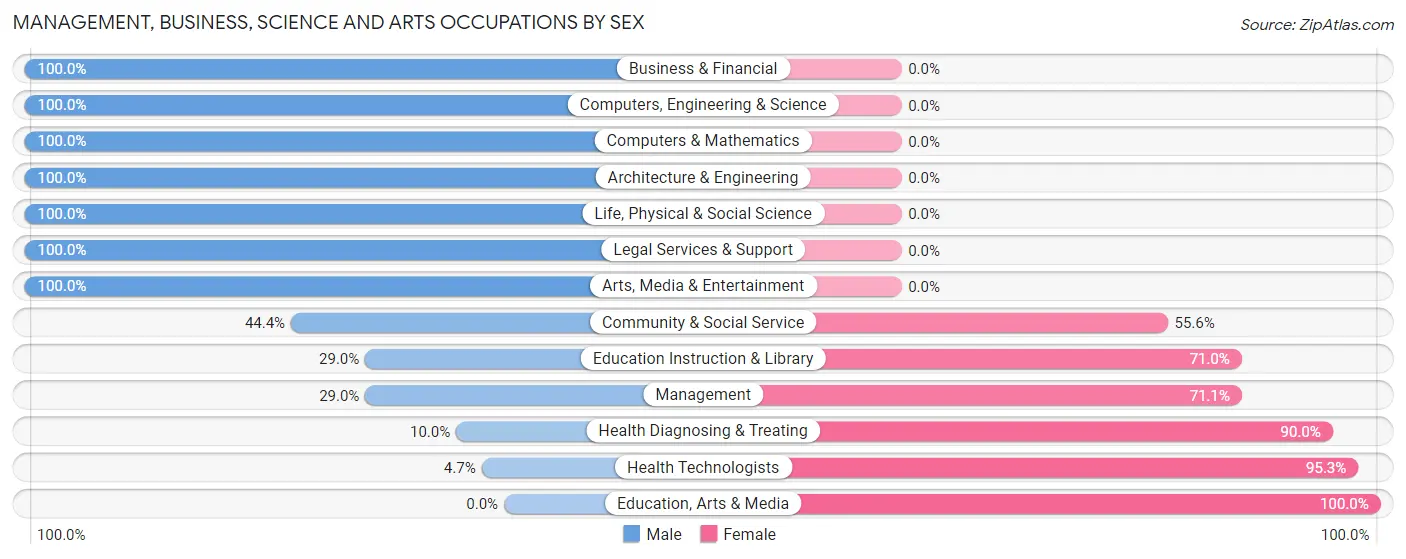
| Occupation | Male | Female |
| Management | 33 (28.9%) | 81 (71.1%) |
| Business & Financial | 25 (100.0%) | 0 (0.0%) |
| Computers, Engineering & Science | 44 (100.0%) | 0 (0.0%) |
| Computers & Mathematics | 16 (100.0%) | 0 (0.0%) |
| Architecture & Engineering | 19 (100.0%) | 0 (0.0%) |
| Life, Physical & Social Science | 9 (100.0%) | 0 (0.0%) |
| Community & Social Service | 68 (44.4%) | 85 (55.6%) |
| Education, Arts & Media | 0 (0.0%) | 9 (100.0%) |
| Legal Services & Support | 18 (100.0%) | 0 (0.0%) |
| Education Instruction & Library | 31 (29.0%) | 76 (71.0%) |
| Arts, Media & Entertainment | 19 (100.0%) | 0 (0.0%) |
| Health Diagnosing & Treating | 8 (10.0%) | 72 (90.0%) |
| Health Technologists | 3 (4.7%) | 61 (95.3%) |
| Total (Category) | 178 (42.8%) | 238 (57.2%) |
| Total (Overall) | 799 (51.4%) | 754 (48.5%) |
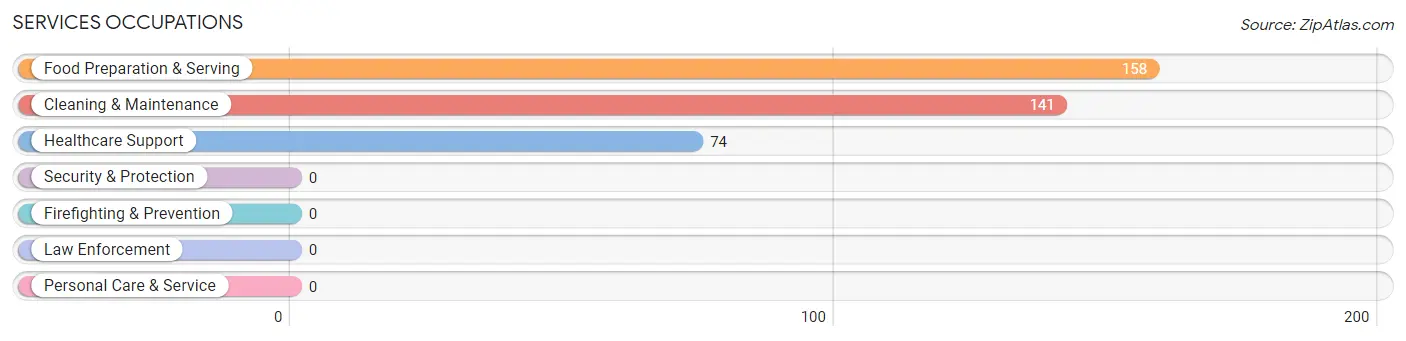
Services Occupations
The most common Services occupations in Bedford borough are Food Preparation & Serving (158 | 10.2%), Cleaning & Maintenance (141 | 9.1%), and Healthcare Support (74 | 4.8%).
Services Occupations by Sex
Within the Services occupations in Bedford borough, the most male-oriented occupations are Cleaning & Maintenance (70.2%), and Food Preparation & Serving (53.8%), while the most female-oriented occupations are Healthcare Support (100.0%), Food Preparation & Serving (46.2%), and Cleaning & Maintenance (29.8%).
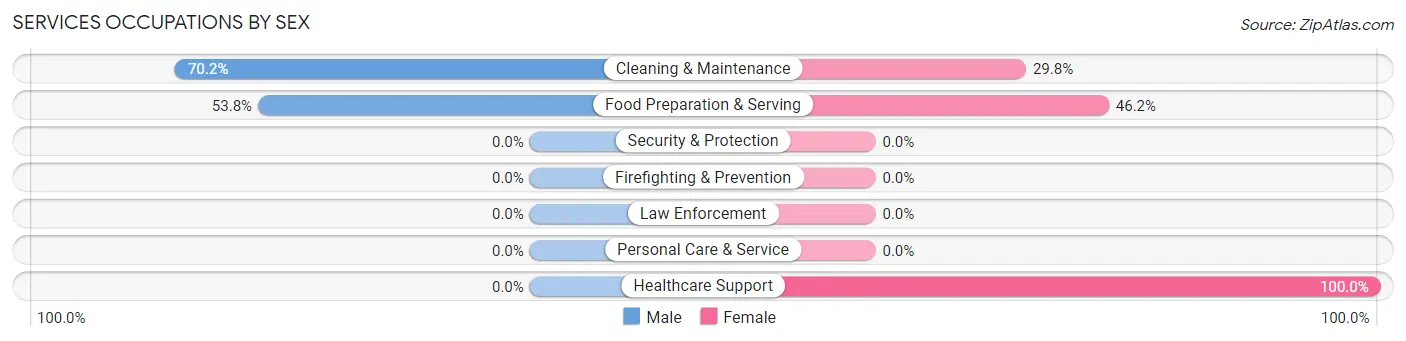
| Occupation | Male | Female |
| Healthcare Support | 0 (0.0%) | 74 (100.0%) |
| Security & Protection | 0 (0.0%) | 0 (0.0%) |
| Firefighting & Prevention | 0 (0.0%) | 0 (0.0%) |
| Law Enforcement | 0 (0.0%) | 0 (0.0%) |
| Food Preparation & Serving | 85 (53.8%) | 73 (46.2%) |
| Cleaning & Maintenance | 99 (70.2%) | 42 (29.8%) |
| Personal Care & Service | 0 (0.0%) | 0 (0.0%) |
| Total (Category) | 184 (49.3%) | 189 (50.7%) |
| Total (Overall) | 799 (51.4%) | 754 (48.5%) |
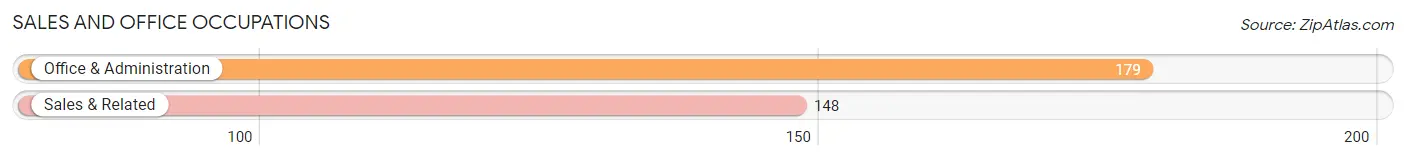
Sales and Office Occupations
The most common Sales and Office occupations in Bedford borough are Office & Administration (179 | 11.5%), and Sales & Related (148 | 9.5%).
Sales and Office Occupations by Sex

| Occupation | Male | Female |
| Sales & Related | 68 (46.0%) | 80 (54.0%) |
| Office & Administration | 16 (8.9%) | 163 (91.1%) |
| Total (Category) | 84 (25.7%) | 243 (74.3%) |
| Total (Overall) | 799 (51.4%) | 754 (48.5%) |
Natural Resources, Construction and Maintenance Occupations
The most common Natural Resources, Construction and Maintenance occupations in Bedford borough are Construction & Extraction (50 | 3.2%), and Installation, Maintenance & Repair (25 | 1.6%).
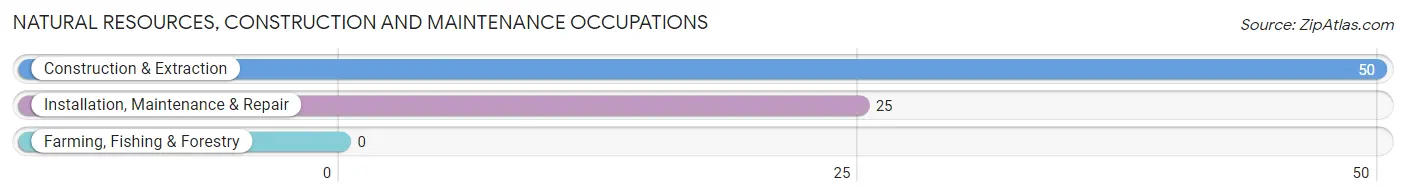
Natural Resources, Construction and Maintenance Occupations by Sex

| Occupation | Male | Female |
| Farming, Fishing & Forestry | 0 (0.0%) | 0 (0.0%) |
| Construction & Extraction | 50 (100.0%) | 0 (0.0%) |
| Installation, Maintenance & Repair | 25 (100.0%) | 0 (0.0%) |
| Total (Category) | 75 (100.0%) | 0 (0.0%) |
| Total (Overall) | 799 (51.4%) | 754 (48.5%) |
Production, Transportation and Moving Occupations
The most common Production, Transportation and Moving occupations in Bedford borough are Transportation (138 | 8.9%), Production (128 | 8.2%), and Material Moving (96 | 6.2%).
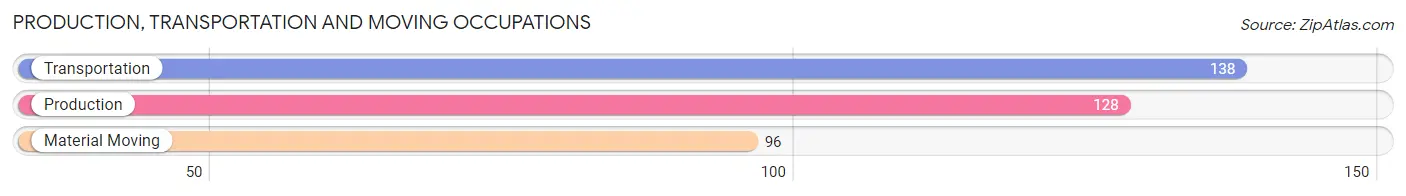
Production, Transportation and Moving Occupations by Sex
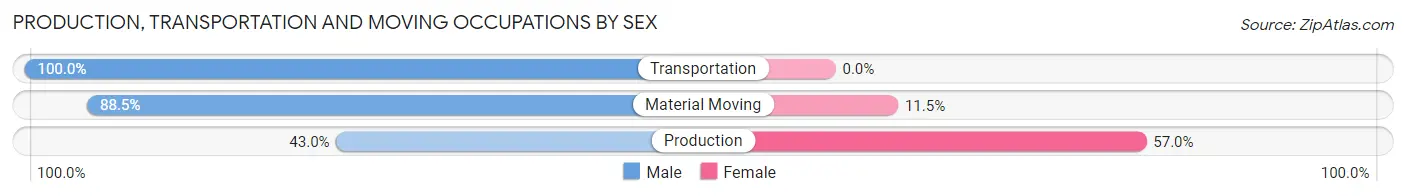
| Occupation | Male | Female |
| Production | 55 (43.0%) | 73 (57.0%) |
| Transportation | 138 (100.0%) | 0 (0.0%) |
| Material Moving | 85 (88.5%) | 11 (11.5%) |
| Total (Category) | 278 (76.8%) | 84 (23.2%) |
| Total (Overall) | 799 (51.4%) | 754 (48.5%) |
Employment Industries by Sex in Bedford borough
Employment Industries in Bedford borough
The major employment industries in Bedford borough include Retail Trade (362 | 23.3%), Accommodation & Food Services (279 | 18.0%), Health Care & Social Assistance (261 | 16.8%), Manufacturing (158 | 10.2%), and Educational Services (105 | 6.8%).
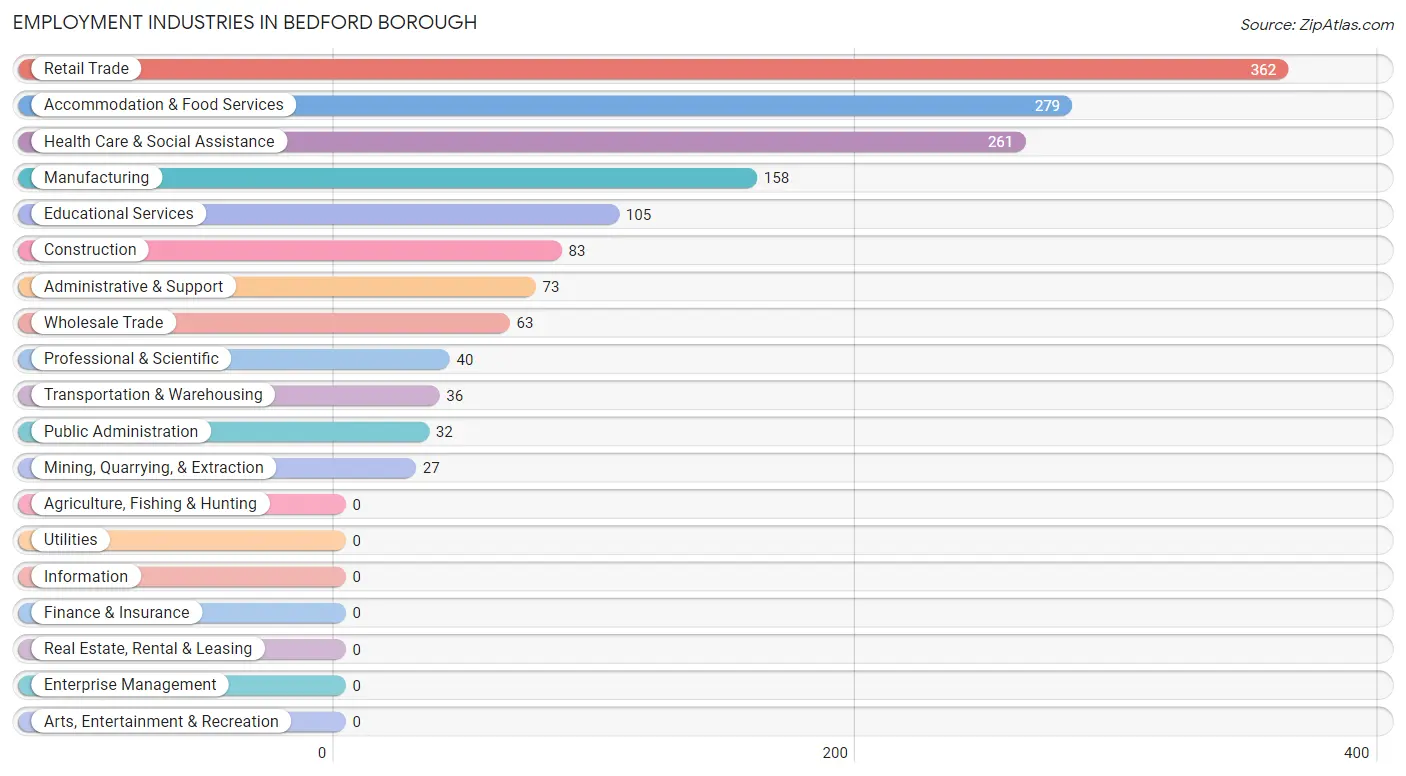
Employment Industries by Sex in Bedford borough
The Bedford borough industries that see more men than women are Wholesale Trade (100.0%), Transportation & Warehousing (100.0%), and Construction (91.6%), whereas the industries that tend to have a higher number of women are Mining, Quarrying, & Extraction (100.0%), Health Care & Social Assistance (86.2%), and Accommodation & Food Services (54.8%).
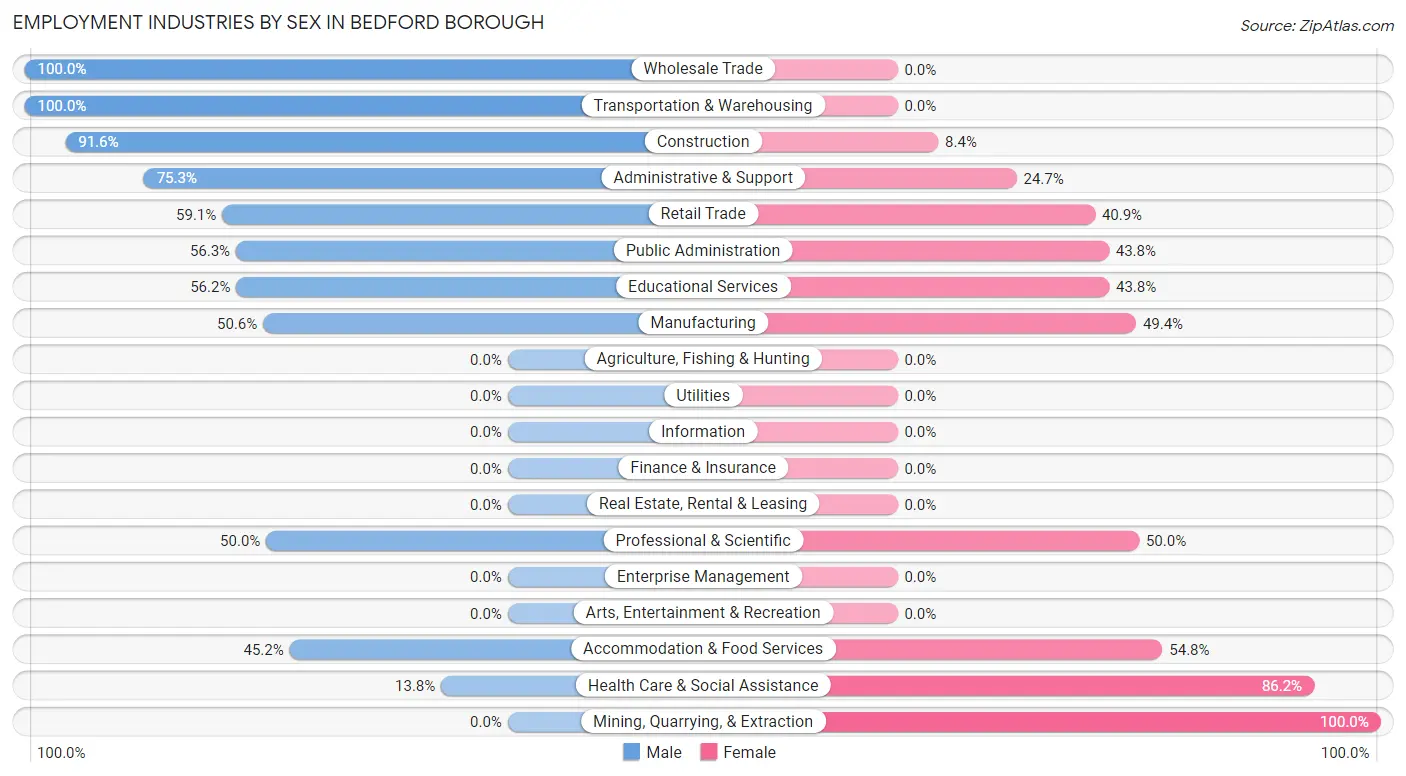
| Industry | Male | Female |
| Agriculture, Fishing & Hunting | 0 (0.0%) | 0 (0.0%) |
| Mining, Quarrying, & Extraction | 0 (0.0%) | 27 (100.0%) |
| Construction | 76 (91.6%) | 7 (8.4%) |
| Manufacturing | 80 (50.6%) | 78 (49.4%) |
| Wholesale Trade | 63 (100.0%) | 0 (0.0%) |
| Retail Trade | 214 (59.1%) | 148 (40.9%) |
| Transportation & Warehousing | 36 (100.0%) | 0 (0.0%) |
| Utilities | 0 (0.0%) | 0 (0.0%) |
| Information | 0 (0.0%) | 0 (0.0%) |
| Finance & Insurance | 0 (0.0%) | 0 (0.0%) |
| Real Estate, Rental & Leasing | 0 (0.0%) | 0 (0.0%) |
| Professional & Scientific | 20 (50.0%) | 20 (50.0%) |
| Enterprise Management | 0 (0.0%) | 0 (0.0%) |
| Administrative & Support | 55 (75.3%) | 18 (24.7%) |
| Educational Services | 59 (56.2%) | 46 (43.8%) |
| Health Care & Social Assistance | 36 (13.8%) | 225 (86.2%) |
| Arts, Entertainment & Recreation | 0 (0.0%) | 0 (0.0%) |
| Accommodation & Food Services | 126 (45.2%) | 153 (54.8%) |
| Public Administration | 18 (56.2%) | 14 (43.8%) |
| Total | 799 (51.4%) | 754 (48.5%) |
Education in Bedford borough
School Enrollment in Bedford borough
The most common levels of schooling among the 586 students in Bedford borough are high school (203 | 34.6%), college / undergraduate (162 | 27.7%), and elementary school (97 | 16.6%).
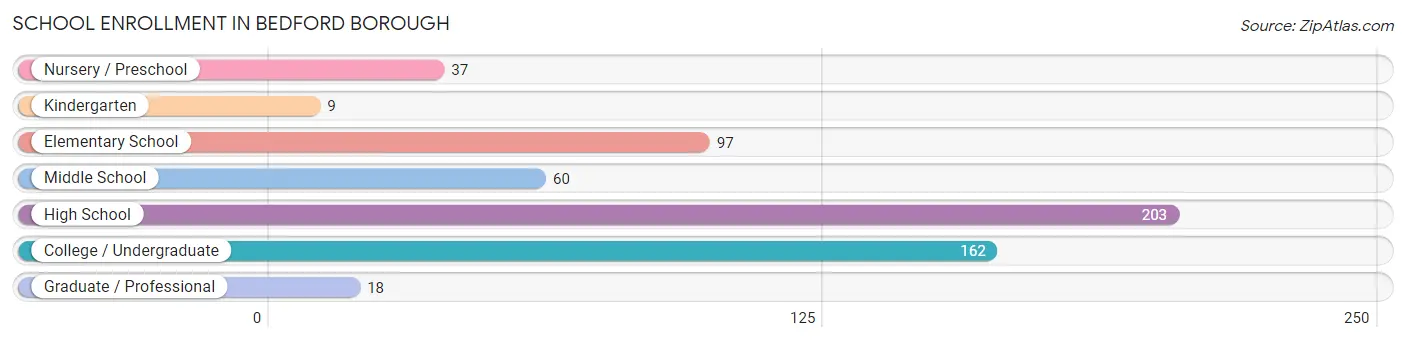
| School Level | # Students | % Students |
| Nursery / Preschool | 37 | 6.3% |
| Kindergarten | 9 | 1.5% |
| Elementary School | 97 | 16.6% |
| Middle School | 60 | 10.2% |
| High School | 203 | 34.6% |
| College / Undergraduate | 162 | 27.7% |
| Graduate / Professional | 18 | 3.1% |
| Total | 586 | 100.0% |
School Enrollment by Age by Funding Source in Bedford borough
Out of a total of 586 students who are enrolled in schools in Bedford borough, 69 (11.8%) attend a private institution, while the remaining 517 (88.2%) are enrolled in public schools. The age group of 35 years and over has the highest likelihood of being enrolled in private schools, with 26 (74.3% in the age bracket) enrolled. Conversely, the age group of 3 to 4 year olds has the lowest likelihood of being enrolled in a private school, with 24 (100.0% in the age bracket) attending a public institution.
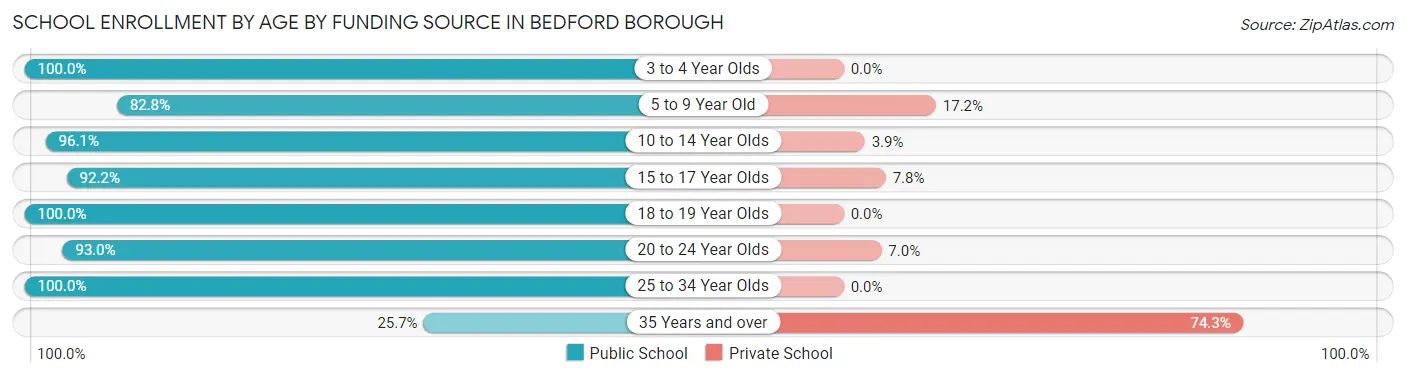
| Age Bracket | Public School | Private School |
| 3 to 4 Year Olds | 24 (100.0%) | 0 (0.0%) |
| 5 to 9 Year Old | 82 (82.8%) | 17 (17.2%) |
| 10 to 14 Year Olds | 98 (96.1%) | 4 (3.9%) |
| 15 to 17 Year Olds | 153 (92.2%) | 13 (7.8%) |
| 18 to 19 Year Olds | 24 (100.0%) | 0 (0.0%) |
| 20 to 24 Year Olds | 119 (93.0%) | 9 (7.0%) |
| 25 to 34 Year Olds | 8 (100.0%) | 0 (0.0%) |
| 35 Years and over | 9 (25.7%) | 26 (74.3%) |
| Total | 517 (88.2%) | 69 (11.8%) |
Educational Attainment by Field of Study in Bedford borough
Education (123 | 21.2%), business (91 | 15.7%), science & technology (63 | 10.9%), bio, nature & agricultural (54 | 9.3%), and literature & languages (41 | 7.1%) are the most common fields of study among 580 individuals in Bedford borough who have obtained a bachelor's degree or higher.
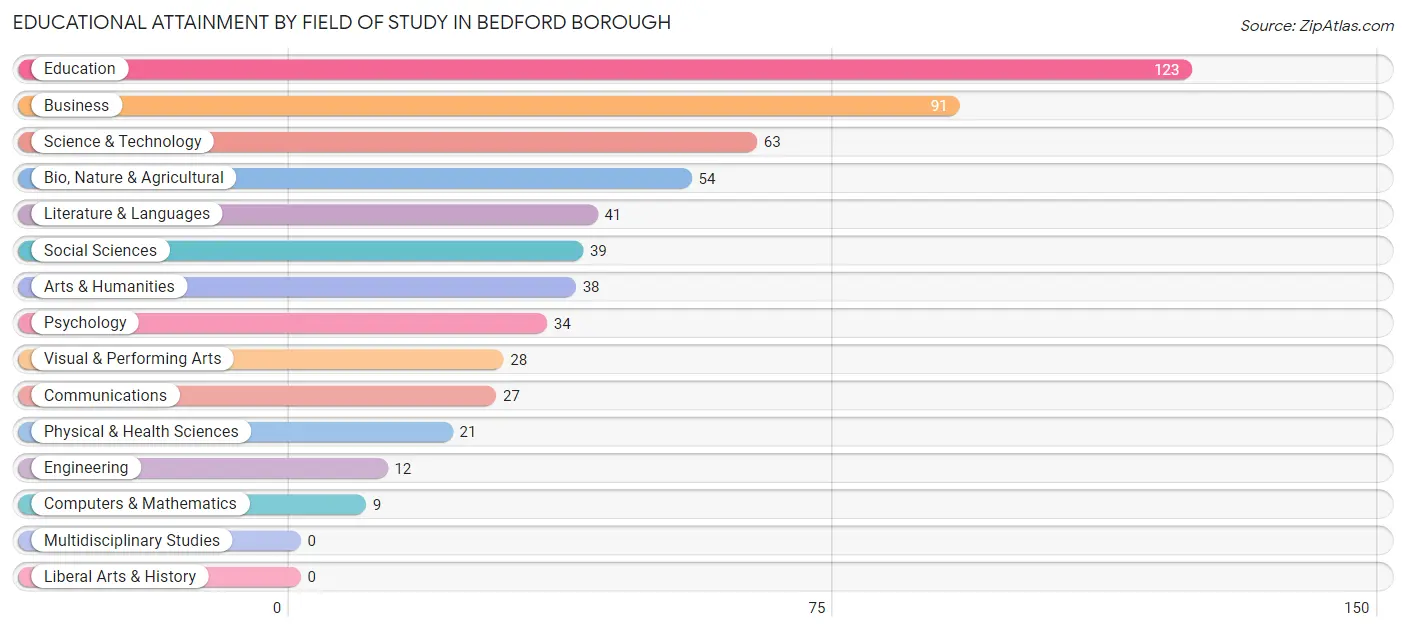
| Field of Study | # Graduates | % Graduates |
| Computers & Mathematics | 9 | 1.5% |
| Bio, Nature & Agricultural | 54 | 9.3% |
| Physical & Health Sciences | 21 | 3.6% |
| Psychology | 34 | 5.9% |
| Social Sciences | 39 | 6.7% |
| Engineering | 12 | 2.1% |
| Multidisciplinary Studies | 0 | 0.0% |
| Science & Technology | 63 | 10.9% |
| Business | 91 | 15.7% |
| Education | 123 | 21.2% |
| Literature & Languages | 41 | 7.1% |
| Liberal Arts & History | 0 | 0.0% |
| Visual & Performing Arts | 28 | 4.8% |
| Communications | 27 | 4.7% |
| Arts & Humanities | 38 | 6.6% |
| Total | 580 | 100.0% |
Transportation & Commute in Bedford borough
Vehicle Availability by Sex in Bedford borough
The most prevalent vehicle ownership categories in Bedford borough are males with 4 vehicles (284, accounting for 35.5%) and females with 4 vehicles (155, making up 38.1%).
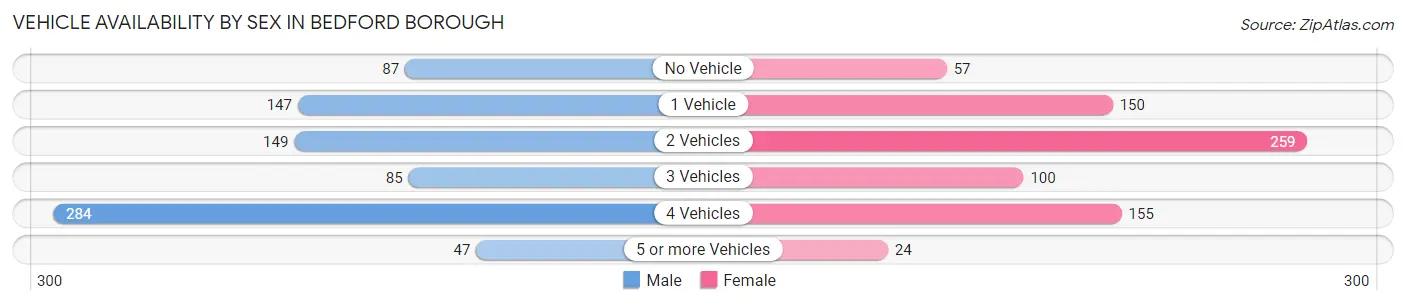
| Vehicles Available | Male | Female |
| No Vehicle | 87 (10.9%) | 57 (7.6%) |
| 1 Vehicle | 147 (18.4%) | 150 (20.1%) |
| 2 Vehicles | 149 (18.6%) | 259 (34.8%) |
| 3 Vehicles | 85 (10.6%) | 100 (13.4%) |
| 4 Vehicles | 284 (35.5%) | 155 (20.8%) |
| 5 or more Vehicles | 47 (5.9%) | 24 (3.2%) |
| Total | 799 (100.0%) | 745 (100.0%) |
Commute Time in Bedford borough
The most frequently occuring commute durations in Bedford borough are 5 to 9 minutes (483 commuters, 32.0%), 10 to 14 minutes (280 commuters, 18.6%), and 15 to 19 minutes (197 commuters, 13.1%).
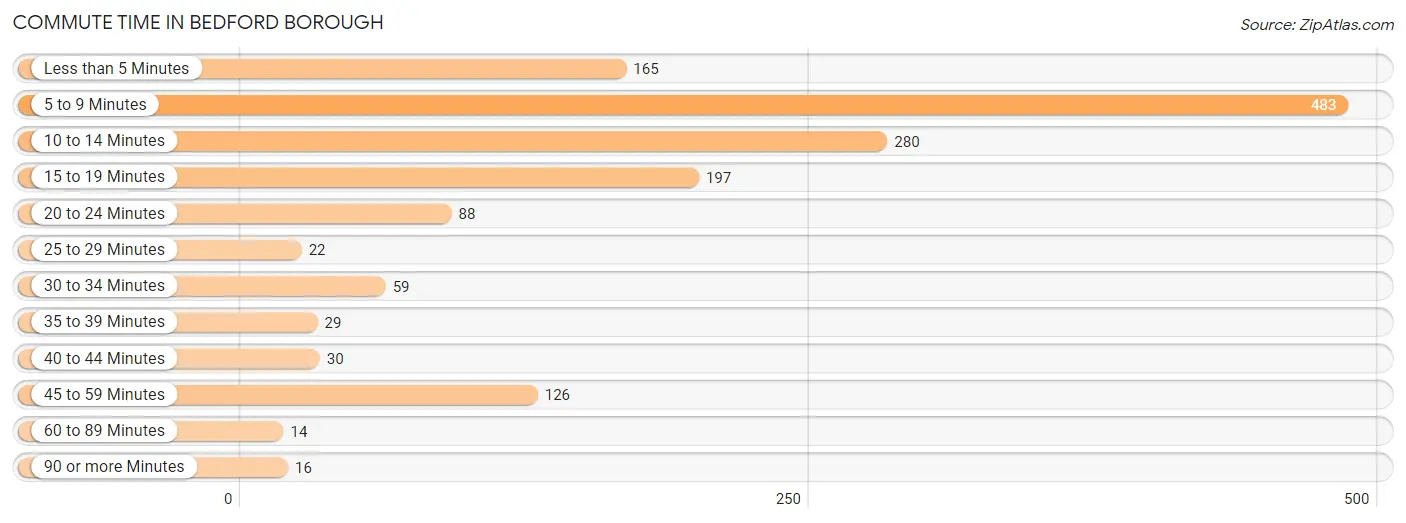
| Commute Time | # Commuters | % Commuters |
| Less than 5 Minutes | 165 | 10.9% |
| 5 to 9 Minutes | 483 | 32.0% |
| 10 to 14 Minutes | 280 | 18.6% |
| 15 to 19 Minutes | 197 | 13.1% |
| 20 to 24 Minutes | 88 | 5.8% |
| 25 to 29 Minutes | 22 | 1.5% |
| 30 to 34 Minutes | 59 | 3.9% |
| 35 to 39 Minutes | 29 | 1.9% |
| 40 to 44 Minutes | 30 | 2.0% |
| 45 to 59 Minutes | 126 | 8.4% |
| 60 to 89 Minutes | 14 | 0.9% |
| 90 or more Minutes | 16 | 1.1% |
Commute Time by Sex in Bedford borough
The most common commute times in Bedford borough are 5 to 9 minutes (276 commuters, 35.6%) for males and 5 to 9 minutes (207 commuters, 28.2%) for females.
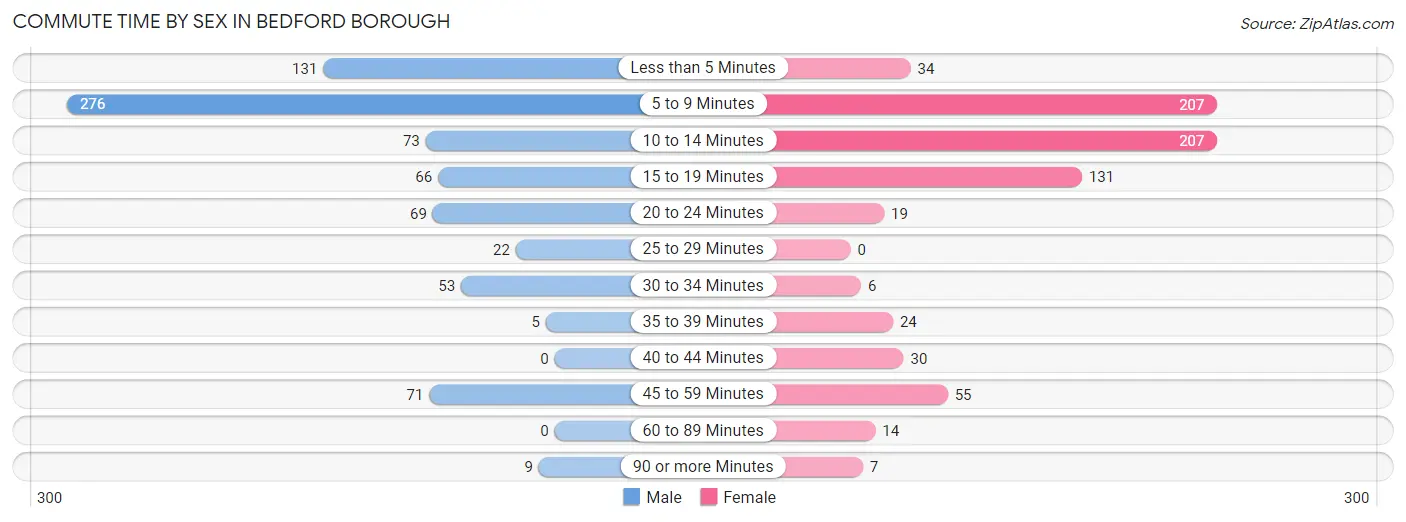
| Commute Time | Male | Female |
| Less than 5 Minutes | 131 (16.9%) | 34 (4.6%) |
| 5 to 9 Minutes | 276 (35.6%) | 207 (28.2%) |
| 10 to 14 Minutes | 73 (9.4%) | 207 (28.2%) |
| 15 to 19 Minutes | 66 (8.5%) | 131 (17.8%) |
| 20 to 24 Minutes | 69 (8.9%) | 19 (2.6%) |
| 25 to 29 Minutes | 22 (2.8%) | 0 (0.0%) |
| 30 to 34 Minutes | 53 (6.8%) | 6 (0.8%) |
| 35 to 39 Minutes | 5 (0.6%) | 24 (3.3%) |
| 40 to 44 Minutes | 0 (0.0%) | 30 (4.1%) |
| 45 to 59 Minutes | 71 (9.2%) | 55 (7.5%) |
| 60 to 89 Minutes | 0 (0.0%) | 14 (1.9%) |
| 90 or more Minutes | 9 (1.2%) | 7 (0.9%) |
Time of Departure to Work by Sex in Bedford borough
The most frequent times of departure to work in Bedford borough are 7:30 AM to 7:59 AM (179, 23.1%) for males and 6:30 AM to 6:59 AM (135, 18.4%) for females.

| Time of Departure | Male | Female |
| 12:00 AM to 4:59 AM | 51 (6.6%) | 70 (9.5%) |
| 5:00 AM to 5:29 AM | 21 (2.7%) | 0 (0.0%) |
| 5:30 AM to 5:59 AM | 78 (10.1%) | 99 (13.5%) |
| 6:00 AM to 6:29 AM | 58 (7.5%) | 51 (7.0%) |
| 6:30 AM to 6:59 AM | 27 (3.5%) | 135 (18.4%) |
| 7:00 AM to 7:29 AM | 79 (10.2%) | 37 (5.0%) |
| 7:30 AM to 7:59 AM | 179 (23.1%) | 87 (11.8%) |
| 8:00 AM to 8:29 AM | 52 (6.7%) | 46 (6.3%) |
| 8:30 AM to 8:59 AM | 87 (11.2%) | 82 (11.2%) |
| 9:00 AM to 9:59 AM | 22 (2.8%) | 21 (2.9%) |
| 10:00 AM to 10:59 AM | 12 (1.5%) | 26 (3.5%) |
| 11:00 AM to 11:59 AM | 0 (0.0%) | 0 (0.0%) |
| 12:00 PM to 3:59 PM | 40 (5.2%) | 39 (5.3%) |
| 4:00 PM to 11:59 PM | 69 (8.9%) | 41 (5.6%) |
| Total | 775 (100.0%) | 734 (100.0%) |
Housing Occupancy in Bedford borough
Occupancy by Ownership in Bedford borough
Of the total 1,367 dwellings in Bedford borough, owner-occupied units account for 676 (49.4%), while renter-occupied units make up 691 (50.5%).
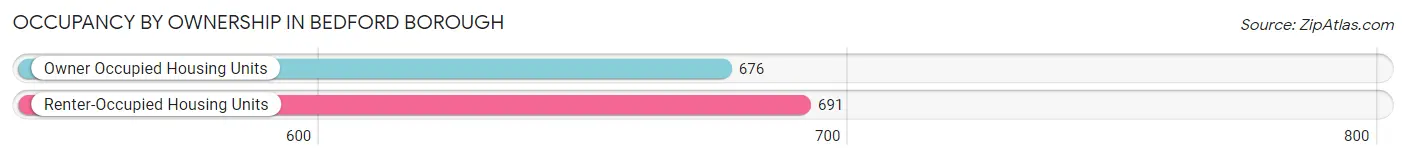
| Occupancy | # Housing Units | % Housing Units |
| Owner Occupied Housing Units | 676 | 49.4% |
| Renter-Occupied Housing Units | 691 | 50.5% |
| Total Occupied Housing Units | 1,367 | 100.0% |
Occupancy by Household Size in Bedford borough
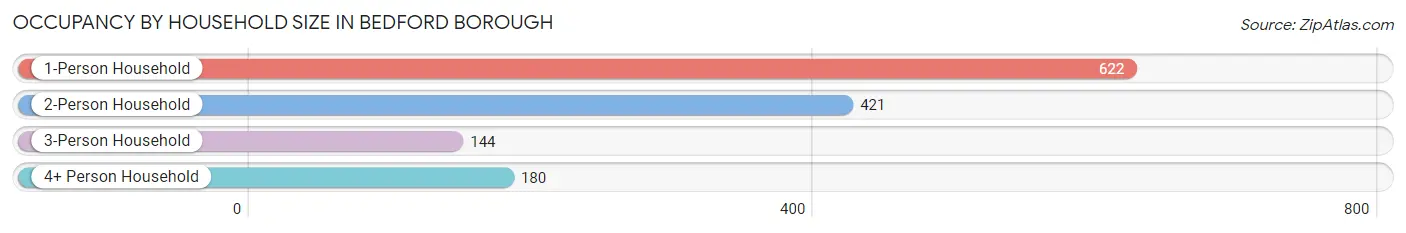
| Household Size | # Housing Units | % Housing Units |
| 1-Person Household | 622 | 45.5% |
| 2-Person Household | 421 | 30.8% |
| 3-Person Household | 144 | 10.5% |
| 4+ Person Household | 180 | 13.2% |
| Total Housing Units | 1,367 | 100.0% |
Occupancy by Ownership by Household Size in Bedford borough
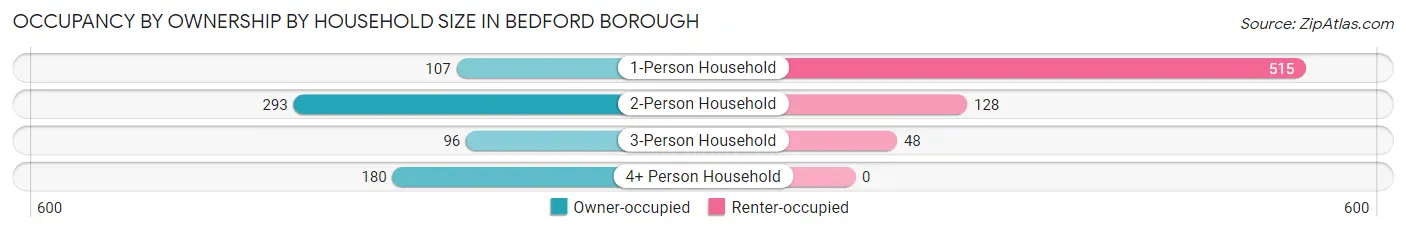
| Household Size | Owner-occupied | Renter-occupied |
| 1-Person Household | 107 (17.2%) | 515 (82.8%) |
| 2-Person Household | 293 (69.6%) | 128 (30.4%) |
| 3-Person Household | 96 (66.7%) | 48 (33.3%) |
| 4+ Person Household | 180 (100.0%) | 0 (0.0%) |
| Total Housing Units | 676 (49.4%) | 691 (50.5%) |
Occupancy by Educational Attainment in Bedford borough
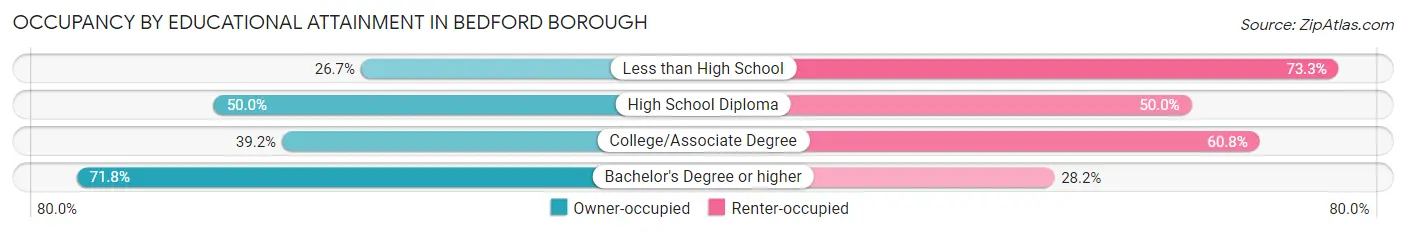
| Household Size | Owner-occupied | Renter-occupied |
| Less than High School | 32 (26.7%) | 88 (73.3%) |
| High School Diploma | 206 (50.0%) | 206 (50.0%) |
| College/Associate Degree | 194 (39.2%) | 301 (60.8%) |
| Bachelor's Degree or higher | 244 (71.8%) | 96 (28.2%) |
Occupancy by Age of Householder in Bedford borough
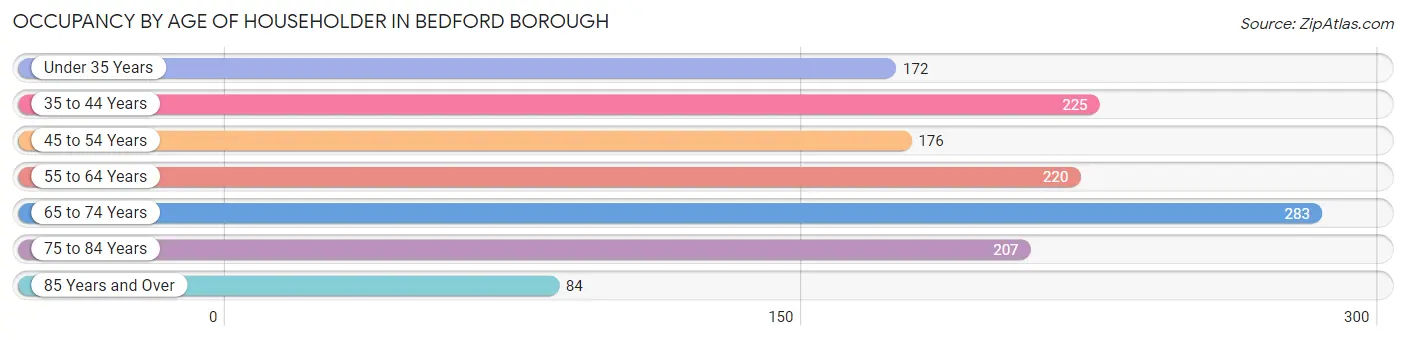
| Age Bracket | # Households | % Households |
| Under 35 Years | 172 | 12.6% |
| 35 to 44 Years | 225 | 16.5% |
| 45 to 54 Years | 176 | 12.9% |
| 55 to 64 Years | 220 | 16.1% |
| 65 to 74 Years | 283 | 20.7% |
| 75 to 84 Years | 207 | 15.1% |
| 85 Years and Over | 84 | 6.1% |
| Total | 1,367 | 100.0% |
Housing Finances in Bedford borough
Median Income by Occupancy in Bedford borough
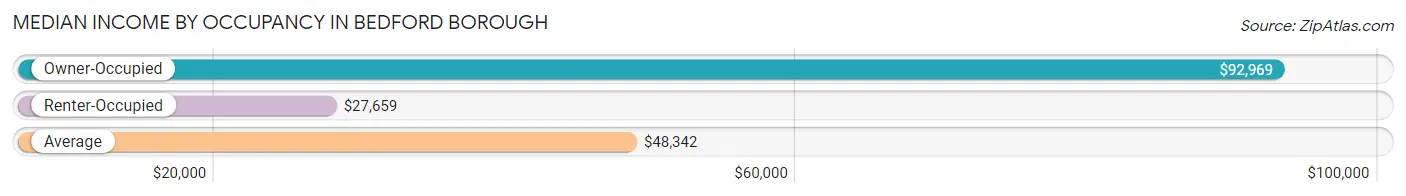
| Occupancy Type | # Households | Median Income |
| Owner-Occupied | 676 (49.4%) | $92,969 |
| Renter-Occupied | 691 (50.5%) | $27,659 |
| Average | 1,367 (100.0%) | $48,342 |
Occupancy by Householder Income Bracket in Bedford borough
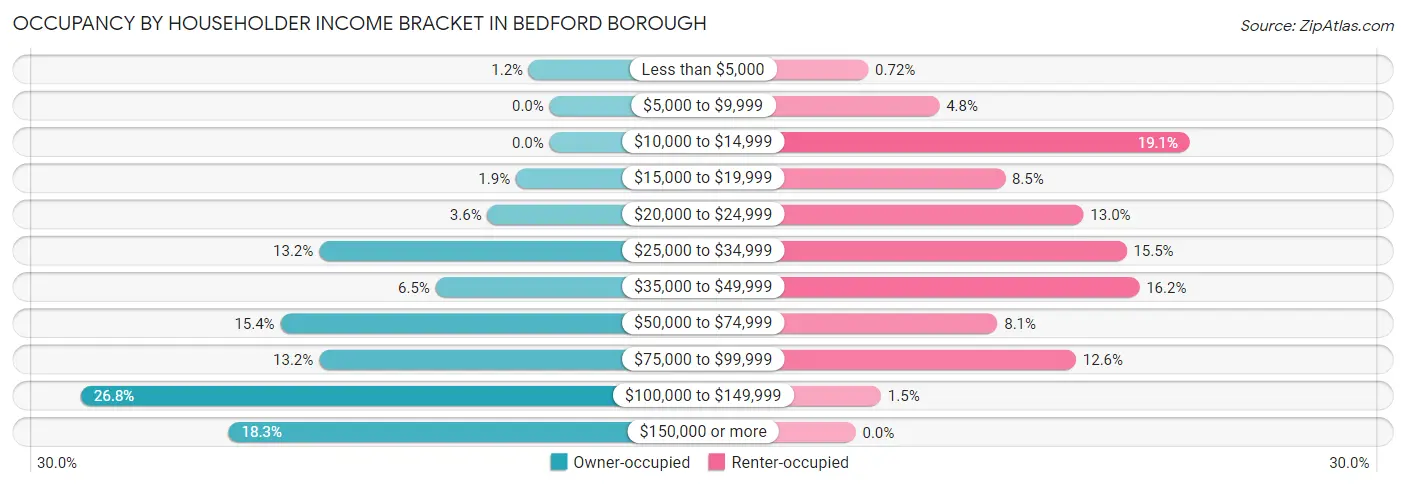
| Income Bracket | Owner-occupied | Renter-occupied |
| Less than $5,000 | 8 (1.2%) | 5 (0.7%) |
| $5,000 to $9,999 | 0 (0.0%) | 33 (4.8%) |
| $10,000 to $14,999 | 0 (0.0%) | 132 (19.1%) |
| $15,000 to $19,999 | 13 (1.9%) | 59 (8.5%) |
| $20,000 to $24,999 | 24 (3.5%) | 90 (13.0%) |
| $25,000 to $34,999 | 89 (13.2%) | 107 (15.5%) |
| $35,000 to $49,999 | 44 (6.5%) | 112 (16.2%) |
| $50,000 to $74,999 | 104 (15.4%) | 56 (8.1%) |
| $75,000 to $99,999 | 89 (13.2%) | 87 (12.6%) |
| $100,000 to $149,999 | 181 (26.8%) | 10 (1.5%) |
| $150,000 or more | 124 (18.3%) | 0 (0.0%) |
| Total | 676 (100.0%) | 691 (100.0%) |
Monthly Housing Cost Tiers in Bedford borough
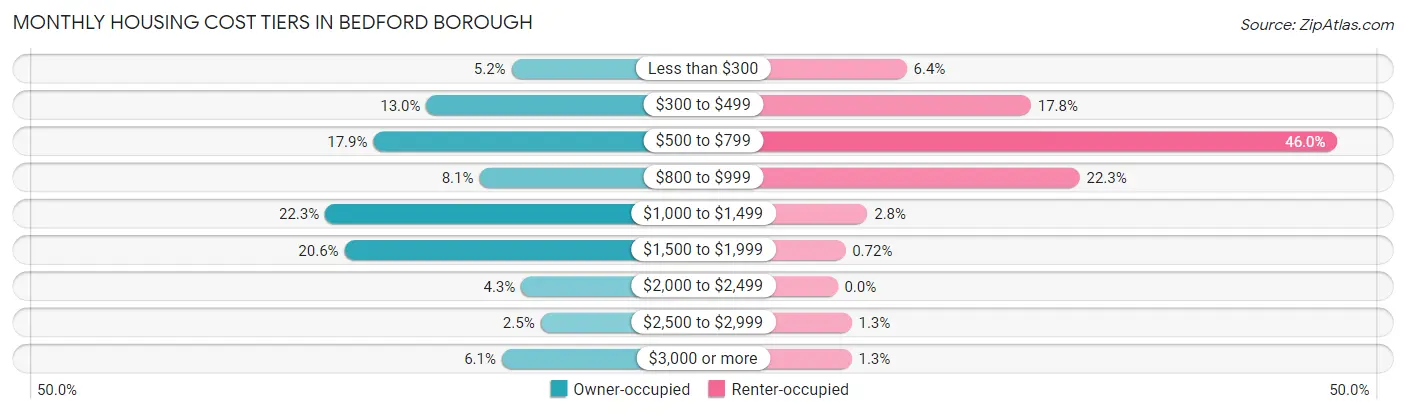
| Monthly Cost | Owner-occupied | Renter-occupied |
| Less than $300 | 35 (5.2%) | 44 (6.4%) |
| $300 to $499 | 88 (13.0%) | 123 (17.8%) |
| $500 to $799 | 121 (17.9%) | 318 (46.0%) |
| $800 to $999 | 55 (8.1%) | 154 (22.3%) |
| $1,000 to $1,499 | 151 (22.3%) | 19 (2.8%) |
| $1,500 to $1,999 | 139 (20.6%) | 5 (0.7%) |
| $2,000 to $2,499 | 29 (4.3%) | 0 (0.0%) |
| $2,500 to $2,999 | 17 (2.5%) | 9 (1.3%) |
| $3,000 or more | 41 (6.1%) | 9 (1.3%) |
| Total | 676 (100.0%) | 691 (100.0%) |
Physical Housing Characteristics in Bedford borough
Housing Structures in Bedford borough
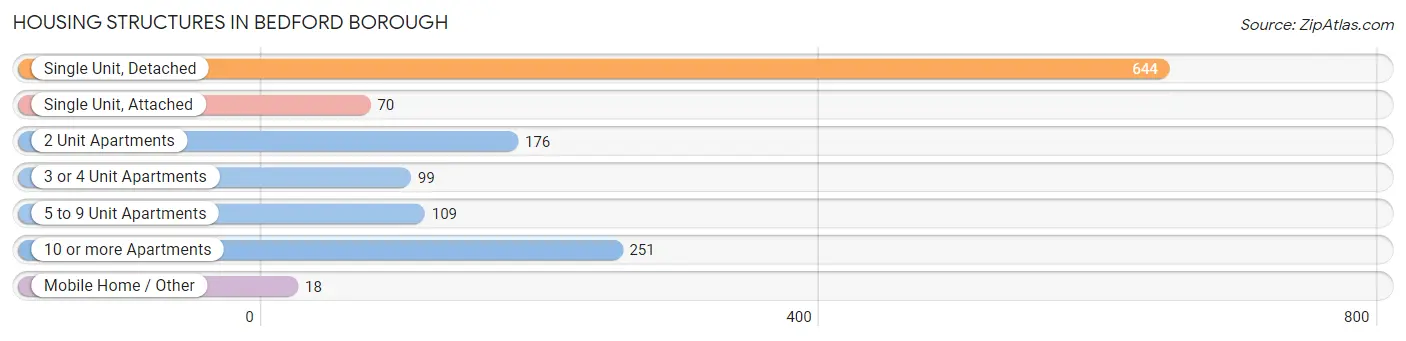
| Structure Type | # Housing Units | % Housing Units |
| Single Unit, Detached | 644 | 47.1% |
| Single Unit, Attached | 70 | 5.1% |
| 2 Unit Apartments | 176 | 12.9% |
| 3 or 4 Unit Apartments | 99 | 7.2% |
| 5 to 9 Unit Apartments | 109 | 8.0% |
| 10 or more Apartments | 251 | 18.4% |
| Mobile Home / Other | 18 | 1.3% |
| Total | 1,367 | 100.0% |
Housing Structures by Occupancy in Bedford borough
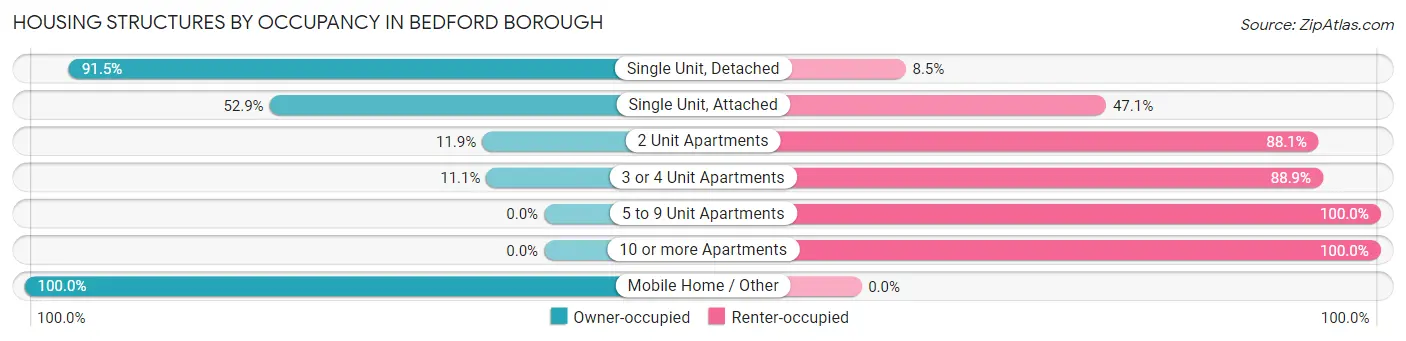
| Structure Type | Owner-occupied | Renter-occupied |
| Single Unit, Detached | 589 (91.5%) | 55 (8.5%) |
| Single Unit, Attached | 37 (52.9%) | 33 (47.1%) |
| 2 Unit Apartments | 21 (11.9%) | 155 (88.1%) |
| 3 or 4 Unit Apartments | 11 (11.1%) | 88 (88.9%) |
| 5 to 9 Unit Apartments | 0 (0.0%) | 109 (100.0%) |
| 10 or more Apartments | 0 (0.0%) | 251 (100.0%) |
| Mobile Home / Other | 18 (100.0%) | 0 (0.0%) |
| Total | 676 (49.4%) | 691 (50.5%) |
Housing Structures by Number of Rooms in Bedford borough
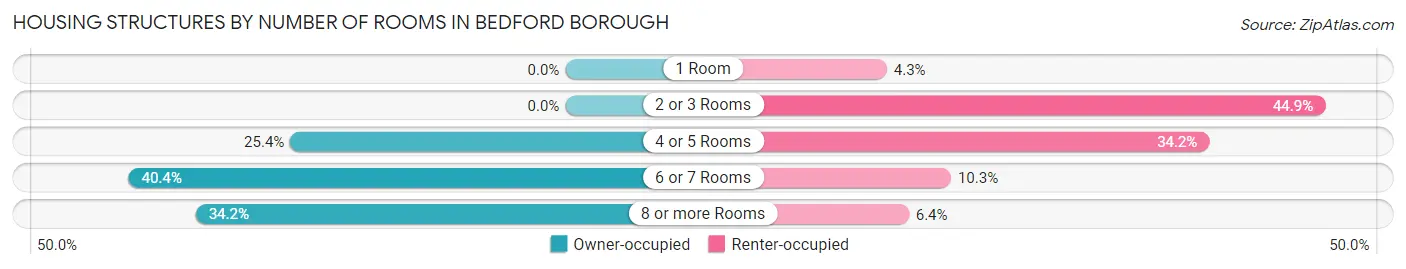
| Number of Rooms | Owner-occupied | Renter-occupied |
| 1 Room | 0 (0.0%) | 30 (4.3%) |
| 2 or 3 Rooms | 0 (0.0%) | 310 (44.9%) |
| 4 or 5 Rooms | 172 (25.4%) | 236 (34.2%) |
| 6 or 7 Rooms | 273 (40.4%) | 71 (10.3%) |
| 8 or more Rooms | 231 (34.2%) | 44 (6.4%) |
| Total | 676 (100.0%) | 691 (100.0%) |
Housing Structure by Heating Type in Bedford borough
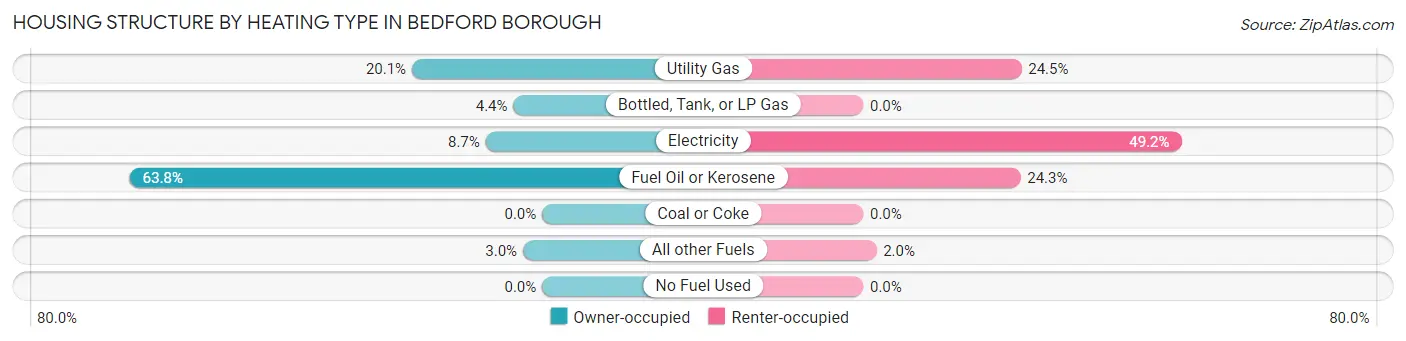
| Heating Type | Owner-occupied | Renter-occupied |
| Utility Gas | 136 (20.1%) | 169 (24.5%) |
| Bottled, Tank, or LP Gas | 30 (4.4%) | 0 (0.0%) |
| Electricity | 59 (8.7%) | 340 (49.2%) |
| Fuel Oil or Kerosene | 431 (63.8%) | 168 (24.3%) |
| Coal or Coke | 0 (0.0%) | 0 (0.0%) |
| All other Fuels | 20 (3.0%) | 14 (2.0%) |
| No Fuel Used | 0 (0.0%) | 0 (0.0%) |
| Total | 676 (100.0%) | 691 (100.0%) |
Household Vehicle Usage in Bedford borough
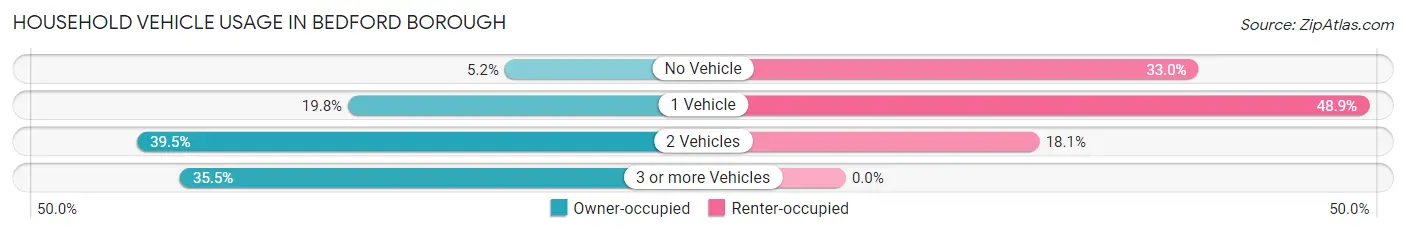
| Vehicles per Household | Owner-occupied | Renter-occupied |
| No Vehicle | 35 (5.2%) | 228 (33.0%) |
| 1 Vehicle | 134 (19.8%) | 338 (48.9%) |
| 2 Vehicles | 267 (39.5%) | 125 (18.1%) |
| 3 or more Vehicles | 240 (35.5%) | 0 (0.0%) |
| Total | 676 (100.0%) | 691 (100.0%) |
Real Estate & Mortgages in Bedford borough
Real Estate and Mortgage Overview in Bedford borough
| Characteristic | Without Mortgage | With Mortgage |
| Housing Units | 259 | 417 |
| Median Property Value | $149,400 | $180,000 |
| Median Household Income | $48,826 | $99 |
| Monthly Housing Costs | $510 | $41 |
| Real Estate Taxes | $1,492 | $0 |
Property Value by Mortgage Status in Bedford borough
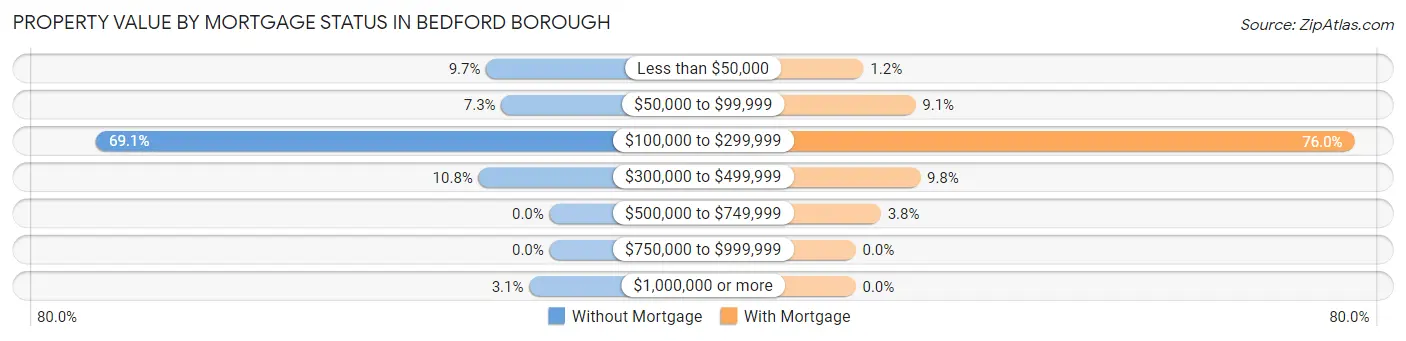
| Property Value | Without Mortgage | With Mortgage |
| Less than $50,000 | 25 (9.7%) | 5 (1.2%) |
| $50,000 to $99,999 | 19 (7.3%) | 38 (9.1%) |
| $100,000 to $299,999 | 179 (69.1%) | 317 (76.0%) |
| $300,000 to $499,999 | 28 (10.8%) | 41 (9.8%) |
| $500,000 to $749,999 | 0 (0.0%) | 16 (3.8%) |
| $750,000 to $999,999 | 0 (0.0%) | 0 (0.0%) |
| $1,000,000 or more | 8 (3.1%) | 0 (0.0%) |
| Total | 259 (100.0%) | 417 (100.0%) |
Household Income by Mortgage Status in Bedford borough
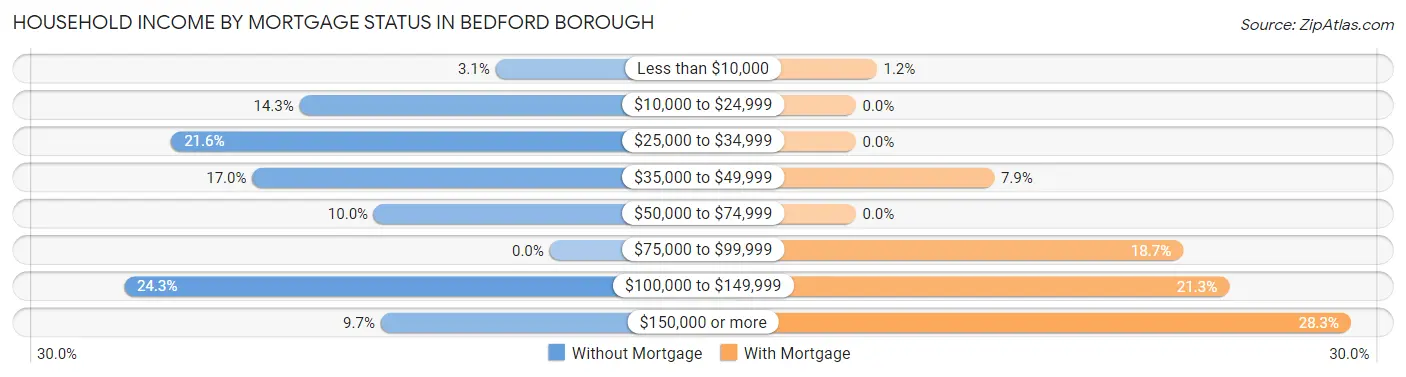
| Household Income | Without Mortgage | With Mortgage |
| Less than $10,000 | 8 (3.1%) | 5 (1.2%) |
| $10,000 to $24,999 | 37 (14.3%) | 0 (0.0%) |
| $25,000 to $34,999 | 56 (21.6%) | 0 (0.0%) |
| $35,000 to $49,999 | 44 (17.0%) | 33 (7.9%) |
| $50,000 to $74,999 | 26 (10.0%) | 0 (0.0%) |
| $75,000 to $99,999 | 0 (0.0%) | 78 (18.7%) |
| $100,000 to $149,999 | 63 (24.3%) | 89 (21.3%) |
| $150,000 or more | 25 (9.7%) | 118 (28.3%) |
| Total | 259 (100.0%) | 417 (100.0%) |
Property Value to Household Income Ratio in Bedford borough
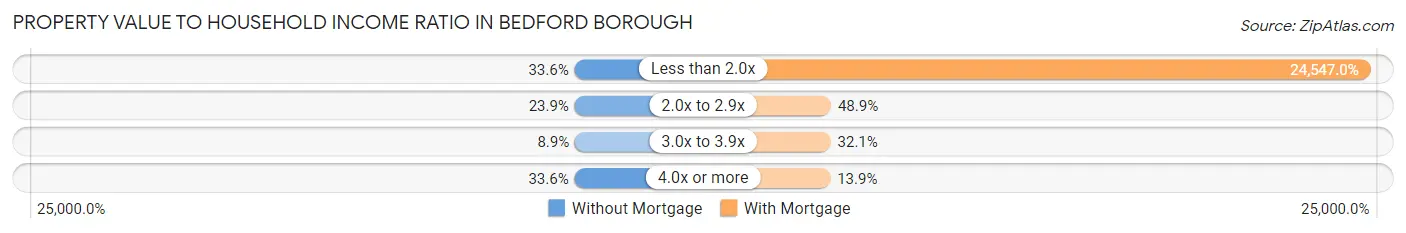
| Value-to-Income Ratio | Without Mortgage | With Mortgage |
| Less than 2.0x | 87 (33.6%) | 102,361 (24,547.0%) |
| 2.0x to 2.9x | 62 (23.9%) | 204 (48.9%) |
| 3.0x to 3.9x | 23 (8.9%) | 134 (32.1%) |
| 4.0x or more | 87 (33.6%) | 58 (13.9%) |
| Total | 259 (100.0%) | 417 (100.0%) |
Real Estate Taxes by Mortgage Status in Bedford borough
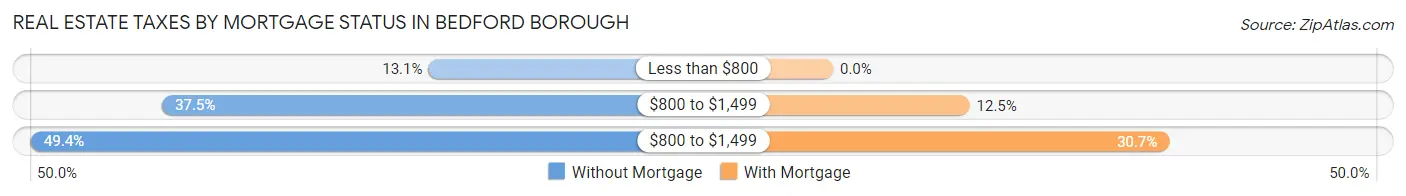
| Property Taxes | Without Mortgage | With Mortgage |
| Less than $800 | 34 (13.1%) | 0 (0.0%) |
| $800 to $1,499 | 97 (37.4%) | 52 (12.5%) |
| $800 to $1,499 | 128 (49.4%) | 128 (30.7%) |
| Total | 259 (100.0%) | 417 (100.0%) |
Health & Disability in Bedford borough
Health Insurance Coverage by Age in Bedford borough
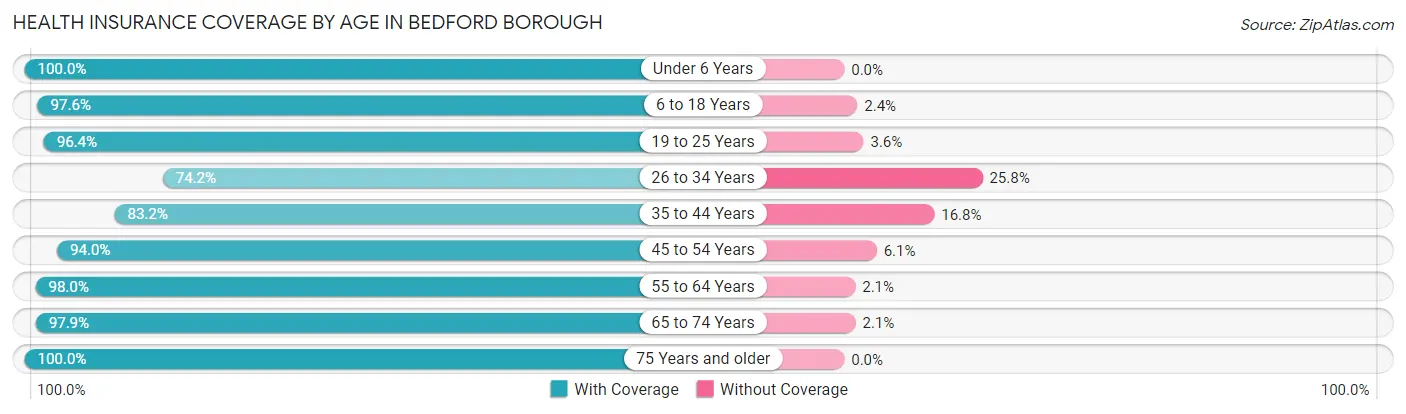
| Age Bracket | With Coverage | Without Coverage |
| Under 6 Years | 104 (100.0%) | 0 (0.0%) |
| 6 to 18 Years | 360 (97.6%) | 9 (2.4%) |
| 19 to 25 Years | 242 (96.4%) | 9 (3.6%) |
| 26 to 34 Years | 193 (74.2%) | 67 (25.8%) |
| 35 to 44 Years | 357 (83.2%) | 72 (16.8%) |
| 45 to 54 Years | 326 (94.0%) | 21 (6.0%) |
| 55 to 64 Years | 335 (98.0%) | 7 (2.1%) |
| 65 to 74 Years | 372 (97.9%) | 8 (2.1%) |
| 75 Years and older | 373 (100.0%) | 0 (0.0%) |
| Total | 2,662 (93.2%) | 193 (6.8%) |
Health Insurance Coverage by Citizenship Status in Bedford borough
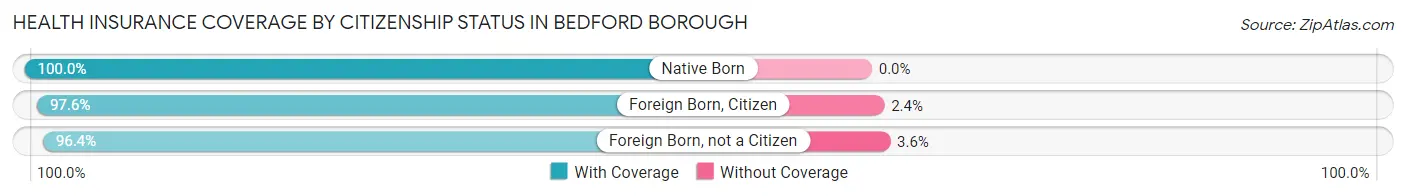
| Citizenship Status | With Coverage | Without Coverage |
| Native Born | 104 (100.0%) | 0 (0.0%) |
| Foreign Born, Citizen | 360 (97.6%) | 9 (2.4%) |
| Foreign Born, not a Citizen | 242 (96.4%) | 9 (3.6%) |
Health Insurance Coverage by Household Income in Bedford borough
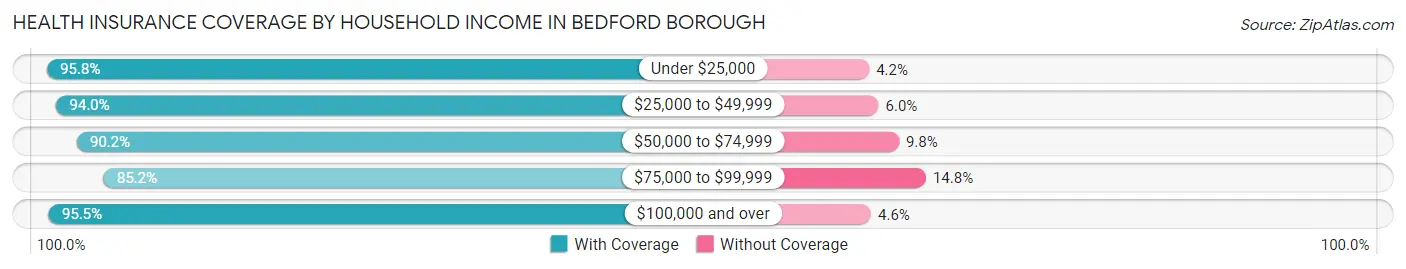
| Household Income | With Coverage | Without Coverage |
| Under $25,000 | 388 (95.8%) | 17 (4.2%) |
| $25,000 to $49,999 | 584 (94.0%) | 37 (6.0%) |
| $50,000 to $74,999 | 323 (90.2%) | 35 (9.8%) |
| $75,000 to $99,999 | 310 (85.2%) | 54 (14.8%) |
| $100,000 and over | 1,048 (95.5%) | 50 (4.5%) |
Public vs Private Health Insurance Coverage by Age in Bedford borough
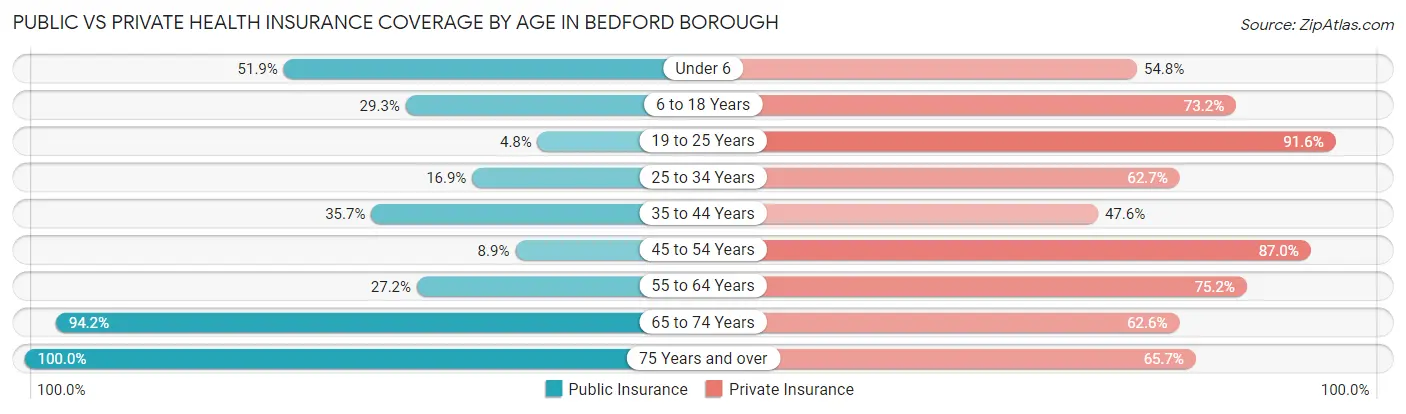
| Age Bracket | Public Insurance | Private Insurance |
| Under 6 | 54 (51.9%) | 57 (54.8%) |
| 6 to 18 Years | 108 (29.3%) | 270 (73.2%) |
| 19 to 25 Years | 12 (4.8%) | 230 (91.6%) |
| 25 to 34 Years | 44 (16.9%) | 163 (62.7%) |
| 35 to 44 Years | 153 (35.7%) | 204 (47.5%) |
| 45 to 54 Years | 31 (8.9%) | 302 (87.0%) |
| 55 to 64 Years | 93 (27.2%) | 257 (75.1%) |
| 65 to 74 Years | 358 (94.2%) | 238 (62.6%) |
| 75 Years and over | 373 (100.0%) | 245 (65.7%) |
| Total | 1,226 (42.9%) | 1,966 (68.9%) |
Disability Status by Sex by Age in Bedford borough
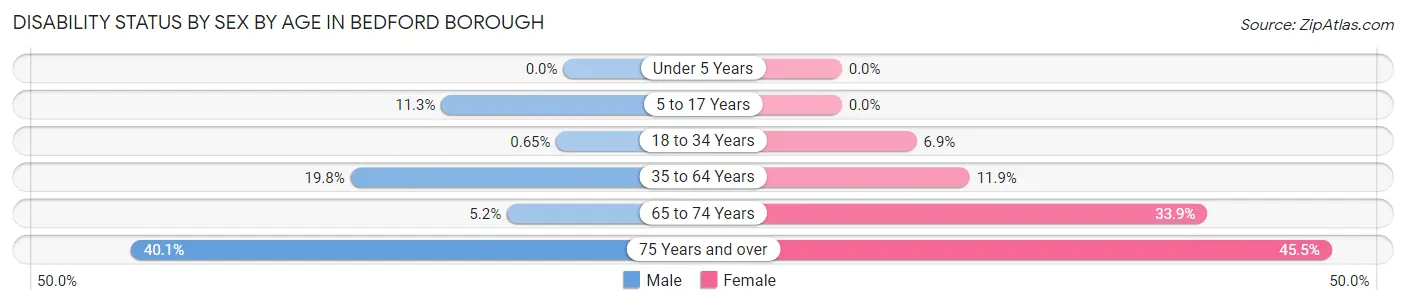
| Age Bracket | Male | Female |
| Under 5 Years | 0 (0.0%) | 0 (0.0%) |
| 5 to 17 Years | 23 (11.3%) | 0 (0.0%) |
| 18 to 34 Years | 2 (0.6%) | 15 (6.9%) |
| 35 to 64 Years | 111 (19.8%) | 66 (11.9%) |
| 65 to 74 Years | 8 (5.2%) | 77 (33.9%) |
| 75 Years and over | 57 (40.1%) | 105 (45.5%) |
Disability Class by Sex by Age in Bedford borough
Disability Class: Hearing Difficulty
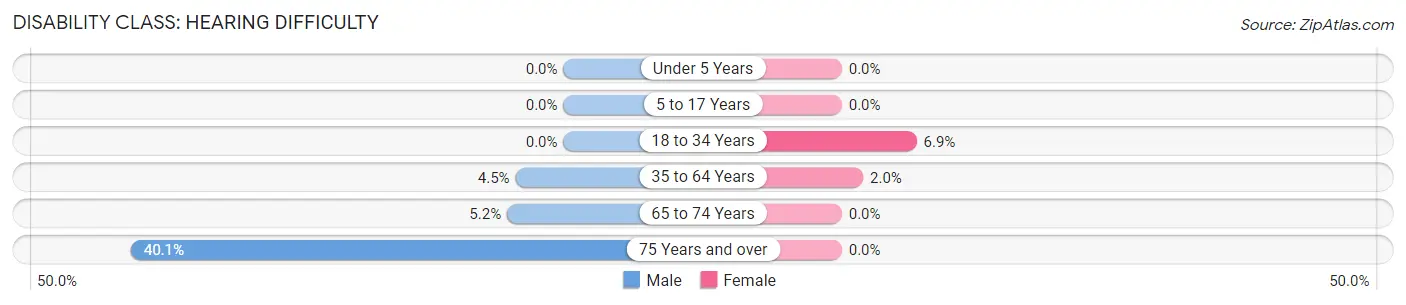
| Age Bracket | Male | Female |
| Under 5 Years | 0 (0.0%) | 0 (0.0%) |
| 5 to 17 Years | 0 (0.0%) | 0 (0.0%) |
| 18 to 34 Years | 0 (0.0%) | 15 (6.9%) |
| 35 to 64 Years | 25 (4.4%) | 11 (2.0%) |
| 65 to 74 Years | 8 (5.2%) | 0 (0.0%) |
| 75 Years and over | 57 (40.1%) | 0 (0.0%) |
Disability Class: Vision Difficulty
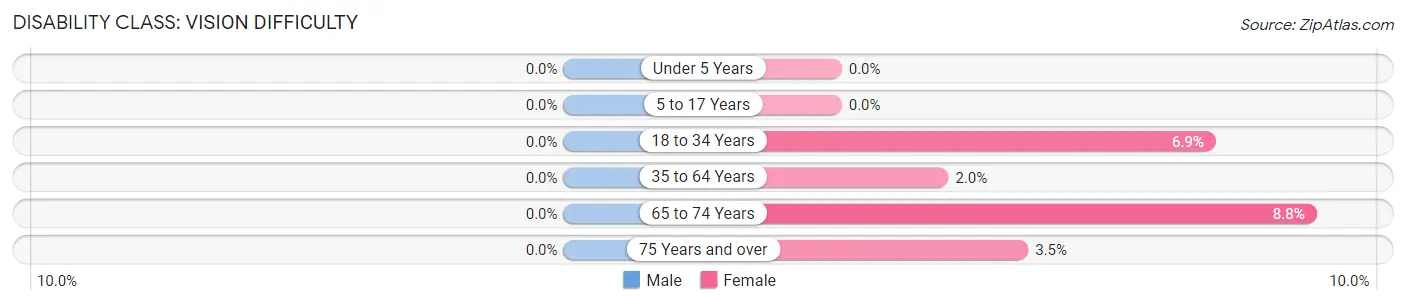
| Age Bracket | Male | Female |
| Under 5 Years | 0 (0.0%) | 0 (0.0%) |
| 5 to 17 Years | 0 (0.0%) | 0 (0.0%) |
| 18 to 34 Years | 0 (0.0%) | 15 (6.9%) |
| 35 to 64 Years | 0 (0.0%) | 11 (2.0%) |
| 65 to 74 Years | 0 (0.0%) | 20 (8.8%) |
| 75 Years and over | 0 (0.0%) | 8 (3.5%) |
Disability Class: Cognitive Difficulty
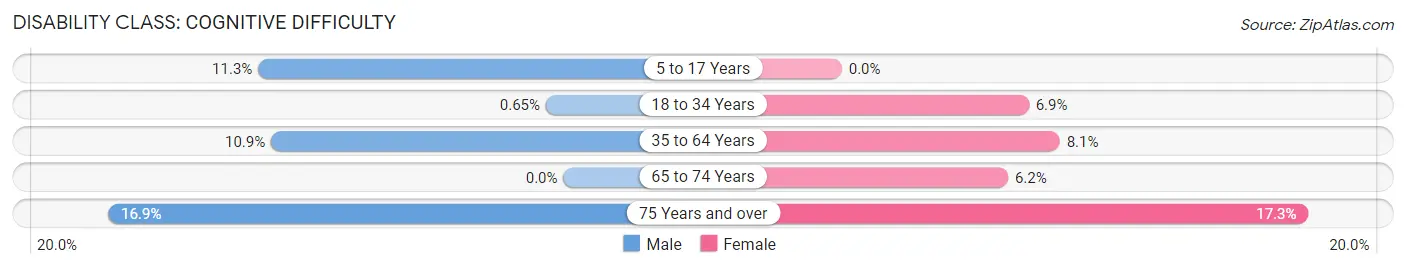
| Age Bracket | Male | Female |
| 5 to 17 Years | 23 (11.3%) | 0 (0.0%) |
| 18 to 34 Years | 2 (0.6%) | 15 (6.9%) |
| 35 to 64 Years | 61 (10.8%) | 45 (8.1%) |
| 65 to 74 Years | 0 (0.0%) | 14 (6.2%) |
| 75 Years and over | 24 (16.9%) | 40 (17.3%) |
Disability Class: Ambulatory Difficulty
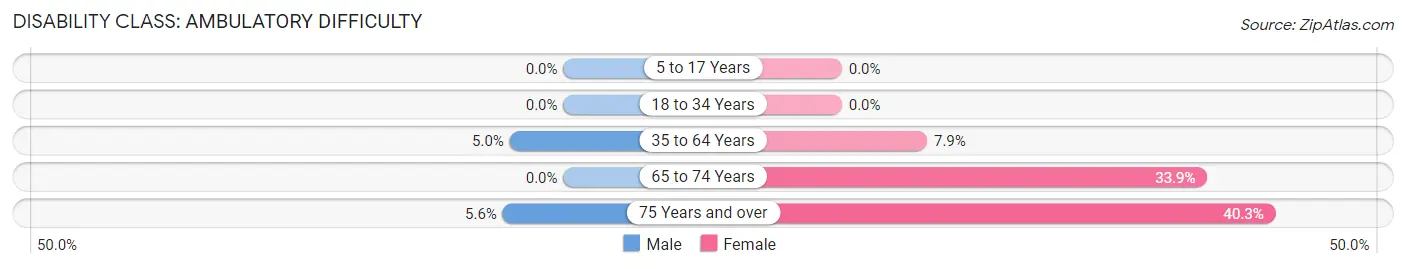
| Age Bracket | Male | Female |
| 5 to 17 Years | 0 (0.0%) | 0 (0.0%) |
| 18 to 34 Years | 0 (0.0%) | 0 (0.0%) |
| 35 to 64 Years | 28 (5.0%) | 44 (7.9%) |
| 65 to 74 Years | 0 (0.0%) | 77 (33.9%) |
| 75 Years and over | 8 (5.6%) | 93 (40.3%) |
Disability Class: Self-Care Difficulty
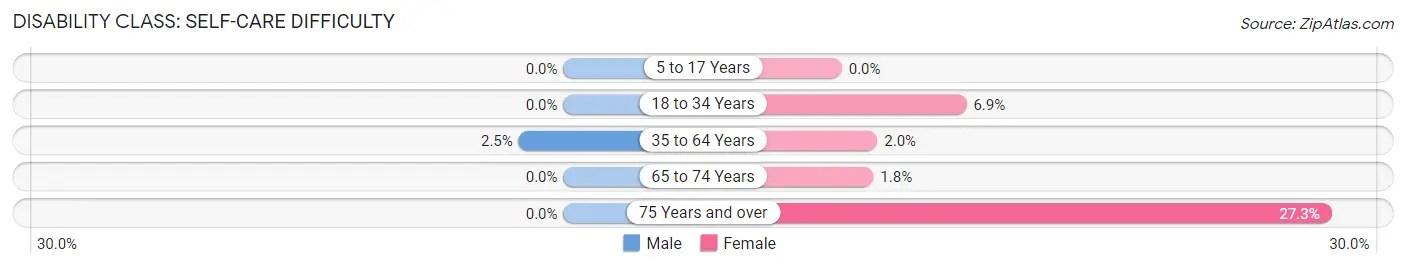
| Age Bracket | Male | Female |
| 5 to 17 Years | 0 (0.0%) | 0 (0.0%) |
| 18 to 34 Years | 0 (0.0%) | 15 (6.9%) |
| 35 to 64 Years | 14 (2.5%) | 11 (2.0%) |
| 65 to 74 Years | 0 (0.0%) | 4 (1.8%) |
| 75 Years and over | 0 (0.0%) | 63 (27.3%) |
Technology Access in Bedford borough
Computing Device Access in Bedford borough
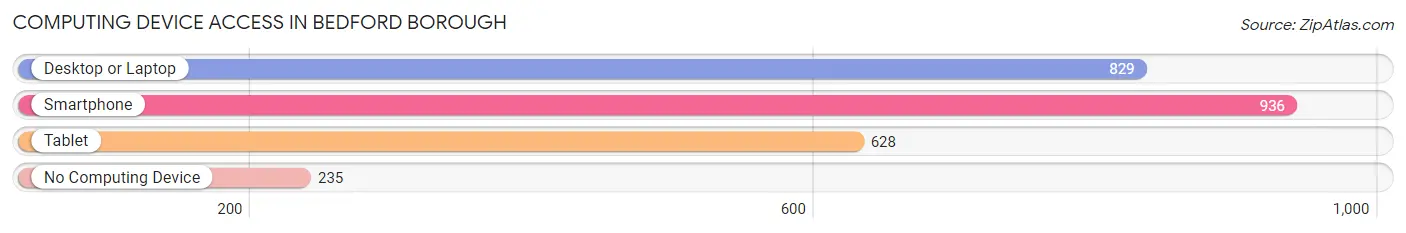
| Device Type | # Households | % Households |
| Desktop or Laptop | 829 | 60.6% |
| Smartphone | 936 | 68.5% |
| Tablet | 628 | 45.9% |
| No Computing Device | 235 | 17.2% |
| Total | 1,367 | 100.0% |
Internet Access in Bedford borough
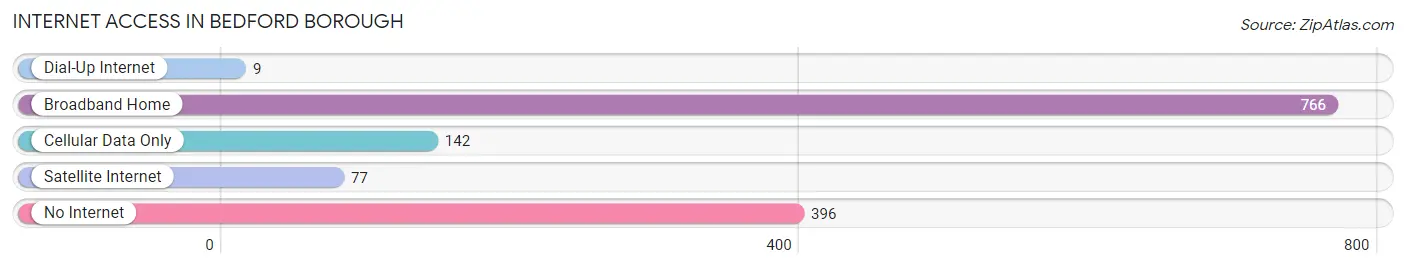
| Internet Type | # Households | % Households |
| Dial-Up Internet | 9 | 0.7% |
| Broadband Home | 766 | 56.0% |
| Cellular Data Only | 142 | 10.4% |
| Satellite Internet | 77 | 5.6% |
| No Internet | 396 | 29.0% |
| Total | 1,367 | 100.0% |
Bedford borough Summary
Bedford Borough is a borough located in Bedford County, Pennsylvania. It is the county seat of Bedford County and is located in the Allegheny Mountains region of the state. The population of Bedford Borough was 2,841 at the 2010 census.
Geography
Bedford Borough is located at 40°02'N 78°32'W (40.037, -78.531). It is situated in the Allegheny Mountains region of Pennsylvania, in the foothills of the Blue Ridge Mountains. The borough is located in the center of Bedford County, and is bordered by the townships of Bedford, Cumberland, and Colerain. The borough is situated along the Juniata River, which flows through the center of the borough.
The borough has a total area of 1.2 square miles, all of which is land. The borough is located in the humid continental climate zone, with cold, snowy winters and hot, humid summers.
History
Bedford Borough was founded in 1750 by William Penn. It was originally named Raystown, after the Ray family who owned the land. The name was changed to Bedford in 1758, after the Duke of Bedford. The borough was incorporated in 1795.
Bedford Borough was an important stop on the Underground Railroad during the Civil War. It was also the site of the Battle of Bedford, which was fought in 1863.
Economy
The economy of Bedford Borough is largely based on tourism and agriculture. The borough is home to several tourist attractions, including the Bedford County Historical Society, the Bedford County Courthouse, and the Bedford County Fairgrounds.
Agriculture is also an important part of the local economy. The borough is home to several farms, including the Bedford County Farm Bureau, which produces a variety of fruits and vegetables.
Demographics
As of the 2010 census, the population of Bedford Borough was 2,841. The racial makeup of the borough was 97.3% White, 0.7% African American, 0.2% Native American, 0.3% Asian, 0.1% from other races, and 1.4% from two or more races. Hispanic or Latino of any race were 0.7% of the population.
The median income for a household in the borough was $37,917, and the median income for a family was $45,000. The per capita income for the borough was $19,945. About 11.2% of families and 14.2% of the population were below the poverty line, including 19.2% of those under age 18 and 8.2% of those age 65 or over.
Education
Bedford Borough is served by the Bedford Area School District. The district operates four elementary schools, one middle school, and one high school. The borough is also home to the Bedford County Technical Center, which offers career and technical education programs.
Common Questions
What is Per Capita Income in Bedford borough?
Per Capita income in Bedford borough is $33,204.
What is the Median Family Income in Bedford borough?
Median Family Income in Bedford borough is $84,635.
What is the Median Household income in Bedford borough?
Median Household Income in Bedford borough is $48,342.
What is Income or Wage Gap in Bedford borough?
Income or Wage Gap in Bedford borough is 31.4%.
Women in Bedford borough earn 68.6 cents for every dollar earned by a man.
What is Family Income Deficit in Bedford borough?
Family Income Deficit in Bedford borough is $7,775.
Families that are below poverty line in Bedford borough earn $7,775 less on average than the poverty threshold level.
What is Inequality or Gini Index in Bedford borough?
Inequality or Gini Index in Bedford borough is 0.45.
What is the Total Population of Bedford borough?
Total Population of Bedford borough is 2,855.
What is the Total Male Population of Bedford borough?
Total Male Population of Bedford borough is 1,383.
What is the Total Female Population of Bedford borough?
Total Female Population of Bedford borough is 1,472.
What is the Ratio of Males per 100 Females in Bedford borough?
There are 93.95 Males per 100 Females in Bedford borough.
What is the Ratio of Females per 100 Males in Bedford borough?
There are 106.44 Females per 100 Males in Bedford borough.
What is the Median Population Age in Bedford borough?
Median Population Age in Bedford borough is 45.4 Years.
What is the Average Family Size in Bedford borough
Average Family Size in Bedford borough is 3.0 People.
What is the Average Household Size in Bedford borough
Average Household Size in Bedford borough is 2.1 People.
How Large is the Labor Force in Bedford borough?
There are 1,581 People in the Labor Forcein in Bedford borough.
What is the Percentage of People in the Labor Force in Bedford borough?
62.2% of People are in the Labor Force in Bedford borough.
What is the Unemployment Rate in Bedford borough?
Unemployment Rate in Bedford borough is 1.7%.