Silverdale borough, PA Map & Demographics
Silverdale borough Overview
$40,465
PER CAPITA INCOME
$112,656
AVG FAMILY INCOME
$108,702
AVG HOUSEHOLD INCOME
50.8%
WAGE / INCOME GAP [ % ]
49.2¢/ $1
WAGE / INCOME GAP [ $ ]
0.32
INEQUALITY / GINI INDEX
1,023
TOTAL POPULATION
499
MALE POPULATION
524
FEMALE POPULATION
95.23
MALES / 100 FEMALES
105.01
FEMALES / 100 MALES
36.9
MEDIAN AGE
3.4
AVG FAMILY SIZE
2.9
AVG HOUSEHOLD SIZE
566
LABOR FORCE [ PEOPLE ]
77.6%
PERCENT IN LABOR FORCE
2.0%
UNEMPLOYMENT RATE
Income in Silverdale borough
Income Overview in Silverdale borough
Per Capita Income in Silverdale borough is $40,465, while median incomes of families and households are $112,656 and $108,702 respectively.
| Characteristic | Number | Measure |
| Per Capita Income | 1,023 | $40,465 |
| Median Family Income | 267 | $112,656 |
| Mean Family Income | 267 | $124,172 |
| Median Household Income | 347 | $108,702 |
| Mean Household Income | 347 | $117,952 |
| Income Deficit | 267 | $0 |
| Wage / Income Gap (%) | 1,023 | 50.77% |
| Wage / Income Gap ($) | 1,023 | 49.23¢ per $1 |
| Gini / Inequality Index | 1,023 | 0.32 |
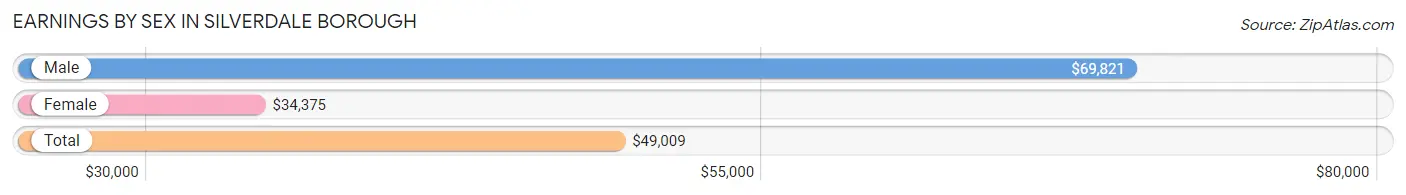
Earnings by Sex in Silverdale borough
Average Earnings in Silverdale borough are $49,009, $69,821 for men and $34,375 for women, a difference of 50.8%.
| Sex | Number | Average Earnings |
| Male | 309 (52.3%) | $69,821 |
| Female | 282 (47.7%) | $34,375 |
| Total | 591 (100.0%) | $49,009 |
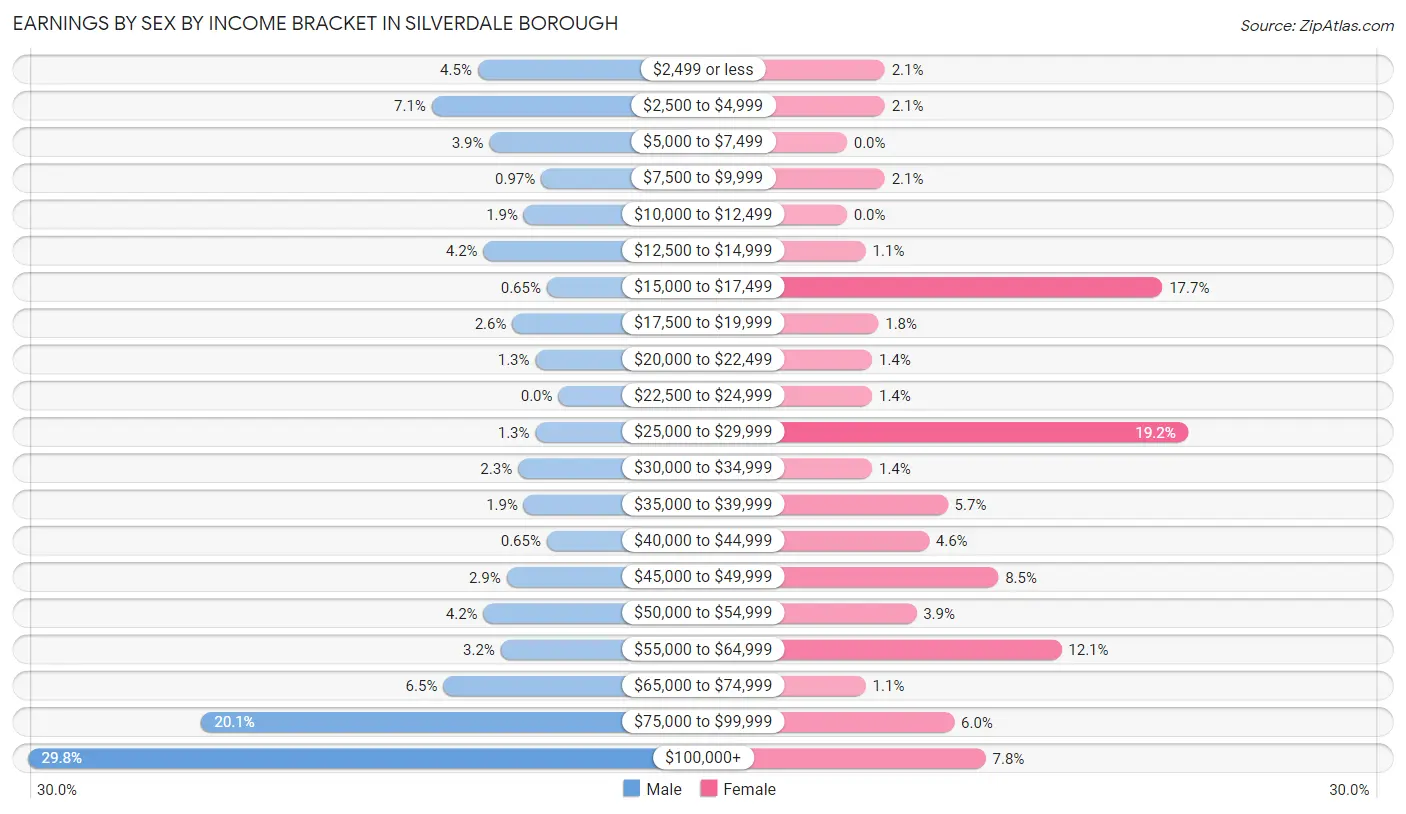
Earnings by Sex by Income Bracket in Silverdale borough
The most common earnings brackets in Silverdale borough are $100,000+ for men (92 | 29.8%) and $25,000 to $29,999 for women (54 | 19.2%).
| Income | Male | Female |
| $2,499 or less | 14 (4.5%) | 6 (2.1%) |
| $2,500 to $4,999 | 22 (7.1%) | 6 (2.1%) |
| $5,000 to $7,499 | 12 (3.9%) | 0 (0.0%) |
| $7,500 to $9,999 | 3 (1.0%) | 6 (2.1%) |
| $10,000 to $12,499 | 6 (1.9%) | 0 (0.0%) |
| $12,500 to $14,999 | 13 (4.2%) | 3 (1.1%) |
| $15,000 to $17,499 | 2 (0.6%) | 50 (17.7%) |
| $17,500 to $19,999 | 8 (2.6%) | 5 (1.8%) |
| $20,000 to $22,499 | 4 (1.3%) | 4 (1.4%) |
| $22,500 to $24,999 | 0 (0.0%) | 4 (1.4%) |
| $25,000 to $29,999 | 4 (1.3%) | 54 (19.2%) |
| $30,000 to $34,999 | 7 (2.3%) | 4 (1.4%) |
| $35,000 to $39,999 | 6 (1.9%) | 16 (5.7%) |
| $40,000 to $44,999 | 2 (0.6%) | 13 (4.6%) |
| $45,000 to $49,999 | 9 (2.9%) | 24 (8.5%) |
| $50,000 to $54,999 | 13 (4.2%) | 11 (3.9%) |
| $55,000 to $64,999 | 10 (3.2%) | 34 (12.1%) |
| $65,000 to $74,999 | 20 (6.5%) | 3 (1.1%) |
| $75,000 to $99,999 | 62 (20.1%) | 17 (6.0%) |
| $100,000+ | 92 (29.8%) | 22 (7.8%) |
| Total | 309 (100.0%) | 282 (100.0%) |
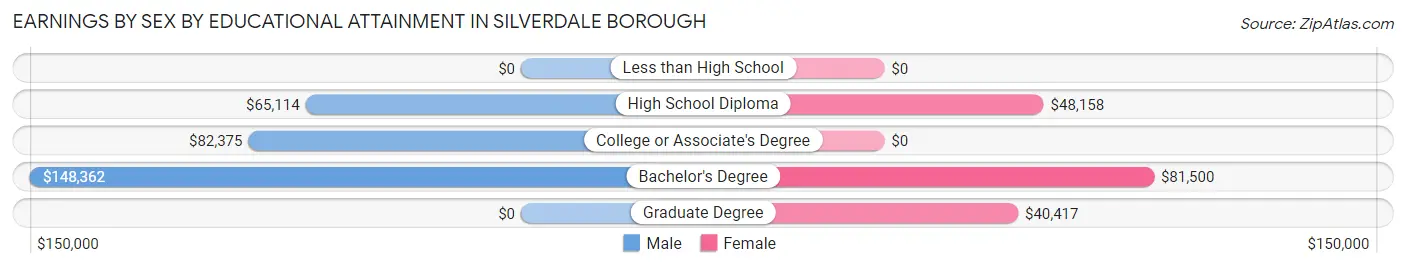
Earnings by Sex by Educational Attainment in Silverdale borough
Average earnings in Silverdale borough are $80,060 for men and $37,083 for women, a difference of 53.7%. Men with an educational attainment of bachelor's degree enjoy the highest average annual earnings of $148,362, while those with high school diploma education earn the least with $65,114. Women with an educational attainment of bachelor's degree earn the most with the average annual earnings of $81,500, while those with graduate degree education have the smallest earnings of $40,417.
| Educational Attainment | Male Income | Female Income |
| Less than High School | - | - |
| High School Diploma | $65,114 | $48,158 |
| College or Associate's Degree | $82,375 | $0 |
| Bachelor's Degree | $148,362 | $81,500 |
| Graduate Degree | - | - |
| Total | $80,060 | $37,083 |
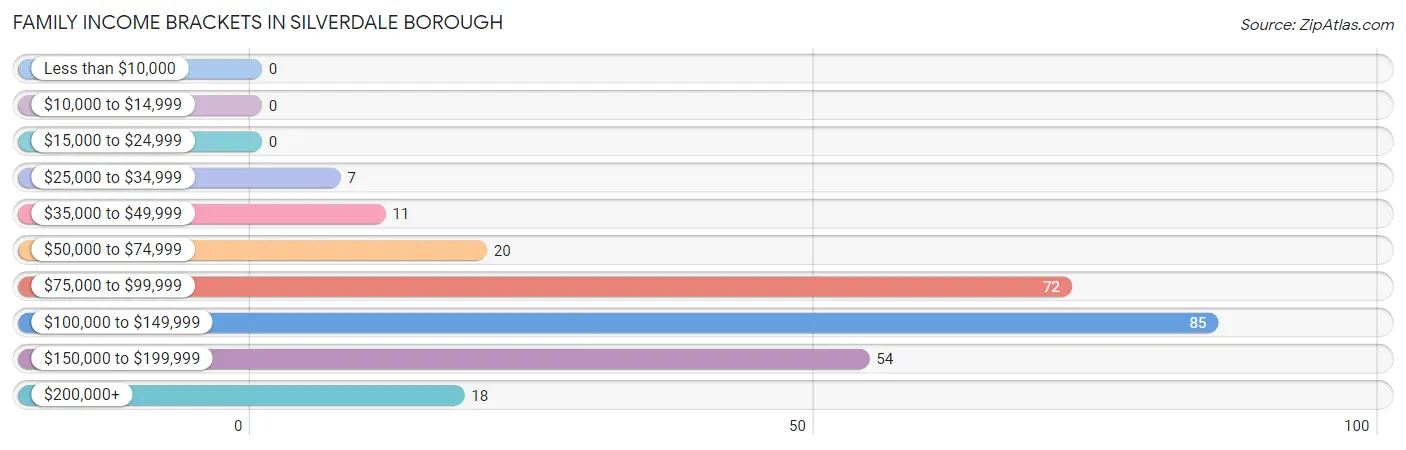
Family Income in Silverdale borough
Family Income Brackets in Silverdale borough
According to the Silverdale borough family income data, there are 85 families falling into the $100,000 to $149,999 income range, which is the most common income bracket and makes up 31.8% of all families.
| Income Bracket | # Families | % Families |
| Less than $10,000 | 0 | 0.0% |
| $10,000 to $14,999 | 0 | 0.0% |
| $15,000 to $24,999 | 0 | 0.0% |
| $25,000 to $34,999 | 7 | 2.6% |
| $35,000 to $49,999 | 11 | 4.1% |
| $50,000 to $74,999 | 20 | 7.5% |
| $75,000 to $99,999 | 72 | 27.0% |
| $100,000 to $149,999 | 85 | 31.8% |
| $150,000 to $199,999 | 54 | 20.2% |
| $200,000+ | 18 | 6.7% |
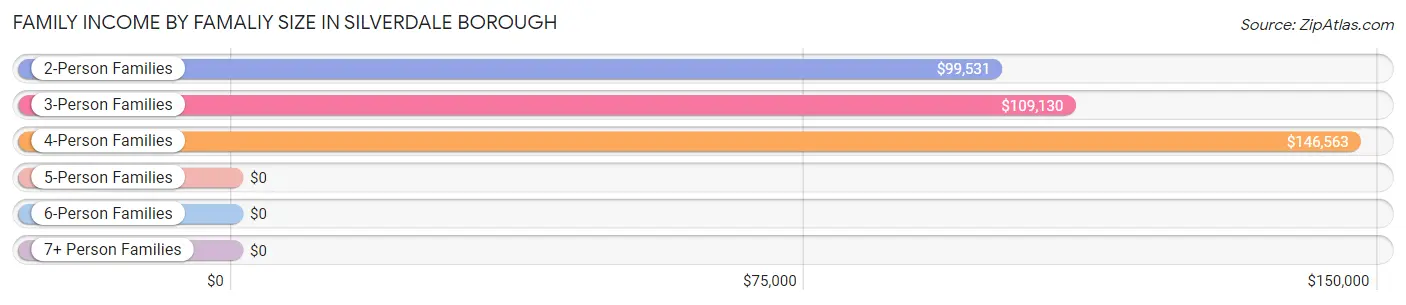
Family Income by Famaliy Size in Silverdale borough
4-person families (37 | 13.9%) account for the highest median family income in Silverdale borough with $146,563 per family, while 2-person families (93 | 34.8%) have the highest median income of $49,766 per family member.
| Income Bracket | # Families | Median Income |
| 2-Person Families | 93 (34.8%) | $99,531 |
| 3-Person Families | 54 (20.2%) | $109,130 |
| 4-Person Families | 37 (13.9%) | $146,563 |
| 5-Person Families | 81 (30.3%) | $0 |
| 6-Person Families | 2 (0.7%) | $0 |
| 7+ Person Families | 0 (0.0%) | $0 |
| Total | 267 (100.0%) | $112,656 |
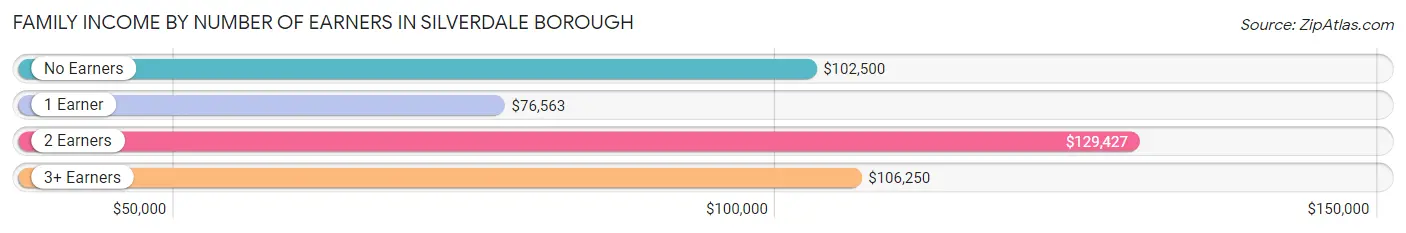
Family Income by Number of Earners in Silverdale borough
The median family income in Silverdale borough is $112,656, with families comprising 2 earners (135) having the highest median family income of $129,427, while families with 1 earner (60) have the lowest median family income of $76,563, accounting for 50.6% and 22.5% of families, respectively.
| Number of Earners | # Families | Median Income |
| No Earners | 12 (4.5%) | $102,500 |
| 1 Earner | 60 (22.5%) | $76,563 |
| 2 Earners | 135 (50.6%) | $129,427 |
| 3+ Earners | 60 (22.5%) | $106,250 |
| Total | 267 (100.0%) | $112,656 |
Household Income in Silverdale borough
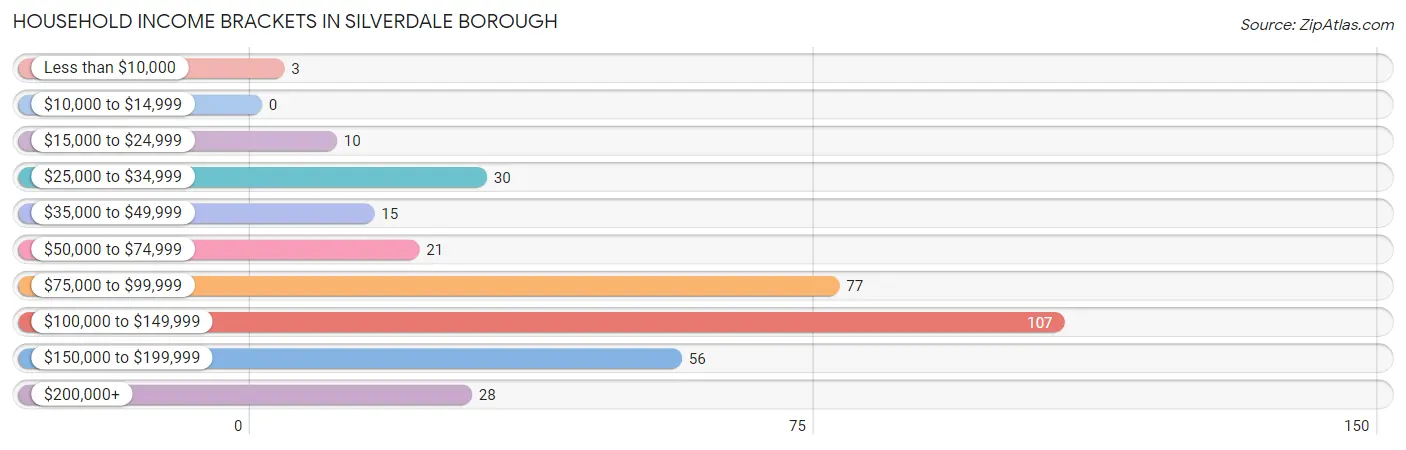
Household Income Brackets in Silverdale borough
With 107 households falling in the category, the $100,000 to $149,999 income range is the most frequent in Silverdale borough, accounting for 30.8% of all households.
| Income Bracket | # Households | % Households |
| Less than $10,000 | 3 | 0.9% |
| $10,000 to $14,999 | 0 | 0.0% |
| $15,000 to $24,999 | 10 | 2.9% |
| $25,000 to $34,999 | 30 | 8.6% |
| $35,000 to $49,999 | 15 | 4.3% |
| $50,000 to $74,999 | 21 | 6.1% |
| $75,000 to $99,999 | 77 | 22.2% |
| $100,000 to $149,999 | 107 | 30.8% |
| $150,000 to $199,999 | 56 | 16.1% |
| $200,000+ | 28 | 8.1% |
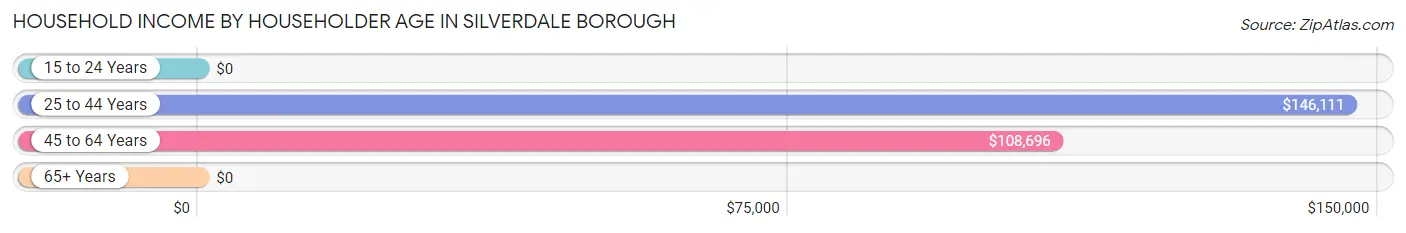
Household Income by Householder Age in Silverdale borough
The median household income in Silverdale borough is $108,702, with the highest median household income of $146,111 found in the 25 to 44 years age bracket for the primary householder. A total of 88 households (25.4%) fall into this category.
| Income Bracket | # Households | Median Income |
| 15 to 24 Years | 0 (0.0%) | $0 |
| 25 to 44 Years | 88 (25.4%) | $146,111 |
| 45 to 64 Years | 184 (53.0%) | $108,696 |
| 65+ Years | 75 (21.6%) | $0 |
| Total | 347 (100.0%) | $108,702 |
Poverty in Silverdale borough
Income Below Poverty by Sex and Age in Silverdale borough
With 0.4% poverty level for males and 1.1% for females among the residents of Silverdale borough, 45 to 54 year old males and 25 to 34 year old females are the most vulnerable to poverty, with 2 males (3.0%) and 2 females (3.0%) in their respective age groups living below the poverty level.
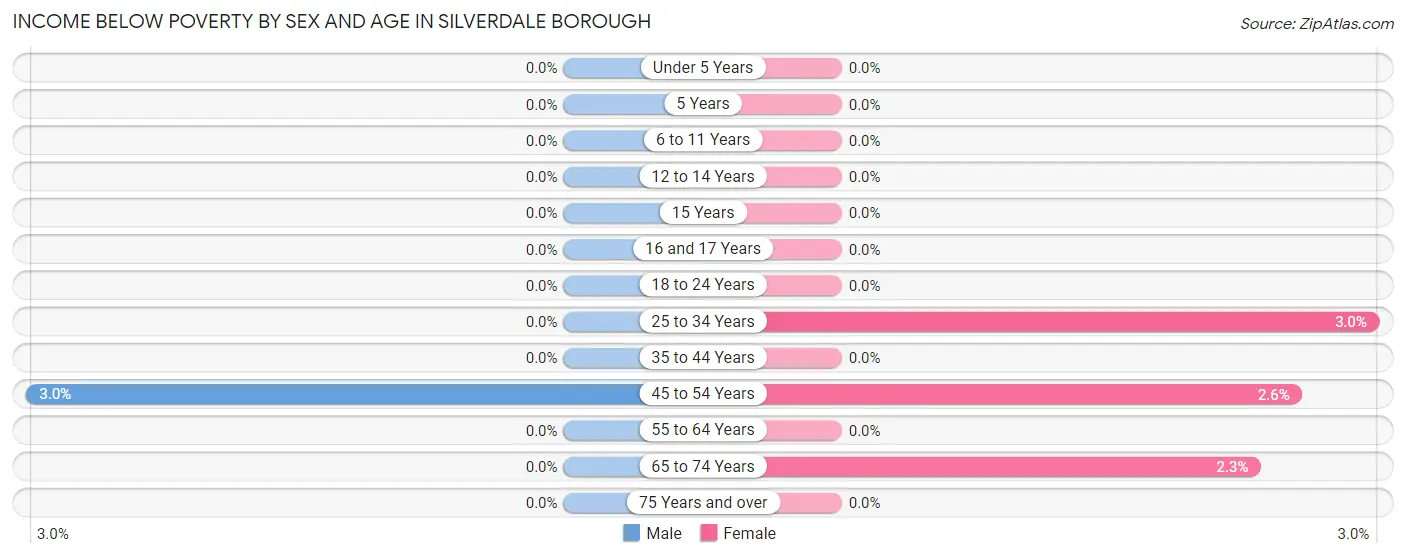
| Age Bracket | Male | Female |
| Under 5 Years | 0 (0.0%) | 0 (0.0%) |
| 5 Years | 0 (0.0%) | 0 (0.0%) |
| 6 to 11 Years | 0 (0.0%) | 0 (0.0%) |
| 12 to 14 Years | 0 (0.0%) | 0 (0.0%) |
| 15 Years | 0 (0.0%) | 0 (0.0%) |
| 16 and 17 Years | 0 (0.0%) | 0 (0.0%) |
| 18 to 24 Years | 0 (0.0%) | 0 (0.0%) |
| 25 to 34 Years | 0 (0.0%) | 2 (3.0%) |
| 35 to 44 Years | 0 (0.0%) | 0 (0.0%) |
| 45 to 54 Years | 2 (3.0%) | 3 (2.6%) |
| 55 to 64 Years | 0 (0.0%) | 0 (0.0%) |
| 65 to 74 Years | 0 (0.0%) | 1 (2.3%) |
| 75 Years and over | 0 (0.0%) | 0 (0.0%) |
| Total | 2 (0.4%) | 6 (1.1%) |
Income Above Poverty by Sex and Age in Silverdale borough
According to the poverty statistics in Silverdale borough, males aged under 5 years and females aged under 5 years are the age groups that are most secure financially, with 100.0% of males and 100.0% of females in these age groups living above the poverty line.
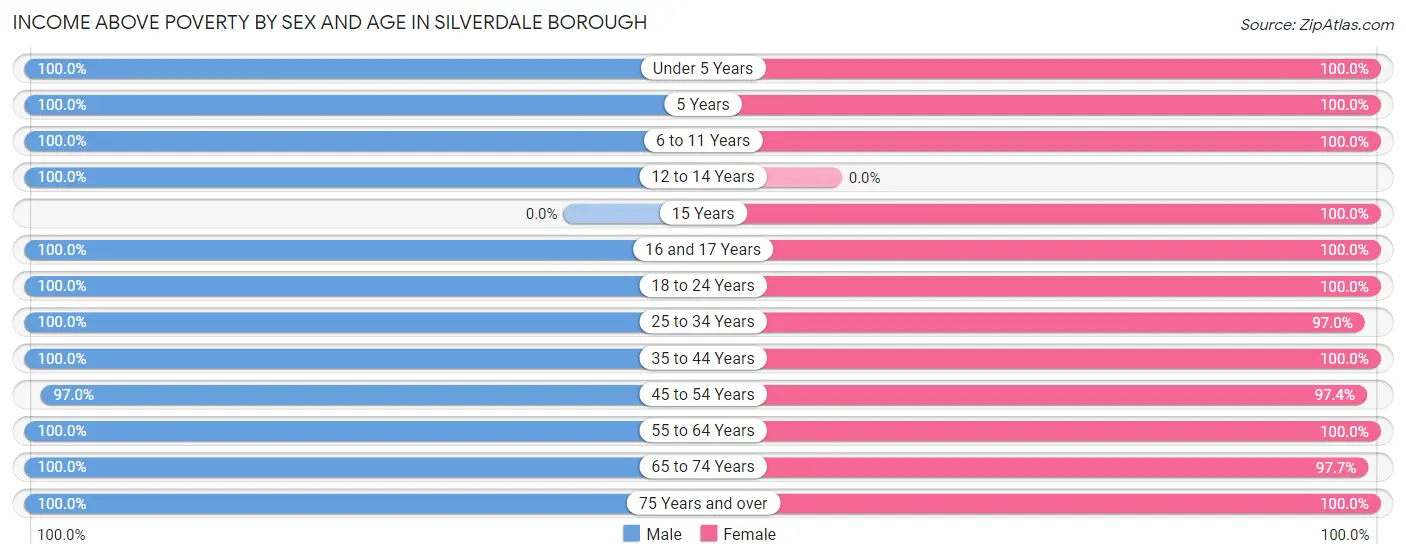
| Age Bracket | Male | Female |
| Under 5 Years | 43 (100.0%) | 13 (100.0%) |
| 5 Years | 9 (100.0%) | 40 (100.0%) |
| 6 to 11 Years | 26 (100.0%) | 74 (100.0%) |
| 12 to 14 Years | 76 (100.0%) | 0 (0.0%) |
| 15 Years | 0 (0.0%) | 7 (100.0%) |
| 16 and 17 Years | 20 (100.0%) | 5 (100.0%) |
| 18 to 24 Years | 26 (100.0%) | 15 (100.0%) |
| 25 to 34 Years | 35 (100.0%) | 65 (97.0%) |
| 35 to 44 Years | 81 (100.0%) | 23 (100.0%) |
| 45 to 54 Years | 65 (97.0%) | 114 (97.4%) |
| 55 to 64 Years | 68 (100.0%) | 88 (100.0%) |
| 65 to 74 Years | 31 (100.0%) | 42 (97.7%) |
| 75 Years and over | 15 (100.0%) | 28 (100.0%) |
| Total | 495 (99.6%) | 514 (98.9%) |
Income Below Poverty Among Married-Couple Families in Silverdale borough
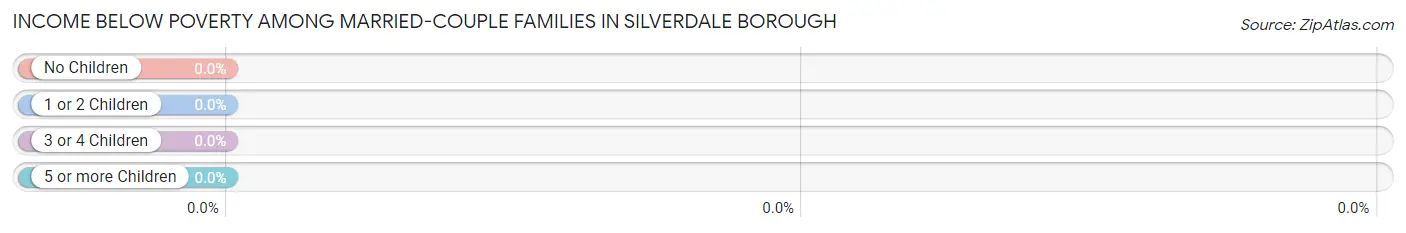
| Children | Above Poverty | Below Poverty |
| No Children | 101 (100.0%) | 0 (0.0%) |
| 1 or 2 Children | 66 (100.0%) | 0 (0.0%) |
| 3 or 4 Children | 37 (100.0%) | 0 (0.0%) |
| 5 or more Children | 0 (0.0%) | 0 (0.0%) |
| Total | 204 (100.0%) | 0 (0.0%) |
Income Below Poverty Among Single-Parent Households in Silverdale borough
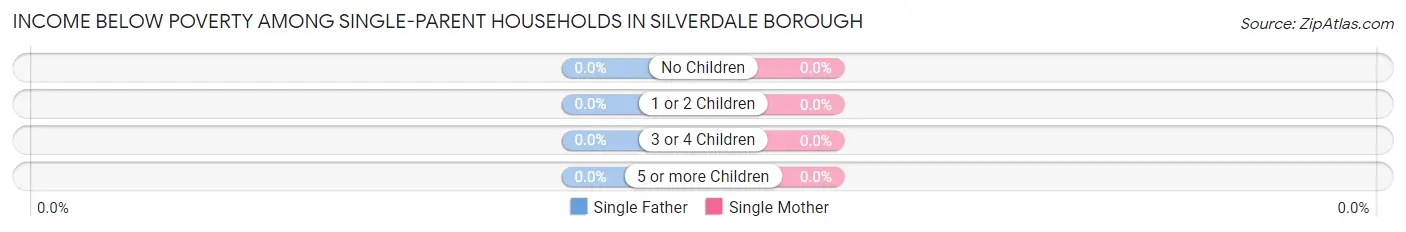
| Children | Single Father | Single Mother |
| No Children | 0 (0.0%) | 0 (0.0%) |
| 1 or 2 Children | 0 (0.0%) | 0 (0.0%) |
| 3 or 4 Children | 0 (0.0%) | 0 (0.0%) |
| 5 or more Children | 0 (0.0%) | 0 (0.0%) |
| Total | 0 (0.0%) | 0 (0.0%) |
Income Below Poverty Among Married-Couple vs Single-Parent Households in Silverdale borough
| Children | Married-Couple Families | Single-Parent Households |
| No Children | 0 (0.0%) | 0 (0.0%) |
| 1 or 2 Children | 0 (0.0%) | 0 (0.0%) |
| 3 or 4 Children | 0 (0.0%) | 0 (0.0%) |
| 5 or more Children | 0 (0.0%) | 0 (0.0%) |
| Total | 0 (0.0%) | 0 (0.0%) |
Race in Silverdale borough
The most populous races in Silverdale borough are White / Caucasian (963 | 94.1%), Two or more Races (35 | 3.4%), and Hispanic or Latino (23 | 2.2%).
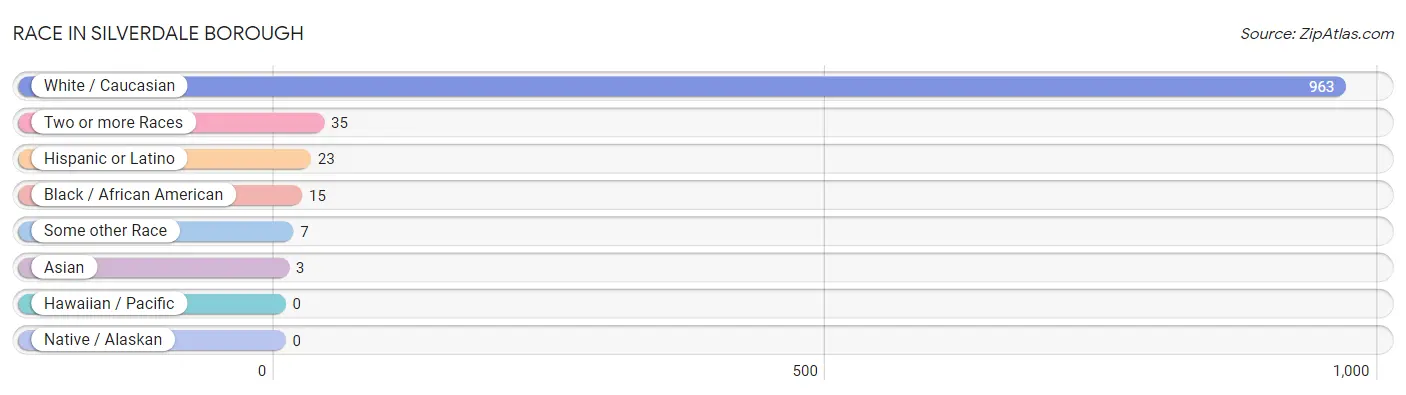
| Race | # Population | % Population |
| Asian | 3 | 0.3% |
| Black / African American | 15 | 1.5% |
| Hawaiian / Pacific | 0 | 0.0% |
| Hispanic or Latino | 23 | 2.2% |
| Native / Alaskan | 0 | 0.0% |
| White / Caucasian | 963 | 94.1% |
| Two or more Races | 35 | 3.4% |
| Some other Race | 7 | 0.7% |
| Total | 1,023 | 100.0% |
Ancestry in Silverdale borough
The most populous ancestries reported in Silverdale borough are German (315 | 30.8%), Irish (202 | 19.8%), English (124 | 12.1%), European (107 | 10.5%), and American (74 | 7.2%), together accounting for 80.4% of all Silverdale borough residents.
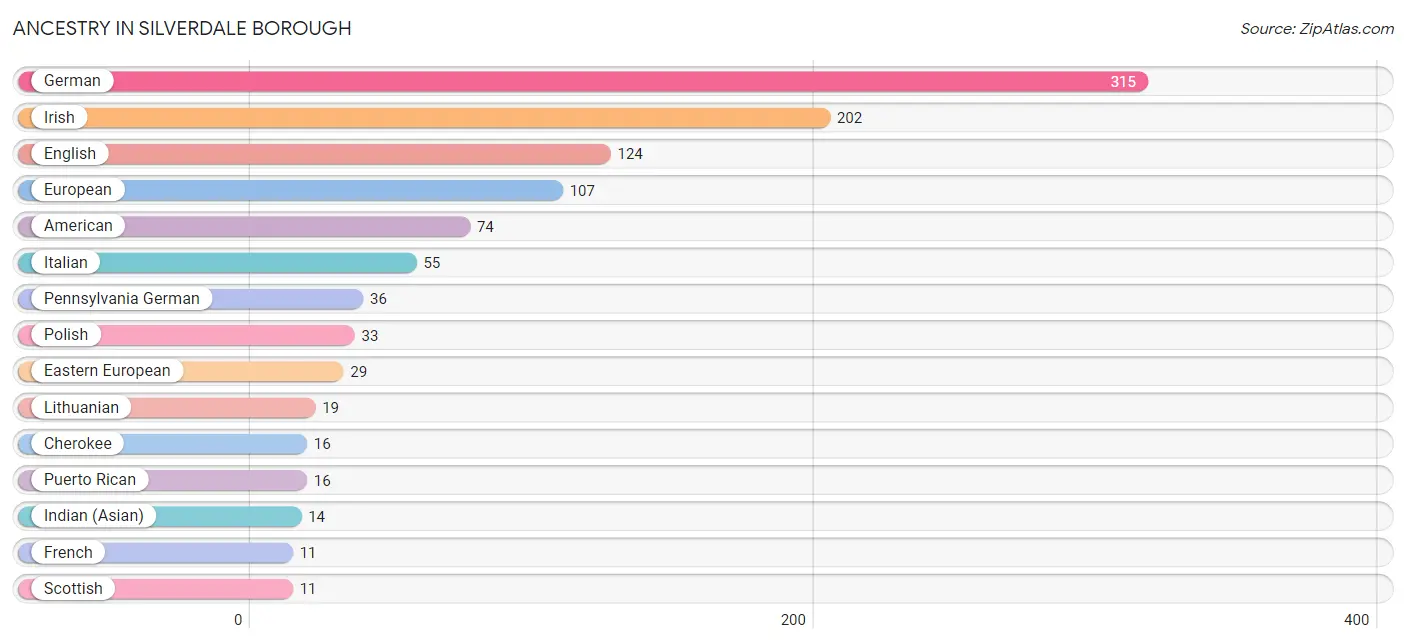
| Ancestry | # Population | % Population |
| American | 74 | 7.2% |
| British | 4 | 0.4% |
| Burmese | 3 | 0.3% |
| Cherokee | 16 | 1.6% |
| Dutch | 4 | 0.4% |
| Eastern European | 29 | 2.8% |
| English | 124 | 12.1% |
| European | 107 | 10.5% |
| French | 11 | 1.1% |
| French Canadian | 4 | 0.4% |
| German | 315 | 30.8% |
| Hungarian | 10 | 1.0% |
| Indian (Asian) | 14 | 1.4% |
| Irish | 202 | 19.8% |
| Italian | 55 | 5.4% |
| Lithuanian | 19 | 1.9% |
| Pennsylvania German | 36 | 3.5% |
| Polish | 33 | 3.2% |
| Puerto Rican | 16 | 1.6% |
| Russian | 2 | 0.2% |
| Scottish | 11 | 1.1% |
| Spaniard | 7 | 0.7% |
| Swiss | 4 | 0.4% |
| Ukrainian | 9 | 0.9% |
| Welsh | 5 | 0.5% | View All 25 Rows |
Immigrants in Silverdale borough
The most numerous immigrant groups reported in Silverdale borough came from Asia (4 | 0.4%), Western Asia (4 | 0.4%), Eastern Europe (1 | 0.1%), Europe (1 | 0.1%), and Russia (1 | 0.1%), together accounting for 1.1% of all Silverdale borough residents.
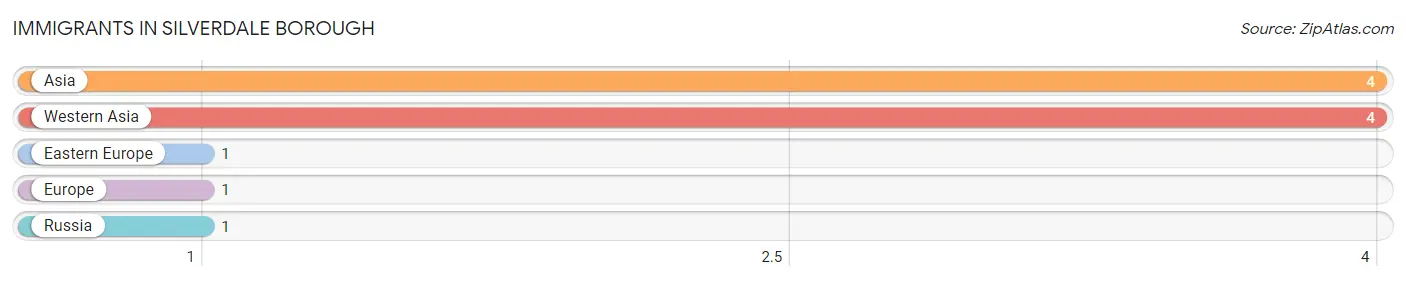
| Immigration Origin | # Population | % Population |
| Asia | 4 | 0.4% |
| Eastern Europe | 1 | 0.1% |
| Europe | 1 | 0.1% |
| Russia | 1 | 0.1% |
| Western Asia | 4 | 0.4% | View All 5 Rows |
Sex and Age in Silverdale borough
Sex and Age in Silverdale borough
The most populous age groups in Silverdale borough are 10 to 14 Years (89 | 17.8%) for men and 55 to 59 Years (85 | 16.2%) for women.
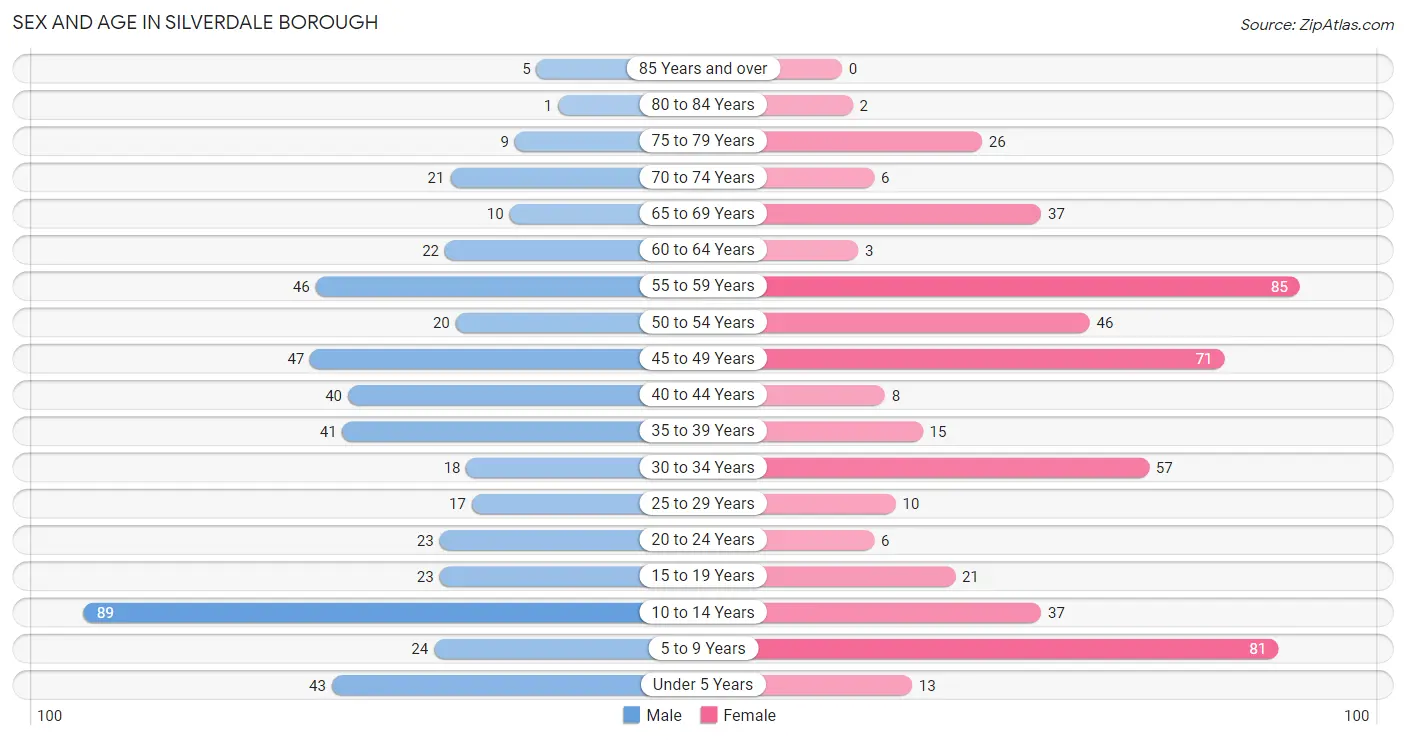
| Age Bracket | Male | Female |
| Under 5 Years | 43 (8.6%) | 13 (2.5%) |
| 5 to 9 Years | 24 (4.8%) | 81 (15.5%) |
| 10 to 14 Years | 89 (17.8%) | 37 (7.1%) |
| 15 to 19 Years | 23 (4.6%) | 21 (4.0%) |
| 20 to 24 Years | 23 (4.6%) | 6 (1.1%) |
| 25 to 29 Years | 17 (3.4%) | 10 (1.9%) |
| 30 to 34 Years | 18 (3.6%) | 57 (10.9%) |
| 35 to 39 Years | 41 (8.2%) | 15 (2.9%) |
| 40 to 44 Years | 40 (8.0%) | 8 (1.5%) |
| 45 to 49 Years | 47 (9.4%) | 71 (13.6%) |
| 50 to 54 Years | 20 (4.0%) | 46 (8.8%) |
| 55 to 59 Years | 46 (9.2%) | 85 (16.2%) |
| 60 to 64 Years | 22 (4.4%) | 3 (0.6%) |
| 65 to 69 Years | 10 (2.0%) | 37 (7.1%) |
| 70 to 74 Years | 21 (4.2%) | 6 (1.1%) |
| 75 to 79 Years | 9 (1.8%) | 26 (5.0%) |
| 80 to 84 Years | 1 (0.2%) | 2 (0.4%) |
| 85 Years and over | 5 (1.0%) | 0 (0.0%) |
| Total | 499 (100.0%) | 524 (100.0%) |
Families and Households in Silverdale borough
Median Family Size in Silverdale borough
The median family size in Silverdale borough is 3.40 persons per family, with single female/mother families (56 | 21.0%) accounting for the largest median family size of 3.63 persons per family. On the other hand, single male/father families (7 | 2.6%) represent the smallest median family size with 2.71 persons per family.
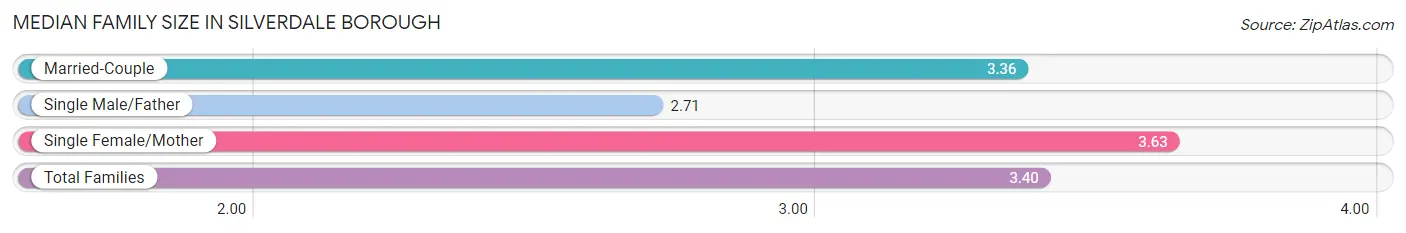
| Family Type | # Families | Family Size |
| Married-Couple | 204 (76.4%) | 3.36 |
| Single Male/Father | 7 (2.6%) | 2.71 |
| Single Female/Mother | 56 (21.0%) | 3.63 |
| Total Families | 267 (100.0%) | 3.40 |
Median Household Size in Silverdale borough
The median household size in Silverdale borough is 2.94 persons per household, with single female/mother households (56 | 16.1%) accounting for the largest median household size of 3.88 persons per household. non-family households (80 | 23.1%) represent the smallest median household size with 1.13 persons per household.
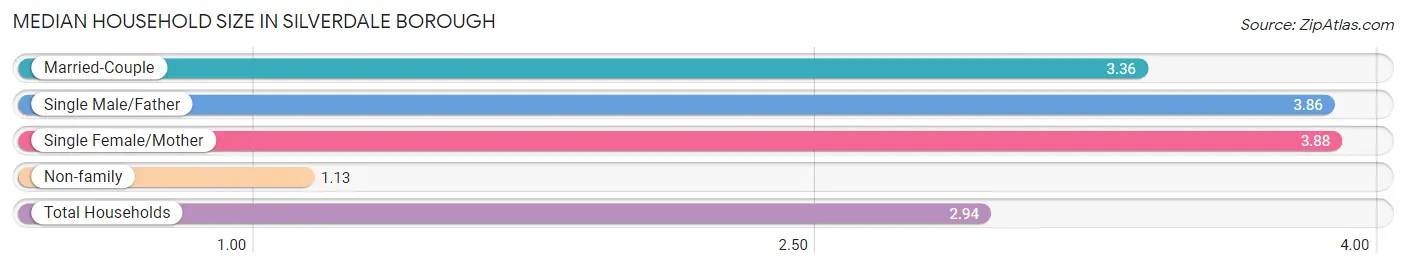
| Household Type | # Households | Household Size |
| Married-Couple | 204 (58.8%) | 3.36 |
| Single Male/Father | 7 (2.0%) | 3.86 |
| Single Female/Mother | 56 (16.1%) | 3.88 |
| Non-family | 80 (23.1%) | 1.13 |
| Total Households | 347 (100.0%) | 2.94 |
Household Size by Marriage Status in Silverdale borough
Out of a total of 347 households in Silverdale borough, 267 (76.9%) are family households, while 80 (23.1%) are nonfamily households. The most numerous type of family households are 2-person households, comprising 85, and the most common type of nonfamily households are 1-person households, comprising 70.
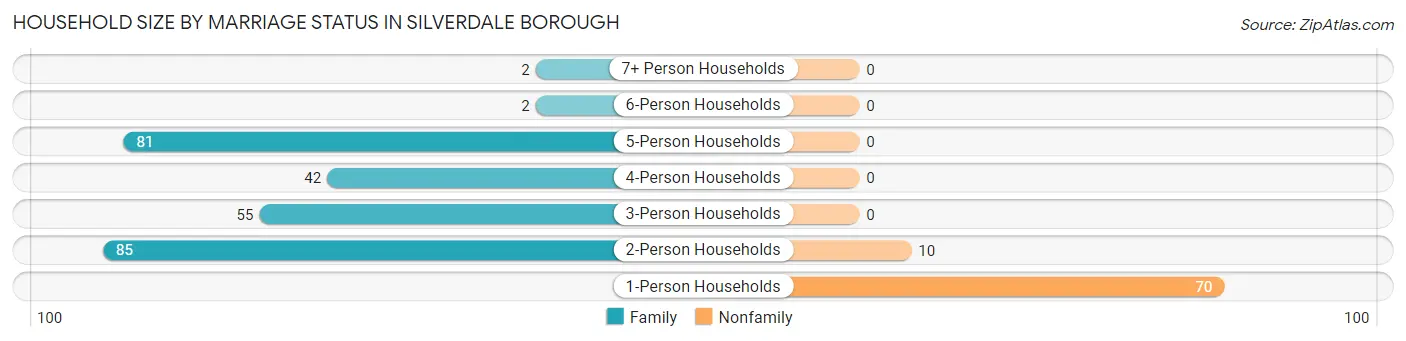
| Household Size | Family Households | Nonfamily Households |
| 1-Person Households | - | 70 (20.2%) |
| 2-Person Households | 85 (24.5%) | 10 (2.9%) |
| 3-Person Households | 55 (15.9%) | 0 (0.0%) |
| 4-Person Households | 42 (12.1%) | 0 (0.0%) |
| 5-Person Households | 81 (23.3%) | 0 (0.0%) |
| 6-Person Households | 2 (0.6%) | 0 (0.0%) |
| 7+ Person Households | 2 (0.6%) | 0 (0.0%) |
| Total | 267 (76.9%) | 80 (23.1%) |
Female Fertility in Silverdale borough
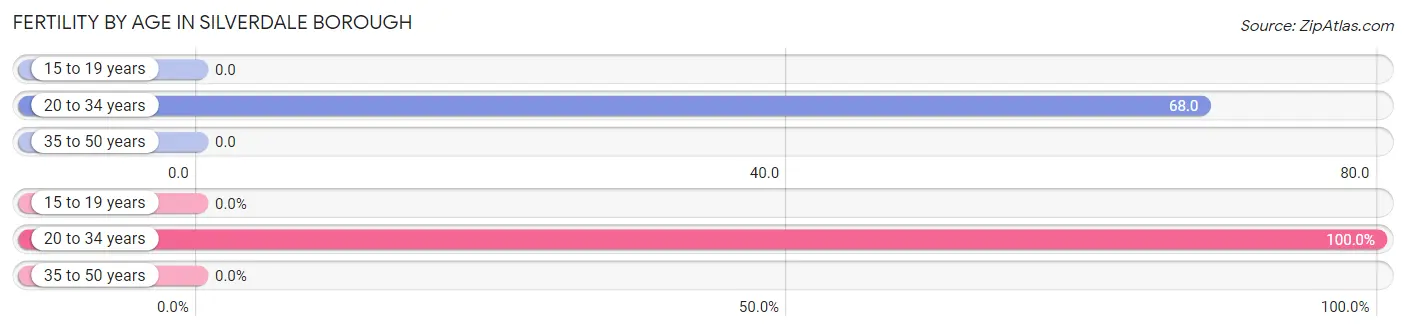
Fertility by Age in Silverdale borough
Average fertility rate in Silverdale borough is 25.0 births per 1,000 women. Women in the age bracket of 20 to 34 years have the highest fertility rate with 68.0 births per 1,000 women. Women in the age bracket of 20 to 34 years acount for 100.0% of all women with births.
| Age Bracket | Women with Births | Births / 1,000 Women |
| 15 to 19 years | 0 (0.0%) | 0.0 |
| 20 to 34 years | 5 (100.0%) | 68.0 |
| 35 to 50 years | 0 (0.0%) | 0.0 |
| Total | 5 (100.0%) | 25.0 |
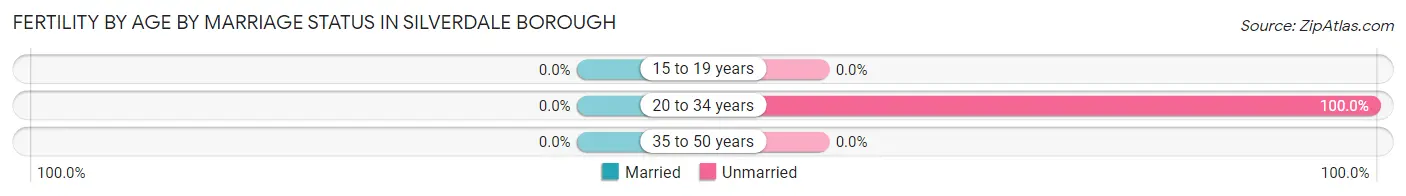
Fertility by Age by Marriage Status in Silverdale borough
| Age Bracket | Married | Unmarried |
| 15 to 19 years | 0 (0.0%) | 0 (0.0%) |
| 20 to 34 years | 0 (0.0%) | 5 (100.0%) |
| 35 to 50 years | 0 (0.0%) | 0 (0.0%) |
| Total | 0 (0.0%) | 5 (100.0%) |
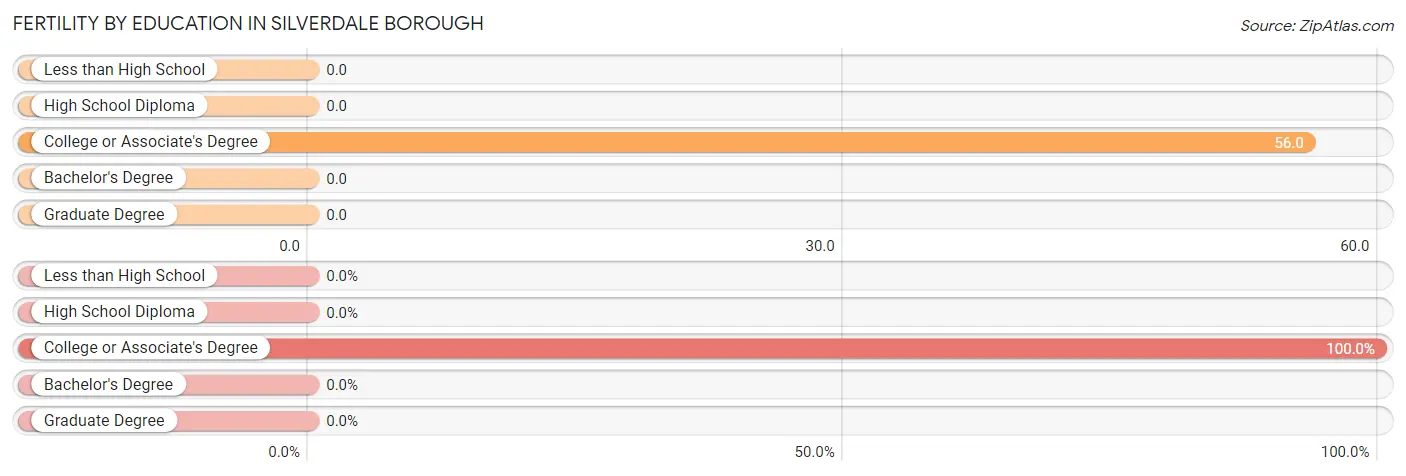
Fertility by Education in Silverdale borough
| Educational Attainment | Women with Births | Births / 1,000 Women |
| Less than High School | 0 (0.0%) | 0.0 |
| High School Diploma | 0 (0.0%) | 0.0 |
| College or Associate's Degree | 5 (100.0%) | 56.0 |
| Bachelor's Degree | 0 (0.0%) | 0.0 |
| Graduate Degree | 0 (0.0%) | 0.0 |
| Total | 5 (100.0%) | 25.0 |
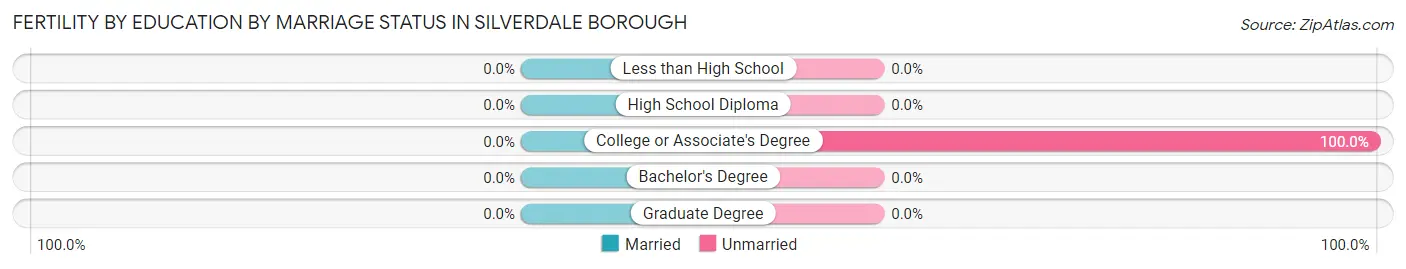
Fertility by Education by Marriage Status in Silverdale borough
| Educational Attainment | Married | Unmarried |
| Less than High School | 0 (0.0%) | 0 (0.0%) |
| High School Diploma | 0 (0.0%) | 0 (0.0%) |
| College or Associate's Degree | 0 (0.0%) | 5 (100.0%) |
| Bachelor's Degree | 0 (0.0%) | 0 (0.0%) |
| Graduate Degree | 0 (0.0%) | 0 (0.0%) |
| Total | 0 (0.0%) | 5 (100.0%) |
Employment Characteristics in Silverdale borough
Employment by Class of Employer in Silverdale borough
Among the 548 employed individuals in Silverdale borough, private company employees (401 | 73.2%), local government employees (70 | 12.8%), and self-employed (not incorporated) (26 | 4.7%) make up the most common classes of employment.
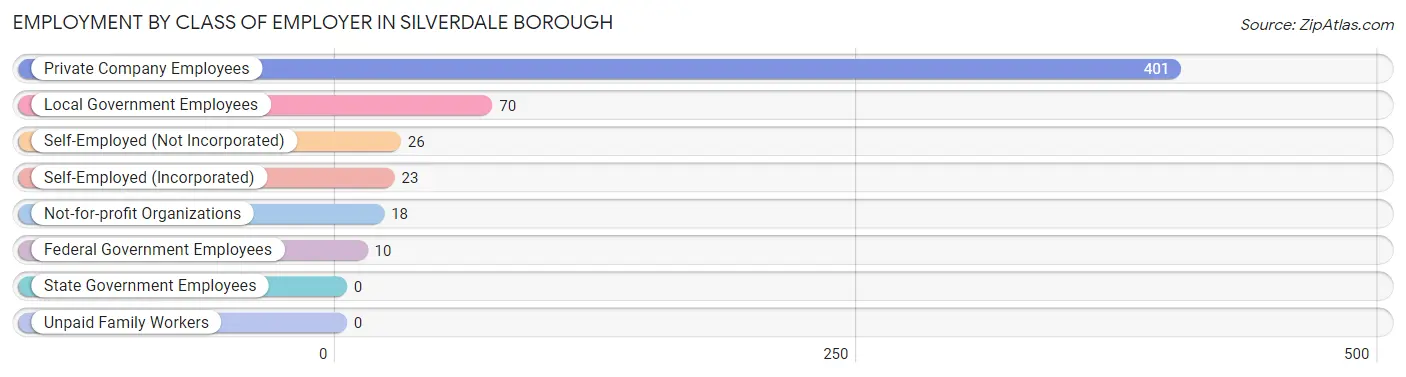
| Employer Class | # Employees | % Employees |
| Private Company Employees | 401 | 73.2% |
| Self-Employed (Incorporated) | 23 | 4.2% |
| Self-Employed (Not Incorporated) | 26 | 4.7% |
| Not-for-profit Organizations | 18 | 3.3% |
| Local Government Employees | 70 | 12.8% |
| State Government Employees | 0 | 0.0% |
| Federal Government Employees | 10 | 1.8% |
| Unpaid Family Workers | 0 | 0.0% |
| Total | 548 | 100.0% |
Employment Status by Age in Silverdale borough
According to the labor force statistics for Silverdale borough, out of the total population over 16 years of age (729), 77.6% or 566 individuals are in the labor force, with 2.0% or 11 of them unemployed. The age group with the highest labor force participation rate is 60 to 64 years, with 100.0% or 25 individuals in the labor force. Within the labor force, the 30 to 34 years age range has the highest percentage of unemployed individuals, with 10.6% or 7 of them being unemployed.
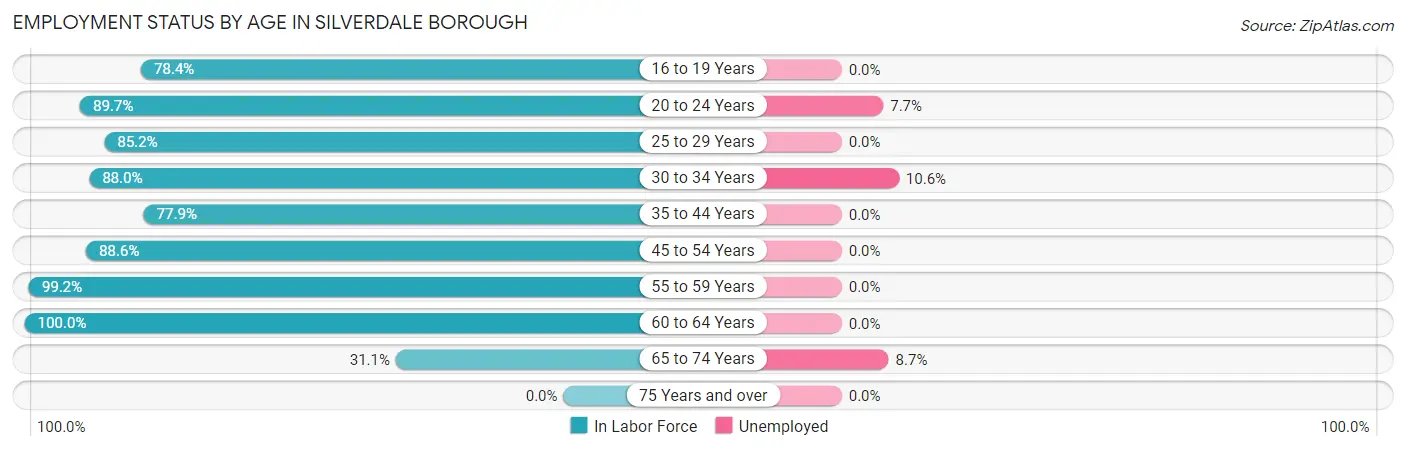
| Age Bracket | In Labor Force | Unemployed |
| 16 to 19 Years | 29 (78.4%) | 0 (0.0%) |
| 20 to 24 Years | 26 (89.7%) | 2 (7.7%) |
| 25 to 29 Years | 23 (85.2%) | 0 (0.0%) |
| 30 to 34 Years | 66 (88.0%) | 7 (10.6%) |
| 35 to 44 Years | 81 (77.9%) | 0 (0.0%) |
| 45 to 54 Years | 163 (88.6%) | 0 (0.0%) |
| 55 to 59 Years | 130 (99.2%) | 0 (0.0%) |
| 60 to 64 Years | 25 (100.0%) | 0 (0.0%) |
| 65 to 74 Years | 23 (31.1%) | 2 (8.7%) |
| 75 Years and over | 0 (0.0%) | 0 (0.0%) |
| Total | 566 (77.6%) | 11 (2.0%) |
Employment Status by Educational Attainment in Silverdale borough
According to labor force statistics for Silverdale borough, 89.4% of individuals (488) out of the total population between 25 and 64 years of age (546) are in the labor force, with 1.4% or 7 of them being unemployed. The group with the highest labor force participation rate are those with the educational attainment of bachelor's degree or higher, with 97.2% or 140 individuals in the labor force. Within the labor force, individuals with high school diploma education have the highest percentage of unemployment, with 3.6% or 6 of them being unemployed.
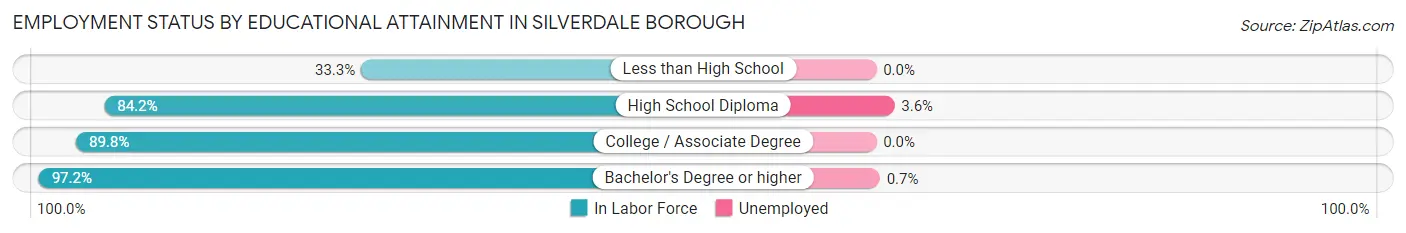
| Educational Attainment | In Labor Force | Unemployed |
| Less than High School | 1 (33.3%) | 0 (0.0%) |
| High School Diploma | 171 (84.2%) | 7 (3.6%) |
| College / Associate Degree | 176 (89.8%) | 0 (0.0%) |
| Bachelor's Degree or higher | 140 (97.2%) | 1 (0.7%) |
| Total | 488 (89.4%) | 8 (1.4%) |
Employment Occupations by Sex in Silverdale borough
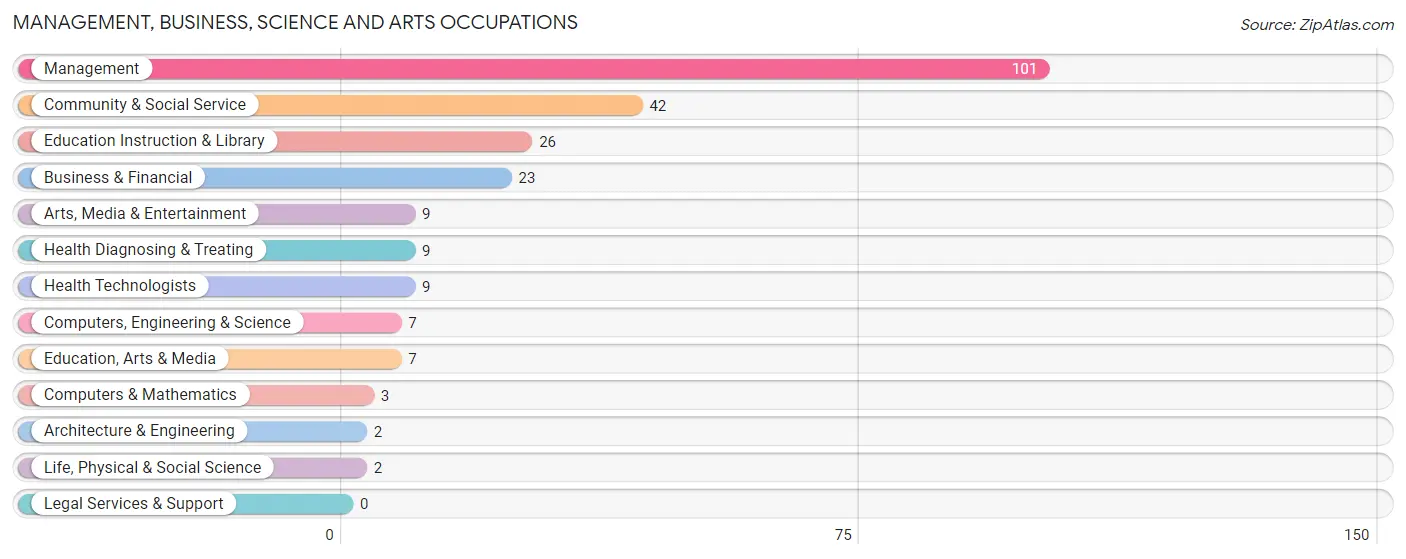
Management, Business, Science and Arts Occupations
The most common Management, Business, Science and Arts occupations in Silverdale borough are Management (101 | 18.4%), Community & Social Service (42 | 7.6%), Education Instruction & Library (26 | 4.7%), Business & Financial (23 | 4.2%), and Arts, Media & Entertainment (9 | 1.6%).
Management, Business, Science and Arts Occupations by Sex
Within the Management, Business, Science and Arts occupations in Silverdale borough, the most male-oriented occupations are Computers & Mathematics (100.0%), Architecture & Engineering (100.0%), and Management (79.2%), while the most female-oriented occupations are Life, Physical & Social Science (100.0%), Health Diagnosing & Treating (66.7%), and Health Technologists (66.7%).
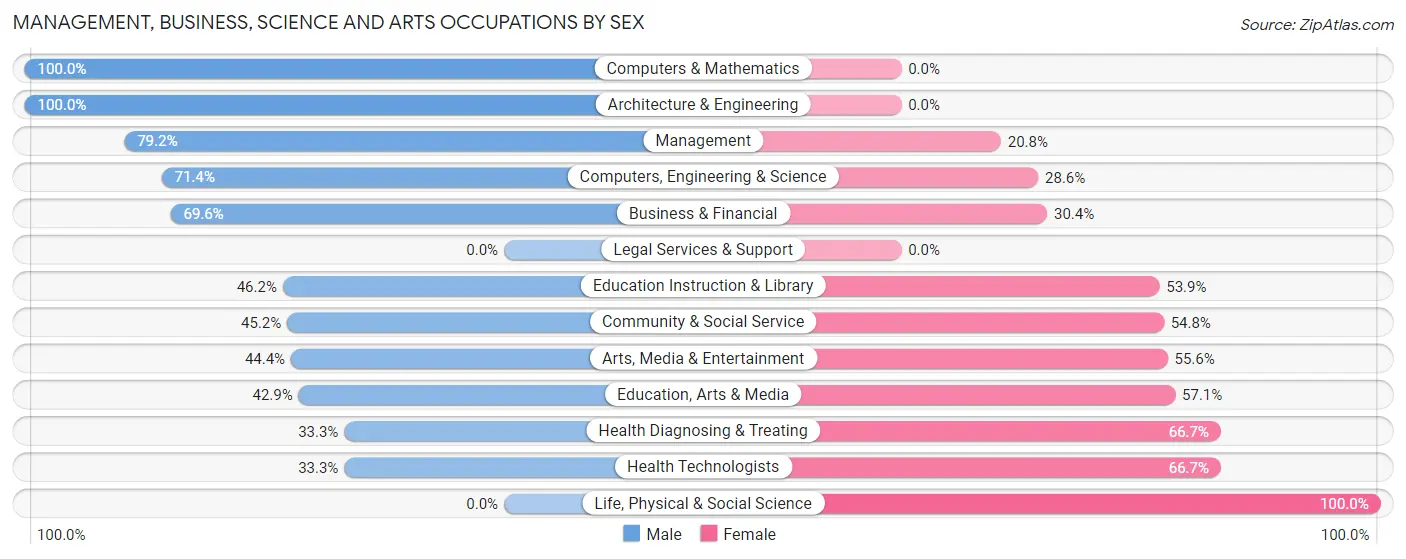
| Occupation | Male | Female |
| Management | 80 (79.2%) | 21 (20.8%) |
| Business & Financial | 16 (69.6%) | 7 (30.4%) |
| Computers, Engineering & Science | 5 (71.4%) | 2 (28.6%) |
| Computers & Mathematics | 3 (100.0%) | 0 (0.0%) |
| Architecture & Engineering | 2 (100.0%) | 0 (0.0%) |
| Life, Physical & Social Science | 0 (0.0%) | 2 (100.0%) |
| Community & Social Service | 19 (45.2%) | 23 (54.8%) |
| Education, Arts & Media | 3 (42.9%) | 4 (57.1%) |
| Legal Services & Support | 0 (0.0%) | 0 (0.0%) |
| Education Instruction & Library | 12 (46.2%) | 14 (53.8%) |
| Arts, Media & Entertainment | 4 (44.4%) | 5 (55.6%) |
| Health Diagnosing & Treating | 3 (33.3%) | 6 (66.7%) |
| Health Technologists | 3 (33.3%) | 6 (66.7%) |
| Total (Category) | 123 (67.6%) | 59 (32.4%) |
| Total (Overall) | 277 (50.4%) | 273 (49.6%) |
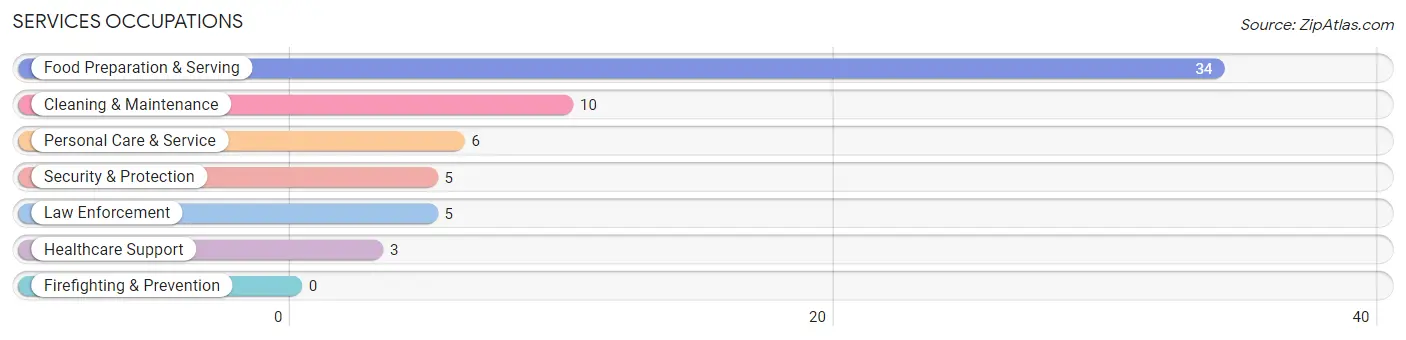
Services Occupations
The most common Services occupations in Silverdale borough are Food Preparation & Serving (34 | 6.2%), Cleaning & Maintenance (10 | 1.8%), Personal Care & Service (6 | 1.1%), Security & Protection (5 | 0.9%), and Law Enforcement (5 | 0.9%).
Services Occupations by Sex
Within the Services occupations in Silverdale borough, the most male-oriented occupations are Security & Protection (100.0%), Law Enforcement (100.0%), and Cleaning & Maintenance (80.0%), while the most female-oriented occupations are Healthcare Support (100.0%), Personal Care & Service (100.0%), and Food Preparation & Serving (50.0%).
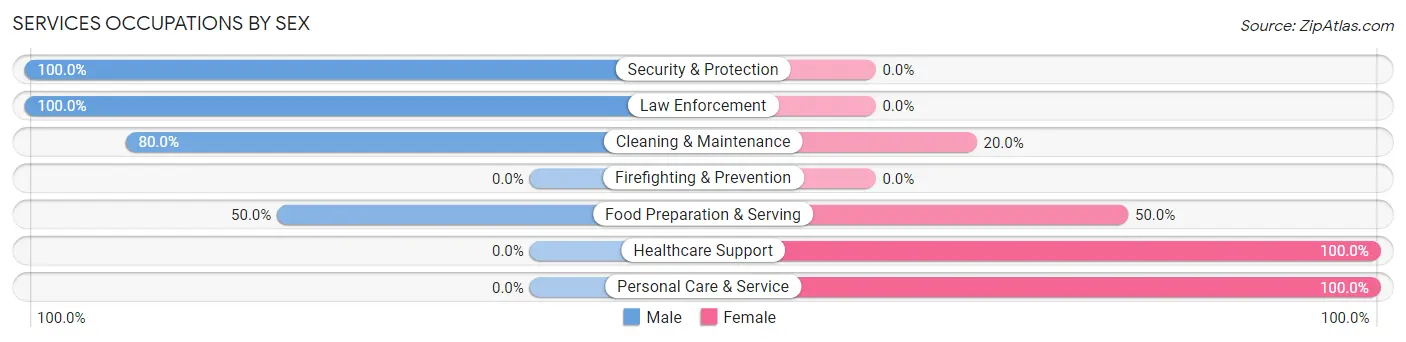
| Occupation | Male | Female |
| Healthcare Support | 0 (0.0%) | 3 (100.0%) |
| Security & Protection | 5 (100.0%) | 0 (0.0%) |
| Firefighting & Prevention | 0 (0.0%) | 0 (0.0%) |
| Law Enforcement | 5 (100.0%) | 0 (0.0%) |
| Food Preparation & Serving | 17 (50.0%) | 17 (50.0%) |
| Cleaning & Maintenance | 8 (80.0%) | 2 (20.0%) |
| Personal Care & Service | 0 (0.0%) | 6 (100.0%) |
| Total (Category) | 30 (51.7%) | 28 (48.3%) |
| Total (Overall) | 277 (50.4%) | 273 (49.6%) |
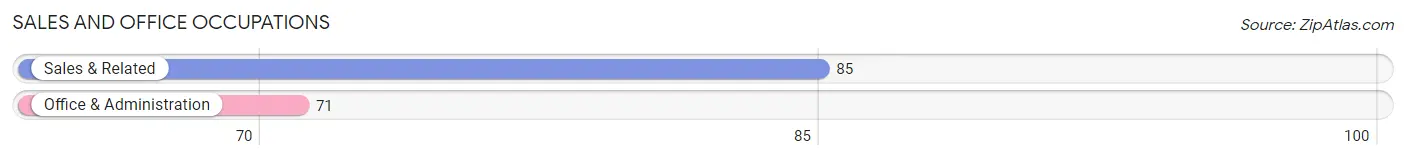
Sales and Office Occupations
The most common Sales and Office occupations in Silverdale borough are Sales & Related (85 | 15.4%), and Office & Administration (71 | 12.9%).
Sales and Office Occupations by Sex
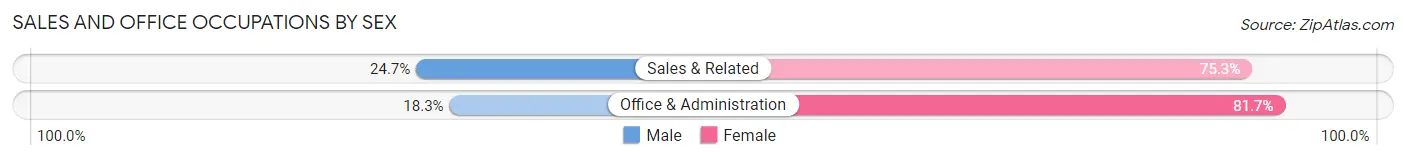
| Occupation | Male | Female |
| Sales & Related | 21 (24.7%) | 64 (75.3%) |
| Office & Administration | 13 (18.3%) | 58 (81.7%) |
| Total (Category) | 34 (21.8%) | 122 (78.2%) |
| Total (Overall) | 277 (50.4%) | 273 (49.6%) |
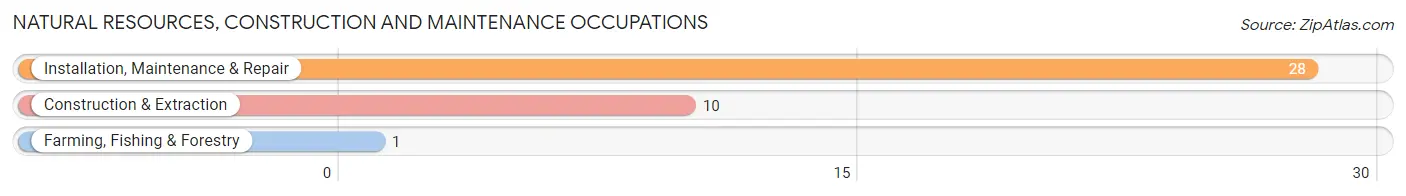
Natural Resources, Construction and Maintenance Occupations
The most common Natural Resources, Construction and Maintenance occupations in Silverdale borough are Installation, Maintenance & Repair (28 | 5.1%), Construction & Extraction (10 | 1.8%), and Farming, Fishing & Forestry (1 | 0.2%).
Natural Resources, Construction and Maintenance Occupations by Sex
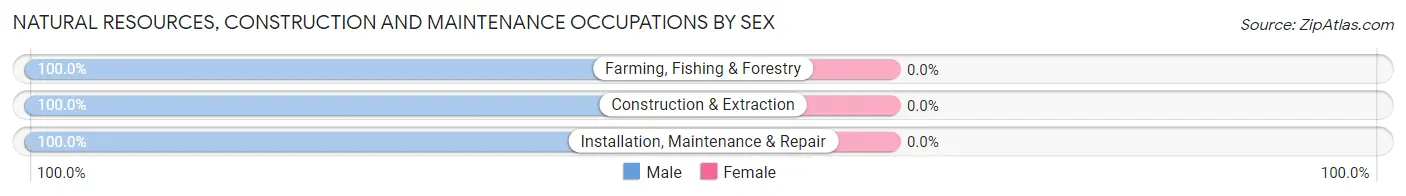
| Occupation | Male | Female |
| Farming, Fishing & Forestry | 1 (100.0%) | 0 (0.0%) |
| Construction & Extraction | 10 (100.0%) | 0 (0.0%) |
| Installation, Maintenance & Repair | 28 (100.0%) | 0 (0.0%) |
| Total (Category) | 39 (100.0%) | 0 (0.0%) |
| Total (Overall) | 277 (50.4%) | 273 (49.6%) |
Production, Transportation and Moving Occupations
The most common Production, Transportation and Moving occupations in Silverdale borough are Production (55 | 10.0%), Material Moving (44 | 8.0%), and Transportation (16 | 2.9%).
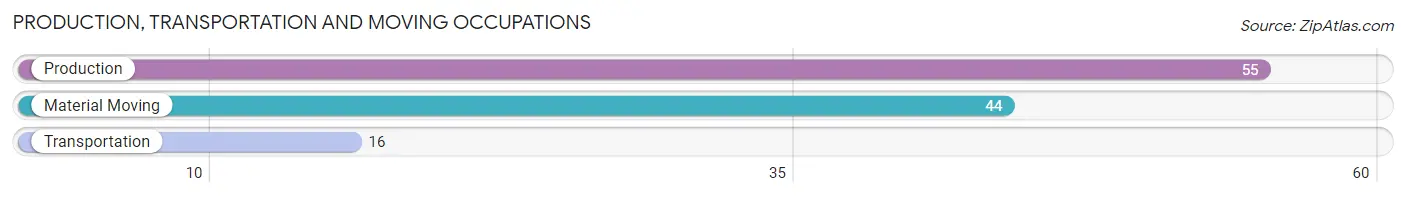
Production, Transportation and Moving Occupations by Sex
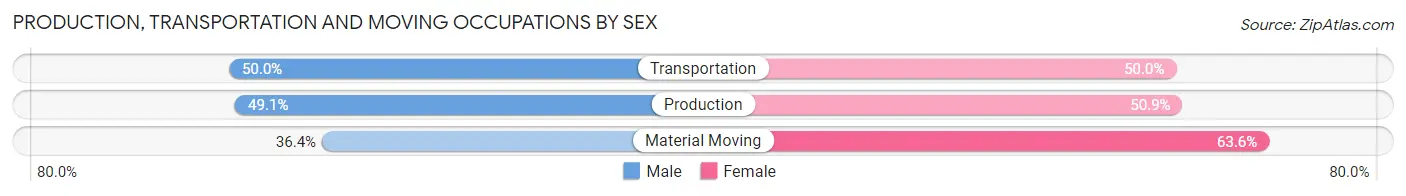
| Occupation | Male | Female |
| Production | 27 (49.1%) | 28 (50.9%) |
| Transportation | 8 (50.0%) | 8 (50.0%) |
| Material Moving | 16 (36.4%) | 28 (63.6%) |
| Total (Category) | 51 (44.4%) | 64 (55.6%) |
| Total (Overall) | 277 (50.4%) | 273 (49.6%) |
Employment Industries by Sex in Silverdale borough
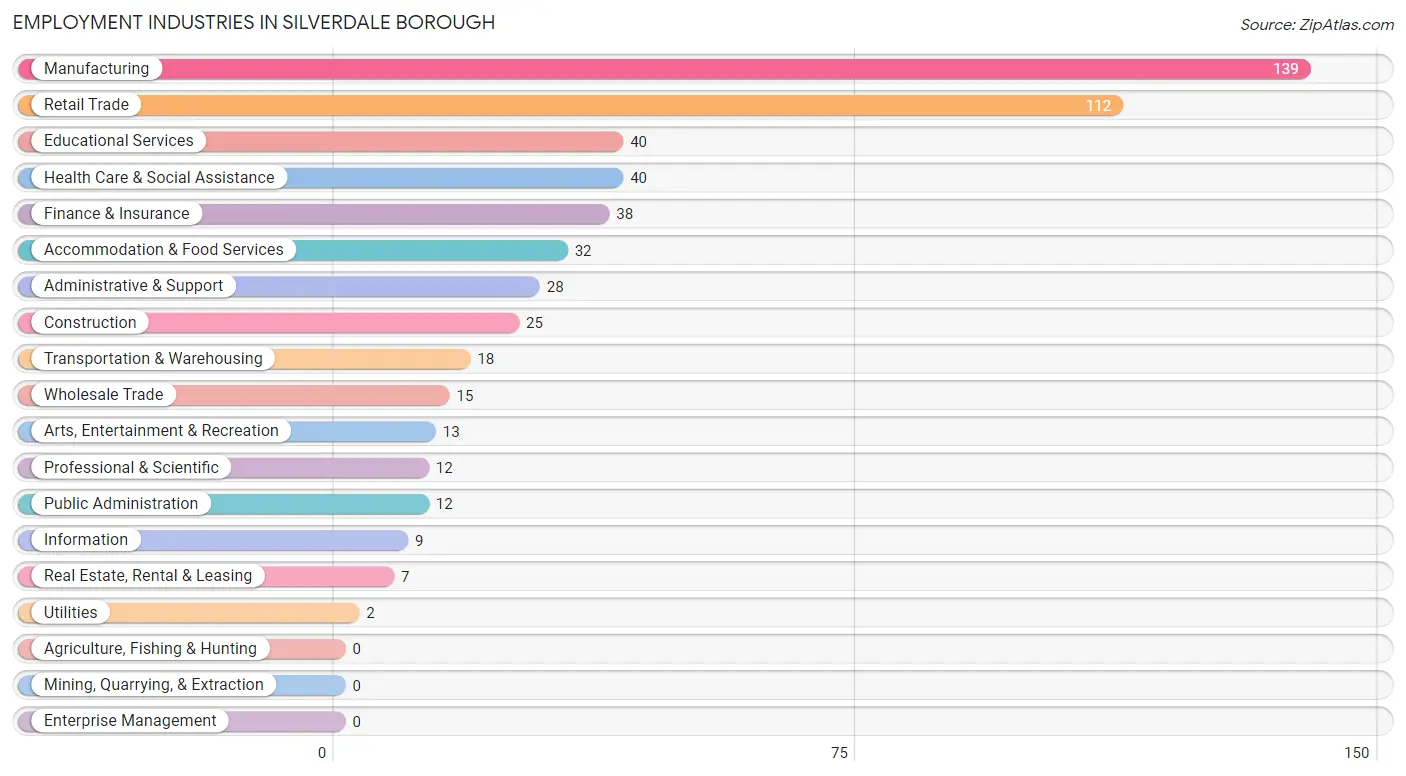
Employment Industries in Silverdale borough
The major employment industries in Silverdale borough include Manufacturing (139 | 25.3%), Retail Trade (112 | 20.4%), Educational Services (40 | 7.3%), Health Care & Social Assistance (40 | 7.3%), and Finance & Insurance (38 | 6.9%).
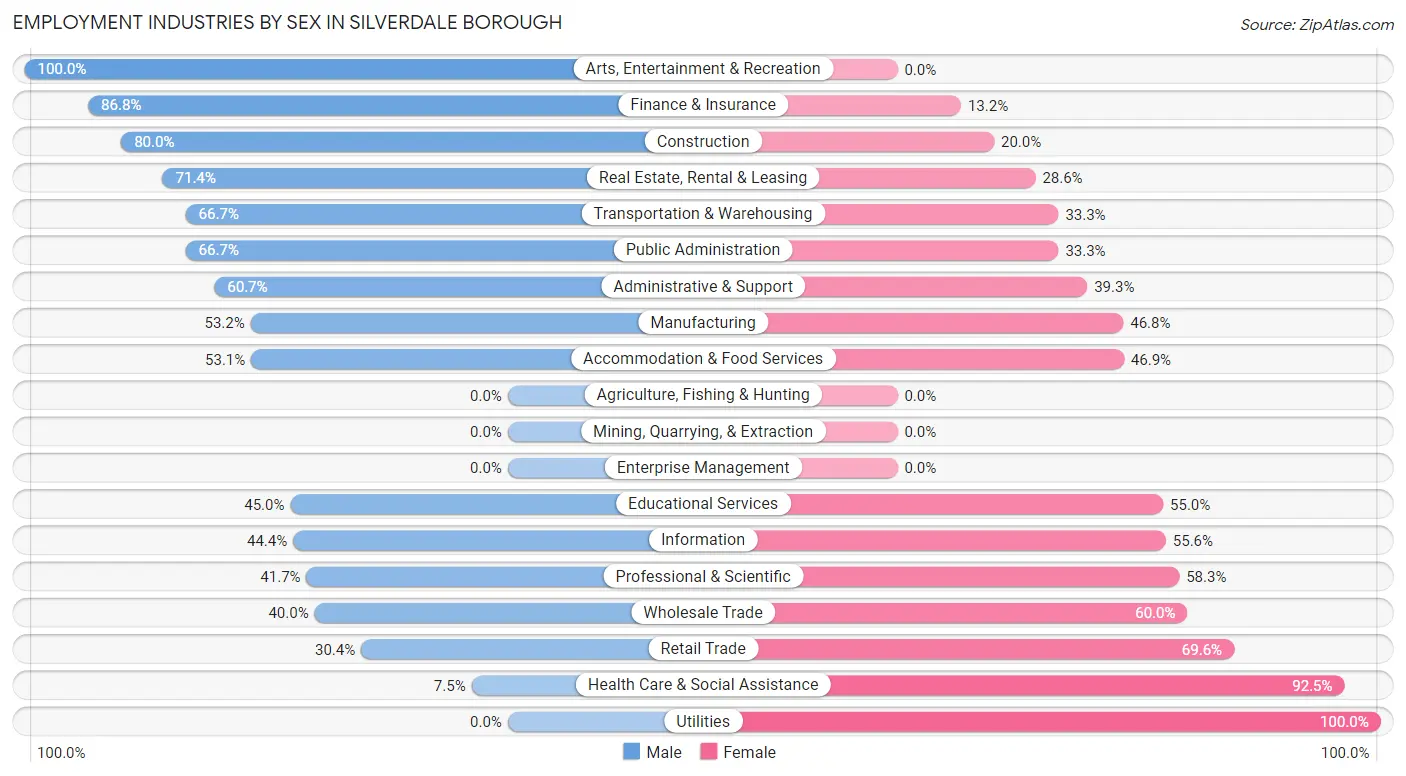
Employment Industries by Sex in Silverdale borough
The Silverdale borough industries that see more men than women are Arts, Entertainment & Recreation (100.0%), Finance & Insurance (86.8%), and Construction (80.0%), whereas the industries that tend to have a higher number of women are Utilities (100.0%), Health Care & Social Assistance (92.5%), and Retail Trade (69.6%).
| Industry | Male | Female |
| Agriculture, Fishing & Hunting | 0 (0.0%) | 0 (0.0%) |
| Mining, Quarrying, & Extraction | 0 (0.0%) | 0 (0.0%) |
| Construction | 20 (80.0%) | 5 (20.0%) |
| Manufacturing | 74 (53.2%) | 65 (46.8%) |
| Wholesale Trade | 6 (40.0%) | 9 (60.0%) |
| Retail Trade | 34 (30.4%) | 78 (69.6%) |
| Transportation & Warehousing | 12 (66.7%) | 6 (33.3%) |
| Utilities | 0 (0.0%) | 2 (100.0%) |
| Information | 4 (44.4%) | 5 (55.6%) |
| Finance & Insurance | 33 (86.8%) | 5 (13.2%) |
| Real Estate, Rental & Leasing | 5 (71.4%) | 2 (28.6%) |
| Professional & Scientific | 5 (41.7%) | 7 (58.3%) |
| Enterprise Management | 0 (0.0%) | 0 (0.0%) |
| Administrative & Support | 17 (60.7%) | 11 (39.3%) |
| Educational Services | 18 (45.0%) | 22 (55.0%) |
| Health Care & Social Assistance | 3 (7.5%) | 37 (92.5%) |
| Arts, Entertainment & Recreation | 13 (100.0%) | 0 (0.0%) |
| Accommodation & Food Services | 17 (53.1%) | 15 (46.9%) |
| Public Administration | 8 (66.7%) | 4 (33.3%) |
| Total | 277 (50.4%) | 273 (49.6%) |
Education in Silverdale borough
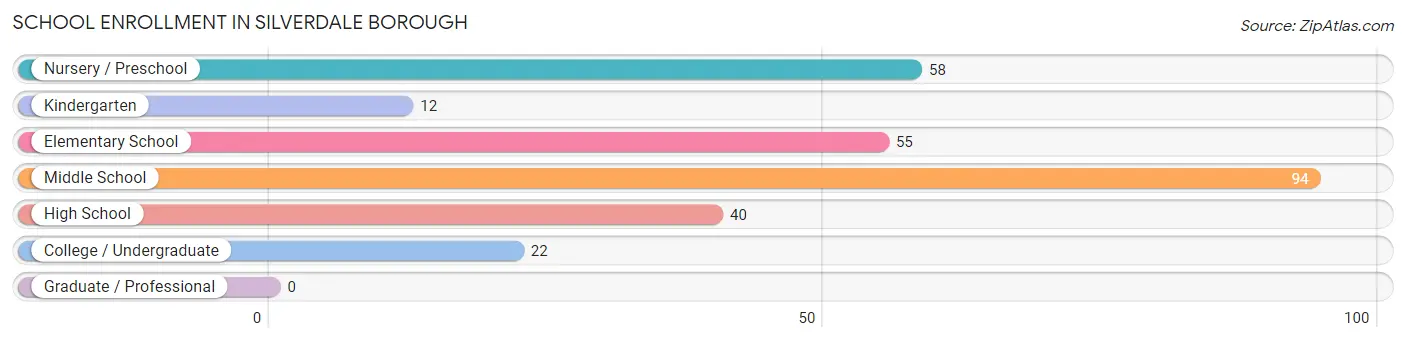
School Enrollment in Silverdale borough
The most common levels of schooling among the 281 students in Silverdale borough are middle school (94 | 33.5%), nursery / preschool (58 | 20.6%), and elementary school (55 | 19.6%).
| School Level | # Students | % Students |
| Nursery / Preschool | 58 | 20.6% |
| Kindergarten | 12 | 4.3% |
| Elementary School | 55 | 19.6% |
| Middle School | 94 | 33.5% |
| High School | 40 | 14.2% |
| College / Undergraduate | 22 | 7.8% |
| Graduate / Professional | 0 | 0.0% |
| Total | 281 | 100.0% |
School Enrollment by Age by Funding Source in Silverdale borough
Out of a total of 281 students who are enrolled in schools in Silverdale borough, 29 (10.3%) attend a private institution, while the remaining 252 (89.7%) are enrolled in public schools. The age group of 3 to 4 year olds has the highest likelihood of being enrolled in private schools, with 12 (66.7% in the age bracket) enrolled. Conversely, the age group of 10 to 14 year olds has the lowest likelihood of being enrolled in a private school, with 101 (100.0% in the age bracket) attending a public institution.
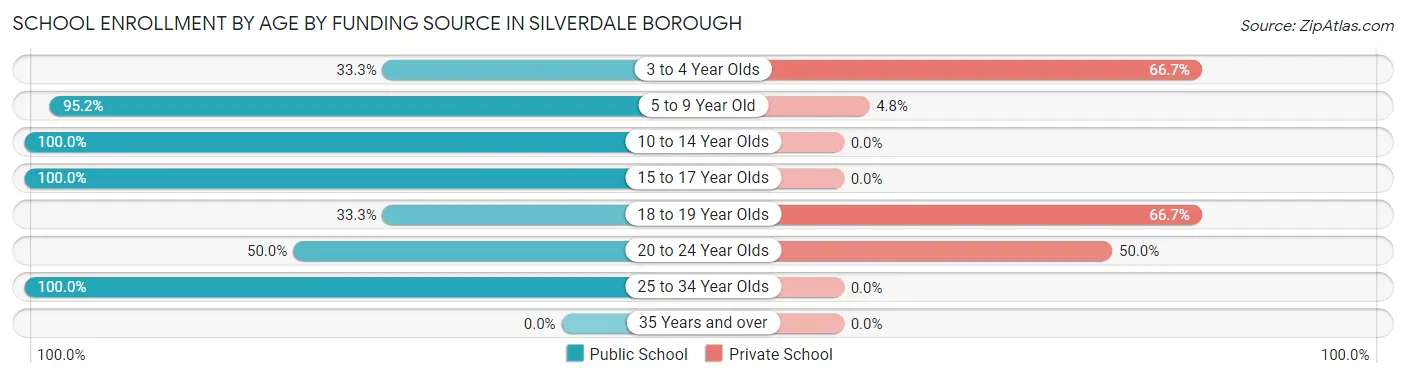
| Age Bracket | Public School | Private School |
| 3 to 4 Year Olds | 6 (33.3%) | 12 (66.7%) |
| 5 to 9 Year Old | 100 (95.2%) | 5 (4.8%) |
| 10 to 14 Year Olds | 101 (100.0%) | 0 (0.0%) |
| 15 to 17 Year Olds | 32 (100.0%) | 0 (0.0%) |
| 18 to 19 Year Olds | 3 (33.3%) | 6 (66.7%) |
| 20 to 24 Year Olds | 6 (50.0%) | 6 (50.0%) |
| 25 to 34 Year Olds | 4 (100.0%) | 0 (0.0%) |
| 35 Years and over | 0 (0.0%) | 0 (0.0%) |
| Total | 252 (89.7%) | 29 (10.3%) |
Educational Attainment by Field of Study in Silverdale borough
Business (34 | 18.2%), science & technology (31 | 16.6%), social sciences (30 | 16.0%), arts & humanities (28 | 15.0%), and education (26 | 13.9%) are the most common fields of study among 187 individuals in Silverdale borough who have obtained a bachelor's degree or higher.
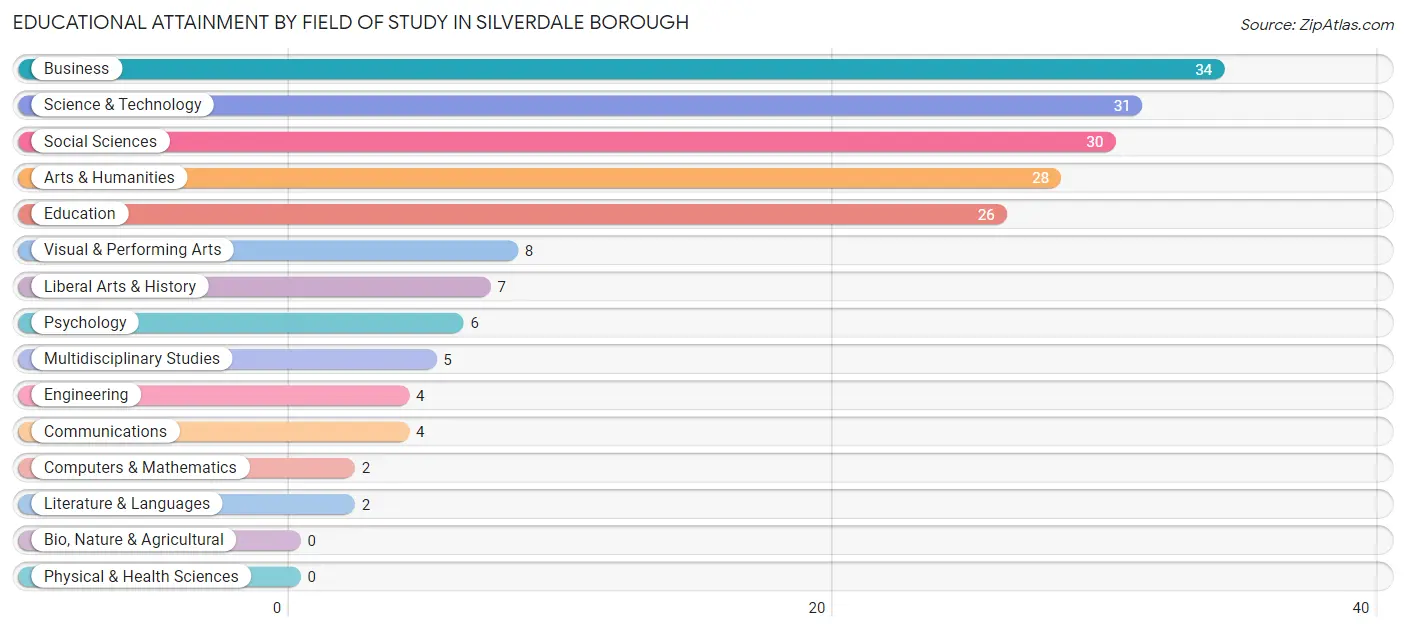
| Field of Study | # Graduates | % Graduates |
| Computers & Mathematics | 2 | 1.1% |
| Bio, Nature & Agricultural | 0 | 0.0% |
| Physical & Health Sciences | 0 | 0.0% |
| Psychology | 6 | 3.2% |
| Social Sciences | 30 | 16.0% |
| Engineering | 4 | 2.1% |
| Multidisciplinary Studies | 5 | 2.7% |
| Science & Technology | 31 | 16.6% |
| Business | 34 | 18.2% |
| Education | 26 | 13.9% |
| Literature & Languages | 2 | 1.1% |
| Liberal Arts & History | 7 | 3.7% |
| Visual & Performing Arts | 8 | 4.3% |
| Communications | 4 | 2.1% |
| Arts & Humanities | 28 | 15.0% |
| Total | 187 | 100.0% |
Transportation & Commute in Silverdale borough
Vehicle Availability by Sex in Silverdale borough
The most prevalent vehicle ownership categories in Silverdale borough are males with 2 vehicles (105, accounting for 37.8%) and females with 2 vehicles (168, making up 38.9%).
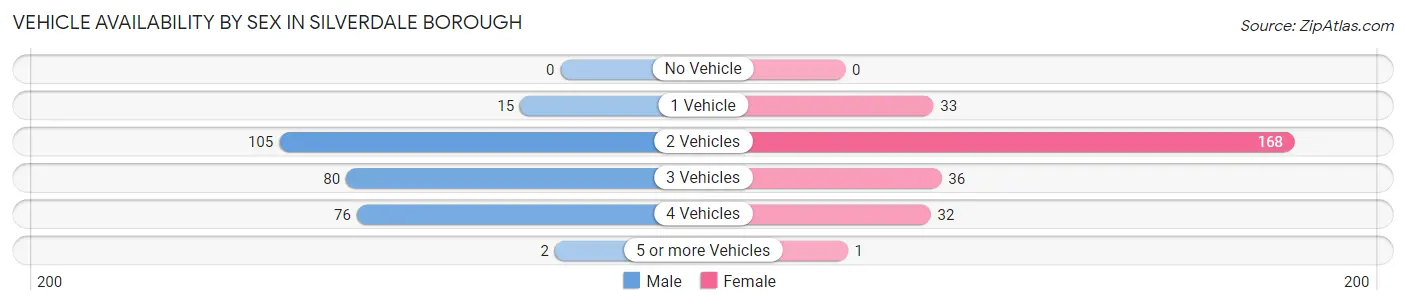
| Vehicles Available | Male | Female |
| No Vehicle | 0 (0.0%) | 0 (0.0%) |
| 1 Vehicle | 15 (5.4%) | 33 (12.2%) |
| 2 Vehicles | 105 (37.8%) | 168 (62.2%) |
| 3 Vehicles | 80 (28.8%) | 36 (13.3%) |
| 4 Vehicles | 76 (27.3%) | 32 (11.8%) |
| 5 or more Vehicles | 2 (0.7%) | 1 (0.4%) |
| Total | 278 (100.0%) | 270 (100.0%) |
Commute Time in Silverdale borough
The most frequently occuring commute durations in Silverdale borough are 20 to 24 minutes (132 commuters, 25.8%), 5 to 9 minutes (90 commuters, 17.6%), and 25 to 29 minutes (67 commuters, 13.1%).
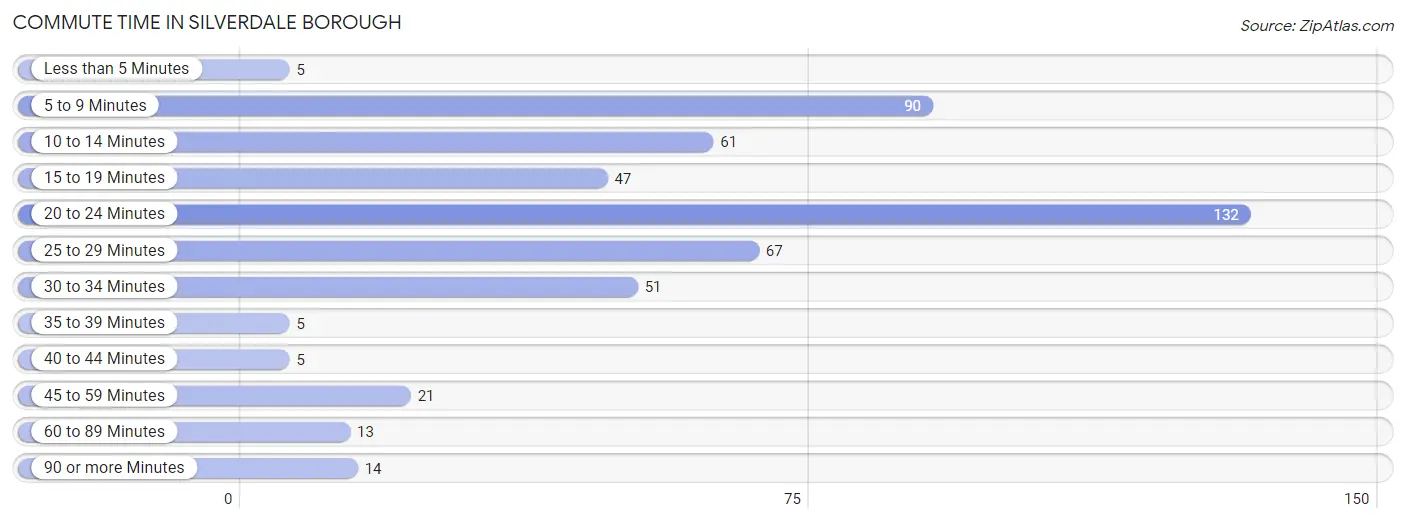
| Commute Time | # Commuters | % Commuters |
| Less than 5 Minutes | 5 | 1.0% |
| 5 to 9 Minutes | 90 | 17.6% |
| 10 to 14 Minutes | 61 | 11.9% |
| 15 to 19 Minutes | 47 | 9.2% |
| 20 to 24 Minutes | 132 | 25.8% |
| 25 to 29 Minutes | 67 | 13.1% |
| 30 to 34 Minutes | 51 | 10.0% |
| 35 to 39 Minutes | 5 | 1.0% |
| 40 to 44 Minutes | 5 | 1.0% |
| 45 to 59 Minutes | 21 | 4.1% |
| 60 to 89 Minutes | 13 | 2.5% |
| 90 or more Minutes | 14 | 2.7% |
Commute Time by Sex in Silverdale borough
The most common commute times in Silverdale borough are 20 to 24 minutes (77 commuters, 28.4%) for males and 5 to 9 minutes (73 commuters, 30.4%) for females.
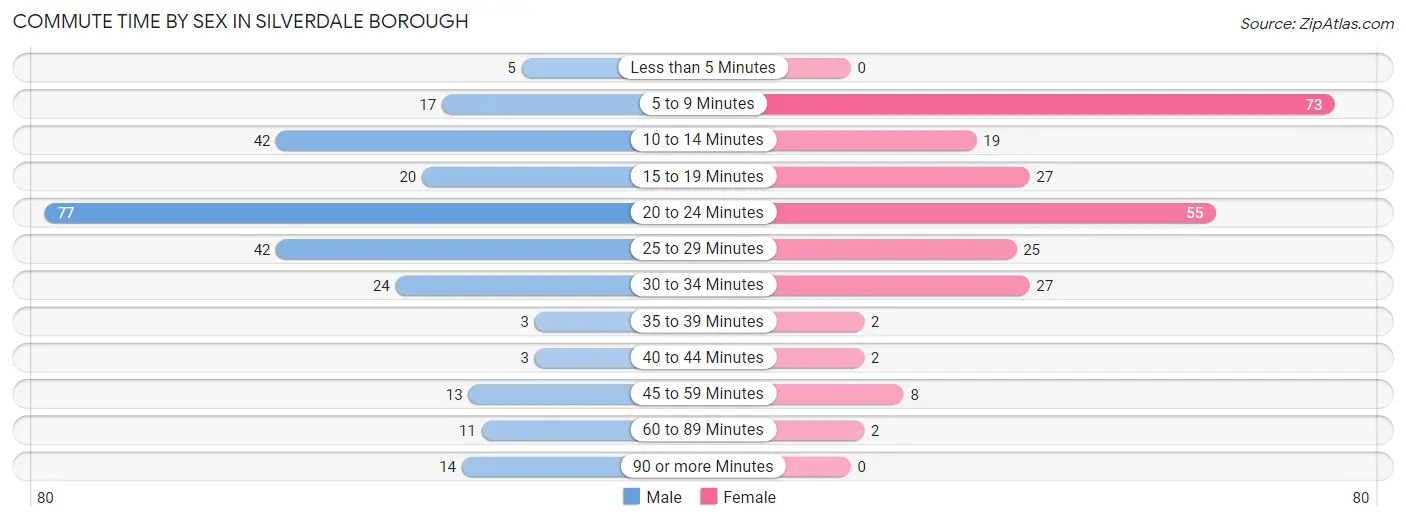
| Commute Time | Male | Female |
| Less than 5 Minutes | 5 (1.8%) | 0 (0.0%) |
| 5 to 9 Minutes | 17 (6.3%) | 73 (30.4%) |
| 10 to 14 Minutes | 42 (15.5%) | 19 (7.9%) |
| 15 to 19 Minutes | 20 (7.4%) | 27 (11.3%) |
| 20 to 24 Minutes | 77 (28.4%) | 55 (22.9%) |
| 25 to 29 Minutes | 42 (15.5%) | 25 (10.4%) |
| 30 to 34 Minutes | 24 (8.9%) | 27 (11.3%) |
| 35 to 39 Minutes | 3 (1.1%) | 2 (0.8%) |
| 40 to 44 Minutes | 3 (1.1%) | 2 (0.8%) |
| 45 to 59 Minutes | 13 (4.8%) | 8 (3.3%) |
| 60 to 89 Minutes | 11 (4.1%) | 2 (0.8%) |
| 90 or more Minutes | 14 (5.2%) | 0 (0.0%) |
Time of Departure to Work by Sex in Silverdale borough
The most frequent times of departure to work in Silverdale borough are 7:00 AM to 7:29 AM (70, 25.8%) for males and 7:00 AM to 7:29 AM (58, 24.2%) for females.

| Time of Departure | Male | Female |
| 12:00 AM to 4:59 AM | 10 (3.7%) | 8 (3.3%) |
| 5:00 AM to 5:29 AM | 17 (6.3%) | 5 (2.1%) |
| 5:30 AM to 5:59 AM | 12 (4.4%) | 0 (0.0%) |
| 6:00 AM to 6:29 AM | 24 (8.9%) | 20 (8.3%) |
| 6:30 AM to 6:59 AM | 14 (5.2%) | 21 (8.7%) |
| 7:00 AM to 7:29 AM | 70 (25.8%) | 58 (24.2%) |
| 7:30 AM to 7:59 AM | 68 (25.1%) | 7 (2.9%) |
| 8:00 AM to 8:29 AM | 9 (3.3%) | 37 (15.4%) |
| 8:30 AM to 8:59 AM | 0 (0.0%) | 13 (5.4%) |
| 9:00 AM to 9:59 AM | 14 (5.2%) | 0 (0.0%) |
| 10:00 AM to 10:59 AM | 17 (6.3%) | 6 (2.5%) |
| 11:00 AM to 11:59 AM | 0 (0.0%) | 0 (0.0%) |
| 12:00 PM to 3:59 PM | 5 (1.8%) | 11 (4.6%) |
| 4:00 PM to 11:59 PM | 11 (4.1%) | 54 (22.5%) |
| Total | 271 (100.0%) | 240 (100.0%) |
Housing Occupancy in Silverdale borough
Occupancy by Ownership in Silverdale borough
Of the total 347 dwellings in Silverdale borough, owner-occupied units account for 307 (88.5%), while renter-occupied units make up 40 (11.5%).
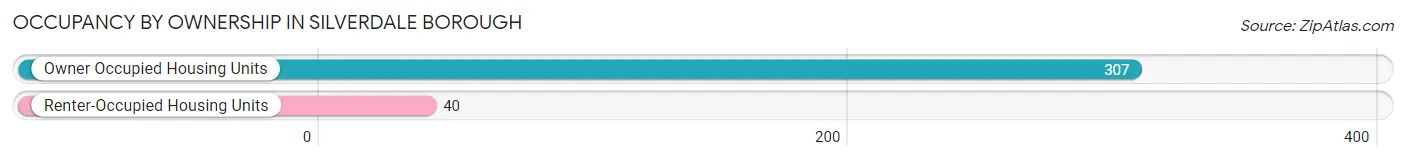
| Occupancy | # Housing Units | % Housing Units |
| Owner Occupied Housing Units | 307 | 88.5% |
| Renter-Occupied Housing Units | 40 | 11.5% |
| Total Occupied Housing Units | 347 | 100.0% |
Occupancy by Household Size in Silverdale borough
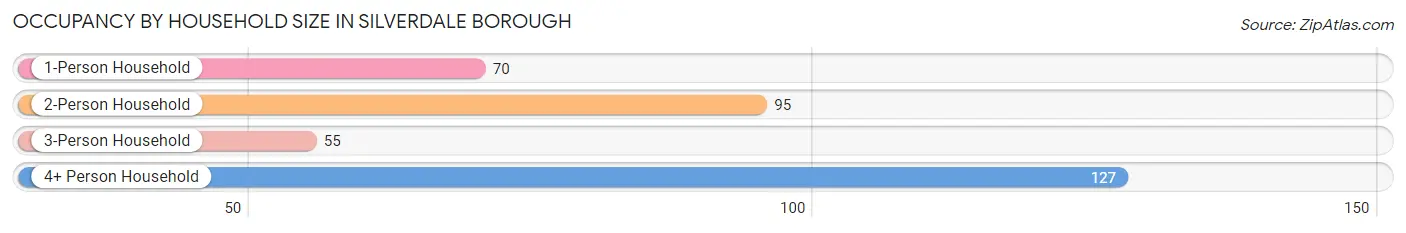
| Household Size | # Housing Units | % Housing Units |
| 1-Person Household | 70 | 20.2% |
| 2-Person Household | 95 | 27.4% |
| 3-Person Household | 55 | 15.9% |
| 4+ Person Household | 127 | 36.6% |
| Total Housing Units | 347 | 100.0% |
Occupancy by Ownership by Household Size in Silverdale borough
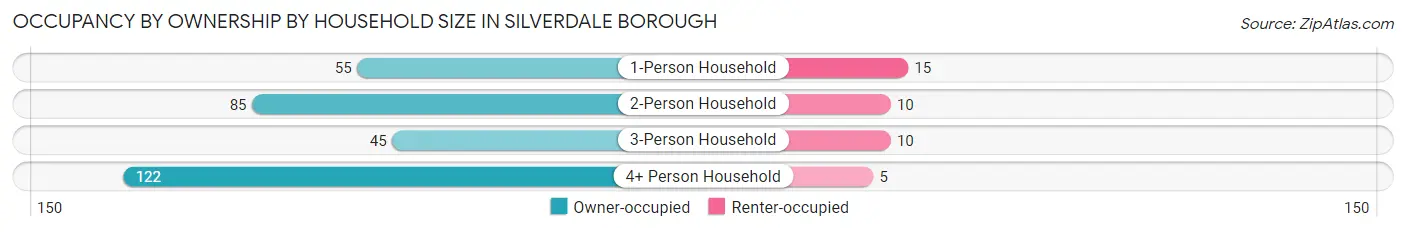
| Household Size | Owner-occupied | Renter-occupied |
| 1-Person Household | 55 (78.6%) | 15 (21.4%) |
| 2-Person Household | 85 (89.5%) | 10 (10.5%) |
| 3-Person Household | 45 (81.8%) | 10 (18.2%) |
| 4+ Person Household | 122 (96.1%) | 5 (3.9%) |
| Total Housing Units | 307 (88.5%) | 40 (11.5%) |
Occupancy by Educational Attainment in Silverdale borough
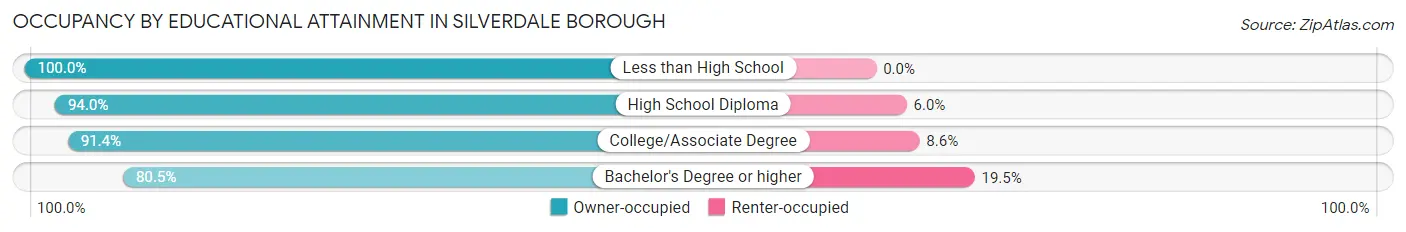
| Household Size | Owner-occupied | Renter-occupied |
| Less than High School | 3 (100.0%) | 0 (0.0%) |
| High School Diploma | 109 (94.0%) | 7 (6.0%) |
| College/Associate Degree | 96 (91.4%) | 9 (8.6%) |
| Bachelor's Degree or higher | 99 (80.5%) | 24 (19.5%) |
Occupancy by Age of Householder in Silverdale borough
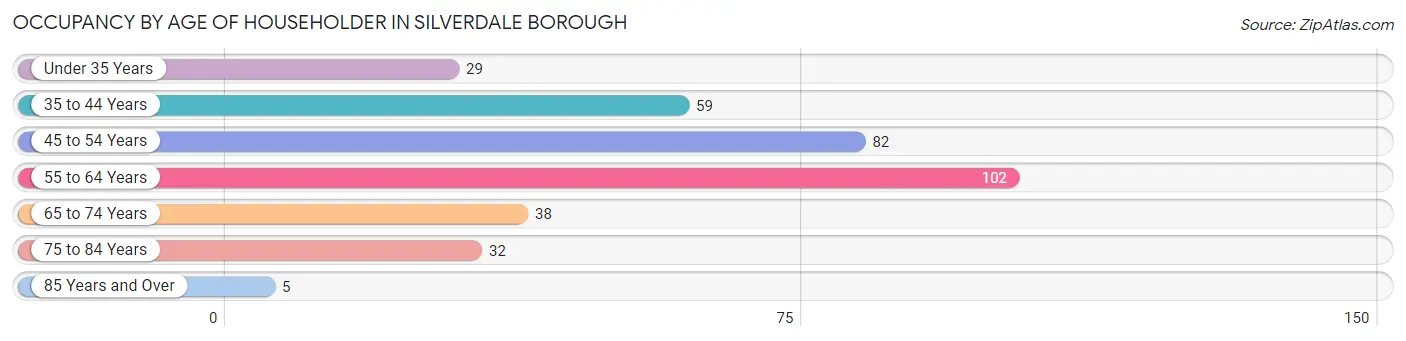
| Age Bracket | # Households | % Households |
| Under 35 Years | 29 | 8.4% |
| 35 to 44 Years | 59 | 17.0% |
| 45 to 54 Years | 82 | 23.6% |
| 55 to 64 Years | 102 | 29.4% |
| 65 to 74 Years | 38 | 11.0% |
| 75 to 84 Years | 32 | 9.2% |
| 85 Years and Over | 5 | 1.4% |
| Total | 347 | 100.0% |
Housing Finances in Silverdale borough
Median Income by Occupancy in Silverdale borough
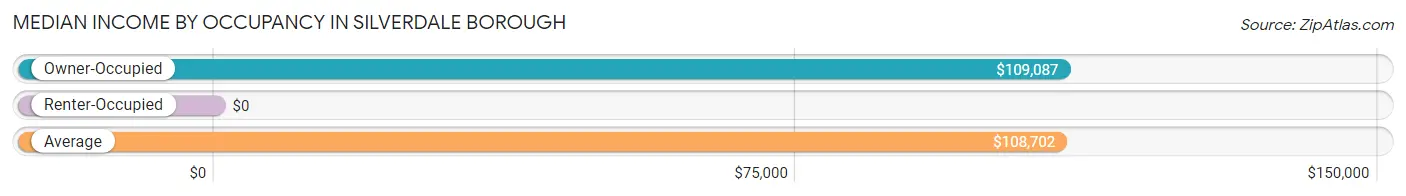
| Occupancy Type | # Households | Median Income |
| Owner-Occupied | 307 (88.5%) | $109,087 |
| Renter-Occupied | 40 (11.5%) | $0 |
| Average | 347 (100.0%) | $108,702 |
Occupancy by Householder Income Bracket in Silverdale borough
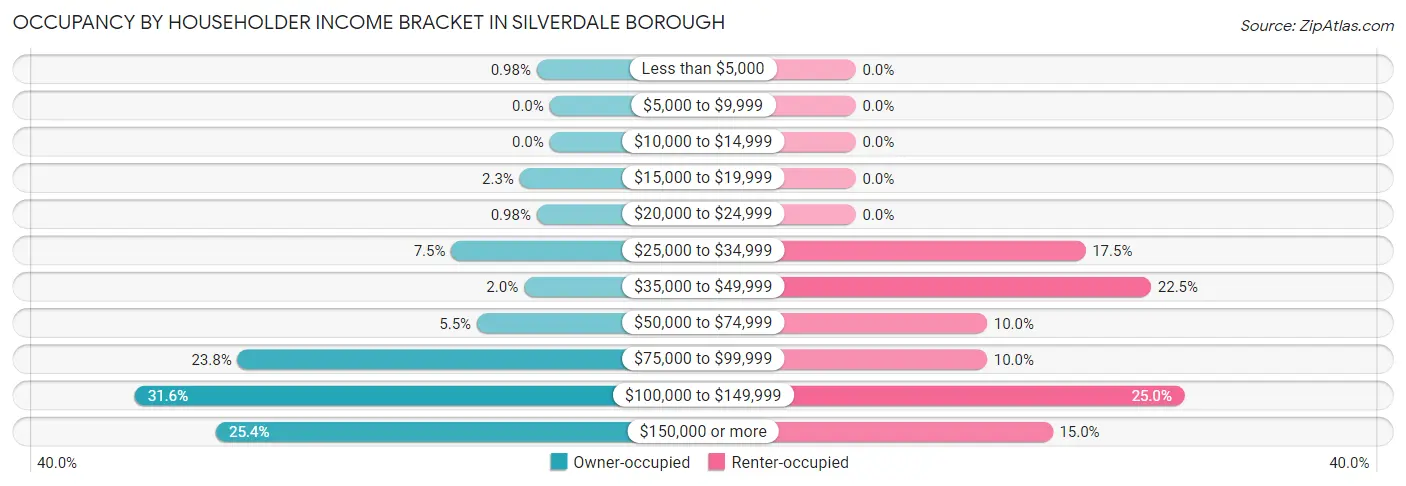
| Income Bracket | Owner-occupied | Renter-occupied |
| Less than $5,000 | 3 (1.0%) | 0 (0.0%) |
| $5,000 to $9,999 | 0 (0.0%) | 0 (0.0%) |
| $10,000 to $14,999 | 0 (0.0%) | 0 (0.0%) |
| $15,000 to $19,999 | 7 (2.3%) | 0 (0.0%) |
| $20,000 to $24,999 | 3 (1.0%) | 0 (0.0%) |
| $25,000 to $34,999 | 23 (7.5%) | 7 (17.5%) |
| $35,000 to $49,999 | 6 (1.9%) | 9 (22.5%) |
| $50,000 to $74,999 | 17 (5.5%) | 4 (10.0%) |
| $75,000 to $99,999 | 73 (23.8%) | 4 (10.0%) |
| $100,000 to $149,999 | 97 (31.6%) | 10 (25.0%) |
| $150,000 or more | 78 (25.4%) | 6 (15.0%) |
| Total | 307 (100.0%) | 40 (100.0%) |
Monthly Housing Cost Tiers in Silverdale borough
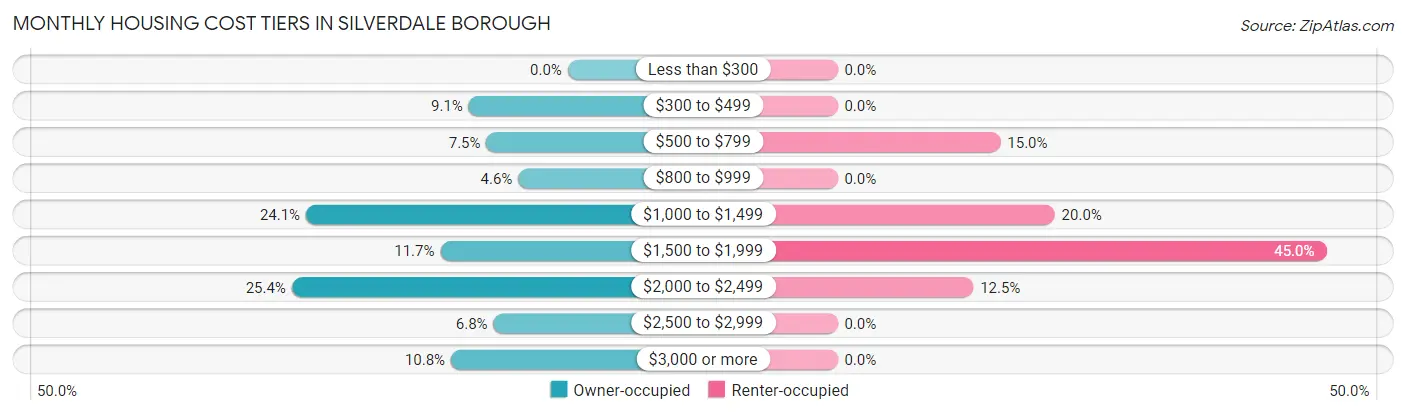
| Monthly Cost | Owner-occupied | Renter-occupied |
| Less than $300 | 0 (0.0%) | 0 (0.0%) |
| $300 to $499 | 28 (9.1%) | 0 (0.0%) |
| $500 to $799 | 23 (7.5%) | 6 (15.0%) |
| $800 to $999 | 14 (4.6%) | 0 (0.0%) |
| $1,000 to $1,499 | 74 (24.1%) | 8 (20.0%) |
| $1,500 to $1,999 | 36 (11.7%) | 18 (45.0%) |
| $2,000 to $2,499 | 78 (25.4%) | 5 (12.5%) |
| $2,500 to $2,999 | 21 (6.8%) | 0 (0.0%) |
| $3,000 or more | 33 (10.7%) | 0 (0.0%) |
| Total | 307 (100.0%) | 40 (100.0%) |
Physical Housing Characteristics in Silverdale borough
Housing Structures in Silverdale borough
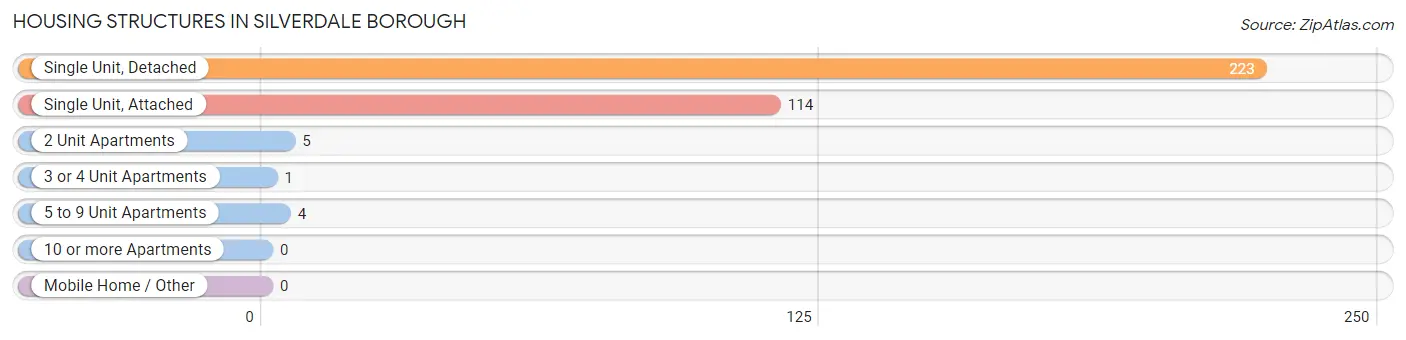
| Structure Type | # Housing Units | % Housing Units |
| Single Unit, Detached | 223 | 64.3% |
| Single Unit, Attached | 114 | 32.9% |
| 2 Unit Apartments | 5 | 1.4% |
| 3 or 4 Unit Apartments | 1 | 0.3% |
| 5 to 9 Unit Apartments | 4 | 1.1% |
| 10 or more Apartments | 0 | 0.0% |
| Mobile Home / Other | 0 | 0.0% |
| Total | 347 | 100.0% |
Housing Structures by Occupancy in Silverdale borough
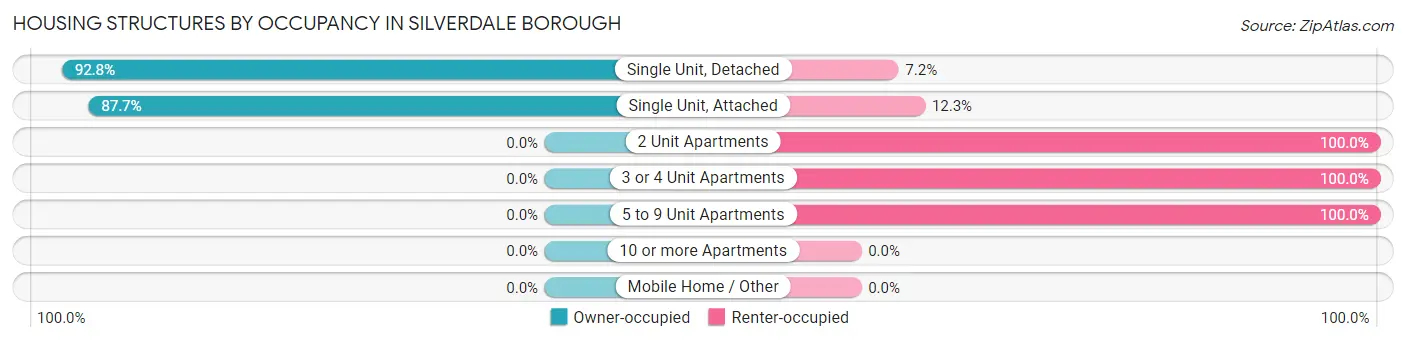
| Structure Type | Owner-occupied | Renter-occupied |
| Single Unit, Detached | 207 (92.8%) | 16 (7.2%) |
| Single Unit, Attached | 100 (87.7%) | 14 (12.3%) |
| 2 Unit Apartments | 0 (0.0%) | 5 (100.0%) |
| 3 or 4 Unit Apartments | 0 (0.0%) | 1 (100.0%) |
| 5 to 9 Unit Apartments | 0 (0.0%) | 4 (100.0%) |
| 10 or more Apartments | 0 (0.0%) | 0 (0.0%) |
| Mobile Home / Other | 0 (0.0%) | 0 (0.0%) |
| Total | 307 (88.5%) | 40 (11.5%) |
Housing Structures by Number of Rooms in Silverdale borough
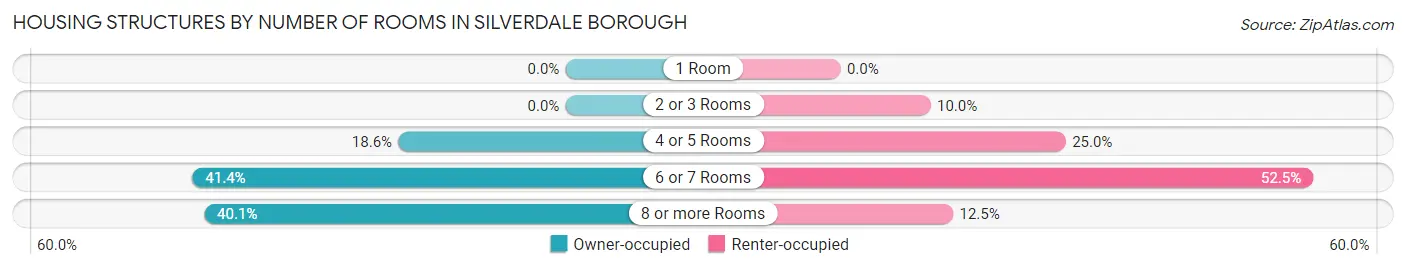
| Number of Rooms | Owner-occupied | Renter-occupied |
| 1 Room | 0 (0.0%) | 0 (0.0%) |
| 2 or 3 Rooms | 0 (0.0%) | 4 (10.0%) |
| 4 or 5 Rooms | 57 (18.6%) | 10 (25.0%) |
| 6 or 7 Rooms | 127 (41.4%) | 21 (52.5%) |
| 8 or more Rooms | 123 (40.1%) | 5 (12.5%) |
| Total | 307 (100.0%) | 40 (100.0%) |
Housing Structure by Heating Type in Silverdale borough
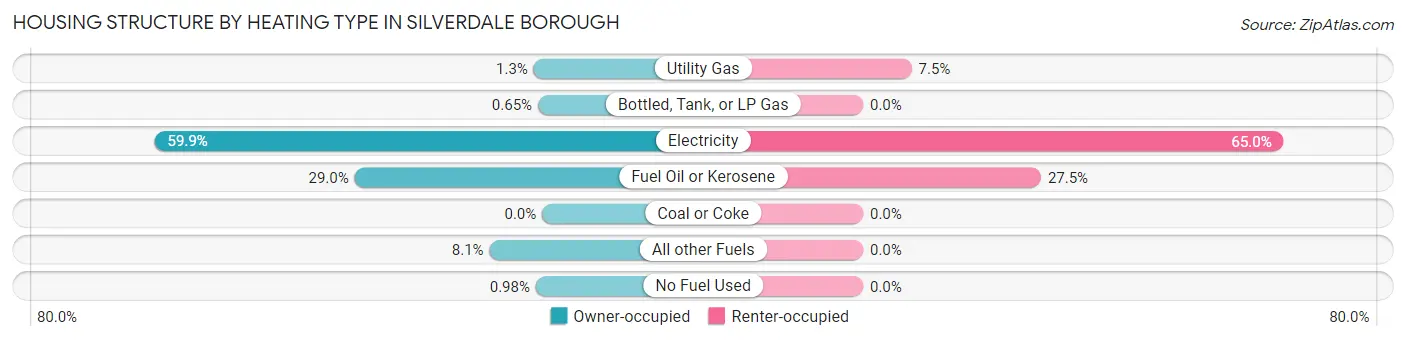
| Heating Type | Owner-occupied | Renter-occupied |
| Utility Gas | 4 (1.3%) | 3 (7.5%) |
| Bottled, Tank, or LP Gas | 2 (0.6%) | 0 (0.0%) |
| Electricity | 184 (59.9%) | 26 (65.0%) |
| Fuel Oil or Kerosene | 89 (29.0%) | 11 (27.5%) |
| Coal or Coke | 0 (0.0%) | 0 (0.0%) |
| All other Fuels | 25 (8.1%) | 0 (0.0%) |
| No Fuel Used | 3 (1.0%) | 0 (0.0%) |
| Total | 307 (100.0%) | 40 (100.0%) |
Household Vehicle Usage in Silverdale borough
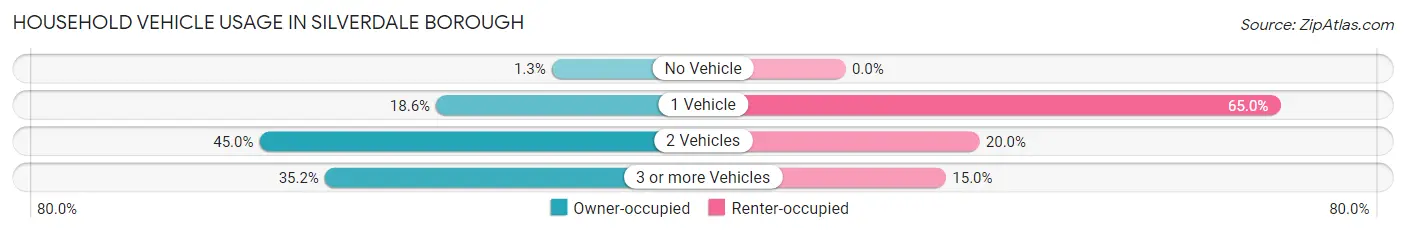
| Vehicles per Household | Owner-occupied | Renter-occupied |
| No Vehicle | 4 (1.3%) | 0 (0.0%) |
| 1 Vehicle | 57 (18.6%) | 26 (65.0%) |
| 2 Vehicles | 138 (45.0%) | 8 (20.0%) |
| 3 or more Vehicles | 108 (35.2%) | 6 (15.0%) |
| Total | 307 (100.0%) | 40 (100.0%) |
Real Estate & Mortgages in Silverdale borough
Real Estate and Mortgage Overview in Silverdale borough
| Characteristic | Without Mortgage | With Mortgage |
| Housing Units | 64 | 243 |
| Median Property Value | $342,500 | $287,500 |
| Median Household Income | $94,167 | $72 |
| Monthly Housing Costs | $600 | $33 |
| Real Estate Taxes | $3,950 | $0 |
Property Value by Mortgage Status in Silverdale borough
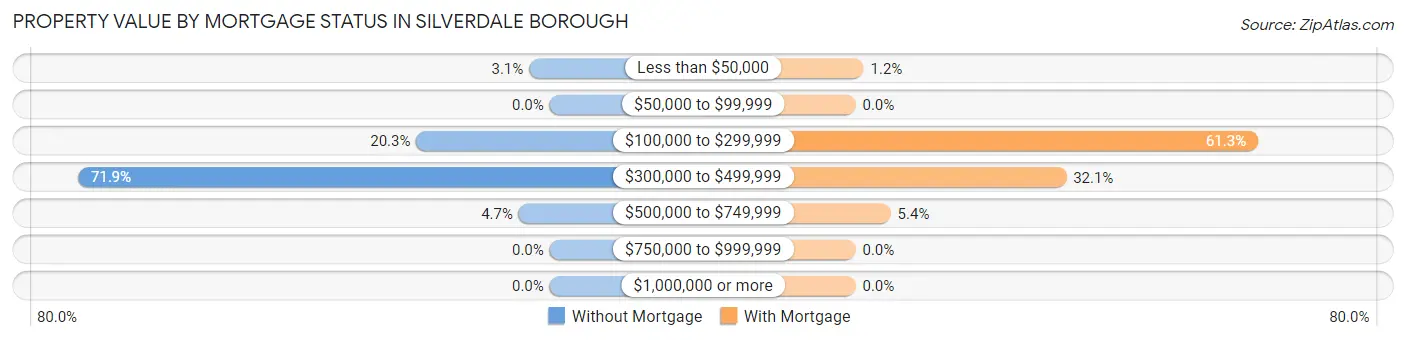
| Property Value | Without Mortgage | With Mortgage |
| Less than $50,000 | 2 (3.1%) | 3 (1.2%) |
| $50,000 to $99,999 | 0 (0.0%) | 0 (0.0%) |
| $100,000 to $299,999 | 13 (20.3%) | 149 (61.3%) |
| $300,000 to $499,999 | 46 (71.9%) | 78 (32.1%) |
| $500,000 to $749,999 | 3 (4.7%) | 13 (5.3%) |
| $750,000 to $999,999 | 0 (0.0%) | 0 (0.0%) |
| $1,000,000 or more | 0 (0.0%) | 0 (0.0%) |
| Total | 64 (100.0%) | 243 (100.0%) |
Household Income by Mortgage Status in Silverdale borough
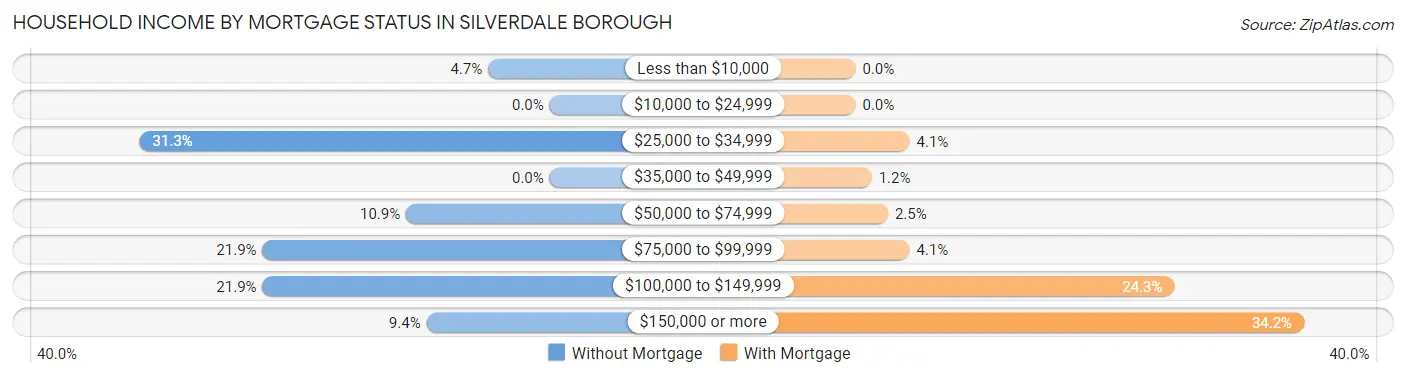
| Household Income | Without Mortgage | With Mortgage |
| Less than $10,000 | 3 (4.7%) | 0 (0.0%) |
| $10,000 to $24,999 | 0 (0.0%) | 0 (0.0%) |
| $25,000 to $34,999 | 20 (31.2%) | 10 (4.1%) |
| $35,000 to $49,999 | 0 (0.0%) | 3 (1.2%) |
| $50,000 to $74,999 | 7 (10.9%) | 6 (2.5%) |
| $75,000 to $99,999 | 14 (21.9%) | 10 (4.1%) |
| $100,000 to $149,999 | 14 (21.9%) | 59 (24.3%) |
| $150,000 or more | 6 (9.4%) | 83 (34.2%) |
| Total | 64 (100.0%) | 243 (100.0%) |
Property Value to Household Income Ratio in Silverdale borough
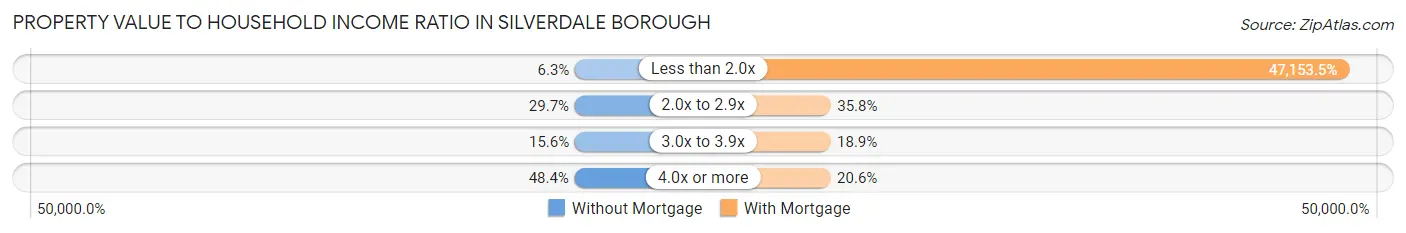
| Value-to-Income Ratio | Without Mortgage | With Mortgage |
| Less than 2.0x | 4 (6.2%) | 114,583 (47,153.5%) |
| 2.0x to 2.9x | 19 (29.7%) | 87 (35.8%) |
| 3.0x to 3.9x | 10 (15.6%) | 46 (18.9%) |
| 4.0x or more | 31 (48.4%) | 50 (20.6%) |
| Total | 64 (100.0%) | 243 (100.0%) |
Real Estate Taxes by Mortgage Status in Silverdale borough
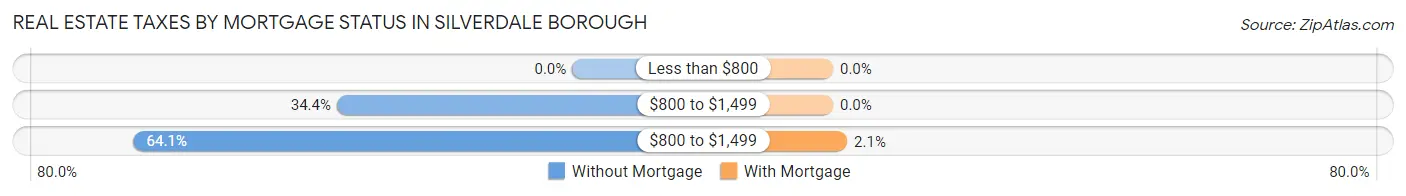
| Property Taxes | Without Mortgage | With Mortgage |
| Less than $800 | 0 (0.0%) | 0 (0.0%) |
| $800 to $1,499 | 22 (34.4%) | 0 (0.0%) |
| $800 to $1,499 | 41 (64.1%) | 5 (2.1%) |
| Total | 64 (100.0%) | 243 (100.0%) |
Health & Disability in Silverdale borough
Health Insurance Coverage by Age in Silverdale borough
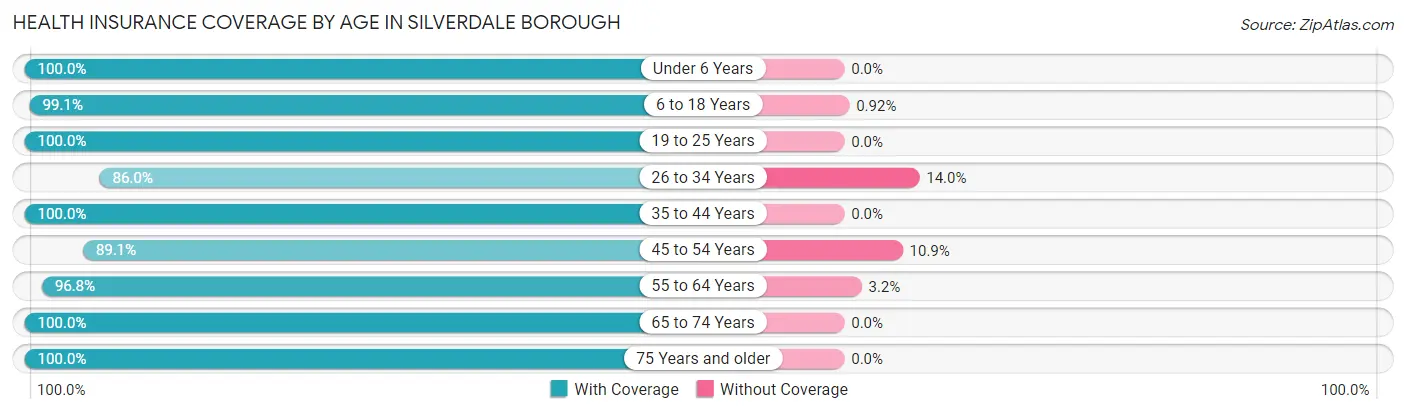
| Age Bracket | With Coverage | Without Coverage |
| Under 6 Years | 105 (100.0%) | 0 (0.0%) |
| 6 to 18 Years | 215 (99.1%) | 2 (0.9%) |
| 19 to 25 Years | 42 (100.0%) | 0 (0.0%) |
| 26 to 34 Years | 80 (86.0%) | 13 (14.0%) |
| 35 to 44 Years | 104 (100.0%) | 0 (0.0%) |
| 45 to 54 Years | 164 (89.1%) | 20 (10.9%) |
| 55 to 64 Years | 151 (96.8%) | 5 (3.2%) |
| 65 to 74 Years | 74 (100.0%) | 0 (0.0%) |
| 75 Years and older | 43 (100.0%) | 0 (0.0%) |
| Total | 978 (96.1%) | 40 (3.9%) |
Health Insurance Coverage by Citizenship Status in Silverdale borough
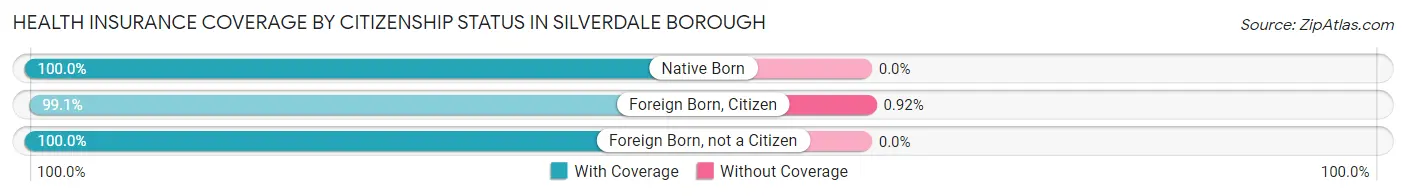
| Citizenship Status | With Coverage | Without Coverage |
| Native Born | 105 (100.0%) | 0 (0.0%) |
| Foreign Born, Citizen | 215 (99.1%) | 2 (0.9%) |
| Foreign Born, not a Citizen | 42 (100.0%) | 0 (0.0%) |
Health Insurance Coverage by Household Income in Silverdale borough
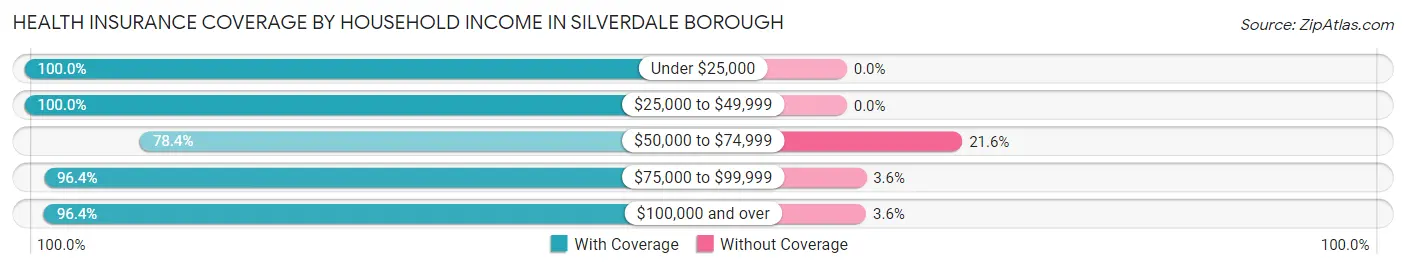
| Household Income | With Coverage | Without Coverage |
| Under $25,000 | 13 (100.0%) | 0 (0.0%) |
| $25,000 to $49,999 | 82 (100.0%) | 0 (0.0%) |
| $50,000 to $74,999 | 29 (78.4%) | 8 (21.6%) |
| $75,000 to $99,999 | 238 (96.4%) | 9 (3.6%) |
| $100,000 and over | 613 (96.4%) | 23 (3.6%) |
Public vs Private Health Insurance Coverage by Age in Silverdale borough
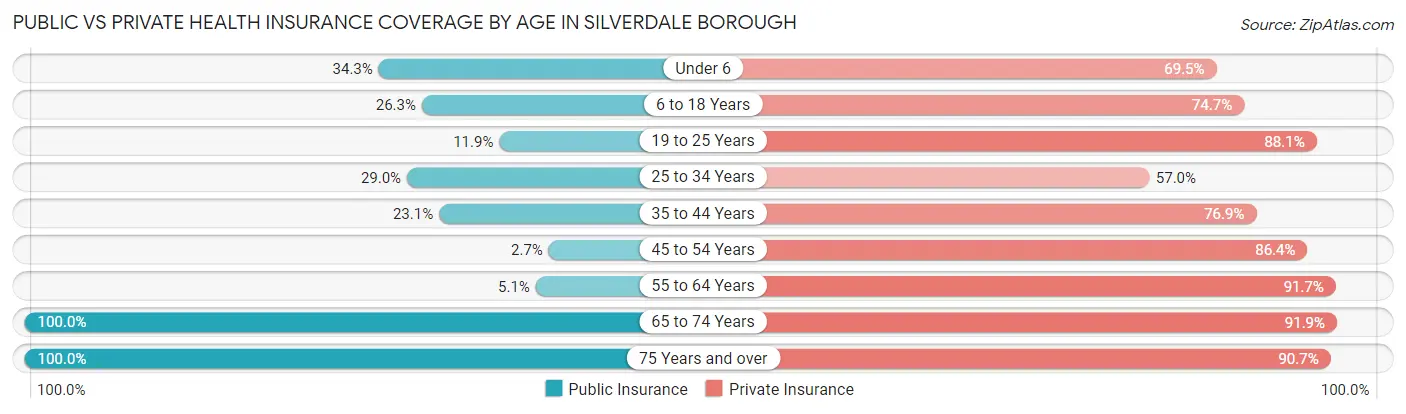
| Age Bracket | Public Insurance | Private Insurance |
| Under 6 | 36 (34.3%) | 73 (69.5%) |
| 6 to 18 Years | 57 (26.3%) | 162 (74.7%) |
| 19 to 25 Years | 5 (11.9%) | 37 (88.1%) |
| 25 to 34 Years | 27 (29.0%) | 53 (57.0%) |
| 35 to 44 Years | 24 (23.1%) | 80 (76.9%) |
| 45 to 54 Years | 5 (2.7%) | 159 (86.4%) |
| 55 to 64 Years | 8 (5.1%) | 143 (91.7%) |
| 65 to 74 Years | 74 (100.0%) | 68 (91.9%) |
| 75 Years and over | 43 (100.0%) | 39 (90.7%) |
| Total | 279 (27.4%) | 814 (80.0%) |
Disability Status by Sex by Age in Silverdale borough
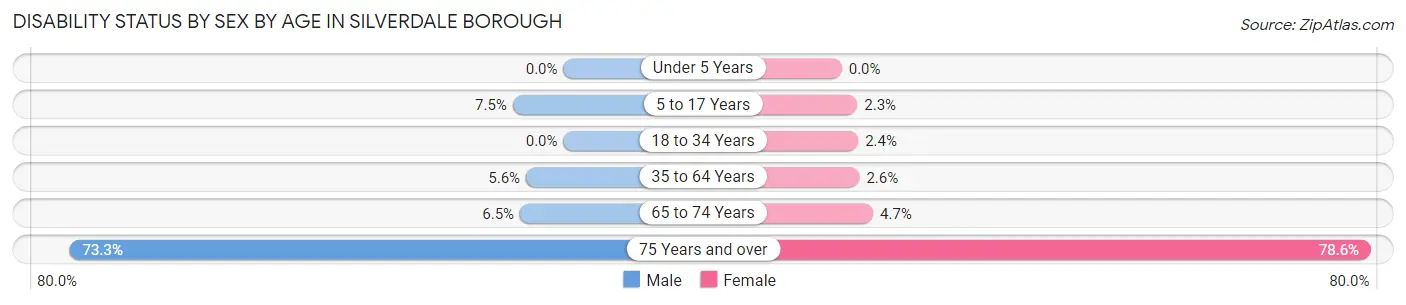
| Age Bracket | Male | Female |
| Under 5 Years | 0 (0.0%) | 0 (0.0%) |
| 5 to 17 Years | 10 (7.5%) | 3 (2.3%) |
| 18 to 34 Years | 0 (0.0%) | 2 (2.4%) |
| 35 to 64 Years | 12 (5.6%) | 6 (2.6%) |
| 65 to 74 Years | 2 (6.5%) | 2 (4.6%) |
| 75 Years and over | 11 (73.3%) | 22 (78.6%) |
Disability Class by Sex by Age in Silverdale borough
Disability Class: Hearing Difficulty
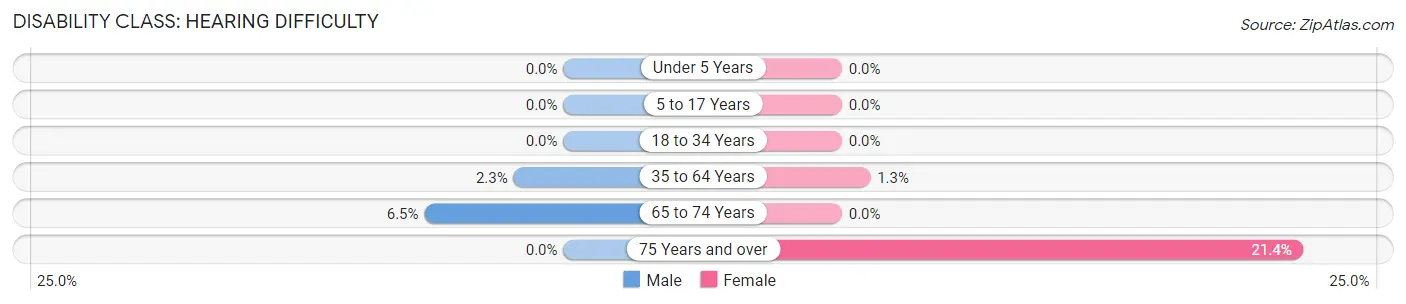
| Age Bracket | Male | Female |
| Under 5 Years | 0 (0.0%) | 0 (0.0%) |
| 5 to 17 Years | 0 (0.0%) | 0 (0.0%) |
| 18 to 34 Years | 0 (0.0%) | 0 (0.0%) |
| 35 to 64 Years | 5 (2.3%) | 3 (1.3%) |
| 65 to 74 Years | 2 (6.5%) | 0 (0.0%) |
| 75 Years and over | 0 (0.0%) | 6 (21.4%) |
Disability Class: Vision Difficulty
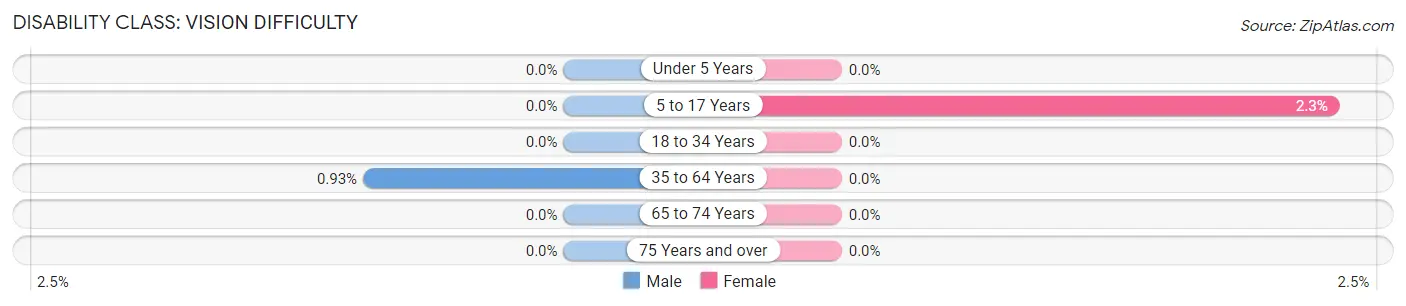
| Age Bracket | Male | Female |
| Under 5 Years | 0 (0.0%) | 0 (0.0%) |
| 5 to 17 Years | 0 (0.0%) | 3 (2.3%) |
| 18 to 34 Years | 0 (0.0%) | 0 (0.0%) |
| 35 to 64 Years | 2 (0.9%) | 0 (0.0%) |
| 65 to 74 Years | 0 (0.0%) | 0 (0.0%) |
| 75 Years and over | 0 (0.0%) | 0 (0.0%) |
Disability Class: Cognitive Difficulty
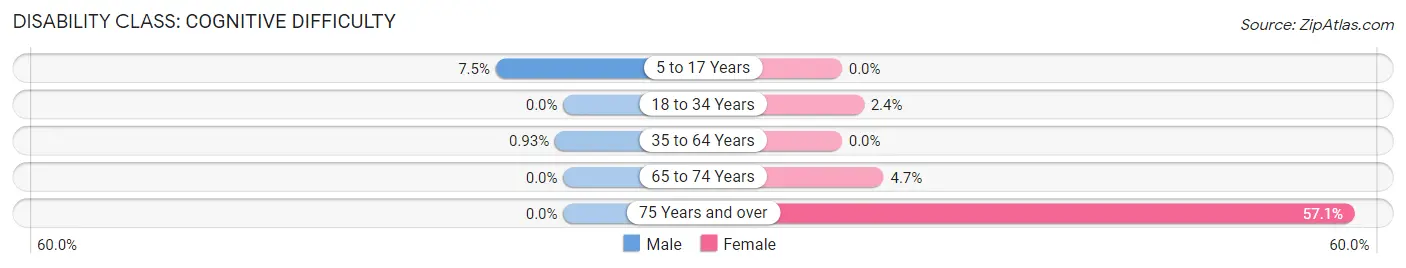
| Age Bracket | Male | Female |
| 5 to 17 Years | 10 (7.5%) | 0 (0.0%) |
| 18 to 34 Years | 0 (0.0%) | 2 (2.4%) |
| 35 to 64 Years | 2 (0.9%) | 0 (0.0%) |
| 65 to 74 Years | 0 (0.0%) | 2 (4.6%) |
| 75 Years and over | 0 (0.0%) | 16 (57.1%) |
Disability Class: Ambulatory Difficulty
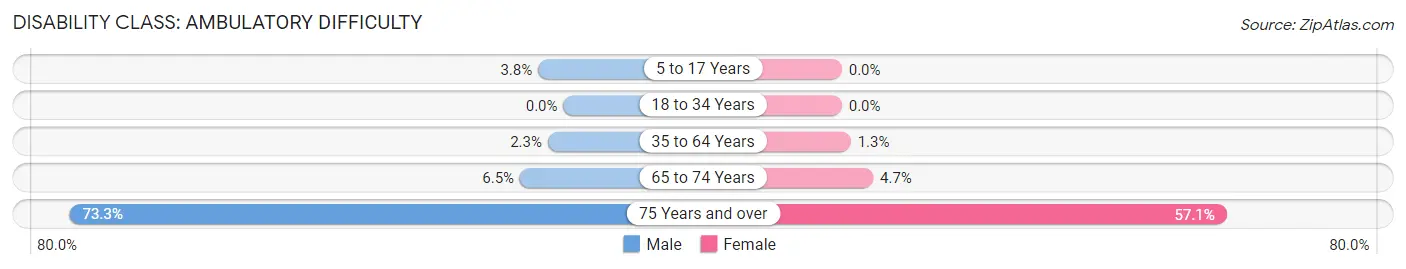
| Age Bracket | Male | Female |
| 5 to 17 Years | 5 (3.8%) | 0 (0.0%) |
| 18 to 34 Years | 0 (0.0%) | 0 (0.0%) |
| 35 to 64 Years | 5 (2.3%) | 3 (1.3%) |
| 65 to 74 Years | 2 (6.5%) | 2 (4.6%) |
| 75 Years and over | 11 (73.3%) | 16 (57.1%) |
Disability Class: Self-Care Difficulty
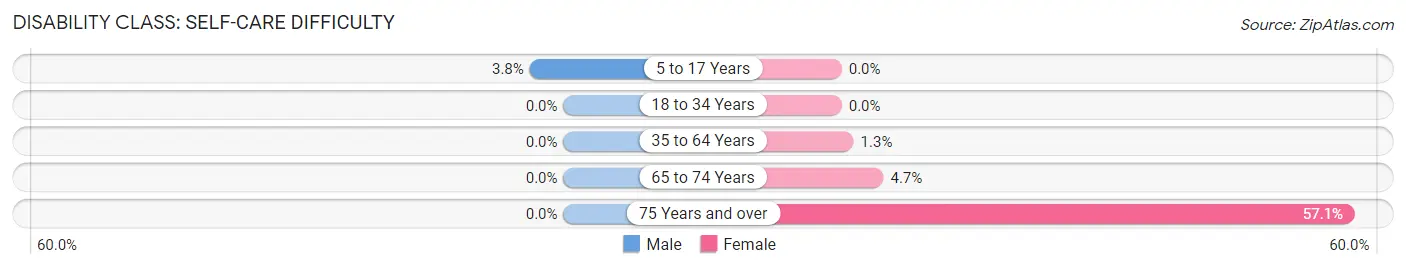
| Age Bracket | Male | Female |
| 5 to 17 Years | 5 (3.8%) | 0 (0.0%) |
| 18 to 34 Years | 0 (0.0%) | 0 (0.0%) |
| 35 to 64 Years | 0 (0.0%) | 3 (1.3%) |
| 65 to 74 Years | 0 (0.0%) | 2 (4.6%) |
| 75 Years and over | 0 (0.0%) | 16 (57.1%) |
Technology Access in Silverdale borough
Computing Device Access in Silverdale borough
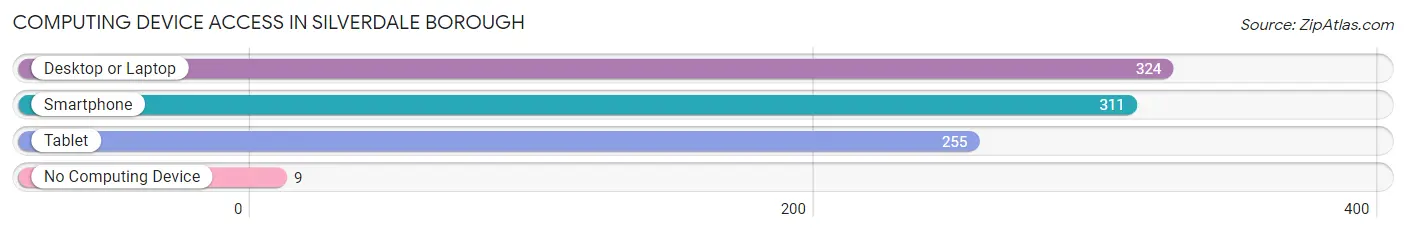
| Device Type | # Households | % Households |
| Desktop or Laptop | 324 | 93.4% |
| Smartphone | 311 | 89.6% |
| Tablet | 255 | 73.5% |
| No Computing Device | 9 | 2.6% |
| Total | 347 | 100.0% |
Internet Access in Silverdale borough
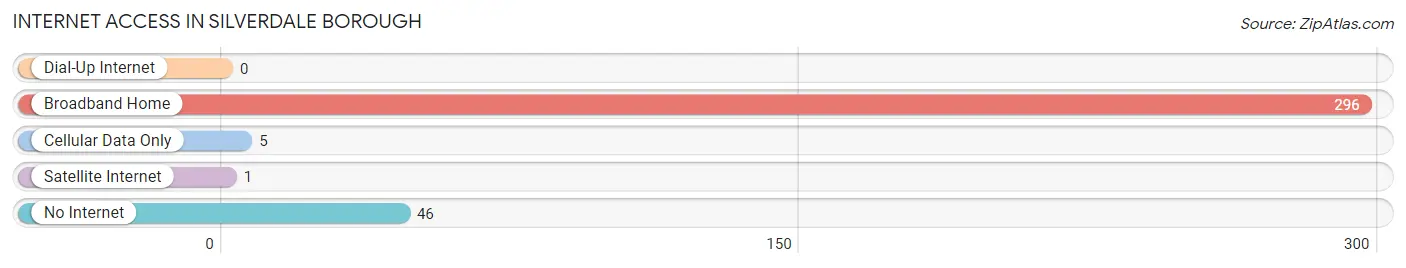
| Internet Type | # Households | % Households |
| Dial-Up Internet | 0 | 0.0% |
| Broadband Home | 296 | 85.3% |
| Cellular Data Only | 5 | 1.4% |
| Satellite Internet | 1 | 0.3% |
| No Internet | 46 | 13.3% |
| Total | 347 | 100.0% |
Silverdale borough Summary
Introduction
Silverdale Borough is a small borough located in Bucks County, Pennsylvania. It is situated in the heart of Bucks County, just north of Philadelphia. The borough is home to a population of approximately 1,500 people and is part of the Quakertown-Perkasie-Silverdale Metropolitan Statistical Area. Silverdale Borough is a small, rural community that is known for its quaint charm and rural beauty.
History
Silverdale Borough was founded in 1876 by a group of settlers from the nearby town of Perkasie. The settlers were looking for a place to settle and start a new life. The area was originally known as Silverdale, named after the silver ore that was found in the area. The ore was used to make jewelry and other items. The settlers built a small village and began to farm the land.
In 1877, the first post office was established in Silverdale. The post office was located in the home of the first postmaster, John B. Miller. The post office was a great convenience for the residents of Silverdale, as it allowed them to send and receive mail from other parts of the country.
In 1881, the first school was built in Silverdale. The school was a one-room schoolhouse and was used to educate the children of the town. The school was later expanded to include a two-room schoolhouse.
In 1883, the first church was built in Silverdale. The church was a Methodist church and was used for religious services and community events.
In 1884, the first newspaper was established in Silverdale. The newspaper was called the Silverdale Gazette and was published weekly. The newspaper was a great source of news and information for the residents of Silverdale.
In 1885, the first bank was established in Silverdale. The bank was called the Silverdale Bank and was used to provide banking services to the residents of Silverdale.
In 1887, the first fire company was established in Silverdale. The fire company was called the Silverdale Fire Company and was used to protect the town from fires.
In 1889, the first telephone was installed in Silverdale. The telephone was a great convenience for the residents of Silverdale, as it allowed them to communicate with each other and with people in other parts of the country.
In 1895, the first electric lights were installed in Silverdale. The electric lights were a great convenience for the residents of Silverdale, as they allowed them to stay up later and do more work.
In 1900, the first water system was installed in Silverdale. The water system was a great convenience for the residents of Silverdale, as it allowed them to have running water in their homes.
Geography
Silverdale Borough is located in the heart of Bucks County, Pennsylvania. It is situated in the southeastern corner of the county, just north of Philadelphia. The borough is bordered by the townships of Bedminster, Hilltown, and Perkasie. The borough is located in a rural area and is surrounded by rolling hills and farmland. The borough is home to a variety of wildlife, including deer, foxes, and other small animals.
The borough is located in the Quakertown-Perkasie-Silverdale Metropolitan Statistical Area. The area is home to a population of approximately 1,500 people and is part of the larger Philadelphia-Camden-Wilmington Combined Statistical Area.
Economy
Silverdale Borough is a small, rural community that is known for its quaint charm and rural beauty. The borough is home to a variety of small businesses, including restaurants, retail stores, and professional services. The borough is also home to a number of farms, which produce a variety of crops, including corn, soybeans, and wheat.
The borough is home to a number of manufacturing companies, including a paper mill and a plastics factory. The borough is also home to a number of small businesses, including a bakery, a hardware store, and a grocery store.
Demographics
As of the 2010 census, the population of Silverdale Borough was 1,500. The racial makeup of the borough was 97.3% White, 0.7% African American, 0.3% Native American, 0.3% Asian, 0.3% from other races, and 1.3% from two or more races. Hispanic or Latino of any race were 1.3% of the population.
The median income for a household in the borough was $50,000, and the median income for a family was $54,000. The per capita income for the borough was $21,000. About 8.3% of families and 10.3% of the population were below the poverty line, including 14.3% of those under age 18 and 6.3% of those age 65 or over.
Conclusion
Silverdale Borough is a small, rural community located in Bucks County, Pennsylvania. The borough is home to a population of approximately 1,500 people and is part of the Quakertown-Perkasie-Silverdale Metropolitan Statistical Area. The borough is known for its quaint charm and rural beauty. The economy of the borough is based on small businesses, manufacturing, and farming. The population of the borough is predominantly White, with a small percentage of African American, Native American, and Asian residents. The median income for a household in the borough is $50,000, and the median income for a family is $54,000.
Common Questions
What is Per Capita Income in Silverdale borough?
Per Capita income in Silverdale borough is $40,465.
What is the Median Family Income in Silverdale borough?
Median Family Income in Silverdale borough is $112,656.
What is the Median Household income in Silverdale borough?
Median Household Income in Silverdale borough is $108,702.
What is Income or Wage Gap in Silverdale borough?
Income or Wage Gap in Silverdale borough is 50.8%.
Women in Silverdale borough earn 49.2 cents for every dollar earned by a man.
What is Inequality or Gini Index in Silverdale borough?
Inequality or Gini Index in Silverdale borough is 0.32.
What is the Total Population of Silverdale borough?
Total Population of Silverdale borough is 1,023.
What is the Total Male Population of Silverdale borough?
Total Male Population of Silverdale borough is 499.
What is the Total Female Population of Silverdale borough?
Total Female Population of Silverdale borough is 524.
What is the Ratio of Males per 100 Females in Silverdale borough?
There are 95.23 Males per 100 Females in Silverdale borough.
What is the Ratio of Females per 100 Males in Silverdale borough?
There are 105.01 Females per 100 Males in Silverdale borough.
What is the Median Population Age in Silverdale borough?
Median Population Age in Silverdale borough is 36.9 Years.
What is the Average Family Size in Silverdale borough
Average Family Size in Silverdale borough is 3.4 People.
What is the Average Household Size in Silverdale borough
Average Household Size in Silverdale borough is 2.9 People.
How Large is the Labor Force in Silverdale borough?
There are 566 People in the Labor Forcein in Silverdale borough.
What is the Percentage of People in the Labor Force in Silverdale borough?
77.6% of People are in the Labor Force in Silverdale borough.
What is the Unemployment Rate in Silverdale borough?
Unemployment Rate in Silverdale borough is 2.0%.