Muse, PA Map & Demographics
Muse Map
Muse Overview
$38,148
PER CAPITA INCOME
$108,947
AVG FAMILY INCOME
$86,932
AVG HOUSEHOLD INCOME
32.3%
WAGE / INCOME GAP [ % ]
67.7¢/ $1
WAGE / INCOME GAP [ $ ]
0.42
INEQUALITY / GINI INDEX
2,501
TOTAL POPULATION
1,027
MALE POPULATION
1,474
FEMALE POPULATION
69.67
MALES / 100 FEMALES
143.52
FEMALES / 100 MALES
34.1
MEDIAN AGE
3.6
AVG FAMILY SIZE
3.1
AVG HOUSEHOLD SIZE
1,525
LABOR FORCE [ PEOPLE ]
74.2%
PERCENT IN LABOR FORCE
3.3%
UNEMPLOYMENT RATE
Muse Zip Codes
Muse Area Codes
Income in Muse
Income Overview in Muse
Per Capita Income in Muse is $38,148, while median incomes of families and households are $108,947 and $86,932 respectively.
| Characteristic | Number | Measure |
| Per Capita Income | 2,501 | $38,148 |
| Median Family Income | 606 | $108,947 |
| Mean Family Income | 606 | $133,660 |
| Median Household Income | 803 | $86,932 |
| Mean Household Income | 803 | $114,855 |
| Income Deficit | 606 | $0 |
| Wage / Income Gap (%) | 2,501 | 32.29% |
| Wage / Income Gap ($) | 2,501 | 67.71¢ per $1 |
| Gini / Inequality Index | 2,501 | 0.42 |
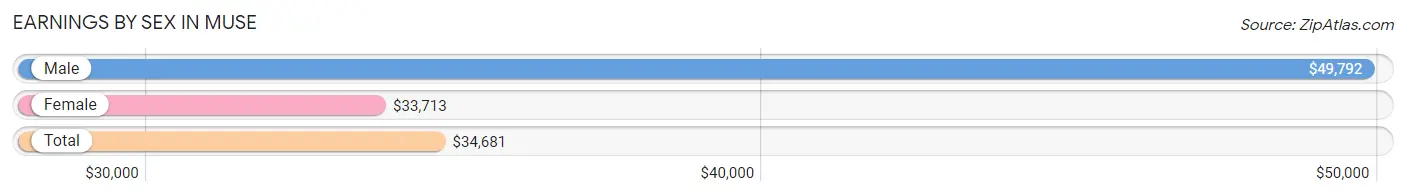
Earnings by Sex in Muse
Average Earnings in Muse are $34,681, $49,792 for men and $33,713 for women, a difference of 32.3%.
| Sex | Number | Average Earnings |
| Male | 650 (42.0%) | $49,792 |
| Female | 897 (58.0%) | $33,713 |
| Total | 1,547 (100.0%) | $34,681 |
Earnings by Sex by Income Bracket in Muse
The most common earnings brackets in Muse are $100,000+ for men (224 | 34.5%) and $30,000 to $34,999 for women (170 | 19.0%).
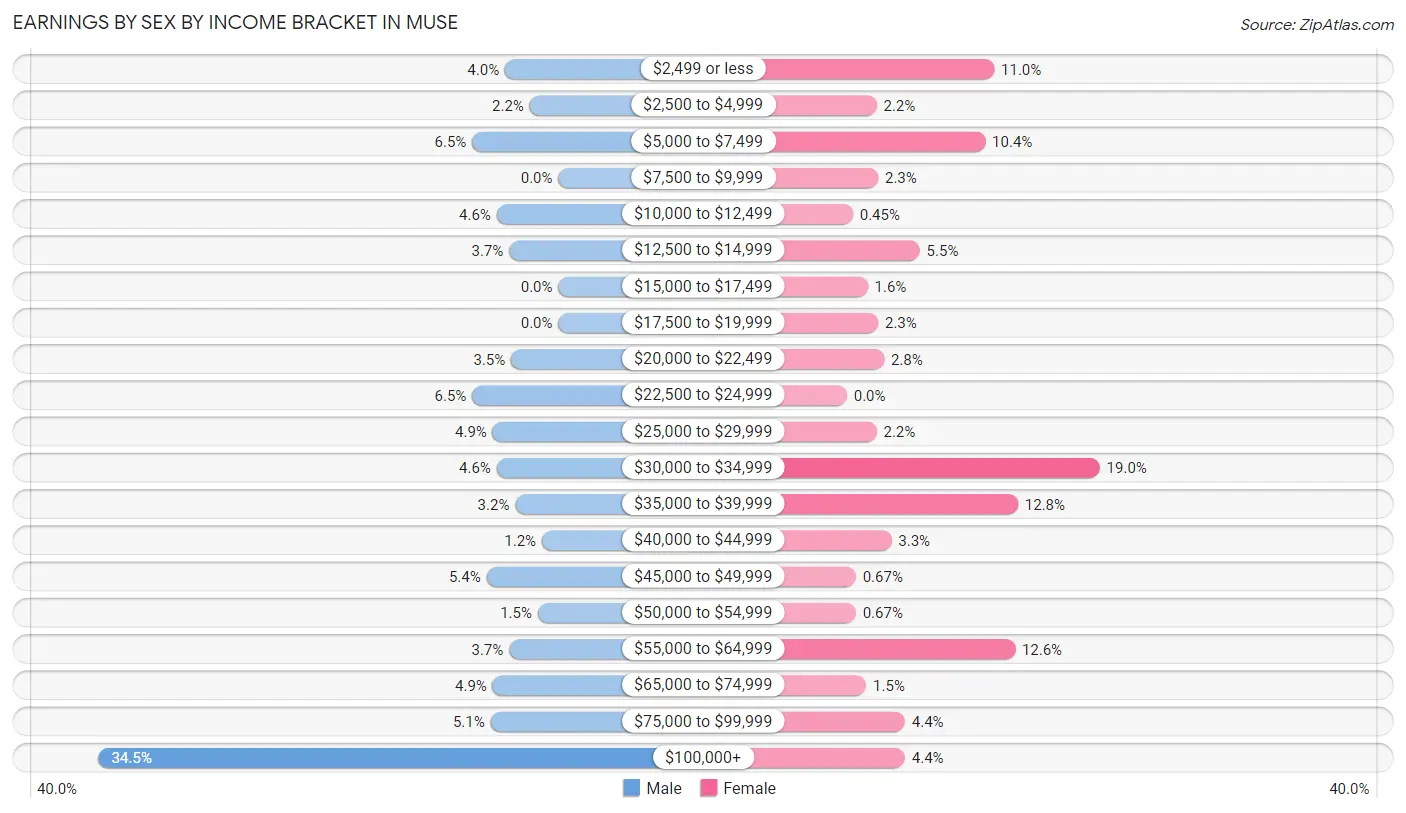
| Income | Male | Female |
| $2,499 or less | 26 (4.0%) | 99 (11.0%) |
| $2,500 to $4,999 | 14 (2.1%) | 20 (2.2%) |
| $5,000 to $7,499 | 42 (6.5%) | 93 (10.4%) |
| $7,500 to $9,999 | 0 (0.0%) | 21 (2.3%) |
| $10,000 to $12,499 | 30 (4.6%) | 4 (0.4%) |
| $12,500 to $14,999 | 24 (3.7%) | 49 (5.5%) |
| $15,000 to $17,499 | 0 (0.0%) | 14 (1.6%) |
| $17,500 to $19,999 | 0 (0.0%) | 21 (2.3%) |
| $20,000 to $22,499 | 23 (3.5%) | 25 (2.8%) |
| $22,500 to $24,999 | 42 (6.5%) | 0 (0.0%) |
| $25,000 to $29,999 | 32 (4.9%) | 20 (2.2%) |
| $30,000 to $34,999 | 30 (4.6%) | 170 (19.0%) |
| $35,000 to $39,999 | 21 (3.2%) | 115 (12.8%) |
| $40,000 to $44,999 | 8 (1.2%) | 30 (3.3%) |
| $45,000 to $49,999 | 35 (5.4%) | 6 (0.7%) |
| $50,000 to $54,999 | 10 (1.5%) | 6 (0.7%) |
| $55,000 to $64,999 | 24 (3.7%) | 113 (12.6%) |
| $65,000 to $74,999 | 32 (4.9%) | 13 (1.5%) |
| $75,000 to $99,999 | 33 (5.1%) | 39 (4.3%) |
| $100,000+ | 224 (34.5%) | 39 (4.3%) |
| Total | 650 (100.0%) | 897 (100.0%) |
Earnings by Sex by Educational Attainment in Muse
Average earnings in Muse are $68,162 for men and $37,083 for women, a difference of 45.6%. Men with an educational attainment of bachelor's degree enjoy the highest average annual earnings of $115,625, while those with graduate degree education earn the least with $73,417. Women with an educational attainment of graduate degree earn the most with the average annual earnings of $61,827, while those with college or associate's degree education have the smallest earnings of $34,964.
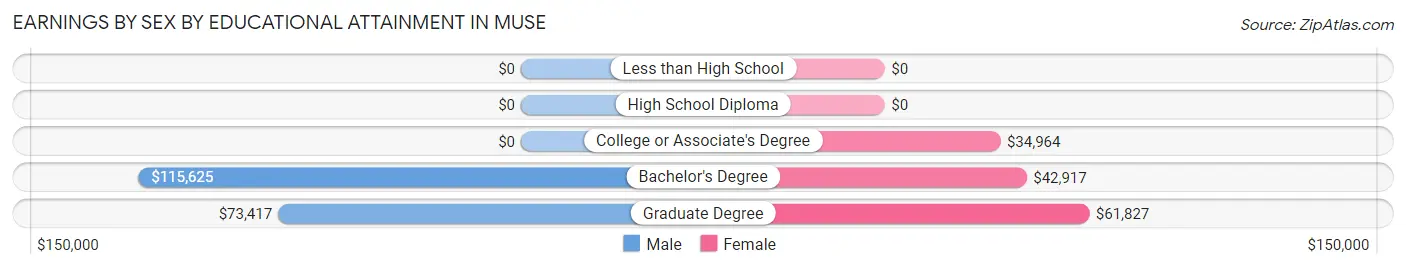
| Educational Attainment | Male Income | Female Income |
| Less than High School | - | - |
| High School Diploma | - | - |
| College or Associate's Degree | - | - |
| Bachelor's Degree | $115,625 | $42,917 |
| Graduate Degree | $73,417 | $61,827 |
| Total | $68,162 | $37,083 |
Family Income in Muse
Family Income Brackets in Muse
According to the Muse family income data, there are 133 families falling into the $200,000+ income range, which is the most common income bracket and makes up 22.0% of all families.
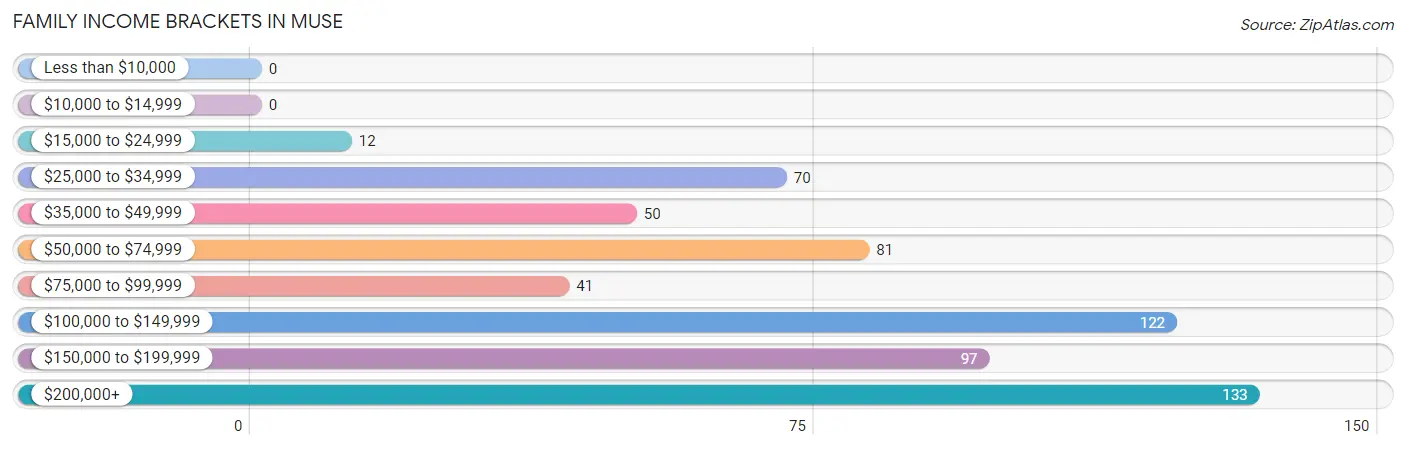
| Income Bracket | # Families | % Families |
| Less than $10,000 | 0 | 0.0% |
| $10,000 to $14,999 | 0 | 0.0% |
| $15,000 to $24,999 | 12 | 2.0% |
| $25,000 to $34,999 | 70 | 11.6% |
| $35,000 to $49,999 | 50 | 8.3% |
| $50,000 to $74,999 | 81 | 13.4% |
| $75,000 to $99,999 | 41 | 6.8% |
| $100,000 to $149,999 | 122 | 20.1% |
| $150,000 to $199,999 | 97 | 16.0% |
| $200,000+ | 133 | 21.9% |
Family Income by Famaliy Size in Muse
4-person families (119 | 19.6%) account for the highest median family income in Muse with $180,066 per family, while 3-person families (166 | 27.4%) have the highest median income of $45,111 per family member.
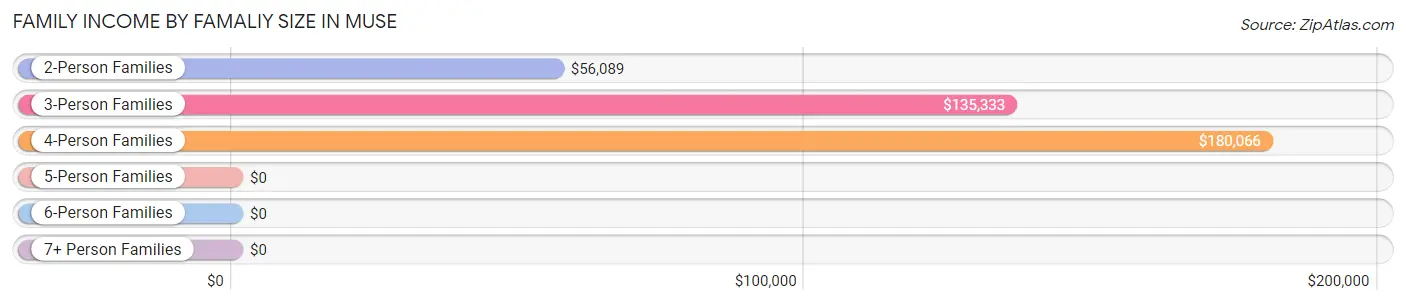
| Income Bracket | # Families | Median Income |
| 2-Person Families | 203 (33.5%) | $56,089 |
| 3-Person Families | 166 (27.4%) | $135,333 |
| 4-Person Families | 119 (19.6%) | $180,066 |
| 5-Person Families | 98 (16.2%) | $0 |
| 6-Person Families | 11 (1.8%) | $0 |
| 7+ Person Families | 9 (1.5%) | $0 |
| Total | 606 (100.0%) | $108,947 |
Family Income by Number of Earners in Muse
The median family income in Muse is $108,947, with families comprising 3+ earners (184) having the highest median family income of $198,929, while families with no earners (61) have the lowest median family income of $30,640, accounting for 30.4% and 10.1% of families, respectively.
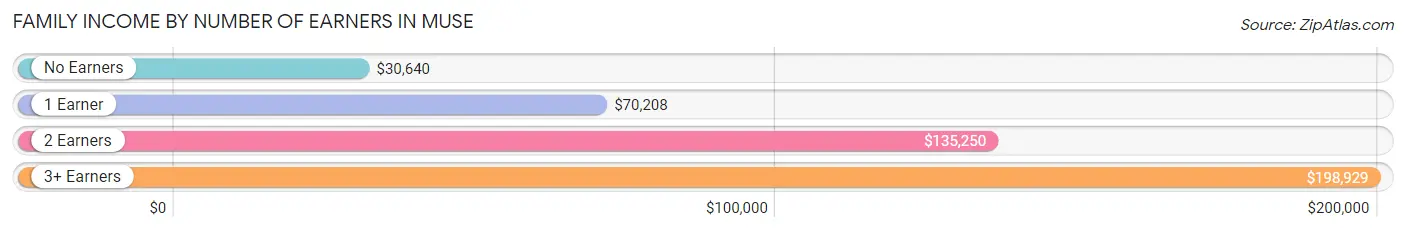
| Number of Earners | # Families | Median Income |
| No Earners | 61 (10.1%) | $30,640 |
| 1 Earner | 114 (18.8%) | $70,208 |
| 2 Earners | 247 (40.8%) | $135,250 |
| 3+ Earners | 184 (30.4%) | $198,929 |
| Total | 606 (100.0%) | $108,947 |
Household Income in Muse
Household Income Brackets in Muse
With 158 households falling in the category, the $50,000 to $74,999 income range is the most frequent in Muse, accounting for 19.7% of all households. In contrast, only 7 households (0.9%) fall into the $10,000 to $14,999 income bracket, making it the least populous group.
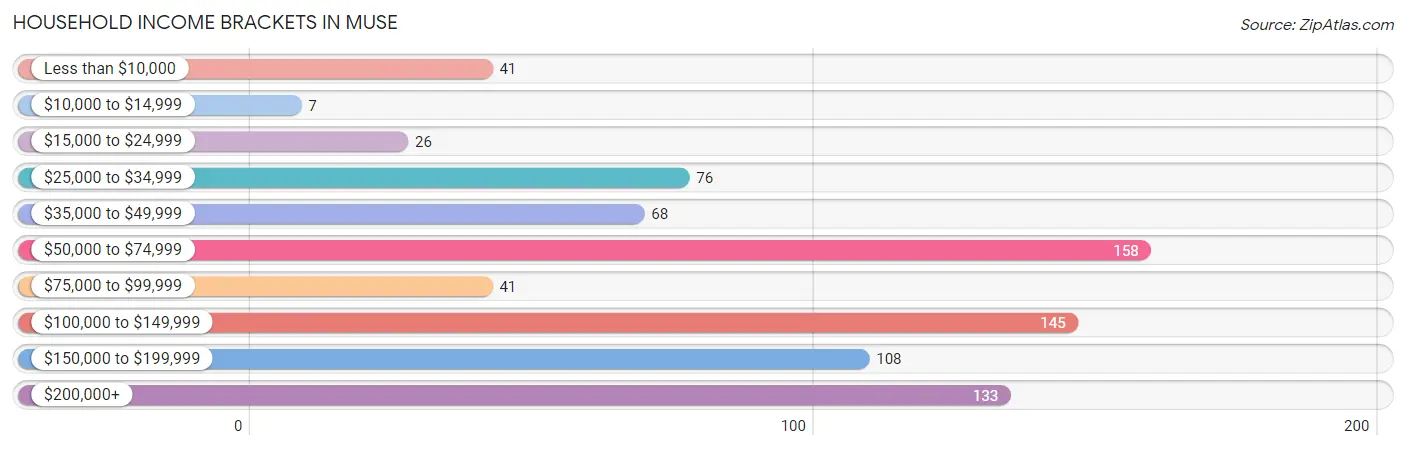
| Income Bracket | # Households | % Households |
| Less than $10,000 | 41 | 5.1% |
| $10,000 to $14,999 | 7 | 0.9% |
| $15,000 to $24,999 | 26 | 3.2% |
| $25,000 to $34,999 | 76 | 9.5% |
| $35,000 to $49,999 | 68 | 8.5% |
| $50,000 to $74,999 | 158 | 19.7% |
| $75,000 to $99,999 | 41 | 5.1% |
| $100,000 to $149,999 | 145 | 18.1% |
| $150,000 to $199,999 | 108 | 13.4% |
| $200,000+ | 133 | 16.6% |
Household Income by Householder Age in Muse
The median household income in Muse is $86,932, with the highest median household income of $132,188 found in the 25 to 44 years age bracket for the primary householder. A total of 212 households (26.4%) fall into this category. Meanwhile, the 15 to 24 years age bracket for the primary householder has the lowest median household income of $0, with 30 households (3.7%) in this group.
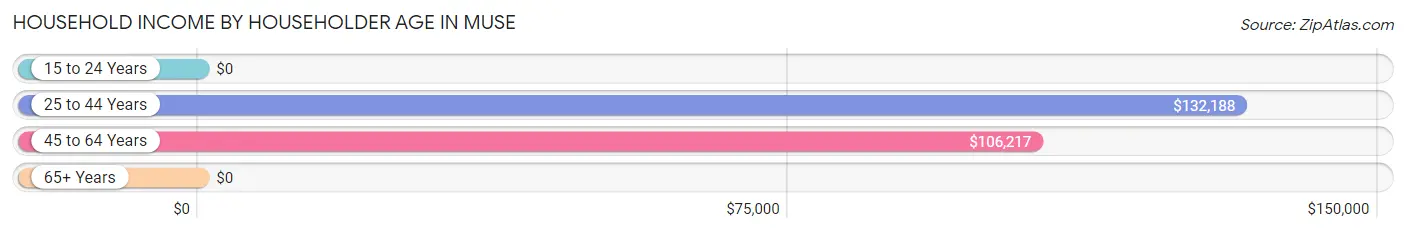
| Income Bracket | # Households | Median Income |
| 15 to 24 Years | 30 (3.7%) | $0 |
| 25 to 44 Years | 212 (26.4%) | $132,188 |
| 45 to 64 Years | 437 (54.4%) | $106,217 |
| 65+ Years | 124 (15.4%) | $0 |
| Total | 803 (100.0%) | $86,932 |
Poverty in Muse
Income Below Poverty by Sex and Age in Muse
With 5.8% poverty level for males and 3.5% for females among the residents of Muse, 16 and 17 year old males and 18 to 24 year old females are the most vulnerable to poverty, with 25 males (32.9%) and 30 females (12.0%) in their respective age groups living below the poverty level.
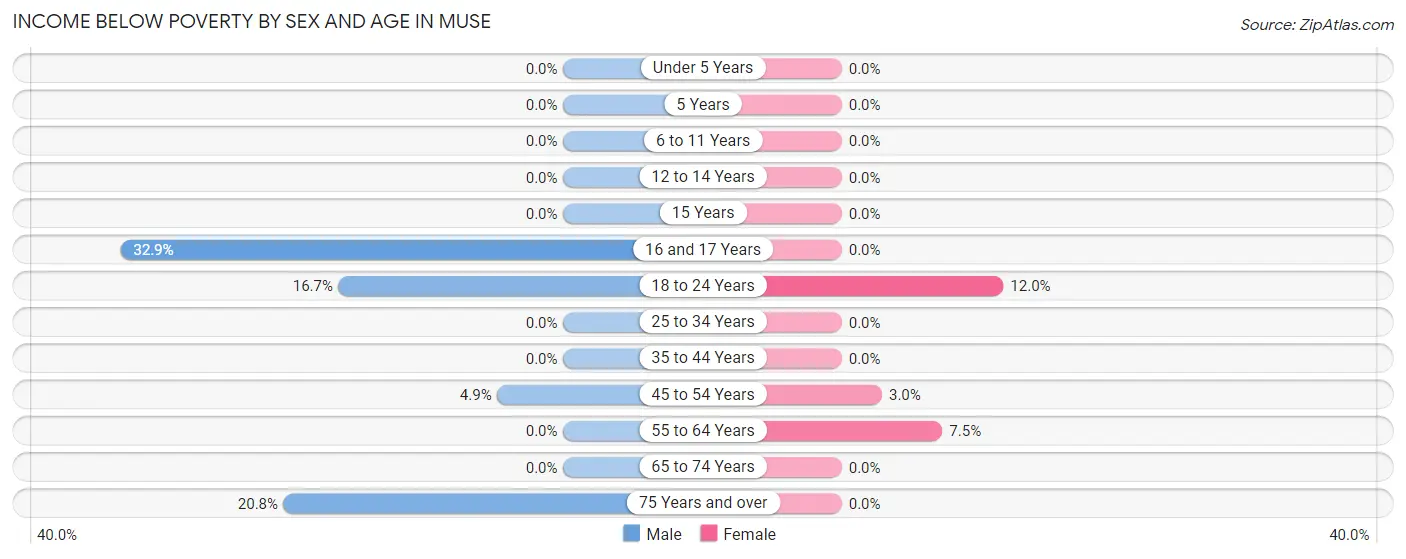
| Age Bracket | Male | Female |
| Under 5 Years | 0 (0.0%) | 0 (0.0%) |
| 5 Years | 0 (0.0%) | 0 (0.0%) |
| 6 to 11 Years | 0 (0.0%) | 0 (0.0%) |
| 12 to 14 Years | 0 (0.0%) | 0 (0.0%) |
| 15 Years | 0 (0.0%) | 0 (0.0%) |
| 16 and 17 Years | 25 (32.9%) | 0 (0.0%) |
| 18 to 24 Years | 15 (16.7%) | 30 (12.0%) |
| 25 to 34 Years | 0 (0.0%) | 0 (0.0%) |
| 35 to 44 Years | 0 (0.0%) | 0 (0.0%) |
| 45 to 54 Years | 9 (4.9%) | 8 (3.0%) |
| 55 to 64 Years | 0 (0.0%) | 13 (7.5%) |
| 65 to 74 Years | 0 (0.0%) | 0 (0.0%) |
| 75 Years and over | 11 (20.7%) | 0 (0.0%) |
| Total | 60 (5.8%) | 51 (3.5%) |
Income Above Poverty by Sex and Age in Muse
According to the poverty statistics in Muse, males aged under 5 years and females aged under 5 years are the age groups that are most secure financially, with 100.0% of males and 100.0% of females in these age groups living above the poverty line.
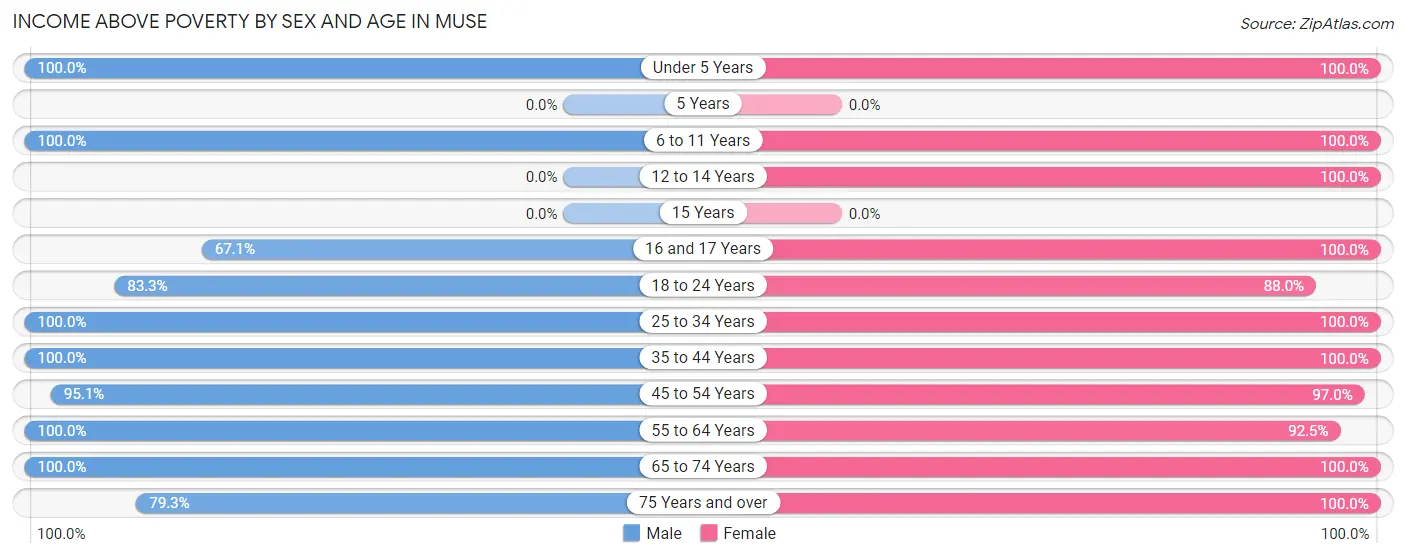
| Age Bracket | Male | Female |
| Under 5 Years | 44 (100.0%) | 111 (100.0%) |
| 5 Years | 0 (0.0%) | 0 (0.0%) |
| 6 to 11 Years | 108 (100.0%) | 121 (100.0%) |
| 12 to 14 Years | 0 (0.0%) | 40 (100.0%) |
| 15 Years | 0 (0.0%) | 0 (0.0%) |
| 16 and 17 Years | 51 (67.1%) | 127 (100.0%) |
| 18 to 24 Years | 75 (83.3%) | 220 (88.0%) |
| 25 to 34 Years | 152 (100.0%) | 131 (100.0%) |
| 35 to 44 Years | 99 (100.0%) | 101 (100.0%) |
| 45 to 54 Years | 175 (95.1%) | 260 (97.0%) |
| 55 to 64 Years | 190 (100.0%) | 161 (92.5%) |
| 65 to 74 Years | 31 (100.0%) | 82 (100.0%) |
| 75 Years and over | 42 (79.2%) | 47 (100.0%) |
| Total | 967 (94.2%) | 1,401 (96.5%) |
Income Below Poverty Among Married-Couple Families in Muse
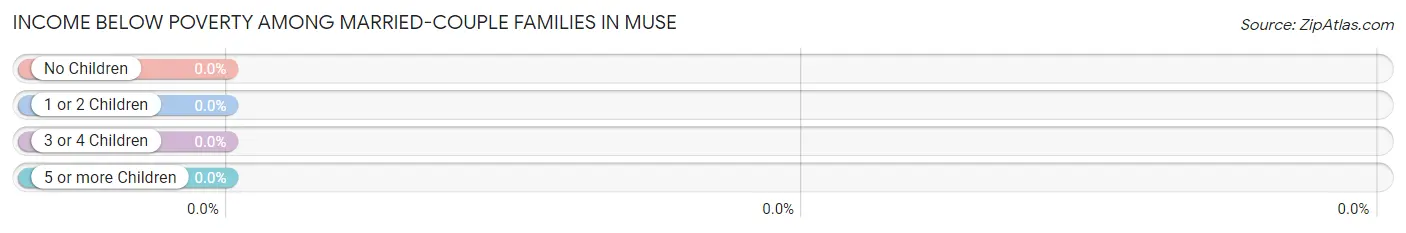
| Children | Above Poverty | Below Poverty |
| No Children | 270 (100.0%) | 0 (0.0%) |
| 1 or 2 Children | 233 (100.0%) | 0 (0.0%) |
| 3 or 4 Children | 32 (100.0%) | 0 (0.0%) |
| 5 or more Children | 0 (0.0%) | 0 (0.0%) |
| Total | 535 (100.0%) | 0 (0.0%) |
Income Below Poverty Among Single-Parent Households in Muse
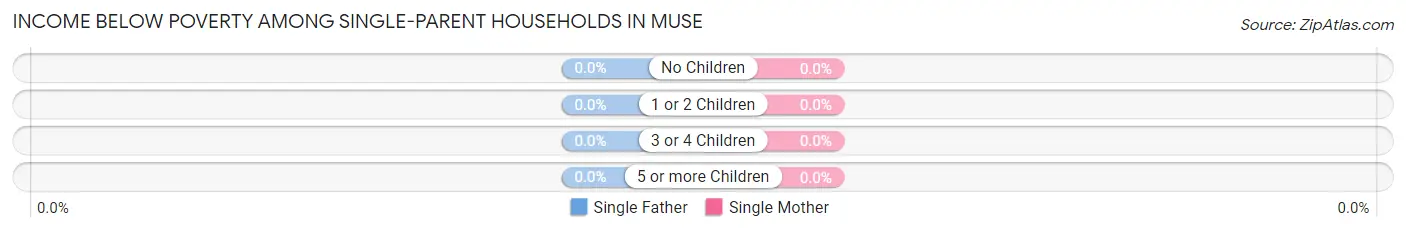
| Children | Single Father | Single Mother |
| No Children | 0 (0.0%) | 0 (0.0%) |
| 1 or 2 Children | 0 (0.0%) | 0 (0.0%) |
| 3 or 4 Children | 0 (0.0%) | 0 (0.0%) |
| 5 or more Children | 0 (0.0%) | 0 (0.0%) |
| Total | 0 (0.0%) | 0 (0.0%) |
Income Below Poverty Among Married-Couple vs Single-Parent Households in Muse
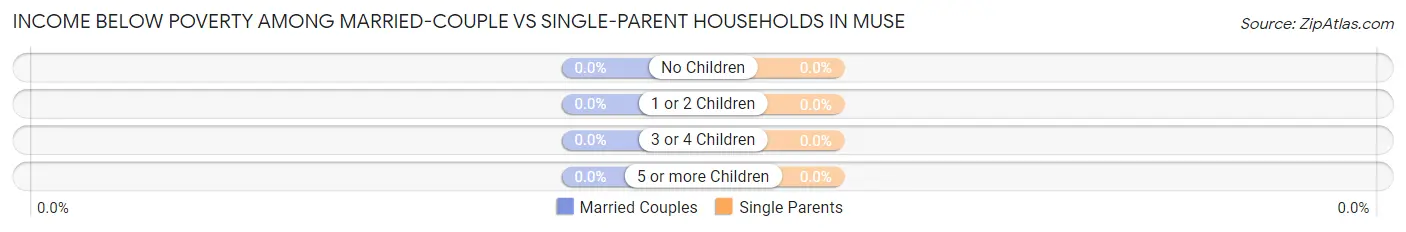
| Children | Married-Couple Families | Single-Parent Households |
| No Children | 0 (0.0%) | 0 (0.0%) |
| 1 or 2 Children | 0 (0.0%) | 0 (0.0%) |
| 3 or 4 Children | 0 (0.0%) | 0 (0.0%) |
| 5 or more Children | 0 (0.0%) | 0 (0.0%) |
| Total | 0 (0.0%) | 0 (0.0%) |
Race in Muse
The most populous races in Muse are White / Caucasian (2,316 | 92.6%), Asian (59 | 2.4%), and Some other Race (59 | 2.4%).
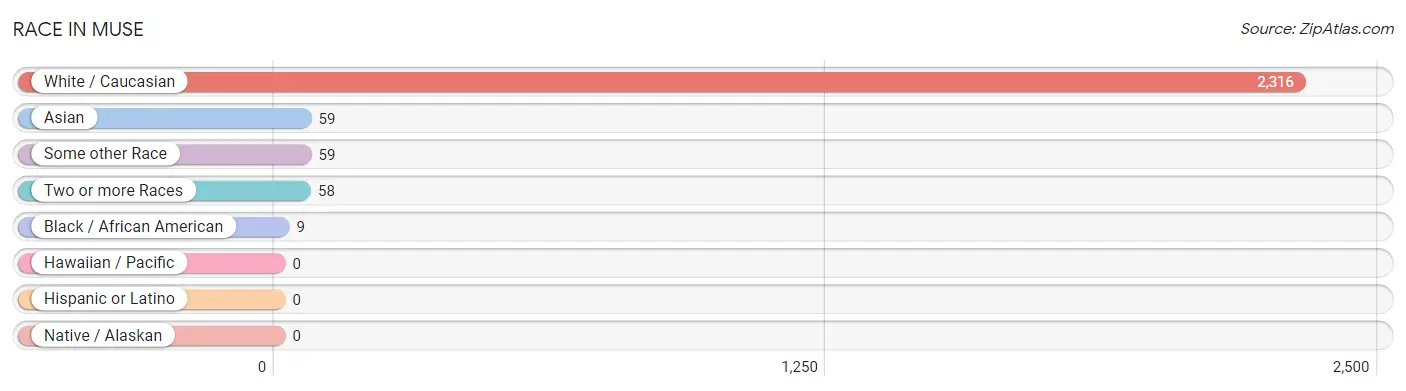
| Race | # Population | % Population |
| Asian | 59 | 2.4% |
| Black / African American | 9 | 0.4% |
| Hawaiian / Pacific | 0 | 0.0% |
| Hispanic or Latino | 0 | 0.0% |
| Native / Alaskan | 0 | 0.0% |
| White / Caucasian | 2,316 | 92.6% |
| Two or more Races | 58 | 2.3% |
| Some other Race | 59 | 2.4% |
| Total | 2,501 | 100.0% |
Ancestry in Muse
The most populous ancestries reported in Muse are German (643 | 25.7%), Italian (607 | 24.3%), Irish (549 | 22.0%), Polish (377 | 15.1%), and English (221 | 8.8%), together accounting for 95.8% of all Muse residents.
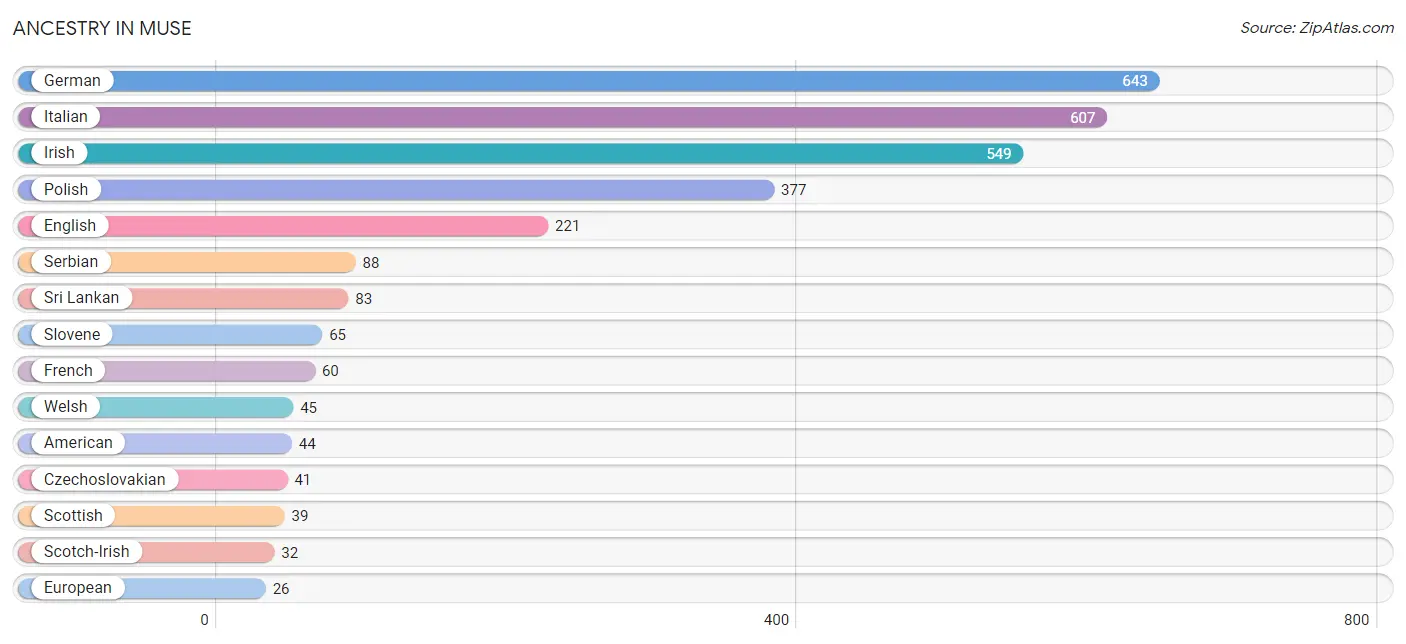
| Ancestry | # Population | % Population |
| American | 44 | 1.8% |
| Austrian | 9 | 0.4% |
| British | 23 | 0.9% |
| Carpatho Rusyn | 6 | 0.2% |
| Croatian | 12 | 0.5% |
| Czech | 4 | 0.2% |
| Czechoslovakian | 41 | 1.6% |
| Dutch | 6 | 0.2% |
| Eastern European | 7 | 0.3% |
| English | 221 | 8.8% |
| European | 26 | 1.0% |
| French | 60 | 2.4% |
| French Canadian | 22 | 0.9% |
| German | 643 | 25.7% |
| Greek | 24 | 1.0% |
| Hungarian | 24 | 1.0% |
| Irish | 549 | 22.0% |
| Italian | 607 | 24.3% |
| Korean | 5 | 0.2% |
| Lithuanian | 6 | 0.2% |
| Polish | 377 | 15.1% |
| Russian | 15 | 0.6% |
| Scotch-Irish | 32 | 1.3% |
| Scottish | 39 | 1.6% |
| Serbian | 88 | 3.5% |
| Slovak | 6 | 0.2% |
| Slovene | 65 | 2.6% |
| Sri Lankan | 83 | 3.3% |
| Swedish | 7 | 0.3% |
| Ukrainian | 23 | 0.9% |
| Welsh | 45 | 1.8% | View All 31 Rows |
Immigrants in Muse
The most numerous immigrant groups reported in Muse came from Asia (37 | 1.5%), South Eastern Asia (37 | 1.5%), Vietnam (32 | 1.3%), Europe (15 | 0.6%), and Italy (8 | 0.3%), together accounting for 5.2% of all Muse residents.
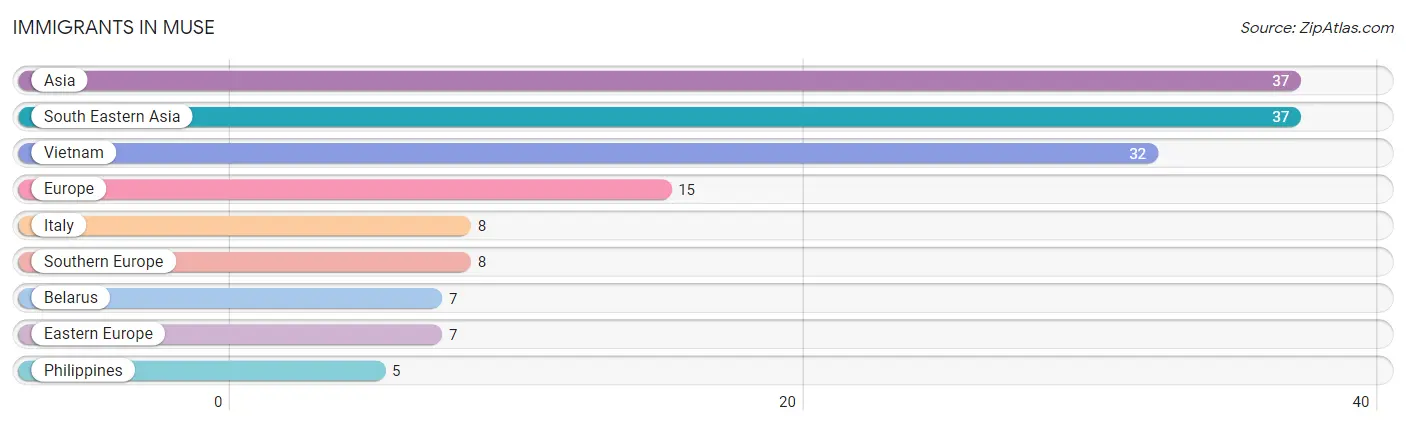
| Immigration Origin | # Population | % Population |
| Asia | 37 | 1.5% |
| Belarus | 7 | 0.3% |
| Eastern Europe | 7 | 0.3% |
| Europe | 15 | 0.6% |
| Italy | 8 | 0.3% |
| Philippines | 5 | 0.2% |
| South Eastern Asia | 37 | 1.5% |
| Southern Europe | 8 | 0.3% |
| Vietnam | 32 | 1.3% | View All 9 Rows |
Sex and Age in Muse
Sex and Age in Muse
The most populous age groups in Muse are 55 to 59 Years (115 | 11.2%) for men and 20 to 24 Years (239 | 16.2%) for women.
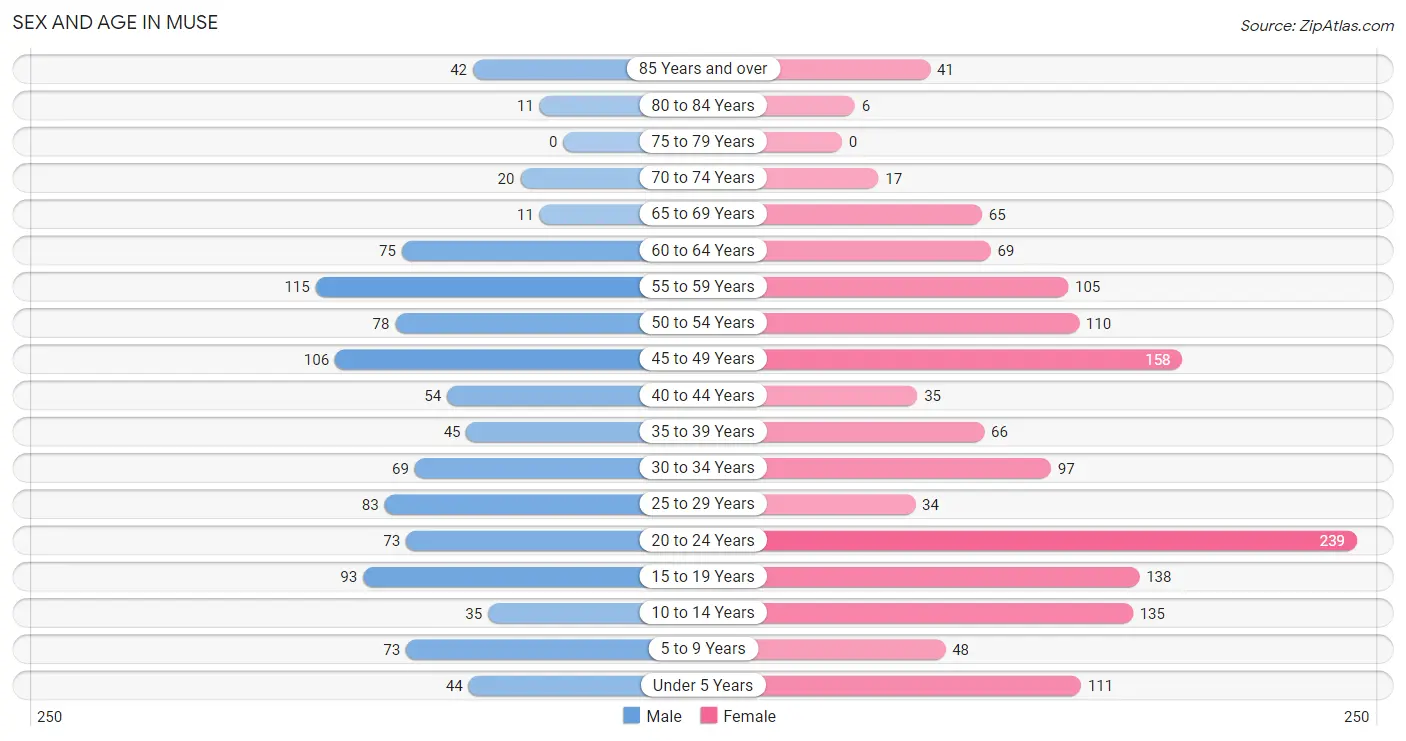
| Age Bracket | Male | Female |
| Under 5 Years | 44 (4.3%) | 111 (7.5%) |
| 5 to 9 Years | 73 (7.1%) | 48 (3.3%) |
| 10 to 14 Years | 35 (3.4%) | 135 (9.2%) |
| 15 to 19 Years | 93 (9.1%) | 138 (9.4%) |
| 20 to 24 Years | 73 (7.1%) | 239 (16.2%) |
| 25 to 29 Years | 83 (8.1%) | 34 (2.3%) |
| 30 to 34 Years | 69 (6.7%) | 97 (6.6%) |
| 35 to 39 Years | 45 (4.4%) | 66 (4.5%) |
| 40 to 44 Years | 54 (5.3%) | 35 (2.4%) |
| 45 to 49 Years | 106 (10.3%) | 158 (10.7%) |
| 50 to 54 Years | 78 (7.6%) | 110 (7.5%) |
| 55 to 59 Years | 115 (11.2%) | 105 (7.1%) |
| 60 to 64 Years | 75 (7.3%) | 69 (4.7%) |
| 65 to 69 Years | 11 (1.1%) | 65 (4.4%) |
| 70 to 74 Years | 20 (1.9%) | 17 (1.1%) |
| 75 to 79 Years | 0 (0.0%) | 0 (0.0%) |
| 80 to 84 Years | 11 (1.1%) | 6 (0.4%) |
| 85 Years and over | 42 (4.1%) | 41 (2.8%) |
| Total | 1,027 (100.0%) | 1,474 (100.0%) |
Families and Households in Muse
Median Family Size in Muse
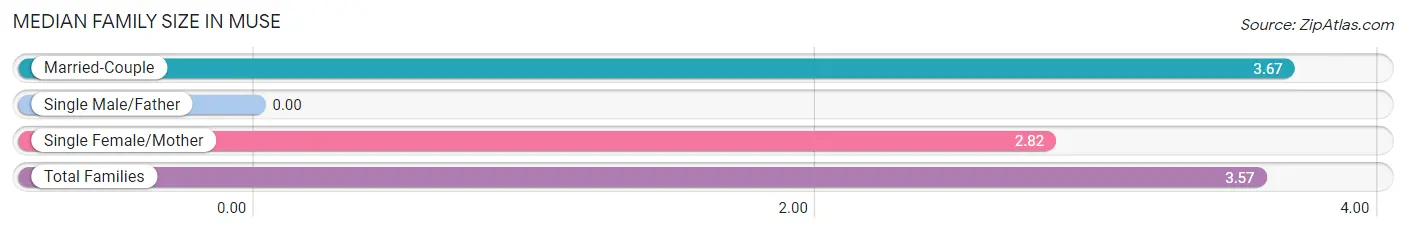
| Family Type | # Families | Family Size |
| Married-Couple | 535 (88.3%) | 3.67 |
| Single Male/Father | 0 (0.0%) | - |
| Single Female/Mother | 71 (11.7%) | 2.82 |
| Total Families | 606 (100.0%) | 3.57 |
Median Household Size in Muse
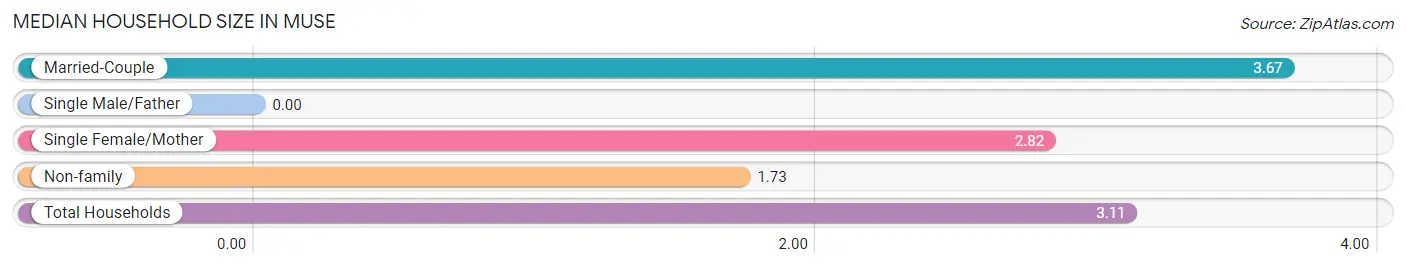
| Household Type | # Households | Household Size |
| Married-Couple | 535 (66.6%) | 3.67 |
| Single Male/Father | 0 (0.0%) | - |
| Single Female/Mother | 71 (8.8%) | 2.82 |
| Non-family | 197 (24.5%) | 1.73 |
| Total Households | 803 (100.0%) | 3.11 |
Household Size by Marriage Status in Muse
Out of a total of 803 households in Muse, 606 (75.5%) are family households, while 197 (24.5%) are nonfamily households. The most numerous type of family households are 2-person households, comprising 203, and the most common type of nonfamily households are 1-person households, comprising 114.
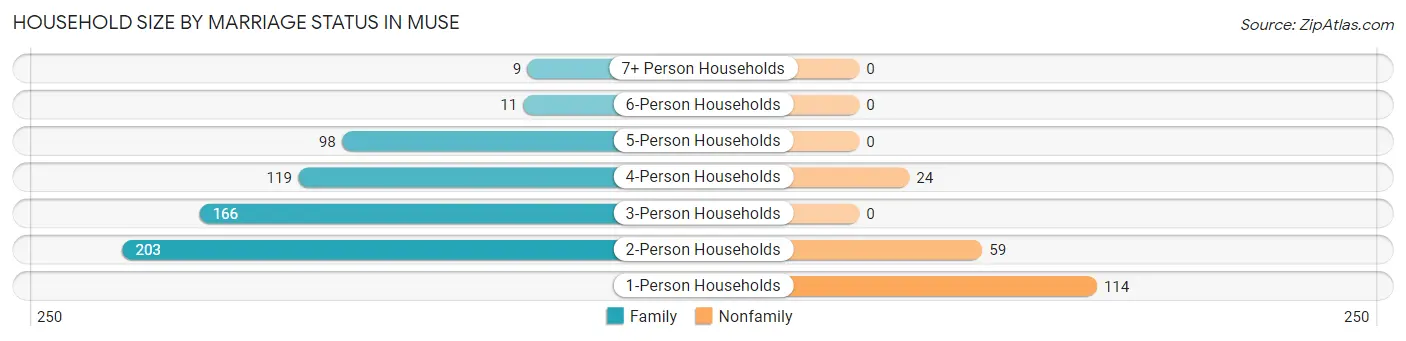
| Household Size | Family Households | Nonfamily Households |
| 1-Person Households | - | 114 (14.2%) |
| 2-Person Households | 203 (25.3%) | 59 (7.3%) |
| 3-Person Households | 166 (20.7%) | 0 (0.0%) |
| 4-Person Households | 119 (14.8%) | 24 (3.0%) |
| 5-Person Households | 98 (12.2%) | 0 (0.0%) |
| 6-Person Households | 11 (1.4%) | 0 (0.0%) |
| 7+ Person Households | 9 (1.1%) | 0 (0.0%) |
| Total | 606 (75.5%) | 197 (24.5%) |
Female Fertility in Muse
Fertility by Age in Muse
Average fertility rate in Muse is 59.0 births per 1,000 women. Women in the age bracket of 20 to 34 years have the highest fertility rate with 92.0 births per 1,000 women. Women in the age bracket of 20 to 34 years acount for 70.8% of all women with births.
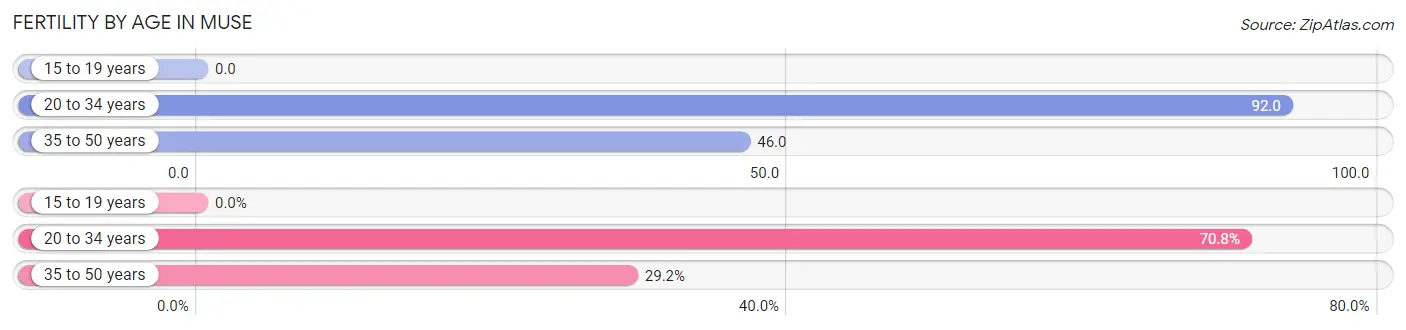
| Age Bracket | Women with Births | Births / 1,000 Women |
| 15 to 19 years | 0 (0.0%) | 0.0 |
| 20 to 34 years | 34 (70.8%) | 92.0 |
| 35 to 50 years | 14 (29.2%) | 46.0 |
| Total | 48 (100.0%) | 59.0 |
Fertility by Age by Marriage Status in Muse
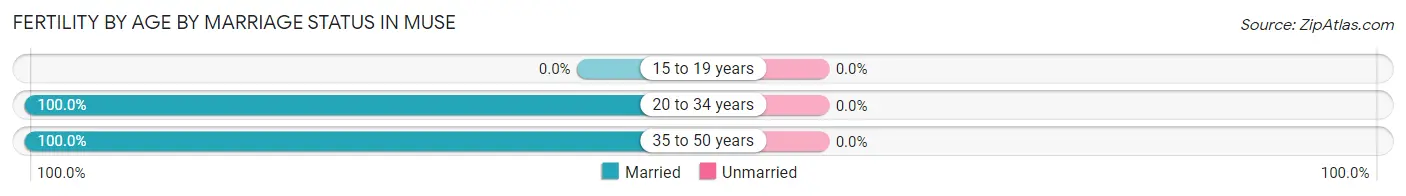
| Age Bracket | Married | Unmarried |
| 15 to 19 years | 0 (0.0%) | 0 (0.0%) |
| 20 to 34 years | 34 (100.0%) | 0 (0.0%) |
| 35 to 50 years | 14 (100.0%) | 0 (0.0%) |
| Total | 48 (100.0%) | 0 (0.0%) |
Fertility by Education in Muse
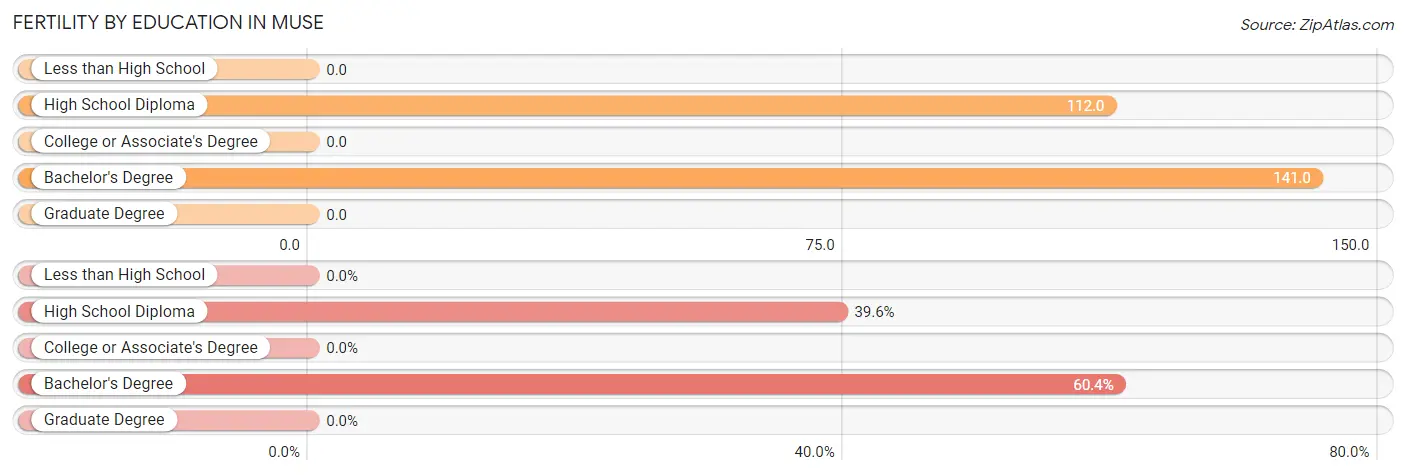
| Educational Attainment | Women with Births | Births / 1,000 Women |
| Less than High School | 0 (0.0%) | 0.0 |
| High School Diploma | 19 (39.6%) | 112.0 |
| College or Associate's Degree | 0 (0.0%) | 0.0 |
| Bachelor's Degree | 29 (60.4%) | 141.0 |
| Graduate Degree | 0 (0.0%) | 0.0 |
| Total | 48 (100.0%) | 59.0 |
Fertility by Education by Marriage Status in Muse
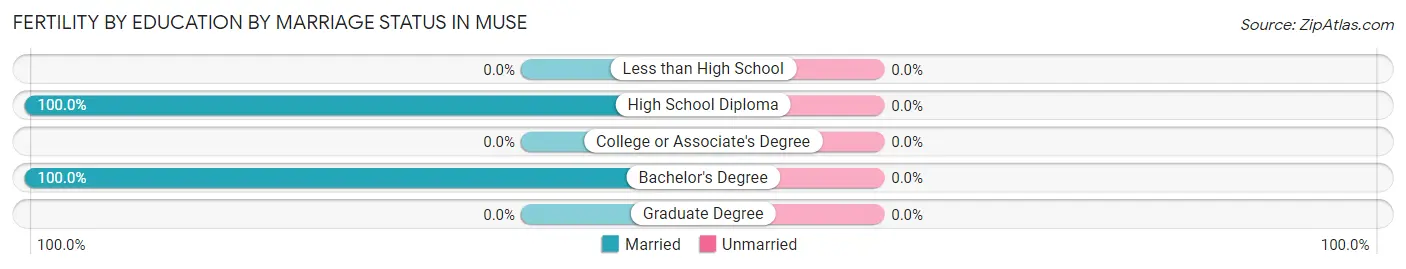
| Educational Attainment | Married | Unmarried |
| Less than High School | 0 (0.0%) | 0 (0.0%) |
| High School Diploma | 19 (100.0%) | 0 (0.0%) |
| College or Associate's Degree | 0 (0.0%) | 0 (0.0%) |
| Bachelor's Degree | 29 (100.0%) | 0 (0.0%) |
| Graduate Degree | 0 (0.0%) | 0 (0.0%) |
| Total | 48 (100.0%) | 0 (0.0%) |
Employment Characteristics in Muse
Employment by Class of Employer in Muse
Among the 1,468 employed individuals in Muse, private company employees (1,011 | 68.9%), local government employees (175 | 11.9%), and not-for-profit organizations (162 | 11.0%) make up the most common classes of employment.
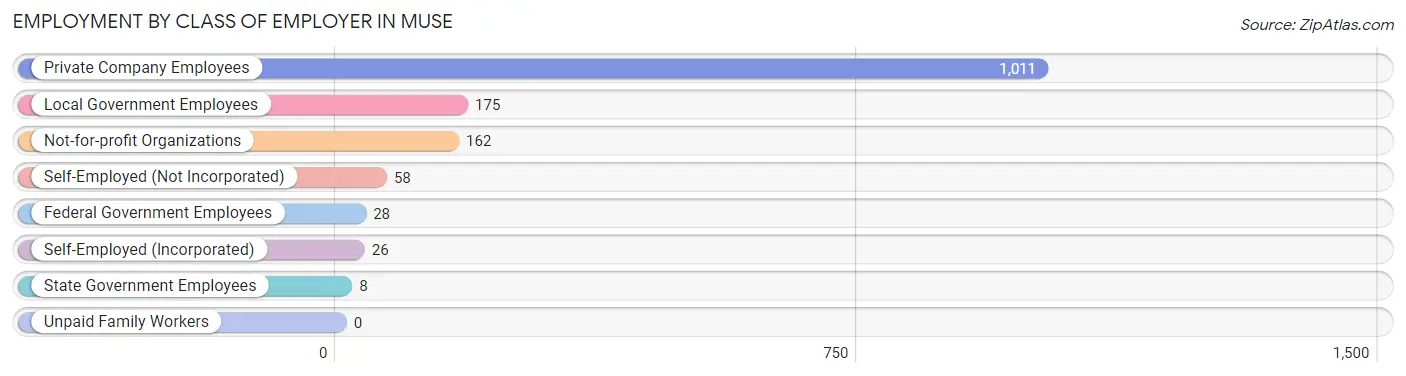
| Employer Class | # Employees | % Employees |
| Private Company Employees | 1,011 | 68.9% |
| Self-Employed (Incorporated) | 26 | 1.8% |
| Self-Employed (Not Incorporated) | 58 | 4.0% |
| Not-for-profit Organizations | 162 | 11.0% |
| Local Government Employees | 175 | 11.9% |
| State Government Employees | 8 | 0.5% |
| Federal Government Employees | 28 | 1.9% |
| Unpaid Family Workers | 0 | 0.0% |
| Total | 1,468 | 100.0% |
Employment Status by Age in Muse
According to the labor force statistics for Muse, out of the total population over 16 years of age (2,055), 74.2% or 1,525 individuals are in the labor force, with 3.3% or 50 of them unemployed. The age group with the highest labor force participation rate is 25 to 29 years, with 100.0% or 117 individuals in the labor force. Within the labor force, the 65 to 74 years age range has the highest percentage of unemployed individuals, with 35.9% or 14 of them being unemployed.
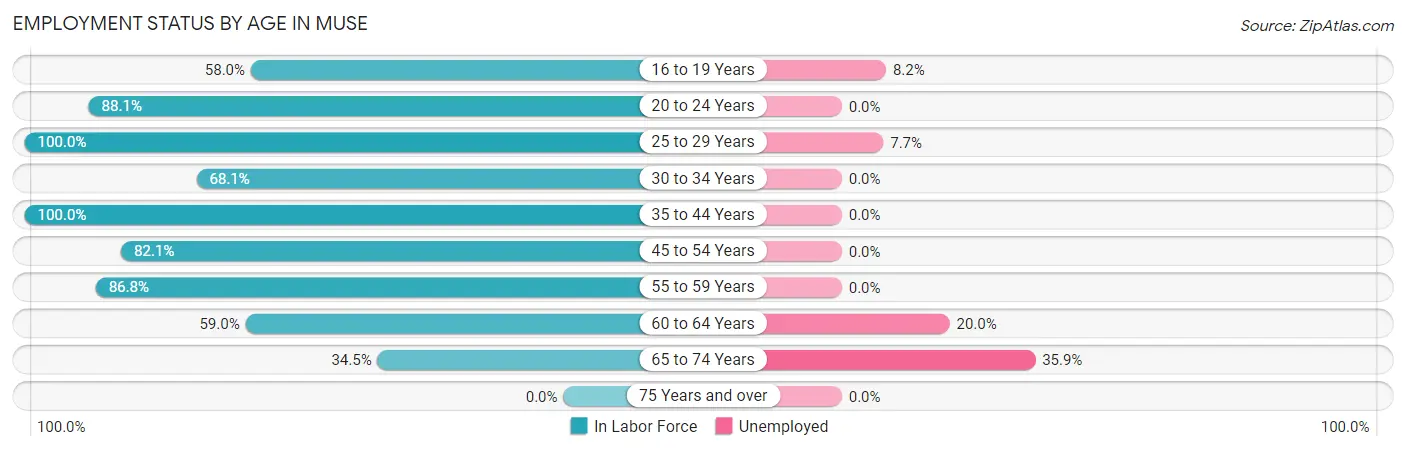
| Age Bracket | In Labor Force | Unemployed |
| 16 to 19 Years | 134 (58.0%) | 11 (8.2%) |
| 20 to 24 Years | 275 (88.1%) | 0 (0.0%) |
| 25 to 29 Years | 117 (100.0%) | 9 (7.7%) |
| 30 to 34 Years | 113 (68.1%) | 0 (0.0%) |
| 35 to 44 Years | 200 (100.0%) | 0 (0.0%) |
| 45 to 54 Years | 371 (82.1%) | 0 (0.0%) |
| 55 to 59 Years | 191 (86.8%) | 0 (0.0%) |
| 60 to 64 Years | 85 (59.0%) | 17 (20.0%) |
| 65 to 74 Years | 39 (34.5%) | 14 (35.9%) |
| 75 Years and over | 0 (0.0%) | 0 (0.0%) |
| Total | 1,525 (74.2%) | 50 (3.3%) |
Employment Status by Educational Attainment in Muse
According to labor force statistics for Muse, 82.9% of individuals (1,077) out of the total population between 25 and 64 years of age (1,299) are in the labor force, with 2.4% or 26 of them being unemployed. The group with the highest labor force participation rate are those with the educational attainment of less than high school, with 100.0% or 22 individuals in the labor force. Within the labor force, individuals with bachelor's degree or higher education have the highest percentage of unemployment, with 3.7% or 18 of them being unemployed.
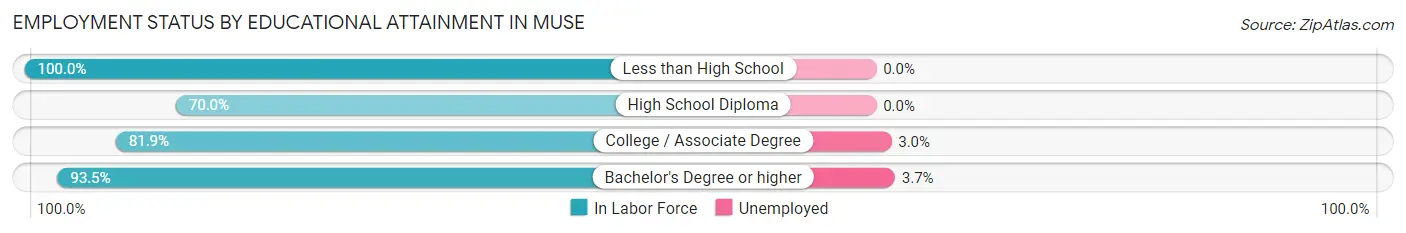
| Educational Attainment | In Labor Force | Unemployed |
| Less than High School | 22 (100.0%) | 0 (0.0%) |
| High School Diploma | 298 (70.0%) | 0 (0.0%) |
| College / Associate Degree | 271 (81.9%) | 10 (3.0%) |
| Bachelor's Degree or higher | 486 (93.5%) | 19 (3.7%) |
| Total | 1,077 (82.9%) | 31 (2.4%) |
Employment Occupations by Sex in Muse
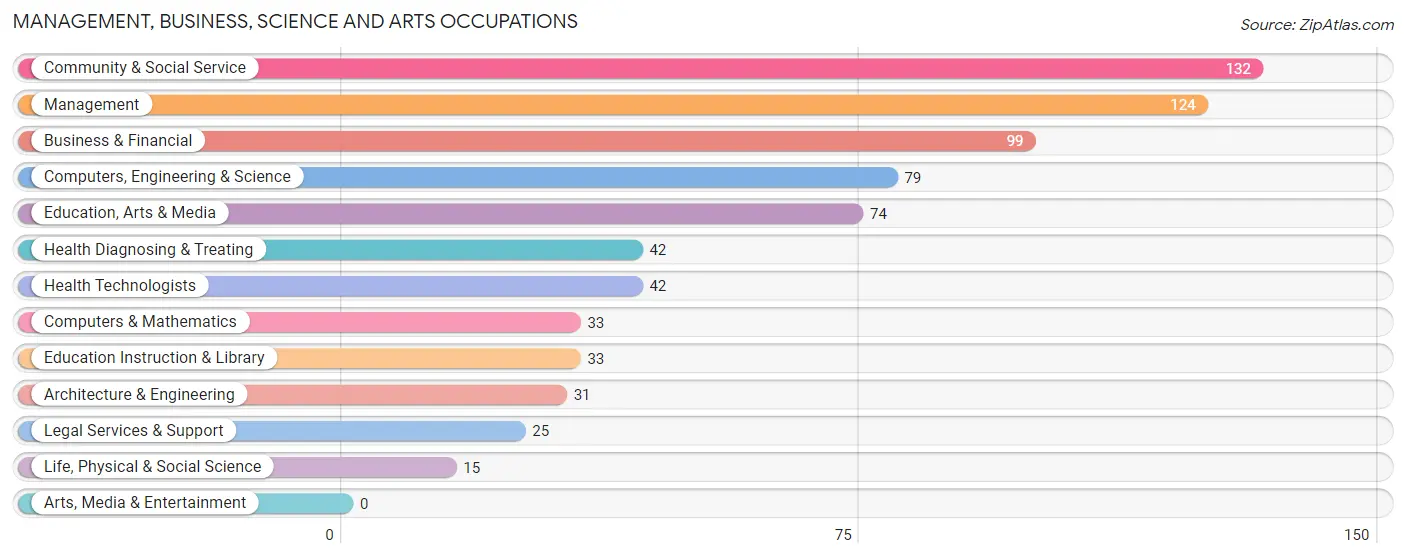
Management, Business, Science and Arts Occupations
The most common Management, Business, Science and Arts occupations in Muse are Community & Social Service (132 | 9.0%), Management (124 | 8.4%), Business & Financial (99 | 6.7%), Computers, Engineering & Science (79 | 5.4%), and Education, Arts & Media (74 | 5.0%).
Management, Business, Science and Arts Occupations by Sex
Within the Management, Business, Science and Arts occupations in Muse, the most male-oriented occupations are Computers, Engineering & Science (100.0%), Computers & Mathematics (100.0%), and Architecture & Engineering (100.0%), while the most female-oriented occupations are Legal Services & Support (100.0%), Education, Arts & Media (90.5%), and Community & Social Service (86.4%).
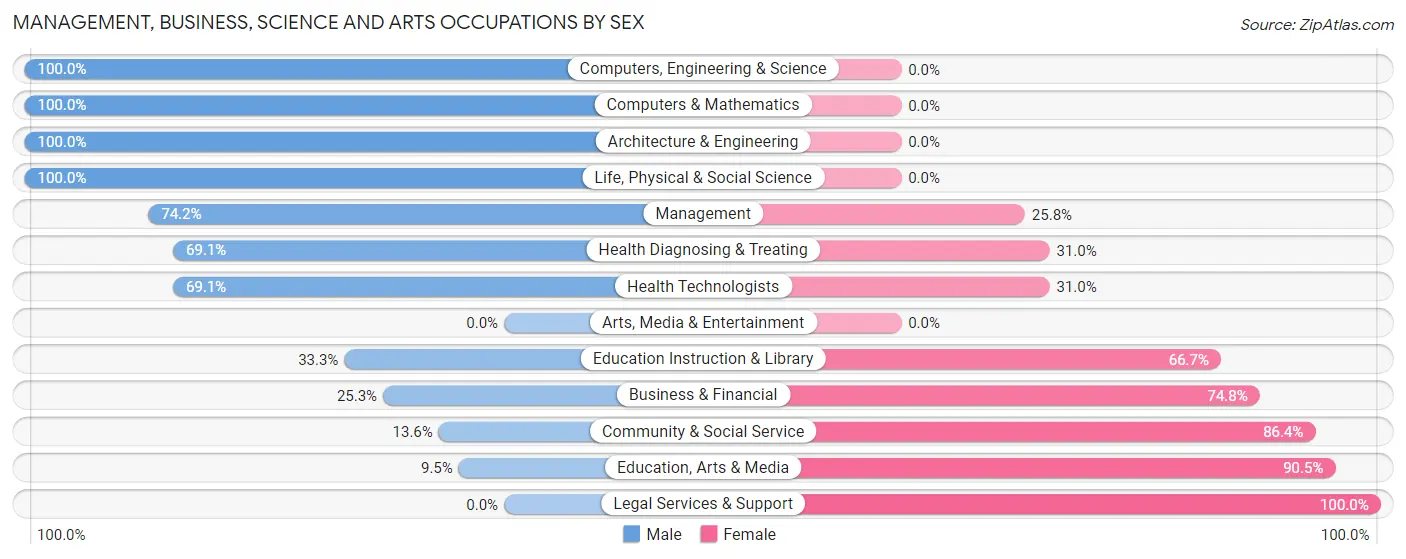
| Occupation | Male | Female |
| Management | 92 (74.2%) | 32 (25.8%) |
| Business & Financial | 25 (25.3%) | 74 (74.8%) |
| Computers, Engineering & Science | 79 (100.0%) | 0 (0.0%) |
| Computers & Mathematics | 33 (100.0%) | 0 (0.0%) |
| Architecture & Engineering | 31 (100.0%) | 0 (0.0%) |
| Life, Physical & Social Science | 15 (100.0%) | 0 (0.0%) |
| Community & Social Service | 18 (13.6%) | 114 (86.4%) |
| Education, Arts & Media | 7 (9.5%) | 67 (90.5%) |
| Legal Services & Support | 0 (0.0%) | 25 (100.0%) |
| Education Instruction & Library | 11 (33.3%) | 22 (66.7%) |
| Arts, Media & Entertainment | 0 (0.0%) | 0 (0.0%) |
| Health Diagnosing & Treating | 29 (69.1%) | 13 (30.9%) |
| Health Technologists | 29 (69.1%) | 13 (30.9%) |
| Total (Category) | 243 (51.0%) | 233 (48.9%) |
| Total (Overall) | 641 (43.5%) | 833 (56.5%) |
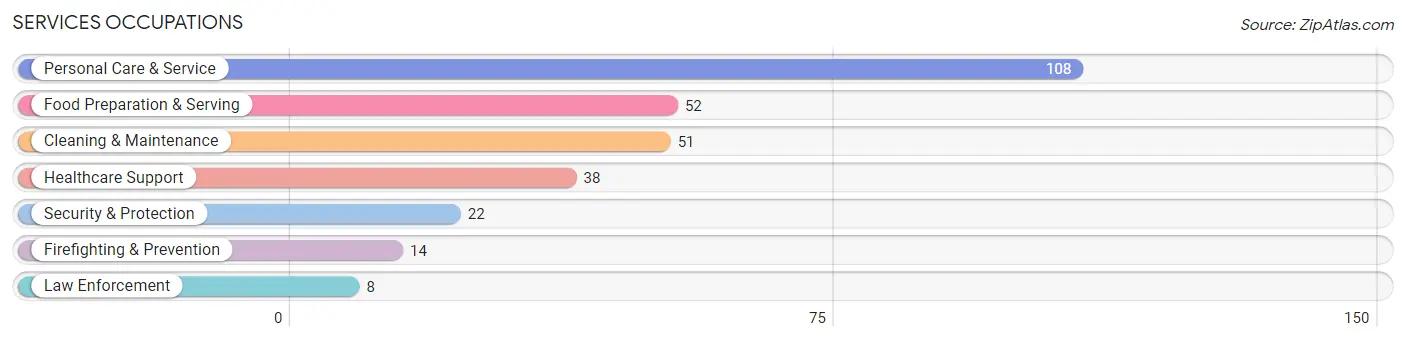
Services Occupations
The most common Services occupations in Muse are Personal Care & Service (108 | 7.3%), Food Preparation & Serving (52 | 3.5%), Cleaning & Maintenance (51 | 3.5%), Healthcare Support (38 | 2.6%), and Security & Protection (22 | 1.5%).
Services Occupations by Sex
Within the Services occupations in Muse, the most male-oriented occupations are Security & Protection (100.0%), Firefighting & Prevention (100.0%), and Law Enforcement (100.0%), while the most female-oriented occupations are Healthcare Support (100.0%), Personal Care & Service (84.3%), and Food Preparation & Serving (82.7%).
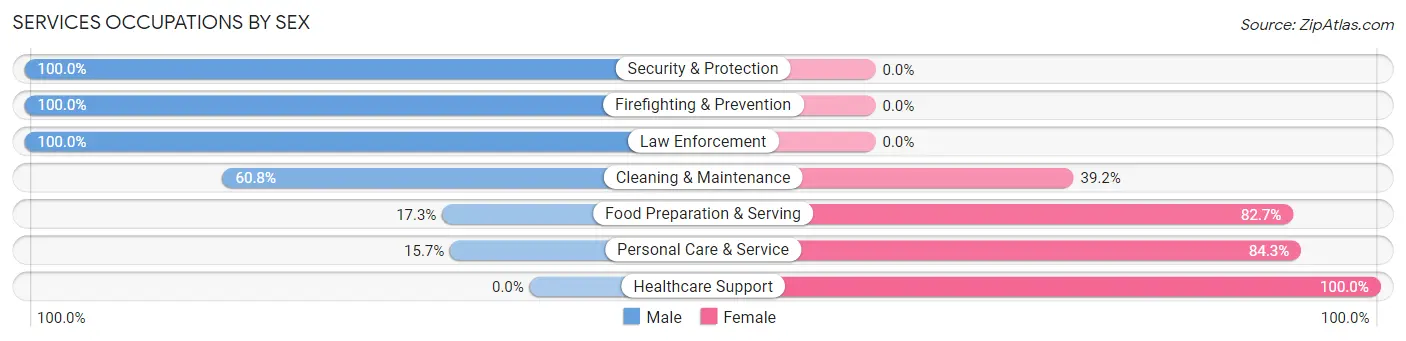
| Occupation | Male | Female |
| Healthcare Support | 0 (0.0%) | 38 (100.0%) |
| Security & Protection | 22 (100.0%) | 0 (0.0%) |
| Firefighting & Prevention | 14 (100.0%) | 0 (0.0%) |
| Law Enforcement | 8 (100.0%) | 0 (0.0%) |
| Food Preparation & Serving | 9 (17.3%) | 43 (82.7%) |
| Cleaning & Maintenance | 31 (60.8%) | 20 (39.2%) |
| Personal Care & Service | 17 (15.7%) | 91 (84.3%) |
| Total (Category) | 79 (29.1%) | 192 (70.9%) |
| Total (Overall) | 641 (43.5%) | 833 (56.5%) |
Sales and Office Occupations
The most common Sales and Office occupations in Muse are Sales & Related (276 | 18.7%), and Office & Administration (231 | 15.7%).
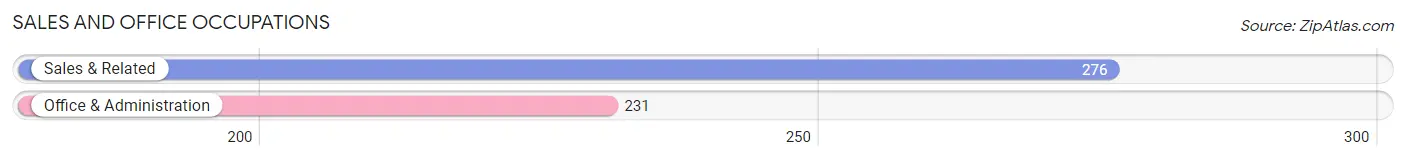
Sales and Office Occupations by Sex

| Occupation | Male | Female |
| Sales & Related | 90 (32.6%) | 186 (67.4%) |
| Office & Administration | 21 (9.1%) | 210 (90.9%) |
| Total (Category) | 111 (21.9%) | 396 (78.1%) |
| Total (Overall) | 641 (43.5%) | 833 (56.5%) |
Natural Resources, Construction and Maintenance Occupations
The most common Natural Resources, Construction and Maintenance occupations in Muse are Construction & Extraction (85 | 5.8%), and Installation, Maintenance & Repair (21 | 1.4%).
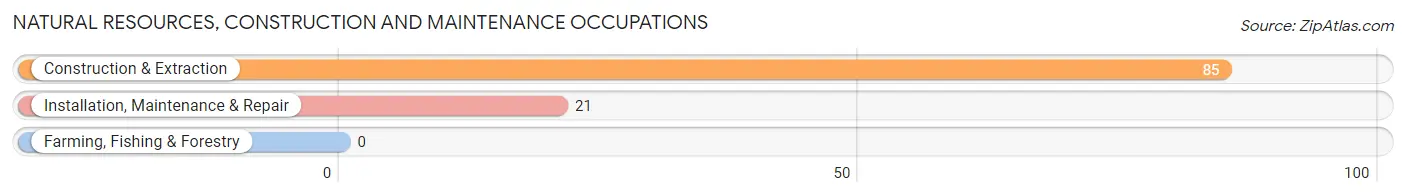
Natural Resources, Construction and Maintenance Occupations by Sex
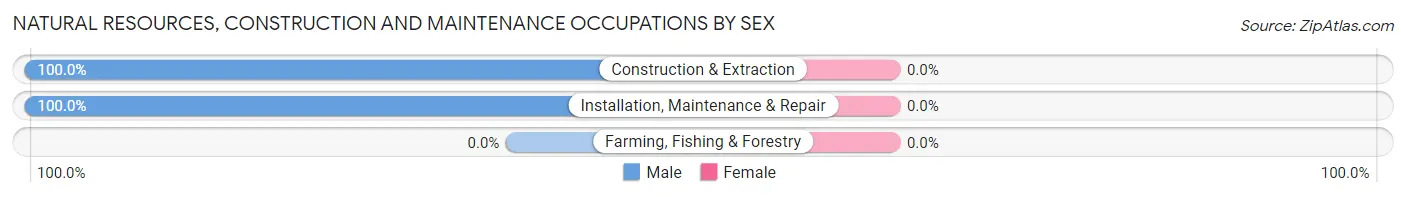
| Occupation | Male | Female |
| Farming, Fishing & Forestry | 0 (0.0%) | 0 (0.0%) |
| Construction & Extraction | 85 (100.0%) | 0 (0.0%) |
| Installation, Maintenance & Repair | 21 (100.0%) | 0 (0.0%) |
| Total (Category) | 106 (100.0%) | 0 (0.0%) |
| Total (Overall) | 641 (43.5%) | 833 (56.5%) |
Production, Transportation and Moving Occupations
The most common Production, Transportation and Moving occupations in Muse are Transportation (53 | 3.6%), Production (41 | 2.8%), and Material Moving (20 | 1.4%).
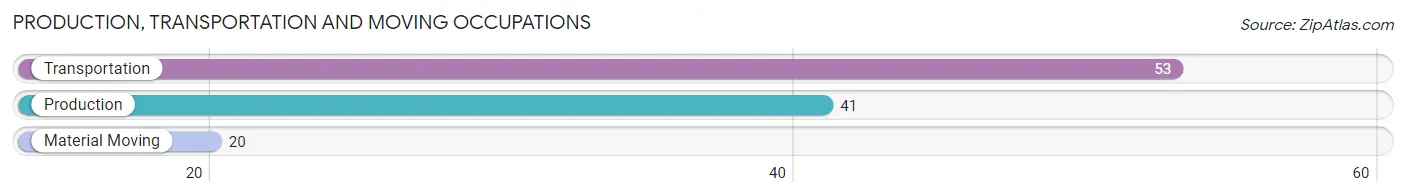
Production, Transportation and Moving Occupations by Sex
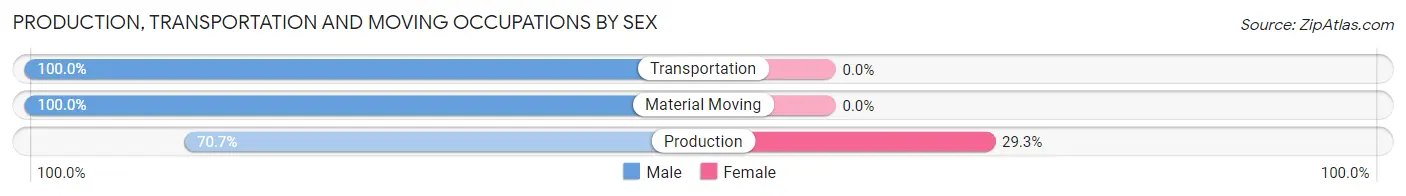
| Occupation | Male | Female |
| Production | 29 (70.7%) | 12 (29.3%) |
| Transportation | 53 (100.0%) | 0 (0.0%) |
| Material Moving | 20 (100.0%) | 0 (0.0%) |
| Total (Category) | 102 (89.5%) | 12 (10.5%) |
| Total (Overall) | 641 (43.5%) | 833 (56.5%) |
Employment Industries by Sex in Muse
Employment Industries in Muse
The major employment industries in Muse include Retail Trade (211 | 14.3%), Public Administration (152 | 10.3%), Professional & Scientific (137 | 9.3%), Finance & Insurance (111 | 7.5%), and Health Care & Social Assistance (98 | 6.7%).
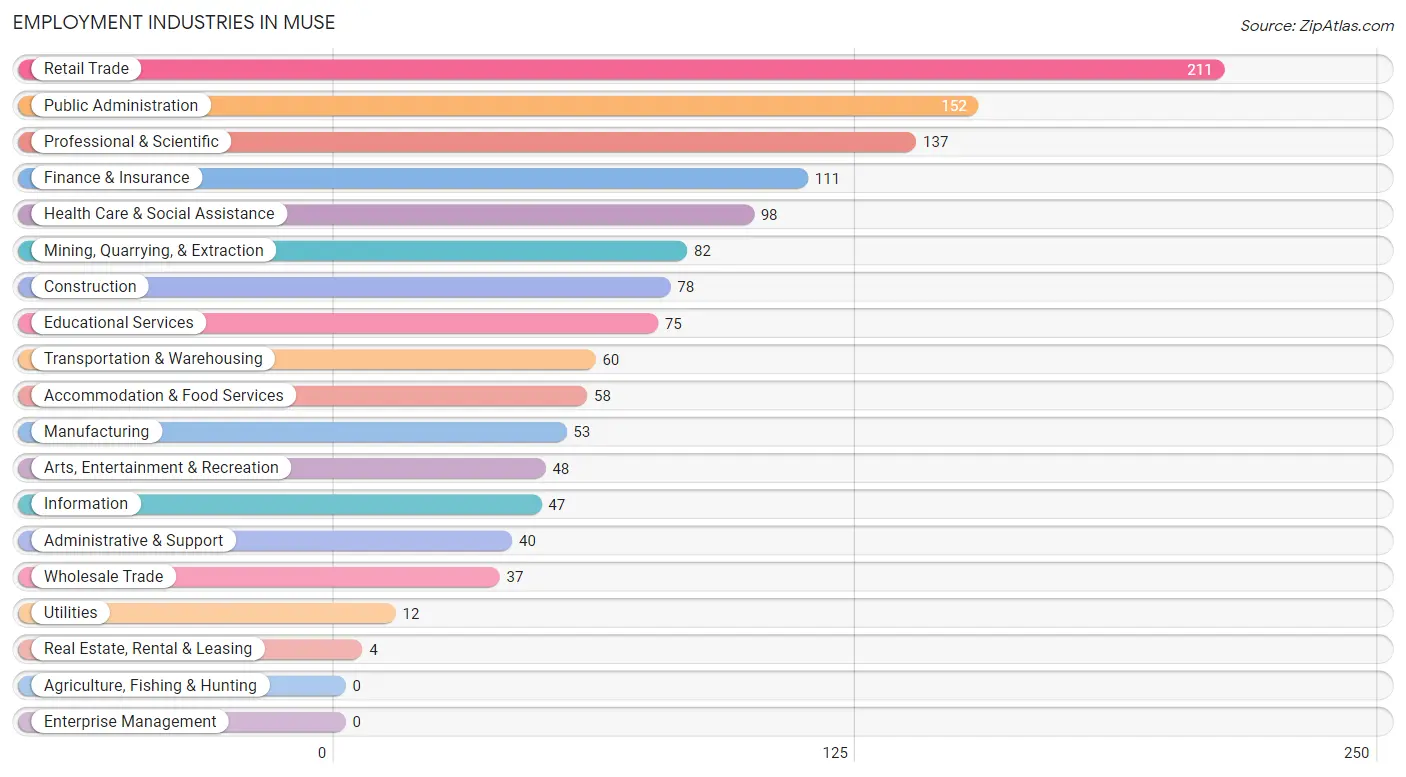
Employment Industries by Sex in Muse
The Muse industries that see more men than women are Mining, Quarrying, & Extraction (100.0%), Construction (100.0%), and Wholesale Trade (100.0%), whereas the industries that tend to have a higher number of women are Utilities (100.0%), Administrative & Support (100.0%), and Arts, Entertainment & Recreation (81.2%).
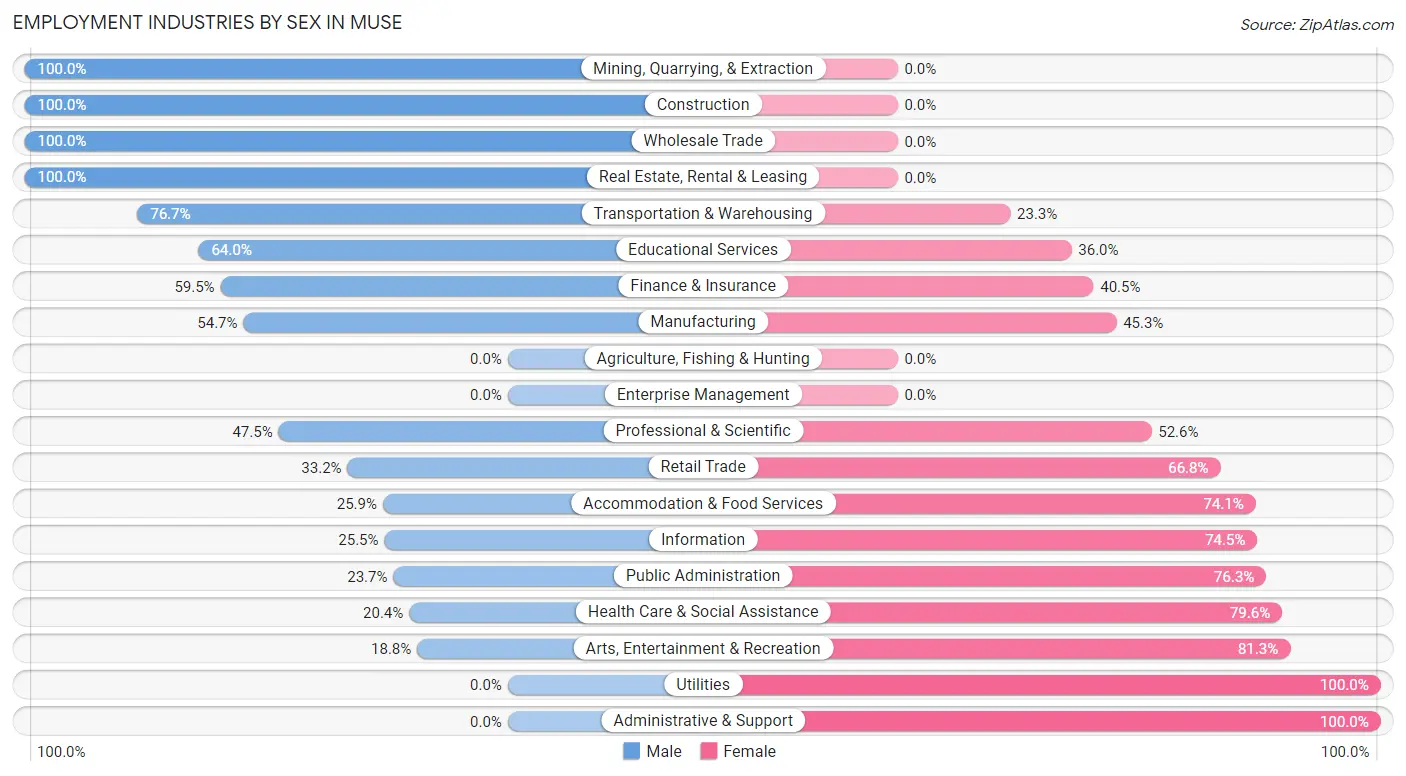
| Industry | Male | Female |
| Agriculture, Fishing & Hunting | 0 (0.0%) | 0 (0.0%) |
| Mining, Quarrying, & Extraction | 82 (100.0%) | 0 (0.0%) |
| Construction | 78 (100.0%) | 0 (0.0%) |
| Manufacturing | 29 (54.7%) | 24 (45.3%) |
| Wholesale Trade | 37 (100.0%) | 0 (0.0%) |
| Retail Trade | 70 (33.2%) | 141 (66.8%) |
| Transportation & Warehousing | 46 (76.7%) | 14 (23.3%) |
| Utilities | 0 (0.0%) | 12 (100.0%) |
| Information | 12 (25.5%) | 35 (74.5%) |
| Finance & Insurance | 66 (59.5%) | 45 (40.5%) |
| Real Estate, Rental & Leasing | 4 (100.0%) | 0 (0.0%) |
| Professional & Scientific | 65 (47.4%) | 72 (52.5%) |
| Enterprise Management | 0 (0.0%) | 0 (0.0%) |
| Administrative & Support | 0 (0.0%) | 40 (100.0%) |
| Educational Services | 48 (64.0%) | 27 (36.0%) |
| Health Care & Social Assistance | 20 (20.4%) | 78 (79.6%) |
| Arts, Entertainment & Recreation | 9 (18.8%) | 39 (81.2%) |
| Accommodation & Food Services | 15 (25.9%) | 43 (74.1%) |
| Public Administration | 36 (23.7%) | 116 (76.3%) |
| Total | 641 (43.5%) | 833 (56.5%) |
Education in Muse
School Enrollment in Muse
The most common levels of schooling among the 639 students in Muse are high school (214 | 33.5%), college / undergraduate (144 | 22.5%), and elementary school (125 | 19.6%).
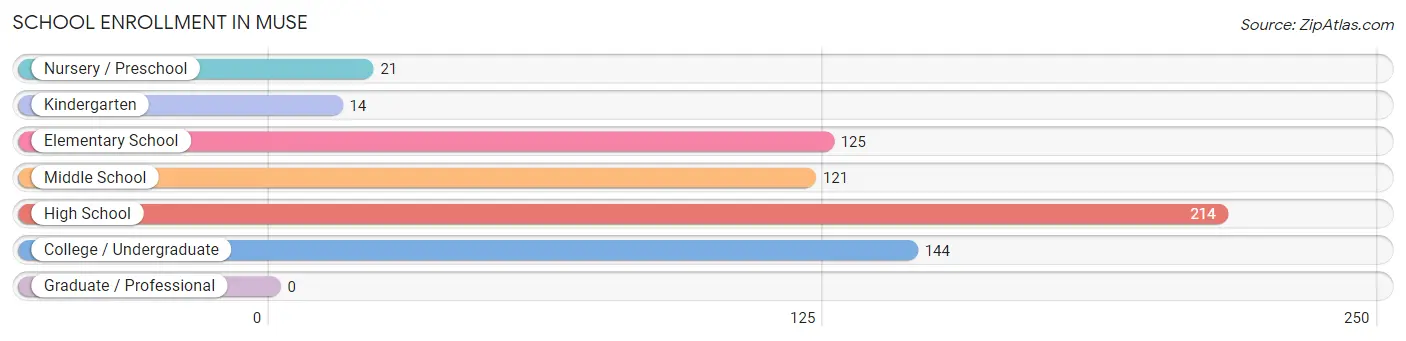
| School Level | # Students | % Students |
| Nursery / Preschool | 21 | 3.3% |
| Kindergarten | 14 | 2.2% |
| Elementary School | 125 | 19.6% |
| Middle School | 121 | 18.9% |
| High School | 214 | 33.5% |
| College / Undergraduate | 144 | 22.5% |
| Graduate / Professional | 0 | 0.0% |
| Total | 639 | 100.0% |
School Enrollment by Age by Funding Source in Muse
Out of a total of 639 students who are enrolled in schools in Muse, 67 (10.5%) attend a private institution, while the remaining 572 (89.5%) are enrolled in public schools. The age group of 35 years and over has the highest likelihood of being enrolled in private schools, with 5 (100.0% in the age bracket) enrolled. Conversely, the age group of 10 to 14 year olds has the lowest likelihood of being enrolled in a private school, with 170 (100.0% in the age bracket) attending a public institution.
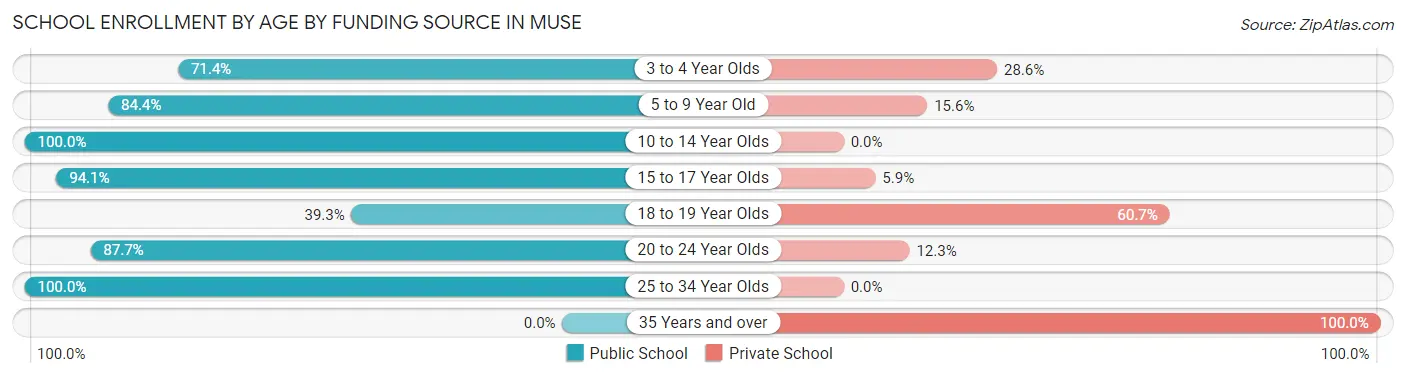
| Age Bracket | Public School | Private School |
| 3 to 4 Year Olds | 15 (71.4%) | 6 (28.6%) |
| 5 to 9 Year Old | 76 (84.4%) | 14 (15.6%) |
| 10 to 14 Year Olds | 170 (100.0%) | 0 (0.0%) |
| 15 to 17 Year Olds | 191 (94.1%) | 12 (5.9%) |
| 18 to 19 Year Olds | 11 (39.3%) | 17 (60.7%) |
| 20 to 24 Year Olds | 93 (87.7%) | 13 (12.3%) |
| 25 to 34 Year Olds | 16 (100.0%) | 0 (0.0%) |
| 35 Years and over | 0 (0.0%) | 5 (100.0%) |
| Total | 572 (89.5%) | 67 (10.5%) |
Educational Attainment by Field of Study in Muse
Business (120 | 20.8%), arts & humanities (88 | 15.2%), education (63 | 10.9%), computers & mathematics (41 | 7.1%), and engineering (40 | 6.9%) are the most common fields of study among 577 individuals in Muse who have obtained a bachelor's degree or higher.
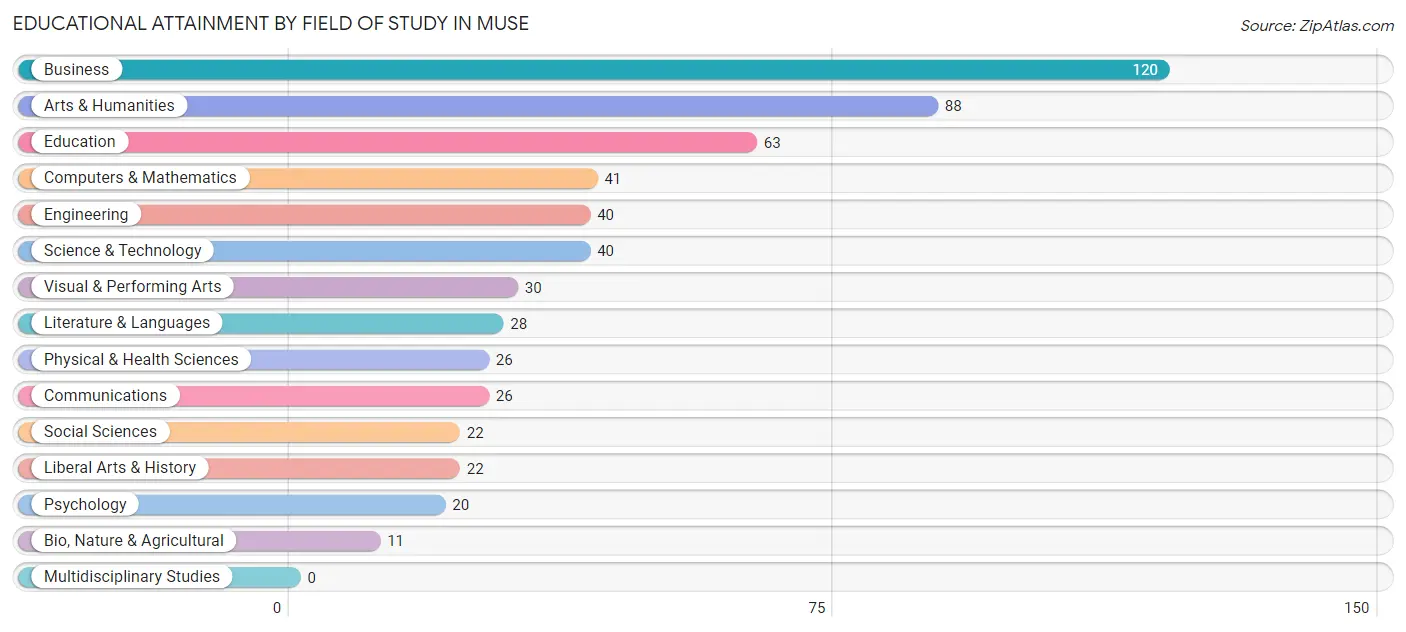
| Field of Study | # Graduates | % Graduates |
| Computers & Mathematics | 41 | 7.1% |
| Bio, Nature & Agricultural | 11 | 1.9% |
| Physical & Health Sciences | 26 | 4.5% |
| Psychology | 20 | 3.5% |
| Social Sciences | 22 | 3.8% |
| Engineering | 40 | 6.9% |
| Multidisciplinary Studies | 0 | 0.0% |
| Science & Technology | 40 | 6.9% |
| Business | 120 | 20.8% |
| Education | 63 | 10.9% |
| Literature & Languages | 28 | 4.9% |
| Liberal Arts & History | 22 | 3.8% |
| Visual & Performing Arts | 30 | 5.2% |
| Communications | 26 | 4.5% |
| Arts & Humanities | 88 | 15.2% |
| Total | 577 | 100.0% |
Transportation & Commute in Muse
Vehicle Availability by Sex in Muse
The most prevalent vehicle ownership categories in Muse are males with 2 vehicles (314, accounting for 49.4%) and females with 2 vehicles (405, making up 37.7%).
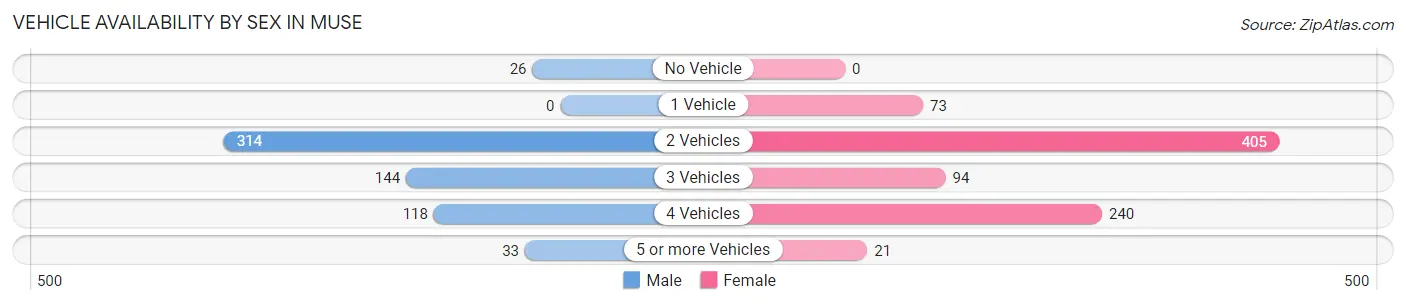
| Vehicles Available | Male | Female |
| No Vehicle | 26 (4.1%) | 0 (0.0%) |
| 1 Vehicle | 0 (0.0%) | 73 (8.8%) |
| 2 Vehicles | 314 (49.4%) | 405 (48.6%) |
| 3 Vehicles | 144 (22.7%) | 94 (11.3%) |
| 4 Vehicles | 118 (18.6%) | 240 (28.8%) |
| 5 or more Vehicles | 33 (5.2%) | 21 (2.5%) |
| Total | 635 (100.0%) | 833 (100.0%) |
Commute Time in Muse
The most frequently occuring commute durations in Muse are 15 to 19 minutes (345 commuters, 28.0%), 10 to 14 minutes (209 commuters, 17.0%), and 45 to 59 minutes (148 commuters, 12.0%).
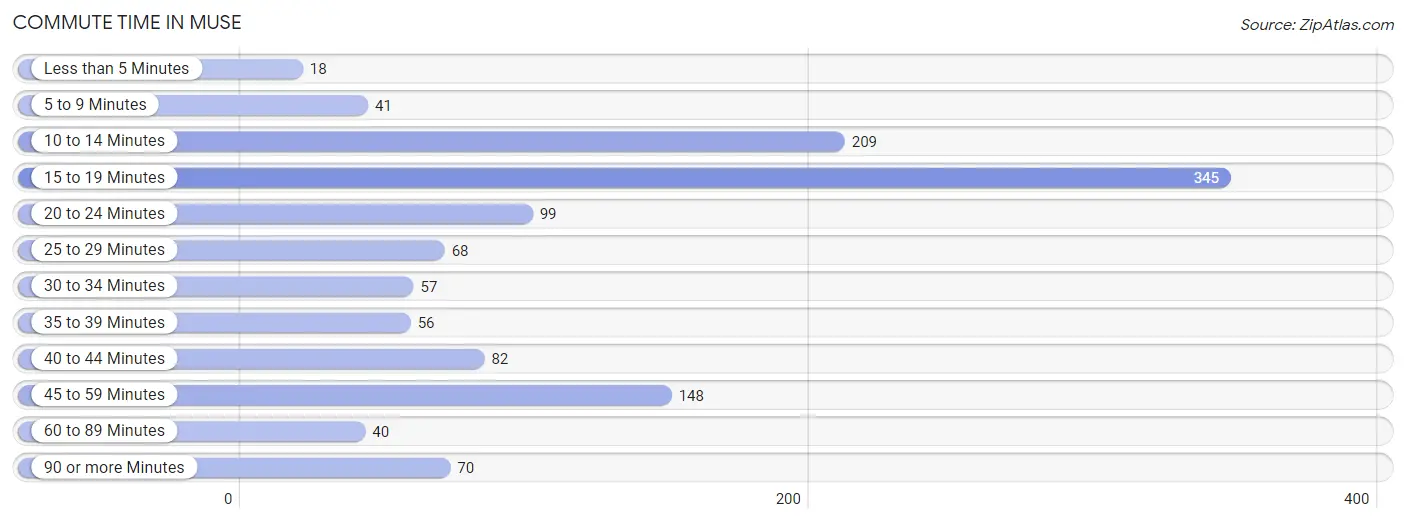
| Commute Time | # Commuters | % Commuters |
| Less than 5 Minutes | 18 | 1.5% |
| 5 to 9 Minutes | 41 | 3.3% |
| 10 to 14 Minutes | 209 | 17.0% |
| 15 to 19 Minutes | 345 | 28.0% |
| 20 to 24 Minutes | 99 | 8.0% |
| 25 to 29 Minutes | 68 | 5.5% |
| 30 to 34 Minutes | 57 | 4.6% |
| 35 to 39 Minutes | 56 | 4.5% |
| 40 to 44 Minutes | 82 | 6.7% |
| 45 to 59 Minutes | 148 | 12.0% |
| 60 to 89 Minutes | 40 | 3.2% |
| 90 or more Minutes | 70 | 5.7% |
Commute Time by Sex in Muse
The most common commute times in Muse are 15 to 19 minutes (111 commuters, 22.6%) for males and 15 to 19 minutes (234 commuters, 31.5%) for females.
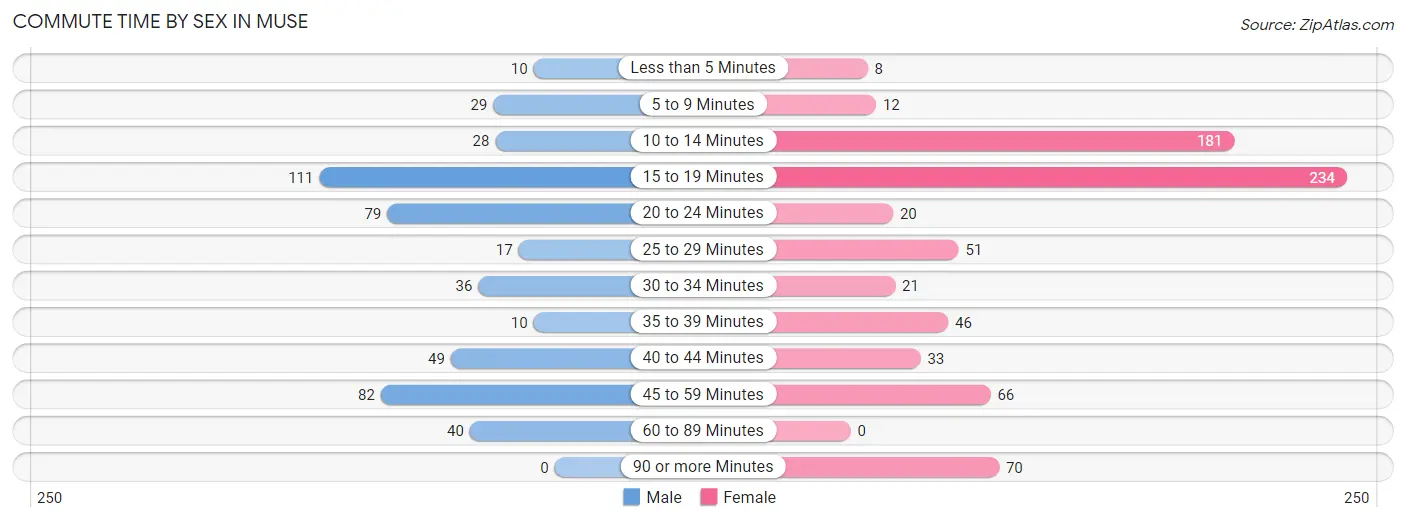
| Commute Time | Male | Female |
| Less than 5 Minutes | 10 (2.0%) | 8 (1.1%) |
| 5 to 9 Minutes | 29 (5.9%) | 12 (1.6%) |
| 10 to 14 Minutes | 28 (5.7%) | 181 (24.4%) |
| 15 to 19 Minutes | 111 (22.6%) | 234 (31.5%) |
| 20 to 24 Minutes | 79 (16.1%) | 20 (2.7%) |
| 25 to 29 Minutes | 17 (3.5%) | 51 (6.9%) |
| 30 to 34 Minutes | 36 (7.3%) | 21 (2.8%) |
| 35 to 39 Minutes | 10 (2.0%) | 46 (6.2%) |
| 40 to 44 Minutes | 49 (10.0%) | 33 (4.4%) |
| 45 to 59 Minutes | 82 (16.7%) | 66 (8.9%) |
| 60 to 89 Minutes | 40 (8.2%) | 0 (0.0%) |
| 90 or more Minutes | 0 (0.0%) | 70 (9.4%) |
Time of Departure to Work by Sex in Muse
The most frequent times of departure to work in Muse are 9:00 AM to 9:59 AM (92, 18.7%) for males and 8:00 AM to 8:29 AM (243, 32.8%) for females.
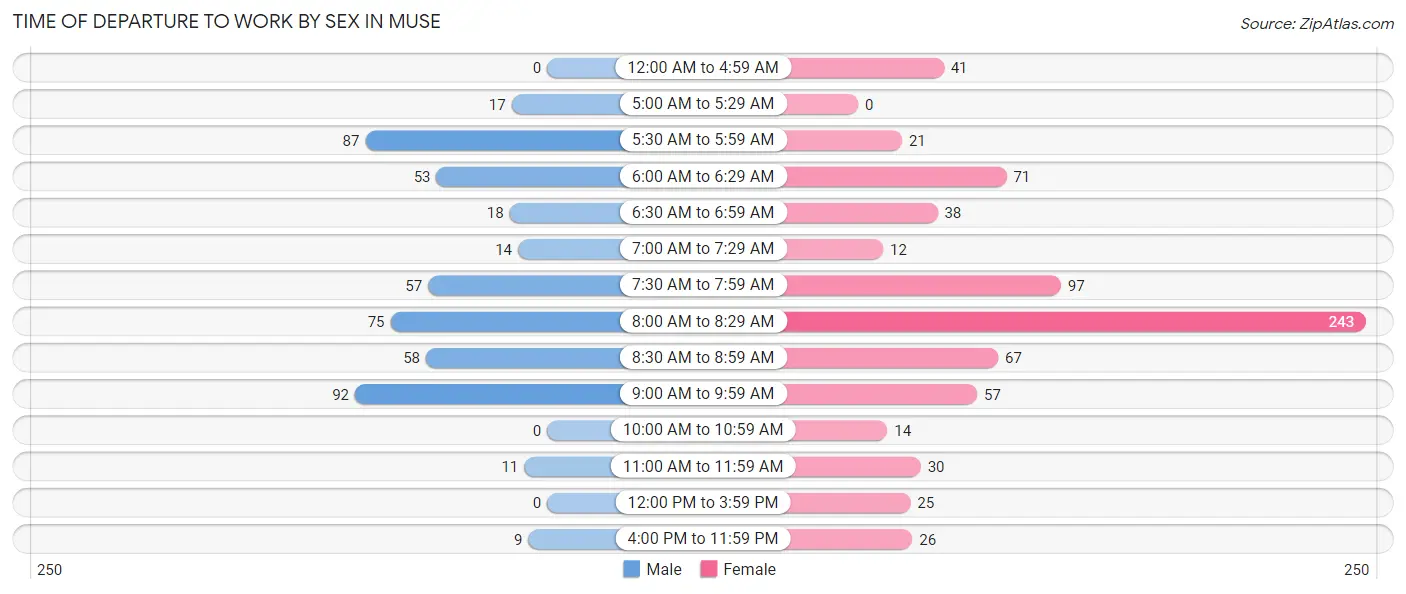
| Time of Departure | Male | Female |
| 12:00 AM to 4:59 AM | 0 (0.0%) | 41 (5.5%) |
| 5:00 AM to 5:29 AM | 17 (3.5%) | 0 (0.0%) |
| 5:30 AM to 5:59 AM | 87 (17.7%) | 21 (2.8%) |
| 6:00 AM to 6:29 AM | 53 (10.8%) | 71 (9.6%) |
| 6:30 AM to 6:59 AM | 18 (3.7%) | 38 (5.1%) |
| 7:00 AM to 7:29 AM | 14 (2.9%) | 12 (1.6%) |
| 7:30 AM to 7:59 AM | 57 (11.6%) | 97 (13.1%) |
| 8:00 AM to 8:29 AM | 75 (15.3%) | 243 (32.8%) |
| 8:30 AM to 8:59 AM | 58 (11.8%) | 67 (9.0%) |
| 9:00 AM to 9:59 AM | 92 (18.7%) | 57 (7.7%) |
| 10:00 AM to 10:59 AM | 0 (0.0%) | 14 (1.9%) |
| 11:00 AM to 11:59 AM | 11 (2.2%) | 30 (4.0%) |
| 12:00 PM to 3:59 PM | 0 (0.0%) | 25 (3.4%) |
| 4:00 PM to 11:59 PM | 9 (1.8%) | 26 (3.5%) |
| Total | 491 (100.0%) | 742 (100.0%) |
Housing Occupancy in Muse
Occupancy by Ownership in Muse
Of the total 803 dwellings in Muse, owner-occupied units account for 672 (83.7%), while renter-occupied units make up 131 (16.3%).
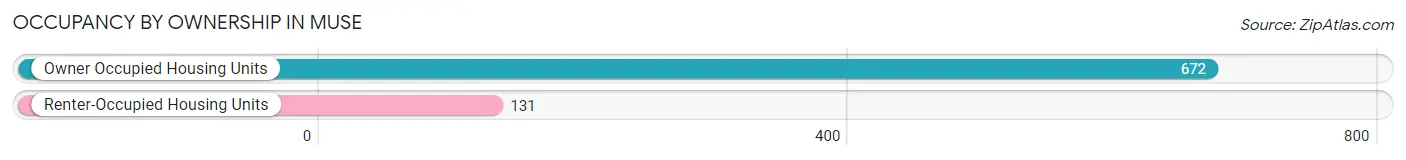
| Occupancy | # Housing Units | % Housing Units |
| Owner Occupied Housing Units | 672 | 83.7% |
| Renter-Occupied Housing Units | 131 | 16.3% |
| Total Occupied Housing Units | 803 | 100.0% |
Occupancy by Household Size in Muse
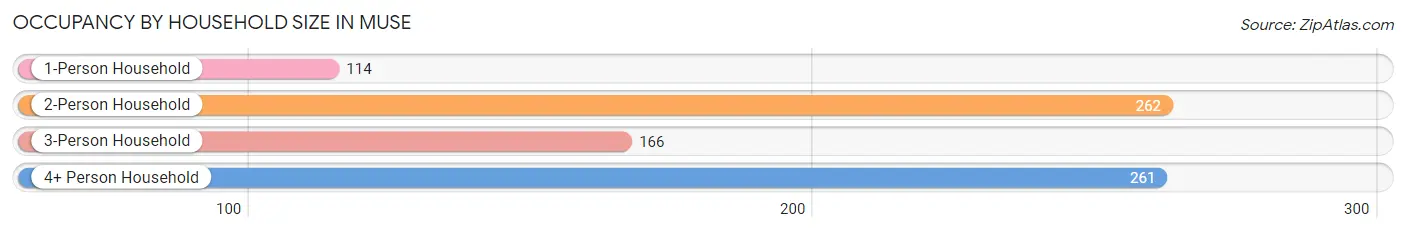
| Household Size | # Housing Units | % Housing Units |
| 1-Person Household | 114 | 14.2% |
| 2-Person Household | 262 | 32.6% |
| 3-Person Household | 166 | 20.7% |
| 4+ Person Household | 261 | 32.5% |
| Total Housing Units | 803 | 100.0% |
Occupancy by Ownership by Household Size in Muse
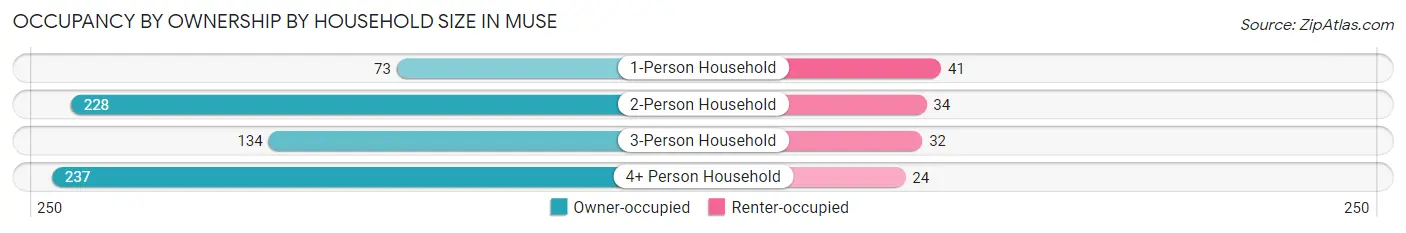
| Household Size | Owner-occupied | Renter-occupied |
| 1-Person Household | 73 (64.0%) | 41 (36.0%) |
| 2-Person Household | 228 (87.0%) | 34 (13.0%) |
| 3-Person Household | 134 (80.7%) | 32 (19.3%) |
| 4+ Person Household | 237 (90.8%) | 24 (9.2%) |
| Total Housing Units | 672 (83.7%) | 131 (16.3%) |
Occupancy by Educational Attainment in Muse
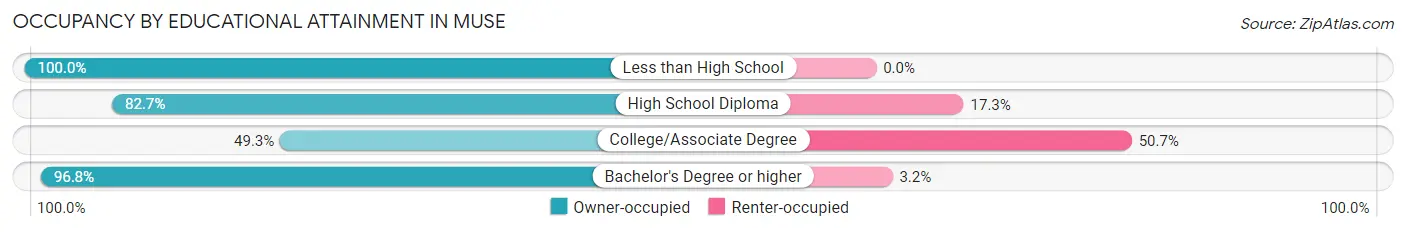
| Household Size | Owner-occupied | Renter-occupied |
| Less than High School | 62 (100.0%) | 0 (0.0%) |
| High School Diploma | 205 (82.7%) | 43 (17.3%) |
| College/Associate Degree | 75 (49.3%) | 77 (50.7%) |
| Bachelor's Degree or higher | 330 (96.8%) | 11 (3.2%) |
Occupancy by Age of Householder in Muse
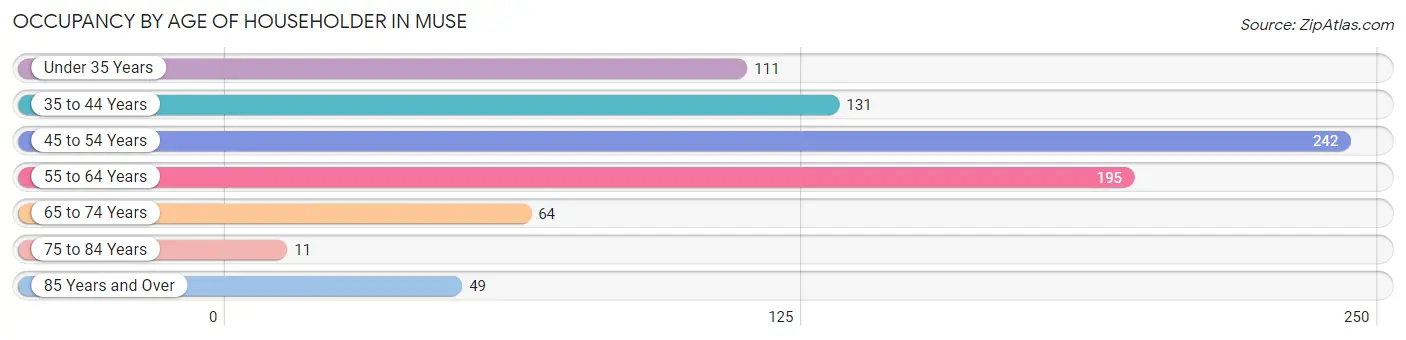
| Age Bracket | # Households | % Households |
| Under 35 Years | 111 | 13.8% |
| 35 to 44 Years | 131 | 16.3% |
| 45 to 54 Years | 242 | 30.1% |
| 55 to 64 Years | 195 | 24.3% |
| 65 to 74 Years | 64 | 8.0% |
| 75 to 84 Years | 11 | 1.4% |
| 85 Years and Over | 49 | 6.1% |
| Total | 803 | 100.0% |
Housing Finances in Muse
Median Income by Occupancy in Muse
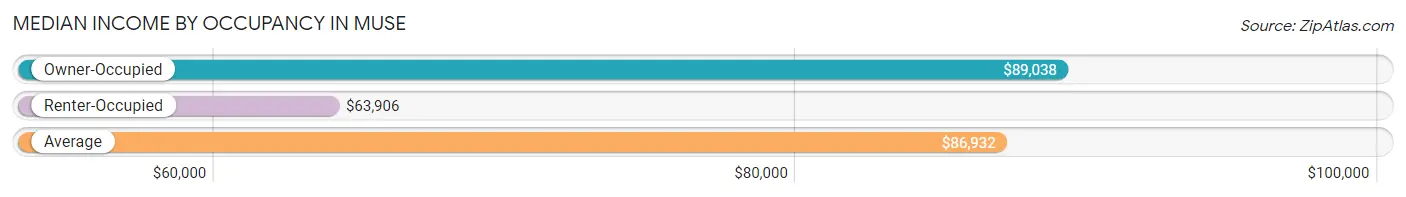
| Occupancy Type | # Households | Median Income |
| Owner-Occupied | 672 (83.7%) | $89,038 |
| Renter-Occupied | 131 (16.3%) | $63,906 |
| Average | 803 (100.0%) | $86,932 |
Occupancy by Householder Income Bracket in Muse
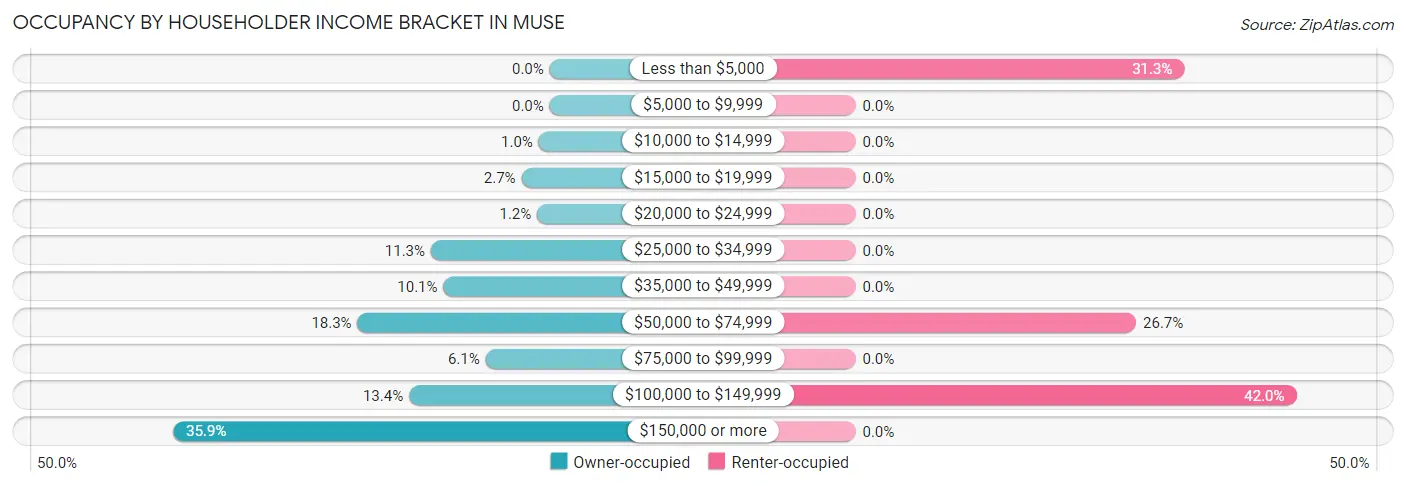
| Income Bracket | Owner-occupied | Renter-occupied |
| Less than $5,000 | 0 (0.0%) | 41 (31.3%) |
| $5,000 to $9,999 | 0 (0.0%) | 0 (0.0%) |
| $10,000 to $14,999 | 7 (1.0%) | 0 (0.0%) |
| $15,000 to $19,999 | 18 (2.7%) | 0 (0.0%) |
| $20,000 to $24,999 | 8 (1.2%) | 0 (0.0%) |
| $25,000 to $34,999 | 76 (11.3%) | 0 (0.0%) |
| $35,000 to $49,999 | 68 (10.1%) | 0 (0.0%) |
| $50,000 to $74,999 | 123 (18.3%) | 35 (26.7%) |
| $75,000 to $99,999 | 41 (6.1%) | 0 (0.0%) |
| $100,000 to $149,999 | 90 (13.4%) | 55 (42.0%) |
| $150,000 or more | 241 (35.9%) | 0 (0.0%) |
| Total | 672 (100.0%) | 131 (100.0%) |
Monthly Housing Cost Tiers in Muse
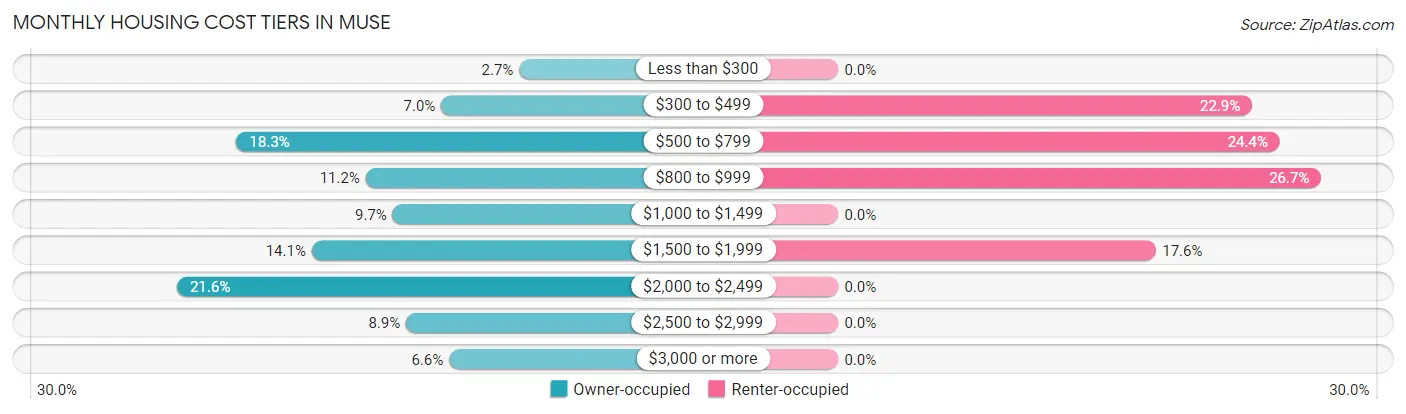
| Monthly Cost | Owner-occupied | Renter-occupied |
| Less than $300 | 18 (2.7%) | 0 (0.0%) |
| $300 to $499 | 47 (7.0%) | 30 (22.9%) |
| $500 to $799 | 123 (18.3%) | 32 (24.4%) |
| $800 to $999 | 75 (11.2%) | 35 (26.7%) |
| $1,000 to $1,499 | 65 (9.7%) | 0 (0.0%) |
| $1,500 to $1,999 | 95 (14.1%) | 23 (17.6%) |
| $2,000 to $2,499 | 145 (21.6%) | 0 (0.0%) |
| $2,500 to $2,999 | 60 (8.9%) | 0 (0.0%) |
| $3,000 or more | 44 (6.6%) | 0 (0.0%) |
| Total | 672 (100.0%) | 131 (100.0%) |
Physical Housing Characteristics in Muse
Housing Structures in Muse
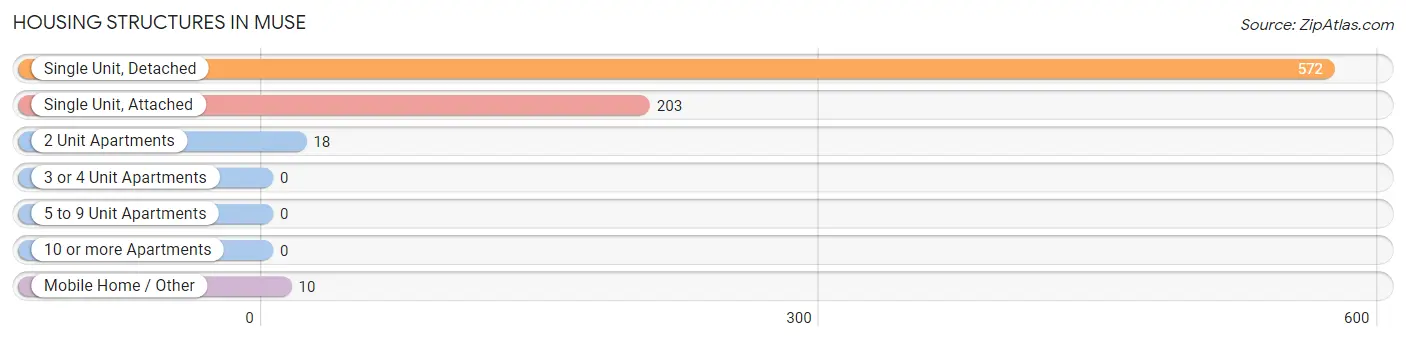
| Structure Type | # Housing Units | % Housing Units |
| Single Unit, Detached | 572 | 71.2% |
| Single Unit, Attached | 203 | 25.3% |
| 2 Unit Apartments | 18 | 2.2% |
| 3 or 4 Unit Apartments | 0 | 0.0% |
| 5 to 9 Unit Apartments | 0 | 0.0% |
| 10 or more Apartments | 0 | 0.0% |
| Mobile Home / Other | 10 | 1.3% |
| Total | 803 | 100.0% |
Housing Structures by Occupancy in Muse
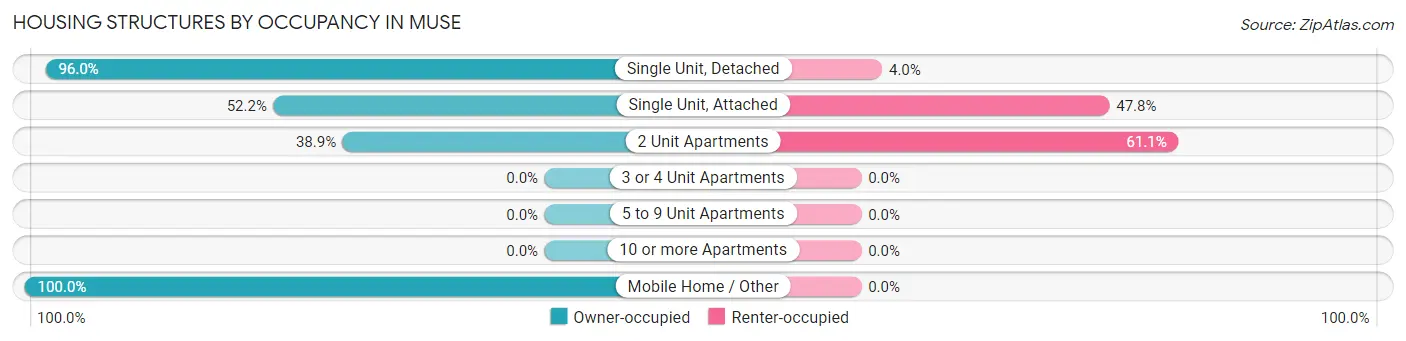
| Structure Type | Owner-occupied | Renter-occupied |
| Single Unit, Detached | 549 (96.0%) | 23 (4.0%) |
| Single Unit, Attached | 106 (52.2%) | 97 (47.8%) |
| 2 Unit Apartments | 7 (38.9%) | 11 (61.1%) |
| 3 or 4 Unit Apartments | 0 (0.0%) | 0 (0.0%) |
| 5 to 9 Unit Apartments | 0 (0.0%) | 0 (0.0%) |
| 10 or more Apartments | 0 (0.0%) | 0 (0.0%) |
| Mobile Home / Other | 10 (100.0%) | 0 (0.0%) |
| Total | 672 (83.7%) | 131 (16.3%) |
Housing Structures by Number of Rooms in Muse
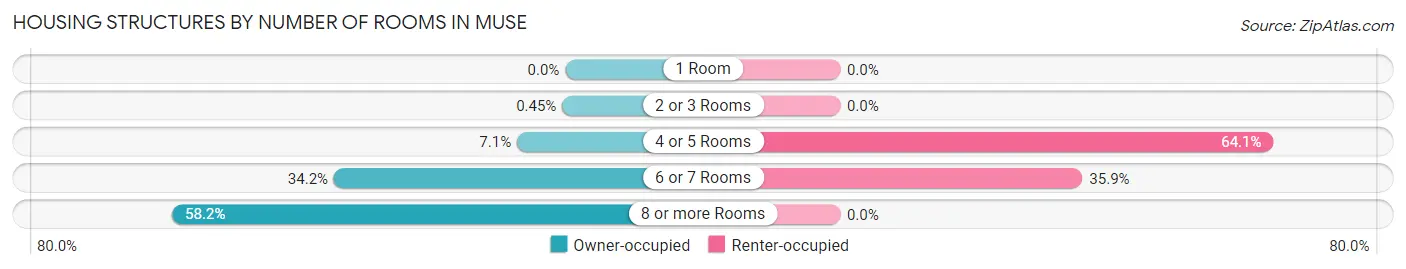
| Number of Rooms | Owner-occupied | Renter-occupied |
| 1 Room | 0 (0.0%) | 0 (0.0%) |
| 2 or 3 Rooms | 3 (0.4%) | 0 (0.0%) |
| 4 or 5 Rooms | 48 (7.1%) | 84 (64.1%) |
| 6 or 7 Rooms | 230 (34.2%) | 47 (35.9%) |
| 8 or more Rooms | 391 (58.2%) | 0 (0.0%) |
| Total | 672 (100.0%) | 131 (100.0%) |
Housing Structure by Heating Type in Muse
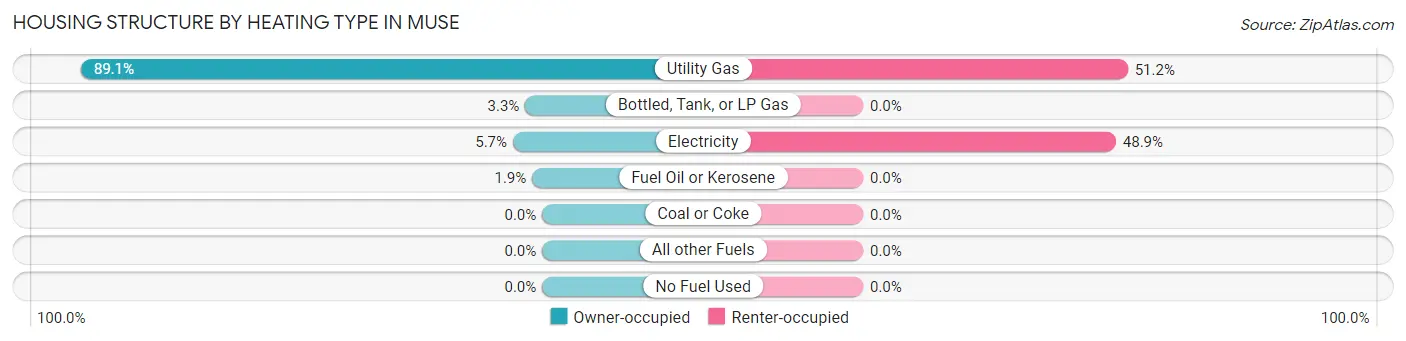
| Heating Type | Owner-occupied | Renter-occupied |
| Utility Gas | 599 (89.1%) | 67 (51.1%) |
| Bottled, Tank, or LP Gas | 22 (3.3%) | 0 (0.0%) |
| Electricity | 38 (5.7%) | 64 (48.8%) |
| Fuel Oil or Kerosene | 13 (1.9%) | 0 (0.0%) |
| Coal or Coke | 0 (0.0%) | 0 (0.0%) |
| All other Fuels | 0 (0.0%) | 0 (0.0%) |
| No Fuel Used | 0 (0.0%) | 0 (0.0%) |
| Total | 672 (100.0%) | 131 (100.0%) |
Household Vehicle Usage in Muse
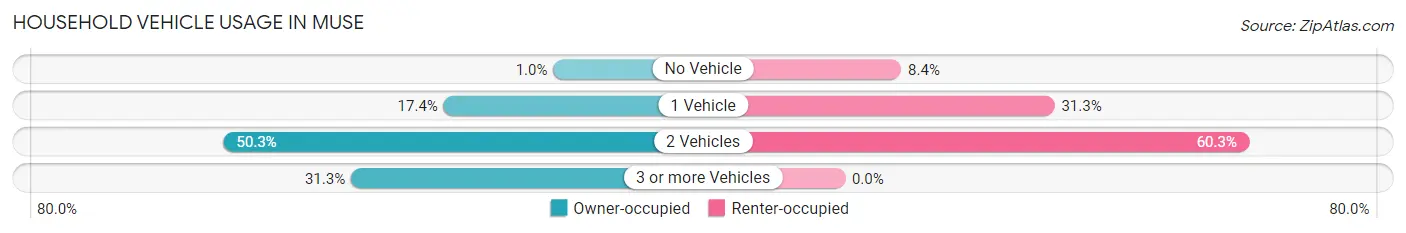
| Vehicles per Household | Owner-occupied | Renter-occupied |
| No Vehicle | 7 (1.0%) | 11 (8.4%) |
| 1 Vehicle | 117 (17.4%) | 41 (31.3%) |
| 2 Vehicles | 338 (50.3%) | 79 (60.3%) |
| 3 or more Vehicles | 210 (31.2%) | 0 (0.0%) |
| Total | 672 (100.0%) | 131 (100.0%) |
Real Estate & Mortgages in Muse
Real Estate and Mortgage Overview in Muse
| Characteristic | Without Mortgage | With Mortgage |
| Housing Units | 215 | 457 |
| Median Property Value | $267,200 | $355,200 |
| Median Household Income | $55,766 | $214 |
| Monthly Housing Costs | $654 | $44 |
| Real Estate Taxes | $3,929 | $0 |
Property Value by Mortgage Status in Muse
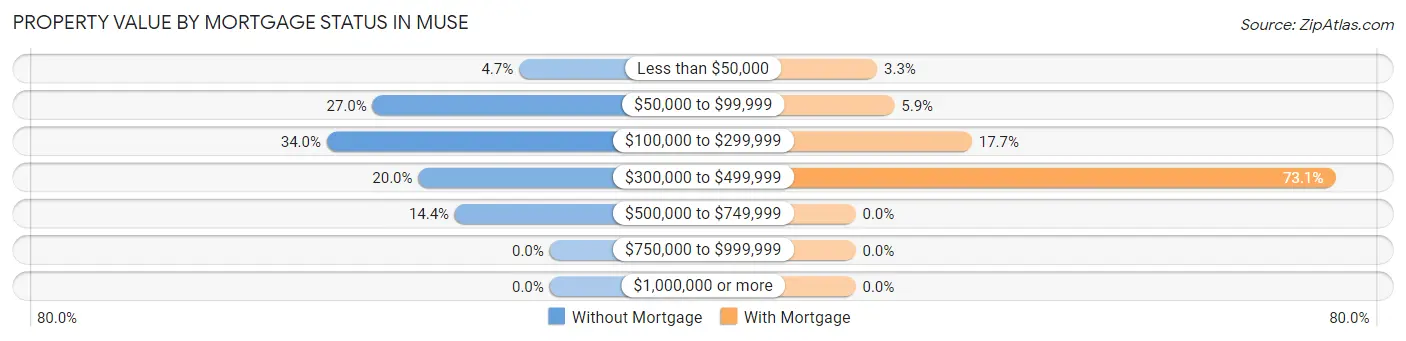
| Property Value | Without Mortgage | With Mortgage |
| Less than $50,000 | 10 (4.6%) | 15 (3.3%) |
| $50,000 to $99,999 | 58 (27.0%) | 27 (5.9%) |
| $100,000 to $299,999 | 73 (34.0%) | 81 (17.7%) |
| $300,000 to $499,999 | 43 (20.0%) | 334 (73.1%) |
| $500,000 to $749,999 | 31 (14.4%) | 0 (0.0%) |
| $750,000 to $999,999 | 0 (0.0%) | 0 (0.0%) |
| $1,000,000 or more | 0 (0.0%) | 0 (0.0%) |
| Total | 215 (100.0%) | 457 (100.0%) |
Household Income by Mortgage Status in Muse
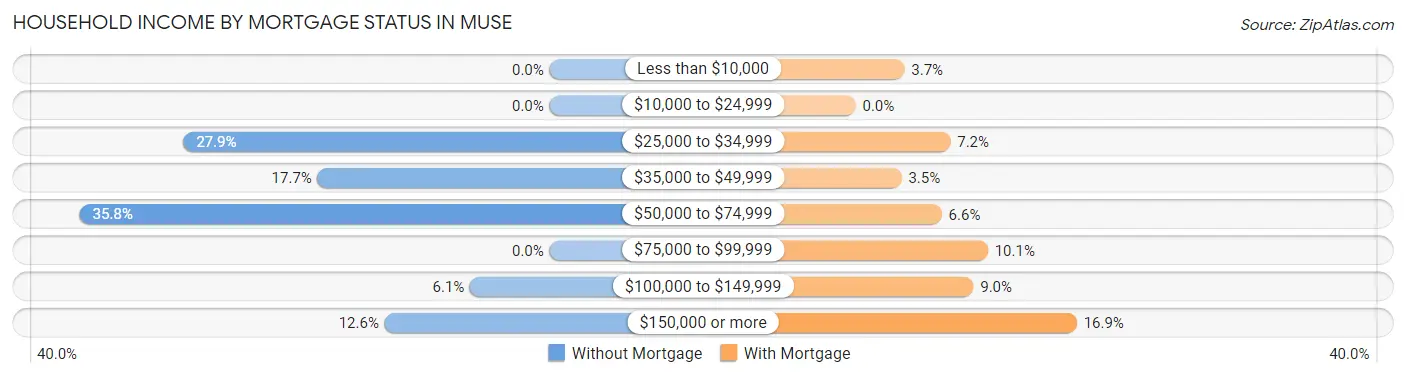
| Household Income | Without Mortgage | With Mortgage |
| Less than $10,000 | 0 (0.0%) | 17 (3.7%) |
| $10,000 to $24,999 | 0 (0.0%) | 0 (0.0%) |
| $25,000 to $34,999 | 60 (27.9%) | 33 (7.2%) |
| $35,000 to $49,999 | 38 (17.7%) | 16 (3.5%) |
| $50,000 to $74,999 | 77 (35.8%) | 30 (6.6%) |
| $75,000 to $99,999 | 0 (0.0%) | 46 (10.1%) |
| $100,000 to $149,999 | 13 (6.0%) | 41 (9.0%) |
| $150,000 or more | 27 (12.6%) | 77 (16.9%) |
| Total | 215 (100.0%) | 457 (100.0%) |
Property Value to Household Income Ratio in Muse
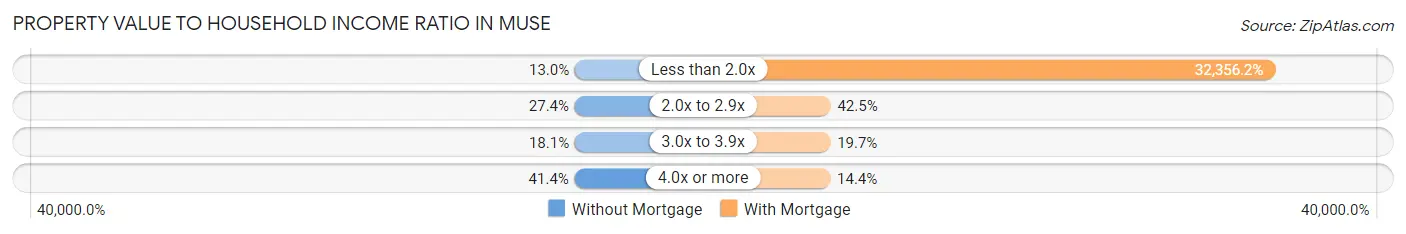
| Value-to-Income Ratio | Without Mortgage | With Mortgage |
| Less than 2.0x | 28 (13.0%) | 147,868 (32,356.2%) |
| 2.0x to 2.9x | 59 (27.4%) | 194 (42.4%) |
| 3.0x to 3.9x | 39 (18.1%) | 90 (19.7%) |
| 4.0x or more | 89 (41.4%) | 66 (14.4%) |
| Total | 215 (100.0%) | 457 (100.0%) |
Real Estate Taxes by Mortgage Status in Muse
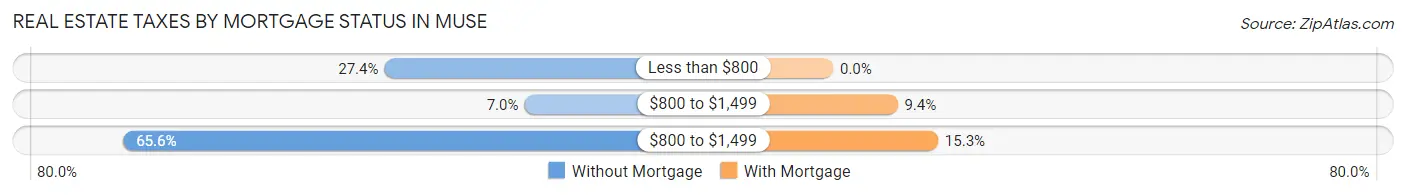
| Property Taxes | Without Mortgage | With Mortgage |
| Less than $800 | 59 (27.4%) | 0 (0.0%) |
| $800 to $1,499 | 15 (7.0%) | 43 (9.4%) |
| $800 to $1,499 | 141 (65.6%) | 70 (15.3%) |
| Total | 215 (100.0%) | 457 (100.0%) |
Health & Disability in Muse
Health Insurance Coverage by Age in Muse
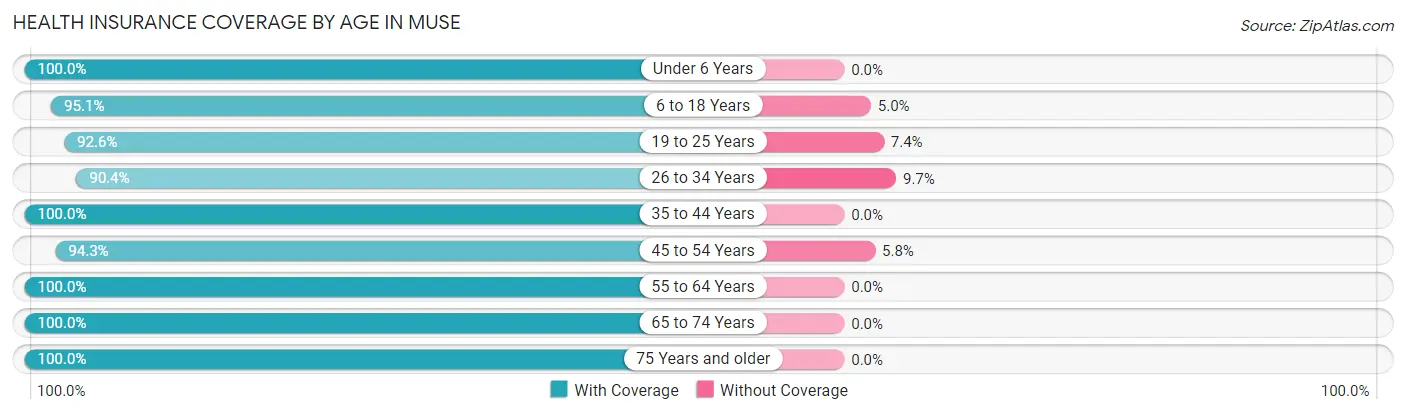
| Age Bracket | With Coverage | Without Coverage |
| Under 6 Years | 155 (100.0%) | 0 (0.0%) |
| 6 to 18 Years | 480 (95.1%) | 25 (5.0%) |
| 19 to 25 Years | 327 (92.6%) | 26 (7.4%) |
| 26 to 34 Years | 234 (90.3%) | 25 (9.7%) |
| 35 to 44 Years | 200 (100.0%) | 0 (0.0%) |
| 45 to 54 Years | 426 (94.3%) | 26 (5.8%) |
| 55 to 64 Years | 364 (100.0%) | 0 (0.0%) |
| 65 to 74 Years | 113 (100.0%) | 0 (0.0%) |
| 75 Years and older | 100 (100.0%) | 0 (0.0%) |
| Total | 2,399 (95.9%) | 102 (4.1%) |
Health Insurance Coverage by Citizenship Status in Muse
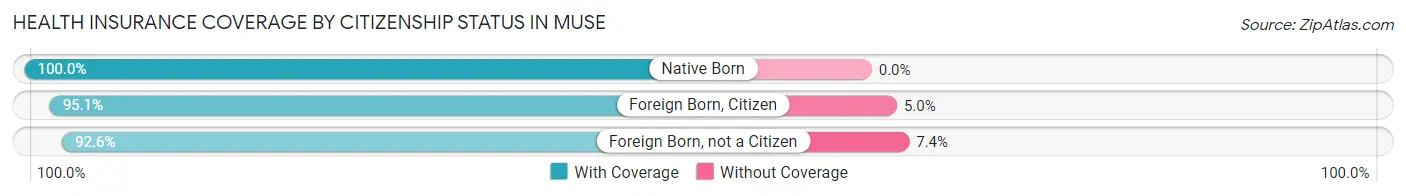
| Citizenship Status | With Coverage | Without Coverage |
| Native Born | 155 (100.0%) | 0 (0.0%) |
| Foreign Born, Citizen | 480 (95.1%) | 25 (5.0%) |
| Foreign Born, not a Citizen | 327 (92.6%) | 26 (7.4%) |
Health Insurance Coverage by Household Income in Muse
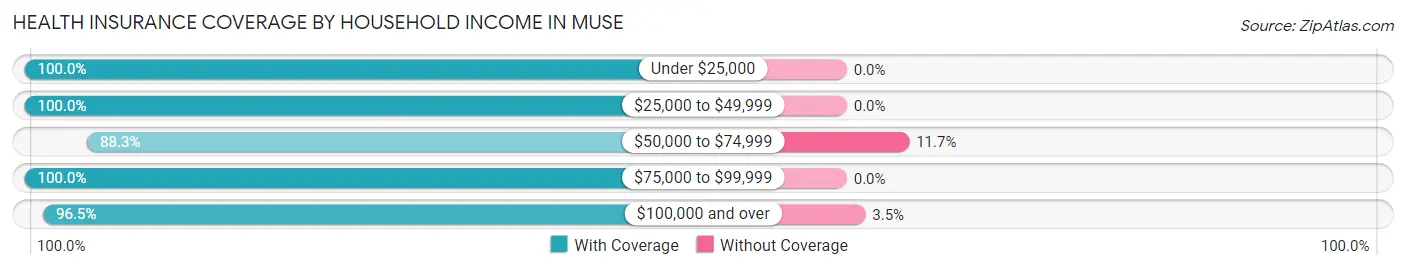
| Household Income | With Coverage | Without Coverage |
| Under $25,000 | 97 (100.0%) | 0 (0.0%) |
| $25,000 to $49,999 | 365 (100.0%) | 0 (0.0%) |
| $50,000 to $74,999 | 385 (88.3%) | 51 (11.7%) |
| $75,000 to $99,999 | 134 (100.0%) | 0 (0.0%) |
| $100,000 and over | 1,418 (96.5%) | 51 (3.5%) |
Public vs Private Health Insurance Coverage by Age in Muse
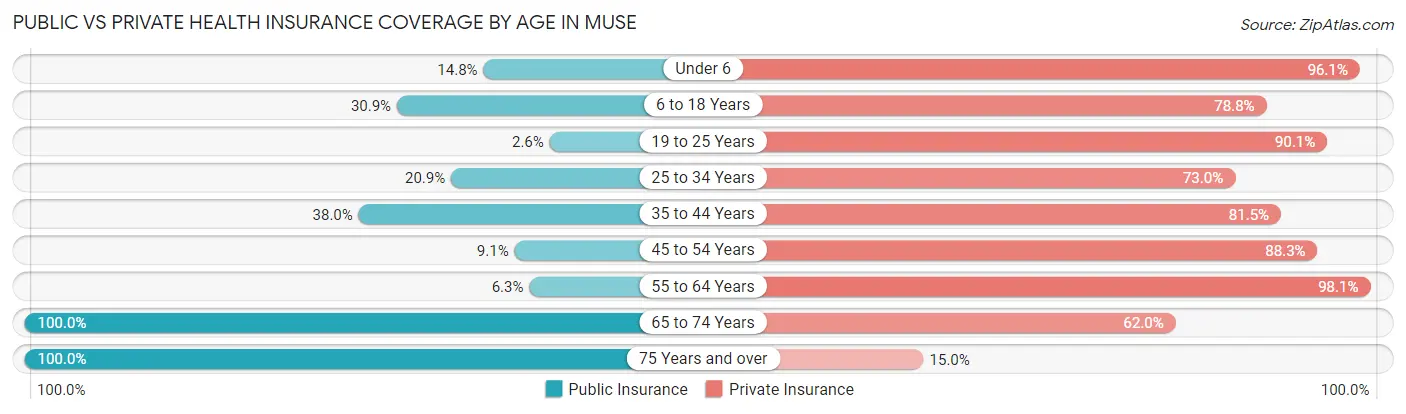
| Age Bracket | Public Insurance | Private Insurance |
| Under 6 | 23 (14.8%) | 149 (96.1%) |
| 6 to 18 Years | 156 (30.9%) | 398 (78.8%) |
| 19 to 25 Years | 9 (2.5%) | 318 (90.1%) |
| 25 to 34 Years | 54 (20.8%) | 189 (73.0%) |
| 35 to 44 Years | 76 (38.0%) | 163 (81.5%) |
| 45 to 54 Years | 41 (9.1%) | 399 (88.3%) |
| 55 to 64 Years | 23 (6.3%) | 357 (98.1%) |
| 65 to 74 Years | 113 (100.0%) | 70 (62.0%) |
| 75 Years and over | 100 (100.0%) | 15 (15.0%) |
| Total | 595 (23.8%) | 2,058 (82.3%) |
Disability Status by Sex by Age in Muse
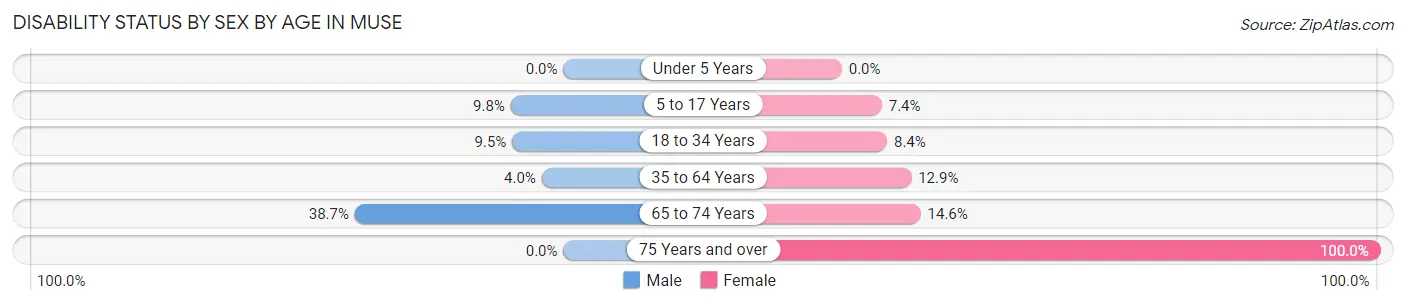
| Age Bracket | Male | Female |
| Under 5 Years | 0 (0.0%) | 0 (0.0%) |
| 5 to 17 Years | 18 (9.8%) | 23 (7.4%) |
| 18 to 34 Years | 23 (9.5%) | 32 (8.4%) |
| 35 to 64 Years | 19 (4.0%) | 70 (12.9%) |
| 65 to 74 Years | 12 (38.7%) | 12 (14.6%) |
| 75 Years and over | 0 (0.0%) | 47 (100.0%) |
Disability Class by Sex by Age in Muse
Disability Class: Hearing Difficulty
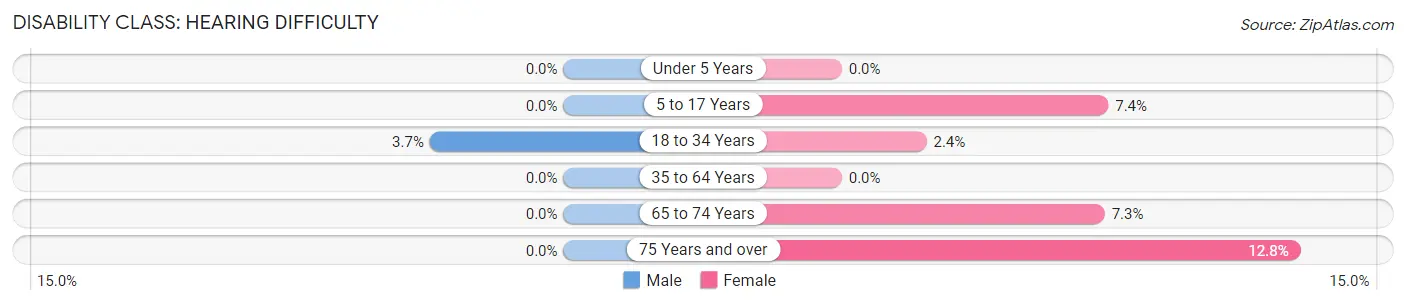
| Age Bracket | Male | Female |
| Under 5 Years | 0 (0.0%) | 0 (0.0%) |
| 5 to 17 Years | 0 (0.0%) | 23 (7.4%) |
| 18 to 34 Years | 9 (3.7%) | 9 (2.4%) |
| 35 to 64 Years | 0 (0.0%) | 0 (0.0%) |
| 65 to 74 Years | 0 (0.0%) | 6 (7.3%) |
| 75 Years and over | 0 (0.0%) | 6 (12.8%) |
Disability Class: Vision Difficulty
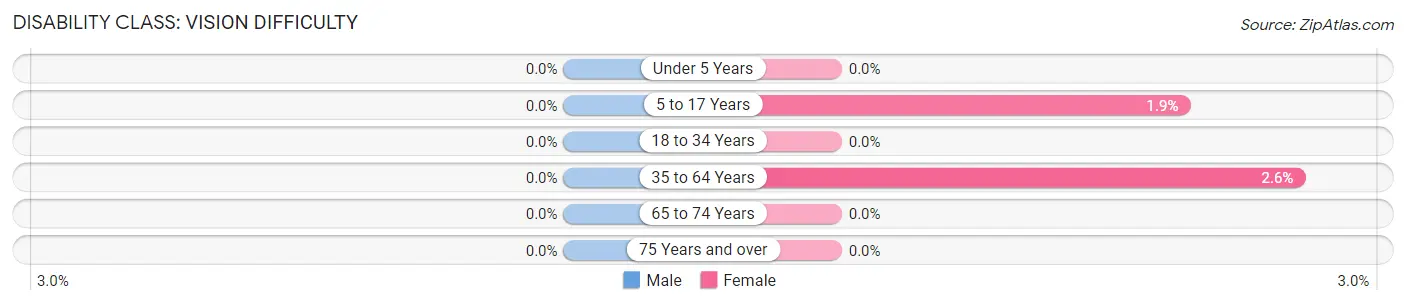
| Age Bracket | Male | Female |
| Under 5 Years | 0 (0.0%) | 0 (0.0%) |
| 5 to 17 Years | 0 (0.0%) | 6 (1.9%) |
| 18 to 34 Years | 0 (0.0%) | 0 (0.0%) |
| 35 to 64 Years | 0 (0.0%) | 14 (2.6%) |
| 65 to 74 Years | 0 (0.0%) | 0 (0.0%) |
| 75 Years and over | 0 (0.0%) | 0 (0.0%) |
Disability Class: Cognitive Difficulty
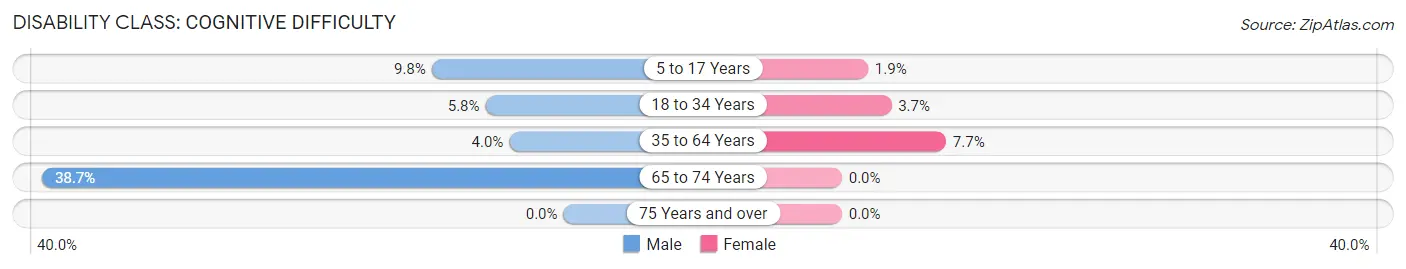
| Age Bracket | Male | Female |
| 5 to 17 Years | 18 (9.8%) | 6 (1.9%) |
| 18 to 34 Years | 14 (5.8%) | 14 (3.7%) |
| 35 to 64 Years | 19 (4.0%) | 42 (7.7%) |
| 65 to 74 Years | 12 (38.7%) | 0 (0.0%) |
| 75 Years and over | 0 (0.0%) | 0 (0.0%) |
Disability Class: Ambulatory Difficulty
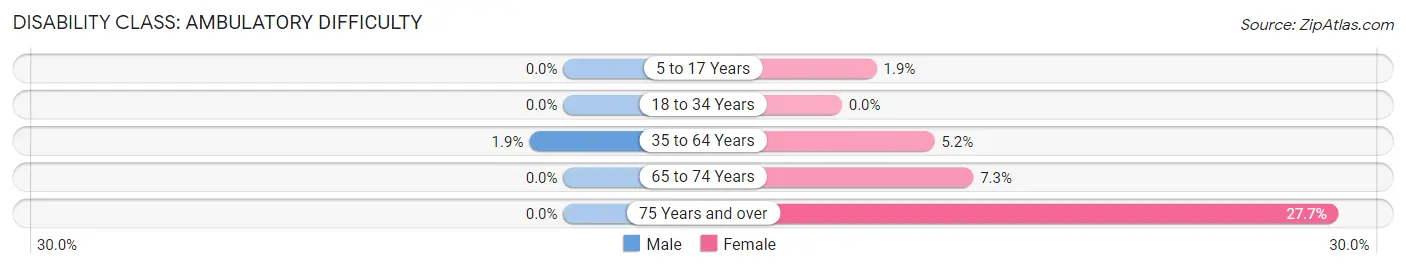
| Age Bracket | Male | Female |
| 5 to 17 Years | 0 (0.0%) | 6 (1.9%) |
| 18 to 34 Years | 0 (0.0%) | 0 (0.0%) |
| 35 to 64 Years | 9 (1.9%) | 28 (5.2%) |
| 65 to 74 Years | 0 (0.0%) | 6 (7.3%) |
| 75 Years and over | 0 (0.0%) | 13 (27.7%) |
Disability Class: Self-Care Difficulty
| Age Bracket | Male | Female |
| 5 to 17 Years | 0 (0.0%) | 6 (1.9%) |
| 18 to 34 Years | 0 (0.0%) | 0 (0.0%) |
| 35 to 64 Years | 9 (1.9%) | 6 (1.1%) |
| 65 to 74 Years | 0 (0.0%) | 0 (0.0%) |
| 75 Years and over | 0 (0.0%) | 0 (0.0%) |
Technology Access in Muse
Computing Device Access in Muse
| Device Type | # Households | % Households |
| Desktop or Laptop | 701 | 87.3% |
| Smartphone | 716 | 89.2% |
| Tablet | 689 | 85.8% |
| No Computing Device | 51 | 6.4% |
| Total | 803 | 100.0% |
Internet Access in Muse
| Internet Type | # Households | % Households |
| Dial-Up Internet | 0 | 0.0% |
| Broadband Home | 719 | 89.5% |
| Cellular Data Only | 8 | 1.0% |
| Satellite Internet | 30 | 3.7% |
| No Internet | 51 | 6.4% |
| Total | 803 | 100.0% |
Muse Summary
Pennsylvania, a state located in the Northeastern and Mid-Atlantic regions of the United States, is a diverse and vibrant state with a rich history, geography, economy, and demographics.
History
Pennsylvania was founded in 1681 by William Penn, a Quaker, who was granted a charter by King Charles II of England. Penn wanted to create a colony that was tolerant of all religions and cultures, and he named the colony after his father, Admiral William Penn. Pennsylvania was the second of the original 13 colonies to ratify the United States Constitution in 1787.
Pennsylvania was a major player in the American Revolution, and it was the site of several major battles, including the Battle of Brandywine and the Battle of Gettysburg. Pennsylvania was also the home of the Liberty Bell, which was rung to announce the first public reading of the Declaration of Independence in 1776.
Geography
Pennsylvania is located in the Northeastern and Mid-Atlantic regions of the United States. It is bordered by New York to the north, New Jersey to the east, Delaware to the southeast, Maryland to the south, and West Virginia to the southwest. Pennsylvania is the 33rd largest state in the United States, with an area of 44,817 square miles.
Pennsylvania is divided into 67 counties, and its capital is Harrisburg. The state is home to several major cities, including Philadelphia, Pittsburgh, Allentown, Erie, and Scranton. Pennsylvania is also home to the Appalachian Mountains, which run through the state from east to west.
Economy
Pennsylvania has a diverse and vibrant economy. The state is home to several major industries, including manufacturing, agriculture, energy, and technology. Pennsylvania is the second-largest producer of steel in the United States, and it is also a major producer of coal, natural gas, and oil.
Agriculture is an important part of the state’s economy, and Pennsylvania is the second-largest producer of mushrooms in the United States. The state is also a major producer of dairy products, poultry, and eggs.
Demographics
As of 2020, Pennsylvania had an estimated population of 12,801,989, making it the sixth-most populous state in the United States. The state is home to a diverse population, with the largest ethnic groups being German, Irish, Italian, and African American.
The median household income in Pennsylvania is $60,828, and the median age is 40.7 years. The state has a higher-than-average poverty rate, with 14.2% of the population living below the poverty line.
Conclusion
Pennsylvania is a diverse and vibrant state with a rich history, geography, economy, and demographics. The state is home to several major industries, including manufacturing, agriculture, energy, and technology. Pennsylvania is also home to a diverse population, with the largest ethnic groups being German, Irish, Italian, and African American. The state has a higher-than-average poverty rate, with 14.2% of the population living below the poverty line.
Common Questions
What is Per Capita Income in Muse?
Per Capita income in Muse is $38,148.
What is the Median Family Income in Muse?
Median Family Income in Muse is $108,947.
What is the Median Household income in Muse?
Median Household Income in Muse is $86,932.
What is Income or Wage Gap in Muse?
Income or Wage Gap in Muse is 32.3%.
Women in Muse earn 67.7 cents for every dollar earned by a man.
What is Inequality or Gini Index in Muse?
Inequality or Gini Index in Muse is 0.42.
What is the Total Population of Muse?
Total Population of Muse is 2,501.
What is the Total Male Population of Muse?
Total Male Population of Muse is 1,027.
What is the Total Female Population of Muse?
Total Female Population of Muse is 1,474.
What is the Ratio of Males per 100 Females in Muse?
There are 69.67 Males per 100 Females in Muse.
What is the Ratio of Females per 100 Males in Muse?
There are 143.52 Females per 100 Males in Muse.
What is the Median Population Age in Muse?
Median Population Age in Muse is 34.1 Years.
What is the Average Family Size in Muse
Average Family Size in Muse is 3.6 People.
What is the Average Household Size in Muse
Average Household Size in Muse is 3.1 People.
How Large is the Labor Force in Muse?
There are 1,525 People in the Labor Forcein in Muse.
What is the Percentage of People in the Labor Force in Muse?
74.2% of People are in the Labor Force in Muse.
What is the Unemployment Rate in Muse?
Unemployment Rate in Muse is 3.3%.