Bernville borough, PA Map & Demographics
Bernville borough Overview
$36,286
PER CAPITA INCOME
$102,125
AVG FAMILY INCOME
$84,196
AVG HOUSEHOLD INCOME
8.2%
WAGE / INCOME GAP [ % ]
91.8¢/ $1
WAGE / INCOME GAP [ $ ]
0.34
INEQUALITY / GINI INDEX
837
TOTAL POPULATION
402
MALE POPULATION
435
FEMALE POPULATION
92.41
MALES / 100 FEMALES
108.21
FEMALES / 100 MALES
35.4
MEDIAN AGE
3.2
AVG FAMILY SIZE
2.8
AVG HOUSEHOLD SIZE
459
LABOR FORCE [ PEOPLE ]
72.5%
PERCENT IN LABOR FORCE
2.4%
UNEMPLOYMENT RATE
Income in Bernville borough
Income Overview in Bernville borough
Per Capita Income in Bernville borough is $36,286, while median incomes of families and households are $102,125 and $84,196 respectively.
| Characteristic | Number | Measure |
| Per Capita Income | 837 | $36,286 |
| Median Family Income | 227 | $102,125 |
| Mean Family Income | 227 | $110,402 |
| Median Household Income | 299 | $84,196 |
| Mean Household Income | 299 | $99,256 |
| Income Deficit | 227 | $0 |
| Wage / Income Gap (%) | 837 | 8.24% |
| Wage / Income Gap ($) | 837 | 91.76¢ per $1 |
| Gini / Inequality Index | 837 | 0.34 |
Earnings by Sex in Bernville borough
Average Earnings in Bernville borough are $49,667, $48,750 for men and $53,125 for women, a difference of 8.2%.
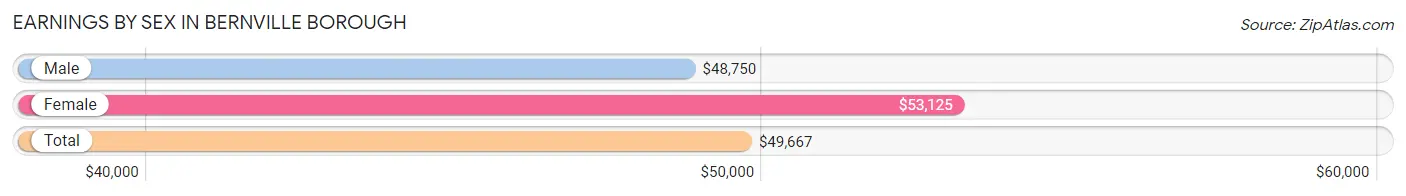
| Sex | Number | Average Earnings |
| Male | 236 (51.1%) | $48,750 |
| Female | 226 (48.9%) | $53,125 |
| Total | 462 (100.0%) | $49,667 |
Earnings by Sex by Income Bracket in Bernville borough
The most common earnings brackets in Bernville borough are $40,000 to $44,999 for men (37 | 15.7%) and $55,000 to $64,999 for women (42 | 18.6%).
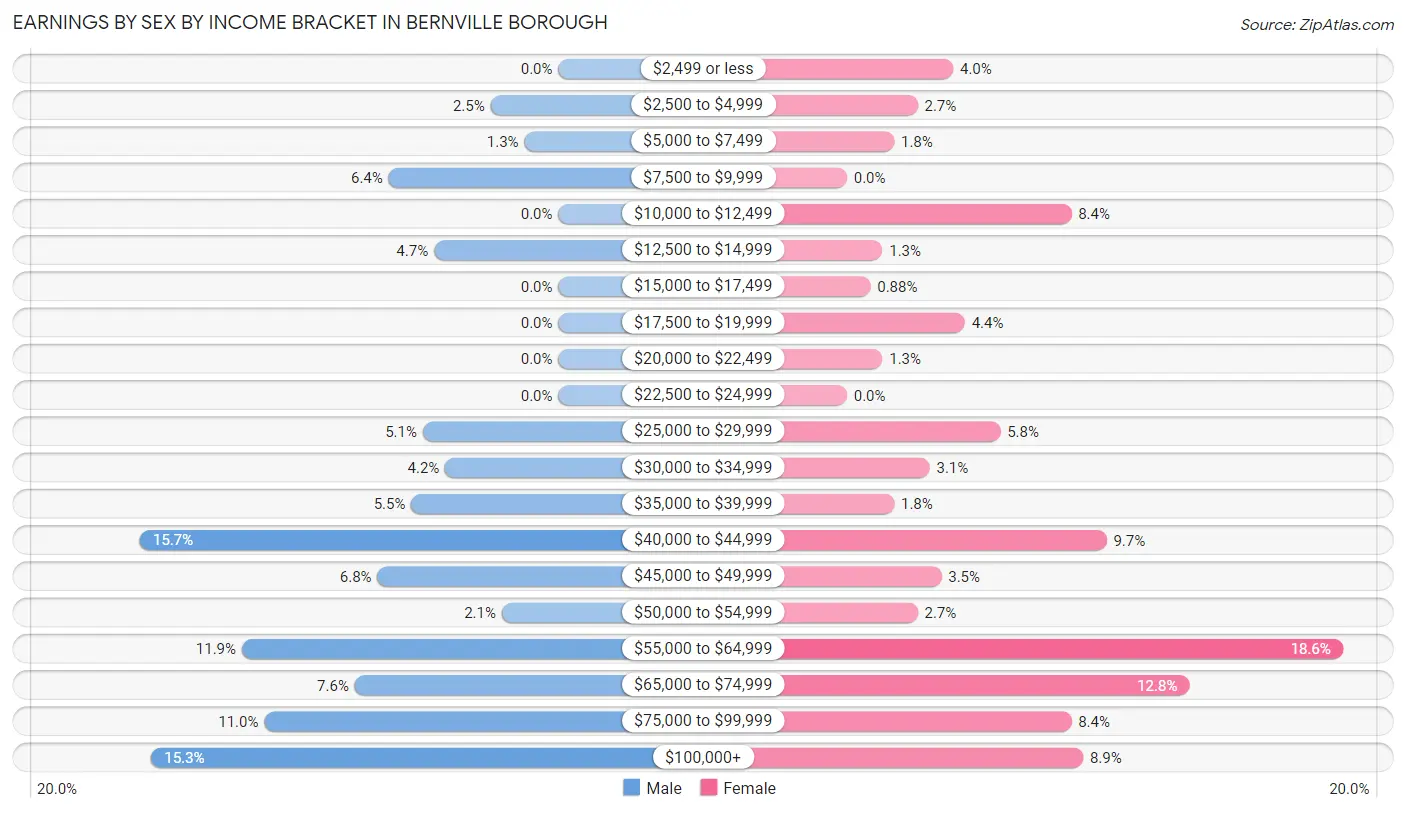
| Income | Male | Female |
| $2,499 or less | 0 (0.0%) | 9 (4.0%) |
| $2,500 to $4,999 | 6 (2.5%) | 6 (2.6%) |
| $5,000 to $7,499 | 3 (1.3%) | 4 (1.8%) |
| $7,500 to $9,999 | 15 (6.4%) | 0 (0.0%) |
| $10,000 to $12,499 | 0 (0.0%) | 19 (8.4%) |
| $12,500 to $14,999 | 11 (4.7%) | 3 (1.3%) |
| $15,000 to $17,499 | 0 (0.0%) | 2 (0.9%) |
| $17,500 to $19,999 | 0 (0.0%) | 10 (4.4%) |
| $20,000 to $22,499 | 0 (0.0%) | 3 (1.3%) |
| $22,500 to $24,999 | 0 (0.0%) | 0 (0.0%) |
| $25,000 to $29,999 | 12 (5.1%) | 13 (5.8%) |
| $30,000 to $34,999 | 10 (4.2%) | 7 (3.1%) |
| $35,000 to $39,999 | 13 (5.5%) | 4 (1.8%) |
| $40,000 to $44,999 | 37 (15.7%) | 22 (9.7%) |
| $45,000 to $49,999 | 16 (6.8%) | 8 (3.5%) |
| $50,000 to $54,999 | 5 (2.1%) | 6 (2.6%) |
| $55,000 to $64,999 | 28 (11.9%) | 42 (18.6%) |
| $65,000 to $74,999 | 18 (7.6%) | 29 (12.8%) |
| $75,000 to $99,999 | 26 (11.0%) | 19 (8.4%) |
| $100,000+ | 36 (15.2%) | 20 (8.8%) |
| Total | 236 (100.0%) | 226 (100.0%) |
Earnings by Sex by Educational Attainment in Bernville borough
Average earnings in Bernville borough are $55,417 for men and $57,857 for women, a difference of 4.2%. Men with an educational attainment of graduate degree enjoy the highest average annual earnings of $74,167, while those with high school diploma education earn the least with $51,250. Women with an educational attainment of graduate degree earn the most with the average annual earnings of $73,125, while those with high school diploma education have the smallest earnings of $40,938.
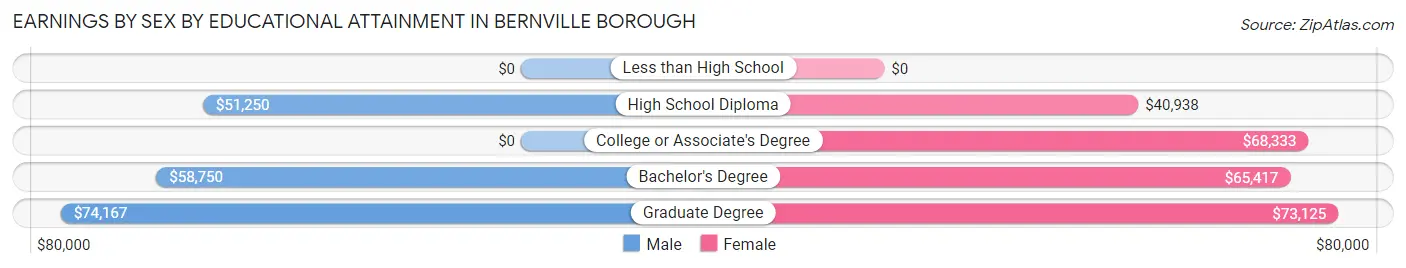
| Educational Attainment | Male Income | Female Income |
| Less than High School | - | - |
| High School Diploma | $51,250 | $40,938 |
| College or Associate's Degree | - | - |
| Bachelor's Degree | $58,750 | $65,417 |
| Graduate Degree | $74,167 | $73,125 |
| Total | $55,417 | $57,857 |
Family Income in Bernville borough
Family Income Brackets in Bernville borough
According to the Bernville borough family income data, there are 59 families falling into the $100,000 to $149,999 income range, which is the most common income bracket and makes up 26.0% of all families.
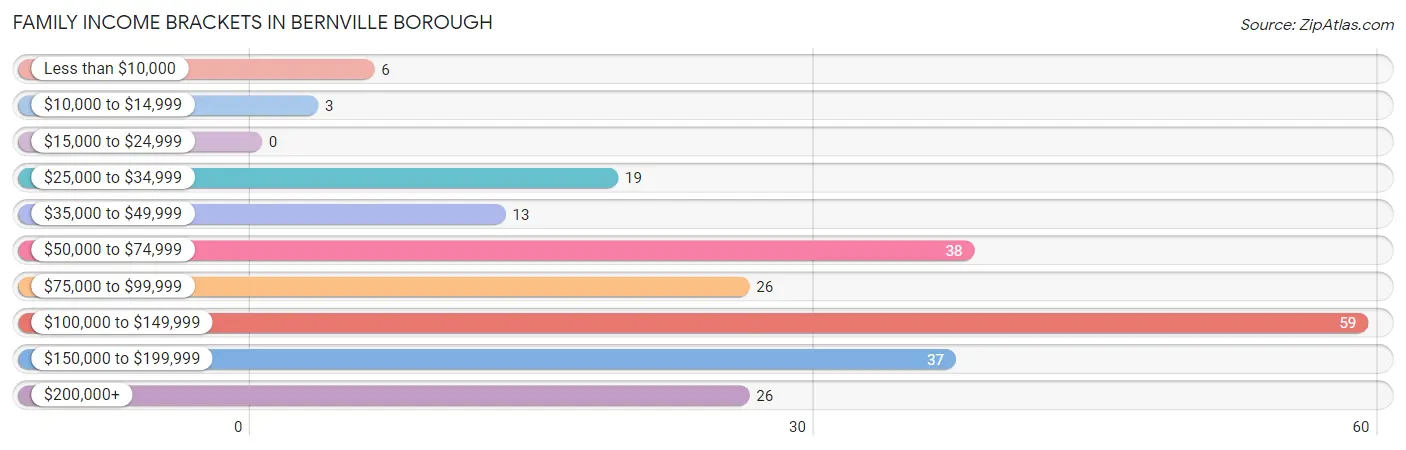
| Income Bracket | # Families | % Families |
| Less than $10,000 | 6 | 2.6% |
| $10,000 to $14,999 | 3 | 1.3% |
| $15,000 to $24,999 | 0 | 0.0% |
| $25,000 to $34,999 | 19 | 8.4% |
| $35,000 to $49,999 | 13 | 5.7% |
| $50,000 to $74,999 | 38 | 16.7% |
| $75,000 to $99,999 | 26 | 11.5% |
| $100,000 to $149,999 | 59 | 26.0% |
| $150,000 to $199,999 | 37 | 16.3% |
| $200,000+ | 26 | 11.5% |
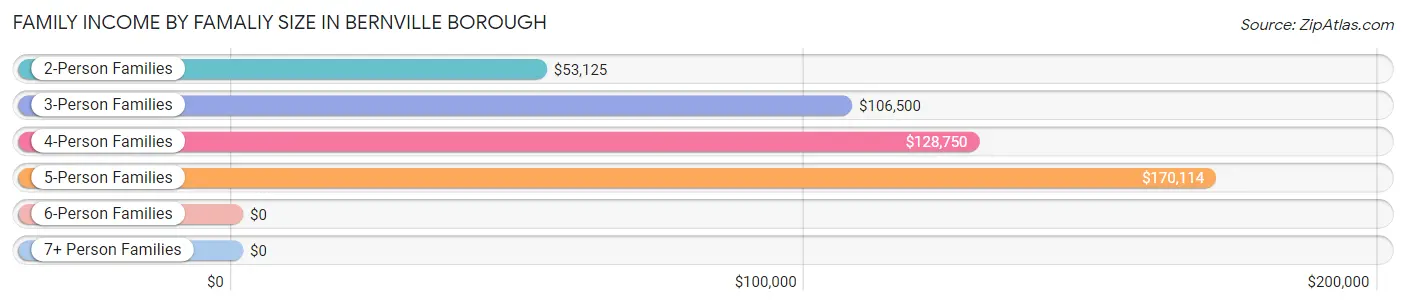
Family Income by Famaliy Size in Bernville borough
5-person families (25 | 11.0%) account for the highest median family income in Bernville borough with $170,114 per family, while 3-person families (54 | 23.8%) have the highest median income of $35,500 per family member.
| Income Bracket | # Families | Median Income |
| 2-Person Families | 93 (41.0%) | $53,125 |
| 3-Person Families | 54 (23.8%) | $106,500 |
| 4-Person Families | 52 (22.9%) | $128,750 |
| 5-Person Families | 25 (11.0%) | $170,114 |
| 6-Person Families | 3 (1.3%) | $0 |
| 7+ Person Families | 0 (0.0%) | $0 |
| Total | 227 (100.0%) | $102,125 |
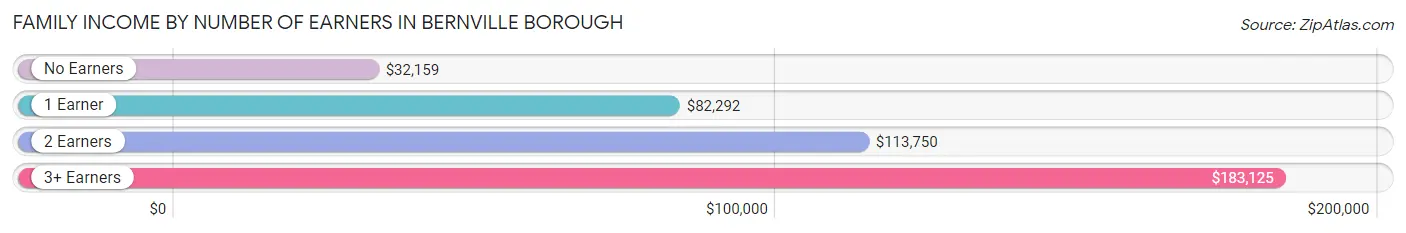
Family Income by Number of Earners in Bernville borough
The median family income in Bernville borough is $102,125, with families comprising 3+ earners (31) having the highest median family income of $183,125, while families with no earners (35) have the lowest median family income of $32,159, accounting for 13.7% and 15.4% of families, respectively.
| Number of Earners | # Families | Median Income |
| No Earners | 35 (15.4%) | $32,159 |
| 1 Earner | 45 (19.8%) | $82,292 |
| 2 Earners | 116 (51.1%) | $113,750 |
| 3+ Earners | 31 (13.7%) | $183,125 |
| Total | 227 (100.0%) | $102,125 |
Household Income in Bernville borough
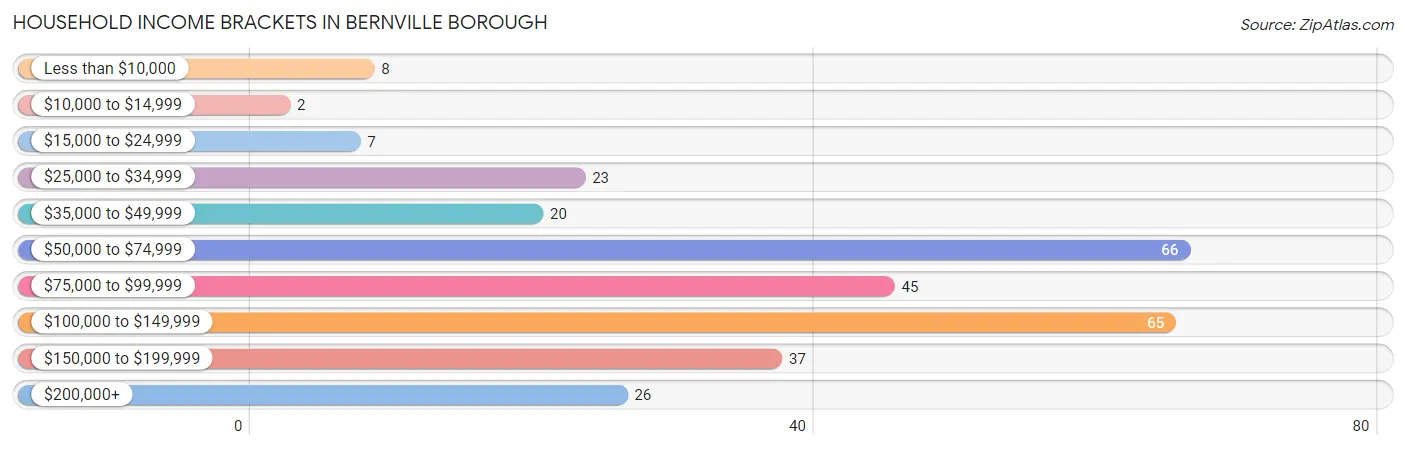
Household Income Brackets in Bernville borough
With 66 households falling in the category, the $50,000 to $74,999 income range is the most frequent in Bernville borough, accounting for 22.1% of all households. In contrast, only 2 households (0.7%) fall into the $10,000 to $14,999 income bracket, making it the least populous group.
| Income Bracket | # Households | % Households |
| Less than $10,000 | 8 | 2.7% |
| $10,000 to $14,999 | 2 | 0.7% |
| $15,000 to $24,999 | 7 | 2.3% |
| $25,000 to $34,999 | 23 | 7.7% |
| $35,000 to $49,999 | 20 | 6.7% |
| $50,000 to $74,999 | 66 | 22.1% |
| $75,000 to $99,999 | 45 | 15.1% |
| $100,000 to $149,999 | 65 | 21.7% |
| $150,000 to $199,999 | 37 | 12.4% |
| $200,000+ | 26 | 8.7% |
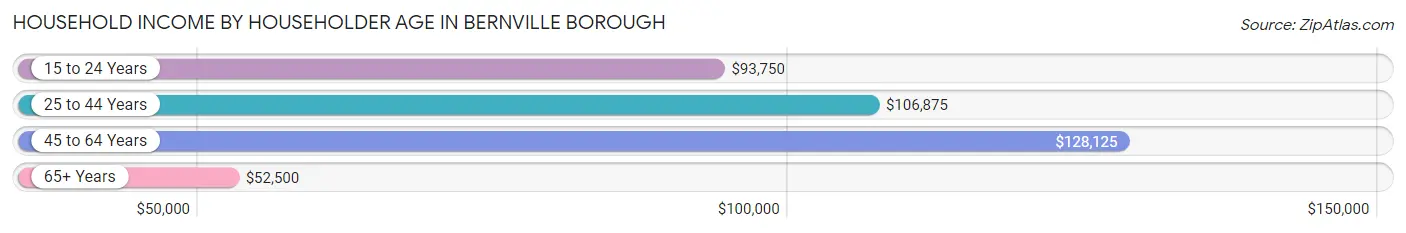
Household Income by Householder Age in Bernville borough
The median household income in Bernville borough is $84,196, with the highest median household income of $128,125 found in the 45 to 64 years age bracket for the primary householder. A total of 55 households (18.4%) fall into this category. Meanwhile, the 65+ years age bracket for the primary householder has the lowest median household income of $52,500, with 96 households (32.1%) in this group.
| Income Bracket | # Households | Median Income |
| 15 to 24 Years | 8 (2.7%) | $93,750 |
| 25 to 44 Years | 140 (46.8%) | $106,875 |
| 45 to 64 Years | 55 (18.4%) | $128,125 |
| 65+ Years | 96 (32.1%) | $52,500 |
| Total | 299 (100.0%) | $84,196 |
Poverty in Bernville borough
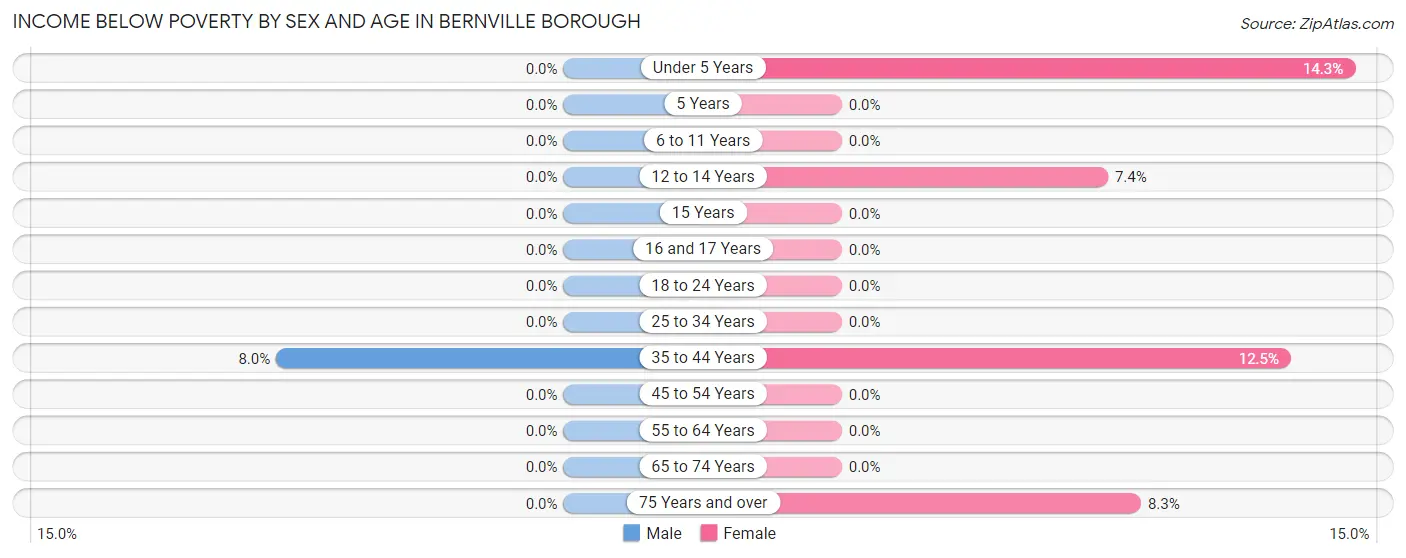
Income Below Poverty by Sex and Age in Bernville borough
With 1.5% poverty level for males and 4.4% for females among the residents of Bernville borough, 35 to 44 year old males and under 5 year old females are the most vulnerable to poverty, with 6 males (8.0%) and 6 females (14.3%) in their respective age groups living below the poverty level.
| Age Bracket | Male | Female |
| Under 5 Years | 0 (0.0%) | 6 (14.3%) |
| 5 Years | 0 (0.0%) | 0 (0.0%) |
| 6 to 11 Years | 0 (0.0%) | 0 (0.0%) |
| 12 to 14 Years | 0 (0.0%) | 2 (7.4%) |
| 15 Years | 0 (0.0%) | 0 (0.0%) |
| 16 and 17 Years | 0 (0.0%) | 0 (0.0%) |
| 18 to 24 Years | 0 (0.0%) | 0 (0.0%) |
| 25 to 34 Years | 0 (0.0%) | 0 (0.0%) |
| 35 to 44 Years | 6 (8.0%) | 9 (12.5%) |
| 45 to 54 Years | 0 (0.0%) | 0 (0.0%) |
| 55 to 64 Years | 0 (0.0%) | 0 (0.0%) |
| 65 to 74 Years | 0 (0.0%) | 0 (0.0%) |
| 75 Years and over | 0 (0.0%) | 2 (8.3%) |
| Total | 6 (1.5%) | 19 (4.4%) |
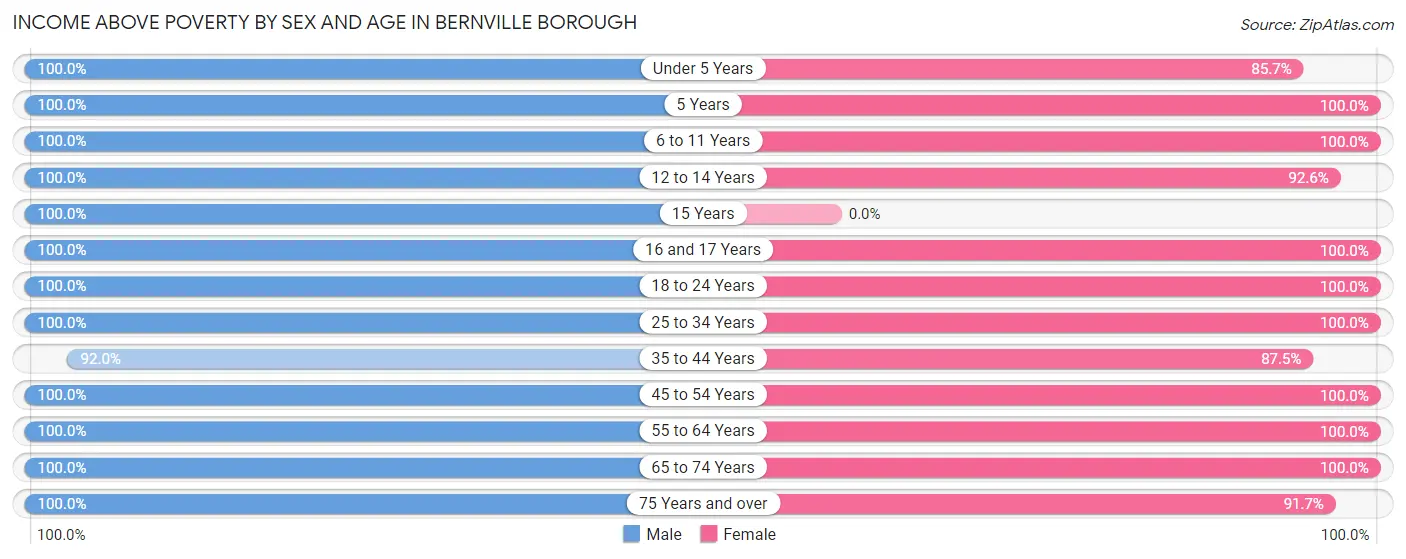
Income Above Poverty by Sex and Age in Bernville borough
According to the poverty statistics in Bernville borough, males aged under 5 years and females aged 5 years are the age groups that are most secure financially, with 100.0% of males and 100.0% of females in these age groups living above the poverty line.
| Age Bracket | Male | Female |
| Under 5 Years | 10 (100.0%) | 36 (85.7%) |
| 5 Years | 9 (100.0%) | 3 (100.0%) |
| 6 to 11 Years | 53 (100.0%) | 43 (100.0%) |
| 12 to 14 Years | 10 (100.0%) | 25 (92.6%) |
| 15 Years | 7 (100.0%) | 0 (0.0%) |
| 16 and 17 Years | 3 (100.0%) | 15 (100.0%) |
| 18 to 24 Years | 45 (100.0%) | 32 (100.0%) |
| 25 to 34 Years | 67 (100.0%) | 47 (100.0%) |
| 35 to 44 Years | 69 (92.0%) | 63 (87.5%) |
| 45 to 54 Years | 26 (100.0%) | 44 (100.0%) |
| 55 to 64 Years | 26 (100.0%) | 26 (100.0%) |
| 65 to 74 Years | 34 (100.0%) | 60 (100.0%) |
| 75 Years and over | 37 (100.0%) | 22 (91.7%) |
| Total | 396 (98.5%) | 416 (95.6%) |
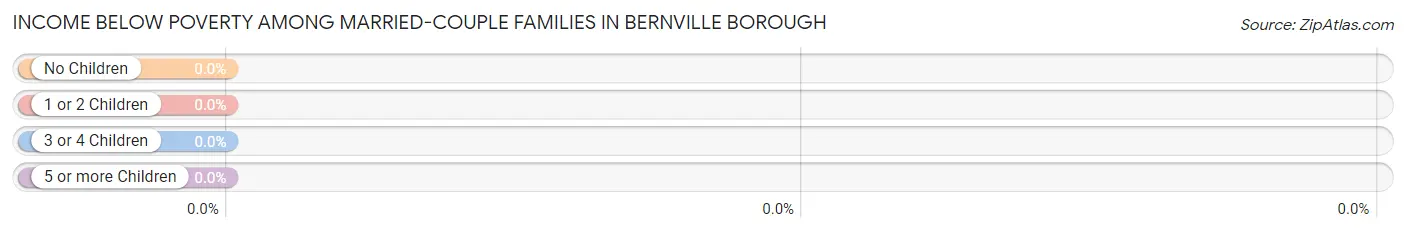
Income Below Poverty Among Married-Couple Families in Bernville borough
| Children | Above Poverty | Below Poverty |
| No Children | 90 (100.0%) | 0 (0.0%) |
| 1 or 2 Children | 62 (100.0%) | 0 (0.0%) |
| 3 or 4 Children | 26 (100.0%) | 0 (0.0%) |
| 5 or more Children | 0 (0.0%) | 0 (0.0%) |
| Total | 178 (100.0%) | 0 (0.0%) |
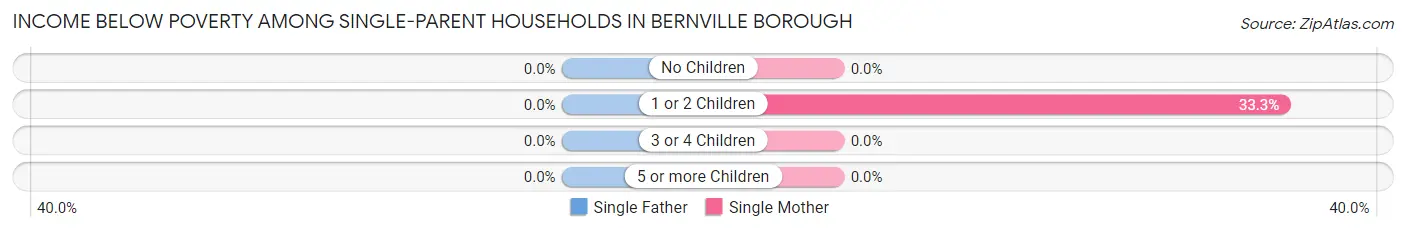
Income Below Poverty Among Single-Parent Households in Bernville borough
| Children | Single Father | Single Mother |
| No Children | 0 (0.0%) | 0 (0.0%) |
| 1 or 2 Children | 0 (0.0%) | 9 (33.3%) |
| 3 or 4 Children | 0 (0.0%) | 0 (0.0%) |
| 5 or more Children | 0 (0.0%) | 0 (0.0%) |
| Total | 0 (0.0%) | 9 (22.5%) |
Income Below Poverty Among Married-Couple vs Single-Parent Households in Bernville borough
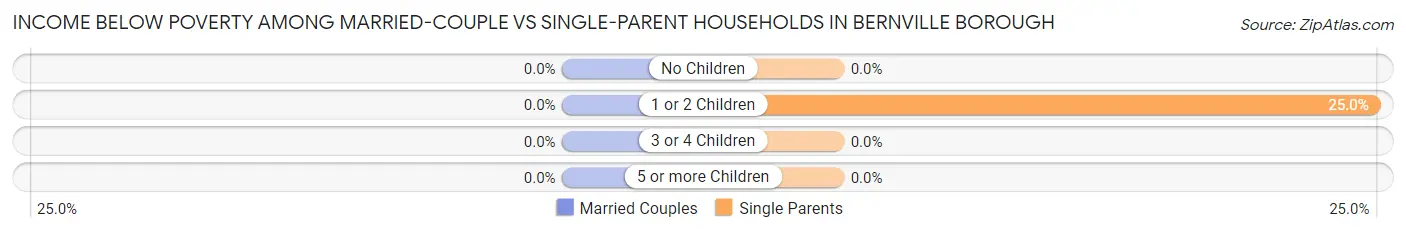
| Children | Married-Couple Families | Single-Parent Households |
| No Children | 0 (0.0%) | 0 (0.0%) |
| 1 or 2 Children | 0 (0.0%) | 9 (25.0%) |
| 3 or 4 Children | 0 (0.0%) | 0 (0.0%) |
| 5 or more Children | 0 (0.0%) | 0 (0.0%) |
| Total | 0 (0.0%) | 9 (18.4%) |
Race in Bernville borough
The most populous races in Bernville borough are White / Caucasian (810 | 96.8%), Hispanic or Latino (32 | 3.8%), and Two or more Races (15 | 1.8%).
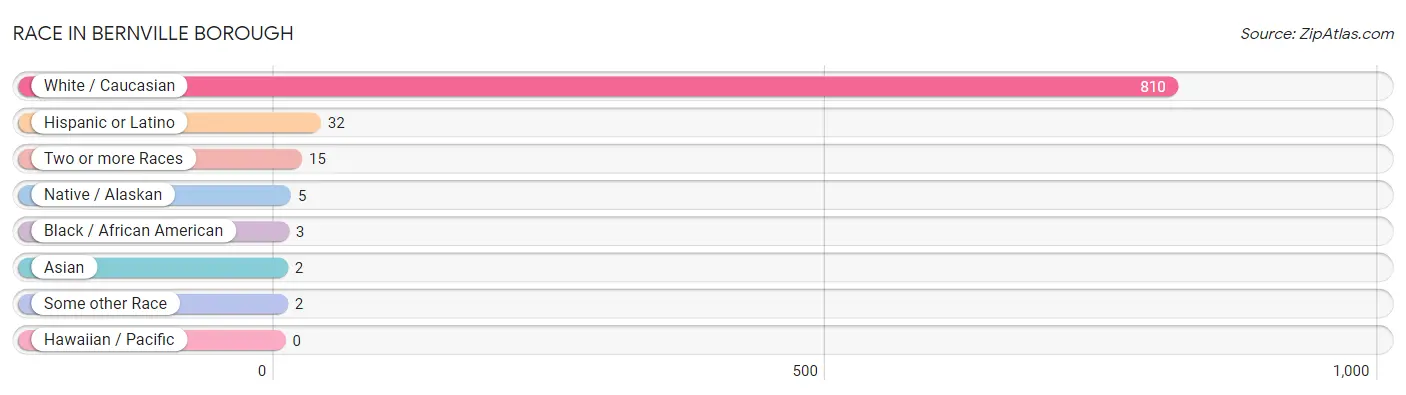
| Race | # Population | % Population |
| Asian | 2 | 0.2% |
| Black / African American | 3 | 0.4% |
| Hawaiian / Pacific | 0 | 0.0% |
| Hispanic or Latino | 32 | 3.8% |
| Native / Alaskan | 5 | 0.6% |
| White / Caucasian | 810 | 96.8% |
| Two or more Races | 15 | 1.8% |
| Some other Race | 2 | 0.2% |
| Total | 837 | 100.0% |
Ancestry in Bernville borough
The most populous ancestries reported in Bernville borough are German (254 | 30.3%), Irish (106 | 12.7%), Polish (63 | 7.5%), Arab (58 | 6.9%), and Lebanese (58 | 6.9%), together accounting for 64.4% of all Bernville borough residents.
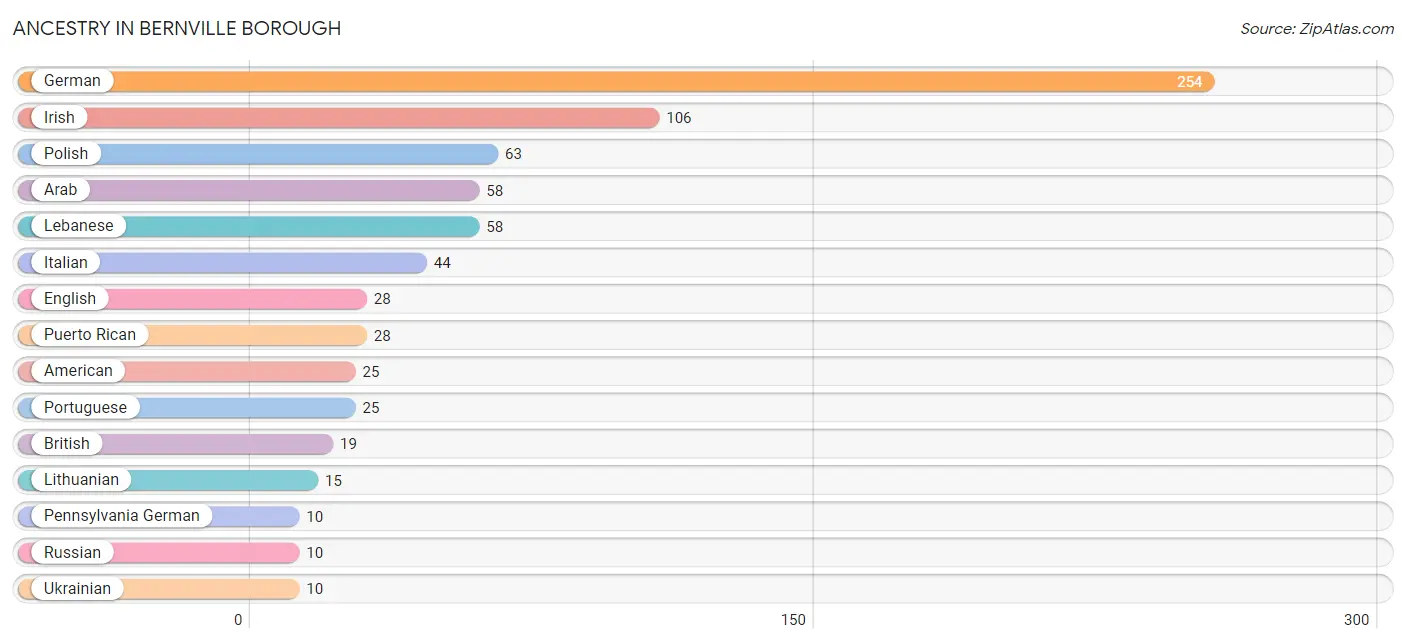
| Ancestry | # Population | % Population |
| American | 25 | 3.0% |
| Arab | 58 | 6.9% |
| British | 19 | 2.3% |
| Burmese | 2 | 0.2% |
| Canadian | 2 | 0.2% |
| Central American Indian | 7 | 0.8% |
| Cherokee | 2 | 0.2% |
| Dutch | 2 | 0.2% |
| English | 28 | 3.4% |
| European | 6 | 0.7% |
| Finnish | 2 | 0.2% |
| German | 254 | 30.3% |
| Irish | 106 | 12.7% |
| Italian | 44 | 5.3% |
| Lebanese | 58 | 6.9% |
| Lithuanian | 15 | 1.8% |
| Mexican | 2 | 0.2% |
| Pennsylvania German | 10 | 1.2% |
| Polish | 63 | 7.5% |
| Portuguese | 25 | 3.0% |
| Puerto Rican | 28 | 3.4% |
| Russian | 10 | 1.2% |
| Scotch-Irish | 3 | 0.4% |
| Slovak | 2 | 0.2% |
| Spaniard | 2 | 0.2% |
| Ukrainian | 10 | 1.2% |
| Welsh | 5 | 0.6% | View All 27 Rows |
Immigrants in Bernville borough
The most numerous immigrant groups reported in Bernville borough came from Europe (20 | 2.4%), Eastern Europe (18 | 2.1%), Lithuania (12 | 1.4%), Ukraine (5 | 0.6%), and Asia (2 | 0.2%), together accounting for 6.8% of all Bernville borough residents.
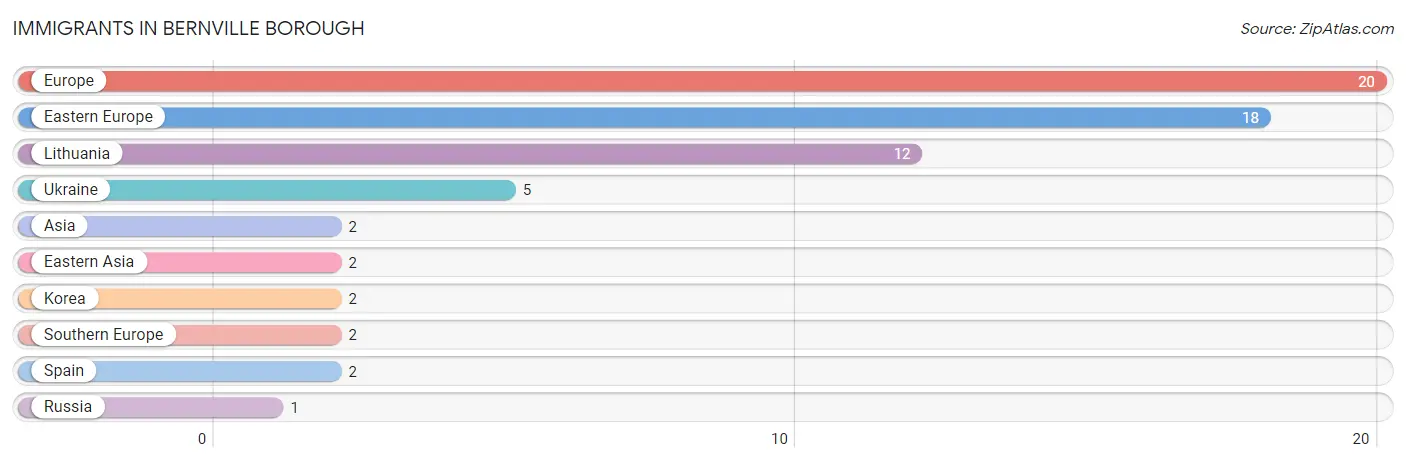
| Immigration Origin | # Population | % Population |
| Asia | 2 | 0.2% |
| Eastern Asia | 2 | 0.2% |
| Eastern Europe | 18 | 2.1% |
| Europe | 20 | 2.4% |
| Korea | 2 | 0.2% |
| Lithuania | 12 | 1.4% |
| Russia | 1 | 0.1% |
| Southern Europe | 2 | 0.2% |
| Spain | 2 | 0.2% |
| Ukraine | 5 | 0.6% | View All 10 Rows |
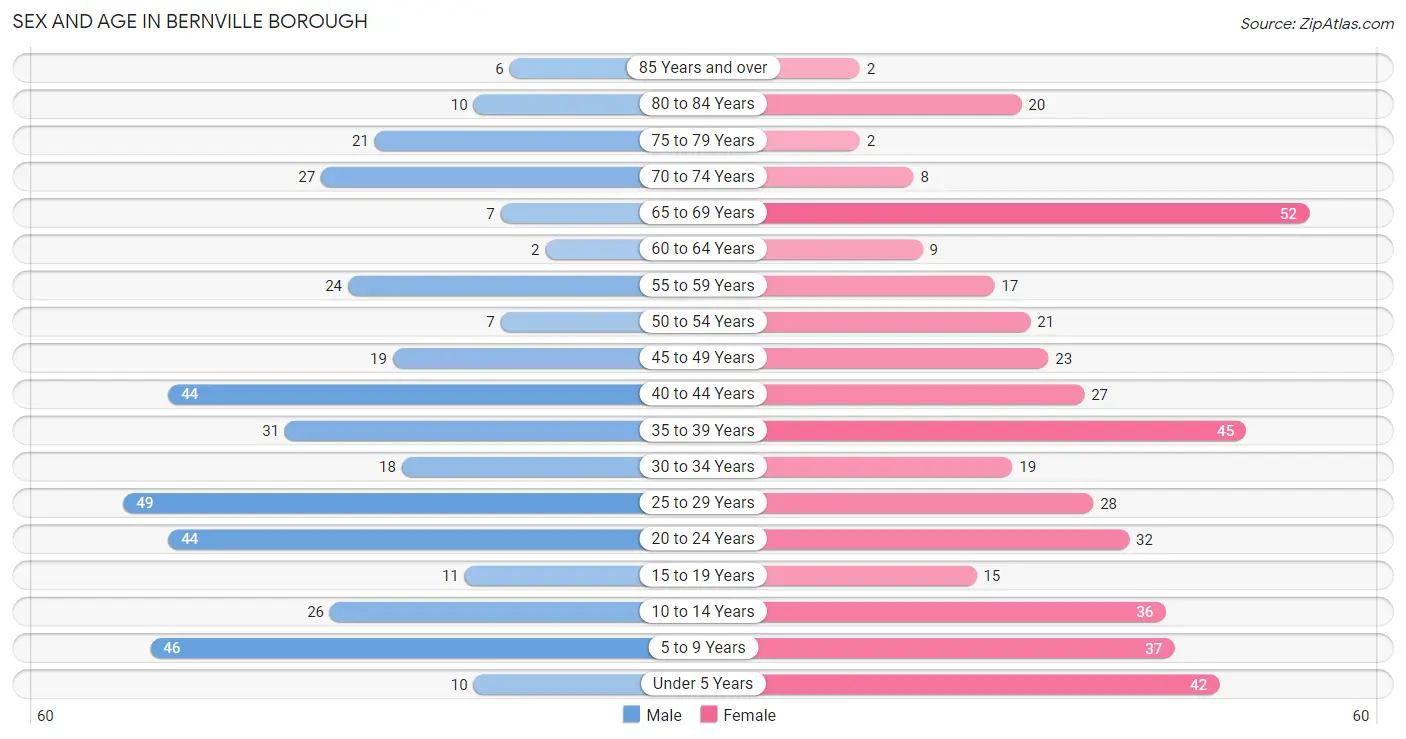
Sex and Age in Bernville borough
Sex and Age in Bernville borough
The most populous age groups in Bernville borough are 25 to 29 Years (49 | 12.2%) for men and 65 to 69 Years (52 | 11.9%) for women.
| Age Bracket | Male | Female |
| Under 5 Years | 10 (2.5%) | 42 (9.7%) |
| 5 to 9 Years | 46 (11.4%) | 37 (8.5%) |
| 10 to 14 Years | 26 (6.5%) | 36 (8.3%) |
| 15 to 19 Years | 11 (2.7%) | 15 (3.5%) |
| 20 to 24 Years | 44 (11.0%) | 32 (7.4%) |
| 25 to 29 Years | 49 (12.2%) | 28 (6.4%) |
| 30 to 34 Years | 18 (4.5%) | 19 (4.4%) |
| 35 to 39 Years | 31 (7.7%) | 45 (10.3%) |
| 40 to 44 Years | 44 (11.0%) | 27 (6.2%) |
| 45 to 49 Years | 19 (4.7%) | 23 (5.3%) |
| 50 to 54 Years | 7 (1.7%) | 21 (4.8%) |
| 55 to 59 Years | 24 (6.0%) | 17 (3.9%) |
| 60 to 64 Years | 2 (0.5%) | 9 (2.1%) |
| 65 to 69 Years | 7 (1.7%) | 52 (11.9%) |
| 70 to 74 Years | 27 (6.7%) | 8 (1.8%) |
| 75 to 79 Years | 21 (5.2%) | 2 (0.5%) |
| 80 to 84 Years | 10 (2.5%) | 20 (4.6%) |
| 85 Years and over | 6 (1.5%) | 2 (0.5%) |
| Total | 402 (100.0%) | 435 (100.0%) |
Families and Households in Bernville borough
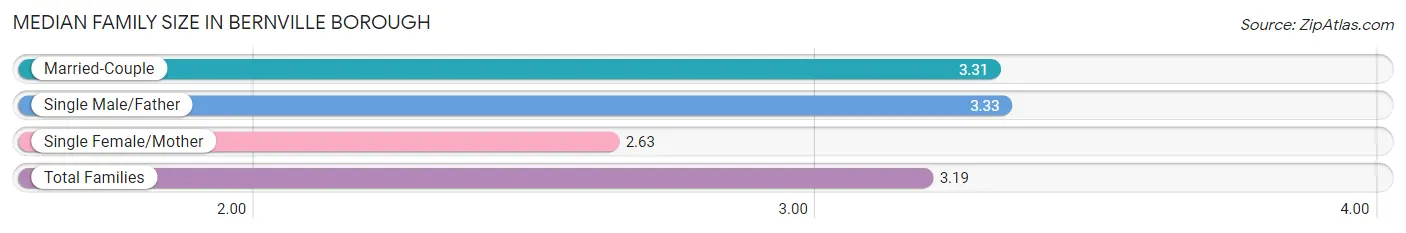
Median Family Size in Bernville borough
The median family size in Bernville borough is 3.19 persons per family, with single male/father families (9 | 4.0%) accounting for the largest median family size of 3.33 persons per family. On the other hand, single female/mother families (40 | 17.6%) represent the smallest median family size with 2.63 persons per family.
| Family Type | # Families | Family Size |
| Married-Couple | 178 (78.4%) | 3.31 |
| Single Male/Father | 9 (4.0%) | 3.33 |
| Single Female/Mother | 40 (17.6%) | 2.63 |
| Total Families | 227 (100.0%) | 3.19 |
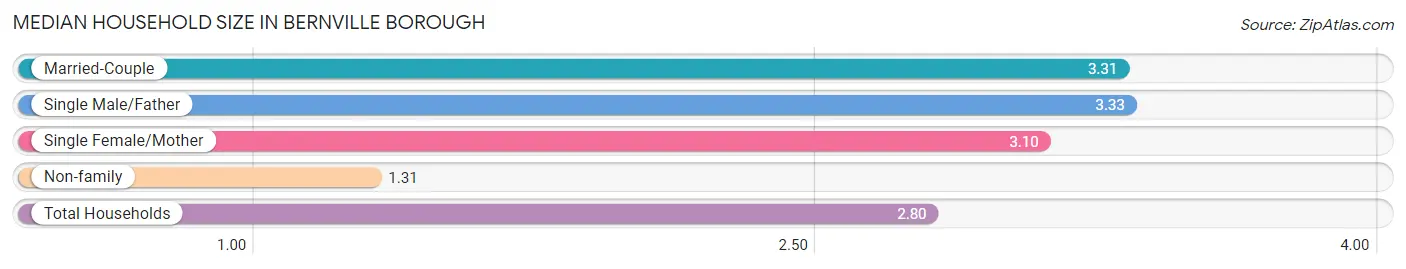
Median Household Size in Bernville borough
The median household size in Bernville borough is 2.80 persons per household, with single male/father households (9 | 3.0%) accounting for the largest median household size of 3.33 persons per household. non-family households (72 | 24.1%) represent the smallest median household size with 1.31 persons per household.
| Household Type | # Households | Household Size |
| Married-Couple | 178 (59.5%) | 3.31 |
| Single Male/Father | 9 (3.0%) | 3.33 |
| Single Female/Mother | 40 (13.4%) | 3.10 |
| Non-family | 72 (24.1%) | 1.31 |
| Total Households | 299 (100.0%) | 2.80 |
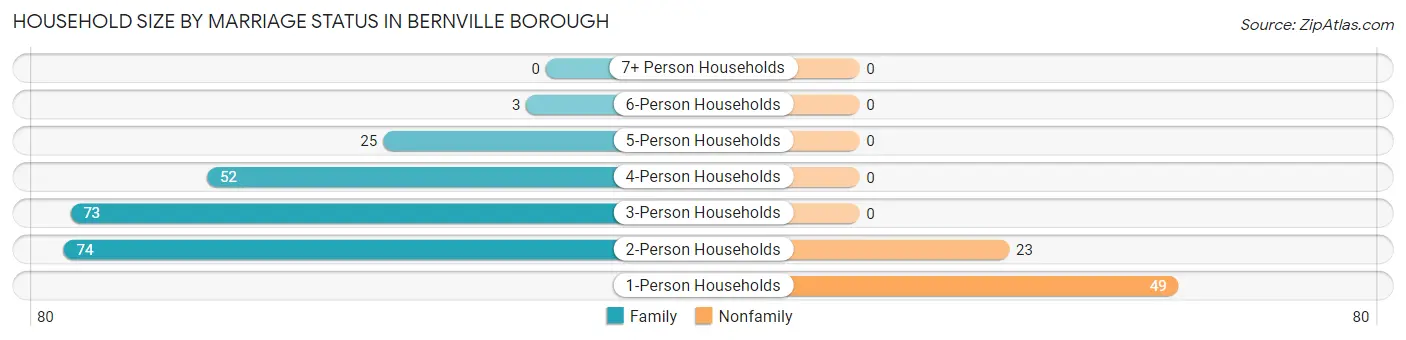
Household Size by Marriage Status in Bernville borough
Out of a total of 299 households in Bernville borough, 227 (75.9%) are family households, while 72 (24.1%) are nonfamily households. The most numerous type of family households are 2-person households, comprising 74, and the most common type of nonfamily households are 1-person households, comprising 49.
| Household Size | Family Households | Nonfamily Households |
| 1-Person Households | - | 49 (16.4%) |
| 2-Person Households | 74 (24.7%) | 23 (7.7%) |
| 3-Person Households | 73 (24.4%) | 0 (0.0%) |
| 4-Person Households | 52 (17.4%) | 0 (0.0%) |
| 5-Person Households | 25 (8.4%) | 0 (0.0%) |
| 6-Person Households | 3 (1.0%) | 0 (0.0%) |
| 7+ Person Households | 0 (0.0%) | 0 (0.0%) |
| Total | 227 (75.9%) | 72 (24.1%) |
Female Fertility in Bernville borough
Fertility by Age in Bernville borough
Average fertility rate in Bernville borough is 95.0 births per 1,000 women. Women in the age bracket of 20 to 34 years have the highest fertility rate with 203.0 births per 1,000 women. Women in the age bracket of 20 to 34 years acount for 88.9% of all women with births.
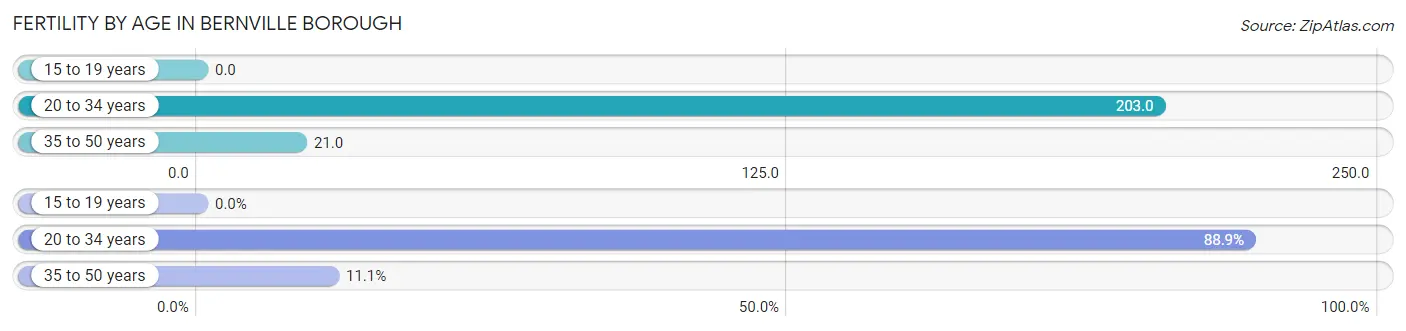
| Age Bracket | Women with Births | Births / 1,000 Women |
| 15 to 19 years | 0 (0.0%) | 0.0 |
| 20 to 34 years | 16 (88.9%) | 203.0 |
| 35 to 50 years | 2 (11.1%) | 21.0 |
| Total | 18 (100.0%) | 95.0 |
Fertility by Age by Marriage Status in Bernville borough
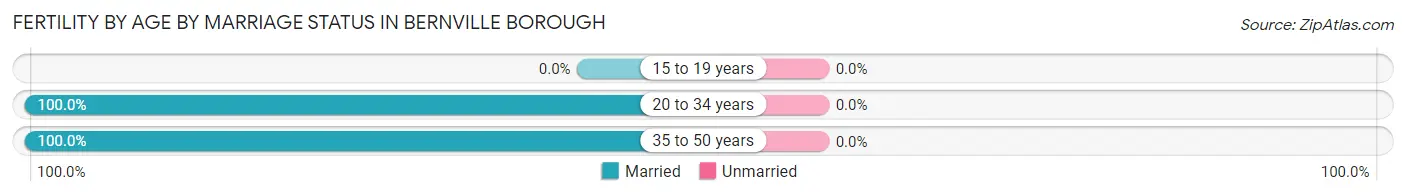
| Age Bracket | Married | Unmarried |
| 15 to 19 years | 0 (0.0%) | 0 (0.0%) |
| 20 to 34 years | 16 (100.0%) | 0 (0.0%) |
| 35 to 50 years | 2 (100.0%) | 0 (0.0%) |
| Total | 18 (100.0%) | 0 (0.0%) |
Fertility by Education in Bernville borough
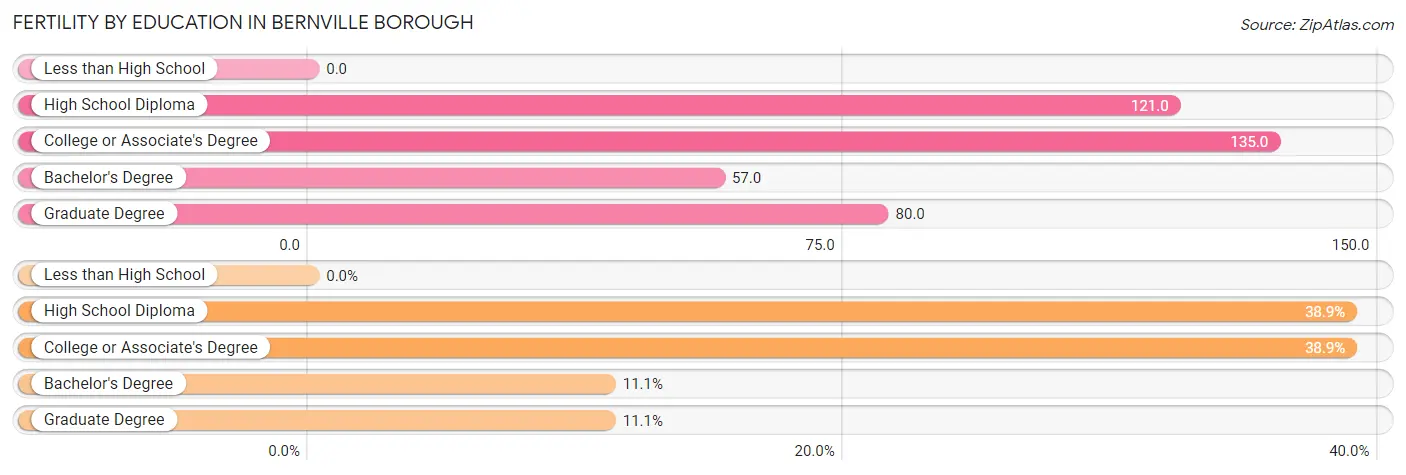
| Educational Attainment | Women with Births | Births / 1,000 Women |
| Less than High School | 0 (0.0%) | 0.0 |
| High School Diploma | 7 (38.9%) | 121.0 |
| College or Associate's Degree | 7 (38.9%) | 135.0 |
| Bachelor's Degree | 2 (11.1%) | 57.0 |
| Graduate Degree | 2 (11.1%) | 80.0 |
| Total | 18 (100.0%) | 95.0 |
Fertility by Education by Marriage Status in Bernville borough
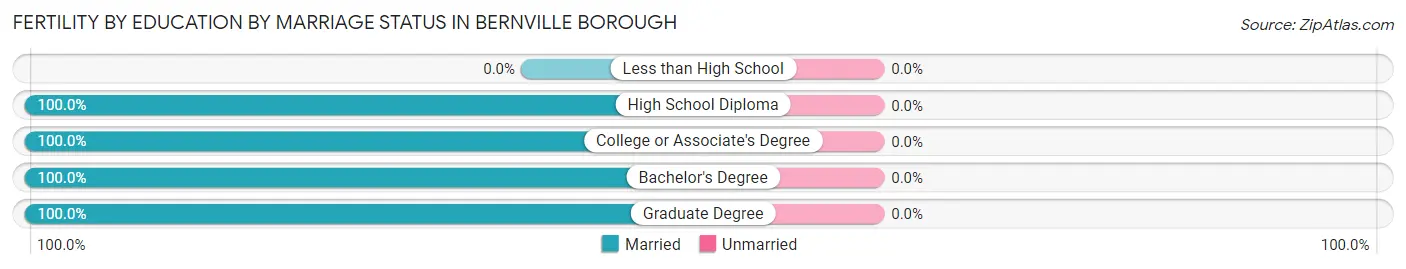
| Educational Attainment | Married | Unmarried |
| Less than High School | 0 (0.0%) | 0 (0.0%) |
| High School Diploma | 7 (100.0%) | 0 (0.0%) |
| College or Associate's Degree | 7 (100.0%) | 0 (0.0%) |
| Bachelor's Degree | 2 (100.0%) | 0 (0.0%) |
| Graduate Degree | 2 (100.0%) | 0 (0.0%) |
| Total | 18 (100.0%) | 0 (0.0%) |
Employment Characteristics in Bernville borough
Employment by Class of Employer in Bernville borough
Among the 441 employed individuals in Bernville borough, private company employees (378 | 85.7%), local government employees (20 | 4.5%), and not-for-profit organizations (16 | 3.6%) make up the most common classes of employment.
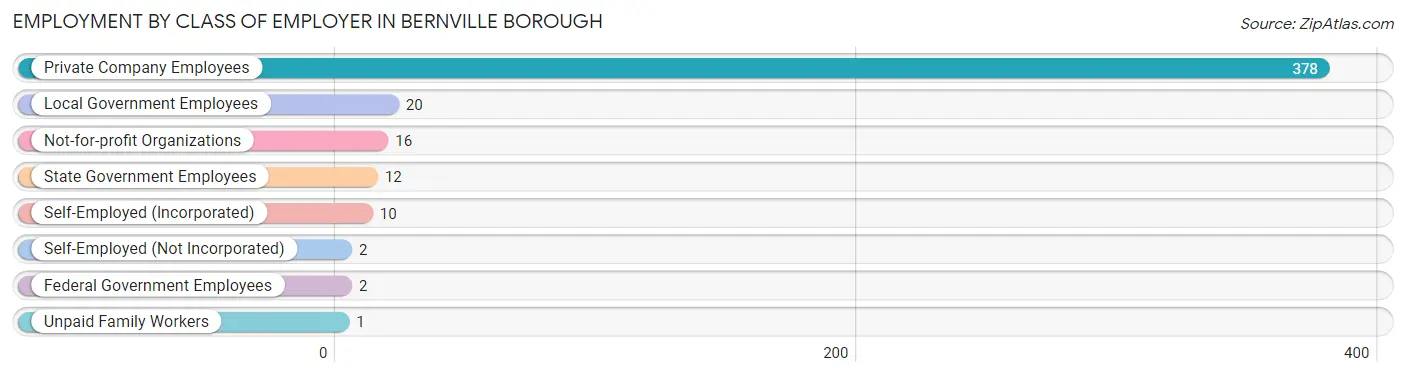
| Employer Class | # Employees | % Employees |
| Private Company Employees | 378 | 85.7% |
| Self-Employed (Incorporated) | 10 | 2.3% |
| Self-Employed (Not Incorporated) | 2 | 0.4% |
| Not-for-profit Organizations | 16 | 3.6% |
| Local Government Employees | 20 | 4.5% |
| State Government Employees | 12 | 2.7% |
| Federal Government Employees | 2 | 0.4% |
| Unpaid Family Workers | 1 | 0.2% |
| Total | 441 | 100.0% |
Employment Status by Age in Bernville borough
According to the labor force statistics for Bernville borough, out of the total population over 16 years of age (633), 72.5% or 459 individuals are in the labor force, with 2.4% or 11 of them unemployed. The age group with the highest labor force participation rate is 25 to 29 years, with 100.0% or 77 individuals in the labor force. Within the labor force, the 75 years and over age range has the highest percentage of unemployed individuals, with 56.3% or 9 of them being unemployed.
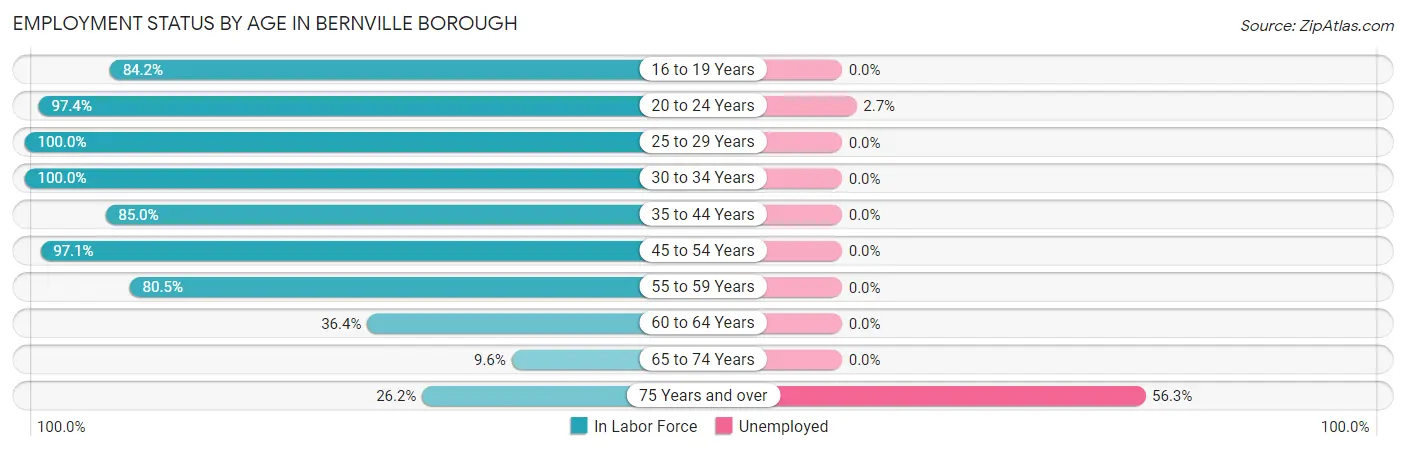
| Age Bracket | In Labor Force | Unemployed |
| 16 to 19 Years | 16 (84.2%) | 0 (0.0%) |
| 20 to 24 Years | 74 (97.4%) | 2 (2.7%) |
| 25 to 29 Years | 77 (100.0%) | 0 (0.0%) |
| 30 to 34 Years | 37 (100.0%) | 0 (0.0%) |
| 35 to 44 Years | 125 (85.0%) | 0 (0.0%) |
| 45 to 54 Years | 68 (97.1%) | 0 (0.0%) |
| 55 to 59 Years | 33 (80.5%) | 0 (0.0%) |
| 60 to 64 Years | 4 (36.4%) | 0 (0.0%) |
| 65 to 74 Years | 9 (9.6%) | 0 (0.0%) |
| 75 Years and over | 16 (26.2%) | 9 (56.3%) |
| Total | 459 (72.5%) | 11 (2.4%) |
Employment Status by Educational Attainment in Bernville borough
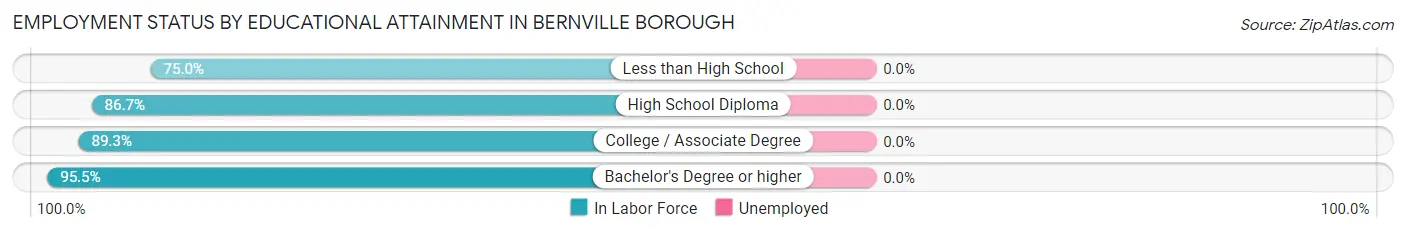
| Educational Attainment | In Labor Force | Unemployed |
| Less than High School | 15 (75.0%) | 0 (0.0%) |
| High School Diploma | 111 (86.7%) | 0 (0.0%) |
| College / Associate Degree | 92 (89.3%) | 0 (0.0%) |
| Bachelor's Degree or higher | 126 (95.5%) | 0 (0.0%) |
| Total | 344 (89.8%) | 0 (0.0%) |
Employment Occupations by Sex in Bernville borough
Management, Business, Science and Arts Occupations
The most common Management, Business, Science and Arts occupations in Bernville borough are Health Diagnosing & Treating (50 | 11.2%), Health Technologists (45 | 10.1%), Computers, Engineering & Science (39 | 8.7%), Community & Social Service (36 | 8.1%), and Business & Financial (27 | 6.0%).
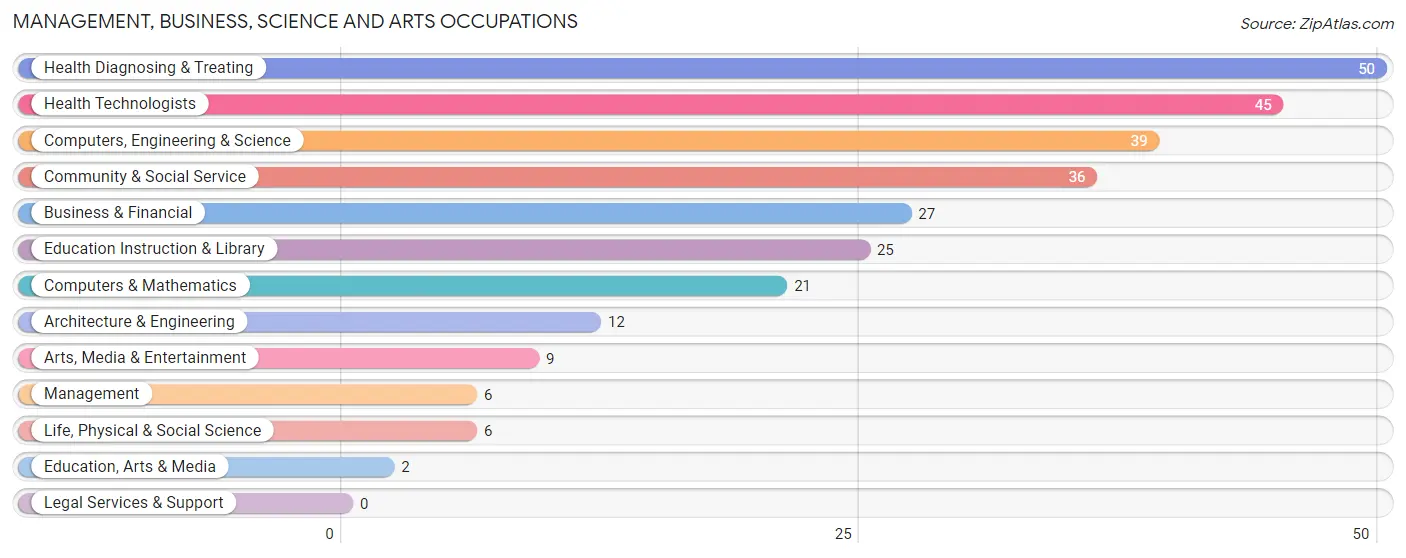
Management, Business, Science and Arts Occupations by Sex
Within the Management, Business, Science and Arts occupations in Bernville borough, the most male-oriented occupations are Architecture & Engineering (100.0%), Life, Physical & Social Science (100.0%), and Computers, Engineering & Science (89.7%), while the most female-oriented occupations are Education, Arts & Media (100.0%), Arts, Media & Entertainment (100.0%), and Community & Social Service (88.9%).
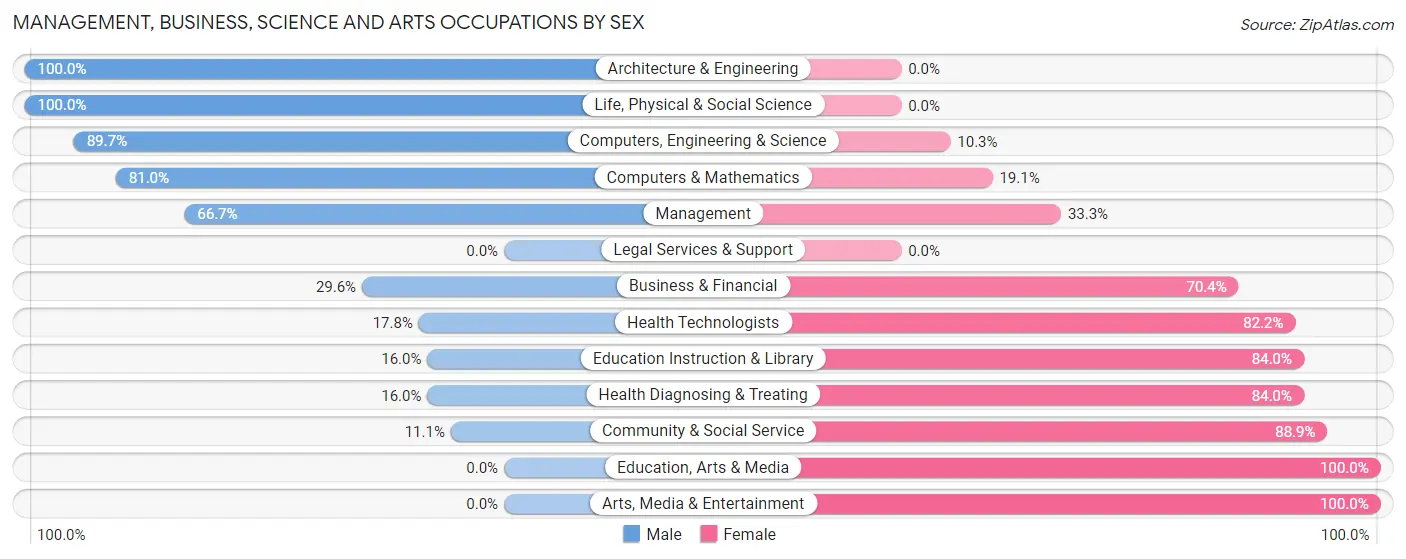
| Occupation | Male | Female |
| Management | 4 (66.7%) | 2 (33.3%) |
| Business & Financial | 8 (29.6%) | 19 (70.4%) |
| Computers, Engineering & Science | 35 (89.7%) | 4 (10.3%) |
| Computers & Mathematics | 17 (80.9%) | 4 (19.1%) |
| Architecture & Engineering | 12 (100.0%) | 0 (0.0%) |
| Life, Physical & Social Science | 6 (100.0%) | 0 (0.0%) |
| Community & Social Service | 4 (11.1%) | 32 (88.9%) |
| Education, Arts & Media | 0 (0.0%) | 2 (100.0%) |
| Legal Services & Support | 0 (0.0%) | 0 (0.0%) |
| Education Instruction & Library | 4 (16.0%) | 21 (84.0%) |
| Arts, Media & Entertainment | 0 (0.0%) | 9 (100.0%) |
| Health Diagnosing & Treating | 8 (16.0%) | 42 (84.0%) |
| Health Technologists | 8 (17.8%) | 37 (82.2%) |
| Total (Category) | 59 (37.3%) | 99 (62.7%) |
| Total (Overall) | 226 (50.6%) | 221 (49.4%) |
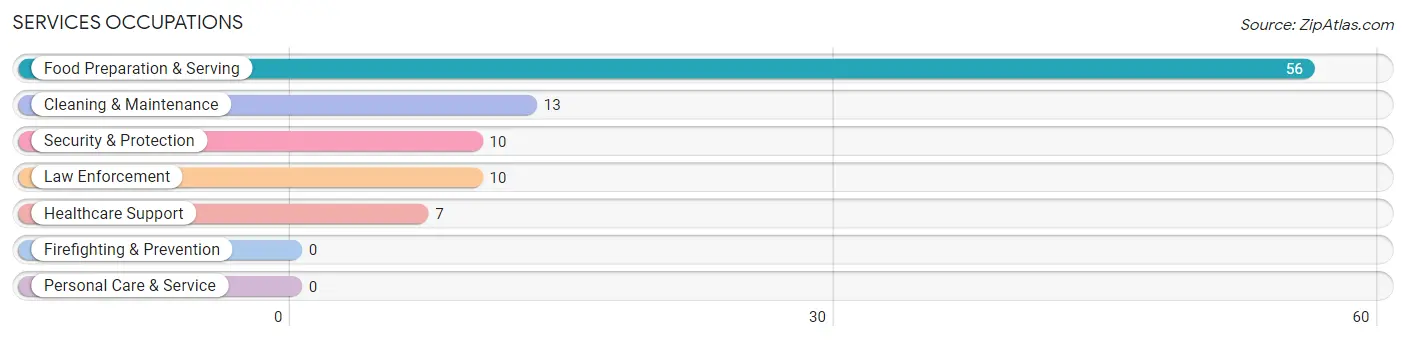
Services Occupations
The most common Services occupations in Bernville borough are Food Preparation & Serving (56 | 12.5%), Cleaning & Maintenance (13 | 2.9%), Security & Protection (10 | 2.2%), Law Enforcement (10 | 2.2%), and Healthcare Support (7 | 1.6%).
Services Occupations by Sex
Within the Services occupations in Bernville borough, the most male-oriented occupations are Cleaning & Maintenance (100.0%), Security & Protection (70.0%), and Law Enforcement (70.0%), while the most female-oriented occupations are Healthcare Support (100.0%), Food Preparation & Serving (62.5%), and Security & Protection (30.0%).
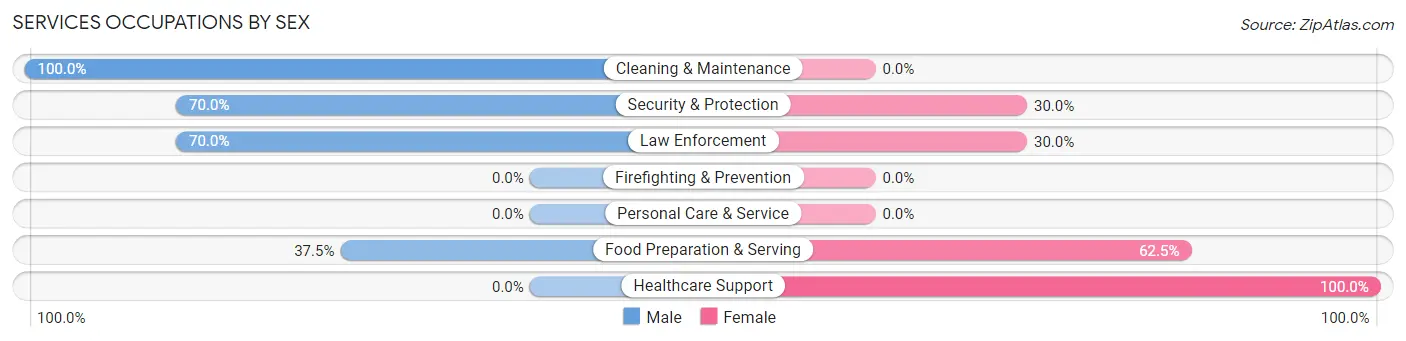
| Occupation | Male | Female |
| Healthcare Support | 0 (0.0%) | 7 (100.0%) |
| Security & Protection | 7 (70.0%) | 3 (30.0%) |
| Firefighting & Prevention | 0 (0.0%) | 0 (0.0%) |
| Law Enforcement | 7 (70.0%) | 3 (30.0%) |
| Food Preparation & Serving | 21 (37.5%) | 35 (62.5%) |
| Cleaning & Maintenance | 13 (100.0%) | 0 (0.0%) |
| Personal Care & Service | 0 (0.0%) | 0 (0.0%) |
| Total (Category) | 41 (47.7%) | 45 (52.3%) |
| Total (Overall) | 226 (50.6%) | 221 (49.4%) |
Sales and Office Occupations
The most common Sales and Office occupations in Bernville borough are Office & Administration (60 | 13.4%), and Sales & Related (44 | 9.8%).

Sales and Office Occupations by Sex

| Occupation | Male | Female |
| Sales & Related | 21 (47.7%) | 23 (52.3%) |
| Office & Administration | 37 (61.7%) | 23 (38.3%) |
| Total (Category) | 58 (55.8%) | 46 (44.2%) |
| Total (Overall) | 226 (50.6%) | 221 (49.4%) |
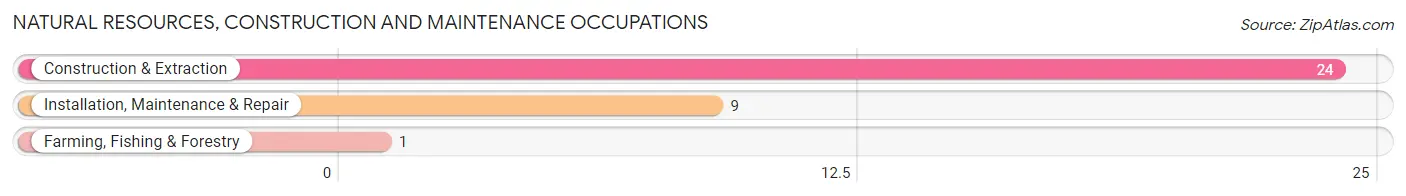
Natural Resources, Construction and Maintenance Occupations
The most common Natural Resources, Construction and Maintenance occupations in Bernville borough are Construction & Extraction (24 | 5.4%), Installation, Maintenance & Repair (9 | 2.0%), and Farming, Fishing & Forestry (1 | 0.2%).
Natural Resources, Construction and Maintenance Occupations by Sex

| Occupation | Male | Female |
| Farming, Fishing & Forestry | 0 (0.0%) | 1 (100.0%) |
| Construction & Extraction | 24 (100.0%) | 0 (0.0%) |
| Installation, Maintenance & Repair | 7 (77.8%) | 2 (22.2%) |
| Total (Category) | 31 (91.2%) | 3 (8.8%) |
| Total (Overall) | 226 (50.6%) | 221 (49.4%) |
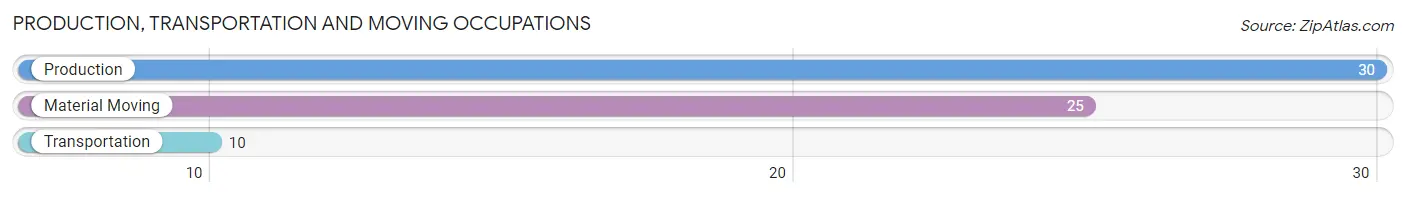
Production, Transportation and Moving Occupations
The most common Production, Transportation and Moving occupations in Bernville borough are Production (30 | 6.7%), Material Moving (25 | 5.6%), and Transportation (10 | 2.2%).
Production, Transportation and Moving Occupations by Sex
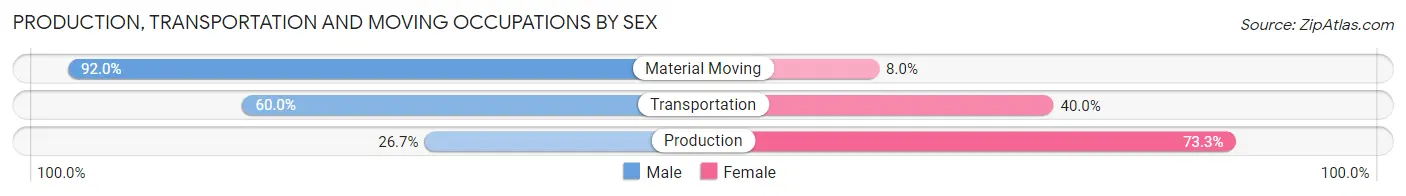
| Occupation | Male | Female |
| Production | 8 (26.7%) | 22 (73.3%) |
| Transportation | 6 (60.0%) | 4 (40.0%) |
| Material Moving | 23 (92.0%) | 2 (8.0%) |
| Total (Category) | 37 (56.9%) | 28 (43.1%) |
| Total (Overall) | 226 (50.6%) | 221 (49.4%) |
Employment Industries by Sex in Bernville borough
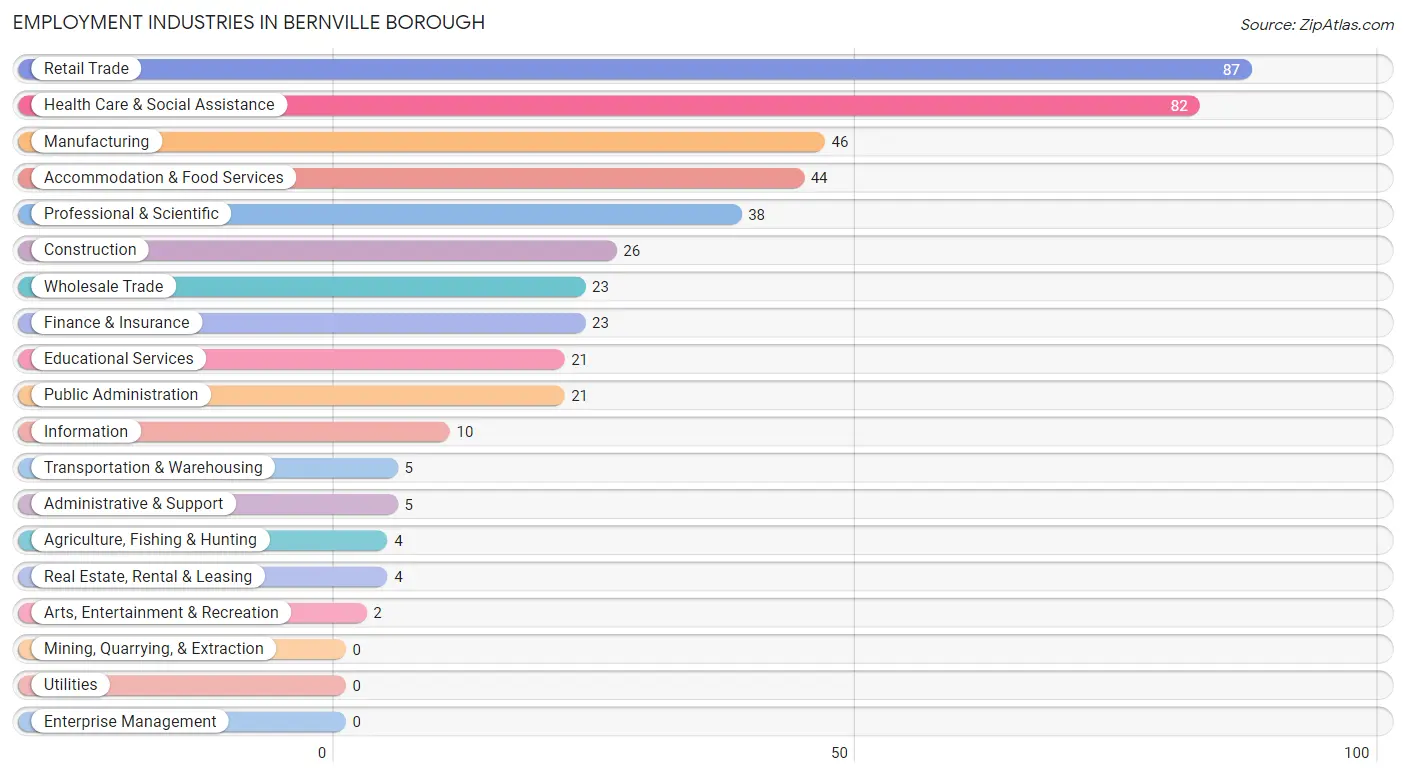
Employment Industries in Bernville borough
The major employment industries in Bernville borough include Retail Trade (87 | 19.5%), Health Care & Social Assistance (82 | 18.3%), Manufacturing (46 | 10.3%), Accommodation & Food Services (44 | 9.8%), and Professional & Scientific (38 | 8.5%).
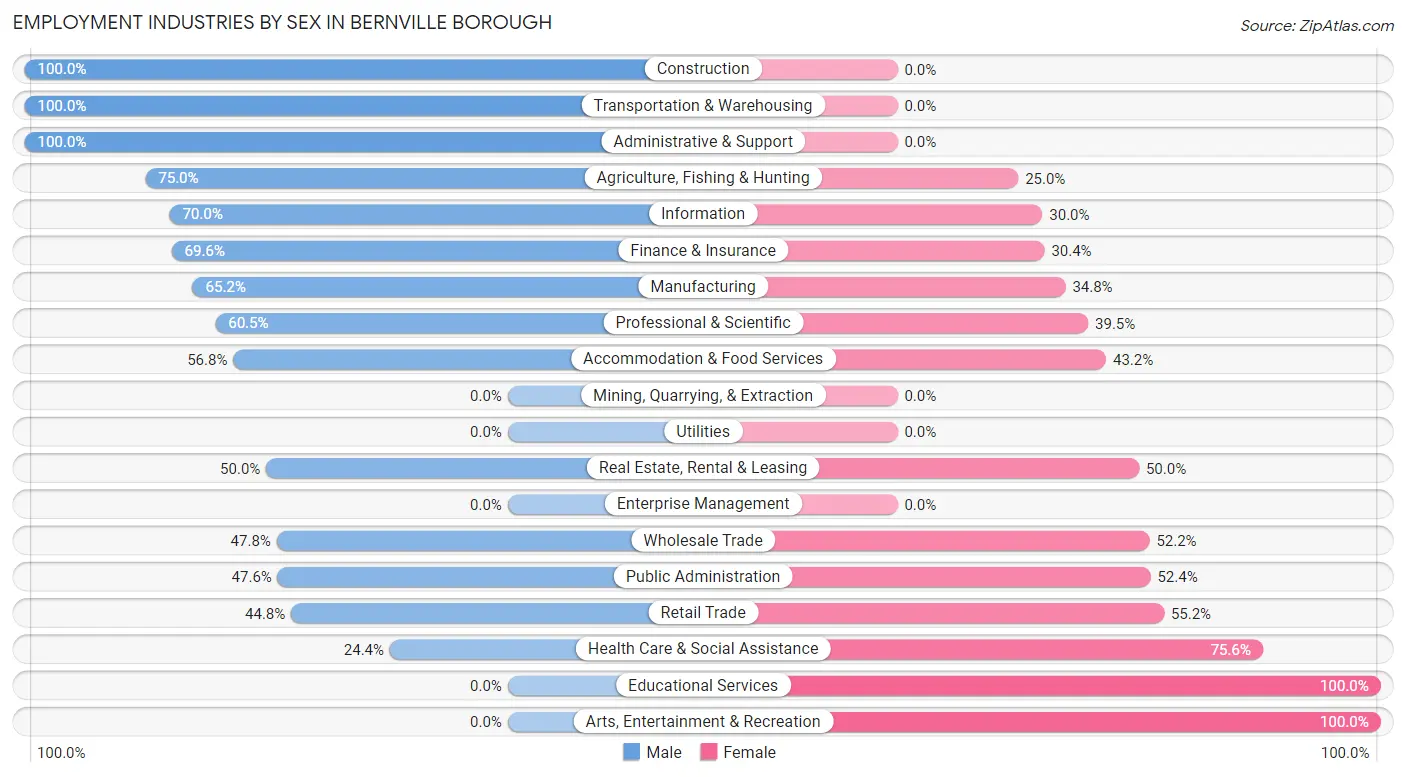
Employment Industries by Sex in Bernville borough
The Bernville borough industries that see more men than women are Construction (100.0%), Transportation & Warehousing (100.0%), and Administrative & Support (100.0%), whereas the industries that tend to have a higher number of women are Educational Services (100.0%), Arts, Entertainment & Recreation (100.0%), and Health Care & Social Assistance (75.6%).
| Industry | Male | Female |
| Agriculture, Fishing & Hunting | 3 (75.0%) | 1 (25.0%) |
| Mining, Quarrying, & Extraction | 0 (0.0%) | 0 (0.0%) |
| Construction | 26 (100.0%) | 0 (0.0%) |
| Manufacturing | 30 (65.2%) | 16 (34.8%) |
| Wholesale Trade | 11 (47.8%) | 12 (52.2%) |
| Retail Trade | 39 (44.8%) | 48 (55.2%) |
| Transportation & Warehousing | 5 (100.0%) | 0 (0.0%) |
| Utilities | 0 (0.0%) | 0 (0.0%) |
| Information | 7 (70.0%) | 3 (30.0%) |
| Finance & Insurance | 16 (69.6%) | 7 (30.4%) |
| Real Estate, Rental & Leasing | 2 (50.0%) | 2 (50.0%) |
| Professional & Scientific | 23 (60.5%) | 15 (39.5%) |
| Enterprise Management | 0 (0.0%) | 0 (0.0%) |
| Administrative & Support | 5 (100.0%) | 0 (0.0%) |
| Educational Services | 0 (0.0%) | 21 (100.0%) |
| Health Care & Social Assistance | 20 (24.4%) | 62 (75.6%) |
| Arts, Entertainment & Recreation | 0 (0.0%) | 2 (100.0%) |
| Accommodation & Food Services | 25 (56.8%) | 19 (43.2%) |
| Public Administration | 10 (47.6%) | 11 (52.4%) |
| Total | 226 (50.6%) | 221 (49.4%) |
Education in Bernville borough
School Enrollment in Bernville borough
The most common levels of schooling among the 215 students in Bernville borough are elementary school (48 | 22.3%), college / undergraduate (37 | 17.2%), and kindergarten (36 | 16.7%).
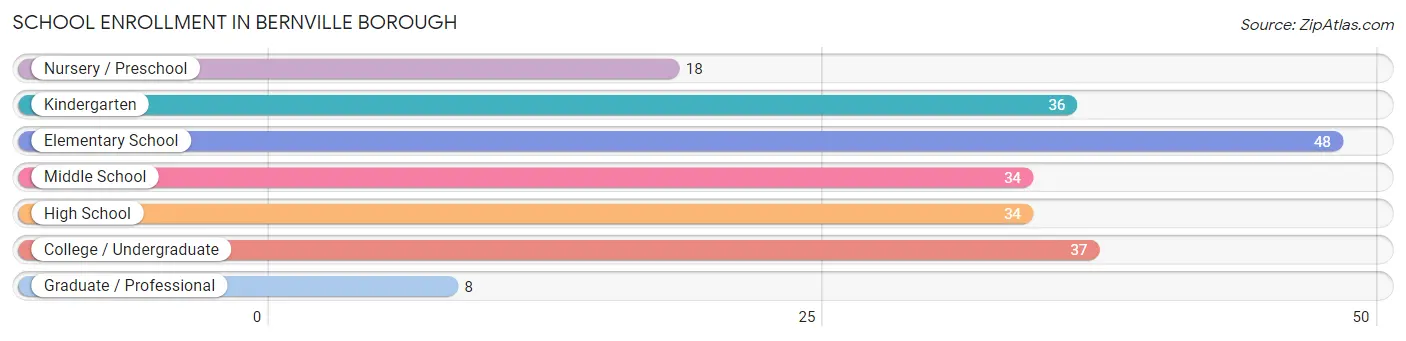
| School Level | # Students | % Students |
| Nursery / Preschool | 18 | 8.4% |
| Kindergarten | 36 | 16.7% |
| Elementary School | 48 | 22.3% |
| Middle School | 34 | 15.8% |
| High School | 34 | 15.8% |
| College / Undergraduate | 37 | 17.2% |
| Graduate / Professional | 8 | 3.7% |
| Total | 215 | 100.0% |
School Enrollment by Age by Funding Source in Bernville borough
Out of a total of 215 students who are enrolled in schools in Bernville borough, 24 (11.2%) attend a private institution, while the remaining 191 (88.8%) are enrolled in public schools. The age group of 3 to 4 year olds has the highest likelihood of being enrolled in private schools, with 6 (85.7% in the age bracket) enrolled. Conversely, the age group of 5 to 9 year old has the lowest likelihood of being enrolled in a private school, with 79 (100.0% in the age bracket) attending a public institution.
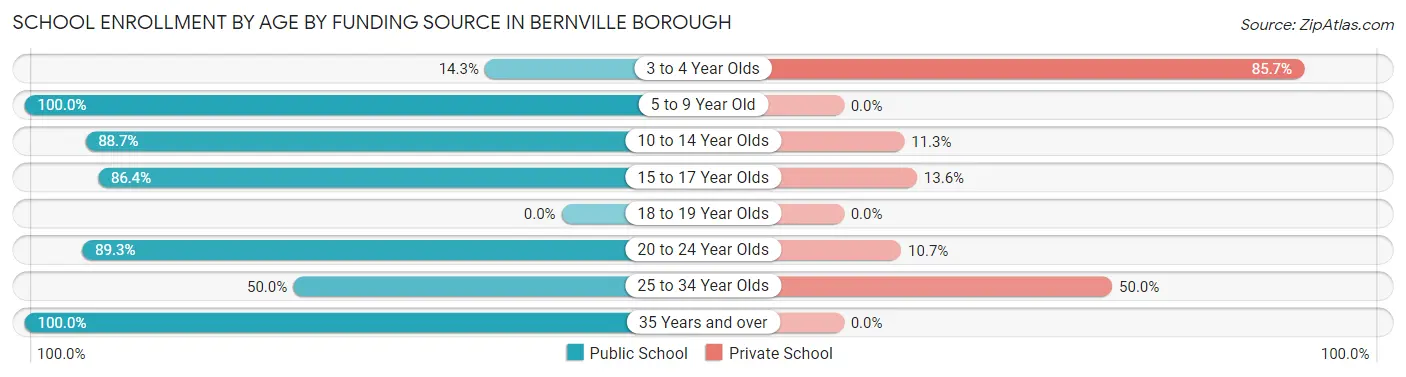
| Age Bracket | Public School | Private School |
| 3 to 4 Year Olds | 1 (14.3%) | 6 (85.7%) |
| 5 to 9 Year Old | 79 (100.0%) | 0 (0.0%) |
| 10 to 14 Year Olds | 55 (88.7%) | 7 (11.3%) |
| 15 to 17 Year Olds | 19 (86.4%) | 3 (13.6%) |
| 18 to 19 Year Olds | 0 (0.0%) | 0 (0.0%) |
| 20 to 24 Year Olds | 25 (89.3%) | 3 (10.7%) |
| 25 to 34 Year Olds | 5 (50.0%) | 5 (50.0%) |
| 35 Years and over | 7 (100.0%) | 0 (0.0%) |
| Total | 191 (88.8%) | 24 (11.2%) |
Educational Attainment by Field of Study in Bernville borough
Business (50 | 29.9%), arts & humanities (31 | 18.6%), science & technology (22 | 13.2%), psychology (15 | 9.0%), and computers & mathematics (11 | 6.6%) are the most common fields of study among 167 individuals in Bernville borough who have obtained a bachelor's degree or higher.
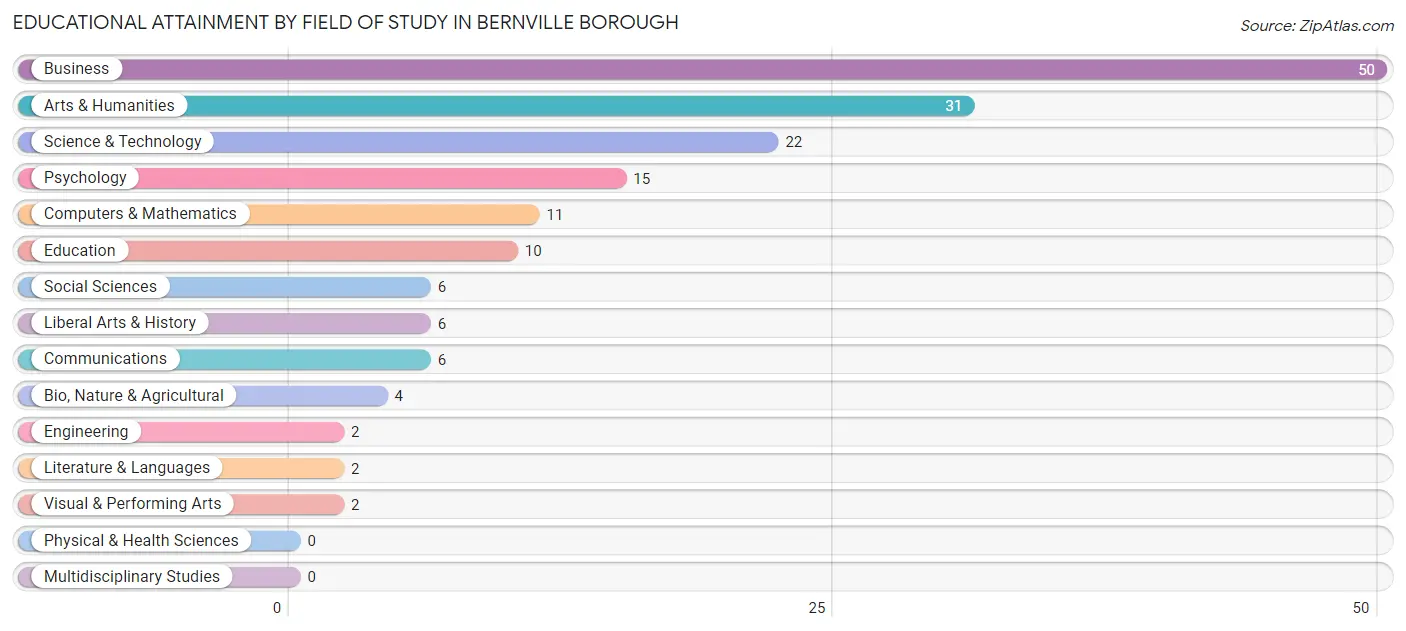
| Field of Study | # Graduates | % Graduates |
| Computers & Mathematics | 11 | 6.6% |
| Bio, Nature & Agricultural | 4 | 2.4% |
| Physical & Health Sciences | 0 | 0.0% |
| Psychology | 15 | 9.0% |
| Social Sciences | 6 | 3.6% |
| Engineering | 2 | 1.2% |
| Multidisciplinary Studies | 0 | 0.0% |
| Science & Technology | 22 | 13.2% |
| Business | 50 | 29.9% |
| Education | 10 | 6.0% |
| Literature & Languages | 2 | 1.2% |
| Liberal Arts & History | 6 | 3.6% |
| Visual & Performing Arts | 2 | 1.2% |
| Communications | 6 | 3.6% |
| Arts & Humanities | 31 | 18.6% |
| Total | 167 | 100.0% |
Transportation & Commute in Bernville borough
Vehicle Availability by Sex in Bernville borough
The most prevalent vehicle ownership categories in Bernville borough are males with 2 vehicles (100, accounting for 44.6%) and females with 2 vehicles (105, making up 46.1%).
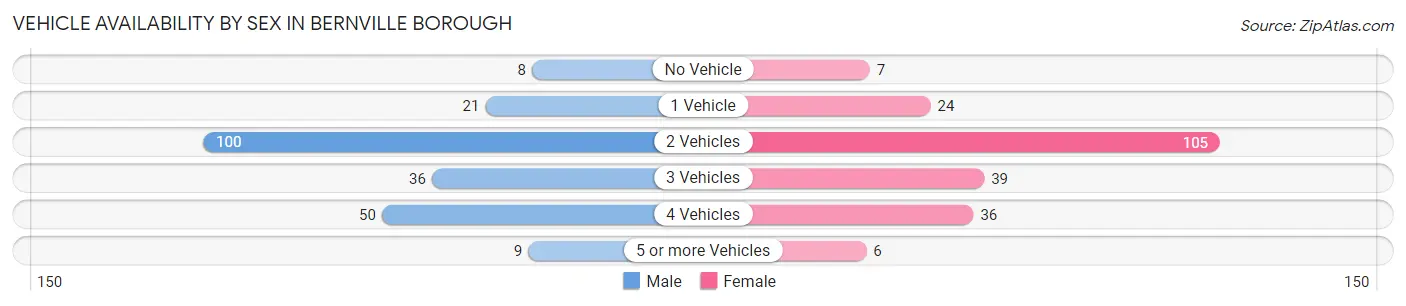
| Vehicles Available | Male | Female |
| No Vehicle | 8 (3.6%) | 7 (3.2%) |
| 1 Vehicle | 21 (9.4%) | 24 (11.1%) |
| 2 Vehicles | 100 (44.6%) | 105 (48.4%) |
| 3 Vehicles | 36 (16.1%) | 39 (18.0%) |
| 4 Vehicles | 50 (22.3%) | 36 (16.6%) |
| 5 or more Vehicles | 9 (4.0%) | 6 (2.8%) |
| Total | 224 (100.0%) | 217 (100.0%) |
Commute Time in Bernville borough
The most frequently occuring commute durations in Bernville borough are 20 to 24 minutes (126 commuters, 29.6%), 30 to 34 minutes (69 commuters, 16.2%), and 45 to 59 minutes (56 commuters, 13.2%).
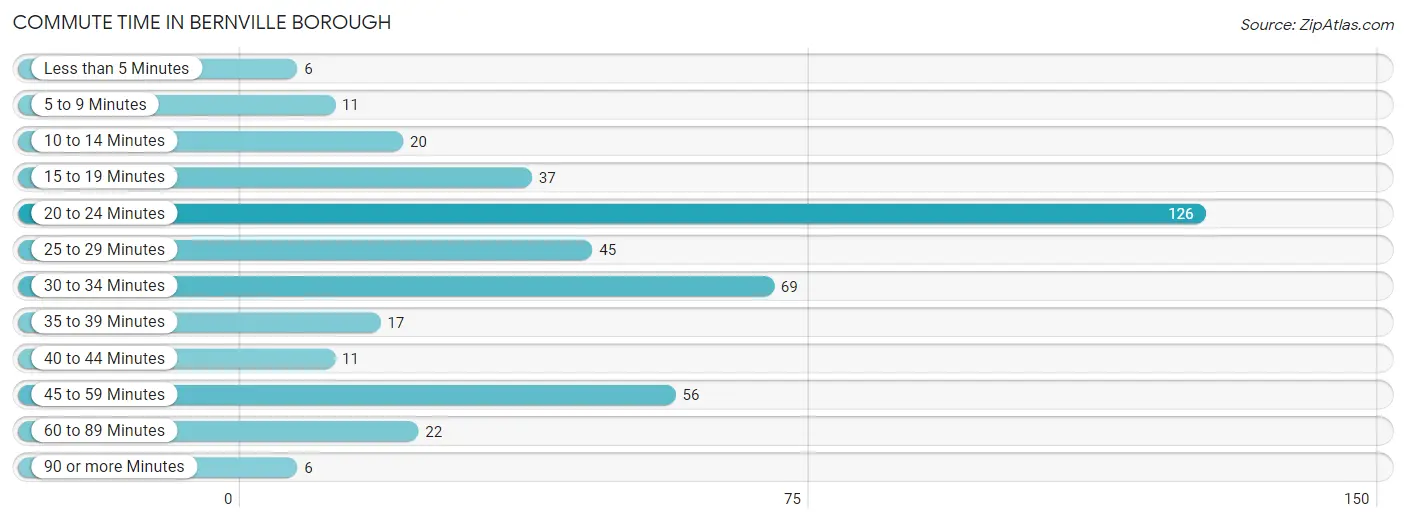
| Commute Time | # Commuters | % Commuters |
| Less than 5 Minutes | 6 | 1.4% |
| 5 to 9 Minutes | 11 | 2.6% |
| 10 to 14 Minutes | 20 | 4.7% |
| 15 to 19 Minutes | 37 | 8.7% |
| 20 to 24 Minutes | 126 | 29.6% |
| 25 to 29 Minutes | 45 | 10.6% |
| 30 to 34 Minutes | 69 | 16.2% |
| 35 to 39 Minutes | 17 | 4.0% |
| 40 to 44 Minutes | 11 | 2.6% |
| 45 to 59 Minutes | 56 | 13.2% |
| 60 to 89 Minutes | 22 | 5.2% |
| 90 or more Minutes | 6 | 1.4% |
Commute Time by Sex in Bernville borough
The most common commute times in Bernville borough are 30 to 34 minutes (50 commuters, 23.0%) for males and 20 to 24 minutes (77 commuters, 36.8%) for females.
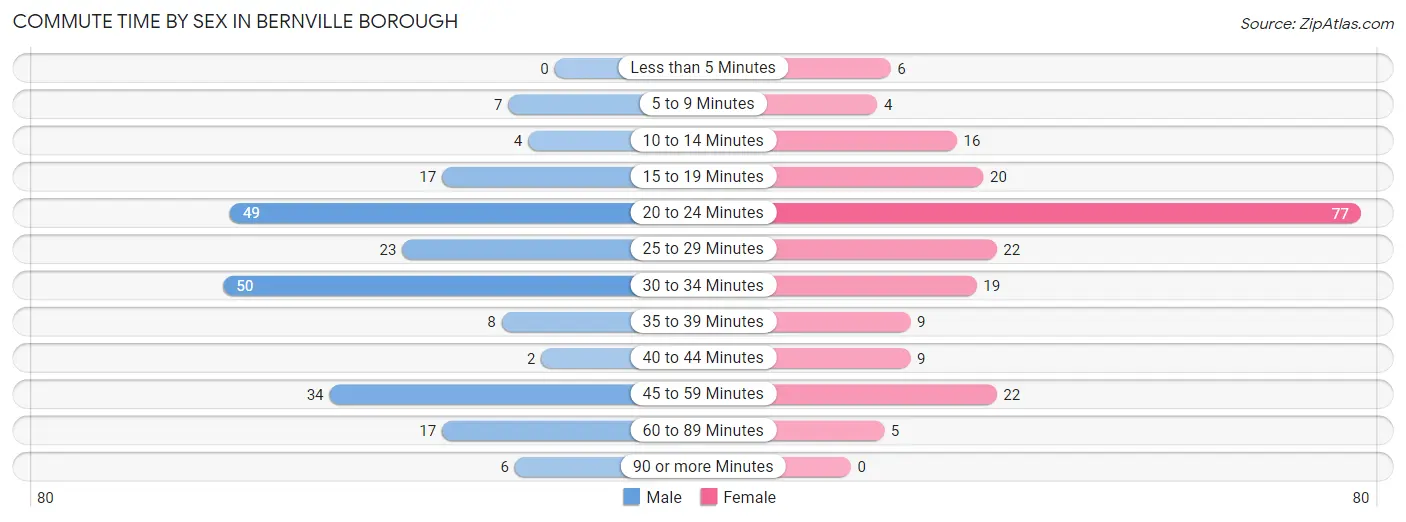
| Commute Time | Male | Female |
| Less than 5 Minutes | 0 (0.0%) | 6 (2.9%) |
| 5 to 9 Minutes | 7 (3.2%) | 4 (1.9%) |
| 10 to 14 Minutes | 4 (1.8%) | 16 (7.7%) |
| 15 to 19 Minutes | 17 (7.8%) | 20 (9.6%) |
| 20 to 24 Minutes | 49 (22.6%) | 77 (36.8%) |
| 25 to 29 Minutes | 23 (10.6%) | 22 (10.5%) |
| 30 to 34 Minutes | 50 (23.0%) | 19 (9.1%) |
| 35 to 39 Minutes | 8 (3.7%) | 9 (4.3%) |
| 40 to 44 Minutes | 2 (0.9%) | 9 (4.3%) |
| 45 to 59 Minutes | 34 (15.7%) | 22 (10.5%) |
| 60 to 89 Minutes | 17 (7.8%) | 5 (2.4%) |
| 90 or more Minutes | 6 (2.8%) | 0 (0.0%) |
Time of Departure to Work by Sex in Bernville borough
The most frequent times of departure to work in Bernville borough are 12:00 PM to 3:59 PM (55, 25.4%) for males and 7:30 AM to 7:59 AM (42, 20.1%) for females.
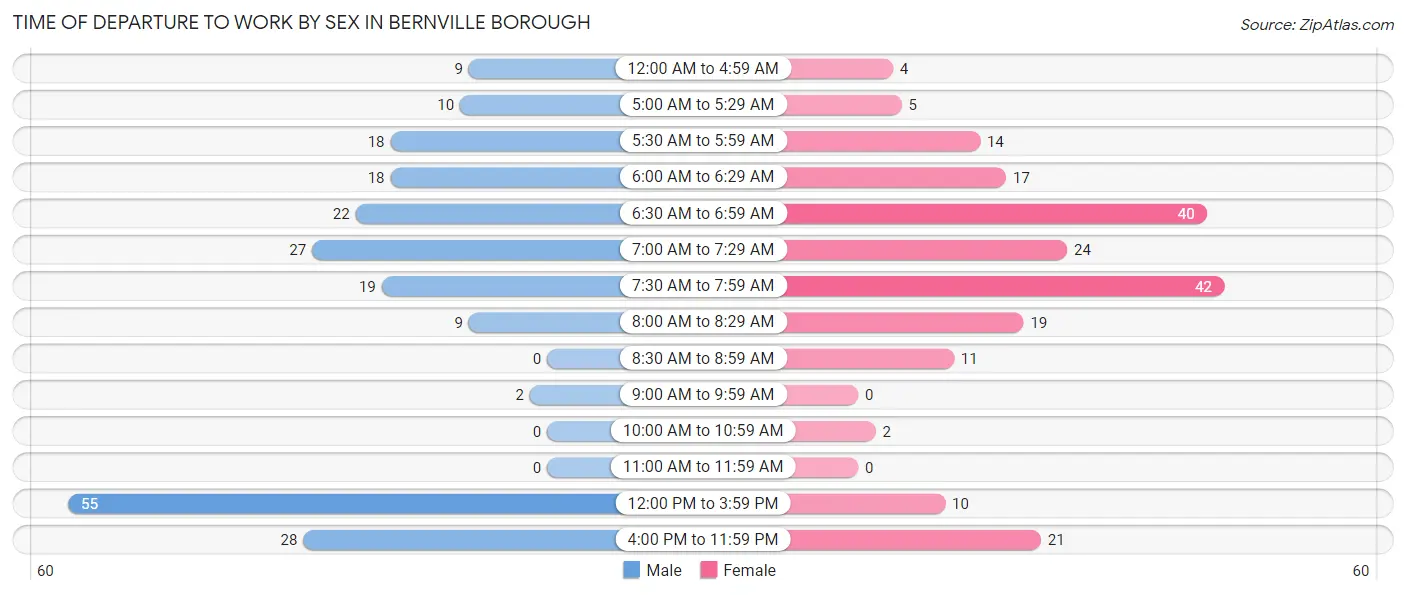
| Time of Departure | Male | Female |
| 12:00 AM to 4:59 AM | 9 (4.2%) | 4 (1.9%) |
| 5:00 AM to 5:29 AM | 10 (4.6%) | 5 (2.4%) |
| 5:30 AM to 5:59 AM | 18 (8.3%) | 14 (6.7%) |
| 6:00 AM to 6:29 AM | 18 (8.3%) | 17 (8.1%) |
| 6:30 AM to 6:59 AM | 22 (10.1%) | 40 (19.1%) |
| 7:00 AM to 7:29 AM | 27 (12.4%) | 24 (11.5%) |
| 7:30 AM to 7:59 AM | 19 (8.8%) | 42 (20.1%) |
| 8:00 AM to 8:29 AM | 9 (4.2%) | 19 (9.1%) |
| 8:30 AM to 8:59 AM | 0 (0.0%) | 11 (5.3%) |
| 9:00 AM to 9:59 AM | 2 (0.9%) | 0 (0.0%) |
| 10:00 AM to 10:59 AM | 0 (0.0%) | 2 (1.0%) |
| 11:00 AM to 11:59 AM | 0 (0.0%) | 0 (0.0%) |
| 12:00 PM to 3:59 PM | 55 (25.4%) | 10 (4.8%) |
| 4:00 PM to 11:59 PM | 28 (12.9%) | 21 (10.1%) |
| Total | 217 (100.0%) | 209 (100.0%) |
Housing Occupancy in Bernville borough
Occupancy by Ownership in Bernville borough
Of the total 299 dwellings in Bernville borough, owner-occupied units account for 212 (70.9%), while renter-occupied units make up 87 (29.1%).
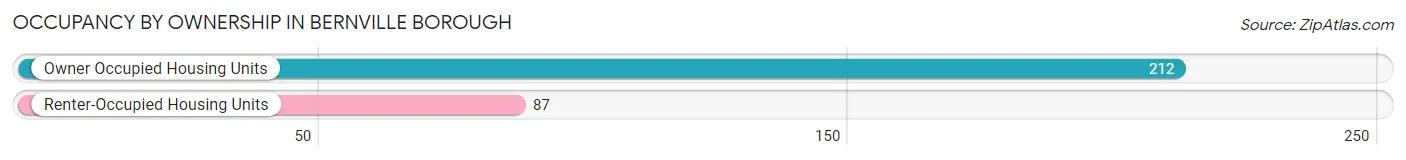
| Occupancy | # Housing Units | % Housing Units |
| Owner Occupied Housing Units | 212 | 70.9% |
| Renter-Occupied Housing Units | 87 | 29.1% |
| Total Occupied Housing Units | 299 | 100.0% |
Occupancy by Household Size in Bernville borough
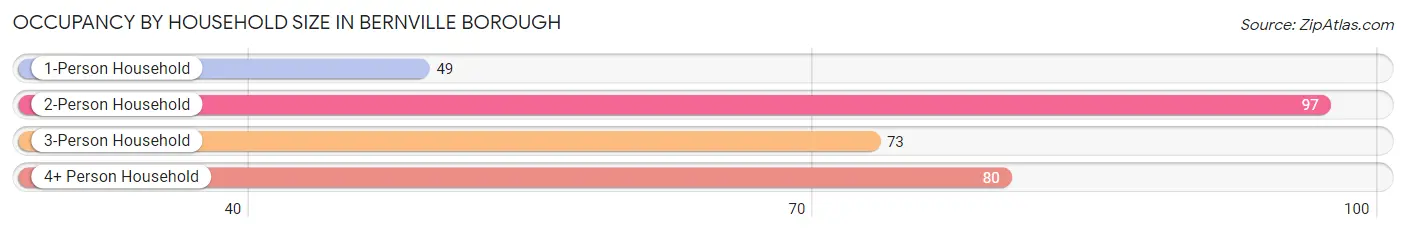
| Household Size | # Housing Units | % Housing Units |
| 1-Person Household | 49 | 16.4% |
| 2-Person Household | 97 | 32.4% |
| 3-Person Household | 73 | 24.4% |
| 4+ Person Household | 80 | 26.8% |
| Total Housing Units | 299 | 100.0% |
Occupancy by Ownership by Household Size in Bernville borough
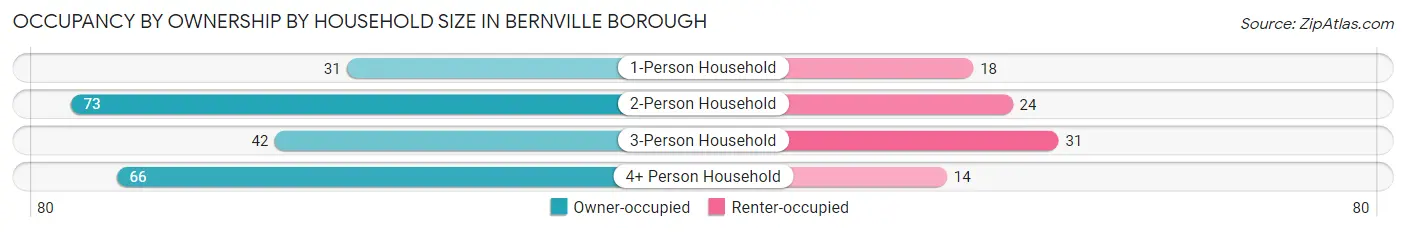
| Household Size | Owner-occupied | Renter-occupied |
| 1-Person Household | 31 (63.3%) | 18 (36.7%) |
| 2-Person Household | 73 (75.3%) | 24 (24.7%) |
| 3-Person Household | 42 (57.5%) | 31 (42.5%) |
| 4+ Person Household | 66 (82.5%) | 14 (17.5%) |
| Total Housing Units | 212 (70.9%) | 87 (29.1%) |
Occupancy by Educational Attainment in Bernville borough
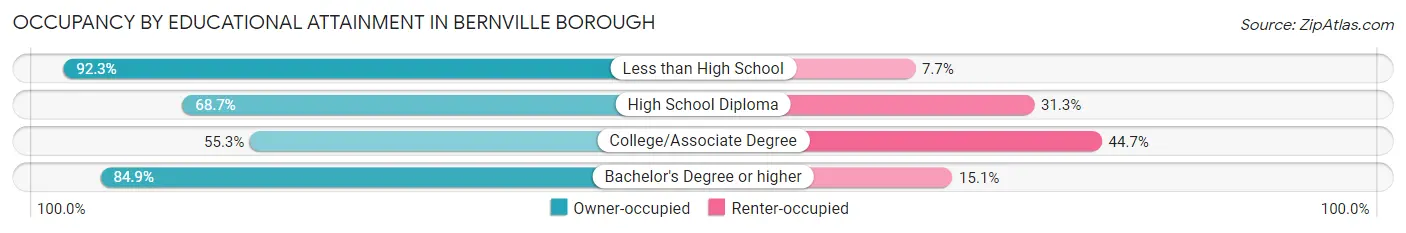
| Household Size | Owner-occupied | Renter-occupied |
| Less than High School | 24 (92.3%) | 2 (7.7%) |
| High School Diploma | 79 (68.7%) | 36 (31.3%) |
| College/Associate Degree | 47 (55.3%) | 38 (44.7%) |
| Bachelor's Degree or higher | 62 (84.9%) | 11 (15.1%) |
Occupancy by Age of Householder in Bernville borough
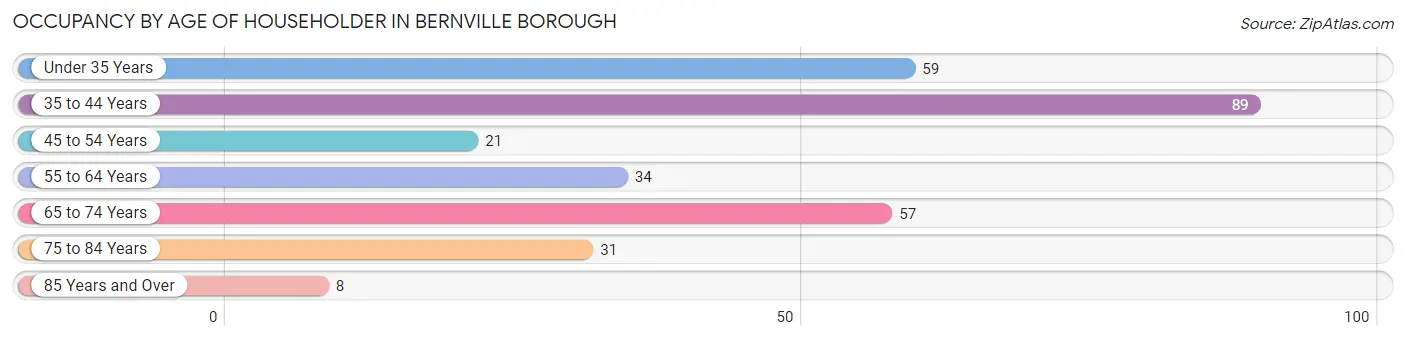
| Age Bracket | # Households | % Households |
| Under 35 Years | 59 | 19.7% |
| 35 to 44 Years | 89 | 29.8% |
| 45 to 54 Years | 21 | 7.0% |
| 55 to 64 Years | 34 | 11.4% |
| 65 to 74 Years | 57 | 19.1% |
| 75 to 84 Years | 31 | 10.4% |
| 85 Years and Over | 8 | 2.7% |
| Total | 299 | 100.0% |
Housing Finances in Bernville borough
Median Income by Occupancy in Bernville borough
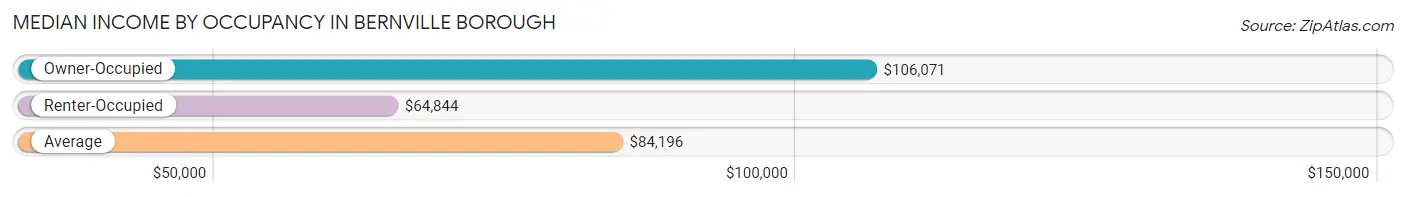
| Occupancy Type | # Households | Median Income |
| Owner-Occupied | 212 (70.9%) | $106,071 |
| Renter-Occupied | 87 (29.1%) | $64,844 |
| Average | 299 (100.0%) | $84,196 |
Occupancy by Householder Income Bracket in Bernville borough
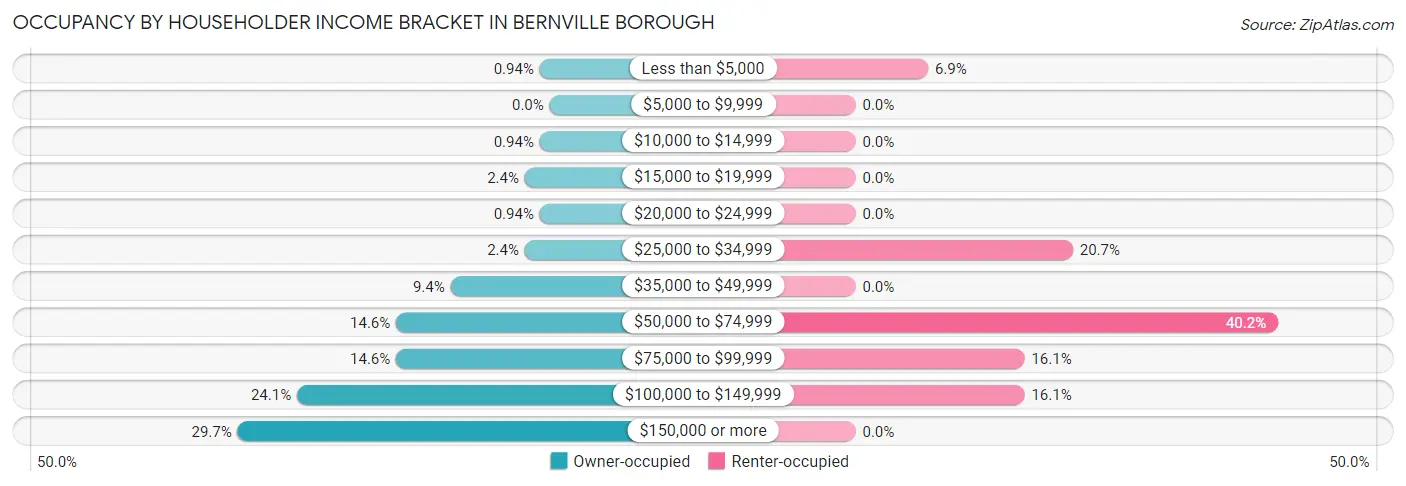
| Income Bracket | Owner-occupied | Renter-occupied |
| Less than $5,000 | 2 (0.9%) | 6 (6.9%) |
| $5,000 to $9,999 | 0 (0.0%) | 0 (0.0%) |
| $10,000 to $14,999 | 2 (0.9%) | 0 (0.0%) |
| $15,000 to $19,999 | 5 (2.4%) | 0 (0.0%) |
| $20,000 to $24,999 | 2 (0.9%) | 0 (0.0%) |
| $25,000 to $34,999 | 5 (2.4%) | 18 (20.7%) |
| $35,000 to $49,999 | 20 (9.4%) | 0 (0.0%) |
| $50,000 to $74,999 | 31 (14.6%) | 35 (40.2%) |
| $75,000 to $99,999 | 31 (14.6%) | 14 (16.1%) |
| $100,000 to $149,999 | 51 (24.1%) | 14 (16.1%) |
| $150,000 or more | 63 (29.7%) | 0 (0.0%) |
| Total | 212 (100.0%) | 87 (100.0%) |
Monthly Housing Cost Tiers in Bernville borough
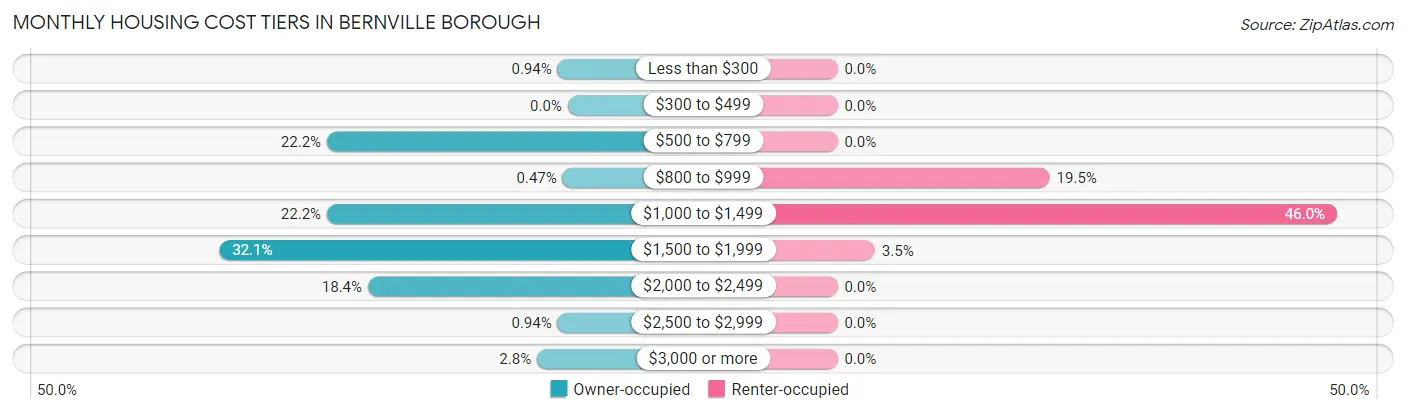
| Monthly Cost | Owner-occupied | Renter-occupied |
| Less than $300 | 2 (0.9%) | 0 (0.0%) |
| $300 to $499 | 0 (0.0%) | 0 (0.0%) |
| $500 to $799 | 47 (22.2%) | 0 (0.0%) |
| $800 to $999 | 1 (0.5%) | 17 (19.5%) |
| $1,000 to $1,499 | 47 (22.2%) | 40 (46.0%) |
| $1,500 to $1,999 | 68 (32.1%) | 3 (3.5%) |
| $2,000 to $2,499 | 39 (18.4%) | 0 (0.0%) |
| $2,500 to $2,999 | 2 (0.9%) | 0 (0.0%) |
| $3,000 or more | 6 (2.8%) | 0 (0.0%) |
| Total | 212 (100.0%) | 87 (100.0%) |
Physical Housing Characteristics in Bernville borough
Housing Structures in Bernville borough
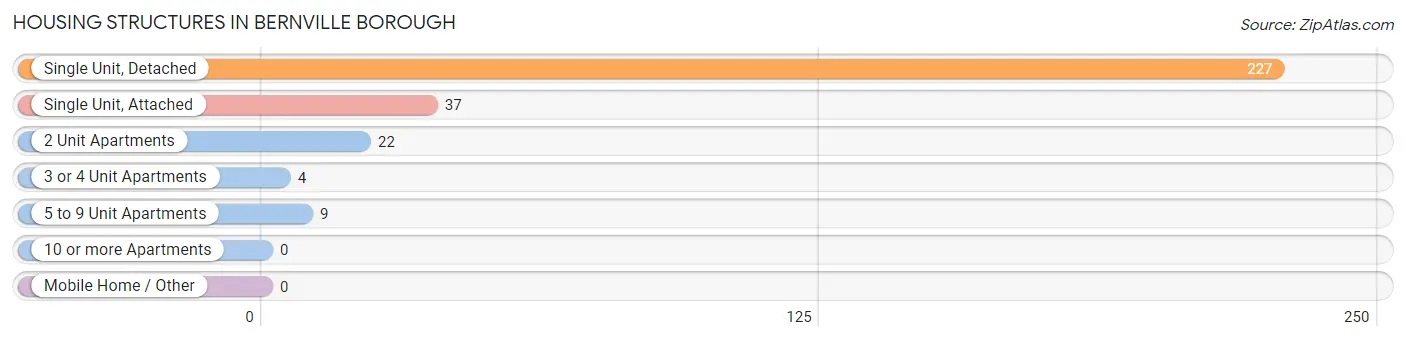
| Structure Type | # Housing Units | % Housing Units |
| Single Unit, Detached | 227 | 75.9% |
| Single Unit, Attached | 37 | 12.4% |
| 2 Unit Apartments | 22 | 7.4% |
| 3 or 4 Unit Apartments | 4 | 1.3% |
| 5 to 9 Unit Apartments | 9 | 3.0% |
| 10 or more Apartments | 0 | 0.0% |
| Mobile Home / Other | 0 | 0.0% |
| Total | 299 | 100.0% |
Housing Structures by Occupancy in Bernville borough
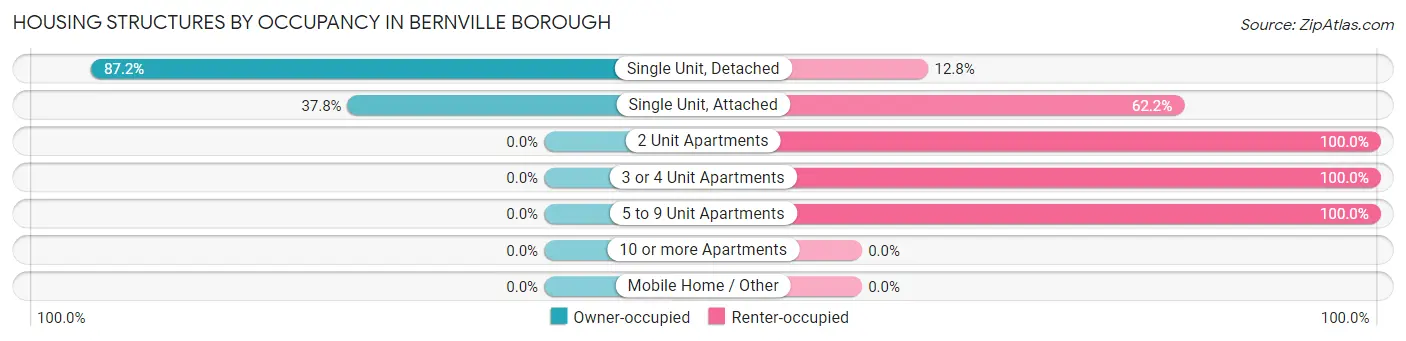
| Structure Type | Owner-occupied | Renter-occupied |
| Single Unit, Detached | 198 (87.2%) | 29 (12.8%) |
| Single Unit, Attached | 14 (37.8%) | 23 (62.2%) |
| 2 Unit Apartments | 0 (0.0%) | 22 (100.0%) |
| 3 or 4 Unit Apartments | 0 (0.0%) | 4 (100.0%) |
| 5 to 9 Unit Apartments | 0 (0.0%) | 9 (100.0%) |
| 10 or more Apartments | 0 (0.0%) | 0 (0.0%) |
| Mobile Home / Other | 0 (0.0%) | 0 (0.0%) |
| Total | 212 (70.9%) | 87 (29.1%) |
Housing Structures by Number of Rooms in Bernville borough
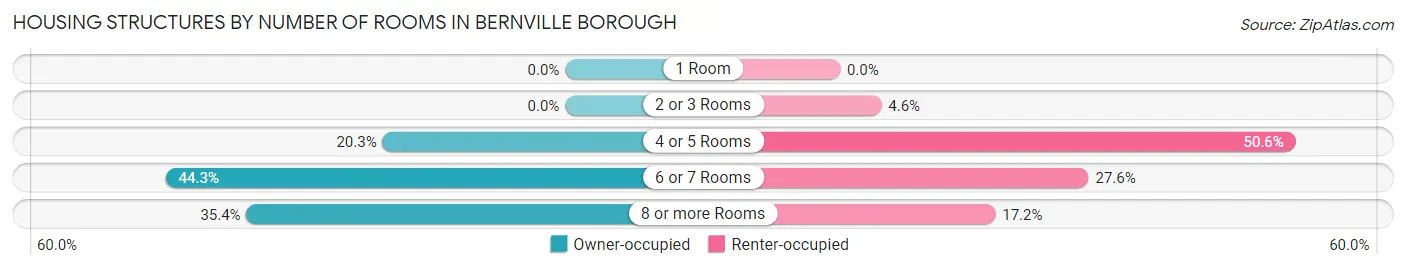
| Number of Rooms | Owner-occupied | Renter-occupied |
| 1 Room | 0 (0.0%) | 0 (0.0%) |
| 2 or 3 Rooms | 0 (0.0%) | 4 (4.6%) |
| 4 or 5 Rooms | 43 (20.3%) | 44 (50.6%) |
| 6 or 7 Rooms | 94 (44.3%) | 24 (27.6%) |
| 8 or more Rooms | 75 (35.4%) | 15 (17.2%) |
| Total | 212 (100.0%) | 87 (100.0%) |
Housing Structure by Heating Type in Bernville borough
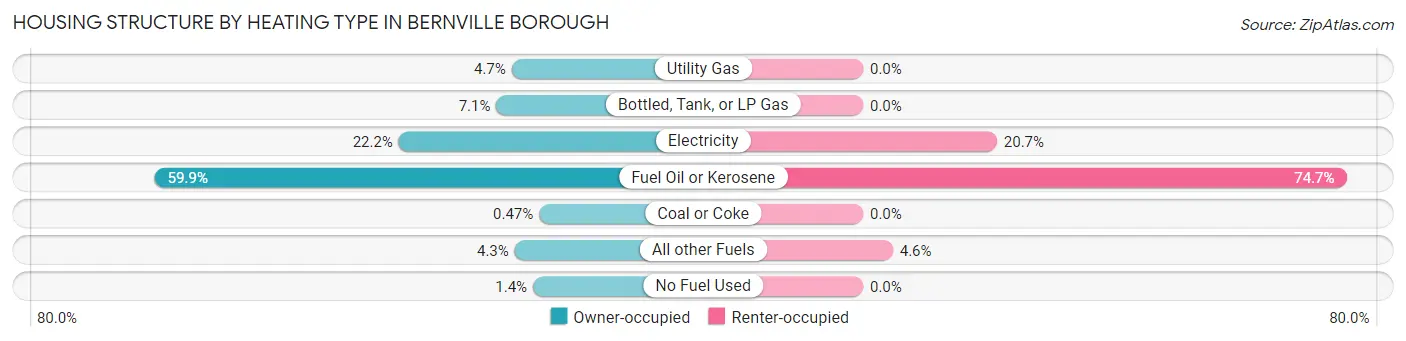
| Heating Type | Owner-occupied | Renter-occupied |
| Utility Gas | 10 (4.7%) | 0 (0.0%) |
| Bottled, Tank, or LP Gas | 15 (7.1%) | 0 (0.0%) |
| Electricity | 47 (22.2%) | 18 (20.7%) |
| Fuel Oil or Kerosene | 127 (59.9%) | 65 (74.7%) |
| Coal or Coke | 1 (0.5%) | 0 (0.0%) |
| All other Fuels | 9 (4.3%) | 4 (4.6%) |
| No Fuel Used | 3 (1.4%) | 0 (0.0%) |
| Total | 212 (100.0%) | 87 (100.0%) |
Household Vehicle Usage in Bernville borough
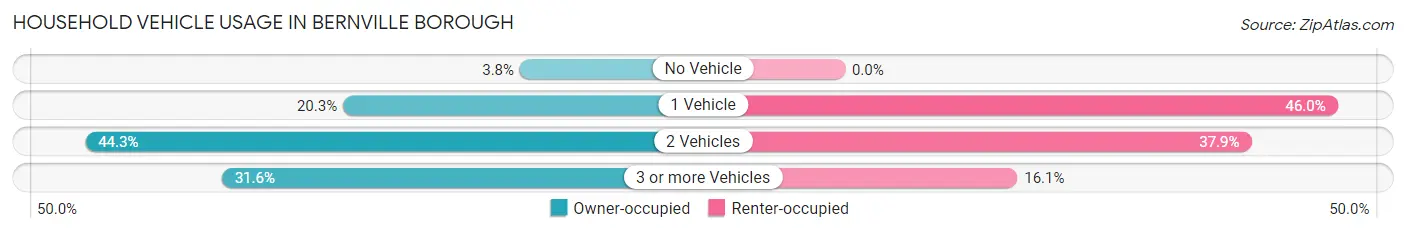
| Vehicles per Household | Owner-occupied | Renter-occupied |
| No Vehicle | 8 (3.8%) | 0 (0.0%) |
| 1 Vehicle | 43 (20.3%) | 40 (46.0%) |
| 2 Vehicles | 94 (44.3%) | 33 (37.9%) |
| 3 or more Vehicles | 67 (31.6%) | 14 (16.1%) |
| Total | 212 (100.0%) | 87 (100.0%) |
Real Estate & Mortgages in Bernville borough
Real Estate and Mortgage Overview in Bernville borough
| Characteristic | Without Mortgage | With Mortgage |
| Housing Units | 53 | 159 |
| Median Property Value | $156,500 | $221,300 |
| Median Household Income | $55,446 | $59 |
| Monthly Housing Costs | $574 | $6 |
| Real Estate Taxes | $2,786 | $3 |
Property Value by Mortgage Status in Bernville borough
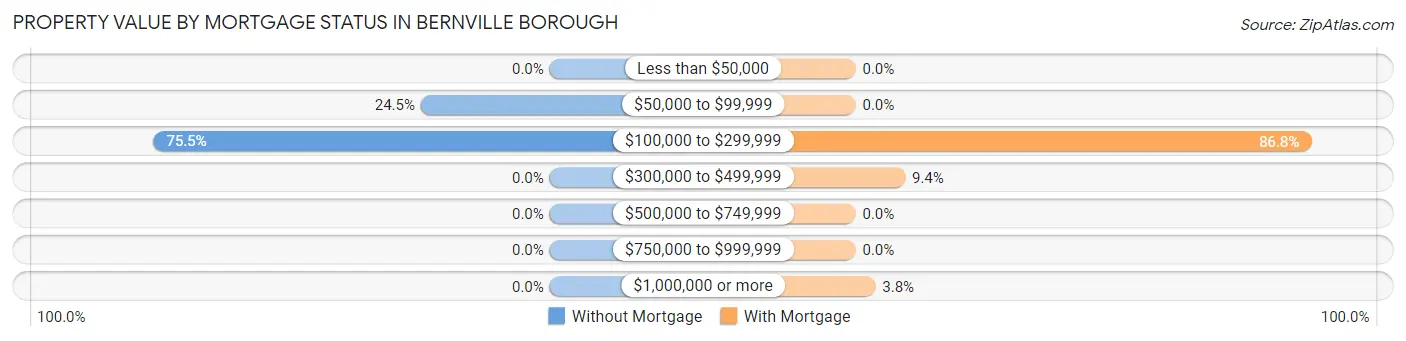
| Property Value | Without Mortgage | With Mortgage |
| Less than $50,000 | 0 (0.0%) | 0 (0.0%) |
| $50,000 to $99,999 | 13 (24.5%) | 0 (0.0%) |
| $100,000 to $299,999 | 40 (75.5%) | 138 (86.8%) |
| $300,000 to $499,999 | 0 (0.0%) | 15 (9.4%) |
| $500,000 to $749,999 | 0 (0.0%) | 0 (0.0%) |
| $750,000 to $999,999 | 0 (0.0%) | 0 (0.0%) |
| $1,000,000 or more | 0 (0.0%) | 6 (3.8%) |
| Total | 53 (100.0%) | 159 (100.0%) |
Household Income by Mortgage Status in Bernville borough
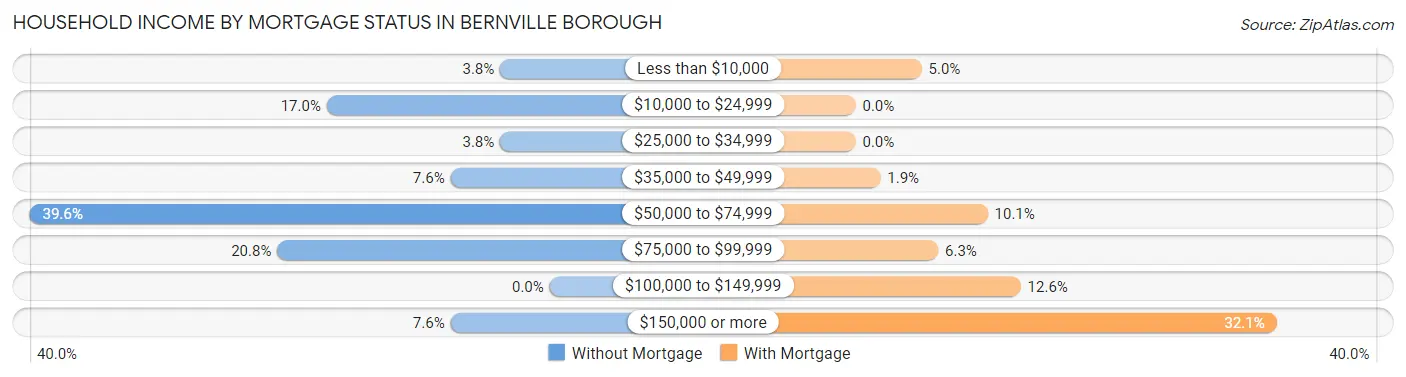
| Household Income | Without Mortgage | With Mortgage |
| Less than $10,000 | 2 (3.8%) | 8 (5.0%) |
| $10,000 to $24,999 | 9 (17.0%) | 0 (0.0%) |
| $25,000 to $34,999 | 2 (3.8%) | 0 (0.0%) |
| $35,000 to $49,999 | 4 (7.5%) | 3 (1.9%) |
| $50,000 to $74,999 | 21 (39.6%) | 16 (10.1%) |
| $75,000 to $99,999 | 11 (20.7%) | 10 (6.3%) |
| $100,000 to $149,999 | 0 (0.0%) | 20 (12.6%) |
| $150,000 or more | 4 (7.5%) | 51 (32.1%) |
| Total | 53 (100.0%) | 159 (100.0%) |
Property Value to Household Income Ratio in Bernville borough
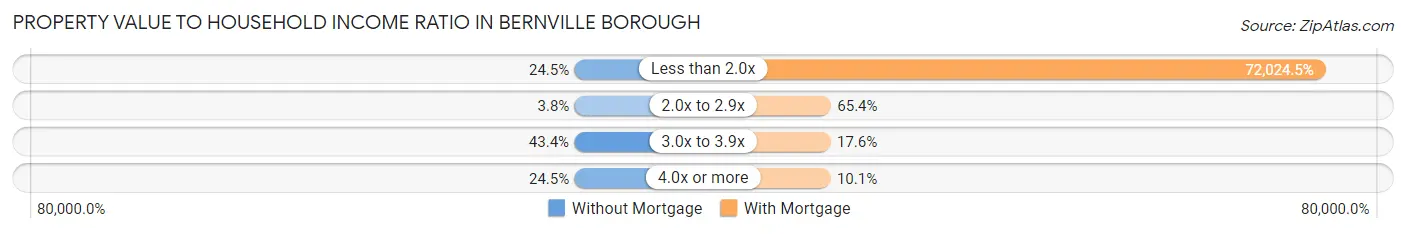
| Value-to-Income Ratio | Without Mortgage | With Mortgage |
| Less than 2.0x | 13 (24.5%) | 114,519 (72,024.5%) |
| 2.0x to 2.9x | 2 (3.8%) | 104 (65.4%) |
| 3.0x to 3.9x | 23 (43.4%) | 28 (17.6%) |
| 4.0x or more | 13 (24.5%) | 16 (10.1%) |
| Total | 53 (100.0%) | 159 (100.0%) |
Real Estate Taxes by Mortgage Status in Bernville borough
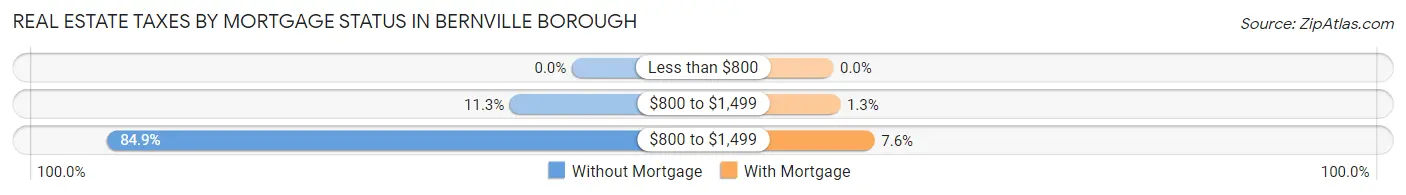
| Property Taxes | Without Mortgage | With Mortgage |
| Less than $800 | 0 (0.0%) | 0 (0.0%) |
| $800 to $1,499 | 6 (11.3%) | 2 (1.3%) |
| $800 to $1,499 | 45 (84.9%) | 12 (7.5%) |
| Total | 53 (100.0%) | 159 (100.0%) |
Health & Disability in Bernville borough
Health Insurance Coverage by Age in Bernville borough
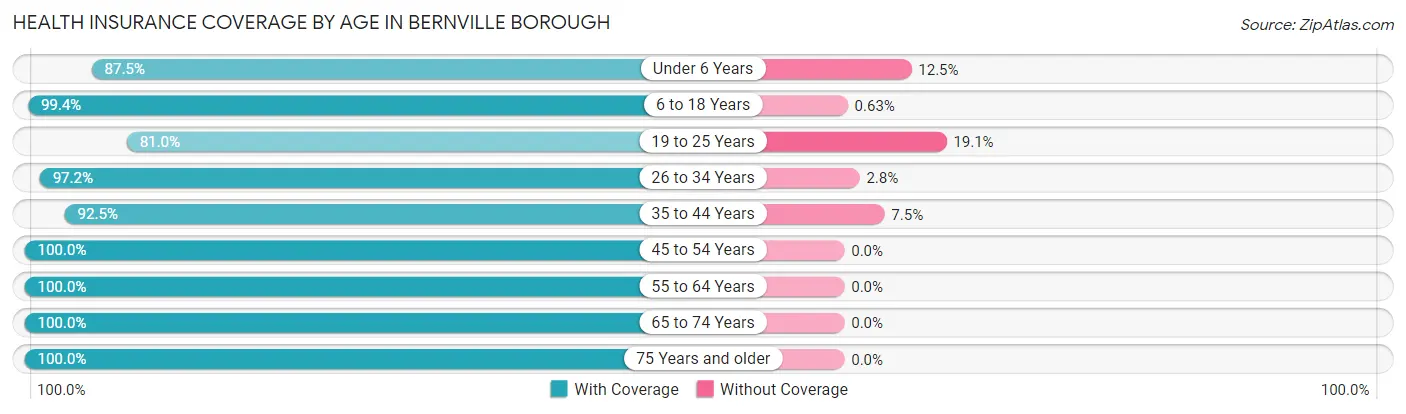
| Age Bracket | With Coverage | Without Coverage |
| Under 6 Years | 56 (87.5%) | 8 (12.5%) |
| 6 to 18 Years | 157 (99.4%) | 1 (0.6%) |
| 19 to 25 Years | 68 (80.9%) | 16 (19.1%) |
| 26 to 34 Years | 103 (97.2%) | 3 (2.8%) |
| 35 to 44 Years | 136 (92.5%) | 11 (7.5%) |
| 45 to 54 Years | 70 (100.0%) | 0 (0.0%) |
| 55 to 64 Years | 52 (100.0%) | 0 (0.0%) |
| 65 to 74 Years | 94 (100.0%) | 0 (0.0%) |
| 75 Years and older | 61 (100.0%) | 0 (0.0%) |
| Total | 797 (95.3%) | 39 (4.7%) |
Health Insurance Coverage by Citizenship Status in Bernville borough
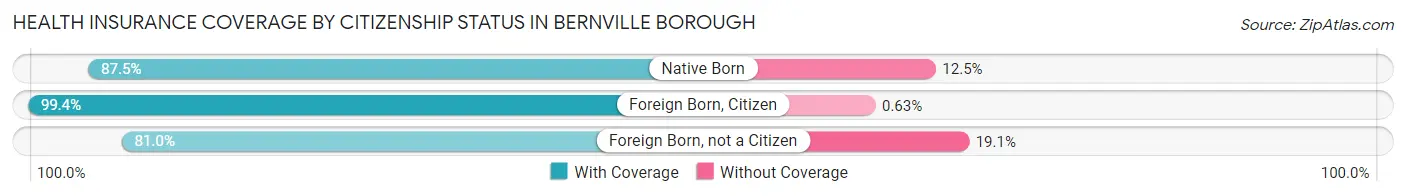
| Citizenship Status | With Coverage | Without Coverage |
| Native Born | 56 (87.5%) | 8 (12.5%) |
| Foreign Born, Citizen | 157 (99.4%) | 1 (0.6%) |
| Foreign Born, not a Citizen | 68 (80.9%) | 16 (19.1%) |
Health Insurance Coverage by Household Income in Bernville borough
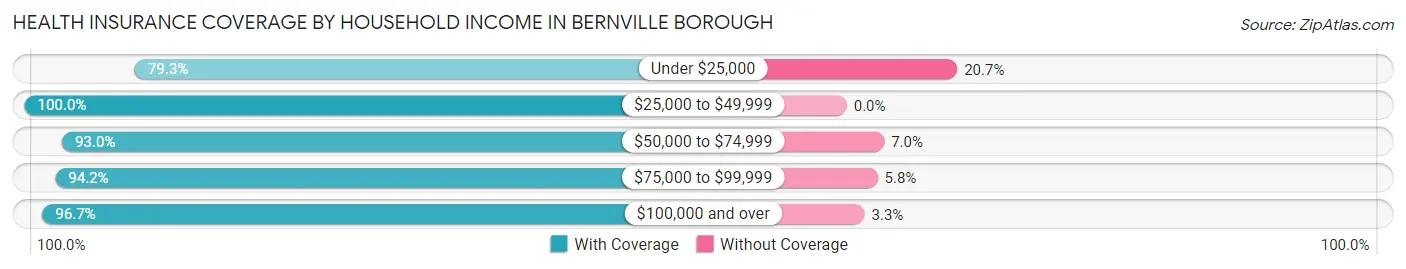
| Household Income | With Coverage | Without Coverage |
| Under $25,000 | 23 (79.3%) | 6 (20.7%) |
| $25,000 to $49,999 | 67 (100.0%) | 0 (0.0%) |
| $50,000 to $74,999 | 146 (93.0%) | 11 (7.0%) |
| $75,000 to $99,999 | 98 (94.2%) | 6 (5.8%) |
| $100,000 and over | 463 (96.7%) | 16 (3.3%) |
Public vs Private Health Insurance Coverage by Age in Bernville borough
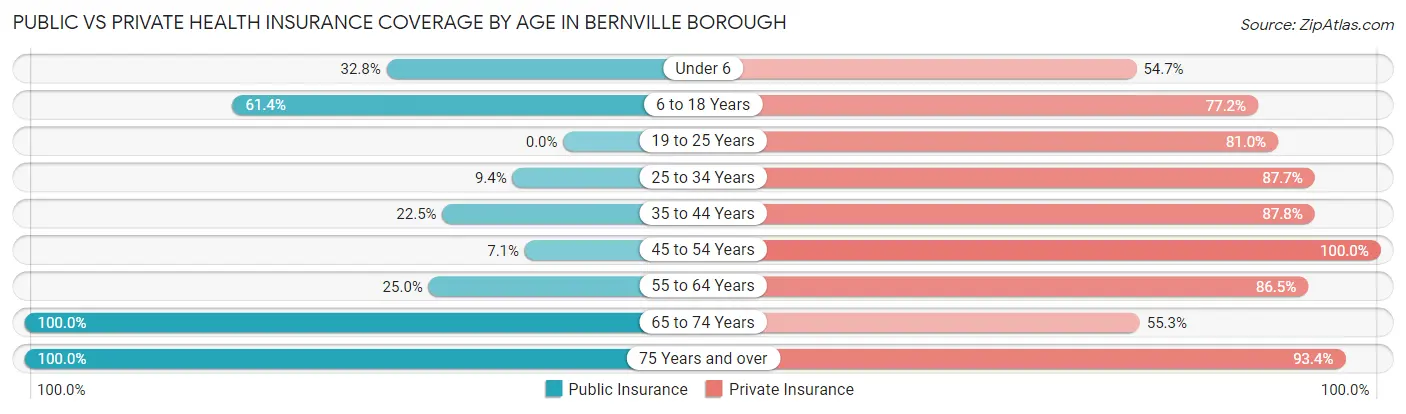
| Age Bracket | Public Insurance | Private Insurance |
| Under 6 | 21 (32.8%) | 35 (54.7%) |
| 6 to 18 Years | 97 (61.4%) | 122 (77.2%) |
| 19 to 25 Years | 0 (0.0%) | 68 (80.9%) |
| 25 to 34 Years | 10 (9.4%) | 93 (87.7%) |
| 35 to 44 Years | 33 (22.5%) | 129 (87.8%) |
| 45 to 54 Years | 5 (7.1%) | 70 (100.0%) |
| 55 to 64 Years | 13 (25.0%) | 45 (86.5%) |
| 65 to 74 Years | 94 (100.0%) | 52 (55.3%) |
| 75 Years and over | 61 (100.0%) | 57 (93.4%) |
| Total | 334 (40.0%) | 671 (80.3%) |
Disability Status by Sex by Age in Bernville borough
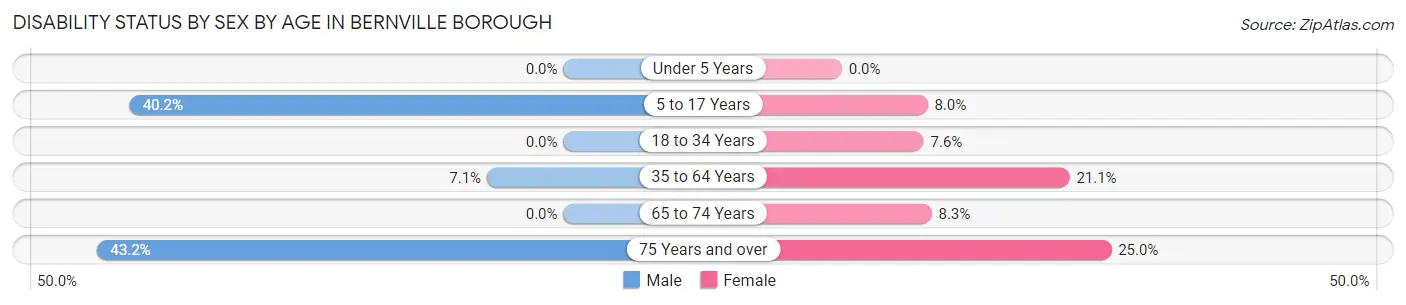
| Age Bracket | Male | Female |
| Under 5 Years | 0 (0.0%) | 0 (0.0%) |
| 5 to 17 Years | 33 (40.2%) | 7 (8.0%) |
| 18 to 34 Years | 0 (0.0%) | 6 (7.6%) |
| 35 to 64 Years | 9 (7.1%) | 30 (21.1%) |
| 65 to 74 Years | 0 (0.0%) | 5 (8.3%) |
| 75 Years and over | 16 (43.2%) | 6 (25.0%) |
Disability Class by Sex by Age in Bernville borough
Disability Class: Hearing Difficulty
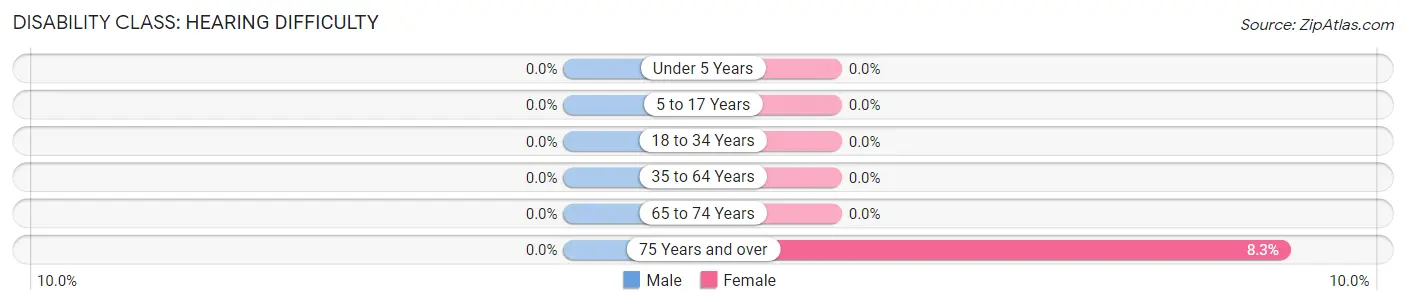
| Age Bracket | Male | Female |
| Under 5 Years | 0 (0.0%) | 0 (0.0%) |
| 5 to 17 Years | 0 (0.0%) | 0 (0.0%) |
| 18 to 34 Years | 0 (0.0%) | 0 (0.0%) |
| 35 to 64 Years | 0 (0.0%) | 0 (0.0%) |
| 65 to 74 Years | 0 (0.0%) | 0 (0.0%) |
| 75 Years and over | 0 (0.0%) | 2 (8.3%) |
Disability Class: Vision Difficulty
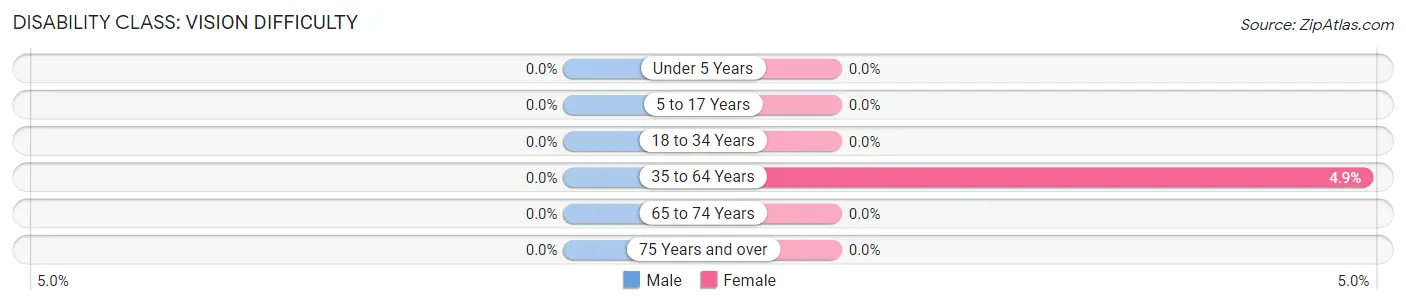
| Age Bracket | Male | Female |
| Under 5 Years | 0 (0.0%) | 0 (0.0%) |
| 5 to 17 Years | 0 (0.0%) | 0 (0.0%) |
| 18 to 34 Years | 0 (0.0%) | 0 (0.0%) |
| 35 to 64 Years | 0 (0.0%) | 7 (4.9%) |
| 65 to 74 Years | 0 (0.0%) | 0 (0.0%) |
| 75 Years and over | 0 (0.0%) | 0 (0.0%) |
Disability Class: Cognitive Difficulty
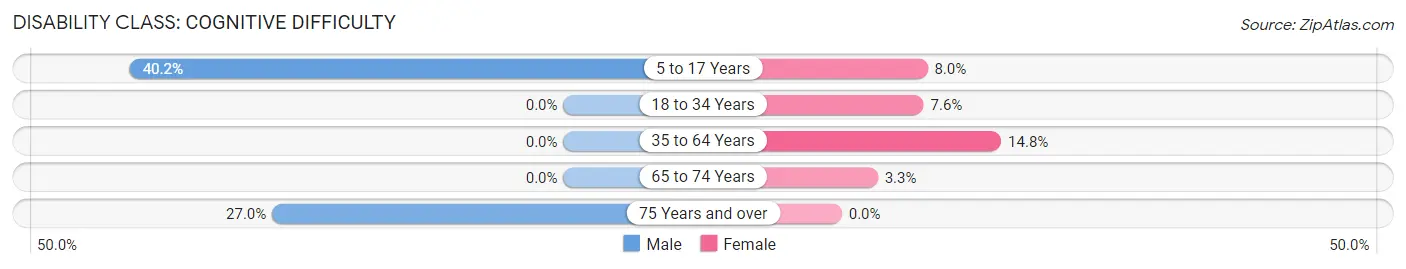
| Age Bracket | Male | Female |
| 5 to 17 Years | 33 (40.2%) | 7 (8.0%) |
| 18 to 34 Years | 0 (0.0%) | 6 (7.6%) |
| 35 to 64 Years | 0 (0.0%) | 21 (14.8%) |
| 65 to 74 Years | 0 (0.0%) | 2 (3.3%) |
| 75 Years and over | 10 (27.0%) | 0 (0.0%) |
Disability Class: Ambulatory Difficulty
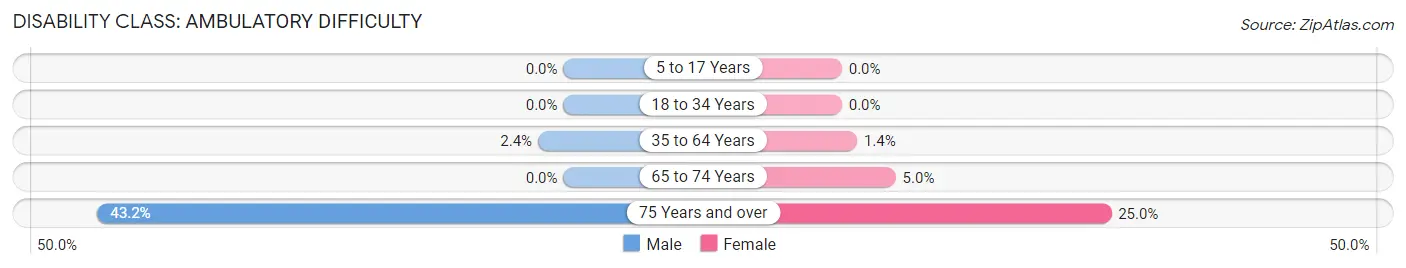
| Age Bracket | Male | Female |
| 5 to 17 Years | 0 (0.0%) | 0 (0.0%) |
| 18 to 34 Years | 0 (0.0%) | 0 (0.0%) |
| 35 to 64 Years | 3 (2.4%) | 2 (1.4%) |
| 65 to 74 Years | 0 (0.0%) | 3 (5.0%) |
| 75 Years and over | 16 (43.2%) | 6 (25.0%) |
Disability Class: Self-Care Difficulty
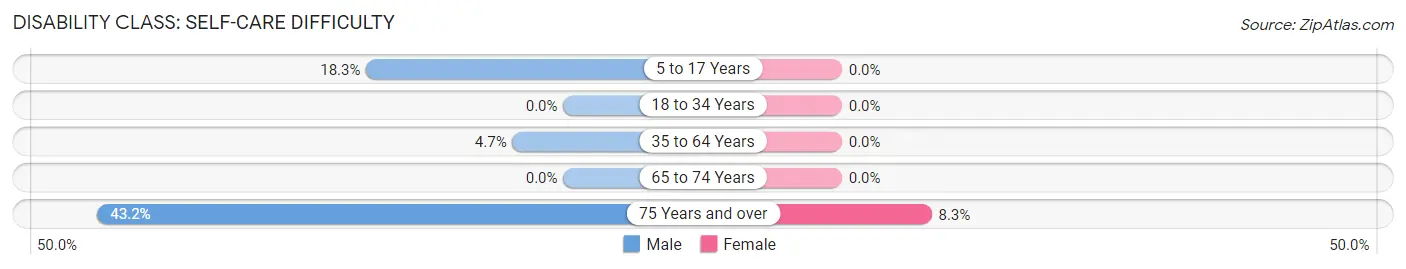
| Age Bracket | Male | Female |
| 5 to 17 Years | 15 (18.3%) | 0 (0.0%) |
| 18 to 34 Years | 0 (0.0%) | 0 (0.0%) |
| 35 to 64 Years | 6 (4.7%) | 0 (0.0%) |
| 65 to 74 Years | 0 (0.0%) | 0 (0.0%) |
| 75 Years and over | 16 (43.2%) | 2 (8.3%) |
Technology Access in Bernville borough
Computing Device Access in Bernville borough
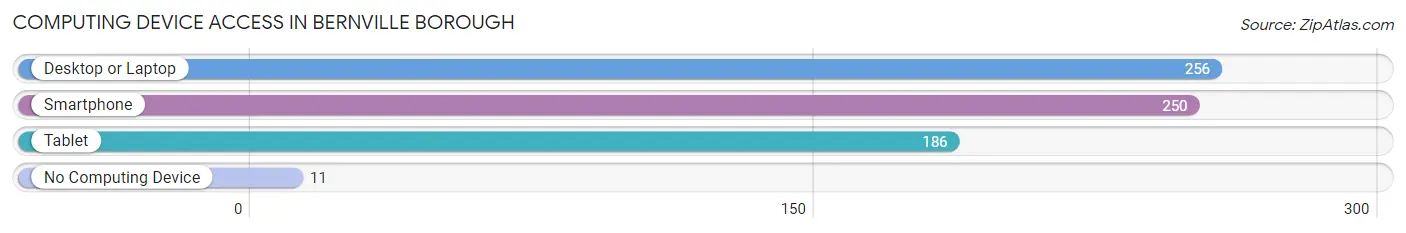
| Device Type | # Households | % Households |
| Desktop or Laptop | 256 | 85.6% |
| Smartphone | 250 | 83.6% |
| Tablet | 186 | 62.2% |
| No Computing Device | 11 | 3.7% |
| Total | 299 | 100.0% |
Internet Access in Bernville borough
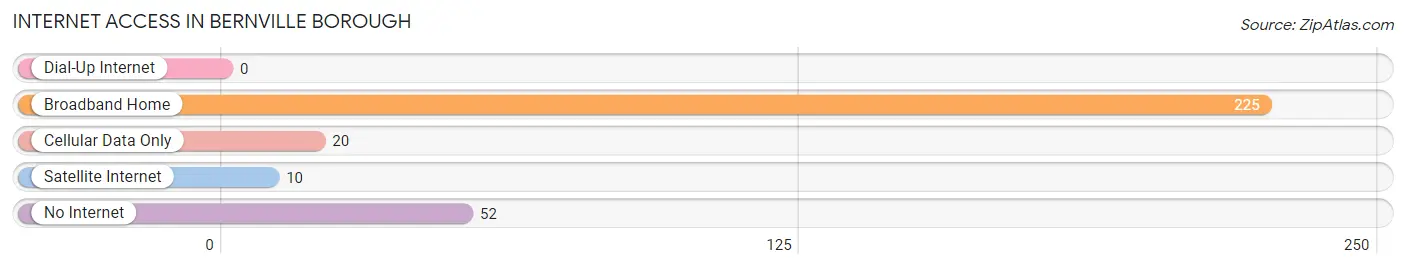
| Internet Type | # Households | % Households |
| Dial-Up Internet | 0 | 0.0% |
| Broadband Home | 225 | 75.2% |
| Cellular Data Only | 20 | 6.7% |
| Satellite Internet | 10 | 3.3% |
| No Internet | 52 | 17.4% |
| Total | 299 | 100.0% |
Bernville borough Summary
Berneville Borough is a small borough located in Berks County, Pennsylvania. It is situated in the southeastern corner of the county, just north of the city of Reading. The borough is home to a population of approximately 1,400 people, and is part of the Reading, PA Metropolitan Statistical Area.
History
Berneville Borough was founded in 1737 by a group of German settlers. The settlers named the town after Bern, Switzerland, which was the hometown of many of the settlers. The town was originally part of the larger Bern Township, which was established in 1741. In 1845, the borough was officially incorporated as a separate municipality.
The borough has a long history of industry and manufacturing. In the late 19th century, the borough was home to several factories, including a paper mill, a brickyard, and a tannery. The borough also had a thriving agricultural industry, with many farms located in the area.
Geography
Berneville Borough is located in southeastern Berks County, Pennsylvania. It is situated just north of the city of Reading. The borough is bordered by Bern Township to the north, Lower Alsace Township to the east, and Exeter Township to the south and west.
The borough is located in the Schuylkill River Valley, and is surrounded by rolling hills and farmland. The borough is located at an elevation of approximately 500 feet above sea level.
Economy
Berneville Borough has a diverse economy. The borough is home to several small businesses, including restaurants, retail stores, and professional services. The borough also has a thriving agricultural industry, with many farms located in the area.
The borough is also home to several manufacturing companies, including a paper mill, a brickyard, and a tannery. The borough is also home to a number of warehouses and distribution centers.
Demographics
As of the 2010 census, Berneville Borough had a population of 1,400 people. The racial makeup of the borough was 94.3% White, 2.9% African American, 0.4% Native American, 0.7% Asian, and 1.7% from other races. Hispanic or Latino of any race were 2.1% of the population.
The median household income in the borough was $45,000, and the median family income was $50,000. The per capita income in the borough was $20,000. Approximately 8.3% of the population was below the poverty line.
Conclusion
Berneville Borough is a small borough located in Berks County, Pennsylvania. It is situated in the southeastern corner of the county, just north of the city of Reading. The borough is home to a population of approximately 1,400 people, and is part of the Reading, PA Metropolitan Statistical Area. The borough has a long history of industry and manufacturing, and is home to several small businesses, manufacturing companies, and farms. The borough has a diverse population, with a median household income of $45,000 and a median family income of $50,000.
Common Questions
What is Per Capita Income in Bernville borough?
Per Capita income in Bernville borough is $36,286.
What is the Median Family Income in Bernville borough?
Median Family Income in Bernville borough is $102,125.
What is the Median Household income in Bernville borough?
Median Household Income in Bernville borough is $84,196.
What is Income or Wage Gap in Bernville borough?
Income or Wage Gap in Bernville borough is 8.2%.
Women in Bernville borough earn 91.8 cents for every dollar earned by a man.
What is Inequality or Gini Index in Bernville borough?
Inequality or Gini Index in Bernville borough is 0.34.
What is the Total Population of Bernville borough?
Total Population of Bernville borough is 837.
What is the Total Male Population of Bernville borough?
Total Male Population of Bernville borough is 402.
What is the Total Female Population of Bernville borough?
Total Female Population of Bernville borough is 435.
What is the Ratio of Males per 100 Females in Bernville borough?
There are 92.41 Males per 100 Females in Bernville borough.
What is the Ratio of Females per 100 Males in Bernville borough?
There are 108.21 Females per 100 Males in Bernville borough.
What is the Median Population Age in Bernville borough?
Median Population Age in Bernville borough is 35.4 Years.
What is the Average Family Size in Bernville borough
Average Family Size in Bernville borough is 3.2 People.
What is the Average Household Size in Bernville borough
Average Household Size in Bernville borough is 2.8 People.
How Large is the Labor Force in Bernville borough?
There are 459 People in the Labor Forcein in Bernville borough.
What is the Percentage of People in the Labor Force in Bernville borough?
72.5% of People are in the Labor Force in Bernville borough.
What is the Unemployment Rate in Bernville borough?
Unemployment Rate in Bernville borough is 2.4%.