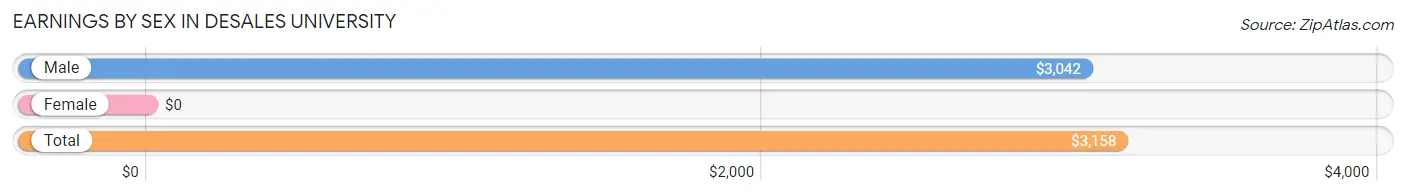
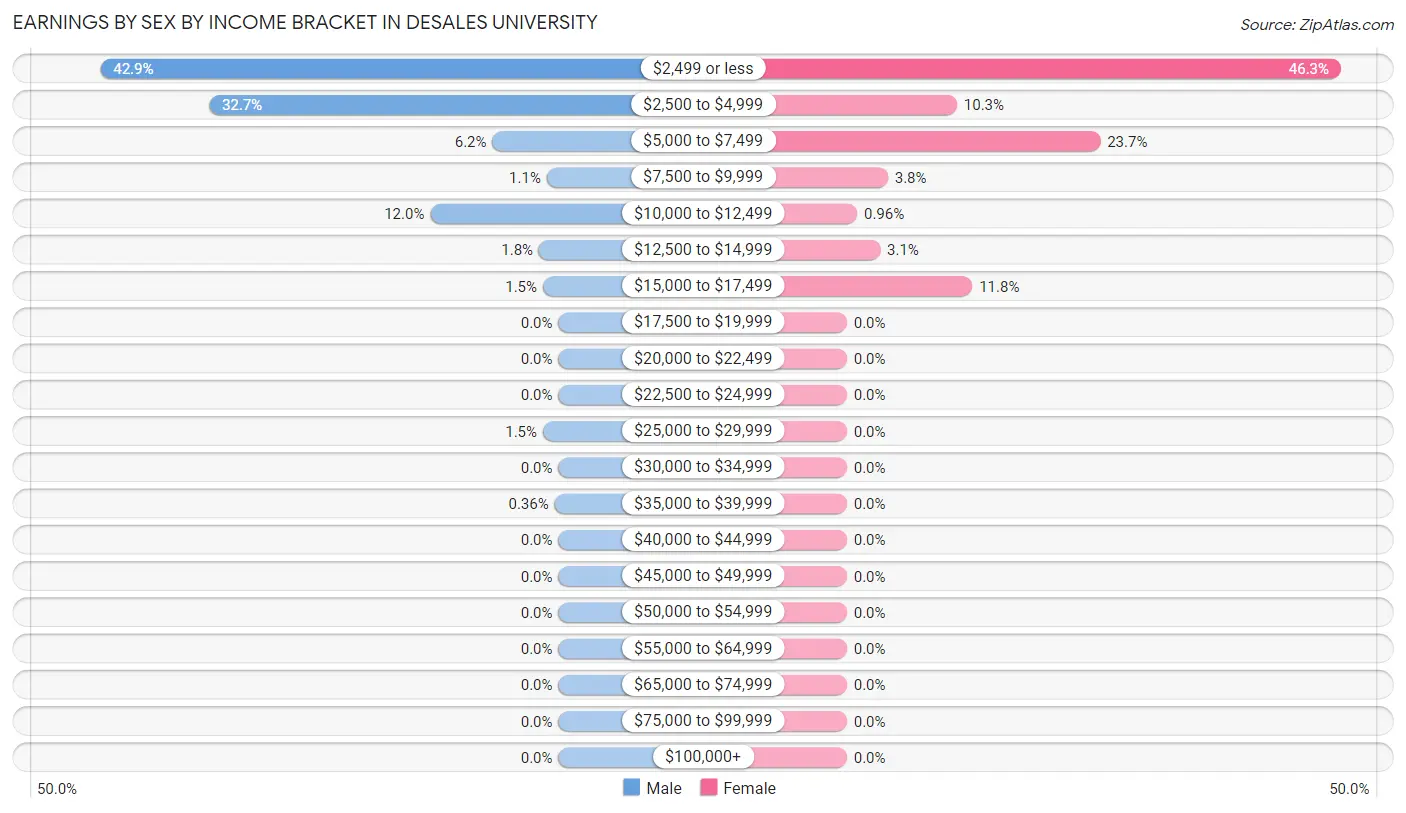
Earnings by Sex by Income Bracket in DeSales University
The most common earnings brackets in DeSales University are $2,499 or less for men (118 | 42.9%) and $2,499 or less for women (193 | 46.3%).
Income
Male
Female
$2,499 or less
118 (42.9%)
193 (46.3%)
$2,500 to $4,999
90 (32.7%)
43 (10.3%)
$5,000 to $7,499
17 (6.2%)
99 (23.7%)
$7,500 to $9,999
3 (1.1%)
16 (3.8%)
$10,000 to $12,499
33 (12.0%)
4 (1.0%)
$12,500 to $14,999
5 (1.8%)
13 (3.1%)
$15,000 to $17,499
4 (1.5%)
49 (11.7%)
$17,500 to $19,999
0 (0.0%)
0 (0.0%)
$20,000 to $22,499
0 (0.0%)
0 (0.0%)
$22,500 to $24,999
0 (0.0%)
0 (0.0%)
$25,000 to $29,999
4 (1.5%)
0 (0.0%)
$30,000 to $34,999
0 (0.0%)
0 (0.0%)
$35,000 to $39,999
1 (0.4%)
0 (0.0%)
$40,000 to $44,999
0 (0.0%)
0 (0.0%)
$45,000 to $49,999
0 (0.0%)
0 (0.0%)
$50,000 to $54,999
0 (0.0%)
0 (0.0%)
$55,000 to $64,999
0 (0.0%)
0 (0.0%)
$65,000 to $74,999
0 (0.0%)
0 (0.0%)
$75,000 to $99,999
0 (0.0%)
0 (0.0%)
$100,000+
0 (0.0%)
0 (0.0%)
Total
275 (100.0%)
417 (100.0%)
Earnings by Sex by Educational Attainment in DeSales University
Educational Attainment
Male Income
Female Income
Less than High School
-
-
High School Diploma
-
-
College or Associate's Degree
-
-
Bachelor's Degree
-
-
Graduate Degree
-
-
Total
-
-
Family Income in DeSales University
Family Income Brackets in DeSales University
Income Bracket
# Families
% Families
Less than $10,000
0
0.0%
$10,000 to $14,999
0
0.0%
$15,000 to $24,999
0
0.0%
$25,000 to $34,999
0
0.0%
$35,000 to $49,999
0
0.0%
$50,000 to $74,999
0
0.0%
$75,000 to $99,999
0
0.0%
$100,000 to $149,999
0
0.0%
$150,000 to $199,999
0
0.0%
$200,000+
0
0.0%
Family Income by Famaliy Size in DeSales University
Income Bracket
# Families
Median Income
2-Person Families
0 (0.0%)
$0
3-Person Families
0 (0.0%)
$0
4-Person Families
0 (0.0%)
$0
5-Person Families
0 (0.0%)
$0
6-Person Families
0 (0.0%)
$0
7+ Person Families
0 (0.0%)
$0
Total
0 (0.0%)
$0
Family Income by Number of Earners in DeSales University
Number of Earners
# Families
Median Income
No Earners
0 (0.0%)
$0
1 Earner
0 (0.0%)
$0
2 Earners
0 (0.0%)
$0
3+ Earners
0 (0.0%)
$0
Total
0 (0.0%)
$0
Household Income in DeSales University
Household Income Brackets in DeSales University
Income Bracket
# Households
% Households
Less than $10,000
0
0.0%
$10,000 to $14,999
0
0.0%
$15,000 to $24,999
0
0.0%
$25,000 to $34,999
0
0.0%
$35,000 to $49,999
0
0.0%
$50,000 to $74,999
0
0.0%
$75,000 to $99,999
0
0.0%
$100,000 to $149,999
0
0.0%
$150,000 to $199,999
0
0.0%
$200,000+
0
0.0%
Household Income by Householder Age in DeSales University
Income Bracket
# Households
Median Income
15 to 24 Years
0 (0.0%)
$0
25 to 44 Years
0 (0.0%)
$0
45 to 64 Years
0 (0.0%)
$0
65+ Years
0 (0.0%)
$0
Total
0 (0.0%)
$0
Poverty in DeSales University
Income Below Poverty by Sex and Age in DeSales University
Age Bracket
Male
Female
Under 5 Years
0 (0.0%)
0 (0.0%)
5 Years
0 (0.0%)
0 (0.0%)
6 to 11 Years
0 (0.0%)
0 (0.0%)
12 to 14 Years
0 (0.0%)
0 (0.0%)
15 Years
0 (0.0%)
0 (0.0%)
16 and 17 Years
0 (0.0%)
0 (0.0%)
18 to 24 Years
0 (0.0%)
0 (0.0%)
25 to 34 Years
0 (0.0%)
0 (0.0%)
35 to 44 Years
0 (0.0%)
0 (0.0%)
45 to 54 Years
0 (0.0%)
0 (0.0%)
55 to 64 Years
0 (0.0%)
0 (0.0%)
65 to 74 Years
0 (0.0%)
0 (0.0%)
75 Years and over
2 (100.0%)
0 (0.0%)
Total
2 (66.7%)
0 (0.0%)
Income Above Poverty by Sex and Age in DeSales University
Age Bracket
Male
Female
Under 5 Years
0 (0.0%)
0 (0.0%)
5 Years
0 (0.0%)
0 (0.0%)
6 to 11 Years
0 (0.0%)
0 (0.0%)
12 to 14 Years
0 (0.0%)
0 (0.0%)
15 Years
0 (0.0%)
0 (0.0%)
16 and 17 Years
0 (0.0%)
0 (0.0%)
18 to 24 Years
0 (0.0%)
0 (0.0%)
25 to 34 Years
0 (0.0%)
0 (0.0%)
35 to 44 Years
0 (0.0%)
0 (0.0%)
45 to 54 Years
0 (0.0%)
0 (0.0%)
55 to 64 Years
0 (0.0%)
0 (0.0%)
65 to 74 Years
1 (100.0%)
0 (0.0%)
75 Years and over
0 (0.0%)
0 (0.0%)
Total
1 (33.3%)
0 (0.0%)
Income Below Poverty Among Married-Couple Families in DeSales University
Children
Above Poverty
Below Poverty
No Children
0 (0.0%)
0 (0.0%)
1 or 2 Children
0 (0.0%)
0 (0.0%)
3 or 4 Children
0 (0.0%)
0 (0.0%)
5 or more Children
0 (0.0%)
0 (0.0%)
Total
0 (0.0%)
0 (0.0%)
Income Below Poverty Among Single-Parent Households in DeSales University
Children
Single Father
Single Mother
No Children
0 (0.0%)
0 (0.0%)
1 or 2 Children
0 (0.0%)
0 (0.0%)
3 or 4 Children
0 (0.0%)
0 (0.0%)
5 or more Children
0 (0.0%)
0 (0.0%)
Total
0 (0.0%)
0 (0.0%)
Income Below Poverty Among Married-Couple vs Single-Parent Households in DeSales University
Children
Married-Couple Families
Single-Parent Households
No Children
0 (0.0%)
0 (0.0%)
1 or 2 Children
0 (0.0%)
0 (0.0%)
3 or 4 Children
0 (0.0%)
0 (0.0%)
5 or more Children
0 (0.0%)
0 (0.0%)
Total
0 (0.0%)
0 (0.0%)
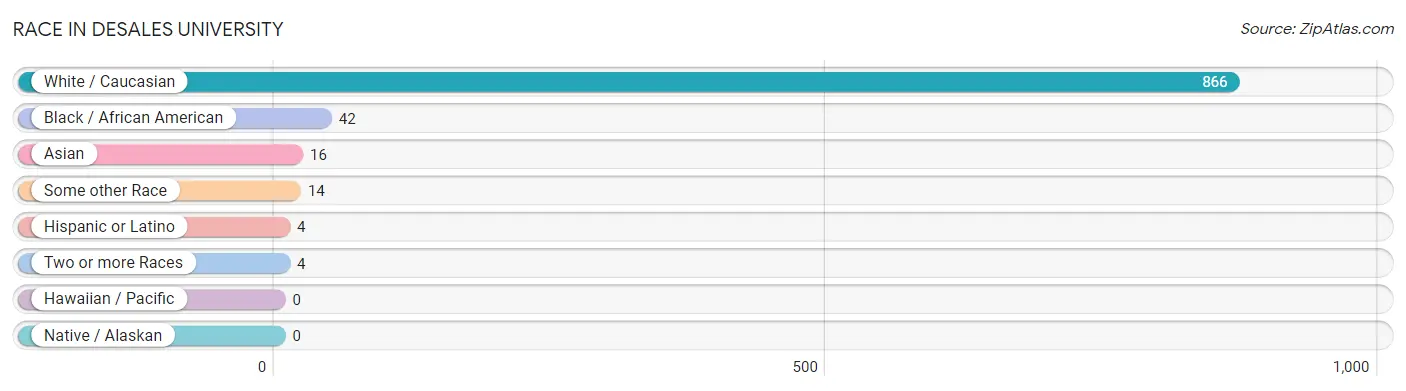
Race in DeSales University
The most populous races in DeSales University are White / Caucasian (866 | 91.9%), Black / African American (42 | 4.5%), and Asian (16 | 1.7%).
Race
# Population
% Population
Asian
16
1.7%
Black / African American
42
4.5%
Hawaiian / Pacific
0
0.0%
Hispanic or Latino
4
0.4%
Native / Alaskan
0
0.0%
White / Caucasian
866
91.9%
Two or more Races
4
0.4%
Some other Race
14
1.5%
Total
942
100.0%
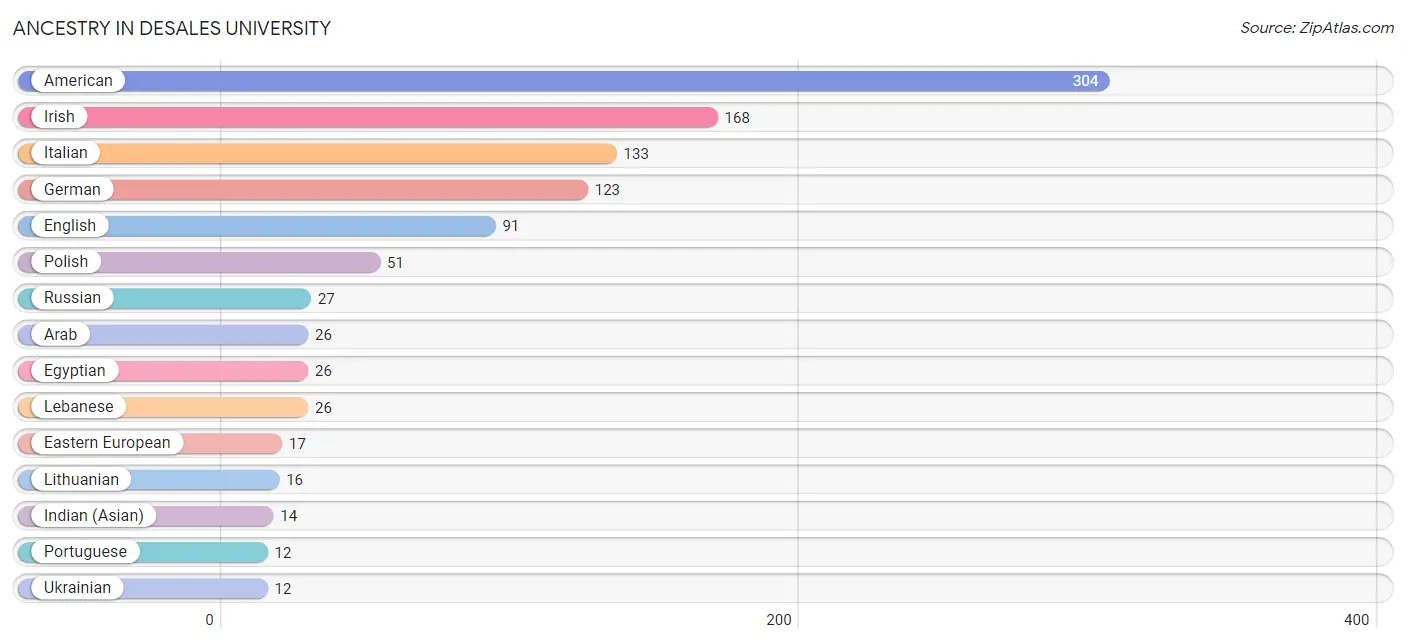
Ancestry in DeSales University
The most populous ancestries reported in DeSales University are American (304 | 32.3%), Irish (168 | 17.8%), Italian (133 | 14.1%), German (123 | 13.1%), and English (91 | 9.7%), together accounting for 86.9% of all DeSales University residents.
Ancestry
# Population
% Population
African
4
0.4%
American
304
32.3%
Arab
26
2.8%
Belgian
4
0.4%
Cherokee
4
0.4%
Czechoslovakian
10
1.1%
Dutch
5
0.5%
Eastern European
17
1.8%
Egyptian
26
2.8%
English
91
9.7%
European
10
1.1%
French
7
0.7%
German
123
13.1%
Indian (Asian)
14
1.5%
Irish
168
17.8%
Italian
133
14.1%
Lebanese
26
2.8%
Lithuanian
16
1.7%
Norwegian
11
1.2%
Polish
51
5.4%
Portuguese
12
1.3%
Russian
27
2.9%
Slovak
7
0.7%
Subsaharan African
4
0.4%
Ukrainian
12
1.3%
Vietnamese
2
0.2%
View All 26 Rows
Immigrants in DeSales University
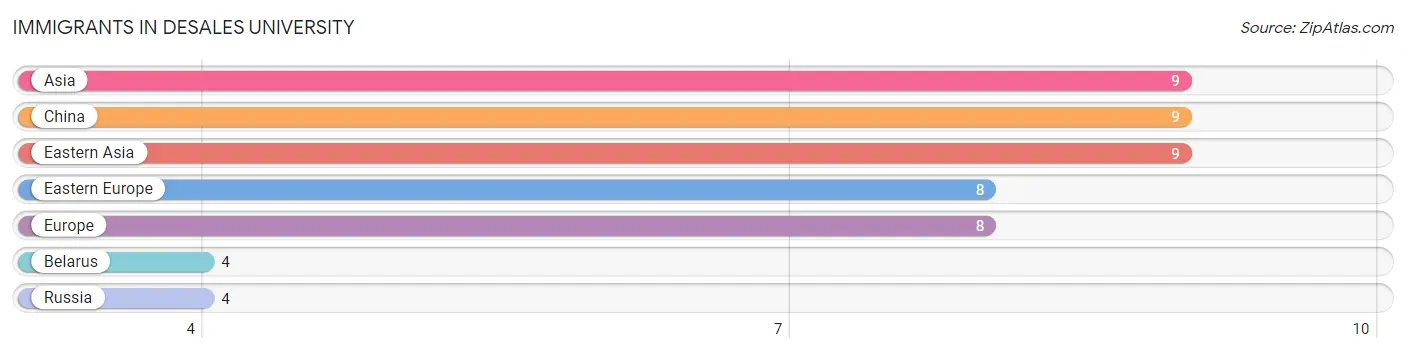
The most numerous immigrant groups reported in DeSales University came from Asia (9 | 1.0%), China (9 | 1.0%), Eastern Asia (9 | 1.0%), Eastern Europe (8 | 0.9%), and Europe (8 | 0.9%), together accounting for 4.6% of all DeSales University residents.
Immigration Origin
# Population
% Population
Asia
9
1.0%
Belarus
4
0.4%
China
9
1.0%
Eastern Asia
9
1.0%
Eastern Europe
8
0.9%
Europe
8
0.9%
Russia
4
0.4%
View All 7 Rows
Sex and Age in DeSales University
Sex and Age in DeSales University
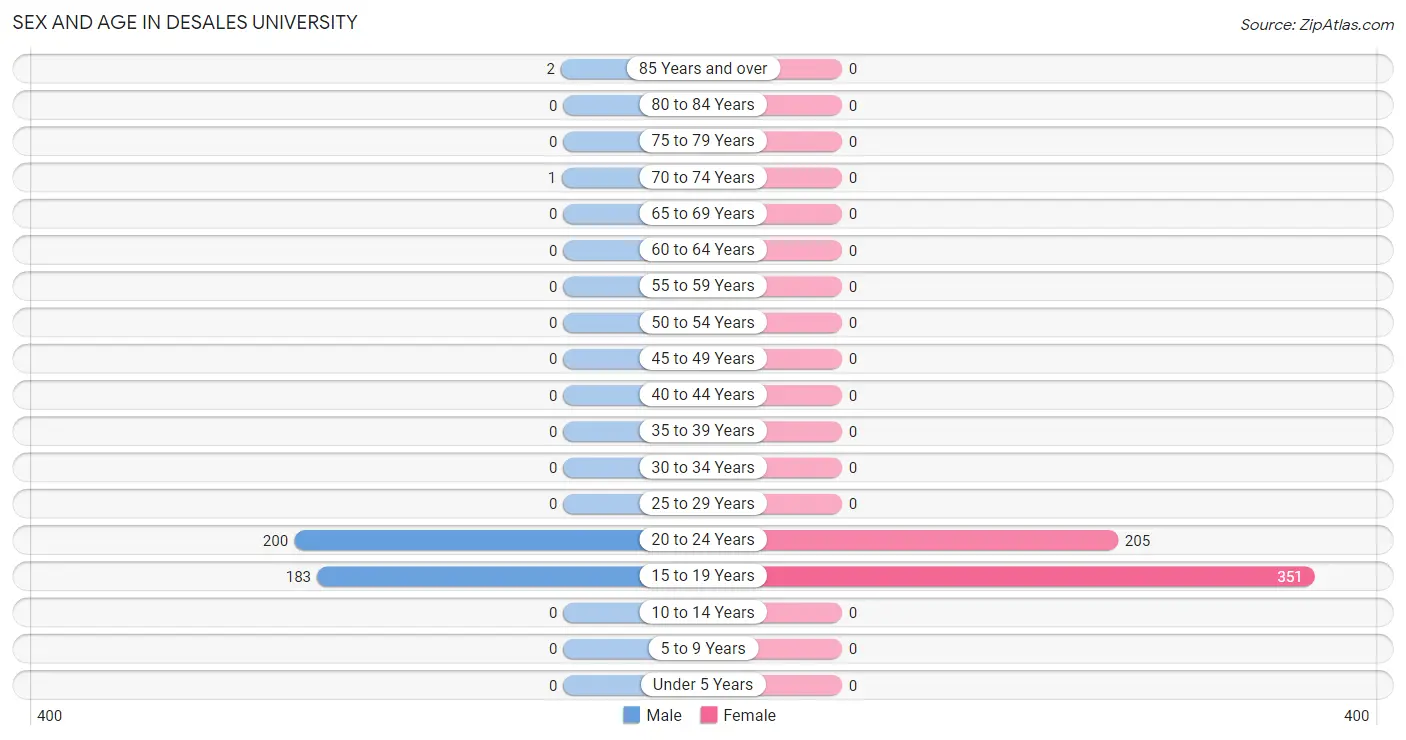
The most populous age groups in DeSales University are 20 to 24 Years (200 | 51.8%) for men and 15 to 19 Years (351 | 63.1%) for women.
Age Bracket
Male
Female
Under 5 Years
0 (0.0%)
0 (0.0%)
5 to 9 Years
0 (0.0%)
0 (0.0%)
10 to 14 Years
0 (0.0%)
0 (0.0%)
15 to 19 Years
183 (47.4%)
351 (63.1%)
20 to 24 Years
200 (51.8%)
205 (36.9%)
25 to 29 Years
0 (0.0%)
0 (0.0%)
30 to 34 Years
0 (0.0%)
0 (0.0%)
35 to 39 Years
0 (0.0%)
0 (0.0%)
40 to 44 Years
0 (0.0%)
0 (0.0%)
45 to 49 Years
0 (0.0%)
0 (0.0%)
50 to 54 Years
0 (0.0%)
0 (0.0%)
55 to 59 Years
0 (0.0%)
0 (0.0%)
60 to 64 Years
0 (0.0%)
0 (0.0%)
65 to 69 Years
0 (0.0%)
0 (0.0%)
70 to 74 Years
1 (0.3%)
0 (0.0%)
75 to 79 Years
0 (0.0%)
0 (0.0%)
80 to 84 Years
0 (0.0%)
0 (0.0%)
85 Years and over
2 (0.5%)
0 (0.0%)
Total
386 (100.0%)
556 (100.0%)
Families and Households in DeSales University
Median Family Size in DeSales University
Family Type
# Families
Family Size
Married-Couple
0 (0.0%)
-
Single Male/Father
0 (0.0%)
-
Single Female/Mother
0 (0.0%)
-
Total Families
0 (0.0%)
-
Median Household Size in DeSales University
Household Type
# Households
Household Size
Married-Couple
0 (0.0%)
-
Single Male/Father
0 (0.0%)
-
Single Female/Mother
0 (0.0%)
-
Non-family
0 (0.0%)
-
Total Households
0 (0.0%)
-
Household Size by Marriage Status in DeSales University
Household Size
Family Households
Nonfamily Households
1-Person Households
-
0 (0.0%)
2-Person Households
0 (0.0%)
0 (0.0%)
3-Person Households
0 (0.0%)
0 (0.0%)
4-Person Households
0 (0.0%)
0 (0.0%)
5-Person Households
0 (0.0%)
0 (0.0%)
6-Person Households
0 (0.0%)
0 (0.0%)
7+ Person Households
0 (0.0%)
0 (0.0%)
Total
0 (0.0%)
0 (0.0%)
Female Fertility in DeSales University
Fertility by Age in DeSales University
Age Bracket
Women with Births
Births / 1,000 Women
15 to 19 years
0 (0.0%)
0.0
20 to 34 years
0 (0.0%)
0.0
35 to 50 years
0 (0.0%)
0.0
Total
0 (0.0%)
0.0
Fertility by Age by Marriage Status in DeSales University
Age Bracket
Married
Unmarried
15 to 19 years
0 (0.0%)
0 (0.0%)
20 to 34 years
0 (0.0%)
0 (0.0%)
35 to 50 years
0 (0.0%)
0 (0.0%)
Total
0 (0.0%)
0 (0.0%)
Fertility by Education in DeSales University
Educational Attainment
Women with Births
Births / 1,000 Women
Less than High School
0 (0.0%)
0.0
High School Diploma
0 (0.0%)
0.0
College or Associate's Degree
0 (0.0%)
0.0
Bachelor's Degree
0 (0.0%)
0.0
Graduate Degree
0 (0.0%)
0.0
Total
0 (0.0%)
0.0
Fertility by Education by Marriage Status in DeSales University
Educational Attainment
Married
Unmarried
Less than High School
0 (0.0%)
0 (0.0%)
High School Diploma
0 (0.0%)
0 (0.0%)
College or Associate's Degree
0 (0.0%)
0 (0.0%)
Bachelor's Degree
0 (0.0%)
0 (0.0%)
Graduate Degree
0 (0.0%)
0 (0.0%)
Total
0 (0.0%)
0 (0.0%)
Employment Characteristics in DeSales University
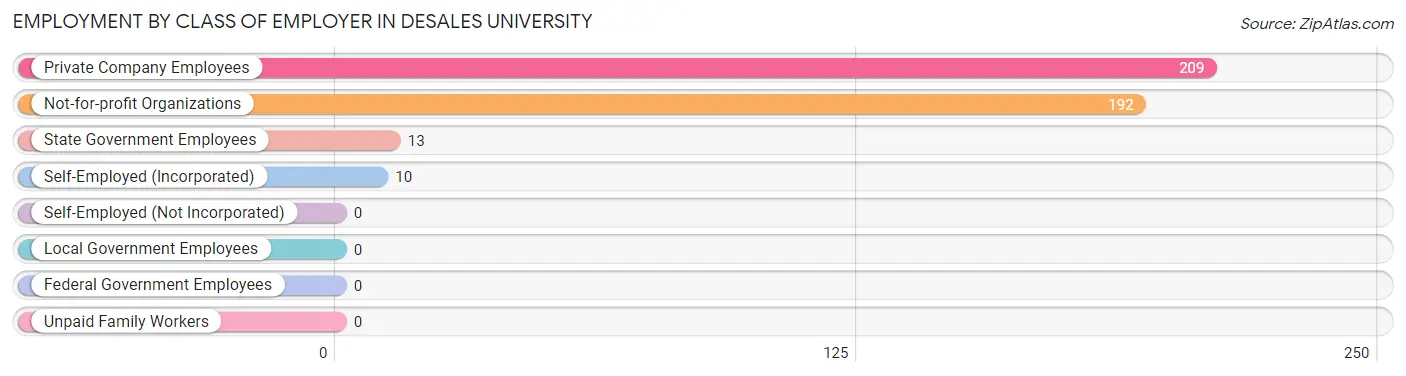
Employment by Class of Employer in DeSales University
Among the 424 employed individuals in DeSales University, private company employees (209 | 49.3%), not-for-profit organizations (192 | 45.3%), and state government employees (13 | 3.1%) make up the most common classes of employment.
Employer Class
# Employees
% Employees
Private Company Employees
209
49.3%
Self-Employed (Incorporated)
10
2.4%
Self-Employed (Not Incorporated)
0
0.0%
Not-for-profit Organizations
192
45.3%
Local Government Employees
0
0.0%
State Government Employees
13
3.1%
Federal Government Employees
0
0.0%
Unpaid Family Workers
0
0.0%
Total
424
100.0%
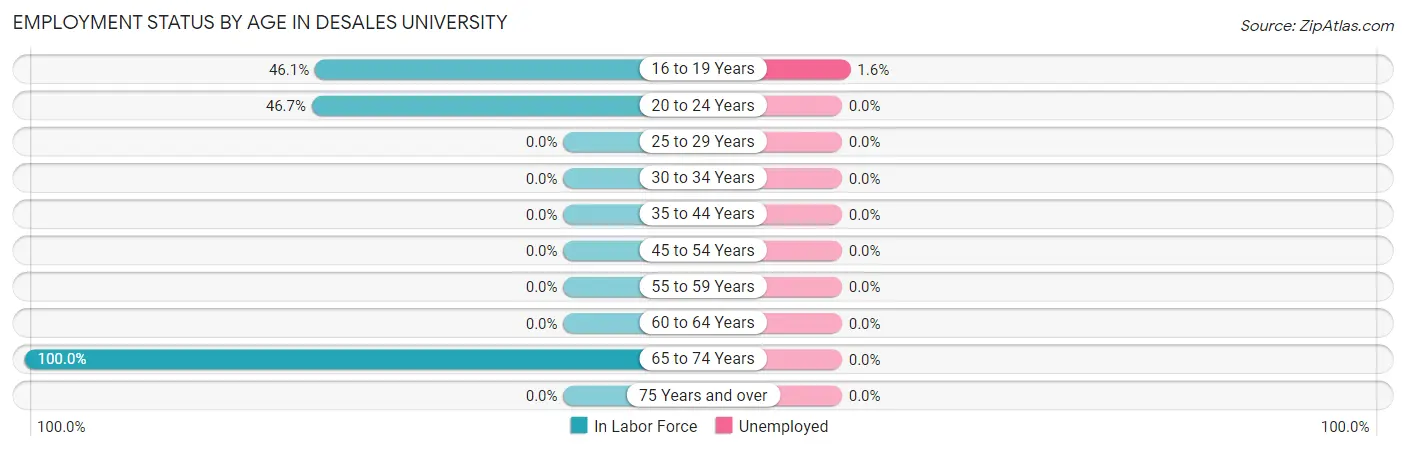
Employment Status by Age in DeSales University
According to the labor force statistics for DeSales University, out of the total population over 16 years of age (942), 46.3% or 436 individuals are in the labor force, with 0.9% or 4 of them unemployed. The age group with the highest labor force participation rate is 65 to 74 years, with 100.0% or 1 individuals in the labor force. Within the labor force, the 16 to 19 years age range has the highest percentage of unemployed individuals, with 1.6% or 4 of them being unemployed.
Age Bracket
In Labor Force
Unemployed
16 to 19 Years
246 (46.1%)
4 (1.6%)
20 to 24 Years
189 (46.7%)
0 (0.0%)
25 to 29 Years
0 (0.0%)
0 (0.0%)
30 to 34 Years
0 (0.0%)
0 (0.0%)
35 to 44 Years
0 (0.0%)
0 (0.0%)
45 to 54 Years
0 (0.0%)
0 (0.0%)
55 to 59 Years
0 (0.0%)
0 (0.0%)
60 to 64 Years
0 (0.0%)
0 (0.0%)
65 to 74 Years
1 (100.0%)
0 (0.0%)
75 Years and over
0 (0.0%)
0 (0.0%)
Total
436 (46.3%)
4 (0.9%)
Employment Status by Educational Attainment in DeSales University
Educational Attainment
In Labor Force
Unemployed
Less than High School
0 (0.0%)
0 (0.0%)
High School Diploma
0 (0.0%)
0 (0.0%)
College / Associate Degree
0 (0.0%)
0 (0.0%)
Bachelor's Degree or higher
0 (0.0%)
0 (0.0%)
Total
0 (0.0%)
0 (0.0%)
Employment Occupations by Sex in DeSales University
Management, Business, Science and Arts Occupations
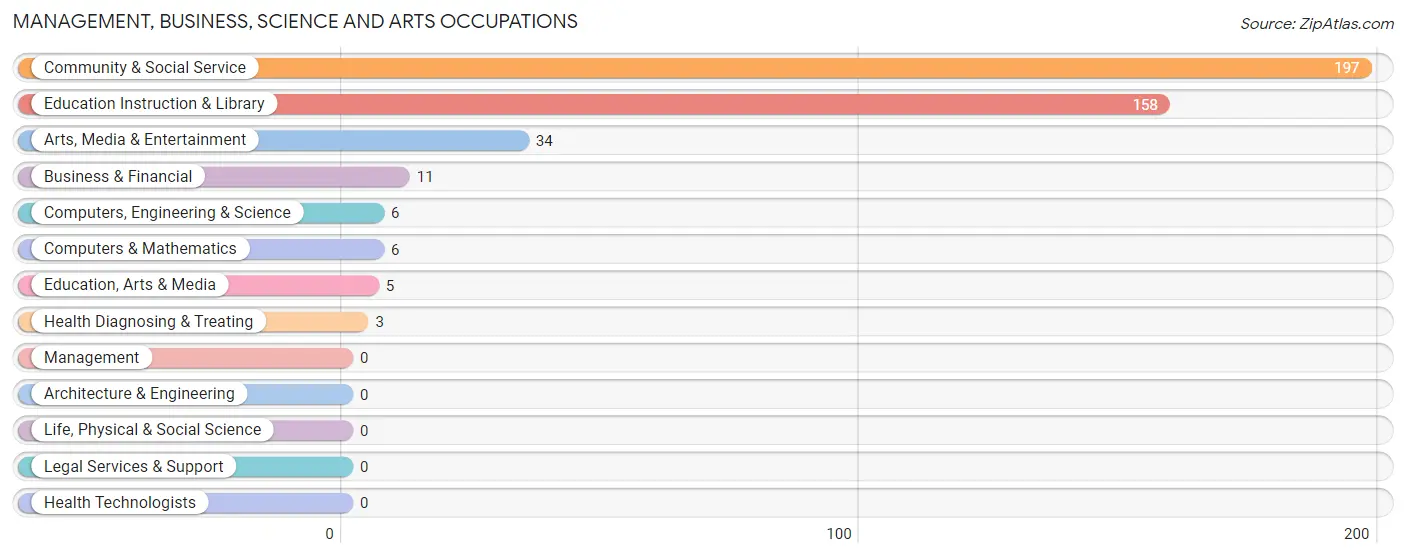
The most common Management, Business, Science and Arts occupations in DeSales University are Community & Social Service (197 | 45.6%), Education Instruction & Library (158 | 36.6%), Arts, Media & Entertainment (34 | 7.9%), Business & Financial (11 | 2.5%), and Computers, Engineering & Science (6 | 1.4%).
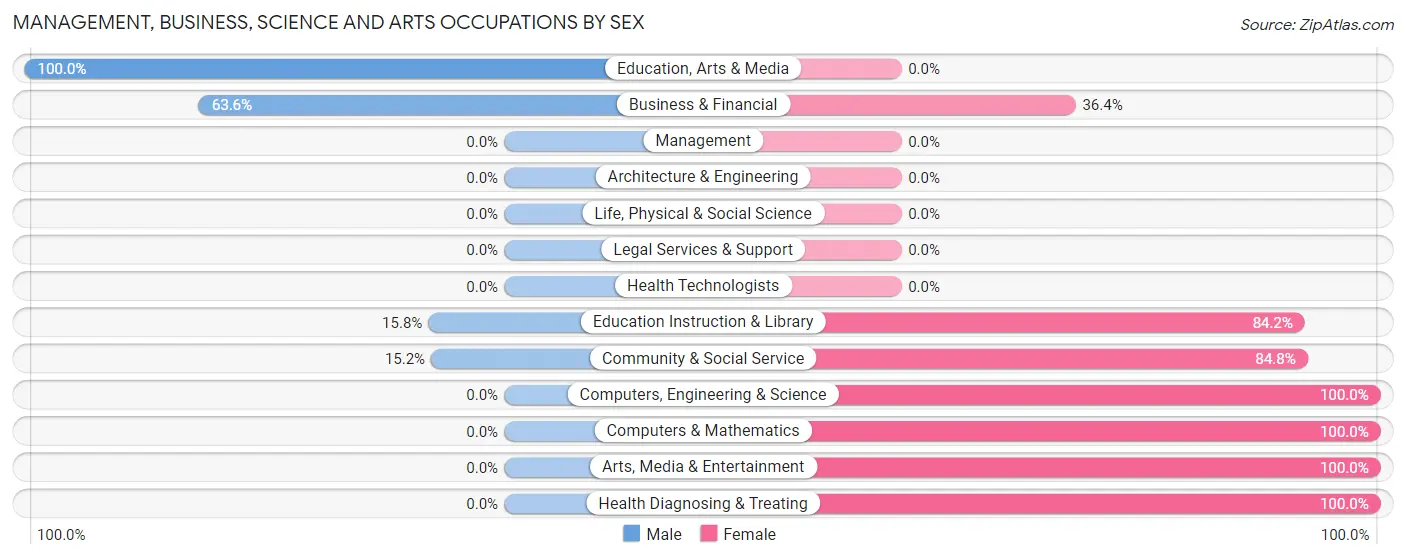
Management, Business, Science and Arts Occupations by Sex
Within the Management, Business, Science and Arts occupations in DeSales University, the most male-oriented occupations are Education, Arts & Media (100.0%), Business & Financial (63.6%), and Education Instruction & Library (15.8%), while the most female-oriented occupations are Computers, Engineering & Science (100.0%), Computers & Mathematics (100.0%), and Arts, Media & Entertainment (100.0%).
Occupation
Male
Female
Management
0 (0.0%)
0 (0.0%)
Business & Financial
7 (63.6%)
4 (36.4%)
Computers, Engineering & Science
0 (0.0%)
6 (100.0%)
Computers & Mathematics
0 (0.0%)
6 (100.0%)
Architecture & Engineering
0 (0.0%)
0 (0.0%)
Life, Physical & Social Science
0 (0.0%)
0 (0.0%)
Community & Social Service
30 (15.2%)
167 (84.8%)
Education, Arts & Media
5 (100.0%)
0 (0.0%)
Legal Services & Support
0 (0.0%)
0 (0.0%)
Education Instruction & Library
25 (15.8%)
133 (84.2%)
Arts, Media & Entertainment
0 (0.0%)
34 (100.0%)
Health Diagnosing & Treating
0 (0.0%)
3 (100.0%)
Health Technologists
0 (0.0%)
0 (0.0%)
Total (Category)
37 (17.1%)
180 (83.0%)
Total (Overall)
153 (35.4%)
279 (64.6%)
Services Occupations
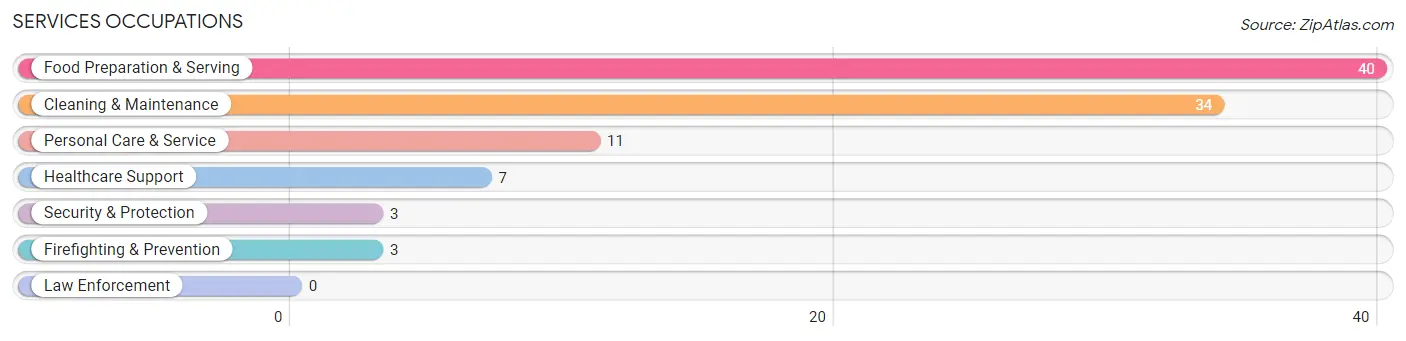
The most common Services occupations in DeSales University are Food Preparation & Serving (40 | 9.3%), Cleaning & Maintenance (34 | 7.9%), Personal Care & Service (11 | 2.5%), Healthcare Support (7 | 1.6%), and Security & Protection (3 | 0.7%).
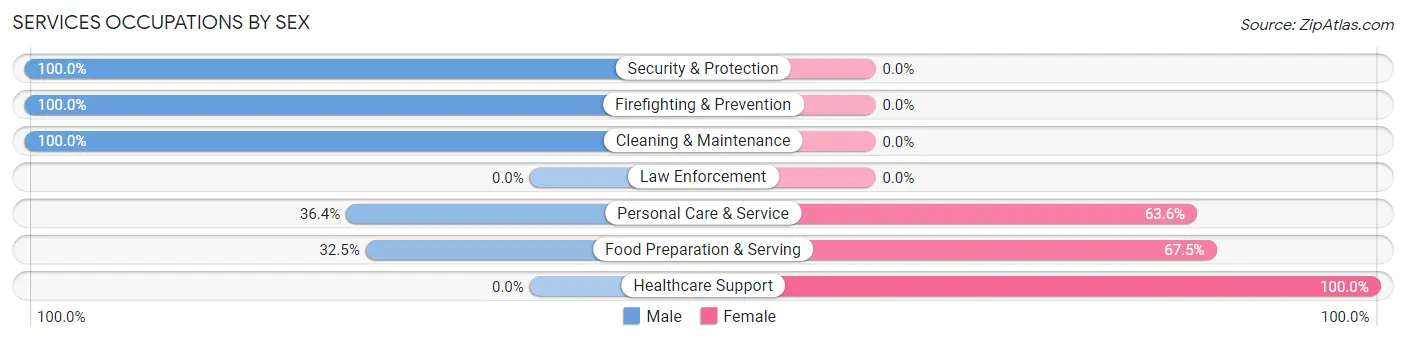
Services Occupations by Sex
Within the Services occupations in DeSales University, the most male-oriented occupations are Security & Protection (100.0%), Firefighting & Prevention (100.0%), and Cleaning & Maintenance (100.0%), while the most female-oriented occupations are Healthcare Support (100.0%), Food Preparation & Serving (67.5%), and Personal Care & Service (63.6%).
Occupation
Male
Female
Healthcare Support
0 (0.0%)
7 (100.0%)
Security & Protection
3 (100.0%)
0 (0.0%)
Firefighting & Prevention
3 (100.0%)
0 (0.0%)
Law Enforcement
0 (0.0%)
0 (0.0%)
Food Preparation & Serving
13 (32.5%)
27 (67.5%)
Cleaning & Maintenance
34 (100.0%)
0 (0.0%)
Personal Care & Service
4 (36.4%)
7 (63.6%)
Total (Category)
54 (56.8%)
41 (43.2%)
Total (Overall)
153 (35.4%)
279 (64.6%)
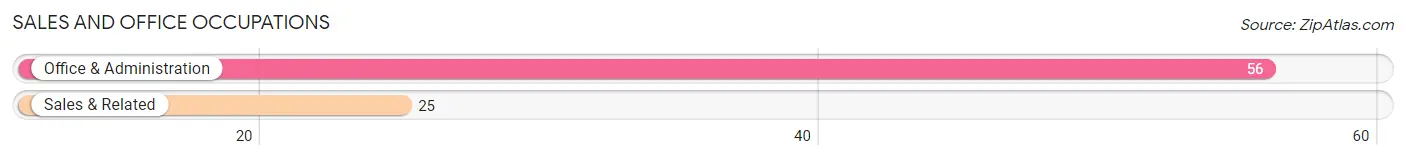
Sales and Office Occupations
The most common Sales and Office occupations in DeSales University are Office & Administration (56 | 13.0%), and Sales & Related (25 | 5.8%).
Sales and Office Occupations by Sex
Occupation
Male
Female
Sales & Related
0 (0.0%)
25 (100.0%)
Office & Administration
42 (75.0%)
14 (25.0%)
Total (Category)
42 (51.8%)
39 (48.1%)
Total (Overall)
153 (35.4%)
279 (64.6%)
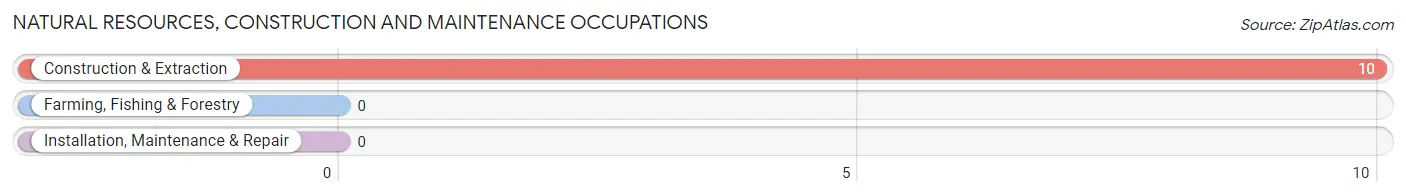
Natural Resources, Construction and Maintenance Occupations
The most common Natural Resources, Construction and Maintenance occupations in DeSales University are , and Construction & Extraction (10 | 2.3%).
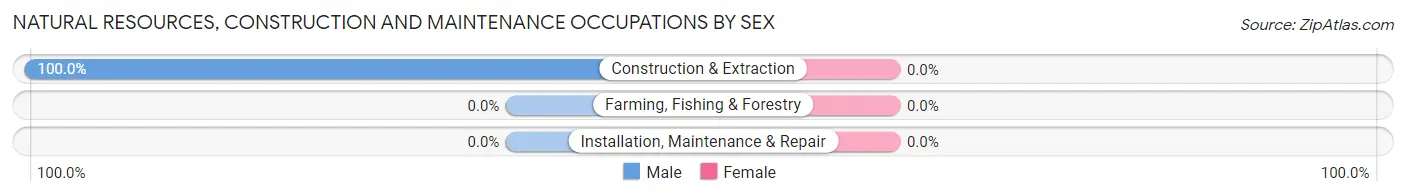
Natural Resources, Construction and Maintenance Occupations by Sex
Occupation
Male
Female
Farming, Fishing & Forestry
0 (0.0%)
0 (0.0%)
Construction & Extraction
10 (100.0%)
0 (0.0%)
Installation, Maintenance & Repair
0 (0.0%)
0 (0.0%)
Total (Category)
10 (100.0%)
0 (0.0%)
Total (Overall)
153 (35.4%)
279 (64.6%)
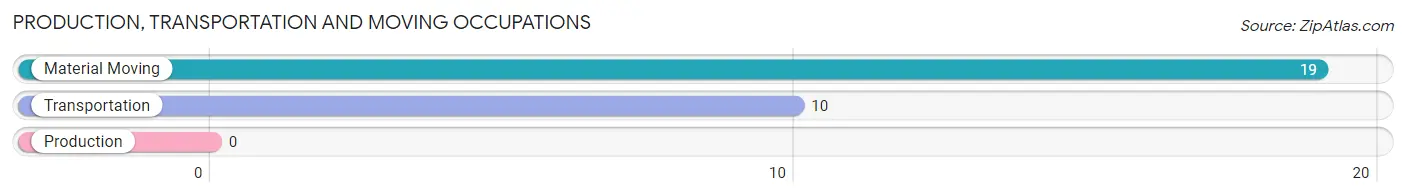
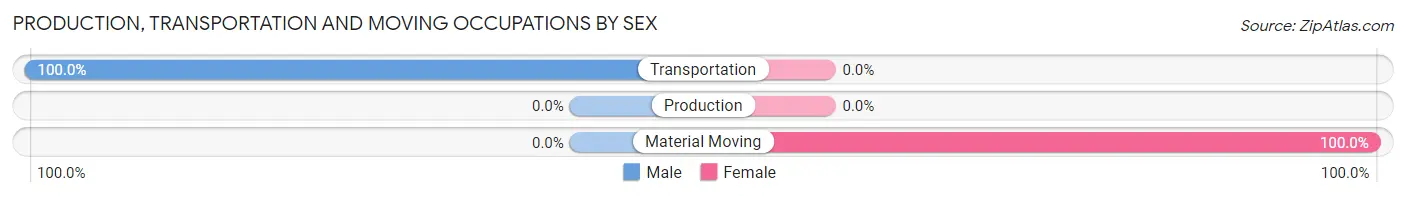
Production, Transportation and Moving Occupations
The most common Production, Transportation and Moving occupations in DeSales University are Material Moving (19 | 4.4%), and Transportation (10 | 2.3%).
Production, Transportation and Moving Occupations by Sex
Occupation
Male
Female
Production
0 (0.0%)
0 (0.0%)
Transportation
10 (100.0%)
0 (0.0%)
Material Moving
0 (0.0%)
19 (100.0%)
Total (Category)
10 (34.5%)
19 (65.5%)
Total (Overall)
153 (35.4%)
279 (64.6%)
Employment Industries by Sex in DeSales University
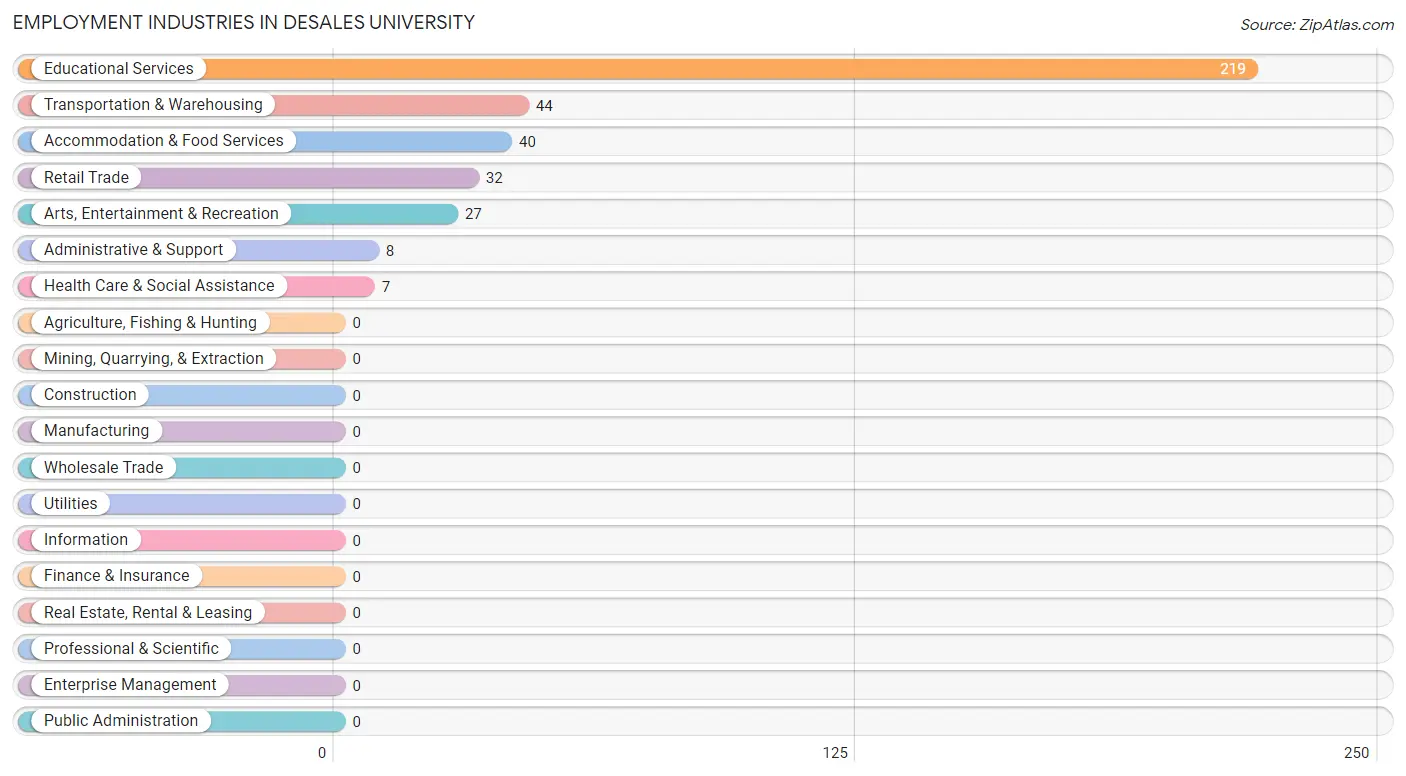
Employment Industries in DeSales University
The major employment industries in DeSales University include Educational Services (219 | 50.7%), Transportation & Warehousing (44 | 10.2%), Accommodation & Food Services (40 | 9.3%), Retail Trade (32 | 7.4%), and Arts, Entertainment & Recreation (27 | 6.2%).
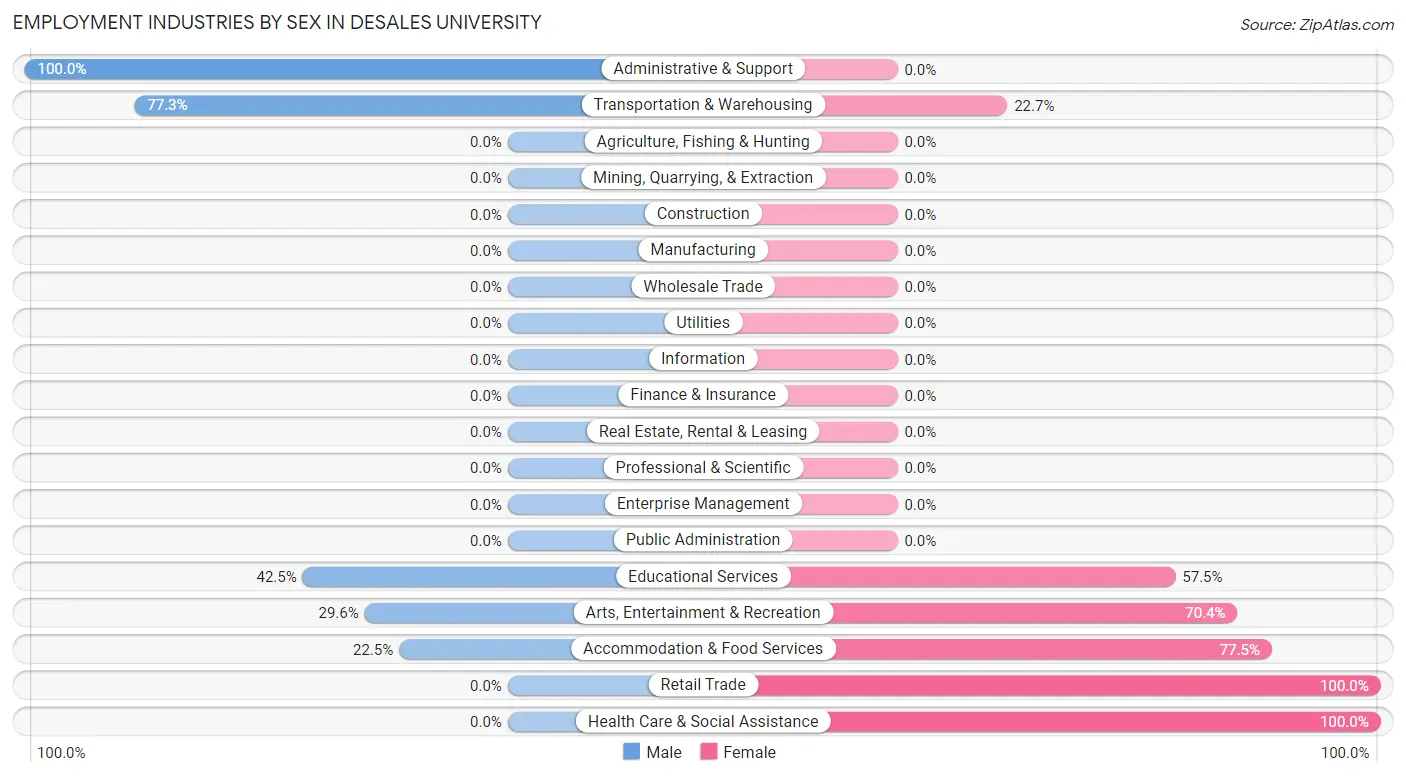
Employment Industries by Sex in DeSales University
The DeSales University industries that see more men than women are Administrative & Support (100.0%), Transportation & Warehousing (77.3%), and Educational Services (42.5%), whereas the industries that tend to have a higher number of women are Retail Trade (100.0%), Health Care & Social Assistance (100.0%), and Accommodation & Food Services (77.5%).
Industry
Male
Female
Agriculture, Fishing & Hunting
0 (0.0%)
0 (0.0%)
Mining, Quarrying, & Extraction
0 (0.0%)
0 (0.0%)
Construction
0 (0.0%)
0 (0.0%)
Manufacturing
0 (0.0%)
0 (0.0%)
Wholesale Trade
0 (0.0%)
0 (0.0%)
Retail Trade
0 (0.0%)
32 (100.0%)
Transportation & Warehousing
34 (77.3%)
10 (22.7%)
Utilities
0 (0.0%)
0 (0.0%)
Information
0 (0.0%)
0 (0.0%)
Finance & Insurance
0 (0.0%)
0 (0.0%)
Real Estate, Rental & Leasing
0 (0.0%)
0 (0.0%)
Professional & Scientific
0 (0.0%)
0 (0.0%)
Enterprise Management
0 (0.0%)
0 (0.0%)
Administrative & Support
8 (100.0%)
0 (0.0%)
Educational Services
93 (42.5%)
126 (57.5%)
Health Care & Social Assistance
0 (0.0%)
7 (100.0%)
Arts, Entertainment & Recreation
8 (29.6%)
19 (70.4%)
Accommodation & Food Services
9 (22.5%)
31 (77.5%)
Public Administration
0 (0.0%)
0 (0.0%)
Total
153 (35.4%)
279 (64.6%)
Education in DeSales University
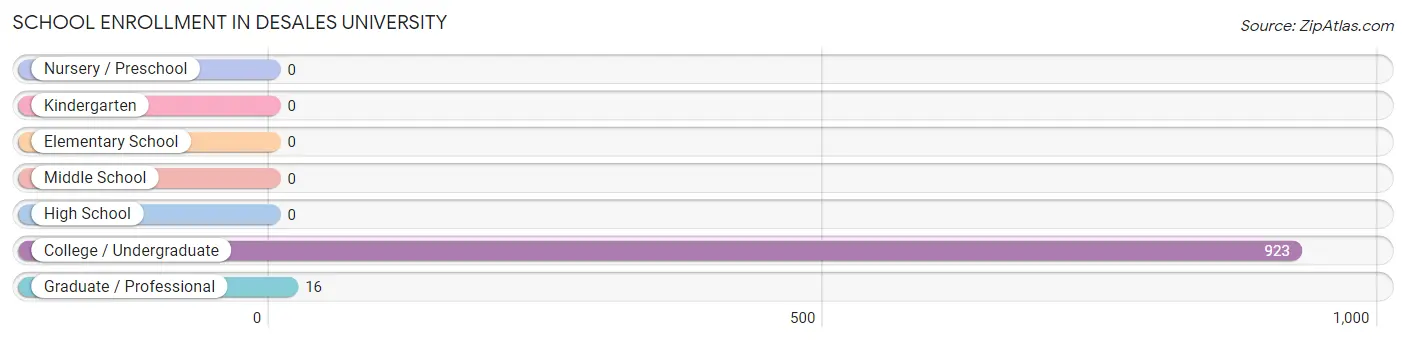
School Enrollment in DeSales University
The most common levels of schooling among the 939 students in DeSales University are college / undergraduate (923 | 98.3%), and graduate / professional (16 | 1.7%).
School Level
# Students
% Students
Nursery / Preschool
0
0.0%
Kindergarten
0
0.0%
Elementary School
0
0.0%
Middle School
0
0.0%
High School
0
0.0%
College / Undergraduate
923
98.3%
Graduate / Professional
16
1.7%
Total
939
100.0%
School Enrollment by Age by Funding Source in DeSales University
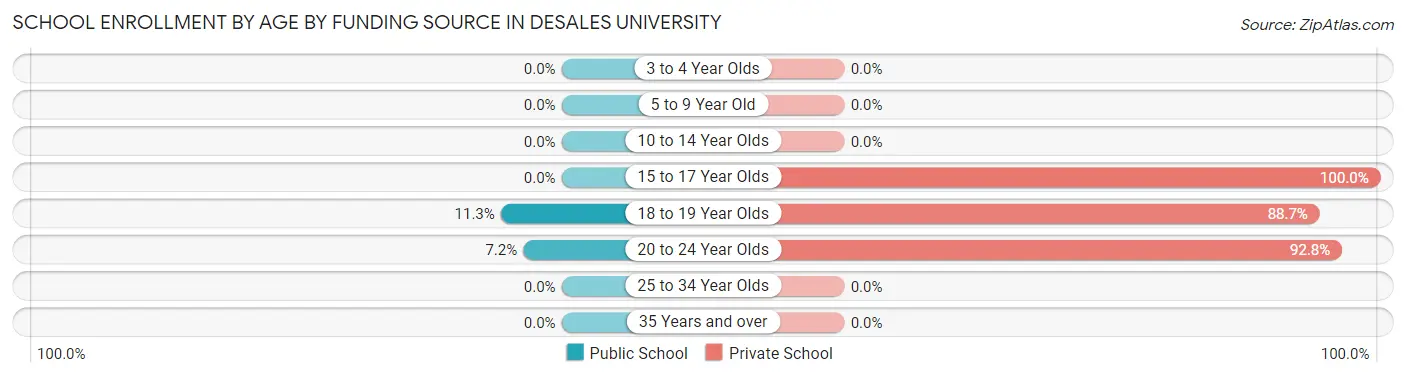
Out of a total of 939 students who are enrolled in schools in DeSales University, 850 (90.5%) attend a private institution, while the remaining 89 (9.5%) are enrolled in public schools. The age group of 15 to 17 year olds has the highest likelihood of being enrolled in private schools, with 5 (100.0% in the age bracket) enrolled. Conversely, the age group of 18 to 19 year olds has the lowest likelihood of being enrolled in a private school, with 60 (11.3% in the age bracket) attending a public institution.
Age Bracket
Public School
Private School
3 to 4 Year Olds
0 (0.0%)
0 (0.0%)
5 to 9 Year Old
0 (0.0%)
0 (0.0%)
10 to 14 Year Olds
0 (0.0%)
0 (0.0%)
15 to 17 Year Olds
0 (0.0%)
5 (100.0%)
18 to 19 Year Olds
60 (11.3%)
469 (88.7%)
20 to 24 Year Olds
29 (7.2%)
376 (92.8%)
25 to 34 Year Olds
0 (0.0%)
0 (0.0%)
35 Years and over
0 (0.0%)
0 (0.0%)
Total
89 (9.5%)
850 (90.5%)
Educational Attainment by Field of Study in DeSales University
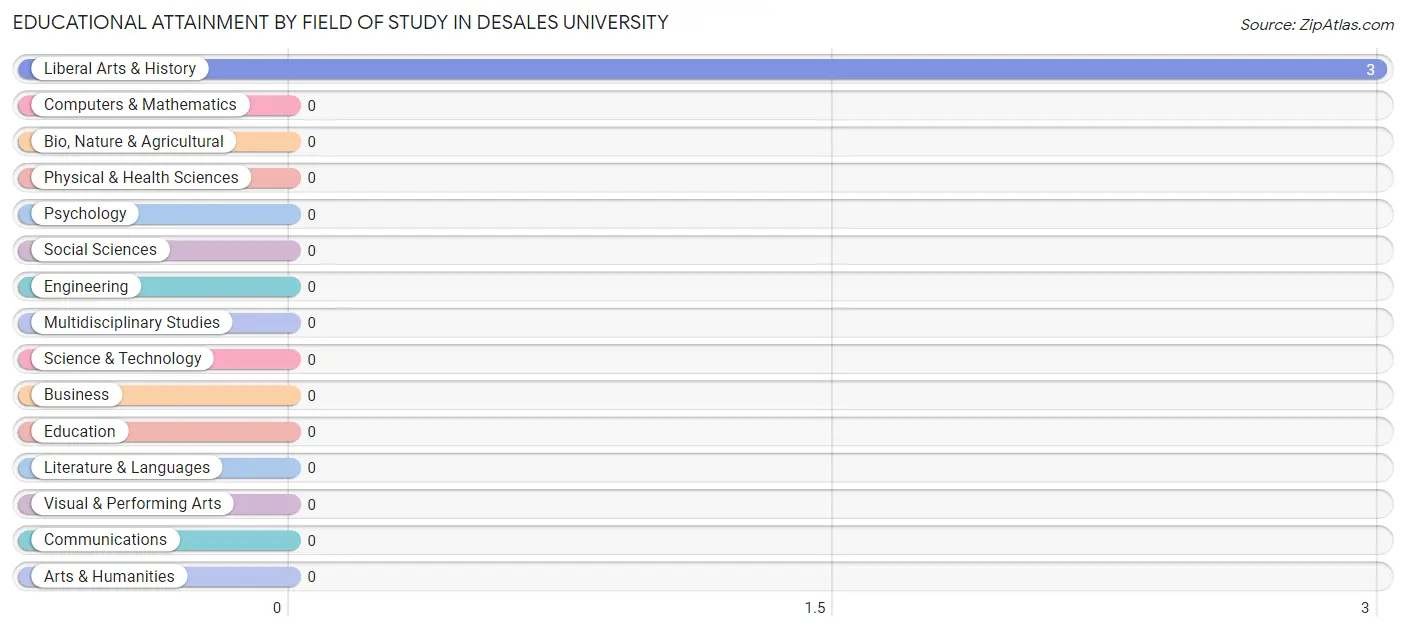
, and liberal arts & history (3 | 100.0%) are the most common fields of study among 3 individuals in DeSales University who have obtained a bachelor's degree or higher.
Field of Study
# Graduates
% Graduates
Computers & Mathematics
0
0.0%
Bio, Nature & Agricultural
0
0.0%
Physical & Health Sciences
0
0.0%
Psychology
0
0.0%
Social Sciences
0
0.0%
Engineering
0
0.0%
Multidisciplinary Studies
0
0.0%
Science & Technology
0
0.0%
Business
0
0.0%
Education
0
0.0%
Literature & Languages
0
0.0%
Liberal Arts & History
3
100.0%
Visual & Performing Arts
0
0.0%
Communications
0
0.0%
Arts & Humanities
0
0.0%
Total
3
100.0%
Transportation & Commute in DeSales University
Vehicle Availability by Sex in DeSales University
Vehicles Available
Male
Female
No Vehicle
0 (0.0%)
0 (0.0%)
1 Vehicle
0 (0.0%)
0 (0.0%)
2 Vehicles
0 (0.0%)
0 (0.0%)
3 Vehicles
0 (0.0%)
0 (0.0%)
4 Vehicles
0 (0.0%)
0 (0.0%)
5 or more Vehicles
0 (0.0%)
0 (0.0%)
Total
0 (0.0%)
0 (0.0%)
Commute Time in DeSales University
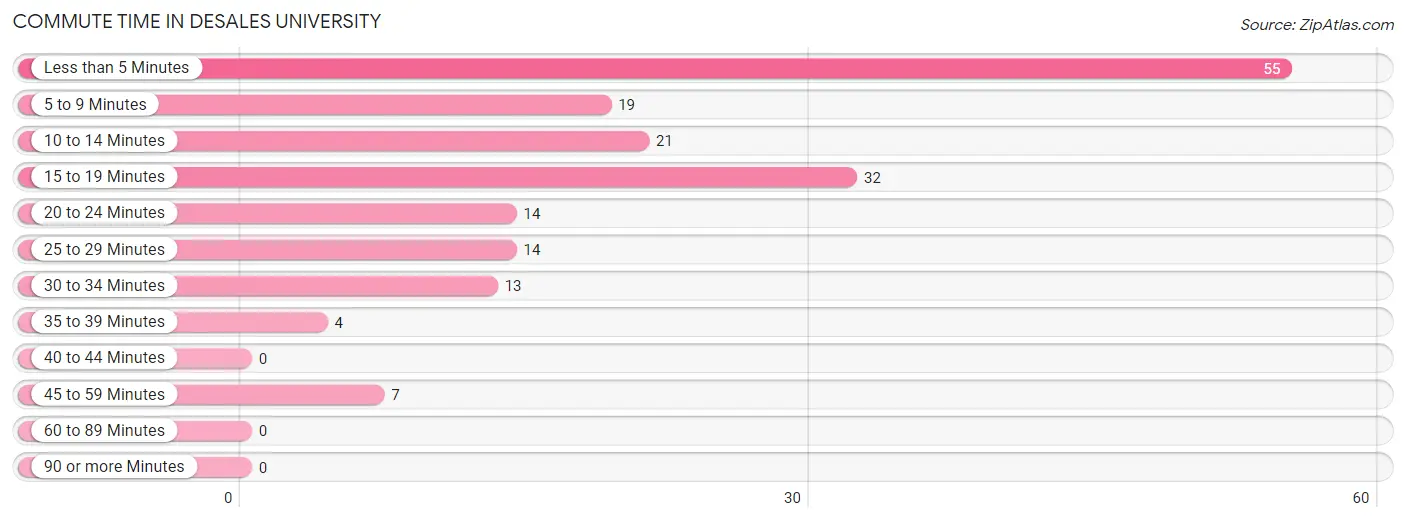
The most frequently occuring commute durations in DeSales University are less than 5 minutes (55 commuters, 30.7%), 15 to 19 minutes (32 commuters, 17.9%), and 10 to 14 minutes (21 commuters, 11.7%).
Commute Time
# Commuters
% Commuters
Less than 5 Minutes
55
30.7%
5 to 9 Minutes
19
10.6%
10 to 14 Minutes
21
11.7%
15 to 19 Minutes
32
17.9%
20 to 24 Minutes
14
7.8%
25 to 29 Minutes
14
7.8%
30 to 34 Minutes
13
7.3%
35 to 39 Minutes
4
2.2%
40 to 44 Minutes
0
0.0%
45 to 59 Minutes
7
3.9%
60 to 89 Minutes
0
0.0%
90 or more Minutes
0
0.0%
Commute Time by Sex in DeSales University
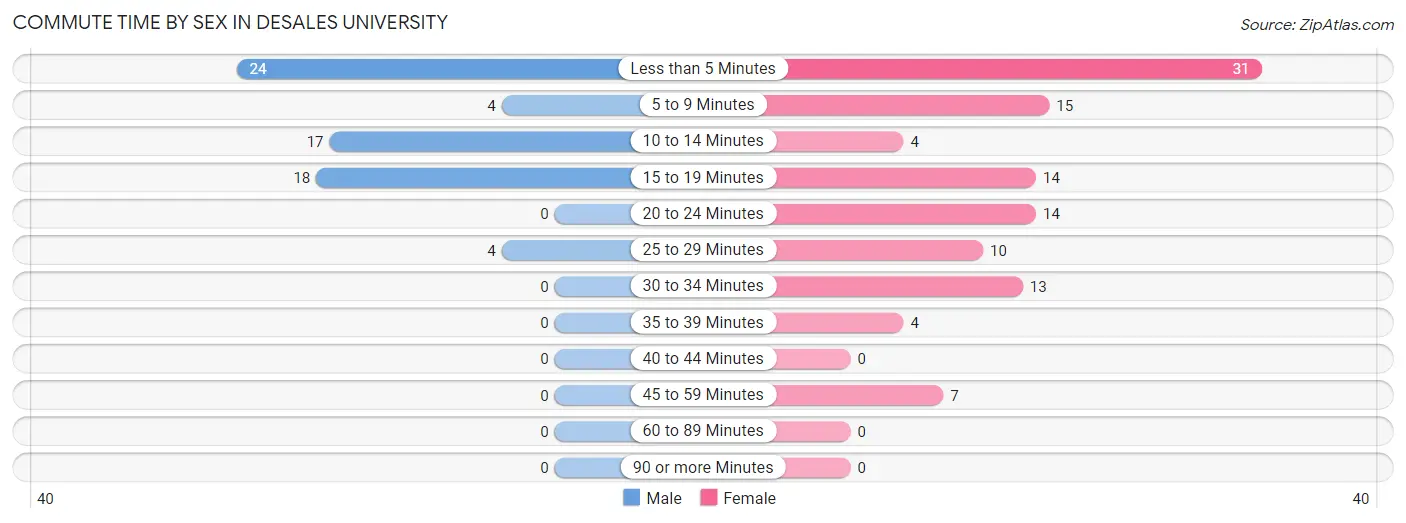
The most common commute times in DeSales University are less than 5 minutes (24 commuters, 35.8%) for males and less than 5 minutes (31 commuters, 27.7%) for females.
Commute Time
Male
Female
Less than 5 Minutes
24 (35.8%)
31 (27.7%)
5 to 9 Minutes
4 (6.0%)
15 (13.4%)
10 to 14 Minutes
17 (25.4%)
4 (3.6%)
15 to 19 Minutes
18 (26.9%)
14 (12.5%)
20 to 24 Minutes
0 (0.0%)
14 (12.5%)
25 to 29 Minutes
4 (6.0%)
10 (8.9%)
30 to 34 Minutes
0 (0.0%)
13 (11.6%)
35 to 39 Minutes
0 (0.0%)
4 (3.6%)
40 to 44 Minutes
0 (0.0%)
0 (0.0%)
45 to 59 Minutes
0 (0.0%)
7 (6.2%)
60 to 89 Minutes
0 (0.0%)
0 (0.0%)
90 or more Minutes
0 (0.0%)
0 (0.0%)
Time of Departure to Work by Sex in DeSales University
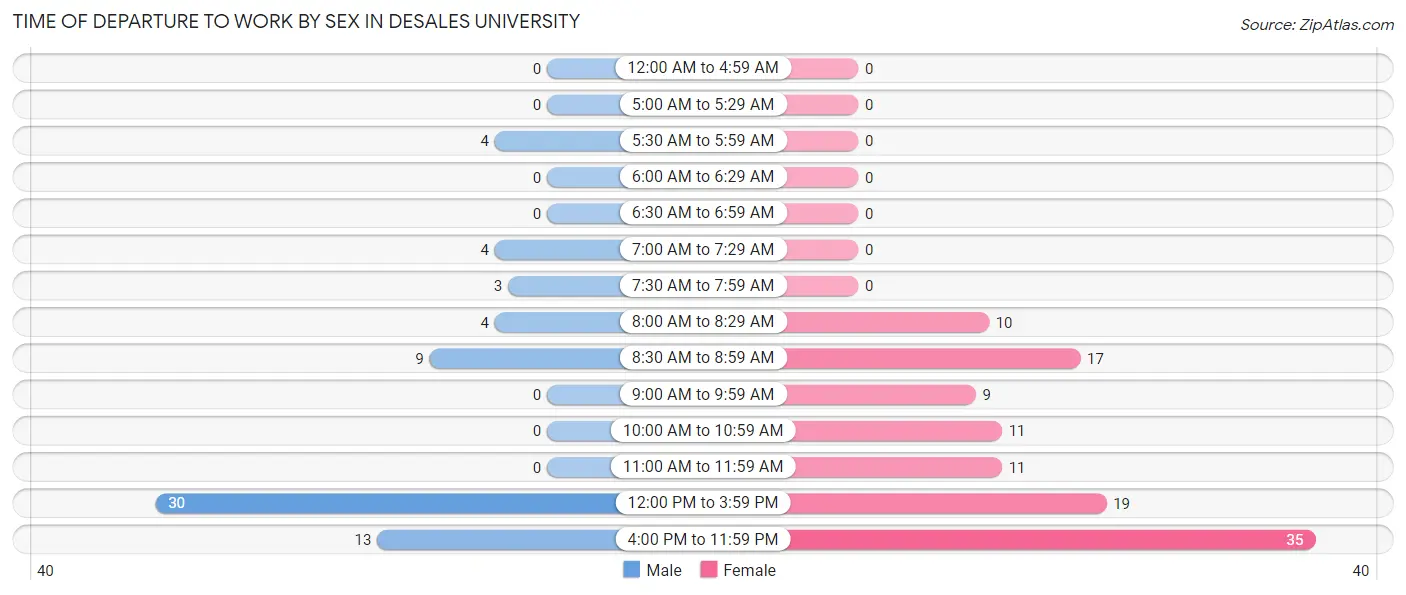
The most frequent times of departure to work in DeSales University are 12:00 PM to 3:59 PM (30, 44.8%) for males and 4:00 PM to 11:59 PM (35, 31.2%) for females.
Time of Departure
Male
Female
12:00 AM to 4:59 AM
0 (0.0%)
0 (0.0%)
5:00 AM to 5:29 AM
0 (0.0%)
0 (0.0%)
5:30 AM to 5:59 AM
4 (6.0%)
0 (0.0%)
6:00 AM to 6:29 AM
0 (0.0%)
0 (0.0%)
6:30 AM to 6:59 AM
0 (0.0%)
0 (0.0%)
7:00 AM to 7:29 AM
4 (6.0%)
0 (0.0%)
7:30 AM to 7:59 AM
3 (4.5%)
0 (0.0%)
8:00 AM to 8:29 AM
4 (6.0%)
10 (8.9%)
8:30 AM to 8:59 AM
9 (13.4%)
17 (15.2%)
9:00 AM to 9:59 AM
0 (0.0%)
9 (8.0%)
10:00 AM to 10:59 AM
0 (0.0%)
11 (9.8%)
11:00 AM to 11:59 AM
0 (0.0%)
11 (9.8%)
12:00 PM to 3:59 PM
30 (44.8%)
19 (17.0%)
4:00 PM to 11:59 PM
13 (19.4%)
35 (31.2%)
Total
67 (100.0%)
112 (100.0%)
Housing Occupancy in DeSales University
Occupancy by Ownership in DeSales University
Occupancy
# Housing Units
% Housing Units
Owner Occupied Housing Units
0
0.0%
Renter-Occupied Housing Units
0
0.0%
Total Occupied Housing Units
0
0.0%
Occupancy by Household Size in DeSales University
Household Size
# Housing Units
% Housing Units
1-Person Household
0
0.0%
2-Person Household
0
0.0%
3-Person Household
0
0.0%
4+ Person Household
0
0.0%
Total Housing Units
0
0.0%
Occupancy by Ownership by Household Size in DeSales University
Household Size
Owner-occupied
Renter-occupied
1-Person Household
0 (0.0%)
0 (0.0%)
2-Person Household
0 (0.0%)
0 (0.0%)
3-Person Household
0 (0.0%)
0 (0.0%)
4+ Person Household
0 (0.0%)
0 (0.0%)
Total Housing Units
0 (0.0%)
0 (0.0%)
Occupancy by Educational Attainment in DeSales University
Household Size
Owner-occupied
Renter-occupied
Less than High School
0 (0.0%)
0 (0.0%)
High School Diploma
0 (0.0%)
0 (0.0%)
College/Associate Degree
0 (0.0%)
0 (0.0%)
Bachelor's Degree or higher
0 (0.0%)
0 (0.0%)
Occupancy by Age of Householder in DeSales University
Age Bracket
# Households
% Households
Under 35 Years
0
0.0%
35 to 44 Years
0
0.0%
45 to 54 Years
0
0.0%
55 to 64 Years
0
0.0%
65 to 74 Years
0
0.0%
75 to 84 Years
0
0.0%
85 Years and Over
0
0.0%
Total
0
0.0%
Housing Finances in DeSales University
Median Income by Occupancy in DeSales University
Occupancy Type
# Households
Median Income
Owner-Occupied
0 (0.0%)
$0
Renter-Occupied
0 (0.0%)
$0
Average
0 (0.0%)
$0
Occupancy by Householder Income Bracket in DeSales University
Income Bracket
Owner-occupied
Renter-occupied
Less than $5,000
0 (0.0%)
0 (0.0%)
$5,000 to $9,999
0 (0.0%)
0 (0.0%)
$10,000 to $14,999
0 (0.0%)
0 (0.0%)
$15,000 to $19,999
0 (0.0%)
0 (0.0%)
$20,000 to $24,999
0 (0.0%)
0 (0.0%)
$25,000 to $34,999
0 (0.0%)
0 (0.0%)
$35,000 to $49,999
0 (0.0%)
0 (0.0%)
$50,000 to $74,999
0 (0.0%)
0 (0.0%)
$75,000 to $99,999
0 (0.0%)
0 (0.0%)
$100,000 to $149,999
0 (0.0%)
0 (0.0%)
$150,000 or more
0 (0.0%)
0 (0.0%)
Total
0 (0.0%)
0 (0.0%)
Monthly Housing Cost Tiers in DeSales University
Monthly Cost
Owner-occupied
Renter-occupied
Less than $300
0 (0.0%)
0 (0.0%)
$300 to $499
0 (0.0%)
0 (0.0%)
$500 to $799
0 (0.0%)
0 (0.0%)
$800 to $999
0 (0.0%)
0 (0.0%)
$1,000 to $1,499
0 (0.0%)
0 (0.0%)
$1,500 to $1,999
0 (0.0%)
0 (0.0%)
$2,000 to $2,499
0 (0.0%)
0 (0.0%)
$2,500 to $2,999
0 (0.0%)
0 (0.0%)
$3,000 or more
0 (0.0%)
0 (0.0%)
Total
0 (0.0%)
0 (0.0%)
Physical Housing Characteristics in DeSales University
Housing Structures in DeSales University
Structure Type
# Housing Units
% Housing Units
Single Unit, Detached
0
0.0%
Single Unit, Attached
0
0.0%
2 Unit Apartments
0
0.0%
3 or 4 Unit Apartments
0
0.0%
5 to 9 Unit Apartments
0
0.0%
10 or more Apartments
0
0.0%
Mobile Home / Other
0
0.0%
Total
0
0.0%
Housing Structures by Occupancy in DeSales University
Structure Type
Owner-occupied
Renter-occupied
Single Unit, Detached
0 (0.0%)
0 (0.0%)
Single Unit, Attached
0 (0.0%)
0 (0.0%)
2 Unit Apartments
0 (0.0%)
0 (0.0%)
3 or 4 Unit Apartments
0 (0.0%)
0 (0.0%)
5 to 9 Unit Apartments
0 (0.0%)
0 (0.0%)
10 or more Apartments
0 (0.0%)
0 (0.0%)
Mobile Home / Other
0 (0.0%)
0 (0.0%)
Total
0 (0.0%)
0 (0.0%)
Housing Structures by Number of Rooms in DeSales University
Number of Rooms
Owner-occupied
Renter-occupied
1 Room
0 (0.0%)
0 (0.0%)
2 or 3 Rooms
0 (0.0%)
0 (0.0%)
4 or 5 Rooms
0 (0.0%)
0 (0.0%)
6 or 7 Rooms
0 (0.0%)
0 (0.0%)
8 or more Rooms
0 (0.0%)
0 (0.0%)
Total
0 (0.0%)
0 (0.0%)
Housing Structure by Heating Type in DeSales University
Heating Type
Owner-occupied
Renter-occupied
Utility Gas
0 (0.0%)
0 (0.0%)
Bottled, Tank, or LP Gas
0 (0.0%)
0 (0.0%)
Electricity
0 (0.0%)
0 (0.0%)
Fuel Oil or Kerosene
0 (0.0%)
0 (0.0%)
Coal or Coke
0 (0.0%)
0 (0.0%)
All other Fuels
0 (0.0%)
0 (0.0%)
No Fuel Used
0 (0.0%)
0 (0.0%)
Total
0 (0.0%)
0 (0.0%)
Household Vehicle Usage in DeSales University
Vehicles per Household
Owner-occupied
Renter-occupied
No Vehicle
0 (0.0%)
0 (0.0%)
1 Vehicle
0 (0.0%)
0 (0.0%)
2 Vehicles
0 (0.0%)
0 (0.0%)
3 or more Vehicles
0 (0.0%)
0 (0.0%)
Total
0 (0.0%)
0 (0.0%)
Real Estate & Mortgages in DeSales University
Real Estate and Mortgage Overview in DeSales University
Characteristic
Without Mortgage
With Mortgage
Housing Units
0
0
Median Property Value
-
-
Median Household Income
-
-
Monthly Housing Costs
-
-
Real Estate Taxes
-
-
Property Value by Mortgage Status in DeSales University
Property Value
Without Mortgage
With Mortgage
Less than $50,000
0 (0.0%)
0 (0.0%)
$50,000 to $99,999
0 (0.0%)
0 (0.0%)
$100,000 to $299,999
0 (0.0%)
0 (0.0%)
$300,000 to $499,999
0 (0.0%)
0 (0.0%)
$500,000 to $749,999
0 (0.0%)
0 (0.0%)
$750,000 to $999,999
0 (0.0%)
0 (0.0%)
$1,000,000 or more
0 (0.0%)
0 (0.0%)
Total
0 (0.0%)
0 (0.0%)
Household Income by Mortgage Status in DeSales University
Household Income
Without Mortgage
With Mortgage
Less than $10,000
0 (0.0%)
0 (0.0%)
$10,000 to $24,999
0 (0.0%)
0 (0.0%)
$25,000 to $34,999
0 (0.0%)
0 (0.0%)
$35,000 to $49,999
0 (0.0%)
0 (0.0%)
$50,000 to $74,999
0 (0.0%)
0 (0.0%)
$75,000 to $99,999
0 (0.0%)
0 (0.0%)
$100,000 to $149,999
0 (0.0%)
0 (0.0%)
$150,000 or more
0 (0.0%)
0 (0.0%)
Total
0 (0.0%)
0 (0.0%)
Property Value to Household Income Ratio in DeSales University
Value-to-Income Ratio
Without Mortgage
With Mortgage
Less than 2.0x
0 (0.0%)
0 (0.0%)
2.0x to 2.9x
0 (0.0%)
0 (0.0%)
3.0x to 3.9x
0 (0.0%)
0 (0.0%)
4.0x or more
0 (0.0%)
0 (0.0%)
Total
0 (0.0%)
0 (0.0%)
Real Estate Taxes by Mortgage Status in DeSales University
Property Taxes
Without Mortgage
With Mortgage
Less than $800
0 (0.0%)
0 (0.0%)
$800 to $1,499
0 (0.0%)
0 (0.0%)
$800 to $1,499
0 (0.0%)
0 (0.0%)
Total
0 (0.0%)
0 (0.0%)
Health & Disability in DeSales University
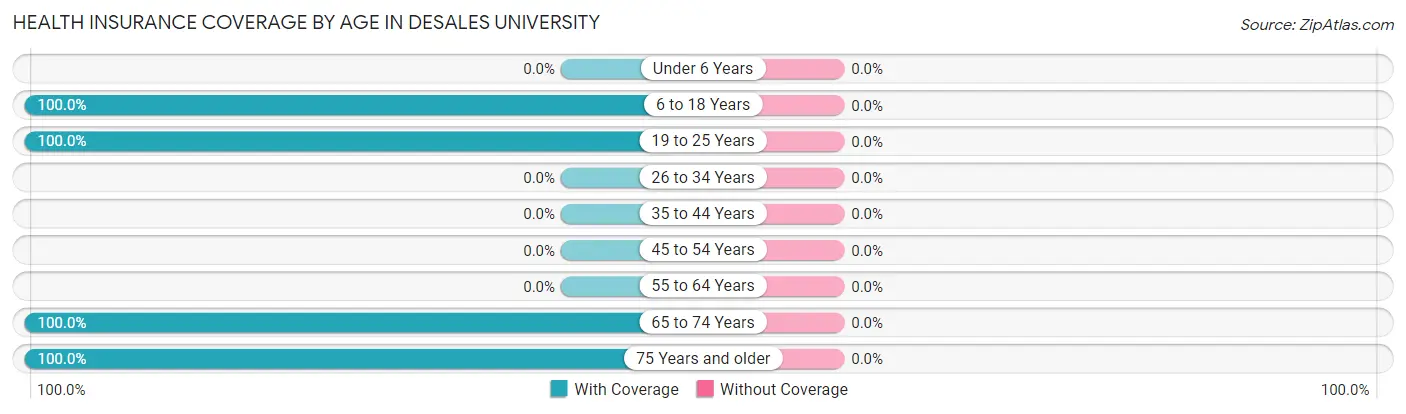
Health Insurance Coverage by Age in DeSales University
Age Bracket
With Coverage
Without Coverage
Under 6 Years
0 (0.0%)
0 (0.0%)
6 to 18 Years
328 (100.0%)
0 (0.0%)
19 to 25 Years
611 (100.0%)
0 (0.0%)
26 to 34 Years
0 (0.0%)
0 (0.0%)
35 to 44 Years
0 (0.0%)
0 (0.0%)
45 to 54 Years
0 (0.0%)
0 (0.0%)
55 to 64 Years
0 (0.0%)
0 (0.0%)
65 to 74 Years
1 (100.0%)
0 (0.0%)
75 Years and older
2 (100.0%)
0 (0.0%)
Total
942 (100.0%)
0 (0.0%)
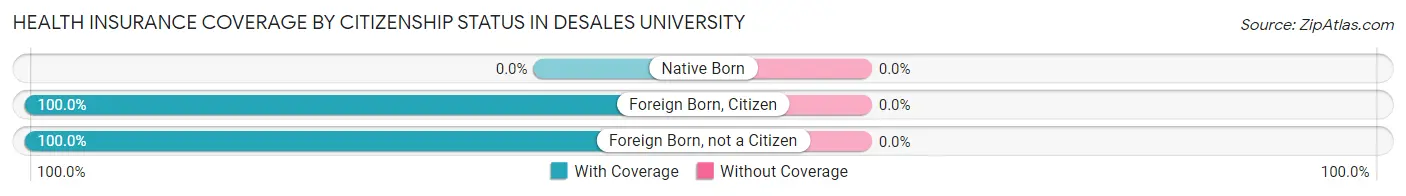
Health Insurance Coverage by Citizenship Status in DeSales University
Citizenship Status
With Coverage
Without Coverage
Native Born
0 (0.0%)
0 (0.0%)
Foreign Born, Citizen
328 (100.0%)
0 (0.0%)
Foreign Born, not a Citizen
611 (100.0%)
0 (0.0%)
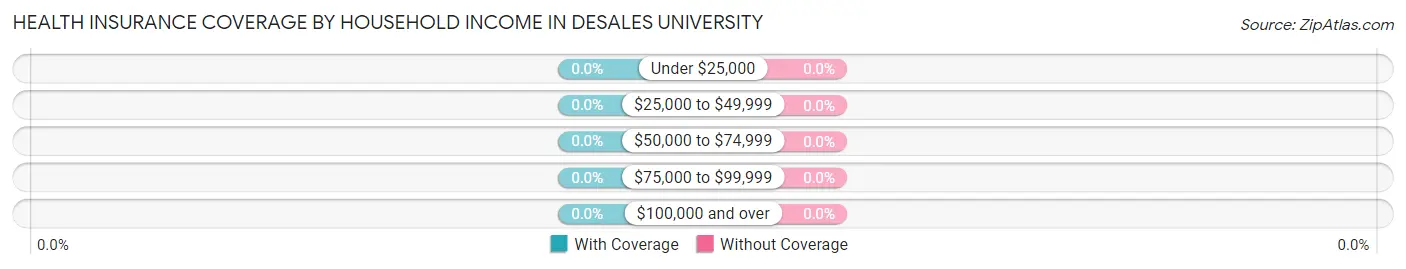
Health Insurance Coverage by Household Income in DeSales University
Household Income
With Coverage
Without Coverage
Under $25,000
0 (0.0%)
0 (0.0%)
$25,000 to $49,999
0 (0.0%)
0 (0.0%)
$50,000 to $74,999
0 (0.0%)
0 (0.0%)
$75,000 to $99,999
0 (0.0%)
0 (0.0%)
$100,000 and over
0 (0.0%)
0 (0.0%)
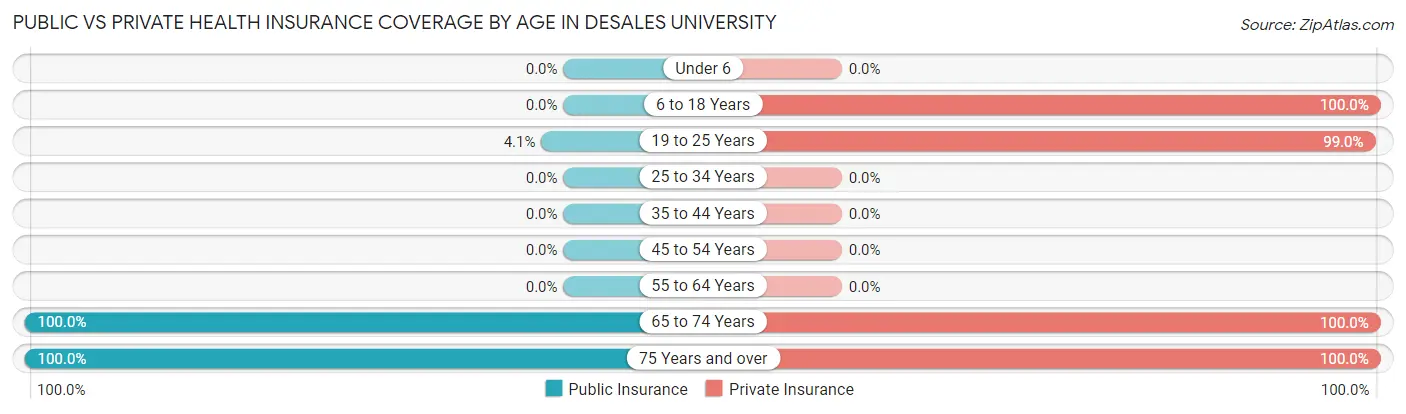
Public vs Private Health Insurance Coverage by Age in DeSales University
Age Bracket
Public Insurance
Private Insurance
Under 6
0 (0.0%)
0 (0.0%)
6 to 18 Years
0 (0.0%)
328 (100.0%)
19 to 25 Years
25 (4.1%)
605 (99.0%)
25 to 34 Years
0 (0.0%)
0 (0.0%)
35 to 44 Years
0 (0.0%)
0 (0.0%)
45 to 54 Years
0 (0.0%)
0 (0.0%)
55 to 64 Years
0 (0.0%)
0 (0.0%)
65 to 74 Years
1 (100.0%)
1 (100.0%)
75 Years and over
2 (100.0%)
2 (100.0%)
Total
28 (3.0%)
936 (99.4%)
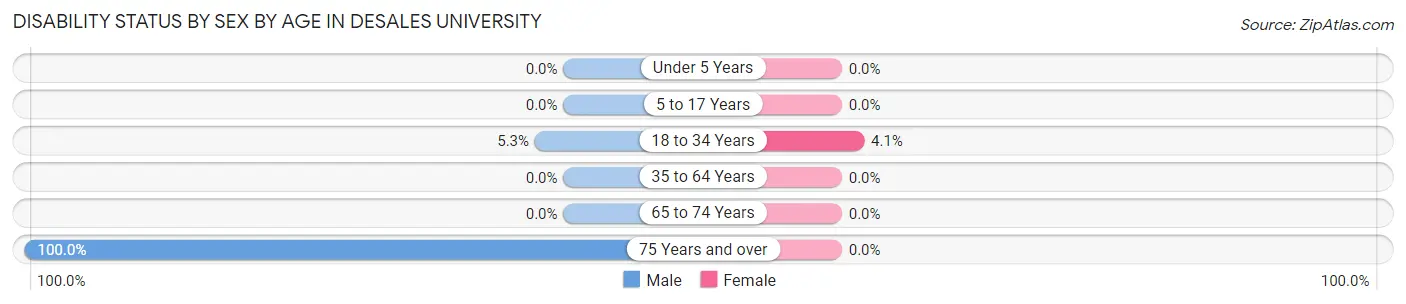
Disability Status by Sex by Age in DeSales University
Age Bracket
Male
Female
Under 5 Years
0 (0.0%)
0 (0.0%)
5 to 17 Years
0 (0.0%)
0 (0.0%)
18 to 34 Years
20 (5.3%)
23 (4.1%)
35 to 64 Years
0 (0.0%)
0 (0.0%)
65 to 74 Years
0 (0.0%)
0 (0.0%)
75 Years and over
2 (100.0%)
0 (0.0%)
Disability Class by Sex by Age in DeSales University
Disability Class: Hearing Difficulty
Age Bracket
Male
Female
Under 5 Years
0 (0.0%)
0 (0.0%)
5 to 17 Years
0 (0.0%)
0 (0.0%)
18 to 34 Years
0 (0.0%)
0 (0.0%)
35 to 64 Years
0 (0.0%)
0 (0.0%)
65 to 74 Years
0 (0.0%)
0 (0.0%)
75 Years and over
0 (0.0%)
0 (0.0%)
Disability Class: Vision Difficulty
Age Bracket
Male
Female
Under 5 Years
0 (0.0%)
0 (0.0%)
5 to 17 Years
0 (0.0%)
0 (0.0%)
18 to 34 Years
5 (1.3%)
0 (0.0%)
35 to 64 Years
0 (0.0%)
0 (0.0%)
65 to 74 Years
0 (0.0%)
0 (0.0%)
75 Years and over
0 (0.0%)
0 (0.0%)
Disability Class: Cognitive Difficulty
Age Bracket
Male
Female
5 to 17 Years
0 (0.0%)
0 (0.0%)
18 to 34 Years
15 (4.0%)
23 (4.1%)
35 to 64 Years
0 (0.0%)
0 (0.0%)
65 to 74 Years
0 (0.0%)
0 (0.0%)
75 Years and over
2 (100.0%)
0 (0.0%)
Disability Class: Ambulatory Difficulty
Age Bracket
Male
Female
5 to 17 Years
0 (0.0%)
0 (0.0%)
18 to 34 Years
0 (0.0%)
0 (0.0%)
35 to 64 Years
0 (0.0%)
0 (0.0%)
65 to 74 Years
0 (0.0%)
0 (0.0%)
75 Years and over
2 (100.0%)
0 (0.0%)
Disability Class: Self-Care Difficulty
Age Bracket
Male
Female
5 to 17 Years
0 (0.0%)
0 (0.0%)
18 to 34 Years
0 (0.0%)
0 (0.0%)
35 to 64 Years
0 (0.0%)
0 (0.0%)
65 to 74 Years
0 (0.0%)
0 (0.0%)
75 Years and over
2 (100.0%)
0 (0.0%)
Technology Access in DeSales University
Computing Device Access in DeSales University
Device Type
# Households
% Households
Desktop or Laptop
0
0.0%
Smartphone
0
0.0%
Tablet
0
0.0%
No Computing Device
0
0.0%
Total
0
0.0%
Internet Access in DeSales University
Internet Type
# Households
% Households
Dial-Up Internet
0
0.0%
Broadband Home
0
0.0%
Cellular Data Only
0
0.0%
Satellite Internet
0
0.0%
No Internet
0
0.0%
Total
0
0.0%
DeSales University Summary
DeSales University is a private, Catholic university located in Center Valley, Pennsylvania. Founded in 1965, the university is named after St. Francis de Sales, the patron saint of writers and journalists. The university is affiliated with the Roman Catholic Church and is part of the Diocese of Allentown. DeSales University offers a variety of undergraduate and graduate degree programs, as well as certificate and continuing education programs.
History
DeSales University was founded in 1965 as Allentown College of St. Francis de Sales. The college was established by the Roman Catholic Diocese of Allentown and was the first Catholic college in the Lehigh Valley. The college was originally located in the former Allentown College of St. Francis de Sales High School building. In 1967, the college moved to its current location in Center Valley, Pennsylvania.
In 1983, the college was renamed DeSales University in honor of St. Francis de Sales, the patron saint of writers and journalists. In the same year, the university was granted university status by the Commonwealth of Pennsylvania.
Geography
DeSales University is located in Center Valley, Pennsylvania, in the Lehigh Valley region of the state. The university is situated on a 200-acre campus in the foothills of the Blue Mountain range. The campus is located approximately 10 miles from Allentown, Pennsylvania, and approximately 60 miles from Philadelphia, Pennsylvania.
Economy
The economy of the Lehigh Valley region is largely driven by the service industry, manufacturing, and healthcare. The region is home to several major employers, including Air Products and Chemicals, Olympus Corporation, and Crayola. The region is also home to several major healthcare providers, including Lehigh Valley Health Network and St. Luke’s University Health Network.
Demographics
As of the 2010 census, the population of Center Valley was 4,845. The population of the Lehigh Valley region was 821,173. The population of the region is largely white (83.3%), with smaller percentages of African American (7.2%), Asian (3.2%), and Hispanic or Latino (4.7%) residents. The median household income in the region is $60,811.
Common Questions
What is Per Capita Income in DeSales University?
Per Capita income in DeSales University is $3,768.
What is the Total Population of DeSales University?
Total Population of DeSales University is 942.
What is the Total Male Population of DeSales University?
Total Male Population of DeSales University is 386.
What is the Total Female Population of DeSales University?
Total Female Population of DeSales University is 556.
What is the Ratio of Males per 100 Females in DeSales University?
There are 69.42 Males per 100 Females in DeSales University.
What is the Ratio of Females per 100 Males in DeSales University?
There are 144.04 Females per 100 Males in DeSales University.
What is the Median Population Age in DeSales University?
Median Population Age in DeSales University is 19.7 Years.
How Large is the Labor Force in DeSales University?
There are 436 People in the Labor Forcein in DeSales University.
What is the Percentage of People in the Labor Force in DeSales University?
46.3% of People are in the Labor Force in DeSales University.
What is the Unemployment Rate in DeSales University?
Unemployment Rate in DeSales University is 0.9%.
Report Title
Report Link
HTML Copy & Paste Link
Social Media
Copy and paste the folowing code into any webpage where you would like this interactive chart to display